UNITED STATES
SECURITIES AND EXCHANGE COMMISSION
Washington, DC 20549
FORM 10-K/A
(Amendment No. 1)10-K
(Mark One)
☑ ANNUAL REPORT PURSUANT TO SECTION 13 OR 15(d) OF THE SECURITIES EXCHANGE ACT OF 1934
For the year ended December 31, 20192020
☐ TRANSITION REPORT PURSUANT TO SECTION 13 OR 15(d) OF THE SECURITIES EXCHANGE ACT OF 1934
For the transition period from to
Commission File Number 001-36362
BioLife Solutions, Inc.
(Exact name of registrant as specified in its charter)
| 94-3076866 |
(State or other jurisdiction of incorporation or organization) | (IRS Employer Identification No.) |
3303 MONTE VILLA PARKWAY, SUITEMonte Villa Parkway, Suite 310, BOTHELL, WASHINGTON,Bothell, Washington, 98021
(Address of registrant’sregistrant’s principal executive offices, Zip Code)
(425) 402-1400
(Telephone number, including area code)
Securities registered pursuant to Section12(b) of the Act:
Title of each class | Trading symbol ($) | Name of exchange on which registered |
Common | BLFS | NASDAQ Capital Market |
Securities registered pursuant to Section 12(g) of the Act: None
Indicate by check mark whether the registrant is a well-known seasoned issuer, as defined in Rule 405 of the Securities Act. Yes ☐☑ No ☑☐
Indicate by check mark whether the registrant is not required to file reports pursuant to Section 13 or Section 15(d) of the Act. Yes ☐ No ☑
Indicate by check mark whether the registrant (1) has filed all reports required to be filed by Section 13 or 15(d) of the Securities Exchange Act of 1934 during the preceding 12 months (or for such shorter period that the registrant was required to file such reports), and (2) has been subject to such filing requirements for the past 90 days. Yes ☑ No ☐
Indicate by check mark whether the registrant has submitted electronically every Interactive Data File required to be submitted pursuant to Rule 405 of Regulation S-T (S232.405 of this chapter) during the preceding 12 months (or for such shorter period that the Registrant was required to submit such said files). Yes ☑ No ☐
Indicate by check mark whether the registrant is a large accelerated filer, an accelerated filer, a non-accelerated filer, a smaller reporting company or an emerging growth company. See the definitions of “large accelerated filer,” “accelerated filer,” “smaller reporting company,” and “emerging growth company” in Rule 12b-2 of the Exchange Act.
Large accelerated filer ☐ Accelerated filer ☑☐ Non-accelerated filer ☐☑ Smaller reporting company ☑ Emerging Growth Company ☐
If an emerging growth company, indicate by check mark if the registrant has elected not to use the extended transition period for complying with any new or revised financial accounting standards provided pursuant to Section 13(a) of the Exchange Act. ☐
Indicate by check mark whether the registrant has filed a report on and attestation to its management’s assessment of the effectiveness of its internal control over financial reporting under Section 404(b) of the Sarbanes-Oxley Act (15 U.S.C. 7262(b)) by the registered public accounting firm that prepared or issued its audit report. ☑☐
Indicate by check mark whether the registrant is a shell company (as defined in Rule 12b-2 of the Act). Yes ☐ No ☑
As of the registrant’s most recently completed second fiscal quarter, the aggregate market value of common equity (based on closing price on June 28, 201930, 2020 of $16.95$16.35 per share) held by non-affiliates was approximately $230$263 million.
As of June 12, 2020, 25,963,241March 19, 2021, 33,401,359 shares of the registrant’s common stock were outstanding.
Explanatory NoteTable of Contents
Page No. | ||
ITEM 1. | 4 | |
ITEM 1A. | 11 | |
ITEM 1B. | 21 | |
| ITEM 2. | 22 | |
ITEM 3. | 22 | |
ITEM 4. | 22 | |
ITEM 5. | 22 | |
ITEM 6. | 22 | |
ITEM 7. | MANAGEMENT’S DISCUSSION AND ANALYSIS OF FINANCIAL CONDITION AND RESULTS OF OPERATIONS | 23 |
ITEM 7A. | 33 | |
ITEM 8. | 34 | |
34 | ||
35 | ||
ITEM 9. | CHANGES IN AND DISAGREEMENTS WITH ACCOUNTANTS ON ACCOUNTING AND FINANCIAL DISCLOSURE | 71 |
ITEM 9A. | 71 | |
ITEM 9B. | 72 | |
ITEM 10. | 73 | |
ITEM 11. | 77 | |
ITEM 12. | SECURITY OWNERSHIP OF CERTAIN BENEFICIAL OWNERS AND MANAGEMENT AND RELATED STOCKHOLDER MATTERS | 83 |
ITEM 13. | CERTAIN RELATIONSHIPS AND RELATED TRANSACTIONS AND DIRECTOR INDEPENDENCE | 85 |
ITEM 14. | 85 | |
ITEM 15. | 87 | |
ITEM 16. | 88 | |
89 | ||
FORWARD LOOKING STATEMENTS
This Annual Report on Form 10-K (“Form 10-K” or “Annual Report”) contains forward-looking statements which are made pursuant to the safe harbor provisions of Section 27A of the Securities Act of 1933, as amended, and Section 21E of the Securities Exchange Act of 1934, as amended (the “Exchange Act”). The forward-looking statements in this Form 10-K do not constitute guarantees of future performance and actual results could differ materially from those contained in the forward-looking statements. These statements are based on current expectations of future events. Such statements include, but are not limited to, statements about our products, including our newly acquired products, customers, regulatory approvals, the potential utility of and market for our products and services, our ability to implement our business strategy and anticipated business and operations, in particular following our 2019 and 2020 acquisitions, future financial and operational performance, our anticipated future growth strategy, including the closing of our merger with Global Cooling, Inc. and the acquisition of other synergistic cell and gene therapy manufacturing tools and services or technologies or other companies or technologies, capital requirements, intellectual property, suppliers, joint venture partners, future financial and operating results, the impact of the COVID-19 pandemic, plans, objectives, expectations and intentions, revenues, costs and expenses, interest rates, outcome of contingencies, business strategies, regulatory filings and requirements, the estimated potential size of markets, capital requirements, the terms of any capital financing agreements and other statements that are not historical facts. You can find many of these statements by looking for words like “believes,” “expects,” “anticipates,” “estimates,” “may,” “should,” “will,” “could,” “plan,” “intend,” or similar expressions in this Form 10-K. We intend that such forward-looking statements be subject to the safe harbors created thereby.
These forward-looking statements are based on the current beliefs and expectations of our management and are subject to significant risks and uncertainties. If underlying assumptions prove inaccurate or unknown risks or uncertainties materialize, actual results may differ materially from current expectations and projections. Factors that might cause such a difference include those discussed under “Risk Factors,” as well as those discussed elsewhere in the Form 10-K.
You are cautioned not to place undue reliance on these forward-looking statements, which speak only as of the date of this Form 10-K or, in the case of documents referred to or incorporated by reference, the date of those documents.
All subsequent written or oral forward-looking statements attributable to us or any person acting on our behalf are expressly qualified in their entirety by the cautionary statements contained or referred to in this section. We do not undertake any obligation to release publicly any revisions to these forward-looking statements to reflect events or circumstances after the date of this Form 10-K or to reflect the occurrence of unanticipated events, except as may be required under applicable U.S. securities law. If we do update one or more forward-looking statements, no inference should be drawn that we will make additional updates with respect to those or other forward-looking statements.
References throughout this Amendment No. 1 to the Annual Report on Form 10-K to “BioLife“BioLife Solutions, Inc.”, “BioLife”“BioLife”, “we”“we”, “us”“us”, “our”“our”, or the “Company”“Company” refer to BioLife Solutions, Inc. and its subsidiaries, taken as a whole, unless the context otherwise indicates.
This Amendment No. 1 ("Amendment No. 1") to the Annual Report on Form 10-K/A amends the Annual Report on Form 10-K of BioLife Solutions, Inc. for the fiscal year ended December 31, 2019, as filed with the Securities and Exchange Commission ("SEC") on May 15, 2020 (the "Original Filing"). In the Original Filing, the Company, in consultation with its Audit Committee, concluded that its previously issued Consolidated Financial Statements for the periods beginning with the first quarter of 2018 through the third quarter of 2019 (collectively, the “Affected Periods”) should be restated because of a misapplication in the guidance around accounting for certain of our outstanding warrants to purchase common stock (the “Warrants”) and should no longer be relied upon (the Audit Committee concluded that it was not necessary to restate the financial statements for any period prior to January 1, 2018).
Historically, the Warrants were reflected as a component of equity as opposed to liabilities on the balance sheets and the statements of operations did not include the subsequent non-cash changes in estimated fair value of the Warrants in accordance with Accounting Standards Codification 480, “Distinguishing Liabilities from Equity” (“ASC 480”). The Warrants generally provide that, in the event of a fundamental transaction under rule 13(e)-3, the holder may receive cash value for the Warrants calculated using a Black Scholes model with a volatility rate equal to the greater of (i) the historical 100-day look-back period or (ii) 100% equity volatility. As a result, the Warrant cannot be classified within equity according to generally accepted accounting principles. Instead, the Warrants issued by the Company should be recorded as a liability at fair value at the date of grant, and marked to market at each reporting period. Changes in fair value are recorded in earnings.
We are filing this Amendment No. 1 to include the selected financial data described in Item 6. Selected Financial Data which such financial data give effect to the change in accounting for the Warrants as previously disclosed in the Original Filing.
The change in accounting for the Warrants did not have any impact on our liquidity, cash flows, revenues or costs of operating our business and the other non-cash adjustments to the Consolidated Financial Statements, in all of the Affected Periods or in any of the periods included in Item 6, Selected Financial Date in this filing. The change in accounting for the warrants does not impact the amounts previously reported for the Company’s cash and cash equivalents, operating expenses or total cash flows from operations for any of these periods.
While, as a smaller reporting company, we are not required to include Item 6. information, we have elected to do so to provide additional disclosure surrounding the Warrants. This Amendment No. 1 consists solely of the preceding cover page, this explanatory note, the information required by Item 6 of Form 10-K, a signature page and the certifications required to be filed as exhibits.
In accordance with Rule 12b-15 under the Securities Exchange Act of 1934, as amended (the "Exchange Act"), Item 6, Selected Financial Data, of the Original Filing is hereby amended and restated in its entirety. This Amendment No. 1 should be read in conjunction with the Original Filing and with our filings with the SEC subsequent to the Original Filing.
This Amendment No. 1 does not reflect events occurring after the filing of the Original Filing, and, except as described above, does not modify or update any other disclosures in the Original Filing.
| ||
|
| |
|
| |
| ||
BUSINESS |
ITEM 6. SELECTED FINANCIAL DATA
The following discussion of our business contains forward-looking statements that involve risks and uncertainties (see the section entitled “Forward Looking Statements” herein). Our actual results could differ materially from those anticipated in these forward-looking statements as a result of certain factors, including those factors set forth under “Risk Factors” and elsewhere in this Form 10-K.
Overview
We develop, manufacture, and market bioproduction tools and services to the cell and gene therapy (“CGT”) industry, which are designed to improve quality and de-risk biologic manufacturing and delivery. We also provide biological and pharmaceutical storage services to the CGT industry. Our products are used in basic and applied research, and commercial manufacturing of biologic-based therapies. Customers use our products to maintain the health and function of biologic material during sourcing, manufacturing, storage, and distribution of cells and tissues.
We currently operate as one bioproduction tools and services business with product lines that support several steps in the biologic material manufacturing and delivery process. We have a diversified portfolio of tools and services that focus on biopreservation, frozen storage, and thawing of biologic materials. We have in-house expertise in cryobiology and continue to capitalize on opportunities to maximize the value of our product platform for our extensive customer base through both organic growth innovations and acquisitions.
COVID-19 Considerations
In March 2020, the World Health Organization declared the COVID-19 outbreak to be a pandemic. During 2020, we believe our quarterly revenues were affected by COVID-19. During the first quarter, our biopreservation media product lines benefited due to what we believe was safety stock purchasing by our customers due to COVID-19. In the second and third quarters, we believe that revenues were negatively impacted by a reduction in clinical trial progression and temporary halts. We then noticed an increase of purchasing in biopreservation media in the fourth quarter as clinical trials and research lab activity resumed with reduced restrictions. Our biological and pharmaceutical services business that we acquired in the fourth quarter was in-line with expectations and we expect increased demand for biological material storage with the reduction of COVID-19 restrictions. Our 2020 revenue was negatively affected for our automated thawing devices, cloud connected “smart” shipping containers, and freezer and storage technology lines of business by the COVID-19 pandemic due to restrictions on in-person selling, customer budget cuts for capital equipment and lack of personnel at our customer sites to receive capital equipment. We have tried and, to date, have been successful in mitigating any supply chain problems. However, we cannot provide any assurance that a continued or prolonged global pandemic will not have a negative impact on our manufacturing and shipping processes or our product costs. The consolidated statementextent to which the COVID-19 pandemic affects our future financial results and operations will depend on future developments which are highly uncertain and cannot be predicted, including the recurrence, severity and/or duration of the ongoing pandemic, and current or future domestic and international actions to contain and treat COVID-19.
We are following public and private sector policies and initiatives to reduce the transmission of COVID-19, such as the imposition of travel restrictions and the promotion of social distancing and work-from-home arrangements. We are taking a variety of measures to ensure the availability and functioning of our critical infrastructure, to promote the safety and security of our employees and to support the communities in which we operate. These measures include increasing our raw materials, manufacturing safety stock inventory for our biopreservation media and expanding availability of our biological and pharmaceutical storage, requiring remote working arrangements for employees who are not integral to physically making and shipping our products or who do not need specialized equipment to perform their work, restricting on-site visits by non-employees and implementing social distancing protocols, and investing in personal protective equipment. Beginning April 2, 2020 face masks were required to be worn by all employees and contractors at all sites. Effective May 11, 2020, temperature screening was required upon entering our facilities where mandated by state law. Starting on May 11, 2020, our employees were required to complete daily COVID-19 exposure and symptom questionnaires where mandated, with the requirement rolling out companywide on October 13, 2020 for all locations.
For further discussion of the risks relating to COVID-19, see “Our financial condition and results of operations formay be adversely affected by the years ended December 31, 2019 and 2018 and the consolidated balance sheet data as of December 31, 2019 and 2018 presented below have been derived from our audited consolidated financial statements and footnotes includedCOVID-19 pandemic” in the Original Filing. The consolidated statement of operations for the years ended December 31, 2017, 2016 and 2015 and the consolidated balance sheet data as of December 31, 2017, 2016 and 2015 have been derived from previously filed consolidated financial statements which were not restated in connection with the reclassification of our Warrants (and, as described in the Original Filing, should not be relied upon) and are not included in our Original Filing. Historical results are not necessarily indicative of future results. The following data should be read in conjunction with Item 7, "Management's Discussion and Analysis of Financial Condition and Results of Operations" and the consolidated financial statements and related notes included elsewhere in our Original Filing.1A. “Risk Factors”, below.
Statement of Operations Data:Our Products
For the Years Ended December 31, | ||||||||||||||||||||
(In thousands, except per share and share data) | 2019(1)(2) | 2018(3) (Restated) | 2017(4) (Restated) (Unaudited) | 2016(4) (Restated) (Unaudited) | 2015(4) (Restated) (Unaudited) | |||||||||||||||
Total product and rental revenue | $ | 27,371 | $ | 19,742 | $ | 11,022 | $ | 8,227 | $ | 6,449 | ||||||||||
Operating costs and expenses: | ||||||||||||||||||||
Cost of product and rental revenue (exclusive of intangible assets amortization) | 8,760 | 6,217 | 4,276 | 3,448 | 2,635 | |||||||||||||||
Research and development | 3,168 | 1,298 | 1,193 | 2,028 | 1,379 | |||||||||||||||
Sales and marketing | 4,701 | 2,615 | 2,086 | 3,010 | 2,583 | |||||||||||||||
General and administrative | 8,893 | 5,950 | 4,523 | 4,592 | 4,869 | |||||||||||||||
Intangible assets amortization | 1,079 | — | — | — | — | |||||||||||||||
Acquisition costs | 940 | — | — | — | — | |||||||||||||||
Change in fair value of contingent consideration | 50 | — | — | — | — | |||||||||||||||
Total operating expenses | 27,591 | 16,080 | 12,078 | 13,078 | 11,466 | |||||||||||||||
Operating income (loss) | (220 | ) | 3,662 | (1,056 | ) | (4,851 | ) | (5,017 | ) | |||||||||||
Change in fair value of warrant liability | (12,835 | ) | (28,271 | ) | (18,456 | ) | 6,529 | (2,237 | ) | |||||||||||
Other income (expenses) | 9,857 | (396 | ) | (1,459 | ) | (3,190 | ) | 22 | ||||||||||||
Total other expenses | (2,978 | ) | (28,667 | ) | (19,915 | ) | 3,339 | (2,215 | ) | |||||||||||
Net income (loss) before provision for income taxes | (3,198 | ) | (25,005 | ) | (20,971 | ) | (1,512 | ) | (7,232 | ) | ||||||||||
Income tax (benefit) | (1,541 | ) | — | — | — | — | ||||||||||||||
Net loss | (1,657 | ) | (25,005 | ) | (20,971 | ) | (1,512 | ) | (7,232 | ) | ||||||||||
Net loss attributable to non-controlling interest | — | — | — | 1,166 | 781 | |||||||||||||||
Net loss attributable to BioLife Solutions, Inc. | (1,657 | ) | (25,005 | ) | (20,971 | ) | (346 | ) | (6,451 | ) | ||||||||||
Less: Preferred stock dividends | — | (339 | ) | (213 | ) | — | — | |||||||||||||
Net loss attributable to common stockholders | $ | (1,657 | ) | $ | (25,344 | ) | $ | (21,184 | ) | $ | (346 | ) | $ | (6,451 | ) | |||||
Earnings per share attributable to common stockholders: | ||||||||||||||||||||
Basic and diluted | $ | (0.09 | ) | $ | (1.56 | ) | $ | (1.60 | ) | $ | (0.03 | ) | $ | (0.53 | ) | |||||
Weighted average shares outstanding | ||||||||||||||||||||
Basic and diluted | 19,460,299 | 16,256,465 | 13,263,881 | 12,642,996 | 12,177,396 | |||||||||||||||
Our bioproduction tools and services are comprised of five main offerings
● | Biopreservation media | |
● | Automated thawing devices | |
● | Cloud connected “smart” shipping containers | |
● | Freezer and storage technology and related components | |
● | Biological and pharmaceutical material storage |
Biopreservation Media
Our proprietary biopreservation media products, HypoThermosol® FRS and CryoStor®, are formulated to mitigate preservation-induced, delayed-onset cell damage and death, which result when cells and tissues are subjected to reduced temperatures. Our technology can provide our CGT customers with significant shelf life extension of biologic source material and final cell products, and can also greatly improve post-preservation cell and tissue viability and function. Our biopreservation media is serum-free, protein-free, fully defined, and manufactured under current Good Manufacturing Practices (cGMP). We strive to source wherever possible, the highest available grade, multi-compendium raw materials. We estimate our media products have been incorporated in over 450 customer clinical applications, including numerous chimeric antigen receptor (CAR) T cell and other cell types.
Stability (i.e. shelf-life) and functional recovery are crucial aspects of academic research and clinical practice in the biopreservation of biologic-based source material, intermediate derivatives, and isolated/derived/expanded cellular products and therapies. Limited stability is especially critical in the CGT field, where harvested cells and tissues will lose viability over time, if not maintained appropriately at normothermic body temperature (37ºC) or stored in a hypothermic state in an effective preservation medium. Chilling (hypothermia) is used to reduce metabolism and delay degradation of harvested cells and tissues. However, subjecting biologic material to hypothermic environments induces damaging molecular stress and structural changes. Although cooling successfully reduces metabolism (i.e., lowers demand for energy), various levels of cellular damage and death occur when using suboptimal methods. Traditional biopreservation media range from simple “balanced salt” (electrolyte) formulations to complex mixtures of electrolytes, energy substrates such as sugars, osmotic buffering agents and antibiotics. The limited stability, which results from the use of these traditional biopreservation media formulations, is a significant shortcoming that our optimized proprietary products address with great success.
Our scientific research activities over the last 20+ years enabled a detailed understanding of the molecular basis for the hypothermic and cryogenic (low-temperature induced) damage/destruction of cells through apoptosis and necrosis. This research led directly to the development of our HypoThermosol® FRS and CryoStor® technologies. Our proprietary biopreservation media products are specifically formulated to:
● | Minimize cell and tissue swelling |
● | Reduce free radical levels upon formation |
● | Maintain appropriate low temperature ionic balances |
● | Provide regenerative, high energy substrates to stimulate recovery upon warming |
● | Avoid the creation of an acidic state (acidosis) |
● | Inhibit the onset of apoptosis and necrosis |
A key feature of our biopreservation media products is their “fully-defined” profile. All of our cGMP products are serum-free, protein-free and are formulated and filled using aseptic processing. We strive to use USP/Multicompendial grade or the highest quality available synthetic components. All of these features benefit prospective customers by facilitating the qualification process required to incorporate our products into their regulatory filings.
The results of independent testing demonstrate that our biopreservation media products significantly extend shelf-life and improve cell and tissue post-thaw viability and function. Our products have demonstrated improved biopreservation outcomes, including greatly extended shelf-life and post-thaw viability, across a broad array of cell and tissue types.
Competing biopreservation media products are often formulated with simple isotonic media cocktails, animal serum, potentially a single sugar or human protein. A key differentiator of our proprietary HypoThermosol FRS formulation is the engineered optimization of the key ionic component concentrations for low temperature environments, as opposed to normothermic body temperature around 37°C, as found in culture media or saline-based isotonic formulas. Competing cryopreservation freeze media is often comprised of a single permeating cryoprotectant such as dimethyl sulfoxide (“DMSO”). Our CryoStor formulations incorporate multiple permeating and non-permeating cryoprotectant agents which allow for multiple mechanisms of protection and reduces the dependence on a single cryoprotectant. We believe that our products offer significant advantages over in-house formulations, or commercial “generic” preservation media, including, time saving, improved quality of components, more rigorous quality control release testing, more cost effective and improved preservation efficacy.
We estimate that annual revenue from each customer commercial application in which our products are used could range from $500,000 to $2.0 million, if such application is approved and our customer commences large scale commercial manufacturing of the biologic based therapy.
Automated, Water-Free Thawing Products
In April 2019, we acquired Astero Bio Corporation (“Astero”), to expand our bioprocessing tools portfolio and diversify our revenue streams. The Astero ThawSTAR® line includes automated vial and cryobag thawing products that control the heat and timing of the thawing process of biologic material. Our customizable, automated, water-free thawing products uses algorithmic programmed, heating plates to consistently bring biologic material from a frozen state to a liquid state in a controlled and consistent manner. This helps reduce damage during the temperature transition. The ThawSTAR products can reduce risks of contamination versus using a traditional water bath.
evo® Cloud Connected Shipping Containers
In August 2019, we acquired the remaining shares of SAVSU Technologies, Inc. (“SAVSU”) we did not previously own. SAVSU is a leading developer and supplier of next generation cold chain management tools for cell and gene therapies. The evo.is cloud app allows biologic products to be traced and tracked in real time. Our evo platform consists of rentable cloud-connected shippers and include technologies that enable tracking software provides real-time information on geolocation, payload temperature, ambient temperature, tilt of shipper, humidity, altitude, and real-time alerts when a shipper has been opened. Our internally developed evo.is software allows customers to customize alert notifications both in data measurements and user requirements. The evo Dry Vapor Shipper (“DVS”) is specifically marketed to cell and gene therapies. The evo DVS has improved form factor and ergonomics over the traditional dewar, including extended thermal performance, reduced liquid nitrogen recharge time, improved payload extractors and ability to maintain temperature for longer periods on its side.
We utilize couriers who already have established logistic channels and distribution centers. Our strategy greatly reduces the cash need to build out specialized facilities around the world. Our partnerships with several white glove couriers allow us to scale our sales and marketing effort by utilizing their salesforce. Our courier partnerships market our evo platform to their existing cell and gene therapy customers as a cost effective and innovative solution. We also market directly to our existing and prospective customers who can utilize the evo platform through our courier partnerships.
Liquid Nitrogen Freezer and Storage Devices
In November 2019, we acquired Custom Biogenic Systems, Inc. (“CBS”) a global leader in the design and manufacture of state-of-the-art liquid nitrogen laboratory freezers, cryogenic equipment and accessories. The addition of CBS allows for product line growth, diversification of revenue and the potential for reduction of supply chain costs for our evo dry vapor shippers.
Included in CBS’s product line of liquid nitrogen freezers are the Isothermal LN2 freezers, constructed with a patented system which stores liquid nitrogen in a jacketed space in the walls of the freezer. This dry storage method eliminates liquid nitrogen contact with stored specimens, reduces the risk of cross-contamination and provides increased user safety in a laboratory setting. To accommodate customer requirements, we offer customizable features including wide bodied and extended height.
To accompany the offerings of cryogenic freezer equipment, we supply equipment for storing critically important biological materials. This storage equipment includes upright freezer racks, chest freezer racks, liquid nitrogen freezer racks, canisters/cassettes and frames as well as laboratory boxes and dividers. Due to our onsite design and manufacturing capability, racks and canisters can be customized to address customers’ varying requirements.
In order to provide customers with a proactive approach to safety and monitoring of equipment containing liquefied gas, CBS offers Versalert, a patented wireless remote asset monitoring system that can monitor and record temperatures. Versalert has an intelligent mesh network system that enables customers to view current equipment conditions and receive alarm notification on smartphones, tablets or personal computers and maintain permanent electronic records for regulatory compliance and legal verification.
Biological and Pharmaceutical Storage
In October 2020, we acquired SciSafe Holdings, Inc. (“SciSafe”), a premier provider of biological and pharmaceutical storage. In addition to providing storage services, SciSafe provides cold chain logistics that ensures materials are kept at target temperatures from the moment that the materials leave the customer’s premises to their ultimate return. State-of-the-art monitoring systems employed by SciSafe allow for customers to monitor the storage temperatures of their materials throughout the entire logistics chain.
We operate four storage facilities in the USA.
Our Market Opportunity
The CGT market has been rapidly expanding, treating diseases once thought incurable. According to the Alliance for Regenerative Medicine (“ARM”) there were over 1,100 ongoing clinical trials utilizing regenerative medicine at the end of 2020. ARM also states there were over $19.9 billion in total global financings in the regenerative market in 2020. The FDA predicts ten to twenty cell and gene therapies per year will be approved by 2025.
These technologies change the way physicians treat patients. The manufacturing, distribution and the delivery process is significantly different from many other types of medicines and therapies. We believe we are well positioned to address many of the manufacturing difficulties in the process of producing cell and gene therapies.
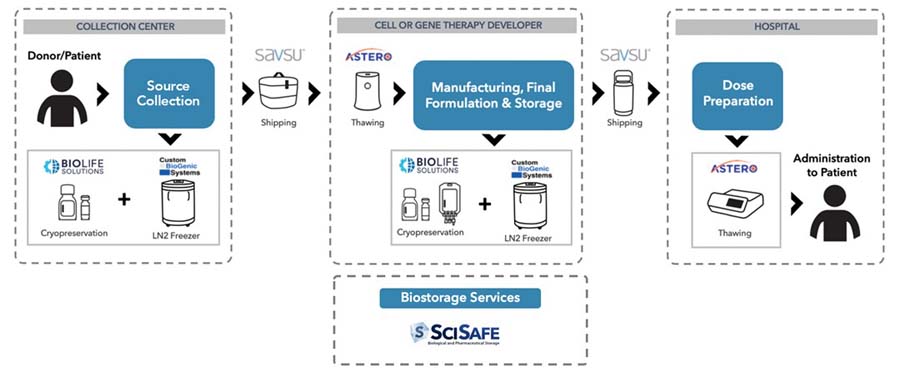
The Bioproduction Process
Our products currently fulfill several steps in the bioproduction process for cell and gene therapies. See the diagram below from an illustration of this process and our product roles. We now offer products that integrate into the critical steps of preservation, thawing, fixed storage, and transportable storage under controlled conditions.
Complementary Products Portfolio
Expanding Participation in Customers’ Workflow
Our Strategy
We aggressively leverage our numerous relationships with the leading cell and gene therapy companies that use our expanded product portfolio of bioproduction tools to cross-sell our portfolio of products and services. Over the last several years, we have built a strong reputation as a trusted supplier of critical tools used in cell and gene therapy manufacturing. We believe that our relationships and reputation could enable us to drive incremental revenue growth through the sale of additional products to a captive customer base. Our products are designed to increase our customers’ product yield and functionality, and we are committed to supporting our customers with strong customer service and our expertise associated with the clinical applications of our products.
Business Operations
Research and Development
Our research and development activity is focused on evaluating new potential disruptive technologies which may be applicable throughout the cell and gene therapy manufacturing workflow. We routinely assess and analyze the strengths and weaknesses of competitive products and are typically engaged in business development discussions on an ongoing basis. We strive to continue to introduce differentiated and high-quality products that address specific difficulties in the biologic storage preservation and thawing process.
Sales and Marketing
We market and sell our products through direct sales and third-party distribution.
We have experienced field-based sales employees who market our growing product portfolio on a direct basis. Over time, we anticipate expanding our sales team. Our technical applications engineers and customer care support teams have extensive experience in cell processing, biopreservation, freezing and thawing.
In the years ended December 31, 2020 and 2019, we derived approximately 13% of our revenue from one customer and approximately 15% of our revenue from one customer, respectively.
Our products are marketed and distributed by STEMCELL Technologies, MilliporeSigma, VWR, Thermo Fisher and several other regional distributors under non-exclusive agreements. In 2020, sales to third party distributors accounted for 45% of our revenue compared to 46% in 2019.
The following table represents the Company’s total revenue by geographic area (based on the location of the customer):
Year Ended December 31, | ||||||||
Revenue by customers’ geographic locations | 2020 | 2019 | ||||||
United States | 73 | % | 69 | % | ||||
Canada | 13 | % | 16 | % | ||||
Europe, Middle East, Africa (EMEA) | 12 | % | 14 | % | ||||
Other | 2 | % | 1 | % | ||||
Total revenue | 100 | % | 100 | % | ||||
Manufacturing
Biopreservation Media - We maintain and operate two independent cGMP clean room production suites for manufacturing sterile biopreservation media products in Bothell, Washington. Our quality management system (“QMS”) is certified to the ISO 13485:2016 standard. Our QMS is aligned with applicable sections of 21 CFR Part 820 - Quality System Regulation for Good Manufacturing Practice of medical devices, 21 CFR Parts 210 and 211 - cGMP for Finished Pharmaceuticals, FDA Guidance - Sterile Drug Products, Volume 4, EU Guidelines Annex 1 - Manufacture of Sterile Medicinal Products, ISO 13408 - Aseptic Processing of Healthcare Products, and ISO 14644 - Clean Rooms and Associated Controlled Environments. We seek to manage single-source supplier risk by regularly assessing the quality and capacity of our suppliers, implementing supply and quality agreements where appropriate and actively managing lead times and inventory levels of sourced components. Pursuant to our supply agreements, we are required to notify customers of any changes to our raw materials. For certain components in which we do not have a secondary supplier, we estimate that it would take up to six months to find and qualify a second source. Order quantities and lead times for externally sourced components are based on our forecasts, which are derived from historical demand and anticipated future demand. Lead times for components may vary depending on the size of the order, specific supplier requirements and current market demand for the materials and parts. Due to COVID-19, we have seen increased lead times for certain raw materials, particularly personal protective equipment used in our clean rooms and certain form factors of bottles and vials used in our finished products. To date, we have not experienced significant difficulties in obtaining raw materials for the manufacture of our biopreservation media products.
Automated Thawing –Our ThawSTAR automated, water-free thawing products are produced by a contract manufacturing organization (“CMO”) based in the United States. We believe this CMO has the skills, experience and capacity needed to meet our quality standards and demand expectations for the product line. Due to COVID-19, we have seen increased lead times from our CMO due to increased lead times from our CMO’s suppliers. We estimate that it would take up to six months to find and qualify an alternative CMO. To date, we have not experienced significant difficulties in obtaining our automated thaw products from our CMO.
evo Cold Chain Products –Production of our evo cold chain management hardware products is performed by external CMOs and by personnel in our Albuquerque, New Mexico facility. Our QMS is certified to the ISO 9001:2015 standard. Due to COVID-19, we have seen increased lead times for certain raw materials and components from our suppliers. To date, we have not experienced significant difficulties in obtaining raw materials for the manufacture of our evo cold chain products.
Freezer and Storage – The majority of our CBS freezers and related accessories are manufactured in our facility in Bruce Township, Michigan. We are reliant on certain critical suppliers for some components. Due to COVID-19, we have seen increased lead times for certain raw materials and components from our suppliers as well as increased costs on certain raw materials. To date, we have not experienced significant difficulties in obtaining raw materials for the manufacture of our freezer and storage products.
We practice continuous improvement based on routine internal audits as well as external feedback and audits performed by our partners and customers. In addition, we maintain a business continuity management system that focuses on key areas such as contingency planning, security stocks and off-site storage of raw materials and finished goods to ensure continuous supply of our products.
Biological storage
Biological and Pharmaceutical Storage –SciSafe operates three cGMP compliant storage facilities and two other state-of-the-art facilities in the United States. Two facilities are certified to the ISO 20387:2018 standard. We rely on outside suppliers for the build out of our cold-storage chambers and stand-alone freezers. Due to COVID-19, we have experienced increased lead times in acquiring stand-alone freezers, which we use to store customer’s biologic materials.
Product Regulatory Status
Our media, thawing, freezer, and evo products are not subject to any specific United States Food and Drug Administration (“FDA”) or other international marketing regulations for drugs, devices, or biologics. We are not required to sponsor formal prospective, controlled clinical trials in order to establish safety and efficacy. However, to support our current and prospective clinical customers, we manufacture and release our products in compliance with cGMP and other relevant quality standards.
To assist customers with their regulatory applications, we maintain Type II Master Files at the FDA for CryoStor, HypoThermosol FRS, BloodStor 27, and our Cell Thawing Media products, which provide the FDA with information regarding our manufacturing facility and process, our quality system, stability and safety, and any additional testing that has been performed. Customers engaged in clinical and commercial applications may notify the FDA of their intention to use our products in their product development and manufacturing process by requesting a cross-reference to our master files.
One freezer in our Customer Biogenic Systems product line is currently regulated as a Class 2 medical device in the EU.
Intellectual Property
The following table lists our granted and pending patents. We have also obtained certain trademarks and tradenames for our products to distinguish our genuine products from our competitors’ products and we maintain certain details about our processes, products, and strategies as trade secrets. While we believe that the protection of patents and trademarks is important to our business, we also rely on a combination of trade secrets, nondisclosure and confidentiality agreements, scientific expertise and continuing technological innovation to maintain our competitive position. Despite these precautions, it may be possible for unauthorized third parties to copy certain aspects of our products and/or to obtain and use information that we regard as proprietary (see “Item 1A. Risk Factors” of this Annual Report for additional details). The laws of some foreign countries in which we may sell our products do not protect our proprietary rights to the same extent as do the laws of the United States.
Issued Patents | Patents Applied For | Registered Trademarks | |
Media and thaw | 31 | 32 | 17 |
evo cold chain | 11 | 6 | 6 |
Freezers and accessories | 1 | 3 | 6 |
Storage services | - | - | 1 |
Total | 43 | 41 | 30 |
Competition
Our bioproduction products and services compete on the basis of value proposition, performance, quality, cost effectiveness, and application suitability with numerous established technologies. Additional products using new technologies that may be competitive with our products may also be introduced. Many of the companies selling or developing competitive products have greater financial and human resources, R&D, manufacturing and marketing experience than we do. They may undertake their own development of products that are substantially similar to or compete with our products and they may succeed in developing products that are more effective or less costly than any that we may develop. These competitors may also prove to be more successful in their production, marketing and commercialization activities. We cannot be certain that the research, development and commercialization efforts of our competitors will not render any of our existing or potential products obsolete.
Recent Developments
On March 19, 2021, we entered into an Agreement and Plan of Merger (the “Merger Agreement”) by and between us, BLFS Merger Subsidiary, Inc., our wholly-owned subsidiary (“Merger Sub”), and Global Cooling, Inc. (“Global Cooling”) pursuant to which Merger Sub will merge with and into Global Cooling, with Global Cooling continuing as the surviving entity and a wholly-owned subsidiary of the Company (the “GCI Merger”). The total consideration to be paid by us to the stockholders of Global Cooling at the closing will be 6,646,870 shares of our common stock (representing 19.9% of the number of our shares of common stock issued and outstanding immediately prior to the date of the execution of the Merger Agreement), a portion of which will be held in two segregated escrow accounts to serve as the sole source of payment for post-closing indemnification claims. The Merger Agreement provides for mutual indemnification, subject, in certain instances, to a basket and cap. The closing of the GCI Merger is subject to various customary closing conditions, including the approval of Global Cooling’s stockholders, and may be terminated by mutual agreement, for the other party’s uncured material breach, or if there is a government order preventing the closing, among other reasons. There is no assurance that the GCI Merger will close or that, if the GCI Merger does close, it will be successful or that Global Cooling will be, or will remain, profitable. For more information regarding the GCI Merger, please see our Current Report on Form 8-K filed on March 25, 2021. For further discussion of the risks relating to the GCI Merger, see “Risks Related to our Acquisition Strategy” in Item 1A. “Risk Factors”, below.
Human Capital
We view our employees and our culture as key to our success. As of December 31, 2020, we had 193 full time employees and 6 part-time employees. Our employees are not covered by any collective bargaining agreement. We consider relations with our employees to be good.
Corporate History
We were incorporated in Delaware in 1987 under the name Trans Time Medical Products, Inc. In 2002, the Company, then known as Cryomedical Sciences, Inc. was engaged in manufacturing and marketing cryosurgical products. The entity was merged with our wholly-owned subsidiary, BioLife Solutions, Inc., which was engaged as a developer and marketer of biopreservation media products for cells and tissues. Following the merger, we changed our name to BioLife Solutions, Inc.
Principal Offices; Available Information
Our principal executive offices are located at 3303 Monte Villa Parkway, Suite 310, Bothell, Washington 98021 and the telephone number is (425) 402-1400. We maintain a website at www.biolifesolutions.com. The information contained on or accessible through our website is not part of this Annual Report on Form 10-K and is not incorporated in any manner into this Annual Report. Our Annual Report on Form 10-K, Quarterly Reports on Form 10-Q, Current Reports on Form 8-K and amendments to reports filed or furnished pursuant to Sections 13(a) and 15(d) of the Securities Exchange Act of 1934 (the “Exchange Act”), are available free of charge on our website as soon as reasonably practicable after we electronically file such reports with, or furnish those reports to, the Securities and Exchange Commission (the “SEC”). The SEC also maintains an Internet site that contains reports, proxy and information statements, and other information regarding issuers that file electronically with the SEC at http://www.sec.gov.
RISK FACTORS |
Investing in our common stock involves a high degree of risk. You should carefully consider the risks and uncertainties described below, together with all of the other information contained in this Annual Report, before deciding to invest in our common stock. If any of the following risks materialize, our business, financial condition, results of operation and prospects will likely be materially and adversely affected. In that event, the market price of our common stock could decline and you could lose all or part of your investment.
Risks Related to our Financial Condition
The majority of our net product revenue come from a relatively small number of customers and products in a limited number of market sectors; if we lose any of these customers or if there are problems in those market sectors, particularly as a result of the COVID-19 pandemic, our net product revenue and operating results could decline significantly.
In the years ended December 31, 2020 and 2019, we derived approximately 13% and 15% of our revenue from one customer, respectively. No other customer accounted for more than 10% of revenue in the years ended December 31, 2020 or 2019. In the years ended December 31, 2020 and 2019, we derived approximately 60% and 74% of our revenue from CryoStor products, respectively. Due to our acquisitions in 2020 and 2019, and our expected merger with Global Cooling in 2021, we expect both our revenue concentration related to CryoStor, and our customer concentration to be reduced for the year ending December 31, 2021. Our principal customers may vary from period to period and such customers may not continue to purchase products from us at current levels or at all (particularly as a result of the COVID-19 pandemic). Further, the inability of some of our customers to consummate anticipated purchases of our products due to changes in end-user demand, and other unpredictable factors that may affect customer ordering patterns could lead to significant reductions in net product revenue which could harm our business. Because our revenue and operating results are difficult to predict (particularly as a result of the COVID-19 pandemic), we believe that period-to-period comparisons of our results of operations are not a good indicator of our future performance. Additionally, if revenue declines in a quarter, whether due to a delay in recognizing expected revenue, adverse economic conditions, the COVID-19 pandemic or otherwise, our results of operations will be harmed because many of our expenses are relatively fixed. In particular, a large portion of our manufacturing costs, our research and development, sales and marketing and general and administrative expenses are not significantly affected by variations in revenue. Further, our cost of product revenue is dependent on product mix. If our quarterly operating results fail to meet investor expectations, the price of our common stock may decline.
We expect our operating results to fluctuate significantly from period to period.
Following our acquisitions in 2020 and 2019, we have increased our fixed costs and now sell products having higher costs of product revenue than our biopreservation media products. We expect that the result of these acquisitions will make it more difficult to predict our revenue and operating results from period-to-period and that, as a result, comparisons of our results of operations are not currently and will not be for the foreseeable future a good indicator of our future performance. For example, if revenue declines in a quarter, whether due to a delay in recognizing expected revenue, adverse economic conditions, the COVID-19 pandemic or otherwise, our results of operations in such period will be harmed because many of our expenses are now relatively fixed. In particular, a large portion of our manufacturing costs, research and development expenses, sales and marketing expenses and general and administrative expenses are not significantly affected by variations in revenue. Further, a shift in product revenue concentration away from our CryoStor products and towards our new products with higher costs of product revenue will adversely affect our operating margin. If our quarterly operating results fail to meet investor expectations, the price of our common stock may decline.
Risks Related to our Acquisition Strategy and the GCI Merger
We may engage in future acquisitions or strategic transactions which may require us to seek additional financing or financial commitments, increase our expenses and/or present significant distractions to our management.
In fiscal 2020 and 2019, we acquired four companies and made investments in three other companies (including a follow-on investment in one company). Additionally, on March 19, 2021, we entered into an agreement and plan of merger with Global Cooling to acquire all of the shares of Global Cooling, which we expect to close, subject to receipt of approval from the stockholders of Global Cooling and certain regulatory approvals, on or prior to May 1, 2021. We are continuing to actively evaluate opportunities to grow our portfolio of cell and gene therapy tools. In the event we engage in an acquisition or strategic transaction, including by making an investment in another company, we may need to acquire additional financing. Obtaining financing through the issuance or sale of additional equity and/or debt securities, if possible, may not be at favorable terms and may result in additional dilution to our current stockholders. Additionally, any such transaction may require us to incur non-recurring or other charges, may increase our near and long-term expenditures and may pose significant integration challenges or disrupt our management or business, which could adversely affect our operations and financial results. For example, an acquisition or strategic transaction, including the merger with Global Cooling, may entail numerous operational and financial risks, including the risks outlined above and additionally:
● | exposure to unknown liabilities; |
● | disruption of our business and diversion of our management's time and attention in order to develop acquired products or technologies; |
● | higher than expected acquisition and integration costs; |
● | write-downs of assets or goodwill or impairment charges; |
● | increased amortization expenses; |
● | difficulty and cost in combining the operations and personnel of any acquired businesses with our operations and personnel; |
● | impairment of relationships with key suppliers or customers of any acquired businesses due to changes in management and ownership; and |
● | inability to retain key employees of any acquired businesses. |
Accordingly, although there can be no assurance that we will undertake or successfully complete any transactions of the nature described above, including the Global Cooling transaction, any transactions that we do complete could have a material adverse effect on our business, results of operations, financial condition and prospects.
If intangible assets and goodwill that we recorded in connection with our acquisitions become impaired, we may have to take significant charges against earnings.
In connection with the accounting for our completed acquisitions in 2020 and 2019, we recorded a significant amount of intangible assets, including developed technology and customer relationships relating to the acquired product lines, and goodwill. Under U.S. GAAP, we must assess, at least annually and potentially more frequently, whether the value of intangible assets and goodwill has been impaired. Intangible assets and goodwill will be assessed for impairment in the event of an impairment indicator. Any reduction or impairment of the value of intangible assets and goodwill will result in a charge against earnings, which could materially adversely affect our results of operations and shareholders’ equity in future periods.
Our acquisitions expose us to risks that could adversely affect our business, and we may not achieve the anticipated benefits of acquisitions of businesses or technologies.
As a part of our growth strategy, we have made and may continue to make selected acquisitions of complementary products and/or businesses, including the expected merger with Global Cooling. Any acquisition involves numerous risks and operational, financial, and managerial challenges, including the following, any of which could adversely affect our business, financial condition, or results of operations:
• | difficulties in integrating new operations, technologies, products, and personnel; |
• | problems maintaining uniform procedures, controls and policies with respect to our financial accounting systems; |
• | lack of synergies or the inability to realize expected synergies and cost-savings; |
• | difficulties in managing geographically dispersed operations, including risks associated with entering foreign markets in which we have no or limited prior experience; |
• | underperformance of any acquired technology, product, or business relative to our expectations and the price we paid; |
• | negative near-term impacts on financial results after an acquisition, including acquisition-related earnings charges; |
• | the potential loss of key employees, customers, and strategic partners of acquired companies; |
• | claims by terminated employees and shareholders of acquired companies or other third parties related to the transaction; |
• | the assumption or incurrence of additional debt obligations or expenses, or use of substantial portions of our cash; |
• | the issuance of equity securities to finance or as consideration for any acquisitions that dilute the ownership of our stockholders (which in the case of Global Cooling, is significant); |
• | the issuance of equity securities to finance or as consideration for any acquisitions may not be an option if the price of our common stock is low or volatile which could preclude us from completing any such acquisitions; |
• | diversion of management’s attention and company resources from existing operations of the business; |
• | inconsistencies in standards, controls, procedures, and policies; |
• | the impairment of intangible assets as a result of technological advancements, or worse-than-expected performance of acquired companies; |
• | assumption of, or exposure to, historical liabilities of the acquired business, including unknown contingent or similar liabilities that are difficult to identify or accurately quantify; and |
• | risks associated with acquiring intellectual property, including potential disputes regarding acquired companies’ intellectual property. |
In addition, the successful integration of acquired businesses requires significant efforts and expense across all operational areas, including sales and marketing, research and development, manufacturing, finance, legal, and information technologies. There can be no assurance that any of the acquisitions we may make will be successful or will be, or will remain, profitable. Our failure to successfully address the foregoing risks may prevent us from achieving the anticipated benefits from any acquisition in a reasonable time frame, or at all.
The closing of the GCI Merger is subject to various closing conditions, including the receipt of stockholder approval from the Global Cooling Stockholders, and if these conditions are not met or waived, we will not be able to close the GCI Merger which may adversely affect our business, financial results and stock price.
The Merger Agreement provides that various closing conditions must be met before the GCI Merger will close including, but not limited to, receipt of stockholder approval from the Global Cooling stockholders and receipt of certain regulatory approvals. If these closing conditions are not met or waived, if permissible, we will not be able to close the GCI Merger. If the GCI Merger is not completed, our ongoing business may be adversely affected and we could see an impact on our financial results and stock price.
The integration of Global Cooling after the GCI Merger may result in significant accounting charges that adversely affect the announced results of our company.
The financial results of our company may be adversely affected by cash expenses and non-cash accounting charges incurred in connection with the GCI Merger. In addition to the anticipated cash charges, costs associated with the amortization of intangible assets are expected. The parties are in the process of preparing pro forma financial statements that reflect the effects of the GCI Merger and, accordingly, the amount and timing of these possible charges are not yet known. The price of our common stock could decline to the extent our financial results are materially affected by the foregoing charges or if the foregoing charges are larger than anticipated.
The announcement and pendency of the GCI Merger could cause disruptions in the businesses of our company and Global Cooling which could have an adverse effect on our and their business and financial results both prior to and after the closing of the GCI Merger.
Each party has operated and, until the completion of the GCI Merger, will continue to operate independently. Uncertainty about the effect of the GCI Merger on employees, customers, distributors and suppliers may have an adverse effect on us and Global Cooling both prior to and following closing of the GCI Merger. These uncertainties may impair each parties’ ability to retain and motivate key personnel and could cause customers, distributors, suppliers and others with whom each company deals to seek to change existing business relationships which may materially and adversely affect their respective businesses. Due to the materiality standards agreed to by the parties in the Merger Agreement, each party may be obligated to consummate the GCI Merger in spite of the adverse effects resulting from the disruption of our and Global Cooling’s ongoing businesses. Furthermore, this disruption could adversely affect our ability to maintain relationships with our and their customers, distributors, suppliers and employees after the GCI Merger or to achieve the anticipated benefits of the GCI Merger. Moreover, integration efforts between the two companies will also divert management attention and resources. These integration matters could have an adverse effect on each party. Each of these events could adversely affect us, in the near term and, if the GCI Merger is completed, thereafter.
The regulatory approvals required to close the GCI Merger may not be obtained or may contain materially burdensome conditions.
Completion of the GCI Merger is conditioned upon the receipt of certain governmental approvals, including the expiration or termination of the applicable antitrust waiting periods, and any extension of the waiting periods. Although the parties have agreed in the Merger Agreement to use their best efforts to obtain the requisite governmental approvals, there can be no assurance that these approvals will be obtained. In addition, the governmental entities from which these approvals are required may impose conditions on the completion of the GCI Merger or require changes to the terms of the GCI Merger. While the parties do not currently expect that any such conditions or changes would be imposed, there can be no assurance that they will not be, and such conditions or changes could have the effect of jeopardizing or delaying completion of the GCI Merger or reducing the anticipated benefits of the GCI Merger. If either party agrees to any material conditions in order to obtain any approvals required to complete the GCI Merger, the business and results of operations of the combined company may be adversely affected.
The GCI Merger may result in unexpected consequences to our business and results of operations.
Although Global Cooling’s business will generally be subject to risks similar to those to which we are subject to in our existing operations, we may not have discovered all risks applicable to Global Cooling’s business during the due diligence process and such risks may not be discovered prior to closing. Some of these risks could produce unexpected and unwanted consequences for us. Undiscovered risks may result in us incurring financial liabilities, which could be material and have a negative impact on our business operations.
Failure to realize the benefits expected from the GCI Merger could adversely affect the value of our common stock.
The success of the GCI Merger will depend, in part, on our ability to:
● | capitalize on our cross-selling opportunities by leveraging our extensive relationships with cell and gene therapy companies to drive sales of Global Cooling’s freezers and leveraging Global Cooling’s relationships with its customers to offer them our full portfolio of bioproduction tools and services; |
● | realize the anticipated cost savings from vertical integration of our synergies including lower capital costs in deploying Global Cooling’s freezers in SciSafe global biorepositories, expanding manufacturing capacity for Global Cooling’s freezers at our CBS facilities and expanding the reach of the Global Cooling sales team and distributors to provide access to our entire portfolio of bioproduction tools and services offered to the cell and gene therapy and biopharma markets; and |
● | realize cost savings from reduced back-office and infrastructure expenses, elimination of duplicative company and management structure costs, and improved purchasing power through greater scale. |
However, to realize the anticipated benefits of the GCI Merger we must successfully integrate the business of Global Cooling in a manner that permits those benefits and cost savings to be realized. Although we expect significant benefits to result from the GCI Merger, there can be no assurance that we will be able to successfully realize these benefits. The challenges involved in this integration, which will be complex and time consuming. If we do not successfully manage these and related issues and challenges, we may not achieve the anticipated benefits of the GCI Merger and our revenue, expenses, operating results, financial condition and stock price could be materially adversely affected.
Risks Related to our Business and Operations
Healthcare reform measures could adversely affect our business.
The efforts of governmental and third-party payors to contain or reduce the costs of healthcare may adversely affect the business and financial condition of pharmaceutical and biotechnology companies, including ours. Specifically, in both the United States and some foreign jurisdictions, there have been a number of legislative and regulatory proposals to change the healthcare system in ways that could affect our ability to sell our products profitably. Efforts by governments and other third-party payors to contain or reduce the costs of healthcare through various means may limit our commercial opportunities and adversely affect our operating results and result in a decrease in the price of our common stock or limit our ability to raise capital.
If our products do not perform as expected or the reliability of the technology on which our products are based is questioned, we could experience lost revenue, delayed or reduced market acceptance of our products, increased costs and damage to our reputation.
Our success depends on the market’s confidence that we can provide reliable, high-quality products to our customers. We believe that customers in our target markets are likely to be particularly sensitive to product defects and errors. Our reputation and the public image of our products and technologies may be impaired if our products fail to perform as expected. Although our products are tested prior to shipment, defects or errors could nonetheless occur in our products. In the future, if our products experience, or are perceived to experience, a material defect or error, this could result in loss or delay of revenues, delayed market acceptance, damaged reputation, diversion of development resources, legal claims, increased insurance costs or increased service and warranty costs, any of which could harm our business. Such defects or errors could also narrow the scope of the use of our products, which could hinder our success in the market. Even after any underlying concerns or problems are resolved, any lingering concerns in our target market regarding our technology or any manufacturing defects or performance errors in our products could continue to result in lost revenue, delayed market acceptance, damaged reputation, increased service and warranty costs and claims against us.
We face significant competition.
The life sciences industry is highly competitive. We anticipate that we will continue to face increased competition as existing companies may choose to develop new or improved products and as new companies could enter the market with new technologies, any of which could compete with our product or even render our products obsolete. Many of our competitors are significantly larger than us and have greater financial, technical, research, marketing, sales, distribution and other resources than us. There can be no assurance that our competitors will not succeed in developing or marketing technologies and products that are more effective or commercially attractive than any that are being developed or marketed by us, or that such competitors will not succeed in obtaining regulatory approval, or introducing or commercializing any such products, prior to us. Such developments could have a material adverse effect on our business, financial condition and results of operations. Also, even if we can compete successfully, there can be no assurance that we can continue do so in a profitable manner.
We are dependent on outside suppliers for all our manufacturing supplies.
We rely on outside suppliers for all our manufacturing supplies, parts and components. Although we believe we could develop alternative sources of supply for most of these components within a reasonable period of time, there can be no assurance that, in the future, our current or alternative sources will be able to meet all our demands on a timely basis, particularly given the uncertainty surrounding the COVID-19 pandemic. Unavailability of necessary components could require us to re-engineer our products to accommodate available substitutions, which could increase costs to us and/or have a material adverse effect on manufacturing schedules, products performance and market acceptance. In addition, an uncorrected defect or supplier’s variation in a component or raw material, either unknown to us or incompatible with our manufacturing process, could harm our ability to manufacture products. We might not be able to find a sufficient alternative supplier in a reasonable amount of time, or on commercially reasonable terms, if at all. If we fail to obtain a supplier for the components of our products, our operations could be disrupted.
Our success will depend on our ability to attract and retain key personnel.
In order to execute our business plan, we must attract, retain and motivate highly qualified managerial, scientific, manufacturing, and sales personnel. If we fail to attract and retain skilled scientific and sales personnel, our sales efforts will be hindered. Our future success depends to a significant degree upon the continued services of key scientific and technical personnel. If we do not attract and retain qualified personnel, we will not be able to achieve our growth objectives.
Difficulties in manufacturing could have an adverse effect upon our expenses and our product revenues.
We currently manufacture all of our biopreservation media products, freezer products and related components. We currently outsource most of the manufacturing of our ThawSTAR and evo products. The manufacturing of our products is difficult and complex. To support our current and prospective clinical customers, we comply with and intend to continue to comply with cGMP in the manufacture of our products. Our ability to adequately manufacture and supply our products in a timely matter is dependent on the uninterrupted and efficient operation of our facilities and those of third-parties producing raw materials and supplies upon which we rely in our manufacturing. The manufacture of our products may be impacted by:
● | availability or contamination of raw materials and components used in the manufacturing process, particularly those for which we have no other source or supplier; |
● | the ongoing capacity of our facilities; |
● | our ability to comply with new regulatory requirements, including our ability to comply with cGMP; |
● | inclement weather and natural disasters; |
● | changes in forecasts of future demand for product components; |
● | potential facility contamination by microorganisms or viruses; |
● | updating of manufacturing specifications; |
● | product quality success rates and yields; and |
● | global viruses and pandemics, including the current COVID-19 pandemic. |
If efficient manufacture and supply of our products is interrupted, we may experience delayed shipments or supply constraints. If we are at any time unable to provide an uninterrupted supply of our products to customers, our customers may be unable to supply their end-products incorporating our products to their patients and other customers, which could materially and adversely affect our product revenue and results of operations.
While we are not currently subject to FDA or other regulatory approvals on our products, if we become subject to regulatory requirements, the manufacture and sale of our products may be delayed or prevented, or we may become subject to increased expenses.
None of our products are subject to FDA. In particular, we are not required to sponsor formal prospective, controlled clinical-trials to establish safety and efficacy. Additionally, we comply with cGMP requirements. This is done solely to support our current and prospective clinical customers. However, there can be no assurance that we will not be required to obtain approval from the FDA, or foreign regulatory authorities, as applicable, prior to marketing any of our products in the future. Any such requirements could delay or prevent the sale of our products or may subject us to additional expenses.
We are and may become the subject of various claims, litigation or investigations which could have a material adverse effect on our business, financial condition, results of operations or price of our common stock.
We are and may become subject to various claims (including “whistleblower” complaints), litigation or investigations, including commercial disputes and employee claims, and from time to time may be involved in governmental or regulatory investigations or similar matters. Any claims asserted against us or our management, regardless of merit or eventual outcome, could harm our reputation and have an adverse impact on our relationship with our clients, distribution partners and other third parties and could lead to additional related claims. Furthermore, there is no guarantee that we will be successful in defending ourselves in pending or future litigation or similar matters under various laws. Any judgments or settlements in any pending litigation or future claims, litigation or investigation could have a material adverse effect on our business, financial condition, results of operations and price of our common stock.
Risks Related to our Intellectual Property and Cyber Security
Expiration of our patents may subject us to increased competition and reduce our opportunity to generate product revenue.
The patents for our products have varying expiration dates and, when these patents expire, we may be subject to increased competition and we may not be able to recover our development costs. In some of the larger economic territories, such as the United States and Europe, patent term extension/restoration may be available. We cannot, however, be certain that an extension will be granted or, if granted, what the applicable time or the scope of patent protection afforded during any extended period will be. If we are unable to obtain patent term extension/restoration or some other exclusivity, we could be subject to increased competition and our opportunity to establish or maintain product revenue could be substantially reduced or eliminated. Furthermore, we may not have sufficient time to recover our development costs prior to the expiration of our U.S. and non-U.S. patents.
Our proprietary rights may not adequately protect our technologies and products.
Our commercial success will depend on our ability to obtain patents and/or regulatory exclusivity and maintain adequate protection for our technologies and products in the United States and other countries. We will be able to protect our proprietary rights from unauthorized use by third parties only to the extent that our proprietary technologies and products are covered by valid and enforceable patents or are effectively maintained as trade secrets.
We intend to apply for additional patents covering both our technologies and products, as we deem appropriate. We may, however, fail to apply for patents on important technologies or products in a timely fashion, if at all. Our existing patents and any future patents we obtain may not be sufficiently broad to prevent others from practicing our technologies or from developing competing products and technologies. In addition, the patent positions of life science industry companies are highly uncertain and involve complex legal and factual questions for which important legal principles remain unresolved. As a result, the validity and enforceability of our patents cannot be predicted with certainty. In addition, we cannot guarantee that:
● | we were the first to make the inventions covered by each of our issued patents and pending patent applications; |
● | we were the first to file patent applications for these inventions; |
● | others will not independently develop similar or alternative technologies or duplicate any of our technologies; |
● | any of our pending patent applications will result in issued patents; |
● | any of our patents will be valid or enforceable; |
● | any patents issued to us will provide us with any competitive advantages, or will not be challenged by third parties; and |
● | we will develop additional proprietary technologies that are patentable, or the patents of others will not have an adverse effect on our business. |
The actual protection afforded by a patent varies on a product-by-product basis, from country to country and depends on many factors, including the type of patent, the scope of its coverage, the availability of regulatory related extensions, the availability of legal remedies in a particular country and the validity and enforceability of the patents. Our ability to maintain and solidify our proprietary position for our products will depend on our success in obtaining effective claims and enforcing those claims once granted. Our issued patents and those that may be issued in the future, or those licensed to us, may be challenged, invalidated, unenforceable or circumvented, and the rights granted under any issued patents may not provide us with proprietary protection or competitive advantages against competitors with similar products. We also rely on trade secrets to protect some of our technology, especially where it is believed that patent protection is inappropriate or unobtainable. However, trade secrets are difficult to maintain. While we use reasonable efforts to protect our trade secrets, our employees, consultants, contractors or scientific and other advisors may unintentionally or willfully disclose our proprietary information to competitors. Enforcement of claims that a third party has illegally obtained and is using trade secrets is expensive, time consuming and uncertain. In addition, non-U.S. courts are sometimes less willing than U.S. courts to protect trade secrets. If our competitors independently develop equivalent knowledge, methods and know-how, we would not be able to assert our trade secrets against them and our business could be harmed.
We may not be able to protect our intellectual property rights throughout the world.
Filing, prosecuting and defending patents on all our products in every jurisdiction would be prohibitively expensive. Competitors may use our technologies in jurisdictions where we have not obtained patent protection to develop their own products. These products may compete with our products and may not be covered by any patent claims or other intellectual property rights.
The laws of some non-U.S. countries do not protect intellectual property rights to the same extent as the laws of the United States, and many companies have encountered significant problems in protecting and defending such rights in foreign jurisdictions. The legal systems of certain countries, particularly certain developing countries, do not favor the enforcement of patents and other intellectual property protection, particularly those relating to biotechnology, which could make it difficult for us to stop the infringement of our patents. Proceedings to enforce our patent rights in foreign jurisdictions could result in substantial cost and divert our efforts and attention from other aspects of our business.
If we fail to protect our intellectual property rights, our competitors may take advantage of our ideas and compete directly against us.
Our success will depend to a significant degree on our ability to secure and protect intellectual property rights and enforce patent and trademark protections relating to our technology. While we believe that the protection of patents and trademarks is important to our business, we also rely on a combination of copyright, trade secret, nondisclosure and confidentiality agreements, know-how and continuing technological innovation to maintain our competitive position. From time to time, litigation may be advisable to protect our intellectual property position. However, these legal means afford only limited protection and may not adequately protect our rights or permit us to gain or keep any competitive advantage. Any litigation in this regard could be costly, and it is possible that we will not have sufficient resources to fully pursue litigation or to protect our intellectual property rights. This could result in the rejection or invalidation of our existing and future patents. Any adverse outcome in litigation relating to the validity of our patents, or any failure to pursue litigation or otherwise to protect our patent position, could materially harm our business and financial condition. In addition, confidentiality agreements with our employees, consultants, customers, and key vendors may not prevent the unauthorized disclosure or use of our technology. It is possible that these agreements will be breached or that they will not be enforceable in every instance, and that we will not have adequate remedies for any such breach. Enforcement of these agreements may be costly and time consuming. Furthermore, the laws of foreign countries may not protect our intellectual property rights to the same extent as the laws of the United States.
We may incur substantial costs as a result of litigation or other proceedings relating to patent and other intellectual property rights and we may be unable to protect our rights to, or use of, our technology.
If we choose to go to court to stop someone else from using the inventions claimed in our patents or our licensed patents, that individual or company has the right to ask the court to rule that these patents are invalid and/or should not be enforced against that third party. These lawsuits are expensive and would consume time and other resources even if we were successful in stopping the infringement of these patents. In addition, there is a risk that the court will decide that these patents are invalid or unenforceable and that we do not have the right to stop the other party from using the inventions. There is also the risk that, even if the validity or enforceability of these patents is upheld, the court will refuse to stop the other party on the grounds that such other party’s activities do not infringe our rights.
If we wish to use the technology claimed in issued and unexpired patents owned by others, we will need to obtain a license from the owner, enter into litigation to challenge the validity or enforceability of the patents or incur the risk of litigation in the event that the owner asserts that we infringed its patents. The failure to obtain a license to technology or the failure to challenge an issued patent that we may require to discover, develop or commercialize our products may have a material adverse effect on us.
If a third party asserts that we infringed its patents or other proprietary rights, we could face a number of risks that could seriously harm our results of operations, financial condition and competitive position, including:
● | patent infringement and other intellectual property claims, which would be costly and time consuming to defend, whether or not the claims have merit, and which could delay a product and divert management’s attention from our business; |
● | substantial damages for past infringement, which we may have to pay if a court determines that our product or technologies infringe a competitor’s patent or other proprietary rights; |
● | a court prohibiting us from selling or licensing our technologies unless the third party licenses its patents or other proprietary rights to us on commercially reasonable terms, which it is not required to do; and |
��� | if a license is available from a third party, we may have to pay substantial royalties or lump-sum payments or grant cross licenses to our patents or other proprietary rights to obtain that license. |
The biotechnology industry has produced a proliferation of patents, and it is not always clear to industry participants, including us, which patents cover various types of products or methods of use. The coverage of patents is subject to interpretation by the courts, and the interpretation is not always uniform. If we are sued for patent infringement, we would need to demonstrate that our products or methods of use either do not infringe the patent claims of the relevant patent, and/or that the patent claims are invalid, and/or that the patent is unenforceable, and we may not be able to do this. Proving invalidity, in particular, is difficult since it requires a showing of clear and convincing evidence to overcome the presumption of validity enjoyed by issued patents.
U.S. patent laws as well as the laws of some foreign jurisdictions provide for provisional rights in published patent applications beginning on the date of publication, including the right to obtain reasonable royalties, if a patent subsequently issues and certain other conditions are met.
Because some patent applications in the United States may be maintained in secrecy until the patents are issued, because patent applications in the United States and many foreign jurisdictions are typically not published until 18 months after filing, and because publications in the scientific literature often lag behind actual discoveries, we cannot be certain that others have not filed patent applications for technology covered by our issued patents or our pending applications, or that we were the first to invent the technology.
Patent applications filed by third parties that cover technology similar to ours may have priority over our patent applications and could further require us to obtain rights to issued patents covering such technologies. If another party files a U.S. patent application on an invention similar to ours, we may elect to participate in or be drawn into an interference proceeding declared by the U.S. Patent and Trademark Office to determine priority of invention in the United States. The costs of these proceedings could be substantial, and it is possible that such efforts would be unsuccessful, resulting in a loss of our U.S. patent position with respect to such inventions. Some of our competitors may be able to sustain the costs of complex patent litigation more effectively than we can because they have substantially greater resources. In addition, any uncertainties resulting from the initiation and continuation of any litigation could have a material adverse effect on our ability to raise the funds necessary to continue our operations. We cannot predict whether third parties will assert these claims against us, or whether those claims will harm our business. If we are forced to defend against these claims, whether they are with or without any merit and whether they are resolved in favor of or against us, we may face costly litigation and diversion of management’s attention and resources. As a result of these disputes, we may have to develop costly non-infringing technology, or enter into licensing agreements. These agreements, if necessary, may be unavailable on terms acceptable to us, if at all, which could seriously harm our business or financial condition.
Our inability to protect our systems and data from continually evolving cybersecurity risks or other technological risks, including as a result of breaches of our associated third parties, could affect our ability to conduct our business.
In conducting our business, we process, transmit and store sensitive business information and personal information about our customers, vendors, and other parties. This information may include account access credentials, credit and debit card numbers, bank account numbers, social security numbers, driver’s license numbers, names and addresses and other types of sensitive business or personal information. Some of this information is also processed and stored by our third-party service providers to whom we outsource certain functions and other agents, including our customers, which we refer to collectively as our associated third parties.
We are a regular target of malicious third-party attempts to identify and exploit system vulnerabilities, and/or penetrate or bypass our security measures, in order to gain unauthorized access to our networks and systems or those of our associated third parties. Such access could lead to the compromise of sensitive, business, personal or confidential information. As a result, we proactively employ multiple methods at different layers of our systems to defend our systems against intrusion and attack and to protect the data we collect. However, we cannot be certain that these measures will be successful and will be sufficient to counter all current and emerging technology threats that are designed to breach our systems in order to gain access to confidential information.
Our computer systems and our associated third parties’ computer systems could be in the future, subject to breach, and our data protection measures may not prevent unauthorized access. The techniques used to obtain unauthorized access, disable or degrade service, or sabotage systems change frequently and are often difficult to detect. Threats to our systems and our associated third parties’ systems can derive from human error, fraud or malice on the part of employees or third parties, or may result from accidental technological failure. Computer viruses and other malware can be distributed and could infiltrate our systems or those of our associated third parties. In addition, denial of service or other attacks could be launched against us for a variety of purposes, including to interfere with our services or create a diversion for other malicious activities. Our defensive measures may not prevent downtime, unauthorized access or use of sensitive data. Further, while we select our third party service providers carefully, and we seek to ensure that our customers adequately protect their systems and data, we do not control their actions and are not able to oversee their processes. Any problems experienced by our associated third parties, including those resulting from breakdowns or other disruptions in the services provided by such parties or cyber-attacks and security breaches, could adversely affect our ability to conduct our business and our financial condition.
We could also be subject to liability for claims relating to misuse of personal information, such as violation of data privacy laws. We cannot provide assurance that the contractual requirements related to security and privacy that we impose on our service providers who have access to customer data will be followed or will be adequate to prevent the unauthorized use or disclosure of data. Any failure to adequately enforce or provide these protective measures could result in liability, protracted and costly litigation, governmental intervention and fines.
Risks Related to our Common Stock
Our stock price may be volatile, and purchasers of our securities could incur substantial losses.
Our common stock, traded on the NASDAQ Capital Market, may be volatile and has experienced price and volume fluctuations. For example, in the year ended December 31, 2020, the highest intra-day sale price of our common stock on Nasdaq was $47.22 per share and the lowest intra-day sale price of our common stock on NASDAQ was $7.37 per share. We may continue to incur substantial increases or decreases in our stock price in the foreseeable future.
Our stock price and the market prices of many publicly traded companies, including emerging companies in the life sciences industry, have been, and can be expected to be, highly volatile. The future market price of our common stock could be significantly impacted by numerous factors, including, but not limited to:
● | Future sales of our common stock or other fundraising events; |
● | Sales of our common stock by existing shareholders; |
● | Changes in our capital structure, including stock splits or reverse stock splits; |
● | Announcements of technological innovations for new commercial products by our present or potential competitors; |
● | Developments concerning proprietary rights; |
● | Adverse results in our field or with clinical tests of our products in customer applications; |
● | Adverse litigation; |
● | Unfavorable legislation or regulatory decisions; |
● | Public concerns regarding our products; |
● | Variations in quarterly operating results; |
● | General trends in the health care industry; |
● | Global viruses, epidemics and pandemics, including the current COVID-19 pandemic; and |
● | Other factors outside of our control, including significant market fluctuations. |
A significant percentage of our outstanding common stock is held by two stockholders, and these stockholders therefore have significant influence on us and our corporate actions.
As of December 31, 2020, based on our review of public filings and the Company’s records, two of our existing stockholders, (i) WAVI Holdings AG and (ii) Casdin Capital, LLC (“Casdin”), owned, collectively, 11.1 million shares of our common stock, representing 34% of the issued and outstanding shares of common stock. Accordingly, these stockholders have had, and will continue to have, significant influence in determining the outcome of any corporate transaction or other matter submitted to the stockholders for approval, including mergers, consolidations and the sale of all or substantially all our assets, election of directors and other significant corporate actions. In addition, without the consent of these stockholders, we could be prevented from entering into transactions that could be beneficial to us.
Any future sales of our securities in the public markets or any future securities issuances in connection with our acquisition strategy, including with respect to the expected merger with Global Cooling, may cause the trading price of our common stock to decline and could impair our ability to raise capital through future equity offerings.
Sales of a substantial number of shares of our common stock or other securities in the public markets, or the perception that these sales may occur, could cause the market price of our common stock or other securities to decline and could materially impair our ability to raise capital through the sale of additional securities. If we issue additional securities in a public offering or a private placement, such sales or any resales of such securities could further adversely affect the market price of our common stock. The sale of a large number of shares of our common stock or other securities also might make it more difficult for us to sell equity or equity-related securities in the future at a time and at the prices that we deem appropriate.
We do not anticipate declaring any cash dividends on our common stock.
We have never declared or paid cash dividends on our common stock and do not plan to pay any cash dividends in the near future. Our current policy is to retain all funds and earnings for use in the operation and expansion of our business.
Risks Related to Accounting Matters
Changes in accounting standards and subjective assumptions, estimates, and judgments by management related to complex accounting matters could significantly affect our financial results or financial condition.
Generally accepted accounting principles and related accounting pronouncements, implementation guidelines, and interpretations with regard to a wide range of matters that are relevant to our business, such as revenue recognition, asset impairment and fair value determinations, inventories, business combinations and intangible asset valuations, leases, and litigation, are highly complex and involve many subjective assumptions, estimates, and judgments. Changes in these rules or their interpretation or changes in underlying assumptions, estimates, or judgments could significantly change our reported or expected financial performance or financial condition and could require us to restate our prior financial statements and issue a non-reliance statement regarding our prior financial disclosures.
Our ability to use net operating loss and tax credit carryforwards and certain built-in losses to reduce future tax payments is limited by provisions of the Internal Revenue Code, and it is possible that certain transactions or a combination of certain transactions may result in material additional limitations on our ability to use our net operating loss and tax credit carryforwards.
Section 382 and 383 of the Internal Revenue Code of 1986, as amended, contain rules that limit the ability of a company that undergoes an ownership change, which is generally any change in ownership of more than 50% of its stock over a three-year period, to utilize its net operating loss and tax credit carryforwards and certain built-in losses recognized in years after the ownership change. These rules generally operate by focusing on ownership changes involving stockholders owning directly or indirectly 5% or more of the stock of a company and any change in ownership arising from a new issuance of stock by the company. Generally, if an ownership change occurs, the yearly taxable income limitation on the use of net operating loss and tax credit carryforwards and certain built-in losses is equal to the product of the applicable long-term, tax-exempt rate and the value of the company’s stock immediately before the ownership change. We may be unable to offset our taxable income with losses, or our tax liability with credits, before such losses and credits expire and therefore would incur larger federal income tax liability.
If we fail to maintain an effective system of internal controls, we may not be able to accurately report financial results or prevent fraud. If we identify a material weakness in our internal control over financial reporting, our ability to meet our reporting obligations and the trading price of our stock could be negatively affected.
As described in Item 9A — Controls and Procedures and elsewhere in this Form 10-K, management identified a material weakness in our internal control over financial reporting for the fiscal years ended December 31, 2020 and 2019.
In the course of making our assessment of the effectiveness of internal control over financial reporting as of December 31, 2019, we identified a material weakness in our internal control over financial reporting with regard to our controls over the accounting for financial instruments containing characteristics of both liabilities and equity. Although substantial progress has been made in remediating this material weakness, it has not been fully remediated as of December 31, 2020, and therefore this control deficiency continues to constitute a material weakness. Specifically, due to insufficient technical resources, the Company’s controls were not operating effectively to allow management to timely identify errors related to the recording of certain transactions involving financial instruments as previously described.
Effective internal controls are necessary to provide reliable financial reports and to assist in the effective prevention of fraud. Any inability to provide reliable financial reports or prevent fraud could harm our business. We regularly review and update our internal controls, disclosure controls and procedures, and corporate governance policies. In addition, we are required under the Sarbanes-Oxley Act of 2002 to report annually on our internal control over financial reporting. Any system of internal controls, however well designed and operated, is based in part on certain assumptions and can provide only reasonable, not absolute, assurances that the objectives of the system are met. A material weakness is a deficiency, or a combination of deficiencies, in internal control over financial reporting, such that there is a reasonable possibility that a material misstatement of our annual or interim financial statements will not be prevented or detected on a timely basis. Accordingly, a material weakness increases the risk that the financial information we report contains material errors.
While we are in the process of addressing our material weakness as disclosed herein, elements of our remediation plan can only be accomplished over time and we can offer no assurance that these initiatives will ultimately have the intended effects. Any failure to maintain such internal controls could adversely impact our ability to report our financial results on a timely and accurate basis. If our financial statements are not accurate, investors may not have a complete understanding of our operations or may lose confidence in our reported financial information. Likewise, if our financial statements are not filed on a timely basis as required by the SEC and The Nasdaq Stock Market, we could face severe consequences from those authorities. In either case, it could result in a material adverse effect on our business or have a negative effect on the trading price of our common stock. Further, if we fail to remedy this deficiency (or any other future deficiencies) or maintain the adequacy of our internal controls, we could be subject to regulatory scrutiny, civil or criminal penalties or shareholder litigation. We can give no assurance that the measures we have taken and plan to take in the future will remediate the material weakness identified or that any additional material weaknesses or restatements of our financial statements will not arise in the future due to a failure to implement and maintain adequate internal control over financial reporting or circumvention of those controls.
Further, in the future, if we cannot conclude that we have effective internal control over our financial reporting, or if our independent registered public accounting firm is unable to provide an unqualified opinion regarding the effectiveness of our internal control over financial reporting, investors could lose confidence in the reliability of our financial statements, which could lead to a decline in our stock price. Failure to comply with reporting requirements could also subject us to sanctions and/or investigations by the SEC, The Nasdaq Stock Market or other regulatory authorities.
Risks Related to COVID-19 and Other Disruptive Events
Our financial condition and results of operations may be adversely affected by the COVID-19 pandemic.
We continue to closely monitor the impact of the COVID-19 global pandemic on all aspects of our business and geographies, including how it has and will impact our customers, team members, suppliers, vendors, business partners and distribution channels. The COVID-19 global pandemic has created significant volatility, uncertainty and economic disruption, which may continue to affect our business operations and may materially and adversely affect our results of operations, cash flows and financial position.
We are currently following the recommendations of local health authorities to minimize exposure risk for our team members and visitors. While we have implemented specific business continuity plans to reduce the impact of COVID-19 and believe that we have sufficient inventory to meet forecasted demand for the next six to nine months, there is no guarantee that our continuity plan will be successful or that our inventory will meet forecasted or actual demand. Disruptions may occur for our customers or suppliers that may materially affect our ability to obtain supplies or other components for our products, produce our products or deliver inventory in a timely manner. This would result in lost product revenue, additional costs, or penalties, or damage our reputation. Similarly, COVID-19 could impact our customers and/or suppliers as a result of a health epidemic or other outbreak occurring in other locations which could reduce their demand for our products or their ability to deliver needed supplies for the production of our products.
We cannot predict at this time the full extent to which the COVID-19 pandemic will impact our business, results, and financial condition, which will depend on many factors that are not known at this time, as the situation is unprecedented and continues to evolve. These include, among others, the extent of harm to public health, including the duration of the pandemic, any potential subsequent waves of COVID-19 infection, the emergence of new variants of COVID-19, some of which may be more transmissible or virulent than the initial strain, and the availability and distribution of effective vaccines and medical treatments, further disruption to the manufacturing of and demand for our products, our ability to effectively manage inventory levels and adjust our production schedules to align with demand, impairments and other charges, the impact of the global business and economic environment on liquidity and the availability of capital, the costs incurred to keep our employees safe while maintaining continued operations, and our ability to effectively motivate and retain the necessary workforce. We are staying in close communication with our manufacturing facilities, employees, customers, and suppliers, and acting to mitigate the impact of this dynamic and evolving situation through a variety of measures, which may not be successful and are subject to the factors described above, many of which are uncertain or outside of our control. Even after the COVID-19 pandemic has subsided, we may continue to experience impacts to our business as a result of its global economic impact.
Natural disasters, geopolitical unrest, war, terrorism, public health issues or other catastrophic events could disrupt the supply, delivery or demand of products, which could negatively affect our operations and performance.
We are subject to the risk of disruption by earthquakes, floods and other natural disasters, fire, power shortages, geopolitical unrest, war, terrorist attacks and other hostile acts, public health issues, epidemics or pandemics and other events beyond our control and the control of the third parties on which we depend. Any of these catastrophic events, whether in the United States or abroad, may have a strong negative impact on the global economy, our employees, facilities, partners, suppliers, distributors or customers, and could decrease demand for our products, create delays and inefficiencies in our supply chain and make it difficult or impossible for us to deliver products to our customers. A catastrophic event that results in the destruction or disruption of our data centers or our critical business or information technology systems would severely affect our ability to conduct normal business operations and, as a result, our operating results would be adversely affected.
UNRESOLVED STAFF COMMENTS |
None.
PROPERTIES |
Our material office and manufacturing leases are detailed below:
Location | Square Feet | Principal Use | Lease Expiration | |||
Bothell, WA | 32,106 | Corporate headquarters, manufacturing, research and development, marketing and administrative offices | July 2031 | |||
Menlo Park, CA | 3,460 | Research and development, and administrative offices | December 2021 | |||
Albuquerque, NM | 9,932 | Manufacturing, research and development, and administrative offices | December 2021 | |||
Bruce Township, MI | 106,998 | Manufacturing, research and development, and administrative offices | Month to Month | |||
United States | 12,500 | Biological and pharmaceutical specimen storage | January 2023 | |||
United States | 20,000 | Biological and pharmaceutical specimen storage | March 2024 | |||
United States | 16,153 | Biological and pharmaceutical specimen storage | June 2024 | |||
United States | 16,800 | Biological and pharmaceutical specimen storage | February 2026 | |||
United States | 26,800 | Biological and pharmaceutical specimen storage | November 2031 |
We consider the facilities to be in a condition suitable for their current uses. Because of anticipated growth in the business and due to the increasing requirements of customers or regulatory agencies, we may need to acquire additional space or upgrade and enhance existing space. We believe that adequate facilities will be available upon the conclusion of our leases.
LEGAL PROCEEDINGS |
From time to time, we may be subject to legal proceedings and claims in the ordinary course of business. We are not currently aware of any such proceedings or claims that we believe will have, individually or in the aggregate, a material adverse effect on our business, financial condition or results of operations.
MINE SAFETY DISCLOSURES |
Not applicable.
MARKET FOR REGISTRANT’S COMMON EQUITY, RELATED STOCKHOLDER MATTERS AND ISSUER PURCHASES OF EQUITY SECURITIES |
Market Information for Common Stock
Our common stock is traded on the NASDAQ Capital Market exchange under the ticker symbol “BLFS.”
Stockholders and Dividends
As of March 19, 2021, there were approximately 169 holders of record of our common stock. We have never paid cash dividends on our common stock and do not anticipate that any cash dividends will be paid in the foreseeable future. We anticipate that we will retain all earnings, if any, to support our operations. Any future determination as to the payment of dividends will be at the sole discretion of our Board of Directors and will depend on our financial condition, results of operations, capital requirements and other factors our Board of Directors deems relevant.
See Item 12 for information regarding securities authorized for issuance under our equity compensation plans.
Issuer Repurchases of Equity Securities
Not applicable.
SELECTED CONSOLIDATED FINANCIAL DATA |
Not applicable.
MANAGEMENT’S DISCUSSION AND ANALYSIS OF FINANCIAL CONDITION AND RESULTS OF OPERATIONS |
This Form 10-K contains “forward-looking statements”. These forward-looking statements involve a number of risks and uncertainties. We caution readers that any forward-looking statement is not a guarantee of future performance and that actual results could differ materially from those contained in the forward-looking statement. These statements are based on current expectations of future events. Such statements include, but are not limited to, statements about our products, including our newly acquired products, customers, regulatory approvals, the potential utility of and market for our products and services, our ability to implement our business strategy and anticipated business and operations, in particular following the 2020 and 2019 acquisitions, future financial and operational performance, our anticipated future growth strategy, including the acquisition of synergistic cell and gene therapy manufacturing tools and services or technologies, or other companies or technologies, capital requirements, intellectual property, suppliers, joint venture partners, future financial and operating results, the impact of the COVID-19 pandemic, plans, objectives, expectations and intentions, revenues, costs and expenses, interest rates, outcome of contingencies, business strategies, regulatory filings and requirements, the estimated potential size of markets, capital requirements, the terms of any capital financing agreements and other statements that are not historical facts. You can find many of these statements by looking for words like “believes,” “expects,” “anticipates,” “estimates,” “may,” “should,” “will,” “could,” “plan,” “intend,” or similar expressions in this Form 10-K. We intend that such forward-looking statements be subject to the safe harbors created thereby.
These forward-looking statements are based on the current beliefs and expectations of our management and are subject to significant risks and uncertainties. If underlying assumptions prove inaccurate or unknown risks or uncertainties materialize, actual results may differ materially from current expectations and projections. Factors that might cause such a difference include those discussed under “Risk Factors,” as well as those discussed elsewhere in the Form 10-K.
You are cautioned not to place undue reliance on these forward-looking statements, which speak only as of the date of this Form 10-K or, in the case of documents referred to or incorporated by reference, the date of those documents.
All subsequent written or oral forward-looking statements attributable to us or any person acting on our behalf are expressly qualified in their entirety by the cautionary statements contained or referred to in this section. We do not undertake any obligation to release publicly any revisions to these forward-looking statements to reflect events or circumstances after the date of this Form 10-K or to reflect the occurrence of unanticipated events, except as may be required under applicable U.S. securities law. If we do update one or more forward-looking statements, no inference should be drawn that we will make additional updates with respect to those or other forward-looking statements.
We are a life sciences company that develops and commercializes innovative technologies used in the manufacture, storage and transportation of biological materials and provides storage solutions for biological and pharmaceutical materials.
We develop, manufacture and market bioproduction tools and services to the cell and gene therapy (“CGT”) industry, which are designed to improve quality and de-risk biologic manufacturing and delivery. Our products are used in basic and applied research, and commercial manufacturing of biologic based therapies by maintaining the health and function of biologic material during sourcing, manufacturing, storage, distribution, and patient delivery of cells and tissues.
Our current portfolio of bioproduction tools and services includes biopreservation media for the preservation of cells and tissues, automated thaw devices which provide controlled, consistent thawing of frozen biologics in vials and cryobags, a line of “smart”, cloud connected devices for transporting biologic payloads at a variety of temperature ranges, a full line of isothermal and liquid nitrogen freezers and accessories for freezing and storage of biologic samples, and biological and pharmaceutical storage.
We currently operate as one bioproduction tools and services business with product lines that serve the continuum in the biologic drug manufacturing and delivery process. We have a diversified portfolio of tools that focus on the freezing and thawing process of biologic drugs. We have in-house expertise in cryobiology and continue to capitalize on opportunities to maximize the value of our product platform for our extensive customer base through both organic growth innovations and acquisitions.
Astero Bio Corporation Acquisition
On April 1, 2019, BioLife completed the acquisition of all the outstanding shares of Astero (the “Astero Acquisition”). Astero’s ThawSTAR product line is comprised of a family of automated thawing devices for frozen cell and gene therapies packaged in cryovials and cryobags. The products improve the quality of administration of high-value, temperature-sensitive biologic therapies to patients by standardizing the thawing process and reducing the risks of contamination and overheating, which are inherent with the use of traditional water baths.
In connection with the Astero Acquisition, the Company paid a base payment in the amount of $12.5 million consisting of an initial cash payment of $8.0 million at the closing of the transactions contemplated by the Purchase Agreement, subject to adjustment for working capital, net debt and transaction expenses, and a deferred cash payment that was paid into escrow of $4.5 million payable upon the earlier of Astero meeting certain product development milestones or one year after the date of the Closing and earnout payments in calendar years 2019, 2020 and 2021 of up to an aggregate of $3.5 million, which shall be payable upon Astero achieving certain specified revenue targets in each year and a separate earnout payment of $5.0 million for calendar year 2021 which shall be payable upon Astero achieving a cumulative revenue target over the three-year period from 2019 to 2021. In the second quarter of 2020 we paid $483,000 for the earnout related to 2019 revenues. We do not expect to pay any earnout in 2021 related to 2020 revenues.
The Astero Acquisition was accounted for as a purchase of a business under Financial Accounting Standards Board (“FASB”) Accounting Standard Codification No. (“ASC”) 805, “Business Combinations.” Under the acquisition method of accounting, the acquired assets and liabilities assumed from Astero were recorded as of the acquisition date, at their fair values, and consolidated with BioLife. The fair value of the net tangible assets acquired is approximately $324,000, the fair value of the identifiable intangibles is $4.1 million, and the residual goodwill is $9.5 million. The fair value estimates required critical estimates, including, but not limited to, future expected cash flows, revenue and expense projections, discount rates, revenue volatility, and royalty rates. BioLife believes these estimates to be reasonable. Actual results may differ from these estimates.
SAVSU Technologies, Inc. Acquisition
On August 7, 2019, the Company consummated the acquisition (the “SAVSU Acquisition”) of the remaining shares of SAVSU Technologies, Inc., a Delaware corporation, pursuant to a Share Exchange Agreement (the “Exchange Agreement”) by and among the Company, SAVSU and SAVSU Origin LLC, a Delaware limited liability company (“Origin”). Pursuant to the Exchange Agreement, Origin agreed to transfer to the Company and the Company agreed to acquire from Origin 8,616 shares of common stock of SAVSU, representing the remaining 56% of the outstanding shares of SAVSU that the Company did not own, in exchange for 1,100,000 shares of common stock of the Company. On August 8, 2019, the Company completed the SAVSU Acquisition, and SAVSU became a wholly owned subsidiary of the Company.
SAVSU is a leading developer and supplier of next generation cold chain management tools for CGT. The evo® cloud connect platform allows biologic products to be traced and tracked in real time. Our evo platform consists of rentable cloud connected shippers and evo technology tracking software provides real-time information on geolocation, payload temperature, ambient temperature, tilt of shipper, humidity, altitude, and real-time alerts when a shipper has been opened. Our internally developed evo software allows customers to customize alert notifications both in data measurements and user requirements. The evo Dry Vapor Shipper (“DVS”) is specifically marketed to CGT companies. The evo DVS has improved form factor and ergonomics over the traditional dewar, including extended thermal performance, reduced liquid nitrogen recharge time, improved payload extractors and ability to maintain temperature for longer periods on its side. The evo DVS does not require to be shipped in a pallet format, enabling shipping on narrow-bodied aircraft which is not an option for competitors who use palletized shipments. Our integrated system of internal and external packing innovations reduces risk of payload breakage due to shock while in transportation.
The Company paid to Origin 1,100,000 shares of unregistered common stock totaling $19.9 million (based on a share price of $18.12 at the time of acquisition) for the 56% we did not previously own.
The SAVSU Acquisition was accounted for as a purchase of a business under ASC 805, “Business Combinations.” Under the acquisition method of accounting, the acquired assets and liabilities assumed from SAVSU were recorded as of the acquisition date, at their fair values, and consolidated with BioLife. The fair value of the net tangible assets acquired is $4.2 million, the fair value of the identifiable intangibles is $12.2 million, and the residual goodwill is $19.5 million. The fair value estimates required critical estimates, including, but not limited to, future expected cash flows, revenue and expense projections, discount rates, revenue volatility, and royalty rates. BioLife believes these estimates to be reasonable. Actual results may differ from these estimates.
Custom Biogenic Systems, Inc. Acquisition
On November 10, 2019, we entered into an Asset Purchase Agreement, by and among the Company, Arctic Solutions, Inc., a Delaware corporation and wholly-owned subsidiary of the Company, and Custom Biogenic Systems, Inc., a Michigan corporation (“CBS Seller”), pursuant to which we agreed to purchase from the CBS Seller substantially all of CBS Seller’s assets, properties and rights (the “CBS Acquisition”). The CBS Seller, a privately held company with operations located near Detroit, Michigan, designs and manufactures liquid nitrogen laboratory freezers and cryogenic equipment and also offers a related cloud-based monitoring system that continuously assesses biologic sample storage conditions and alerts equipment owners if a fault condition occurs. The Acquisition closed on November 12, 2019.
In connection with the CBS Acquisition, we paid to CBS Seller a base payment in the amount of $15.0 million, consisting of a cash payment of $11.0 million paid at the closing of the CBS Acquisition, less a cash holdback escrow of $550,000 to satisfy certain indemnification claims, and an aggregate number of shares of our common stock, with an aggregate fair value equal to $4.0 million, less a holdback escrow of shares of Common Stock with an aggregate value equal to $3.0 million to satisfy potential payments related to any product liability claims outstanding as of March 13, 2019 and potential earnout payments in calendar years 2020, 2021, 2022, 2023 and 2024 of up to an aggregate of, but not exceeding, $15.0 million payable to CBS Seller upon achieving certain specified revenue targets in each year for certain product lines. We do not expect to pay any earnout in 2021 related to 2020 revenues.
The CBS acquisition was accounted for as a purchase of a business under FASB ASC Topic 805, “Business Combinations”. Under the acquisition method of accounting, the acquired assets and liabilities assumed from CBS were recorded as of the acquisition date, at their fair values, and consolidated with BioLife. The fair value of the net tangible assets acquired is $6.0 million, the fair value of the identifiable intangibles is $6.8 million, and the residual goodwill is $3.1 million. The fair value estimates required critical estimates, including, but not limited to, future expected cash flows, revenue and expense projections, discount rates, revenue volatility, and royalty rates. BioLife believes these estimates to be reasonable. Actual results may differ from these estimates.
SciSafe Holdings, Inc. Acquisition
On September 18, 2020, BioLife entered into a Stock Purchase Agreement, by and among the Company, SciSafe Holdings, Inc., a Delaware corporation, and the stockholders of SciSafe (collectively, the “SciSafe Sellers”), pursuant to which the Company agreed to purchase from the SciSafe Sellers one hundred percent (100%) of the issued and outstanding capital shares or other equity interests of SciSafe (the “SciSafe Acquisition”). The SciSafe Acquisition closed October 1, 2020.
In connection with the SciSafe Acquisition, the Company issued to the SciSafe Sellers 611,683 shares of common stock valued at $29.29 per share and a cash payment of $15 million, with $1.5 million held in escrow to account for adjustments for net working capital and as a security for, and a source of payment of, the Company’s indemnity rights. Pending the occurrence of certain events, the Company will issue to the SciSafe Sellers an additional 626,000 shares of common stock, which shall be issuable to SciSafe Sellers upon SciSafe achieving certain specified revenue targets in each year from 2021 to 2024.
The SciSafe Acquisition was accounted for as a purchase of a business under FASB ASC Topic 805, “Business Combinations”. The fair value of the contingent consideration is $3.7 million, the fair value of the net tangible assets acquired is $2.8 million, the fair value of the deferred tax liability is $3.3 million, the fair value of the intangible assets acquired is $12.1 million, and the residual goodwill is $24.9 million. The fair value estimates required critical estimates, including, but not limited to, future expected cash flows, revenue and expense projections, discount rates, revenue volatility, and royalty rates. BioLife believes these estimates to be reasonable. Actual results may differ from these estimates.
Critical Accounting Policies and Estimates
We have identified the policies and estimates below as being critical to our business operations and the understanding of our results of operations. These policies require management’s most difficult, subjective or complex judgements, often as a result of the need to make estimates about the effect of matters that are inherently uncertain. The impact of any associated risks related to these policies on our business operations are discussed throughout “Management’s Discussion and Analysis of Financial Condition,” including in the “Results of Operations” section, where such policies affect our reported and expected financial results. Although we believe that our estimates, assumptions, and judgements are reasonable, they are based upon information presently available. Actual results may differ significantly from these estimates under different assumptions, judgments, or conditions.
Revenue Recognition
We generate revenue from the sale or lease of our products and services, primarily to customers within the CGT market. Under ASC 606, “Revenue from Contracts with Customers,” revenue is recognized when, or as, obligations under the terms of a contract are satisfied, which occurs when control of the promised products or services is transferred to customers. Revenue is measured as the amount of consideration the Company expects to receive in exchange for transferring products or services to a customer (“transaction price”). To the extent the transaction price includes variable consideration, the Company estimates the amount of variable consideration that should be included in the transaction price utilizing the expected value method or the most likely amount method, depending on the facts and circumstances relative to the contract. When determining the transaction price of a contract, an adjustment is made if payment from a customer occurs either significantly before or significantly after performance, resulting in a significant financing component. Applying the practical expedient in paragraph 606-10-32-18, the Company does not assess whether a significant financing component exists if the period between when the Company performs its obligations under the contract and when the customer pays is one year or less. None of the Company’s contracts contained a significant financing component or variable consideration as of and during the year ended December 31, 2020.
The Company also generates revenue from the leasing of our evo cold chain systems, which are typically cloud-connected shippers with enabling cold chain cloud applications, to customers pursuant to rental arrangements entered into with the customer. Revenue from the rental of cold chain systems is not within the scope of FASB ASC Topic 606 as it is within the scope of FASB ASC Topic 842, “Leases”. All customers leasing shippers currently do so under month-to-month rental arrangements. We account for these rental transactions as operating leases and record rental revenue on a straight-line basis over the rental term. These rental arrangements may contain both lease and non-lease components. We have elected to utilize the practical expedient to account for lease and non-lease components together as a single combined lease component as the timing and pattern of transfer are the same for the non-lease components and associated lease component and, the lease component, if accounted for separately, would be classified as an operating lease.
Contracts with customers may contain multiple performance obligations. For such arrangements, the transaction price is allocated to each performance obligation based on the estimated relative standalone selling prices of the promised products or services underlying each performance obligation. The Company determines standalone selling prices based on the price at which the performance obligation is sold separately. If the standalone selling price is not observable through past transactions, the Company estimates the standalone selling price, taking into account available information such as market conditions and internally approved pricing guidelines related to the performance obligations. The Company recognizes product revenue under the terms of each customer agreement upon transfer of control to the customer, which occurs at a point in time.
Inventories
We value biopreservation media inventory at cost or, if lower, net realizable value, using the specific identification method. All other inventory is valued at cost or, if lower, net realizable value, using the first-in, first-out method. We review our inventory at least quarterly and record a provision for excess and obsolete inventory based on our estimates of expected product revenue volume, production capacity and expiration dates of raw materials, work-in-process and finished products. We write down inventory that has become obsolete, inventory that has a cost basis in excess of its expected net realizable value, and inventory in excess of expected requirements to cost of product revenue. Manufacturing of bioproduction finished goods is done to order and tested for quality specifications prior to shipment.
A change in the estimated timing or amount of demand for our products could result in additional provisions for excess inventory quantities on hand. Any significant unanticipated changes in demand or unexpected quality failures could have a significant impact on the value of inventory and reported operating results. During all periods presented in the accompanying consolidated financial statements, there have been no material adjustments related to a revised estimate of inventory valuations.
Assets held for rent
Assets held for rent consists of all evo shippers and related components, in process of being assembled, and evo shippers and accessories complete and ready to be deployed and placed in service upon a customer order. Our customers rent the shippers per a rental agreement, which includes access to the evo.is cloud based tracking and information app. We retain ownership of the evo shippers and the evo tracking software platform. At the end of the rental agreement, the customer returns the shipper to the Company. Once an evo shipper is deployed and placed in service with a customer, we depreciate the cost of the evo shippers and related accessories over an estimated useful life of three years.
Business combinations
Amounts paid for acquisitions are allocated to the tangible and intangible assets acquired and liabilities assumed, if any, based on their fair values at the dates of acquisition. This purchase price allocation process requires management to make significant estimates and assumptions with respect to intangible assets and deferred revenue obligations. The fair value of identifiable intangible assets is based on detailed valuations that use information and assumptions determined by management. Any excess of purchase price over the fair value of the net tangible and intangible assets acquired is allocated to goodwill. While we use our best estimates and assumptions to accurately value assets acquired and liabilities assumed at the acquisition date as well as any contingent consideration, where applicable, our estimates are inherently uncertain and subject to refinement. As a result, during the measurement period, which may be up to one year from the acquisition date, we record adjustments to the assets acquired and liabilities assumed with the corresponding offset to goodwill. Upon conclusion of the measurement period or final determination of the values of assets acquired or liabilities assumed, whichever comes first, any subsequent adjustments are recorded to our consolidated statements of comprehensive income. The fair value of contingent consideration includes estimates and judgments made by management regarding the probability that future contingent payments will be made, the extent of royalties to be earned in excess of the defined minimum royalties, etc. Management updates these estimates and the related fair value of contingent consideration at each reporting period based on the estimated probability of achieving the earnout targets and applying a discount rate that captures the risk associated with the expected contingent payments. To the extent our estimates change in the future regarding the likelihood of achieving these targets we may need to record material adjustments to our accrued contingent consideration. Changes in the fair value of contingent consideration are recorded in our consolidated statements of operations. We use the income approach to determine the fair value of certain identifiable intangible assets including customer relationships and developed technology. This approach determines fair value by estimating after-tax cash flows attributable to these assets over their respective useful lives and then discounting these after-tax cash flows back to a present value. We base our assumptions on estimates of future cash flows, expected growth rates, expected trends in technology, etc. We base the discount rates used to arrive at a present value as of the date of acquisition on the time value of money and certain industry-specific risk factors. We believe the estimated purchased customer relationships, developed technologies, trademark/tradename, patents, and in process research and development amounts so determined represent the fair value at the date of acquisition and do not exceed the amount a third party would pay for the assets.
Intangible Assets and Goodwill
Intangible assets
Intangible assets with a definite life are amortized over their estimated useful lives using the straight-line method and the amortization expense is recorded within intangible asset amortization in the consolidated statements of operations. Intangible assets and their related estimated useful lives are reviewed at least annually to determine if any adverse conditions exist that would indicate the carrying value of these assets may not be recoverable. More frequent impairment assessments are conducted if certain conditions exist, including a change in the competitive landscape, any internal decisions to pursue new or different technology strategies, a loss of a significant customer, or a significant change in the marketplace, including changes in the prices paid for the Company’s products or changes in the size of the market for the Company’s products. If impairment indicators are present, the Company determines whether the underlying intangible asset is recoverable through estimated future undiscounted cash flows. If the asset is not found to be recoverable, it is written down to the estimated fair value of the asset based on the sum of the future discounted cash flows expected to result from the use and disposition of the asset. If the estimate of an intangible asset’s remaining useful life is changed, the remaining carrying amount of the intangible asset is amortized prospectively over the revised remaining useful life. The Company continues to believe that its definite-lived intangible assets are recoverable at December 31, 2020.
Goodwill
We test goodwill for impairment on an annual basis, and between annual tests if events and circumstances indicate it is more likely than not that the fair value of our goodwill is less than its carrying value. Events that would indicate impairment and trigger an interim impairment assessment include, but are not limited to, current economic and market conditions, including a decline in the Company’s market capitalization, a significant adverse change in legal factors, business climate or operational performance of the business, and an adverse action or assessment by a regulator. Goodwill is tested for impairment as of December 31st of each year, or more frequently as warranted by events or changes in circumstances mentioned above. Accounting guidance also permits an optional qualitative assessment for goodwill to determine whether it is more likely than not that the carrying value of a reporting unit exceeds its fair value. If, after this qualitative assessment, we determine that it is not more likely than not that the fair value of a reporting unit is less than its carrying amount, then no further quantitative testing would be necessary. A quantitative assessment is performed if the qualitative assessment results in a more likely than not determination or if a qualitative assessment is not performed. The quantitative assessment considers whether the carrying amount of a reporting unit exceeds its fair value, in which case an impairment charge is recorded to the extent the reporting unit’s carrying value exceeds its fair value. The Company operates as one reporting unit as of the goodwill impairment measurement date of December 31, 2020. As a result of our 2020 quantitative assessment, we concluded that goodwill was not impaired as of December 31, 2020.
Contingent Consideration
We estimate the acquisition date fair value of the acquisition-related contingent consideration using various valuation approaches, including option pricing models and Monte Carlo simulations, as well as significant unobservable inputs, reflecting the Company’s assessment of the assumptions market participants would use to value these liabilities. The fair value of the contingent consideration is remeasured each reporting period, with any change in the value recorded in our consolidated statements of operations as change in fair value of contingent consideration.
Stock-based Compensation
We measure and record compensation expense using the applicable accounting guidance for share-based payments related to stock options, time-based restricted stock, market-based restricted stock awards and performance-based awards granted to our directors and employees. The fair value of stock options is determined by using the Black-Scholes option-pricing model. The fair value of market-based restricted stock awards is estimated, at the date of grant, using the Monte Carlo Simulation model. The Black-Scholes and Monte Carlo Simulation valuation models incorporate assumptions as to stock price volatility, the expected life of options or awards, a risk-free interest rate and dividend yield. In valuing our stock options and market-based stock awards, significant judgment is required in determining the expected volatility of our common stock. Expected volatility for stock options is based on the historical and implied volatility of our own common stock while the volatility for our market-based restricted stock awards is based on the historical volatility of our own stock and the stock of companies within our defined peer group. Further, our expected volatility may change in the future, which could substantially change the grant-date fair value of future awards and, ultimately, the expense we record. The fair value of restricted stock, including performance awards, without a market condition is estimated using the current market price of our common stock on the date of grant.
We expense stock-based compensation for stock options, restricted stock awards, and performance awards over the requisite service period. For awards with only a service condition, we expense stock-based compensation using the straight-line method over the requisite service period for the entire award. For awards with a market condition, we expense over the vesting period regardless of the value that the award recipients will ultimately receive.
Provision for Income Taxes
We maintain a full valuation allowance on our net deferred tax assets. The assessment regarding whether a valuation allowance is required considers both positive and negative evidence when determining whether it is more likely than not that deferred tax assets are recoverable. In making this assessment, significant weight is given to evidence that can be objectively verified. In its evaluation, the Company considered its cumulative loss and its forecasted losses in the near-term as significant negative evidence. Based upon a review of the four sources of income identified within ASC 740, “Accounting for Income Taxes”, the Company determined that the negative evidence outweighed the positive evidence and a full valuation allowance on its assets will be maintained. The Company will continue to assess the realizability of its assets going forward and will adjust the valuation allowance as needed.
The Company determines its uncertain tax positions based on a determination of whether and how much of a tax benefit taken by the Company in its tax filings or positions is more likely than not to be sustained upon examination by the relevant income tax authorities. The Company is generally subject to examination by U.S. federal and local income tax authorities for all tax years in which loss carryforward is available.
The Company applies judgment in the determination of the financial statement recognition and measurement of tax positions taken or expected to be taken in a tax return. As of December 31, 2020, the Company has an unrecorded tax benefit of $96,000 related to tax attributes being carried forward. The Company is generally subject to examination by U.S. federal and local income tax authorities for all tax years in which loss carryforward is available.
As of December 31, 2020, the Company had U.S. federal net operating loss (“NOL”) carryforwards of approximately $56.6 million, which is available to reduce future taxable income. Approximately $32.3 million of NOL will expire from 2021 through 2036, and approximately $24.3 million of NOL will be carried forward indefinitely. The NOL carryforwards may become subject to an annual limitation in the event of certain cumulative changes in the ownership interest. This could limit the amount of tax attributes that can be utilized annually to offset future taxable income or tax liabilities. Subsequent ownership changes may further affect the limitation in future years.
Recent Accounting Standards Update
See Note 1: “Organization and Significant Accounting Policies – Recent Accounting Pronouncements,” to our consolidated financial statements included in this report for more information.
Results of Operations
The following discussion of the financial condition and results of operations should be read in conjunction with the accompanying consolidated financial statements and the related footnotes thereto.
Revenue
Acquisitions that occurred in 2020 and 2019 resulted in increased revenue diversification compared to prior years, in which nearly all revenue was derived from our biopreservation media product line. Our revenues in 2020 and late 2019 were more diversified, both in terms of product and customer concentration, a trend we expect to continue to see in future years. In addition, we realized quarterly fluctuations based on large customer ordering patterns. This trend is expected to continue in 2021.
Revenue for years ended December 31, 2020, and 2019 were comprised of the following:
Year Ended December 31, | ||||||||
(In thousands) | 2020⁽¹⁾ | 2019⁽²⁾ | ||||||
Biopreservation media | $ | 30,946 | $ | 23,358 | ||||
Automated thawing | 1,709 | 1,184 | ||||||
Cold chain management | 46 | 165 | ||||||
Freezers and accessories | 11,839 | 2,137 | ||||||
Total product revenue | 44,540 | 26,844 | ||||||
Cold chain management | 1,795 | 527 | ||||||
Total rental revenue | 1,795 | 527 | ||||||
Biological and pharmaceutical storage | 1,752 | - | ||||||
Total storage revenue | 1,752 | - | ||||||
Total revenue | $ | 48,087 | $ | 27,371 | ||||
(1) | 2020 revenue includes service revenue related to SciSafe from October 1, 2020 through December 31, 2020. |
(2) | 2019 revenue includes automated thawing revenue related to Astero from April 1, 2019 through December 31, 2019; cold chain management revenue related to SAVSU from August 8, 2019 through December 31, 2019; and freezer and accessory revenue related to CBS from November 12, 2019 through December 31, 2019. |
For 2020, revenue increased by $20.7 million, or 76%, compared with 2019. The increase is due to an increase in product revenue from our biopreservation media products along with the SciSafe acquisition and operating three businesses acquired in 2019 for a full year. Product revenue of our biopreservation media products in 2020 increased $7.6 million, or 32% compared with 2019. Our biopreservation media products continued to be adopted by customers in the CGT market and we realized a higher selling price per liter in 2020 compared to 2019. Service revenues generated by SciSafe post-acquisition amounted to $1.8 million. Product and rental revenues from the automated thawing, cold chain management, and freezers and accessories product lines in 2020 increased $11.4 million, or 284% compared with 2019. Revenue is impacted by the relatively high degree of customer concentration, the timing of orders, the development efforts of our customers or end-users and regulatory approvals for biologics that incorporate our products, which may result in significant quarterly fluctuations. Such quarterly fluctuations are expected, but they may not be predictive of future revenue or otherwise indicative of a trend.
Costs and Operating Expenses
Total costs and operating expenses for years ended December 31, 2020 and 2019 were comprised of the following:
Year Ended December 31, | ||||||||||||||||
(In thousands, except percentages) | 2020 | 2019 | $ Change | % Change | ||||||||||||
Cost of product, rental, and service revenue | $ | 20,646 | $ | 8,760 | $ | 11,886 | 136 | % | ||||||||
Research and development | 6,720 | 3,168 | 3,552 | 112 | % | |||||||||||
Sales and marketing | 6,413 | 4,701 | 1,712 | 36 | % | |||||||||||
General and administrative | 14,607 | 8,893 | 5,714 | 64 | % | |||||||||||
Intangible asset amortization | 3,033 | 1,079 | 1,954 | 181 | % | |||||||||||
Acquisition costs | 668 | 940 | (272 | ) | (29 | )% | ||||||||||
Change in fair value of contingent consideration | 1,575 | 50 | 1,525 | 3,050 | % | |||||||||||
Total operating expenses | $ | 53,662 | $ | 27,591 | $ | 26,071 | 94 | % | ||||||||
Cost of Product, Rental, and Service Revenue
In 2020, cost of product, rental, and service revenue increased $11.9 million or 136% when compared to 2019, due primarily to increased revenues as a result of increases in product revenue of our biopreservation media products, our SciSafe acquisition, and operation of the three businesses acquired in 2019 for a full year. The product lines that we acquired in 2020 and 2019 have a higher cost of product, rental, and service revenue than our biopreservation media products. We expect the cost of product, rental, and service revenue to fluctuate in future quarters based on production volumes, product mix, and the full year impact of our acquisition of SciSafe.
Cost of product, rental, and service revenue as a percentage of revenue was 43%, and 32% for 2020 and 2019, respectively. Cost of product, rental, and service revenue in 2020 and 2019 includes $411,000 and $289,000, respectively, in inventory step-up related amortization recorded in the purchase accounting of our Astero and CBS acquisitions. The increase in cost of product, rental, and service revenue as a percentage of revenue is a result of the higher costs of product, rental, and service revenue as a percentage of revenue for the product lines acquired in 2020 and 2019 through the Astero, SAVSU, CBS, and SciSafe acquisitions. Incremental costs of product, rental, and service revenue contributed by the automated thawing, cold chain management, freezer and accessories, and biological and pharmaceutical storage product lines in 2020 were $258,000, $961,000, $7.2 million, and $1.2 million, respectively.
Research and Development Expenses
During 2020 and 2019 research and development (“R&D”) expense consisted primarily of personnel-related costs, consulting and external product development services.
R&D expense increased $3.6 million in 2020, or 112%, compared with 2019. The increase is primarily due to operation of the three businesses acquired in 2019 for a full year, increased consulting and development costs in 2020 related to our acquired products, and stock compensation expense.
We expect our R&D expense to increase as we continue to expand, develop and refine the product lines we acquired in 2020 and 2019.
Sales and Marketing Expenses
Sales and marketing expense (“S&M”) consisted primarily of personnel-related costs, stock compensation expense, trade shows, sales commissions and advertising.
In 2020, S&M expense increased $1.7 million, or 36%, compared with 2019. The increase reflects the S&M costs we absorbed related to our acquisitions, stock compensation expense and an increase in personnel-related costs.
We expect S&M expense to increase, as we expand our direct selling efforts to support the broader product line offerings resulting from our 2020 and 2019 acquisitions.
General and Administrative Expenses
General and administrative (“G&A”) expense consists primarily of personnel-related expenses, non-cash stock-based compensation for administrative personnel and members of the board of directors, professional fees, such as accounting and legal, and corporate insurance.
In 2020, G&A expenses increased by $5.7 million, or 64%, compared with 2019. The increase reflects the assumption of G&A expenses related to our 2020 and 2019 acquisitions, and the continued buildout of our administrative infrastructure, primarily through increased headcount and information technology expenditures, to support expected future growth and stock compensation expense.
We expect G&A expense to increase reflecting the infrastructure and costs related to supporting the larger expected enterprise created as a result of our 2020 and 2019 acquisitions.
Intangible asset amortization expense
Amortization expense consists of charges related to the amortization of intangible assets associated with acquisitions, Astero, SAVSU, CBS, and SciSafe in which we acquired definite-lived intangible assets.
Acquisition costs
Acquisition costs consist of legal, accounting, third-party valuations, and other due diligence costs related to our Astero, SAVSU, CBS, and SciSafe acquisitions.
Change in fair value of contingent consideration
Change in fair value of contingent consideration consists of changes in estimated fair value of our potential earnouts related to our Astero, CBS, and SciSafe acquisitions.
Other Income and Expenses
Total other expenses for the years ended December 31, 2020 and 2019 were comprised of the following:
Year Ended December 31, | ||||||||||||||||
(In thousands, except percentages) | 2020 | 2019 | $ Change | % Change | ||||||||||||
Change in fair value of warrant liability | $ | 3,601 | $ | (12,835 | ) | $ | 16,436 | (128 | )% | |||||||
Change in fair value of investments | 1,319 | - | 1,319 | - | % | |||||||||||
Interest income, net | 58 | 501 | (443 | ) | (88 | )% | ||||||||||
Other expense | - | (13 | ) | 13 | (100 | )% | ||||||||||
Loss from equity-method investment in SAVSU | - | (739 | ) | 739 | (100 | )% | ||||||||||
Gain on acquisition of SAVSU | - | 10,108 | (10,108 | ) | (100 | )% | ||||||||||
Total other income (expenses) | $ | 4,978 | $ | (2,978 | ) | $ | 7,956 | (267 | )% | |||||||
Change in fair value of warrant liability. Reflects the changes in fair value associated with the periodic “mark to market” valuation of certain warrants that were issued in 2014. See Note 1: “Organization and Significant Accounting Policies” of our accompanying consolidated financial statements “Certain Warrants which have Features that may Result in Cash Settlement” for more information.
Change in fair value of investments. Reflects the fair value adjustments to our investment in iVexSol convertible debt prior to it’s conversion to Series A-1 Preferred Stock. The fair value was determined by expected term of the instrument, the underlying credit worthiness of iVexSol and the valuation of various embedded features in the note, which were based on future financings of iVexSol. The expected term range of our estimate was 1 to 5 years, with projected weighting over this term.
Interest Income, net. We earn interest on cash held in our money market account. Despite having a higher average cash balance in the year ended December 31, 2020 as compared to 2019, yields in our money market account dropped steeply between February and March due to reduced interest rates set by the United States Federal Reserve, causing interest income to be significantly lower in the year ended December 31, 2020 compared to 2019.
Loss on equity method investment. The non-cash loss associated with our proportionate share of the net loss in our investment in SAVSU prior to our acquisition of the remaining shares of SAVSU and subsequent consolidation of SAVSU in our financial statements.
Gain on acquisition of SAVSU. The non-cash gain associated with our equity investment in SAVSU due to the acquisition of the remaining shares of SAVSU and subsequent consolidation of SAVSU in our financial statements.
Liquidity and Capital Resources
On December 31, 2020, we had $90.4 million in cash and cash equivalents, compared to $6.4 million at December 31, 2019. The increase in cash is primarily due to the Company selling shares of common stock in both May and July of 2020. These increases were reduced by cash payments made for the acquisition of SciSafe. Details regarding these events can be found in the following paragraphs.
On May 22, 2020, the Company closed on a share purchase agreement with Casdin Capital LLC, a current stockholder of the Company, pursuant to which Casdin invested $20.0 million in the Company at $10.50 per share.
On July 7, 2020, the Company closed its public offering of 5,951,250 shares of common stock at the public offering price of $14.50 per share, which includes the shares purchased pursuant to the exercise in full of the underwriters' option to purchase up to an additional 776,250 shares of its common stock. The net proceeds from the public offering to BioLife, after deducting underwriting discounts and commissions and estimated underwriter offering expenses of $6.1 million, were approximately $80.2 million.
On October 1, 2020, we acquired SciSafe for $15.0 million in cash, 611,683 shares of common stock, and up to 626,000 additional shares of common stock as contingent consideration (which payment requirement has not been triggered or otherwise paid to date).
Cash Flows
Year Ended December 31, | ||||||||||||
(In thousands) | 2020 | 2019 | $ Change | |||||||||
Operating activities | $ | 6,645 | $ | 1,213 | $ | 5,432 | ||||||
Investing activities | (24,715 | ) | (27,018 | ) | 2,303 | |||||||
Financing activities | 102,078 | 1,596 | 100,482 | |||||||||
Net increase (decrease) in cash and cash equivalents | $ | 84,008 | $ | (24,209 | ) | $ | 108,217 | |||||
Operating Activities
In 2020, our operating activities provided cash of $6.6 million reflecting net income of $2.7 million and non-cash charges totaling $5.8 million primarily related to depreciation, amortization, changes in the fair value of investments, changes in fair value of contingent consideration, income tax benefit related to the acquisition of SciSafe, change in the fair value of the warrant liability, and stock-based compensation charges. An increase in accounts receivable used $1.8 million of cash and was primarily driven by the 76% year-to-date increase in revenues and an increase in inventory used $629,000 to support future revenue. These cash items used for operating activities were offset by cash items provided by operating activities that included an increase in accrued liabilities of $780,000. The remaining cash used in operating activities resulted from unfavorable changes in various other working capital accounts.
In 2019, our operating activities provided cash of $1.2 million, reflecting a net loss of $1.7 million and non-cash charges totaling $7.3 million primarily related to depreciation, amortization, gain on acquisition of SAVSU, changes in fair value contingent consideration, income tax benefit related to the acquisition of SAVSU, fair value change in warrant liability and stock-based compensation charges. An increase in accounts receivable used $290,000 of cash and was primarily driven by the 39% year-to-date increase in revenues and an increase in inventory used $3.7 million to support future revenue. These cash items used for operating activities were offset by cash items provided by operating activities that included an increase in accounts payable of $768,000. The remaining cash used in operating activities resulted from unfavorable changes in various other working capital accounts.
Investing Activities
Our investing activities used $24.7 million of cash during 2020. We used $15.0 million in cash for the SciSafe acquisition. We also invested $1.0 million and $995,000 in our strategic investments in iVexSol and PanTHERA, respectively. Capital expenditures, deposits on future capital expenditures, purchases of assets held for rent, and deposits made on assets held for rent used $7.8 million as we continue to invest in our manufacturing and storage facilities.
Our investing activities used $27.0 million of cash during 2019. We used $12.4 million, gained $1.3 million, and used $11.0 million in cash for the Astero, SAVSU, and CBS acquisitions, respectively. We also invested $1.0 million and $1.5 million in our strategic investments in iVexSol and Sexton Bio, respectively. Capital expenditures used $2.3 million in our manufacturing facilities and to increase SAVSU’s assets held for rent.
Financing Activities
In 2020, cash provided by financing activities was $102.1 million. We received $100.3 million from the sale of common shares and $1.5 million from the proceeds of warrant and stock option exercises. We used $483,000 for contingent consideration related to the Astero acquisition.
In 2019, cash provided by financing activities of $1.6 million of cash included $1.8 million from the proceeds of warrant and stock option exercises.
Impacts of COVID-19
In March 2020, the World Health Organization declared the COVID-19 outbreak to be a pandemic. During 2020, we believe our quarterly revenues were affected by COVID-19. During the first quarter, our biopreservation media product lines benefited due to what we believe was safety stock purchasing by our customers due to COVID-19. In the second and third quarters, we believe that revenues were negatively impacted by a reduction in clinical trial progression and temporary halts. We then noticed an increase of purchasing in biopreservation media in the fourth quarter as clinical trials and research lab activity resumed with reduced restrictions. Our biological and pharmaceutical services business that we acquired in the fourth quarter was in-line with expectations and we expect increased demand for biological material storage with the reduction of COVID-19 restrictions. Our 2020 revenue was negatively affected for our automated thawing devices, cloud connected “smart” shipping containers, and freezer and storage technology lines of business by the COVID-19 pandemic due to restrictions on in-person selling, customer budget cuts for capital equipment and lack of personnel at our customer sites to receive capital equipment. We have tried and, to date, have been successful in mitigating any supply chain problems. However, we cannot be assured that a continued or prolonged global pandemic will not have a negative impact on our manufacturing and shipping processes or our product costs. The extent to which the COVID-19 pandemic affects our future financial results and operations will depend on future developments which are highly uncertain and cannot be predicted, including the recurrence, severity and/or duration of the ongoing pandemic, and current or future domestic and international actions to contain and treat COVID-19.
We are following public and private sector policies and initiatives to reduce the transmission of COVID-19, such as the imposition of travel restrictions and the promotion of social distancing and work-from-home arrangements. We are taking a variety of measures to ensure the availability and functioning of our critical infrastructure, to promote the safety and security of our employees and to support the communities in which we operate. These measures include increasing our raw materials, manufacturing safe stock inventory for our biopreservation media and expanding availability of our biological and pharmaceutical storage, requiring remote working arrangements for employees who are not integral to physically making and shipping our products or who do not need specialized equipment to perform their work, restricting on-site visits by non-employees and implementing social distancing protocols and investing in personal protective equipment. Beginning April 2, 2020 face masks were required to be worn by all employees and contractors at all sites. Effective May 11, 2020, temperature screening was required upon entering our facilities where mandated by state law. Starting on May 11, 2020, our employees were required to complete daily COVID-19 exposure and symptom questionnaires where mandated, with the requirement rolling out companywide on October 13, 2020 for all locations.
Off-Balance Sheet Arrangements
We do not have any special purpose entities or off-balance sheet financing arrangements.
Capital Requirements
Our future capital requirements will depend on many factors, including the following:
● | the expansion of our cell and gene therapy tools and services business; |
● | the ability to sustain product revenue and profits of our cell and gene therapy products and services; | |
● | The degree to which we implement additional automated production equipment throughout our facilities; |
● | our ability to acquire additional cell and gene therapy products and services; |
● | the scope of and progress made in our research and development activities; and |
● | the success of any proposed financing efforts. |
Absent acquisitions of additional products, product candidates or intellectual property, we believe our current cash balances are adequate to meet our cash needs for at least the next 12 months. We expect operating expenses in the year ending December 31, 2021 to increase as we continue to expand our CGT tools business. We expect to incur continued spending related to the development and expansion of our product lines and expansion of our commercial capabilities for the foreseeable future. Our future capital requirements may include, but are not limited to, purchases of property, plant and equipment, the acquisition of additional cell and gene therapy products and technologies to complement our existing manufacturing capabilities, and continued investment in our intellectual property portfolio.
We actively evaluate various strategic transactions on an ongoing basis, including acquiring complementary products, technologies or businesses that would complement our existing portfolio. We continue to seek to acquire such potential assets that may offer us the best opportunity to create value for our shareholders. In order to acquire such assets, we may need to seek additional financing to fund these investments. If our available cash balances and anticipated cash flow from operations are insufficient to satisfy our liquidity requirements, including because of any such acquisition-related financing needs or lower demand for our products, we may seek to sell common or preferred equity or convertible debt securities, enter into a credit facility or another form of third-party funding, or seek other debt funding. The sale of equity and convertible debt securities may result in dilution to our stockholders, and those securities may have rights senior to those of our common shares. If we raise additional funds through the issuance of preferred stock, convertible debt securities or other debt financing, these securities or other debt could contain covenants that would restrict our operations. Any other third-party funding arrangement could require us to relinquish valuable rights. We may require additional capital beyond our currently anticipated amounts. Additional capital may not be available on reasonable terms, if at all.
QUANTITATIVE AND QUALITATIVE DISCLOSURE ABOUT MARKET RISK |
Not applicable.
CONSOLIDATED FINANCIAL STATEMENTS AND SUPPLEMENTARY DATA |
INDEX TO CONSOLIDATED FINANCIAL STATEMENTS
Page No. | ||
35 | ||
38 | ||
39 | ||
40 | ||
41 | ||
42 |
REPORTS OF INDEPENDENT REGISTERED PUBLIC ACCOUNTING FIRMS
Shareholders and Board of Directors
BioLife Solutions, Inc.
Bothell, Washington
Opinion on the Consolidated Financial Statements
We have audited the accompanying consolidated balance sheets of BioLife Solutions, Inc. (the “Company”) as of December 31, 2020 and 2019, the related consolidated statements of operations, shareholders’ equity, and cash flows for the years then ended, and the related notes (collectively referred to as the “consolidated financial statements”). In our opinion, the consolidated financial statements present fairly, in all material respects, the financial position of the Company at December 31, 2020 and 2019, and the results of its operations and its cash flows for the years then ended, in conformity with accounting principles generally accepted in the United States of America.
Change in Accounting Principle
As disclosed Note 1 to the consolidated financial statements, the Company changed its method of accounting for leases in 2019 due to the adoption of the Accounting Standards Codification Topic 842, Leases.
Basis for Opinion
These consolidated financial statements are the responsibility of the Company’s management. Our responsibility is to express an opinion on the Company’s consolidated financial statements based on our audits. We are a public accounting firm registered with the Public Company Accounting Oversight Board (United States) (“PCAOB”) and are required to be independent with respect to the Company in accordance with the U.S. federal securities laws and the applicable rules and regulations of the Securities and Exchange Commission and the PCAOB.
We conducted our audits in accordance with the standards of the PCAOB. Those standards require that we plan and perform the audit to obtain reasonable assurance about whether the consolidated financial statements are free of material misstatement, whether due to error or fraud. The Company is not required to have, nor were we engaged to perform, an audit of its internal control over financial reporting. As part of our audits we are required to obtain an understanding of internal control over financial reporting but not for the purpose of expressing an opinion on the effectiveness of the Company’s internal control over financial reporting. Accordingly, we express no such opinion.
Our audits included performing procedures to assess the risks of material misstatement of the consolidated financial statements, whether due to error or fraud, and performing procedures that respond to those risks. Such procedures included examining, on a test basis, evidence regarding the amounts and disclosures in the consolidated financial statements. Our audits also included evaluating the accounting principles used and significant estimates made by management, as well as evaluating the overall presentation of the consolidated financial statements. We believe that our audits provide a reasonable basis for our opinion.
Critical Audit Matters
The critical audit matters communicated below are matters arising from the current period audit of the consolidated financial statements that were communicated or required to be communicated to the audit committee and that: (1) relates to accounts or disclosures that are material to the consolidated financial statements and (2) involved our especially challenging, subjective, or complex judgments. The communication of critical audit matters does not alter in any way our opinion on the consolidated financial statements, taken as a whole, and we are not, by communicating the critical audit matters below, providing separate opinions on the critical audit matters or on the accounts or disclosures to which they relate.
Contingent Consideration
As described in Notes 2 and 11 to the consolidated financial statements, contingent consideration liabilities are recorded at fair value on the acquisition date and are revalued each reporting period, with changes in the fair value recognized within the consolidated statement of operations. As of and for the year ended December 31, 2020, the Company recorded a total contingent consideration liability of $7.2 million and a change in fair value of $1.6 million. Management estimated the fair value of contingent consideration through valuation models that incorporate unobservable inputs including projected revenue, revenue and asset volatility, and discount rates. Changes in the fair value of contingent consideration can result from changes to one or multiple assumptions.
We identified the estimation of the contingent consideration liabilities’ fair value as a critical audit matter. The determination of the contingent consideration liabilities’ fair value requires management to make significant judgments including the appropriateness of the valuation model and the reasonableness of estimates and assumptions. Changes in these estimates and assumptions could have a significant impact on the fair value of the contingent consideration liabilities. Auditing these elements involved especially challenging auditor judgment due to the subjectivity and the nature and extent of audit effort required to address the matter, including the extent of specialized skill or knowledge needed.
The primary procedures we performed to address this critical audit matter included:
• | Assessing the reasonableness of certain significant assumptions used in the valuation model, through: (i) comparing and mathematically checking against the acquired Company’s historical performance, (ii) evaluating the reasonableness of significant assumptions (including revenue projections) against budgets and the current performance of the acquired company, and (iii) performing sensitivity analyses to test the potential effect of changes in certain assumptions on the valuation. |
• | Utilizing professionals with specialized skills and knowledge to assist in evaluating the appropriateness of the valuation models utilized by management and to assess the reasonableness of assumptions and accuracy of the underlying calculations used by management to develop the discount rates, revenue volatility, and asset volatility applied to revenue forecasts. |
Market-based Restricted Stock
As disclosed in Note 9 of the consolidated financial statements, the Company granted restricted stock awards that vest at the end of two years of service, subject to achieving market conditions based on the Company’s total shareholder return during the two-year period relative to its peer group. The market conditions are included in the determination of the estimated grant-date fair value for the restricted stock units. With the assistance of valuation specialists, the Company estimated the fair value of the market-based restricted stock awards using the Monte-Carlo valuation model using key assumptions including historical volatility and dividend yield of its peer group.
We identified the measurement of the Company’s market-based restricted stock as a critical audit matter. Management exercises significant judgment to estimate the fair value of the awards using the Monte-Carlo valuation model. Auditing these elements required especially challenging auditor judgment due to the nature and extent of audit effort required to address these matters, including the extent of specialized skill or knowledge needed to evaluate the methodologies used and assumptions made.
The primary procedures we performed to address this critical audit matter included:
• | Utilizing personnel with specialized skill and knowledge of valuation techniques to assist in: (i) evaluating the reasonableness of the valuation methodologies utilized by the Company, (ii) testing the accuracy of historical stock prices and volatilities of the Company and the peer group companies, and (iii) preparing an independent estimate of fair value and comparing to the Company’s estimate. |
Valuation of Investments in Convertible Debt
As described in Note 2 to the consolidated financial statements, the cumulative change in fair value of the Company's convertible debt investment was $1.3 million for the year ended December 31, 2020. Prior to conversion of the note to preferred stock in November 2020, the convertible debt was valued in accordance with ASC 820, Fair Value Measurement (“ASC 820”). Under ASC 820 fair value is an exit price, representing the amount that would be received to sell an asset in an orderly transaction between market participants. Pursuant to ASC 820, Level 3 investments utilize inputs that are unobservable and include situations where there is little market activity for the asset. With the assistance of valuation specialists, the Company utilizes various unobservable inputs to determine the fair value of this investment, including: (i) the expected term of the investment, (ii) the creditworthiness of iVexSol and (iii) the valuation of various embedded features in the note which were based on future financings of iVexSol.
We identified the valuation of investment in convertible debt as a critical audit matter. The principal considerations for our determination are: (i) the use of various complex models to value the investment and (ii) the use of significant unobservable inputs and assumptions in the valuation models. Auditing these elements required especially challenging auditor judgment due to the nature and extent of audit effort required to address these matters, including the extent of specialized skill or knowledge needed to evaluate the methodologies used and assumptions made.
The primary procedures we performed to address this critical audit matter included:
• | Evaluating the reasonableness of management’s fair value estimate of investments by: (i) gaining an understanding of management’s assumptions related to the probability weighted scenarios through inspection of relevant agreements, (ii) assessing the reasonableness of the various settlement probabilities, and (iii) testing the accuracy and relevance of significant inputs. |
• | Utilizing personnel with specialized skill and knowledge of valuation techniques to assist in: (i) assessing the appropriateness of the valuation methods, (ii) assessing the reasonableness of key assumptions and inputs, and (iii) performing an independent calculation to verify accuracy of the valuation. |
Business Combination
As described in Note 11 of the consolidated financial statements, during 2020, the Company acquired 100% of SciSafe, Inc. for a purchase price of approximately $36.5 million, which included contingent consideration with an acquisition date fair value of $3.7 million. As a result of the acquisition, management determined the estimated fair value of the identifiable assets acquired and liabilities assumed at the acquisition date and recorded identifiable intangible assets of $12.1 million related to acquired customer relationships, tradenames, and non-compete agreements as well as $24.9 million of goodwill.
We determined the accounting for the business combination to be a critical audit matter. The principal considerations for our determination were the inherent uncertainties that exist related to the Company’s forecasts used to determine the fair value of the intangible assets and goodwill acquired. Auditing these elements required especially challenging auditor judgment due to the nature and extent of audit effort required to address these matters, including the extent of specialized skill or knowledge needed to evaluate the methodologies used and assumptions made.
The primary procedures we performed to address this critical audit matter included:
• | Assessing the reasonableness of significant underlying assumptions through evaluating the historical performance of the acquired entity. |
• | Utilizing professionals with specialized skills and knowledge to assist in: (i) evaluating the appropriateness of the valuation models used by management, (ii) testing the mathematical accuracy of the Company’s calculations, and (iii) assessing the reasonableness of the revenue volatility and discount rate assumptions. |
/S/ BDO USA, LLP
We have served as the Company's auditor since 2019.
Seattle, Washington
March 31, 2021
BioLife Solutions, Inc.
December 31, | ||||||||
(In thousands, except per share and share data) | 2020 | 2019 | ||||||
Assets | ||||||||
Current assets | ||||||||
Cash and cash equivalents | $ | 90,403 | $ | 6,448 | ||||
Restricted cash | 53 | 0 | ||||||
Accounts receivable, trade, net of allowance for doubtful accounts of $85 and $68 at December 31, 2020 and 2019, respectively | 8,006 | 5,345 | ||||||
Inventories | 11,602 | 10,972 | ||||||
Prepaid expenses and other current assets | 4,648 | 1,348 | ||||||
Total current assets | 114,712 | 24,113 | ||||||
Assets held for rent, net | 4,705 | 3,922 | ||||||
Property and equipment, net | 10,120 | 5,572 | ||||||
Operating lease right-of-use assets, net | 9,675 | 1,040 | ||||||
Financing lease right-of-use assets, net | 17 | 0 | ||||||
Long-term deposits and other assets | 230 | 50 | ||||||
Investments | 5,872 | 2,500 | ||||||
Intangible assets, net | 31,049 | 21,982 | ||||||
Goodwill | 58,449 | 33,637 | ||||||
Total assets | $ | 234,829 | $ | 92,816 | ||||
Liabilities and Shareholders’ Equity | ||||||||
Current liabilities | ||||||||
Accounts payable | $ | 3,672 | $ | 3,119 | ||||
Accrued expenses and other current liabilities | 5,369 | 3,369 | ||||||
Lease liabilities, operating, current portion | 1,107 | 804 | ||||||
Lease liabilities, financing, current portion | 8 | 0 | ||||||
Warrant liability, current portion | 2,780 | 0 | ||||||
Contingent consideration, current portion | 2,637 | 377 | ||||||
Total current liabilities | 15,573 | 7,669 | ||||||
Warrant liability, long-term | 0 | 39,602 | ||||||
Contingent consideration, long-term | 4,515 | 1,537 | ||||||
Lease liabilities, operating, long-term | 8,757 | 550 | ||||||
Lease liabilities, financing, long-term | 12 | 0 | ||||||
Other long-term liabilities | 726 | 4 | ||||||
Total liabilities | 29,583 | 49,362 | ||||||
Commitments and Contingencies (Note 12) | ||||||||
Shareholders’ equity | ||||||||
Preferred stock, $0.001 par value; 1,000,000 shares authorized, Series A, 4,250 shares designated, and 0 shares issued and outstanding at December 31, 2020 and 2019, respectively | 0 | 0 | ||||||
Common stock, $0.001 par value; 150,000,000 shares authorized, 33,039,146 and 20,825,452 shares issued and outstanding at December 31, 2020 and 2019, respectively | 33 | 21 | ||||||
Additional paid-in capital | 302,598 | 143,485 | ||||||
Accumulated deficit | (97,385 | ) | (100,052 | ) | ||||
Total shareholders’ equity | 205,246 | 43,454 | ||||||
Total liabilities and shareholders’ equity | $ | 234,829 | $ | 92,816 | ||||
The accompanying Notes to consolidated Financial Statements are an integral part of these consolidated financial statements
BioLife Solutions, Inc.
Consolidated Statements of Operations
Years Ended December 31, | ||||||||
2020 | 2019 | |||||||
(In thousands, except per share and share data) | ||||||||
Product revenue | $ | 44,540 | $ | 26,844 | ||||
Rental revenue | 1,795 | 527 | ||||||
Service revenue | 1,752 | 0 | ||||||
Total product, rental, and service revenue | 48,087 | 27,371 | ||||||
Costs and operating expenses: | ||||||||
Cost of product revenue (exclusive of intangible assets amortization) | 18,058 | 8,355 | ||||||
Cost of rental revenue (exclusive of intangible assets amortization) | 1,367 | 405 | ||||||
Cost of service revenue (exclusive of intangible assets amortization) | 1,221 | 0 | ||||||
Research and development | 6,720 | 3,168 | ||||||
Sales and marketing | 6,413 | 4,701 | ||||||
General and administrative | 14,607 | 8,893 | ||||||
Intangible asset amortization | 3,033 | 1,079 | ||||||
Acquisition costs | 668 | 940 | ||||||
Change in fair value of contingent consideration | 1,575 | 50 | ||||||
Total operating expenses | 53,662 | 27,591 | ||||||
Operating loss | (5,575 | ) | (220 | ) | ||||
Other income (expense) | ||||||||
Change in fair value of warrant liability | 3,601 | (12,835 | ) | |||||
Change in fair value of investments | 1,319 | 0 | ||||||
Interest income, net | 58 | 501 | ||||||
Other expense | 0 | (13 | ) | |||||
Loss from equity-method investment in SAVSU | - | (739 | ) | |||||
Gain on acquisition of SAVSU | 0 | 10,108 | ||||||
Total other income (expense) | 4,978 | (2,978 | ) | |||||
Net loss before provision for income taxes | (597 | ) | (3,198 | ) | ||||
Income tax benefit | 3,264 | 1,541 | ||||||
Net income (loss) | $ | 2,667 | $ | (1,657 | ) | |||
Net income (loss) attributable to stockholders | ||||||||
Basic | 2,450 | (1,657 | ) | |||||
Diluted | (954 | ) | (1,657 | ) | ||||
Earnings (loss) per share attributable to common stockholders: | ||||||||
Basic | $ | 0.09 | $ | (0.09 | ) | |||
Diluted | $ | (0.03 | ) | $ | (0.09 | ) | ||
Weighted average shares used to compute earnings (loss) per share attributable to common stockholders: | ||||||||
Basic and Diluted | 27,306,258 | 19,460,299 | ||||||
The accompanying Notes to Consolidated Financial Statements are an integral part of these consolidated financial statements
BioLife Solutions, Inc.
Consolidated Statements of Shareholders’ Equity
Common | Common | Additional | Shareholders’ | |||||||||||||||||
Stock | Stock | Paid-in | Accumulated | Equity | ||||||||||||||||
(In thousands, except share data) | Shares | Amount | Capital | Deficit | (Deficit) | |||||||||||||||
Balance, December 31, 2018 | 18,547,406 | $ | 19 | $ | 113,008 | $ | (98,395 | ) | $ | 14,632 | ||||||||||
Stock based compensation | - | 0 | 3,043 | 0 | 3,043 | |||||||||||||||
Shares issued in acquisitions | 1,334,219 | 1 | 23,931 | 0 | 23,932 | |||||||||||||||
Stock option exercises | 697,010 | 1 | 1,180 | 0 | 1,181 | |||||||||||||||
Stock issued – on vested RSUs | 125,817 | 0 | 0 | 0 | 0 | |||||||||||||||
Warrant exercises | 121,000 | 0 | 2,323 | 0 | 2,323 | |||||||||||||||
Net loss | - | 0 | 0 | (1,657 | ) | (1,657 | ) | |||||||||||||
Balance, December 31, 2019 | 20,825,452 | $ | 21 | $ | 143,485 | $ | (100,052 | ) | $ | 43,454 | ||||||||||
Stock issued as 2019 bonus payout | - | 0 | 314 | 0 | 314 | |||||||||||||||
Stock based compensation | - | 0 | 5,981 | 0 | 5,981 | |||||||||||||||
Sale of common stock, net of costs | 7,856,012 | 8 | 100,113 | 0 | 100,121 | |||||||||||||||
Common stock issued for services | 3,175 | 0 | 60 | 0 | 60 | |||||||||||||||
Shares issued in acquisitions | 611,683 | 0 | 17,916 | 0 | 17,916 | |||||||||||||||
Stock option exercises | 777,496 | 1 | 1,471 | 0 | 1,472 | |||||||||||||||
Stock issued – on vested RSUs | 208,858 | 0 | 0 | 0 | 0 | |||||||||||||||
Cashless exercises of 3,871,405 warrants | 2,747,970 | 3 | 33,108 | 0 | 33,111 | |||||||||||||||
Warrant exercises | 8,500 | 0 | 150 | 0 | 150 | |||||||||||||||
Net income | - | 0 | 0 | 2,667 | 2,667 | |||||||||||||||
Balance, December 31, 2020 | 33,039,146 | $ | 33 | $ | 302,598 | $ | (97,385 | ) | $ | 205,246 | ||||||||||
The accompanying Notes to Consolidated Financial Statements are an integral part of these consolidated financial statements
BioLife Solutions, Inc.
Consolidated Statements of Cash Flows
Years Ended December 31, | ||||||||
(In thousands) | 2020 | 2019 | ||||||
Cash flows from operating activities | ||||||||
Net income (loss) | $ | 2,667 | $ | (1,657 | ) | |||
Adjustments to reconcile net income (loss) to net cash provided by operating activities | ||||||||
Depreciation | 2,035 | 718 | ||||||
Amortization of intangible assets | 3,033 | 1,079 | ||||||
Stock-based compensation | 5,981 | 3,043 | ||||||
Non cash lease expense | 737 | 512 | ||||||
Loss from equity method investment in SAVSU | 0 | 739 | ||||||
Gain on acquisition of SAVSU | 0 | (10,108 | ) | |||||
Change in fair value of contingent consideration | 1,575 | 50 | ||||||
Deferred income tax benefit | (3,297 | ) | (1,541 | ) | ||||
Change in fair value of warrant liability | (3,601 | ) | 12,835 | |||||
Change in fair value of investments | (1,319 | ) | 0 | |||||
Stock issued for services | 60 | 0 | ||||||
Loss on disposal of assets held for rent, net | 365 | 0 | ||||||
Other | 190 | 15 | ||||||
Change in operating assets and liabilities | ||||||||
Accounts receivable, trade, net | (1,786 | ) | (290 | ) | ||||
Inventories | (629 | ) | (3,777 | ) | ||||
Prepaid expenses and other current assets | 25 | (704 | ) | |||||
Accounts payable | (171 | ) | 768 | |||||
Accrued expenses and other current liabilities | 780 | (327 | ) | |||||
Other | 0 | (142 | ) | |||||
Net cash provided by operating activities | 6,645 | 1,213 | ||||||
Cash flows from investing activities | ||||||||
Cash acquired in acquisition of SAVSU | 0 | 1,251 | ||||||
Acquisition of Astero Bio, net of cash acquired | 0 | (12,439 | ) | |||||
Payments related to the acquisition of CBS | 0 | (11,000 | ) | |||||
Payments related to the acquisition of SciSafe, net of cash acquired | (14,947 | ) | 0 | |||||
Investment in Sexton | 0 | (1,500 | ) | |||||
Investment in iVexSol convertible debt | 0 | (1,000 | ) | |||||
Investment in iVexSol preferred stock | (1,000 | ) | 0 | |||||
Investment in PanTHERA Cryosolutions | (995 | ) | 0 | |||||
Purchase of property and equipment | (1,961 | ) | (675 | ) | ||||
Deposits on property and equipment | (2,672 | ) | 0 | |||||
Purchase of assets held for lease | (2,813 | ) | (1,655 | ) | ||||
Deposits on assets held for lease | (362 | ) | 0 | |||||
Proceeds from sale of equipment | 35 | 0 | ||||||
Net cash used in investing activities | (24,715 | ) | (27,018 | ) | ||||
Cash flows from financing activities | ||||||||
Proceeds from PPP Loan | 2,175 | 0 | ||||||
Payoff of PPP Loan | (2,175 | ) | 0 | |||||
Proceeds from equipment loans | 984 | 0 | ||||||
Payments of contingent consideration | (483 | ) | 0 | |||||
Proceeds from sale of common stock, net of $6.2 million of costs | 100,121 | 0 | ||||||
Proceeds from exercise of common stock options | 1,471 | 1,181 | ||||||
Proceeds from exercise of warrants | 40 | 574 | ||||||
Payment of costs related to stock issuance | 0 | 0 | ||||||
Other | (55 | ) | (159 | ) | ||||
Net cash provided by financing activities | 102,078 | 1,596 | ||||||
Net increase (decrease) in cash, cash equivalents, and restricted cash | 84,008 | (24,209 | ) | |||||
Cash, cash equivalents, and restricted cash – beginning of year | 6,448 | 30,657 | ||||||
Cash, cash equivalents, and restricted cash – end of year | $ | 90,456 | $ | 6,448 | ||||
Non-cash investing and financing activities | ||||||||
Cashless exercise of warrants reclassed from warrant liability to common stock | $ | 33,111 | $ | 0 | ||||
Equipment acquired under operating leases | 8,096 | 0 | ||||||
Reclassification of warrant liabilities to equity upon exercise | 110 | 1,749 | ||||||
Purchase of property and equipment not yet paid | 0 | 29 | ||||||
Stock issued as consideration to acquire SAVSU | 0 | 19,932 | ||||||
Stock issued as consideration to acquire assets of CBS | 0 | 4,000 | ||||||
Stock issued as consideration to acquire SciSafe | 17,916 | 0 | ||||||
Stock issued as bonus consideration | 314 | 0 | ||||||
The accompanying Notes to Consolidated Financial Statements are an integral part of these consolidated financial statements
NOTES TO CONSOLIDATED FINANCIAL STATEMENTS
1. | Organization and Significant Accounting Policies |
Business
BioLife Solutions, Inc. (“BioLife,” “us,” “we,” “our,” or the “Company”) is a developer, manufacturer and supplier of a portfolio of bioproduction tools and services including; proprietary biopreservation media, automated thawing devices, cloud-connected shipping containers, freezer technology, and biological and pharmaceutical materials storage for cell and gene therapies. Our CryoStor® freeze media and HypoThermosol® hypothermic storage are optimized to preserve cells in the regenerative medicine market. These novel biopreservation media products are serum-free and protein-free, fully defined, and are formulated to reduce preservation-induced cell damage and death. Our ThawSTAR® product line is comprised of a family of automated thawing devices for frozen cell and gene therapies packaged in cryovials and cryobags. These products administer temperature-sensitive biologic therapies to patients by standardizing the thawing process and reducing the risks of contamination and overheating, which are inherent with the use of traditional water baths. Our evo shipping containers provide cloud-connected passive storage and transport containers for temperature-sensitive biologics and pharmaceuticals. Our cryogenic freezer technology provides for controlled rate freezing and storage of biologic materials. Our biological and pharmaceutical materials storage services provide facilities that allow for real-time tracking of materials that can be stored at a wide range of temperatures.
Use of estimates
The preparation of financial statements in conformity with generally accepted accounting principles (“GAAP”) requires management to make estimates and assumptions that affect the reported amounts of assets and liabilities at the date of the financial statements and reported amounts of revenue and expenses during the reporting period. Actual results could differ from those estimates.
Significant estimates and assumptions by management affect the Company’s allowance for doubtful accounts, the net realizable value of inventory, fair value of warrant liability, valuation of market based awards, valuations and purchase price allocations related to investments and business combinations, expected future cash flows including growth rates, discount rates, terminal values and other assumptions and estimates used to evaluate the recoverability of long-lived assets, estimated fair values of intangible assets and goodwill, amortization methods and periods, certain accrued expenses, share-based compensation, contingent consideration from business combinations, tax reserves and recoverability of the Company’s net deferred tax assets, and related valuation allowance.
The Company regularly assesses these estimates, however, actual results could differ materially from these estimates. Changes in estimates are recorded in the period in which they become known. The Company bases its estimates on historical experience and various other assumptions that it believes to be reasonable under the circumstances.
Basis of presentation
The consolidated financial statements include the accounts of the Company and its wholly-owned subsidiaries, Astero Bio Corporation (“Astero” or “ThawStar” acquired on April 1, 2019), SAVSU Technologies, Inc. (“SAVSU” acquired on August 8, 2019), Arctic Solutions, Inc. dba Custom Biogenic Systems (“CBS” acquired on November 12, 2019), and SciSafe Holdings, Inc. (“SciSafe” acquired on October 1, 2020). All significant intercompany accounts and transactions have been eliminated in consolidation.
All long-lived assets are maintained in the United States of America.
Segment reporting
The Company operates and manages its business as one reportable and operating segment, which is the business of bioproduction tools and services. The Company’s Chief Executive Officer, who is the chief operating decision maker, reviews financial information on an aggregate basis for purposes of allocating and evaluating financial performance.
Revenue recognition
To determine revenue recognition for contractual arrangements that we determine are within the scope of Financial Accounting Standards Board (“FASB”) Topic 606, “Revenue from Contracts with Customers”, we perform the following five steps: (i) identify each contract with a customer; (ii) identify the performance obligations in the contract; (iii) determine the transaction price; (iv) allocate the transaction price to our performance obligations in the contract; and (v) recognize revenue when (or as) we satisfy the relevant performance obligation. We only apply the five-step model to contracts when it is probable that we will collect the consideration we are entitled to in exchange for the goods or services we transfer to the customer. The Company primarily recognizes product revenue and service revenues. Product revenues are generated from the sale of biopreservation media, ThawStar, and freezer products. We generally recognize product revenue, including shipping and handling charges billed to customers, when we transfer control of our products to our customers (transfer of control generally occurs upon shipment of our product). Shipping and handling costs are classified as part of cost of product revenue in the statement of operations. Service revenues are generated from the storage of biological and pharmaceutical materials. We generally recognize service revenues over time as services are performed or ratably over the contract term.
The following table includes estimated revenue expected to be recognized in the future related to performance obligations that are unsatisfied or partially unsatisfied at the end of the reporting periods. The Company is electing not to disclose the value of the remaining unsatisfied performance obligation with a duration of one year or less as permitted by the practical expedient in ASU 2014-09, “Revenue from Contracts with Customers”. The estimated revenue in the following table does not include contracts with the original durations of one year or less, amounts of variable consideration attributable to royalties, or contract renewals that are unexercised as of December 31, 2020.
The balances in the table below are partially based on judgments involved in estimating future orders from customers subject to the exercise of material rights pursuant to respective contracts:
Year Ended December 31, | ||||||||||||||||||||
(In thousands) | 2021 | 2022 | 2023 | 2024 | Total | |||||||||||||||
Service revenue | $ | 3,342 | $ | 1,170 | $ | 31 | $ | 10 | $ | 4,553 | ||||||||||
The Company also generates revenue from the leasing of our evo cold chain systems, which are typically cloud-connected shippers with enabling cold chain cloud applications, to customers pursuant to rental arrangements entered into with the customer. Revenue from the rental of cold chain systems is not within the scope of FASB ASC Topic 606 as it is within the scope of FASB ASC Topic 842, “Leases”. All customers leasing shippers currently do so under month-to-month rental arrangements. We account for these rental transactions as operating leases and record rental revenue on a straight-line basis over the rental term. These rental arrangements may contain both lease and non-lease components. We have elected to utilize the practical expedient to account for lease and non-lease components together as a single combined lease component as the timing and pattern of transfer are the same for the non-lease components and associated lease component and, the lease component, if accounted for separately, would be classified as an operating lease.
The following table presents revenues by product line:
Year Ended December 31, | ||||||||
(In thousands) | 2020⁽¹⁾ | 2019⁽²⁾ | ||||||
Biopreservation media | $ | 30,946 | $ | 23,358 | ||||
Automated thawing | 1,709 | 1,184 | ||||||
Cold chain management | 46 | 165 | ||||||
Freezers and accessories | 11,839 | 2,137 | ||||||
Total product revenue | 44,540 | 26,844 | ||||||
Cold chain management | 1,795 | 527 | ||||||
Total rental revenue | 1,795 | 527 | ||||||
Biological and pharmaceutical storage | 1,752 | 0 | ||||||
Total storage revenue | 1,752 | 0 | ||||||
Total revenue | $ | 48,087 | $ | 27,371 | ||||
(1) | 2020 revenue includes service revenue related to SciSafe from October 1, 2020 through December 31, 2020. |
(2) | 2019 revenue includes automated thawing revenue related to Astero from April 1, 2019 through December 31, 2019; evo shipper rental revenue related to SAVSU from August 8, 2019 through December 31, 2019; and freezer and accessory revenue related to CBS from November 12, 2019 through December 31, 2019. |
Risks and uncertainties
COVID-19 Pandemic
On March 10, 2020, the World Health Organization declared the outbreak of the novel strain of coronavirus, SARS-CoV-2, which causes coronavirus disease 2019 (“COVID-19”) a pandemic. The COVID-19 pandemic, and the resulting restrictions intended to slow the spread of COVID-19, including stay-at-home orders, business shutdowns and other restrictions, has affected the Company’s business in several ways. The cell and gene therapy (“CGT”) industry that BioLife services has a complex and highly controlled supply chain that has been impacted by COVID-19. Challenges faced include, but are not limited to, the diversion of healthcare industry resources towards studying and treating COVID-19, logistics operations slowing down on a global scale, and changing environments related to in-person sales efforts. During the year ended December 31, 2020, BioLife’s automated thaw and freezer product lines sold fewer units than were originally forecasted. The sales of these capital equipment products were negatively impacted by customer facility closures that resulted in delayed deliveries and continued limitations on the Company’s in-person, direct selling process.
The Company reviews capital and amortizing intangible assets (long-lived assets) for impairment on an annual basis or whenever events or changes in circumstances indicate that the carrying amount may not be recoverable. The Company determined that the economic uncertainty caused by the COVID-19 pandemic was a trigger for an impairment review in the quarter ended June 30, 2020 of certain long-lived assets based on the expected near-term weakness in ThawSTAR and freezer revenue resulting from the impact of COVID-19.
As a result of the Company’s outlook for near term revenue from the ThawSTAR and freezer product lines, estimated undiscounted cash flow projections were developed to determine if any impairment of the related intangible assets was warranted. After conducting such review, the Company determined that there was no impairment of the remaining long-lived assets as of June 30, 2020. Given the inherent uncertainties of the COVID-19 pandemic and the estimates used in these cash flow projections, changes based on facts and circumstances in future quarters could give rise to impairment.
The Company revised the revenue projections for the ThawSTAR and freezer product lines in the second quarter ended June 30, 2020 to determine the impact on the fair value of the contingent consideration related to the existing earnout provisions. Based on results of the year ended December 31, 2020 related to these two product lines, we made further adjustments to our revenue projections. After reviewing the impact of the updated revenue projections on estimated undiscounted cash flow projections, the Company determined that there was no impairment of the remaining long-lived assets as of December 31, 2020. The Company reduced the fair value of the combined contingent consideration liability from $388,000 at June 30, 2020, to $221,000 at December 31, 2020 due to updated revenue projections, the time value of money, and actual results for the year ended December 31, 2020.
The Company may also experience other negative impacts of the COVID-19 outbreak such as the lack of availability of the Company’s key personnel, additional temporary closures of the Company’s office or the facilities of the Company’s business partners, customers, third party service providers or other vendors, the inability to travel to market and sell our products, and the interruption of the Company’s supply chain, distribution channels, liquidity and capital or financial markets.
Any disruption and volatility in the global capital markets as a result of the pandemic may increase the Company’s cost of capital and adversely affect the Company’s ability to access financing when and on terms that the Company desires. In addition, a potential recession resulting from the spread of COVID-19 could materially affect the Company’s business, especially if a recession results in higher unemployment causing potential patients to not have access to health insurance.
The ultimate extent to which the COVID-19 pandemic and its repercussions impact the Company’s business will depend on future developments, which are highly uncertain. However, the foregoing and other continued disruptions to the Company’s business as a result of COVID-19 could result in a material adverse effect on the Company’s business, results of operations, financial condition and cash flows.
On March 27, 2020, the President of the United States signed into law the “Coronavirus Aid, Relief, and Economic Security (CARES) Act.” The CARES Act, among other things, includes provisions relating to refundable payroll tax credits, deferment of employer side social security tax payments, net operating loss carryback periods, alternative minimum tax credit refunds, modifications to the net interest deduction limitations, increased limitations on qualified charitable contributions, and technical corrections to tax depreciation methods for qualified improvement property.
On March 11, 2021, the President of the United States signed into law the “American Rescue Plan Act of 2021” (the American Rescue Plan), which included additional economic stimulus and tax credits, including the expansion of the Employee Retention Credit. BioLife continues to examine the impact that the American Rescue Plan will have on its financial condition, results of operations, and liquidity.
We determined that we met the original eligibility requirements per the guidelines original established by the U.S. federal government as part of the CARES Act for the Pursuant to the Paycheck Protection Program (the “PPP”). As such, on April 20, 2020, the Company received $2,175,320 in support from the PPP. Because the U.S. government subsequently changed its position and guidelines related to the PPP and publicly traded companies, the Company repaid the loan on April 29, 2020. As of March 30, 2020, the company started deferring the employer side of social security tax payments. At December 31, 2020, the amount of deferred social security tax payments was $432,000. We will pay back 50% of our total deferred payments in 2021 and the remaining 50% in 2022.
In the SciSafe acquisition, the Company acquired a $295,300 loan from the PPP. The loan incurs interest at 1% and is unsecured. Should any portion of the principal of the note not meet the forgiveness provisions, monthly principal and interest payments will be repayable using a monthly amortization schedule starting from the end of the covered period until maturity in October 2022. The Company intends to apply for loan forgiveness in accordance with the loan forgiveness provisions in the legislation; however, there can be no assurance that the Company will obtain full forgiveness of the loans based on the legislation.
Earningsper share
The Company considers its unexercised warrants and unvested restricted shares, which contain non-forfeitable rights to dividends, participating securities, and includes such participating securities in its computation of earnings per share pursuant to the two-class method. Basic earnings per share for the two classes of stock (common stock and warrants) is calculated by dividing net income by the weighted average number of shares of common stock and warrants outstanding during the reporting period. Diluted earnings per share is calculated using the weighted average number of shares of common stock plus the potentially dilutive effect of common equivalent shares outstanding determined under both the two-class method and the treasury stock method, whichever is more dilutive.
The following table presents computations of basic and diluted earnings per share under the two-class method:
Year Ended December 31, | ||||||||
(In thousands, except share and earnings per share data) | 2020 | 2019 | ||||||
Basic earnings (loss) per common share | ||||||||
Numerator: | ||||||||
Net income (loss) | $ | 2,667 | $ | (1,657 | ) | |||
Amount attributable to unvested restricted shares | (135 | ) | 0 | |||||
Amount attributable to warrants outstanding | (82 | ) | 0 | |||||
Net income (loss) allocated to common shareholders | 2,450 | (1,657 | ) | |||||
Denominator: | ||||||||
Weighted-average common shares issued and outstanding | 27,306,258 | 19,460,299 | ||||||
Basic earnings (loss) per common share | 0.09 | (0.09 | ) | |||||
Diluted earnings (loss) per common share | ||||||||
Numerator: | ||||||||
Net income (loss) | 2,667 | (1,657 | ) | |||||
Amount attributable to warrants | (20 | ) | 0 | |||||
Less: gain related to change in fair value of warrants | (3,601 | ) | 0 | |||||
Diluted loss allocated to common shareholders | (954 | ) | (1,657 | ) | ||||
Denominator: | ||||||||
Weighted-average common shares issued and outstanding | 27,306,258 | 19,460,299 | ||||||
Diluted loss per common share | $ | (0.03 | ) | $ | (0.09 | ) | ||
The following table sets forth the number of shares excluded from the computation of diluted loss per share, as their inclusion would have been anti-dilutive:
Year Ended December 31, | ||||||||
2020 | 2019 | |||||||
Stock options and restricted stock awards | 2,131,794 | 2,564,456 | ||||||
Warrants | 1,499,953 | 2,956,039 | ||||||
Total | 3,631,747 | 5,520,495 | ||||||
Cash, cash equivalents, and restricted cash
Cash equivalents consist primarily of interest-bearing money market accounts. We consider all highly liquid debt instruments purchased with an initial maturity of three months or less to be cash equivalents. We maintain cash balances that may exceed federally insured limits. We do not believe that this results in any significant credit risk.
Restricted cash consists entirely of amounts that will be recovered from escrow in relation to the acquisition of SciSafe. The restricted cash is short term in nature, as the Company anticipates to receive the funds within one year of the balance sheet date.
The following is a summary of the Company’s cash, cash equivalents, and restricted cash total as presented in the Company’s consolidated statements of cash flows for the years ended December 31, 2020 and 2019.
Year Ended December 31, | ||||||||
(In thousands) | 2020 | 2019 | ||||||
Cash and cash equivalents | $ | 90,403 | $ | 6,448 | ||||
Restricted cash | 53 | 0 | ||||||
Total cash, cash equivalents, and restricted cash | $ | 90,456 | $ | 6,448 | ||||
Inventories
Inventories relate to the Company’s cell and gene therapy products. The Company values biopreservation media inventory at cost or, if lower, net realizable value, using the specific identification method. All other inventory is valued at cost or, if lower, net realizable value, using the first-in, first-out method. The Company reviews its inventories at least quarterly and records a provision for inventory that has become obsolete, inventory that has a cost basis in excess of its expected net realizable value, and inventory in excess of expected revenue volume to cost of product revenue. The Company bases its estimates on expected product revenue volume, production capacity and expiration dates of raw materials, work in process, and finished products. A change in the estimated timing or amount of demand for the Company’s products could result in additional provisions for excess inventory quantities on hand. Any significant unanticipated changes in demand or unexpected quality failures could have a significant impact on the value of inventory and reported operating results. During all periods presented in the accompanying consolidated financial statements, there have been no material adjustments related to a revised estimate of inventory valuations. Work-in-process and finished products inventories consist of material, labor, outside testing costs and manufacturing overhead.
Accounts receivable
Accounts receivable consist of short-term amounts due from our customers (generally 30 to 90 days) and are stated at the amount we expect to collect. We establish an allowance for doubtful accounts based on our assessment of the collectability of specific customer accounts. Changes in accounts receivable are primarily due to the timing and magnitude of orders of our products, the timing of when control of our products is transferred to our customers and the timing of cash collections.
Accounts receivable are stated at principal amount, do not bear interest, and are generally unsecured. We provide an allowance for doubtful accounts based on an evaluation of customer account balances past due ninety days from the date of invoicing. Accounts considered uncollectible are charged against the established allowance.
Investments
We periodically invest in securities of private companies to promote business and strategic objectives. These investments are measured and recorded as follows:
Non-marketable equity securities are equity securities without a readily determinable fair value. At December 31, 2020, these investments are comprised of $1.5 million in Series A Preferred Stock in Sexton BioTechnologies, Inc. (“Sexton”), $3.4 million in Series A-1 and A-2 Preferred Stock in iVexSol, Inc. (“iVexSol”), and $995,000 in Series E Preferred Stock in PanTHERA CryoSolutions, Inc. (“PanTHERA”). At December 31, 2019, investments were comprised of $1.5 million in Series A Preferred Stock in Sexton.
The Sexton investment is measured and recorded using a measurement alternative that measures the securities at cost minus impairment, if any. The preferred stock is also convertible at our option into common stock at a price of $0.33 per share. In September of 2019, the Company invested $1.0 million in a convertible note receivable of iVexSol, Inc. The Company made an irrevocable election to record this convertible note in its entirety at fair value utilizing the fair value option available under U.S. GAAP. The Company believed that carrying this investment at fair value better portrayed the economic substance of the investment. Under the fair value option, gains and losses on the convertible note are included in unrealized gains/(losses) on investments within net earnings each reporting period. Gains related to the increase in fair value of this convertible note were $1.3 million and zero for the years ended December 31, 2020 and 2019, respectively. The fair value of the note on the date of investment was determined to be equal to its principal amount. Interest income related to this note is recorded separately from other changes in its fair value within interest income each period. In November of 2020, the Company elected to convert the note into Series A-1 Preferred Stock and invest an additional $1.0 million in Series A-2 Preferred Stock in iVexSol. The Preferred Stock investments in iVexSol are carried at cost minus impairment.
In November of 2020, the Company invested $995,000 in Class E Preferred Shares in PanTHERA CryoSolutions, Inc. In conjunction with this investment, the Company executed a development and license agreement with PanTHERA under which the Company will make milestone development payments up to $2 million over the next 24 months in the event that certain milestones are met in exchange for exclusive, perpetual, worldwide marketing and distribution rights to the technology for use in cell and gene therapy applications. The Preferred Stock investments in PanTHERA are carried at cost minus impairment.
As of December 31, 2020, management believes there are no indications of impairment for the investments in Sexton, iVexSol, or PanTHERA.
Property and equipment
Property and equipment are stated at cost and are depreciated using the straight-line method over estimated useful lives of three to ten years. Leasehold improvements are amortized using the straight-line method over the shorter of the estimated useful lives of the assets or the remaining lease term of the respective assets. Gains or losses on disposals of property and equipment are recorded within income from operations. Costs of repairs and maintenance are included as part of operating expenses unless they are incurred in relation to major improvements to existing property and equipment, at which time they are capitalized.
Property and equipment are reviewed for impairment whenever events or changes in circumstances indicate that their net book value may not be recoverable. If the sum of the expected future cash flows (undiscounted and before interest) from the use of the assets is less than the net book value of the asset an impairment could exist and the amount of the impairment loss, if any, will generally be measured as the difference between the net book value of the assets and their estimated fair values. There were 0 impairment losses recognized during the years ended December 31, 2020 and 2019.
Assets held for rent
Assets held for rent are carried at cost less accumulated depreciation. These assets consist of evo shippers and related components in production shippers complete and ready to be deployed and placed in service upon a customer order, shippers in the process of being assembled, and components available to build shippers. When the shipper is sent to our customers, we depreciate the cost of the shippers over its estimated useful life of three years.
Our customers rent the shippers per a rental agreement. Each agreement provides for fixed monthly rent. Rental revenue and fees are recognized over the rental term on a straight-line basis. We retain the ownership of the shippers and the evo tracking software platform. At the end of the rental agreement, the customer returns the shipper to the Company.
Assets held for rent are reviewed for impairment whenever events or changes in circumstances indicate that their net book value may not be recoverable. If the sum of the expected future cash flows (undiscounted and before interest) from the use of the assets is less than the net book value of the asset an impairment could exist and the amount of the impairment loss, if any, will generally be measured as the difference between the net book value of the assets and their estimated fair values. There were 0 impairment losses recognized during the years ended December 31, 2020 and 2019.
Lease accounting
We determine if an arrangement is a lease at inception. Where an arrangement is a lease, we determine if it is an operating lease or a finance lease. At lease commencement, we record a lease liability and corresponding right-of-use (“ROU”) asset. Lease liabilities represent the present value of our future lease payments over the expected lease term which includes options to extend or terminate the lease when it is reasonably certain those options will be exercised. The present value of our lease liability is determined using our incremental collateralized borrowing rate at lease inception. ROU assets represent our right to control the use of the leased asset during the lease and are recognized in an amount equal to the lease liability for leases with an initial term greater than 12 months. Over the lease term we use the effective interest rate method to account for the lease liability as lease payments are made and the ROU asset is amortized to consolidated statement of operations in a manner that results in straight-line expense recognition.
We elected to apply the practical expedient for short-term leases and accordingly do not apply lease recognition requirements for short-term leases. Instead, we recognize payments related to these arrangements in the consolidated statement of operations as lease costs on a straight-line basis over the lease term.
We adopted ASU 2016-02 and related ASUs (collectively Accounting Standards Codification (“ASC”) 842) effective January 1, 2019. The adoption of this standard resulted in the recording of operating lease right-of-use assets of $1.3 million and short-term and long-term lease liabilities of $1.8 million. We elected the practical expedient to combine lease and non-lease components for all of our leases.
Income taxes
We account for income taxes using an asset and liability method which generally requires recognition of deferred tax assets and liabilities for the expected future tax effects of events that have been included in the financial statements or tax returns. Under this method, deferred tax assets and liabilities are recognized for the future tax effects of differences between tax bases of assets and liabilities, and financial reporting amounts, based upon enacted tax laws and statutory rates applicable to the periods in which the differences are expected to affect taxable income. We evaluate the likelihood of realization of deferred tax assets and provide an allowance where, in management’s opinion, it is more likely than not that the asset will not be realized. Our policy for interest and penalties is to recognize interest and penalties as a component of the provision for income taxes in the consolidated statement of operations.
We determine any uncertain tax positions based on a determination of whether and how much of a tax benefit taken in the Company’s tax filings or positions is more likely than not to be sustained upon examination by the relevant income tax authorities.
Judgment is applied in the determination of the financial statement recognition and measurement of tax positions taken or expected to be taken in a tax return. As of December 31, 2020, the Company has an unrecorded tax benefit of $96,000 related to tax attributes being carried forward. The Company is generally subject to examination by U.S. federal and local income tax authorities for all tax years in which loss carryforward is available.
Advertising
Advertising costs are expensed as incurred and totaled $167,000 and $43,000 for the years ended December 31,2020 and 2019, respectively.
Concentrations of risk
In the years ended December 31, 2020 and 2019, we derived approximately 13% of our revenue from one customer and 15% of our revenue from one customer, respectively. All revenue from foreign customers are denominated in United States dollars.
In the year ended December 31, 2020, no suppliers accounted for more than 10% of purchases. In the year ended December 31, 2019, we derived approximately 12% of purchases from 1 supplier.
The following table represents the Company’s total revenue by geographic area (based on the location of the customer):
Year Ended December 31, | ||||||||
Revenue by customers’ geographic locations | 2020 | 2019 | ||||||
United States | 73 | % | 69 | % | ||||
Canada | 13 | % | 16 | % | ||||
Europe, Middle East, Africa (EMEA) | 12 | % | 14 | % | ||||
Other | 2 | % | 1 | % | ||||
Total revenue | 100 | % | 100 | % | ||||
At December 31,2020,one customer accounted for 17% of gross accounts receivable. At December 31,2019,two customers accounted for 25% of gross accounts receivable. No other customers accounted for more than 10% of our gross accounts receivable. In the years 2020 and 2019, we derived approximately 60% and 74%, respectively, of our revenue from CryoStor products.
At December 31, 2020, one supplier accounted for 21% of accounts payable. At December 31, 2019, 2 suppliers accounted for 24% of accounts payable. No other suppliers accounted for more than 10% of our accounts payable.
Research and development
Research and development costs are expensed as incurred.
Stock-based compensation
We measure and record compensation expense using the applicable accounting guidance for share-based payments related to stock options, time-based restricted stock, market-based restricted stock awards and performance-based restricted stock awards granted to our directors and employees. The fair value of stock options, including performance awards, without a market-based condition is determined by using the Black-Scholes option-pricing model. The fair value of restricted stock awards with a market condition is estimated, at the date of grant, using the Monte Carlo Simulation model. The Black-Scholes and Monte Carlo Simulation valuation models incorporate assumptions as to stock price volatility, the expected life of options or awards, a risk-free interest rate and dividend yield. In valuing our stock options, significant judgment is required in determining the expected volatility of our common stock. Expected volatility for stock options is based on the historical and implied volatility of our own common stock while the volatility for our restricted stock awards with a market condition is based on the historical volatility of our own stock and the stock of companies within our defined peer group. Further, our expected volatility may change in the future, which could substantially change the grant-date fair value of future awards and, ultimately, the expense we record. The fair value of restricted stock, including performance awards, without a market condition is estimated using the current market price of our common stock on the date of grant.
We expense stock-based compensation for stock options, restricted stock awards, and performance awards over the requisite service period. For awards with only a service condition, we expense stock-based compensation using the straight-line method over the requisite service period for the entire award. For awards with a market condition, we expense the grant date fair value over the vesting period regardless of the value that the award recipients ultimately receive.
Business combinations, goodwill and intangible assets
Business Combinations
The Company accounts for business acquisitions using the acquisition method as required by FASB ASC Topic 805, “Business Combinations”.
The Company’s identifiable assets acquired and liabilities, including identified intangible assets, assumed in a business combination are recorded at their acquisition date fair values. The valuation requires management to make significant estimates and assumptions, especially with respect to long-lived and intangible assets. Critical estimates in valuing intangible assets include, but are not limited to:
● | future expected cash flows, including revenue and expense projections; |
● | discount rates to determine the present value of recognized assets and liabilities and; |
● | revenue volatility to determine contingent consideration using option pricing models |
The Company’s estimates of fair value are based upon assumptions it believes to be reasonable, but that are inherently uncertain and unpredictable. Assumptions may be incomplete or inaccurate, and unanticipated events and circumstances may occur. While the Company uses its best estimates and assumptions to value assets acquired and liabilities assumed as of the acquisition date, the estimates are inherently uncertain and subject to refinement.
Goodwill is calculated as the excess of the acquisition price over the fair value of net assets acquired, including the amount assigned to identifiable intangible assets. Acquisition-related costs, including advisory, legal, accounting, valuation, and other costs, are expensed in the periods in which these costs are incurred. The results of operations of an acquired business are included in the consolidated financial statements beginning at the acquisition date.
The Company estimates the acquisition date fair value of the acquisition-related contingent consideration using various valuation approaches, including option pricing models, as well as significant unobservable inputs, reflecting the Company’s assessment of the assumptions market participants would use to value these liabilities. The fair value of the contingent consideration is remeasured each reporting period.
During the measurement period, which may be up to one year from the acquisition date, any refinements made to the fair value of the assets acquired, liabilities assumed, or contingent consideration are recorded in the period in which the adjustments are recognized. Upon the conclusion of the measurement period or final determination of the fair value of the assets acquired, liabilities assumed, or contingent consideration, whichever comes first, any subsequent adjustments are recognized in the consolidated statements of operations.
Goodwill
Goodwill represents the excess of the purchase price over the net amount of identifiable assets acquired and liabilities assumed in a business combination measured at fair value. Goodwill is not amortized but is tested for impairment at least annually. The Company reviews goodwill for impairment annually at the end of its fourth fiscal quarter and whenever events or changes in circumstances indicate that the fair value of a reporting unit may be less than its carrying amount (a triggering event). The Company first assesses qualitative factors to determine whether it is more likely than not that the fair value of a reporting unit is less than its carrying amount as a basis for determining whether it is necessary to perform the quantitative goodwill impairment test described in FASB ASC Topic 350, “Intangibles – Goodwill and Other”. The more likely than not threshold is defined as having a likelihood of more than 50 percent. If, after assessing the totality of events or circumstances, the Company determines that it is not more likely than not that the fair value of a reporting unit is less than its carrying amount, then performing the quantitative goodwill impairment test is unnecessary and goodwill is considered to be unimpaired. However, if based on the qualitative assessment the Company concludes that it is more likely than not that the fair value of a reporting unit is less than its carrying amount, the Company will proceed with performing the quantitative goodwill impairment test. In performing the quantitative goodwill impairment test, the Company determines the fair value of each reporting unit and compares it to its carrying value. If the fair value of the reporting unit exceeds the carrying value of the net assets assigned to that unit, goodwill is not impaired. If the carrying value of a reporting unit exceeds its fair value, the Company records an impairment loss equal to the difference. The Company operates as one reporting unit as of the goodwill impairment measurement date of December 31, 2020. As of December 31, 2020, management believes there are no indications of impairment.
Intangible Assets
Intangible assets consist of developed technology, customer relationships, and tradenames and trademarks, resulting from the Company’s acquisitions. Intangible assets are recorded at fair value on the date of acquisition and amortized over their estimated useful lives on a straight-line basis. Intangible assets and their related useful lives are reviewed at least annually to determine if any adverse conditions exist that would indicate the carrying value of these assets may not be recoverable. More frequent impairment assessments are conducted if certain conditions exist, including a change in the competitive landscape, any internal decisions to pursue new or different technology strategies, a loss of a significant customer, or a significant change in the marketplace, including changes in the prices paid for the Company’s products or changes in the size of the market for the Company’s products. If impairment indicators are present, the Company determines whether the underlying intangible asset is recoverable through estimated future undiscounted cash flows. If the asset is not found to be recoverable, it is written down to the estimated fair value of the asset based on the sum of the future discounted cash flows expected to result from the use and disposition of the asset. If the estimate of an intangible asset’s remaining useful life is changed, the remaining carrying amount of the intangible asset is amortized prospectively over the revised remaining useful life. The Company continues to believe that its definitive-lived intangible assets are recoverable at December 31, 2020.
Certain warrants which have features that may result in cash settlement
Warrants that include cash settlement features are recorded as liabilities at their estimated fair value at the date of issuance and are remeasured at fair value each reporting period with the increase or decrease in fair value recorded in the consolidated statements of operations. The warrants are measured at estimated fair value using the Black Scholes valuation model, which is based, in part, upon inputs for which there is little or no observable market data, requiring the Company to develop its own assumptions. Inherent in this model are assumptions related to expected stock-price volatility, expected life, risk-free interest rate and dividend yield. We estimate the volatility of our common stock at the date of issuance, and at each subsequent reporting period, based on historical volatility that matches the contractual remaining life of the warrants. The risk-free interest rate is based on the U.S. Treasury zero-coupon yield curve on the grant date for a maturity similar to the expected remaining life of the warrants. The expected life of the warrants is assumed to be equivalent to their remaining contractual term. The dividend rate is based on our historical rate, which we anticipate to remain at zero. The assumptions used in calculating the estimated fair value of the warrants represent our best estimates. However, these estimates involve inherent uncertainties and the application of management judgment. As a result, if factors change and different assumptions are used, the warrant liability and the change in estimated fair value could be materially different. The following is our weighted average assumptions used in the Black Scholes calculations of the warrants:
Year Ended December 31, | ||||||||
2020 | 2019 | |||||||
Risk free interest rate | 0.1 | % | 1.9 | % | ||||
Expected dividend yield | 0.0 | % | 0.0 | % | ||||
Contractual remaining lives | 0.2 | 1.7 | ||||||
Expected volatility | 56.8 | % | 70.3 | % | ||||
Recent accounting pronouncements
In August 2018, the FASB issued ASU 2018-13, “Fair Value Measurement (Topic 820): Disclosure Framework – Changes to the Disclosure Requirements for Fair Value Measurement.” ASU 2018-13 includes amendments that aim to improve the effectiveness of fair value measurement disclosures. The amendments in this guidance modify the disclosure requirements on fair value measurements based on the concepts in FASB Concepts Statement, “Conceptual Framework for Financial Reporting—Chapter 8: Notes to Financial Statements,” including the consideration of costs and benefits. The amendments become effective for the Company in the year ending December 31, 2020 and early adoption is permitted. The Company adopted this guidance January 1, 2020. The adoption did not have a material impact on the Company’s consolidated financial statements as of and for the year ended December 31, 2020.
In December 2019, the FASB issued ASU 2019-12, “Income Taxes (Topic 740) – Simplifying the Accounting for Income Taxes.” ASU 2019-12 simplifies the accounting for income taxes by removing certain exceptions to the general principles in Topic 740, including, but not limited to, the exception to the incremental approach for intraperiod tax allocation when there is a loss from continuing operations and income or a gain from other items, the exceptions related to the recognition of a deferred tax liability related to an equity method investment and the exception to methodology for calculating income taxes in an interim period when a year-to-date loss exceeds the anticipated loss for the year. ASU 2019-12 becomes effective for the Company in the year ended December 31, 2021, including interim periods. Due to the full valuation allowance on the Company’s net deferred tax assets, the Company is currently expecting no material impact from the adoption of ASU 2019-12 on its consolidated financial statements.
In June 2016, the FASB issued ASU No.2016-13, “Financial Instruments – Credit Losses (Topic 326): Measurement of Credit Losses on Financial Instruments.” ASU 2016-13 requires companies to measure credit losses utilizing a methodology that reflects expected credit losses and requires a consideration of a broader range of reasonable and supportable information to inform credit loss estimates. For Smaller Reporting Companies as defined by the SEC, ASU 2016-13 is effective for fiscal years beginning after December 15, 2022, including interim periods within those fiscal years. The Company is evaluating the impact of the guidance on its financial statements.
In August 2018, the FASB issued ASU No.2018-15, “Intangibles—Goodwill and Other—Internal-Use Software (Subtopic 350-40): Customer’s Accounting for Implementation Costs Incurred in a Cloud Computing Arrangement That Is a Service Contract”, which clarifies the accounting for implementation costs in cloud computing arrangements. ASU 2018-15 is effective for fiscal years beginning after December 15, 2019, including interim periods within those fiscal years. The Company adopted this guidance January 1, 2020 and there was no material impact on its consolidated financial statements.
2. | Fair Value Measurement |
In accordance with FASB ASC Topic 820, “Fair Value Measurements and Disclosures,” (“ASC Topic 820”), the Company measures its cash and cash equivalents and investments at fair value on a recurring basis. The Company also measures certain assets and liabilities at fair value on a non-recurring basis when applying acquisition accounting. ASC Topic 820 clarifies that fair value is an exit price, representing the amount that would be received to sell an asset or paid to transfer a liability in an orderly transaction between market participants. As such, fair value is a market-based measurement that should be determined based on assumptions that market participants would use in pricing an asset or liability. As a basis for considering such assumptions, ASC Topic 820 establishes a three-tier value fair hierarchy, which prioritizes the inputs used in measuring fair value as follows:
Level 1 – Observable inputs that reflect quoted prices (unadjusted) in active markets for identical assets or liabilities.
Level 2 – Observable inputs other than quoted prices included in Level 1 for similar assets or liabilities, quoted prices in markets that are not active or other inputs that are observable or can be corroborated by observable market data for substantially the full term of the related assets or liabilities.
Level 3 – Unobservable data points for the asset or liability, and include situations where there is little, if any, market activity for the asset or liability.
For the investment in iVexSol convertible debt that was converted to Series A-1 preferred stock in November 2020, the significant Level 3 inputs were the expected term of the instrument, the underlying credit worthiness of iVexSol and the valuation of various embedded features in the note, which were based on future financings of iVexSol. We considered a range of probability-weighted financing or payoff settlements between 5% and 50% with outcomes occurring over a range of 1 to 2 years. The estimated market interest rate of approximately 8.0% was based on an average of indexes of below investment grade debt. The market rate was calibrated to the rate implied in the original issuance in September 2019 and adjusted for changes in market rates quarterly. Certain assumptions used in estimating the fair value of the convertible debt were uncertain by nature. Actual results may differ materially from estimates.
The fair value of the Astero contingent consideration liability was initially valued based on unobservable inputs using a Black-Scholes valuation model. These inputs included the estimated amount and timing of projected future revenue, a discount rate of 17.5%, risk-free rates between 2.29% and 2.41% and revenue volatility of 56%. Significant increases (decreases) in any of those inputs in isolation would result in a significantly higher (lower) fair value measurement. Generally, changes used in the assumptions for projected future revenue and revenue volatility would be accompanied by a directionally similar change in the fair value measurement. Conversely, changes in the discount rate would be accompanied by a directionally opposite change in the related fair value measurement. However, due to the contingent consideration having a maximum payout amount, changes in these assumptions would not affect the fair value of the contingent consideration if they increase (decrease) beyond certain amounts. Subsequent to the acquisition date, at each reporting period, the contingent consideration liability is re-measured to fair value with changes recorded in the change in fair value of contingent consideration in the consolidated statements of operations. During the most recent re-measurement of the contingent consideration liability as of December 31, 2020, the Company used a discount rate of 11.0%, a risk-free rate of 0.11% and revenue volatility of 76.6%. This contingent consideration liability is presented in the Consolidated Balance Sheet Data:at December 31, 2020 and 2019 in the amount of $81,000 and $1.1 million, respectively. Certain assumptions used in estimating the fair value of the contingent consideration are uncertain by nature. Actual results may differ materially from estimates.
As of December 31, | ||||||||||||||||||||
(In thousands) | 2019(1)(2) | 2018(3) (Restated) | 2017(4) (Restated) (Unaudited) | 2016(4) (Restated) (Unaudited) | 2015(4) (Restated) (Unaudited) | |||||||||||||||
Cash and cash equivalents, including investments of marketable securities | $ | 6,448 | $ | 30,657 | $ | 6,663 | $ | 1,406 | $ | 3,825 | ||||||||||
Total assets | 92,816 | 45,467 | 12,143 | 7,927 | 12,370 | |||||||||||||||
Current liabilities | 7,669 | 1,939 | 1,513 | 1,133 | 1,726 | |||||||||||||||
Warrant liability | 39,602 | 28,516 | 19,624 | 3,722 | 10,251 | |||||||||||||||
Promissory note payable to related party | — | — | — | 2,844 | — | |||||||||||||||
Total liabilities | 49,362 | 30,835 | 21,674 | 8,482 | 12,762 | |||||||||||||||
Additional paid in capital | 143,485 | 113,008 | 63,505 | 51,270 | 49,737 | |||||||||||||||
Accumulated earnings (deficit) | (100,052 | ) | (98,395 | ) | (73,050 | ) | (51,839 | ) | (51,493 | ) | ||||||||||
Total shareholders’ equity (deficit) | $ | 43,454 | $ | 14,632 | $ | (9,530 | ) | $ | (556 | ) | $ | (393 | ) | |||||||
The fair value of the CBS contingent consideration liability was initially valued based on unobservable inputs using a Monte Carlo simulation. These inputs included the estimated amount and timing of projected future revenue, a discount rate of 26.0%, a risk-free rate of approximately 1.74% and revenue volatility of 70%. Significant increases (decreases) in any of those inputs in isolation would result in a significantly higher (lower) fair value measurement. Generally, changes used in the assumptions for projected future revenue and revenue volatility would be accompanied by a directionally similar change in the fair value measurement. Conversely, changes in the discount rate would be accompanied by a directionally opposite change in the related fair value measurement. However, due to the contingent consideration having a maximum payout amount, changes in these assumptions would not affect the fair value of the contingent consideration if they increase (decrease) beyond certain amounts. Subsequent to the acquisition date, at each reporting period, the contingent consideration liability is re-measured to fair value with changes recorded in the change in fair value of contingent consideration in the consolidated statements of operations. During the most recent re-measurement of the contingent consideration liability as of December 31, 2020, the Company used a discount rate of 21.0%, a risk-free rate of 0.23% and revenue volatility of 63%. This contingent consideration liability is presented in the Consolidated Balance Sheet at December 31, 2020 and 2019 in the amount of $140,000 and $856,000, respectively. Certain assumptions used in estimating the fair value of the contingent consideration are uncertain by nature. Actual results may differ materially from estimates.
The fair value of the SciSafe contingent consideration liability was initially valued based on unobservable inputs using a Monte Carlo simulation. These inputs included the estimated amount and timing of projected future revenue, a discount rate of 4.5%, a risk-free rate of approximately 0.20%, asset volatility of 60%, and revenue volatility of 15%. Significant increases (decreases) in any of those inputs in isolation would result in a significantly higher (lower) fair value measurement. Generally, changes used in the assumptions for projected future revenue and revenue volatility would be accompanied by a directionally similar change in the fair value measurement. Conversely, changes in the discount rate would be accompanied by a directionally opposite change in the related fair value measurement. However, due to the contingent consideration having a maximum payout amount, changes in these assumptions would not affect the fair value of the contingent consideration if they increase (decrease) beyond certain amounts. At the acquisition date, the contingent consideration was determined to have a fair value of $3.7 million. Subsequent to the acquisition date, the contingent consideration liability was re-measured to fair value with changes recorded in the change in fair value of contingent consideration in the consolidated statements of operations. During the most recent re-measurement of the contingent consideration liability as of December 31, 2020, the Company used a discount rate of 4.5%, a risk-free rate of approximately 0.22%, asset volatility of 61%, and revenue volatility of 15%. This contingent consideration liability is presented in the Consolidated Balance Sheet at December 31, 2020 in the amount of $6.9 million. The change in fair value of contingent consideration of $3.3 million associated with this liability is presented within the consolidated statements of operations for the year ended December 31, 2020. Certain assumptions used in estimating the fair value of the contingent consideration are uncertain by nature. Actual results may differ materially from estimates.
For the warrant liability, the significant Level 3 inputs include the contractual remaining term of the warrants and the volatility of the Company’s common stock. For the estimated term of the warrants, we used the actual terms of the warrants, which are all currently less than one year. For the volatility off the Company’s stock we used historical volatility for the remaining term of each warrant. These amounts ranged from 56.8% to 84.6% during the year ended December 31, 2020. We did not make any adjustments to the historical volatility. Certain assumptions used in estimating the fair value of the warrants are uncertain by nature. Actual results may differ materially from estimates.
There were no remeasurements to fair value during the year ended December 31, 2020 of financial assets and liabilities that are not measured at fair value on a recurring basis.
The following tables set forth the Company’s financial assets and liabilities measured at fair value on a recurring basis as of December 31, 2020 and December 31, 2019, based on the three-tier fair value hierarchy:
(In thousands)
As of December 31, 2020 | Level 1 | Level 2 | Level 3 | Total | ||||||||||||
Assets: | ||||||||||||||||
Money market accounts | $ | 90,403 | $ | 0 | $ | 0 | $ | 90,403 | ||||||||
Total | 90,403 | 0 | 0 | 90,403 | ||||||||||||
Liabilities: | ||||||||||||||||
Contingent consideration - business combinations | 0 | 0 | 7,152 | 7,152 | ||||||||||||
Warrant liability | 0 | 0 | 2,780 | 2,780 | ||||||||||||
Total | $ | 0 | $ | 0 | $ | 9,932 | $ | 9,932 | ||||||||
As of December 31, 2019 | Level 1 | Level 2 | Level 3 | Total | ||||||||||||
Assets: | ||||||||||||||||
Money market accounts | $ | 6,448 | $ | 0 | $ | 0 | $ | 6,448 | ||||||||
Convertible debt held at fair value | 0 | 0 | 1,000 | 1,000 | ||||||||||||
Total | 6,448 | 0 | 1,000 | 7,448 | ||||||||||||
Liabilities: | ||||||||||||||||
Contingent consideration - business combinations | 0 | 0 | 1,914 | 1,914 | ||||||||||||
Warrant liability | 0 | 0 | 39,602 | 39,602 | ||||||||||||
Total | $ | 0 | $ | 0 | $ | 41,516 | $ | 41,516 | ||||||||
The fair values of money market funds classified as Level 1 were derived from quoted market prices as active markets for these instruments exist. The fair values of investments and contingent consideration classified as Level 3 were derived from management assumptions (see Note 1 – “Organization and Significant Accounting Policies.”) There have been no transfers of assets or liabilities between the fair value measurement levels.
The following table presents the changes in fair value of convertible debt investments which are measured using Level 3 inputs at December 31, 2020 and 2019:
(In thousands) | 2020 | 2019 | ||||||
Beginning balance | $ | 1,000 | $ | 0 | ||||
Purchases | 0 | 1,000 | ||||||
Change in fair value recognized in net income | 1,319 | 0 | ||||||
Recognition of accrued interest in fair value upon conversion | 58 | 0 | ||||||
Conversion of convertible debt to preferred stock | (2,377 | ) | 0 | |||||
Total | $ | 0 | $ | 1,000 | ||||
The following table presents the changes in fair value of contingent consideration liabilities which are measured using Level 3 inputs at December 31, 2020 and 2019:
(In thousands) | 2020 | 2019 | ||||||
Beginning balance | $ | 1,914 | $ | 0 | ||||
Additions | 3,663 | 2,347 | ||||||
Change in fair value recognized in net income | 1,575 | 50 | ||||||
Payments earned, reclassified to accrued liabilities | 0 | (483 | ) | |||||
Total | $ | 7,152 | $ | 1,914 | ||||
The following table presents the changes in fair value of warrant liabilities which are measured using Level 3 inputs at December 31, 2020 and 2019:
(In thousands) | 2020 | 2019 | ||||||
Beginning balance | $ | 39,602 | $ | 28,516 | ||||
Exercised warrants | (33,221 | ) | (1,749 | ) | ||||
Change in fair value recognized in net income | (3,601 | ) | 12,835 | |||||
Total | $ | 2,780 | $ | 39,602 | ||||
3. | Inventories |
Inventories consist of the following at December 31,2020 and 2019:
(In thousands) | 2020 | 2019 | ||||||
Raw materials | $ | 2,855 | $ | 2,979 | ||||
Work in progress | 2,006 | 1,896 | ||||||
Finished goods | 6,741 | 6,097 | ||||||
Total | $ | 11,602 | $ | 10,972 | ||||
4. | Assets held for rent |
Assets held for rent consist of the following at December 31, 2020 and 2019:
(In thousands) | 2020 | 2019 | ||||||
Shippers placed in service | $ | 3,171 | $ | 3,073 | ||||
Accumulated depreciation | (411 | ) | (174 | ) | ||||
Net | 2,760 | 2,899 | ||||||
Shippers and related components in production | 1,945 | 1,023 | ||||||
Total | $ | 4,705 | $ | 3,922 | ||||
Shippers and related components in production include shippers complete and ready to be deployed and placed in service upon a customer order, shippers in the process of being assembled, and components available to build shippers. We recognized $671,000 and $174,000 in depreciation expense related to assets held for rent during the year ended December 31, 2020 and 2019, respectively.
5. | Leases |
We lease approximately 32,106 square feet in our Bothell, Washington headquarters. In November of 2020, the Company entered into an amendment to the current lease agreement associated with this facility to extend the term of the lease until July 31, 2031. The amendment included a $2.6 million tenant allowance that the Company expects to receive as improvements are made between 2021 and 2023. This lease includes two options to extend the term of the lease, each of which is for an additional period of five years, with the first extension term commencing, if at all, on August 1, 2031, and the second extension term commencing, if at all, immediately following the expiration of the first extension term. In accordance with the amended lease agreement, our monthly base rent is approximately $65,000 at December 31, 2020, with scheduled annual increases each August. We are also required to pay an amount equal to the Company’s proportionate share of certain taxes and operating expenses.
We lease approximately 3,460 square feet in our Menlo Park, California location. The term of our lease continues until December 31, 2021. In accordance with the lease agreement, the monthly base rent is approximately $11,000 at December 31, 2020. We are also required to pay an amount equal to the Company’s proportionate electrical expenses and common area maintenance fees.
We lease approximately 9,932 square feet in our Albuquerque, New Mexico location. The term of our lease continues until December 31, 2021 with two options to extend the terms of the lease, each of which is for an additional period of three years, with the first extension term commencing, if at all, on December 1, 2021, and the second extension term commencing, if at all, December 1, 2024. In accordance with the lease agreement, the monthly base rent is approximately $9,000 at December 31, 2020, with an increase at the beginning of each extension term if the lease term is extended.
We lease approximately 106,998 square feet in our Detroit, Michigan location under a month-to-month arrangement. The monthly base rent is approximately $35,000 at December 31, 2020.
The Company leases approximately 32,500 square feet at two locations in the United States. The terms of the two leases go through March 31, 2024 and January 31, 2023, respectively, and have no options to extend the terms. In accordance with the first lease, the Company’s monthly base rent is approximately $13,000 at December 31, 2020, with scheduled increases each April. In accordance with the second lease, the Company’s monthly base rent is approximately $8,000 at December 31, 2020, with a one-time scheduled increase in February 2021. For each lease, the Company is also required to pay an amount equal to the Company’s proportionate share of certain taxes and operating expenses.
The Company also leases approximately 16,153 square feet in the United States. The term of the lease continues until June 30, 2024 and has no option to extend the term. In accordance with the amended lease agreement, the Company’s monthly base rent is approximately $13,000 at December 31, 2020, with scheduled increases each July. The Company is also required to pay an amount equal to the Company’s proportionate share of certain taxes and operating expenses.
Operating leases recorded on our consolidated balance sheet are primarily related to our Bothell, Washington headquarters space lease and our SciSafe space leases in the United States. We have not included extension options in our ROU assets or lease liabilities as we are not reasonably certain we will enter into the renewal options in their current terms. Our Detroit, Michigan and Menlo Park, California lease are not recorded on our consolidated balance sheet as the term expires in one year or less.
Our financing lease is related to research equipment, machinery, and other equipment.
We used a weighted average discount rate of 3.3% as of December 31, 2020 and 6.5% as of December 31, 2019, our market collateralized borrowing rate; and 5.7% as of December 31, 2020 and 8.1% as of December 31, 2019, the weighted average implied interest on our leases, to determine our operating and financing lease liabilities, respectively. The weighted average remaining term of our operating and financing leases are 9.4 years as of December 31, 2020 and 1.8 years as of December 31, 2019; and 2.6 years as of December 31, 2020 and 1.2 years as of December 31, 2019, respectively. As a result of the Company entering into an amendment to the Bothell lease agreement, operating right of use asset and operating lease liability balances increased by a total of $7.9 million. Through the SciSafe acquisition, we acquired $1.3 million in operating lease right of use assets and operating lease liabilities. Cash paid for amounts included in the measurement of operating lease liabilities (all operating cash flows) in the years ended December 31, 2020 and 2019 were $1.3 million and $778,000, respectively.
The components of lease expense for the years ended December 31, 2020 and 2019 were as follows:
(In thousands) | 2020 | 2019 | ||||||
Operating lease costs | $ | 839 | $ | 612 | ||||
Short-term lease costs | 277 | 51 | ||||||
Total operating lease costs | 1,116 | 663 | ||||||
Variable lease costs | 357 | 299 | ||||||
Total lease expense | $ | 1,473 | $ | 962 | ||||
Maturities of our lease liabilities as of December 31, 2020 is as follows:
(In thousands) | Operating Leases | Financing Leases | ||||||
2021 | $ | 1,442 | $ | 9 | ||||
2022 | 1,341 | 7 | ||||||
2023 | 1,207 | 6 | ||||||
2024 | 1,023 | 0 | ||||||
2025 | 924 | 0 | ||||||
Thereafter | 5,685 | 0 | ||||||
Total lease payments | 11,622 | 22 | ||||||
Less: interest | (1,758 | ) | (2 | ) | ||||
Total present value of lease liabilities | $ | 9,864 | $ | 20 | ||||
6. | Goodwill and Intangible Assets |
Goodwill
The following table represents the changes in the carrying value of goodwill for the year ended December 31, 2020:
(In thousands) | Goodwill | |||
Balance as of December 31, 2018 | $ | 0 | ||
Goodwill related to Astero acquisition | 9,515 | |||
Goodwill related to SAVSU acquisition | 21,037 | |||
Goodwill related to CBS acquisition | 3,085 | |||
Balance as of December 31, 2019 | 33,637 | |||
Correction of an error related to CBS goodwill | (131 | ) | ||
Goodwill related to SciSafe acquisition | 24,943 | |||
Balance as of December 31, 2020 | $ | 58,449 | ||
We adjusted goodwill from the CBS Acquisition related to an immaterial error of $131,000 in payables that were paid during closing and incorrectly recorded as liabilities in our purchase price accounting as of December 31, 2019. We reduced our goodwill and accounts payable by $131,000.
Intangible Assets
Intangible assets, net consisted of the following at December 31, 2020 and 2019:
(In thousands, except weighted average useful life) | December 31, 2020 | |||||||||||||||
Finite-lived intangible assets: | Gross Carrying Value | Accumulated Amortization | Net Carrying Value | Weighted Average Useful Life (in years) | ||||||||||||
Customer Relationships | $ | 8,220 | $ | (330 | ) | $ | 7,890 | 12.8 | ||||||||
Tradenames | 6,610 | (508 | ) | 6,102 | 14.0 | |||||||||||
Technology - acquired | 19,670 | (3,232 | ) | 16,438 | 7.1 | |||||||||||
Non-compete agreements | 660 | (41 | ) | 619 | 3.8 | |||||||||||
Total intangible assets | $ | 35,160 | $ | (4,111 | ) | $ | 31,049 | 9.7 | ||||||||
December 31, 2019 | ||||||||||||||||
Gross Carrying Value | Accumulated Amortization | Net Carrying Value | Weighted Average Useful Life (in years) | |||||||||||||
Customer Relationships | $ | 800 | $ | (51 | ) | $ | 749 | 5.6 | ||||||||
Tradenames | 2,590 | (123 | ) | 2,467 | 8.1 | |||||||||||
Technology - acquired | 19,020 | (904 | ) | 18,116 | 8.4 | |||||||||||
In-process R&D⁽¹⁾ | 650 | 0 | 650 | 9.0 | ||||||||||||
Total intangible assets | $ | 23,060 | $ | (1,078 | ) | $ | 21,982 | 8.3 | ||||||||
(1) | In-process R&D represents the fair value of incomplete research and development that had not yet reached technological feasibility as of December 31, 2019. In the second quarter of 2020, the asset reached technological feasibility and was placed in service. |
Amortization expense for finite-lived intangible assets was $3.0 million and $1.1 million for the year ended December 31, 2020 and 2019, respectively. In-process research and development was put into service in the second quarter of 2020. As of December 31, 2020, the Company expects to record the following amortization expense:
(In thousands) | ||||
For the Years Ended December 31, | Estimated Amortization Expense | |||
2021 | $ | 3,731 | ||
2022 | 3,731 | |||
2023 | 3,701 | |||
2024 | 3,635 | |||
2025 | 3,463 | |||
Thereafter | 12,788 | |||
Total | $ | 31,049 | ||
7. | Income Taxes |
The provision (benefit) for income taxes consists of the following:
Year Ended December 31, | ||||||||
(In thousands) | 2020 | 2019 | ||||||
Federal | $ | 0 | $ | 0 | ||||
State | 33 | 0 | ||||||
Total current tax provision | 33 | 0 | ||||||
Federal | (3,297 | ) | (1,541 | ) | ||||
State | 0 | 0 | ||||||
Total deferred tax provision | (3,297 | ) | (1,541 | ) | ||||
Provision (benefit) for income taxes | $ | (3,264 | ) | $ | (1,541 | ) | ||
In connection with the 2020 SciSafe Acquisition, the Company recognized a deferred tax liability of $3.3 million on acquired intangible assets. As a result, the Company recorded an income tax benefit of $3.3 million for the release of valuation allowance on our existing U.S. deferred tax assets as a result of the offset of deferred tax liabilities established for intangible assets from the acquisition.
In connection with the 2019 SAVSU Acquisition, the Company recognized a deferred tax liability of $1.5 million on acquired intangible assets. As a result, the Company recorded an income tax benefit of $1.5 million for the release of valuation allowance on our existing U.S. deferred tax assets as a result of the offset of deferred tax liabilities established for intangible assets from the acquisition.
A reconciliation of income taxes computed using the U.S. federal statutory rate to that reflected in operations follows:
Year Ended December 31, | ||||||||
2020 | 2019 | |||||||
Tax on net income at federal statutory rate | 21 | % | 21 | % | ||||
State tax expense | 39 | % | 0 | |||||
Change in valuation allowance | 35 | % | (5 | %) | ||||
Stock-based compensation | 538 | % | 74 | % | ||||
Section 162(m) limitation on executive compensation | (35 | %) | (17 | %) | ||||
Book loss on equity method investment | 0 | (5 | %) | |||||
Fair value change in warrant liability | 127 | % | (82 | %) | ||||
Gain on stock acquisition | 0 | 64 | % | |||||
Transaction costs | (6 | %) | (4 | %) | ||||
Fair value change in contingent consideration | (81 | %) | 0 | |||||
Tax credits | 12 | % | 5 | % | ||||
Expired net operating losses | (100 | %) | (5 | %) | ||||
Other | (3 | %) | 1 | % | ||||
Total | 547 | % | 47 | % | ||||
The principal components of the Company’s net deferred tax assets are as follows:
December 31, | ||||||||
(In thousands) | 2020 | 2019 | ||||||
Deferred tax assets related to: | ||||||||
Net operating loss carryforward | $ | 12,314 | $ | 9,495 | ||||
Stock-based compensation | 1,678 | 1,110 | ||||||
Accruals and reserves | 427 | 192 | ||||||
Inventory | 142 | 88 | ||||||
Lease liabilities | 2,247 | 208 | ||||||
Tax credit carryforward | 225 | 152 | ||||||
Other | 48 | 4 | ||||||
Total deferred tax assets | 17,081 | 11,249 | ||||||
Deferred tax liabilities related to: | ||||||||
Intangibles | (5,025 | ) | (2,217 | ) | ||||
Right-of-use assets | (2,261 | ) | (218 | ) | ||||
Fair value change in investments | (287 | ) | 0 | |||||
Fixed assets | (959 | ) | (108 | ) | ||||
Other | (51 | ) | 0 | |||||
Total deferred tax liabilities | (8,583 | ) | (2,543 | ) | ||||
Total deferred taxes | 8,498 | 8,706 | ||||||
Less: valuation allowance | (8,498 | ) | (8,706 | ) | ||||
Net deferred taxes | $ | 0 | $ | 0 | ||||
The Company maintains a full valuation allowance on its net deferred tax assets. The assessment regarding whether a valuation allowance is required considers both positive and negative evidence when determining whether it is more likely than not that deferred tax assets are recoverable. In making this assessment, significant weight is given to evidence that can be objectively verified. In its evaluation, the Company considered its cumulative book losses, not including transaction gains, as significant negative evidence. Based upon a review of the four sources of income identified within ASC 740, “Accounting for Income Taxes”, the Company determined that the negative evidence outweighed the positive evidence and a full valuation allowance on its deferred tax assets will be maintained. The Company will continue to assess the realizability of its deferred tax assets going forward and will adjust the valuation allowance as needed.
As of December 31, 2020, the Company had U.S. federal net operating loss (“NOL”) carryforwards of approximately $56.6 million, which is available to reduce future taxable income. Approximately $32.3 million of NOL will expire from 2021 through 2036, and approximately $24.3 million of NOL will be carried forward indefinitely. The NOL carryforwards may become subject to an annual limitation in the event of certain cumulative changes in the ownership interest. This could limit the amount of tax attributes that can be utilized annually to offset future taxable income or tax liabilities. The Company is planning to complete a study during 2021 to determine whether the net operating losses are subject to such limitations. Subsequent ownership changes may further affect the limitation in future years.
The Company determines its uncertain tax positions based on a determination of whether and how much of a tax benefit taken by the Company in its tax filings or positions is more likely than not to be sustained upon examination by the relevant income tax authorities.
As of December 31, 2020, the Company had the following uncertain tax positions:
(In thousands) | 2020 | 2019 | ||||||
Balance at January 1 | $ | 0 | $ | 0 | ||||
Increase related to prior year tax positions | 36 | 0 | ||||||
Increase related to current year tax positions | 60 | 0 | ||||||
Balance at December 31 | $ | 96 | $ | 0 | ||||
The Company is generally subject to examination by U.S. federal and local income tax authorities for all tax years in which loss carryforward is available.
8. | Warrants |
In March 2014, pursuant to a to a registered public offering and note conversion agreement with certain note holders, the Company issued warrants to purchase 6,910,283 shares of common stock at $4.75 per share. The warrants expired on March 20, 2021.
In May 2016, in connection with our WAVI credit facility, the Company issued a warrant to purchase 550,000 shares of common stock at $1.75 per share. The warrant was immediately exercisable and expires in May 2021.
On May 14, 2020, the Company entered into separate warrant exercise agreements with WAVI Holding AG and Taurus4757 GmbH pursuant to which the warrant holders immediately exercised their respective warrants via a “cashless” exercise as agreed to by the Company. As a result of the cashless exercise, the Company issued an aggregate of 2,747,970 shares of Company common stock upon cashless exercise of an aggregate of 3,871,405 warrants.
Additionally, during the year ended December 31, 2020, 8,500 warrants were exercised with a weighted average exercise price of $4.75, yielding proceeds of $40,000.
The following table summarizes warrant activity for the years ended December 31,2020 and 2019:
Year Ended December 31, 2020 | Year Ended December 31, 2019 | |||||||||||||||
Shares | Wtd. Avg. Exercise Price | Shares | Wtd. Avg. Exercise Price | |||||||||||||
Outstanding at beginning of year | 3,959,005 | $ | 4.33 | 4,080,005 | $ | 4.35 | ||||||||||
Exercised | (3,879,905 | ) | 4.33 | (121,000 | ) | 4.75 | ||||||||||
Outstanding and exercisable at end of year | 79,100 | $ | 4.75 | 3,959,005 | $ | 4.33 | ||||||||||
9. | Stock-Based Compensation |
Stock Compensation Plans
Our stock-based compensation programs are long-term retention programs that are intended to attract, retain and provide incentives for talented employees, officers and directors, and to align stockholder and employee interests. We have the following stock-based compensation plans and programs:
During 2013, we adopted the 2013 Performance Incentive Plan (the “2013 Plan”), which allows us to grant options or restricted stock units to all employees, including executive officers, outside consultants and non-employee directors. An aggregate of 3.1 million shares of common stock were initially reserved for issuance under the 2013 Plan. In May 2017, the shareholders approved an increase in the number of shares available for issuance to 4.1 million shares. In July 2020, the shareholders approved an increase in the number of shares available for issuance to 5.0 million shares. As of December 31, 2020, there were outstanding options to purchase 1.4 million shares of Company common stock and 1.2 million unvested restricted stock awards outstanding under the 2013 Plan.
The Company also issued, outside any approved compensation plans, non-incentive stock options. As of December 31, 2020, there were 123,000 such options outstanding which were fully vested prior to 2019.
Issuance of Shares
When options and warrants are exercised, it is the Company’s policy to issue new shares.
Stock Option Activity
Service Vesting-Based Stock Options
The following is a summary of service vesting-based stock option activity for 2020 and 2019, and the status of service vesting-based stock options outstanding at December 31,2020 and 2019:
Year Ended December 31, 2020 | Year Ended December 31, 2019 | |||||||||||||||
Shares | Wtd. Avg. Exercise Price | Shares | Wtd. Avg. Exercise Price | |||||||||||||
Outstanding at beginning of year | 1,570,455 | $ | 1.96 | 2,043,402 | $ | 1.91 | ||||||||||
Granted | 0 | 0 | 0 | 0 | ||||||||||||
Exercised | (726,000 | ) | 1.91 | (469,510 | ) | 1.72 | ||||||||||
Forfeited | 0 | 0 | (3,437 | ) | 5.69 | |||||||||||
Outstanding at end of year | 844,455 | $ | 2.00 | 1,570,455 | $ | 1.96 | ||||||||||
Stock options exercisable at year end | 832,478 | $ | 1.98 | 1,465,599 | $ | 1.94 | ||||||||||
We recognized stock compensation expense related to service-based options of $119,000 and $370,000 during the years ended December 31, 2020 and 2019. As of December 31, 2020, there was $32.0 million of aggregate intrinsic value of outstanding service vesting-based stock options, including $31.6 million of aggregate intrinsic value of exercisable service vesting-based stock options. Intrinsic value is the total pretax intrinsic value for all “in-the-money” options (i.e., the difference between the Company’s closing stock price on the last trading day of the year and the exercise price, multiplied by the number of shares) that would have been received by the option holders had all option holders exercised their options on December 31, 2020. This amount will change based on the fair market value of the Company’s stock. Intrinsic value of service vesting-based awards exercised during the years ended December 31, 2020 and 2019 was $13.1 million and $7.1 million, respectively. There were 0 service based-vesting options granted during the years ended December 31, 2020 and 2019. The weighted average remaining contractual life of service vesting-based options outstanding and exercisable at December 31, 2020 and 2019 is 3.7 years and 5.0 years, respectively. Total unrecognized compensation cost of service vesting-based stock options at December 31, 2020 of $29,000 is expected to be recognized over a weighted average period of 0.8 years.
The following table summarizes information about service vesting-based stock options outstanding at December 31,2020:
Range of Exercise Prices | Number Outstanding at December 31, 2020 | Weighted Average Remaining Contractual Life | Weighted Average Exercise Price | |||||||||||||
| $0.49 | - | 1.00 | 3,571 | 0.91 | $ | 0.49 | ||||||||||
| $1.01 | - | 1.50 | 110,449 | 0.78 | 1.19 | |||||||||||
| $1.51 | - | 2.50 | 676,367 | 4.07 | 1.95 | |||||||||||
| $2.51 | - | 8.60 | 54,068 | 4.64 | 4.49 | |||||||||||
| 844,455 | 3.66 | $ | 2.00 | |||||||||||||
Performance-based Stock Options
The Company’s Board of Directors implemented a Management Performance Bonus Plan for 2017. Based on achieving varying levels of specified revenue for the year ending December 31, 2017, up to 1,000,000 options to purchase shares of the Company’s common stock may be vested. The options have an exercise price of $1.64, and vested if revenue levels for 2017 were met. If the minimum performance targets are not achieved, no options will vest. On February 27, 2018, the Company’s Board of Directors determined that the specified revenue target had been achieved. Accordingly, 999,997 options to purchase shares of the Company’s common stock vested in 2017 and 2018.
The following is a summary of performance-based stock option activity under our stock option plans for 2020 and 2019, and the status of performance-based stock options outstanding at December 31, 2020 and 2019:
Year Ended December 31, 2020 | Year Ended December 31, 2019 | |||||||||||||||
Shares | Wtd. Avg. Exercise Price | Shares | Wtd. Avg. Exercise Price | |||||||||||||
Outstanding at beginning of year | 737,497 | $ | 1.64 | 964,997 | $ | 1.64 | ||||||||||
Granted | 0 | 0 | 0 | 0 | ||||||||||||
Exercised | (51,496 | ) | 1.64 | (227,500 | ) | 1.64 | ||||||||||
Outstanding at end of year | 686,001 | $ | 1.64 | 737,497 | $ | 1.64 | ||||||||||
Stock options exercisable at year end | 686,001 | 1.64 | 737,497 | 1.64 | ||||||||||||
NaN stock compensation expense was recognized during the years ended December 31, 2020 and 2019 related to performance-based options. As of December 31, 2020, there was $26.2 million of aggregate intrinsic value outstanding and exercisable performance-based stock options. Intrinsic value is the total pretax intrinsic value for all “in-the-money” options (i.e., the difference between the Company’s closing stock price on the last trading day of the quarter and the exercise price, multiplied by the number of shares) that would have been received by the option holders had all option holders exercised their options on December 31, 2020. This amount will change based on the fair market value of the Company’s stock. Intrinsic value of performance-based awards exercised during the years ending December 31, 2020 and 2019 was $1.3 million and $3.7 million, respectively. The weighted average remaining contractual life of performance-based options outstanding and exercisable at December 31, 2020, is 1 year.
There were 0 stock options granted to employees and non-employee directors in the year ending December 31, 2020 and 2019.
Restricted Stock
Service vesting-based restricted stock
The following is a summary of service vesting-based restricted stock activity for the year ended December 31, 2020 and 2019, and the status of unvested service vesting-based restricted stock outstanding at December 31, 2020 and 2019:
Year Ended December 31, 2020 | Year Ended December 31, 2019 | |||||||||||||||
Shares | Wtd. Avg. Grant Date Fair Value | Shares | Wtd. Avg. Grant Date Fair Value | |||||||||||||
Outstanding at beginning of year | 429,399 | $ | 13.25 | 279,919 | $ | 5.00 | ||||||||||
Granted | 717,267 | 20.88 | 309,218 | 17.15 | ||||||||||||
Granted in lieu of cash | 34,154 | 9.18 | 0 | 0 | ||||||||||||
Vested | (208,858 | ) | 11.32 | (125,818 | ) | 4.57 | ||||||||||
Forfeited | (41,108 | ) | 15.47 | (33,920 | ) | 12.88 | ||||||||||
Non-vested at end of year | 930,854 | $ | 19.31 | 429,399 | $ | 13.25 | ||||||||||
The aggregate fair value of the service vesting-based awards granted during the years ended December 31, 2020 and 2019 was $15.3 million and $5.3 million, respectively, which represents the market value of BioLife common stock on the date that the restricted stock awards were granted. The aggregate fair value of the service vesting-based awards that vested during the years ended December 31, 2020 and 2019 was $4.5 million and $1.9 million, respectively.
On March 25, 2020, our board of directors granted 34,154 restricted stock awards, based on a fair value on the grant date of $9.18 per share, in lieu of the 2019 cash performance bonus for our executive compensation plan. The award vested in full on September 25, 2020 regardless of employment status on that date. All expenses related to these awards were incurred in the year ended December 31, 2019.
We recognized stock compensation expense of $3.0 million and $1.2 million related to service vesting-based awards during the years ended December 31, 2020 and 2019, respectively. As of December 31, 2020, there was $16.3 million in unrecognized compensation costs related to service vesting-based awards. We expect to recognize those costs over 3.3 years.
Performance-based restricted stock
On March 25, 2020, the Company granted 82,805 shares of performance-based stock to its executives in the form of restricted stock. The shares granted contain a performance condition based on several Company metrics related to 2020 performance. The performance-based restricted stock awards will vest as to between 0% and 125% of the number of restricted shares granted to each recipient. The grant date fair value of this award was $9.18 per share. The fair value of this award will be expensed on a straight-line basis over the requisite service period ending on December 31, 2020.
The following is a summary of performance-based restricted stock activity for the year ended December 31, 2020 (there was no activity in 2019):
Year Ended December 31, 2020 | ||||||||
Shares | Wtd. Avg. Grant Date Fair Value | |||||||
Outstanding at beginning of year | 0 | $ | 0 | |||||
Granted | 82,805 | 9.18 | ||||||
Vested | (82,805 | ) | 9.18 | |||||
Non-vested at end of year | 0 | $ | 0 | |||||
We recognized stock compensation expense of $760,000 related to performance-based restricted stock awards for the year ended December 31, 2020. As of December 31, 2020, there were no unrecognized non-cash compensation costs related to performance-based restricted stock awards. Non-cash compensation costs were expensed over the period for which performance was measured.
Market-based restricted stock
On February 25, 2019 the Company granted 94,247 shares and on April 1, 2019 granted 29,604 shares of market-based stock to its executives in the form of restricted stock. The shares granted contain a market condition based on Total Shareholder Return (“TSR”). The TSR market condition measures the Company’s performance against a peer group. On February 8, 2021, the Company determined the TSR attainment was 200% of the targeted shares and 231,268 shares were vested and granted to current employees of the Company based on our total shareholder return during the period beginning on January 1, 2019 through December 31, 2020 as compared to the total shareholder return of 20 of our peers. The fair value of this award was determined at the grant date using a Monte Carlo simulation with the following assumptions: a historical volatility of 69%, 0% dividend yield and a risk-free interest rate of 2.5%. The historical volatility was based on the most recent 2-year period for the Company and correlated with the components of the peer group. The stock price projection for the Company and the components of the peer group assumes a 0% dividend yield. This is mathematically equivalent to reinvesting dividends in the issuing entity over the performance period. The risk-free interest is based on the yield on the U.S. Treasury Strips as of the Measurement Date with a maturity consistent with the 2-year term associated with the market condition of the award. The fair value of this award of $3.1 million was expensed on a straight-line basis over the grant date to the vesting date of December 31, 2020.
On March 25, 2020, the Company granted 109,140 shares of market-based stock to its executives in the form of restricted stock. The shares granted contain a market condition based on TSR. The TSR market condition measures the Company’s performance against a peer group. The market-based restricted stock awards will vest as to between 0% and 200% of the number of restricted shares granted to each recipient based on our total shareholder return during the period beginning on January 1, 2020 through December 31, 2021 as compared to the total shareholder return of 20 of our peers. The fair value of this award was determined at the grant date using a Monte Carlo simulation with the following assumptions: a historical volatility of 78%, 0% dividend yield and a risk-free interest rate of 0.3%. The historical volatility was based on the most recent 2-year period for the Company and correlated with the components of the peer group. The stock price projection for the Company and the components of the peer group assumes a 0% dividend yield. This is mathematically equivalent to reinvesting dividends in the issuing entity over the performance period. The risk-free interest is based on the yield on the U.S. Treasury Strips as of the Measurement Date with a maturity consistent with the 2-year term associated with the market condition of the award. The fair value of this award of $1.2 million will be expensed on a straight-line basis over the grant date to the vesting date of December 31, 2021.
We recognized stock compensation expense of $2.1 million and $1.5 million related to market-based restricted stock awards for the years ended December 31, 2020 and 2019. As of December 31, 2020, there was $674,000 in unrecognized non-cash compensation costs related to market-based restricted stock awards expected to vest. We expect to recognize those costs over 1 year.
Total Stock Compensation Expense
We recorded total stock compensation expense for the years ended December 31, 2020 and 2019, as follows:
Year Ended December 31, | ||||||||
(In thousands) | 2020 | 2019 | ||||||
Research and development costs | $ | 1,012 | $ | 571 | ||||
Sales and marketing costs | 852 | 711 | ||||||
General and administrative costs | 3,518 | 1,584 | ||||||
Cost of revenue | 599 | 177 | ||||||
Total | $ | 5,981 | $ | 3,043 | ||||
10. | Commitments and Contingencies |
Employment agreements
We have employment agreements with our Chief Executive Officer, Chief Financial and Operating Officer, Chief Science Officer, Chief Quality Officer, Chief Marketing Officer, Chief Revenue Officer, Vice President - Freezer Technologies, Vice President of Sales – Thaw Technologies, Vice President of Product Development – Thaw Technologies, and General Manager – Biostorage. None of these employment agreements is for a definitive period, but rather each will continue indefinitely until terminated in accordance with its terms. The agreements provide for a base annual salary, payable in monthly (or shorter) installments. In addition, the agreement with the Chief Executive Officer provides for incentive bonuses at the discretion of the Board of Directors. Under certain conditions and for certain of these officers, we may be required to pay additional amounts upon terminating the officer or upon the officer resigning for good reason.
Litigation
From time to time, the Company is subject to various legal proceedings that arise in the ordinary course of business, none of which are currently material to the Company’s business. The Company’s industry is characterized by frequent claims and litigation, including claims regarding intellectual property. As a result, the Company may be subject to various legal proceedings from time to time. The results of any future litigation cannot be predicted with certainty, and regardless of the outcome, litigation can have an adverse impact on the Company because of defense and settlement costs, diversion of management resources and other factors. Management is not aware of any pending or threatened litigation.
Indemnification
As permitted under Delaware law and in accordance with the Company’s bylaws, the Company is required to indemnify its officers and directors for certain errors and occurrences while the officer or director is or was serving in such capacity. The Company is also party to indemnification agreements with its directors. The Company believes the fair value of the indemnification rights and agreements is minimal. Accordingly, the Company has not recorded any liabilities for these indemnification rights and agreements as of December 31, 2020.
11. | Acquisitions |
Astero Acquisition
On April 1, 2019, BioLife completed the acquisition of all the outstanding shares of Astero. Astero’s ThawSTAR product line is comprised of a family of automated thawing devices for frozen cell and gene therapies packaged in cryovials and cryobags. The products improve the quality of administration of high-value, temperature-sensitive biologic therapies to patients by standardizing the thawing process and reducing the risks of contamination and overheating, which are inherent with the use of traditional water baths.
In connection with the acquisition, the Company paid (i) a base payment in the amount of $12.5 million consisting of an initial cash payment of $8.0 million at the closing of the transactions, subject to adjustment for working capital, net debt and transaction expenses, and a deferred cash payment that was paid into escrow and subsequently paid to Astero of $4.5 million which was payable upon the earlier of Astero meeting certain product development milestones or one year after the date of the Closing and (ii) earnout payments in calendar years 2019,2020 and 2021 of up to an aggregate of $3.5 million, which shall be payable upon Astero achieving certain specified revenue targets in each year and a separate earnout payment of $5.0 million for calendar year 2021, which shall be payable upon Astero achieving a cumulative revenue target over the three-year period from 2019 to 2021. In the second quarter of 2020 we paid $483,000 for the earnout related to 2019 revenues. We do not expect to pay any earnout in 2021 related to 2020 revenues.
Consideration transferred
The Astero acquisition was accounted for as a purchase of a business under FASB ASC Topic 805, “Business Combinations”. The Astero acquisition was funded through payment of approximately $12.5 million in cash and under the terms of the share purchase agreement, Astero shareholders are eligible to receive up to an additional $8.5 million of contingent consideration in cash over the next three years based on attainment of specific revenue targets. Under the acquisition method of accounting, the assets acquired and liabilities assumed from Astero were recorded as of the acquisition date, at their respective fair values, and consolidated with those of BioLife. The fair value of the contingent consideration of $1.5 million was determined using an option pricing model. The fair value of the net tangible assets acquired is estimated to be approximately $324,000, the fair value of the intangible assets acquired is estimated to be approximately $4.1 million, and the residual goodwill is estimated to be approximately $9.5 million. The fair value estimates required critical estimates, including, but not limited to, future expected cash flows, revenue and expense projections, discount rates, revenue volatility, and royalty rates. BioLife believes these estimates to be reasonable. Actual results may differ from these estimates.
Total consideration recorded for the acquisition of Astero is as follows (amounts in thousands):
Cash consideration | $ | 12,521 | ||
Contingent consideration | 1,491 | |||
Working capital adjustment | (71 | ) | ||
Total consideration transferred | $ | 13,941 |
Fair Value of Net Assets Acquired
The table below represents the purchase price allocation to the net assets acquired based on their estimated fair values (amounts in thousands). Such amounts were estimated using the most recent financial statements from Astero as of March 31, 2019.
Cash and cash equivalents | $ | 11 | ||
Accounts receivable, net | 154 | |||
Inventory | 456 | |||
Customer relationships | 160 | |||
Tradenames | 470 | |||
Developed technology | 2,840 | |||
In-process research and development | 650 | |||
Goodwill | 9,515 | |||
Other assets | 99 | |||
Accounts Payable | (250 | ) | ||
Other liabilities | (164 | ) | ||
Fair value of net assets acquired | $ | 13,941 |
The fair value of Astero’s identifiable intangible assets and estimated useful lives have been estimated as follows (amounts in thousands except years):
Estimated Fair Value | Estimated Useful Life (Years) | |||||||||
Customer relationships | $ | 160 | 4 | |||||||
Tradenames | 470 | 9 | ||||||||
Developed technology | 2,840 | 5 | - | 9 | ||||||
In-process research and development | 650 | N/A | ||||||||
Total identifiable intangible assets | $ | 4,120 | ||||||||
Fair value measurement methodologies used to calculate the value of any asset can be broadly classified into one of three approaches, referred to as the cost, market and income approaches. In any fair value measurement analysis, all three approaches must be considered, and the approach or approaches deemed most relevant will then be selected for use in the fair value measurement of that asset. The fair value of identifiable intangible assets was determined by third-party appraisal primarily using variations of the income approach, which is based on the present value of the future after-tax cash flows attributable to each identifiable intangible asset. The fair value of inventories was determined using both the cost approach and the market approach.
Some of the more significant assumptions inherent in the development of intangible asset fair values, from the perspective of a market participant, include, but are not limited to (i) the amount and timing of projected future cash flows (including revenue and expenses), (ii) the discount rate selected to measure the risks inherent in the future cash flows, (iii) the assessment of the asset’s life cycle, and (iv) the competitive trends impacting the asset. Some of the more significant assumptions inherent in valuing the contingent consideration, include, but are not limited to (i) the amount and timing of projected future revenue, (ii) the volatility rate selected to measure the risks inherent in the revenue, and (iii) risk free interest rate.
Acquired Goodwill
The goodwill of $9.5 million represents future economic benefits expected to arise from synergies from combining operations and commercial organizations to increase market presence and the extension of existing customer relationships. All but $1.1 million of the goodwill recorded is not expected to be deductible for income tax purposes.
SAVSU Acquisition
On August 8, 2019, we closed the acquisition of SAVSU pursuant to a Share Exchange Agreement. Pursuant to the Share Exchange Agreement, SAVSU Origin, LLC agreed to transfer to us and we agreed to acquire from the seller 8,616 shares of common stock of SAVSU, representing the remaining 56% of the outstanding shares of SAVSU that we did not previously own, in exchange for 1,100,000 shares of BioLife common stock. As a result of the acquisition, SAVSU became a wholly-owned subsidiary on August 8, 2019, the acquisition date.
Consideration transferred
The SAVSU acquisition was accounted for as a purchase of a business under FASB ASC Topic 805, “Business Combinations”. The acquisition of 56% of SAVSU was funded through a transfer of 1,100,000 shares of BioLife common stock, which had a fair value of $18.12 per share or $19.9 million at time of closing. The total value of 100% of SAVSU consisting of the fair value of the stock issued and the fair value of our existing investment in SAVSU was $35.8 million at time of closing. Prior to the acquisition, we accounted for our investment of SAVSU using the equity method of accounting which resulted in a recorded book value of $5.8 million at the acquisition date. We remeasured to fair value the equity interest in SAVSU held immediately before the business combination. The fair value of our equity interest was determined to be $15.9 million on our existing 44% ownership based on the fair value of shares transferred at the time of acquisition for the 56% we did not previously own. As a result, we recorded a non-operating gain of $10.1 million.
Under the acquisition method of accounting, the assets acquired and liabilities assumed from SAVSU were recorded as of the acquisition date, at their respective fair values, and consolidated with those of BioLife. The fair value of the net tangible assets acquired is estimated to be approximately $4.2 million, the fair value of the intangible assets acquired is estimated to be approximately $12.2 million, and the residual goodwill is estimated to be approximately $19.5 million. The fair value estimates required critical estimates, including, but not limited to, future expected cash flows, revenue and expense projections, discount rates, revenue volatility, and royalty rates. BioLife believes these estimates to be reasonable. Actual results may differ from these estimates.
Total consideration paid for the acquisition of SAVSU is as follows (amounts in thousands):
Stock consideration for 55.6% equity interest purchased | $ | 19,932 |
This stock consideration plus the fair value of our existing equity investment in SAVSU of $15.9 million results in the total purchase price for accounting purposes of $35.8 million.
Fair Value of Net Assets Acquired
The table below represents the purchase price allocation to the net assets acquired based on their estimated fair values (amounts in thousands). Such amounts were estimated using the most recent financial statements from SAVSU as of August 7, 2019.
Cash and cash equivalents | $ | 1,251 | ||
Accounts receivable, net | 753 | |||
Prepaid expenses and other current assets | 19 | |||
Property, plant and equipment, net | 546 | |||
Operating right-of-use asset | 233 | |||
Assets held for lease | 2,441 | |||
Customer relationships | 80 | |||
Tradenames | 1,320 | |||
Developed technology | 10,750 | |||
Goodwill | 21,037 | |||
Accounts Payable and accrued expenses | (807 | ) | ||
Deferred tax liabilities | (1,541 | ) | ||
Other liabilities | (232 | ) | ||
Fair value of net assets acquired | $ | 35,850 |
The fair value of SAVSU’s identifiable intangible assets and estimated useful lives have been estimated as follows (amounts in thousands except years):
Estimated Fair Value | Estimated Useful Life (Years) | |||||||||
Customer relationships | $ | 80 | 6 | |||||||
Tradenames | 1,320 | 9 | ||||||||
Developed technology | 10,750 | 7 | - | 8 | ||||||
Total identifiable intangible assets | $ | 12,150 | ||||||||
Fair value measurement methodologies used to calculate the value of any asset can be broadly classified into one of three approaches, referred to as the cost, market and income approaches. In any fair value measurement analysis, all three approaches must be considered, and the approach or approaches deemed most relevant will then be selected for use in the fair value measurement of that asset. The fair value of identifiable intangible assets was determined primarily using variations of the income approach, which is based on the present value of the future after-tax cash flows attributable to each identifiable intangible asset. The fair value of assets held for rent and property, plant and equipment was determined using both the cost approach and the market approach.
Some of the more significant assumptions inherent in the development of intangible asset fair values, from the perspective of a market participant, include, but are not limited to (i) the amount and timing of projected future cash flows (including revenue and expenses), (ii) the discount rate selected to measure the risks inherent in the future cash flows, (iii) the assessment of the asset’s life cycle, and (iv) the competitive trends impacting the asset. Some of the more significant assumptions inherent in the in valuing the contingent consideration, include, but are not limited to (i) the amount and timing of projected future revenue, (ii) the volatility rate selected to measure the risks inherent in the revenue, and (iii) risk free interest rate.
Acquired Goodwill
The goodwill of $21.0 million represents future economic benefits expected to arise from synergies from combining operations and commercial organizations to increase market presence and the extension of existing customer relationships. None of the goodwill recorded is expected to be deductible for income tax purposes.
Custom Biogenic Systems Acquisition
On November 10, 2019, we entered into an Asset Purchase Agreement, by and among the Company, Arctic Solutions, Inc., a Delaware corporation and wholly-owned subsidiary of the Company, and CBS, a Michigan corporation, pursuant to which we agreed to purchase from CBS substantially all of CBS’s assets, properties and rights (the “CBS Acquisition”). CBS, a privately held company with operations located near Detroit, Michigan, designs and manufactures liquid nitrogen laboratory freezers and cryogenic equipment and also offers a related cloud-based monitoring system that continuously assesses biologic sample storage conditions and alerts equipment owners if a fault condition occurs. The CBS Acquisition closed on November 12, 2019.
In connection with the CBS Acquisition, we paid to CBS (i) a base payment in the amount of $15.0 million, consisting of a cash payment of $11.0 million paid at the closing of the CBS Acquisition, less a cash holdback escrow of $550,000 to satisfy certain indemnification claims, and an aggregate number of shares of our common stock, with an aggregate fair value equal to $4.0 million, less a holdback escrow of shares of Common Stock with an aggregate value equal to $3.0 million to satisfy potential payments related to any product liability claims outstanding as of March 13, 2019, and (ii) potential earnout payments in calendar years 2020,2021,2022,2023 and 2024 of up to an aggregate of, but not exceeding, $15.0 million payable to the sole shareholder of CBS upon achieving certain specified revenue targets in each year for certain product lines. We do not expect to pay any earnout in 2021 related to 2020 revenues.
The CBS Acquisition was accounted for as a purchase of a business under FASB ASC Topic 805, “Business Combinations”. Under the acquisition method of accounting, the acquired assets and liabilities assumed from CBS were recorded as of the acquisition date, at their fair values, and consolidated with BioLife. The fair value of the net tangible assets acquired is $6.0 million, the fair value of the identifiable intangibles is $6.8 million, and the residual goodwill is $3.1 million. The fair value estimates required critical estimates, including, but not limited to, future expected cash flows, revenue and expense projections, discount rates, revenue volatility, and royalty rates. BioLife believes these estimates to be reasonable.
Total consideration transferred (in thousands):
Cash consideration | $ | 11,000 | ||
Stock consideration | 4,000 | |||
Contingent consideration | 856 | |||
Total consideration transferred | $ | 15,856 |
Fair Value of Net Assets Acquired
The table below represents the purchase price allocation to the net assets acquired based on their fair values (amounts in thousands). Such amounts were estimated using the most recent financial statements from CBS as of November 11, 2019.
Accounts receivable, net | $ | 1,044 | ||
Inventory | 3,232 | |||
Prepaid expenses and other current assets | 29 | |||
Property, plant and equipment, net | 3,615 | |||
Customer relationships | 560 | |||
Tradenames | 800 | |||
Developed technology | 5,430 | |||
Goodwill | 2,954 | |||
Accounts Payable | (1,197 | ) | ||
Other liabilities | (611 | ) | ||
Fair value of net assets acquired | $ | 15,856 |
The fair value of CBS’s identifiable intangible assets and weighted average useful lives have been estimated as follows (amounts in thousands except years):
Estimated Fair Value | Estimated Useful Life (Years) | |||||||
Customer relationships | $ | 560 | 6 | |||||
Tradenames | 800 | 6 | ||||||
Developed technology | 5,430 | 9 | ||||||
Total identifiable intangible assets | $ | 6,790 | ||||||
Fair value measurement methodologies used to calculate the value of any asset can be broadly classified into one of three approaches, referred to as the cost, market and income approaches. In any fair value measurement analysis, all three approaches must be considered, and the approach or approaches deemed most relevant will then be selected for use in the fair value measurement of that asset. The fair value of identifiable intangible assets was determined primarily using variations of the income approach, which is based on the present value of the future after-tax cash flows attributable to each identifiable intangible asset. The fair value of inventories was determined using both the cost approach and the market approach and the fair value of property, plant and equipment was determined using the cost and market approach.
Some of the more significant assumptions inherent in the development of intangible asset fair values, from the perspective of a market participant, include, but are not limited to (i) the amount and timing of projected future cash flows (including revenue and expenses), (ii) the discount rate selected to measure the risks inherent in the future cash flows, (iii) the assessment of the asset’s life cycle, and (iv) the competitive trends impacting the asset. Some of the more significant assumptions inherent in valuing the contingent consideration, include, but are not limited to (i) the amount and timing of projected future revenue, (ii) the volatility rate selected to measure the risks inherent in the revenue, and (iii) risk free interest rate.
Acquired Goodwill
The goodwill of $3.0 million represents future economic benefits expected to arise from synergies from combining operations and commercial organizations to increase market presence and the extension of existing customer relationships. All of the goodwill recorded is expected to be deductible for income tax purposes.
Revenue, Net Income and Pro Forma Presentation for all 2019 Acquisitions
The Company recorded revenue from Astero of $1.2 million and a net loss of $1.5 million from April 1, 2019, the date of acquisition, to December 31, 2019. The Company recorded revenue from SAVSU of $692,000 and a net loss of $1.7 million from August 8, 2019, the date of acquisition, to December 31, 2019. The Company recorded revenue from CBS of $2.1 million and net income of $187,000 from November 12, 2019, the date of acquisition, to December 31, 2019. The Company has included the operating results of the acquisitions in its consolidated statements of operations since their respective acquisition date. The following pro forma financial information presents the combined results of operations of Astero, SAVSU and CBS as if the acquisition had occurred on January 1, 2019 after giving effect to certain pro forma adjustments. These pro forma adjustments include amortization expense on the acquired identifiable intangible assets, adjustments to stock-based compensation expense for equity compensation issued to employees and the income tax effect of the adjustments made. In addition, acquisition-related transaction costs and an accounting adjustment to record inventory at fair value were excluded from pro forma net income in 2019.
The following pro forma financial information does not reflect any adjustments for anticipated expense savings resulting from the acquisition and is not necessarily indicative of the operating results that would have actually occurred had the transactions been consummated on January 1, 2019 or of future results. Common stock equivalents are excluded since the effect is anti-dilutive due to the Company’s pro forma net losses. Common stock equivalents include unvested restricted stock, stock options and warrants:
Year Ended December 31, (unaudited) | ||||||||
(In thousands) | 2019 | 2018 | ||||||
Total revenue | $ | 37,728 | $ | 32,353 | ||||
Net income (loss) | (3,160 | ) | (3,397 | ) | ||||
Income (loss) per share: | ||||||||
Basic and diluted | $ | (0.16 | ) | $ | (0.20 | ) | ||
SciSafe Acquisition
On September 18, 2020, BioLife entered into a Stock Purchase Agreement, by and among the Company, SciSafe Holdings, Inc., a Delaware corporation, and the stockholders of SciSafe (collectively, the “SciSafe Sellers”) in accordance with the Stock Purchase Agreement, pursuant to which the Company agreed to purchase from the SciSafe Sellers one hundred percent (100%) of the issued and outstanding capital shares or other equity interests of SciSafe (the “SciSafe Acquisition”). The SciSafe Acquisition closed October 1, 2020.
Consideration transferred
The SciSafe Acquisition was accounted for as a purchase of a business under FASB ASC Topic 805, “Business Combinations”. At the closing of the SciSafe Acquisition, the Company agreed to issue to the SciSafe Sellers 611,683 shares of common stock valued at $29.29 per share and a cash payment of $15 million, with $1.5 million held in escrow to account for adjustments for net working capital and as a security for, and a source of payment of, the Company’s indemnity rights. Pending the occurrence of certain events, the Company will issue to the SciSafe Sellers an additional 626,000 shares of common stock, which shall be issuable to SciSafe Sellers upon SciSafe achieving certain specified revenue targets in each year from 2021 to 2024. Under the acquisition method of accounting, the assets acquired and liabilities assumed from SciSafe were recorded as of the acquisition date, at their respective fair values, and consolidated with those of BioLife. The fair value of the contingent consideration of $3.7 million was determined using an Monte Carlo simulation. The fair value of the net tangible assets acquired is approximately $2.8 million, the fair value of the deferred tax liability acquired is approximately $3.3 million, the fair value of the intangible assets acquired is approximately $12.1 million, and the residual goodwill is approximately $24.9 million. The fair value calculations required critical estimates, including, but not limited to, future expected cash flows, revenue and expense projections, discount rates, revenue volatility, and royalty rates.
Total consideration transferred (in thousands):
Cash consideration | $ | 15,000 | ||
Stock consideration | 17,916 | |||
Contingent consideration | 3,663 | |||
Working capital adjustment | (53 | ) | ||
Total consideration transferred | $ | 36,526 |
Fair Value of Net Assets Acquired
The table below represents the purchase price allocation to the net assets acquired based on their estimated fair values (amounts in thousands).
Cash | $ | 500 | ||
Accounts receivable, net | 945 | |||
Prepaid expenses and other current assets | 31 | |||
Property, plant and equipment, net | 3,400 | |||
Customer relationships | 7,420 | |||
Tradenames | 4,020 | |||
Non-compete agreements | 660 | |||
Goodwill | 24,943 | |||
Other assets | 1,547 | |||
Accounts payable | (885 | ) | ||
Deferred tax liability | (3,297 | ) | ||
Other liabilities | (2,758 | ) | ||
Fair value of net assets acquired | $ | 36,526 |
On September 30, 2020, the Company advanced SciSafe $500,000 in cash for working capital purposes. This cash and a payable due to the Company were both assumed in the transaction and are both reflected in the fair value of net assets acquired.
The fair value of SciSafe’s identifiable intangible assets and estimated useful lives have been estimated as follows (amounts in thousands except years):
Estimated Fair Value | Estimated Useful Life (Years) | |||||||
Customer relationships | $ | 7,420 | 14 | |||||
Tradenames | 4,020 | 19 | ||||||
Non-compete agreements | 660 | 4 | ||||||
Total identifiable intangible assets | $ | 12,100 | ||||||
Fair value measurement methodologies used to calculate the value of any asset can be broadly classified into one of three approaches, referred to as the cost, market and income approaches. In any fair value measurement analysis, all three approaches must be considered, and the approach or approaches deemed most relevant will then be selected for use in the fair value measurement of that asset. The estimated fair values of customer relationships were estimated using a multi-period excess earnings approach. The estimated fair value of the tradenames is based on the relief from royalty method which estimates the value of the trade names based on the hypothetical royalty payments that are saved by owning the asset. The estimated fair values of non-compete agreements were estimated using a “with and without” approach, comparing projected cash flows under scenarios assuming the non-compete agreements were and were not in place. The fair value of property, plant and equipment was determined using the “market approach”. The fair value of the milestone contingent consideration was determined using a scenario analysis valuation method which incorporates BioLife’s assumptions with respect to the likelihood of achievement of certain revenue milestones, revenue volatility, credit risk, timing of earnout share issuances and a risk-adjusted discount rate to estimate the present value of the expected earnout share issuances.
Some of the more significant assumptions inherent in the development of intangible asset fair values, from the perspective of a market participant, include, but are not limited to (i) the amount and timing of projected future cash flows (including revenue and expenses), (ii) the discount rate selected to measure the risks inherent in the future cash flows, (iii) the assessment of the asset’s life cycle, and (iv) the competitive trends impacting the asset.
Indemnification Asset
In 2020, the Company recognized a $130,000 liability for a non-income tax contingency related to the acquisition of SciSafe. At the date of acquisition, we recognized an indemnification asset at the same time and on the same basis as the recognized liability, to the extent that collection is reasonably assured, in accordance with ASC 805. When indemnified, subsequent changes in the indemnified item are offset by changes in the indemnification asset. We assess the realizability of the indemnification asset each reporting period. Changes in the principal portion of non-income tax contingencies, as well as changes in any related indemnification asset, are included in operating income. The indemnification asset is included within prepaid expenses and other current assets on the balance sheet.
Acquired Goodwill
The goodwill of $24.9 million represents future economic benefits expected to arise from synergies from combining operations and commercial organizations to increase market presence and the extension of existing customer relationships. The goodwill recorded is not expected to be deductible for income tax purposes.
Revenue, Net Income and Pro Forma Presentation
The Company recorded revenue from SciSafe of $1.8 million and a net loss of $416,000 from October 1, 2020, the date of acquisition, to December 31, 2020. The Company has included the operating results of the acquisition in its consolidated statements of operations since the acquisition date. The following pro forma financial information presents the combined results of operations of SciSafe as if the acquisition had occurred on January 1, 2019 after giving effect to certain pro forma adjustments. These pro forma adjustments include depreciation adjustments for differences in the fair value of property and equipment, amortization expense on the acquired identifiable intangible assets, adjustments to stock-based compensation expense for equity compensation issued to employees, and the income tax effect of the adjustments made. In addition, acquisition-related transaction costs were excluded from pro forma net income in 2020.
The following pro forma financial information does not reflect any adjustments for anticipated expense savings resulting from the acquisition and is not necessarily indicative of the operating results that would have actually occurred had the transactions been consummated on January 1, 2019 or of future results. Common stock equivalents are excluded since the effect is anti-dilutive due to the Company’s pro forma net income (loss). Common stock equivalents include unvested restricted stock, stock options and warrants.
Year Ended December 31, (unaudited) | ||||||||
(In thousands) | 2020 | 2019 | ||||||
Total revenue | $ | 52,613 | $ | 43,221 | ||||
Net income (loss) | 1,798 | (4,528 | ) | |||||
Income (loss) per share: | ||||||||
Basic | 0.06 | (0.23 | ) | |||||
Diluted | $ | (0.07 | ) | $ | (0.23 | ) | ||
12. | Consolidated Balance Sheet Detail |
Property and Equipment
Property and equipment consist of the following:
December 31, | ||||||||
(In thousands) | 2020 | 2019 | ||||||
Property and equipment | ||||||||
Leasehold improvements | $ | 2,393 | $ | 2,112 | ||||
Furniture and computer equipment | 902 | 794 | ||||||
Manufacturing and other equipment | 10,076 | 5,187 | ||||||
Construction in-progress | 591 | 0 | ||||||
Subtotal | 13,962 | 8,093 | ||||||
Less: Accumulated depreciation | (3,842 | ) | (2,521 | ) | ||||
Net property and equipment | $ | 10,120 | $ | 5,572 | ||||
Depreciation expense for property and equipment was $1.4 million and $544,000 for the years ended December 31, 2020 and 2019, respectively.
Accrued Expenses and Other Current Liabilities
Accrued expenses and other current liabilities consist of the following:
December 31, | ||||||||
(In thousands) | 2020 | 2019 | ||||||
Accrued expenses | $ | 472 | $ | 301 | ||||
Accrued taxes | 112 | 0 | ||||||
Accrued compensation | 2,898 | 1,554 | ||||||
Warranty reserve liability | 212 | 191 | ||||||
Deferred revenue, current | 931 | 324 | ||||||
Loans payable, current | 614 | 13 | ||||||
Other | 130 | 986 | ||||||
Total accrued expenses and other current liabilities | $ | 5,369 | $ | 3,369 | ||||
Other Long-Term Liabilities
Other long-term liabilities consist of the following:
December 31, | ||||||||
(In thousands) | 2020 | 2019 | ||||||
Loans payable, net of current | $ | 655 | $ | 0 | ||||
Deferred revenue, net of current | 71 | 0 | ||||||
Other | 0 | 4 | ||||||
Total other long-term liabilities | $ | 726 | $ | 4 | ||||
Loans Payable
Loans payable consisted of the following:
December 31, | |||||||||||||
(In thousands) | Maturity Date | Interest Rate | 2020 | 2019 | |||||||||
Paycheck Protection Program loan | May 2022 | 1.0 | % | $ | 295 | $ | 0 | ||||||
Freezer equipment loan | December 2025 | 5.7 | % | 365 | 0 | ||||||||
Manufacturing equipment loans | October 2025 | 5.7 | % | 439 | 0 | ||||||||
Freezer installation loan | Various | 6.3 | % | 156 | 0 | ||||||||
Other loans | Various | Various | 14 | 13 | |||||||||
Total | $ | 1,269 | $ | 13 | |||||||||
Equipment loans are collateralized by the financed equipment.
As of December 31, 2020, the scheduled maturities of loans payable for each of the next five years and thereafter were as follows:
(In thousands) | Amount | |||
2021 | $ | 614 | ||
2022 | 158 | |||
2023 | 167 | |||
2024 | 177 | |||
2025 | 153 | |||
Total | $ | 1,269 | ||
13. | Employee Benefit Plan |
The Company sponsors a 401(k) defined contribution plan for its employees. This plan provides for pre-tax and post-tax contributions for all employees. Employee contributions are voluntary. Employees may contribute up to 100% of their annual compensation to this plan, as limited by an annual maximum amount as determined by the Internal Revenue Service. The Company matches employee contributions in amounts to be determined at the Company’s sole discretion. The Company made contributions of $347,000 and $158,000 to the plan for the years ended December 31, 2020 and 2019.
14. | Subsequent Events |
On January 4, 2021, the Company entered into a lease agreement for approximately 16,800 square feet in the United States. The term of our lease begins on March 1, 2021 and continues until February 28, 2026. In accordance with the lease agreement, the monthly base rent is approximately $13,650 at commencement and includes provisions for rent increases of approximately 3% in March of each year.
On January 29, 2021, the Company entered into a lease agreement for approximately 26,800 square feet in the United States. The term of our lease begins on the earlier of the completion of certain work set forth in the agreement and June 1, 2021 and continues until the last day of the calendar month that occurs 10 years and 5 months after the lease begins. In accordance with the lease agreement, the monthly base rent is approximately $26,800 at commencement and includes provisions for rent increases of approximately 2.5% on the first day of the first month that follows the first anniversary of the beginning of the lease of each year and on each anniversary date thereafter.
On March 11, 2021, the President of the United States signed into law the “American Rescue Plan Act of 2021” (the American Rescue Plan), which included additional economic stimulus and tax credits, including the expansion of the Employee Retention Credit. BioLife continues to examine the impact that the American Rescue Plan will have on its financial condition, results of operations, and liquidity.
On March 19, 2021, we entered into an Agreement and Plan of Merger (the “Merger Agreement”) by and between us, BLFS Merger Subsidiary, Inc., our wholly-owned subsidiary (“Merger Sub”), and Global Cooling, Inc. (“Global Cooling”) pursuant to which Merger Sub will merge with and into Global Cooling, with Global Cooling continuing as the surviving entity and a wholly-owned subsidiary of the Company (the “GCI Merger”). The total consideration to be paid by us to the stockholders of Global Cooling at the closing will be 6,646,870 shares of our common stock (representing 19.9% of the number of our shares of common stock issued and outstanding immediately prior to the date of the execution of the Merger Agreement), a portion of which will be held in two segregated escrow accounts to serve as the sole source of payment for post-closing indemnification claims. The Merger Agreement provides for mutual indemnification, subject, in certain instances, to a basket and cap. The closing of the GCI Merger is subject to various customary closing conditions, including the approval of Global Cooling’s stockholders, and may be terminated by mutual agreement, for the other party’s uncured material breach, or if there is a government order preventing the closing, among other reasons. There is no assurance that the GCI Merger will close or that, if the GCI Merger does close, it will be successful or that Global Cooling will be, or will remain, profitable.
CHANGES IN AND DISAGREEMENTS WITH ACCOUNTANTS ON ACCOUNTING AND FINANCIAL DISCLOSURE |
None.
CONTROLS AND PROCEDURES |
(a) | Evaluation of Disclosure Controls and Procedures |
Our management, with the participation of our Chief Executive Officer and Chief Financial Officer, evaluated the effectiveness of our disclosure controls and procedures (as defined in Rules 13a-15(e) and 15d-15(e) under the Exchange Act) as of the end of the period covered by this Form 10-K. Based on that evaluation, our Chief Executive Officer and Chief Financial Officer concluded that our disclosure controls and procedures as of the end of the period covered by this Form 10-K were not effective, due to the material weakness in our internal controls over financial reporting described below.
Our management, including our Chief Executive Officer and Chief Financial Officer, does not expect that our disclosure controls and procedures or our internal controls will prevent all error and all fraud. A control system, no matter how well conceived and operated, can provide only reasonable, not absolute, assurance that the objectives of the control system are met. Further, the design of a control system must reflect the fact that there are resource constraints, and the benefits of controls must be considered relative to their costs. Because of the inherent limitations in all control systems, no evaluation of controls can provide absolute assurance that all control issues and instances of fraud, if any, within BioLife Solutions have been detected.
(b) | Management’s Annual Report on Internal Control Over Financial Reporting |
Our management is responsible for establishing and maintaining adequate internal control over financial reporting (as defined in Rule 13a-15(f) of the Exchange Act). Our management assessed the effectiveness of our internal control over financial reporting as of December 31, 2020. In making this assessment, our management used the criteria set forth by the Committee of Sponsoring Organizations of the Treadway Commission (“COSO”) in Internal Control—Integrated Framework (2013 framework). Based on our assessment under the framework in Internal Control—Integrated Framework (2013 framework), our management concluded that our internal control over financial reporting was not effective as of December 31, 2020 due to the existence of a material weakness in our internal controls described below. A material weakness in internal control is a deficiency in internal control, or combination of control deficiencies, that adversely affects the Company’s ability to initiate, authorize, record, process, or report external financial data reliably in accordance with GAAP such that there is more than a remote likelihood that a material misstatement of the Company’s annual or interim financial statements will not be prevented or detected.
As previously reported, we identified a material weakness in our internal control over financial reporting as of December 31, 2019 with regard to our controls over the accounting for financial instruments containing characteristics of both liabilities and equity. Although substantial progress has been made in remediating this material weakness, it has not been fully remediated as of December 31, 2020, and therefore this control weakness continues to constitute a material weakness. Specifically, due to insufficient technical resources, the Company’s controls were not operating effectively to allow management to timely identify errors related to the recording of certain transactions involving financial instruments as previously described.
In accordance with guidance issued by the Securities and Exchange Commission, companies are permitted to exclude acquisitions from their final assessment of internal control over financial reporting for the first fiscal year in which the acquisition occurred. Our management’s evaluation of internal control over financial reporting excluded the internal control activities of SciSafe Holdings, Inc. (“SciSafe” acquired on October 1, 2020) as discussed in Note 11, “Acquisitions,” of the Notes to the Consolidated Financial Statements. We have included the financial results of these in the consolidated financial statements from the date of acquisition. These acquired business constituted approximately 6% of our total consolidated assets (excluding goodwill and intangible assets related to the transactions, which were integrated into our systems and control environment) and 4% of the total consolidated revenue included in our consolidated financial statements as of and for the year ended December 31, 2020.
Because we are a smaller reporting company and a non-accelerated filer, our independent registered public accounting firm is not required to attest to or issue a report on the effectiveness of our internal control over financial reporting.
(c) | Changes in Internal Control Over Financial Reporting |
Other than the controls implemented to remediate the material weakness described above, there have been no changes in our internal control over financial reporting during the fiscal quarter ended December 31, 2020 that have materially affected, or are reasonably likely to materially affect, our internal control over financial reporting.
(d) | Remediation |
With respect to the material weakness described above, management has continued to test and evaluate the elements of the remediation plan implemented to date. These elements include:
● | Implementing a risk assessment process by which management identifies transactions involving financial instruments that give rise to specific risks of inappropriate accounting; |
● | Hiring of additional resources, including third-party consultants, to address complex accounting matters primarily related to the expanding scope of our business operations; and, |
● | Enhancing the design and implementation of key internal controls in response to identified risks. |
Based on management’s review and the oversight of the Audit Committee, we have determined that, although substantial progress has been made in remediating this material weakness, the weakness has not been fully remediated as of December 31, 2020.
As we continue to evaluate and test the remediation plan outlined above, we may also identify additional measures to address the material weakness or modify certain of the remediation procedures described above. We also may implement additional changes to our internal control over financial reporting as may be appropriate in the course of remediating the material weakness. Management, with the oversight of the Audit Committee, will continue to take steps necessary to remedy the material weakness to reinforce the overall design and capability of our control environment.
OTHER INFORMATION |
None.
DIRECTORS, EXECUTIVE OFFICERS, AND CORPORATE GOVERNANCE |
The following table and text set forth the names and ages of our directors and executive officers as of March 19, 2021. The Board is comprised of only one class. Also provided herein are brief descriptions of the business experience of each director and executive officer during the past five years (based on information supplied by them) and an indication of directorships held by each director in other public companies subject to the reporting requirements under the Federal securities laws. During the past ten years, none of our directors or executive officers has been involved in any legal proceedings that are material to an evaluation of the ability or integrity of such person, including any of the legal proceedings identified in Item 401(f) of Regulation S-K.
Name | Age | Position and Offices With the Company | ||
Todd Berard | 52 | Chief Marketing Officer | ||
Roderick de Greef | 60 | Chief Operating Officer and Chief Financial Officer | ||
Karen Foster | 61 | Chief Quality Officer | ||
Marcus Schulz | 43 | Chief Revenue Officer | ||
Sarah Aebersold | 45 | Vice President, Global Human Resources | ||
Aby J. Mathew, Ph.D. | 49 | Executive Vice President and Chief Scientific Officer | ||
Michael Rice | 58 | Chief Executive Officer, President, and Director | ||
Raymond W. Cohen | 61 | Chairman of the Board | ||
Andrew Hinson | 57 | Director | ||
Joseph Schick | 59 | Director |
Todd Berard has been Chief Marketing Officer since December 2019. Before his appointment as Chief Marketing Officer, Mr. Berard had served as Vice President of Marketing since February 2015 and Senior Director of Marketing since July 2014. Previous to BioLife, Mr. Berard served as Director of Marketing at Verathon Medical; a division of Roper Inc., from September 2010 until July 2014, overseeing the global marketing, product development, and product launch strategies for a portfolio of six medical device brands. He also managed all strategic partnerships for product development and helped guide the organization through several key product launches and the corporate acquisition. At Verathon, Mr. Berard oversaw a creative and product management team of 12. Responsibilities included all global marketing initiatives and campaigns, strategy, product portfolio management, and strategic planning. He has over twenty years of experience in life sciences, health care, medical devices, and technology; working for both global leaders and small technology startups, including the University of Washington School of Medicine, DuPont, and Medtronic. He has a Bachelor of Science Degree in Biochemistry from the University of Vermont and an MBA from the University of Washington Foster School of Business.
Roderick de Greef has been Chief Financial Officer since May 2016. In December 2019, Mr. de Greef was additionally appointed Chief Operating Officer. He was appointed interim Chief Financial Officer and interim Secretary in March 2016. Previously, Mr. de Greef served as a director of the Company from June 2000 through November 2013, and provided the Company with strategic and financial consulting services from July 2007 through August 2011. Since February 2019, Mr. de Greef has served as a director, chairman of the Audit Committee of the board of directors of Indonesia Energy Corporation Limited, an oil and gas exploration and production company. Mr. de Greef served Pareteum Corporation., a mobile communications company, as a director, chair of the Audit Committee and member of the Nominating and Corporate Governance Committee and Compensation Committee from September 2015 to September 2017, and also from January 2008 to October 2011. From November 2013 to October 2014, Mr. de Greef served as the president and sole director of Cambridge Cardiac Technologies, Inc. a privately held successor to Cambridge Heart, Inc. From November 2008 to October 2013, Mr. de Greef was the chairman of the board of Cambridge Heart, Inc., a manufacturer of non-invasive diagnostic cardiology products. From November 2003 to May 2013, Mr. de Greef served as a director, member of the Audit Committee and chairman of the Compensation Committee of Endologix, Inc. From 2001 to 2006, Mr. de Greef served as Executive Vice President and Chief Financial Officer of NASDAQ listed Cardiac Science, Inc., which in 2004 was ranked as the 4th fastest growing technology company in North America on Deloitte & Touche’s Fast 500 listing. Mr. de Greef received his MBA degree from the University of Oregon, and a B.A in Economics and International Relations from San Francisco State University. Mr. de Greef has extensive experience in corporate finance and the business world in general as well as serving as an officer and director of public companies.
Karen Foster has been Chief Quality Officer since December 2019. Before her appointment as Chief Quality Officer, Ms. Foster had served as Vice President, Operations since April 2016. From 2003 to early 2016, Ms. Foster was Vice President of Laboratory Operations and Site Leader at ViaCord, LLC, a family cord blood bank, and subsidiary of PerkinElmer Inc. Over a 25-year career, Ms. Foster has managed manufacturing and quality operations in several capacities for companies including ViaCord, Pfizer, Inc. (formerly Pharmacia Corporation) and Amersham Pharmacia Biotech, Inc. (formerly Phamacia Biotech, Inc.). She holds an MBA from the University of Wisconsin-Milwaukee (specialization in Operations Management), an M.S. in Zoology from University of Wisconsin-Milwaukee (specialization in Microbiology) and a B.S. in Biological Sciences from Michigan Technological University.
Marcus Schulz has been Chief Revenue Officer since February 2021. Before his appointment as Chief Revenue Officer, Mr. Schulz has served as the Vice President, Global Sales, since July 2020. Mr. Schulz joined the Company in August 2019 as Vice President of Sales, evo® Platform. In that role, Mr. Schulz supported the Company’s partnerships with specialty couriers that market the evo cold chain management platform to the regenerative medicine market. Prior to joining the Company, Mr. Schulz served in a variety of strategic business development and executive sales leadership roles with companies including Siemens Healthcare (2000-2009, most recently as Director, Strategic National Accounts), Johnson & Johnson (2010-2012, most recently as Sales Director), Aramark Healthcare Technologies (2012-2013, most recently as Director of Business Development), Abbott Laboratories (2013-2015, most recently as Executive Director, Healthcare Improvement), Belimed, AG (2015-2016, most recently as Executive Director, Strategic Solutions Group) and most recently, GE Healthcare (2016-2019, most recently as General Manager, National Accounts), where he managed a $1 billion annual revenue strategic account.
Sarah Aebersold has been Vice President, Global Human Resources since January 2021. Before her appointment as Vice President, Global Human Resources, Ms. Aebersold has served as the Senior Director, Global Human Resources & Administration since February 2020. In that role, Ms. Aebersold oversaw human resources programs in the areas of employee relations, talent acquisition, benefits, compensation, coaching, training and development, policy, and data management. Prior to joining the Company, Ms. Aebersold served in a variety of human resources roles with companies including MCG Health, a healthcare solutions provider (2016-2020, most recently as Head of Human Resources and Administration), Spacelabs Healthcare, a manufacturer of medical equipment (2014-2016, 2012-2013, most recently as Senior Manager, Human Resources), T-Mobile, a mobile communication company, (2013-2013, most recently as Human Resource Manager), Seattle Children’s Hospital, a children’s hospital (2009-2012, most recently as Manager, Human Resources Consulting), and ZymoGenetics, Inc., a biotechnology/pharmaceutical company (2004-2009, most recently as Human Resources Manager).
Aby J. Mathew, Ph.D. has been Executive Vice President and Chief Scientific Officer since December 2019. Before his appointment as Executive Vice President and Chief Scientific Officer, Dr. Mathew had served as Chief Technical Officer. Dr. Mathew was part of the founding team of BioLife Solutions, Inc., and has been employed by BioLife since 2000. Dr. Mathew is a co-developer of BioLife’s biopreservation media solutions and co-inventor on issued and pending patents related to methods, devices, and formulations for the preservation of cells, tissues, and organs. He holds a Ph.D. in Biological Sciences from Binghamton University and a B.S. in Microbiology from Cornell University. Dr. Mathew has been researching low temperature biopreservation since 1994, and his studies contributed to the development of BioLife’s current commercial HypoThermosol® and CryoStor® product platforms and intellectual property foundation. Dr. Mathew is currently active in, or previously a member of, AABB (formerly the American Association of Blood Banks), BEST (the Biomedical Excellence for Safer Transfusion collaborative), the International Society for Cell Therapy (ISCT), the Alliance for Regenerative Medicine (ARM), Tissue Engineering & Regenerative Medicine International Society (TERMIS), Society for Cryobiology, International Society for Biological and Environmental Repositories (ISBER), American Society for Cell Biology, and the Society for In Vitro Biology. Dr. Mathew is a member of, the Board of Directors, and Advisory Panel, of the Parent’s Guide to Cord Blood Foundation, the Scientific Advisory Board of HemaCare Corporation, the founding Board of Directors of the Cord Blood Association, the NIST-AMTech National Cell Manufacturing Consortium, the California Institute for Regenerative Medicine (CIRM) Clinical Advisory Panel, the Business Advisory Board of RoosterBio Inc., and the Scientific Advisory Board of SAVSU Technologies. Dr. Mathew has obtained UCLA Corporate Governance Program Certification.
Michael Rice has been President and Chief Executive Officer and a director of the Company since August 2006, and was chairman of the Board from August 2007 to November 2013. Mr. Rice has more than 30 years of leadership and entrepreneurial experience in the medical and high-tech industries. He was most recently the senior business development manager for medical and wireless products at AMI Semiconductor, from October 2004 to August 2006. From October 2000 to August 2006, Mr. Rice also served as the director of marketing and business development at Cardiac Science, Inc., a manufacturer of automated external defibrillators. Prior to that, from May 1998 to October 2000, he was the Vice President, Sales and Marketing for TEGRIS Corporation, a privately held network services provider. Mr. Rice also spent 12 years, from May 1986 to May 1998 at Physio Control Corporation in several sales and marketing management roles prior to its acquisition by Medtronic Inc. The Board has determined that Mr. Rice is qualified to serve as a director because it values management’s insight.
Raymond W. Cohen joined the Board in May 2006 and has served as Chairman of the Board since November 2013. Mr. Cohen is an accredited public company director with extensive operating and corporate governance experience holding positions on the boards of publicly listed life science companies. Mr. Cohen currently serves as the Chief Executive Officer and member of the board of directors of Axonics Modulation Technologies, Inc., (NASDAQ: AXNX), a manufacturer of neuromodulation devices. From 2010 to 2012, Mr. Cohen served as Chief Executive Officer of Vessix Vascular, Inc. until Vessix was acquired by Boston Scientific Corporation. Previously, from 1997 to 2006, Mr. Cohen served as Chairman and Chief Executive Officer of NASDAQ listed Cardiac Science, Inc., which in 2004 was ranked as the 4th fastest growing technology company in North America on Deloitte & Touche’s Fast 500 listing. In October 2020, Cohen was named as Entrepreneur of the Year by Ernst & Young for the Southwest US. Mr. Cohen holds a B.S. in Business Management from Binghamton University. The board has determined that Mr. Cohen is qualified to serve as a director because of his extensive experience with public companies.
Andrew Hinson joined the Board in February 2007. Mr. Hinson currently serves as a consultant to the biotechnology industry specializing in matters of clinical and regulatory affairs. Mr. Hinson served as Vice President of Clinical and Regulatory Affairs for LoneStar Heart, Inc. from 2004 to 2016. Mr. Hinson previously served as the Senior Director of research and clinical development at AnGes MG, Inc. (TSE: 4563) a biotechnology firm engaged in the development and commercialization of novel gene and cell therapies for the treatment of cardiovascular disease. Prior to that Mr. Hinson had a long career with Procter & Gamble Pharmaceutical (NYSE:PG) holding multiple technical and management positions in research, clinical development and medical affairs. Mr. Hinson has diverse experience in the cell and gene therapy markets and extensive experience with regulatory affairs and clinical development of new therapies for cardiac, neurologic, and gastrointestinal diseases. The Board has determined that Mr. Hinson is qualified to serve as a director because of his experience and knowledge of companies in the biotechnology space.
Joseph Schick joined the Board in November 2013. He has 13 years of experience as a Chief Financial Officer spanning four different mid-sized companies in various industries. Prior to his experience as a Chief Financial Officer, Mr. Schick worked in various roles for seven years at Expedia (NASDAQ: EXPE), including Senior Vice President of Finance. From this background, Mr. Schick has significant experience with SEC reporting, strategic planning, and mergers and acquisitions. Mr. Schick started his career with Arthur Andersen and is a CPA who received his B.S. in Accounting from the University of Illinois. He is also on various non-profit boards and completed the Director Certification program at UCLA. The Board has determined that Mr. Schick is qualified to serve as a director because of his financial experience with public companies.
Except as otherwise provided by law, each director shall hold office until either their successor is elected and qualified, or until he or she sooner dies, resigns, is removed or becomes disqualified. Officers serve at the discretion of the Board.
There are no family relationships between any of our directors or executive officers and any other of our directors or executive officers.
Delinquent Section 16(a) Reports
Section 16(a) of the Exchange Act requires the Company’s directors and executive officers, and persons who own more than 10% of a registered class of the Company’s equity securities, to file with the SEC reports of beneficial ownership and reports of changes in beneficial ownership in the Company’s securities. Based solely upon a review of Forms 3, 4 and 5, and amendments thereto, filed electronically with the SEC during the year ended December 31, 2020, the Company believes that all Section 16(a) filings applicable to its directors, officers, and 10% stockholders were filed on a timely basis during the year ended December 31, 2020, except that Walter Villiger filed three late Form 4s reporting a total of five transactions, Thomas Girschweiler filed three late Form 4s reporting four transactions, and Marcus Schulz filed one late Form 4 reporting one transaction.
BOARD OF DIRECTORS
Overview
Our Bylaws provide that the size of our Board is to be determined from time to time by resolution of the Board but shall consist of at least three members. Our Board presently consists of four members. Our Board has determined three of our directors– Messrs. Cohen, Hinson, and Schick – to be independent under the rules of the NASDAQ Stock Market, after taking into consideration, among other things, those transactions described under “Certain Transactions”. Mr. Cohen serves as Chairman of the Board and is an independent director. The Board does not have a lead director; however, recognizing that the Board is composed almost entirely of outside directors, in addition to the Board’s strong committee system (as described more fully below), we believe this leadership structure is appropriate for the Company and allows the Board to maintain effective oversight of management.
At each annual meeting of stockholders, members of our Board are elected to serve until the next annual meeting and until their successors are duly elected and qualified.
Committees of the Board of Directors
The Board has established an Audit Committee, a Compensation Committee, and a Nominating and Governance Committee. Each committee operates pursuant to a written charter that may be viewed on our website at www.biolifesolutions.com. The inclusion of our web site address in this Annual Report does not include or incorporate by reference the information on our web site into this Annual Report.
The following table sets forth the current composition of the three standing committees of our Board:
Name | Board | Audit | Compensation | Nominating | ||||
Mr. Rice | X | |||||||
Mr. Cohen | Chair | X | Chair | X | ||||
Mr. Hinson | X | X | X | Chair | ||||
Mr. Schick (financial expert) | X | Chair | X | X |
Audit Committee. Our Audit Committee’s role includes the oversight of our financial, accounting and reporting processes; our system of internal accounting and financial controls; and our compliance with related legal, regulatory and ethical requirements. The Audit Committee oversees the appointment, compensation, engagement, retention, termination and services of our independent registered public accounting firm, including conducting a review of its independence; reviewing and approving the planned scope of our annual audit; overseeing our independent registered public accounting firm’s audit work; reviewing and pre-approving any audit and non-audit services that may be performed by our independent registered public accounting firm; reviewing with management and our independent registered public accounting firm the adequacy of our internal financial and disclosure controls; reviewing our critical accounting policies and the application of accounting principles; and monitoring the rotation of partners of our independent registered public accounting firm on our audit engagement team as required by regulation.
In addition, the Audit Committee’s role includes meeting to review our annual audited financial statements and quarterly financial statements with management and our independent registered public accounting firm. The Audit Committee has the authority to obtain independent advice and assistance from internal or external legal, accounting and other advisors, at the Company’s expense.
The Board has determined that all members of our Audit Committee meet the independence and financial literacy standards of the NASDAQ Stock Market and applicable SEC rules. The Board of Directors has determined that Mr. Schick is an “audit committee financial expert” as defined by the rules of the SEC.
Compensation Committee. The purpose of the Compensation Committee is to discharge its fiduciary responsibilities relating to the compensation of executive officers, the organizational structure, succession, retention and training policies and review and oversight of benefit programs. Our Compensation Committee is responsible for reviewing the recommendations of our Chief Executive Officer and Chief Financial Officer, making recommendations to the Board regarding the compensation of our executive officers, and ensuring that the total compensation paid to the executive officers is reasonable and competitive, and does not promote excessive risk taking. In making its recommendation to the Board, the Compensation Committee considers the results of the most recent stockholder advisory vote on executive compensation. The Chief Executive Officer may not be present during voting or deliberation on his compensation. The Compensation Committee is also responsible for reviewing and making recommendations to the Board regarding director and committee member compensation. In addition, the Compensation Committee approves and has oversight over our bonus plans for executive officers and/or stock-based compensation plans and oversight of our overall compensation plans and benefit programs, including approval and oversight of grants.
In discharge of its duties related to administration of executive bonus plans, the Compensation Committee may, subject to the terms of each plan, delegate authority to management for the day-to-day non-material administration of such plans. Further, the Compensation Committee may, subject to the terms of each plan, delegate authority to management to make grants to non-executive officers under stock-based compensation plans.
The Compensation Committee has the authority to obtain independent advice and assistance from internal or external legal, accounting and other advisors, at the Company’s expense. The Compensation Committee may select, or receive advice from, a compensation consultant, legal counsel or other adviser to the Committee, other than in-house legal counsel, only after taking into consideration the six factors outlined in Rule 10C-1 of the Exchange Act. In considering and determining compensation levels, the Compensation Committee reviews independent and externally generated compensation data, in accordance with Rule 10C-1 of the Exchange Act.
The members of the Compensation Committee are independent directors within the meaning of the listing standards of the NASDAQ Stock Market.
Nominating and Governance Committee. Our Nominating and Governance Committee’s primary purpose is to evaluate candidates for membership on our Board and make recommendations to our Board regarding candidates; make recommendations with respect to the composition of our Board and its committees; provide guidance to our human resources, legal, and finance departments relating to director orientation programs; recommend corporate governance principles applicable to the Company; manage periodic review, discussion and evaluation of the performance of our Board, its committees and its members and oversee and monitor compliance with our Code of Business Conduct and Ethics. The Nominating and Governance Committee has the authority to obtain independent advice and assistance from internal or external legal, accounting and other advisors, at the Company’s expense.
All members of our Nominating and Governance Committee are independent under the listing standards of the NASDAQ Stock Market.
The Nominating and Governance Committee will consider candidates recommended by stockholders in accordance with the procedures set forth in our Bylaws, and prior to the date it recommends a slate of director nominees to the Board. Pursuant to the Nominating and Governance Committee Charter, there is no difference in the manner in which a nominee recommended by a stockholder or otherwise is evaluated.
In carrying out its function to nominate candidates for election to our Board, the Nominating and Governance Committee considers the Board’s mix of skills, experience, character, commitment and diversity—diversity being broadly construed to mean a variety of opinions, perspectives and backgrounds, such as gender, race and ethnicity differences, as well as other differentiating characteristics, all in the context of the requirements and needs of our Board at that point in time. In reviewing potential candidates, the Committee will also consider all relationships between any proposed nominee and any of our stockholders, competitors, customers, suppliers or other persons with a relationship to the Company. The Nominating and Governance Committee believes that each candidate should be an individual who has demonstrated exceptional ability and judgment, who are willing and able to make a sufficient time commitment to the Company, and who shall be most effective, in conjunction with the other nominees to the Board, in collectively serving the long-term interests of the stockholders.
The Nominating and Governance Committee’s methods for identifying candidates for election to our Board include the solicitation of ideas for possible candidates from a number of sources, including from members of our Board, our executive officers, individuals who our executive officers or Board members believe would be aware of candidates who would add value to our Board and through other research. The Nominating and Governance Committee may, from time to time, retain, for a fee, one or more third-party search firms to identify suitable candidates. The Nominating and Governance Committee will consider all candidates identified through the processes described above, and will evaluate each candidate, including incumbents, based on the same criteria.
The Nominating and Governance Committee does not have a formal policy with respect to diversity; however, the Board and the Nominating and Governance Committee believe that it is essential that the Board members represent diverse viewpoints.
Codes of Business Conduct and Ethics
We believe in sound corporate governance practices and have always encouraged our employees, including officers and directors to conduct business in an honest and ethical manner. Additionally, it has always been our policy to comply with all applicable laws and provide accurate and timely disclosure.
Accordingly, the Board has adopted a formal written code of ethics for all employees. The Board has adopted an additional corporate code of ethics for its Chief Executive Officer, Chief Financial Officer and other senior financial officers, which is intended to be a “code of ethics” as defined by applicable SEC rules. The Code of Ethics is publicly available on our website at http://investors.biolifesolutions.com/corporate-governance. The Company undertakes to provide to any person without charge, upon written request, a copy of our code of ethics by writing to Secretary, BioLife Solutions Inc., 3303 Monte Villa Parkway, Suite 310, Bothell, Washington, 98021. The code of ethics is designed to deter wrongdoing and promote honest and ethical conduct and compliance with applicable laws and regulations. These codes also incorporate what we expect from our executives so as to enable us to provide accurate and timely disclosure in our filings with the SEC and other public communications. Any amendments made to the Code of Ethics will be available on our website.
EXECUTIVE COMPENSATION |
Summary Compensation Table
The following Summary Compensation Table sets forth certain information regarding the compensation, for services rendered in all capacities to us during 2020 and 2019, of our current principal executive officer, current principal financial officer, and our three other most highly compensated executive officers at the end of 2020 (together, the “named executive officers”).
Name and Principal | Year | Salary | Bonus | Stock | All Other Compensation ($) (f) | Total | ||||||||||||||||
Michael Rice | 2020 | 514,712 | — | 963,799 | (2) | — | 1,478,511 | |||||||||||||||
President, Chief Executive Officer and Director | 2019 | 530,000 | 119,250 | (3) | 1,592,520 | (4) | — | 2,241,770 | ||||||||||||||
Aby J. Mathew | 2020 | 407,642 | — | 637,388 | (5) | — | 1,045,030 | |||||||||||||||
Executive Vice President and Chief Scientific Officer | 2019 | 419,750 | 47,222 | (6) | 744,644 | (7) | — | 1,211,616 | ||||||||||||||
Roderick de Greef | 2020 | 390,889 | — | 2,663,189 | (8) | — | 3,054,078 | |||||||||||||||
Chief Operating Officer and Chief Financial Officer | 2019 | 402,500 | 45,281 | (9) | 707,767 | (10) | — | 1,155,548 | ||||||||||||||
Karen Foster | 2020 | 345,731 | — | 541,347 | (11) | — | 887,078 | |||||||||||||||
Chief Quality Officer | 2019 | 356,500 | 40,106 | (12) | 523,467 | (13) | — | 920,073 | ||||||||||||||
Todd Berard | 2020 | 286,490 | — | 447,961 | (14) | — | 734,451 | |||||||||||||||
Chief Marketing Officer | 2019 | 295,000 | 33,188 | (15) | 291,209 | (16) | — | 619,397 | ||||||||||||||
(1) | Reflects base salary earned in each applicable period. |
(2) | Represents fair value of 35,924 time-vested restricted stock, 28,868 market-based restricted stock, and 34,641 performance-based restricted stock granted on March 25, 2020. The time-vested stock award will vest 1/4 of the shares on March 25, 2021 with the remainder vesting quarterly over 3 years. The market-based restricted stock awards will vest as to between 0% and 200% of the number of restricted shares granted to each recipient based on our total shareholder return during the period beginning on January 1, 2020 through December 31, 2021 as compared to the total shareholder return of 20 of our peers. The performance-based restricted stock will vest as to between 0% and 125% of the number of restricted shares granted to each recipient based on certain performance metrics set forth by the Company. |
(3) | Performance bonus earned in 2019 was paid out in 12,991 restricted stock awards in lieu of cash, which fully vested on September 25, 2020. |
(4) | Represents fair value of 35,497 shares of time-vested restricted stock and 35,497 market-based restricted stock granted on February 25, 2019. The time-vested stock award vested 1/4 of the shares on February 25, 2020 with the remainder vesting quarterly over 3 years. The market-based restricted stock awards vested at 200% of the number of restricted shares granted to each recipient based on our total shareholder return during the period beginning on January 1, 2019 through December 31, 2020 as compared to the total shareholder return of 20 of our peers. |
(5) | Represents fair value of 28,451 time-vested restricted stock, 22,863 market-based restricted stock, and 13,718 performance-based restricted stock granted on March 25, 2020. The time-vested stock award will vest 1/4 of the shares on March 25, 2021 with the remainder vesting quarterly over 3 years. The market-based restricted stock awards will vest as to between 0% and 200% of the number of restricted shares granted to each recipient based on our total shareholder return during the period beginning on January 1, 2020 through December 31, 2021 as compared to the total shareholder return of 20 of our peers. The performance-based restricted stock will vest as to between 0% and 125% of the number of restricted shares granted to each recipient based on certain performance metrics set forth by the Company. |
(6) | Performance bonus earned in 2019 was paid out in 5,144 restricted stock awards in lieu of cash, which fully vested on September 25, 2020. |
(7) | Represents fair value of 16,598 shares of time-vested restricted stock and 16,598 market-based restricted stock granted on February 25, 2019. The time-vested stock award vested 1/4 of the shares on February 25, 2020 with the remainder vesting quarterly over 3 years. The market-based restricted stock awards vested at 200% of the number of restricted shares granted to each recipient based on our total shareholder return during the period beginning on January 1, 2019 through December 31, 2020 as compared to the total shareholder return of 20 of our peers. |
(8) | Represents fair value of 27,282 time-vested restricted stock, 21,923 market-based restricted stock, and 13,154 performance-based restricted stock granted on March 25, 2020 and 100,000 time-vested restricted stock granted on July 22, 2020. The time-vested stock awarded on March 25, 2020 will vest 1/4 of the shares on March 25, 2021 with the remainder vesting quarterly over 3 years. The time-vested stock awarded on July 22, 2020 will vest 1/4 of the shares on July 22, 2021 with the remainder vesting quarterly over 3 years. The market-based restricted stock awards will vest as to between 0% and 200% of the number of restricted shares granted to each recipient based on our total shareholder return during the period beginning on January 1, 2020 through December 31, 2021 as compared to the total shareholder return of 20 of our peers. The performance-based restricted stock will vest as to between 0% and 125% of the number of restricted shares granted to each recipient based on certain performance metrics set forth by the Company. |
(9) | Performance bonus earned in 2019 was paid out in 4,933 restricted stock awards in lieu of cash, which fully vested on September 25, 2020. |
(10) | Represents fair value of 15,776 shares of time-vested restricted stock and 15,776 performance-based restricted stock granted on February 25, 2019. The time-vested stock award vested 1/4 of the shares on February 25, 2020 with the remainder vesting quarterly over 3 years. The market-based restricted stock awards vested at 200% of the number of restricted shares granted to each recipient based on our total shareholder return during the period beginning on January 1, 2019 through December 31, 2020 as compared to the total shareholder return of 20 of our peers. |
(11) | Represents fair value of 24,164 time-vested restricted stock, 19,418 market-based restricted stock, and 11,651 performance-based restricted stock granted on March 25, 2020. The time-vested stock award will vest 1/4 of the shares on March 25, 2021 with the remainder vesting quarterly over 3 years. The market-based restricted stock awards will vest as to between 0% and 200% of the number of restricted shares granted to each recipient based on our total shareholder return during the period beginning on January 1, 2020 through December 31, 2021 as compared to the total shareholder return of 20 of our peers. The performance-based restricted stock will vest as to between 0% and 125% of the number of restricted shares granted to each recipient based on certain performance metrics set forth by the Company. |
(12) | Performance bonus earned in 2019 was paid out in 4,369 restricted stock awards in lieu of cash, which fully vested on September 25, 2020. |
(13) | Represents fair value of 11,668 shares of time-vested restricted stock and 11,668 performance-based restricted stock granted on February 25, 2019. The time-vested stock award vested 1/4 of the shares on February 25, 2020 with the remainder vesting quarterly over 3 years. The market-based restricted stock awards vested at 200% of the number of restricted shares granted to each recipient based on our total shareholder return during the period beginning on January 1, 2019 through December 31, 2020 as compared to the total shareholder return of 20 of our peers. |
(14) | Represents fair value of 19,996 time-vested restricted stock, 16,068 market-based restricted stock, and 9,641 performance-based restricted stock granted on March 25, 2020. The time-vested stock award will vest 1/4 of the shares on March 25, 2021 with the remainder vesting quarterly over 3 years. The market-based restricted stock awards will vest as to between 0% and 200% of the number of restricted shares granted to each recipient based on our total shareholder return during the period beginning on January 1, 2020 through December 31, 2021 as compared to the total shareholder return of 20 of our peers. The performance-based restricted stock will vest as to between 0% and 125% of the number of restricted shares granted to each recipient based on certain performance metrics set forth by the Company. |
(15) | Performance bonus earned in 2019 was paid out in 3,615 restricted stock awards in lieu of cash, which fully vested on September 25, 2020. |
(16) | Represents fair value of 6,491 shares of time-vested restricted stock and 6,491 performance-based restricted stock granted on February 25, 2019. The time-vested stock award vested 1/4 of the shares on February 25, 2020 with the remainder vesting quarterly over 3 years. The market-based restricted stock awards vested at 200% of the number of restricted shares granted to each recipient based on our total shareholder return during the period beginning on January 1, 2019 through December 31, 2020 as compared to the total shareholder return of 20 of our peers. |
Narrative Disclosure to Summary Compensation Table
Employment Agreements
The Company entered into an employment agreement with Michael Rice, Chief Executive Officer, effective January 1, 2018 for a salary of $450,000 per year. Subsequently, on November 19, 2018, the Compensation Committee approved a salary increase to $517,500 effective January 1, 2019. With consideration to recommendations of FW Cook, on February 23, 2019, the Compensation Committee approved a salary increase to $530,000 effective February 15, 2019. The agreement provides that if Mr. Rice’s employment is terminated without “Cause” (other than by reason of death or disability) or if he resigns for “Good Reason,” he is entitled to a lump sum payment equal to 12 months’ salary, an amount equal to the cost of 12 months’ medical insurance premiums at a monthly amount equal to the amount of COBRA coverage in effect as of the termination date, plus a tax gross-up amount with respect to such premiums and unvested stock options, awards, or other equity grants shall immediately fully vest; If Mr. Rice’s employment is terminated upon or within 90 days following a “Change in Control”, Mr. Rice is entitled to a lump sum payment equal to 24 months’ salary and an amount equal to the cost of 24 months’ medical insurance premiums at a monthly amount equal to the amount of COBRA coverage in effect as of the termination date, plus a tax gross-up amount with respect to such premiums. On December 1, 2020, this employment agreement was amended. The termination provisions of the agreement were modified to provide that all unvested stock options, awards or other equity awards granted to the employee will fully vest upon a change in control of the Company and allow the employees’ estate to receive any vested benefits or compensation.
The Company entered into an employment agreement with Aby Mathew, Ph.D., Chief Technology Officer, effective January 1, 2018 for a salary of $365,000 per year. Subsequently, on November 19, 2018, the Compensation Committee approved a salary increase to $419,750 effective January 1, 2019. The agreement provides that if Mr. Mathew’s employment is terminated without “Cause” (other than by reason of death or disability) or if he resigns for “Good Reason,” he is entitled to a lump sum payment equal to 12 months’ salary, an amount equal to the cost of 12 months’ medical insurance premiums at a monthly amount equal to the amount of COBRA coverage in effect as of the termination date, plus a tax gross-up amount with respect to such premiums and unvested stock options, awards, or other equity grants shall immediately fully vest; If Mr. Mathew’s employment is terminated upon or within 90 days following a “Change in Control”, Mr. Mathew is entitled to a lump sum payment equal to 12 months’ salary and an amount equal to the cost of 12 months’ medical insurance premiums at a monthly amount equal to the amount of COBRA coverage in effect as of the termination date, plus a tax gross-up amount with respect to such premiums. On December 1, 2020, this employment agreement was amended. The termination provisions of the agreement were modified to provide that all unvested stock options, awards or other equity awards granted to the employee will fully vest upon a change in control of the Company and allow the employees’ estate to receive any vested benefits or compensation.
The Company entered into an employment agreement with Roderick de Greef, Chief Financial Officer, effective January 1, 2018 for a salary of $350,000 per year. Subsequently, on November 19, 2018, the Compensation Committee approved a salary increase to $402,500 effective January 1, 2019. The agreement provides that if Mr. de Greef’s employment is terminated without “Cause” (other than by reason of death or disability) or if he resigns for “Good Reason,” he is entitled to a lump sum payment equal to 12 months’ salary, an amount equal to the cost of 12 months’ medical insurance premiums at a monthly amount equal to the amount of COBRA coverage in effect as of the termination date, plus a tax gross-up amount with respect to such premiums and unvested stock options, awards, or other equity grants shall immediately fully vest; If Mr. de Greef’s employment is terminated upon or within 90 days following a “Change in Control”, Mr. de Greef is entitled to a lump sum payment equal to 18 months’ salary and an amount equal to the cost of 18 months’ medical insurance premiums at a monthly amount equal to the amount of COBRA coverage in effect as of the termination date, plus a tax gross-up amount with respect to such premiums. On December 1, 2020, this employment agreement was amended. The termination provisions of the agreement were modified to provide that all unvested stock options, awards or other equity awards granted to the employee will fully vest upon a change in control of the Company and allow the employees’ estate to receive any vested benefits or compensation.
The Company entered into an employment agreement with Karen Foster, Chief Quality Officer, effective January 1, 2018 for a salary of $310,000 per year. Subsequently, on November 19, 2018, the Compensation Committee approved a salary increase to $356,000 effective January 1, 2019. The agreement provides that if Ms. Foster’s employment is terminated without “Cause” (other than by reason of death or disability) or if she resigns for “Good Reason,” she is entitled to a lump sum payment equal to 6 months’ salary, an amount equal to the cost of 6 months’ medical insurance premiums at a monthly amount equal to the amount of COBRA coverage in effect as of the termination date, plus a tax gross-up amount with respect to such premiums and unvested stock options, awards, or other equity grants shall immediately fully vest; If Ms. Foster’s employment is terminated upon or within 90 days following a “Change in Control”, Ms. Foster is entitled to a lump sum payment equal to 12 months’ salary and an amount equal to the cost of 12 months’ medical insurance premiums at a monthly amount equal to the amount of COBRA coverage in effect as of the termination date, plus a tax gross-up amount with respect to such premiums. On December 1, 2020, this employment agreement was amended. The termination provisions of the agreement were modified to provide that all unvested stock options, awards or other equity awards granted to the employee will fully vest upon a change in control of the Company and allow the employees’ estate to receive any vested benefits or compensation.
The Company entered into an employment agreement with Todd Berard, Chief Marketing Officer, effective January 1, 2018 for a salary of $230,000 per year. Subsequently, on November 19, 2018, the Compensation Committee approved a salary increase to $264,500 effective January 1, 2019. With consideration to recommendations of FW Cook, on February 23, 2019, the Compensation Committee approved a salary increase to $295,000 effective February 15, 2019. The agreement provides that if Mr. Berard’s employment is terminated without “Cause” (other than by reason of death or disability) or if he resigns for “Good Reason,” he is entitled to a lump sum payment equal to 6 months’ salary, an amount equal to the cost of 6 months’ medical insurance premiums at a monthly amount equal to the amount of COBRA coverage in effect as of the termination date, plus a tax gross-up amount with respect to such premiums and unvested stock options, awards, or other equity grants shall immediately fully vest; If Mr. Berard’s employment is terminated upon or within 90 days following a “Change in Control”, Mr. Berard is entitled to a lump sum payment equal to 6 months’ salary and an amount equal to the cost of 6 months’ medical insurance premiums at a monthly amount equal to the amount of COBRA coverage in effect as of the termination date, plus a tax gross-up amount with respect to such premiums. On December 1, 2020, this employment agreement was amended. The termination provisions of the agreement were modified to provide that all unvested stock options, awards or other equity awards granted to the employee will fully vest upon a change in control of the Company and allow the employees’ estate to receive any vested benefits or compensation.
For purposes of each of these employment agreements, a “Change in Control” means (i) the consummation of a merger or consolidation of the Company with or into another entity, (ii) the dissolution, liquidation or winding up of the Company or (iii) the sale of all or substantially all of the Company’s assets. The foregoing notwithstanding, a merger or consolidation of the Company shall not constitute a “Change in Control” if immediately after such merger or consolidation a majority of the voting power of the capital stock of the continuing or surviving entity, or any direct or indirect parent corporation of such continuing or surviving entity, will be owned by the persons who were the Company’s stockholders immediately prior to such merger or consolidation in substantially the same proportions as their ownership of the voting power of the Company’s capital stock immediately prior to such merger or consolidation.
Under each employment agreement, “Cause” means the Company’s belief that any of the following has occurred: (i) any breach of the employment agreement by the executive officer; (ii) any failure to perform assigned job responsibilities that continues unremedied for a period of 10 days after written notice to the executive officer by the Company; (iii) the executive officer’s malfeasance or misconduct in connection with the executive officer’s duties under the employment agreement or any act or omission of the executive officer which is materially injurious to the financial condition or business reputation of the Company or any of its subsidiaries or affiliates, (iv) commission of a felony or misdemeanor or failure to contest prosecution for a felony or misdemeanor; (v) the Company’s reasonable belief that the executive officer engaged in a violation of any statute, rule or regulation, any of which in the judgment of the Company is harmful to the business or to Company’s reputation; (vi) the Company’s reasonable belief that the executive officer engaged in unethical practices, dishonesty or disloyalty; or (vii) any reason that would constitute “cause” under the laws the State of Washington.
Under each employment agreement, “Good Reason” for the executive officer to terminate his or her employment means the following: (i) the Company’s material breach of the terms of the employment agreement or any other written agreement between the executive officer and Company; (ii) the assignment to the executive officer of any duties that are substantially inconsistent with or materially diminish the executive officer’s position prior to execution of the employment agreement; (iii) a material reduction of the executive officer’s salary, other than as a result of a general salary reduction affecting substantially all Company employees; (iv) any failure by the Company to obtain the assumption of the employment agreement by any successor or assign of the Company; or (v) a requirement that the executive officer be based at any office or location more than 50 miles from the executive officer’s primary work location prior to the effective date of the employment agreement.
Outstanding Equity Awards at December 31, 2020
The following table sets forth information concerning the outstanding equity awards as of December 31, 2020 granted to the named executive officers.
OPTION AWARDS | ||||||||||||||
Name (a) | Number of Securities | Number of Securities | Equity Incentive Plan Awards: Number of Securities Underlying | Option Exercise Price ($) | Option Expiration | |||||||||
Michael Rice | 194,843 | –– | –– | 1.64 | 12/20/2021(1) | |||||||||
Michael Rice | 100,000 | –– | –– | 1.90 | 3/15/2026(1) | |||||||||
Michael Rice | 95,833 | 4,167 | –– | 1.78 | 2/7/2022(2) | |||||||||
Aby J. Mathew | 17,857 | –– | –– | 1.40 | 2/15/2022(1) | |||||||||
Aby J. Mathew | 55,451 | –– | –– | 1.12 | 2/11/2021(1) | |||||||||
Aby J. Mathew | 197,707 | –– | –– | 1.64 | 12/20/2021(1) | |||||||||
Aby J. Mathew | 10,000 | –– | –– | 3.70 | 4/21/2024(1) | |||||||||
Aby J. Mathew | 199,837 | –– | –– | 2.06 | 5/4/2025(1) | |||||||||
Roderick de Greef | 6,919 | –– | –– | 1.64 | 12/20/2021(1) | |||||||||
Roderick de Greef | 34,000 | –– | –– | 1.81 | 5/3/2026(1) | |||||||||
Karen Foster | 100,000 | –– | –– | 1.90 | 4/13/2026(1) | |||||||||
Karen Foster | 163,323 | –– | –– | 1.64 | 12/20/2021(1) | |||||||||
Todd Berard | 50,000 | –– | –– | 2.06 | 5/4/2025(1) | |||||||||
Todd Berard | 10,000 | –– | –– | 2.62 | 8/7/2024(1) | |||||||||
Todd Berard | 123,209 | –– | –– | 1.64 | 12/20/2021(1) | |||||||||
(1) | This award is fully vested. |
(2) | This award vested 1/4 of the total shares on February 7, 2017 and, thereafter, has vested and continues to vest in 36 equal monthly increments. |
Name (a) | Grant Date (b) | Number of shares or units of stock that have not vested (#) (c) | Market value of shares of units of stock that have not vested(1) ($) | Equity incentive plan awards: Number of unearned shares, units or other rights that have not vested (#) (e) | Equity incentive plan awards: Market or payout value of unearned shares, units or other rights that have not vested ($) | |||||||||||||
Michael Rice | 1/1/2018 | 5,860 | (2) | 233,755 |
| — |
| — | ||||||||||
Michael Rice | 2/25/2019 | 19,968 | (3) | 796,524 | 35,497 | (4) | 1,415,975 | |||||||||||
Michael Rice | 3/25/2020 | 35,924 | (5) | 1,433,008 | 63,509 | (6) | 2,533,374 | |||||||||||
Aby J. Mathew | 1/1/2018 | 4,753 | (7) | 189,597 |
| — |
| — | ||||||||||
Aby J. Mathew | 2/25/2019 | 9,337 | (8) | 372,453 | 16,598 | (9) | 662,094 | |||||||||||
Aby J. Mathew | 3/25/2020 | 28,451 | (10) | 1,134,910 | 36,581 | (11) | 1,459,216 | |||||||||||
Roderick de Greef | 1/1/2018 | 4,558 | (12) | 181,819 |
| — |
| — | ||||||||||
Roderick de Greef | 2/25/2019 | 8,874 | (13) | 353,984 | 15,776 | (14) | 629,305 | |||||||||||
Roderick de Greef | 3/25/2020 | 27,282 | (15) | 1,088,279 | 35,077 | (16) | 1,399,222 | |||||||||||
Roderick de Greef | 7/22/2020 | 100,000 | (17) | 3,989,000 |
| — |
| — | ||||||||||
Karen Foster | 1/1/2018 | 4,037 | (18) | 161,036 |
| — |
| — | ||||||||||
Karen Foster | 2/25/2019 | 6,564 | (19) | 261,838 | 11,668 | (20) | 465,437 | |||||||||||
Karen Foster | 3/25/2020 | 24,164 | (21) | 963,902 | 31,069 | (22) | 1,239,342 | |||||||||||
Todd Berard | 1/1/2018 | 2,995 | (23) | 119,471 |
| — |
| — | ||||||||||
Todd Berard | 2/25/2019 | 3,652 | (24) | 145,678 | 6,491 | (25) | 258,926 | |||||||||||
Todd Berard | 3/25/2020 | 19,996 | (26) | 797,640 | 25,709 | (27) | 1,025,532 | |||||||||||
(1) |
|
(2) |
| |
(3) |
| |
(4) | The | |
(5) | 35,924 time-based RSAs subject to this award vested 1/4 on 3/25/2021 and, thereafter, will vest in 12 equal quarterly increments, provided that Mr. Rice continues to be employed with BioLife through the vesting dates. | |
(6) | The target number of 28,868 market-based and 34,641 performance-based RSAs is shown. Between 0% and 200% of the target number of market-based RSAs vest depending on BioLife’s Relative Total Shareholder Return (“TSR”) compared to a group of 20 peers over the relevant two-year performance period between January 1, 2020 and December 31, 2021. Between 0% and 125% of the target number of performance-based RSAs vest depending on the achievement of certain performance metrics set forth by the Company | |
(7) | 4,753 unvested time-based RSAs subject to this award are scheduled to vest in 4 equal quarterly increments, provided that Mr. Mathew continues to be employed with BioLife through the vesting dates. | |
(8) | 9,337 unvested time-based RSAs subject to this award are scheduled to vest in 13 equal quarterly increments, provided that Mr. Rice continues to be employed with BioLife through the vesting dates. | |
(9) | The target number of market-based RSAs is shown. Between 0% and 200% of the target number of market-based RSAs vest depending on BioLife’s Relative Total Shareholder Return (“TSR”) compared to a group of 20 peers over the relevant two-year performance period between January 1, 2019 and December 31, 2020. | |
(10) | 28,451 time-based RSAs subject to this award vested 1/4 on 3/25/2021 and, thereafter, will vest in 12 equal quarterly increments, provided that Mr. Mathew continues to be employed with BioLife through the vesting dates. | |
(11) | The target number of 22,863 market-based and 13,718 performance-based RSAs is shown. Between 0% and 200% of the target number of market-based RSAs vest depending on BioLife’s Relative Total Shareholder Return (“TSR”) compared to a group of 20 peers over the relevant two-year performance period between January 1, 2020 and December 31, 2021. Between 0% and 125% of the target number of performance-based RSAs vest depending on the achievement of certain performance metrics set forth by the Company | |
(12) | 4,558 unvested time-based RSAs subject to this award are scheduled to vest in 4 equal quarterly increments, provided that Mr. de Greef continues to be employed with BioLife through the vesting dates. | |
(13) | 8,874 unvested time-based RSAs subject to this award are scheduled to vest in 13 equal quarterly increments, provided that Mr. de Greef continues to be employed with BioLife through the vesting dates. | |
(14) | The target number of market-based RSAs is shown. Between 0% and 200% of the target number of market-based RSAs vest depending on BioLife’s Relative Total Shareholder Return (“TSR”) compared to a group of 20 peers over the relevant two-year performance period between January 1, 2019 and December 31, 2020. | |
(15) | 27,282 time-based RSAs subject to this award vested 1/4 on 3/25/2021 and, thereafter, will vest in 12 equal quarterly increments, provided that Mr. de Greef continues to be employed with BioLife through the vesting dates. | |
(16) | The target number of 21,923 market-based and 13,154 performance-based RSAs is shown. Between 0% and 200% of the target number of market-based RSAs vest depending on BioLife’s Relative Total Shareholder Return (“TSR”) compared to a group of 20 peers over the relevant two-year performance period between January 1, 2020 and December 31, 2021. Between 0% and 125% of the target number of performance-based RSAs vest depending on the achievement of certain performance metrics set forth by the Company | |
(17) | 100,000 time-based RSAs subject to this award are schedule to vest 1/4 on 7/22/2021 and, thereafter, will vest in 12 equal quarterly increments, provided that Mr. Rice continues to be employed with BioLife through the vesting dates. | |
(18) | 4,037 unvested time-based RSAs subject to this award are scheduled to vest in 4 equal quarterly increments, provided that Ms. Foster continues to be employed with BioLife through the vesting dates. | |
(19) | 6,564 unvested time-based RSAs subject to this award are scheduled to vest in 13 equal quarterly increments, provided that Ms. Foster continues to be employed with BioLife through the vesting dates. | |
(20) | The target number of market-based RSAs is shown. Between 0% and 200% of the target number of market-based RSAs vest depending on BioLife’s Relative Total Shareholder Return (“TSR”) compared to a group of 20 peers over the relevant two-year performance period between January 1, 2019 and December 31, 2020. | |
(21) | 24,164 time-based RSAs subject to this award vested 1/4 on 3/25/2021 and, thereafter, will vest in 12 equal quarterly increments, provided that Ms. Foster continues to be employed with BioLife through the vesting dates. | |
(22) | The target number of 19,418 market-based and 11,651 performance-based RSAs is shown. Between 0% and 200% of the target number of market-based RSAs vest depending on BioLife’s Relative Total Shareholder Return (“TSR”) compared to a group of 20 peers over the relevant two-year performance period between January 1, 2020 and December 31, 2021. Between 0% and 125% of the target number of performance-based RSAs vest depending on the achievement of certain performance metrics set forth by the Company | |
(23) | 2,995 unvested time-based RSAs subject to this award are scheduled to vest in 4 equal quarterly increments, provided that Mr. Berard continues to be employed with BioLife through the vesting dates. | |
(24) | 3,652 unvested time-based RSAs subject to this award are scheduled to vest in 13 equal quarterly increments, provided that Mr. Berard continues to be employed with BioLife through the vesting dates. | |
(25) | The target number of market-based RSAs is shown. Between 0% and 200% of the target number of market-based RSAs vest depending on BioLife’s Relative Total Shareholder Return (“TSR”) compared to a group of 20 peers over the relevant two-year performance period between January 1, 2019 and December 31, 2020. | |
(26) | 19,996 time-based RSAs subject to this award vested 1/4 on 3/25/2021 and, thereafter, will vest in 12 equal quarterly increments, provided that Mr. Berard continues to be employed with BioLife through the vesting dates. | |
(27) | The target number of 16,068 market-based and 9,641 performance-based RSAs is shown. Between 0% and 200% of the target number of market-based RSAs vest depending on BioLife’s Relative Total Shareholder Return (“TSR”) compared to a group of 20 peers over the relevant two-year performance period between January 1, 2020 and December 31, 2021. Between 0% and 125% of the target number of performance-based RSAs vest depending on the achievement of certain performance metrics set forth by the Company |
Director Compensation
Each of our non-employee directors, during the year ended December 31, 2020, non-employee directors were compensated with an annual retainer fee of $50,000. Due to the impacts of COVID-19, this annual cash retainer was reduced in May and June 2020 by amounts equal to 25% of the total monthly compensation to each director. In addition, the Board Chairman was compensated an additional $100,000 for the year. Committee chairpersons were compensated with additional annual retainers as follows:
Annual | ||||
Audit Committee Chairman | $ | 10,000 | ||
Nominating and Governance Committee Chairman | $ | 5,000 | ||
A total of $301,875 in cash director compensation was recorded during the year ended December 31, 2020. The following table sets forth information regarding compensation earned by our non-employee directors for the year ended December 31, 2020.
Name(1) | Annual Cash ($)(2) | Board and | Total Compensation | |||||||||
Raymond Cohen | 43,750 | 100,000 | 143,750 | |||||||||
Thomas Girschweiler | 47,917 | — | 47,917 | |||||||||
Andrew Hinson | 47,708 | 5,000 | 52,708 | |||||||||
Joseph Schick | 47,500 | 10,000 | 57,500 | |||||||||
(1) | Michael Rice did not receive any additional compensation for his services as a director. | |
(2) | Due to the impacts of COVID-19, annual cash retainer was reduced in May and June 2020 by amounts equal to 25% of the total monthly compensation to each director. |
SECURITY OWNERSHIP OF CERTAIN BENEFICIAL OWNERS AND MANAGEMENT AND RELATED STOCKHOLDER MATTERS |
OWNERSHIP OF CERTAIN BENEFICIAL OWNERS AND MANAGEMENT
The following table sets forth, as of March 19, 2021, certain information regarding the beneficial ownership of Common Stock by (i) each stockholder known by the Company to be the beneficial owner of more than 5% of the outstanding shares thereof; (ii) each director of the Company; (iii) each named executive officer of the Company; and (iv) all of the Company’s current directors and executive officers (including executive officers that are not named executive officers) as a group. This table is based upon information supplied by officers, directors, and principal stockholders and Schedule 13D(s) and Schedule 13G(s) filed with the SEC.
Name and Address of Beneficial Owner | Common | Percentage | ||||||
Directors and Executive Officers | ||||||||
Michael Rice (Officer and Director)(1) | 645,174 | 1.9 | % | |||||
Aby J. Mathew (Officer)(2) | 629,398 | 1.9 | % | |||||
Roderick de Greef (Officer)(3) | 220,051 | 0.7 | % | |||||
Karen Foster (Officer)(4) | 314,962 | 0.9 | % | |||||
Todd Berard (Officer)(5) | 233,435 | 0.7 | % | |||||
| Sarah Aebersold (Officer)(6) | 20,899 | 0.1 | % | |||||
| Marcus Schulz (Officer)(7) | 40,019 | 0.1 | % | |||||
Andrew Hinson (Director)(8) | 50,175 | 0.2 | % | |||||
Raymond Cohen (Director)(9) | 22,763 | 0.1 | % | |||||
Joseph Schick (Director)(10) | 10,625 | 0.0 | % | |||||
Total shares owned by Executive Officers and Directors (10 persons)(11) | 2,187,501 | 6.2 | % | |||||
5% Stockholders | ||||||||
Casdin Capital, LLC(12) | 7,440,107 | 22.3 | % | |||||
WAVI Holding AG(13) | 3,281,778 | 9.8 | % | |||||
Except as indicated by footnote, and subject to community property laws where applicable, we believe that the persons named in the table have sole voting and investment power with respect to all shares shown as beneficially owned by them. Unless otherwise indicated, the business address of each person listed is in care of 3303 Monte Villa Parkway, #310, Bothell, WA 98021.
(1) | Includes options to purchase 394,843 shares of Common Stock issuable under stock options exercisable within 60 days from March 19, 2021 and 65,872 shares of Common Stock to be issued pursuant to restricted stock awards. |
(2) | Includes options to purchase 425,401 shares of Common Stock issuable under stock options exercisable within 60 days from March 19, 2021 and 45,443 shares of Common Stock to be issued pursuant to restricted stock awards. |
(3) | Includes options to purchase 40,919 shares of Common Stock issuable under stock options exercisable within 60 days from March 19, 2021 and 143,556 shares of Common Stock to be issued pursuant to restricted stock awards. |
(4) | Includes options to purchase 246,989 shares of Common Stock issuable under stock options exercisable within 60 days from March 19, 2021 and 37,385 shares of Common Stock to be issued pursuant to restricted stock awards. |
(5) | Includes options to purchase 158,565 shares of Common Stock issuable under stock options exercisable within 60 days from March 19, 2021 and 29,248 shares of Common Stock to be issued pursuant to restricted stock awards. |
| (6) | Includes 20,899 shares of Common Stock to be issued pursuant to restricted stock awards. |
| (7) | Includes 39,849 shares of Common Stock to be issued pursuant to restricted stock awards. |
(8) | Includes options to purchase 35,714 shares of Common Stock issuable under stock options exercisable within 60 days from March 19, 2021 and 7,500 shares of Common Stock to be issued pursuant to restricted stock awards. |
(9) | Includes 8,750 shares of Common Stock to be issued pursuant to a restricted stock award. |
(10) | Includes 7,500 shares of Common Stock to be issued pursuant to a restricted stock award. |
(11) | Includes the securities listed in footnotes 1-8, in addition to 170 shares of Common Stock, options to purchase 557,532 shares of Common Stock issuable under stock options exercisable within 60 days from March 19, 2021 and 87,237 shares of Common Stock to be issued pursuant to restricted stock awards held by executive officers of the Company that are not named executive officers. |
(12) | Based on a Form 4 filed on November 27, 2020. Consists of 7,440,107 shares of Common Stock. The business address of Casdin Capital, LLC is 1350 Avenue of the Americas, Suite 2405, New York, New York 10019. |
(13) | Based on a Form 4 filed on February 5, 2021. Consists of 3,281,778 shares of Common Stock. The business address of WAVI Holding AG is Paradiesstrasse 25 Jona V8 CH 8645. |
Equity Compensation Plan Information
The following table sets forth information as of December 31, 2020 relating to all our equity compensation plans:
Plan category | Number of securities to exercise options (in thousands) | Weighted Average | Number of | Number of securities (in thousands) | ||||||||||||
Equity compensation plans not approved by security holders (1) | 123 | $ | 1.45 | — | — | |||||||||||
Second amended and restated 2013 performance incentive plan | 1,407 | $ | 1.88 | 1,238 | 470 | |||||||||||
(1) Represents shares of common stock issuable pursuant to non-plan stock option agreements entered into prior to the adoption of our 2013 Performance Incentive Plan. Prior to the adoption of our 2013 Performance Incentive Plan, we granted certain individuals stock options pursuant to stock option agreements that were not issued under a stockholder-approved plan. Each agreement entitles the holder to purchase from us a fixed number of shares of common stock at a fixed purchase price per share for a fixed period of time, which may not exceed ten (10) years. The specific terms and conditions of each option, including when the right to exercise the option vests, the number of shares subject to the option, the exercise price per share, the method of exercise, exercisability following termination, disability and death, and adjustments upon stock splits, combinations, mergers, consolidation and like events are specified in each agreement. In the event of a liquidation of the Company, or a merger, reorganization, or consolidation of the Company with any other corporation in which we are not the surviving corporation or we become a wholly-owned subsidiary of another corporation, any unexercised options shall be deemed canceled unless the surviving corporation elects to assume the options or to issue substitute options in place thereof. In the event of the forgoing, the holder will have the right to exercise the option during a ten-day period immediately prior to such liquidation, merger, or consolidation.
CERTAIN RELATIONSHIPS AND RELATED TRANSACTIONS AND DIRECTOR INDEPENDENCE |
Certain Relationships and Related Transactions
Since January 1, 2019, there has not been, nor has there been proposed, any transaction, arrangement or relationship or series of similar transactions, arrangements or relationships, including those involving indebtedness not in the ordinary course of business, to which we or our subsidiaries were or are a party, or in which we or our subsidiaries were or are a participant, in which the amount involved exceeded or exceeds the lesser of $120,000 or 1% of the average of our total assets at year-end for the last two completed fiscal years and in which any of our directors, nominees for director, executive officers, beneficial owners of more than 5% of any class of our voting securities, or any member of the immediate family of any of the foregoing persons, had or will have a direct or indirect material interest, other than as described above under the headings “Executive Compensation” and “Board of Directors—Director Compensation” and other than the transactions described below. Each of the transactions described below was reviewed and approved or ratified by the Audit Committee of the Board. It is anticipated that any future transactions between us and our officers, directors, principal stockholders and affiliates will be on terms no less favorable to us than could be obtained from unaffiliated third parties. In accordance with our Audit Committee’s charter, all such transactions will be reviewed and approved by our Audit Committee and a majority of the independent and disinterested members of the Board.
On May 14, 2020, we entered into separate warrant exercise agreements with WAVI Holding AG (5% security holder) and Taurus4757 GmbH (affiliate of our former director, Thomas Girschweiler) pursuant to which the warrant holders immediately exercised their respective warrants via a “cashless” exercise as agreed to by the Company. As a result of the cashless exercise, the Company issued approximately 2.7 million shares to the warrant holders and eliminated approximately 3.9 million warrants from its overhang.
On May 22, 2020, we closed a financing transaction with Casdin Partners Master Fund, L.P. (5% security holder) pursuant to which we received gross proceeds of approximately $20,000,000. The transaction was consummated pursuant to a share purchase agreement, dated May 14, 2020, and we issued to Casdin 1,904,762 shares of common stock at the purchase price of $10.50 per share. We also granted Casdin certain registration rights requiring us to file a registration statement with the SEC covering the resale by Casdin of all shares of Company common stock held by Casdin.
Director Independence
Our board of directors is responsible for determining the independence of our directors. For purposes of determining director independence, our board of directors has applied the definitions set forth in NASDAQ Rule 5605(a)(2) and the related rules of the SEC. Based upon its evaluation, our board of directors has affirmatively determined that the following directors meet the standards of independence: Mr. Cohen, Mr. Schick, and Mr. Hinson.
PRINCIPAL ACCOUNTINGFEES AND SERVICES |
Independent Registered Public Accounting Firm Fees
The following table sets forth the aggregate fees billed by our current independent accountants, BDO USA, LLP, for professional services rendered in the fiscal years ended December 31, 2020 and 2019.
2020 | 2019 | |||||||
Audit fees(1) | $ | 429,300 | $ | 314,645 | ||||
Audit related fees(2) | 132,450 |
| –– | |||||
Tax fees(3) |
| –– |
| –– | ||||
All other fees(4) |
| –– |
| –– | ||||
Total | $ | 561,750 | $ | 314,645 | ||||
(1) | Audit fees consist of professional services for the audit of our annual financial statements, review of financial statements included in our Form 10-Q or services that are normally provided by the accountant in connection with statutory and regulatory filings or engagement for those fiscal years. |
(2) | Audit-related fees consist of assurance and related services reasonably related to the performance of the audit or review of our financial statements that are not reported under the heading Audit fees above. In the years ended December 31, |
(3) | There were no fees paid that would be considered “Tax fees” in 2020 or 2019. Fees to be disclosed under this category would be for professional services for tax compliance, tax advice, and tax planning. |
(4) | There were no fees paid that would be considered “All Other fees” in 2020 or 2019. Fees to be disclosed under this category would be for products and services other than those described under the headings Audit fees, Audit-related fees and Tax fees above. |
Audit Committee Pre-Approval Policies and Procedures
The Audit Committee must pre-approve all services to be performed for us by our independent auditors. Pre-approval is granted usually at regularly scheduled meetings of the Audit Committee. If unanticipated items arise between regularly scheduled meetings of the Audit Committee, the Audit Committee has delegated authority to the chairman of the Audit Committee to pre-approve services, in which case the chairman communicates such pre-approval to the full Audit Committee at its next meeting. The Audit Committee also may approve the additional unanticipated services by either convening a special meeting or acting by unanimous written consent. During the years ended December 31, 2020 and 2019, all services billed by BDO USA, LLP were pre-approved by the Audit Committee in accordance with this policy.
EXHIBITS AND FINANCIAL STATEMENT SCHEDULES |
| The following documents are filed as part of this Annual Report on Form10-K: |
(1) Financial Statements (Included Under Item 8): The Index to the Financial Statements is included on page 28 of this Annual Report on Form 10-K and is incorporated herein by reference.
(2) Financial Statement Schedules:
None.
(b) | Exhibits |
Exhibit Number | Document | |
2.1†* | ||
2.2† | ||
2.3†* | ||
2.4†* | ||
2.5†* | ||
3.1 | ||
3.2 | ||
3.3 | ||
3.4 | ||
4.1 | ||
10.1** | ||
10.2** | Amendment No. 1 to Second Amended and Restated 2013 Performance Incentive Plan (filed herewith) | |
10.3** | ||
10.4 | ||
10.5 | ||
10.6 | ||
10.7 | ||
10.8 | ||
10.9 | ||
10.10 | ||
10.11** |
10.12** | ||
10.13** | ||
10.14 | ||
10.15 | ||
10.16 | ||
10.17** | ||
10.18** | ||
10.19 | ||
10.20 | ||
10.21 | ||
10.22 | ||
10.23 | ||
10.24** | Employment Agreement dated January 1, 2021 between the Company and Sarah Aebersold (filed herewith) | |
10.25** | ||
21.1 | ||
23.1 | ||
31.1 | Certification pursuant to Section 302 of the Sarbanes-Oxley Act of 2002 (filed herewith) | |
31.2 | Certification pursuant to Section 302 of the Sarbanes-Oxley Act of 2002 (filed herewith) | |
32.1 | Certification pursuant to Section 906 of the Sarbanes-Oxley Act of 2002 (filed herewith) | |
32.2 | Certification pursuant to Section 906 of the Sarbanes-Oxley Act of 2002 (filed herewith) | |
101.INS | Inline XBRL Instance Document (filed herewith) | |
101.SCH | Inline XBRL Taxonomy Extension Schema (filed herewith) | |
101.CAL | Inline XBRL Taxonomy Extension Calculation Linkbase (filed herewith) | |
101.DEF | Inline XBRL Taxonomy Extension Definition Linkbase (filed herewith) | |
101.LAB | Inline XBRL Taxonomy Extension Label Linkbase (filed herewith) | |
101.PRE | Inline XBRL Taxonomy Extension Presentation Linkbase (filed herewith) | |
| 104 | Cover Page Interactive Data File (formatted as Inline XBRL and contained in Exhibit 101) |
* | Certain sensitive financial, commercial and strategic information relating to the Company has been redacted in the marked portions of the exhibit. | |
** | Management contract or compensatory plan or arrangement. | |
† | The exhibits and schedules to this Exhibit have been omitted in accordance with Regulation S-K Item 601(b)(2). The Registrant agrees to furnish supplementally a copy of all omitted exhibits and schedules to the Securities and Exchange Commission upon its request. |
(c) | Excluded financial statements: |
None.
FORM 10-K SUMMARY |
The Company has elected not to include a summary pursuant to this Item 16.
Pursuant to the requirements of Section 13 or 15(d) of the Securities Exchange Act of 1934, the registrant has duly caused this report to be signed on its behalf by the undersigned, thereunto duly authorized.
Date: |
| March 31, 2021 | BIOLIFE SOLUTIONS, INC. | |
/s/ MICHAEL RICE | ||||
Michael Rice | ||||
Chief Executive Officer and President |
Pursuant to the requirements of the Securities Exchange Act of 1934, this report has been signed below by the following persons on behalf of the registrant and in the capacities and on the dates indicated.
Date: | March 31, 2021 | /s/ MICHAEL RICE | |
Michael Rice | |||
Chief Executive Officer and President | |||
Date: | March 31, 2021 | /s/ RODERICK DE GREEF | |
Roderick de Greef | |||
Chief Financial Officer (principal financial | |||
Date: | March 31, 2021 | /s/ RAYMOND COHEN | |
Raymond Cohen | |||
Chairman of the Board of Directors | |||
Date: | March 31, 2021 | /s/ ANDREW HINSON | |
Andrew Hinson | |||
Director | |||
Date: | March 31, 2021 | /s/ JOSEPH SCHICK | |
Joseph Schick | |||
Director |