UNITED STATES SECURITIES AND EXCHANGE COMMISSION | ||||||||
Washington, D.C. 20549 | ||||||||
FORM |
| ☒ | ANNUAL REPORT PURSUANT TO SECTION 13 OR 15(d) OF THE SECURITIES EXCHANGE ACT OF 1934 |
For the fiscal year ended December 31, 20202021
or
☐ | TRANSITION REPORT PURSUANT TO SECTION 13 OR 15(d) OF THE SECURITIES EXCHANGE ACT OF 1934 |
Commission file number 000-19297 | ||||||||
FIRST COMMUNITY BANKSHARES, INC. | ||||||||
(Exact name of registrant as specified in its charter) | ||||||||
Virginia | 55-0694814 | |||||||
(State or other jurisdiction of incorporation or organization) | (I.R.S. Employer Identification No.) | |||||||
P.O. Box 989 Bluefield, Virginia 24605-0989 | ||||||||
(Address of principal executive offices) (Zip Code) | ||||||||
Registrant’s telephone number, including area code: (276) 326-9000 | ||||||||
Securities registered pursuant to Section 12(b) of the Act: | ||||||||
Title of each class | Trading Symbols | Name of each exchange on which registered | ||||||||
Common Stock, $1.00 par value | FCBC | NASDAQ Global Select | ||||||||
Securities registered pursuant to Section 12(g) of the Act: None | ||||||||
Indicate by check mark if the registrant is a well-known seasoned issuer, as defined in Rule 405 of the Securities Act. ☐ Yes ☑ No Indicate by check mark if the registrant is not required to file reports pursuant to Section 13 or Section 15(d) of the Act. ☐ Yes ☑ No Indicate by check mark whether the registrant (1) has filed all reports required to be filed by Section 13 or 15(d) of the Securities Exchange Act of 1934 during the preceding 12 months (or for such shorter period that the registrant was required to file such reports), and (2) has been subject to such filing requirements for the past 90 days. ☑ Yes ☐ No Indicate by check mark whether the registrant has submitted electronically every Interactive Data File required to be submitted ☑ Yes ☐ No |
Indicate by check mark whether the registrant is a large accelerated filer, an accelerated filer, a non-accelerated filer, a smaller reporting company, or an emerging growth company. See the definitions of “large accelerated filer,” “accelerated filer,” “smaller reporting company,” and “emerging growth company” in Rule 12b-2 of the Exchange Act.
| Large accelerated filer ☐ | Accelerated filer ☑ | |
| Non-accelerated filer ☐ | Smaller reporting company ☐ | |
| Emerging growth company ☐ |
If an emerging growth company, indicate by check mark if the registrant has elected not to use the extended transition period for complying with any new or revised financial accounting standards provided pursuant to Section 13(a) of the Exchange Act. ☐
Indicate by check mark whether the registrant has filed a report on and attestation to its management's assessment of the effectiveness of its internal control over financial reporting under Section 404 (b) of the Sarbanes-Oxley Act (15 U.S.C. 7262(b)) by the registered public accounting firm that prepared or issued its audit report. ☑
Indicate by check mark whether the registrant is a shell company (as defined in Rule 12b-2 of the Act).
☐ Yes ☑ No
As of June 30, 2020,2021, the aggregate market value of the registrant’s voting and non-voting common stock held by non-affiliates was $282.85 million.$374.88 million.
As of March 2, 2021,February 23, 2022, there were 17,641,12416,806,360 shares outstanding of the registrant’s Common Stock, $1.00 par value.
DOCUMENTS INCORPORATED BY REFERENCE
Portions of the Proxy Statement for the Annual Meeting of Stockholders to be held on April 27, 2021,26, 2022, are incorporated by reference in Part III of this Form 10-K.
EXPLANATORY NOTE
First Community Bankshares, Inc. (the “Company”) is filing this Form 10-K/A (the “Form 10-K/A”) to the Company’s Annual Report on Form 10-K for the fiscal year ended December 31, 2020 (the “Original Filing”), as filed with the Securities and Exchange Commission (“SEC”) on March 12, 2021, for the sole purpose of including information that was inadvertently omitted in the EDGAR preparation process. Specifically, the following information was excluded in the Original Filing :
Report of Independent Registered Public Accounting Firm on Consolidated Financial Statements
Management’s Assessment of Internal Control over Financial Reporting
Report of Independent Registered Public Accounting Firm on Management’s Assessment of Internal Control Over Financial Reporting
Item 9 – Changes in Disagreements with Accounting and Financial Disclosure (none)
Item 9A – Controls and Procedures
Item 9B – Other Information (none)
All of Part III, including:
Item 10 – Directors, Executive Officers and Corporate Governance
Item 11 – Executive Compensation
Item 12 – Security Ownership of Certain Beneficial Owners and Management and Related Stockholder Matters
Item 13 – Certain Relationships and Related Transactions and Director Independence
Item 14 – Principal Accounting Fees and Services
Part IV:
Item 15 – Exhibits, Financial Statement Schedules
Signatures
For the convenience of the reader, this Form 10-K/A sets forth the Original Filing in its entirety. However, this Form 10-K/A is only amended to include those sections identified above, and no other information in the Original Filing is amended hereby. Other than the foregoing, and the new certifications required under the Securities and Exchange Act of 1934, the Original Filing is not being amended or updated in any respect. Accordingly, this Form 10-K/A should be read in conjunction with the Company’s other filings made with the SEC subsequent to the filing of the Original Filing.
FIRST COMMUNITY BANKSHARES, INC.
20202021 FORM 10-K
INDEX
Page | ||
Item 1. | 4 | |
Item 1A. | 11 | |
Item 1B. | ||
Item 2. | ||
Item 3. | ||
Item 4. | ||
Item 5. | 18 | |
Item 6. | [Reserved] | |
Item 7. | Management’s Discussion and Analysis of Financial Condition and Results of Operations. | |
Item 7A. | ||
Item 8. | ||
Item 9. | Changes in and Disagreements With Accountants on Accounting and Financial Disclosure. | |
Item 9A. | ||
Item 9B. | ||
| Item 9C. | Disclosure Regarding Foreign Jurisdictions that Prevent Inspections. | |
Item 10. | ||
Item 11. | ||
Item 12. | Security Ownership of Certain Beneficial Owners and Management and Related Stockholder Matters. | |
Item 13. | Certain Relationships and Related Transactions, and Director Independence. | |
Item 14. | ||
Item 15. | ||
CAUTIONARY STATEMENT REGARDING FORWARD-LOOKING STATEMENTS
Forward-looking statements in filings with the Securities and Exchange Commission, including this Annual Report on Form 10-K and the accompanying Exhibits, filings incorporated by reference, reports to shareholders, and other communications that represent the Company’s beliefs, plans, objectives, goals, guidelines, expectations, anticipations, estimates, and intentions are made in good faith pursuant to the safe harbor provisions of the Private Securities Litigation Reform Act of 1995. These statements are not guarantees of future performance and involve certain risks, uncertainties, and assumptions that are difficult to predict. The words “may,” “could,” “should,” “would,” “believe,” “anticipate,” “estimate,” “expect,” “intend,” “plan,” and other similar expressions identify forward-looking statements. The following factors, among others, could cause financial performance to differ materially from that expressed in such forward-looking statements:
| ● | the effects of the COVID-19 pandemic, including the negative impacts and disruptions to the communities the Company serves, and the | |
● | the strength of the U.S. economy in general and the strength of the local economies in which we conduct operations; |
● | the effects of, and changes in, trade, monetary, and fiscal policies and laws, including interest rate policies of the Federal Reserve System; |
● | inflation, interest rate, market and monetary fluctuations; |
● | timely development of competitive new products and services and the acceptance of these products and services by new and existing customers; |
● | the willingness of customers to substitute competitors’ products and services for the Company’s products and services and vice versa; |
● | the impact of changes in financial services laws and regulations, including laws about taxes, banking, securities, and insurance; |
● | the impact of the U.S. Department of the Treasury and federal banking regulators’ continued implementation of programs to address capital and liquidity in the banking system; |
● | technological changes; |
● | the costs and effects of cyber incidents or other failures, interruptions, or security breaches of our systems or those of third-party providers; |
| ● | the effect of changes in accounting policies and practices, as may be adopted by the regulatory agencies, as well as the Public Company Accounting Oversight Board, the Financial Accounting Standards Board, and other accounting standard | |
● | the effect of acquisitions, including, without limitation, the failure to achieve the expected revenue growth and/or expense savings from such acquisitions; |
● | the growth and profitability of noninterest, or fee, income being less than expected; |
● | unanticipated regulatory or judicial proceedings; |
● | changes in consumer spending and saving habits; and |
● | the Company’s success at managing the risks mentioned above. |
The list of important factors is not exclusive. If one or more of the factors affecting these forward-looking statements proves incorrect, actual results, performance, or achievements could differ materially from those expressed in, or implied by, forward-looking statements contained in this Annual Report on Form 10-K and other reports we file with the Securities and Exchange Commission. Therefore, the Company cautions you not to place undue reliance on forward-looking information and statements. Further, statements about the potential effects of the COVID-19 pandemic on our business, financial condition, liquidity and results of operations may contain forward-looking statements and are subject to the risk that the actual effects may differ, possibly materially, from what is reflected in those forward-looking statements due to factors and future developments that are uncertain, unpredictable and in many cases beyond our control. Further, statements about the potential effects of the COVID-19 pandemic on our business, financial condition, liquidity and results of operations may contain forward-looking statements and are subject to the risk that the actual effects may differ, possibly materially, from what is reflected in those forward-looking statements due to factors and future developments that are uncertain, unpredictable and in many cases beyond our control. The Company does not intend to update any forward-looking statements, whether written or oral, to reflect changes. These cautionary statements expressly qualify all forward-looking statements that apply to the Company including the risk factors presented in Part I, Item 1A of this report.
Business. |
General
First Community Bankshares, Inc. (the “Company”), a financial holding company, was founded in 1989 and reincorporated under the laws of the Commonwealth of Virginia in 2018. The Company is the successor to First Community Bancshares, Inc., a Nevada corporation, pursuant to an Agreement and Plan of Reincorporation and Merger, the sole purpose of which was to change the Company’s state of incorporation from Nevada to Virginia. The reincorporation was completed on October 2, 2018. The Company’s principal executive office is located in Bluefield, Virginia. The Company provides banking products and services to individual and commercial customers through its wholly owned subsidiary First Community Bank (the “Bank”), a Virginia-chartered banking institution founded in 1874. The Bank offers wealth management and investment advice through its Trust Division and wholly owned subsidiary First Community Wealth Management. Unless the context suggests otherwise, the terms “First Community,” “Company,” “we,” “our,” and “us” in this Annual Report on Form 10-K refer to First Community Bankshares, Inc. and its subsidiaries as a consolidated entity.
We focus on building financial partnerships and creating enduring and mutually beneficial relationships with businesses and individuals through a personal and local approach to banking and financial services. We strive to be the bank of choice in the markets we serve by offering impeccable service and a complete line of competitive products that include:
● | demand deposit accounts, savings and money market accounts, certificates of deposit, and individual retirement arrangements; |
● | commercial, consumer, and real estate mortgage loans and lines of credit; |
● | various credit card, debit card, and automated teller machine card services; |
● | corporate and personal trust services; and |
● | investment management services. |
Our operations are guided by a strategic plan that focuses on organic growth supplemented by strategic acquisitions of complementary financial institutions. For a summary of our financial performance, see Item 6, “Selected Financial Data,” in Part II of this report.
Employees and Human Capital Resources
As of December 31, 2020,2021, we had 605599 full-time employees and 30 part-time26 part-time employees. The employees are not represented by a collective bargaining unit and we consider our relationship with our employees to be good.
We encourage and support the growth and development of our employees and, wherever possible, seek to fill positions by promotion and transfer from within the organization. Continual learning and career development is advanced through ongoing performance and development conversations with employees, internally developed training programs and customized corporate training engagements.
The safety, health and wellness of our employees is a top priority. The COVID-19 pandemic presented a unique challenge with regard to maintaining employee safety while continuing successful operations. Within a short period of time, through teamwork and the adaptability of our management and staff, we were able to transition and provide remote access to non-customer facing employees to effectively work from remote locations and were able to ensure a safely-distanced working environment for employees performing customer facing activities at branches and operations centers. All employees are asked not to come to work when they experience signs or symptoms of a possible communicable illness, including COVID-19, and have been provided additional paid time off to cover compensation during such absences. On an ongoing basis, we further promote the health and wellness of our employees by strongly encouraging work-life balance and keeping increases in the employee portion of health care premiums as small as possible and sponsoring various wellness programs.
Employee retention helps us operate efficiently and achieve one of our business objectives, which is building financial partnerships. We believe our commitment to living out our core values, actively prioritizing concern for our employees’ well-being, supporting our employees’ career goals, offering competitive wages and providing valuable fringe benefits aids in retention of our top-performing employees. In addition, nearly all of our employees are stockholders of the Company through participation in our current 401(k) plan and a former employee stock ownership plan, which aligns employee and stockholder interests by providing stock ownership on a tax-deferred basis at no investment cost to our associates.
Market Area
As of December 31, 2020,2021, we operated 5049 branch locations in Virginia, West Virginia, North Carolina, and Tennessee through our sole operating segment, Community Banking. Economic indicators in our market areas show relatively stable employment and business conditions. We serve a diverse base of individuals and businesses across a variety of industries such as education; government and health services; retail trade; construction; manufacturing; tourism; coal mining and gas extraction; and transportation.
Competition
The financial services industry is highly competitive and constantly evolving. We encounter strong competition in attracting and retaining deposit, loan, and other financial relationships in our market areas. We compete with other commercial banks, thrifts, savings and loan associations, credit unions, consumer finance companies, mortgage banking firms, commercial finance and leasing companies, securities firms, brokerage firms, and insurance companies. We have positioned ourselves as a regional community bank that provides an alternative to larger banks, which often place less emphasis on personal relationships, and smaller community banks, which lack the capital and resources to efficiently serve customer needs. Factors that influence our ability to remain competitive include the ability to develop, maintain, and build long-term customer relationships; the quality, variety, and pricing of products and services; the convenience of banking locations and office hours; technological developments; and industry and general economic conditions. We seek to mitigate competitive pressures with our relationship style of banking, competitive pricing, and cost efficiencies, and disciplined approach to loan underwriting.efficiencies.
Supervision and Regulation
Overview
We are subject to extensive examination, supervision, and regulation under applicable federal and state laws and various regulatory agencies. These regulations are intended to protect consumers, depositors, borrowers, deposit insurance funds, and the stability of the financial system and are not for the protection of stockholders or creditors.
Applicable laws and regulations restrict our permissible activities and investments and impose conditions and requirements on the products and services we offer and the manner in which they are offered and sold. They also restrict our ability to repurchase stock or pay dividends, or to receive dividends from our banking subsidiary, and impose capital adequacy requirements on the Company and the Bank. The consequences of noncompliance with these laws and regulations can include substantial monetary and nonmonetary sanctions.
The following discussion summarizes significant laws and regulations applicable to the Company and the Bank. These summaries are not intended to be complete and are qualified in their entirety by reference to the applicable statute or regulation. Changes in laws and regulations may have a material effect on our business, financial condition, or results of operations.
First Community Bankshares, Inc.
The Company is a bank holding company registered under the Bank Holding Company Act of 1956, as amended, (“BHC Act”) and a financial holding company under the Gramm-Leach-Bliley Act of 1999 (“GLB Act”). The Company elected financial holding company status in December 2006. The Company and its subsidiaries are subject to supervision, regulation, and examination by the Board of Governors of the Federal Reserve System (“Federal Reserve”). The BHC Act generally provides for umbrella regulation of financial holding companies, such as the Company, by the Federal Reserve, as well as functional regulation of financial holding company subsidiaries by applicable regulatory agencies. The Federal Reserve is granted the authority, in certain circumstances, to require reports of, examine, and adopt rules applicable to any bank holding company subsidiary.
The Company is also subject to the disclosure and regulatory requirements of the Securities Act of 1933, as amended, and the Securities Exchange Act of 1934, as amended, (“Exchange Act”), as administered by the Securities and Exchange Commission (“SEC”). The Company’s common stock is listed on the NASDAQ Global Select Market under the trading symbol FCBC and is subject to NASDAQ’s rules for listed companies.
First Community Bank
The Bank is a Virginia chartered bank and a member of the Federal Reserve subject to supervision, regulation, and examination by the Virginia Bureau of Financial Institutions and the Federal Reserve Bank (“FRB”) of Richmond. The Bank is a member of the Federal Deposit Insurance Corporation (“FDIC”), and its deposits are insured by the FDIC to the extent provided by law. The regulations of these agencies govern most aspects of the Bank’s business, including requirements concerning the allowance for loan losses, lending and mortgage operations, interest rates received on loans and paid on deposits, the payment of dividends, loans to affiliates, mergers and acquisitions, capital, and the establishment of branches. Various consumer and compliance laws and regulations also affect the Bank’s operations.
As a member bank, the Bank is required to hold stock in the FRB of Richmond in an amount equal to 6% of its capital stock and surplus (half paid to acquire the stock with the remainder held as a cash reserve). Member banks do not have any control over the Federal Reserve as a result of owning the stock and the stock cannot be sold or traded.
Permitted Activities under the BHC Act
The BHC Act limits the activities of bank holding companies, such as the Company, to the business of banking, managing or controlling banks and other activities the Federal Reserve determines to be closely related to banking. A bank holding company that elects treatment as a financial holding company under the GLB Act, such as the Company, may engage in a broader range of activities that are financial in nature or complementary to a financial activity and do not pose a substantial risk to the safety and soundness of depository institutions or the financial system. These activities include securities underwriting, dealing, and market making; sponsoring mutual funds and investment companies; insurance underwriting and agency; merchant banking activities; and other activities that the Federal Reserve determines to be closely related to banking.
In order to maintain financial holding company status, the Company and the Bank must be well-capitalized and well-managed under applicable Federal Reserve regulations and have received at least a satisfactory rating under the Community Reinvestment Act (“CRA”). See “Prompt Corrective Action” and “Community Reinvestment Act” below. If we fail to meet these requirements, the Federal Reserve may impose corrective capital and managerial requirements and place limitations or conditions on our ability to conduct activities permissible for financial holding companies. If the deficiencies persist, the Federal Reserve may require the Company to divest the Bank or divest investments in companies engaged in activities permissible only for financial holding companies.
In July 2019, the federal bank regulators adopted final rules (the “Capital SimplificationsSimplification Rules”) that, among other things, eliminated the standalone prior approval requirement in the Basel III Capital Rules for any repurchase of common stock. The Company is required to give the Federal Reserve prior notice of any redemption or repurchase of its own equity securities, subject to certain exemptions, if the consideration to be paid, together with the consideration paid for any repurchases or redemptions in the preceding 12 months, is equal to 10% or more of the Company’s consolidated net worth. The Federal Reserve may oppose the transaction if it believes that the transaction would constitute an unsafe or unsound practice or would violate any law or regulation. Any redemption or repurchase of preferred stock or subordinated debt remains subject to the prior approval of the Federal Reserve Board.
The BHC Act requires that bank holding companies obtain the Federal Reserve’s approval before acquiring direct or indirect ownership or control of more than 5% of the voting shares or all, or substantially all, of the assets of a bank. The regulatory authorities are required to consider the financial and managerial resources and future prospects of the bank holding company and the target bank, the convenience and needs of the communities to be served, and various competitive factors when approving acquisitions. The BHC Act also prohibits a bank holding company from acquiring direct or indirect control of more than 5% of the outstanding voting stock of any company engaged in a non-banking business unless the Federal Reserve determines it to be closely related to banking.
Capital Requirements
We are subject to various regulatory capital requirements administered by the Federal Reserve (the "Basel III Capital Rules").
Since fully phased in on January 1, 2019, Basel III Capital Rules require the Company and the Bank to maintain the following:
● | A minimum ratio of Common Equity Tier 1 ("CET1") to risk-weighted assets of at least 4.50%, plus a 2.50% "capital conservation buffer" that is composed entirely of CET1 capital (resulting in a minimum ratio of CET1 to risk-weighted assets of 7.00%); |
● | A minimum ratio of Tier 1 capital to risk-weighted assets of at least 6.00%, plus the capital conservation buffer (resulting in a minimum Tier 1 capital ratio of 8.50%); |
| ● | A minimum ratio of total capital (Tier 1 capital plus Tier 2 capital) to risk-weighted assets of at least 8.00%, plus the capital conservation buffer (resulting in a minimum total capital ratio of 10.50%); and | |
● | A minimum leverage ratio of 4.00%, calculated as the ratio of Tier 1 capital to average consolidated assets as reported on consolidated financial statements (known as the "leverage ratio"). |
Banking institutions that fail to meet the effective minimum ratios once the capital conservation buffer is taken into account, as detailed above, will be subject to constraints on capital distributions, including dividends and share repurchases, and certain discretionary executive compensation. The severity of the constraints depends on the amount of the shortfall and the institution’s “eligible retained income” (that is, the greater of (i) net income for the preceding four quarters, net of distributions and associated tax effects not reflected in net income and (ii) average net income over the preceding four quarters).
Basel III Capital Rules and the Capital Simplification Rules provide for a number of deductions from and adjustments to CET1. These include, for example, the requirement that certain deferred tax assets and significant investments in non-consolidated financial entities be deducted from CET1 to the extent that any one such category exceeds 25% of CET1. Prior to the adoption of the Capital Simplification Rules in July 2019, amounts were deducted from CET1 to the extent that any one such category exceeded 10% of CET1 or all such items, in the aggregate, exceeded 15% of CET1. The Capital Simplification Rules took effect for the Company and the Bank as of January 1, 2020. These limitations did not impact our regulatory capital during any of the reported periods.
Basel III Capital Rules prevent certain hybrid securities, such as trust preferred securities, as Tier 1 capital of bank holding companies, subject to phase-out. The rules do not require a phase-out of trust preferred securities issued before May 19, 2010, for holding companies of depository institutions with less than $15 billion in consolidated total assets, as of December 1, 2009.
In February 2019, the federal bank regulatory agencies issued a final rule (the “2019 CECL Rule”) that revised certain capital regulations to account for changes to credit loss accounting under U.S. GAAP. The 2019 CECL Rule included a transition option that allows banking organizations to phase in, over a three-year period, the day-one adverse effects of adopting a new accounting standard related to the measurement of current expected credit losses (“CECL”) on their regulatory capital ratios (three-year transition option). In March 2020, the federal bank regulatory agencies issued an interim final rule that maintains the three-year transition option of the 2019 CECL Rule and also provides banking organizations that were required under U.S. GAAP (as of January 2020) to implement CECL before the end of 2020 the option to delay for two years an estimate of the effect of CECL on regulatory capital, relative to the incurred loss methodology’s effect on regulatory capital, followed by a three-year transition period (five-year transition option).
Basel III Capital Rules prescribe a standardized approach for risk weightings that expand the risk-weighting categories from the four Basel I categories (0%, 20%, 50% and 100%) to a larger and more risk-sensitive number of categories, depending on the nature of the assets, generally ranging from 0% for U.S. government and agency securities, to 600% for certain equity exposures, and resulting in higher risk weights for a variety of asset categories. In November 2019, the federal banking agencies adopted a rule revising the scope of commercial real estate mortgages subject to a 150% risk weight.
In August 2018, the Federal Reserve issued an interim final rule, which expanded the applicability of the Small Bank Holding Company Policy Statement through an increase in the size limitation for qualifying bank holding companies from $1 billion to $3 billion in total consolidated assets. As a result, the Company qualifies under the Small Bank Holding Company Policy Statement for exemption from the Federal Reserve’s consolidated risk-based capital requirements at the holding company level. Management believes that the Company and the Bank wouldBank's current capital levels exceed the required capital amounts to the considered well-capitalized and also meet allthe fully phased-in minimum capital adequacy requirements, underincluding the related capital convervation buffers, as required by the Basel III Capital Rules on a fully phased-in basis, as of December 31, 2020.
Beginning2021. For additional information, see Note 20, "Regulatory Requirments and Restrictions," to the Consolidated Financial Statements in the first quarterPart II, Item 8 of 2020, a qualifying community banking organization may elect to use the community bank leverage ratio (“CBLR”) framework to eliminate the requirements for calculating and reporting risk-based capital ratios. A qualifying community organization is a depository institution or its holding company that has less than $10 billion in average total consolidated assets; has off-balance sheet exposures of 25% or less of total consolidated assets; has trading assets plus trading liabilities of 5% or less of total consolidated assets; and is not an advance approaches banking organization. Qualifying community banking organizations that elect to use the CBLR framework and that maintain a leverage ratio of greater than 9% are considered to have satisfied the risk-based and leverage capital requirements and are considered to have met the well-capitalized ratio requirements for purposes of Section 38 of the FDICIA. Temporary relief was provided to community banks under the Coronavirus Aid, Relief and Economic Security Act to set the community bank ratio to 8.00% beginning in the second quarter of 2020 and for the remainder of 2020, and to 8.50% effective January 1, 2021, and 9.00% effective January 1, 2022. A qualifying community banking organization may opt into and out of the CBLR framework by completing the associated reporting requirements on its callthis report.
Prompt Corrective Action
The federal banking regulators are required to take prompt corrective action with respect to capital-deficient institutions. Agency regulations define, for each capital category, the levels at which institutions are well-capitalized, adequately capitalized, undercapitalized, significantly undercapitalized, or critically undercapitalized. An institution may be downgraded to, or deemed to be in, a capital category that is lower than indicated by its capital ratios if the appropriate federal regulators determine that it is engaging in an unsafe or unsound practice or is in an unsafe or unsound condition. A bank’s capital category is determined solely for applying prompt corrective action regulations, and the capital category may not constitute an accurate representation of the bank’s financial condition or prospects for other purposes.
The Bank was classified as well-capitalized under prompt corrective action regulations as of December 31, 2020.2021. In order to be considered a well-capitalized institution under Basel III Capital Rules, an organization must not be subject to any written agreement, order, capital directive, or prompt corrective action directive and must maintain the following minimum capital ratios:
● | 6.5% CET1 to risk-weighted assets |
● | 8.0% Tier 1 capital to risk-weighted assets |
● | 10.0% Total capital to risk-weighted assets |
● | 5.0% Tier 1 leverage ratio |
Undercapitalized institutions are required to submit a capital restoration plan to federal banking regulators. Under the Federal Deposit Insurance Act, as amended (“FDIA”), in order for the capital restoration plan to be accepted by the appropriate federal banking agency, a bank holding company must provide appropriate assurances of performance and guarantee that its subsidiary bank will comply with its capital restoration plan, subject to certain limitations. Agency regulations contain broad restrictions on certain activities of undercapitalized institutions, including asset growth, acquisitions, establishing branches, and engaging in new lines of business. With certain exceptions, a depository institution is prohibited from making capital distributions, including dividends, and is prohibited from paying management fees to its parent holding company if the institution would be undercapitalized after such distribution or payment.
A significantly undercapitalized institution is subject to various requirements and restrictions, including orders to sell sufficient voting stock to become adequately capitalized, requirements to reduce total assets, and ending deposits from correspondent banks. The FDIC has limited discretion in dealing with a critically undercapitalized institution and is generally required to appoint a receiver or conservator.
Safety and Soundness Standards
Guidelines adopted by federal bank regulatory agencies establish general standards relating to internal controls and information systems, internal audit systems, loan documentation, credit underwriting, interest rate exposure, asset growth, and compensation fees and benefits.compensation. In general, the guidelines require, among other things, appropriate systems and practices to identify and manage risks and exposures. If an institution fails to meet safety and soundness standards, the regulatory agencies may require the institution to submit a written compliance plan describing the steps they would take to correct the situation and the time that such steps would be taken. If an institution fails to submit or implement an acceptable compliance plan, after being notified, the agency must issue an order directing action to correct the deficiency and may issue an order directing other actions, such as those applicable to undercapitalized institutions under the prompt corrective action provisions of the FDIA. An institution may be subject to judicial proceedings and civil money penalties if it fails to follow such an order.
Payment of Dividends
The Company is a legal entity that is separate and distinct from its subsidiaries. The Company’s principal source of cash flow is derived from dividends paid by the Bank. There are various restrictions by regulatory agencies related to dividends paid by the Bank to the Company and dividends paid by the Company to its shareholders. The payment of dividends by the Company and the Bank may be limited by certain factors, such as requirements to maintain capital above regulatory guideline minimums.
Prior FRB approval is required for the Bank to declare or pay a dividend to the Company if the total of all dividends declared in any given year exceed the total of the Bank’s net profits for that year and its retained profits for the preceding two years, less any required transfers to surplus or to fund the retirement of preferred stock. Dividends paid by the Company to shareholders are subject to oversight by the Federal Reserve. Federal Reserve policy states that bank holding companies generally should pay dividends on common stock only from income available over the past year if prospective earnings retention is consistent with the organization’s expected future needs, asset quality, and financial condition.
Regulatory agencies have the authority to limit or prohibit the Company and the Bank from paying dividends if the payments are deemed to constitute an unsafe or unsound practice. The appropriate regulatory authorities have stated that paying dividends that deplete a bank’s capital base to an inadequate level would be an unsafe and unsound banking practice and that banking organizations should generally pay dividends only from current operating earnings. In addition, the Bank may not declare or pay a dividend if, after paying the dividend, the Bank would be classified as undercapitalized. In the current financial and economic environment, the FRB has discouraged payout ratios that are at maximum allowable levels, unless both asset quality and capital are very strong, and has noted that bank holding companies should carefully review their dividend policy. Bank holding companies should not maintain dividend levels that undermine their ability to be a source of strength to their banking subsidiaries.
Source of Strength
Federal Reserve policy and federal law requires the Company to act as a source of financial and managerial strength to the Bank. Under this requirement, the Company is expected to commit resources to support the Bank even when it may not be in a financial position to provide such resources. Because the Company is a legal entity separate and distinct from its subsidiaries, any capital loans it makes to the Bank are subordinate in right of payment to depositors and to certain other indebtedness of the Bank. In the event of the Company’s bankruptcy, any commitment by the Company to a federal bank regulatory agency to maintain the capital of the Bank will be assumed by the bankruptcy trustee and entitled to priority of payment.
Transactions with Affiliates
The Federal Reserve Act (“FRA”) and Federal Reserve Regulation W place restrictions on “covered transactions” between the Bank and its affiliates, including the Company. The term “covered transactions” includes making loans, purchasing assets, issuing guarantees, and other similar transactions. The Dodd-Frank Act expanded the definition of “covered transactions” to include derivative activities, repurchase agreements, and securities lending or borrowing activities. These restrictions limit the amount of transactions with affiliates, require certain levels of collateral for loans to affiliates, and require that all transactions with affiliates be on terms that are consistent with safe and sound banking practices. In addition, these transactions must be on terms that are substantially the same, or at least as favorable to the Bank, as those prevailing at the time for similar transactions with non-affiliates.
The FRA and Federal Reserve Regulation O place restrictions on loans between the Company and the Bank and their directors, executive officers, principal shareholders, affiliates, and interests of those directors, executive officers, and principal shareholders. These restrictions limit the amount of loans to one borrower and require that loans are on terms that are substantially the same as, and follow underwriting procedures that are not less stringent than, those prevailing at the time for similar loans with non-insiders. In addition, the aggregate limit of loans to all insiders, as a group, cannot exceed the Bank’s total unimpaired capital and surplus.
Deposit Insurance and Assessments
Substantially all of the Bank’s deposits are insured up to applicable limits by the Deposit Insurance Fund (“DIF”) of the FDIC and are subject to quarterly deposit insurance assessments to maintain the DIF. Deposit insurance premiums are assessed using a risk-based system that places FDIC-insured institutions into one of four risk categories based on capital, supervisory ratings and other factors. The assessment rate determined by considering such information is then applied to the institution's average assets minus average tangible equity to determine the institution's insurance premium. The FDIC may change assessment rates or revise its risk-based assessment system if deemed necessary to maintain an adequate reserve ratio for the DIF. The Dodd-Frank Act required that the minimum reserve ratio for the DIF increase from 1.15% to 1.35% by September 30, 2020. Under the FDIA, the FDIC may terminate deposit insurance if it determines that the institution has engaged in unsafe and unsound practices, is in an unsafe or unsound condition to continue operations, or has violated any applicable law, regulation, rule, order, or condition imposed by the FDIC. The Bank’s FDIC deposit insurance assessments were $426 thousand in 2020, $318 thousand in 2019, and $840 thousand in 2018. The decrease in FDIC assessments in 2019 and 2020 were primarily the result of the receipt of Small Bank Assessment Credits from the FDIC. On September 30, 2018, the Deposit Insurance Fund Reserve Ratio reached 1.36 percent. Because the reserve ratio exceeded 1.35 percent, two deposit insurance assessment changes occurred under the FDIC regulations. Surcharges on large banks, $10 billion or more in consolidated assets, ended; and small banks, less than $10 billion in consolidated assets, were awarded assessment credits for the portion of their assessments that contributed to the growth in the reserve ration from 1.15 percent to 1.35 percent. The credit was applied when the reserve ratio was at least 1.38 percent. The Small Bank Credit was fully utilized by the second quarter of 2020.
In addition, all FDIC-insured institutions were required to pay annual assessments to fund interest payments on bonds issued by the Financing Corporation (“FICO”) through March 29, 2019. The FICO is a mixed-ownership government corporation that was formed to borrow the money necessary to carry out the closing and ultimate disposition of failed thrift institutions by the Resolution Trust Corporation. The Bank’s FICO assessments, which were set quarterly, were $6 thousand in 2019, and $66 thousand in 2018.
The Volcker Rule
The Dodd-Frank Act amended the BHC Act to prohibit depository institutions and their affiliates from engaging in proprietary trading and from investing in, sponsoring, or having certain relationships with hedge funds or private equity funds, known as the Volcker Rule. The Volcker Rule, which became effective in July 2015 and the implementing regulations of which were amended in 2019 and were subject to further amendment in 2020, does not significantly impact the operations of the Company and its subsidiaries, as we do not have any engagement in the businesses prohibited by the Volcker Rule.
Community Reinvestment Act
The CRA of 1977, as amended, requires depository institutions to help meet the credit needs of their market areas, including low- andlow-and moderate-income individuals and communities, consistent with safe and sound banking practices. Federal banking regulators periodically examine depository institutions and assign ratings based on CRA compliance. A rating of less than satisfactory may restrict certain operating activities, delay or deny certain transactions, or result in an institution losing its financial holding company status. The Bank received a rating of satisfactory in its most recent CRA examination.
In December 2019,2021, the Federal Deposit Insurance Corporation (“FDIC”)OCC issued a proposal to rescind its June 2020 CRA rulemaking and replace it with previous rules jointly adopted by the Office of the Comptroller of the Currency (“OCC”) jointly proposed rules that would significantly change existing CRA regulations. The proposed rules are intended to increase bank activity in low- and moderate-income communities where there is significant need for credit, more responsible lending, greater access to banking services, and improvements to critical infrastructure. The proposals change four key areas: (i) clarifying what activities qualify for CRA credit; (ii) updating where activities count for CRA credit; (iii) providing a more transparent and objective method for measuring CRA performance; and (iv) revising CRA-related data collection, record keeping, and reporting. However,OCC, the Federal Reserve Board, the FDIC, and the former Office of Thrift Supervision in 1995. Last year, although the OCC and the FDIC published a joint notice of proposed rulemaking, the FDIC did not ultimately join with the OCC in that proposedthe June 2020 CRA rulemaking. In May 2020,an interagency statement, the OCC, issued its final CRA rule, effective October 1, 2020. The FDIC has not finalized the revisions to its CRA rule. In September 2020, the Federal Reserve Board, issued an Advance Noticeand the FDIC indicated their commitment to work together on developing a joint notice of Proposed Rulemaking (“ANPR”) that invites public comment on an approachproposed CRA rulemaking to modernize the regulations that implement the CRA by strengthening, clarifying, and tailoring themensure a modernized framework exists for insured depository institutions to reflect the current banking landscape and better“help meet the core purposecredit needs of the CRA. The ANPR seeks feedback on ways to evaluate how banks meet the needs ofcommunities in which they do business, including low- and moderate-income communities and address inequities in credit access.neighborhoods.” As such, we will continue to evaluate the impact of any changes to the regulations implementing the CRA and their impact to our financial condition, results of operations, and/or liquidity, which cannot be predicted at this time.
Incentive Compensation
Federal regulatory agencies have issued comprehensive guidance intended to ensure that the incentive compensation policies of banking organizations do not undermine the safety and soundness of such organizations by encouraging excessive risk-taking. The guidance is based on the key principles that a banking organization’s incentive compensation arrangements should (1) provide incentives that do not encourage risk taking beyond the organization’s ability to effectively identify and manage risks, (2) be compatible with effective internal controls and risk management, and (3) be supported by strong corporate governance, including active and effective oversight by the organization’s board of directors.
Federal banking regulators periodically examine the incentive compensation arrangements of banking organizations and incorporate any deficiencies in the organization’s supervisory ratings, which can affect certain operating activities. The FRB may initiate enforcement actions if the organization’s incentive compensation arrangements or related risk management, control, or governance processes pose a risk to the organization’s safety and soundness and the organization is not taking prompt and effective measures to correct the deficiencies. The scope and content of the U.S. banking regulators’ policies on incentive compensation are continuing to develop. It cannot be determined at this time if or when a final rule will be adopted or if compliance with such a final rule will adversely affect the ability of the Company and its subsidiaries to hire, retain and motivate their key employees.
Anti-Tying Restrictions
The Bank and its affiliates are prohibited from tying the provision of certain services, such as extensions of credit, to other services offered by the Company.
Consumer Protection and Privacy
We are subject to certain consumer laws and regulations that are designed to protect consumers in transactions with banks. These laws and regulations include the Mortgage Reform and Anti-Predatory Lending Act, the Truth in Lending Act, the Truth in Savings Act, the Home Mortgage Disclosure Act, the Electronic Funds Transfer Act, the Expedited Funds Availability Act, the Equal Credit Opportunity Act, the Fair Credit Reporting Act, the Fair Debt Collections Act, the Right to Financial Privacy Act, the Fair Housing Act, and various state law counterparts. These laws and regulations contain extensive customer privacy protection provisions that limit the ability of financial institutions to disclose non-public information about consumers to non-affiliated third parties and require financial institutions to disclose certain policies to consumers.
The Consumer Financial Protection Bureau (“CFPB”) is a federal agency with broad authority to implement, examine, and enforce compliance with federal consumer protection laws that relate to credit card, deposit, mortgage, and other consumer financial products and services. The CFPB may enforce actions to prevent and remedy unfair, deceptive, or abusive acts and practices related to consumer financial products and services. The agency has authority to impose new disclosure requirements for any consumer financial product or service. The CFPB may impose a civil penalty or injunction against an entity in violation of federal consumer financial laws. The CFPB has examination and enforcement authority over all banks with more than $10 billion in assets, as well as their affiliates. As a bank with less than $10 billion in assets, the Bank is subject to these federal consumer financial laws, but continues to be examined for compliance by the Federal Reserve, its primary federal banking regulator, not the CFPB.
Cybersecurity
In March 2015, federal regulators issued two related statementsFebruary 2018, the SEC published interpretive guidance to assist public companies in preparing disclosures about cybersecurity. One statement indicates that financial institutions should design multiple layers of security controls to establish lines of defensecybersecurity risks and to ensure that their risk management processes also address the risk posed by compromised customer credentials, including security measures to reliably authenticate customers accessing internet-based services of the financial institution. Theincidents. These SEC guidelines, and any other statement indicates that a financial institution’s management is expected to maintain sufficient business continuity planning processes to ensure the rapid recovery, resumption, and maintenance of the institution’s operations after a cyberattack involving destructive malware. A financial institution is also expected to develop appropriate processes to enable recovery of data and business operations and address rebuilding network capabilities and restoring data if the institution or its critical service providers fall victim to this type of cyberattack. If the Bank fails to observe the regulatory guidance, the Bank could be subjectare in addition to various regulatory sanctions, including financial penalties.notification and disclosure requirements under state and federal banking law and regulations.
In October 2016, the federal banking regulators jointly issued an advance notice of proposed rulemaking on enhanced cyber risk management standards that are intended to increase the operational resilience of large and interconnected entities under their supervision. If established, the enhanced cyber risk management standards would be designed to help reduce the potential impact of a cyber-attack or other cyber-related failure on the financial system. The advance notice of proposed rulemaking addresses five categories of cyber standards: (i) cyber risk governance; (ii) cyber risk management; (iii) internal dependency management; (iv) external dependency management; and (v) incident response, cyber resilience, and situational awareness. In May 2019, the Federal Reserve announced that it would revisit the Advance Notice of Proposed Rulemaking in the future. In December 2020,November 2021, the federal banking agencies issued a Notice of Proposed Rulemakingfinal rule that would requirerequires banking organizations to notify their primary regulator within 36 hours of becoming aware of a “computer-security incident” orthat rises to the level of a “notification incident.” The Notice of Proposed Rulemakingrule also would requirerequires specific and immediate notifications by bank service providers that become aware of similar incidents.
The federal banking regulators regularly issue new guidance and standards, and update existing guidance and standards, regarding cybersecurity intended to enhance cyber risk management among financial institutions. Financial institutions are expected to comply with such guidance and standards and to accordingly develop appropriate security controls and risk management processes. If we fail to observe such regulatory guidance or standards, we could be subject to various regulatory sanctions, including financial penalties. Our employees particpate in regular company-sponsored training about cyber risks and cybersecurity. We feel this is part of a sound cyber risk management program, but can be no assurance that we will not be the victim of a cyberattack.
Bank Secrecy Act and Anti-Money Laundering
The Bank is subject to the requirements of the Bank Secrecy Act and the Uniting and Strengthening America by Providing Appropriate Tools Required to Intercept and Obstruct Terrorism Act (“USA PATRIOT Act”) of 2001. The USA PATRIOT Act broadened existing anti-money laundering legislation by imposing new compliance and due diligence obligations focused on detecting and reporting money laundering transactions. These laws and regulations require the Bank to implement policies, procedures, and controls to detect, prevent, and report money laundering and terrorist financing and to verify the identity of our customers. Violations can result in substantial civil and criminal sanctions. In addition, provisions of the USA PATRIOT Act require the federal financial regulatory agencies to consider the effectiveness of a financial institution's anti-money laundering activities when reviewing mergers and acquisitions.
The Anti-Money Laundering Act of 2020 (“AMLA”), which amends the Bank Secrecy Act of 1970 (“BSA”), was enacted in January 2021. The AMLA is intended to be a comprehensive reform and modernization to U.S. bank secrecy and anti-money laundering laws. Among other things, it codifies a risk-based approach to anti-money laundering compliance for financial institutions; requires the development of standards for evaluating technology and internal processes for BSA compliance; expands enforcement- and investigation-related authority, including increasing available sanctions for certain BSA violations and instituting BSA whistleblower incentives and protections.
Office of Foreign Assets Control Regulation
The U.S. Department of the Treasury’s (“Treasury”) Office of Foreign Assets Control (“OFAC”) administers and enforces economic and trade sanctions against targeted foreign countries and regimes, under authority of various laws, including designated foreign countries, nationals, and others. OFAC publishes lists of specially designated targets and countries. We are responsible for, among other things, blocking accounts of, and transactions with, such targets and countries, prohibiting unlicensed trade and financial transactions with them, and reporting blocked transactions after their occurrence. Failure to comply with these sanctions could have serious legal, financial, and reputational consequences, including causing applicable bank regulatory authorities to not approve merger or acquisition transactions when regulatory approval is required or to prohibit such transactions even if approval is not required.
Sarbanes-Oxley Act
The Sarbanes-Oxley Act (“SOX Act”) of 2002 addresses a broad range of corporate governance, auditing and accounting, executive compensation, and disclosure requirements for public companies and their directors and officers. The SOX Act requires our Chief Executive Officer and Chief Financial Officer to certify the accuracy of certain information included in our quarterly and annual reports. The rules require these officers to certify that they are responsible for establishing, maintaining, and regularly evaluating the effectiveness of our financial reporting and disclosure controls and procedures; that they have made certain disclosures to the auditors and to the Audit Committee of the Board of Directors about our controls and procedures; and that they have included information in their quarterly and annual filings about their evaluation and whether there have been significant changes to the controls and procedures or other factors which would significantly impact these controls subsequent to their evaluation. Section 404 of the SOX Act requires management to undertake an assessment of the adequacy and effectiveness of our internal controls over financial reporting and requires our auditors to attest to and report on the effectiveness of these controls.
Available Information
We file annual, quarterly, and current reports; proxy statements; and other information with the SEC. You may read and copy any document we file with the SEC at the SEC’s website at www.sec.gov that contains reports, proxy and information statements, and other information that issuers file electronically with the SEC. We maintain a website at www.firstcommunitybank.com that makes available, free of charge, our Annual Reports on Form 10-K, Quarterly Reports on Form 10-Q, Current Reports on Form 8-K, and other information, including any amendments to those reports as soon as reasonably practicable after such reports are filed with, or furnished to, the SEC. You are encouraged to access these reports and other information about our business from the Investor Relations section of our website. The Investor Relations section contains information about our Board of Directors, executive officers, and corporate governance policies and principles, which include the charters of the standing committees of the Board of Directors, the Insider Trading Policy, and the Standards of Conduct governing our directors, officers, and employees. Information on our website is not incorporated by reference in this report.
Risk Factors. |
The risk factors described below discuss potential events, trends, or other circumstances that could adversely affect our business, financial condition, results of operations, cash flows, liquidity, access to capital resources, and, consequently, cause the market value of our common stock to decline. These risks could cause our future results to differ materially from historical results and expectations of future financial performance. If any of the risks occur and the market price of our common stock declines significantly, individuals may lose all, or part, of their investment in our Company. Individuals should carefully consider our risk factors and information included, or incorporated by reference, in this report before making an investment decision. There may be risks and uncertainties that we have not identified or that we have deemed immaterial that could adversely affect our business; therefore, the following risk factors are not intended to be an exhaustive list of all risks we face.
Risks Related to the Economic Environment
The COVID-19 pandemic hasand government responses to the pandemic have adversely affected our business, financial condition and results of operations, and the ultimate impacts of the pandemic on our business, financial condition and results of operations will depend on future developments and other factors that are highly uncertain and will be impacted by the scope and duration of the pandemic and actions taken by governmental authorities in response to the pandemic.
The ongoing COVID-19 global and national health emergency has caused significant disruption in the international and United States economies and financial markets and has had an adverse effect on our business, financial condition and results of operations. The spread of COVID-19 has caused illness, quarantines, cancellation of events and travel, business and school shutdowns, reduction in business activity and financial transactions, supply chain interruptions and overall economic and financial market instability. In
Although financial markets have largely rebounded from the governmentssignificant declines that occurred earlier in the pandemic and global economic conditions showed signs of improvement, many of the states in which we have branches and of most other states have taken preventativecircumstances that arose or protective actions, such as imposing restrictions on travel and business operations, advising or requiring individuals to limit or forego their time outside of their homes, and ordering temporary closures of businesses that have been deemed to be non-essential. These restrictions and other consequencesbecame more pronounced after the onset of the pandemic have resulted in significant adverse effects for many different types of businesses, including, among others, those in the travel, hospitality and food and beverage industries, and have resulted in a significant number of layoffs and furloughs of employees nationwide and in the regions in which we operate.
The ultimate effects of the COVID-19 pandemic on the broader economy and the markets that we serve are not known nor is the ultimate length of the restrictions described above and any accompanying effects. Moreover, the Federal Reserve has taken action to lower the Federal Funds rate, which may negatively affect our interest income and, therefore, earnings, financial condition and results of operation. This may include, or exacerbate, among other consequences, the following:
persist, including:
| ● | employees contracting COVID-19; |
| ● | reductions in our operating effectiveness as our employees work from home; |
| ● | increased cybersecurity risk due to the continuation of the work-from-home measures; |
| ● | a work stoppage, forced quarantine, or other interruption of our business; |
| ● | unavailability of key personnel necessary to conduct our business activities; |
| ● | effects on key employees, including operational management personnel and those charged with preparing, monitoring and evaluating our financial reporting and internal controls; |
| ● | sustained closures of our branch lobbies or the offices of our customers; |
| ● | declines in demand for loans and other banking services and products; |
| ● | reduced consumer spending due to both job losses and other effects attributable to the COVID-19 pandemic; |
| ● | unprecedented volatility in United States financial markets; |
| ● | volatile performance of our investment securities portfolio; |
| ● |
|
| declines in value of collateral for loans, including real estate collateral; |
| ● | declines in the net worth and liquidity of borrowers and loan guarantors, impairing their ability to honor commitments to us; and |
| ● | declines in demand resulting from businesses being deemed to be “non-essential” by governments in the markets we serve, and from “non-essential” and “essential” businesses suffering adverse effects from reduced levels of economic activity in our markets. |
These factors, together or in combination with other events or occurrences that may not yet be known or anticipated, may materially and adversely affect our business, financial condition and results of operations.
The further spread of the COVID-19 outbreak, as well as ongoing or new governmental, regulatory and private sector responses to the pandemic, may materially disrupt banking and other economic activity generally and in the areas in which we operate. This could result in further decline in demand for our banking products and services, and could negatively impact, among other things, our liquidity, regulatory capital and our growth strategy. Any one or more of these developments could have a material adverse effect on our business, financial condition and results of operations.
We are taking precautions to protect the safety and well-being of our employees and customers. However, no assurance can be given that the steps being taken will be adequate or deemed to be appropriate, nor can we predict the level of disruption which will occur to our employee’s ability to provide customer support and service. If we are unable to recover from a business disruption on a timely basis, our business, financial condition and results of operations could be materially and adversely affected. We may also incur additional costs to remedy damages caused by such disruptions, which could further adversely affect our business, financial condition and results of operations.
The current economic environment poses significant challenges.
Our financial performance is generally highly dependent on the business environment in the markets we operate in and of the U.S. as a whole, which includes the ability of borrowers to pay interest, repay principal on outstanding loans, the value of collateral securing those loans, and demand for loans and other products and services we offer. A favorable business environment is generally characterized by, among other factors, economic growth, efficient capital markets, low inflation, low unemployment, high business and investor confidence, and strong business earnings. Unfavorable or uncertain economic and market conditions can be caused by declines in economic growth, business activity, and investor or business confidence; limitations on the availability, or increases, in the cost of credit and capital; increases in inflation, interest rates, or interest rates;employee costs; high unemployment; natural disasters; or a combination of these or other factors.
In recent years, economic growth and business activity across a wide range of industries has been slow and uneven. There are continuing concerns related to the level of U.S. government debt, fiscal actions that may be taken to address that debt, energy price volatility, global economic conditions, and significant uncertainty with respect to domestic and international fiscal and monetary policy. Economic and inflationary pressure on consumers and uncertainty about continuing economic improvement may result in changes in consumer and business spending, borrowing, and savings habits. There can be no assurance that these conditions will improve or that these conditions will not worsen. Such conditions could adversely affect the credit quality of the Bank’s loans and the Company’s business, financial condition, and results of operations.
As a participating lender in the SBA Paycheck Protection Program (“PPP”), the Company and the Bank are subject to additional risks of litigation from the Bank’s customers or other parties regarding the Bank’s processing of loans for the PPP and risks that the SBA may not fund some or all PPP loan guaranties.
On March 27, 2020, President Trump signed the CARES Act, which included a $349 billion loan program administered through the SBA referred to as the PPP. Under the PPP, small businesses and other entities and individuals can applyapplied for loans from existing SBA lenders and other approved regulated lenders that enrollenrolled in the program, subject to numerous limitations and eligibility criteria. The Bank is participatingparticipated as a lender in the PPP. The PPP opened on April 3, 2020 and on or about April 16, 2020, the SBA notified lenders that the $349 billion earmarked for the PPP was exhausted. Congress approved additional funding for the PPP of approximately $320 billion on April 24, 2020. As part of the Economic Aid to Hard-Hit Small Businesses, Nonprofits, and Venues Act (Economic Aid Act) enacted on December 27, 2020, in January, 2021, the SBA released applications for the second round of PPP loans for second draw loans for borrowers who received funding in the first round and first draw loans to first time borrowers. As of December 31, 2020,2021, we have funded approximately 8031,429 loans with original principal balances totaling $62.74$92.58 million through the PPP program. Through December 31, 2020 $3.942021 $56.86 million, or 6.46%93.20%, of the Company’s Paycheck Protection ProgramCompany's first round PPP loan balances had been forgiven by the SBA. Current PPP loan balances at December 31, 2021, which include second round originations, were $20.64 million.
Since the opening of the PPP, several other larger banks have been subject to litigation regarding the process and procedures that such banks used in processing applications for the PPP. The Company and the Bank may be exposed to the risk of litigation, from both customers and non-customers who approached the Bank regarding PPP loans, regarding its process and procedures used in processing applications for the PPP. If any such litigation is filed against the Company or the Bank and is not resolved in a manner favorable to the Company or the Bank, it may result in significant financial liability or adversely affect the Company’s reputation. In addition, litigation can be costly, regardless of outcome. Any financial liability, litigation costs or reputational damage caused by PPP related litigation could have a material adverse impact on our business, financial condition and results of operations.
The Bank also has credit risk on PPP loans if a determination is made by the SBA that there is a deficiency in the manner in which the loan was originated, funded, or serviced by the Bank, such as an issue with the eligibility of a borrower to receive a PPP loan, which may or may not be related to the ambiguity in the laws, rules and guidance regarding the operation of the PPP. In the event of a loss resulting from a default on a PPP loan and a determination by the SBA that there was a deficiency in the manner in which the PPP loan was originated, funded, or serviced by the Company, the SBA may deny its liability under the guaranty, reduce the amount of the guaranty, or, if it has already paid under the guaranty, seek recovery of any loss related to the deficiency from the Company.
Additionally, if a borrower under the PPP loan fails to qualify for loan forgiveness, the Bank is at the heightened risk of holding the loan at an unfavorable interest rate as compared to loans to customers that the Bank would have otherwise extended credit. Rules providing for forgiveness have been constantly evolving, including an automatic forgiveness if the amount of the PPP loan was not larger than a specified floor.
Regulatory Risks
We operate in a highly regulated industry subject to examination, supervision, enforcement, and other legal actions by various federal and state governmental authorities, laws, and judicial and administrative decisions.
Congress and federal regulatory agencies continually review banking laws, regulations, and policies. Changes to these statutes, regulations, and regulatory policies, including changes in the interpretation or implementation, may cause substantial and unpredictable effects, require additional costs, limit the types of financial services and products offered, or allow non-banks to offer competing financial services and products. Failure to follow laws, regulations, and policies may result in sanctions by regulatory agencies and civil money penalties, which could have material adverse effects on our reputation, business, financial condition, and results of operations. We have policies and procedures designed to prevent violations; however, there is no assurance that violations will not occur. Existing and future laws, regulations, and policies yet to be adopted may make compliance more difficult or expensive; restrict our ability to originate, broker, or sell loans; further limit or restrict commissions, interest, and other charges earned on loans we originate or sell; and adversely affect our business, financial condition, and results of operations.
The Bank’s ability to pay dividends is subject to regulatory limitations that may affect the Company’s ability to pay expenses and dividends to shareholders.
The Company is a legal entity that is separate and distinct from its subsidiaries. The Company depends on the Bank and its other subsidiaries for cash, liquidity, and the payment of dividends to the Company to pay operating expenses and dividends to stockholders. There is no assurance that the Bank will have the capacity to pay dividends to the Company in the future or that the Company will not require dividends from the Bank to satisfy obligations. The Bank’s dividend payment is governed by various statutes and regulations. For additional information, see “Payment of Dividends” in Item 1 of this report. The Company may not be able to service obligations as they become due if the Bank is unable to pay dividends sufficient to satisfy the Company’s obligations, including our common stock. Consequently, the inability to receive dividends from the Bank could adversely affect the Company’s financial condition, results of operations, cash flows, and prospects.
Market and Interest Rate Risk
We are subject to interest rate risk.
Interest rate risk results principally when interest-earning assets and interest-bearing liabilities reprice at differing times, when underlying rates change at different levels or in varying degrees, when there is an unequal change in the spread between two or more rates for different maturities, and when embedded options, if any, are exercised. Our earnings and cash flows are largely dependent upon net interest income. Interest rates are highly sensitive to many factors that are beyond our control, including general economic conditions and policies of various governmental and regulatory agencies, particularly, the Federal Reserve. Changes in monetary policy and interest rates could influence the interest we receive on loans and securities and the amount of interest we pay on deposits and borrowings. Further, such changes could also affect our ability to originate loans and obtain deposits and the fair value of our financial assets and liabilities. If the interest rates paid on deposits and other borrowings increase at a faster rate than the interest rates received on loans and other investments, our net interest income and earnings could be adversely affected. Conversely, if interest rates received on loans and other investments fall more quickly than interest rates paid on deposits and other borrowings, our net interest income and earnings could also be adversely affected.
Uncertainty relating to LIBOR calculation process and potentialthe phasing out of LIBOR may adversely affect us.
The London Interbank Offered Rate (“LIBOR”) and certain other “benchmarks” are the subject of recent national, international, and other regulatory guidance and proposals for reform. These reforms may cause such benchmarks to perform differently than in the past or have other consequences, which cannot be predicted. On July 27, 2017, the Chief Executive of the United KingdomKingdom’s Financial Conduct Authority (“FCA”), which regulates the London InterBank Offered Rate (“LIBOR” the benchmark interest rate at which major global banks lend to one another in the international interbank market for short-term loans),LIBOR, publicly announced that it intends to stop persuading or compelling banks to submit rates for the calibration of LIBOR to the administrator of LIBORrates after 2021. Subsequently,Since then, regulators, industry groups and certain committees (e.g., the Federal Reserve Board announced final plansAlternative Reference Rates Committee) have, among other things, published recommended fall-back language for the production ofLIBOR-linked financial instruments, identified recommended alternatives for certain LIBOR rates (e.g., the Secured Overnight Financing Rate (SOFR)as the recommended alternative to U.S. Dollar LIBOR), which resulted in the commencement of its published rates by the Federal Reserve Bank of New York on April 3, 2018. Whether or not SOFR attains market traction as a LIBOR replacement tool remains in question and the future of LIBOR at this time is uncertain. The announcement indicates that the continuation of LIBOR on the current basis cannot and will not be guaranteed after 2021. It is impossible to predict whether and to what extent banks will continue to provide LIBOR submissions to the administrator of LIBOR or whether any additional reforms to LIBOR may be enacted in the United Kingdom or elsewhere. At this time, no consensus exists as to what rate or rates may become acceptable alternatives to LIBOR and it is impossible to predict the effect of any such alternatives on the value of LIBOR-based securities and variable rate loans, debentures, or other securities or financial arrangements, given LIBOR’s role in determining market interest rates globally. Uncertainty as to the nature of alternative reference rates and as to potential changes or other reforms to LIBOR may adversely affect LIBOR rates and the value of LIBOR-based loans and securities in our portfolio and may impact the availability and cost of hedging instruments and borrowings. If LIBOR rates are no longer available, and we are required to implement substitute indices for the calculation of interest rates under our loan agreements with our borrowers, we may incur significant expenses in effecting the transition, and may be subject to disputes or litigation with customers over the appropriateness or comparability to LIBORproposed implementations of the substitute indices, which could have a material adverse effect on our financial condition or results of operations.recommended alternatives in floating rate instruments. On November 30, 2020, ICE Benchmark Administration Limited (“IBA”), the benchmark administrator offor the U.S. Dollar (“USD”) LIBOR announced that it will consult on its intentiona proposal to ceaseextend the publication of the one week and two monthmost commonly used USD LIBOR settings immediately followinguntil June 30, 2023.
The administrator for LIBOR announced on March 5, 2021 that it will permanently cease to publish most LIBOR settings beginning on January 1, 2022 and cease to publish the overnight, one-month, three-month, six-month and 12-month USD LIBOR publicationsettings on July 1, 2023. Accordingly, the FCA has stated that is does not intend to persuade or compel banks to submit to LIBOR after such respective dates. Until such time, however, FCA panel banks have agreed to continue to support LIBOR.
Banking regulators issued guidance strongly encouraging banks to cease entering into new contracts that use USD LIBOR as a reference rate as soon as practicable and in any event by December 31, 2021,2021. There can be no assurances on which benchmark rate(s) may replace LIBOR or how LIBOR will be determined for purposes of financial instruments that are currently referencing LIBOR when it ceases to exist. The discontinuance of LIBOR may result in uncertainty or differences in the calculation of the applicable interest rate or payment amount depending on the terms of the governing documents, may adversely affect the value of our floating rate obligations, loans, deposits, derivatives, and other financial instruments tied to LIBOR rates and may also increase operational and other risks to the Company and the remainingindustry.
In addition, the implementation of LIBOR settings immediately following thereform proposals may result in increased compliance costs and operational costs, including costs related to continued participation in LIBOR publication on June 30, 2023. The outcome of such consultation and its impact on LIBOR could materially affect the economics as well as the timing of the transition away from LIBOR.
to a replacement reference rate or rates. We cannot reasonably estimate the expected cost.
Changes in the fair value of our investment securities may reduce stockholders’ equity and net income.
A decline in the estimated fair value of the investment portfolio may result in a decline in stockholders’ equity, book value per common share, and tangible book value per common share. Unrealized losses are recorded even though the securities are not sold or held for sale. If a debt security is never sold and no credit impairment exists, the decrease is recovered at the security’s maturity. Equity securities have no stated maturity; therefore, declines in fair value may or may not be recovered over time. We conduct quarterly reviews of our securities portfolio to determine if unrealized losses are temporary or other than temporary. No assurance can be given that we will not need to recognize other-than-temporary impairment (“OTTI”) charges in the future. Additional OTTI charges may materially affect our financial condition and earnings. For additional information, see Note 1, “Basis of Presentation and Accounting Policies,” and Note 3, “Debt Securities,” to the Consolidated Financial Statements in Part II, Item 8 of this report.
The repeal of the federal prohibitions on payment of interest on demand deposits could increase our interest expense.
All federal prohibitions on the ability of financial institutions to pay interest on demand deposit accounts were repealed as part of the Dodd-Frank Act. We do not know what interest rates other institutions may offer as market interest rates begin to increase. Our interest expense will increase and net interest margin will decrease if we offer interest on demand deposits to attract additional customers or maintain current customers, which could have a material adverse effect on our business, financial condition, and results of operations.
Credit Risk
Our accounting estimates and risk management processes rely on analytical and forecasting models.
The processes we use to estimate probable loan losses and to measure the fair value of financial instruments, as well as the processes used to estimate the effects of changing interest rates and other market measures on our financial condition and results of operations, depend upon analytical and forecasting models. These models reflect assumptions that may not be accurate, particularly in times of market stress or other unforeseen circumstances. Even if these assumptions are adequate, the models may prove to be inadequate or inaccurate because of other flaws in their design or their implementation. If the models we use for interest rate risk and asset/liability management are inadequate, we may incur increased or unexpected losses upon changes in market interest rates or other market measures. If the models used for determining probable loan losses are inadequate, the allowance for loancredit losses may not be sufficient to cover actual loan losses and an increase in the loan loss provision could materially and adversely affect our operating results. Federal regulatory agencies regularly review our loans and allowance for loancredit losses as an integral part of the examination process. There is no assurance that we will not, or that regulators will not require us to, increase our allowance in future periods, which could materially and adversely affect our earnings and profitability. If the models we use to measure the fair value of financial instruments are inadequate, the fair value of such financial instruments may fluctuate unexpectedly or may not accurately reflect what we could realize upon the sale or settlement of such financial instruments. Any such failure in our analytical or forecasting models could have a material adverse effect on our business, financial condition, and results of operations. For additional information, see "Fair Value Measurements" and "Allowance for LoanCredit Losses" in the "Critical Accounting Policies" section in Part II, Item 7 and Note 1, "Basis of Presentation and Accounting Policies," to the Consolidated Financial Statements in Part II, Item 8 of this report.
We are subject to credit risk associated with the financial condition of other financial institutions
Credit risk is the risk of not collecting payments pursuant to the contractual terms of loans, leases and investment securities. Financial institutions are interrelated as a result of trading, clearing, counterparty, and other relationships. We have exposure to different industries and counterparties, and we routinely execute transactions with counterparties in the financial services industry, including brokers and dealers, commercial banks, investment banks, investment companies, and other institutional clients. Our ability to engage in routine funding transactions could be adversely affected by the failure, actions, and commercial soundness of other financial institutions. These transactions may expose us to credit risk if our counterparty or client defaults on their contractual obligation. Our credit risk may increase if the collateral we hold cannot be realized or liquidated at prices sufficient to recover the full amount of the loan or derivative exposure due to us. In the event of default, we may be required to provide collateral to secure the obligation to the counterparties. In the event of a bankruptcy or insolvency proceeding involving one of such counterparties, we may experience delays in recovering the assets posted as collateral or may incur a loss to the extent that the counterparty was holding collateral in excess of the obligation to such counterparty. Losses from routine funding transactions could have a material adverse effect on our financial condition and results of operations.
Our commercial loan portfolio may expose us to increased credit risk.
Commercial business and real estate loans generally have a higher risk of loss because loan balances are typically larger than residential real estate and consumer loans and repayment is usually dependent on cash flows from the borrower’s business or the property securing the loan. Our commercial business loans are primarily made to small business and middle market customers. As of December 31, 2020,2021, commercial business and real estate loans totaledtotaled$1.03 $1.11 billion, or 47.64%,50.84%, of our total loan portfolio. As of the same date, our largest outstanding commercial business loan was $5.72 million $5.37 million and largest outstanding commercial real estate loan was $9.73 million. $15.94 million. Commercial construction loans generally have a higher risk of loss due to the assumptions used to estimate the value of property at completion and the cost of the project, including interest. If the assumptions and estimates are inaccurate, the value of completed property may fall below the related loan amount. As of December 31, 2020,2021, commercial construction loans totaled $44.65 totaled$65.81 million, or 2.04% o3f.04% of our total loan portfolio. As of the same date, our largest outstanding commercial construction loan was $4.51 million. $3.46 million. Losses from our commercial loan portfolio could have a material adverse effect on our financial condition and results of operations.
Operational Risks
We face strong competition from other financial institutions, financial service companies, and organizations that offer services similar to our offerings.
Our larger competitors may have substantially greater resources and lending limits, name recognition, and market presence that allow them to offer products and services that we do not offer and to price loans and deposits more aggressively than we do. The expansion of non-bank competitors, which may have fewer regulatory constraints and lower cost structures, has intensified competitive pressures on core deposit generation and retention. For additional information, see "Competition" in Item 1 of this report. Our success depends, in part, on our ability to attract and retain customers by adapting our products and services to evolving customer needs and industry and economic conditions. Failure to perform in any of these areas could weaken our competitive position, reduce deposits and loan originations, and adversely affect our financial condition, results of operations, cash flows, and prospects.
Liquidity risk could impair our ability to fund operations.
Liquidity is essential to our business and the inability to raise funds through deposits, borrowings, equity and debt offerings, or other sources could have a materially adverse effect on our liquidity. Company specific factors such as a decline in our credit rating, an increase in the cost of capital from financial capital markets, a decrease in business activity due to adverse regulatory action or other company specific event, or a decrease in depositor or investor confidence may impair our access to funding with acceptable terms adequate to finance our activities. General factors related to the financial services industry such as a severe disruption in financial markets, a decrease in industry expectations, or a decrease in business activity due to political or environmental events may impair our access to liquidity.
We may require additional capital in the future that may not be available when needed.
We may need to raise additional capital to strengthen our capital position, increase our liquidity, satisfy obligations, or pursue growth objectives. Our ability to raise additional capital depends on current conditions in capital markets, which are outside our control, and our financial performance. Certain economic conditions and declining market confidence may increase our cost of funds and limit our access to customary sources of capital, such as borrowings with other financial institutions, repurchase agreements, and availability under the FRB’s Discount Window. Events that limit access to capital markets and the inability to obtain capital may have a materially adverse effect on our business, financial condition, results of operations, and market value of common stock. We cannot provide any assurance that additional capital will be available, on acceptable terms or at all, in the future.
We test goodwill for impairment annually, or more frequently if events or circumstances indicate there may be impairment, using either a quantitative or qualitative assessment. If we determine that the carrying amount of a reporting unit is greater than its fair value, a goodwill impairment charge is recognized for the difference, but limited to the amount of goodwill allocated to that reporting unit. Unfavorable or uncertain economic and market conditions may trigger additional impairment charges that may cause an adverse effect on our earnings and financial position. For additional information, see “Goodwill and Other Intangible Assets” in the “Critical Accounting Policies” section in Part II, Item 7 and Note 1, “Basis of Presentation and Accounting Policies,” and Note 9,8, “Goodwill and Other Intangible Assets,” to the Consolidated Financial Statements in Part II, Item 8 of this report.
We are subject to certain obligations under FDIC loss share agreements that specify how to manage, service, report, and request reimbursement for losses incurred on covered assets.
Our ability to receive benefits under FDIC loss share agreements is subject to compliance with certain requirements, oversight and interpretation, and contractual term limitations. Our obligations under loss share agreements are extensive, and failure to follow any obligations could result in a specific asset, or group of assets, losing loss share coverage. Reimbursement requests are subject to FDIC review and may be delayed or disallowed if we do not comply with our obligations. Losses projected to occur during the loss share term may not be realized until after the expiration of the applicable agreement; consequently, those losses may have a material adverse impact on our results of operations. Our current loss estimates only include those projected to occur during the loss share period and for which we expect reimbursement from the FDIC at the applicable reimbursement rate. We are subject to FDIC audits to ensure compliance with the loss share agreements. The loss share agreements are subject to interpretation by the FDIC and us; therefore, disagreements about the coverage of losses, expenses, and contingencies may arise. The realization of benefits to be received from the FDIC ultimately depends on the performance of the underlying covered assets, the passage of time, claims paid by the FDIC, and interpretation; therefore, the amount received could differ materially from the carrying value of expected reimbursements and have a material effect on our financial condition and results of operations. For additional information, see Note 1, “Basis of Presentation and Accounting Policies,” and Note 7, “FDIC Indemnification Asset,” to the Consolidated Financial Statements in Part II, Item 8 of this report.
We may be required to pay higher FDIC insurance premiums or special assessments.
Our deposits are insured up to applicable limits by the DIF of the FDIC and we are subject to deposit insurance assessments to maintain the DIF. For additional information, see “Deposit Insurance and Assessments” in Item 1 of this report. We are unable to predict future insurance assessment rates; however, deterioration in our risk-based capital ratios or adjustments to base assessment rates may result in higher insurance premiums or special assessments. The deterioration of banking and economic conditions and financial institution failures deplete the FDIC’s DIF and reduce the ratio of reserves to insured deposits. If the DIF is unable to meet funding requirements, increases in deposit insurance premium rates or special assessments may be required. Future assessments, increases, or required prepayments related to FDIC insurance premiums may negatively affect our financial condition and results of operations.
We continue to encounter technological change and are subject to information security risks associated with technology.
The financial services industry continues to experience rapid technological change with the introduction of new, and increasingly complex, technology-driven products and services. The effective use of technology increases operational efficiency that enables financial service institutions to reduce costs. Our future success depends, in large part, on our ability to provide products and services that satisfactorily meet the financial needs of our customers, as well as to realize additional efficiencies in our operations. We may fail to use technology-driven products and services effectively to better serve our customers and increase operational efficiency or sufficiently invest in technology solutions and upgrades to ensure systems are operating properly. Further, many of our competitors have substantially greater resources to invest in technology, which may adversely affect our ability to compete.
We rely on electronic communications and information systems, including those provided by third-party vendors, to conduct our business operations. Our security risks increase as our reliance on technology increases; consequently, the expectation to safeguard information by monitoring systems for potential failures, disruptions, and breakdowns has also increased. Risks associated with technology include security breaches, operational failures and service interruptions, and reputational damages. These risks also apply to our third-party service providers. Our third-party vendors include large entities with significant market presence in their respective fields; therefore, their services could be difficult to replace quickly if there are operational failures or service interruptions.
We rely on our technology-driven systems to conduct daily business and accounting operations that include the collection, processing, and retention of confidential financial and client information. We may be vulnerable to security breaches, such as employee error, cyberattacks, and viruses, beyond our control. In addition to security breaches, programming errors, vandalism, natural disasters, terrorist attacks, and third-party vendor disruptions may cause operational failures and service interruptions to our communication and information systems. Further, our systems may be temporarily disrupted during implementation or upgrade. Security breaches and service interruptions related to our information systems could damage our reputation, which may cause us to lose customers, subject us to regulatory scrutiny, or expose us to civil litigation and financial liability.
Our customers and employees have been, and will continue to be, targeted by parties using fraudulent e-mails and other communications in attempts to misappropriate passwords, bank account information or other personal information, or to introduce viruses or other malware through "Trojan horse" programs to our information systems and/or our customers' computers. Though we endeavor to mitigate these threats through product improvements, use of encryption and authentication technology, and customer and employee education, such cyberattacks against us or our third-party service providers remain a serious issue. The pervasiveness of cybersecurity incidents in general and the risks of cybercrime are complex and continue to evolve. More generally, publicized information about security and cyber-related problems could inhibit the use or growth of electronic or web-based applications or solutions as a means of conducting commercial transactions.
While we have not experienced a significant compromise, significant data loss, or any material financial losses related to cybersecurity attacks, our systems and those of our customers and third-party service providers are under constant threat and it is possible that we could experience a significant event in the future. Although we make significant efforts to maintain the security and integrity of our information systems and have implemented various measures to manage the risk of a security breach or disruption, there can be no assurance that our security efforts and measures will be effective or that attempted security breaches or disruptions would not be successful or damaging. Even the most well protected information, networks, systems and facilities remain potentially vulnerable because attempted security breaches, particularly cyberattacks and intrusions, or disruptions will occur in the future, and because the techniques used in such attempts are constantly evolving and generally are not recognized until launched against a target, and in some cases are designed not to be detected and, in fact, may not be detected. Accordingly, we may be unable to anticipate these techniques or to implement adequate security barriers or other preventative measures, and thus it is virtually impossible for us to entirely mitigate this risk. A security breach or other significant disruption of our information systems or those related to our customers, merchants and our third-party vendors, including as a result of cyberattacks, could (1) disrupt the proper functioning of our networks and systems and therefore our operations and/or those of our customers; (2) result in the unauthorized access to, and destruction, loss, theft, misappropriation or release of confidential, sensitive or otherwise valuable information of ours or our customers; (3) result in a violation of applicable privacy, data breach and other laws, subjecting us to additional regulatory scrutiny and expose us to civil litigation, governmental fines and possible financial liability; (4) require significant management attention and resources to remedy the damages that result; or (5) harm our reputation or cause a decrease in the number of customers who choose to do business with us. The occurrence of any of the foregoing could have a material adverse effect on our business, financial condition and results of operations.
We may be subject to claims and litigation pertaining to intellectual property.
Banking and other financial services companies, such as the Company, rely on technology companies to provide information technology products and services necessary to support the Company’s day-to-day operations. Technology companies often enter into litigation based on allegations of patent infringement or other violations of intellectual property rights. In addition, patent holding companies seek to monetize patents they have purchased or otherwise obtained. Competitors of the Company’s vendors, or other individuals or companies, have from time to time claimed to hold intellectual property sold to the Company by its vendors. Such claims may increase in the future as the financial services sector becomes more reliant on information technology vendors. The plaintiffs in these actions often seek injunctions and substantial damages.
Regardless of the scope or validity of such patents or other intellectual property rights, or the merits of any claims by potential or actual litigants, the Company may have to engage in protracted litigation. Such litigation is often expensive, time consuming, disruptive to the Company’s operations, and distracting to management. If the Company is found to have infringed on one or more patents or other intellectual property rights, it may be required to pay substantial damages or royalties to a third party. In certain cases, the Company may consider entering into licensing agreements for disputed intellectual property, although no assurance can be given that such licenses can be obtained on acceptable terms or that litigation will not occur. These licenses may also significantly increase the Company’s operating expenses. If legal matters related to intellectual property claims were resolved against the Company or settled, the Company could be required to make payments in amounts that could have a material adverse effect on its business, financial condition, and results of operations.
Risks Related to Our Common Stock
The market price of our common stock may be volatile.
Stock price volatility may make it more difficult for our stockholders to resell their common stock when desired. Our common stock price may fluctuate significantly due to a variety of factors that include the following:
● | actual or expected variations in quarterly results of operations; |
● | recommendations by securities analysts; |
● | operating and stock price performance of comparable companies, as deemed by investors; |
● | news reports relating to trends, concerns, and other issues in the financial services industry; |
● | perceptions in the marketplace about our Company or competitors; |
● | new technology used, or services offered, by competitors; |
● | significant acquisitions or business combinations, strategic partnerships, joint ventures, or capital commitments by, or involving, our Company or competitors; |
● | failure to integrate acquisitions or realize expected benefits from acquisitions; |
● | changes in government regulations; and |
● | geopolitical conditions, such as acts or threats of terrorism or military action. |
General market fluctuations; industry factors; political conditions; and general economic conditions and events, such as economic slowdowns, recessions, interest rate changes, or credit loss trends, could also cause our common stock price to decrease regardless of operating results.
The trading volume in our common stock is less than that of other larger financial services companies.
Although our common stock is listed for trading on the NASDAQ, the trading volume in our common stock is less than that of other, larger financial services companies. A public trading market having the desired characteristics of depth, liquidity, and orderliness depends on the presence in the marketplace of willing buyers and sellers of our common stock at any given time. This presence depends on the individual decisions of investors and general economic and market conditions over which we have no control. Given the lower trading volume of our common stock, significant sales of our common stock or the expectation of these sales could cause our stock price to fall.
We may not continue to pay dividends on our common stock in the future.
Our common stockholders are only entitled to receive dividends when declared by our Board of Directors from funds legally available for such payments. Although we have historically declared cash dividends on our common stock, we are not required to do so, and may reduce or eliminate our common stock dividend in the future. This could adversely affect the market price of our common stock. As a financial holding company, the Company’s ability to declare and pay dividends is dependent on certain federal regulatory considerations, including the guidelines of the Federal Reserve about capital adequacy and dividends. For additional information, see “Payment of Dividends” in Item 1 of this report.
General Risks
We may require additional capital in the future that may not be available when needed.
We may need to raise additional capital to strengthen our capital position, increase our liquidity, satisfy obligations, or pursue growth objectives. Our ability to raise additional capital depends on current conditions in capital markets, which are outside our control, and our financial performance. Certain economic conditions and declining market confidence may increase our cost of funds and limit our access to customary sources of capital, such as borrowings with other financial institutions, repurchase agreements, and availability under the FRB's Discount Window. Events that limit access to capital markets and the inability to obtain capital may have a materially adverse effect on our business, financial condition, results of operations, and market value of common stock. We cannot provide any assurance that additional capital will be available, on acceptable terms or at all, in the future.
We are subject to environmental liability risk associated with lending activities.
A significant portion of our loan portfolio is secured by real property. In the ordinary course of business, we foreclose on and take title to properties that secure certain loans. Hazardous or toxic substances could be found on properties we own. If substances are present, we may be liable for remediation costs, personal injury claims, and property damage and our ability to use or sell the property would be limited. We have policies and procedures in place that require environmental reviews before initiating foreclosure actions on real property; however, these reviews may not detect all potential environmental hazards. Environmental laws that require us to incur substantial remediation costs, which could materially reduce the affected property’s value, and other liabilities associated with environmental hazards could have a material adverse effect on our financial condition and results of operations.
Potential acquisitions may disrupt our business and dilute stockholder value.
We may seek merger or acquisition partners that are culturally similar, have experienced management, and possess either significant market presence or the potential for improved profitability through financial management, economies of scale, or expanded services. Risks inherent in acquiring other banks, businesses, and banking branches may include the following:
● | potential exposure to unknown or contingent liabilities of the target company; |
● | exposure to potential asset quality issues of the target company; |
● | difficulty, expense, and delays of integrating the operations and personnel of the target company; |
● | potential disruption to our business; |
● | potential diversion of management’s time and attention; |
● | loss of key employees and customers of the target company; |
● | difficulty in estimating the value of the target company; |
● | potential changes in banking or tax laws or regulations that may affect the target company; |
● | unexpected costs and delays; |
● | the target company’s performance does not meet our growth and profitability expectations; |
● | limited experience in new markets or product areas; |
● | increased time, expenses, and personnel as a result of strain on our infrastructure, staff, internal controls, and management; and |
● | potential short-term decreases in profitability. |
We regularly evaluate merger and acquisition opportunities and conduct due diligence activities related to possible transactions with other financial institutions and financial services companies. As a result, merger or acquisition discussions and, in some cases, negotiations may take place and future mergers or acquisitions involving the payment of cash or the issuance of debt or equity securities may occur at any time. Acquisitions typically involve goodwill, a purchase premium over the acquired company’s book and market values; therefore, dilution of our tangible book value and net income per common share may occur. If we are unable to realize revenue increases, cost savings, geographic or product presence growth, or other projected benefits from acquisitions, our financial condition and results of operations may be adversely affected.
Attractive acquisition opportunities may not be available in the future.
We expect banking and financial companies, which may have significantly greater resources, to compete for the acquisition of financial service businesses. This competition could increase the price of potential acquisitions that we believe are attractive. If we fail to receive proper regulatory approval, we will not be able to consummate an acquisition. Our regulators consider our capital, liquidity, profitability, regulatory compliance, level of goodwill and intangible assets, and other factors when considering acquisition and expansion proposals. Future acquisitions may be dilutive to our earnings and equity per share of our common stock.
We may lose members of our management team and have difficulty attracting skilled personnel.
Our success depends, in large part, on our ability to attract and retain key employees. Competition for the best people can be intense. The unexpected loss of key personnel could have a material adverse impact on our business due to the loss of certain skills, market knowledge, and industry experience and the difficulty of promptly finding qualified replacement personnel. Certain existing and proposed regulatory guidance on compensation may also negatively affect our ability to retain and attract skilled personnel.
Our internal controls and procedures may fail or be circumvented.
We review our internal controls over financial reporting quarterly and enhance controls in response to these assessments, internal and external audit, and regulatory recommendations. A control system, no matter how well conceived and operated, includes certain assumptions and can only provide reasonable assurance that the objectives of the control system are met. These controls may be circumvented by individual acts, collusion, or management override. Any failure or circumvention related to our controls and procedures or failure to follow regulations related to controls and procedures could have a material adverse effect on our business, reputation, results of operations, and financial condition.
We are subject to environmental, social and governance ("ESG") risks that could adversely affect the Company's results of operations, reputation, and the market price of its securities.
Certain investors have begun to consider the steps taken and resources allocated by financial institutions and other commercial organizations with respect to ESG matters when making investment decisions. Certain investors are beginning to incorporate the business risks of ESG regulation and activism and the adequacy of companies’ responses to these into their investment decisions. These shifts in investing priorities may result in adverse effects on the market price of the Company’s securities.
The U.S. Congress, state legislatures and federal and state regulatory agencies, as well as certain stock exchanges, continue to propose numerous initiatives related to ESG matters. Similar and even more expansive initiatives are expected under the current administration, including potentially increasing supervisory expectations with respect to banks’ risk management practices, accounting practices, and credit portfolio concentrations management practices. The lack of empirical data surrounding the credit and other financial risks posed by ESG regulation and activism render it impossible to predict how specifically ESG matters may impact the Company’s financial condition and results of operations.
Specifically, environmental activism may adversely impact the economic viability of many of the Company’s deposit and loan customers in our West Virginia and southwestern Virginia markets. We have customers who operate in carbon-intensive industries like coal, oil and gas that are exposed to climate activism risks and those risks created by a transition to a less carbon-dependent economy, as well as customers who operate in low-carbon industries that may be subject to risks associated with new technologies. Further, the effects of climate change activism may negatively impact regional and local economic activity, which could impact the economies of the communities the Company serves and in which we operate. The Company’s business, reputation and ability to attract and retain employees and customers may also be harmed if our response to ESG activism is perceived to be excessive or insufficient.
Federal and state banking regulators and supervisory authorities, investors and other stakeholders have increasingly viewed financial institutions as a tool to effect ESG activism, both directly and with respect to their customers, which may result in financial institutions coming under increased pressure regarding the disclosure and management of ESG matters. Given that ESG matters could impose systemic risks upon the financial sector, either via disruptions in economic activity resulting from activism, the Company faces increasing focus on our resilience to ESG risks. Ongoing legislative or regulatory uncertainties and changes regarding ESG risk management and practices may result in higher regulatory, compliance, credit and reputational risks and costs.
Unresolved Staff Comments. |
None.
Properties. |
We own our corporate headquarters located at One Community Place, Bluefield, Virginia. As of December 31, 2020,2021, the Bank provided financial services through a network of 5049 branch locations in West Virginia (18(17 branches), Virginia (23 branches), North Carolina (7 branches), and Tennessee (2 branches). We own 4948 of those branches and lease the remaining branch. As of December 31, 2020,2021, there were no mortgages or liens against any properties. We believe that our properties are suitable and adequate to serve as financial services facilities. A list of all branch and ATM locations is available on our website at www.firstcommunitybank.com. Information contained on our website is not part of this report. For additional information, see Note 8,7, “Premises, Equipment, and Leases,” to the Consolidated Financial Statements in Part II, Item 8 of this report.
Legal Proceedings. |
We are currently a defendant in various legal actions and asserted claims in the normal course of business. Although we are unable to assess the ultimate outcome of each of these matters with certainty, we are of the belief that the resolution of these actions should not have a material adverse effect on our financial position, results of operations, or cash flows.
Mine Safety Disclosures. |
None.
Market for Registrant’s Common Equity, Related Stockholder Matters and Issuer Purchases of Equity Securities. |
Market Information and Holders
Our common stock is traded on the NASDAQ Global Select Market under the symbol FCBC. As of March 02, 2021,February 23, 2022, there were 2,900 2,789 record holders and 17,641,124 outstanding16,806,360 outstanding shares of our common stock.
Purchases of Equity Securities
We repurchased 949,386 shares of our common stock in 2021, 734,653 shares of our common stock in 2020, and 487,400 shares of our common stock in 2019, and 1,060,312 shares in 2018.2019.
The following table provides information about purchases of our common stock made by us or on our behalf by any affiliated purchaser, as defined in Rule 10b-18(a)(3) under the Exchange Act, during the periods indicated:
| ||||||||||||||||
| ||||||||||||||||
| ||||||||||||||||
| ||||||||||||||||
| Total Number of Shares Purchased | Average Price Paid per Share | Total Number of Shares Purchased as Part of a Publicly Announced Plan | Maximum Number of Shares that May Yet be Purchased Under the Plan(1) | |||||||||||||
October 1-31, 2021 | 60,100 | $ | 32.32 | 1,942,637 | 1,613,214 | |||||||||||
November 1-30, 2021 | 88,000 | 34.25 | 3,014,050 | 1,525,214 | ||||||||||||
December 1-31, 2021 | 74,600 | 33.47 | 2,496,609 | 1,450,614 | ||||||||||||
Total | 222,700 | $ | 33.47 | 7,453,296 | ||||||||||||
(1) | In the first quarter of 2020, the Company exhausted its 6,600,000 shares repurchase authorization. As a result of the uncertainty associated with the COVID-19 pandemic; the Company elected not to repurchase shares during the remainder of 2020. In February 2021, the Board of Directors approved a new repurchase plan to repurchase 2,400,000 | ||||
Stock Performance Graph
The following graph, compiled by S&P Global Market Intelligence (“S&P Global”), compares the cumulative total shareholder return on our common stock for the five years ended December 31, 2020,2021, with the cumulative total return of the S&P 500 Index, the NASDAQ Composite Index, and S&P Global’s Asset Size & Regional Peer Group. The Asset Size & Regional Peer Group consists of 42 bank holding companies with total assets between $1 billion and $5 billion that are located in the Southeast Region of the United States and traded on NASDAQ, the OTC Bulletin Board, and pink sheets. The cumulative returns assume that $100 was originally invested on December 31, 2014,2016, and that all dividends are reinvested.
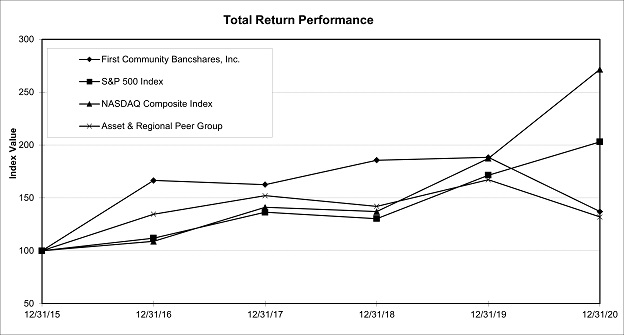
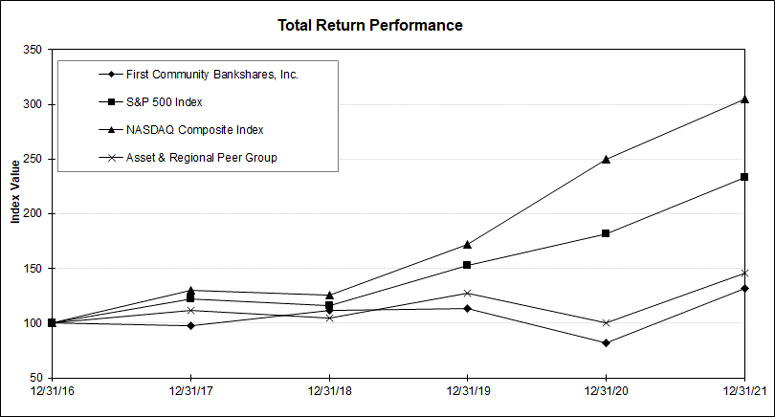
Year Ended December 31, | Year Ended December 31, | |||||||||||||||||||||||||||||||||||||||||||||||
2015 | 2016 | 2017 | 2018 | 2019 | 2020 | 2016 | 2017 | 2018 | 2019 | 2020 | 2021 | |||||||||||||||||||||||||||||||||||||
First Community Bankshares, Inc. | 100.00 | 166.50 | 162.63 | 185.68 | 188.32 | 137.10 | 100.00 | 97.65 | 111.50 | 113.09 | 82.36 | 132.20 | ||||||||||||||||||||||||||||||||||||
S&P 500 Index | 100.00 | 111.96 | 136.40 | 130.42 | 171.49 | 203.04 | 100.00 | 121.83 | 116.49 | 153.17 | 181.35 | 233.41 | ||||||||||||||||||||||||||||||||||||
NASDAQ Composite Index | 100.00 | 108.87 | 141.13 | 137.12 | 187.44 | 271.64 | 100.00 | 129.64 | 125.96 | 172.18 | 249.51 | 304.85 | ||||||||||||||||||||||||||||||||||||
S&P Global Asset & Regional Peer Group(1) | 100.00 | 134.61 | 152.15 | 142.04 | 167.21 | 132.04 | 100.00 | 112.06 | 104.51 | 127.31 | 100.28 | 146.01 | ||||||||||||||||||||||||||||||||||||
(1) Includes the following institutions: American National Bankshares Inc.; Atlantic Capital Bancshares, Inc.; Auburn National Bancorporation, Inc.; BankFirst Capital Corporation; C&F Financial Corporation; Capital City Bank Group, Inc.; CapStar Financial Holdings, Inc.; Carter Bankshares, Inc.; Chesapeake Financial Shares, Inc.; Citizens Bancorp Investment, Inc.; Citizens Holding Company; CoastalSouth Bancshares, Inc.; Colony Bankcorp, Inc.; |
|
The following table presents selected consolidated financial data, derived from the audited financial statements, as of and for the five years ended December 31, 2020. This information should be read in conjunction with Item 7, “Management Discussion and Analysis of Financial Condition and Results of Operations,” and Item 8, “Financial Statements and Supplementary Data,” of this report.
Year Ended December 31, | ||||||||||||||||||||
(Amounts in thousands, except share and per share data) | 2020 | 2019 | 2018 | 2017 | 2016 | |||||||||||||||
Selected Balance Sheet Data | ||||||||||||||||||||
Investment debt securities | $ | 83,358 | $ | 169,574 | $ | 178,129 | $ | 190,674 | $ | 212,639 | ||||||||||
Loans | 2,186,632 | 2,114,460 | 1,775,084 | 1,817,184 | 1,852,948 | |||||||||||||||
Allowance for loan losses | 26,182 | 18,425 | 18,267 | 19,276 | 17,948 | |||||||||||||||
Total assets | 3,011,136 | 2,798,847 | 2,244,374 | 2,388,460 | 2,386,398 | |||||||||||||||
Average assets | 2,892,287 | 2,217,241 | 2,330,611 | 2,370,321 | 2,455,458 | |||||||||||||||
Deposits | 2,546,247 | 2,329,912 | 1,855,750 | 1,929,891 | 1,841,338 | |||||||||||||||
Borrowings | 964 | 1,641 | 29,370 | 80,086 | 178,713 | |||||||||||||||
Total liabilities | 2,584,406 | 2,370,028 | 1,911,517 | 2,037,746 | 2,047,341 | |||||||||||||||
Total stockholders' equity | 426,730 | 428,819 | 332,857 | 350,714 | 339,057 | |||||||||||||||
Average stockholders' equity | 420,792 | 336,138 | 341,519 | 349,701 | 338,475 | |||||||||||||||
Summary of Operations | ||||||||||||||||||||
Interest income | $ | 114,036 | $ | 94,968 | $ | 98,294 | $ | 95,308 | $ | 94,724 | ||||||||||
Interest expense | 5,464 | 5,515 | 7,449 | 8,090 | 9,844 | |||||||||||||||
Net interest income | 108,572 | 89,453 | 90,845 | 87,218 | 84,880 | |||||||||||||||
Provision for loan losses | 12,668 | 3,571 | 2,393 | 2,771 | 1,255 | |||||||||||||||
Noninterest income | 29,833 | 33,677 | 26,443 | 24,568 | 25,534 | |||||||||||||||
Noninterest expense | 79,625 | 69,763 | 69,773 | 66,902 | 71,214 | |||||||||||||||
Income tax expense | 10,186 | 10,994 | 8,782 | 20,628 | 12,819 | |||||||||||||||
Net income | 35,926 | 38,802 | 36,340 | 21,485 | 25,126 | |||||||||||||||
Net income available to common shareholders | 35,926 | 38,802 | 36,340 | 21,485 | 25,126 | |||||||||||||||
Selected Share and Per Share Data | ||||||||||||||||||||
Basic earnings per common share | $ | 2.02 | $ | 2.47 | $ | 2.19 | $ | 1.26 | $ | 1.45 | ||||||||||
Diluted earnings per common share | 2.02 | 2.46 | 2.18 | 1.26 | 1.45 | |||||||||||||||
Cash dividends per common share | 1.00 | 0.96 | 0.78 | 0.68 | 0.60 | |||||||||||||||
Special cash dividend per common share | — | — | 0.48 | — | — | |||||||||||||||
Book value per common share at year-end | 24.08 | 23.33 | 20.79 | 20.63 | 19.95 | |||||||||||||||
Weighted average basic shares outstanding | 17,781,748 | 15,690,812 | 16,587,504 | 17,002,116 | 17,319,689 | |||||||||||||||
Weighted average diluted shares outstanding | 17,815,380 | 15,756,093 | 16,666,385 | 17,077,842 | 17,365,524 | |||||||||||||||
Selected Ratios | ||||||||||||||||||||
Return on average assets | 1.24 | % | 1.75 | % | 1.56 | % | 0.91 | % | 1.02 | % | ||||||||||
Return on average common equity | 8.54 | % | 11.54 | % | 10.64 | % | 6.14 | % | 7.42 | % | ||||||||||
Average equity to average assets | 14.55 | % | 15.16 | % | 14.65 | % | 14.75 | % | 13.78 | % | ||||||||||
Dividend payout | 49.50 | % | 38.82 | % | 57.51 | % | 53.81 | % | 41.36 | % | ||||||||||
Common equity Tier 1 ratio | 14.28 | % | 14.31 | % | 13.72 | % | 13.98 | % | 13.88 | % | ||||||||||
Tier 1 risk-based capital ratio | 14.28 | % | 14.31 | % | 13.72 | % | 13.98 | % | 14.74 | % | ||||||||||
Total risk-based capital ratio | 15.53 | % | 15.21 | % | 14.79 | % | 15.06 | % | 15.79 | % | ||||||||||
Tier 1 leverage ratio | 10.24 | % | 14.02 | % | 10.95 | % | 11.06 | % | 11.07 | % | ||||||||||
Management’s Discussion and Analysis of Financial Condition and Results of Operations. |
Management’s Discussion and Analysis of Financial Condition and Results of Operations (“MD&A”) is intended to help the reader understand our financial condition, changes in financial condition, and results of operations. MD&A contains forward-looking statements and should be read in conjunction with our consolidated financial statements, accompanying notes, and other financial information included in this report. Unless the context suggests otherwise, the terms “First Community,” “Company,” “we,” “our,” and “us” refer to First Community Bankshares, Inc. and its subsidiaries as a consolidated entity.
Executive Overview
First Community Bankshares, Inc. (the “Company”) is a financial holding company, headquartered in Bluefield, Virginia, that provides banking products and services through its wholly owned subsidiary First Community Bank (the “Bank”), a Virginia chartered bank institution. As of December 31, 2020,2021, the Bank operated 5049 branches in Virginia, West Virginia, North Carolina and Tennessee. Our primary source of earnings is net interest income, the difference between interest earned on assets and interest paid on liabilities, which is supplemented by fees for services, commissions on sales, and various deposit service charges. We fund our lending and investing activities primarily through the retail deposit operations of our branch banking network and, to a lesser extent,supplemented by retail and wholesale repurchase agreements and Federal Home Loan Bank (“FHLB”) borrowings. We invest our funds primarily in loans to retail and commercial customers and various investment securities.
The Bank offers trust management, estate administration, and investment advisory services through its Trust Division and wholly owned subsidiary First Community Wealth Management (“FCWM”). The Trust Division manages inter vivos trusts and trusts under will, develops and administers employee benefit and individual retirement plans, and manages and settles estates. Fiduciary fees for these services are charged on a schedule related to the size, nature, and complexity of the account. Revenues consist primarily of commissions on assets under management and investment advisory fees. As of December 31, 2020,2021, the Trust Division and FCWM managed and administered $1.18$1.32 billion in combined assets under various fee-based arrangements as fiduciary or agent.
Our acquisition and divestiture activity during the last three years includes the December 31, 2019, acquisition of Highlands Bankshares, Inc. (“Highlands”), headquartered in Abingdon, Virginia with total assets of $563 million. The completion of the transaction resulted in total consolidated assets increasing to $2.80 billion immediately after the transaction. Activity in prior years include the completion of our Agreement and Plan of Reincorporation and Merger changing our corporate domicile from Nevada to Virginia on October 2, 2018, as well as the sale of our remaining insurance agency assets to Bankers Insurance, LLC on October 1, 2018. For additional information, see Note 2, “Acquisitions and Divestitures,” to the Consolidated Financial Statements in Item 8 of this report.
Recent Developments:Operating, Accounting, and Reporting Considerations Related to COVID-19 and the CARES Act
The outbreak of COVID-19 has significantly disrupted local, national, and global economies and has adversely impacted a broad range of industries in which the Company’s customers operate and could impair their ability to fulfill their financial obligations to the Company. The World Health Organization has declared COVID-19 to be a global pandemic and almost all public commerce and related business activities have been curtailed, to varying degrees, with the goal of decreasing the rate of new infections. The spread of the outbreak has caused significant disruptions in the U.S. and global economy and has disrupted banking and other financial activity in the areas in which the Company operates. While there has been no material impact to the Company’s employees to date, COVID-19 has the potential to create widespread business continuity issues for the Company.
Congress, the Executive Branch, and the Federal Reserve have taken several actions designed to cushion the economic fallout. Most notably, the Coronavirus Aid, Relief and Economic Security (“CARES”) Act was signed into law at the end of March 2020 as a $2 trillion legislative package. The goal of the CARES Act iswas to curb the economic downturn through various measures, including direct financial aid to American families and economic stimulus to significantly impacted industry sectors through programs like the Paycheck Protection Program (“PPP”). The package also included extensive emergency funding for hospitals and providers. In addition to the general impact of COVID-19, certain provisions of the CARES Act as well as other recent legislative and regulatory relief efforts have had a material impact on the Company’s operations and could continue to impact operations going forward.
The Company’s business is dependent upon the willingness and ability of its employees and customers to conduct banking and other financial transactions. While progress has been made on the vaccine front, if the global response to contain COVID-19 is prolonged or is unsuccessful, the Company could experience further adverse effects on its business, financial condition, results of operations and cash flows. While it is not possible to know the full universe or extent that the impact of COVID-19, and resulting measures to curtail its spread, will have on the Company’s operations, the Company is disclosing potentially material items of which it is aware.
Financial position and results of operations
Pertaining to our December 31,In 2020, financial condition and results of operations, COVID-19 had a material impact on our allowance for loan losses (“ALL”).credit losses. While we havedid not yet experiencedexperience any significant charge-offs related to COVID-19, our ALLallowance calculation and resulting provision for loancredit losses were significantly impacted by expectationsgovernmental reactions and forced shutdowns. On January 1, 2021, we adopted ASU 2016-13, "Financial Instruments - Credit Losses (Topic 326): Measurement of Credit Losses on Financial Instruments", ("CECL"), which had the effect of increasing our allowance for futurecredit losses by $13.11 million largely due to governmental reactionsthe uncertainty around the impact of COVID-19 which adversely affected the economic forecasts that were utilized in the adoption. In 2021, the economic forecasts improved significantly and credit quality remained strong; with both factors contributing to the pandemic. Refer to our discussiona reversal of the ALL in Note 6provision for credit losses of our financial statements as well as additional discussion in MD&A. Should$8.47 million. However, should economic conditions or forecasts worsen and credit quality deteriorate, we could experience further increasesincrease in our required ALLallowance for credit losses and record additional loan loss expense.provision for credit. It is possible that our asset quality measures could worsen at future measurement periods if the effects of COVID-19 are prolonged.
The Company’sCompany's fee income has been reduced due to COVID-19. Consumer spending behavior has proven to be very conservative during the pandemic resulting in a decrease in overdraft behavior that generates NSF and other fee income. However, as lock-down restrictions have either eased or been lifted, the Company is beginning to experience an upward trend in these fees. Recovering from a negative trend throughout the last half of 2020 and the first quarter of 2021, service charges on deposits increased $427 thousand or 3.28%, year to date from 2020. Should the pandemic and the global response escalate further, it is possible that the Company could see further decreases in fees in future periods; however, at this time, the Company is unable to project the materiality of such an impact on the results of operations in future periods.
The Company’s interest income could be reduced due to COVID-19. In keeping with guidance from regulators, the Company continues to work with COVID-19 affected borrowers to defer their payments, interest, and fees. While interest and fees continue to accrue to income, through normal GAAP accounting, should eventual credit losses on these deferred payments emerge, the related loans would be placed on nonaccrual status and interest income and fees accrued would be reversed. In such a scenario, interest income in future periods could be negatively impacted. As of December 31, 2020,2021 the Company carried $3.47$2.87 million of accrued interest income and fees on outstanding deferrals made to COVID-19 affected borrowers.borrowers compared to $3.47 million in 2020. At this time, the Company is unable to project the materiality of such an impact on future deferrals to COVID-19 affected borrowers, but recognizes the breadth of the economic impact may affect its borrowers’ ability to repay in future periods.
Capital and liquidity
As of December 31, 2020,2021, the Company continued to meet all capital adequacy requirements and were classified as well-capitalized under the regulatory framework for prompt corrective action. Management believes there have been no conditions or events since those notifications that would change the Bank’s classification. Additionally, our capital ratios were in excess of the minimum standards under the Basel III capital rules on a fully phased-in basis, if such requirements were in effect, as of December 31, 2020.2021. While we believe that we have sufficient capital, our reported and regulatory capital ratios could be adversely impacted by loan losses and other negative trends initiated by the pandemic. We rely on cash on hand as well as dividends from the Bank to pay dividends to our shareholders. If our capital deteriorates such that the Bank is unable to pay dividends for an extended period of time, we may not be able to pay dividends to our shareholders.
We maintain access to multiple sources of liquidity. Wholesaleliquidity including wholesale funding markets remain open to us, however, short-term funding rates have been volatile throughout 2020.markets. If funding costs are elevated for an extended period of time, it could have an adverse effect on our net interest margin. In addition, if an extended recession caused large numbers of our deposit customers to withdraw their funds, we might become more reliant on volatile or more expensive sources of funding.
Asset valuation
Currently, we do not expect COVID-19 to affect our ability to account timely for the assets on our balance sheet; however, this could change in future periods. While certain valuation assumptions and judgments will change to account for pandemic-related circumstances such as widening credit spreads, we do not anticipate significant changes in methodology used to determine the fair value of assets measured in accordance with GAAP.
As of December 31, 2020,2021, our goodwill was not impaired. ManagementA goodwill step 1 analysis was performed a quantitative goodwill impairment test as of October 1, 2020.31, 2021. The goodwill impairment testanalysis did not identify any goodwill impairment for our one reporting unit, nor was it at riskunit. There were no events that occurred after the annual analysis of failing the quantitative test.goodwill, that would indicate to management any impairment of goodwill as of December 31, 2021. COVID-19 could cause a decline in our stock price or the occurrence of what management would deem to be a triggering event that could, under certain circumstances, cause us to perform a goodwill impairment test and result in an impairment charge being recorded for that period. In the event that we conclude that all or a portion of our goodwill is impaired, a non-cash charge for the amount of such impairment would be recorded to earnings. Such a charge would have no impact on tangible capital or regulatory capital. At December 31, 2020, we had goodwill of $129.57 million, representing approximately 30.36% of equity.
As of December 31, 2020,2021, we did not have any impairment with respect to our intangible assets or other long-livedintangible assets. It is possible that the lingering effects of COVID-19 could cause the occurrence of what management would deem to be a triggering event that could, under certain circumstances, cause us to perform an intangible asset impairment test and result in an impairment charge being recorded for that period. In the event that we conclude that all or a portion of our other intangible assets are impaired, a non-cash charge for the amount of such impairment would be recorded to earnings. Such a charge would have no impact on tangible capital or regulatory capital. At December 31, 20202021 we had other intangible assets of $7.07$5.62 million, representing approximately 1.66%1.31% of equity.
Impairment charges related to certain long-term investments in land and buildings totaled $781 thousand in 2021 and $812 thousand in 2020
Our processes, controls and business continuity plan
The Company maintains an Enterprise Risk Management team to respond to, prepare, and execute responses to unforeseen circumstances, such as, natural disasters and pandemics. Upon the WHO’s pandemic declaration, the Company’s Enterprise Risk Management team implemented its Board approved Business Continuity Plan. The Company appointed an internal pandemic preparedness task force comprised of the Company’s management to address both operational and financial risks posed by COVID-19. Shortly after invoking the Plan, the Company deployed a successful remote working strategy, provided timely communication to team members and customers, implemented protocols for team member safety, and initiated strategies for monitoring and responding to local COVID-19 impacts - including customer relief efforts. The Company’s preparedness efforts, coupled with quick and decisive plan implementation, resulted in minimal impacts to operations as a result of COVID-19. At December 31, 2020,2021, a significant portion of our backroom operations employees continue to work remotely with no disruption to our operations. We have not incurred additional material cost related to our remote working strategy to date, nor do we anticipate incurring material cost in future periods.
As of December 31, 2020,2021, we don’t anticipate significant challenges to our ability to maintain our systems and controls in light of the measures we have taken to prevent the spread of COVID-19. The Company does not currently face any material resource constraint through the implementation of our business continuity plans.
Lending operations and accommodations to borrowers
The Coronavirus Aid, Relief and Economic Security (“CARES”)CARES Act included a provision allowing banks to not apply the guidance on accounting for troubled debt restructurings to loan modifications, such as extensions or deferrals, related to COVID-19 made between March 1, 2020, and the earlier of (i) December 31, 2020, or (ii) 60 days after the end of the COVID-19 national emergency. The relief can only be applied to modifications for borrowers that were not more than 30 days past due as of December 31, 2019. The Company elected to adopt this provision of the CARES Act. Through December 31, 2020,2021, we have modified 3,6254,066 commercial and consumer loans totaling $458.17$475.82 million. Those modifications were generally short-term payment deferrals and are not considered TDR's based on the CARES Act. Our policy is to downgrade commercial loans modified for COVID-19 to special mention, which caused the significant increase in loans in that rating. Subsequent upgrade or downgrade will be on a case by case basis. The Company is upgrading these loans back to pass once the modification period has ended and timely contractual payments resume. Further downgrade would be based on a number of factors, including but not limited to additional modifications, payment performance and current underwriting. As of December 31, 2020,2021, current commercial and consumer COVID-19 loan deferrals stood at $26.54$2.92 million, and $5.72 million, respectively.compared with $32.26 millionas of December 31, 2020. It is possible that these deferrals could be extended further under the CARES Act; as amended by the Consolidated Appropriations Act of 2021 ("CAA") signed into law on December 27, 2000,2021, that extended the ability to provide necessary loan modifications to our customers and not consider these troubled debt restructurings. However, the volume of these future potential extensions is unknown. It is also possible that in spite of our best efforts to assist our borrowers and achieve full collection of our investment, these deferred loans could result in future charge-offs with additional credit loss expense charged to earnings; however, the amount of any future charge-offs on deferred loans is unknown.
With the passage of the PPP, administered by the Small Business Administration (“SBA”) small businesses and other entities and individuals can apply for loans from existing SBA lenders and other approved regulated lenders that enroll in the program, subject to numerous limitations and eligibility criteria. The Bank is participatingparticipated as a lender in the PPP. The PPP opened on April 3, 2020, and on or about April 16, 2020, the SBA notified lenders that the $349 billion earmarked for the PPP was exhausted. Congress approved additional funding for the PPP of approximately $320 billion on April 24, 2020. As part of the Economic Aid to Hard-Hit Small Businesses, Nonprofits, and Venues Act ("Economic Aid Act") enacted on December 27, 2020, in January, 2021, the SBA released applications for the second round of PPP loans for second draw loans for borrowers who received funding in the first round and first draw loans to first time borrowers. As of December 31, 2020,2021 we have funded approximately 8031,429 loans with original principal balances totaling $62.74$92.58 million through the PPP program. Through December 31, 2020, $3.942021, $56.86 million, or 6.46%93.20%, of the Company’s first round PPP loan balances had been forgiven by the SBA. Current PPP loan balances at December 31, 2021, which include second round originations, were $20.64 million. It is the Company’s understanding that loans funded through the PPP program are fully guaranteed by the U.S. government. Should those circumstances change, the Company could be required to establish an allowance for credit loss through additional credit loss expense charged to earnings.
The Company is committed to assisting our customers in this time of need. Branch locations have converted to drive-thru only in order to ensure the health and safety of our customers and team members with lobbies available on a limited appointment-only basis. In addition, we have increased our emphasis on digital banking platforms.
The safety, health and wellness of our employees is a top priority. The COVID-19 pandemic presented a unique challenge with regard to maintaining employee safety while continuing successful operations. Within a short period of time, through teamwork and the adaptability of our management and staff, we were able to transition and provide remote access to non-customer facing employees to effectively work from remote locations and were able to ensure a safely-distanced working environment for employees performing customer facing activities at branches and operations centers. All employees are asked not to come to work when they experience signs or symptoms of a possible communicable illness, including COVID-19, and have been provided additional paid time off to cover compensation during such absences.
It is impossible to predict the full extent to which COVID-19 and the resulting measures to prevent its spread will affect the Company’s operations. Although there is a high degree of uncertainty around the magnitude and duration of the economic impact of COVID-19, the Company’s management believes its financial position, including high levels of capital and liquidity, will allow it to successfully endure the negative economic impacts of the crisis.
Critical Accounting Policies
Our consolidated financial statements are prepared in conformity with generally accepted accounting principles (“GAAP”) in the U.S. and prevailing practices in the banking industry. Our accounting policies, as presented in Note 1, “Basis of Presentation and Accounting Policies,” to the Consolidated Financial Statements in Item 8 of this report are fundamental in understanding MD&A and the disclosures presented in Item 8, “Financial Statements and Supplementary Data,” of this report. Management may be required to make significant estimates and assumptions that have a material impact on our financial condition or operating performance. Due to the level of subjectivity and the susceptibility of such matters to change, actual results could differ significantly from management’s assumptions and estimates. Based on the valuation techniques used and the sensitivity of financial statement amounts to the methods, assumptions, and estimates used, we have identified the allowance for loan losses and goodwill as the accounting areas that require the most subjective or complex judgments or are the most susceptible to change.
Allowance for LoanCredit Losses or "ACL"
We reviewThe ACL reflects management’s estimate of losses that will result from the inability of our allowance forborrowers to make required loan losses quarterlypayments. Management uses a systematic methodology to determine if it is sufficient to absorb probable loan losses inits ACL for loans held for investment and certain off-balance-sheet credit exposures. Management considers the portfolio. This determination requires management to make significant estimateseffects of past events, current conditions, and assumptions. While management uses its best judgmentreasonable and available information,supportable forecasts on the ultimate adequacycollectability of the allowance is dependent uponloan portfolio. The Company’s estimate of its ACL involves a varietyhigh degree of factors beyond our control, including the performance of our loan portfolio, the economy, changes in interest rates, and the view of regulatory authorities towards loan classifications. These uncertaintiesjudgment; therefore, management’s process for determining expected credit losses may result in material changesa range of expected credit losses. It is possible that others, given the same information, may at any point in time reach a different reasonable conclusion. The Company’s ACL recorded in the balance sheet reflects management’s best estimate of expected credit losses. The Company recognizes in net income the amount needed to adjust the ACL for management’s current estimate of expected credit losses. See Note 1 – "Basis of Presentation - Significant Accounting Policies" in this Annual Report on Form 10-K for further detailed descriptions of our estimation process and methodology related to the ACL. See also Note 6 — "Allowance for Credit Losses" in this Annual Report on Form 10-K, “Provision for Credit Losses and Nonperforming Assets” in this MD&A. Periods prior to the January 1, 2021, adoption of ASU 2016-13 follow prior accounting guidance for estimated loan losses and are not comparable
Our allowance for loan losses consists of specific reserves assigned to impaired loans and credit relationships and general reserves assigned to unimpaired loans that have been segmented into loan classes with similar risk characteristics such as the type of loan and collateral. General reserve allocations are basedJanuary 1, 2021, estimate. Based on management’s judgments of qualitative and quantitative factors that include, but are not limited to, probable losses from loan and other credit arrangements, general economic conditions, changes in credit concentrations or pledged collateral, historical loan loss experience, and trends in portfolio volume, maturities, composition, delinquencies, and nonaccruals. Historical loss rates for loans classified as special mention and substandard within each loan class in the commercial loan segment are adjusted by an additional qualitative factor. Loans are considered impaired when, in the opinion of management and based on current information and events, the collection of principal and interest payments due under the contractual terms of the loan agreements are uncertain. The Company conducts quarterly reviews of loans with balances of $500 thousand or greater that are deemed to be impaired. Factors considered in determining impairment include, but are not limited to, the borrower’s cash flow and capacity for debt repayment, the valuation of collateral, historical loss percentages, and economic conditions. Impairment allowances allocated to individual loans, including individual credit relationships and loan pools grouped by similar risk characteristics, are reviewed quarterly by management, Impairment is measured based upon the present value of expected future cash flows discounted at the loan's effective interest rate or the net realizable value of the collateral if the loan is collateral dependent. No allowance for loan losses is carried over or established at acquisition for purchased loans acquired in business combinations. A provision for loan losses is recorded for any credit deterioration in purchased performing loans after the acquisition date. Loans acquired in business combinations that are deemed impaired at acquisition, purchased credit impaired (“PCI”) loans, are grouped into pools and evaluated separately from the non-PCI portfolio. The estimated cash flows to be collected on PCI loans are discounted at a market rate of interest. Management believed the allowance was adequate to absorb probable loan losses inherent in the loan portfoliosensitivity analysis as of December 31, 2020. For additional information, see Note 6, “Allowance2021, an increase of 1% in the unemployment forecast would result in an increase in the allowance for Loan Losses,” to the Consolidated Financial Statements in Item 8credit losses of this report.
Goodwill
Goodwill is tested for impairment annually, on October 31st, or more frequently if events or circumstances indicate there may be impairment. We have one reporting unit, Community Banking. If we elect to perform a qualitative assessment, we evaluate factors such as macroeconomic conditions, industry and market considerations, overall financial performance, changes in stock price, and progress towards stated objectives in determining if it is more likely than not that the fair value of our reporting unit is less than its carrying amount. If we conclude that it is more likely than not that the fair value of our reporting unit is less than its carrying amount, a quantitative test is performed; otherwise, no further testing is required. The quantitative test consists of comparing the fair value of our reporting unit to its carrying amount, including goodwill. If the fair value of our reporting unit is greater than its book value, no goodwill impairment exists. If the carrying amount of our reporting unit is greater than its calculated fair value, a goodwill impairment charge is recognized for the difference. We performed a quantitative assessment for the annual test on October 31, 2020,2021, which resulted in no goodwill impairment.
Quantitative goodwill impairment testing involves significant management judgement, requiring an assessment of whether the carrying value of the reporting unit can be supported by its fair value. The process to determine fair value of our reporting unit utilizes widely accepted valuation techniques, such as the market approach (earnings multiples and transaction multiples) and the income approach (discounted cash flow (“DCF”) method). The Company engaged an independent valuation specialist to assist with goodwill impairment testing utilizing both the market and DCF methods. The resulting fair values from the aforementioned methods were appropriately weighted to determine the final fair value of our reporting unit.
Under the market approach, the key assumptions are selected price to earnings ratios and price to tangible book value multiples. The selection of the multiples considers the operating performance and financial condition of our reporting unit as compared with those of a group of selected publicly traded guideline companies. Among other factors considered, are the level and expected growth in return on tangible equity relative to the guideline companies selected, implied control premiums, recent transaction prices, as well as data in comparable macroeconomic environments.
Under the DCF approach, the key assumptions used are the cash flows for the forecasted period, the terminal growth rate, and the discount rate. The cash flows for the forecasted period are estimated based on management’s most recent projections available as of the testing date, given consideration to minimum equity capital requirements. The projections include macroeconomic variables developed at the same time. The terminal growth rate is selected based on management’s long-term expectation for the reporting unit. The discount rate is based on the reporting unit’s estimated cost of equity capital, computed under the capital asset pricing model and reflects the risk and uncertainty in the financial markets in the internally generated cash flow projections.
At October 31, 2020, the fair value of the Company’s reporting unit compared to the carrying value resulted in no impairment of goodwill. While the inherent risk related to uncertainty is embedded in the key assumptions used in the valuations, the current environment continues to evolve due to the challenge and uncertainties related to the pandemic. Further deterioration in macroeconomic and market conditions, potential adverse effects to economic forecasts due to the severity and duration of the pandemic, as well as the responses of governments, customers, and clients, could negatively impact the assumptions used in the valuation. If the future should differ from management’s best estimate of key assumptions, the Company could potentially experience goodwill impairment charges in the future. For additional information, see Note 9,8, “Goodwill and Other Intangible Assets,” to the Consolidated Financial Statements in Item 8 of this report.
Non-GAAP Financial Measures
In addition to financial statements prepared in accordance with GAAP, we use certain non-GAAP financial measures that provide useful information for financial and operational decision making, evaluating trends, and comparing financial results to other financial institutions. The non-GAAP financial measures presented in this report include certain financial measures presented on a fully taxable equivalent (“FTE”) basis. While we believe certain non-GAAP financial measures enhance the understanding of our business and performance, they are supplemental and not a substitute for, or more important than, financial measures prepared in accordance with GAAP and may not be comparable to those reported by other financial institutions. The reconciliations of non-GAAP to GAAP measures are presented below.
We believe FTE basis is the preferred industry measurement of net interest income and provides better comparability between taxable and tax exempt amounts. We use this non-GAAP financial measure to monitor net interest income performance and to manage the composition of our balance sheet. FTE basis adjusts for the tax benefits of income from certain tax exempt loans and investments using the federal statutory income tax rate of 21% for periods after January 1, 2018. The following table reconciles net interest income and margin, as presented in our consolidated statements of income, to net interest income on a FTE basis for the periods indicated:
Year Ended December 31, | Year Ended December 31, | |||||||||||||||||||||||
2020 | 2019 | 2018 | 2021 | 2020 | 2019 | |||||||||||||||||||
(Amounts in thousands) | ||||||||||||||||||||||||
Net interest income, GAAP | $ | 108,572 | $ | 89,453 | $ | 90,845 | $ | 102,474 | $ | 108,572 | $ | 89,453 | ||||||||||||
FTE adjustment(1) | 647 | 848 | 899 | 439 | 647 | 848 | ||||||||||||||||||
Net interest income, FTE | $ | 109,219 | $ | 90,301 | $ | 91,744 | $ | 102,913 | $ | 109,219 | $ | 90,301 | ||||||||||||
Net interest margin, GAAP | 4.27 | % | 4.54 | % | 4.37 | % | 3.65 | % | 4.27 | % | 4.54 | % | ||||||||||||
FTE adjustment(1) | 0.02 | % | 0.05 | % | 0.04 | % | 0.02 | % | 0.02 | % | 0.05 | % | ||||||||||||
Net interest margin, FTE | 4.29 | % | 4.59 | % | 4.41 | % | 3.67 | % | 4.29 | % | 4.59 | % | ||||||||||||
(1) | FTE basis of 21%. |
Performance Overview
Highlights of our results of operations in 2020,2021, and financial condition as of December 31, 2020,2021, include the following:
● |
|
● | Return on average assets |
● | Return on average common equity increased to 11.96% compared to 8.54% for 2020. |
● | Non-interest income increased 14.98% to $34.30 million, over last year. The increase is largely attributable to an increase in other service charges due to the |
● | Net |
| ● | The | ||
| ● | The SBA had forgiven $56.86 million, or 93.20%, of the | ||
● | Book value per share at December 31, 2021, was $25.34, an increase of $1.26 from |
● | The Company |
|
|
| ||
| ||
|
|
|
|
Results of Operations
Net Income
The following table presents the changes in net income and related information for the periods indicated:
2020 Compared to 2019 | 2019 Compared to 2018 | 2021 Compared to 2020 | 2020 Compared to 2019 | |||||||||||||||||||||||||||||||||||||||||||||||||||||
Year Ended December 31, | Increase | % | Increase | % | Year Ended December 31, | Increase | % | Increase | % | |||||||||||||||||||||||||||||||||||||||||||||||
(Amounts in thousands, except per share data) | 2020 | 2019 | 2018 | (Decrease) | Change | (Decrease) | Change | 2021 | 2020 | 2019 | (Decrease) | Change | (Decrease) | Change | ||||||||||||||||||||||||||||||||||||||||||
Net income | $ | 35,926 | $ | 38,802 | $ | 36,340 | $ | (2,876 | ) | (7.41 | )% | $ | 2,462 | 6.77 | % | $ | 51,168 | $ | 35,926 | $ | 38,802 | $ | 15,242 | 42.43 | % | $ | (2,876 | ) | (7.41 | )% | ||||||||||||||||||||||||||
Basic earnings per common share | 2.02 | 2.47 | 2.19 | (0.45 | ) | (18.22 | )% | 0.28 | 12.79 | % | 2.95 | 2.02 | 2.47 | 0.93 | 46.04 | % | (0.45 | ) | (18.22 | )% | ||||||||||||||||||||||||||||||||||||
Diluted earnings per common share | 2.02 | 2.46 | 2.18 | (0.44 | ) | (17.88 | )% | 0.28 | 12.84 | % | 2.94 | 2.02 | 2.46 | 0.92 | 45.54 | % | (0.44 | ) | (17.88 | )% | ||||||||||||||||||||||||||||||||||||
Return on average assets | 1.24 | % | 1.75 | % | 1.56 | % | (0.51 | )% | (29.14 | )% | 0.19 | % | 12.18 | % | 1.63 | % | 1.24 | % | 1.75 | % | 0.39 | % | 31.45 | % | (0.51 | )% | (29.14 | )% | ||||||||||||||||||||||||||||
Return on average common equity | 8.54 | % | 11.54 | % | 10.64 | % | (3.00 | )% | (26.00 | )% | 0.90 | % | 8.46 | % | 11.96 | % | 8.54 | % | 11.54 | % | 3.42 | % | 40.05 | % | (3.00 | )% | (26.00 | )% | ||||||||||||||||||||||||||||
2021 Compared to 2020. Pre-tax income increased $20.42 million, or 44.27%, primarily due to a reversal of $8.47 million in the allowance for credit losses in 2021 compared to $12.67 million in provision recorded in 2020. The decrease in credit loss provisioning increased pre-tax income $21.14 million and is primarily due to significantly improved economic forecasts in the current year, as well as strong credit quality metrics, versus prior year provisioning driven by the pandemic. The increase was offset by a decrease in net interest income of $6.10 million, or 5.62%, driven by the current historically low interest rate environment, as well as a $3.33 million decrease in accretion on acquired loans. Income tax expense increased $5.17 million from 2020 primarily as a result of the increase in pre-tax income.
2020 Compared to 2019. Pre-tax income decreased $3.68 million, or 7.40%, due to an increase in noninterest expense of $9.86 million, an increase in the provision for loan losses of $9.10 million, and a decrease in noninterest income of $3.84 million. The decreases to income were offset by a increase in net interest income of $19.12 million. Income tax expense decreased $808 thousand primarily as a result of the decrease in pre-tax income.
2019 Compared to 2018. Pre-tax income increased $4.67 million, or 10.36%, due to an increase in noninterest income of $7.23 million partially offset by a decrease in net interest income of $1.39 million and an increase in the provision for loan losses of $1.18 million. Income tax expense increased $2.21 million due to an increase in the effective rate from 19.46% in 2019 to 22.08% in 2020.
Net Interest Income
Net interest income, our largest contributor to earnings, is analyzed on a fully taxable equivalent (“FTE”) basis, a non-GAAP financial measure. For additional information, see “Non-GAAP Financial Measures” above. The following table presents the consolidated average balance sheets and net interest analysis on a FTE basis for the dates indicated:
Year Ended December 31, | Year Ended December 31, | |||||||||||||||||||||||||||||||||||||||||||||||||||||||||||||||||||||||
2020 | 2019 | 2018 | 2021 | 2020 | 2019 | |||||||||||||||||||||||||||||||||||||||||||||||||||||||||||||||||||
(Amounts in thousands) | Average Balance | Interest(1) | Average Yield/ Rate(1) | Average Balance | Interest(1) | Average Yield/ Rate(1) | Average Balance | Interest(1) | Average Yield/ Rate(1) | Average Balance | Interest(1) | Average Yield/ Rate(1) | Average Balance | Interest(1) | Average Yield/ Rate(1) | Average Balance | Interest(1) | Average Yield/ Rate(1) | ||||||||||||||||||||||||||||||||||||||||||||||||||||||
Assets | ||||||||||||||||||||||||||||||||||||||||||||||||||||||||||||||||||||||||
Earning assets | ||||||||||||||||||||||||||||||||||||||||||||||||||||||||||||||||||||||||
Loans(2)(3) | $ | 2,142,637 | $ | 110,619 | 5.16 | % | $ | 1,722,419 | $ | 88,990 | 5.17 | % | $ | 1,795,391 | $ | 91,819 | 5.11 | % | $ | 2,153,099 | $ | 102,996 | 4.78 | % | $ | 2,142,637 | $ | 110,619 | 5.16 | % | $ | 1,722,419 | $ | 88,990 | 5.17 | % | ||||||||||||||||||||||||||||||||||||
Securities available for sale | 105,005 | 3,259 | 3.10 | % | 126,732 | 4,334 | 3.42 | % | 176,766 | 5,419 | 3.07 | % | 81,049 | 2,008 | 2.48 | % | 105,005 | 3,259 | 3.10 | % | 126,732 | 4,334 | 3.42 | % | ||||||||||||||||||||||||||||||||||||||||||||||||
Securities held to maturity | — | — | — | 3,045 | 45 | 1.48 | % | 25,081 | 418 | 1.67 | % | — | — | — | — | — | — | 3,045 | 45 | 1.48 | % | |||||||||||||||||||||||||||||||||||||||||||||||||||
Interest-bearing deposits | 296,495 | 805 | 0.27 | % | 116,119 | 2,447 | 2.10 | % | 81,520 | 1,537 | 1.89 | % | 570,040 | 745 | 0.13 | % | 296,495 | 805 | 0.27 | % | 116,119 | 2,447 | 2.10 | % | ||||||||||||||||||||||||||||||||||||||||||||||||
Total earning assets | 2,544,137 | $ | 114,683 | 4.51 | % | 1,968,315 | $ | 95,816 | 4.87 | % | 2,078,758 | $ | 99,193 | 4.77 | % | 2,804,188 | $ | 105,749 | 3.77 | % | 2,544,137 | $ | 114,683 | 4.51 | % | 1,968,315 | $ | 95,816 | 4.87 | % | ||||||||||||||||||||||||||||||||||||||||||
Other assets | 348,150 | 248,926 | 251,853 | 330,640 | 348,150 | 248,926 | ||||||||||||||||||||||||||||||||||||||||||||||||||||||||||||||||||
Total assets | $ | 2,892,287 | $ | 2,217,241 | $ | 2,330,611 | $ | 3,134,828 | $ | 2,892,287 | $ | 2,217,241 | ||||||||||||||||||||||||||||||||||||||||||||||||||||||||||||
Liabilities and stockholders' equity | ||||||||||||||||||||||||||||||||||||||||||||||||||||||||||||||||||||||||
Interest-bearing deposits | ||||||||||||||||||||||||||||||||||||||||||||||||||||||||||||||||||||||||
Demand deposits | $ | 556,279 | $ | 311 | 0.06 | % | $ | 453,824 | $ | 281 | 0.06 | % | $ | 466,403 | $ | 246 | 0.05 | % | $ | 646,999 | $ | 127 | 0.02 | % | $ | 556,279 | $ | 311 | 0.06 | % | $ | 453,824 | $ | 281 | 0.06 | % | ||||||||||||||||||||||||||||||||||||
Savings deposits | 711,831 | 902 | 0.13 | % | 504,081 | 823 | 0.16 | % | 508,353 | 382 | 0.08 | % | 816,845 | 281 | 0.03 | % | 711,831 | 902 | 0.13 | % | 504,081 | 823 | 0.16 | % | ||||||||||||||||||||||||||||||||||||||||||||||||
Time deposits | 456,755 | 4,247 | 0.93 | % | 418,450 | 4,288 | 1.02 | % | 471,335 | 4,516 | 0.96 | % | 387,249 | 2,427 | 0.63 | % | 456,755 | 4,247 | 0.93 | % | 418,450 | 4,288 | 1.02 | % | ||||||||||||||||||||||||||||||||||||||||||||||||
Total interest-bearing deposits | 1,724,865 | 5,460 | 0.32 | % | 1,376,355 | 5,392 | 0.39 | % | 1,446,091 | 5,144 | 0.36 | % | 1,851,093 | 2,835 | 0.15 | % | 1,724,865 | 5,460 | 0.32 | % | 1,376,355 | 5,392 | 0.39 | % | ||||||||||||||||||||||||||||||||||||||||||||||||
Borrowings | ||||||||||||||||||||||||||||||||||||||||||||||||||||||||||||||||||||||||
Retail repurchase agreements | 1,145 | 3 | 0.28 | % | 2,471 | 4 | 0.14 | % | 4,010 | 5 | 0.12 | % | 1,194 | 1 | 0.07 | % | 1,145 | 3 | 0.28 | % | 2,471 | 4 | 0.14 | % | ||||||||||||||||||||||||||||||||||||||||||||||||
Wholesale repurchase agreements | — | — | — | 3,767 | 119 | 3.17 | % | 25,000 | 806 | 3.22 | % | — | — | — | — | — | — | 3,767 | 119 | 3.17 | % | |||||||||||||||||||||||||||||||||||||||||||||||||||
FHLB advances and other borrowings | 36 | 1 | 2.23 | % | — | — | — | 36,849 | 1,494 | 4.05 | % | — | — | — | % | 36 | 1 | 2.23 | % | — | — | — | ||||||||||||||||||||||||||||||||||||||||||||||||||
Total borrowings | 1,181 | 4 | 0.34 | % | 6,238 | 123 | 1.96 | % | 65,859 | 2,305 | 3.50 | % | 1,194 | 1 | 0.07 | % | 1,181 | 4 | 0.34 | % | 6,238 | 123 | 1.96 | % | ||||||||||||||||||||||||||||||||||||||||||||||||
Total interest-bearing liabilities | 1,726,046 | 5,464 | 0.32 | % | 1,382,593 | 5,515 | 0.40 | % | 1,511,950 | 7,449 | 0.49 | % | 1,852,287 | 2,836 | 0.15 | % | 1,726,046 | 5,464 | 0.32 | % | 1,382,593 | 5,515 | 0.40 | % | ||||||||||||||||||||||||||||||||||||||||||||||||
Noninterest-bearing demand deposits | 707,623 | 468,774 | 448,903 | 816,638 | 707,623 | 468,774 | ||||||||||||||||||||||||||||||||||||||||||||||||||||||||||||||||||
Other liabilities | 37,826 | 29,736 | 28,239 | 38,151 | 37,826 | 29,736 | ||||||||||||||||||||||||||||||||||||||||||||||||||||||||||||||||||
Total liabilities | 2,471,495 | 1,881,103 | 1,989,092 | 2,707,076 | 2,471,495 | 1,881,103 | ||||||||||||||||||||||||||||||||||||||||||||||||||||||||||||||||||
Stockholders' equity | 420,792 | 336,138 | 341,519 | 427,752 | 420,792 | 336,138 | ||||||||||||||||||||||||||||||||||||||||||||||||||||||||||||||||||
Total liabilities and equity | $ | 2,892,287 | $ | 2,217,241 | $ | 2,330,611 | $ | 3,134,828 | $ | 2,892,287 | $ | 2,217,241 | ||||||||||||||||||||||||||||||||||||||||||||||||||||||||||||
Net interest income, FTE(1) | $ | 109,219 | $ | 90,301 | $ | 91,744 | $ | 102,913 | $ | 109,219 | $ | 90,301 | ||||||||||||||||||||||||||||||||||||||||||||||||||||||||||||
Net interest rate spread, FTE(1) | 4.19 | % | 4.47 | % | 4.28 | % | 3.62 | % | 4.19 | % | 4.47 | % | ||||||||||||||||||||||||||||||||||||||||||||||||||||||||||||
Net interest margin, FTE(1) | 4.29 | % | 4.59 | % | 4.41 | % | 3.67 | % | 4.29 | % | 4.59 | % | ||||||||||||||||||||||||||||||||||||||||||||||||||||||||||||
(1) | FTE basis based on the federal statutory rate of 21%. |
(2) | Nonaccrual loans are included in average balances; however, no related interest income is recognized during the period of nonaccrual. |
(3) | Interest on loans include non-cash purchase accounting accretion of $4.66 million in 2021, $7.99 million in 2020, and $3.23 million in |
The following table presents the impact to net interest income on a FTE basis due to changes in volume (average volume times the prior year’s average rate), rate (average rate times the prior year’s average volume), and rate/volume (average volume times the change in average rate), for the periods indicated:
Year Ended | Year Ended | Year Ended | Year Ended | |||||||||||||||||||||||||||||||||||||||||||||||||||||||||||||
December 31, 2020 Compared to 2019 | December 31, 2019 Compared to 2018 | December 31, 2021 Compared to 2020 | December 31, 2020 Compared to 2019 | |||||||||||||||||||||||||||||||||||||||||||||||||||||||||||||
Dollar Increase (Decrease) due to | Dollar Increase (Decrease) due to | Dollar Increase (Decrease) due to | Dollar Increase (Decrease) due to | |||||||||||||||||||||||||||||||||||||||||||||||||||||||||||||
Rate/ | Rate/ | Rate/ | Rate/ | |||||||||||||||||||||||||||||||||||||||||||||||||||||||||||||
(Amounts in thousands) | Volume | Rate | Volume | Total | Volume | Rate | Volume | Total | Volume | Rate | Volume | Total | Volume | Rate | Volume | Total | ||||||||||||||||||||||||||||||||||||||||||||||||
Interest earned on(1): | ||||||||||||||||||||||||||||||||||||||||||||||||||||||||||||||||
Loans | $ | 21,736 | $ | (42 | ) | $ | (65 | ) | $ | 21,629 | $ | (3,729 | ) | $ | 1,077 | $ | (177 | ) | $ | (2,829 | ) | $ | 540 | $ | (8,123 | ) | $ | (40 | ) | $ | (7,623 | ) | $ | 21,736 | $ | (42 | ) | $ | (65 | ) | $ | 21,629 | ||||||||||||||||||||||
Securities available for sale | (743 | ) | (101 | ) | (231 | ) | (1,075 | ) | (1,536 | ) | 619 | (168 | ) | (1,085 | ) | (744 | ) | (657 | ) | 150 | (1,251 | ) | (743 | ) | (101 | ) | (231 | ) | (1,075 | ) | ||||||||||||||||||||||||||||||||||
Securities held to maturity | (45 | ) | — | — | (45 | ) | (368 | ) | (48 | ) | 43 | (373 | ) | — | — | — | — | (45 | ) | — | — | (45 | ) | |||||||||||||||||||||||||||||||||||||||||
Interest-bearing deposits with other banks | 3,791 | (534 | ) | (4,899 | ) | (1,642 | ) | 654 | 171 | 85 | 910 | 715 | (388 | ) | (387 | ) | (60 | ) | 3,791 | (534 | ) | (4,899 | ) | (1,642 | ) | |||||||||||||||||||||||||||||||||||||||
Total interest-earning assets | 24,739 | (677 | ) | (5,195 | ) | 18,867 | (4,979 | ) | 1,819 | (217 | ) | (3,377 | ) | 511 | (9,168 | ) | (277 | ) | (8,934 | ) | 24,739 | (677 | ) | (5,195 | ) | 18,867 | ||||||||||||||||||||||||||||||||||||||
Interest paid on(1): | ||||||||||||||||||||||||||||||||||||||||||||||||||||||||||||||||
Demand deposits | 63 | (7 | ) | (26 | ) | 30 | (6 | ) | 47 | (6 | ) | 35 | 51 | (202 | ) | (33 | ) | (184 | ) | 63 | (7 | ) | (26 | ) | 30 | |||||||||||||||||||||||||||||||||||||||
Savings deposits | 338 | (46 | ) | (213 | ) | 79 | (3 | ) | 407 | 37 | 441 | 133 | (657 | ) | (97 | ) | (621 | ) | 338 | (46 | ) | (213 | ) | 79 | ||||||||||||||||||||||||||||||||||||||||
Time deposits | 391 | (97 | ) | (335 | ) | (41 | ) | (508 | ) | 283 | (3 | ) | (228 | ) | (646 | ) | (1,384 | ) | 210 | (1,820 | ) | 391 | (97 | ) | (335 | ) | (41 | ) | ||||||||||||||||||||||||||||||||||||
Retail repurchase agreements | (2 | ) | 1 | — | (1 | ) | (2 | ) | 1 | — | (1 | ) | — | (1 | ) | (1 | ) | (2 | ) | (2 | ) | 1 | — | (1 | ) | |||||||||||||||||||||||||||||||||||||||
Wholesale repurchase agreements | (119 | ) | — | — | (119 | ) | (684 | ) | (12 | ) | 9 | (687 | ) | — | — | — | — | (119 | ) | — | — | (119 | ) | |||||||||||||||||||||||||||||||||||||||||
FHLB advances and other borrowings | — | — | 1 | 1 | (1,492 | ) | (1,492 | ) | 1,490 | (1,494 | ) | (1 | ) | — | — | (1 | ) | — | — | 1 | 1 | |||||||||||||||||||||||||||||||||||||||||||
Total interest-bearing liabilities | 671 | (149 | ) | (573 | ) | (51 | ) | (2,695 | ) | (766 | ) | 1,527 | (1,934 | ) | (463 | ) | (2,244 | ) | 79 | (2,628 | ) | 671 | (149 | ) | (573 | ) | (51 | ) | ||||||||||||||||||||||||||||||||||||
Change in net interest income(1) | $ | 24,068 | $ | (528 | ) | $ | (4,622 | ) | $ | 18,918 | $ | (2,284 | ) | $ | 2,585 | $ | (1,744 | ) | $ | (1,443 | ) | $ | 974 | $ | (6,924 | ) | $ | (356 | ) | $ | (6,306 | ) | $ | 24,068 | $ | (528 | ) | $ | (4,622 | ) | $ | 18,918 | ||||||||||||||||||||||
(1) | FTE basis based on the federal statutory rate of 21%. |
2021 Compared to 2020. Net interest income comprised 74.92% of total net interest and noninterest income in 2021 compared to 78.45% in 2020. Net interest income decreased $6.10 million, or 5.62%, decreased $6.31 million, or 5.77%, on a FTE basis. The FTE net interest margin decreased 62 basis points and the FTE net interest spread decreased 57 basis points. The decrease in the net interest margin and the net interest spread are primarily attributable to the current historically low interest rate environment as well as a decrease in purchase accounting accretion from acquired loans.
Average earning assets increased $260.05 million, or 10.22%, primarily due to an increase in average interest-bearing deposits and average loans offset by a decrease in average debt securities. The yield on earning assets decreased 74 basis points as the yields decreased primarily due to the historically low rate environment. Average loans increased $10.46 million, or 0.49%, and the average loan to deposit ratio decreased to 80.71% from 88.08% in 2020. Non-cash accretion income related to PCI loans decreased $3.33 million, or 41.73%, to $4.66 million due reduced balances in the PCI portfolios. The impact of non-cash purchase accounting accretion income on the FTE net interest margin was 17 basis points compared to 31 basis points in the prior year.
Average interest-bearing liabilities, which consist of interest-bearing deposits and borrowings, increased $126.24 million, or 7.31%, primarily due to an increase in average interest-bearing deposits. The yield on interest-bearing liabilities decreased 17 basis points. Average interest-bearing deposits increased $126.23 million, or 7.32%, with increases of $105.01 million, or 14.75%, in average savings deposits, $90.72 million, or 16.31%, in average interest-bearing demand deposits, offset by a decrease of $69.51, or 15.22%, in average time deposits.
2020 Compared to 2019. Net interest income comprised 78.45% of total net interest and noninterest income in 2020 compared to 72.65% in 2019. Net interest income increased $19.12 million, or 21.37%, compared to a increase of $18.92 million, or 20.95%, on a FTE basis. The FTE net interest margin decreased 30 basis points and the FTE net interest spread decreased 28 basis points. The decrease in the net interest margin and the net interest spread are primarily attributable to the current historically low interest rate environment partially offset by purchase accounting accretion from the Highlands portfolio as well as accelerated paydowns of acquired loans.
Average earning assets increased $575.82 million, or 29.25%, primarily due to an increase in average loans and average interest-bearing deposits offset by a decrease in average debt securities. The yield on earning assets decreased 36 basis points as the yields on interest-bearing deposits and debt securities decreased primarily due to the historically low rate environment. Average loans increased $420.22 million, or 24.40%, and the average loan to deposit ratio decreased to 88.08% from 93.35%. The increase in average loans was primarily due to the addition of Highlands. Non-cash accretion income related to PCI loans increased $4.76 million, or 147.37%, to $7.99 million due the addition of Highlands and the fourth quarter payoff of a large acquired loan relationship. The impact of non-cash purchase accounting accretion income on the FTE net interest margin was 31 basis points compared to 17 basis points in the prior year.
Average interest-bearing liabilities, which consist of interest-bearing deposits and borrowings, increased $343.45 million, or 24.84%, primarily due to an increase in average interest-bearing deposits. The yield on interest-bearing liabilities decreased 8 basis points. Average interest-bearing deposits increased $348.51 million, or 25.32%, which was driven by the December 31, 2019, Highlands acquisition with increases of $207.75 million, or 41.21%, in average savings deposits, $102.46 million, or 22.58%, in average interest-bearing demand deposits, and $38.31 million, or 9.15%, in average time deposits.
2019 Compared to 2018. Net interest income comprised 72.65% of total net interest and noninterest income in 2019 compared to 77.45% in 2018. Net interest income decreased $1.39 million, or 1.53%, compared to a decrease of $1.44 million, or 1.57%, on a FTE basis. The FTE net interest margin increased 18 basis points and the FTE net interest spread increased 19 basis points.
Average earning assets decreased $110.44 million, or 5.31%, primarily due to a decrease in average loans and debt securities offset by an increase in interest-bearing deposits. The yield on earning assets increased 10 basis points as the yields on debt securities, and interest-bearing deposits increased. Average loans decreased $72.97 million, or 4.06%, and the average loan to deposit ratio decreased to 93.35% from 94.74%. Non-cash accretion income related to PCI loans decreased $3.16 million, or 49.46%, to $3.23 million due to continued acquired portfolio attrition. The impact of non-cash purchase accounting accretion income on the FTE net interest margin was 17 basis points compared to 30 basis points in the prior year.
Average interest-bearing liabilities, which consist of interest-bearing deposits and borrowings, decreased $129.36 million, or 8.56%, primarily due to a decline in average interest-bearing deposits and average borrowings. The yield on interest-bearing liabilities decreased 9 basis points. Average borrowings decreased $59.62 million, or 90.53%, largely due to a $22.77 million, or 78.50%, decrease in average retail and wholesale repurchase agreements and a $36.85 million, or 100.00%, decrease in average FHLB advances. Average interest-bearing deposits decreased $69.74 million, or 4.82%, which was driven by a $52.89 million, or 11.22%, decrease in average time deposits, and a $12.58 million, or 2.70%, decrease in average interest-bearing demand deposits.
Provision for Credit/Loan Losses
2021 Compared to 2020. The provision charged to operations decreased $21.14 million, or 166.87%. The decrease was primarily due to significantly improved economic forecasts in the current year, as well as strong credit quality metrics, versus prior year provisioning driven by the pandemic. The most significant forecast variable in our allowance model is unemployment. The forecast used for December 31, 2021, ranged from 4.1% to 3.6%. That forecast was much stronger than that used for January 1, 2021, that ranged from 6.6% to 5.6% over the forecast period.
2020 Compared to 2019. The provision charged to operations increased $9.10 million, or 254.75%. The increase was primarily related to the economic uncertainty caused by the coronavirus pandemic.
2019 Compared to 2018. The provision charged to operations increased $1.18 million, or 49.23%, to $3.57 million, as we effectively covered net charge-offs for the year.
Noninterest Income
The following table presents the components of, and changes in, noninterest income for the periods indicated:
2020 Compared to 2019 | 2019 Compared to 2018 | 2021 Compared to 2020 | 2020 Compared to 2019 | |||||||||||||||||||||||||||||||||||||||||||||||||||||
Year Ended December 31, | Increase | % | Increase | % | Year Ended December 31, | Increase | % | Increase | % | |||||||||||||||||||||||||||||||||||||||||||||||
2020 | 2019 | 2018 | (Decrease) | Change | (Decrease) | Change | 2021 | 2020 | 2019 | (Decrease) | Change | (Decrease) | Change | |||||||||||||||||||||||||||||||||||||||||||
(Amounts in thousands) | ||||||||||||||||||||||||||||||||||||||||||||||||||||||||
Wealth management | $ | 3,417 | $ | 3,423 | $ | 3,262 | $ | (6 | ) | -0.18 | % | $ | 161 | 4.94 | % | $ | 3,853 | $ | 3,417 | $ | 3,423 | $ | 436 | 12.76 | % | $ | (6 | ) | -0.18 | % | ||||||||||||||||||||||||||
Service charges on deposits | 13,019 | 14,594 | 14,733 | (1,575 | ) | -10.79 | % | (139 | ) | -0.94 | % | 13,446 | 13,019 | 14,594 | 427 | 3.28 | % | (1,575 | ) | -10.79 | % | |||||||||||||||||||||||||||||||||||
Other service charges and fees | 10,333 | 8,281 | 7,733 | 2,052 | 24.78 | % | 548 | 7.09 | % | 12,422 | 10,333 | 8,281 | 2,089 | 20.22 | % | 2,052 | 24.78 | % | ||||||||||||||||||||||||||||||||||||||
Insurance commissions | — | — | 966 | — | — | (966 | ) | -100.00 | % | |||||||||||||||||||||||||||||||||||||||||||||||
Net (loss) gain on sale of securities | 385 | (43 | ) | (618 | ) | 428 | -995.35 | % | 575 | -93.04 | % | — | 385 | (43 | ) | (385 | ) | -100.00 | % | 428 | -995.35 | % | ||||||||||||||||||||||||||||||||||
Net FDIC indemnification asset amortization | (1,690 | ) | (2,377 | ) | (2,181 | ) | 687 | -28.90 | % | (196 | ) | 8.99 | % | (1,226 | ) | (1,690 | ) | (2,377 | ) | 464 | -27.46 | % | 687 | -28.90 | % | |||||||||||||||||||||||||||||||
Litigation income | — | 6,995 | — | (6,995 | ) | -100.00 | % | 6,995 | — | — | — | 6,995 | — | — | (6,995 | ) | -100.00 | % | ||||||||||||||||||||||||||||||||||||||
Other operating income | 4,369 | 2,804 | 2,548 | 1,565 | 55.81 | % | 256 | 10.05 | % | 5,806 | 4,369 | 2,804 | 1,437 | 32.89 | % | 1,565 | 55.81 | % | ||||||||||||||||||||||||||||||||||||||
Total noninterest income | $ | 29,833 | $ | 33,677 | $ | 26,443 | $ | (3,844 | ) | -11.41 | % | $ | 7,234 | 27.36 | % | $ | 34,301 | $ | 29,833 | $ | 33,677 | $ | 4,468 | 14.98 | % | $ | (3,844 | ) | -11.41 | % | ||||||||||||||||||||||||||
2021 Compared to 2020. Noninterest income comprised 25.08% of total net interest and noninterest income in 2021 compared to 21.55% in 2020. Noninterest income increased $4.47 million, or 14.98%, primarily due to an increase in other service charges of $2.09 million, or 20.22%, due primarily to an increase in net interchange income of $1.90 million, compared to 2020. In addition, a recovered amount of $1.00 million was recieved and recorded in other operating income during the second quarter of 2021 for the recovery of an acquired loan from a failed bank acquisition that had been written down prior to acquisition. Additional increases occurred in wealth management income and service charges on deposits of $436 thousand and $427 thousand, respectively.
2020 Compared to 2019. Noninterest income comprised 21.55% of total net interest and noninterest income in 2020compared to 27.35% in 2019. Noninterest income decreased $3.84 million, or 11.41%, primarily due to $7.00 million received in litigation settlements in 2019. Service charges on deposits decreased $1.58 million, or 10.79%; the decrease was primarily attributable to pandemic shutdowns throughout 2020. Other service charges and fees increased $2.05 million, or 24.78%, primarily from an increase in net interchange income for the addition of Highlands accounts. Other operating income increased $1.57 million, or 55.81%, and was primarily driven by third party incentives associated with debit cards.
2019 Compared to 2018. Noninterest income comprised 27.35% of total net interest and noninterest income in 2020 compared to 22.55% in 2019. Noninterest income increased $7.23 million, or 27.36%, primarily due to the receipt of $7.00 million received in litigation settlements. Other service charges and fees increased $548 thousand, or 7.09%, primarily from an increase in net interchange income. Net securities losses decreased $575 thousand, or 93.04%. Other operating income increases were offset by a $966 thousand decrease in insurance commissions due to the divestiture of the Company’s remaining insurance agency assets in 2019.
Noninterest Expense
The following table presents the components of, and changes in, noninterest expense for the periods indicated:
2020 Compared to 2019 | 2019 Compared to 2018 | 2021 Compared to 2020 | 2020 Compared to 2019 | |||||||||||||||||||||||||||||||||||||||||||||||||||||
Year Ended December 31, | Increase | % | Increase | % | Year Ended December 31, | Increase | % | Increase | % | |||||||||||||||||||||||||||||||||||||||||||||||
2020 | 2019 | 2018 | (Decrease) | Change | (Decrease) | Change | 2021 | 2020 | 2019 | (Decrease) | Change | (Decrease) | Change | |||||||||||||||||||||||||||||||||||||||||||
(Amounts in thousands) | ||||||||||||||||||||||||||||||||||||||||||||||||||||||||
Salaries and employee benefits | $ | 44,005 | $ | 37,148 | $ | 36,690 | $ | 6,857 | 18.46 | % | $ | 458 | 1.25 | % | $ | 44,239 | $ | 44,005 | $ | 37,148 | $ | 234 | 0.53 | % | $ | 6,857 | 18.46 | % | ||||||||||||||||||||||||||||
Occupancy expense | 5,043 | 4,334 | 4,542 | 709 | 16.36 | % | (208 | ) | -4.58 | % | 4,913 | 5,043 | 4,334 | (130 | ) | -2.58 | % | 709 | 16.36 | % | ||||||||||||||||||||||||||||||||||||
Furniture and equipment expense | 5,558 | 4,457 | 3,980 | 1,101 | 24.70 | % | 477 | 11.98 | % | 5,627 | 5,558 | 4,457 | 69 | 1.24 | % | 1,101 | 24.70 | % | ||||||||||||||||||||||||||||||||||||||
Service fees | 5,665 | 4,448 | 3,860 | 1,217 | 27.36 | % | 588 | 15.23 | % | 6,324 | 5,665 | 4,448 | 659 | 11.63 | % | 1,217 | 27.36 | % | ||||||||||||||||||||||||||||||||||||||
Advertising and public relations | 1,951 | 2,310 | 2,011 | (359 | ) | -15.54 | % | 299 | 14.87 | % | 2,076 | 1,951 | 2,310 | 125 | 6.41 | % | (359 | ) | -15.54 | % | ||||||||||||||||||||||||||||||||||||
Professional fees | 1,224 | 1,698 | 1,430 | (474 | ) | -27.92 | % | 268 | 18.74 | % | 1,524 | 1,224 | 1,698 | 300 | 24.51 | % | (474 | ) | -27.92 | % | ||||||||||||||||||||||||||||||||||||
Amortization of intangibles | 1,450 | 997 | 1,039 | 453 | 45.44 | % | (42 | ) | -4.04 | % | 1,446 | 1,450 | 997 | (4 | ) | -0.28 | % | 453 | 45.44 | % | ||||||||||||||||||||||||||||||||||||
FDIC premiums and assessments | 426 | 318 | 906 | 108 | 33.96 | % | (588 | ) | -64.90 | % | 832 | 426 | 318 | 406 | 95.31 | % | 108 | 33.96 | % | |||||||||||||||||||||||||||||||||||||
Loss on extinguishment of debt | — | — | 1,096 | — | — | (1,096 | ) | — | ||||||||||||||||||||||||||||||||||||||||||||||||
Merger, acquisition, and divestiture expense | 1,893 | 2,124 | — | (231 | ) | -10.88 | % | 2,124 | — | — | 1,893 | 2,124 | (1,893 | ) | -100.00 | % | (231 | ) | -10.88 | % | ||||||||||||||||||||||||||||||||||||
Goodwill impairment | — | — | 1,492 | — | — | (1,492 | ) | — | ||||||||||||||||||||||||||||||||||||||||||||||||
Other operating expense | 12,410 | 11,929 | 12,727 | 481 | 4.03 | % | (798 | ) | -6.27 | % | 11,737 | 12,410 | 11,929 | (673 | ) | -5.42 | % | 481 | 4.03 | % | ||||||||||||||||||||||||||||||||||||
Total noninterest expense | $ | 79,625 | $ | 69,763 | $ | 69,773 | $ | 9,862 | 14.14 | % | $ | (10 | ) | -0.01 | % | $ | 78,718 | $ | 79,625 | $ | 69,763 | $ | (907 | ) | -1.14 | % | $ | 9,862 | 14.14 | % | ||||||||||||||||||||||||||
2021 Compared to 2020. Noninterest expense decreased $907 thousand, or 1.14%. The decrease was primarily due to residual merger expenses of $1.89 million recoginized in the first quarter of 2020. In addition, other operating expense decreased $673 thousand. These decreases were offset by increases in other service fees, FDIC premiums and assessments, professional fees and salaries and employee benefits of $659 thousand, $406 thousand, $300 thousand, and $234 thousand, respectively.
2020 Compared to 2019. Noninterest expense increased $9.86 million, or 14.14%. The increase was primarily due to an increase in salaries and benefits of $6.86 million, or 18.46%, which was largely due to the addition of Highlands employees. In addition, occupancy and furniture and equipment expense increase a combined total of $1.81 million and was primarily driven by the addition of branch locations acquired in the Highlands transaction.
2019 Compared to 2018. Noninterest expense decreased $10 thousand, or 0.01%, which was largely due to one-time charges recognized in 2019 for goodwill impairment related to the divestiture of the Company’s remaining insurance agency assets of $1.49 million and the loss on extinguishment of the Company’s remaining FHLB debt of $1.10 million. In addition, other operating expense decreased $798 thousand due to property write-downs that occurred in 2019 and FDIC premiums decreased $588 thousand due to small bank assessment credits received from the FDIC. These decreases were offset by an increase in merger expenses of $2.12 million related to the Highlands acquisition as well as increases in service fees, furniture and equipment expense, and an increase in salaries and employee benefits totaling $1.52 million.
Income Tax Expense
The Company’s effective tax rate, income tax as a percent of pre-tax income, may vary significantly from the statutory rate due to permanent differences and available tax credits. Permanent differences are income and expense items excluded by law in the calculation of taxable income. The Company’s most significant permanent differences generally include interest income on municipal securities and increases in the cash surrender value of life insurance policies.
2021 Compared to 2020. Income tax expense increased $5.17 million or 50.80%, and is primarily attributable to the increase in pre-tax net income. The Tax Reform Act enacted on December 22, 2017, reduced our federal statutory incomeeffective tax rate from 35%increased to 21% beginning January 1, 2018.23.09% in 2021 compared to 22.09% in 2020.
2020 Compared to 2019. Income tax expense decreased $808 thousand, or 7.35%, and is primarily attributable to the decrease in pre-tax net income. The effective tax rate increased to 22.09% in 2020 compared to 22.08% in 2019.
2019 Compared to 2018. Income tax expense increased $2.21 million, or 25.19%, and the effective tax rate increased to 22.08% in 2019 compared to 19.46% in 2018. The lower effective rate in 2019 was primarily due to the enactment of the Tax Reform Act and the completion of the deferred tax asset revaluation, which resulted in a $1.67 million reduction in tax expense.
Financial Condition
Total assets as of December 31, 2020,2021, increased $212.29$183.38 million, or 7.58%6.09%, to $3.01$3.19 billion from $2.80$3.01 billion as of December 31, 2019.2020. The increase is primarily attributable to the increase in overnight funds of $247.76$231.28 million, or 167.40%58.44%. TotalIn addition, total liabilities as of December 31, 2020,2021, increased $214.38$182.34 million, or 9.05%7.06%, to $2.58$2.77 billion from $2.37$2.58 billion as of December 31, 2019.2020. The increase is primarily the result of an increase in total deposits of $216.34$183.14 million, or 9.29%7.19%. The increase in deposits is primarily attributable to the significant increase in demand deposits due to the unprecedented level of stimulus payments from the Federal Governmentfederal government in response to the pandemic.
Investment Securities
Our investment securities are used to generate interest income through the deployment of excess funds, to fund loan demand or deposit liquidation, to pledge as collateral where required, and to make selective investments for Community Reinvestment Act purposes. The composition of our investment portfolio changes from time to time as we consider our liquidity needs, interest rate expectations, asset/liability management strategies, and capital requirements. Available-for-sale debt securities as of December 31, 2020,2021, decreased $86.22$7.07 million, or 50.84%8.48%, compared to December 31, 2019.2020. The decrease was primarily attributable to sales of $51.03$27.26 million primarily due to the liquidation of the Highlands portfolio, as well asfrom maturities, prepayments, and calls of $44.68 million offset by purchases of $10.27$22.39 million. The market value of debt securities available for sale as a percentage of amortized cost was 100.02% as of December 31, 2021 compared to 101.71% as of December 31, 2020 compared to 100.65% as of December 31, 2019.2020. There were no held-to-maturity debt securities as of December 31, 2020 or2021or December 31, 2019. The remaining debt securities in the held-to-maturity category in 2018 matured during the first quarter of 2019. The funds were used to repay the Company’s remaining wholesale repurchase agreement of $25 million.2020 The following table presents the amortized cost and fair value of debt securities as of the dates indicated:
December 31, | December 31, | |||||||||||||||||||||||||||||||||||||||
2020 | 2019 | 2018 | 2021 | 2020 | ||||||||||||||||||||||||||||||||||||
Amortized | Fair | Amortized | Fair | Amortized | Fair | Amortized | Fair | Amortized | Fair | |||||||||||||||||||||||||||||||
(Amounts in thousands) | Cost | Value | Cost | Value | Cost | Value | Cost | Value | Cost | Value | ||||||||||||||||||||||||||||||
Available for Sale | ||||||||||||||||||||||||||||||||||||||||
U.S. Agency securities | $ | 555 | $ | 551 | $ | 5,038 | $ | 5,034 | $ | 1,108 | $ | 1,113 | $ | 469 | $ | 466 | $ | 555 | $ | 551 | ||||||||||||||||||||
U.S. Treasury securities | — | — | — | — | 19,970 | 19,960 | — | — | — | — | ||||||||||||||||||||||||||||||
Municipal securities | 43,950 | 44,459 | 85,992 | 86,878 | 96,886 | 97,289 | 28,596 | 28,794 | 43,950 | 44,459 | ||||||||||||||||||||||||||||||
Single issue trust preferred securites | — | — | — | — | — | — | ||||||||||||||||||||||||||||||||||
Corporate Notes | 9,935 | 9,919 | — | — | ||||||||||||||||||||||||||||||||||||
Mortgage-backed Agency securities | 37,453 | 38,348 | 77,448 | 77,662 | 35,513 | 34,754 | 37,273 | 37,113 | 37,453 | 38,348 | ||||||||||||||||||||||||||||||
Total securities available for sale | $ | 81,958 | $ | 83,358 | $ | 168,478 | $ | 169,574 | $ | 153,477 | $ | 153,116 | $ | 76,273 | $ | 76,292 | $ | 81,958 | $ | 83,358 | ||||||||||||||||||||
Fair value to amortized cost | 101.71 | % | 100.65 | % | 99.76 | % | 100.02 | % | 101.71 | % | ||||||||||||||||||||||||||||||
Held to Maturity | ||||||||||||||||||||||||||||||||||||||||
U.S. Agency securities | $ | — | $ | — | $ | — | $ | — | $ | 17,887 | $ | 17,867 | ||||||||||||||||||||||||||||
Corporate securities | — | — | — | — | 7,126 | 7,123 | ||||||||||||||||||||||||||||||||||
Total securities held to maturity | $ | — | $ | — | $ | — | $ | — | $ | 25,013 | $ | 24,990 | ||||||||||||||||||||||||||||
Fair value to amortized cost | 99.91 | % | ||||||||||||||||||||||||||||||||||||||
The following table provides information about our investment portfolio as of the dates indicated:
December 31, | ||||||||||||||||||||||||||||||||
2020 | 2019 | December 31, | ||||||||||||||||||||||||||||||
| Available for Sale | Held to Maturity | Total | Available for Sale | Held to Maturity | Total | 2021 | 2020 | |||||||||||||||||||||||||
(Amounts in years) | ||||||||||||||||||||||||||||||||
Average life | 5.02 | N/A | 5.02 | 6.41 | N/A | 6.41 | 4.74 | 5.02 | ||||||||||||||||||||||||
Average duration | 1.84 | N/A | 1.84 | 5.30 | N/A | 5.30 | 2.99 | 1.84 | ||||||||||||||||||||||||
There were no holdings of any one issuer, other than the U.S. government and its agencies, in an amount greater than 10% of our total consolidated shareholders’ equity as of December 31, 20202021 or 2019.2020.
The following table presents the amortized cost, fair value, and weighted-average yield of available-for-sale debt securities by contractual maturity, as of December 31, 2020.2021. Actual maturities could differ from contractual maturities because issuers may have the right to call or prepay obligations with or without penalties.
Available-for-Sale Securities | ||||||||||||||||||||||||||||||||||||||||
(Amounts in thousands) | U.S. Agency Securities | U.S. Treasury Securities | Municipal Securities | Total | Tax Equivalent Purchase Yield(1) | U.S. Agency Securities | Municipal Securities | Corporate Notes | Total | Tax Equivalent Purchase Yield(1) | ||||||||||||||||||||||||||||||
Amortized cost maturity: | ||||||||||||||||||||||||||||||||||||||||
One year or less | $ | — | $ | — | $ | — | $ | — | — | $ | — | $ | 735 | $ | 7,382 | $ | 8,117 | 0.46 | % | |||||||||||||||||||||
After one year through five years | — | — | 24,485 | 24,485 | 3.78 | % | — | 19,425 | 2,553 | 21,978 | 3.35 | % | ||||||||||||||||||||||||||||
After five years through ten years | 555 | — | 19,465 | 20,020 | 3.24 | % | 469 | 8,436 | — | 8,905 | 3.17 | % | ||||||||||||||||||||||||||||
After ten years | — | — | — | — | — | — | — | — | — | — | ||||||||||||||||||||||||||||||
Amortized cost | $ | 555 | $ | — | $ | 43,950 | 44,505 | $ | 469 | $ | 28,596 | $ | 9,935 | 39,000 | ||||||||||||||||||||||||||
Mortgage-backed securities | 37,453 | 2.13 | % | 37,273 | 1.61 | % | ||||||||||||||||||||||||||||||||||
Total amortized cost | $ | 81,958 | $ | 76,273 | ||||||||||||||||||||||||||||||||||||
Tax equivalent purchase yield(1) | 2.09 | % | — | 3.56 | % | 3.54 | % | 2.07 | % | 3.57 | % | 0.25 | % | 2.71 | % | |||||||||||||||||||||||||
Average contractual maturity (in years) | 6.05 | — | 4.75 | 4.77 | 5.07 | 3.75 | 0.63 | 2.97 | ||||||||||||||||||||||||||||||||
Fair value maturity: | ||||||||||||||||||||||||||||||||||||||||
One year or less | $ | — | $ | — | $ | — | $ | — | $ | — | $ | 736 | $ | 7,372 | $ | 8,108 | ||||||||||||||||||||||||
After one year through five years | — | — | 24,703 | 24,703 | — | 19,537 | 2,547 | 22,084 | ||||||||||||||||||||||||||||||||
After five years through ten years | 551 | — | 19,756 | 20,307 | 466 | 8,521 | — | 8,987 | ||||||||||||||||||||||||||||||||
After ten years | — | — | — | — | — | — | — | — | ||||||||||||||||||||||||||||||||
Fair value | $ | 551 | $ | — | $ | 44,459 | 45,010 | $ | 466 | $ | 28,794 | $ | 9,919 | 39,179 | ||||||||||||||||||||||||||
Mortgage-backed securities | 38,348 | 37,113 | ||||||||||||||||||||||||||||||||||||||
Total fair value | $ | 83,358 | $ | 76,292 | ||||||||||||||||||||||||||||||||||||
(1) | FTE basis of 21% | ||||||
InvestmentOn January 1, 2021, we adopted ASU 2016-13, CECL. Management evaluates securities for impairment where there has been a decline in fair value below the amortized cost basis of a security to determine whether there is a credit loss associated with the decline in fair value on at least a quarterly basis, and more frequently when economic or market concerns warrant such evaluation. Credit losses are calculated individually, rather than collectively, using a discounted cash flow method, whereby Management compares the present value of expected cash flows with the amortized cost basis of the security. The credit loss component would be recognized through the provision for credit losses and the creation of an allowance for credit losses. Consideration is given to (1) the financial condition and near-term prospects of the issuer including looking at default and delinquency rates, (2) the outlook for receiving the contractual cash flows of the investments, (3) the length of time and the extent to which the fair value has been less than cost, (4) our intent and ability to retain its investment in the issuer for a period of time sufficient to allow for any anticipated recovery in fair value or for a debt security whether it is more-likely-than-not that we will be required to sell the debt security prior to recovering its fair value, (5) the anticipated outlook for changes in the general level of interest rates, (6) credit ratings, (7) third party guarantees, and (8) collateral values. In analyzing an issuer’s financial condition, management considers whether the securities are reviewedissued by the federal government or its agencies, whether downgrades by bond rating agencies have occurred, the results of reviews of the issuer’s financial condition, and the issuer’s anticipated ability to pay the contractual cash flows of the investments. U.S. Treasury Securities, Agency-Backed Securities including GNMA, FHLMC, FNMA, FHLB, FFCB and SBA. All of the U.S. Treasury and Agency-Backed Securities have the full faith and credit backing of the United State Government or one of its agencies. Municipal securities and all other securities that do not have a zero expected credit loss are evaluated quarterly to determine whether there is a credit loss associated with a decline in fair value. Based on the application of the new standard, and that all debt securities available for indicationssale in an unrealized loss position as of other-than-temporary impairment (“OTTI”) charges.December 31, 2021continue to perform as scheduled; we do not believe that a provision for credit losses is necessary in 2021. We recognized no OTTIimpairment charges in earnings associated with debt securities in 2020 or 2019.2020. For additional information, see Note 1, “Basis of Presentation and Accounting Policies,” and Note 3, “Debt Securities,” to the Consolidated Financial Statements in Item 8, of this report.
Loans Held for Investment
Loans held for investment, our largest component of interest income, are grouped into commercial, consumer real estate, and consumer and other loan segments. Each segment is divided into various loan classes based on collateral or purpose. CertainEffective September 28, 2021, the Company terminated its remaining loss share agreement with the FDIC associated with Waccamaw Bank and received a payment of $176 thousand in consideration. The termination elimates the FDIC guarantee on particular loan losses associated with Waccamaw Bank and removes future responsibility related to the agreement. Prior to the termination, certain loans acquired in the FDIC-assisted transactions aretransaction were covered under the loss share agreements (“agreement and noted as covered loans”).loans. Covered loans were $9.68 million at year-end 2020. The general characteristics of each loan segment are as follows:
● | Commercial loans – This segment consists of loans to small and mid-size industrial, commercial, and service |
● | Consumer real estate loans – This segment consists of largely of loans to individuals within our market footprint for home equity loans and lines of credit and for the |
● | Consumer and other loans – This segment consists of loans to individuals within our market footprint that include, but are not limited to, automobile, credit cards, personal lines of credit, |
Total loans held for investment, net of unearned income, as of December 31, 2020, increased $72.172021, decreased $21.06 million, or 3.41%0.96%, compared to December 31, 2019. Covered loans decreased $3.18 million, or 24.73%, as the Waccamaw Bank (“Waccamaw”) covered loan portfolio continues to pay down.2020. We had no foreign loans or loan concentrations to any single borrower or industry, which are not otherwise disclosed as a category of loans that represented 10% or more of outstanding loans, as of December 31, 20202021 or 2019.2020. For additional information, see Note 4, “Loans,” to the Consolidated Financial Statements in Item 8 of this report.
The following table presents loans, net of unearned income and by loan class, as of the dates indicated:
December 31, | December 31, | |||||||||||||||||||||||||||
(Amounts in thousands) | 2020 | 2019 | 2018 | 2017 | 2016 | 2021 | 2020 | |||||||||||||||||||||
Non-covered loans held for investment | ||||||||||||||||||||||||||||
Loans held for investment | ||||||||||||||||||||||||||||
Commercial loans | ||||||||||||||||||||||||||||
Construction, development, and other land | $ | 44,649 | $ | 48,659 | $ | 63,508 | $ | 60,017 | $ | 56,948 | $ | 65,806 | $ | 44,674 | ||||||||||||||
Commercial and industrial | 173,024 | 142,962 | 104,863 | 92,188 | 92,204 | 133,630 | 173,024 | |||||||||||||||||||||
Multi-family residential | 115,161 | 121,840 | 107,012 | 125,202 | 134,228 | 100,402 | 115,161 | |||||||||||||||||||||
Single family non-owner occupied | 187,598 | 163,181 | 140,097 | 141,670 | 142,965 | 198,778 | 187,783 | |||||||||||||||||||||
Non-farm, non-residential | 734,793 | 727,261 | 613,877 | 616,633 | 598,674 | 707,506 | 734,793 | |||||||||||||||||||||
Agricultural | 9,749 | 11,756 | 8,545 | 7,035 | 6,003 | 9,341 | 9,749 | |||||||||||||||||||||
Farmland | 19,761 | 23,155 | 18,905 | 25,649 | 31,729 | 15,013 | 19,761 | |||||||||||||||||||||
Total commercial loans | 1,284,735 | 1,238,814 | 1,056,807 | 1,068,394 | 1,062,751 | 1,230,476 | 1,284,945 | |||||||||||||||||||||
Consumer real estate loans | ||||||||||||||||||||||||||||
Home equity lines | 89,432 | 110,078 | 93,466 | 103,205 | 106,361 | 79,857 | 96,526 | |||||||||||||||||||||
Single family owner occupied | 658,678 | 620,697 | 510,963 | 502,686 | 500,891 | 703,864 | 661,054 | |||||||||||||||||||||
Owner occupied construction | 17,720 | 17,241 | 18,171 | 39,178 | 44,535 | 16,910 | 17,720 | |||||||||||||||||||||
Total consumer real estate loans | 765,830 | 748,016 | 622,600 | 645,069 | 651,787 | 800,631 | 775,300 | |||||||||||||||||||||
Consumer and other loans | ||||||||||||||||||||||||||||
Consumer loans | 120,373 | 110,027 | 71,552 | 70,772 | 77,445 | 129,794 | 120,373 | |||||||||||||||||||||
Other | 6,014 | 4,742 | 5,310 | 5,001 | 3,971 | 4,668 | 6,014 | |||||||||||||||||||||
Total consumer and other loans | 126,387 | 114,769 | 76,862 | 75,773 | 81,416 | 134,462 | 126,387 | |||||||||||||||||||||
Total non-covered loans | 2,176,952 | 2,101,599 | 1,756,269 | 1,789,236 | 1,795,954 | |||||||||||||||||||||||
Total covered loans | 9,680 | 12,861 | 18,815 | 27,948 | 56,994 | |||||||||||||||||||||||
Total loans held for investment, net of unearned income | 2,186,632 | 2,114,460 | 1,775,084 | 1,817,184 | 1,852,948 | |||||||||||||||||||||||
Total loans | 2,165,569 | 2,186,632 | ||||||||||||||||||||||||||
Less: allowance for loan losses | 26,182 | 18,425 | 18,267 | 19,276 | 17,948 | 27,858 | 26,182 | |||||||||||||||||||||
Total loans held for investment, net of unearned income and allowance | $ | 2,160,450 | $ | 2,096,035 | $ | 1,756,817 | $ | 1,797,908 | $ | 1,835,000 | $ | 2,137,711 | $ | 2,160,450 | ||||||||||||||
Loans held for sale | $ | — | $ | 263 | $ | — | $ | — | $ | — | ||||||||||||||||||
The following table presents covered loans, by loan class, as of the dates indicated:
December 31, | ||||||||||||||||||||
(Amounts in thousands) | 2020 | 2019 | 2018 | 2017 | 2016 | |||||||||||||||
Commercial loans | ||||||||||||||||||||
Construction, development, and other land | $ | 25 | $ | 28 | $ | 35 | $ | 39 | $ | 4,570 | ||||||||||
Commercial and industrial | — | — | — | — | 895 | |||||||||||||||
Multi-family residential | — | — | — | — | 8 | |||||||||||||||
Single family non-owner occupied | 185 | 199 | 238 | 284 | 962 | |||||||||||||||
Non-farm, non-residential | — | 3 | 6 | 9 | 7,512 | |||||||||||||||
Agricultural | — | — | — | — | 25 | |||||||||||||||
Farmland | — | — | — | — | 397 | |||||||||||||||
Total commercial loans | 210 | 230 | 279 | 332 | 14,369 | |||||||||||||||
Consumer real estate loans | ||||||||||||||||||||
Home equity lines | 7,094 | 9,853 | 15,284 | 23,720 | 35,817 | |||||||||||||||
Single family owner occupied | 2,376 | 2,778 | 3,252 | 3,896 | 6,729 | |||||||||||||||
Owner occupied construction | — | — | — | — | — | |||||||||||||||
Total consumer real estate loans | 9,470 | 12,631 | 18,536 | 27,616 | 42,546 | |||||||||||||||
Consumer and other loans | ||||||||||||||||||||
Consumer loans | — | — | — | — | 79 | |||||||||||||||
Total covered loans | $ | 9,680 | $ | 12,861 | $ | 18,815 | $ | 27,948 | $ | 56,994 | ||||||||||
The following table presents the percentage of loans to total loans in the non-covered portfolio, by loan class, as of the dates indicated:
December 31, | ||||||||||||||||||||
2020 | 2019 | 2018 | 2017 | 2016 | ||||||||||||||||
Commercial loans | ||||||||||||||||||||
Construction, development, and other land | 2.04 | % | 2.31 | % | 3.61 | % | 3.36 | % | 3.17 | % | ||||||||||
Commercial and industrial | 7.95 | % | 6.80 | % | 5.97 | % | 5.15 | % | 5.13 | % | ||||||||||
Multi-family residential | 5.29 | % | 5.80 | % | 6.09 | % | 7.00 | % | 7.47 | % | ||||||||||
Single family non-owner occupied | 8.62 | % | 7.76 | % | 7.98 | % | 7.92 | % | 7.96 | % | ||||||||||
Non-farm, non-residential | 33.75 | % | 34.62 | % | 34.95 | % | 34.46 | % | 33.34 | % | ||||||||||
Agricultural | 0.45 | % | 0.56 | % | 0.49 | % | 0.39 | % | 0.34 | % | ||||||||||
Farmland | 0.91 | % | 1.10 | % | 1.08 | % | 1.43 | % | 1.77 | % | ||||||||||
Total commercial loans | 59.01 | % | 58.95 | % | 60.17 | % | 59.71 | % | 59.18 | % | ||||||||||
Consumer real estate loans | ||||||||||||||||||||
Home equity lines | 4.11 | % | 5.24 | % | 5.32 | % | 5.77 | % | 5.92 | % | ||||||||||
Single family owner occupied | 30.26 | % | 29.52 | % | 29.09 | % | 28.09 | % | 27.89 | % | ||||||||||
Owner occupied construction | 0.81 | % | 0.83 | % | 1.04 | % | 2.19 | % | 2.48 | % | ||||||||||
Total consumer real estate loans | 35.18 | % | 35.59 | % | 35.45 | % | 36.05 | % | 36.29 | % | ||||||||||
Consumer and other loans | ||||||||||||||||||||
Consumer loans | 5.54 | % | 5.25 | % | 4.08 | % | 3.96 | % | 4.31 | % | ||||||||||
Other | 0.27 | % | 0.21 | % | 0.30 | % | 0.28 | % | 0.22 | % | ||||||||||
Total consumer and other loans | 5.81 | % | 5.46 | % | 4.38 | % | 4.24 | % | 4.53 | % | ||||||||||
Total non-covered loans | 100.00 | % | 100.00 | % | 100.00 | % | 100.00 | % | 100.00 | % | ||||||||||
December 31, | ||||||||
2021 | 2020 | |||||||
Commercial loans | ||||||||
Construction, development, and other land | 3.04 | % | 2.04 | % | ||||
Commercial and industrial | 6.17 | % | 7.91 | % | ||||
Multi-family residential | 4.64 | % | 5.27 | % | ||||
Single family non-owner occupied | 9.18 | % | 8.59 | % | ||||
Non-farm, non-residential | 32.67 | % | 33.60 | % | ||||
Agricultural | 0.43 | % | 0.45 | % | ||||
Farmland | 0.69 | % | 0.91 | % | ||||
Total commercial loans | 56.82 | % | 58.77 | % | ||||
Consumer real estate loans | ||||||||
Home equity lines | 3.69 | % | 4.41 | % | ||||
Single family owner occupied | 32.50 | % | 30.23 | % | ||||
Owner occupied construction | 0.78 | % | 0.81 | % | ||||
Total consumer real estate loans | 36.97 | % | 35.45 | % | ||||
Consumer and other loans | ||||||||
Consumer loans | 5.99 | % | 5.50 | % | ||||
Other | 0.22 | % | 0.28 | % | ||||
Total consumer and other loans | 6.21 | % | 5.78 | % | ||||
Total loans | 100.00 | % | 100.00 | % | ||||
The following table presents the percentage of loans to total loans in the covered portfolio, by loan class, as of the dates indicated:
December 31, | ||||||||||||||||||||
2020 | 2019 | 2018 | 2017 | 2016 | ||||||||||||||||
Commercial loans | ||||||||||||||||||||
Construction, development, and other land | 0.26 | % | 0.22 | % | 0.19 | % | 0.14 | % | 8.02 | % | ||||||||||
Commercial and industrial | 0.00 | % | 0.00 | % | 0.00 | % | 0.00 | % | 1.57 | % | ||||||||||
Multi-family residential | 0.00 | % | 0.00 | % | 0.00 | % | 0.00 | % | 0.01 | % | ||||||||||
Single family non-owner occupied | 1.91 | % | 1.55 | % | 1.26 | % | 1.02 | % | 1.69 | % | ||||||||||
Non-farm, non-residential | 0.00 | % | 0.02 | % | 0.03 | % | 0.03 | % | 13.18 | % | ||||||||||
Agricultural | 0.00 | % | 0.00 | % | 0.00 | % | 0.00 | % | 0.04 | % | ||||||||||
Farmland | 0.00 | % | 0.00 | % | 0.00 | % | 0.00 | % | 0.70 | % | ||||||||||
Total commercial loans | 2.17 | % | 1.79 | % | 1.48 | % | 1.19 | % | 25.21 | % | ||||||||||
Consumer real estate loans | ||||||||||||||||||||
Home equity lines | 73.28 | % | 76.61 | % | 81.23 | % | 84.87 | % | 62.84 | % | ||||||||||
Single family owner occupied | 24.55 | % | 21.60 | % | 17.29 | % | 13.94 | % | 11.81 | % | ||||||||||
Owner occupied construction | 0.00 | % | 0.00 | % | 0.00 | % | 0.00 | % | 0.00 | % | ||||||||||
Total consumer real estate loans | 97.83 | % | 98.21 | % | 98.52 | % | 98.81 | % | 74.65 | % | ||||||||||
Consumer and other loans | ||||||||||||||||||||
Consumer loans | 0.00 | % | 0.00 | % | 0.00 | % | 0.00 | % | 0.14 | % | ||||||||||
Total covered loans | 100.00 | % | 100.00 | % | 100.00 | % | 100.00 | % | 100.00 | % | ||||||||||
The following table presents the maturities and rate sensitivities of the non-covered loan portfolio as of December 31, 2020:2021:
(Amounts in thousands) | Due in One Year or Less | Due After One Year Through Five Years | Due After Five Years | Total | Due in One Year or Less | Due After One Year Through Five Years | Due After Five Through Fifteen Years | Due After Fifteen Years | Total | |||||||||||||||||||||||||||
Commercial loans | ||||||||||||||||||||||||||||||||||||
Construction, development, and other land(1) | $ | 8,954 | $ | 8,533 | $ | 27,162 | $ | 44,649 | $ | 2,982 | $ | 10,518 | $ | 26,078 | $ | 26,228 | $ | 65,806 | ||||||||||||||||||
Commercial and industrial | 18,539 | 117,394 | 37,091 | 173,024 | 19,205 | 78,649 | 35,322 | 454 | 133,630 | |||||||||||||||||||||||||||
Multi-family residential | 3,197 | 19,411 | 92,553 | 115,161 | 1,303 | 19,957 | 55,405 | 23,737 | 100,402 | |||||||||||||||||||||||||||
Single family non-owner occupied | 8,900 | 21,630 | 157,068 | 187,598 | 5,560 | 18,126 | 75,297 | 99,795 | 198,778 | |||||||||||||||||||||||||||
Non-farm, non-residential | 54,172 | 169,001 | 511,620 | 734,793 | 51,274 | 122,883 | 289,248 | 244,101 | 707,506 | |||||||||||||||||||||||||||
Agricultural | 1,615 | 7,174 | 960 | 9,749 | 994 | 6,702 | 1,645 | — | 9,341 | |||||||||||||||||||||||||||
Farmland | 2,329 | 6,414 | 11,018 | 19,761 | 1,650 | 4,262 | 6,373 | 2,728 | 15,013 | |||||||||||||||||||||||||||
Total commercial loans | 97,706 | 349,557 | 837,472 | 1,284,735 | 82,968 | 261,097 | 489,368 | 397,043 | 1,230,476 | |||||||||||||||||||||||||||
Consumer real estate loans | ||||||||||||||||||||||||||||||||||||
Home equity lines | 5,263 | 11,912 | 72,257 | 89,432 | 7,028 | 14,162 | 47,833 | 10,834 | 79,857 | |||||||||||||||||||||||||||
Single family owner occupied | 2,734 | 21,836 | 634,108 | 658,678 | 3,209 | 20,605 | 182,836 | 497,214 | 703,864 | |||||||||||||||||||||||||||
Owner occupied construction | 270 | 764 | 16,686 | 17,720 | — | 669 | 1,844 | 14,397 | 16,910 | |||||||||||||||||||||||||||
Total consumer real estate loans | 8,267 | 34,512 | 723,051 | 765,830 | 10,237 | 35,436 | 232,513 | 522,445 | 800,631 | |||||||||||||||||||||||||||
Consumer and other loans | ||||||||||||||||||||||||||||||||||||
Consumer loans | 9,770 | 87,023 | 23,580 | 120,373 | 6,830 | 89,574 | 31,493 | 1,897 | 129,794 | |||||||||||||||||||||||||||
Other | 6,014 | — | — | 6,014 | 4,668 | — | — | — | 4,668 | |||||||||||||||||||||||||||
Total consumer and other loans | 15,784 | 87,023 | 23,580 | 126,387 | 11,498 | 89,574 | 31,493 | 1,897 | 134,462 | |||||||||||||||||||||||||||
Total non-covered loans | $ | 121,757 | $ | 471,092 | $ | 1,584,103 | $ | 2,176,952 | ||||||||||||||||||||||||||||
Total loans | $ | 104,703 | $ | 386,107 | $ | 753,374 | $ | 921,385 | $ | 2,165,569 | ||||||||||||||||||||||||||
Rate sensitivities | ||||||||||||||||||||||||||||||||||||
Predetermined interest rate | $ | 77,371 | $ | 434,895 | $ | 862,277 | $ | 1,374,543 | $ | 75,595 | $ | 339,582 | $ | 501,013 | $ | 540,826 | $ | 1,457,016 | ||||||||||||||||||
Floating or adjustable interest rate | 44,385 | 36,197 | 721,827 | 802,409 | 29,108 | 46,525 | 252,360 | 380,560 | 708,553 | |||||||||||||||||||||||||||
Total non-covered loans | $ | 121,756 | $ | 471,092 | $ | 1,584,104 | $ | 2,176,952 | ||||||||||||||||||||||||||||
Total loans | $ | 104,703 | $ | 386,107 | $ | 753,373 | $ | 921,386 | $ | 2,165,569 | ||||||||||||||||||||||||||
(1) | Construction loans with maturities due after five years include construction to permanent loans that have not yet converted to principal and interest payments. | |||||
The following table presents the maturities and rate sensitivities of the covered loan portfolio as of December 31, 2020:
(Amounts in thousands) | Due in One Year or Less | Due After One Year Through Five Years | Due After Five Years | Total | ||||||||||||
Commercial loans | ||||||||||||||||
Construction, development, and other land | $ | — | $ | 25 | $ | — | $ | 25 | ||||||||
Single family non-owner occupied | 168 | 17 | — | 185 | ||||||||||||
Non-farm, non-residential | — | — | — | — | ||||||||||||
Total commercial loans | 168 | 42 | — | 210 | ||||||||||||
Consumer real estate loans | ||||||||||||||||
Home equity lines | 792 | 4,553 | 1,749 | 7,094 | ||||||||||||
Single family owner occupied | 8 | 202 | 2,166 | 2,376 | ||||||||||||
Total consumer real estate loans | 800 | 4,755 | 3,915 | 9,470 | ||||||||||||
Total covered loans | $ | 968 | $ | 4,797 | $ | 3,915 | $ | 9,680 | ||||||||
Rate sensitivities | ||||||||||||||||
Predetermined interest rate | $ | 222 | $ | 703 | $ | 2,192 | $ | 3,117 | ||||||||
Floating or adjustable interest rate | 746 | 4,094 | 1,723 | 6,563 | ||||||||||||
Total covered loans | $ | 968 | $ | 4,797 | $ | 3,915 | $ | 9,680 | ||||||||
Risk Elements
We seek to mitigate credit risk by following specific underwriting practices and by ongoing monitoring of our loan portfolio. Our underwriting practices include the analysis of borrowers’ prior credit histories, financial statements, tax returns, and cash flow projections; valuation of collateral based on independent appraisers’ reports; and verification of liquid assets. We believe our underwriting criteria are appropriate for the various loan types we offer; however, losses may occur that exceed the reserves established in our allowance for loan losses. We track certain credit quality indicators that include: trends related to the risk rating of commercial loans, the level of classified commercial loans, net charge-offs, nonperforming loans, and general economic conditions. The Company’sCompany has a loan review function generally analyzes all commercialindependent of credit administration that performs a risk-based review of a sample of loans and loan relationships greater than $4.00 million annuallyin the Company's commercial portfolio, and at various times duringconducts analytical review of credit quality on the year. Smaller commercial and retail loans are sampled for review during the year.Company's non-commercial portfolios.
Nonperforming assets consist of nonaccrual loans, accrual loans contractually past due 90 days or more, unseasoned troubled debt restructurings (“TDRs”), and OREO.other real estate owned ("OREO"). Ongoing activity in the classification and categories of nonperforming loans include collections on delinquencies, foreclosures, loan restructurings, and movements into or out of the nonperforming classification due to changing economic conditions, borrower financial capacity, or resolution efforts. Loans acquired with credit deterioration, with a discount, continue to accrue interest based on expected cash flows; therefore, PCI loans are not generally considered nonaccrual. For additional information, see Note 5, “Credit Quality,” to the Consolidated Financial Statements in Item 8 of this report.
The following table presents the components of nonperforming assets and related information as of the periods indicated:
December 31, | December 31, | |||||||||||||||||||||||||||||||||||||||
(Amounts in thousands) | 2020 | 2019 | 2018 | 2017 | 2016 | 2021 | 2020 | 2019 | 2018 | 2017 | ||||||||||||||||||||||||||||||
Non-covered nonperforming | ||||||||||||||||||||||||||||||||||||||||
Nonperforming | ||||||||||||||||||||||||||||||||||||||||
Nonaccrual loans | $ | 21,706 | $ | 16,113 | $ | 19,583 | $ | 18,997 | $ | 15,854 | $ | 20,768 | $ | 22,003 | $ | 16,357 | $ | 19,905 | $ | 19,339 | ||||||||||||||||||||
Accruing loans past due 90 days or more | 295 | 144 | 58 | 1 | — | 87 | 295 | 144 | 58 | 1 | ||||||||||||||||||||||||||||||
TDRs(1) | 187 | 720 | 161 | 120 | 114 | 1,367 | 187 | 720 | 161 | 120 | ||||||||||||||||||||||||||||||
Total non-covered nonperforming loans | 22,188 | 16,977 | 19,802 | 19,118 | 15,968 | 22,222 | 22,485 | 17,221 | 20,124 | 19,460 | ||||||||||||||||||||||||||||||
Non-covered OREO | 2,083 | 3,969 | 3,806 | 2,409 | 5,109 | |||||||||||||||||||||||||||||||||||
Total non-covered nonperforming assets | $ | 24,271 | $ | 20,946 | $ | 23,608 | $ | 21,527 | $ | 21,077 | ||||||||||||||||||||||||||||||
Covered nonperforming | ||||||||||||||||||||||||||||||||||||||||
Nonaccrual loans | $ | 297 | $ | 244 | $ | 322 | $ | 342 | $ | 608 | ||||||||||||||||||||||||||||||
Total covered nonperforming loans | 297 | 244 | 322 | 342 | 608 | |||||||||||||||||||||||||||||||||||
Covered OREO | — | — | 32 | 105 | 276 | |||||||||||||||||||||||||||||||||||
Total covered nonperforming assets | $ | 297 | $ | 244 | $ | 354 | $ | 447 | $ | 884 | ||||||||||||||||||||||||||||||
Total nonperforming | ||||||||||||||||||||||||||||||||||||||||
Nonaccrual loans | $ | 22,003 | $ | 16,357 | $ | 19,905 | $ | 19,339 | $ | 16,462 | ||||||||||||||||||||||||||||||
Accruing loans past due 90 days or more | 295 | 144 | 58 | 1 | — | |||||||||||||||||||||||||||||||||||
TDRs(1) | 187 | 720 | 161 | 120 | 114 | |||||||||||||||||||||||||||||||||||
Total nonperforming loans | 22,485 | 17,221 | 20,124 | 19,460 | 16,576 | |||||||||||||||||||||||||||||||||||
OREO | 2,083 | 3,969 | 3,838 | 2,514 | 5,385 | 1,015 | 2,083 | 3,969 | 3,838 | 2,514 | ||||||||||||||||||||||||||||||
Total nonperforming assets | $ | 24,568 | $ | 21,190 | $ | 23,962 | $ | 21,974 | $ | 21,961 | $ | 23,237 | $ | 24,568 | $ | 21,190 | $ | 23,962 | $ | 21,974 | ||||||||||||||||||||
Additional Information | ||||||||||||||||||||||||||||||||||||||||
Performing TDRs(2) | $ | 10,061 | $ | 5,855 | $ | 6,266 | $ | 7,614 | $ | 12,838 | ||||||||||||||||||||||||||||||
Total TDRs(3) | 10,248 | 6,575 | 6,427 | 7,734 | 12,952 | |||||||||||||||||||||||||||||||||||
Total TDRs(2) | 8,652 | 10,248 | 6,575 | 6,427 | 7,734 | |||||||||||||||||||||||||||||||||||
Gross interest income that would have been recorded under the original terms of restructured and nonperforming loans | — | 1,068 | 1,175 | 1,217 | 1,414 | 1,129 | 1,586 | 1,068 | 1,175 | 1,217 | ||||||||||||||||||||||||||||||
Actual interest income recorded on restructured and nonperforming loans | 473 | 277 | 264 | 222 | 424 | 422 | 473 | 277 | 264 | 222 | ||||||||||||||||||||||||||||||
Non-covered ratios | ||||||||||||||||||||||||||||||||||||||||
Nonperforming loans to total loans | 1.02 | % | 0.81 | % | 1.13 | % | 1.07 | % | 0.89 | % | ||||||||||||||||||||||||||||||
Nonperforming assets to total assets | 0.81 | % | 0.75 | % | 1.06 | % | 0.91 | % | 0.90 | % | ||||||||||||||||||||||||||||||
Non-PCI allowance to nonperforming loans | 118.00 | % | 108.53 | % | 92.25 | % | 100.83 | % | 112.32 | % | ||||||||||||||||||||||||||||||
Non-PCI allowance to total loans | 1.20 | % | 0.88 | % | 1.04 | % | 1.08 | % | 1.00 | % | ||||||||||||||||||||||||||||||
Total ratios | ||||||||||||||||||||||||||||||||||||||||
Nonperforming loans to total loans | 1.03 | % | 0.81 | % | 1.13 | % | 1.07 | % | 0.89 | % | 1.03 | % | 1.03 | % | 0.81 | % | 1.13 | % | 1.07 | % | ||||||||||||||||||||
Nonperforming assets to total assets | 0.82 | % | 0.76 | % | 1.07 | % | 0.92 | % | 0.92 | % | 0.73 | % | 0.82 | % | 0.76 | % | 1.07 | % | 0.92 | % | ||||||||||||||||||||
Allowance for loan losses to nonperforming loans | 116.44 | % | 106.99 | % | 90.77 | % | 99.05 | % | 108.28 | % | ||||||||||||||||||||||||||||||
Allowance for loan losses to total loans | 1.20 | % | 0.87 | % | 1.03 | % | 1.06 | % | 0.97 | % | ||||||||||||||||||||||||||||||
Allowance for credit losses to nonperforming loans | 125.36 | % | 116.44 | % | 106.99 | % | 90.77 | % | 99.05 | % | ||||||||||||||||||||||||||||||
Allowance for credit losses to total loans | 1.29 | % | 1.20 | % | 0.87 | % | 1.03 | % | 1.06 | % | ||||||||||||||||||||||||||||||
(1) | TDRs restructured within the past six months and nonperforming TDRs exclude nonaccrual TDRs of | ||||||
(2) |
| ||||||
| Total accruing TDRs exclude nonaccrual TDRs of | ||||||
Non-covered nonperformingNonperforming assets as of December 31, 2020, increased $3.332021, decreased $1.33 million, or 15.87%5.42%, from December 31, 2019,2020, primarily due to an increasedecreases of $5.59$1.24 million, or 34.71%5.61%, in non-covered nonaccrual loans, $1.07 million, or 51.27%, in OREO, offset by a $1.89$1.18 million increase, or 47.52% decrease in non-covered OREO, and a $533 thousand, or 74.03%631.02%, decrease in non-covered,increase non-performing troubled debt restructurings. Non-covered OREO, which is carried at the lesser of estimated net realizable value or cost, consisted of 2215 properties with an average holding period of 1612 months as of December 31, 2020.2021. The net loss on the sale of OREO was $231 thousand in 2021, $316 thousand in 2020, and $1.25 million in 2019, and $1.33 million in 2018.2019. The following table presents the changes in OREO during the periods indicated:
Year Ended December 31, | ||||||||||||||||||||||||||||||||
2020 | 2019 | Year Ended December 31, | ||||||||||||||||||||||||||||||
Non-covered | Covered | Total | Non-covered | Covered | Total | 2021 | 2020 | |||||||||||||||||||||||||
(Amounts in thousands) | ||||||||||||||||||||||||||||||||
Beginning balance | $ | 3,969 | $ | — | $ | 3,969 | $ | 3,806 | $ | 32 | $ | 3,838 | $ | 2,083 | $ | 3,969 | ||||||||||||||||
Acquired | — | — | — | 1,962 | — | 1,962 | ||||||||||||||||||||||||||
Additions | 695 | — | 695 | 3,030 | 131 | 3,161 | 1,283 | 695 | ||||||||||||||||||||||||
Disposals | (2,139 | ) | — | (2,139 | ) | (3,837 | ) | (152 | ) | (3,989 | ) | (2,063 | ) | (2,139 | ) | |||||||||||||||||
Valuation adjustments | (442 | ) | — | (442 | ) | (992 | ) | (11 | ) | (1,003 | ) | (288 | ) | (442 | ) | |||||||||||||||||
Ending balance | $ | 2,083 | $ | — | $ | 2,083 | $ | 3,969 | $ | — | $ | 3,969 | $ | 1,015 | $ | 2,083 | ||||||||||||||||
As of December 31, 2020, non-covered2021, nonaccrual loans were largely attributed to single family owner occupied (36.67%(43.13%) and non-farm, non-residential (29.22%(21.86%) loans. As of December 31, 2020,2021, approximately $6.09$3.45 million, or 28.06%16.63%, of non-covered nonaccrual loans were attributed to performing loans acquired in business combinations. Certain loans included in the nonaccrual category have been written down to estimated realizable value or assigned specific reserves in the allowance for loan losses based on management’s estimate of loss at ultimate resolution.
When restructuring loans for borrowers experiencing financial difficulty, we generally make concessions in interest rates, loan terms, or amortization terms. Certain TDRsTDR's are classified as nonperforming when modified and are returned to performing status after six months of satisfactory payment performance; however, these loans remain identified as impaired until full payment or other satisfactionsatification of the obligationobligations occurs. TotalAccruing TDRs as of December 31, 2020, increased $3.152021, decreased $1.60 million, or 35.27%15.57%, to $12.06$8.65 million from December 31, 2019.2020. Nonperforming accruing TDRs as of December 31, 2020, decreased $533 thousand,2021, increased $1.18 million, or 74.03%631.02%, to $187 thousand$1.37 million from December 31, 2019.2020. Nonperforming accruing TDRs as a percent of total accruing TDRs totaled 15.81% as of December 31, 2021, compared to 1.82% as of December 31, 2020, compared to 13.69%2020. There were no specific reserves on TDRs as of December 31, 2019. Specific reserves on TDRs totaled $233 thousand as of December 31, 2020,2021, compared to $353$233 thousand as of December 31, 2019.2020. When restructuring loans for borrowers experiencing financial difficulty, we generally make concessions in interest rates, loan terms, or amortization terms.
The Coronavirus Aid, Relief and Economic Security ("CARES")CARES Act included a provision allowing banks to not apply the guidance on accounting for troubled debt restructurings to loan modifications, such as extensions or deferrals, related to COVID-19 made between March 1, 2020, and the earlier of (i) December 31, 20202021, or (ii) 60 days after the end of the COVID-19 national emergency. The relief can only be applied to modifications for borrowers that were not more than 30 days past due as of December 31, 2019. The Company elected to adopt this provision of the CARES Act.
Through December 31, 2020,2021, we havehad modified 3,625 commercial and consumera total of 4,066 loans totaling $458.17 million.for $475.82 million related to COVID-19 relief. Those modifications were generally short-term payment deferrals and are not considered TDR'sTDRs based on the CARES Act. Our policy is to downgrade commercial loans modified for COVID-19 to special mention, which caused the significant increase in loans in that rating. Subsequent upgrade or downgrade will be on a case by case basis. The Company is upgradinghas upgraded these loans back to pass once the modification period has ended and timely contractual payments resume. Further downgrade would be based on a number of factors, including but not limited to additional modifications, payment performance and current underwriting. As of December 31, 2020,2021, current commercial and consumer COVID-19 loan deferrals stood at $26.54$2.92 million, and $5.72down significantly from $32.26 million respectively.at December 31, 2020.
The following table details the balance of commercial loans modified for short-term payment deferral under provision of the CARES Act as of the dates indicated.
December 31, 2020 | September 30, 2020 | June 30, 2020 | |||||||||||||||||||
Percent | Percent | Percent | |||||||||||||||||||
(unaudited, in thousands) | Balance | Modified | Balance | Modified | Balance | Modified | |||||||||||||||
Construction, development, and other land | $ | 1,409 | 3.15 | % | $ | 3,753 | 8.88 | % | $ | 14,377 | 27.33 | % | |||||||||
Commercial and industrial | 1,363 | 0.79 | % | 6,700 | 3.61 | % | 25,584 | 13.88 | % | ||||||||||||
Multi-family residential | 351 | 0.30 | % | 5,919 | 5.61 | % | 22,021 | 20.82 | % | ||||||||||||
Single family non-owner occupied | 1,683 | 0.90 | % | 7,049 | 3.65 | % | 39,135 | 20.75 | % | ||||||||||||
Commercial Real Estate - Hotel/Motel | 17,465 | 17.42 | % | 48,225 | 46.69 | % | 92,940 | 89.75 | % | ||||||||||||
Commercial Real Estate - Retail Strip Centers | — | — | 4,432 | 6.45 | % | 19,740 | 38.17 | % | |||||||||||||
Commercial Real Estate - Other | 3,968 | 0.69 | % | 22,912 | 3.92 | % | 116,871 | 20.58 | % | ||||||||||||
Agricultural | 33 | 0.34 | % | 1,322 | 12.93 | % | 3,464 | 33.29 | % | ||||||||||||
Farmland | 266 | 1.35 | % | 2,223 | 9.56 | % | 5,865 | 24.79 | % | ||||||||||||
Total commercial modifications | $ | 26,538 | 2.07 | % | $ | 102,535 | 7.78 | % | $ | 339,997 | 26.39 | % | |||||||||
Non-covered delinquentDelinquent loans, comprised of loans 30 days or more past due and nonaccrual loans, totaled $33.10 million as of December 31, 2021, an decrease of $2.61 million, or 7.32%, compared to $35.72 million as of December 31, 2020, an increase of $97 thousand, or 0.27%, compared to $35.62 million as of December 31, 2019. Non-covered delinquent2020. Delinquent loans as a percent of total non-covered loans totaled 1.53% as of December 31, 2021, which includes past due loans (0.57%) and nonaccrual loans (0.96%), compared to 1.64% as of December 31, 2020, which includes2020.
Allowance for CreditLosses (ACL)
The ACL reflects management’s estimate of losses that will result from the inability of our borrowers to make required loan payments. Management uses a systematic methodology to determine its ACL for loans held for investment and certain off-balance-sheet credit exposures. The ACL is a valuation account that is deducted from the amortized cost basis to present the net amount expected to be collected on the loan portfolio. Management considers the effects of past dueevents, current conditions, and reasonable and supportable forecasts on the collectability of the loan portfolio. The Company’s estimate of its ACL involves a high degree of judgment; therefore, management’s process for determining expected credit losses may result in a range of expected credit losses. It is possible that others, given the same information, may at any point in time reach a different reasonable conclusion. The Company’s ACL recorded in the balance sheet reflects management’s best estimate of expected credit losses. The Company recognizes in net income the amount needed to adjust the ACL for management’s current estimate of expected credit losses. The Company’s measurement of credit losses policy adheres to GAAP as well as interagency guidance. The Company's ACL is calculated using collectively evaluated and individually evaluated loans.
For collectively evaluated loans, (0.64%)the Company in general uses two modeling approaches to estimate expected credit losses. The Company projects the contractual run-off of its portfolio at the segment level and nonaccrual loans (1.00%), comparedincorporates a prepayment assumption in order to 1.69%estimate exposure at default. Financial assets that have been individually evaluated can be returned to a pool for purposes of estimating the expected credit loss insofar as of December 31, 2019.their credit profile improves and that the repayment terms were not considered to be unique to the asset
AllowanceIn addition to its own loss experience, management also includes peer bank historical loss experience in its assessment of expected credit losses to determine the ACL. The Company utilized call report data to measure historical credit loss experience with similar risk characteristics within the segments. For the majority of segment models for Loan Lossescollectively evaluated loans, the Company incorporated at least one macroeconomic driver either using a statistical regression modeling methodology or simple loss rate modeling methodology.
TheIncluded in its systematic methodology to determine its ACL for loans held for investment and certain off-balance-sheet credit exposures. Management considers the need to qualitatively adjust expected credit losses for information not already captured in the loss estimation process. These qualitative adjustments either increase or decrease the quantitative model estimation (i.e. formulaic model results). Each period the Company considers qualitative factors that are relevant within the qualitative framework. For further discussion of our Allowance for Credit Losses - See Note 1 - "Basis of Presentation - Significant Accounting Policies".
With the adoption of ASU 2016-13 effective January 1, 2021, the Company changed its method for calculating it allowance for loans from an incurred loss method to a life of loan losses is maintained at a level management deems sufficient to absorb probable loan losses inherent in the loan portfolio. The allowance is increased by the provisionmethod. See Note 1 – "Basis of Presentation - Significant Accounting Policies" for loan losses and recoveries of prior loan charge-offs and decreased by loans charged off. The provision for loan losses is calculated and charged to expense to bring the allowance to an appropriate level using a systematic process of measurement that requires significant judgments and estimates.further details. As of December 31, 2020, our qualitative risk factors reflect a increased risk of possible loan losses due to2021, the effectsbalance of the COVID-19 pandemic.ACL for loans was $27.86 million, or 1.29% of total loans. The loan portfolio is continually monitoredACL at December 31, 2021, increased $1.68 million from the balance of $26.18 million recorded before the adoption of the new standard on January 1, 2021. This increase included a $13.11 million cumulative adjustment for deteriorationthe adoption of ASU 2016-13 offset by a reversal of provision of $8.47 million and net charge-offs for the twelve months of $2.96 million. The reversal in provision for the twelve months ended December 31, 2021, was due largely to significantly improved forecasts for unemployment from those used at year-end 2020 .
At December 31, 2021, the Company also had an allowance for unfunded commitments of $678 thousand which was recorded in Other Liabilities on the Balance Sheet. With the adoption of ASU 2016-13 effective January 1, 2021, the Company increased its allowance for credit losses on unfunded commitments by $509 thousand. During 2021, the provision for credit losses on unfunded commitments was $103 thousand which may resultwas recorded in the need to increaseprovision for credit losses on the Statement of Income. The Company did not have an allowance for loancredit losses in future periods. or record a provision for credit losses on investment securities or other financial assets during 2021.
Management considered the allowance adequate as of December 31, 2020;2021; however, no assurance can be made that additions to the allowance will not be required in future periods. For additional information, see “Allowance for Loan Losses” in the “Critical Accounting Policies” section above and Note 6, “Allowance for Loan Losses,” to the Consolidated Financial Statements in Item 8 of this report.
The allowance for loan losses as of December 31, 2020, increased $7.76, or 42.10%, from December 31, 2019, primarily due the increased potential for loan defaults and losses related to the COVID-19 pandemic. The non-PCI allowance as a percent of non-covered loans totaled 1.20% as of December 31, 2020, compared to 0.88% as of December 31, 2019. PCI loans were aggregated into fifteen loan pools as of December 31, 2020 and five loan pools in 2019. The Highlands transaction added ten additional pools to the five existing pools from 2019. Effective January 1, 2020, the Company collapsed the PCI loans and discounts for Peoples and Waccamaw acquired loans into the non-PCI loan portfolio. The Highlands transaction added the following pools: 1-4 Family, Senior-Consumer, 1-4 Family Senior-Commercial, 1-4 Family, Junior and Home Equity Lines, Commercial Land and Development, Farmland and Agricultural, Multi-family, Commercial Real Estate – Owner Occupied, Commercial Real Estate – Non-owner Occupied, Commercial and Industrial, and Consumer. Net charge-offs increased $1.50 million, or 43.89% in 2020 compared to 2019.
The following table presents the changes in the allowance for loan losses,net charge-offs, by loan class, and the ratio to average loans during the periods indicated:
December 31, | December 31, | |||||||||||||||||||||||||||||||||||||||||||||||||||||||
2020 | 2019 | 2018 | 2017 | 2016 | 2021 | 2020 | 2019 | |||||||||||||||||||||||||||||||||||||||||||||||||
(Amounts in thousands) | Net (charge-offs) recoveries | Average Loans | Ratio of Net (charge-offs) recoveries to average loans | Net (charge-offs) recoveries | Average Loans | Ratio of Net (charge-offs) recoveries to average loans | Net (charge-offs) recoveries | Average Loans | Ratio of Net (charge-offs) recoveries to average loans | |||||||||||||||||||||||||||||||||||||||||||||||
Beginning balance | $ | 18,425 | $ | 18,267 | $ | 19,276 | $ | 17,948 | $ | 20,233 | ||||||||||||||||||||||||||||||||||||||||||||||
Provision for loan losses charged to operations, non-PCI loans | 12,668 | 3,571 | 2,393 | 2,783 | 1,296 | |||||||||||||||||||||||||||||||||||||||||||||||||||
(Recovery of) provision for loan losses charged to operations, PCI loans | — | — | — | (12 | ) | (41 | ) | |||||||||||||||||||||||||||||||||||||||||||||||||
Recovery of loan losses recorded through the FDIC indemnification asset | — | — | — | — | (1 | ) | ||||||||||||||||||||||||||||||||||||||||||||||||||
Charge-offs | ||||||||||||||||||||||||||||||||||||||||||||||||||||||||
Commercial loans | ||||||||||||||||||||||||||||||||||||||||||||||||||||||||
Construction, development, and other land | 349 | 353 | 100 | 427 | 254 | $ | (108 | ) | $ | 47,285 | -0.23 | % | $ | (83 | ) | $ | 44,493 | -0.19 | % | $ | (207 | ) | $ | 61,434 | -0.34 | % | ||||||||||||||||||||||||||||||
Commercial and industrial | 856 | 549 | 566 | 224 | 144 | (639 | ) | 173,206 | -0.37 | % | (679 | ) | 188,475 | -0.36 | % | (450 | ) | 118,080 | -0.38 | % | ||||||||||||||||||||||||||||||||||||
Multi-family residential | 295 | 310 | 16 | 9 | 64 | 302 | 102,175 | 0.30 | % | (256 | ) | 109,611 | -0.23 | % | (307 | ) | 89,534 | -0.34 | % | |||||||||||||||||||||||||||||||||||||
Single family non-owner occupied | 442 | 64 | 88 | 52 | 237 | 58 | 185,752 | 0.03 | % | (405 | ) | 173,431 | -0.23 | % | (52 | ) | 127,745 | -0.04 | % | |||||||||||||||||||||||||||||||||||||
Non-farm, non-residential | 650 | 1,015 | 119 | 142 | 1,684 | (696 | ) | 724,444 | -0.10 | % | (555 | ) | 746,127 | -0.07 | % | (469 | ) | 610,858 | -0.08 | % | ||||||||||||||||||||||||||||||||||||
Agricultural | 160 | 52 | 68 | — | — | (157 | ) | 9,441 | -1.66 | % | (149 | ) | 10,683 | -1.39 | % | (51 | ) | 9,367 | -0.54 | % | ||||||||||||||||||||||||||||||||||||
Farmland | 17 | 205 | 279 | 68 | 9 | (56 | ) | 16,799 | -0.33 | % | (12 | ) | 22,422 | -0.05 | % | (139 | ) | 14,797 | -0.94 | % | ||||||||||||||||||||||||||||||||||||
Total commercial loans | (1,296 | ) | 1,259,102 | -0.10 | % | (2,139 | ) | 1,295,242 | -0.17 | % | (1,675 | ) | 1,031,815 | -0.16 | % | |||||||||||||||||||||||||||||||||||||||||
Consumer real estate loans | ||||||||||||||||||||||||||||||||||||||||||||||||||||||||
Home equity lines | 145 | 474 | 285 | 13 | 1,073 | 397 | 82,861 | 0.48 | % | 117 | 103,289 | 0.11 | % | (73 | ) | 95,511 | -0.08 | % | ||||||||||||||||||||||||||||||||||||||
Single family owner occupied | 413 | 1,316 | 1,720 | 675 | 508 | 132 | 657,741 | 0.02 | % | (271 | ) | 610,532 | -0.04 | % | (271 | ) | 487,489 | -0.06 | % | |||||||||||||||||||||||||||||||||||||
Owner occupied construction | — | — | — | 11 | 31 | — | 27,529 | 0.00 | % | — | 20,918 | 0.00 | % | 42 | 17,019 | 0.25 | % | |||||||||||||||||||||||||||||||||||||||
Total consumer real estate loans | 529 | 768,131 | 0.07 | % | (154 | ) | 734,739 | 0.07 | % | (302 | ) | 600,019 | -0.05 | % | ||||||||||||||||||||||||||||||||||||||||||
Consumer and other loans | ||||||||||||||||||||||||||||||||||||||||||||||||||||||||
Consumer loans | 3,296 | 1,923 | 1,666 | 1,322 | 1,172 | (2,193 | ) | 125,866 | -1.74 | % | (2,618 | ) | 118,504 | -2.21 | % | (1,436 | ) | 89,413 | -1.61 | % | ||||||||||||||||||||||||||||||||||||
Total charge-offs | 6,623 | 6,261 | 4,907 | 2,943 | 5,176 | |||||||||||||||||||||||||||||||||||||||||||||||||||
Recoveries | ||||||||||||||||||||||||||||||||||||||||||||||||||||||||
Commercial loans | ||||||||||||||||||||||||||||||||||||||||||||||||||||||||
Construction, development, and other land | 266 | 146 | 210 | 306 | 282 | |||||||||||||||||||||||||||||||||||||||||||||||||||
Commercial and industrial | 177 | 99 | 200 | 160 | 484 | |||||||||||||||||||||||||||||||||||||||||||||||||||
Multi-family residential | 39 | 3 | 17 | 9 | 15 | |||||||||||||||||||||||||||||||||||||||||||||||||||
Single family non-owner occupied | 37 | 12 | 98 | 180 | 79 | |||||||||||||||||||||||||||||||||||||||||||||||||||
Non-farm, non-residential | 95 | 546 | 191 | 146 | 59 | |||||||||||||||||||||||||||||||||||||||||||||||||||
Agricultural | 11 | 1 | 7 | — | — | |||||||||||||||||||||||||||||||||||||||||||||||||||
Farmland | 5 | 66 | — | — | — | |||||||||||||||||||||||||||||||||||||||||||||||||||
Consumer real estate loans | ||||||||||||||||||||||||||||||||||||||||||||||||||||||||
Home equity lines | 262 | 401 | 216 | 201 | 137 | |||||||||||||||||||||||||||||||||||||||||||||||||||
Single family owner occupied | 142 | 1,045 | 238 | 108 | 182 | |||||||||||||||||||||||||||||||||||||||||||||||||||
Owner occupied construction | — | 42 | — | 105 | 39 | |||||||||||||||||||||||||||||||||||||||||||||||||||
Consumer and other | ||||||||||||||||||||||||||||||||||||||||||||||||||||||||
Consumer loans | 678 | 487 | 328 | 285 | 360 | |||||||||||||||||||||||||||||||||||||||||||||||||||
Total recoveries | 1,712 | 2,848 | 1,505 | 1,500 | 1,637 | |||||||||||||||||||||||||||||||||||||||||||||||||||
Net charge-offs | 4,911 | 3,413 | 3,402 | 1,443 | 3,539 | |||||||||||||||||||||||||||||||||||||||||||||||||||
Ending balance | $ | 26,182 | $ | 18,425 | $ | 18,267 | $ | 19,276 | $ | 17,948 | ||||||||||||||||||||||||||||||||||||||||||||||
Net charge-offs to average non-covered loans | 0.23 | % | 0.20 | % | 0.19 | % | 0.08 | % | 0.21 | % | ||||||||||||||||||||||||||||||||||||||||||||||
Net charge-offs to average total loans | 0.23 | % | 0.20 | % | 0.19 | % | 0.08 | % | 0.20 | % | ||||||||||||||||||||||||||||||||||||||||||||||
Total | $ | (2,960 | ) | $ | 2,153,099 | 0.14 | % | $ | (4,911 | ) | $ | 2,148,485 | -0.23 | % | $ | (3,413 | ) | $ | 1,721,247 | -0.20 | % | |||||||||||||||||||||||||||||||||||
The following table presents the allowance for loan losses, excluding PCI loans, by loan class, as of the dates indicated:
December 31, | ||||||||||||||||||||
(Amounts in thousands) | 2020 | 2019 | 2018 | 2017 | 2016 | |||||||||||||||
Commercial loans | �� | |||||||||||||||||||
Construction, development, and other land | $ | 528 | $ | 245 | $ | 417 | $ | 830 | $ | 889 | ||||||||||
Commercial and industrial | 1,024 | 699 | 663 | 762 | 495 | |||||||||||||||
Multi-family residential | 1,417 | 969 | 1,192 | 1,094 | 1,157 | |||||||||||||||
Single family non-owner occupied | 1,861 | 1,323 | 1,442 | 1,976 | 2,752 | |||||||||||||||
Non-farm, non-residential | 9,417 | 6,653 | 6,530 | 6,597 | 6,185 | |||||||||||||||
Agricultural | 218 | 145 | 85 | 51 | 43 | |||||||||||||||
Farmland | 196 | 201 | 170 | 362 | 169 | |||||||||||||||
Consumer real estate loans | ||||||||||||||||||||
Home equity lines | 799 | 673 | 748 | 803 | 895 | |||||||||||||||
Single family owner occupied | 7,957 | 5,528 | 5,853 | 5,710 | 4,364 | |||||||||||||||
Owner occupied construction | 195 | 124 | 131 | 297 | 228 | |||||||||||||||
Consumer and other loans | ||||||||||||||||||||
Consumer loans | 2,570 | 1,865 | 1,036 | 794 | 759 | |||||||||||||||
Total allowance, excluding PCI loans | $ | 26,182 | $ | 18,425 | $ | 18,267 | $ | 19,276 | $ | 17,936 | ||||||||||
December 31, | ||||||||||||||||
2021 | 2020 | |||||||||||||||
(Amounts in thousands) | Balance | Percentage of Total Allowance | Balance | Percentage of Total Allowance | ||||||||||||
Commercial loans | ||||||||||||||||
Construction, development, and other land | $ | 759 | 2.72 | % | $ | 528 | 2.02 | % | ||||||||
Commercial and industrial | 1,480 | 5.31 | % | 1,024 | 3.91 | % | ||||||||||
Multi-family residential | 863 | 3.10 | % | 1,417 | 5.41 | % | ||||||||||
Single family non-owner occupied | 2,586 | 9.28 | % | 1,861 | 7.11 | % | ||||||||||
Non-farm, non-residential | 8,877 | 31.87 | % | 9,417 | 35.97 | % | ||||||||||
Agricultural | 5 | 0.02 | % | 218 | 0.83 | % | ||||||||||
Farmland | 205 | 0.74 | % | 196 | 0.75 | % | ||||||||||
Consumer real estate loans | ||||||||||||||||
Home equity lines | 677 | 2.43 | % | 799 | 3.05 | % | ||||||||||
Single family owner occupied | 9,172 | 32.92 | % | 7,957 | 30.39 | % | ||||||||||
Owner occupied construction | 123 | 0.44 | % | 195 | 0.74 | % | ||||||||||
Consumer and other loans | ||||||||||||||||
Consumer loans | 3,111 | 11.17 | % | 2,570 | 9.82 | % | ||||||||||
Total allowance, excluding PCI loans | $ | 27,858 | 100.00 | % | $ | 26,182 | 100.00 | % | ||||||||
Deposits
Total deposits as of December 31, 2020,2021, increased $216.34$183.14 million, or 9.29%7.19%, compared to December 31, 2019. Time2020. Savings deposits, which consist of money market accounts and savings accounts, increased $100.81 million, interest-bearing demand deposits increased $78.11 million, noninterest-bearing demand deposits increased $69.99 million, time deposits, which consist of certificates of deposit and individual retirement accounts, decreased $95.00 million; savings deposits, which consist of money market accounts and savings accounts, increased $65.73 million; interest-bearing demand deposits increased $100.68 million while noninterest-bearing demand deposits increased $144.93$65.76 million, as of December 31, 2020,2021, compared to December 31, 2019.2020. We attribute the significant increase in demand deposits to the unprecedented level of stimulus payments from the Federal Governmentfederal government in response to the pandemic. We had no material deposit concentrations to any single customer or industry that represented 10% or more of outstanding deposits as of December 31, 20202021 or 2019.2020.
The following schedule presents the contractual maturities of time deposits of $100$250 thousand or more as of December 31, 2020:2021:
(Amounts in thousands) | ||||||||
Three months or less | $ | 22,487 | $ | 6,057 | ||||
Over three through six months | 24,516 | 2,268 | ||||||
Over six through twelve months | 32,584 | 8,861 | ||||||
Over twelve months | 74,197 | 9,952 | ||||||
| $ | 153,784 | $ | 27,138 | |||||
Borrowings
Total borrowings as of December 31, 2020, decreased $6372021, increased $572 thousand, or 39.79%59.34%, compared to December 31, 2019.2020. Total borrowings for 20202021 were comprised entirely of short-term borrowings, which consist of retail repurchase agreements. The weighted average rate increased 18decreased 27 basis points to 0.32%0.07% as of December 31, 2020,2021, compared to December 31, 2019.2020.
The following table presents the balances and weighted average rates paid on short-term borrowings for the periods indicated:
Year Ended December 31, | Year Ended December 31, | |||||||||||||||||||||||||||||||||||||||
2020 | 2019 | 2018 | 2021 | 2020 | ||||||||||||||||||||||||||||||||||||
Amount | Rate | Amount | Rate | Amount | Rate | Amount | Rate | Amount | Rate | |||||||||||||||||||||||||||||||
(Amounts in thousands) | ||||||||||||||||||||||||||||||||||||||||
Year-end balance | $ | 964 | 0.23 | % | $ | 1,601 | 0.16 | % | $ | 4,370 | 0.13 | % | $ | 1,536 | 0.07 | % | $ | 964 | 0.23 | % | ||||||||||||||||||||
Average annual balance | 1,181 | 0.32 | % | 2,471 | 0.14 | % | 4,010 | 0.12 | % | 1,194 | 0.07 | % | 1,181 | 0.34 | % | |||||||||||||||||||||||||
Maximum month-end balance | 2,348 | 28,508 | 29,305 | 1,536 | 2,348 | |||||||||||||||||||||||||||||||||||
Long-term borrowings consisted of a $40 thousand amortizing advance with the FHLB of Atlanta that was assumed in the Highlands transaction. That small borrowing was repaid early in 2020. In the first quarter of 2019, the Company’s remaining wholesale repurchase agreement of $25.00 million with a weighted average rate of 3.18% matured. During 2018, the prepayment of the FHLB advance resulted in a prepayment penalty of $1.10 million. The prepayment was funded with cash and equivalents on hand, as well as proceeds from the sale of single issue trust preferred investment securities, and resulted in annualized net pre-tax savings of approximately $800 thousand.
Liquidity and Capital Resources
Liquidity
Liquidity is a measure of our ability to convert assets tomeet current and future cash or raise cashflow needs as they become due. The liquidity of a financial institution reflects its ability to meet loan requests, to accommodate possible outflows in deposits and to take advantage of interest rate market opportunities. The ability of a financial obligations. We believe that liquidity management should encompass an overallinstituition to meet its current financial obligations is a function of its balance sheet approachstructure that draws together all sources and uses of liquidity. The objective of our liquidity management is to manage cash flow and liquidity reserves so that tthey are adequate to fund our operations and to meet obligations and other commitments on a timely basis and at a reasonable cost. We seek to achieve this objective and ensure that funding needs are met by maintaining an appropriate level of liquid funds throught asset/liability management, which includes managing the mix and time to maturity of financial assets and financial liabilities on our balance sheet.
Poor or inadequate liquidity risk management may result in a funding deficit that could have a material impact on our operations. We maintain a liquidity risk management policy and contingency funding policy (“Liquidity Plan”) to detect potential liquidity issues and protect our depositors, creditors, and shareholders. The Liquidity Plan includes various internal and external indicators that are reviewed on a recurring basis by our Asset/Liability Management Committee (“ALCO”) of the Board of Directors. ALCO reviews liquidity risk exposure and policies related to liquidity management; ensures that systems and internal controls are consistent with liquidity policies; and provides accurate reports about liquidity needs, sources, and compliance. The Liquidity Plan involves ongoing monitoring and estimation of potentially credit sensitive liabilities and the sources and amounts of balance sheet and external liquidity available to replace outflows during a funding crisis. The liquidity model incorporates various funding crisis scenarios and a specific action plan is formulated, and activated, when a financial shock that affects our normal funding activities is identified. Generally, the plan will reflect a strategy of replacing liability outflows with alternative liabilities, rather than balance sheet asset liquidity, to the extent that significant premiums can be avoided. If alternative liabilities are not available, outflows will be met through liquidation of balance sheet assets, including unpledged securities. As of December 31, 2021, management is not aware of any events that are reasonably likely to have a material adverse effect on our liquidity, capital resources or operations. In addtion, management is not aware of any regulatory recommendations regarding liquidity that would have a material adverse effect on the Company.
In the ordinary course of busisness we have entered into contractual obligations and have made other commitments to make future payments. Refer to the accompanying notes to the Consolidated Financial Statements in Item 8 of this report for the expected timing of such payments as of December 31, 2021. These include payments related to (i) operating leases (Note - 7 Premises, Equipment, and Leases ), (ii) time deposits with stated maturity dates (Note 9 - Deposits), and (iii) commitments to extend credit and standby letters of credit (Note - 19 Litigation, Commitments, and Contingencies).
As a financial holding company, the Company’s primary source of liquidity is dividends received from the Bank, which are subject to certain regulatory limitations. Other sources of liquidity include cash, investment securities, and borrowings. As of December 31, 2020,2021, the Company’s cash reserves and short-term investment securities totaled $10.09$17.65 million and availability on an unsecured, committed line of credit with an unrelated financial institution totaled $15.00 million. There was no outstanding balance on the line of credit as of December 31, 2020. The Company’s cash reserves and investments provide adequate working capital to meet obligations and projected dividends to shareholders and anticipated debt repayments for the next twelve months.
In addition to cash on hand and deposits with other financial institutions, we rely on customer deposits, cash flows from loans and investment securities, and lines of credit from the FHLB and the Federal Reserve Bank (“FRB”) Discount Window to meet potential liquidity demands. These sources of liquidity are immediately available to satisfy deposit withdrawals, customer credit needs, and our operations. Secondary sources of liquidity include approved lines of credit with correspondent banks and unpledged available-for-sale securities. As of December 31, 2020,2021, our unencumbered cash totaled $456.56$677.44 million, unused borrowing capacity from the FHLB totaled $292.92$411.23 million, available credit from the FRB Discount Window totaled $6.08 million, available lines from correspondent banks totaled $85.00$90.00 million, and unpledged available-for-sale securities totaled $46.79$54.14 million.
Cash Flows
The following table summarizes the components of cash flow for the periods indicated:
Year Ended December 31, | Year Ended December 31, | |||||||||||||||||||||||
2020 | 2019 | 2018 | 2021 | 2020 | 2019 | |||||||||||||||||||
(Amounts in thousands) | ||||||||||||||||||||||||
Net cash provided by operating activities | $ | 45,844 | $ | 56,655 | $ | 49,499 | $ | 48,215 | $ | 45,844 | $ | 56,655 | ||||||||||||
Net cash provided by investing activities | 17,798 | 171,377 | 49,398 | 35,350 | 17,798 | 171,377 | ||||||||||||||||||
Net cash used in financing activities | 175,910 | (87,896 | ) | (179,975 | ) | |||||||||||||||||||
Net increase (decrease) in cash and cash equivalents | 239,552 | 140,136 | (81,078 | ) | ||||||||||||||||||||
Net cash provided by (used) in financing activities | 137,313 | 175,910 | (87,896 | ) | ||||||||||||||||||||
Net increase in cash and cash equivalents | 220,878 | 239,552 | 140,136 | |||||||||||||||||||||
Cash and cash equivalents, beginning balance | 217,009 | 76,873 | 157,951 | 456,561 | 217,009 | 76,873 | ||||||||||||||||||
Cash and cash equivalents, ending balance | $ | 456,561 | $ | 217,009 | $ | 76,873 | $ | 677,439 | $ | 456,561 | $ | 217,009 | ||||||||||||
2021 Compared to 2020. Cash and cash equivalents increased $220.88 million compared to a increase of $239.55 million in the prior year. The increase was primarily due to an increase in both interest-bearing and noninterest-bearing deposits for a total of $183.14 million as well as $27.47 million received for repayment of loan balances. The increase in deposits was largely due to the significant inflow of unprecedented government stimulus in response to the COVID-19 pandemic and changes in consumer spending. The repayment of loan balances is primarily due to proceeds from the SBA for debt forgiveness for loans originated throught the Small Business Administration's Paycheck Protection Lending program.
2020 Compared to 2019. Cash and cash equivalents increased $239.55 million compared to aan increase of $140.14 million in the prior year. The increase was primarily due to an increase in both interest-bearing and noninterest-bearing deposits for a total of $216.34 million. The increase in deposits was largely due to the significant inflow of unprecedented government stimulus in response to the COVID-19 pandemic and changes in consumer spending.
2019 Compared to 2018. Cash and cash equivalents increased $140.14 million compared to a decrease of $81.08 million in the prior year. The increase was primarily due to a $121.98 million increase in net cash used in investing activities due to a net decrease in funds used to purchase investment securities and an increase in loan proceeds received. Net cash provided by financing activities increased $92.08 million largely due to a reduction in the net decrease in deposits year over year, and a net decrease in the repayment of borrowings. Net cash provided by operating activities increased $7.16 million primarily due to an increase in net income and a decrease in accretion income on acquired loans.
Capital Resources
We are committed to effectively managing our capital to protect our depositors, creditors, and shareholders. Failure to meet certain capital requirements may result in actions by regulatory agencies that could have a material impact on our operations. Total stockholders’ equity as of December 31, 2020, decreased $2.092021, increased $1.05 million, or 0.49%0.24%, to $426.73$427.78 million from $428.82$426.73 million as of December 31, 2019.2020. The Company earned $35.93$51.17 million, which was offset by repurchasing 734,653949,386 shares of our common stock totaling $21.87$28.88 million and declaring dividends on our common stock of $17.88$18.06 million. Our book value per common share increased $0.75$1.26 to $25.34 as of December 31, 2021, from $24.08 as of December 31, 2020, from $23.33 as of December 31, 2019.2020.
Capital Adequacy Requirements
Risk-based capital guidelines, issued by state and federal banking agencies, include balance sheet assets and off-balance sheet arrangements weighted by the risks inherent in the specific asset type. Our current risk-based capital requirements are based on the international capital standards known as Basel III. Our current minimum required capital ratios are as follows:
● | 4.5% Common Equity Tier 1 capital to risk-weighted assets (effectively 7.00% including the capital conservation buffer) |
● | 6.0% Tier 1 capital to risk-weighted assets (effectively 8.50% including the capital conservation buffer) |
● | 8.0% Total capital to risk-weighted assets (effectively 10.50% including the capital conservation buffer) |
● | 4.0% Tier 1 capital to average consolidated assets (“Tier 1 leverage ratio”) |
The following table presents our capital ratios as of the dates indicated:
December 31, | December 31, | |||||||||||||||||||||||
2020 | 2019 | 2018 | 2021 | 2020 | 2019 | |||||||||||||||||||
The Company | ||||||||||||||||||||||||
Common equity Tier 1 ratio | 14.28 | % | 14.31 | % | 13.72 | % | 14.39 | % | 14.28 | % | 14.31 | % | ||||||||||||
Tier 1 risk-based capital ratio | 14.28 | % | 14.31 | % | 13.72 | % | 14.39 | % | 14.28 | % | 14.31 | % | ||||||||||||
Total risk-based capital ratio | 15.53 | % | 15.21 | % | 14.79 | % | 15.65 | % | 15.53 | % | 15.21 | % | ||||||||||||
Tier 1 leverage ratio | 10.24 | % | 14.01 | % | 10.95 | % | 9.65 | % | 10.24 | % | 14.01 | % | ||||||||||||
The Bank | ||||||||||||||||||||||||
Common equity Tier 1 ratio | 13.57 | % | 12.87 | % | 12.55 | % | 13.37 | % | 13.57 | % | 12.87 | % | ||||||||||||
Tier 1 risk-based capital ratio | 13.57 | % | 12.87 | % | 12.55 | % | 13.37 | % | 13.57 | % | 12.87 | % | ||||||||||||
Total risk-based capital ratio | 14.82 | % | 13.78 | % | 13.62 | % | 14.62 | % | 14.82 | % | 13.78 | % | ||||||||||||
Tier 1 leverage ratio | 9.73 | % | 12.61 | % | 9.98 | % | 8.94 | % | 9.73 | % | 12.61 | % | ||||||||||||
As of December 31, 2020,2021, we continued to meet all capital adequacy requirements and were classified as well-capitalized under the regulatory framework for prompt corrective action. Management believes there have been no conditions or events since those notifications that would change the Bank’s classification. Additionally, our capital ratios were in excess of the minimum standards under the Basel III capital rules on a fully phased-in basis, if such requirements were in effect, as of December 31, 2020.2021. For additional information, see “Capital Requirements” in Part I, Item 1 and Note 21,20, “Regulatory Requirements and Restrictions,” to the Consolidated Financial Statements in Item 8 of this report.
Commitments, Contingencies, and Off-Balance Sheet Arrangements
Contractual Obligations
We enter into certain contractual obligations in the normal course of business that require future cash payments. Management believes we have adequate resources to fund our outstanding commitments and the ability to adjust rates on certificates of deposit, in a changing interest rate environment; attract new deposits; and replace deposits with FHLB advances or other fund providers, if cost effective. The following table presents our contractual cash obligations, by payment date, as of December 31, 2020:
Less Than | One to | Three to | More than | |||||||||||||||||
One Year | Three Years | Five Years | Five Years | Total | ||||||||||||||||
(Amounts in thousands) | ||||||||||||||||||||
Deposits without a stated maturity(1) | $ | 2,125,628 | $ | — | $ | — | $ | — | $ | 2,125,628 | ||||||||||
Certificates of deposit(2)(3) | 228,133 | 134,403 | 55,765 | 7,898 | 426,199 | |||||||||||||||
Securities sold under agreements to repurchase | 964 | — | — | — | 964 | |||||||||||||||
Operating leases | 154 | 250 | 218 | 362 | 984 | |||||||||||||||
Total contractual cash obligations | $ | 2,354,879 | $ | 134,653 | $ | 55,983 | $ | 8,260 | $ | 2,553,775 | ||||||||||
|
|
|
|
|
|
Off-Balance Sheet Arrangements
We extend contractual commitments with off-balance sheet risk in the normal course of business to meet the financing needs of our customers. Our exposure to credit loss in the event of nonperformance by other parties to financial instruments is the same as the contractual amount of the instrument.
The following table presents our off-balance sheet arrangements, by commitment expiration, as of December 31, 2020:
Less than | One to | Three to | More than | |||||||||||||||||
One Year(1) | Three Years | Five Years | Five Years | Total | ||||||||||||||||
(Amounts in thousands) | ||||||||||||||||||||
Commitments to extend credit | $ | 101,309 | $ | 53,429 | $ | 7,511 | $ | 67,159 | $ | 229,408 | ||||||||||
Financial letters of credit | 80 | 160 | 50 | — | 290 | |||||||||||||||
Performance letters of credit(2) | 2,288 | 176,239 | 205 | — | 178,732 | |||||||||||||||
Total off-balance sheet risk | $ | 103,677 | $ | 229,828 | $ | 7,766 | $ | 67,159 | $ | 408,430 | ||||||||||
|
|
|
|
The reserve for the risk inherent in unfunded lending commitments totaled $66 thousand as of December 31, 2020 and 2019. For additional information, see Note 20, “Litigation, Commitments, and Contingencies,” to the Consolidated Financial Statements in Item 8 of this report.
Market Risk and Interest Rate Sensitivity
Market risk represents the risk of loss due to adverse changes in current and future cash flows, fair values, earnings, or capital due to movements in interest rates and other factors. Our profitability is largely dependent upon net interest income, which is subject to variation due to changes in the interest rate environment and unbalanced repricing opportunities. We are subject to interest rate risk when interest-earning assets and interest-bearing liabilities reprice at differing times, when underlying rates change at different levels or in varying degrees, when there is an unequal change in the spread between two or more rates for different maturities, and when embedded options, if any, are exercised. ALCO reviews our mix of assets and liabilities with the goal of limiting exposure to interest rate risk, ensuring adequate liquidity, and coordinating sources and uses of funds while maintaining an acceptable level of net interest income given the current interest rate environment. ALCO is also responsible for overseeing the formulation and implementation of policies and strategies to improve balance sheet positioning and mitigate the effect of interest rate changes.
In order to manage our exposure to interest rate risk, we periodically review internal and third-party simulation models that project net interest income at risk, which measures the impact of different interest rate scenarios on net interest income, and the economic value of equity at risk, which measures potential long-term risk in the balance sheet by valuing our assets and liabilities at fair value under different interest rate scenarios. Simulation results show the existence and severity of interest rate risk in each scenario based on our current balance sheet position, assumptions about changes in the volume and mix of interest-earning assets and interest-bearing liabilities, and estimated yields earned on assets and rates paid on liabilities. The simulation model provides the best tool available to us and the industry for managing interest rate risk; however, the model cannot precisely predict the impact of fluctuations in interest rates on net interest income due to the use of significant estimates and assumptions. Actual results will differ from simulated results due to the timing, magnitude, and frequency of interest rate changes; changes in market conditions and customer behavior; and changes in our strategies that management might undertake in response to a sudden and sustained rate shock.
During 2020,2021, the Federal Open Market Committee decreasedmaintained the benchmark federal funds rate 150 basis points toat a range of 0 to 25 basis points. The following table presents the sensitivity of net interest income from immediate and sustained rate shocks in various interest rate scenarios over a twelve-month period for the periods indicated. Due to the current target Fed Funds rate as of December 31, 2020,2021, we do not reflect a decrease of more than 100 basis points from current rates in our analysis.
Year Ended December 31, | Year Ended December 31, | |||||||||||||||||||||||||||||||
2020 | 2019 | 2021 | 2020 | |||||||||||||||||||||||||||||
Increase (Decrease) in Basis Points | Change in Net Interest Income | Percent Change | Change in Net Interest Income | Percent Change | Change in Net Interest Income | Percent Change | Change in Net Interest Income | Percent Change | ||||||||||||||||||||||||
(Dollars in thousands) | ||||||||||||||||||||||||||||||||
300 | $ | 8,429 | 8.5 | % | $ | 171 | 0.2 | % | $ | 14,960 | 14.9 | % | $ | 8,429 | 8.5 | % | ||||||||||||||||
200 | 5,912 | 6.0 | % | 428 | 0.4 | % | 10,303 | 10.3 | % | 5,912 | 6.0 | % | ||||||||||||||||||||
100 | 3,130 | 3.2 | % | 426 | 0.4 | % | 5,502 | 5.5 | % | 3,130 | 3.2 | % | ||||||||||||||||||||
(100) | (4,749 | ) | -4.8 | % | (4,631 | ) | -4.3 | % | (6,285 | ) | -6.3 | % | (4,749 | ) | -4.8 | % | ||||||||||||||||
(200) | N/A | N/A | (8,571 | ) | -8.0 | % | ||||||||||||||||||||||||||
We have established policy limits for tolerance of interest rate risk in various interest rate scenarios and exposure limits to changes in the economic value of equity. As of December 31, 2020,2021, we feel our exposure to interest rate risk was adequately mitigated for the scenarios presented.
The Company primarily uses derivative instruments to manage exposure to market risk and meet customer financing needs. As of December 31, 2020, we maintained interest rate swap agreements with notional amounts totaling $16.70 million to modify our exposure to interest rate risk caused by changes in the LIBOR curve in relation to certain designated fixed rate loans. The total of the fair value of the swap agreements on the balance sheet, which are accounted for as fair value hedges, was recorded as a derivative liability totaling $1.13 million as of December 31, 2020, and a derivative liability totaling $510 thousand as of December 31, 2019. For additional information, see Note 12, “Derivative Instruments and Hedging Activities,” to the Consolidated Financial Statements in Item 8 of this report.
Inflation and Changing Prices
Our consolidated financial statements and related notes are presented in accordance with GAAP, which requires the measurement of results of operations and financial position in historical dollars. Inflation may cause a rise in price levels and changes in the relative purchasing power of money. These inflationary effects are not reflected in historical dollar measurements. The primary effect of inflation on our operations is increased operating costs. In management’s opinion, interest rates have a greater impact on our financial performance than inflation. Interest rates do not necessarily fluctuate in the same direction, or to the same extent, as the price of goods and services; therefore, the effect of inflation on businesses with large investments in property, plant, and inventory is generally more significant than the effect on financial institutions. The U.S. inflation rate continues to be relatively stable, and management believes that any changes in inflation will not be material to our financial performance.
Quantitative and Qualitative Disclosures about Market Risk. |
The information required in this item is incorporated by reference to “Market Risk and Interest Rate Sensitivity” in Item 7 of this report.
Financial Statements and Supplementary Data. |
FINANCIAL STATEMENTS AND SUPPLEMENTARY DATA | ||
INDEX |
FIRST COMMUNITY BANKSHARES, INC.
CONSOLIDATED BALANCE SHEETS
December 31, | December 31, | |||||||||||||||
(Amounts in thousands, except share and per share data) | 2020 | 2019 | 2021 | 2020 | ||||||||||||
Assets | ||||||||||||||||
Cash and due from banks | $ | 58,404 | $ | 66,818 | $ | 47,067 | $ | 58,404 | ||||||||
Federal funds sold | 395,756 | 148,000 | 627,036 | 395,756 | ||||||||||||
Interest-bearing deposits in banks | 2,401 | 2,191 | 3,336 | 2,401 | ||||||||||||
Total cash and cash equivalents | 456,561 | 217,009 | 677,439 | 456,561 | ||||||||||||
Debt securities available for sale | 83,358 | 169,574 | 76,292 | 83,358 | ||||||||||||
Loans held for sale | 0 | 263 | ||||||||||||||
Loans held for investment, net of unearned income (includes covered loans of $9,680 and $12,861, respectively) | 2,186,632 | 2,114,460 | ||||||||||||||
Allowance for loan losses | (26,182 | ) | (18,425 | ) | ||||||||||||
Loans held for investment, net of unearned income | 2,165,569 | 2,186,632 | ||||||||||||||
Allowance for credit/loan losses (1) | (27,858 | ) | (26,182 | ) | ||||||||||||
Loans held for investment, net | 2,160,450 | 2,096,035 | 2,137,711 | 2,160,450 | ||||||||||||
FDIC indemnification asset | 1,223 | 2,883 | ||||||||||||||
Premises and equipment, net | 57,700 | 62,824 | 52,284 | 57,700 | ||||||||||||
Other real estate owned | 2,083 | 3,969 | 1,015 | 2,083 | ||||||||||||
Interest receivable | 9,052 | 6,677 | 7,900 | 9,052 | ||||||||||||
Goodwill | 129,565 | 129,565 | 129,565 | 129,565 | ||||||||||||
Other intangible assets | 7,069 | 8,519 | 5,622 | 7,069 | ||||||||||||
Other assets | 104,075 | 101,529 | 106,691 | 105,298 | ||||||||||||
Total assets | $ | 3,011,136 | $ | 2,798,847 | $ | 3,194,519 | $ | 3,011,136 | ||||||||
Liabilities | ||||||||||||||||
Noninterest-bearing deposits | $ | 772,795 | $ | 627,868 | $ | 842,783 | $ | 772,795 | ||||||||
Interest-bearing deposits | 1,773,452 | 1,702,044 | 1,886,608 | 1,773,452 | ||||||||||||
Total deposits | 2,546,247 | 2,329,912 | 2,729,391 | 2,546,247 | ||||||||||||
Securities sold under agreements to repurchase | 964 | 1,601 | 1,536 | 964 | ||||||||||||
Interest, taxes, and other liabilities | 37,195 | 38,515 | 35,817 | 37,195 | ||||||||||||
Total liabilities | 2,584,406 | 2,370,028 | 2,766,744 | 2,584,406 | ||||||||||||
Stockholders' equity | ||||||||||||||||
Preferred stock, undesignated par value; 1,000,000 shares authorized; Series A Noncumulative Convertible Preferred Stock, $0.01 par value; 25,000 shares authorized; none outstanding | 0 | 0 | 0 | 0 | ||||||||||||
Common stock, $1 par value; 50,000,000 shares authorized; 24,319,076 issued and 17,722,507 outstanding at December 31, 2020; 24,238,907 shares issued and 18,376,991 shares outstanding at December 31, 2019. | 17,723 | 18,377 | ||||||||||||||
Common stock, $1 par value; 50,000,000 shares authorized; 23,971,347 issued and 16,878,220 outstanding at December 31, 2021; 24,319,076 shares issued and 17,722,507 shares outstanding at December 31, 2020 | 16,878 | 17,723 | ||||||||||||||
Additional paid-in capital | 173,345 | 192,413 | 147,619 | 173,345 | ||||||||||||
Retained earnings | 237,585 | 219,535 | 264,824 | 237,585 | ||||||||||||
Accumulated other comprehensive loss | (1,923 | ) | (1,506 | ) | (1,546 | ) | (1,923 | ) | ||||||||
Total stockholders' equity | 426,730 | 428,819 | 427,775 | 426,730 | ||||||||||||
Total liabilities and stockholders' equity | $ | 3,011,136 | $ | 2,798,847 | $ | 3,194,519 | $ | 3,011,136 | ||||||||