Commission File Number 001-36729


FRESHPET, INC.
(Exact name of registrant as specified in its charter)
Delaware |
20-1884894 | ||
(State ofIncorporation) | (I.R.S. EmployerIdentification No.) | |
400 Plaza Drive, 1st Floor Secaucus, | 07094 | |
(Address of Principal Executive Offices) | (Zip Code) | |
(201) 520-4000
(201) 520-4000
Securities registered pursuant to Section12(b) of the Act:
Title of each class | Trading Symbol | Name of exchange on which registered |
Common Stock, | FRPT | NASDAQ Global Market |
Securities registered pursuant to Section12(g) of the Act: None
Indicate by check mark if the registrant is a well-known seasoned issuer, as defined in Rule 405 of the Securities Act. Yes ☒ No ☐
Indicate by check mark if the registrant is not required to file reports pursuant to Section 13 or Section 15(d) of the Act. Yes ☐ No ☒
Indicate by check mark whether the registrant (1) has filed all reports required to be filed by Section 13 or 15(d) of the Securities Exchange Act of 1934 during the preceding 12 months (or for such shorter period that the registrant was required to file such reports), and (2) has been subject to such filing requirements for the past 90 days. Yes ☒ No ☐
Indicate by check mark whether the registrant has submitted electronically every Interactive Data File required to be submitted pursuant to Rule 405 of Regulation S-T (§ 232.405 of this chapter) during the preceding 12 months (or for such shorter period that the registrant was required to submit such files). Yes ☒ No ☐
Indicate by check mark whether the registrant is a large accelerated filer, an accelerated filer, a non-accelerated filer, a smaller reporting company, or an emerging growth company. See the definitions of “large accelerated filer,” “accelerated filer,” “smaller reporting company,” and “emerging growth company” in Rule 12b-2 of the Exchange Act.
Large accelerated filer | ☒ | Accelerated filer | ☐ | |||
Non-Accelerated filer | ☐ | Smaller reporting company | ☐ | |||
| Emerging growth company | ☐ | |||||
If an emerging growth company, indicate by check mark if the registrant has elected not to use the extended transition period for complying with any new or revised financial accounting standards provided pursuant to Section 13(a) of the Exchange Act. ☐
Indicate by check mark whether the registrant has filed a report on and attestation to its management’smanagement's assessment of the effectiveness of its internal control over financial reporting under Section 404(b) of the Sarbanes-Oxley Act (15 U.S.C. 7262(b)U.S.C.7262(b)) by the registered public accounting firm that prepared or issued its audit report. Yes ☒ No ☐
If securities are registered pursuant to Section 12(b) of the Act, indicate by check mark whether the financial statements of the registrant included in the filing reflect the correction of an error to previously issued financial statements. ☐
Indicate by check mark whether any of those error corrections are restatements that required a recovery analysis of incentive-based compensation received by any of the registrant's executive officers during the relevant recovery period pursuant to §240.10D-1(b)§240.10D-1 (b). ☐
Indicate by check mark whether the registrant is a shell company (as defined in Rule 12b-2 of the Act). Yes ☐ No ☒
As of June 30, 2023, the last business day of the registrant’s most recently completed second fiscal quarter, the aggregate market value of the voting and non-votingregistrant’s common equitystock held by non-affiliates was approximately $3.1 billion.
As of the Registrant, based on the closing price of theFebruary 22, 2024, 48,292,606 shares of common stock on The NASDAQ Stock Market on June 30, 2022, was approximately $2.4 billion.
Documents Incorporated byBy Reference
The information required by Items 10 through 14 of Part III, of Form 10-K. This information was previously omitted from the 2022 10-K in reliance on General Instruction G(3) to Form 10-K, which permits the information in the above referenced items to be incorporated in the Form 10-K by reference from the Company’s definitive proxy statement if such statement is filed no later than 120 days after the Company’s fiscal year-end. We are filing this Amendment to provide the information required in Part III of Form 10-K because a definitive proxy statement containing such information will not be filed by the Company within 120 days after the end of the fiscal year covered by the 2022 10-K.
Freshpet, Inc.
Annual Report on Form 10-K
Item 1 | ||
Item 1A | ||
Item 1B | ||
| Item 1C | Cybersecurity | 24 |
Item 2 | ||
Item 3 | ||
Item 4 | ||
Item 5 | ||
| Item 6 | [Reserved] | |
Item 7 | Management’s Discussion and Analysis of Financial Condition and Results of Operations | |
Item 7A | ||
Item 8 | ||
Item 9 | Changes in and Disagreements with Accountants on Accounting and Financial Disclosure | |
Item 9A | ||
Item 9B | ||
| Item 9C | Disclosure Regarding Foreign Jurisdictions that Prevent Inspections | 68 |
Item 10 | ||
Item 11 | ||
Item 12 | Security Ownership of Certain Beneficial Owners and Management and Relate Stockholder Matters | |
Item 13 | Certain Relationships and Related Transactions, and Director Independence | |
Item 14 | ||
Item 15 | ||
| Item 16 | Form 10-K Summary | 73 |
Signatures | ||
Forward-Looking Statements
This report contains forward-looking statements that are subject to risks and uncertainties. All statements other than statements of historical fact included in this report are forward-looking statements. Forward-looking statements discuss our current expectations and projections relating to our financial condition, results of operations, plans, objectives, future performance and business. You can identify forward-looking statements by the fact that they do not relate strictly to historical or current facts. These statements may include words such as “aim,” “anticipate,” “believe,” “estimate,” “expect,” “forecast,” "target," “outlook,” “potential,” “project,” “projection,” “plan,” “intend,” “seek,” “may,” “could,” “would,” “will,” “should,” “can,” “can have,” “likely,” the negatives thereof and other words and terms of similar meaning in connection with any discussion of the 2022 10-Ktiming or nature of future operating or financial performance or other events. They appear in a number of places throughout this report and include statements regarding our intentions, beliefs or current expectations concerning, among other things, our results of operations, financial condition, liquidity, prospects, growth, strategies and the exhibit index set forthindustry in Part IVwhich we operate. All forward-looking statements are subject to risks and uncertainties that may cause actual results to differ materially from those that we expected, including:
| ● | our ability to meet our sustainability targets, goals, and commitments, including due to the impact of climate change; | |
| ● | changes in global economic and financial market conditions generally, such as inflation and interest rate increases; | |
| ● | the impact of various worldwide or macroeconomic events, such as the ongoing conflict between Russia and Ukraine and the current conflict in Israel and the Gaza Strip, on the U.S. and global economics, our employees, suppliers, customers and end consumers, which could adversely and materially impact our business, financial condition and results of operations; | |
● | our ability to successfully implement our growth strategy, including related to implementing our marketing strategy and building capacity to meet demand, such as through the timely expansion of certain of our Freshpet Kitchens (as defined below); |
| ● | our ability to successfully implement new processes and systems as we continue to stabilize and improve our ERP; | |
● | our ability to timely complete the construction at our Freshpet Kitchens Ennis and achieve the anticipated benefits therefrom; |
● | the loss of key members of our senior management team; |
● | allegations that our products cause injury or illness or fail to comply with government regulations; |
● | the loss of a significant customer; |
● | the entrance of new competitors into our industry; |
● | the effectiveness of our marketing and trade spending programs; |
● | our ability to introduce new products and improve existing products; |
● | our ability to match our manufacturing capacity with demand; |
● | the impact of government regulation, scrutiny, warning and public perception; |
● | the effect of false marketing claims; |
● | adverse weather conditions, natural disasters, pestilences and other natural conditions affecting our operations; |
● | our ability to develop and maintain our brand; |
● | the effect of potential price increases and shortages on the inputs, commodities and ingredients that we require, including those effects caused by inflation; |
● | our ability to manage our supply chain effectively; |
| ● | global or local pandemics, such as COVID-19; | |
| ● | the failure of our information technology systems to perform adequately, including as a result of any interruptions, intrusions, cyber attacks or physical or electronic security breaches of such systems; | |
| ● | actions of activist stockholders; | |
● | volatility in the price of our common stock; and |
● | other factors discussed under the headings “Risk Factors,” “Business,” and “Management’s Discussion and Analysis of Financial Condition and Results of Operations” in this report. |
While we believe that our assumptions are reasonable, we caution that it is very difficult to predict the impact of known factors, and it is impossible for us to anticipate all factors that could affect our actual results. Important factors that could cause actual results to differ materially from our expectations, or cautionary statements, are disclosed under “Risk Factors” and “Management’s Discussion and Analysis of Financial Condition and Results of Operations” in this report. All forward-looking statements are expressly qualified in their entirety by these cautionary statements. You should evaluate all forward-looking statements made in this report in the context of these risks and uncertainties.
Overview
Freshpet, Inc. (“Freshpet,” the “Company,” "we" or "our") is disrupting the over $52.0 billion United States pet food industry by driving consumers to reassess conventional dog and cat food offerings that have remained essentially unchanged for decades. We position our brand to benefit from mainstream trends of growing pet humanization and consumer focus on health and wellness. We price our products to be accessible to the average consumer, providing us with broad demographic appeal and allowing us to penetrate multiple classes of retail, including grocery, mass, club, pet specialty, natural and digital. We have successfully expanded our network of Freshpet Fridges within leading blue-chip retail chains. The strength of our business model extends to our customers, who we believe find that Freshpet grows their pet category sales, drives higher traffic, increases shopper frequency and delivers category leading margins. As of December 31, 2023, our household penetration within the U.S. was approximately 11.5 million, with a target of 20 million households by 2027. Additionally, we believe that there are opportunities to expand our network into international markets as demonstrated by our recent initiatives in the U.K. market.
Our Industry
We primarily compete in the United States dog and cat food market. We believe pet food spending in North America will continue to increase at a similar rate as it has in the past. The pet food market has historically been resilient as consumers continue to spend on their pets even during economic downturns.
We believe the following trends are driving growth in our industry:
Pet ownership. There are currently approximately 86.9 million pet owning households in the United States, which represents approximately 66% of total households, and over 111.6 million dogs and cats in the United States, according to the American Pet Products Association.
Pet humanization. According to Packaged Facts, 92-96% of U.S. pet owners view their pets as members of the 2022 10-Kfamily. As pets are increasingly viewed as companions, friends and includes certain exhibitsfamily members, pet owners are being transformed into “pet parents” who spare no expense for their loved ones, driving premiumization across pet categories. This trend is reflected in food purchasing decisions. According to an American Pet Products Association's Pulse Study, 48% of pet parents feel they are closer/more bonded with their pet due to the COVID-19 pandemic. We believe that pet owners' closer bond to their pets aligns with recent trends, which the COVID-19 pandemic has further accelerated.
Increasing consumer focus on health & wellness. Consumers are increasingly purchasing fresh, natural and organic food products. We believe consumers are seeking simple, fresh and easy to understand food products from brands they trust and made with ingredients that are transparently sourced.
The pet food purchasing decision is underpinned by higher brand loyalty than many other consumer packaged goods categories. A consumer selecting a pet food brand resists frequent switching in order to avoid disrupting the pet’s diet, resulting in high repeat purchasing behavior. As a result, we believe that as noted thereon. The cover pageconsumers try fresh, refrigerated pet food, they are likely to become repeat users of the 2022 10-K is also amendedproduct.
Our Opportunity
Freshpet has a unique opportunity to deletecapture market share in this large and growing category by mainstreaming fresh food for pets and making fresh food a greater part of dogs' and cats' main meals.
Even though long-term consumer trends of pet humanization and health and wellness are well documented, conventional pet food sold as dry kibble or wet food in cans has not changed substantially for decades. We believe that the referencepet food industry has not kept pace with how consumers think about food for their families, including their pets. As a result, consumers are searching for higher quality, less processed food for their dogs’ and cats’ meals that measure up to today’s sensibilities of what actually constitutes “good food.” Freshpet was specifically designed to address this growing need with affordable offerings accessible to the incorporationaverage consumer.
Our Mission and Values
We started Freshpet with a single-minded mission—to bring the power of real, fresh food to our dogs and cats. And, we are committed to doing so in ways that are good for Pets, People, and Planet.
Pets
Our pets are members of our family and deserve to eat the kind of fresh, healthy food that we do. Freshpet's carefully selected ingredients and gentle cooking process ensures best-in-class bioavailable nutrition. Hundreds of customer testimonials each year underscore Freshpet's support of a long and healthy life. Further, since founding Freshpet, we have donated over seventeen million fresh meals to pets via shelters, charitable organizations, and humane societies, including St Hubert's Animal Welfare Center, Pennsylvania SPCA and 4 Paws for Ability.
People
People include our team members, pet parents, and our partners. We treat our team members with respect and are committed to helping them develop professionally and personally. These efforts have contributed to an employee net promoter score of 8.2. Additionally, we strive to be good partners with customers, distributors, and suppliers by referenceconducting business with honesty and transparency knowing that we cannot grow without their support.
Planet
We are committed to minimizing our environmental impact while providing the healthiest, tastiest pet food possible. Freshpet Kitchens Bethlehem is a landfill-free facility thanks to state-of-the-art recycling, digesting, and waste-to-energy processes. We support renewable energy by matching the electricity used in Freshpet Kitchens and offices as well as our refrigerators in over 26,000 retail locations with Green-E Certified renewable energy certificates from North American based projects. Freshpet's chiller fleet efficiency continues to improve with our latest units using 91% less electricity than older units. In 2022 we opened our state-of-the-art Kitchens in Ennis, TX. This facility has been designed to be our most sustainable yet, incorporating on-site solar power and battery micro-grid, wastewater recycling, and advanced heating / cooling technology. These efforts are intended to help achieve our environmental goals while reducing the costs of doing business. 2023 saw the introduction of our new Texas distribution center and freight bracket pricing program. These efforts helped minimize the fuel used to ship Freshpet products to our customers resulting in significantly reduced logistics costs and environmental footprints.
Our commitment to our values helps us engage with consumers, motivate our team members, and attract strong partners, which allows us to fulfill our mission of delivering the best nutritional product choices to improve the well-being of our pets, enrich pet parents’ lives, and contribute to communities.
Our Products
Freshpet's business operates in a single segment: the manufacturing, marketing and distribution of pet food and pet treats for dogs and cats. Our portfolio of products consists of dog food, cat food, and dog treats. All Freshpet products are made according to our nutritional philosophy of fresh, nutritional ingredients and minimal processing. Our proprietary recipes include real, fresh meat and varying combinations of vitamin-rich vegetables, leafy greens and antioxidant rich fruits, without the use of preservatives or additives. Our unique product attributes appeal to diverse consumer needs across multiple classes of retail where Freshpet is sold. Consequently, our brand resonates across a broad cross-section of pet parent demographics.
Our products are sold under the Freshpet brand name, with ingredients, packaging, and labeling customized by different classes of trade and are available in multiple forms.
 | 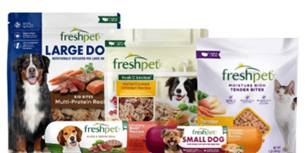 |
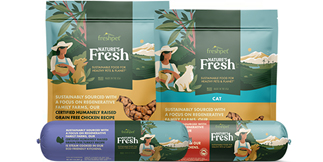 |  |
 | 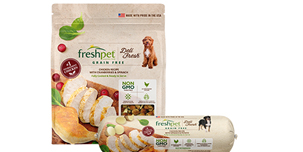 |
We also offer fresh treats across all classes of retail under the Dognation and Dog Joy labels.
 | 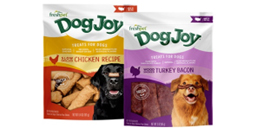 |
Our Product Innovation
As the first manufacturer of fresh, refrigerated pet food distributed across North America, product innovation is core to our strategy. We take a fresh approach to pet food and are not constrained by conventional pet food products, attributes, and production capabilities. We employ a tightly-knit, creative team of marketing and research and development professionals, and we consult with outside experts through our Nutrition Council, which consist of PhDs in nutrition and veterinary nutritionists. Our team often identifies pet parents’ needs by evaluating emerging demand trends in both pet food and human food. New products are refined iteratively with the help of consumer panel data to arrive at products that we believe can be commercially successful.
The success of our approach is evidenced by our broad product portfolio today. We began Freshpet by producing fresh, refrigerated slice and serve rolls, and over time have steadily expanded into successful new product forms including bags and treats. We also introduced new fresh recipes and ingredients, such as proteins and grain-free options never before seen in pet food that cater to the specific dietary requirements of pets.
Our Innovation Center, which is part of our Freshpet Kitchens (collectively, our Freshpet Kitchens Bethlehem, Freshpet Kitchens South and Freshpet Kitchens Ennis), helps us ensure that we remain capable of strong innovation, including creating new product platforms to expand the breadth of our fresh pet food offerings. We expect that new product innovation and the introduction of new cooking techniques will continue to delight our consumers and drive growth going forward.
Our Supply Chain
Manufacturing: All of our products are manufactured in the United States. We own and operate what we believe to be the first fresh, refrigerated pet food manufacturing network in North America. Our original Freshpet Kitchens Bethlehem, located in Bethlehem, Pennsylvania, is a 240,000 square foot facility, built to United States Department of Agriculture standards and currently houses six production lines customized to produce fresh, refrigerated food.
In 2020, we began making investments at a manufacturing facility called Freshpet Kitchens South. Freshpet Kitchens South currently has three production lines with the space for additional production lines in the future.
The construction of Freshpet Kitchens Ennis, located in Ennis, Texas, began in 2020. The first production line was commissioned in Q4 of 2022, and two more lines were successfully commissioned in 2023, completing 1 of 3 construction phases for the site. Phase 2 is expected to commence production on its first line at the end of Q3 of 2024, with the balance of Phase 2 and Phase 3 to be completed over the next several years.
Due to the continued growth of our fresh pet food sales, we plan to continue expanding our manufacturing capacity via operational efficiency improvements at our current facilities and via future expansion of our physical features.
In 2023, approximately 99.1% of our product volume was manufactured with Freshpet owned equipment.
Ingredients and Packaging: Our products are made with natural and fresh ingredients including meat, vegetables, fruits, whole grains, vitamins and minerals. We believe in building long-term supplier and farmer partnerships to source healthy and sustainable ingredients. We strive to source raw ingredients within a 300-mile radius of the Company’s definitive proxy statement.Freshpet Kitchens. All of our suppliers are well-established companies that have the scale to support our growth. For every ingredient, we either use multiple suppliers or have identified alternative sources of supply that meet our quality and safety standards.
Distribution: Outbound transportation from our distribution center ("DC") facilities is managed by third-party refrigerated freight brokers. The service areas for our Pennsylvania and Texas DC locations are in a continual progression towards growing distribution out of Texas to serve the central and western US in tandem with the scale up of the Ennis Kitchen; and the Pennsylvania DC will principally service the eastern US and our international businesses. As volume grows, we will continue to leverage our distribution network to continuously improve customer service levels and decrease certain distribution costs. For certain retailers, we use national and regional distributors.
Our Product Quality and Safety
We go to great lengths to ensure product quality, consistency and safety from ingredient sourcing to finished product. Our Freshpet-owned manufacturing lines allows us to exercise significant control over production. We have a highly skilled Food Safety and Quality Assurance team consisting of quality assurance supervisors, specialists, analysts, and quality technicians with significant experience in pet and human food production.
Our production processes are designed to meet science-based quality standards with documented plans for Hazard Analysis Critical Control Points and Hazard Analysis Risk Based Preventive Control to monitor established production controls, calibrate instruments, record data and perform corrective actions. Our on-site laboratory has microbial and composition testing capabilities. Quality control approvals are based on a positive release strategy, wherein a batch can only be shipped when it passes control point record reviews and laboratory testing. Before commencing production, quality assurance professionals swab equipment to test for potential contaminants.
Freshpet’s food safety program is certified at Safe Quality Food Level III, which is the highest standard determined under the Global Food Safety Initiative Benchmarks. We believe our systems and standards for product quality and safety can support our growth and ensure continued success in the market.
Our Customers and Distributors
We sell our products throughout the United States, Canada, and Europe, and generate the vast majority of our sales in the United States. The strength of our business model makes us an attractive partner for leading blue-chip retailers, who we believe find that Freshpet grows the sales of their pet category, drives higher traffic, increases shopper frequency, and delivers category-leading margins. Our Freshpet Fridge locations have been madeconsistently increasing as we add new retail accounts and add stores in existing accounts. As of December 31, 2023, we are in approximately 26,777 stores, with approximately 22% of stores having second and third Freshpet Fridge placements. We sell our products through the following classes of retail: grocery, mass, club, pet specialty, natural, and digital.
Our customers determine whether they wish to purchase our products directly from us or through a third-party distributor. In 2023, our largest distributor by net sales, Animal Supply Co., accounted for 9.0% of our net sales and our largest customer, Walmart, accounted for 23.4% of our net sales.
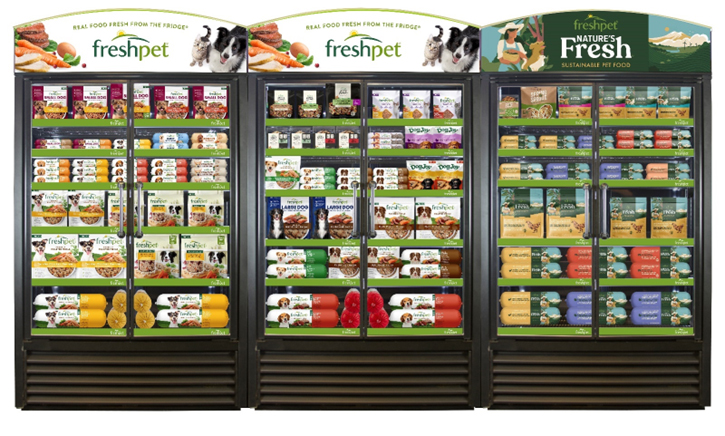
The Freshpet Fridge
We sell our products through a growing network of company-owned branded refrigerators, the 2022 10-K,Freshpet Fridges. Our Freshpet Fridges are typically four feet wide by seven feet high and this Amendment does not modify, amendreplace standard shelving in the pet aisle or updatean end-cap of a retail store. Our Freshpet Fridge designs are constantly evolving with all new models featuring prominent edge-lit LED headers, LED interior lighting, crisp black interiors and frameless glass swing doors for aesthetics and easy access. We use state-of-the-art refrigeration technology and environmentally friendly refrigerants to minimize energy consumption and environmental impact.
We design and produce the Freshpet Fridge through a combination of in-house resources and world-class partners. We source our Freshpet Fridges from leading global commercial refrigerator manufacturers with whom we have a collaborative approach to refrigerator design and innovation. Once ordered by us, Freshpet Fridges are shipped to distribution centers for delivery and installation in any way anyretail stores.
Installation into retail locations and ongoing maintenance of the financial orFreshpet Fridge is coordinated by Freshpet and executed through leading third-party service providers. All of our Freshpet Fridges are protected by a manufacturer warranty of three years. Our refrigerators are designed to be highly reliable, and at any given time, less than 0.5% of the network is out of service for maintenance. Moreover, to ensure quality, cleanliness and appropriate in-stock levels, we employ brokerage partners to conduct a physical audit of the Freshpet Fridge network on an ongoing basis, with photographic results of our Freshpet Fridges transmitted back to Freshpet for review by members of our sales team.
We currently estimate less than 12-month cash-on-cash payback for the average Freshpet Fridge installation, calculated by comparing our total current costs for a refrigerator (including installation) to our current margin on net revenues. We believe our attractive value proposition to retailers and pet parents will allow us to continue penetrating store locations of existing and new customers. The Freshpet Fridge provides a highly-visible merchandising platform, allowing us to control how our brand is presented to consumers at point-of-sale and represents a significant point of differentiation from other pet food competitors. Our total chiller fleet at retailers covers over 1.7 million cubic feet of space.
 |
Marketing and Advertising
Our marketing strategy is designed to educate consumers about the benefits of fresh refrigerated pet food and build awareness of the Freshpet brand. We deploy a broad set of marketing tools across television, digital and public relations to reach consumers through multiple touch points and increase product trials.
Our network of fridges at approximately 26,777 retail locations within blue-chip retailers helps to introduce consumers to our brand and instantly distinguish Freshpet from traditionally merchandised pet food. We have effectively used national TV advertising to drive incremental consumers to try Freshpet products. We expect to realize greater benefits from national TV advertising as we continue to grow the network of Freshpet store locations nationwide. We have also expanded our online presence to better target consumers seeking information containedon healthy pet food. We reach consumers across multiple digital and social media platforms including websites, blogs and online reviews, as well as with tailored messaging on popular digital hubs including Instagram, Facebook, X, TikTok and YouTube.
Our marketing strategy has allowed us to drive new consumers to our brand and develop a highly engaged community of users who actively advocate for Freshpet.
Competition
Pet food is a highly competitive industry. We compete with some of the largest pet food manufacturers such as Nestlé Purina Pet Care, the J.M. Smucker Company, Hill's Pet Nutrition, Mars Pet Care, General Mills Pet, and Post Consumer Brands. In addition, we compete with many regional niche brands in individual geographic markets, as well as the launch of new direct-to-consumer frozen brands.
Given a North American retail landscape dominated by large retailers, with limited shelf space and a significant number of competing products, competitors actively support their brands through marketing, advertising, promotional spending and discounting.
Competitive factors in the 2022 10-K. This Amendment does not reflect events occurring afterpet food industry include product quality, ingredients, brand awareness and loyalty, product variety, product packaging and design, reputation, price, advertising, promotion and nutritional claims. We believe that we compete effectively with respect to each of these factors.
Team Members & Human Capital Resources
At Freshpet we always want to build a fair, healthy and safe workplace, while creating work environment policies that promote diversity, equality and inclusion for our valued employees. We believe that when we create a workplace where our colleagues are engaged, committed and empowered for the date of the filinglong-term, we are better positioned to create value for our company, as well as for our stockholders. We are proud of our 2022 10-K. Accordingly, this Amendment should be read in conjunction withfocus on promoting employee engagement across our 2022 10-Koperations - from our supply chain to our products - and withare committed to building our filings withbusiness on a foundation of strong ethics.
Attracting and retaining talent at all levels is vital to continuing our success. We promote the SEC subsequent to the filingwork-life balance of our 2022 10-K.employees, we invest in our employees through high-quality benefits and various health and wellness initiatives, and we have created a healthy work environment in our offices. In order to incentivize and engage our workforce, Freshpet provides:
| ● | Industry-leading compensation, including stock compensation for every employee | ● | Industry-leading healthcare offered equitably for every employee |
| ● | Annual equity grants and Key Talent awards to employees identified by the Executive Leadership team and the Board | ● | Competitive perquisites, including pet insurance, tuition reimbursement, paid parental leave, free healthy snack room and catered lunches |
| ● | 401(k) matching for every employee | ● | Rigorous focus on Diversity & Inclusion to create an inclusive culture to attract, engage and retain our diverse talent |
As of December 31, 2023, we had 1,083 employees located primarily in Bethlehem, PA, Ennis, TX, Secaucus, NJ and Europe. None of our employees are represented by a labor union or by any collective bargaining arrangements with respect to his or her employment with us.
Our Corporate Information
We were incorporated in Delaware in November 2004 and currently exist as a Delaware corporation. Our principal executive offices are located at 400 Plaza Drive, 1st Floor, Secaucus, New Jersey 07094.
Website Information
The address of our corporate website is www.freshpet.com. Our annual reports, annual proxy statements and related proxy cards are made available on our website at the same time they are mailed to Rule 12b-15 understockholders, as required by applicable law. Our annual reports on Form 10-K, quarterly reports on Form 10-Q, periodic reports on Form 8-K and amendments to those reports that we file or furnish pursuant to Section 13(a) or 15(d) of the Securities Exchange Act of 1934, as amended (the “Exchange Act”), this Form 10-K/Aare available through our website, free of charge, as soon as reasonably practicable after they have been electronically filed or furnished to the Securities and Exchange Commission (the “SEC”). Our website also contains certificationsprovides access to reports filed by our directors, executive officers and certain significant shareholders pursuant to Section 30216 of the Sarbanes-Oxley Act of 2002, which are attached hereto. Because no financial statements have been included in this Amendment and this Amendment does not contain or amend any disclosure with respect to Items 307 and 308 of Regulation S-K, paragraphs 3, 4 and 5 of the certifications have been omitted. Terms used but not defined herein are as defined in our 2022 10-K.
Trademarks and Other Intellectual Property
We will provide any person, without charge, upon request,believe that our rights in our trademarks and service marks are important to our marketing efforts to develop brand recognition and differentiate our brand from our competitors and are a copyvaluable part of our General Codebusiness. We own a number of trademarks and service marks that have been registered, or Codefor which applications are pending, with the United States Patent and Trademark Office including, among others, Freshpet, Vital, Nature’s Fresh, Roasted Meals, Fresh From The Kitchen, Freshpet Dog Joy, Dognation, Homestyle Creations, and Pets People Planet.
We believe that our intellectual property has substantial value and has significantly contributed to our success to date. We are continually developing new technology and enhancing proprietary technology related to our pet food, Freshpet Fridges and manufacturing operations.
We also rely on unpatented proprietary expertise, recipes and formulations, continuing innovation and other trade secrets to develop and maintain our competitive position.
Government Regulation
Along with our brokers, distributors, and ingredients and packaging suppliers, we are subject to extensive laws and regulations in the United States by federal, state and local government authorities. In the United States, the federal agencies governing the manufacture, distribution and advertising of Ethics. Such requests shouldour products include, among others, the Federal Trade Commission, the U.S. Food and Drug Administration (“FDA”), the U.S. Department of Agriculture, the United States Environmental Protection Agency, and the Occupational Safety and Health Administration. Under various statutes, these agencies, among other things, prescribe the requirements and establish the standards for quality and safety and regulate our marketing and advertising to consumers. Certain of these agencies, in certain circumstances, must not only approve our products, but also review the manufacturing processes and facilities used to produce these products before they can be mademarketed in writingthe United States. In addition to agency regulation, we are required to comply with state feed control requirements in the United States. We are also subject to the attentionlaws of Canada, including the Canadian Food Inspection Agency, and the United Kingdom, including the Food Standards Agency, as well as provincial and local regulations.
We are subject to labor and employment laws, laws governing advertising, privacy laws, safety regulations and other laws, including consumer protection regulations that regulate retailers or govern the promotion and sale of merchandise. Our operations, and those of our Corporate Secretary at the following address: Freshpet, Inc., 400 Plaza Drive, 1st Floor, Secaucus, New Jersey 07094.
Investing in our common stock involves a high degree of risk. The following is a discussion of the risks, uncertainties and assumptions that we believe are material to our business, which should be considered in conjunction with the other information contained in this report, including our consolidated financial statements and accompanying notes. If any of the following risks actually occurs, our business, financial condition or results of operations could be materially adversely affected. While the risks are organized by headers, and each risk is discussed separately, many are interrelated. In any such case, the trading price of our common stock could decline, and you could lose all or part of your investment. Additional risks and uncertainties not currently known to us or that we currently deem to be immaterial also may materially adversely affect our business, financial condition, or results of operations.
Risks Related to our Growth Strategy and Need for Capital
We may not be able to successfully implement our growth strategy on a timely basis or at all.
Our future success depends, in large part, on our ability to implement our growth strategy by attracting new consumers to our brand, expanding distribution through the timely expansion of certain of our Freshpet Kitchens, the installation of new Freshpet Fridges, and launching new products. Our ability to increase awareness, consumer trial and adoption of our products, and to implement this growth strategy depends, among other things, on our ability to:
● | implement our marketing strategy; |
● | expand and maintain brand loyalty; |
● | partner with customers to secure space for our Freshpet Fridges; |
● | develop new product lines and extensions; |
● | partner with distributors to deliver our products to customers; |
● | continue to compete effectively in multiple classes of retail, including grocery, mass, club, pet specialty, natural, and digital; and |
● | build capacity to meet demands, including the timely expansion of certain of our Freshpet Kitchens. |
We may not be able to successfully implement our growth strategy or to grow consistently from period to period. Our business, financial condition and results of operations will be adversely affected if we fail to implement our growth strategy or if we invest resources in a growth strategy that ultimately proves unsuccessful.
We expect to need capital in the future for business development, and we may not be able to generate sufficient cash flow or raise capital on acceptable terms to meet our needs.
Developing our business has in the past required and will continue in the future to require significant capital. To meet our capital needs, we expect to continue to rely on our cash flow from operations, as well as cash received from our Convertible Notes (as defined below), and other third-party financing. Third-party financing in the future may not, however, be available on terms favorable to us, or at all. Our ability to obtain additional funding will be subject to various factors, including general economic and market conditions, our operating performance, the market’s perception of our growth potential, lender sentiment and our ability to incur additional debt in compliance with our contractual restrictions.
Additionally, our ability to make payments on and to refinance any indebtedness and to fund planned expenditures for our growth and operational efficiency plans will depend on our ability to generate cash in the future. If our business does not achieve the levels of profitability or generate the amount of cash that we anticipate or if we expand faster than anticipated, we may need to seek additional debt or equity financing to operate and expand our business. From time to time, we may seek to raise additional capital by accessing the debt and/or equity markets to fund capital expenditures or otherwise. We cannot assure you that our business will generate cash flow from operations in an amount sufficient to enable us to fund our liquidity needs. Further, our capital requirements may vary materially from those currently planned if, for example, our revenues do not reach expected levels, or we have to incur unforeseen capital expenditures and make investments to maintain our competitive position. If this is the case, we may seek alternative financing, such as selling additional debt or equity securities, and we cannot assure you that we will be able to do so on favorable terms, if at all. For additional possible effects of such offerings, see "Future offerings of debt securities, which would rank senior to our common stock upon our bankruptcy or liquidation, and future offerings of equity securities, which may be senior to our common stock for the purposes of dividend and liquidating distributions, may adversely affect the market price of our common stock."
Loss of our key executive officers or personnel, or an inability to attract and retain such management and other personnel, could negatively affect our business.
Our future success depends to a significant degree on the skills, experience and efforts of our key executive officers. The sudden loss of any of these executives' services or our failure to appropriately plan for any expected key executive succession could materially and adversely affect our business and prospects, as we may not be able to find suitable individuals to replace them on a timely basis, if at all. Additionally, we also depend on our ability to attract and retain qualified personnel to efficiently operate and expand our business. If we fail to attract or retain talented new employees, our business and results of operations could be negatively affected.
Risks Related to Competition in Our Industry
The pet food product category in which we participate is highly competitive. If we are unable to compete effectively, our results of operations could be adversely affected.
The pet food product category in which we participate is highly competitive. There are numerous brands and products that compete for shelf space and sales, with competition based primarily upon brand recognition and loyalty, product packaging, quality and innovation, taste, nutrition, breadth of product line, price and convenience. We compete with a significant number of companies of varying sizes, including divisions or subsidiaries of larger companies. We face strong competition from competitors’ products that are sometimes sold at lower prices. Price gaps between our products and our competitors’ products may result in market share erosion and harm our business. A number of our competitors have broader product lines, substantially greater financial and other resources and/or lower fixed costs than we have. Our competitors may succeed in developing new or enhanced products, including additional fresh, refrigerated pet food, that are more attractive to customers or consumers than our products. These competitors may also prove to be more successful in marketing and selling their products or may be better able to increase prices to reflect cost pressures. We may not be able to compete successfully with these other companies or maintain or grow the distribution of our products. We cannot predict the pricing or promotional activities of our competitors or whether their strategies will negatively affect us. Many of our competitors engage in aggressive pricing and promotional activities. There are competitive pressures and other factors which could cause our products to lose market share or decline in sales or result in significant price or margin erosion, which would have a material adverse effect on our business, financial condition and results of operations.
Our operating results depend, in part, on the sufficiency and effectiveness of our marketing and trade spending programs.
In general, due to the highly competitive nature of the businesses in which we compete, we must execute effective and efficient marketing investments and trade spending programs with respect to our businesses overall to sustain our competitive position in our markets. Marketing investments may be costly. Additionally, we may, from time to time, change our marketing and trade spending strategies, including the timing, amount or nature of television advertising and related promotional programs. The sufficiency and effectiveness of our marketing and trade spending practices is important to our ability to retain or improve our market share or margins. If our marketing and trade spending programs are not successful or if we fail to implement sufficient and effective marketing and trade spending programs, our business, financial condition and results of operations may be adversely affected.
Risks Related to our Products and Customers
Our business depends on our ability to introduce new products and improve existing products in anticipation of changes in consumer preferences and demographics.
Our business is focused on the development, manufacture, marketing and distribution of pet food products. If consumer demand for our products decreased, our business would suffer. Sales of pet food products are subject to evolving consumer preferences, changing demographics and economic pressures. A significant shift in consumer demand away from our products or a decline in pet ownership could reduce our sales or the prestige of our brand, which would harm our business, financial condition and results of operations.
A key element of our growth strategy depends on our ability to develop and market new products and improvements to our existing products that meet our standards for quality and appeal to consumer preferences. The success of our innovation and product development efforts is affected by our ability to anticipate changes in consumer preferences and demographics, the technical capability of our product development staff in developing and testing product prototypes, including complying with governmental regulations, and the success of our management and sales team in introducing and marketing new products. Additionally, the development and introduction of new products requires substantial research, development and marketing expenditures, which we may be unable to recoup if the new products do not gain widespread market acceptance. Efforts to accelerate our innovation may exacerbate risks associated with innovation. Failure to develop and market new products that appeal to consumers and meet our objectives could negatively impact our business, financial condition and results of operations.
If we fail to develop and maintain our brand, or the quality of our products that customers have come to expect, our business could suffer.
We believe that developing and maintaining our brand and the quality of our products is critical to our success. The importance of our brand recognition and the quality of our products may become even greater as competitors offer more products similar to ours. Our financial success is directly dependent on consumer perception of our brand and our products. Our brand-building activities involve providing high-quality products, increasing awareness of our brand, creating and maintaining brand loyalty and increasing the availability of our products.
The success of our brand may suffer if our marketing plans or product initiatives do not have the desired impact on our brand’s image or its ability to attract customers. Further, our brand value could diminish significantly due to a number of factors, including consumer perception that we have acted in an irresponsible manner, adverse publicity about our products (whether or not valid), our failure to maintain the quality of our products, product contamination, the failure of our products to deliver consistently positive consumer experiences, or the products becoming unavailable to consumers. The growing use of social and digital media by consumers increases the speed and extent that information and opinions can be shared. Negative posts or comments about us or our brands or products on social or digital media could damage our brands and reputation. If we fail to maintain the favorable perception of our brands, our business, financial condition and results of operations could be negatively impacted.
The loss of a significant customer, certain actions by a significant customer or financial difficulties of a significant customer could adversely affect our results of operations.
A relatively limited number of customers account for a large percentage of our net sales. During 2023, ten customers, who purchase either directly from us or through third-party distributors, collectively accounted for approximately 73.1% of our net sales. This percentage may increase if there is consolidation among retailers or if mass merchandisers grow disproportionately to their competition. We expect that a significant portion of our revenues will continue to be derived from a small number of customers; however, these customers may not continue to purchase our products in the same quantities as they have in the past. Our customers are not contractually obligated to purchase from us. Changes in our customers’ strategies, including a reduction in the number of brands they carry, shipping strategies, a shift of shelf space to or increased emphasis on private label products (including “store brands”), a reduction in shelf space for pet food items or a reduction in the space allocated for our Freshpet hasFridges may adversely affect our sales. Requirements that may be imposed on us by our customers, such as sustainability, inventory management or product specification requirements, may have an adverse effect on our results of operations. Additionally, especially during economic downturns, our customers may face financial difficulties, bankruptcy or other business disruptions that may impact their operations and their purchases from us and may affect their ability to pay us for products purchased from us. To the extent customers seek to reduce their usual or customary inventory levels or change their practices regarding purchases in excess of consumer consumption, our sales and results of operations could be adversely impacted in that period. If our sales of products to one or more of our significant customers are reduced, this reduction could have a zero-tolerance policymaterial adverse effect on our business, financial condition and results of operations.
If we are unable to maintain or increase prices for briberyour products, our results of operations may be adversely affected.
We rely in part on price increases to neutralize cost increases and corruption. The Board establishedimprove the profitability of our business. Our ability to effectively implement price increases or otherwise raise prices for our products can be affected by a robust Whistleblower Policynumber of factors, including competition, our competitors’ pricing and marketing, aggregate industry supply, category limitations, market demand and economic conditions, including inflationary and interest rate pressures. During challenging economic times, our ability to set optimal proceduresincrease the prices of our products may be particularly constrained. Additionally, customers may pressure us to rescind price increases that we have announced or already implemented (either through a change in list price or increased promotional activity). If we are unable to maintain or increase prices for our products (or if we must increase promotional activity), our results of operations could be adversely affected. Furthermore, price increases generally result in volume losses, as consumers purchase fewer units. If such losses (also referred to as the elasticity impact) are greater than expected or if we lose distribution due to a price increase (which may result from a customer response or otherwise), our business, financial condition and results of operations could be adversely affected.
If our products are alleged to cause injury or illness, be mislabeled or misbranded, or fail to comply with regardgovernmental regulations, we may suffer adverse public relations, need to recall our products and experience product liability claims.
We have in the past and may in the future be exposed to product recalls, including voluntary recalls or withdrawals, and adverse public relations if our products are alleged to cause injury or illness or if we are alleged to have mislabeled or misbranded our products or otherwise violated governmental regulations. We may also voluntarily recall or withdraw products that we consider below our standards, whether for taste, appearance or otherwise, in order to protect our brand reputation. Consumer or customer concerns (whether justified or not) regarding the quality or safety of our products could adversely affect our business. Product recalls or withdrawals can result in substantial and unexpected expenditures, destruction of product inventory, and lost sales due to the unavailability of the product for a period of time, which could reduce profitability and cash flow. In addition, a product recall or withdrawal may require significant management attention. As an example, in June 2022 we initiated a voluntary recall of a single lot of a particular brand due to potential salmonella contamination. Although we received no reports of harm to pets or their owners as a result of this potential contamination, this recall resulted in production delays and significant diversion of management time to identify and remediate the issue. Product recalls, product liability claims (even if unmerited or unsuccessful), or any other events that cause consumers to no longer associate our brands with high quality and safe products may also result in adverse publicity or legal challenges, hurt the value of our brands, lead to a decline in consumer confidence in and demand for our products, and lead to increased scrutiny, fines, or other penalties by federal and state regulatory agencies of our operations, which could have a material adverse effect on our business, financial condition and results of operations.
We also may be subject to product liability claims and adverse public relations if consumption or use of our products is alleged to cause injury or illness. While we carry product liability insurance, our insurance may not be adequate to cover all liabilities we may incur in connection with product liability claims. For example, punitive damages are generally not covered by insurance. In addition, we may not be able to continue to maintain our existing insurance, obtain comparable insurance at a reasonable cost, if at all, or secure additional coverage (which may result in future product liability claims being uninsured). A product liability judgment against us or our agreement to settle a product liability claim could also result in substantial and unexpected expenditures, which would reduce profitability and cash flow. In addition, even if product liability claims against us are not successful or are not fully pursued, these claims could harm our brand image, be costly and time-consuming and may require management to spend time defending the claims rather than operating our business.
From time to time we may be subject to claims from competitors or consumers, including consumer class actions, alleging that our product claims are deceptive, such as products being mislabeled or misbranded. For example, we have had legal claims brought against us in California for our use of the word "natural" in describing certain of our products. Regardless of their merit, these claims can require significant time and expense to investigate and defend. Whether or not a false marketing claim is successful, such assertions could have an adverse effect on our business, financial condition and results of operations, and the negative publicity surrounding them could harm our reputation and brand image.
Risks Related to our Manufacturing and Supply Chain
We may not be able to successfully implement initiatives to improve productivity and streamline operations to control or reduce costs. Failure to implement such initiatives could adversely affect our results of operations.
Because our ability to effectively implement price increases for our products can be affected by factors outside of our control, our profitability and growth depend significantly on our efforts to control our operating costs. Because many of our costs, such as energy and logistics costs, packaging costs and ingredient, commodity and raw product costs, are affected by factors outside or substantially outside our control, we generally must seek to control or reduce costs through operating efficiency or other initiatives. If we are not able to identify and complete initiatives designed to control or reduce costs and increase operating efficiency on time or within budget, our results of operations could be adversely impacted. In addition, if the cost savings initiatives we have implemented to date, or any future cost-savings initiatives, do not generate expected cost savings, our business, financial condition and results of operations could be adversely affected.
Our manufacturing capacity and expansion plans could have a material adverse effect on our business, financial condition and results of operations.
Due to limited manufacturing capacity and our continued growth, the Company recently expanded its manufacturing capacity and may in the future continue expanding its manufacturing capacity via organic growth, operational efficiency increases or other means. See "Item 1. Business" and "Item 7. Management's Discussion and Analysis of Financial Condition and Results of Operations - Recent Developments." If our growth exceeds our expectations, we may not be able to increase our own manufacturing capacity to, or obtain contract manufacturing capacity at, a level that meets demand for our products, which could prevent us from meeting increased customer demand and harm our business. If we overestimate our demand and overbuild our capacity, we may have significantly underutilized assets, and we may experience reduced margins. If we do not accurately align our manufacturing capabilities with demand, it could have a material adverse effect on our business, financial condition and results of operations.
The inputs, commodities and ingredients that we require are subject to price increases, inflationary and interest rate pressures, and shortages that could adversely affect our results of operations.
The primary inputs, commodities and ingredients that we use include meat, vegetables, fruits, carrageenans, whole grains, vitamins, minerals, packaging and energy (including wind power). Prices for these and other items we use may be volatile, and we may experience shortages in these items due to factors beyond our control, such as commodity market fluctuations, availability of supply, increased demand (whether for the item we require or for other items, which in turn impacts the item we require), weather conditions, natural disasters, the effects of climate change, currency fluctuations, inflationary and/or interest rate pressures, governmental regulations (including import restrictions), agricultural programs or issues, energy programs, geopolitical concerns, madeincluding the ongoing conflict between Ukraine and Russia, labor strikes and the financial health of our suppliers. Input, commodity and ingredient price increases or shortages may result in higher costs or interrupt our production schedules, each of which could have a material adverse effect on our results of operations. Production delays could lead to reduced sales volumes and profitability, as well as loss of market share. Higher costs could adversely impact our earnings. For example, fuel prices affect our transportation costs for both ingredients and finished product. If we are not able to implement our productivity initiatives or increase our product prices to offset price increases of our inputs, commodities and ingredients, as a result of consumer sensitivity to pricing or otherwise, or if sales volumes decline due to price increases, our results of operations could be adversely affected. Our competitors may be better able than we are to implement productivity initiatives or effect price increases or to otherwise pass along cost increases to their customers. Moreover, if we increase our prices in response to increased costs, we may need to increase marketing spending, including trade promotion spending, in order to retain our market share. Such increased marketing spending may significantly offset the benefits, if any, of any price increase and negatively impact our business, financial condition and results of operations.
If we do not manage our supply chain effectively, including inventory levels, our business, financial condition and results of operation may be adversely affected.
The inability of any supplier, co-packer, third-party distributor or transportation provider to deliver or perform for us in a timely or cost-effective manner could cause our operating costs to increase and our profit margins to decrease. We must continuously monitor our inventory and product mix against forecasted demand or risk having inadequate supplies to meet consumer demand, as well as having too much inventory on hand that may reach its expiration date and become unsaleable. Changes in the availability and cost of freight may affect our supply chain and ultimately the pricing and availability of our products. If we are unable to manage our supply chain effectively and ensure that our products are available to meet consumer demand, our operating costs could increase and our profit margins could decrease.
Adverse weather conditions, natural disasters, pestilences, global or local pandemics, such as COVID-19 and other natural conditions can disrupt our operations, which can adversely affect our business, financial condition and results of operations.
The ingredients that we use in the production of our products (including, among others, meat, vegetables, fruits, carrageenans, whole grains, vitamins and minerals) are vulnerable to adverse weather conditions and natural disasters, such as floods, droughts, frosts, fires, earthquakes, tornadoes and pestilences. Adverse weather conditions may be impacted by climate change and other factors. Adverse weather conditions and natural disasters can reduce crop size and crop quality, which in turn could reduce our supply of ingredients, lower recoveries of usable ingredients, increase the prices of our ingredients, increase our transportation costs or increase our cost of storing ingredients if harvests are accelerated and processing capacity is unavailable. Additionally, the growth of crops, as well as the manufacture and processing of our products, requires significant amounts of water. Drought or other causes of a reduction of water in aquifers may affect availability of water, which in turn may adversely affect our results of operations. Competing manufacturers may be affected differently by weather conditions and natural disasters depending on the location of their supplies or operations. If our supply of ingredients is reduced, we may not be able to find enough supplemental supply sources on favorable terms, if at all, which could impact our ability to supply product to our customers and adversely affect our business, financial condition and results of operations. Increased costs for ingredients or other inputs could also adversely affect our business, financial condition and results of operations as described in “—The inputs, commodities and ingredients that we require are subject to price increases and shortages that could adversely affect our results of operations.”
Additionally, adverse weather conditions, natural disasters or other natural conditions, including global or local pandemics, such as COVID-19, affecting our operating activities or major facilities could cause an interruption or delay in our production or delivery schedules and loss of inventory and/or data or render us unable to accept and fulfill customer orders in a timely manner, or at all. If our operations are damaged by a fire, flood or other disaster, for example, we may be subject to supply or delivery interruptions, destruction of our facilities and products or other business disruptions, which could adversely affect our business, financial condition and results of operations. For example, during Q4 2020, we experienced a delay in our distribution chain due to winter storms in the Northeastern United States, which negatively impacted our results of operations for Q4 2020.
If the operating capacity or reputation of our Freshpet Fridges is harmed, our business, financial condition and results of operations may suffer.
Our success depends on our network of company-owned branded refrigerators, known as Freshpet Fridges. If the operating capacity of our Freshpet Fridges is harmed by external factors, such as adverse weather or energy supply, or internal factors, such as faulty manufacturing or insufficient maintenance, our products contained in those fridges may be damaged and need to be discarded. In addition, if our Freshpet Fridges fail to operate as intended, for any reason, the reputation of our Freshpet Fridges with customers and the reputation of our brand with consumers may decline. In such event, customers may choose to discontinue, or not to expand, their use of Freshpet Fridges and our products and consumers may choose to forgo purchasing our products. Any such harm to the operating capacity or reputation of our Freshpet Fridges could adversely affect our business, financial condition and results of operations.
If the ingredients we use in our products are contaminated, alleged to be contaminated or are otherwise rumored to have adverse effects, our results of operations could be adversely affected.
We buy our ingredients from third-party suppliers. If these materials are alleged or prove to include contaminants that affect the safety or quality of our products or are otherwise rumored to have adverse effects, for any reason, we may need to find alternate ingredients for our products, delay production of our products, or discard or otherwise dispose of our products, which could adversely affect our results of operations. Additionally, if this occurs after the affected product has been distributed, we may need to withdraw or recall the affected product and we may experience adverse publicity or product liability claims. In either case, our business, financial condition and results of operations could be adversely affected.
Restrictions imposed in reaction to outbreaks of animal diseases could have a material adverse effect on our business, financial condition and results of operations.
The cost of the protein-based ingredients we use in our products has been adversely impacted in the past by the publicity surrounding animal diseases, such as bovine spongiform encephalopathy, or “mad cow disease.” As a result of extensive global publicity and trade restrictions imposed to provide safeguards against mad cow disease, the cost of alternative sources of the protein-based ingredients we use in our products has from time to time increased significantly and may increase again in the future if additional cases of mad cow disease are found.
If mad cow disease or other animal diseases, such as foot-and-mouth disease or highly pathogenic avian influenza, also known as “bird flu,” impacts the availability of the protein-based ingredients we use in our products, we may be required to locate alternative sources for protein-based ingredients. Those sources may not be available to sustain our sales volumes, may be more costly and may affect the quality and nutritional value of our products. If outbreaks of mad cow disease, foot-and-mouth disease, bird flu or any other animal disease or the regulation or publicity resulting therefrom impacts the cost of the protein-based ingredients we use in our products, or the cost of the alternative protein-based ingredients necessary for our products as compared to our current costs, we may be required to increase the selling price of our products to avoid margin deterioration. However, we may not be able to charge higher prices for our products without negatively impacting future sales volumes.
We rely on co-packers to provide our supply of certain products. Any failure by co-packers to fulfill their obligations or any termination or renegotiation of our co-packing agreements could adversely affect our results of operations.
We have supply agreements with co-packers that require them to provide us with specific finished products. We rely on co-packers as our sole source for certain products. We also anticipate that we will rely on sole suppliers for future products. The failure for any reason of a co-packer to fulfill its obligations under the applicable agreements with us or the termination or renegotiation of any such co-packing agreement could result in disruptions to our supply of finished goods and have an adverse effect on our results of operations. Additionally, from time to time, a co-packer may experience financial difficulties, bankruptcy or other business disruptions, which could disrupt our supply of finished goods or require that we incur additional expense by providing financial accommodations to the co-packer or taking other steps to seek to minimize or avoid supply disruption, such as establishing a new co-packing arrangement with another provider. During economic downturns, our co-packers may be more susceptible to experiencing such financial difficulties, bankruptcies or other business disruptions. A new co-packing arrangement may not be available on terms as favorable to us as the existing co-packing arrangement, if at all.
Failure by our transportation providers to deliver our products on time or at all could result in lost sales.
We use third-party transportation providers for our product shipments. We rely on two primary providers for almost all of our shipments. Transportation services include scheduling and coordinating transportation of finished products to our customers, shipment tracking and freight dispatch services. Our use of transportation services for shipments is subject to risks, including increases in fuel prices, which would increase our shipping costs, and employee strikes and inclement weather, which may impact the ability of providers to provide delivery services that adequately meet our shipping needs, including keeping our products adequately refrigerated during shipment. Any such change could cause us to incur costs and expend resources. Moreover, in the future we may not be able to obtain terms as favorable as those we receive from the third-party transportation providers that we currently use, which in turn would increase our costs and thereby adversely affect our business, financial condition and results of operations.
Disruptions in the worldwide economy may adversely affect our business, results of operations, and financial condition.
Adverse and uncertain economic conditions may impact distributor, customer, and consumer demand for our products. In addition, our ability to manage normal commercial relationships with our suppliers, contract manufacturers, distributors, customers, consumers, and creditors may suffer. Consumers have access to lower-priced offerings and, during economic downturns, may shift purchases to these lower-priced or other perceived value offerings. Customers may become more conservative in response to these conditions and seek to reduce their inventories. For example, during the economic downturn from 2007 through 2009, customers significantly reduced their inventories. Global or local pandemics, such as COVID-19, could also have adverse impacts on our business operations. Our results of operations depend upon, among other things, our ability to maintain and increase sales volume with our existing customers, to attract new consumers and to provide products that appeal to consumers at prices they are willing and able to pay. Prolonged unfavorable economic conditions may have an adverse effect on our sales and profitability.
Our ability to meet our workforce needs, particularly for staffing our Freshpet Kitchens, is crucial
We rely on the existence of an available, qualified workforce to efficiently execute our operations and manufacture our products. Competition for qualified employees or inflationary pressures on employee compensation could require us to pay higher wages to attract and retain a sufficient number of qualified employees. We cannot be certain that we will be able to attract and retain qualified employees to meet current or future operational needs at a reasonable cost, or at all.
Although none of our employees are currently covered under collective bargaining agreements, any disruption in our employee relationships, including hiring and retaining our employees, could adversely affect our ability to attract and retain qualified employees to meet current or future manufacturing needs at a reasonable cost, or at all.
Risks Related to Government Regulation and Legal Proceedings
Government regulation, scrutiny, warnings and public perception could increase our costs of production and increase legal and regulatory expenses.
Manufacturing, processing, labeling, packaging, storing and distributing pet products are activities subject to extensive federal, state and local regulation, as well as foreign regulation. In the United States, these aspects of our operations are regulated by the FDA, and various state and local public health and agricultural agencies. The FDA Food Safety Modernization Act of 2011 provides direct recall authority to the FDA and includes a number of other provisions designed to enhance food safety, including increased inspections by the FDA of domestic and foreign food facilities and increased review of food products imported into the United States. In addition, many states have adopted the Association of American Feed Control Officials’ model pet food regulations or variations thereof, which generally regulate the information manufacturers provide about pet food. Complying with government regulation can be costly or may otherwise adversely affect our business. Failure to comply with applicable laws and regulations could subject us to civil remedies, including fines, injunctions, recalls or seizures, as well as potential criminal sanctions, which could have a material adverse effect on our business, financial condition and results of operations.
Our business is also affected by import and export controls and similar laws and regulations, both in the United States and elsewhere. Issues such as national security or health and safety, which slow or otherwise restrict imports or exports, could adversely affect our business. In addition, the modification of existing laws or regulations or the introduction of new laws or regulations could require us to make material expenditures or otherwise adversely affect the way that we have historically operated our business.
From time to time, we may be subject to litigation, government investigations or governmental proceedings, which may adversely impact our results of operations and financial condition.
From time to time, we have been and may continue to be involved in various legal, regulatory or administrative investigations, negotiations or proceedings arising in the normal course of business. In the event of litigation, government investigations or governmental proceedings, we are subject to the inherent risks and uncertainties that may result if outcomes differ from our expectations. In the event of adverse outcomes in any litigation, investigation or government proceeding, we could be required to pay substantial damages, fines or penalties and cease certain practices or activities, which could materially harm our business. For example, as an employer, we may be subject to various employment-related claims, such as individual or class actions or government enforcement actions relating to alleged employment discrimination, employee classification and related withholding, wage-hour, labor standards or healthcare and benefit issues. Such actions, if successful in whole or in part, may affect our ability to compete or could materially adversely affect our business, financial condition and results of operations.
Risks Related to Intellectual Property
If we are not successful in protecting our intellectual property rights, our business, financial conditions and results of operations may be harmed.
We rely on trademark, copyright, trade secret, patent and other intellectual property laws, as well as nondisclosure and confidentiality agreements and other methods, to protect our intellectual property rights as well as the intellectual property of third parties with respect to which we are subject to non-use and non-disclosure obligations. We may need to engage in litigation or similar activities to enforce our intellectual property rights, to protect our trade secrets or to determine the validity and scope of proprietary rights of others. Any such litigation could require us to expend significant resources and divert the efforts and attention of our management and other personnel from our business operations. The steps we take to prevent misappropriation, infringement or other violation of our intellectual property or the intellectual property of others may not be successful. In addition, effective patent, copyright, trademark and trade secret protection may be unavailable or limited for some of our trademarks and patents in some foreign countries. Failure to protect our intellectual property could harm our business, financial condition and results of operations.
Our brand names and trademarks are important to our business, and we have registered or applied to register many of these trademarks. We cannot assure you that our trademark applications will be approved. Third parties may also oppose our trademark applications, or otherwise challenge our use of the trademarks. In the event that our trademarks are successfully challenged, we could be forced to rebrand our products, which could result in the loss of brand recognition and could require us to devote resources to advertising and marketing new brands. Further, we cannot assure you that competitors will not infringe our trademarks, or that we will have adequate resources to enforce our trademarks.
We rely on unpatented proprietary know-how in the areas of recipes, ingredients sourcing, cooking techniques, packaging, transportation and delivery. It is possible that others will independently develop the same or similar know-how or otherwise obtain access to our proprietary know-how. To protect our trade secrets and other proprietary know-how, we require employees, consultants, advisors and collaborators to enter into confidentiality agreements. We cannot assure you that these agreements will provide meaningful protection in the event of any unauthorized use, misappropriation or disclosure of our trade secrets, know-how or other proprietary information. If we are unable to maintain the proprietary nature of our recipes, methods and other know-how, we could be materially adversely affected.
Further, to the extent we develop, introduce and acquire products, the risk of such claims may be exacerbated. Any such claims, even those without merit, could (i) require us to expend significant resources, (ii) cause us to cease making or using products that incorporate the challenged intellectual property, (iii) require us to redesign, reengineer or rebrand our products or packaging, including our Freshpet Fridges, (iv) divert management's attention and resources or (v) require us to enter into royalty or licensing agreements in order to obtain the right to use a third-party's intellectual property, which may not be available to us on acceptable terms or at all. Any of such events may adversely impact our business, financial condition and results of operations.
Risks Related to our International Operations
We may face difficulties as we expand into countries in which we have no prior operating experience.
In recent years, we have expanded our global footprint by entering into new markets and may expand into additional markets in the future. For example, we currently do business with four retailers in the United Kingdom, where our products are selling in approximately 544 stores. As we continue to expand our business into new countries, we may encounter regulatory, personnel, technological and other difficulties that increase our expenses or delay our ability to become profitable in such countries. This may have an adverse effect on our business.
In addition, our expansion into new countries may require significant resources and the efforts and attention of our management and other personnel, which will divert resources from our existing business operations. As we expand our business globally, our success will depend, in large part, on our ability to anticipate and effectively manage these and other risks associated with our operations outside of the United States and Canada.
Risks Related to Environmental Regulation and Environmental Risks
We are subject to environmental regulation and environmental risks, which may adversely affect our business. Climate change or concerns regarding climate change may increase environmental regulation and environmental risks.
As a result of our agricultural and food processing operations, we are subject to numerous environmental laws and regulations at the federal, state and local levels. As these laws and regulations become increasingly complex, our compliance costs become increasingly expensive. Changes in environmental conditions may result in existing legislation having a greater impact on us. Additionally, we may be subject to new legislation and regulation in the future.
For example, the long-term effects of global climate change present both physical risks (such as extreme weather conditions or rising sea levels) and transition risks (such as regulatory or technology changes), which are expected to be widespread and unpredictable. These changes could over time affect, for example, the availability and cost of products, commodities, including our ingredients, and energy (including utilities), which in turn may impact our ability to procure goods or services required for the operation of our business at the quantities and levels we require. Regulations limiting greenhouse gas emissions and energy inputs may also increase in coming years, which may increase our costs associated with compliance.
Additionally, compliance with evolving environmental legislation and regulations, particularly if they are more aggressive than our current sustainability measures used to monitor our emissions and improve our energy efficiency, may increase our costs and adversely affect our results of operations. We cannot predict the extent to which any environmental law or regulation that may be enacted or enforced in the future may affect our operations. The effect of these actions and future actions on the availability and use of pesticides could adversely impact our financial position or results of operations. If the cost of compliance with applicable environmental laws or regulations increases, our business, financial condition and results of operations could be negatively impacted.
Risks Related to Information Technology and Cyber Security
Our business operations could be disrupted if our information technology systems fail to perform adequately.
The efficient operation of our business depends on our information technology systems, some of which are managed by third-party service providers. We rely on our information technology systems to effectively manage our business data, communications, supply chain, order entry and fulfillment, and other business processes. The failure of our information technology systems to perform as we anticipate could disrupt our business and could result in transaction errors, processing inefficiencies, and the loss of sales and customers, impacts to working capital, causing our business and results of operations to suffer. In addition, our information technology systems may be vulnerable to damage or interruption from circumstances beyond our control, including fire, natural disasters, power outages, systems failures, security breaches, physical theft or vandalism, cyber-attacks and viruses. Any such damage or interruption could have a material adverse effect on our business, financial condition and results of operations.
We are subject to cyber security risks and may incur increasing costs in an effort to minimize those risks.
Our business employs systems and websites that allow for the secure storage and transmission of proprietary or confidential information regarding our customers, employees, suppliers and others, including personal identification information. Security breaches could expose us to a risk of loss or misuse of this information, litigation, and potential liability. We, or third-party service providers on whom we may rely, may not have the resources or technical sophistication to anticipate or prevent rapidly-evolving types of cyber-attacks, including those generated by artificial intelligence. Attacks may be targeted at us, our customers and suppliers, or others who have entrusted us with information. Actual or anticipated attacks may cause us to incur increasing costs, including costs to deploy additional personnel and protection technologies, provide additional training for employees, and engage third-party experts and consultants. In addition, data and security breaches can also occur as a result of non-technical issues, including breach by us or by persons with whom we have commercial relationships that result in the unauthorized release of personal or confidential information. Furthermore, the increased use of smartphones, tablets, and other wireless devices, as well as continued work-from-home arrangements for a substantial portion of our corporate employees, may also heighten these and other operational risks. Any compromise or breach of our security could result in a violation of applicable privacy and other laws, including federal and state law, as well as the General Data Protection Regulation ("GDPR"), which could result in significant legal and financial exposure, and a loss of confidence in our security measures, which could have an adverse effect on our business, financial condition and results of operations.
Risks Related to our NOLs
We may be unable to use some or all of our net operating loss carryforwards, which could adversely affect our financial results.
As of December 31, 2023, we had federal net operating loss (“NOLs”) carryforwards of approximately $420.3 million and state NOLs of approximately $312.8 million that we may use to offset against taxable income for U.S. federal and state income tax purposes, respectively. In general, a corporation that undergoes an "ownership change" is subject to limitations on its ability to utilize its “pre-ownership change” NOLs to offset future taxable income. In general, under the U.S. Internal Revenue Code of 1986, as amended (the “Code”), an ownership change occurs if the aggregate stock ownership of certain stockholders (generally 5% stockholders, applying certain look-through and aggregation rules) increases by more than 50 percentage points over such stockholders’ lowest percentage ownership during the testing period (generally three years). We have completed several analyses under Section 382 of the Code in the past which concluded that certain annual limitations exist. Purchases or sales of our common stock in amounts greater than specified levels, which are generally beyond our control, could create additional limitations on our ability to utilize our NOLs for tax purposes in the future. Limitations imposed on our ability to utilize NOLs could cause an increase in the amount of our aggregate payments of U.S. federal and state income taxes in future years. In addition, (i) the amount of NOLs generated in taxable years beginning after December 31, 2017 that we are permitted to deduct in any taxable year beginning after December 31, 2020 is limited to 80% of our taxable income in such year, and (ii) NOLs generated in taxable years beginning after December 31, 2020 cannot be carried back to prior taxable years. Furthermore, we may not be able to generate sufficient taxable income to utilize our pre-2018 NOLs before they expire. If any of these events occur, we may not derive some or all of the expected benefits from our NOLs. In addition, NOLs incurred in one state will not be available to offset income earned in a different state. Furthermore, there may be periods during which the use of NOLs is suspended or otherwise limited for state tax purposes, which could accelerate or permanently increase state taxes owed.
Risks Related to Interest Rates
Changes in interest rates may adversely affect our earnings and cash flows.
During periods of rising interest rates, our cost of borrowing could increase, the fair value of our investments could be affected, and it could constrain the purchasing power of our customers.
Risks Related to Ownership of Our Common Stock
Our quarterly operating results may fluctuate significantly and could fall below the expectations of securities analysts and investors due to various factors that are beyond our control, resulting in a decline in our stock price.
Our quarterly operating results may fluctuate significantly, including because of the risks described in this "Risks Factors" section. Accordingly, results for any one period are not necessarily indicative of results to be expected for any future period. In the future, operating results may fall below the expectations of securities analysts and investors. In that event, the price of our common stock would likely decrease.
The price of our common stock has been and may continue to be volatile and you may lose all or part of your investment.
The trading price of our common stock has been, and may continue to be, volatile, and you may not be able to resell your shares at or above the purchase price. Such volatility could be based on various factors relating to our Company and industry, including those described in this “Risks Factors" section.
In addition, in recent years the stock market has experienced significant price and volume fluctuations. These fluctuations may be unrelated to the operating performance of particular companies. These broad market fluctuations may cause declines in the market price of our common stock. The price of our common stock could fluctuate based upon factors that have little or nothing to do with our business, financial condition and results of operations, and those fluctuations could materially reduce our common stock price.
As we operate in a single industry, we are especially vulnerable to these factors to the extent that they affect our industry or our products. In the past, securities class action litigation has often been initiated against companies following periods of volatility in their stock price and we have defended against such lawsuits in the past.
Future sales of our common stock, or the perception that such sales may occur, could depress our common stock price.
As of December 31, 2023, we had 48,263,097 shares of common stock outstanding, and our Certificate of Incorporation authorizes us to issue up to 200 million shares of common stock.
In the future, we may issue additional shares of common stock or other securities if we need to raise additional capital. The number of new shares of our common stock issued in connection with raising additional capital could constitute a material portion of the then outstanding shares of our common stock. Any future sales of our common stock, or the perception that such sales may occur, could negatively impact the price of our common stock.
Actions of activist stockholders have in the past and could in the future cause us to incur substantial costs, divert management's attention and resources, and have an adverse effect on our business.
We have been and may continue to be subject to proposals by stockholders urging us to take certain corporate actions. If activist stockholder activities continue, our business could be adversely affected because responding to proxy contests and reacting to other actions by activist stockholders can be costly and time-consuming, disrupt our operations, and divert the attention of management and our employees. For example, we have been and may continue to be required to retain the services of various professionals to advise us on activist stockholder matters, including legal, financial, and communications advisers, the costs of which may negatively impact our future financial results. This may be exploited by our competitors, cause concern to our current or potential customers, and make it more difficult to attract and retain qualified personnel. In addition, actions of activist shareholders may cause significant fluctuations in our stock price based on temporary or speculative market perceptions or other factors that do not necessarily reflect the underlying fundamentals and prospects of our business.
Future offerings of debt securities, which would rank senior to our common stock upon our bankruptcy or liquidation, and future offerings of equity securities, which may be senior to our common stock for the purposes of dividend and liquidating distributions, may adversely affect the market price of our common stock.
In the future, we may attempt to increase our capital resources by making offerings of debt securities or additional offerings of equity securities. Upon bankruptcy or liquidation, holders of our debt securities and shares of preferred stock and lenders with respect to other borrowings will receive a distribution of our available assets prior to the holders of our common stock. Additional equity offerings may dilute the holdings of our existing stockholders or reduce the market price of our common stock, or both, and may result in future Section 382 limitations that could reduce the rate at which we utilize our NOL carryforwards. Preferred stock, if issued, could have a preference on liquidating distributions or a preference on dividend payments or both that could limit our ability to make a dividend distribution to the holders of our common stock. Our decision to issue securities in any future offering will depend on market conditions and other factors beyond our control. As a result, we cannot predict or estimate the amount, timing or nature of our future offerings, and purchasers of our common stock in this offering bear the risk of our future offerings reducing the market price of our common stock and diluting their ownership interest in our company.
ITEM 1B. UNRESOLVED STAFF COMMENTS
None.
The information technology systems we rely upon to effectively manage our business data, communications, supply chain, order entry and fulfillment, and other business processes are subject to risk from security breaches and other significant disruptions. Such breaches and disruptions may occur through breaches by our personnel or by intrusions over the Internet, malware, computer viruses, attachments to e-mails or by persons with whom we have commercial relationships. While we have not, as of the date of this Form 10-K, experienced a cybersecurity threat or incident that resulted in a material adverse impact to our business or operations, there can be no guarantee that we will not experience such an incident in the future. See "Item 1A. Risk Factors— We are subject to cyber security risks and may incur increasing costs in an effort to minimize those risks".
Our information security organization, led by our Chief Information Officer (our "CIO") who reports to our Chief Financial Officer (our "CFO"), is comprised of both I.T. security leadership and dedicated Cybersecurity staff. The information security organization has extensive technology security and program management experience including cybersecurity professional certifications such as Certified Information Systems Security Professional ("CISSP"), advanced degrees in Information Assurance, and numerous years' experience assessing and managing cybersecurity risk within the Department of Defense and other public companies. Our CIO has over 25 years of technology experience, including leading information governance, I.T. security, and cybersecurity teams and initiatives across both publicly traded companies and global organizations.
Our policies, practices, and standards for addressing material risks associated with cybersecurity are integrated into our overall risk management and are based on industry standards including the National Institute of Standards and Technology ("NIST") which aligns the prevention techniques, identification, protection, detection, response, and recovery related to an incident. These controls are tested by our information security organization and by independent third parties. We actively engage with industry groups for awareness of best practices and our third-party provides for industry benchmarking of critical areas within our cybersecurity posture.
Our organization-wide information security program focuses on implementing effective and efficient controls, technologies, and other processes to help protect, identify, assess, manage and mitigate material cybersecurity threats and incidents. These processes include, among other things, regular testing of these controls through table-top exercises, penetration and vulnerability testing, auditing of our information security by an independent third-party auditor, ongoing security awareness training for employees and other parties,educational programs, and continuous monitoring of our cybersecurity posture. We also employ numerous tools including, but not limited to, protect whistleblowers against harassment or retaliation. The Whistleblower linesegregated layers of controls for access to our systems and security tools that help identify, isolate, remediate, and recover from identified vulnerabilities and security incidents in a timely manner. Our cybersecurity posture is monitored directlymanaged by both our CEOinformation security organization and Senior Vice Presidentthrough partnerships with industry recognized cybersecurity firms.
We have also created, and tested through incident response drills, the Freshpet Incident Response Plan and Playbook, which together set forth policy-level directives as well as specific guidelines for implementation, that describe our process for responding in the event of Human Resourcescertain defined cyber incidents. These protocols (i) define the roles and is reportedresponsibilities of participants, relationships to other Company policies and procedures, and reporting requirements needed during an incident, (ii) provide a framework by which our Incident Response Team (IRT) shall determine the scope and risk of an incident, respond appropriately to that incident, and inform the Board and others depending upon the nature and severity of the incident, and (iii) reduce the likelihood of a similar incident from reoccurring following identification of such an incident.
Our CIO and other members of the information security organization routinely engage with our CFO regarding cyber risk management activities and provide updates and data, as needed, to other members of our executive team to facilitate decisions regarding security matters. No less than twice per year, and more frequently as appropriate, our CFO and CIO also provide updates regarding our cybersecurity risk management strategy and related activities to the Audit Committee quarterly.of our Board of Directors, and provide other information as needed to facilitate the committee's oversight of our cybersecurity risk.
Our corporate headquarters, located in Secaucus, New Jersey and consisting of approximately 24,000 square feet of office space, is subject to a lease agreement that expires on June 30, 2024.
We own the Freshpet received four inquiriesKitchens Bethlehem ("Kitchens 1.0" and "Kitchens 2.0"). Kitchens 1.0 is approximately a 100,000 square-foot manufacturing facility, and Kitchens 2.0 is approximately a 140,000 square-foot manufacturing facility, each located in Bethlehem, Pennsylvania (together, the "Freshpet Kitchens Bethlehem").
Additionally we own a second location in Ennis, Texas ("Freshpet Kitchens Ennis"), that will be completed in 3 phases. Phase 1 had one line commissioned during 2022 and the remaining two lines were completed during 2023, subsequent to which, the Freshpet Kitchens Ennis facility represents approximately 400,000 square-foot. The first line in phase 2 is planned to be completed by the third quarter of 2024 with the remaining lines to be completed along with phase 3 over the next several years. At the completion of phase 2 and 3, the Freshpet Kitchens Ennis facility will grow by approximately 300,000 and 325,000 square-foot, respectively.
We believe that our properties have been adequately maintained, are in good condition generally and are suitable and adequate for our business as presently conducted.
We are currently involved in various claims and legal actions that arise in the ordinary course of our business. While the results of such litigation proceedings cannot be predicted with certainty, management believes none of these claims or proceedings are expected to have a material adverse effect on our business, financial condition, results of operations or cash flows. See also “Item 1A. Risk Factors” and Note 9 to our Consolidated Financial Statements for a discussion of certain legal proceedings involving the Company.
ITEM 4. MINE SAFETY DISCLOSURES
Not applicable.
ITEM 5. Market for registrant’s common equity, related stockholder matters and issueR purchases of equity secuRIties
Market Information
Shares of our common stock are publicly traded on the Whistleblower lineNasdaq Global Market under the symbol "FRPT".
The number of stockholders of record of our common stock as of February 22, 2024 was approximately 425. This number excludes stockholders whose stock is held in 2022 from callers based withinnominee or street name by brokers.
Dividend Policy
Since we became a publicly traded company in 2014, we have not declared or paid, and do not anticipate declaring or paying in the foreseeable future, any cash dividends on our manufacturing Kitchens. The inquiries relatedcapital stock. Any future determination to hourly employee shift concernsdeclare and were investigated internallypay cash dividends will be at the discretion of our Board of Directors in accordance with applicable laws and will depend on, among other things, our financial condition, results of operations, cash requirements, contractual restrictions and such other factors as our Board of Directors deems relevant. Our ability to pay dividends may also be limited by covenants of any future outstanding indebtedness we or by an independent labor attorney. Remedial actions were takenour subsidiaries incur.
Issuer Purchases of Equity Securities
None.
Stock Performance Graph
This performance graph shall not be deemed “soliciting material” or to addressbe “filed” with the employee concerns and all inquiries have been closed.
The following graph compares our total common stock (collectively, “Reporting Persons”) to filereturn with the total return for (i) the NASDAQ Composite Index (the “NASDAQ Composite”) and (ii) the Russell 3000 Index (the “Russell 3000”) for the five-year period ended December 31, 2023. The graph assumes that $100 was invested on December 31, 2019, in each of our common stock, the NASDAQ Composite and the Russell 3000. The comparisons in the table are required by the SEC initial reportsand are not intended to forecast or be indicative of ownership and changes in ownershippossible future performance of the Company’sour common stock. Based solely on its review
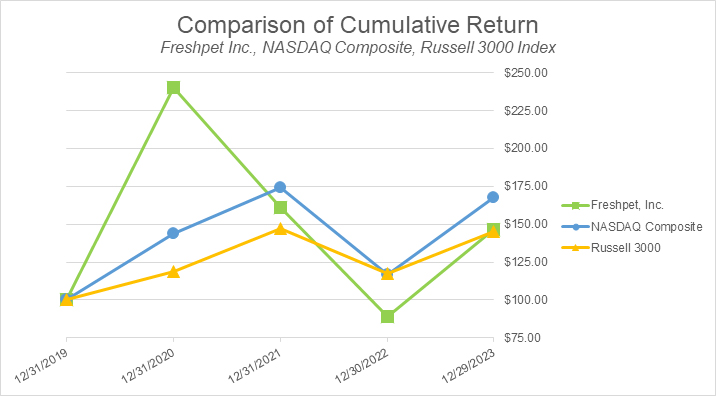
Date | Freshpet, Inc. | NASDAQ Composite | Russell 3000 | |||||||||
31-Dec-19 | $ | 100.00 | $ | 100.00 | $ | 100.00 | ||||||
31-Dec-20 | $ | 240.29 | $ | 143.64 | $ | 118.82 | ||||||
31-Dec-21 | $ | 161.23 | $ | 174.36 | $ | 147.35 | ||||||
31-Dec-22 | $ | 89.30 | $ | 116.65 | $ | 117.17 | ||||||
31-Dec-23 | $ | 146.83 | $ | 167.30 | $ | 145.24 | ||||||
ITEM 7. Management’s Discussion and Analysis of the copiesFinancial Condition and Results of such reports received or written representationsOperations
The following discussion contains forward-looking statements that involve risks and uncertainties. Our actual results may differ materially from certain Reporting Persons that no other reports were required,those discussed in these forward-looking statements as a result of various factors, including those set forth in “Risk Factors.” The following discussion of our financial condition and results of operations should be read in conjunction with our consolidated financial statements included elsewhere in this report.
For more information regarding our consolidated results and liquidity and capital resources for the Company believes that during its fiscal year ended December 31, 2022 all filing requirements applicableas compared to the Reporting Persons were timely met except (i) Mr. Macchiaverna did not timely file Forms 4year ended December 31, 2021, refer to "Part II, Item 7. Management’s Discussion and Analysis of Financial Condition and Results of Operations" in connection with tax withholdings of shares of common stockthe Company's 2022 Annual Report on March 12, 2022 and April 1, 2022, (ii) Mr. Walsh did not timely file a Form 4 in connection10-K, which information is incorporated herein by reference.
Overview
We started Freshpet with a tax withholdingsingle-minded mission to bring the power of shares of common stock on March 12, 2022, and (iii) Mr. Garcia did not timely file Forms 4 in connection with tax withholdings of shares of common stock on March 12, 2022 and April 1, 2022 and receipt of a grant of restricted shares of common stock on March 14, 2022, in each case due to administrative oversight.
Components of our Results of Operations
Net Sales
Our net sales are obsessedderived from the sale of pet food products that are sold to retailers through broker and distributor arrangements. Our products are sold to consumers through a fast-growing network of company-owned branded refrigerators, known as Freshpet Fridges, located in our missioncustomers’ stores. We continue to ensure that all people who touchroll out Freshpet are betterFridges at leading retailers across North America and parts of Europe and have installed Freshpet Fridges in some way. We strive to be the place where people love to work and we encourage everyone to grow, have fun and deliver on our vision. Our overall people strategy is designed to attract, develop and retain the best qualified employees to meet our business goals on an ongoing basis and to execute our growth strategy. We do this through practices that promote inclusion, provide development opportunities for employees across the organization and provide competitive rewards and benefits. We also believe that having an engaged, diverse and committed workforce not only enhances our culture but also drives our business success.
Our net sales growth is driven by the following key factors:
● | Increasing sales velocity from the average Freshpet Fridge due to increasing awareness, trial and adoption of Freshpet products and innovation. Our investments in marketing and advertising help to drive awareness and trial at each point of sale. |
● | Increasing penetration of Freshpet Fridge locations in major classes of retail, including Grocery, Mass, Club, Pet Specialty, Natural, and Digital. The impact of new Freshpet Fridge installations on our net sales varies by retail class and depends on numerous factors including store traffic, refrigerator size, placement within the store, and proximity to other stores that carry our products. |
● | Consumer trends including growing pet ownership, pet humanization and a focus on health and wellness. | |
| ● | At times we increase our sales price to offset any adverse movement in input costs. |
We believe that as a result of the above key factors, we will continue to penetrate the pet food marketplace and increase our share of approximately 26% from one year earlier, based across our three locations of Bethlehem, Pennsylvania, Secaucus, New Jersey, and Ennis, Texas. In Europe, Freshpet has also employed seven employees. None of our employees are represented by a labor union or covered by a collective bargaining agreement.
Employee EngagementGross Profit
Our gross profit is net of costs of goods sold, which include the costs of product manufacturing, product ingredients, packaging materials and inbound freight, as well as depreciation and amortization and non-cash share-based compensation.
We expect to continue to mitigate any adverse movement in input costs through a combination of cost management and price increases.
Selling, General and Administrative Expenses
Our selling, general and administrative expenses consist of the following:
Outbound freight. We use a third-party logistics provider for outbound freight that ships directly to retailers as well as third-party distributors.
Marketing & advertising. Our marketing and advertising expenses primarily consist of national television media, digital marketing, social media and grass roots marketing to drive brand awareness. These expenses may vary from quarter to quarter depending on the timing of our marketing and advertising campaigns. Our Feed the Growth initiative focuses on growing the business through increased marketing investments.
Freshpet achievedFridge operating costs. Freshpet Fridge operating costs consist of repair costs and depreciation. The purchase and installation costs for new Freshpet Fridges are capitalized and depreciated over the estimated useful life. All new refrigerators are covered by a manufacturer warranty for three years. We subsequently incur maintenance and freight costs for repairs and refurbishments handled by third-party service providers.
Research & development. Research and development costs consist of expenses to develop and test new products. The costs are expensed as incurred.
Brokerage. We use third-party brokers to assist with monitoring our products at the point-of-sale as well as representing us at headquarters for various customers. These brokers visit our retail customers’ store locations to ensure items are appropriately stocked and maintained.
Share-based compensation. We account for all share-based compensation payments issued to employees, directors and non-employees using a fair value method. Accordingly, share-based compensation expense is measured based on the estimated fair value of the awards on the grant date using the Black-Scholes Merton option-pricing model. We recognize compensation expense for the portion of the award that is ultimately expected to vest over the period during which the recipient renders the required services to us using the straight-line single option method.
Other general & administrative costs. Other general and administrative costs include non-plant personnel salaries and benefits, as well as corporate general & administrative costs.
Income Taxes
We had federal net operating loss (“NOL”) carry forwards of approximately $420.3 million as of December 31, 2023, of which, approximately $175.4 million, generated in 2017 and prior, will expire between 2025 and 2037. The NOL generated from 2018 through 2023, of approximately $244.9 million, will have an engagement scoreindefinite carryforward period, but can generally only be used to offset 80% of 78% with a total participation rate of 66%. Our Net Promoter score was 8.0. While this represents a 0.3 point decline from our previous survey (2020), we believe that the positive score continuestaxable income in any particular year. We may be subject to demonstrate our employees' positive perception about the future of Freshpet and strong beliefcertain limitations in our vision.
Consolidated Statements of Operations and Comprehensive Loss
Twelve Months Ended December 31, | ||||||||||||||||||||||||
2023 | 2022 | 2021 | ||||||||||||||||||||||
Amount | % of Net Sales | Amount | % of Net Sales | Amount | % of Net Sales | |||||||||||||||||||
(Dollars in thousands) | ||||||||||||||||||||||||
Net sales | $ | 766,895 | 100 | % | $ | 595,344 | 100 | % | $ | 425,489 | 100 | % | ||||||||||||
Cost of goods sold | 516,023 | 67 | 409,311 | 69 | 263,343 | 62 | ||||||||||||||||||
Gross profit | 250,872 | 33 | 186,033 | 31 | 162,146 | 38 | ||||||||||||||||||
Selling, general and administrative expenses | 281,318 | 37 | 238,016 | 40 | 186,809 | 44 | ||||||||||||||||||
Loss from operations | (30,446 | ) | (4 | ) | (51,983 | ) | (9 | ) | (24,663 | ) | (6 | ) | ||||||||||||
Interest and other income, net | 13,029 | 2 | 1,710 | 0 | 13 | 0 | ||||||||||||||||||
Interest expense | (14,097 | ) | (2 | ) | (5,208 | ) | (1 | ) | (2,882 | ) | (1 | ) | ||||||||||||
Loss before income taxes | (31,514 | ) | (4 | ) | (55,481 | ) | (10 | ) | (27,532 | ) | (6 | ) | ||||||||||||
Income tax expense | 210 | 0 | 282 | 0 | 162 | 0 | ||||||||||||||||||
Loss on equity method investment | 1,890 | 0 | 3,731 | 1 | 2,005 | 0 | ||||||||||||||||||
Net loss | $ | (33,614 | ) | (4 | )% | $ | (59,494 | ) | (10 | )% | $ | (29,699 | ) | (7 | )% | |||||||||
Twelve Months Ended December 31, 2023 Compared To Twelve Months Ended December 31, 2022
Net Sales
The following table sets forth net sales by class of retail:
Year Ended December 31, | ||||||||||||||||||||||||
2023 | 2022 | |||||||||||||||||||||||
Amount | % of Net Sales | Store Count | Amount | % of Net Sales | Store Count | |||||||||||||||||||
(Dollars in thousands) | ||||||||||||||||||||||||
Grocery, Mass and Club (1) | $ | 685,307 | 89 | % | 21,135 | $ | 524,971 | 88 | % | 19,670 | ||||||||||||||
Pet Specialty and Natural (2) | 81,588 | 11 | % | 5,642 | 70,373 | 12 | % | 5,611 | ||||||||||||||||
Net Sales | $ | 766,895 | 100 | % | 26,777 | $ | 595,344 | 100 | % | 25,281 | ||||||||||||||
(1) | Stores at December 31, 2023 and December 31, 2022 consisted of 14,800 and 13,847 grocery and 6,335 and 5,823 mass and club, respectively. |
(2) | Stores at December 31, 2023 and December 31, 2022 consisted of 5,164 and 5,135 pet specialty and 478 and 476 natural, respectively. |
Net sales increased $171.6 million, or 28.8%, to $766.9 million for the twelve months ended December 31, 2023 as compared to the prior year. The $171.6 million increase in net sales was driven by growth in the Grocery, Mass, and Club channel of $160.3 million, with the remaining growth in Pet Specialty and Natural. The net sales increase was primarily driven by volume gains of 20%.
Gross Profit
Gross profit was $250.9 million, or 32.7% as a percentage of net sales, for the twelve months ended December 31, 2023, compared to $186.0 million, or 31.2% as a percentage of net sales, in the prior year. The increase in gross profit as a percentage of net sales was primarily due to improved leverage on plant expenses, reduced quality costs, and decreased input cost as a percentage of sales mainly due to an increase in net sales pricing, partially offset by increased depreciation expense associated with the Company's capacity expansion and cost related to the disposal of equipment. For the twelve months ended December 31, 2023, Adjusted Gross Profit was $306.6 million, or 40.0% as a percentage of net sales, compared to $214.1 million, or 36.0% as a percentage of net sales, in the prior year.
See "—Non-GAAP Financial Measures" for how we define Adjusted Gross Profit, a reconciliation of Adjusted Gross Profit to gross profit, the closest comparable U.S. GAAP measure, certain limitations of Non-GAAP measures and why management has included such Non-GAAP measures.
Selling, General and Administrative Expenses
Selling, general and administrative expenses ("SG&A") were $281.3 million, for the twelve months ended December 31, 2023, compared to $238.0 million in the prior year. As a percentage of net sales, SG&A decreased to 36.7% for the twelve months ended December 31, 2023, compared to 40.0% in the prior year. The decrease of 330 basis points in SG&A as a percentage of net sales was mainly a result of reduced logistics cost as a percentage of net sales, decreased cost related to the ERP implementation, and increased leverage on depreciation and share-based compensation as the business scales, partially offset by activism engagement charges, increased media spend and increased variable compensation accrual.
Adjusted SG&A for the twelve months ended December 31, 2023, was $240.1 million, or 31.3% as a percentage of net sales, compared to $195.7 million, or 32.9% as a percentage of net sales, in the prior year.
See “—Non-GAAP Financial Measures” for how we define Adjusted SG&A, a reconciliation of Adjusted SG&A to SG&A, the closest comparable U.S. GAAP measure, certain limitations of Non-GAAP measures and why management has included such Non-GAAP measures.
Loss from Operations
As a result of the factors discussed above, loss from operations decreased by $21.5 million to a loss from operations of $30.4 million for the twelve months ended December 31, 2023 as compared to a loss from operations of $52.0 million in the prior year.
Interest and Other Income, net
The Company recorded interest and other income, net of $13.0 million for the twelve months ended December 31, 2023 as a result of interest income generated from cash and short-term investments.
Interest Expense
Interest expense increased $8.9 million to interest expense of $14.1 million for the twelve months ended December 31, 2023 as compared to interest expense of $5.2 million for the same period in the prior year. The increase was primarily driven by the termination of our Credit Agreement in the current period resulting in the write-off of unamortized fees of $2.5 million which were recorded to interest expense, $5.2 million increase as a result of interest incurred on our Convertible Notes (as defined below) compared to interest incurred on the Credit Agreement that existed in the prior period, as well as a $1.2 million increase related to the interest on our finance lease liability.
Loss on Equity Method Investment
Our staffloss on equity method investment for the twelve months ended December 31, 2023 was $1.9 million as compared to a loss on equity method investment of $3.7 million in the prior year from the Company's interest in a privately held company, as discussed in Note 1.
Net Loss
Net loss decreased $25.9 million to a net loss of $33.6 million for the twelve months ended December 31, 2023 as compared to a net loss of $59.5 million for the prior year due to contribution from higher sales, increased gross margin and reduced logistics costs as a percentage of net sales, partially offset by increased SG&A including increased media spend of $23.1 million.
Adjusted EBITDA
Adjusted EBITDA was $66.6 million, or 8.7% as a percentage of net sales (also called Adjusted EBITDA Margin), for the twelve months ended December 31, 2023, compared to $20.1 million, or 3.4% as a percentage of net sales, in the prior year. The increase in Adjusted EBITDA was a result of increased Adjusted Gross Profit partially offset by higher Adjusted SG&A expense.
See "—Non-GAAP Financial Measures" for how we define Adjusted EBITDA, a reconciliation of Adjusted EBITDA to EBITDA, the closest comparable U.S. GAAP measure, certain limitations of Non-GAAP measures and why management has included such Non-GAAP measures; see the section entitled "Forward-Looking Statements" in this report and the section entitled "Risk Factors" in this report for factors that could cause our results to differ, in some cases materially.
Non-GAAP Financial Measures
Freshpet uses the following non-GAAP financial measures in its financial communications. These non-GAAP financial measures should be considered as supplements to the U.S. GAAP reported measures, should not be considered replacements for, or superior to, the U.S. GAAP measures and may not be comparable to similarly named measures used by other companies.
• | Adjusted Gross Profit |
• | Adjusted Gross Profit as a percentage of net sales (Adjusted Gross Margin) |
• | Adjusted SG&A expenses |
• | Adjusted SG&A expenses as a percentage of net sales |
• | EBITDA |
• | Adjusted EBITDA |
• | Adjusted EBITDA as a percentage of net sales (Adjusted EBITDA Margin) |
Such financial measures are not financial measures prepared in accordance with U.S. GAAP. We define Adjusted Gross Profit as Gross Profit before depreciation expense, non-cash share-based compensation, and loss on disposal of manufacturing equipment. We define Adjusted SG&A as SG&A expenses before depreciation and amortization expense, non-cash share-based compensation, implementation and other costs associated with the implementation of an ERP system, fees related to the Capped Call Transactions, loss on disposal of equipment, and advisory fees related to activism engagement. EBITDA represents net income (loss) plus interest expense net of interest income, income tax expense and depreciation and amortization. Adjusted EBITDA represents EBITDA plus loss on equity method investment, non-cash share-based compensation, implementation and other costs associated with the implementation of an ERP system, loss on disposal of property, plant and equipment, fees related to the Capped Call Transactions, and advisory fees related to activism engagement.
We believe that each of these non-GAAP financial measures provide additional metrics to evaluate our operations and, when considered with both our U.S. GAAP results and the reconciliation to the closest comparable U.S. GAAP measures, provides a more complete understanding of our business than could be obtained absent this disclosure. We use the non-GAAP financial measures, together with U.S. GAAP financial measures, such as net sales, gross profit margins and cash flow from operations, to assess our historical and prospective operating performance, to provide meaningful comparisons of operating performance across allperiods, to enhance our understanding of our operating performance and to compare our performance to that of our peers and competitors.
Adjusted EBITDA is also an important component of internal budgeting and setting management compensation.
The non-GAAP financial measures are presented here because we believe they are useful to investors in assessing the operating performance of our business without the effect of non-cash items, and other items as detailed below. The non-GAAP financial measures should not be considered in isolation or as alternatives to net income (loss), income (loss) from operations or any other measure of financial performance calculated and prescribed in accordance with U.S. GAAP. Neither EBITDA nor Adjusted EBITDA should be considered a measure of discretionary cash available to us to invest in the growth of our business. Our non-GAAP financial measures may not be comparable to similarly titled measures in other organizations because other organizations may not calculate non-GAAP financial measures in the same manner as we do.
Our presentation of the non-GAAP financial measures should not be construed as an inference that our future results will be unaffected by the expenses that are excluded from that term or by unusual or non-recurring items. We recognize that the non-GAAP financial measures have limitations as analytical financial measures. For example, the non-GAAP financial measures do not reflect:
● | our capital expenditures or future requirements for capital expenditures; |
● | the interest expense, or the cash requirements necessary to service interest expense or principal payments, associated with indebtedness; |
● | depreciation and amortization, which are non-cash charges, although the assets being depreciated and amortized will likely have to be replaced in the future, nor any cash requirements for such replacements; and |
● | changes in cash requirements for our working capital needs. |
Additionally, Adjusted EBITDA (i) excludes non-cash share-based compensation expense, which is and will remain a key element of our overall long-term incentive compensation package, and (ii) certain costs essential to our sales growth and strategy. Adjusted EBITDA also excludes certain cash charges resulting from matters we consider not to be indicative of our ongoing operations. Other companies in our industry may calculate the non-GAAP financial measures differently than we do, limiting their usefulness as comparative measures.
The following table provides a reconciliation of EBITDA and Adjusted EBITDA to net loss, the most directly comparable financial measure presented in accordance with U.S. GAAP:
Twelve Months Ended | ||||||||||||
December 31, | ||||||||||||
2023 | 2022 | 2021 | ||||||||||
(Dollars in thousands) | ||||||||||||
Net loss | $ | (33,614 | ) | $ | (59,494 | ) | $ | (29,699 | ) | |||
Depreciation and amortization | 57,058 | 34,555 | 30,468 | |||||||||
Interest expense, net of interest income | 1,069 | 5,208 | 2,882 | |||||||||
Income tax expense | 210 | 282 | 162 | |||||||||
EBITDA | $ | 24,723 | $ | (19,449 | ) | $ | 3,813 | |||||
Loss on equity method investment | $ | 1,890 | $ | 3,731 | $ | 2,005 | ||||||
Loss on disposal of property, plant and equipment | 4,321 | 396 | 1,000 | |||||||||
Non-cash share-based compensation (a) | 24,936 | 26,092 | 24,998 | |||||||||
Enterprise Resource Planning (b) | 2,457 | 8,558 | 1,379 | |||||||||
Capped Call Transaction fees (c) | 113 | — | — | |||||||||
COVID-19 expense (d) | — | — | 1,758 | |||||||||
Activism engagement (e) | 8,177 | — | — | |||||||||
Organization changes (f) | (67 | ) | 734 | — | ||||||||
Adjusted EBITDA | $ | 66,550 | $ | 20,062 | $ | 34,953 | ||||||
Adjusted EBITDA as a % of Net Sales | 8.7 | % | 3.4 | % | 8.2 | % | ||||||
(a) | Includes the true-up of share-based compensation expense during the period ended December 31, 2023. We have certain outstanding multi-year share-based awards, granted in FY 2020, with performance-based vesting conditions that require the achievement of certain Adjusted EBITDA targets in FY 2024 as a condition to vesting. At each reporting period, we reassess the probability of achieving the performance criteria and the performance period required to meet those targets set in 2020. When such performance conditions are deemed to be improbable of achievement, the compensation cost previously recorded is reversed. |
(b) | Represents implementation, amortization of deferred implementation costs and other costs associated with the implementation of an ERP system. |
(c) | Represents fees associated with the Capped Call Transactions. |
(d) | Represents COVID-19 expenses including (i) costs incurred to protect the health and safety of our employees during the COVID-19 pandemic, (ii) temporary increased compensation expense to ensure continued operations during the pandemic, and (iii) costs related to mitigating potential supply chain disruptions during the pandemic. |
(e) | Represents advisory fees related to activism engagement. |
| (f) | Represents a true-up to transition costs related to the organization changes designed to support growth, including several changes in organizational structure designed to enhance capabilities and support long-term growth objectives. |
The following table provides a reconciliation of Adjusted Gross Profit to Gross Profit, the most directly comparable financial measure presented in accordance with U.S. GAAP:
Twelve Months Ended | ||||||||||||
December 31, | ||||||||||||
2023 | 2022 | 2021 | ||||||||||
(Dollars in thousands) | ||||||||||||
Gross profit | $ | 250,872 | $ | 186,033 | $ | 162,146 | ||||||
Depreciation expense | 41,209 | 20,774 | 16,545 | |||||||||
Non-cash share-based compensation | 10,995 | 7,293 | 4,152 | |||||||||
COVID-19 expense (a) | — | — | 1,753 | |||||||||
Loss on disposal of manufacturing equipment | 3,547 | — | — | |||||||||
Adjusted Gross Profit | $ | 306,623 | $ | 214,100 | $ | 184,596 | ||||||
Adjusted Gross Profit as a % of Net Sales | 40.0 | % | 36.0 | % | 43.4 | % | ||||||
(a) | Represents COVID-19 expenses including (i) costs incurred to protect the health and safety of our employees during the COVID-19 pandemic, (ii) temporary increased compensation expense to ensure continued operations during the pandemic, and (iii) costs related to mitigating potential supply chain disruptions during the pandemic included in cost of goods sold. |
The following table provides a reconciliation of Adjusted SG&A expenses to SG&A expenses, the most directly comparable financial measure presented in accordance with U.S. GAAP:
Twelve Months Ended | ||||||||||||
December 31, | ||||||||||||
2023 | 2022 | 2021 | ||||||||||
(Dollars in thousands) | ||||||||||||
SG&A expenses | $ | 281,318 | $ | 238,016 | $ | 186,809 | ||||||
Depreciation and amortization expense | 15,849 | 13,781 | 13,923 | |||||||||
Non-cash share-based compensation (a) | 13,941 | 18,799 | 20,846 | |||||||||
Loss on disposal of equipment | 774 | 396 | 1,000 | |||||||||
Enterprise Resource Planning (b) | 2,457 | 8,558 | 1,379 | |||||||||
Capped Call Transactions fees (c) | 113 | — | — | |||||||||
Activism engagement (d) | 8,177 | — | — | |||||||||
COVID-19 expense (e) | — | — | 5 | |||||||||
Organization changes (f) | (67 | ) | 734 | — | ||||||||
Adjusted SG&A Expenses | $ | 240,074 | $ | 195,748 | $ | 149,656 | ||||||
Adjusted SG&A Expenses as a % of Net Sales | 31.3 | % | 32.9 | % | 35.2 | % | ||||||
(a) | Includes the true-up of share-based compensation expense during the period ended December 31, 2023. We have certain outstanding multi-year share-based awards, granted in FY 2020, with performance-based vesting conditions that require the achievement of certain Adjusted EBITDA targets in FY 2024 as a condition to vesting. At each reporting period, we reassess the probability of achieving the performance criteria and the performance period required to meet those targets set in 2020. When such performance conditions are deemed to be improbable of achievement, the compensation cost previously recorded is reversed. |
(b) | Represents implementation, amortization of deferred implementation costs and other costs associated with the implementation of an ERP system. |
(c) | Represents fees associated with the Capped Call Transactions. |
(d) | Represents advisory fees related to activism engagement. |
(e) | Represents COVID-19 expenses including (i) costs incurred to protect the health and safety of our employees during the COVID-19 pandemic, (ii) temporary increased compensation expense to ensure continued operations during the pandemic, and (iii) costs related to mitigating potential supply chain disruptions during the pandemic included in SG&A. |
(f) | Represents a true-up to transition costs related to the organization changes designed to support growth, including several changes in organizational structure designed to enhance capabilities and support long-term growth objectives. |
Liquidity and Capital Resources
To meet our capital needs, we issued approximately $402.5 million in convertible notes in March 2023 (the "Convertible Notes"), used $66.2 million of the proceeds to enter into capped call transactions, and used $11.0 million of the proceeds on debt issuance related costs. Further, on March 13, 2023, in connection with the proposed offering of the Convertible Notes, the Company, notified City National Bank of Freshpet's intent to terminate the Credit Agreement, and such termination became effective as of March 15, 2023 (the "Termination Date"). The Company had no borrowings outstanding under the Credit Agreement as of the Termination Date.
We expect to make future capital expenditures in connection with the completion of our planned development of Freshpet Kitchens Ennis phase 2 and 3. During fiscal year 2023, we spent approximately $239.1 million of capital to meet our capacity needs as well as recurring capital expenditures. In fiscal year 2024, we expect to spend approximately $210.0 million.
We expect to rely on our current and future cash flow from operations, may issue additional debt, and/or raise capital through our access to capital markets, if appropriate. Our ability to obtain additional funding will be subject to various factors, including general economic and market conditions, our operating performance, the market's perception of our growth potential, lender sentiment and our ability to incur additional debt in compliance with other contractual restrictions.
Our ability to make future minimum interest payments on the Convertible Notes, to refinance any indebtedness and to fund any necessary expenditures for our growth will depend on our ability to generate cash in the future. If our business does not achieve the levels of profitability or generate the amount of cash that we anticipate or if we expand faster than anticipated, we may need to seek additional debt or equity financing to operate and expand our business. Future third-party financing may not be available on favorable terms or at all.
Our primary cash needs, in addition to our plant expansions, are for purchasing ingredients, operating expenses, marketing expenses and capital expenditures to procure Freshpet Fridges. We believe that cash and cash equivalents, short-term investments, expected cash flow from operations, amounts previously raised through the issuance of the Convertible Notes and our ability to access the capital markets, if appropriate, are adequate to fund our debt requirements, operating and finance lease obligations, capital expenditures and working capital obligations for the foreseeable future. We believe our sources of liquidity and capital will be sufficient to finance our continued operations, growth strategy and additional expenses we expect to incur for at least the next twelve months. However, our ability to continue to meet these requirements and obligations will depend on, among other things, our ability to achieve anticipated levels of revenue and cash flow from operations and our ability to manage costs and working capital successfully. Additionally, our cash flow generation ability is subject to general economic factors, including but not limited to increasing interest rates and inflation, financial, competitive, legislative and regulatory factors and other factors that are beyond our control. We cannot assure you that our business will generate cash flow from operations in an amount sufficient to enable us to fund our liquidity needs. Expanding certain of our Freshpet locations reflect a diverse mixKitchens primarily comprises our material future cash requirement. However, our capital requirements, including our cash requirements, may vary materially from those currently planned if, for example, our revenues do not reach expected levels, or we have to incur unforeseen capital expenditures and make investments to maintain our competitive position. If this is the case, we may seek alternative financing, such as selling additional debt or equity securities, and we cannot assure you that we will be able to do so on favorable terms, if at all. Moreover, if we issue new debt securities, the debt holders would have rights senior to common stockholders to make claims on our assets, and the terms of approximately 54% white, 32% Hispanic, 9% African Americanany debt could restrict our operations, including our ability to pay dividends on our common stock. If we issue additional equity or if the Convertible Notes are converted to common shares, existing stockholders may experience dilution, and 5% other ethnicities. Women represent 29%such new securities could have rights senior to those of our total employee population. Atcommon stock. These factors may make the Board level,timing, amount, terms and conditions of the nine non-executive members of the Board, three are women. One of the members of the Board is African American.
The following table listssets forth, for the periods indicated, our NEOsworking capital:
December 31, | December 31, | |||||||
2023 | 2022 | |||||||
(Dollars in thousands) | ||||||||
Cash and cash equivalents | $ | 296,871 | $ | 132,735 | ||||
Accounts receivable, net of allowance for doubtful accounts | 56,754 | 57,572 | ||||||
Inventories, net | 63,238 | 58,290 | ||||||
Prepaid expenses | 7,615 | 9,778 | ||||||
Other current assets | 2,841 | 3,590 | ||||||
Accounts payable | (36,096 | ) | (55,088 | ) | ||||
Accrued expenses | (49,816 | ) | (33,016 | ) | ||||
Current operating lease liabilities | (1,312 | ) | (1,510 | ) | ||||
Current finance lease liabilities | (1,998 | ) | - | |||||
Total Working Capital | $ | 338,097 | $ | 172,351 | ||||
Working capital consists of current assets net of current liabilities. Working capital increased $165.7 million to $338.1 million at December 31, 2023 compared with working capital of $172.4 million at December 31, 2022. The increase was primarily a result of an increase of $164.1 million in cash and cash equivalents primarily resulting from the sale of the Convertible Notes as we fund our capital expansion plan, an increase in inventory of $4.9 million, a decrease in accounts payable of $19.0 million as a result of timing and capital expenditures of approximately $15.5 million related to our capital expansion plan and a decrease in current operating lease liabilities of $0.2 million. The increase was partially offset by a decrease in accounts receivable of $0.8 million, a decrease in prepaid expenses of $2.2 million, a decrease in other current assets of $0.7 million, an increase in accrued expenses of $16.8 million due to timing and capital expenditures of approximately $3.8 million related to our capital expansion plan, and an increase in current finance lease liabilities of $2.0 million.
We normally carry three to four weeks of finished goods inventory and less than 30 days of accounts receivable.
For the year ended December 31, 2023 our capital resources consisted primarily of $296.9 million of cash and cash equivalents on hand.
For the year ended December 31, 2022, our capital resources consisted primarily of $132.7 million of cash and cash equivalents on hand, $270.0 million available under our $350.0 million credit facilities, subject to debt covenants. Our credit facilities reflected $2.0 million reserved for two letters of credit and the remaining availability after the 2022 which isborrowing activity of $78.0 million under the group consistingDelayed Draw Facility.
We expect to fund our ongoing operations and obligations with cash and cash equivalents, and cash flow from operations.
The following table sets forth, for the periods indicated, our beginning balance of each individual who served as our Chief Executive Officer or Chief Financial Officer during 2022,cash, net cash flows provided by operating, investing and financing activities and our three other most highly compensated executive officers who were serving as executive officersending balance of cash.
Year Ended | ||||||||
December 31, | ||||||||
2023 | 2022 | |||||||
(Dollars in thousands) | ||||||||
Cash at the beginning of period | $ | 132,735 | $ | 72,788 | ||||
Net cash provided by (used in) operating activities | 75,940 | (43,227 | ) | |||||
Net cash used in investing activities | (239,093 | ) | (233,364 | ) | ||||
Net cash provided by financing activities | 327,289 | 336,538 | ||||||
Cash at the end of period | $ | 296,871 | $ | 132,735 | ||||
Net Cash Provided by (Used In) Operating Activities
Cash provided by (used in) operating activities consists primarily of net loss adjusted for certain non-cash items (i.e., provision for (gains) loss on December 31, 2022.
2023
Net cash provided by operating activities of $75.9 million in 2023 was primarily attributed to:
● | |
$61.7 million of net income adjusted for reconciling non-cash items, which excludes $95.3 million of non-cash items primarily related to $4.3 million of loss on disposal of property, plant and | |
● | $14.3 million increase due to changes in operating assets and liabilities. The increase was primarily due to the change in accounts receivable, accounts payable and accrued expenses, primarily offset by the change in inventories, prepaid expenses and other current assets, other assets and operating lease liability. |
2022
Net cash used in operating activities of $43.2 million in 2022 was primarily attributed to:
● | $10.9 million of net income adjusted for reconciling non-cash items, which excludes $70.4 million of non-cash items primarily related to $34.6 million in depreciation and amortization, $26.1 million in share-based compensation, $3.7 million of investments in equity method investment, $3.5 million in inventory obsolescence, $1.4 million of change in operating lease right of use asset, $0.8 million of amortization of deferred financing costs and $0.4 million in loss on disposal of property, plant and equipment. |
This was offset by:
● | $54.1 million decrease due to changes in operating assets and liabilities. The decrease was primarily due to the change in accounts receivable, inventory, accounts payable, other assets, other lease liabilities and prepaid expenses, offset by change in accrued expenses. |
Leadership ChangesNet Cash Used in Investing Activities
2023
Net cash used in investing activities of $239.1 million in 2023 was provided with a severance package, including, amongst other items, 12 months of salary continuation as well as eligibility to continue health insurance under COBRA. See “2022 Summary Compensation Table” for additional disclosure on Ms. Pomerantz’s severance arrangements.
● | $5.3 million in capital expenditures related to Freshpet Kitchens South expansion. | |
| ● | ||
| ● | $39.3 million in capital expenditures related to | |
| ● | $11.0 million in plant recurring capital expenditures. | |
| ● | $113.4 million purchase of |
This was partially offset by:
● | $113.4 million of proceeds from maturities of short-term investments. |
2022
Net cash used in investing activities of $233.4 million in 2022 was primarily attributed to:
● | $28.4 million in capital expenditures related to Freshpet Kitchens South expansion. |
| ● | ||
| ● | $27.4 million in capital expenditures related to investment in fridges and other capital spend. | |
| ● | $9.2 million in plant recurring capital expenditures. | |
| ● | $19.8 million purchase of | |
| ● | $3.3 million investment in equity method investment. |
This was partially offset by:
● | $19.8 million of |
Net Cash Provided by Financing Activities
2023
Net cash provided by financing activities of $327.3 million in 2023 was primarily attributed to:
| ● | $393.5 million net proceeds from Convertible Notes. |
| ● |
This was partially offset by:
● | $66.2 million for the purchase of capped call options. |
● | $2.0 million for debt issuance costs. | |
| ● | $1.4 million for tax withholdings related to net share settlements of restricted stock units. | |
| ● | $1.1 million for principal payments under finance lease obligations. |
2022
Net cash provided by financing activities of $336.5 million in 2022 was primarily attributed to:
● | $337.5 million of proceeds from common shares issued in a primary offering, net of issuance cost. |
● | $78.0 million of proceeds from borrowings under Credit Facility. | |
| ● | $0.5 million of proceeds from the exercise of stock options. |
This was partially offset by:
● | $78.0 million for repayment of borrowings under Credit Facility. | |
| ● | $1.4 million for tax withholdings related to net share settlements of restricted stock units. |
Indebtedness
For a discussion of our material indebtedness, see Note 6 and 7 to our Consolidated Financial Statements included in this report.
Critical Accounting Estimates and Policies
Our management’s discussion and analysis of financial condition and results of operations is based on our financial statements, which have been prepared in accordance with accounting principles generally accepted in the United States, or ("U.S. GAAP"). The preparation of these changes are designedfinancial statements requires us to strengthen organizational capabilitymake estimates and better position Freshpet to stay aheadassumptions that affect the reported amounts of anticipated rapid growth.
While our significant accounting estimates and policies are described in the notes to our financial statements appearing in this report, we believe that the following critical accounting estimates and policies are most important to understanding and evaluating our reported financial results.
The preparation of financial statements in conformity with U.S. GAAP requires management to make estimates and assumptions that affect the reported amounts of assets and liabilities and disclosure of contingent assets and liabilities at the date of the financial statements, and the reported amounts of net sales and expenses during the reporting period.
We believe that the accounting estimates policies discussed below are critical to understanding our historical and future performance, as these policies related to the more significant areas involving management’s judgments and estimates. We base our estimates on historical experience and on various assumptions that we believe to be reasonable under the circumstances. Actual results, as determined at a later date, could differ from those estimates. To the extent that there are differences between our estimate and the actual results, our future financial statement presentation, financial condition, results of operations and cash flows will be affected.
The following critical accounting policies reflect significant judgments and estimates used in preparation of our consolidated financial statements:
Long-Term Goal SettingRevenue Recognition and Incentives
Share-based Compensation—We account for all share-based compensation payments issued to employees, directors and nonemployees using a fair value creation for the Company and its investors. For the NEOs, the equity grants were 75% performance-based (with 50% of such performance-based options vestingmethod. Accordingly, share-based compensation expense is measured based on achieving certain Adjusted EBITDA performance-based conditions and 50% vesting based on net sales performance-based conditions) and 25% time-based (with vesting occurring in annual installments over a four-year period of 20%, 40%, 60%, 100%) and replaced all annual grants for the next four years for those individuals. In lightestimated fair value of the awards made in 2020, no additional equity grants were made in 2021 or 2022on the date of grant. We recognize compensation expense for the portion of the award that is ultimately expected to NEOs who participated invest over the 2020 multi-year grant program.
We have outstanding individual performance issues. We believeshare-based awards that this creates an “all-for-one and one-for-all” mentality within Freshpet that allows individual employeeshave performance-based vesting conditions in addition to make the right choices for the Company without regard to their impact ontime-based vesting. Awards with performance-based vesting conditions require the achievement of less important functional or personal goals.
Recent Accounting Pronouncements
For a discussion of Our Executive Compensation Program are Related to Each Other
Segment
We have determined we operate in one segment: the manufacturing, marketing and short-term financialdistribution of pet food and strategic goals. Our compensation philosophy is designed to foster entrepreneurship at all levels of the organizationpet treats for dogs and is focused on employee value and retention by making long-term, equity-based incentive opportunities a substantial component of our executive compensation. The level for each compensation component is based in part, but not exclusively, on internal equity and consistency, experience, and responsibilities, and other relevant considerations such as rewarding extraordinary performance. The Compensation Committee has not adopted any formal or informal policies or guidelines for allocating compensation between long-term and currently paid compensation, between cash and non-cash compensation, or among different forms of non-cash compensation.
Independent Compensation ConsultantITEM 7a. QUANTITATIVE AND QUALITATIVE DISCLOSURES ABOUT MARKET RISKS
Interest Rate Risk
During periods of rising interest rates, our cost of borrowing could increase, the Compensation Committee retained Korn Ferry (“KF”) to advise on compensation practices for our executive officers, including each NEO. Specifically, KF was engaged to review our compensation peer group and our compensation structure for our executive officers, develop and recommend targets for our executive compensation program by analyzing the compensation structuresfair value of our peer group companiesinvestments could be affected, and it could constrain the purchasing power of our customers.
Commodity Price and Inflation Risk
We purchase certain products and services that are affected by commodity prices and are, therefore, subject to price volatility caused by weather, market trends,conditions and provide adviceother factors which are not considered predictable or within our control. In many cases, we believe we will be able to address material commodity cost increases by either increasing prices or reducing operating expenses. However, increases in commodity prices, without adjustments to pricing or reduction to operating expenses, could increase our operating costs as a percentage of our net sales.
Inflation
Our profitability is dependent, among other things, on our ability to anticipate and react to changes in the costs of key operating resources, including food and other raw materials, labor, energy and other supplies and services. Substantial increases in costs and expenses could impact our operating results to the Compensation Committee onextent that such increases cannot be passed along to our executive compensation structurecustomers.
While generally we have been able to offset inflation and program based on KF’s analysis. KF was also engagedother changes in the costs of key operating resources through price increases, productivity improvements and greater economies of scale, our price increases are not always implemented immediately, which can cause us to separately reviewtemporarily absorb increased cost. Further, there can be no assurance that we will be able to continue to effectively implement such offsets in the compensation arrangements applicablefuture. From time to employees attime, competitive conditions could limit our pricing flexibility. In addition, macroeconomic conditions could make additional price increases imprudent. There can be no assurance that all future cost increases can be offset by increased prices or that increased prices will be fully absorbed without any resulting changes in product purchasing patterns.
Foreign Exchange Rates
Fluctuations in the director levelcurrencies of countries where the Company operates outside the U.S. may impact our financial results. The Company is exposed to movements in the British pound sterling and above,Euro. The Statements of Financial Position of non-U.S. business units are translated into U.S. dollars using period-end exchange rates for assets and the non-employee, independent directorsliabilities and weighted-average exchange rates for revenues and expenses. The percentage of the Board. In 2022, the Compensation Committee, in consultation with KF, decided to include an ESG goalour consolidated revenue for the Freshpet executive team which would further reinforcetwelve months ended December 31, 2023 recognized in Europe was approximately 1%.
The Company may, from time to time, enter into forward exchange contracts to reduce the organization's commitmentCompany's exposure to doing right by Pets, Peopleforeign currency fluctuations of certain assets and liabilities denominated in foreign currencies. Historically, the Planet. The compensation committee approved the 2022 goal, which focused on "Employee Retention",foreign currency forward contracts have not been designated as outlined below under Executive ESG Goal.
Name | Annual Base Salary Rate | |||
| William B. Cyr | $ | 620,000 | ||
| Scott Morris | $ | 510,000 | ||
| Todd Cunfer (Current CFO: 12/1/2022) | $ | 500,000 | ||
| Thembeka Machaba | $ | 340,000 | ||
| Cathal Walsh | $ | 312,500 | ||
Heather Pomerantz (Former CFO – 9/7/2022) | $ | 440,000 | ||
Richard Kassar (Interim CFO – 11/30/2022) | $ | 320,000 | ||
FRESHPET, INC.
INDEX TO THE CONSOLIDATED FINANCIAL STATEMENTS
Page | ||||
Consolidated Balance Sheets as of December 31, 2023 and 2022 | ||||
Consolidated Statements of Cash Flows for the years ended December 31, 2023, 2022, and 2021 | ||||
Report of Independent Registered Public Accounting Firm
To the Stockholders and Board of ourDirectors
Freshpet, Inc.:
Opinions on the Consolidated Financial Statements and Internal Control Over Financial Reporting
We have audited the accompanying consolidated balance sheets of Freshpet, Inc. and subsidiaries (the Company) as of December 31, 2023 and 2022, annual incentive program were based 45% on Adjusted EBITDAthe related consolidated statements of operations and 45% on net sales, withcomprehensive loss, changes in stockholders’ equity, and cash flows for each of the remaining 10%years in the three-year period ended December 31, 2023, and the related notes (collectively, the consolidated financial statements). We also have audited the Company’s internal control over financial reporting as of December 31, 2023, based on ESG. For each performance metric,criteria established in Internal Control – Integrated Framework (2013) issued by the Committee of Sponsoring Organizations of the Treadway Commission.
In our opinion, the consolidated financial statements referred to above present fairly, in all material respects, the financial position of the Company then established performance targetsas of December 31, 2023 and minimum performance thresholds, with a maximum payout2022, and the results of no more than 250%its operations and its cash flows for each of target for any NEO. Performance above and below each performance metric target results in increases or decreasesthe years in the bonuses earned based on pre-determined factors that are based on the economic value added or lost by stockholders due to the over/under performance. To encourage teamwork, the Compensation Committee determines a single Company performance result as an aggregate percentage of the target Company performance metrics. The resulting percentage is then multiplied against each eligible employee’s target bonus amount to determine annual incentive compensation.
Weighting | Target ($ millions) | Minimum Threshold | Result ($ millions) | |||||||||||||
| Net Sales | 45 | % | $ | 600 | $ | 565 | $ | 595.3 | ||||||||
| Adj. EBITDA before bonus accrual | 45 | % | $ | 66 | $ | 59.6 | $ | 50.2 | ||||||||
Basis for Opinions
The Company’s management is explained in more detailresponsible for these consolidated financial statements, for maintaining effective internal control over financial reporting, and for its assessment of the effectiveness of internal control over financial reporting, included in the section “Non-GAAPaccompanying Management's Report on Internal Control Over Financial Measures” in “Item 7. Management’s DiscussionReporting. Our responsibility is to express an opinion on the Company’s consolidated financial statements and Analysis of Financial Conditionsan opinion on the Company’s internal control over financial reporting based on our audits. We are a public accounting firm registered with the Public Company Accounting Oversight Board (United States) (PCAOB) and Results of Operations” in our annual report, where it is reconciledare required to be independent with respect to the closest GAAP measure.
We conducted our audits in accordance with the standards of our workforce (largely employeesthe PCAOB. Those standards require that we plan and perform the audits to obtain reasonable assurance about whether the consolidated financial statements are free of material misstatement, whether due to error or fraud, and whether effective internal control over financial reporting was maintained in all material respects.
Our audits of the consolidated financial statements included performing hourly labor)procedures to assess the risks of material misstatement of the consolidated financial statements, whether due to error or fraud, and an essential strategy necessaryperforming procedures that respond to supportthose risks. Such procedures included examining, on a fast-growing company. The ESG goal for 2022 was therefore focused on Employee Retention, with three specific measures:
Definition and Limitations of Internal Control Over Financial Reporting
A company’s internal control over financial reporting is a process designed to provide reasonable assurance regarding the reliability of financial reporting and the preparation of financial statements for external purposes in accordance with generally accepted accounting principles. A company’s internal control over financial reporting includes those policies and procedures that (1) pertain to the improved performancemaintenance of our production operations – particularly towardsrecords that, in reasonable detail, accurately and fairly reflect the endtransactions and dispositions of 2022the assets of the company; (2) provide reasonable assurance that transactions are recorded as necessary to permit preparation of financial statements in accordance with generally accepted accounting principles, and into 2023 – demonstratingthat receipts and expenditures of the long-lasting impactcompany are being made only in accordance with authorizations of this goalmanagement and its sustainability.
| ESG: | Weighting | Target | Minimum Threshold | Result | |||||||||
| Employee Net Promoter Score | 10% (approx. 1/3 each) | 8.3 | 7.6 | 8.0 | |||||||||
| Manufacturing LTO | ≤35% | ≤45% | 25% | ||||||||||
| Retention of Key Talent | ≥90% | ≥80% | 96% | ||||||||||
Because of its inherent limitations, internal control over financial reporting may not prevent or detect misstatements. Also, projections of any evaluation of effectiveness to future periods are subject to the risk that controls may become inadequate because of changes in conditions, or that the degree of compliance with the policies or procedures may deteriorate.
Critical Audit Matter
The critical audit matter communicated below is a matter arising from the current period audit of the consolidated financial statements that was communicated or required to be communicated to the audit committee and that: (1) relates to accounts or disclosures that are material to the consolidated financial statements and (2) involved our especially challenging, subjective, or complex judgments. The communication of a critical audit matter does not alter in any way our opinion on the consolidated financial statements, taken as a whole, and we are not, by communicating the critical audit matter below, providing a separate opinion on the critical audit matter or on the accounts or disclosures to which it relates.
Assessment of the probability of achieving the vesting performance criteria of share-based awards
As discussed in Notes 1 and 11 to the consolidated financial statements, the Company recognizes share-based compensation based on the foregoingvalue of the number of share-based payment awards that are ultimately expected to vest during the period. Share-based awards with performance-based vesting conditions require the achievement of certain financial criteria as a condition to vesting. For certain performance-based awards, the quantity of awards received can range based on the level of performance achieved. The performance-based awards with financial criteria have 1) an annual revenue target or 2) an adjusted earnings before interest, taxes, depreciation and amortization target within fiscal years 2023 through 2026. At each reporting period, the Company reassesses the probability of achieving the performance criteria required to meet those vesting targets. When achievement of the vesting criteria is considered probable, compensation cost is recognized. As of December 31, 2023, there were 423,000 unvested performance-based options outstanding that were deemed not probable, with an aggregate fair value of $31.0 million.
We identified the assessment of the probability of achieving the vesting performance criteria of share-based awards as a critical audit matter. Evaluating the assumptions related to the Company’s determination of the probability that the performance criteria will be achieved for the share-based awards involved subjective auditor judgment. In particular, judgment was required to assess the probability of meeting the Company’s future performance targets, including forecasted revenue.
The following are the primary procedures we performed to address this critical audit matter. We evaluated the design and tested the operating effectiveness of certain internal controls over the Company’s share-based compensation process, including a control related to the Company’s assessment of assumptions that were used in the determination that a performance criteria was probable of achievement. To assess the Company’s ability to accurately forecast revenue, we compared the Company’s historical revenue forecasts to actual results. We compared forecasted revenue to those in communications to the Board of Directors, press releases and analyst reports. We evaluated the timing of the Company’s expansion projects by comparing the progress of the Company’s plans to construction milestones achieved.
/s/ KPMG LLP
We have served as the Company’s auditor since 2012.
Short Hills, New Jersey
February 26, 2024
FRESHPET, INC. AND SUBSIDIARIES
CONSOLIDATED BALANCE SHEETS
(in thousands, except per share data)
December 31, | December 31, | |||||||
2023 | 2022 | |||||||
ASSETS | ||||||||
CURRENT ASSETS: | ||||||||
Cash and cash equivalents | $ | 296,871 | $ | 132,735 | ||||
Accounts receivable, net of allowance for doubtful accounts | 56,754 | 57,572 | ||||||
Inventories, net | 63,238 | 58,290 | ||||||
Prepaid expenses | 7,615 | 9,778 | ||||||
Other current assets | 2,841 | 3,590 | ||||||
Total Current Assets | 427,319 | 261,965 | ||||||
Property, plant and equipment, net | 979,164 | 800,586 | ||||||
Deposits on equipment | 1,895 | 3,823 | ||||||
Operating lease right of use assets | 3,616 | 5,165 | ||||||
Equity method investment | — | 25,418 | ||||||
Long term investment in equity securities | 23,528 | — | ||||||
Other assets | 28,899 | 28,426 | ||||||
Total Assets | $ | 1,464,421 | $ | 1,125,383 | ||||
LIABILITIES AND STOCKHOLDERS' EQUITY | ||||||||
CURRENT LIABILITIES: | ||||||||
Accounts payable | $ | 36,096 | $ | 55,088 | ||||
Accrued expenses | 49,816 | 33,016 | ||||||
Current operating lease liabilities | 1,312 | 1,510 | ||||||
Current finance lease liabilities | 1,998 | — | ||||||
Total Current Liabilities | $ | 89,222 | $ | 89,614 | ||||
Convertible senior notes | 393,074 | — | ||||||
Long term operating lease liabilities | 2,591 | 4,200 | ||||||
Long term finance lease liabilities | 26,080 | — | ||||||
Total Liabilities | $ | 510,967 | $ | 93,814 | ||||
Commitments and contingencies | — | — | ||||||
STOCKHOLDERS' EQUITY: | ||||||||
Common stock — voting, $0.001 par value, 200,000 shares authorized, 48,277 issued and 48,263 outstanding on December 31, 2023, and 48,051 issued and 48,037 outstanding on December 31, 2022 | 48 | 48 | ||||||
Additional paid-in capital | 1,282,984 | 1,325,524 | ||||||
Accumulated deficit | (328,731 | ) | (295,117 | ) | ||||
Accumulated other comprehensive (loss) income | (591 | ) | 1,370 | |||||
Treasury stock, at cost — 14 shares on December 31, 2023 and on December 31, 2022 | (256 | ) | (256 | ) | ||||
Total Stockholders' Equity | 953,454 | 1,031,569 | ||||||
Total Liabilities and Stockholders' Equity | $ | 1,464,421 | $ | 1,125,383 | ||||
See accompanying notes to the consolidated financial statements.
FRESHPET, INC. AND SUBSIDIARIES
CONSOLIDATED STATEMENTS OF OPERATIONS AND COMPREHENSIVE LOSS
(in thousands, except per share data)
For the Year Ended | ||||||||||||
December 31, | ||||||||||||
2023 | 2022 | 2021 | ||||||||||
NET SALES | $ | 766,895 | $ | 595,344 | $ | 425,489 | ||||||
COST OF GOODS SOLD | 516,023 | 409,311 | 263,343 | |||||||||
GROSS PROFIT | 250,872 | 186,033 | 162,146 | |||||||||
SELLING, GENERAL, AND ADMINISTRATIVE EXPENSES | 281,318 | 238,016 | 186,809 | |||||||||
LOSS FROM OPERATIONS | (30,446 | ) | (51,983 | ) | (24,663 | ) | ||||||
OTHER EXPENSES: | ||||||||||||
Interest and Other Income, net | 13,029 | 1,710 | 13 | |||||||||
Interest Expense | (14,097 | ) | (5,208 | ) | (2,882 | ) | ||||||
| (1,068 | ) | (3,498 | ) | (2,869 | ) | |||||||
LOSS BEFORE INCOME TAXES | (31,514 | ) | (55,481 | ) | (27,532 | ) | ||||||
INCOME TAX EXPENSE | 210 | 282 | 162 | |||||||||
LOSS ON EQUITY METHOD INVESTMENT | 1,890 | 3,731 | 2,005 | |||||||||
LOSS ATTRIBUTABLE TO COMMON STOCKHOLDERS | $ | (33,614 | ) | $ | (59,494 | ) | $ | (29,699 | ) | |||
OTHER COMPREHENSIVE (LOSS) INCOME: | ||||||||||||
Change in foreign currency translation | $ | (1,961 | ) | $ | 1,490 | $ | (40 | ) | ||||
TOTAL OTHER COMPREHENSIVE (LOSS) INCOME | (1,961 | ) | 1,490 | (40 | ) | |||||||
TOTAL COMPREHENSIVE LOSS | $ | (35,575 | ) | $ | (58,004 | ) | $ | (29,740 | ) | |||
NET LOSS PER SHARE ATTRIBUTABLE TO COMMON STOCKHOLDERS | ||||||||||||
-BASIC | $ | (0.70 | ) | $ | (1.29 | ) | $ | (0.69 | ) | |||
-DILUTED | $ | (0.70 | ) | $ | (1.29 | ) | $ | (0.69 | ) | |||
WEIGHTED AVERAGE SHARES OF COMMON STOCK OUTSTANDING | ||||||||||||
-BASIC | 48,163 | 46,191 | 42,931 | |||||||||
-DILUTED | 48,163 | 46,191 | 42,931 | |||||||||
See accompanying notes to the consolidated financial statements.
FRESHPET, INC. AND SUBSIDIARIES
CONSOLIDATED STATEMENTS OF CHANGES IN STOCKHOLDERS’ EQUITY
(in thousands)
Common Shares | Common Stock | Additional Paid-in Capital | Accumulated Deficit | Accumulated Other Comprehensive (Loss) | Treasury Shares | Treasury Stock | Total Stockholders' Equity | |||||||||||||||||||||||||
BALANCES, December 31, 2020 | 40,732 | $ | 40 | $ | 600,388 | $ | (205,924 | ) | $ | (80 | ) | 14 | $ | (256 | ) | $ | 394,169 | |||||||||||||||
Exercise of options to purchase common stock | 224 | — | 2,271 | — | — | — | — | 2,271 | ||||||||||||||||||||||||
Vesting of restricted stock units | 78 | — | (4,187 | ) | — | — | — | — | (4,187 | ) | ||||||||||||||||||||||
Share-based compensation expense | — | — | 25,068 | — | — | — | — | 25,068 | ||||||||||||||||||||||||
Shares issued in primary offering, net of issuance costs | 2,415 | 2 | 332,170 | — | — | — | — | 332,172 | ||||||||||||||||||||||||
Foreign Currency Translation | — | — | — | — | (40 | ) | — | — | (40 | ) | ||||||||||||||||||||||
Net loss | — | — | — | (29,699 | ) | — | — | — | (29,699 | ) | ||||||||||||||||||||||
BALANCES, December 31, 2021 | 43,449 | $ | 43 | $ | 955,710 | $ | (235,623 | ) | $ | (120 | ) | 14 | $ | (256 | ) | $ | 719,754 | |||||||||||||||
Exercise of options to purchase common stock | 45 | — | 471 | — | — | — | — | 471 | ||||||||||||||||||||||||
Vesting of restricted stock units | 43 | 1 | (1,441 | ) | — | — | — | — | (1,440 | ) | ||||||||||||||||||||||
Share-based compensation expense | — | — | 23,505 | — | — | — | — | 23,505 | ||||||||||||||||||||||||
Issuance and exercise of partner warrants | 194 | 9,775 | 9,775 | |||||||||||||||||||||||||||||
Shares issued in primary offering, net of issuance costs | 4,320 | 4 | 337,504 | — | — | — | — | 337,508 | ||||||||||||||||||||||||
Foreign Currency Translation | — | — | — | — | 1,490 | — | — | 1,490 | ||||||||||||||||||||||||
Net loss | — | — | — | (59,494 | ) | — | — | — | (59,494 | ) | ||||||||||||||||||||||
BALANCES, December 31, 2022 | 48,051 | $ | 48 | $ | 1,325,524 | $ | (295,117 | ) | $ | 1,370 | 14 | $ | (256 | ) | $ | 1,031,569 | ||||||||||||||||
Exercise of options to purchase common stock | 160 | — | 4,517 | — | — | — | — | 4,517 | ||||||||||||||||||||||||
Vesting of restricted stock units | 66 | — | (1,400 | ) | — | — | — | — | (1,400 | ) | ||||||||||||||||||||||
Share-based compensation expense | — | — | 20,554 | — | — | — | — | 20,554 | ||||||||||||||||||||||||
Purchase of capped call options | — | — | (66,211 | ) | — | — | — | — | (66,211 | ) | ||||||||||||||||||||||
Foreign currency translation | — | — | — | — | (1,961 | ) | — | — | (1,961 | ) | ||||||||||||||||||||||
Net loss | — | — | — | (33,614 | ) | — | — | — | (33,614 | ) | ||||||||||||||||||||||
BALANCES, December 31, 2023 | 48,277 | 48 | $ | 1,282,984 | $ | (328,731 | ) | $ | (591 | ) | 14 | $ | (256 | ) | $ | 953,454 | ||||||||||||||||
See accompanying notes to the consolidated financial statements.
FRESHPET, INC. AND SUBSIDIARIES
CONSOLIDATED STATEMENT OF CASH FLOWS
(in thousands)
For the Year Ended | ||||||||||||
December 31, | ||||||||||||
2023 | 2022 | 2021 | ||||||||||
CASH FLOWS FROM OPERATING ACTIVITIES: | ||||||||||||
Net loss | $ | (33,614 | ) | $ | (59,494 | ) | $ | (29,699 | ) | |||
Adjustments to reconcile net loss to net cash flows provided by (used in) operating activities: | ||||||||||||
Provision for (gains) loss on accounts receivable | (2 | ) | (20 | ) | 29 | |||||||
Loss on disposal of property, plant and equipment | 4,321 | 396 | 538 | |||||||||
Share-based compensation | 24,935 | 26,092 | 24,998 | |||||||||
Inventory obsolescence | - | 3,455 | 349 | |||||||||
Depreciation and amortization | 58,517 | 34,555 | 30,468 | |||||||||
Write-off and amortization of deferred financing costs and loan discount | 4,060 | 795 | 1,212 | |||||||||
Change in operating lease right of use asset | 1,549 | 1,372 | 1,329 | |||||||||
Loss on equity method investment | 1,890 | 3,731 | 2,005 | |||||||||
Changes in operating assets and liabilities: | ||||||||||||
Accounts receivable | 820 | (32,993 | ) | (16,371 | ) | |||||||
Inventories | (1,207 | ) | (26,171 | ) | (16,804 | ) | ||||||
Prepaid expenses and other current assets | (2,249 | ) | (435 | ) | (2,891 | ) | ||||||
Other assets | (4,053 | ) | (3,141 | ) | (7,899 | ) | ||||||
Accounts payable | 3,543 | (3,063 | ) | 14,958 | ||||||||
Accrued expenses | 19,237 | 13,078 | (273 | ) | ||||||||
Operating lease liability | (1,807 | ) | (1,384 | ) | (1,302 | ) | ||||||
Net cash flows provided by (used in) operating activities | 75,940 | (43,227 | ) | 647 | ||||||||
CASH FLOWS FROM INVESTING ACTIVITIES: | ||||||||||||
Purchase of short-term investments | (113,441 | ) | (19,840 | ) | — | |||||||
Proceeds from maturities of short-term investments | 113,441 | 19,840 | — | |||||||||
Investments in equity method investment | — | (3,293 | ) | — | ||||||||
Acquisitions of property, plant and equipment, software and deposits on equipment | (239,093 | ) | (230,071 | ) | (322,099 | ) | ||||||
Net cash flows used in investing activities | (239,093 | ) | (233,364 | ) | (322,099 | ) | ||||||
CASH FLOWS FROM FINANCING ACTIVITIES: | ||||||||||||
Proceeds from common shares issued in primary offering, net of issuance cost | — | 337,508 | 332,172 | |||||||||
Proceeds from exercise of options to purchase common stock | 4,517 | 471 | 2,271 | |||||||||
Tax withholdings related to net shares settlements of restricted stock units | (1,400 | ) | (1,441 | ) | (4,187 | ) | ||||||
Proceeds from borrowings under Credit Facility | — | 78,000 | — | |||||||||
Repayment of borrowings under Credit Facility | — | (78,000 | ) | — | ||||||||
Purchase of capped call options | (66,211 | ) | — | — | ||||||||
Proceeds from issuance of convertible senior notes | 393,518 | — | — | |||||||||
Principal payments under finance lease obligations | (1,109 | ) | — | — | ||||||||
Debt issuance costs | (2,026 | ) | — | — | ||||||||
Fees paid in connection with financing agreements | — | — | (3,263 | ) | ||||||||
Net cash flows provided by financing activities | 327,289 | 336,538 | 326,993 | |||||||||
NET CHANGE IN CASH AND CASH EQUIVALENTS | 164,136 | 59,947 | 5,541 | |||||||||
CASH AND CASH EQUIVALENTS, BEGINNING OF YEAR | 132,735 | 72,788 | 67,247 | |||||||||
CASH AND CASH EQUIVALENTS, END OF PERIOD | $ | 296,871 | $ | 132,735 | $ | 72,788 | ||||||
SUPPLEMENTAL CASH FLOW INFORMATION: | ||||||||||||
Taxes paid | $ | 308 | $ | 297 | $ | 182 | ||||||
Interest paid | $ | 9,303 | $ | 3,152 | $ | 1,730 | ||||||
NON-CASH FINANCING AND INVESTING ACTIVITIES: | ||||||||||||
Property, plant and equipment purchases in accounts payable and accrued expenses | $ | 19,286 | $ | 44,258 | $ | 22,482 | ||||||
Non-cash addition of finance lease to property, plant and equipment | $ | 29,187 | $ | - | $ | - | ||||||
Issuance of partner warrants | $ | — | $ | 9,775 | — | |||||||
See accompanying notes to the consolidated financial statements.
FRESHPET, INC. AND SUBSIDIARIES
NOTES TO CONSOLIDATED FINANCIAL STATEMENTS
(in thousands, except per share data)
Note 1 – Summary of Significant Accounting Policies:
Nature of the Business – Freshpet, Inc. (hereafter referred to as “Freshpet”, the “Company”, "we," "us" or "our"), a Delaware corporation, manufactures and markets natural fresh meals and treats for dogs and cats. The Company’s products are distributed throughout the United States, Canada and other international markets, into major retail classes including Grocery, Mass and Club, Pet Specialty, Natural, and Digital retail.
Basis of Presentation –The accompanying consolidated financial statements have been prepared in accordance with accounting principles generally accepted in the U.S. (“U.S. GAAP”). The consolidated financial statements have been prepared in accordance with the rules and regulations of the United States Securities and Exchange Commission (the "SEC"). All amounts included in the consolidated financial statements have been rounded except where otherwise stated. As figures are rounded, numbers presented throughout this document may not add up precisely to the totals we provide and percentages may not precisely reflect the absolute figures.
Principles of Consolidation – The financial statements include the accounts of the Company as well as the Company’s wholly-owned subsidiaries. All intercompany accounts and transactions have been eliminated in consolidation.
Estimates and Uncertainties – The preparation of our consolidated financial statements in conformity with U.S. GAAP requires management to make estimates and assumptions that affect the reported amounts of assets and liabilities and disclosure of contingent assets and liabilities at the date of the consolidated financial statements and the reported amounts of revenues and expenses during the reporting period. Estimates are used in determining, among other items, trade incentives, share-based compensation, and useful lives for long-lived assets. Actual results, as determined at a later date, could differ from those estimates.
Segments – The Company operates as a single operating segment reporting to its chief operating decision maker.
Investment in Unconsolidated Company – The Company utilizes the equity method to account for investments when the Company possesses the ability to exercise significant influence, but not control, over the operating and ESG goals,financial policies of the investee. The ability to exercise significant influence is presumed when an investor possesses more than 20% of the voting interests of the investee. This presumption may be overcome based on specific facts and circumstances that demonstrate that the ability to exercise significant influence is restricted.
In applying the equity method, the Company records the investment at cost and subsequently increases or decreases the carrying amount of the investment by its proportionate share of the net income or loss. The Company has elected to record its share of equity in income (losses) of equity method investment on a one-quarter lag based on the most recently available financial statements.
Through 2022, we paid annual incentive awardsinvested a total of $31,200 in a privately held company that operates in our industry, with no additional investments during 2023. The Company concluded that it is not the primary beneficiary, which is primarily the result of the Company's conclusion that it does not have the power to each NEOdirect activities that most significantly impact economic performance. Prior to March 30, 2023, the Company accounted for the investment under the equity method of accounting based on our ability to exercise significant influence, based on our representation on and the makeup of the investee's Board of Directors. The basis difference between the Company's carrying value of its investment and the amount of underlying equity in net assets of the privately held company is not material to the Company's consolidated financial statements.
On March 30, 2023, the Company no longer had representation on the investee's Board of Directors, and therefore determined that significant influence had been lost as follows:
Name | Operational Goals | Executive ESG Goal | ||||||||||||||
Amount of Award | % of Target Awarded | Amount of Award | % of Target Awarded | |||||||||||||
| William B. Cyr | $ | 233,244 | 44 | % | $ | 49,476 | 84 | % | ||||||||
| Scott Morris | $ | 121,176 | 44 | % | $ | 25,704 | 84 | % | ||||||||
| Todd Cunfer * | $ | 10,090 | 44 | % | $ | 2,140 | 84 | % | ||||||||
| Thembeka Machaba | $ | 53,856 | 44 | % | $ | 11,424 | 84 | % | ||||||||
| Cathal Walsh | $ | 49,500 | 44 | % | $ | 10,500 | 84 | % | ||||||||
| Heather Pomerantz** | $ | 58,500 | 44 | % | $ | 12,382 | 84 | % | ||||||||
| Richard Kassar *** | $ | 15,998 | 44 | % | $ | 3,360 | 84 | % | ||||||||
FRESHPET, INC. AND SUBSIDIARIES
NOTES TO CONSOLIDATED FINANCIAL STATEMENTS
(in thousands, except per share data)
Because the investee is a privately held company, there is not a means to obtain a readily determinable fair value of the entity. The Company follows ASC 321 using the measurement alternative to measure investments in investees that do not have readily determinable fair value and over which the Company does not have significant influence. Under ASC 321, the initial carrying value of the investment is equal to the previous carrying amount of the investment under the equity method. As the Company has historically recorded its proportionate share of income or loss from the investee on a one-quarter lag, the final adjustment to the carrying value of the investment was recorded in June 2023. The carrying amount of the investment is subsequently adjusted for any impairment or adjustments resulting from observable price changes in orderly transactions for identical or similar investments of the same issuer, if any. Dividends and distributions, if any, from the investee would be recognized in the period in which they are received and recorded in other income on the consolidated statement of operations.
The Company performs a qualitative assessment of whether the investment is impaired at each reporting date. If a qualitative assessment indicates that the investment is impaired, the company estimates the investment's fair value in accordance with the principles of ASC Topic 820 ("ASC 820"), Fair Value Measurements and Disclosures. If the fair value is less than the investment's carrying value, the entity recognizes an impairment loss in earnings equal to the difference between the carrying value and fair value. There were no observable price changes, impairment, or other matters that would require adjustment to the investment during the year ended December 31, 2023.
March 2023 Issuance of $402.5 million of 3.00% Convertible Senior Notes (the "Convertible Notes") – In conjunction with the issuance of the $402.5 million Convertible Notes in March 2023, the Company evaluated the debt instrument and its embedded features to determine if the contract or the embedded components of the contract qualified as a derivative that would be required to be separately accounted for in accordance with the relevant accounting literature.
The Company accounts for the Convertible Notes as a single liability measured at amortized cost. The Company uses the effective interest rate method to amortize the debt issuance costs to interest expense over the respective term of the Convertible Notes.
Inventories – Inventories are stated at the lower of cost or market, using the first-in, first-out method. When necessary, the Company provides allowances to adjust the carrying value of its inventories to the lower of cost or net realizable value, including any costs to sell or dispose and consideration for obsolescence, excessive inventory levels, product deterioration and other factors in evaluating net realizable value.
Property, Plant, and Equipment – Property, plant, and equipment are recorded at cost. The Company provides for depreciation on the straight-line method by charges to income at rates based upon estimated recovery periods of 7 years for furniture and office equipment, 5 years for automotive equipment, 9 years for refrigeration equipment, 5 to 10 years for machinery and equipment, 2 years for plates & dies, and 15 to 39 years for building and improvements. Capitalized cost includes the costs incurred to bring the property, plant, and equipment to the condition and location necessary for its intended use, which includes any necessary delivery, electrical, and installation cost for equipment. Maintenance and repairs that do not extend the useful life of the assets over two years are charged to expense as incurred. Leasehold improvements are amortized over the shorter of the term of the related lease or the estimated useful lives on the straight-line method.
Long-Lived Assets – The Company evaluates all long-lived assets for impairment. Long-lived assets are evaluated for impairment whenever events or changes in circumstances indicate the carrying value of an asset may not be recoverable. Recoverability of assets to be held and used is measured by a comparison of the carrying amount of an asset to estimated undiscounted future net cash flows expected to be generated by the asset. If the carrying amount of an asset exceeds its estimated undiscounted future net cash flows, an impairment charge is recognized by the amount by which the carrying amount of the asset exceeds the fair value of the asset. Recoverability of assets held for sale is measured by a comparison of the carrying amount of an asset or asset group to their fair value less estimated costs to sell. Estimating future cash flows and calculating fair value of assets requires significant estimates and assumptions by management. If the carrying amount is not fully recoverable, an impairment loss is recognized to reduce the carry amount to fair value and is charged to expense in the period of impairment.
FRESHPET, INC. AND SUBSIDIARIES
NOTES TO CONSOLIDATED FINANCIAL STATEMENTS
(in thousands, except per share data)
Leases – The Company is a lessee in noncancelable (1) operating leases, and (2) finance leases, which it accounts for in accordance with Accounting Standards Codification (ASC) Topic 842,Leases.
The Company determines if an arrangement is or contains a lease at contract inception. The Company recognizes a right of use asset and a lease liability at the lease commencement date. For both operating and finance leases, the right of use asset is initially measured at cost, which comprises the initial amount of the lease liability adjusted for lease payments made at or before the lease commencement date, plus any initial direct costs incurred less any lease incentives received; and the lease liability is initially measured at the present value of the unpaid lease payments at the lease commencement date. For operating leases, amortization of the right of use asset is calculated as the difference between the straight-line lease expense over the lease term and the accretion of interest on the lease liability each period. For the finance lease, the right of use asset is subsequently amortized using the straight-line method from the lease commencement date to the earlier of the end of the useful life of the underlying asset or the end of the lease term. Amortization of the finance lease right of use asset is recognized and presented separately from interest expense on the lease liability.
The Company’s leases do not provide an implicit rate; therefore, the Company uses its incremental borrowing rate based on the information available at the lease commencement date in determining the present value of future payments for those leases. The Company’s incremental borrowing rate for a lease is the rate of interest it would have to pay on a collateralized basis to borrow an amount equal to the lease payments under similar terms in a similar economic environment.
Right of use assets for the operating and finance leases are periodically reviewed for impairment losses. The Company uses the long-lived assets impairment guidance in ASC Subtopic 360-10, Property, Plant, and Equipment - Overall, to determine whether a right of use asset is impaired, and if so, the amount of the impairment loss to recognize. No such loss was recognized as of December 31, 2023.
The Company monitors for events or changes in circumstances that require a reassessment of it leases. When a reassessment results in the remeasurement of a lease liability, a corresponding adjustment is made to the carrying amount of the corresponding right of use asset.
The Company has elected the practical expedient to combine lease and non-lease components when determining the right of use asset and lease liability. The Company has also elected not to recognize right of use assets and lease liabilities for short-term leases that have a formal policy coveringlease term of 12 months or less. The Company recognizes the lease payments associated with its short-term leases as an expense on a straight-line basis over the lease term.
Income Taxes – The Company provides for deferred income taxes for temporary differences between financial and income tax reporting, principally net operating loss carryforwards, depreciation, and share-based compensation. Deferred tax assets and liabilities are measured using enacted tax rates in effect for the years in which those temporary differences are expected to be recovered or settled.
A valuation allowance is appropriate when management believes it is more likely than not, the deferred tax asset will not be realized. At December 31, 2023 and 2022, the Company determined that full valuation of its net deferred tax assets and liabilities is appropriate.
Share-based Compensation – The Company recognizes share-based compensation based on the value of the portion of share-based payment awards that is ultimately expected to vest during the period. The Company estimates grant date fair value of equity compensationits options using the Black-Scholes Merton option-pricing model. Share awards to our executive officers, we believe that equity compensation provides our executive officers with a strong link to our long-term performance, creates an ownership culture, and helps to alignare amortized under the interestsstraight-line method over the requisite service period of our executive officers and our stockholders. Further, we believe that stock option awards with time-based vesting features promote executive retention,the entire award. The Company accounts for forfeitures as they incentivize our executive officersoccur.
Cash Equivalents – The Company holds treasury bills with original maturities when purchased of less than three months, within cash and cash equivalents, carried at amortized cost on the Consolidated Balance Sheet. Treasury bills have been classified as held-to-maturity as we have the ability and intent to remain employed with us for hold them to maturity. As of December 31, 2023, the applicable vesting period. Accordingly, Company had $134,570 of treasury bills within cash equivalents, which included $692 of amortized discount. As of December 31, 2022, the Compensation Committee (or alternatively, the Board) periodically reviews the equity compensation of our NEOs andCompany had no treasury bills within cash equivalents.
FRESHPET, INC. AND SUBSIDIARIES
NOTES TO CONSOLIDATED FINANCIAL STATEMENTS
(in thousands, except per share data)
Short-Term Investments – The Company, from time to time, holds treasury bills with original maturities when purchased of greater than three months, within short-term investments, carried at amortized cost on the Consolidated Balance Sheet. Treasury bills have been classified as held-to-maturity as we have the ability and intent to hold them to maturity. As of December 31, 2023, all of the Company's treasury bills within short-term investments matured during the year at $115,000, which included $1,559 of interest income. As of December 31, 2022, all of the Company's treasury bills within short-term investments matured during the year at $20,000, which included $160 of interest income.
Trade Account Receivable – The allowance for doubtful accounts is based on the Company's assessment of the collectability of customer accounts. The Company regularly reviews the allowance by considering factors such as historical experience, credit quality, the age of the accounts receivable balances and current economic conditions that may grant awards as it deems appropriate.
Implementation Costs of Cloud Computing Arrangement – As of December 31, 2023 and 2022, the Company's deferred implementation costs of our 2014 Omnibus Incentive Plan (or “2014 Plan”),new ERP system associated with our cloud computing arrangement, which allows for awards of tax-qualified incentive stock options, non-statutory stock options, stock appreciation rights, restricted stock, other stock-based awards,were reflected within prepaid and other cash-based awardsassets, were $9,895 and $9,444, respectively. The cost will be recognized over the term of the agreement, which began in the first quarter of 2022.
Fair Value of Financial Instruments – Financial Accounting Standards Board (“FASB”) ASC 820, Fair Value Measurements and Disclosure guidance specifies a hierarchy of valuation techniques based on whether the inputs to those valuation techniques are observable or unobservable. Observable inputs reflect market data obtained from independent sources, while unobservable inputs reflect market assumptions. The hierarchy gives the highest priority to unadjusted quoted prices in active markets for identical assets or liabilities (Level 1 measurement) and the lowest priority to unobservable inputs (Level 3 measurement).
The three levels of the fair value hierarchy are as follows:
● | Level 1 – Unadjusted quoted prices in active markets for identical assets or liabilities that the reporting entity has the ability to access at the measurement date. Level 1 primarily consists of financial instruments whose value is based on quoted market prices such as exchange-traded instruments and listed equities. |
● | Level 2 – Inputs other than quoted prices included within Level 1 that are observable for the asset or liability, either directly or indirectly (e.g., quoted prices of similar assets or liabilities in active markets, or quoted prices for identical or similar assets or liabilities in markets that are not active). Level 2 includes financial instruments that are valued using models or other valuation methodologies. |
● | Level 3 – Unobservable inputs for the asset or liability. Financial instruments are considered Level 3 when their fair values are determined using pricing models, discounted cash flows or similar techniques and at least one significant model assumption or input is unobservable. |
Our financial assets and liabilities include cash and cash equivalents, receivables, accounts payable and accrued liabilities, the fair values of which approximate their carrying values due to the short-term nature of these instruments. The Company holds certain financial assets within cash and cash equivalents in the form of held-to-maturity treasury bills as we have the ability and intent to hold them to maturity, as such, they are not fair valued each reporting period but instead measured at amortized cost. The fair value of these assets is based on quoted market prices for the same or similar securities within less active markets, which the Company determined to be Level 2 inputs. As of December 31, 2023, the fair value of these treasury bills approximates their carrying value due to the short-term nature of these instruments.
Certain financial and non-financial assets, including the equity method investment, operating lease right-of-use assets and property, plant, and equipment are reported at their carrying values and are not subject to recurring fair value measurements. We review our directors, officers, employees, consultants, and advisors. Eachlong-lived assets for impairment whenever events or changes in circumstances indicate that the carrying amount of an asset may not be recoverable. For the investment in equity securities, we have elected the measurement alternative under which we measure this investment at cost minus impairment, if any, plus or minus changes resulting from observable price changes, if any, in orderly transactions for an identical or a similar investment of the same issuer, for which the change in fair value would be included in net income.
Refer to Note 7 for the fair value of our NEOsConvertible Senior Notes.
As of December 31, 2023, the Company only maintained Level 1 and Level 2 assets and liabilities.
FRESHPET, INC. AND SUBSIDIARIES
NOTES TO CONSOLIDATED FINANCIAL STATEMENTS
(in thousands, except per share data)
Debt Issuance Cost – The Company's policy is eligible to participaterecord debt issuance costs as a direct deduction to the related debt liability in the Consolidated Balance Sheet and to amortize these debt issuance costs to interest expense over the term of the related debt using the effective interest method.
Revenue Recognition and Incentives – Revenues primarily consist of the sale of pet food products that are sold to retailers through broker and distributor arrangements. These revenue contracts generally have single performance obligations. Revenue, which includes shipping and handling charges billed to the customer, is reported net of applicable trade incentives and allowances. Amounts billed and due from our 2014 Plan.
Revenue from product sales is recognized when obligations under the Board) determines the size and vesting terms of the contract with the customer are satisfied, which occurs once control is transferred upon delivery to the customer. Revenue is measured as the amount of consideration the Company expects to receive in exchange for transferring goods.
The amount of consideration the Company receives and revenue the Company recognizes varies with changes in trade incentives the Company offers to its customers and their consumers. Trade incentives consists primarily of customer pricing allowances and merchandising funds, and consumer coupons are offered through various programs to customers and consumers. Estimates of trade promotion expense and coupon redemption costs are based upon programs offered, timing of those offers, estimated redemption/usage rates from historical performance, management’s experience and current economic trends.
Sales taxes and other similar taxes are excluded from revenue.
There were no contract assets as of December 31, 2023 and 2022.
Net Sales – Information about the Company’s net sales by class of retailer is as follows:
Twelve Months Ended | ||||||||||||
December 31, | ||||||||||||
2023 | 2022 | 2021 | ||||||||||
Grocery, Mass and Club | $ | 685,307 | $ | 524,971 | $ | 356,965 | ||||||
Pet Specialty and Natural | 81,588 | 70,373 | 68,524 | |||||||||
Net Sales | $ | 766,895 | $ | 595,344 | $ | 425,489 | ||||||
Advertising – Advertising costs are expensed when incurred, with the exception of production costs which are expensed the first time advertising takes place. Advertising costs, consisting primarily of media ads, were $97,877, $71,720 and $53,687, in 2023, 2022 and 2021, respectively. As of December 31, 2023, 2022 and 2021 we had $56, $553 and $1,173, respectively of production cost in prepaid expense, representing advertising that had yet to take place.
Shipping and Handling Costs/Freight Out – Costs incurred for shipping and handling are included in selling, general, and administrative expenses within the statement of operations and comprehensive loss. Shipping and handling costs primarily consist of costs associated with moving finished products to customers, including costs associated with our distribution center and the cost of shipping products to customers through third-party carriers. Shipping and handling cost totaled $57,427, $63,891, and $47,713 in 2023,2022 and 2021, respectively.
FRESHPET, INC. AND SUBSIDIARIES
NOTES TO CONSOLIDATED FINANCIAL STATEMENTS
(in thousands, except per share data)
Recently Issued Accounting Pronouncements
In November 2023, the Financial Accounting Standards Board ("FASB") issued ASU 2023-07, Segment Reporting (Topic 280): Improvements to Reportable Segment Disclosures to improve reportable segment disclosure requirements, primarily through enhanced disclosures about significant segment expenses. This guidance will be effective for the Company for the annual report for the fiscal year ending December 31, 2024 and subsequent interim periods. Early adoption is permitted and retrospective adoption is required for all awards made under our 2014 Planprior periods presented. The Company is currently evaluating the provisions of this guidance and administersits effect on its future consolidated financial statements.
In December 2023, the FASB issued ASU 2023-09, Improvements to Income Tax Disclosures, which requires improved disclosures related to the rate reconciliation and income taxes paid. This ASU requires companies to reconcile the income tax expense attributable to continuing operations to the statutory federal income tax rate applied to pre-tax income from continuing operations. Additionally, this ASU requires companies to disclose the total amount of income taxes paid during the period. This guidance will be effective for the Company for the annual report for the fiscal year ending December 31, 2025, with early adoption permitted. The guidance is required to be applied on a prospective basis with the option to apply retrospectively to all other aspectsprior periods presented in the financial statements. The Company is currently evaluating the provisions of this guidance and its effect on its future consolidated financial statements.
The Company did not adopt any new Accounting Standard Updates during 2023.
Note 2 – Inventories, net:
Inventories are summarized as follows:
December 31, | December 31, | |||||||
2023 | 2022 | |||||||
Raw Materials and Work in Process | $ | 16,055 | $ | 20,608 | ||||
Packaging Components Material | 5,607 | 6,186 | ||||||
Finished Goods | 41,576 | 31,639 | ||||||
| 63,238 | 58,433 | |||||||
Reserve for Obsolete Inventory | - | (143 | ) | |||||
Inventories, net | $ | 63,238 | $ | 58,290 | ||||
Note 3 – Property, Plant and Equipment, net:
Property, plant and equipment are summarized as follows:
December 31, | December 31, | |||||||
2023 | 2022 | |||||||
Refrigeration Equipment | $ | 167,956 | $ | 137,875 | ||||
Machinery and Equipment | 242,256 | 199,504 | ||||||
Building, Land, and Improvements | 535,003 | 458,800 | ||||||
Furniture and Office Equipment | 14,987 | 14,040 | ||||||
Leasehold Improvements | 1,319 | 1,319 | ||||||
Construction in Progress | 187,952 | 134,338 | ||||||
Finance Lease Right of Use Asset | 29,187 | - | ||||||
| 1,178,660 | 945,877 | |||||||
Less: Accumulated Depreciation and Amortization | (199,496 | ) | (145,291 | ) | ||||
Property, Plant and Equipment, net | $ | 979,164 | $ | 800,586 | ||||
FRESHPET, INC. AND SUBSIDIARIES
NOTES TO CONSOLIDATED FINANCIAL STATEMENTS
(in thousands, except per share data)
Depreciation and amortization expense related to property, plant and equipment totaled $58,169, $34,332, and $29,467 in 2023,2022 and 2021, respectively; of which $42,667, $20,774, and $16,545 was recorded in cost of goods sold for 2023, 2022 and 2021, respectively, with the remainder of depreciation expense being recorded to selling, general and administrative expense.
Note 4 – Income Taxes
A summary of income taxes as follows:
Year Ended December 31, | ||||||||||||
2023 | 2022 | 2021 | ||||||||||
Federal | $ | — | $ | — | $ | — | ||||||
State | 210 | 282 | 162 | |||||||||
International | — | — | — | |||||||||
| $ | 210 | $ | 282 | $ | 162 | |||||||
The provisions for income taxes do not bear a normal relationship to loss before income taxes primarily as a result of the plan. In 2022,valuation allowance on deferred tax assets.
The reconciliation of the Compensation Committee took into account a number of factors when making awards under our 2014 Plan, including, among others, the eligible employee’s expected contributionstatutory federal income tax rate to the long-term successCompany’s effective tax is presented below:
Year Ended December 31, | ||||||||||||
2023 | 2022 | 2021 | ||||||||||
Tax at federal statutory rate | 21.0 | % | 21.0 | % | 21.0 | % | ||||||
State taxes, net of federal | 1.2 | % | 3.6 | % | 7.4 | % | ||||||
Permanent items | 5.8 | % | 3.7 | % | 30.6 | % | ||||||
Other | (0.4 | %) | (0.7 | %) | (0.2 | %) | ||||||
State rate change | (1.8 | %) | 0.5 | % | (0.5 | %) | ||||||
Valuation allowance | (26.4 | %) | (28.6 | %) | (58.8 | %) | ||||||
Effective tax rate | (0.6 | %) | (0.5 | %) | (0.5 | %) | ||||||
In assessing the realizability of the net deferred tax assets, the Company considers all relevant positive and negative evidence to determine whether it is more likely than not that some portion or all of the deferred income tax assets will not be realized. The realization of the gross deferred tax assets is dependent on several factors, including the generation of sufficient taxable income prior to the expiration of the net operating loss carryforwards. The Company believes that it is more likely than not that the Company’s deferred income tax assets will not be realized. The Company has experienced taxable losses from inception. As such, there is a full valuation allowance against the net deferred tax assets as of December 31, 2023, 2022 and 2021.
FRESHPET, INC. AND SUBSIDIARIES
NOTES TO CONSOLIDATED FINANCIAL STATEMENTS
(in thousands, except per share data)
The tax effects of temporary differences that give rise to significant portions of the deferred tax assets and deferred tax liabilities are as follows:
Year Ended December 31, | ||||||||||||
2023 | 2022 | 2021 | ||||||||||
Net operating loss | $ | 105,233 | $ | 85,214 | $ | 73,436 | ||||||
Stock option expense | 23,643 | 18,709 | 12,169 | |||||||||
Property and equipment | (35,756 | ) | (20,753 | ) | (14,957 | ) | ||||||
Other | 5,536 | 5,920 | 2,845 | |||||||||
Less: Valuation allowance | (98,656 | ) | (89,090 | ) | (73,493 | ) | ||||||
Net deferred income tax assets | $ | - | $ | - | $ | - | ||||||
At December 31, 2023, the Company had federal net operating loss (“NOL”) carryforwards of $420.3 million, of which $175.4 million, generated in 2017 and prior, will expire between 2025 and 2037. The NOL generated from 2018 through 2023, of approximately $244.9 million, will have an indefinite carryforward period but can generally only be used to offset 80% of taxable income in any particular year. The Company may be subject to the net operating loss utilization provisions of Section 382 of the Internal Revenue Code. The effect of an ownership change would be the imposition of an annual limitation on the use of NOL carry forwards attributable to periods before the change. The amount of the annual limitation depends upon the value of the Company immediately before the change, changes to the Company’s capital during a specified period prior to the change, and information gatheredthe federal published interest rate. We have completed several analyses under Section 382 of the Code in the past which concluded that certain annual limitations exist. At December 31, 2023, the Company had $312.8 million of state NOLs which expire between 2024 and 2043, and had $20.7 million of foreign NOLs in the United Kingdom which do not expire.
Entities are also required to evaluate, measure, recognize and disclose any uncertain income tax provisions taken on their income tax returns. The Company has analyzed its tax positions and has concluded that as of December 31, 2023, there were no uncertain positions. The Company’s U.S. federal and state net operating losses have occurred since its inception in 2005 and as such, tax years subject to potential tax examination could apply from that date because the utilization of net operating losses from prior years opens the relevant year to audit by the Compensation Committee regarding compensation paidIRS and/or state taxing authorities. Interest and penalties, if any, as they relate to similarly situated executives at companiesincome taxes assessed, are included in our compensation peer group, as well as the amounts of outstanding stock options that each NEO held at such time. In lightincome tax provision. The Company did not have any unrecognized tax benefits and has not accrued any interest or penalties through 2023, 2022 and 2021.
The Company considered the impact of the stock options granteddisallowance of certain compensation tax deductions in excess of $1.0 million under Internal Revenue Code Section 162(m); however, to our NEO’s the extent an adjustment to the deferred tax asset is required the impact will be offset by a corresponding adjustment to the valuation allowance.
Note 5 – Accrued Expenses:
Accrued expenses are summarized as follows:
2023 | 2022 | |||||||
Accrued Compensation and Employee Related Costs | $ | 19,307 | $ | 8,559 | ||||
Accrued Construction Costs | — | 4,235 | ||||||
Accrued Chiller Cost | 7,478 | 4,106 | ||||||
Accrued Customer Consideration | 1,228 | 656 | ||||||
Accrued Freight | 6,078 | 2,705 | ||||||
Accrued Production Expenses | 6,928 | 3,755 | ||||||
Accrued Corporate and Marketing Expenses | 3,627 | 3,794 | ||||||
Accrued Interest | 3,019 | 922 | ||||||
Other Accrued Expenses | 2,151 | 4,284 | ||||||
Accrued Expenses | $ | 49,816 | $ | 33,016 | ||||
FRESHPET, INC. AND SUBSIDIARIES
NOTES TO CONSOLIDATED FINANCIAL STATEMENTS
(in 2020,thousands, except per share data)
Note 6 – Debt:
On February 19, 2021, the Company entered into the Sixth Amended and Restated Loan and Security Agreement ("Credit Agreement"), which amended and restated in full the Company's Fifth Amended and Restated Loan and Security Agreement, dated as of April 17, 2020. The Credit Agreement provided for a $350,000 senior secured credit facility (as amended the "Credit Facility"), encompassing a $300,000 delayed draw term loan facility (the "Delayed Draw Facility") and a $50,000 revolving loan facility (the "Revolving Loan Facility"), which replaced the Company's prior $130,000 delayed draw term loan facility and $35,000 revolving loan facility. The Company incurred an additional $3,263 of fees associated with the debt modification, of which $2,797 was related to the Delayed Draw Term Loan ("DDTL") (as defined below) with the remaining balance relating to the Revolving Loan Facility (as defined below). The Company's policy is to record the debt issuance cost related to the Delayed Draw Term Loan, net of debt, for the portion of the Delayed Draw Term Loan that is outstanding, with the remaining amount recorded within assets.
The Credit Facility had an original maturity date of February 19, 2026 and borrowings thereunder bore interest at variable rates depending on the Company's election, either at a base rate or at the adjusted term SOFR (which rate was to be calculated based upon a one-month tenor in effect on such date and was to be determined on a daily basis), in each case, plus an applicable margin. Subject to the Company's leverage ratio, the applicable margin varies between 0.75% and 2.25% for base rate loans and 1.75% and 3.25% for SOFR loans. The Company had the option to borrow term loans under the Delayed Draw Facility ("Delayed Draw Term Loans") until August 19, 2023, subject to certain conditions.
Borrowings under the Credit Facility were secured by substantially all of the Company's and certain of its subsidiaries' assets. The Credit Agreement required compliance with various covenants customary for agreements of this type, including financial covenants and negative covenants that limit, among other things, the Company's ability to incur additional debt, create or incur liens, engage in mergers or consolidations, sell, transfer or otherwise dispose of assets, make voluntary prepayments to subordinated debt, permit a change of control, pay dividends or distributions, make investments, and enter into certain transactions with affiliates. The Credit Agreement also included events of default customary for agreements of this type. The Credit Facility included a quarterly commitment fee on any unused amounts at a per annum rate between 0.30% to 0.50% depending on the aggregate principal outstanding.
On April 29, 2022, the Company entered into the First Amendment to the Credit Agreement, which amendment, among other things, (i) made amendments to allow for the Company's projected capital expenditures without either triggering mandatory prepayment obligations or violating the covenant and (ii) replaced the LIBOR interest rate for U.S. dollar loans with a term Secured Overnight Financing Rate ("Term SOFR").
On March 13, 2023, the Company notified City National Bank, of Freshpet's intent to terminate the Credit Agreement, with such termination to be effective as of March 15, 2023 (the "Termination Date"), in connection with the offering of the Convertible Notes.
As of March 13, 2023, the Termination Date and December 31, 2022, the Company had no borrowings outstanding under the Credit Facility. Interest expense and fees totaled $2,785, $5,208 and $2,882 in 2023,2022 and 2021, respectively. Interest expense in 2023 included $2,478 of debt issuance costs written off in conjunction with the termination of the Credit Facility in March 2023. There was $0 of accrued interest on the credit facilities as of December 31, 2023 and $904 accrued interest on the credit facilities as of December 31, 2022.
FRESHPET, INC. AND SUBSIDIARIES
NOTES TO CONSOLIDATED FINANCIAL STATEMENTS
(in thousands, except per share data)
Note 7 – Convertible Senior Notes:
In March 2023, we issued $402,500 aggregate principal amount of 3.0% convertible senior notes due 2028. The Convertible Notes were issued in a private offering to qualified institutional buyers pursuant to Rule 144A under the Securities Act of 1933, as amended (the Securities Act"). The net proceeds from the sale of the Convertible Notes were approximately $391,492 after deducting offering and issuance costs related to the Convertible Notes and before the 2023 Capped Call transactions, as described below, no additionalbelow.
The Convertible Notes are our senior, unsecured obligations and accrue interest at a rate of 3.0% per annum, payable semi-annually in arrears on April 1 and October 1 of each year, beginning on October 1, 2023. The Convertible Notes will mature on April 1, 2028 unless earlier converted, redeemed or repurchased by us. Before January 3, 2028, noteholders will have the right to convert their Convertible Notes only under the following circumstances: (1) during any calendar quarter commencing after the calendar quarter ended on June 30, 2023 (and only during such calendar quarter), if the last reported sale price of our common stock, option grants were grantedpar value $0.001 per share (the "common stock"), for each of at least 20 trading days (whether or not consecutive) during a period of 30 consecutive trading days ending on, and including, the last trading day of the immediately preceding calendar quarter is greater than or equal to 130% of the conversion price on each applicable trading day; (2) during the five consecutive business day period immediately after any 10 consecutive trading day period (the "measurement period") in 2022 to those NEOs who participatedwhich the trading price per $1,000 principal amount of notes, as determined following a request by a holder or holders of the Convertible Notes in the 2020 program.
We will settle conversions by paying or delivering, as applicable, cash, shares of our common stock under our 2014 Plan, 50%or a combination of which are scheduled to vestcash and become exercisable in equal installments on each of the first three anniversaries of the grant date and 50% of which are scheduled to vest and become exercisable annually according to the achievement of Adjusted EBITDA performance-based conditions (and in each case subject to the NEO’s continued employment with us). Upon a termination by the Company other than for “cause” or by the NEO for “good reason”, within two years following a “change in control” (as each is defined in the applicable award agreements), the time-vesting options will accelerate and vest.
We may not redeem the Convertible Notes prior to April 3, 2026. We may redeem for cash all or any portion of the Convertible Notes, at our option, on or after April 3, 2026 and on or before the 40th scheduled trading day immediately preceding the maturity date, if the last reported sale price of our common stock has been at least 130% of the conversion price then in effect for each of at least 20 trading days (whether or not consecutive) during the first three anniversaries30 consecutive trading day period (including the last trading day of such period) ending on, and including, the trading day immediately preceding the date on which we send the notice of redemption, at a redemption price equal to 100% of the grant dateprincipal amount of the Convertible Notes to be redeemed, plus accrued and 20,000unpaid interest to, but excluding, the redemption date. However, we may not redeem less than all of whichthe outstanding Convertible Notes unless at least $100 million aggregate principal amount of Convertible Notes are scheduled to vestoutstanding and become exercisable followingnot called for redemption as of the achievementtime we send the related redemption notice.
Upon the occurrence of certain annual net sales goalsa fundamental change (as defined in the 2023 calendar year (and in each case subjectIndenture), holders may require the Company to Mr. Walsh’s continued employment with us).
FRESHPET, INC. AND SUBSIDIARIES
NOTES TO CONSOLIDATED FINANCIAL STATEMENTS
(in thousands, except per share data)
The effective interest rate for the Convertible Notes is 3.59%. Transaction costs of stock options under our 2014 Plan$11,008 attributable to certain officers. These grants were designed to align the most senior managementissuance of the Convertible Notes were recorded as a direct deduction from the related debt liability in the Consolidated Balance Sheet and are amortized to interest expense over the term of the Convertible Notes using the effective interest method.
The Company measures the fair value of its Convertible Notes for disclosure purposes. The fair value is based on observable market prices for this debt, which is traded in less active markets and is therefore classified as a Level 2 fair value measurement. The following table discloses the carrying value and fair value of the Company's Convertible Notes as of December 31, 2023:
As of December 31, 2023 | ||||||||
Carrying Value (1) | Fair Value | |||||||
3.00% Convertible Senior Notes Maturing April 1, 2028 | 393,074 | 581,613 | ||||||
(1) The carrying amounts presented are net of unamortized debt issuance costs of $9,426 as of December 31, 2023.
Lender fees that were paid upfront to the lenders and debt issuance fees paid to third parties are recorded as a discount to the carrying amount of debt and are being amortized to interest expense over the life of the debt. The total interest expense for the twelve months ended December 31, 2023, recognized related to the Convertible Notes consists of the following:
Twelve Months Ended | ||||
December 31, | ||||
Contractual interest expense | 9,426 | |||
Amortization of issuance costs | 1,582 | |||
Total | 11,008 | |||
As of December 31, 2023, of the $9,426 interest expense incurred to date, $6,406 was paid during the year, with $3,019 of accrued interest expense as of the year end. Of the $9,426 of interest expense incurred, approximately $1,207 of interest expense was capitalized to construction in progress as of December 31, 2023, as the proceeds from the sale of the Convertible Notes are being used to fund construction on the Company's manufacturing facility expansion in Ennis, Texas. As of December 31, 2023, $136 of the $1,207 was reclassified from construction in progress to assets placed in service.
Note 8 – Purchase of Capped Call Options:
In connection with the long-term goals established bypricing of the CompanyConvertible Notes issued in early 2020, and cover a four-year performance period ending December 31, 2024. March 2023, we used $66,211 of the net proceeds from the Convertible Notes to enter into privately negotiated capped call transactions (collectively, the "Capped Call Transactions") with certain financial institutions.
The Committee will notCapped Call Transactions are generally expected to reduce potential dilution to holders of our common stock upon any conversion of the Convertible Notes and/or offset any cash payments we are required to make any additional grants to these individuals during this performance period, so none of these individuals received a grant in 2021 or 2022. For the NEOs, the grants are 75% performance-based and 25% time-based, with the performance targets set in excess of the long-term goals communicatedprincipal amount of the Convertible Notes upon conversion of the Convertible Notes in the event that the market price per share of our common stock is greater than the strike price of the Capped Call Transactions, with such reduction and/or offset subject to investors. For competitive reasons, a cap.
FRESHPET, INC. AND SUBSIDIARIES
NOTES TO CONSOLIDATED FINANCIAL STATEMENTS
(in thousands, except per share data)
The Capped Call Transactions have an initial cap price of approximately $120.23 per share, which represents a premium of 120% over the last reported sale price of our common stock of $54.65 per share on March 15, 2023, and is subject to certain adjustments under the terms of the Capped Call Transactions. Collectively, the Capped Call Transactions cover, initially, the number of shares of our common stock underlying the Convertible Notes, subject to anti-dilution adjustments substantially similar to those applicable to the Convertible Notes.
The Capped Call Transactions are accounted for as freestanding derivatives and recorded at the initial fair value in additional paid-in-capital in the Consolidated Balance Sheet with no recorded subsequent change to fair value as long as they meet the criteria for equity classification. As of December 31, 2023, the instrument continued to qualify for equity classification.
Note 9 – Commitments and Contingencies
Leases:
We have various noncancelable operating lease agreements for office and warehouse space with original remaining lease terms of two years to nine years, some of which include an option to extend the lease term for up to four years. Because the Company is not reasonably certain to exercise the renewal options on these lease arrangements, the options are not considered in determining the lease term and associated potential option payments are excluded from lease payments. The Company’s leases generally do not include termination options for either party to the lease or restrictive financial or other covenants.
As of July 2023, we are not disclosingalso entered into a finance lease agreement for manufacturing equipment with an initial term of ten years, which includes an option to extend the specific goalslease term for up to ten years, which the Company is not reasonably certain to exercise. The agreement did not include termination options for either party to the lease or restrictive financial or other covenants. In connection with the manufacturing equipment lease, which is a new asset class, we elected the practical expedient to combine lease and instead theynon-lease components to determine the right of use asset and lease liability.
Weighted-average remaining lease term (in years) and discount rate related to operating and finance leases were as follows:
Operating Leases | Finance Lease | |||||||
Weighted-average remaining lease term | 2.97 | 9.5 | ||||||
Weighted-average discount rate | 6.2 | % | 8.6 | % | ||||
As most of our leases do not provide an implicit rate, we use our incremental borrowing rate based on the information available at the commencement date to determine the present value of lease payments.
Maturities of lease liabilities under noncancelable operating leases and finance lease as of December 31, 2023 were as follows:
As of December 31, 2023 | ||||||||
Operating Leases | Finance Lease | |||||||
2024 | $ | 1,511 | $ | 4,336 | ||||
2025 | 1,210 | 4,336 | ||||||
2026 | 1,239 | 4,336 | ||||||
2027 | 337 | 4,336 | ||||||
2028 and beyond | - | 23,844 | ||||||
Total lease payments | $ | 4,297 | $ | 41,188 | ||||
Less: Imputed interest | (394 | ) | (13,110 | ) | ||||
Present value of lease liabilities | $ | 3,903 | $ | 28,078 | ||||
FRESHPET, INC. AND SUBSIDIARIES
NOTES TO CONSOLIDATED FINANCIAL STATEMENTS
(in thousands, except per share data)
A summary of lease costs for 2023 and 2022 were as follows:
For the Twelve Months Ended December 31, | |||||||||
Statement of Operations and Comprehensive Loss Location | 2023 | 2022 | |||||||
Operating Lease: | |||||||||
Lease cost | Cost of goods sold and selling, general and administrative | $ | 1,752 | $ | 1,752 | ||||
Finance Lease: | |||||||||
Amortization of right of use asset | Cost of goods sold | $ | 1,459 | $ | - | ||||
Interest on lease liabilities | Interest Expense | $ | 1,235 | $ | - | ||||
Variable lease cost (a) | Cost of goods sold (a) | $ | 6,733 | $ | - | ||||
(a) Variable lease cost primarily consists of the procurement and manufacturing costs capitalized to inventory. During the period, $6,733 of variable lease costs were capitalized to inventory and will be disclosed uponcaptured as part of cost of goods sold as the conclusioninventory turns.
Supplemental balance sheet information as of the four-year performance period. Upon a termination by the Company other than for “cause” or by the NEO for “good reason” (eachDecember 31, 2023 and December 31, 2022 related to leases are as defined in each applicable award agreements), within two years following a “change in control” (as defined in the applicable award agreements), the time-vesting options will acceleratefollows:
Balance Sheet Location | As of December 31, 2023 | As of December 31, 2022 | |||||||
Assets: | |||||||||
Operating leases | Operating lease right of use assets | $ | 3,616 | $ | 5,165 | ||||
Finance lease, net | Property, plant and equipment, net | 27,728 | - | ||||||
Total lease assets | $ | 31,344 | $ | 5,165 | |||||
Liabilities: | |||||||||
Current: | |||||||||
Operating lease liabilities | Current operating lease liabilities | $ | 1,312 | $ | 1,510 | ||||
Finance lease liabilities | Current finance lease liabilities | 1,998 | - | ||||||
Long-term: | |||||||||
Operating lease liabilities | Long term operating lease liabilities | 2,591 | 4,200 | ||||||
Finance lease liabilities | Long term finance lease liabilities | 26,080 | - | ||||||
Total lease liabilities | $ | 31,981 | $ | 5,710 | |||||
Supplemental cash flow information and vestnon-cash activity relating to operating and the performance-vesting options will in accelerate and vest in part or in full based on actual Company performance through the change in control. Upon termination by the Company other than for “cause” not in connection with a “change in control”, the performance-vesting options will accelerate on a prorated basis based on number of days employed during the performance period, based on actual Company performance through the end of the performance period.
For the Twelve Months Ended December 31, | ||||||||
Operating cash flow information: | 2023 | 2022 | ||||||
Cash paid for amounts included in the measurement of operating lease liabilities | $ | 1,802 | $ | 1,764 | ||||
Cash paid for amounts included in the measurement of finance lease liabilities (i.e. interest) | $ | 1,235 | $ | - | ||||
Finance cash flow information: | ||||||||
Cash paid for amounts included in the measurement of finance lease liabilities (i.e. principal payment) | $ | 1,109 | $ | - | ||||
FRESHPET, INC. AND SUBSIDIARIES
NOTES TO CONSOLIDATED FINANCIAL STATEMENTS
(in thousands, except per share data)
Commitments:
As of December 31, 2023, the 401(k) Plan, Company has the following future commitments:
In August 2023, we do not maintain any pension plans or non-qualified deferred compensation plansentered into a lease arrangement for a to-be constructed office space, which will contribute right of use assets and lease liabilities upon lease commencement, which is anticipated to occur by the benefitend of our employees or other service providers.
Certain of the initial term. Any automatic extension may be cancelled upon at least 90 days’ prior written notice from the respective NEO or the Company. Under their agreements, and following past adjustments made in connection with the Board’s annual review, Messrs. Cyr, Morris, Cunfer and WalshCompany’s executives are entitled to receive annual base salaries of $620,000, $510,000, $500,000, and $312,500, respectively, subject to annual reviewcovered by the Board. Further, Messrs. Cyr, Morris, Cunfer and Walsh have the opportunity to earn annual target bonuses equal to at least 95%, 60%, 60% and 40%, respectively, of their base salaries. Each executive is also entitled to participate in the Company’s employee and fringe benefit plans as may be in effect from time to time on the same basis as other employees ofemployment contracts requiring the Company generally. The Company is also party to an offer letter with Ms. Machaba, which is described further below.
The future minimum payments due under manufacturing and service obligations for five years were as follows:
December 31, 2023 | ||||
2024 | $ | 10,003 | ||
2025 | 6,194 | |||
2026 | 1,500 | |||
2027 | 1,500 | |||
2028 and beyond | 1,500 | |||
Total Manufacturing and Servicing Obligations | $ | 20,697 | ||
Legal Obligations:
We are currently involved in various claims and legal actions that arise in the ordinary course of our business. None of these claims or proceedings, most of which are covered by insurance, are expected to have a material adverse effect on our business, financial condition, results of operations or cash flows. However, a significant increase in the number of these claims or an increase in amounts owing under successful claims could materially and adversely affect our business, financial condition, results of operations or cash flows.
On April 8, 2022, Phillips Feed Service, Inc., d/b/a Phillips Feed And Pet Supply ("Phillips") filed a complaint against the Company in U.S. District Court for the Eastern District of Pennsylvania (Allentown Division) for damages allegedly sustained as a result of the termination of the NEOCompany's distribution arrangement with Phillips, a former distributor of Freshpet products. Phillips asserts a claim for breach of contract, and seeks monetary damages in excess of $8,300 based on a claimed "termination payment" under a 2018 "Letter Of Intent" and additional damages based on a claim for improper notice of termination. Phillips also claims a right of setoff with respect to monies owed by Phillips to the Company.
On July 5, 2022, the Company without “cause,” byanswered the NEO for “good reason,” or due to “permanent disability” (each as defined incomplaint disputing the respective employment agreements), each NEO is generally eligible to receive, subject to his timely executionclaimed damages, assertions of breach of contract, and non-revocationthe right of a general release of claims against the Company: (i) an amount equal to 12 months of the NEO’s base salary in accordance with the Company’s normal payroll practice; (ii) Company payment of premiums (at active employee rates) for continuation of group health coverage for the NEO and his eligible dependents for 12 months; and (iii) only in the event of a termination byoffset. In addition, the Company without “cause” or by the NEOcounterclaimed breach of contract for “good reason” after June 30th during any year in which the employment agreement is effective, a pro-rated annual incentive award based on actual performance for the year in which termination occurs.
As of certain change-in-control payments in order to avoid any excise tax or loss of deduction under Code Section 280G, if the cutback would result (after factoring any potential excise taxes under Section 280G) in a larger after-tax payment to the NEO.
The fact discovery period in this action closed on December 2022, we granted our CFO, Mr. Cunfer,31, 2023, subject to the parties' agreement that each side may take an inducement grant of stock options in accordance with the Nasdaq Marketplace Rules. Mr. Cunfer’s inducement grant consisted of 40,120 time-vesting options and 22,381 restricted stock units.
The parties are designed to hedge or offset, any decreaseengaged in the valueexpert discovery phase, which will close on March 31, 2024. The case is scheduled for a non-jury trial on September 16, 2024.
Based on information currently available and advice of our securities. As such,counsel, we have implemented a policydo not believe that prohibits our directors, officers, and other employees at or above the Vice President level from engaging in any speculative or hedging transactions or any other transactions that are designed to offset any decrease in the valueoutcome of our securities.
FRESHPET, INC. AND SUBSIDIARIES
NOTES TO CONSOLIDATED FINANCIAL STATEMENTS
(in thousands, except share data)
Note 10 – Warrants:
In connection with an agreement we entered into with operators of Freshpet Kitchens South during the third quarter of 2022 in exchange for services, we issued our partner warrants to purchase up to an aggregate of 194,000 shares of voting common stock of the Company at a purchase price of $0.01 per share. The Company determined these warrants are accounted for under FASB ASC 718 Stock Compensation. The warrants were recorded as a prepaid expense as the warrants were exercisable at the grant date. The prepaid expense will be amortized within Cost of Goods Sold as services are provided by the supplier. As of December 31, 2023, and 2022 there were $2,027 and $5,750 of warrants in prepaid expense, respectively and $0 and $1,438 of warrants in other assets, respectively.
During 2022, 194,000 warrants were both issued and exercised, respectively. The grant date fair value of warrants granted during 2022 was $50.32 per share.
Total amortization associated with partner warrants during 2023 and 2022 was $5,160 and $2,587, respectively.
Note 11 – Equity Incentive Plans and Equity:
Total compensation cost for share-based payments recognized in 2023,2022 and 2021 was approximately $19,774, $23,505 and $24,998, respectively. Cost of goods sold in 2023,2022 and 2021 included share-based compensation of approximately $5,833, $4,706 and $4,152, respectively. Selling, general, and administrative expense in 2023,2022 and 2021 included share-based compensation of approximately $13,941, $18,799 and $20,846, respectively.
The Company maintains the approved 2014 Omnibus Incentive Planunder which shares of common stock may be issued or used for reference purposes as awards granted under the 2014 Plan. These awards may be in the form of stock options, stock appreciation rights, restricted stock, as well as other stock-based and cash-based awards. As of December 31, 2023, the awards granted were either time-based (cliff vest over three years), performance-based (vest when performance targets are met, as defined in the stock option grant agreement), or restricted stock units (employee RSUs cliff vest over three years and non-employee director RSUs cliff vest over one year).
NASDAQ Marketplace Rules Inducement Award—During 2016, 500,000 service period stock options and 500,000 performance-based stock options were granted to the Company’s CEO as an inducement under the NASDAQ Marketplace Rules.
During 2022, as an inducement under the NASDAQ Marketplace Rules, and therefore outside of any Plan, 40,120 service period stock options and 22,381 restricted stock units were granted to the Company's CFO.
Under the terms of the applicable agreement, each grant is governed as if issued under the 2014 Omnibus Plan. The awards granted are time-based (cliff vest over four years or three years) and performance-based (vest when performance targets are met, as defined in the stock option grant agreement).
FRESHPET, INC. AND SUBSIDIARIES
NOTES TO CONSOLIDATED FINANCIAL STATEMENTS
(in thousands, except per share data)
Service Period Stock Options—A summary of service period stock options outstanding and changes under the plans during the year ended December 31, 2023 is presented below:
Options | Shares | Weighted Average Exercise Price | Average Remaining Contractual Term | Aggregate Intrinsic Value | ||||||||||||
Outstanding at December 31, 2022 | 1,291 | $ | 51.63 | |||||||||||||
Granted | 19 | 57.79 | ||||||||||||||
Exercised | (111 | ) | 69.77 | |||||||||||||
Forfeited | (36 | ) | 139.17 | |||||||||||||
Outstanding at December 31, 2023 | 1,163 | $ | 47.30 | 4.40 | $ | 58,718 | ||||||||||
Exercisable at December 31, 2023 | 1,016 | $ | 40.25 | 2.50 | $ | 57,641 | ||||||||||
Of the options exercisable at the end of December 31, 2023, 810 shares were in-the-money, which account for the entire aggregate intrinsic value.
As of December 31, 2023, there was $9,287 of total unrecognized compensation costs related to non-vested service period options, of which $8,667 will be incurred in 2024, and the remaining $620 will be incurred in 2025.
Performance Based Options—Performance based option vesting is contingent upon the Company achieving certain annual Net Sales or Adjusted EBITDA goals. A summary of performance-based stock options outstanding and changes under the plans in 2023 is presented below:
Options | Shares | Weighted Average Exercise Price | Average Remaining Contractual Term | Aggregate Intrinsic Value | ||||||||||||
Outstanding at December 31, 2022 | 1,925 | $ | 75.50 | |||||||||||||
Granted | 65 | 65.88 | ||||||||||||||
Exercised | (47 | ) | 67.95 | |||||||||||||
Outstanding at December 31, 2023 | 1,943 | $ | 75.36 | 5.2 | $ | 73,466 | ||||||||||
Exercisable at December 31, 2023 | 1,109 | $ | 22.88 | 3.3 | $ | 72,115 | ||||||||||
Of the options exercisable at the end of December 31, 2023, 1,059 shares were in-the-money, which account for the entire aggregate intrinsic value.
As of December 31, 2023, there was approximately $8,805 of total unrecognized compensation costs related to performance-based awards for which the achievement of the vesting criteria is considered probable, of which $7,255 will be incurred in 2024, $760 will be incurred in 2025, $730 will be incurred in 2026, and the remaining $60 will be incurred in 2027.
As of December 31, 2023, there were 423 unvested performance-based options outstanding that were deemed not probable, with an aggregate fair value of $30,965.
FRESHPET, INC. AND SUBSIDIARIES
NOTES TO CONSOLIDATED FINANCIAL STATEMENTS
(in thousands, except per share data)
Service Period Restricted Stock Units—The following table includes activity related to outstanding restricted stock units in 2023.
Shares | Weighted-Average Grant-Date Fair Value Per Unit | |||||||
Outstanding at December 31, 2022 | 278 | $ | 74.52 | |||||
Granted | 171 | 59.89 | ||||||
Exercised/Vested | (64 | ) | 80.14 | |||||
Forfeited | (13 | ) | 70.53 | |||||
Outstanding at December 31, 2023 | 372 | $ | 66.97 | |||||
As of December 31, 2023, there was approximately $14,395 of total unrecognized compensation costs related to restricted stock units, of which $7,224 will be incurred in 2024, $4,893 will be incurred in 2025, $2,241 will be incurred in 2026, and the remaining $37 will be incurred in 2027.
Performance Based Restricted Stock Units—The following table includes activity related to outstanding restricted stock units in 2023.
Shares | Weighted-Average Grant-Date Fair Value Per Unit | |||||||
Outstanding at December 31, 2022 | 176 | $ | 63.01 | |||||
Exercised/Vested | (2 | ) | 111.65 | |||||
Forfeited | (7 | ) | 71.77 | |||||
Outstanding at December 31, 2023 | 167 | $ | 62.11 | |||||
As of December 31, 2023, there was approximately $5,478 of total unrecognized compensation costs related to performance-based restricted stock units for which the achievement of the vesting criteria is considered probable, of which $2,743 will be incurred in 2024, and the remaining $2,735 will be incurred in 2025.
Grant Date Fair Value of Options—The weighted average grant date fair value of options (service period options and performance based options) granted during in 2023,2022 and 2021 were $35.81, $37.39 and $74.90 per share, respectively.
Expected Volatility—Expected volatility was based on the historical volatility of the Company’s common stock.
Weighted Average Expected Term—The Company determined the expected term based on the “shortcut method” described in FASB ASC 718, Compensation—Stock Compensation (an expected term based on the midpoint between the vesting date and the end of the contractual term).
Risk-Free Interest Rate—The risk-free interest rates are based on the U.S. Treasury yield for a period consistent with the expected term of the option in effect at the time of the grant.
FRESHPET, INC. AND SUBSIDIARIES
NOTES TO CONSOLIDATED FINANCIAL STATEMENTS
(in thousands, except per share data)
Expected Dividend Yield—The Company has not historically declared dividends, and no future dividends are expected to be available to benefit option holders. Accordingly, the Company used an expected dividend yield of zero in the valuation model.
Year Ended December 31, | |||||||||
2023 | 2022 | 2021 | |||||||
Weighted average exercise price of options granted | $ 64.05 | $ 67.02 | $ 155.00 | ||||||
Expected volatility | 51.8% | 52.5% | 50.4% | ||||||
Average expected terms in years | 6.4 | 6.5 | 6.1 | ||||||
Risk-free interest rate | 4.5% | 3.8% | 1.1% | ||||||
Expected dividend yield | 0.0% | 0.0% | 0.0% | ||||||
Note 12 – Net Loss Per Share Attributable to Common Stockholder:
Basic net income (loss) per share of common stock is calculated by dividing net income (loss) attributable to common stockholders by the weighted-average number of shares of common stock outstanding for the period. Diluted net income (loss) per share of common stock is computed by giving effect to all potentially dilutive securities. Diluted net loss per common share is the same as basic net loss per common share, due to the fact that potentially dilutive securities would have an antidilutive effect as the Company incurred a net loss in 2023,2022 and 2021.
In 2023,2022 and 2021, there were no reconciling items between net loss and net loss attributable to common stockholders.
The potentially dilutive securities excluded from the determination of diluted loss per share, as their effect is antidilutive, are as follows:
Twelve Months Ended December 31, | ||||||||||||
2023 | 2022 | 2021 | ||||||||||
Service Period Stock Options | 1,163 | 1,291 | 1,291 | |||||||||
Restricted Stock Units | 372 | 275 | 173 | |||||||||
Performance Stock Options | 1,109 | 1,107 | 972 | |||||||||
Convertible Notes | 5,776 | — | — | |||||||||
Total | 8,420 | 2,673 | 2,437 | |||||||||
Note 13 – Retirement Plan:
The Company sponsors a safe harbor 401(k) plan covering all employees. All employees are eligible to participate. Active participants in the plan may make contributions of up to 50% of their compensation, subject to certain limitations. Company contributions totaled approximately $3,109 in 2023, $2,297 in 2022 and $1,829 in 2021.
FRESHPET, INC. AND SUBSIDIARIES
NOTES TO CONSOLIDATED FINANCIAL STATEMENTS
(in thousands, except per share data)
Note 14 – Concentrations:
Concentration of Credit Risk—The Company maintains its cash balances in financial institutions that are insured by the Federal Deposit Insurance Corporation up to $250,000 each. At times, such balances may be in excess of the FDIC insurance limit.
Major Customers—In 2023, 2022 and 2021, net sales to one of our distributors accounted for 9%, 8% and 16% of our net sales, respectively. In 2023 and 2022 one customer accounted for more than 10% of our net sales, respectively, while in 2021, no customers accounted for 10% of our net sales. As of December 31, 2023, one distributor and two customers accounted for 15%, 21% and 13% respectively, of our accounts receivable. As of December 31, 2022, two distributors and two customers accounted for 15%, 6%, 26% and 11% respectively, of our accounts receivable. As of December 31, 2021, two distributors and two customers accounted for 20%, 10%, 14% and 13%, respectively, of our accounts receivable.
Major Suppliers—The Company purchased approximately 29% of its raw materials from one vendor during 2023, approximately 33% of its raw materials from one vendor during 2022, and approximately 21% of its raw materials from one vendor during 2021.
The Company purchased approximately 96% of its packaging material from five vendors during 2023, 91% of its packaging material from five vendors during 2022, and approximately 84% of its packaging material from five vendors during 2021.
Note 15 – Subsequent Events:
The Company evaluates events that have occurred after the balance sheet date but before the financial statements are issued for recognition or disclosures.
The Company did not identify any recognized or unrecognized subsequent events that have required adjustment or disclosure in the financial statements.
ITEM 9. — CHANGES IN AND DISAGREEMENTS WITH ACCOUNTANTS ON ACCOUNTING AND FINANCIAL DISCLOSURE
None.
ITEM 9A. CONTROL AND PROCEDURES
Evaluation of Disclosure Controls and Procedures
We do not believemaintain “disclosure controls and procedures,” as defined in Rules 13a-15(e) and 15d-15(e) under the Exchange Act, that are designed to ensure that information required to be disclosed by a company in the reports that it files or submits under the Exchange Act is recorded, processed, summarized and reported, within the time periods specified in the SEC’s rules and forms. Disclosure controls and procedures include, without limitation, controls and procedures designed to ensure that information required to be disclosed by a company in the reports that it files or submits under the Exchange Act is accumulated and communicated to the company’s management, including its principal executive and principal financial officers, as appropriate to allow timely decisions regarding required disclosure.
Our management, with the participation of our compensation plans, programs,Chief Executive Officer and our Chief Financial Officer, evaluated the effectiveness of our disclosure controls and procedures as of December 31, 2023. Based on the evaluation of our disclosure controls and procedures as of December 31, 2023, our Chief Executive Officer and Chief Financial Officer concluded that, as of such date, our disclosure controls and procedures were effective at the reasonable assurance level.
Management’s Report on Internal Control Over Financial Reporting
Our management is responsible for establishing and maintaining adequate internal control over financial reporting as defined in Rules 13a-15(f) and 15d-15(f) under the Exchange Act. The Company’s internal control over financial reporting is a process designed to provide reasonable assurance regarding the reliability of financial reporting and the preparation of the Company’s financial statements for external reporting purposes in accordance with generally accepted accounting principles.
Management assessed the effectiveness of the Company’s internal control over financial reporting as of December 31, 2023. In making this assessment, management used the criteria set forth by the Committee of Sponsoring Organizations of the Treadway Commission ("COSO") in its Internal Control-Integrated Framework (2013). This evaluation was carried out under the supervision and with the participation of our management, including our Chief Executive Officer and Chief Financial Officer. Based on this assessment, management concluded that as of December 31, 2023, the Company’s internal control over financial reporting was effective.
Our independent registered public accounting firm that audited the consolidated financial statements included in this annual report has issued an audit report on the effectiveness of our internal control over financial reporting, which is included within "Item 8. Financial Statements and Supplementary Data" under section "Report of Independent Registered Public Accounting Firm".
Changes in Internal Control over Financial Reporting
There were no changes in our internal control over financial reporting identified in management’s evaluation pursuant to Rules 13a-15(d) and 15d-15(d) of the Exchange Act during the period covered by this Annual Report on Form 10-K that materially affected, or arrangements create risks that are reasonably likely to have a material adverse effect on Freshpet.
Inherent Limitations on Effectiveness of Controls
Our management, including our Chief Executive Officer and Chief Financial Officer, believes that our disclosure controls and procedures and internal control over financial reporting are designed to provide reasonable assurance of achieving their objectives and are effective at the reasonable assurance level. However, our management does not expect that our disclosure controls and procedures or our internal control over financial reporting will prevent all errors and all fraud. A control system, no matter how well conceived and operated, can provide only reasonable, not absolute, assurance that the objectives of the control system are met. Further, the design of a control system must reflect the fact that there are resource constraints, and the benefits of controls must be considered relative to their costs. Because of the inherent limitations in all control systems, no evaluation of controls can provide absolute assurance that all control issues and instances of fraud, if any, have been detected. These inherent limitations include the realities that judgments in decision making can be faulty, and that breakdowns can occur because of a simple error or mistake. Additionally, controls can be circumvented by the individual acts of some persons, by collusion of two or more people or by management override of the controls. The design of any system of controls also is based in part upon certain assumptions about the likelihood of future events, and there can be no assurance that any design will succeed in achieving its stated goals under all potential future conditions; over time, controls may become inadequate because of changes in conditions, or the degree of compliance with policies or procedures may deteriorate. Because of the inherent limitations in a cost-effective control system, misstatements due to error or fraud may occur and not be detected.
Insider Trading Arrangements
Our directors and executive officers may from time to time enter into plans or other arrangement for the purchase or sale of our shares that are intended to satisfy the affirmative defense conditions of Rule 10b5–1(c) or may represent a non-Rule 10b5-1 trading arrangement under the Exchange Act.
During the fiscal quarter ended December 31, 2023,none of our directors or officers informed us of the adoption or termination of a "Rule 10b5-1 trading arrangement" or "non-Rule 10b5-1 trading arrangement," as those terms are defined in Regulation S-K, Item 408.
2022 Summary Compensation TableITEM 9C. DISCLOSURE REGARDING FOREIGN JURISDICTIONS THAT PREVENT INSPECTIONS
Name and Principal Position | Year | Salary ($)(1) | Stock Awards ($)(2) | Options Awards ($)(3) | Non-Equity Incentive Plan Compensation ($)(4) | All Other Compensation ($)(5) | Total ($) | ||||||||||||||||||
William B. Cyr(6) Chief Executive Officer | 2022 | 620,000 | — | — | 282,720 | 12,200 | 914,920 | ||||||||||||||||||
| 2021 | 600,000 | — | — | 153,440 | 11,600 | 765,040 | |||||||||||||||||||
| 2020 | 600,000 | — | 14,701,112 | 545,940 | 11,400 | 15,858,452 | |||||||||||||||||||
Scott Morris President and Chief Operating Officer | 2022 | 510,000 | — | — | 146,880 | 12,200 | 669,080 | ||||||||||||||||||
| 2021 | 490,000 | — | — | 80,556 | 11,600 | 582,156 | |||||||||||||||||||
| 2020 | 475,000 | — | 11,342,468 | 288,135 | 11,400 | 12,117,003 | |||||||||||||||||||
Todd Cunfer(7) Current Chief Financial Officer | 2022 | 41,667 | 1,500,000 | 1,500,000 | 12,230 | — | 3,053,897 | ||||||||||||||||||
Thembi Machaba Senior Vice President, Human Resources | 2022 | 340,000 | — | — | 65,280 | 2,448 | 407,728 | ||||||||||||||||||
Cathal Walsh Managing Director Europe | 2022 | 348,379 | 156,235 | — | 60,000 | — | 564,614 | ||||||||||||||||||
| 2021 | 429,231 | 149,977 | — | 35,275 | — | 614,483 | |||||||||||||||||||
| 2020 | 285,000 | — | 3,204,674 | 103,767 | — | 3,593,441 | |||||||||||||||||||
Heather Pomerantz(8) Former Chief Financial Officer | 2022 | 294,800 | — | — | 639,891 | 934,691 | |||||||||||||||||||
| 2021 | 425,000 | — | — | 58,225 | 10,921 | 494,146 | |||||||||||||||||||
| 2020 | 400,000 | — | 7,972,163 | 196,106 | 9,846 | 8,578,115 | |||||||||||||||||||
Richard Kassar(9) Interim Chief Financial Officer/Vice Chairman | 2022 | 80,000 | — | — | 19,358 | 152,000 | 251,358 | ||||||||||||||||||
| 2021 | 80,000 | — | — | 10,960 | 94,160 | 185,120 | |||||||||||||||||||
| 2020 | 282,000 | — | 166,656 | 80,880 | 11,400 | 540,936 | |||||||||||||||||||
Not applicable.
ITEM 10. DIRECTORS, EXECUTIVE OFFICERS AND CORPORATE GOVERNANCE
The following table sets forth certain information with respect to grants of plan-based awards to our NEOs during 2022. Please see “Annual Incentive Awards” in the CD&A above for additional information about the non-equity incentive plan awards reflected in the table below. Please see the “2022 Outstanding Equity Awards at Fiscal Year-End” table below for additional information about the vesting parameters that are applicable to equity awards reflected in the table immediately below.
Name | Award Type | Grant Date | Estimated Future Payouts Under Non-Equity Incentive Plan Awards | All Other Stock Awards: Number of Shares of Stock or Units (#) | All Other Option Awards: Number of Securities Underlying Options (#) | Exercise or Base Price of Option Awards ($/Sh) | Grant Date Fair Value of Stock and Option Awards ($) | ||||||||||||||||||||||||||
Threshold ($) | Target ($) | Maximum ($) | |||||||||||||||||||||||||||||||
| William B. Cyr | Annual Incentive | — | 235,600 | 589,000 | 1,472,500 | — | — | — | — | ||||||||||||||||||||||||
| Scott Morris | Annual Incentive | — | 122,400 | 306,000 | 765,000 | — | — | — | — | ||||||||||||||||||||||||
| Todd Cunfer | Annual Incentive | — | 10,192 | 25,479 | (1) | 63,698 | — | — | — | — | |||||||||||||||||||||||
| Inducement Grant (Options) | 12/1/2022 | — | — | — | — | 40,120 | 67.02 | 1,500,000 | |||||||||||||||||||||||||
| Inducement Grant (RSUs) | 12/1/2022 | — | — | — | 22,381 | — | — | 1,500,000 | |||||||||||||||||||||||||
| Thembeka Machaba | Annual Incentive | — | 54,400 | 136,000 | 340,000 | — | — | — | — | ||||||||||||||||||||||||
| Cathal Walsh | Annual Incentive | — | 50,000 | 125,000 | 312,500 | — | — | — | — | ||||||||||||||||||||||||
| RSU Grant under 2014 Plan | 3/14/2022 | — | — | — | 1,852 | (4) | — | — | 156,235 | (5) | |||||||||||||||||||||||
| Heather Pomerantz | Annual Incentive | — | 59,068 | 147,671 | (2) | 369,178 | — | — | — | — | |||||||||||||||||||||||
| Richard Kassar (Interim CFO) | Annual Incentive | — | 16,131 | 40,329 | (3) | 100,822 | — | — | — | — | |||||||||||||||||||||||
| Richard Kassar (Vice Chairman) | Annual Incentive | — | 24,000 | 60,000 | (3) | 150,000 | — | — | — | — | |||||||||||||||||||||||
Option Awards | Stock Awards | ||||||||||||||||||||||||||||||||||||
Name | Grant Date | Number of Securities Underlying Unexercised Options Exercisable (#) | Number of Securities Underlying Unexercised Options Unexercisable (#) | Equity Incentive Plan Awards: Number of Securities Underlying Unexercised Unearned Options (#) | Option Exercise Price ($) | Option Expiration Date | Number of Shares or Units of Stock That Have Not Vested (#) | Market Value of Shares or Units of Stock That Have Not Vested ($) | Equity Incentive Plan Awards: Number of Unearned Shares, Units or Other Rights that have Not Vested (#) | Equity Incentive Plan Awards: Market or Payout Value of Unearned Shares, Units or Other Rights That Have Not Vested ($) | |||||||||||||||||||||||||||
| William B. Cyr | 9/6/2016 | 1,000,000 | — | — | 10.23 | 9/6/2026 | — | — | — | — | |||||||||||||||||||||||||||
| 12/24/2020 | 27,344 | 41,016 | (1) | 205,079 | (2) | 142.79 | 12/24/2030 | — | — | — | — | ||||||||||||||||||||||||||
| Scott Morris | 9/27/2016 | 123,000 | — | — | 8.90 | 9/27/2026 | — | — | — | — | |||||||||||||||||||||||||||
| 4/3/2017 | 81,949 | — | — | 11.00 | 4/3/2027 | — | — | — | — | ||||||||||||||||||||||||||||
| 4/1/2020 | 7,808 | 2,603 | (3) | 2,604 | (4) | 63.87 | 4/1/2030 | — | — | — | — | ||||||||||||||||||||||||||
| 12/24/2020 | 20,508 | 30,762 | (1) | 153,809 | (2) | 142.79 | 12/24/2030 | — | — | — | — | ||||||||||||||||||||||||||
| Todd Cunfer | 12/1/2022 | — | 40,120 | (5) | — | 67.02 | 12/1/2032 | — | — | — | — | ||||||||||||||||||||||||||
| 12/1/2022 | — | — | — | — | — | 22,381 | (5) | 1,181,045 | (6) | — | — | ||||||||||||||||||||||||||
| Thembeka Machaba | 8/1/2020 | 3,333 | 1,667 | (5) | — | 96.05 | 8/1/2030 | — | — | — | — | ||||||||||||||||||||||||||
| 12/24/2020 | 10,936 | 16,408 | 82,031 | (2) | 142.79 | 12/24/2030 | — | — | — | — | |||||||||||||||||||||||||||
| Cathal Walsh | 5/10/2016 | 20,463 | — | — | 9.05 | 5/10/2026 | — | — | — | — | |||||||||||||||||||||||||||
| 4/3/2017 | 15,449 | — | — | 11.00 | 4/3/2027 | — | — | — | — | ||||||||||||||||||||||||||||
| 3/30/2018 | 16,092 | — | — | 16.45 | 3/30/2028 | — | — | — | — | ||||||||||||||||||||||||||||
| 4/1/2019 | 6,820 | — | — | 42.29 | 4/1/2029 | — | — | — | — | ||||||||||||||||||||||||||||
| 4/1/2020 | 3,287 | 1,645 | (3) | — | 63.87 | 4/1/2030 | — | — | — | — | |||||||||||||||||||||||||||
| 10/1/2020 | 23,330 | 11,670 | (7) | — | 111.65 | 10/1/2030 | — | — | — | — | |||||||||||||||||||||||||||
| 10/1/2020 | — | — | 20,000 | (8) | 111.65 | 10/1/2030 | — | — | — | — | |||||||||||||||||||||||||||
| 3/12/2021 | — | — | — | — | — | 638 | (9) | 33,667 | (6) | — | — | ||||||||||||||||||||||||||
| 3/14/2022 | — | — | — | — | — | 1,852 | (9) | 97,730 | (6) | — | — | ||||||||||||||||||||||||||
| Richard Kassar | 9/27/2016 | 79,800 | — | — | 8.90 | 9/27/2026 | — | — | — | — | |||||||||||||||||||||||||||
| 4/3/2017 | 18,940 | — | — | 11.00 | 4/3/2027 | — | — | — | — | ||||||||||||||||||||||||||||
| 3/30/2018 | 9,723 | — | 4,471 | (4) | 16.45 | 3/30/2028 | — | — | — | — | |||||||||||||||||||||||||||
| 4/1/2019 | 11,447 | — | — | 42.29 | 4/1/2029 | — | — | — | — | ||||||||||||||||||||||||||||
| 4/1/2020 | 5,478 | 1,371 | (3) | 1,371 | (4) | 63.87 | 2/1/2030 | — | — | — | — | ||||||||||||||||||||||||||
| 3/12/2021 | 552 | 1,105 | (3) | 1,658 | (4) | — | — | — | — | — | — | ||||||||||||||||||||||||||
| 3/14/2022 | — | — | — | — | — | 1,481 | (5) | 78,152 | (6) | — | — | ||||||||||||||||||||||||||
| Heather Pomerantz | 1/12/2020 | 10,000 | 5,000 | (3) | — | 60.70 | 1/12/2030 | — | — | — | — | ||||||||||||||||||||||||||
| 4/1/2020 | 4,930 | 1,645 | (3) | 3,289 | (4) | 63.87 | 4/1/2030 | — | — | — | — | ||||||||||||||||||||||||||
| 12/24/2020 | 13,672 | 20,508 | (1) | 102,539 | (2) | 142.79 | 12/24/2030 | — | — | — | — | ||||||||||||||||||||||||||
Name | Number of Shares Acquired on Vesting (#) | Value Realized on Vesting ($)(1) | ||||||
William B. Cyr | — | — | ||||||
Scott Morris | — | — | ||||||
Todd Cunfer | — | — | ||||||
Thembi Machaba | — | — | ||||||
Cathal Walsh | 318 | 29,170 | ||||||
Richard Kassar | — | — | ||||||
Heather Pomerantz | — | — | ||||||
Name | Cash ($) | COBRA ($) | Equity ($)(15) | Total ($) | ||||||||||||
William B. Cyr | ||||||||||||||||
| Termination due to permanent disability | — | 46,363 | (1) | — | (5) | 46,363 | ||||||||||
| Involuntary termination (13) | 2,720,250 | (2) | 46,363 | (1) | — | (5) | 2,766,613 | |||||||||
| Change in control | — | — | — | — | ||||||||||||
| Involuntary termination after change in control | 2,720,250 | (2) | 46,363 | (1) | — | (6) | 2,766,613 | |||||||||
Scott Morris | ||||||||||||||||
| Termination due to permanent disability | — | 30,908 | (3) | — | (7) | 30,908 | ||||||||||
| Involuntary termination (14) | 656,880 | (4) | 30,908 | (3) | — | (7) | 687,788 | |||||||||
| Change in control | — | — | — | — | ||||||||||||
| Involuntary termination after change in control | 656,880 | (4) | 30,908 | (3) | — | (8) | 687,788 | |||||||||
Heather Pomerantz | ||||||||||||||||
| Termination due to permanent disability | — | — | — | — | ||||||||||||
| Involuntary termination (13) | 392,421 | (11) | — | — | (9) | 392,421 | ||||||||||
| Change in control | — | — | — | (9) | — | |||||||||||
| Involuntary termination after change in control | — | — | — | (10) | — | |||||||||||
Todd Cunfer | ||||||||||||||||
| Termination due to permanent disability | — | 30,908 | (3) | — | 30,908 | |||||||||||
| Involuntary termination (13) | 512,230 | (4) | 30,908 | (3) | 580,839 | (12) | 1,123,977 | |||||||||
| Change in control | — | — | 580,839 | (12) | 580,839 | |||||||||||
| Involuntary termination after change in control | 512,230 | (4) | 30,908 | (3) | 580,839 | (12) | 1,123,977 | |||||||||
Cathal Walsh | ||||||||||||||||
| Termination due to permanent disability | — | --- | — | --- | ||||||||||||
| Involuntary termination (13) | 348,513 | (4) | --- | 82,004 | (14) | 430,518 | ||||||||||
| Change in control | — | — | 82,004 | (14) | 82,004 | |||||||||||
| Involuntary termination after change in control | 348,513 | (4) | --- | 82,004 | (14) | 430,518 | ||||||||||
Richard Kassar | ||||||||||||||||
| Termination due to permanent disability | — | — | --- | --- | ||||||||||||
| Involuntary termination (13) | — | — | 78,152 | (15) | 78,152 | |||||||||||
| Change in control | — | — | 78,152 | (15) | 78,152 | |||||||||||
| Involuntary termination after change in control | — | — | 78,152 | (15) | 78,152 | |||||||||||
Thembeka Machaba | ||||||||||||||||
| Termination due to permanent disability | — | — | — | — | ||||||||||||
| Involuntary termination (13) | — | — | — | (16) | — | |||||||||||
| Change in control | — | — | — | (16) | — | |||||||||||
| Involuntary termination after change in control | — | — | — | (16) | — | |||||||||||
The full Board approved director compensation for 2022, based on the recommendation of the Compensation Committee with assistance from KF, and in accordance with the Company’s non-employee director compensation program. For 2022, each non-employee member of the Board who served for the entire year receivedinformation required by this item will be filed (and is hereby incorporated by reference) by an annual cash retainer of $60,000, paid quarterly. In 2022, each Board member was also granted an award of restricted shares under our 2014 Plan, which vest on the first anniversary of the grant date, subjectamendment hereto or pursuant to continued service, with an upfront grant date value of $119,960 (or $169,985 for the Chair of the Board). In addition, certain directors who served as Chairs of Board committees received additional cash payments for 2022 as follows: $15,000 for the Chair of the Company’s Audit Committee and $7,500 each for the Chairs of the Compensation Committee and the Nominating, Governance and Sustainability Committee. Certain directors who served on multiple committees also received additional cash payments for 2022 of $5,000.
Name | Fees Earned or Paid in Cash ($) | Stock Awards ($)(1) | Total ($) | |||||||||
Charles A. Norris (2) | 60,000 | 169,985 | 229,985 | |||||||||
J. David Basto | 60,000 | 119,960 | 179,960 | |||||||||
Olu Beck (6) | 65,000 | 119,960 | 184,960 | |||||||||
Daryl G. Brewster (3) | 67,500 | 119,960 | 187,460 | |||||||||
Lawrence S. Coben | 60,000 | 119,960 | 179,960 | |||||||||
Walter N. George III (4) | 67,500 | 119,960 | 187,460 | |||||||||
Jacki S. Kelley | 60,000 | 119,960 | 179,960 | |||||||||
Leta D. Priest | 60,000 | 119,960 | 179,960 | |||||||||
Craig D. Steeneck (5) | 75,000 | 119,960 | 194,960 | |||||||||
Stock Ownership Guidelines for Non-Employee Directors
The following table shows information about the beneficial ownership of our common stock, as of April 24, 2022, by:
Name and Address of Beneficial Owner (1) | Amount and Nature of Beneficial Ownership | Percent of Common Stock Outstanding | ||||||
Principal Stockholders: | ||||||||
| The Vanguard Group, Inc. (2) | 4,423,502 | 9.2 | % | |||||
| JANA Partners LLC (3) | 4,145,087 | 8.6 | % | |||||
| Wasatch Advisors LP (4) | 3,353,636 | 7.0 | % | |||||
| FMR LLC (5) | 2,660,064 | 5.5 | % | |||||
| Wellington Management Group LLP (6) | 2,443,050 | 5.1 | % | |||||
Named Executive Officers and Directors: | ||||||||
| William B. Cyr (7) | 1,104,695 | 2.3 | % | |||||
| Charles A. Norris (8) | 597,869 | 1.2 | % | |||||
| J. David Basto | 35,147 | * | ||||||
| Olu Beck | 6,483 | * | ||||||
| Daryl G. Brewster | 54,761 | * | ||||||
| Lawrence S. Coben | 51,738 | * | ||||||
| Walter N. George III | 46,176 | * | ||||||
| Jacki S. Kelley | 8,566 | * | ||||||
| Craig D. Steeneck | 29,384 | * | ||||||
| Leta D. Priest | 9,640 | * | ||||||
| Todd E. Cunfer | 11,007 | * | ||||||
| Scott Morris (9) | 355,645 | * | ||||||
| Cathal Walsh | 91,502 | * | ||||||
| Thembeka Machaba | 14,269 | * | ||||||
| Richard Kassar | 41,246 | * | ||||||
| Heather Pomerantz | 6,000 | * | ||||||
Executive Officers and Directors as a Group (14 persons) (10) | 2,464,128 | 5.1 | % | |||||
Plan Category | Number of Securities to be Issued Upon Exercise of Outstanding Options, Warrants, and Rights (#) (a) | Weighted-Average Exercise Price of Outstanding Options, Warrants, and Rights ($) (b)(1) | Number of Securities Remaining Available for Future Issuance Under Equity Compensation Plans (Excluding Securities Reflected in Column (a)) (#) (c) | |||||||||
| Equity Compensation Plans Approved by Security Holders | 2,593,468 | (2) | — | 383,883 | ||||||||
| Equity Compensation Plans Not Approved by Security Holders | 1,077,501 | (3) | 14.23 | — | ||||||||
| Total | 3,670,969 | 383,883 | ||||||||||
ITEM13. CERTAIN RELATIONSHIPS AND RELATED TRANSACTIONS, AND DIRECTOR INDEPENDENCE
The information required by this item will be filed (and is hereby incorporated by reference) by an amendment hereto or pursuant to a definitive proxy statement pursuant to Regulation 14A that require reporting under SEC rules. Our Board of Directors has adopted a written related party transaction policy, which sets forth the policies and procedures for the review and approval or ratification of related party transactions. This policy is administrated by our Audit Committee. These policies provide that, in determining whether or not to recommend the initial approval or ratification of a related party transaction, the relevant facts and circumstances available shall be considered, including, among other factors it deems appropriate, whether the interested transaction is on terms no less favorable than terms generally available to an unaffiliated third party under the same or similar circumstances and the extent of the related party’s interest in the transaction.
DIRECTOR INDEPENDENCE
Our independent registered public accounting firm is KPMG LLP, Short Hills, New Jersey,NJ, Auditor ID: 185
The following table presents fees for professional services renderedinformation required by our current independent registered public accounting firm, KPMG, for the fiscal years ended December 31, 2022 and 2021.
| 2022 | 2021 | |||||||
| Audit Fees (1) | $ | 1,759,000 | $ | 1,085,000 | ||||
| Audit-Related Fees | — | — | ||||||
| Tax Fees | — | — | ||||||
| All Other Fees (2) | 1,900 | 1,900 | ||||||
| Total | $ | 1,760,900 | $ | 1,086,900 | ||||
The following documents are filed as a part of this report:
(1) Financial Statements – See Index to the Consolidated Financial Statements appearing on page 47.
(2) Financial Statement Schedules – None.
(3) Exhibits – The exhibits listed on the accompanying Exhibit Index are furnished, filed or incorporated by reference as part of this report.
None.
EXHIBIT INDEX
Exhibit No. | Description | |
3.1 | ||
3.2 | ||
4.1 | ||
4.2 | ||
| 4.3 | Form of certificate representing the 3.00% Convertible Senior Notes due 2028 (included as Exhibit A to the Indenture, dated as of March 20, 2023, between Freshpet, Inc. and U.S. Bank Trust Company, National Association, as trustee (incorporated by reference to Exhibit 4.2 to the Company's Current Report on Form 8-K filed with the SEC on March 23, 2023) | |
| | ||
| 10.1+ | Freshpet, Inc. Second Amended and Restated 2014 Omnibus Incentive Plan (incorporated by reference to Exhibit 99.1 to the Company's Registration Statement on Form S-8, filed with the SEC on October 7, 2020) | |
| 10.2+ | ||
10.3+ | ||
10.4+ | ||
10.5+ | ||
10.6+ | ||
10.7+ | ||
10.8+ | ||
10.9+ | ||
| 10.10*+ | ||
| 10.11+ | ||
| 10.12+ | ||
| 10.13+ | ||
| 10.14+ | ||
| 10.15+ | ||
| 10.16+ | ||
SIGNATURES
Pursuant to the requirements of Section 13 or 15(d) of the Securities Exchange Act of 1934, the registrant has duly caused this report to be signed on its behalf by the undersigned, thereunto duly authorized on May 1, 2023.
FRESHPET, INC.
By: /s/ Todd Cunfer
Name: Todd Cunfer
Title: Chief Financial Officer
* * * *
Power of Attorney
Each person whose signature appears below constitutes and appoints Todd Cunfer as his or her true and lawful attorney-in-fact and agent, with full power of substitution and resubstitution, for him or her and in his or her name, place and stead, in any and all capacities, to sign any and all amendments to this Annual Report on Form 10-K, and to file the same, with all exhibits thereto, and other documents in connection therewith, with the Securities and Exchange Commission, granting unto said attorney-in-fact and agent full power and authority to do and perform each and every act and thing requisite and necessary to be done in connection therewith, as fully to all intents and purposes as he or she might or could do in person, hereby ratifying and confirming all that said attorney-in-fact and agent or his substitute or substitutes may lawfully do or cause to be done by virtue hereof.
Pursuant to the requirements of the Securities Exchange Act of 1934, this report has been signed below by the following persons on behalf of the registrant and in the capacities indicated on February 26, 2024.
Signature | Title | |||
/s/ | Chief Executive Officer and Director | |||
/s/ Todd Cunfer | Chief Financial Officer | |||
/s/ Olu Beck | Director | |||
/s/ David Biegger | Director | |||
/s/ Daryl G. Brewster | Director | |||
/s/ Lawrence S. Coben | Director | |||
/s/ Walter N. George III | Director |
Signature | Title | |
| /s/ Jacki S. Kelley Jacki S. Kelley | Director | |
| /s/ Timothy McLevish Timothy McLevish | Director | |
/s/ Leta D. Priest | Director | |
/s/ Joseph Scalzo Joseph Scalzo | Director | |
/s/ Craig D. Steeneck Craig D. Steeneck | Director | |
/s/ David J. West David J. West | Director |