Customer Contracts – Virtual Sports
Our contracts in the Virtual Sports segment typically involve the supply of licenses to operators to make available, either via online or retail channels, virtual sporting events such as darts, cricket, or basketball, and to enable end-users to place bets on these events. These are typically one-time non-exclusive licenses specific to the virtual sporting event. We may agree to customize and brand the virtual sporting events for the operator or to provide language variations of the event. The contracts may be terminated early in various circumstances, including, for example, if the operator fails to pay an invoice within 60 days of receipt.
Our Virtual Sports products are typically offered to operators on a participation basis, whereby we receive a portion of the gaming revenues generated, plus an upfront software license fee. With our participation-driven business model, our Virtual Sports segment produces approximately 99% of total revenue on a recurring basis under long-term contracts that average four years when entered into and we have historically had a 100% renewal rate over the last three years for contracts that expired.
Customer Contracts – Interactive
Our contracts in the Interactive segment vary but generally involve the provision of a limited, non-exclusive, non-transferable, revocable license to operators to display certain slot and casino content on which online bets are placed or to make our games available for play by end-users of an operator’s online gaming business operations. The contracts may be terminated early in various circumstances, including material breach or inability to operate due to a change in regulatory status.
Our Interactive products are typically offered to operators on a participation basis, whereby we receive a percentage of total amount of stakes wagered or a percentage of net gaming revenue. With our participation-driven business model, approximately 100% of revenue for our Interactive segment is recurring in nature and derived under long-term contracts that averaged three years from when we entered into these contracts. Over the last three years, we have renewed approximately 100% of these contracts for those customers that have continued to trade.
Customer Contracts – Leisure
Our contracts in the Leisure segment vary but generally involve (i) agreement whereby the operator or proprietor of certain leisure resorts contributes premises and we provide, on an exclusive basis, gaming and amusement terminals as well as gaming software and games for the machines provided, (ii) contracts to supply gaming terminals as well as gaming software and games for the terminals provided to leisure operators on a non-exclusive basis, and (iii) rental agreements, which we enter into with certain motorway services providers, whereby we rent unit space in motorway service areas and populate this space with our gaming terminals.
Depending on the contract type, we have general obligations to deliver, install, upgrade and service the terminals and software provided, to acquire licensing for the various prizes and toys, which may be used in the terminals, to keep the premises open for minimum operating hours and not to use the premises for certain business. These contracts may be terminated early in various circumstances, including for material breach or insolvency events.
Under our leisure contracts, we typically generate revenue on a participation-basis by participating, typically as a function of gross revenue from each terminal, in a percentage of volumes generated by these terminals. With our participation-driven or fixed weekly fee business model, approximately 100% of service revenue for our Leisure segment is recurring in nature and derived under long-term contracts that are usually between three and five years. Since the NTG Acquisition, within the Leisure segment we have successfully renewed or extended the significant majority of major contracts that have expired.
Operations and Employees
Our operations include game production, platform and hardware design, production, testing, and distribution; the maintenance, management, and extension of our centralized network for product distribution and product monitoring; the delivery and, in certain circumstances, maintenance of SBG terminals; gaming machine engineering, assembly, repair and storage; parts supply; change and release management; remote operational services; problem management; business development; market account management; and general administration and management, including Finance, Legal, People (Human Resources), Investor Relations, Marketing and Communications, Quality, Compliance and Information Security.
| 14 |
As atof December 31, 2019,2022, we had approximately 1,700 full time employees.1,600 employees, approximately 1,500 of which were full-time. Of those employees, over 600 were dedicated to delivering our digital gaming platforms, content and manufacturing. Approximately 10085 of our employees were assigned to the ongoing operation of our network, through which we supply and maintain our products. Approximately 750600 of our employees were involved in UK field operations. Our management, sales and administration teams accounted for approximately 250200 employees. We have been in the process of consolidating a number of offices and functions as part of our integration project which will result in an overall reduction in employees.
Intellectual Property
Our intellectual property consists principally of the propriety software we develop to operate our network and in the design and distribution of our games. We depend upon agreements relating to trade secrets and proprietary know-how to protect our rights in this intellectual property. We require all our employees, contractors and other collaborators to enter into agreements that prohibit the disclosure of our confidential information to other parties. In addition, it is our policy to require our employees, contractors and other collaborators who have access to proprietary and trade secret material to enter into agreements that require them to assign any and all intellectual property rights to us that arise as a result of their work on our behalf. We also require our employees to review and acknowledge our trade secretintellectual property policies regarding how we handle trade secrets.intellectual property. These agreements, acknowledgements and policies may not provide adequate protection for our trade secrets, know-how or other proprietary information in the event of any unauthorized use or disclosure in violation of these agreements, and may not be sufficient to secure for us the value in such developments that they are designed to secure.
We also hold certain patents, trademarks, design rights and other intellectual property rights in respect of our products, systems, web domains, and other intellectual property. We also rely on certain products and technologies that we license from third parties. Proprietary licenses typically limit our use of intellectual property to specific uses and for specific time periods.
CompetitionThe terms of our intellectual property registrations vary based on the type of registration and the date and jurisdiction of filing or grant. European and U.K trademark registration lasts for 10 years but can be renewed indefinitely. European and U.K design registration lasts for five years but it can be renewed four times (giving a maximum total of 25 years of protection). European and U.K patents can only be renewed for up to 20 years. U.S. design patents expire 15 years from the date of grant, and the term of utility patents generally expires 20 years from the date of filing of the first non-provisional patent application in a family of patents. The actual protection afforded by a patent depends upon the type of patent, the scope of its coverage and the availability of legal remedies in the applicable country.
Competition
We operate in a highly competitive industry, and in highly competitive business segments. We face competition from a number of worldwide businesses, many of which have substantially greater financial resources and operating scale than we do. Such competition could adversely affect our ability to win new contracts and sales and renew existing contracts. We operate in a period of intense price-based competition in some key sectors, which could affect the profitability of the contracts and sales we do win. In certain sectors, our businesses also face competition from suppliers, operators or licensees who offer products for internet gaming in illegal or unregulated sectors, but are still able or permitted to supply products and compete with us in regulated sectors. These competitors often have substantially greater financial resources and operating scale than we do. Some larger competitors hold long term contracts which control access points for some of our products and this may mean we must contract with those competitors rather than directly with the customer to provide our products. Our principal competitors include, among others, certain businesses that have vertically integrated gaming machine and retail betting operations and businesses that operate in both regulated and unregulated sectors and thereby effectively subsidize their regulated operations with unregulated operations.
Seasonality
Our revenues are subject to a number of variations. Equipment sales and software license revenues usually reflect a limited number of large transactions, which may not recur on an annual basis. Consequently, revenues and operating results can vary substantially from period to period as a result of the timing of equipment sales and software licensing. In addition, revenues may vary depending on the timing of contract awards and renewals, changes in customer budgets and general economic conditions. However, our revenues are not subject to regular seasonal variations of the sort often related to seasonal consumer behavior, except that income from the Acquired Businesses is generally strongest in the spring and summer and predominantly in Leisure Parks, in Italy and Greece we experience reductions in revenue in the summer and in the UK, Italy and Greece we experience increases in revenue around customers’ pay dates.
Corporate Information
We maintain a website at www.inseinc.com. Our annual report on Form 10-K, quarterly reports on Form 10-Q, current reports on Form 8-K and any amendments to those reports filed or furnished pursuant to Section 13(a) of the Exchange Act are available free of charge through the Investors link on our website as soon as reasonably practical after they are electronically filed with or furnished to the SEC. Also available on our website are our Code of Ethics, as well as the charters of the audit, compensation and nominating and corporate governance committees of the Board of Directors. Information on our website is not incorporated into this report.
10
| 15 |
Our business is subject to a high degree of risk. You should carefully read and assess our discussion of the risk factors facing our business, below. Any of these risks could materially and adversely affect our business, operating results, financial condition and prospects, and cause the value of our common stock to decline, which could cause investors in our common stock to lose all or part of their investments.
Summary of Risk Factors
Our business is subject to a number of risks, including risks that may prevent us from achieving our business objectives or may adversely affect our business, financial condition, results of operations, cash flows, and prospects. These risks are discussed more fully below and include, but are not limited to, risks related to the following:
| ● | We rely on a relatively small number of customers for a significant portion of our sales, and the loss of, or material reduction in, sales to any of our top customers could have an adverse effect on our business, results of operations, financial condition and prospects. | |
| ● | We are dependent on our relationships with key suppliers to obtain equipment and other supplies for our business on acceptable terms. | |
| ● | The UK Government’s impending review of the Gambling Act, together with other rules that may be considered in the UK in response to recent consultations, could have a material negative impact on our business. | |
| ● | Data privacy and security laws and regulations in the jurisdictions in which we do business could increase the cost of our operations and subject us to possible sanctions and other penalties. | |
| ● | Our results of operations fluctuate due to seasonality and other factors and, therefore, our periodic operating results are not guarantees of future performance. | |
| ● | Our industry is subject to strict government regulations that could limit our existing operations and have a negative impact on our ability to grow. | |
| ● | Our industry is subject to regulations that set parameters for levels of gaming or wagering duty, tax, stake, prize and return to player. | |
| ● | We may be adversely affected by disruptions to our transaction gaming and lottery systems, as well as disruptions to our internal enterprise and information technology systems. | |
| ● | Our directors and key personnel are subject to the approval of certain regulatory authorities, which, if withheld, would require us to sever our relationship with non-approved individuals, which could adversely impact our operations. | |
| ● | Licensing and gaming authorities have significant control over our operations and ownership and could cause us to redeem certain stockholders on potentially disadvantageous terms. | |
| ● | Certain of our executive officers and directors are affiliated with entities engaged in business activities similar to those conducted by us (or may enter into similar business activities in the future) and, accordingly, may have conflicts of interest in determining whether a particular business opportunity should be presented to us or to another entity. | |
| ● | We have operations in a variety of countries, which subjects us to additional risks. | |
| ● | We may have future capital needs and may not be able to obtain additional financing on acceptable terms. | |
| ● | Because tax laws and regulations are subject to interpretation and uncertainty, tax payments may ultimately differ from amounts currently recorded by the Company. |
| 16 |
| ● | We may be unable to develop sufficient new products and product lines and integrate them into our existing business, which may adversely affect our ability to compete; our expansion into new sectors may present competitive and regulatory challenges that differ from current ones. |
| ● | We may be required to recognize impairment charges related to goodwill, identified intangible assets and property and equipment or to take write-downs or write-offs, restructuring or other charges that could have a significant negative effect on our financial condition, results of operations and stock price, which could have an adverse effect on your investment. |
| ● | Volatility or disruption in the financial markets could materially adversely affect our business and the trading price of our common stock. |
| ● | Global economic conditions could have an adverse effect on our business, operating results and financial condition. |
| ● | We face risks and uncertainty arising from the United Kingdom’s withdrawal from the European Union. |
Risks Relating to Our Business and Industry
The ongoing coronavirus (COVID-19) pandemic is adversely affecting
Disruption of our business.supply chain or distribution capabilities have an adverse effect on our business, financial condition, and results of operations.
Our business has been and will be affected by the rapidly expanding coronavirus (COVID-19) pandemic. Our ability to offer land-based gaming generally has been affected by the closure, for an indeterminate periodmanufacture and ship machines is critical to our success. We are subject to damage or disruption to supplies of time, of all venues that offer gaming in the jurisdictions in which we operate (including, but not limitedparts or our manufacturing or distribution capabilities (in particular, to the UK, Greece and Italy, from which we derive a substantial portionextent that our parts are sourced globally) due to weather, including any potential effects of our income). In addition, the economic impact of theclimate change, natural disaster, fire, terrorism, adverse changes in political conditions or political unrest, pandemic, may resultstrikes, labor shortages, freight transportation availability, disruption in the permanent closure of certain venues and/logistics, import restrictions, or a decrease in the willingness or ability of consumers to engage in gambling activities, both during and possibly after the pandemic The pandemic may also adversely affect a broad range of our operations, includingother factors that impair our ability to obtainmanufacture or sell our machines. Failure to take adequate steps to mitigate the likelihood or potential impact of such events, or to effectively manage such events if they occur, adversely affect our business, financial condition, and ship our products, our ability to continue to develop new products and servicesresults of operations, as well as require additional resources to restore our supply chain.
Our results of operations could be adversely affected by labor shortages, turnover, and labor cost increases.
Inflationary pressures, shortages in the abilitylabor market, and increased competition within and outside our industry for talented employees have increased our labor costs, which could negatively impact our profitability. Labor shortages or lack of skilled labor have led to increases in costs to meet demand as we roll out incremental programs to attract and retain talent. Labor shortages may also negatively impact us from servicing all demand that exists for our customers to pay outstanding amountsproducts or operating our service operations and manufacturing facilities efficiently. Further, we distribute our machines and receive parts through the freight transportation market, and reduced trucking capacity due to us. The emergency measures with respectshortages of drivers has led to employment announced by the governments in the UKincreased costs and Italy (where the Company has employees) are being followed by the Company but there is a risk that the measures may take longer to implement by the government than the Company anticipates and there is a possibility that the further detail with respect to those emergency measures to be announced is contrary to assumptions made by the Company. Moreover, the emergency measures may not provide any significant measure of support for the Company.
As a result of office closures relating to the COVID-19 outbreak, together with other unusual factors, we identified a material weakness in connection with the preparation of our financial statements. Despite the implementation of enhanced controls going forward, there can be no assurance that we do not experience a similar incident in the future if we stay on government ordered lockdown with furloughed staffs.
During March 2020, we closed our officesreduced service levels due to the COVID-19 outbreak. As a result, our employees have been working remotely since such time and we anticipate that they will continue to do so until the COVID-19 outbreak subsides. As described In Item 9A herein, we have identified a material weakness in our financial control system that arose in connection with the preparationlack of our year-end financial statements and the related review processes, associated with such office closures and other unusual factors. Despite the implementation of enhanced controls going forward, there can be no assurance that we do not experience a similar incident in the future if we stay on government ordered lockdown with furloughed staffs.freight transportation availability.
We operate in a highly competitive industry and our success depends upon our ability to effectively compete with numerous worldwide businesses.
We face competition from a number of businesses, including worldwide businesses, many of which have substantially greater financial resources and operating scale than we do. Such competition could adversely affect our ability to win new contracts and sales and renew existing contracts. We operate in a period of intense price-based competition in some key sectors, which could affect the profitability of the contracts and sales we do win.
In certain sectors, our businesses also face competition from suppliers, operators or licensees who offer products for internet gaming in illegal or unregulated sectors, but are still able or permitted to supply products and compete with us in regulated sectors. These competitors often have substantially greater financial resources and operating scale than we do.
If we cannot successfully compete in our industry and business segments, our business, results, financial condition and prospects could suffer.
| 17 |
We are heavily dependent on our ability to renew our long-term contracts with our customers and we could lose substantial revenue if we are unable to renew certain of these contracts.
Generally, customer contracts in our Gaming, Virtual Sports contractsand Interactive business segments are for initial terms of three to five years, but longer in certain territories, with renewals at the customer’s option. Generally, our SBG terminalcustomer contracts within the Acquired BusinessesLeisure business segment are for terms of four to six years (although in certain cases they are longer), but certain customers have options for early termination under certain circumstances or to reduce machines volumes in certain circumstances, and we may face pressure to renew or upgrade terminals during the lives of these contracts, which could adversely affect revenues or our return on capital and leave us with surplus terminals. At any given time, we have multiple substantial customer contracts that have years to run and others that may be nearing expiration or renewal, which we may lose if we cannot compete effectively to retain their business.
There can be no assurance that current contracts will be extended or that we will be awarded contract extensions or new contracts as a result of competitive bidding processes or otherwise. The termination, expiration or failure to renew one or more of our contracts could cause us to lose substantial revenue.
Changes in applicable gambling regulations or taxation regimes may affect the revenues or profits generated by the contracts we enter into with our customers. Many of the contracts we have with our customers are on revenue-sharing (net of gaming taxes) terms, and therefore changes which adversely affect our customers may also adversely affect us. In addition, any such changes may cause our customers to seek to renegotiate their contracts, may alter the terms on which such customers are prepared to renew their contracts and may affect their ability or willingness to renew their contracts.
We rely on a relatively small number of customers for a significant portion of our sales, and the loss of, or material reduction in, sales to any of our top customers could have an adverse effect on our business, results of operations, financial condition and prospects.
Certain key customers, including certain UK, Italian and Greek SBGgaming terminal customers and certain Virtual Sports customers, make a significant contribution to our revenues and profitability. Our top ten customers generated approximately 60%56% of total revenues and one customer generated more than 10% of total revenues in the year ended December 31, 2019. During the year ended December 31, 2019, two customers represented at least 10% of revenues, accounting for 14% and 13% of the Company’s revenues’2022. We expect that these customers will continue to represent a significant portion of our sales in the future. However, the loss of any of our top customers, whether through contract expiry and non-renewal, breach of contract or other adverse factors could materially adversely affect our revenues or return on capital and leave us with surplus terminals. Moreover, if any of these customers experience reduced revenue, such reduction could adversely affect any revenue-sharing arrangements we have with those customers, reduce our own revenues and adversely affect our financial results.
11
We are dependent on our relationships with key suppliers to obtain equipment and other supplies for our business on acceptable terms.
We have achieved significant cost savings through our centralization of equipment and non-equipment purchases. However, as a result, we are exposed to the credit and other risks of a group of key suppliers. While we make every effort to evaluate our counterparties prior to entering into long-term and other significant procurement contracts, we cannot predict the impact on our suppliers of the current economic environment and other developments in their respective businesses. Insolvency, financial difficulties, supply chain delays or other factors may result in our suppliers not being able to fulfill the terms of their agreements with us. Further, such factors may render suppliers unwilling to extend contracts that provide favorable terms to us, or may force them to seek to renegotiate existing contracts with us. In addition, our business has signed a number of significant contracts whose performance depends upon third party suppliers delivering equipment on schedule for us to meet its contract commitments. Failure of the suppliers to meet their delivery commitments could result in us being in breach of and subsequently losing those contracts. Although we believe we have alternative sources of supply for the equipment and other supplies used in our business, concentration in the number of our suppliers could lead to delays in the delivery of products or components, and possible resultant breaches of contracts that we have entered into with our customers; increases in the prices we must pay for products or components; problems with product quality or components coming to the end of their life; and other concerns.
| 18 |
Our ability to bid on new contracts may be dependent upon our ability to fund any required up-front capital expenditures through our cash from operations, the incurrence of indebtedness or the raising of additional equity capital.
Our SBGGaming and Leisure terminal contracts in the UK, Italy and Greece and terminal contracts within the Acquired Businesses often require significant up-front capital expenditures for terminal assembly, software customization and implementation, systems and equipment installation and telecommunications configuration. Historically, we have funded these up-front costs through cash flows generated from operations and external borrowings. Our ability to continue to procure new contracts, including in new jurisdictions, will depend upon, among other things, our liquidity levels at the time or our ability to obtain additional debt or equity funding at commercially acceptable terms to finance the initial up-front costs. If we do not have adequate liquidity or are unable to obtain other funding for these up-front costs on favorable terms or at all, we may not be able to bid on certain contracts, which could restrict our ability to grow and have an adverse effect on our ability to retain existing contracts and therefore on future profitability. Certain contracts within the Acquired BusinessesLeisure business segment also require injections of capital expenditure during the term for new or replacement hardware.
12
The UK Government’s reductionimpending review of maximum permitted bets to £2 on B2 Gaming Machines from April 2019, along with other recent UK gambling rules, has had, and,the Gambling Act, together with potential new legislation andother rules that may be considered in the UK in response to recent consultations, could have a material negative impact on our business.
Effective asIn December 2020, DCMS announced that it is reviewing the Gambling Act, the consultation period for which closed on March 31, 2021 with the objective of April 1, 2019,(i) examining whether changes are needed to the maximum stakes limit at fixed-odds betting terminals was required to be reduced from £100 to £2. As a result of this change, a number of LBO operators commenced a rationalization of their retail operations, which among other measures has included closure of certain LBO shops. The rationalization is likely to continue for the foreseeable future, and to have a negative impact on our business.
In January 2020, the U.K. Gambling Commission announced (i) a ban, which will come into effect on April 14, 2020, on the abilitysystem of gambling businesses to allow consumersregulation in Great Britain to use credit cardsreflect changes to gamble in allthe gambling landscape since 2005, particularly due to technological advances (ii) ensuring there is an appropriate balance between consumer freedoms and choice on the one hand, and prevention of harm to vulnerable groups and wider communities on the other and (iii) making sure customers are suitably protected whenever and wherever they are gambling, and that there is an equitable approach to the regulation of the online and offline gambling products, with the exceptionland based industries. There have a been a number of non-remote lotteries,similar consultations launched, including a DCMS consultation in relation to fees which closed on March 25, 2021 and (ii) changes to license conditions which will require all online gambling operators to participate in a multi-operator self-exclusion scheme, GAMSTOP, which will allow consumers to self-exclude from multiple online operators with one request. These license condition changes will be effective March 31, 2020. We will continue to assess the impact of these matters on our UK business. Furthermore, the U.K Gambling Commission has announced that it intendsconsultation in relation to review the UK Gambling Act.Remote Customer Interaction which closed on February 9, 2021. The timing of such review and the potential outcomes of such reviewreviews are not currently known but new legislation or regulations could adversely affect our business. A recent example of legislative change implemented by the UK Government which adversely affected our business was the reduction of maximum permitted bets from £100 to £2 on B2 Gaming Machines which became effective as of April 1, 2019. As a result of this change, a number of land-based operators commenced a rationalization of their retail operations, which among other measures led to the closure of certain land-based operator shops.
Our business depends on our ability to prevent or mitigate the effects of a cybersecurity attack.
Our information technology may be subject to cyber-attacks, security breaches or computer hacking, including a widespread ransomware attack encrypting corporate IT equipment, a directed motivated attack against us or a data breach or cyber incident happening to a third-party network and affecting us. Regardless of our efforts, there may still be a breach and the costs to eliminate, mitigate or address the aforementioned threats and vulnerabilities before or after a cyber incident could be significant. Any such breaches or attacks could result in interruptions, delays or cessation of service, and loss of existing or potential suppliers or customers. In addition, breaches of our security measures and the unauthorized dissemination of sensitive personal, proprietary or confidential information about the Company, our business partners or other third parties could expose us to significant potential liability and reputational harm. We could also be negatively impacted by existing and proposed laws and regulations, and government policies and practices related to cybersecurity, data privacy, data localization and data protection. The risk of cyber attacks may also increase owing to the current war in Ukraine.
Our business depends upon the protection of our intellectual property and proprietary information.
We believe that our success depends, in part, on protecting our intellectual property in the UK and in other countries. Our intellectual property includes certain trademarks relating to our systems, as well as certain patents and proprietary or confidential information that is not subject to patent or similar protection. Our intellectual property protects the integrity of our games, systems, products and services, which is a core value of the industries in which we operate. Protecting our intellectual property can be expensive and time-consuming, may not always be successful depending on local laws or other circumstances, and we also may choose not to pursue registrations in certain countries. Competitors may independently develop similar or superior products, software, systems or business models. In cases where our intellectual property is not protected by an enforceable patent, or other intellectual property protection, such independent development may result in a significant diminution in the value of itsour intellectual property.
There can be no assurance that we will be able to protect our intellectual property. We enter into confidentiality or license agreements with our employees, vendors, consultants and, to the extent legally permissible, our customers, and generally control access to, and the distribution of, our game designs, systems and other software documentation and other proprietary information, as well as the designs, systems and other software documentation and other information we license from others. Despite our effort to protect these proprietary rights, parties may try to copy our gaming products, business models or systems, use certain of our confidential information to develop competing products, or independently develop or otherwise obtain and use our gaming products or technology, any of which could have an adverse effect on our business. Policing unauthorized use of our technology is difficult and expensive, particularly because of the global nature of our operations. The laws of some countries may not adequately protect our intellectual property.
There can be no assurance that our business activities, games, products and systems will not infringe upon, misappropriate of otherwise violate the proprietary rights of others, or that other parties will not assert infringement or misappropriation claims against us. Any such claim and any resulting litigation, should it occur, could subject us to significant liability for costs and damages and could result in invalidation of our proprietary rights, distract management, and/or require us to enter into costly and burdensome royalty and licensing agreements. Such royalty and licensing agreements, if required, may not be available on terms acceptable to us, or may not be available at all. In the future, we may also need to file lawsuits to defend the validity of our intellectual property rights and trade secrets, or to determine the validity and scope of the proprietary rights of others. Such litigation, whether successful or unsuccessful, could result in substantial costs and diversion of resources.
We also rely on certain products and technologies that we license from third parties. Proprietary licenses typically limit our use of intellectual property to specific uses and for specific time periods. There can be no assurance that these third-party licenses, or the support for such licenses, will continue to be available to us on commercially reasonable terms. In the event that we cannot renew and/or expand existing licenses, we may be required to discontinue or limit our use of the products that include, incorporate, or rely on licensed intellectual property.
| 19 |
Data privacy and security laws and regulations in the jurisdictions in which we do business could increase the cost of our operations and subject us to possible sanctions and other penaltiespenalties.
Our business is subject to a number of federal, state, local and foreign laws and regulations governing data privacy and security, including with respect to the collection, storage, use, transmission and protection of personal information. In particular, we are subject to the European Union (the “EU”) has adopted strict data privacy regulations. Following recent developments, such as the EU’sEU General Data Protection Regulation (“(the “EU GDPR”) coming into forcewhere we are established in May 2018,the EEA or where we are not established in the EEA but process personal data of individuals in the EEA in relation to the offering of goods or services to, or the monitoring the behavior of, individuals in the EEA.
Following the end of the Brexit Transition Period on December 31, 2020, the EU GDPR has been implemented in the UK as the “UK GDPR”. The requirements of the UK GDPR are (for the time being) virtually identical to those of the EU GDPR.
The EU GDPR and the UK GDPR (collectively the “GDPR”) set out a number of requirements that must be complied with when handling personal data including (amongst others): (i) accountability and transparency requirements, and enhanced requirements for obtaining valid consent; (ii) obligations to consider data protection as any new products or services are developed and to limit the amount of personal data processed; (iii) obligations to comply with data protection rights of data subjects; and (iv) reporting of personal data breaches to the supervisory authority without undue delay (and no later than 72 hours where feasible).
The GDPR also prohibits the international transfer of personal data from the EEA/UK to countries outside of the EEA/UK unless made to a country deemed to have adequate data privacy laws by the European Commission or UK Government or a data transfer mechanism has been put in place. In July 2020, the Court of Justice of the European Union (“CJEU”) in its Schrems II ruling invalidated the EU-US Privacy Shield framework, a self-certification mechanism that facilitated the lawful transfer of personal data from the EEA/UK to the United States, with immediate effect. The CJEU upheld the validity of standard contractual clauses (“SCCs”) as a legal mechanism to transfer personal data but companies relying on SCCs will need to carry out a transfer privacy impact assessment, which among other things, assesses laws governing access to personal data in the recipient country and securityconsiders whether supplementary measures that provide privacy protections additional to those provided under SCCs will need to be implemented to ensure an essentially equivalent level of data protection to that afforded in the EU. This may have implications for our cross-border data flows and may result in compliance incosts.
In addition, Brexit has implications for transfers of personal data between the UK and the EU and vice versa. Transfers of personal data from the UK to the EU are increasingly complexunrestricted and challenging. Failure to comply with such restrictions could subject us to criminal and civil sanctions and other penalties. GDPR continues to apply indo not require additional safeguards as the UK throughouthas approved the withdrawal period during 2020. Theadequacy of the EU and all 12 nations deemed adequate by the EU. As regards transfers of personal data from the EEA to the UK, under the terms of the Trade and Cooperation Agreement agreed between the EU and UK on December 24, 2020, such data flows remain unrestricted as the European Commission granted the UK an “adequacy decision” meaning transfers of personal data from the EEA to the UK may continue unrestricted and would not require any additional safeguards.
Compliance with the GDPR will incur compliance and operational costs. In addition, a data supervisory authority may find our data processing practices and compliance steps to be inconsistent with the GDPR’s application in particular has broad extraterritorial effect and imposes a strict data protection compliance regime with penaltiestheir respective jurisdiction. Data supervisory authorities also have the power to issue fines for non-compliance of the GDPR of up to the greater of 20 million Euro and 4% of an organization’s annual worldwide revenue.turnover or €20m (£17.5 million under the UK GDPR), whichever is higher. Data subjects also have a right to compensation as a result of an organization’s breach of the GDPR that has affected them, for financial or non-financial losses (e.g., distress).
Our results of operations fluctuate due to seasonality and other factors and, therefore, our periodic operating results are not guarantees of future performance.
Our revenues are subject to a number of variations. Equipment sales and software license revenues usually reflect a limited number of large transactions, which may not recur on an annual basis. Consequently, revenues and operating results can vary substantially from period to period as a result of the timing of equipment sales and software licensing. In addition, revenues may vary depending on the timing of contract awards and renewals, changes in customer budgets and general economic conditions. A proportion of our revenues are subject to regular seasonal variations of the sort often related to seasonal consumer behavior, income from the Acquired BusinessesLeisure business segment is generally strongest in the spring and summer, and predominantly in Leisure Parksparks, and in Italy and Greece we experience reductions in revenue in the summer and in the UK, Italy and Greece we experience increases in revenue around customers’ pay dates.summer.
Our industry is subject to strict government regulations that could limit our existing operations and have a negative impact on our ability to grow.
In certain jurisdictions, forms of wagering, betting and lottery may be expressly authorized and governed by law and in other jurisdictions forms of wagering, betting and lottery may be expressly prohibited by law. If expressly authorized, such activities are typically subject to extensive and evolving governmental regulation. Gaming regulatory requirements vary from jurisdiction to jurisdiction. Therefore, we are subject to a wide range of complex gaming laws, rules and regulations in the jurisdictions in which we are licensed or may seek to be licensed. Most jurisdictions require that we are licensed or authorized, that our key personnel and certain of our security holders are found to be suitable or are licensed, and that our products are reviewed, tested and certified or approved before placement. If a license, approval, certification or finding of suitability is required by a regulatory or national authority and we fail to seek or do not receive the necessary approval, license, certification or finding of suitability, or if it is revoked, then we may be prohibited from distributing our products for use in the respective jurisdiction. Additionally, such prohibition could trigger reviews of our Company by regulatory bodies in other jurisdictions and adversely affect our ability to obtain or retain the required licenses and approvals in those jurisdictions.
| 20 |
The regulatory environment in any particular jurisdiction may change in the future, and any such change could have an adverse effect on our results of operations or business in general. Moreover, there can be no assurance that the operation of Server Based Gaming terminals, Video Lottery Terminals or other Terminals, Virtual Sports betting, betting online, lottery or other forms of wagering systems will be approved, certified or found suitable by additional jurisdictions or that those jurisdictions in which these activities are currently permitted will continue to permit such activities in their existing forms (stricter regulations, including regulation relating to age verification, could come into force which could have adverse impacts on the Company) or at all. While we believe that we have the means to continue to develop procedures and policies designed to comply with and monitor the requirements of evolving laws, there can be no assurance that law enforcement agencies, governmental agencies or gaming regulatory authorities, whether in existing or new jurisdictions, will not seek to restrict our business or otherwise institute enforcement proceedings or other legal claims against the Company. Moreover, in addition to the risk of such enforcement actions or claims, we are also at risk from loss of business reputation in the event of any potential legal or regulatory investigation whether or not we are ultimately accused of or found to have committed any violations.
We supply our products to operators of gaming venues, platforms and websites who typically must themselves be licensed by gaming regulators. If any one of these operators fails to maintain its gaming licenses, or violates gaming laws or regulations, our business may suffer, due to our loss of a viable customer and, in instances where we have a revenue-sharing arrangement with the operator, due to our loss of our shares of the revenue generated by that operator’s business.
We supply certain of our products to operators who operate gaming websites. Some of those operators may take bets from customers in sectors where no gaming laws or regulations exist and where the provision of online gaming is effectively unregulated. Although the Company seeks to ensure that its customers only take bets in sectors where online gaming is legal, if any of those operators is subjected to investigatory or enforcement action for acting otherwise, this could result in the operator suffering interventions ranging from special conditions being applied to its licenses, license suspension or license loss, or the operator otherwise withdrawing from or curtailing its activities in its sector. Any such developments could adversely affect such operator’s revenues and in turn adversely affect our earnings from such operator. The Company may itself be subject to investigatory or enforcement action (if and to the extent that local laws or the laws of other jurisdictions in which the Company operates impose liability on suppliers for the activities of the customers that they supply or for receiving funds that are deemed to be illegal because of such activities). We seek to protect ourselves against any such liability for the activities of the operators that we supply, including by contractually requiring those operators not to operate in certain territories and only supplying operators who we have reviewed to determine whether they uphold the requisite standards of regulatory and legal compliance. Nonetheless, there is a risk that we may fail to undertake sufficient due diligence, fail to receive accurate information on which to conduct due diligence, or become subject to investigatory or enforcement action should we or any of our customers be accused of breaching any regulations or laws. Any such action may adversely affect our standing with gaming regulators and our ability to obtain and retain required licenses and other approvals in other jurisdictions.
We may be required to obtain and maintain licenses and certifications from various state and local jurisdictions in order to operate certain aspects of our business and we and our key personnel and certain security holders may be subject to extensive background investigations and suitability standards. We may also become subject to regulation in any other jurisdiction where our customers are permitted to operate in the future. Licenses and ongoing regulatory compliance can be costly. There can be no assurance that we will be able to obtain new licenses or renew any of our existing licenses, and the loss, denial or non-renewal of any of our licenses could have an adverse effect on our business. Generally, regulatory authorities have broad discretion when granting, renewing or revoking approvals and licenses. Our failure, or the failure of any of our key personnel, systems or machines, in obtaining or retaining a required license or approval in one jurisdiction could have a negative impact on our ability (or the ability of any of our key personnel, systems or gaming machines) to obtain or retain required licenses and approvals in other jurisdictions. The failure to obtain or retain a required license or approval in any jurisdiction would decrease the geographic area where we may operate and generate revenues, decrease our share in the gaming marketplace and put us at a disadvantage compared with our competitors. In addition, the levy of substantial fines or forfeiture of assets could significantly harm our business, financial condition and results of operations.
Some jurisdictions also require extensive personal and financial disclosure and background checks from persons and entities beneficially owning a specified percentage of equity securities of licensed or regulated businesses. The failure of beneficial owners of our common stock to submit to such background checks and provide required disclosure could jeopardize our business. In light of these regulations and the potential impact on our business, our second amended and restated certificate of incorporation provides for the prohibition of stock ownership by persons or entities who fail to comply with informational or other regulatory requirements under applicable gaming law, who are found unsuitable to hold our stock by gaming authorities or whose stock ownership adversely affects our ability to obtain, maintain, renew or qualify for a license, contract, franchise or other regulatory approval from a gaming authority. The licensing procedures and background investigations of the authorities that regulate our businesses and the proposed amendment may inhibit potential investors from becoming significant stockholders or inhibit existing stockholders from retaining or increasing their ownership.
| 21 |
Our businesses are subject to a number of federal, state, local and foreign laws and regulations governing data privacy and security, including with respect to the collection, storage, use, transmission and protection of personal information and other consumer data. In particular, the EU has adopted strict data privacy regulations. Following recent developments such as the European Court of Justice’s 2015 ruling that the transfer of personal data from the EU to the U.S. under the EU/U.S. Safe Harbor was an invalid mechanism of personal data transfer, the adoption of the EU-U.S. Privacy Shield as a replacement for the Safe Harbor (which has since been declared invalid by Schrems II), and the upcoming effective datecoming into effect of the EU’s General Data Protection Regulation, data privacy and security compliance in the EU are increasingly complex and challenging. The scope of data privacy and security regulations continues to evolve, and we believe that the adoption of increasingly restrictive regulations in this area is likely within the U.S. and other jurisdictions. Compliance with data privacy and security restrictions could increase the cost of our operations and failure to comply with such restrictions could subject us to criminal and civil sanctions as well as other penalties.
We are subject to the provisions of the UK Bribery Act 2010, the U.S. Foreign Corrupt Practices Act and other anti-corruption laws. The UK Bribery Act generally prohibits giving a financial or other advantage to another person with the intention of inducing that person to improperly perform a relevant function or activity. The U.S. Foreign Corrupt Practices Act generally prohibits U.S. persons and companies and their agents from offering, promising, authorizing or making improper payments to foreign government officials for the purpose of obtaining or retaining business. Certain of these anti-corruption laws also contain provisions that require accurate record keeping and further require companies to devise and maintain an adequate system of internal accounting controls. Because a significant percentage of our revenue derives from foreign sources, and our business activities involve continuing relationships with governmental regulators, there exists a risk that certain provisions of these anti-corruption laws may be breached. We are also subject to anti-money laundering and anti-terrorist financing laws and regulations, and to economic and trade sanctions programs administered by the Office of Foreign Assets Control (OFAC) in the United States relating to our ability to engage in transactions with entities that are domiciled in countries or territories subject to comprehensive OFAC trade sanctions (currently, Cuba, Iran, North Korea, Syria, and Crimea), or that are included on OFAC’s list of Specially Designated Nationals and Blocked Persons. Although we have policies and controls in place that are designed to ensure compliance with these laws, if those controls are ineffective or an employee or intermediary fails to comply with the applicable regulations, we may be subject to criminal and civil sanctions as well as other penalties. Any such violation could disrupt our business and adversely affect our reputation, results of operations, cash flows and financial condition.
We review and develop our internal compliance programs in an effort to ensure that we comply with legal requirements imposed in connection with our business activities. The compliance program is run on a day-to-day basis by our in-house legal department with compliance and technical advice provided by our compliance manager and outside professionals. There can be no assurance that such steps will prevent the violation of one or more laws or regulations, or that a violation by us or an employee will not result in the imposition of administrative, civil and even criminal sanctions, monetary fines or suspension or revocation of one or more of our licenses.
16
Our industry is subject to regulations that set parameters for levels of gaming or wagering duty, tax, stake, prize and return to player.
In most jurisdictions in which we operate or expect to seek to operate, the level of duty or taxation, the stake, prize and return to player of wagering, betting and lottery games and the speed at which players can participate in gaming are defined in government regulations which are subject to change. Those regulations may also affect the premises in which gaming activities may take place (i.e., by limiting the number of gaming machines which may be housed in a licensed gaming location, or by restricting the locations in which licensed gaming premises may be situated). Once authorized, such parameters are subject to extensive and evolving governmental regulation. Moreover, such gaming regulatory requirements vary from jurisdiction to jurisdiction. Therefore, we are subject to a wide range of complex gaming parameters in the jurisdictions in which we are licensed. If a key parameter is changed, such as the level of taxation or duty or the maximum stake or prize or return to player of a game, then it may be to the detriment of our business, financial condition, results and prospects or we may be unable to distribute our products profitably.
Our business is subject to evolving technology.
The sectors for our products are affected by changing technology, new regulations and evolving industry standards. Our ability to anticipate or respond to such changes and to develop and introduce new and enhanced products and services on a timely basis will be a significant factor in our ability to expand, remain competitive, attract new customers and retain existing contracts. For example, some of our contracts with customers require that the technology being licensed by the customer remain compliant with applicable regulations. Because regulatory changes cannot always be foreseen, such contractual requirements can from time-to-time result in us having to incur unforeseen costs to adapt our technology to changes in regulation.
Generally, there can be no assurance that we will achieve the necessary technological advances, have the financial resources, introduce new products or services on a timely basis or otherwise have the ability to compete effectively on a technological basis in the sectors we serve.
| 22 |
Our business competes on the basis of the stability, security and integrity of our software, networks, systems, games and products.
We believe that our success depends, in significant part, on providing secure products and systems to our vendors and customers with high levels of uptime, quality and availability. Attempts to penetrate security measures may come from various combinations of customers, retailers, vendors, players, employees and others. Our ability to monitor and ensure quality of our products is continually reviewed and enhanced. There can be no assurance that our business might not be affected by a security breach, virus, Denial of Service attack, or technical error, failure or lapse which could have an adverse impact on our business.
Additionally, we maintain a large number of games and terminals and jackpot systems, which rely on algorithms and software designed to pay out winnings to players at certain ratios. Our systems, testing and processes to monitor and ensure the payout of games are continually reviewed and enhanced, and are additionally reviewed and tested by third-party expert test houses. There can be no assurance that our business might not be affected by a malicious or unintentional breach or technical error, failure or lapse which could have an adverse impact on payout ratios which would consequently have an adverse effect on our business in the form of lost revenues or penalty payments to players or customers. Gaming regulators may take enforcement action against us (including the imposition of significant fines) where the payout ratios fall below the ratios advertised to customers, or our software, networks, systems, games and/or products otherwise suffer from technical error, failure or lapse.
We may be adversely affected by disruptions to our transaction gaming and lottery systems, as well as disruptions to our internal enterprise and information technology systems.
Our operations are dependent upon our transactional gaming, lottery and information technology systems. We rely upon such systems to manage customer systems on a timely basis, to coordinate our sales and installation activities across all of our locations and to manage invoicing. A substantial disruption in our transactional gaming, lottery and information technology systems for any prolonged time period (arising from, for example, system capacity limits from unexpected increases in our volume of business, outages, computer viruses, unauthorized access or delays in its service) could result in delays in serving our customers, which could adversely affect our reputation and customer relationships and could result in monetary penalties pursuant to the terms of customer contracts. Our systems might be damaged or interrupted by natural or man-made events or by computer viruses, physical or electronic break-ins, or similar disruptions affecting the Internet and our disaster recovery plan may be ineffective at mitigating the effects of these risks. Such delays, problems or costs could have an adverse effect on our financial condition, results of operations and cash flows.
Because tax laws and regulations are subject to interpretation and uncertainty, tax payments may ultimately differ from amounts currently recorded by the Company.
17
We are subject to income taxes as well as non-income based taxes, in both the United States and numerous foreign jurisdictions. The determination of the Company’s worldwide provision for income taxes and other tax liabilities requires judgment and is based on diverse legislative and regulatory structures that exist in the various jurisdictions where the company operates. The ultimate tax outcome may differ from the amounts recorded in the Company’s financial statements and may adversely affect the Company’s financial results for the period when such determination is made. Tax authorities may disagree with certain positions we have taken and assess additional taxes via tax audit. We work with local tax experts to support our tax provisions in line with our tax strategy. However, there can be no assurance that we will not be subject to challenge and the future outcome of any potential audits could adversely affect our results of operations, financial condition and cash flows.
Gaming opponents persist in their efforts to curtail legalized gaming, which, if successful, could limit our existing operations.
Legalized gaming is subject to opposition from gaming opponents, including in the UK, Italy and other sectors where we are active. There can be no assurance that this opposition will not succeed in either preventing the legalization of gaming in jurisdictions where these activities are presently prohibited or prohibiting or limiting the expansion or continuance of gaming where it is currently permitted, in either case to the detriment of our business, financial condition, results and prospects.
Our directors and key personnel are subject to the approval of certain regulatory authorities, which, if withheld, would require us to sever our relationship with non-approved individuals, which could adversely impact our operations.
Our members, managers, directors, officers and key employees must also be approved by certain government and state regulatory authorities. If such regulatory authorities were to find a person occupying any such position unsuitable, we would be required to sever our relationship with that person. We may thereby lose key personnel which would have a negative effect on our operations. Certain public and private issuances of securities and certain other transactions by us also require the approval of certain state regulatory authorities. Further, our gaming regulators can require us to disassociate ourselves from suppliers or business partners found unsuitable by the regulators. The regulatory environment in any particular jurisdiction may change in the future and any such change could have an adverse effect on our results of operations. In addition, we are subject to various gaming taxes, which are subject to increase at any time.
| 23 |
Licensing and gaming authorities have significant control over our operations and ownership, and could cause us to redeem certain stockholders on potentially disadvantageous terms.
Regulatory authorities have broad powers to request detailed financial and other information, to limit, condition, suspend or revoke a registration, gaming license or related approval and to approve changes in our operations. Some jurisdictions also require extensive personal and financial disclosure and background checks from persons and entities beneficially owning a specified percentage of equity securities of licensed or regulated businesses. For example, in the UK, an entity holding a gambling license must notify the Gambling Commission of the identity of any stockholder holding, directly or indirectly, 3% or more of its equity or voting rights, and must apply for permission to continue to rely on its operating license whenever a new person acquires, directly or indirectly, 10% or more of its equity or voting rights. The failure of beneficial owners of our common stock to submit to such background checks and provide required disclosure could jeopardize our business. Our second amended and restated certificate of incorporation provides that, to the extent required by the gaming authority making the determination of unsuitability or to the extent the board of directors determines, in its sole discretion, that a person is likely to jeopardize the Company’s or any affiliate’s application for, receipt of, approval for, right to the use of, or entitlement to, any gaming license, shares of our capital stock that are owned or controlled by an unsuitable person or its affiliates are subject to mandatory redemption by us. The redemption price may be paid in cash, by promissory note, or both, as required, and pursuant to the terms established by, the applicable gaming authority and, if not, as we elect. Such a redemption could occur on terms or at a time that a stockholder believes to be disadvantageous.
Changes in laws or regulations, or a failure to comply with, or liabilities under, any laws and regulations, may adversely affect our business, investments and results of operations.
We are subject to laws and regulations enacted by national, regional, state and local governments, including non-U.S. governments. Compliance with, and monitoring of, applicable laws and regulations may be difficult, time consuming and costly. Those laws and regulations and their interpretation and application may also change from time to time and those changes could have an adverse effect on our business, investments and results of operations. In addition, a failure to comply with applicable laws or regulations, as interpreted and applied, or liabilities thereunder, could have an adverse effect on our business and results of operations.
18
Certain of our executive officers and directors aremay become affiliated with entities engaged in business activities similar to those conducted by us (or may enter into similar business activities in the future) and, accordingly, may have conflicts of interest in determining whether a particular business opportunity should be presented to us or to another entity.
Certain of our executive officers and directors aremay become affiliated with entities that are engaged in businesses similar to the ones we operate (or may enter into similar business activities in the future). As a result, any of them may become aware of business opportunities which may be appropriate for presentation to us and to other entities to which they owe certain fiduciary or contractual duties. Accordingly, they may have conflicts of interest in determining to which entity a particular business opportunity should be presented — to us or to another entity. These conflicts may not be resolved in our favor and a potential business opportunity may be presented to another entity prior to its presentation to us. Our second amended and restated certificate of incorporation provides that we renounce our interest in any corporate opportunity offered to any director or officer unless such opportunity is expressly offered to such person solely in his or her capacity as a director or officer of our Company and such opportunity is one that we are legally and contractually permitted to undertake and would otherwise be reasonable for us to pursue.
We are a holding company and conduct all of our operations through our subsidiaries.
We are a holding company and derive all of our operating income from our subsidiaries. Other than any cash we retain, all of our assets are held by our direct and indirect subsidiaries. We rely on the earnings and cash flows of our subsidiaries, which are paid to us by our subsidiaries, if and only to the extent available, in the form of dividends and other payments or distributions, to meet our debt service obligations. The ability of our subsidiaries to pay dividends or make other payments or distributions to us will depend upon their respective operating results and may be restricted by, among other things, the laws of their jurisdiction of organization (which may limit the amount of funds available for the payment of dividends and other distributions to us), the terms of existing and future indebtedness and other agreements of our subsidiaries and the covenants of any future outstanding indebtedness we or our subsidiaries incur.
| 24 |
Our inability to complete future acquisitions of gaming and related businesses and successfully integrate the Acquired Businesses or businesses we acquire in the future could limit our future growth, if any.
We continue to pursue expansion and acquisition opportunities in gaming and related businesses. We are also in the process of integrating the Acquired Businesses. We could face significant challenges in managing and integrating the expanded or combined operations including acquired assets, operations and personnel. There can be no assurance that acquisition opportunities will be available on acceptable terms or at all or that we will be able to obtain necessary financing or regulatory approvals to complete potential acquisitions. Our ability to succeed in implementing our strategy will depend upon the ability of our management to identify, complete and successfully integrate commercially viable acquisitions. Acquisition transactions may disrupt our ongoing business and distract management from other responsibilities. Any future acquisition transactions involving the use of company stock would dilute our existing stockholders and earnings per share.
Our business may be affected by changes in general and local economic and political conditions.
The demand for our services is sensitive to general and local economic conditions over which we have no control, including changes in the levels of consumer disposable income and geographic exposure to macro-economic trends and taxation. In addition, the economic stability of certain Eurozone countries where we conduct or intend to conduct business may become affected by sovereign debt crises or other general and local economic and political conditions. Adverse changes in economic conditions may affect our business generally or may be more prevalent or concentrated in particular sectors in which we operate. Any deterioration in economic conditions or the continuation of uncertain economic conditions could have an adverse effect on our business, financial condition, results of operations and prospects. Other economic risks which may adversely affect our performance include high interest rates, inflation and volatile foreign exchange markets, and effects arising from Great Britain’s exit from the European Union (“Brexit”).
The performance of our business may also be subject to political risks in certain jurisdictions where we operate, including change of government, political unrest, war or terrorism.
Our revenues can vary substantially from period to period and you should not rely upon our periodic operating results as indications of future performance.
Our revenues are subject to variations. Wagering equipment sales and software license revenues usually reflect a limited number of large transactions, which may not recur on an annual basis. Consequently, revenues and operating results can vary substantially from period to period as a result of the timing of major equipment sales and software license revenue. In addition, revenues may vary depending on the timing of contract awards and renewals, changes in customer budgets and general economic conditions. Revenues may also vary based on adverse sequences of payouts of prizes, unusual jackpot wins, and other variations in game margin.
Our business could also be affected by natural or man-made disasters such as floods, storms or terrorist attacks. We have taken steps to have disaster recovery plans in place but there can be no assurance that such an event would not have a significant adverse impact on our business.
We have operations in a variety of countries, which subjects us to additional risks.
We are a global business and derived substantially all of our revenue outside the United States during the year ended December 31, 2019.2022. In the year ended December 31, 2019,2022, we earned approximately 68%73% of our revenue from our operations in the UK, 11% Italy, 13%8% of our revenue from our operations in Greece, 8%and 19% of our revenue from our operations in the rest of the world. Our business in foreign markets subjectsubjects us to risks customarily associated with such operations, including:
| ● | foreign withholding taxes on, or bank regulatory restrictions on expatriating, our subsidiaries’ earnings that could reduce cash flow available to meet our required debt service and other obligations; |
| ● | the complexity of foreign laws, regulations and markets; |
| ● | the impact of foreign labor laws and disputes; |
| ● | potential risks relating to our ability to manage our foreign operations, monitor our customers’ activities or our partners’ activities which may subject us to risks involving such other entities’ financial condition or to inconsistent interests or goals; |
| ● | recent gaming tax increases in Italy; |
| 25 |
| ● | other economic, tax and regulatory policies of foreign governments; and |
| ● | the ability to attract and retain key personnel in foreign jurisdictions. |
Our consolidated financial results are significantly affected by foreign currency exchange rate fluctuations. Foreign currency exchange rate exposures arise from current transactions and anticipated transactions denominated in currencies other than U.S. Dollars, and from the translation of foreign currency balance sheet accounts into GBP-denominated or USD-denominated balance sheet accounts. Exposure to currency exchange rate fluctuations exists and will continue because a significant portion of our revenues are denominated in currencies other than the USD, particularly GBP and the Euro. Exchange rate fluctuations have in the past adversely affected operating results and cash flows and may continue to adversely affect our results of operations and cash flows and the value of assets.
As a result of the geographic concentration of our operations in the UK, Italy and Greece, our operating results and cash flow depend significantly on economic conditions and the other factors listed above in these sector areas. There can be no assurance that we will be able to operate on a continuing successful basis in these sectors or in any combination of different geographical sectors.
20
Our business could be negatively affected by ownership changes and consolidation in the gaming industry.
Because a substantial part of our revenue is recurring in nature, our medium to long term results of operations, cash flows and financial condition could be negatively affected if any of our customers were sold to or merged with other customers, or if consolidation in the gaming industry were otherwise effected. Consolidation among gaming operators could result in our customers using more products and services of our competitors or reducing their spending on our products, or could otherwise cause downward pricing pressures, any of which outcomes could negatively affect our business.
We may not be able to capitalize on the expansion of interactive gaming or other trends and changes in the gaming and lottery industries, including due to laws and regulations governing these industries, and other factors.
We participate in new and evolving aspects of the interactive gaming and lottery industries. Part of our strategy is to take advantage of the liberalization of regulations covering these industries on a global basis. These industries involve significant risks and uncertainties, including legal, business and financial risks. The fast-changing environment in these industries can make it difficult to plan strategically and can provide opportunities for competitors to grow their businesses at our expense. Consequently, our future results of operations, cash flows and financial condition are difficult to predict and may not grow at the rates we expect.
Laws relating to internetinteractive gaming are evolving. To varying degrees, governments have taken steps to change the regulation of internetinteractive wagering through the implementation of new or revised licensing and taxation regimes, including the possible imposition of sanctions on unlicensed providers. We cannot predict the timing, scope or terms of the implementation or revision of any such state, federal or foreign laws or regulations, or the extent to which any such laws and regulations may facilitate or hinder our strategy.
In jurisdictions that authorize internetinteractive gaming, we cannot assure that we will be successful in offering our technology, content and services to internetinteractive gaming operators, because we expect to face intense competition from our traditional competitors in the gaming and lottery industries as well as a number of other domestic and foreign competitors (and, in some cases, the operators themselves), many of which have substantially greater financial resources or experience in this area than we do.
Know-your-customer and geo-location programs and technologies supplied by third parties are an important aspect of certain internet and mobileinteractive gaming products and services, because they can confirm certain information with respect to players and prospective players, such as age, identity and location. Payment processing programs and technologies, typically provided by third parties, are also a necessary feature of interactive wagering products and services. These programs and technologies are costly, and our use of them may have an adverse impact on our results of operations, cash flows and financial condition. Additionally, we cannot assure that products or services containing these programs and technologies will be available to us on commercially reasonable terms, if at all, or that they will perform accurately or otherwise in accordance with required specifications.
| 26 |
Our business is capital intensive and our ability to retain customers may be influenced by our ability to deploy additional capital.
Customers of our server based gaming products may request us to incur capital expenditures to provide gaming terminals to support their land-based operations. While we seek to obtain what we believe to be satisfactory rates of return on such investments, these capital expenditures can be meaningful and may be concentrated within short periods of time. To the extent that we have insufficient access to capital or liquidity at the time that a customer, or prospective customer, makes such a request, we may be at a competitive disadvantage in retaining or attracting such customer. Such a circumstance could have an adverse effect on our business, financial condition, results of operations or prospects.
We may be subject to claims arising from the operations of our various businesses for periods prior to the dates we acquired them.
We may be subject to claims or liabilities arising from the ownership or operation of the Acquired Businesses, and other businesses we have acquired for the periods prior to our acquisition of them, including environmental, employee-related and other liabilities and claims not covered by insurance.
Our success depends upon our key personnel.
Our business results depend largely upon the continued contributions of various members of our management team, as well as certain key technical specialists, game designers, operational experts and other developers and operators of key intellectual property and processes. If we lose the services of one or more members of our management team or key employees, our business, financial condition and results of operations, as well as the market price of our securities, could be adversely affected.
The long-term performance of our business relies on our ability to attract, develop and retain talented personnel and our labor force while controlling our labor costs.
To be successful, we must attract, develop and retain highly qualified and talented personnel who have the experience, knowledge and expertise to successfully implement our key business strategies. We also must attract, develop and retain our labor force while maintaining labor costs. We compete for employees, including sales people, regional management, executive officers and others, with a broad range of employers in many different industries, including large multinational firms, and we invest significant resources in recruiting, developing, motivating and retaining them. The failure to attract and retain key employees, or to develop effective succession planning to assure smooth transitions of those employees and the knowledge, customer relationships and expertise they possess, could negatively affect our competitive position and our operating results. Further, if we are unable to cost-effectively recruit, train and retain sufficient skilled personnel, we may not be able to adequately satisfy increased demand for our products and services, which could adversely affect our operating results.
Restrictions in our existing borrowings, including covenants set forth in our existing debt facilities, or any other indebtedness we may incur in the future, could adversely affect our business, financial condition, or results of operations, and our ability to make distributions to stockholders and the value of our common stock.
Our existing borrowings, and any other indebtedness we may enter into, may limit our ability to, among other things:
| ● | incur or guarantee additional debt; |
| ● | make distributions or dividends on or redeem or repurchase shares of common stock; |
| ● | make certain investments and acquisitions; |
| ● | make capital expenditures; |
| ● | incur certain liens or permit them to exist; |
| ● | enter into certain types of transactions with affiliates; |
| ● | acquire, merge or consolidate with another company; and |
| ● | transfer, sell or otherwise dispose of all or substantially all of our assets. |
| 27 |
The provisions of our existing borrowings may affect our ability to obtain future financing and pursue attractive business opportunities and our flexibility in planning for, and reacting to, changes in business conditions.
In connection with the Acquisition on September 27, 2019, we refinanced the business with an effective dateAs of October 1, 2019. The newDecember 31, 2022, our senior debt consisted of two senior secured five year term loansan aggregate of £140m£235.0 million ($282.9 million) of Senior Secured Notes (carrying an interest rate of 7.875% per annum, and €90m together with a secured revolvingmaturing on June 1, 2026), and we had £20.0 million ($24.1 million) of credit facility loan in an original principal amount of £20m. The SFA Loans will bear interest at LIBOR or EURIBOR as applicable, plus a margin (based on Inspired’s consolidated total net leverage ratio) ranging from 5.00% to 7.25%. With respect to the RCF Loan, a commitment fee of 30% of the then applicable margin accrues on any unutilized portion of the RCF Loan. Any accrued commitment fee is payable quarterly in arrears and, with respect to any commitmentborrowings available under the RCF LoanAgreement (see Note 13).
The Indenture governing the Senior Secured Notes contains incurrence covenants that is cancelled, atlimit the timeability of the cancellation is effective. Company and the Company’s restricted subsidiaries to, among other things, (i) incur or guarantee additional debt and issue certain preferred stock of restricted subsidiaries; (ii) create or incur certain liens; (iii) make restricted payments, including dividends or distributions to the Company’s stockholders or repurchase the Company’s stock; (iv) prepay or redeem subordinated debt; (v) make certain investments, including participating joint ventures; (vi) create encumbrances or restrictions on the payment of dividends or other distributions by restricted subsidiaries; (vii) sell assets, or consolidate or merge with or into other companies; (viii) sell or transfer all or substantially all of the Company’s assets or those of the Company’s subsidiaries on a consolidated basis; (ix) engage in certain transactions with affiliates; and (x) create unrestricted subsidiaries. Certain of these covenants will be suspended if and for so long as the Senior Secured Notes have investment grade ratings from any two of Moody’s Investors Service, Inc., Standard & Poor’s Investors Ratings Services and Fitch Ratings, Inc. These covenants are subject to exceptions and qualifications as set forth in the Indenture.
The RCF Agreement governing credit facility borrowings contains various covenants (which include restrictions regarding the incurrence of liens, the incurrence of indebtedness by Inspired’sthe Company’s subsidiaries and fundamental changes, subject in each case to certain exceptions in each case. exceptions), representations, warranties, limitations and events of default (which include non-payment, breach of obligations under the financing documents, cross-default, insolvency and litigation) customary for similar facilities for similarly rated borrowers and subject to customary carve-outs and grace periods. Following the occurrence of an event of default which has not been waived or remedied, the Lenders who represent more than 66.67% of total commitments under the RCF may, subject to the terms of an intercreditor agreement (which governs the relationship between the Lenders and the holders of the Senior Secured Notes), instruct the agent to (i) accelerate the RCF Loans, (ii) instruct the security agent to enforce the transaction security and/or (iii) exercise any other remedies available to the Lenders.
The SFARCF Agreement requires that Inspiredthe Company maintain a maximum consolidated totalsenior secured net leverage ratio of 4.1x (subject to a step6.25x on the test date for the relevant period ending June 30, 2022, stepping down to 3.0x6.0x on March 31, 2022, 5.75x on March 31, 2023 and after June 30, 2021)5.50x from March 31, 2024 and thereafter (the “RCF Financial Covenant”). The ratioRCF Financial Covenant is calculated based on earnings before interest, taxes,as the ratio of consolidated senior secured net debt to consolidated pro forma EBITDA (defined as net loss excluding depreciation and amortization, as adjusted pursuantinterest expense, interest income and income tax expense) for the 12-month period preceding the relevant quarterly testing date and is tested quarterly on a rolling basis, subject to the SFA.Initial Facility (as defined in the RCF Agreement) being drawn on the relevant test date. The SFA also restricts capital expenditures based on fixed annual limits, which grow pro rata with respect to consolidated EBITDA acquired pursuant to any permitted acquisition of a company or business, (subject to the ability to carry forward the unused part of such limit in any given year into the immediately following year, to carry back up to 50% of such limit into the then current year from the immediately succeeding year and to fund capital expenditures from certain specified funding sources in which case such expenditure does not count towards the annual limit) applicable from the financial year ending December 31, 2019 to the financial year ending December 31, 2026. The SFARCF Agreement does not include a minimum interest coverage ratio or other financial covenants. The outstanding principal amount of the Term Loans is payable on October 1, 2024. The outstanding principal amount of each advance under the RCF Loan is payable on the last day of the interest period relating to such advance, unless such advance is rolled over on a cashless basis in accordance with customary rollover provisions contained in the SFA.
Failure to comply with the provisions of our existing borrowings or any other indebtedness we may enter into, including the covenants set forth in our existing debt facilities, could result in a default or an event of default that could enable our lenders or other debt holders to declare the outstanding principal of that debt, together with accrued and unpaid interest, to be immediately due and payable. In addition, some of our debt could be subject to cross-acceleration terms, pursuant to which repayment of that debt would be accelerated if the repayment of other debt we owe is accelerated. If the payment of some or all of our debt is accelerated, our assets may be insufficient to repay such debt in full.
We may have future capital needs and may not be able to obtain additional financing on acceptable terms.
Economic and credit market conditions, the performance of the gaming industry and our financial performance, as well as other factors, may constrain our financing abilities. Our ability to secure additional financing, if available, and to satisfy our financial obligations under indebtedness outstanding from time to time will depend upon our future operating performance, the availability of credit, economic conditions and financial, business and other factors, many of which are beyond our control.
We may require additional financing to fund our operations and growth. The failure to secure additional financing could have an adverse effect on our continued development or growth. None of our officers, directors or stockholders is required to provide any financing to us.
| 28 |
We may be unable to identify and develop sufficient new products and product lines and integrate them into our existing business, which may adversely affect our ability to compete; our expansion into new sectors may present competitive and regulatory challenges that differ from current ones.
Our business depends in part on our ability to identify and develop future products and product lines that complement existing products and product lines and that respond to our customers’ and players’ needs. We may not be able to compete effectively unless our product selection keeps up with trends in the sectors in which it competes or trends in new products. In addition,If our ability to integrate new products and product lines intodo not meet our existing business could affectcustomers’ and players’ expectations, or if they are not brought to market in a timely and effective manner, our revenue (especially our revenue under revenue participation-based contracts) and financial performance will be negatively affected. In addition to market factors, our ability to compete.develop new products and their ability to achieve commercial success will depend on a number of factors, including our ability to:
| ● | effectively market our games to our customers and to existing and new players; | |
| ● | adapt to changing customer needs and player preferences; | |
| ● | adapt to new technologies; | |
| ● | adapt game features and contents for an increasingly diverse set of devices and specifications; | |
| ● | minimize launch delays and cost overruns on the development of new products and features; | |
| ● | expand and enhance games and content after their initial release; | |
| ● | attract, retain and motivate talented and experienced game designers, product managers and engineers; | |
| ● | achieve and maintain player engagement; | |
| ● | develop games that can build upon or become franchise games; | |
| ● | maintain quality content and game experience; | |
| ● | compete successfully against a large and growing number of market participants; | |
| ● | integrate new products and product lines into our existing business; and | |
| ● | minimize and quickly resolve bugs or outages. |
In addition, if new technologies are protected by the intellectual property rights of others, including our competitors, we may be prevented from introducing new products and product lines based on these technologies or expanding into sectors created by these technologies. Even if we are able to develop new products and product lines that achieve success, it is possible that these products and product lines could divert players of our other games without growing our overall user base, which could harm our operating results. Furthermore, the success of new products and product lines will depend upon market demand and there is a risk that new products and product lines will not deliver expected results, which could adversely affect our future sales and results of operations. It is difficult to know whether we will succeed in continuing to develop successful new products and product lines.
Our expansion into new sectors may present competitive, distribution and regulatory challenges that differ from current ones. We may be less familiar with new product categories and may face different or additional risks, as well as increased or unexpected costs, compared to existing operations.
Changes in customer and player preferences could adversely affect our results of operations.
Competition in the gaming industry is intense and subject to rapid change, including changes from evolving customer and player preferences. Accordingly, our success in the gaming industry is dependent on our ability to offer attractive products to our customers and players. In the markets in which we operate, we compete with various other gaming vendors and our customers and players now have access to many other forms of recreational and leisure activities. Our participation-based revenue will depend on the appeal of our gaming offerings to our customers and players relative to our competitors. If we are not able to anticipate and react to changes in customer and player preferences, our competitive and financial position may be adversely affected.
In addition, our future success will also depend on the success of the gaming industry as a whole in attracting and retaining players. Gaming may lose popularity as new leisure activities arise or as other leisure activities become more popular. Alternatively, changes in social mores and demographics could result in reduced acceptance of gaming as a leisure activity. If the popularity of gaming declines for any reason, our business, financial condition and results of operations may be adversely affected.
23
| 29 |
Our financial success is dependent on our customers’ ability to attract and maintain players.
We have a participation-driven business model, whereby a significant amount of our revenues are generated from the gaming revenue of our customers, typically as a percentage of gross revenue. Accordingly, our results of operation and financial condition have been and are expected to continue to be influenced by the ability of our customers to attract and maintain players. The ability of our customers to attract and maintain players depends on a number of factors, including player gaming preferences, marketing of our products and player perceptions of our customers. If we are unable to provide our customers with products that players find engaging or fail to perform our obligations in maintaining the products we provide to our customers, players may reduce the amount they spend with our customers, which in turn may have an adverse effect on our results of operations (see “—We may be unable to identify and develop sufficient new products and product lines and integrate them into our existing business, which may adversely affect our ability to compete; our expansion into new sectors may present competitive and regulatory challenges that differ from current ones.”). Under most of our contracts, our customers are under no obligation to market our products and therefore we are dependent on our customers in promoting our products to maintain and attract players. Failure by our customers to effectively market our products may result in decreased gaming revenue for our customers from our products, which may have an adverse effect on our results of operations. Player perception of our customers may also impact the willingness of players to engage with our customers, which in turn may have an adverse effect on our results of operation.
Risks Relating to Our Status as a Public Company and Ownership of Our Common Stock
We may be required to recognize impairment charges related to goodwill, identified intangible assets and property and equipment or to take write-downs or write-offs, restructuring or other charges that could have a significant negative effect on our financial condition, results of operations and stock price, which could have an adverse effect on our common stock and your investment.
We are required to test goodwill and any other intangible asset with an indefinite life for possible impairment on the same date each year and on an interim basis if there are indicators of a possible impairment. We are also required to evaluate amortizable intangible assets and property and equipment for impairment if there are indicators of a possible impairment. There is significant judgment required in the analysis of a potential impairment of goodwill, identified intangible assets and property and equipment. If, as a result of a general economic slowdown, deterioration in one or more of the sectors in which we operate or impairment in our financial performance and/or future outlook, the estimated fair value of our long-lived assets decreases, we may determine that one or more of our long-lived assets is impaired. An impairment charge would be determined based on the estimated fair value of the assets and any such impairment charge could have an adverse effect on our financial condition and results of operations.
Even though these charges may be non-cash items and would not have an immediate impact on our liquidity, the fact that we report charges of this nature could contribute to negative market perceptions about the Company or our securities. In addition, charges of this nature may cause us to be unable to obtain future financing on favorable terms or at all.
The liquidity of the trading markets for our securities and other factors may adversely affect the price of our securities.
The price of our securities may be affected by the light volume of the trading markets for our securities as well as a variety of other factors including due to general economic conditions and forecasts, our general business condition and the release of our financial reports. If our results do not meet the expectations of investors or securities analysts, the market price of our securities may decline. In addition, fluctuations in the price of our securities could contribute to the loss of all or part of your investment. Any of the factors listed below could have an adverse effect on the price of our securities, and our securities may trade at prices significantly below the price you paid for them. In such circumstances, the trading price of our securities may not recover and may experience a further decline.
Factors affecting the trading price of the Company’s securities may include:
| ● | market conditions affecting the gaming industry; |
| ● | quarterly variations in our results of operations; |
| ● | changes in government regulations; |
| ● | the announcement of acquisitions by us or our competitors; |
| ● | changes in general economic and political conditions; |
| ● | volatility in the financial markets; |
| ● | results of our operations and the operations of others in our industry; |
| ● | changes in interest rates; |
| ● | threatened or actual litigation and government investigations; |
| ● | the addition or departure of key personnel; |
| ● | actions taken by our stockholders, including the sale or disposition of their shares of our common stock; and |
| ● | differences between our actual financial and operating results and those expected by investors and analysts and changes in analysts’ recommendations or projections. |
Broad market and industry factors may materially harm the market price of our securities irrespective of our operating performance. The stock market in general, and NASDAQ in particular, have experienced price and volume fluctuations that have often been unrelated or disproportionate to the operating performance of the particular companies affected. The trading prices and valuations of these stocks, and of our securities, may not be predictable. A loss of investor confidence in the market for retail stocks or the stocks of other companies which investors perceive to be similar to the Company could depress our stock price regardless of our business, prospects, financial condition or results of operations. A decline in the market price of our securities also could adversely affect our ability to issue additional securities and our ability to obtain additional financing in the future.
Depending on the number of shares you hold and other factors, you may not be able to sell your shares at the times you prefer at desirable market prices.
Our warrants trade in over-the-counter markets operated by OTC Markets Group which may limit the ability of investors to effect transactions in the warrants.
Our warrants could expire worthless, the terms could be amended and we may redeem them at a time that is disadvantageous to holders.
Our warrants have an exercise price of $5.75 per one-half of one share ($11.50 per whole share), subject to adjustment, and may be exercised only for a whole number of shares of our common stock. There is no guarantee that the warrants will be in-the-money when warrant holders choose to exercise their warrants and they may expire worthless.
In addition, the warrant agreement between Continental Stock Transfer & Trust Company, as warrant agent, and us provides that the terms of the warrants may be amended without the consent of any holder in order to cure any ambiguity, correct any defective provision or to add or change a provision with respect to a matter or question that the parties may deem necessary or desirable and that the parties deem not to adversely affect the interest of the holders. Other modifications or amendments, including to increase the warrant exercise price or shorten the period of exercise, would require the approval of the holders of at least 65% of the then outstanding warrants.
We also have the ability to redeem our warrants upon 30 days’ notice of redemption at a redemption price of $0.01 per warrant, provided that (i) the last reported sale price of our common stock equals or exceeds $24.00 per share on any 20 trading days within the 30 trading-day period ending on the third business day before we send the notice of such redemption and (ii) on the date we give notice of redemption and during the entire period thereafter until the time the warrants are redeemed, there is an effective registration statement under the Securities Act covering the shares of our common stock issuable upon exercise of the warrants and a current prospectus relating to them is available unless we have notified holders in the notice of redemption that we have elected to require the warrants to be exercised on a cashless basis. Redemption of the outstanding warrants could force holders:
The redemption rights that we have under the warrant agreement do not extend to the private warrants provided they continue to be held by the initial purchasers or their permitted transferees.
25
Concentration of ownership of the Company may have the effect of delaying or preventing a change in control and sales of substantial amounts of our shares may impact the market price of our shares.
Our largest stockholder, Landgame S.à.r.l, holds approximately 29.3% of the outstanding common stock of the Company and is party to a stockholders agreement with us that provides it with the right to designate two of the seven members of our board of directors. In addition, under the same stockholders agreement, another one of our stockholders, Hydra Industries Sponsor LLC (the “Hydra Sponsor”), has the right to nominate one director, and affiliates of Macquarie Group Limited (the “Macquarie Sponsor”) have the right, jointly with the Hydra Sponsor, to nominate two directors. As a result, these stockholders have the ability to exert influence over our business and may support or make decisions with which other stockholders may disagree and that could have the effect of delaying or preventing a change of control or adversely affecting the market price of our common stock.
If Landgame S.à.r.l or other of our stockholders sell substantial amounts of their shares in the public market, the market price of our common stock could decrease significantly. The perception in the public market that our stockholders might sell shares of common stock could also depress our market price. A decline in the price of the shares of our common stock could impede our ability to raise capital through the issuance of additional shares or other equity securities. Moreover, any such decline could result in our common stock trading at prices significantly below the price you paid.
We do not currently intend to pay dividends on our common stock.
We do not currently expect to pay cash dividends on our common stock and have not paid cash dividends on our common stock to date. Any future dividend payments are within the absolute discretion of our board of directors and will depend upon, among other things, our results of operations, working capital requirements, capital expenditure requirements, financial condition, level of indebtedness, contractual restrictions with respect to payment of dividends, business opportunities, anticipated cash needs, provisions of applicable law and other factors that our board of directors may deem relevant.
Our business and stock price may suffer if securities or industry analysts do not publish or cease publishing research or reports about the Company, our business, or our sector, or if they change their recommendations regarding our common stock adversely, the price and trading volume of our common stock could decline.
The trading market for our common stock will be influenced by the research and reports that industry or securities analysts may publish about us, our business, our sector, or our competitors. If securities or industry analysts do not continue to cover the Company, our stock price and trading volume would likely be negatively affected. If any of the analysts who may cover the Company change their recommendation regarding our stock adversely, or provide more favorable relative recommendations about our competitors, the price of our common stock would likely decline. If any analyst who may cover the Company were to cease coverage of the Company or fail to regularly publish reports on the Company, we could lose visibility in the financial markets, which could cause our stock price or trading volume to decline.
We may issue a significant number of shares of our common stock or other securities from time to time.
We may issue shares of our common stock or other securities from time to time as consideration for, or to finance, future acquisitions and investments or for other capital needs. We cannot predict the size of future issuances of our shares or the effect, if any, that future sales and issuances of shares would have on the market price of our common stock. If any such acquisition or investment is significant, the number of shares of common stock or the number or aggregate principal amount, as the case may be, of other securities that we may issue may in turn be substantial and may result in additional dilution to our stockholders. We may also grant registration rights covering shares of our common stock or other securities that we may issue in connection with any such acquisitions and investments. On February 16, 2022, the Company filed a registration statement pursuant to which the Company may offer and sell from time to time, in one or more series, any one of the following securities of our company, for total gross proceeds up to $300,000,000:
| ● | common stock; | |
| ● | preferred stock; | |
| ● | secured or unsecured debt securities consisting of notes, debentures or other evidences of indebtedness which may be senior debt securities, senior subordinated debt securities or subordinated debt securities, each of which may be convertible into equity securities; | |
| ● | warrants to purchase our securities; | |
| ● | rights to purchase any of the foregoing securities; or | |
| ● | units comprised of, or other combinations of, the foregoing securities. |
| 31 |
Anti-takeover provisions contained in our second amended and restated certificate of incorporation and bylaws, as well as provisions of Delaware law, could impair a takeover attempt.
Our second amended and restated certificate of incorporation and bylaws contain provisions that could have the effect of delaying or preventing changes in control or changes in our management without the consent of our board of directors. These provisions include:
| ● | no cumulative voting in the election of directors, which limits the ability of minority stockholders to elect director candidates; |
| ● | the exclusive right of our board of directors to elect a director to fill a vacancy created by the expansion of the board of directors or the resignation, death, or removal of a director with or without cause by stockholders, which prevents stockholders from being able to fill vacancies on our board of directors; |
| ● | the ability of our board of directors to determine whether to issue shares of our preferred stock and to determine the price and other terms of those shares, including preferences and voting rights, without stockholder approval, which could be used to significantly dilute the ownership of a hostile acquirer; |
| ● | limiting the liability of, and providing indemnification to, our directors and officers; |
| ● | designating the Court of Chancery of the State of Delaware as the exclusive forum for adjudication of disputes; |
| ● | controlling the procedures for the conduct and scheduling of stockholder meetings; and |
| ● | advance notice procedures that stockholders must comply with in order to nominate candidates to our board of directors or to propose matters to be acted upon at a stockholders’ meeting, which may discourage or deter a potential acquirer from conducting a solicitation of proxies to elect the acquirer’s own slate of directors or otherwise attempting to obtain control of the Company. |
These provisions, alone or together, could delay hostile takeovers and changes in control of the Company or changes in our board of directors and management.
As a Delaware corporation, we are also subject to provisions of Delaware law, including Section 203 of the Delaware General Corporation Law, which prevents some stockholders holding more than 15% of our outstanding common stock from engaging in certain business combinations without approval of the holders of substantially all of our outstanding common stock. In addition, we adopted a stockholder rights plan in August 2017 in the form of a Rights Agreement, which could have the effect of making it uneconomical for a third party to acquire us on a hostile basis. Such plan is currently set to expire in August 2020. Any provision of our second amended and restated certificate of incorporation or bylaws, the Stockholders’ Rights Agreement or Delaware law that has the effect of delaying or deterring a change in control could limit the opportunity for our stockholders to receive a premium for their shares of our common stock and could also affect the price that some investors are willing to pay for our common stock.
Risks Relating to Economic and Political Conditions
Volatility or disruption in the financial markets could materially adversely affect our business and the trading price of our common stock.
Our business relies on stable and efficient financial markets. Any disruption in the credit and capital markets could adversely impact our ability to obtain financing on acceptable terms. Volatility in the financial markets could also result in difficulties for financial institutions and other parties that we do business with, which could potentially affect the ability to access financing under existing arrangements. We are exposed to the impact of any global or domestic economic disruption, including any potential impact of the decision by the United Kingdom to exit the EU and the sovereign debt crises in certain Eurozone countries where we do business. Our ability to continue to fund operating expenses, capital expenditures and other cash requirements over the long term may require access to additional sources of funds, including equity and debt capital markets, and market volatility and general economic conditions may adversely affect our ability to access capital markets. In addition, the inability of our vendors to access capital and liquidity with which to maintain their inventory, production levels and product quality and to operate their businesses, or the insolvency of our vendors, could lead to their failure to deliver merchandise. If we are unable to purchase products when needed, our sales could be materially adversely affected. Accordingly, volatility or disruption in the financial markets could impair our ability to execute our growth strategy and could have an adverse effect on the trading price of our common stock.
| 32 |
Currency exchange rate fluctuations could result in lower revenues, higher costs and decreased margins and earnings.
We conduct purchase and sale transactions in various currencies, which increases our exposure to fluctuations in foreign currency exchange rates globally. Additionally, there has been, and may continue to be, volatility in currency exchange rates as a result of the United Kingdom’s June 23, 2016 referendum in which voters approved Brexit and subsequent entry into and ratification of a withdrawal agreement as of January 29, 2020.2021 followed by an agreement of the terms of a trade and cooperation agreement effective as of December 31, 2021. It is possible that sovereign debt crises in certain Eurozone countries could lead to the abandonment of the Euro and the reintroduction of national currencies in those countries. International revenues and expenses generally are derived from sales and operations in various foreign currencies, and these revenues and expenses could be affected by currency fluctuations, specifically amounts recorded in foreign currencies and translated into USD for consolidated financial reporting, as weakening of foreign currencies relative to the USD will adversely affect the USD value of the Company’s foreign currency-denominated sales and earnings. Currency exchange rate fluctuations could also disrupt the business of the independent manufacturers that produce our products by making their purchases of raw materials more expensive and more difficult to finance. Foreign currency fluctuations could have an adverse effect on our results of operations and financial condition.
We may hedge other foreign currency exposures to lessen and delay, but not to completely eliminate, the effects of foreign currency fluctuations on our financial results. Since the hedging activities are designed to lessen volatility, they not only reduce the negative impact of a stronger USD or other trading currency, but they also reduce the positive impact of a weaker USD or other trading currency. Our future financial results could be significantly affected by the value of the USD in relation to the foreign currencies in which we conduct business. The degree to which our financial results are affected for any given time period will depend in part upon our hedging activities, and there can be no assurance that our hedging activities will be effective.
Global economic conditions could have an adverse effect on our business, operating results and financial condition.
The uncertain state of the global economy continues to affect businesses around the world, most acutely in emerging markets and developing economies. If global economic and financial market conditions do not improve or deteriorate, the following factors could have an adverse effect on our business, operating results and financial condition:
| ● | Slower consumer spending may result in reduced demand for our products, reduced orders from retailers for our products, order cancellations, lower revenues, higher discounts, increased inventories and lower gross margins; |
| ● | In the future, we may be unable to access financing in the credit and capital markets at reasonable rates in the event we find it desirable to do so; |
| ● | We conduct transactions in various currencies, which increases our exposure to fluctuations in foreign currency exchange rates relative to the USD. Continued volatility in the markets and exchange rates for foreign currencies and contracts in foreign currencies could have a significant impact on our reported operating results and financial condition; |
| ● | Continued volatility in the availability and prices for commodities and raw materials we use in our products and in our supply chain could have an adverse effect on our costs, gross margins and profitability; |
| ● | If operators or distributors of our products experience declining revenues or experience difficulty obtaining financing in the capital and credit markets to purchase our products, this could result in reduced orders for our products, order cancellations, late retailer payments, extended payment terms, higher accounts receivable, reduced cash flows, greater expense associated with collection efforts and increased bad debt expense; |
| ● | If operators or distributors of our products experience severe financial difficulty, some may become insolvent and cease business operations, which could negatively affect the sale of our products to consumers; and |
| ● | If contract manufacturers of our products or other participants in our supply chain experience difficulty obtaining financing in the capital and credit markets to purchase raw materials or to finance capital equipment and other general working capital needs, it may result in delays or non-delivery of shipments of our products. |
28
| 33 |
International hostilities, terrorist or cyber-terrorist activities, natural disasters, pandemics, and infrastructure disruptions could prevent us from effectively serving our customers and thus adversely affect our results of operations.
Acts of terrorist violence, cyber-terrorism, political unrest, armed regional and international hostilities and international responses to these hostilities, natural disasters, including hurricanes or floods, global health risks or pandemics (such as COVID-19) or the threat of or perceived potential for these events could have a negative impact on us. These events could adversely affect our customers’ levels of business activity (or involve government mandated shutdowns of our venues) and precipitate sudden significant changes in regional and global economic conditions and cycles. These events also pose significant risks to our employees and our physical facilities and operations around the world, whether the facilities are ours or those of our third-party service providers or customers. By disrupting communications and travel and increasing the difficulty of obtaining and retaining highly skilled and qualified personnel, these events could make it difficult or impossible for us to deliver products and services to our customers. Extended disruptions of electricity, other public utilities or network services at our facilities, as well as system failures at our facilities or otherwise, could also adversely affect our ability to serve our customers. We may be unable to protect our employees, facilities and systems against all such occurrences. We generally do not have insurance for losses and interruptions caused by terrorist attacks, conflicts and wars. If these disruptions prevent us from effectively serving our customers, our results of operations could be adversely affected.
We face risks and uncertainty arising from the United Kingdom’s withdrawal from the European Union.
Following from the United Kingdom’s public referendum vote to exit from the European Union in June 2016, a withdrawal agreement was signed by both the United Kingdom and European Union and formally ratified as of January 29, 2020. Under2021. In accordance with the terms of the agreement, the terms of a trade deal are to be negotiatedand cooperation agreement were agreed between officials from the European Union and United Kingdom by no later thanon December 31, 2020, failing which trade between the UK and the European Union will fall back to basic World Trade Organization terms. The effects of Brexit will depend upon any agreements the United Kingdom makes to retain access to European Union markets either during a transitional period or more permanently.2021. As with other businesses operating in the UK and Europe, the measures could potentially have corporate structural consequences, adversely affect manufacturing and other costs, adversely change tax benefits or liabilities in these or other jurisdictions and could disrupt some of the markets and jurisdictions in which we operate. In addition, Brexit could lead to legal uncertainty and potentially divergent national laws and regulations as the United Kingdom determines which European Union laws to replace or replicate. In addition, the announcement of Brexit has caused significant volatility in global stock markets and currency exchange rate fluctuations, including the strengthening of the USD against some foreign currencies, and the Brexit negotiations may continue to cause significant volatility. The progress and outcomes of these provisional and further trade deal negotiations also may create global economic uncertainty, which may cause customers and potential customers to monitor their costs and reduce their budgets for products and services. Any of these effects of Brexit, among others, could materially adversely affect the business, business opportunities, results of operations, financial condition and cash flows of our Company.
ITEM 1B. UNRESOLVED STAFF COMMENTS.
None.
| 34 |
None.
As of December 31, 2019,2022, the Company occupied approximately 400,000240,000 square feet of leased space in the United Kingdom, 3,3003,000 square feet of leased space elsewhere in Europe, 2,0003,200 square feet in New York and 4,00017,000 square feet in Kochi, India. The primary locations were as follows:
| ● | Approximately |
| ● | Approximately |
| ● | Approximately |
| ● | Approximately 2,000 square feet of offices on one floor in Rome, Italy. |
| ● | Approximately |
| ● | Approximately |
During the first half of 2020, we plan to consolidate the UK property estate and reduce the overall UK estate by 130,000 square footage.
During this same period, we also plan to complete the following:
From time to time, the Company is involved in legal matters arising in the ordinary course of business. While the Company believes that such matters are currently not material, there can be no assurance that matters arising in the ordinary course of business for which the Company is, or could be, involved in litigation, will not have an adverse effect on its business, financial condition or results of operations.
ITEM 4. MINE SAFETY DISCLOSURES.
Not applicable.
| 35 |
Not applicable.
ITEM 5. MARKET FOR REGISTRANT’S COMMON EQUITY, RELATED STOCKHOLDER MATTERS AND ISSUER PURCHASES OF EQUITY SECURITIES.
Market Information
Our common stock is listed and traded on the Nasdaq Capital Market under the symbol “INSE”. Our public warrants trade on the over-the-counter markets operated by OTC Markets Group under the symbol “INSEW”.
Holders
As of March 25, 2020,13, 2023, there were 6435 holders of record of our common stock and 11 holdersstock. This does not include the number of recordstockholders who hold shares of our warrants.common stock through banks, brokers or other financial institutions.
Recent Sales of Unregistered Securities
None.
Purchases of Equity Securities by the Issuer and Affiliated Purchasers
None.
The Company’s share repurchase activities for the three months ended December 31, 2022 were as follows(1):
| Period | Number of shares purchased | Average price paid per share(2) | Total number of shares purchased as part of publicly announced plans or programs | Maximum dollar value of shares that may yet be purchased under the plans or programs | ||||||||||||
| October 1, 2022 to October 31, 2022 | 39,469 | $ | 8.91 | 39,469 | $ | 14,555,517 | ||||||||||
| November 1, 2022 to November 30, 2022 | – | $ | – | – | $ | – | ||||||||||
| December 1, 2022 to December 31, 2022 | – | $ | – | – | $ | – | ||||||||||
| 39,469 | $ | 8.91 | 39,469 | $ | 14,555,517 | |||||||||||
| (1) | On May 10, 2022, the Company announced that its Board of Directors authorized the Company to repurchase up to $25.0 million of shares of the Company’s common stock (the “Share Repurchase Program”), exclusive of any fees, commissions or other expenses related to such repurchases, on or prior to May 10, 2025. The first repurchases under the Share Repurchase Program were made on May 24, 2022. | |
| (2) | The average price paid per share includes commissions related to the repurchases. |
We do not currently expect to pay cash dividends on our common stock and have not paid cash dividends on our common stock to date. Any future dividend payments are within the absolute discretion of our board of directors and will depend upon, among other things, our results of operations, working capital requirements, capital expenditure requirements, financial condition, level of indebtedness, contractual restrictions with respect to payment of dividends, business opportunities, anticipated cash needs, provisions of applicable law and other factors that our board of directors may deem relevant.
ITEM 6. SELECTED FINANCIAL DATA.[Reserved]
Not required.
31
ITEM 7. MANAGEMENT’S DISCUSSION AND ANALYSIS OF FINANCIAL CONDITION AND RESULTS OF OPERATIONS
The following discussion and analysis of our financial condition and results of operations should be read in conjunction with the financial statements and related notes thereto included elsewhere in this report. This discussion contains forward-looking statements that involve risks and uncertainties. Our actual future results could differ materially from the historical results discussed below. Factors that could cause or contribute to such differences include, but are not limited to, those identified below and those discussed in the section titled “Risk Factors” included elsewhere in this report.
This “Management’s
Forward-Looking Statements
We make forward-looking statements in this Management’s Discussion and Analysis of Financial Condition and Results of Operations” has been amended and restated to give effect toOperations. For definitions of the restatement of our financial statements, as more fully described in “Restatement of Previously Reported Information” within Note 1 to our financial statements. For further detail regarding the restatement, see “Explanatory Note” and “Item 9A. Controls and Procedures.”
term Forward-Looking Statements,
We make forward-looking statements see the definitions provided in the Cautionary Note Regarding Forward-Looking Statements at the start of this Annual Report on Form 10-K. These forward-looking statements relate to expectations for future financial performance, business strategies or expectations for our business, and the timing and ability for us to complete currently contemplated or future acquisitions. Specifically, forward-looking statements may include statements relating to:
These forward-looking statements are based on information available as of the date hereof, and current expectations, forecasts and assumptions that involve a number of judgments, risks and uncertainties. Accordingly, forward-looking statements should not be relied upon as representing our views as of any subsequent date, and we do not undertake any obligation to update forward-looking statements to reflect events or circumstances after the date they were made, whether as a result of new information, future events or otherwise, except as may be required under applicable securities laws. As a result of a number of known and unknown risks and uncertainties, our actual results or performance may be materially different from those expressed or implied by these forward-looking statements. Some factors that could cause our actual results or performance to differ include:
Subsequent Events
Investors and potential investors are advised to review this annual report on Form 10-K in light of ongoing events. As with other businesses worldwide, we are experiencing severe disruption to our business as a result of the COVID-19 pandemic and the far-reaching actions of the governments of various countries where we do, and hope to do, business, as well as countries sourcing our supply chain.
The World Health Organization has declared COVID-19 to be a global pandemic. There have been a number of government-imposed emergency measures in many of the jurisdictions in which we operate in response to the pandemic. The duration of these measures are unknown, but include the closure of all retail venues (including pubs, bookmakers, holiday parks, and adult gaming centers), restrictions on all non-essential travel, social distancing, bans on public mobility and shelter in place measures. Retail operations of our customers in Italy, Greece, the U.S and the UK have closed and are no longer generating revenues for us. Our Interactive business, which includes Virtual Sports products, to the extent delivered online, remain operational.
Although there have been a number of government-supported initiatives (across our various geographies) proposed to ease the burden on businesses and employees, including employee retention schemes, credit relief and tax deferrals, there is still much uncertainty regarding the scope of these initiatives or their respective impact on our business.
While the situation is fluid, we have already experienced adverse effects on our business, which we are currently working to mitigate. Since mid-March, we have drawn down the full amount of GBP20.0 million (equivalent to $24.8 million at current exchange rates) on our revolving credit facility to provide additional near-term liquidity and cancelled or delayed material capital expenditures. Most recently, we implemented furloughs, reduced work hours and compensation levels, as well as additional measures across our entire business. The objective of these actions has been to lower our future cash expenditures for the period in which these initiatives remain in place.
Additionally, the Board has determined to (i) indefinitely delay the payment of accrued executive bonuses for the year ended December 31, 2019 and (ii) waive cash payments2022.
Seasonality
Our results of Board retainersoperations can fluctuate due to seasonal trends and other factors. Sales of our gaming machines can vary quarter on quarter due to both supply and demand factors. Player activity for our holiday parks is generally higher in the second and third quarters of the year, particularly during the summer months and slower during the first and fourth quarters of the year. Historical seasonality has been impacted by COVID-19 business disruptions and could continue to be disbursed duringimpacted in future periods.
| 36 |
COVID-19 Update
During the twelve-month period ended December 31, 2021, all land-based operations were either subject to lockdown or had social distancing restriction in place. These social distancing measures continued throughout Greece and Italy until the second quarter of 2020. The Executive Chairman has also voluntarily withdrawn his Employment Agreement from consideration at our upcoming annual meeting of stockholders and we are examining arrangements with all debtors. In addition, the Office of the Executive Chairman have consented to temporary reductions2022, however, were no longer in base pay, as described in Item 9B below.
Though we have seen an increase in our virtual/interactive business since the government-mandated closures, depending on the duration of the pandemic and government-mandated restrictions, as well as government-sponsored remediation regimes, the effects of these events are potentially catastrophic for the worldwide economy, including our business. However, the dynamic nature of the pandemic and government restrictions, as well as evolving potential for relevant, government sponsored business stimuli and creditor relief plans are neither quantifiable nor predictable as of this Report.
Overview
We are a global business-to-business gaming technology company, supplying Server Based Gaming (“SBG”) and Virtual Sports (which includes Interactive) systems to regulated lottery, betting and gaming operators worldwide through an “omni-channel” distribution strategy. We provide end-to-end digital gaming solutions on our proprietary and secure network, which accommodates a wide range of devices, including land-based gaming machine terminals, mobile devices such as smartphones and tablets and online computer and social applications.
Our key strategic priorities are to:
Our most recent fiscal year ended on December 31, 2019. On September 24, 2018, our Board of Directors determined, in accordance with our bylaws and the recommendation of the Audit Committee of our Board of Directors, to change our financial year, so that it begins on January 1 and ends on December 31 of each year, commencing on January 1, 2019. Subsequent to this change in financial year, we filed a transition report on Form 10-Q, covering the transition period of October 1, 2018 to December 31, 2018. Accordingly, this Form 10-K covers our financial year as amended, being the period from January 1, 2019 to December 31, 2019. Comparatives are shown for the calendar year period from January 1, 2018 to December 31, 2018, as shownplace in the accompanying reconciliation table.
On October 1, 2019, the Company completed the acquisition of the Gaming Technology Group (“NTG”) of Novomatic UK Ltd., a division of Novomatic Group, a leading international supplier of gaming equipment and solutions.
Our business is being and will continue to be adversely affected by the rapidly expanding nature of the coronavirus (COVID-19) pandemic. All venues offering land-based gaming, including our products, are closed for an indeterminate period of time in the jurisdictions in which we operate through governmental mandate. In addition, the extent of a significant economic impact from the pandemic may result in a decrease in the willingness or ability of consumers to engage in gambling activities. Land-based customers globally, and the United States, United Kingdom Greecefrom July 2021, and Italy specifically, are impacted by the COVID-19 pandemictherefore year on year comparisons may not be meaningful due to the closure of venues. There is also a possibility that player behavior may change following any resolution of the pandemic, including that consumers may spend less time or wager smaller amounts at gambling facilities. The pandemic is adversely affecting a broad range of our operations, including our ability to obtain and ship our products, our ability to continue to develop new products and services and the ability of our customers to pay outstanding amounts due to us. As a result of the significant reductions in revenue and other changes to our business, at least in the short term (which also affects other companies in our industry), we are working to protect our existing available liquidity by pro-actively managing capital expenditures and working capital as well as identifying both immediate and longer term opportunities for cost savings.COVID-19 impacts.
We expect, due to closures of land-based venues, that there could be a meaningful increase in our online revenues from slots and virtual sports but it is not possible to quantify any potential impact at this time. Prior to any COVID-19 impact, we would have expected this part of our business to account for approximately 10% of Company revenue during 2020.
As part of these efforts to preserve liquidity, the Company drew all remaining availability (£18.0 million ($23.8 million using rates prevailing at December 31, 2019)) under its £20 million ($26.4 million using rates prevailing at December 31, 2019) revolving credit facility on March 13, 2020.
Business Segments
We report our operations in three business segments, SBG, Virtual Sports (which includes Interactive, an operating segment which does not exceed the quantitative thresholds in Accounting Standards Committee (“ASC” 280-10-50-12), and Acquired Businesses (which is comprised of the aforementioned NTG business, acquired on October 1, 2019), representing our different products and services. We evaluate our business performance, resource allocation and capital spending on an operating segment level, where possible. We use our operating results and identified assets of each of our operating segments in order to make prospective operating decisions. Although our revenue and cost of sales (excluding depreciation and amortization) are reported exclusively by segment, we do include unallocated items in our consolidated financial statements for certain expenses including depreciation and amortization as well as selling, general and administrative expenses. Unallocated balance sheet line items include items that are a shared resource and therefore not allocated between operating segments.
In this report, we have changed how certain selling, general and administrative expenses are split between segments, reducing the allocation of costs within “Corporate Functions”, which management believes provides a more informed allocation. As such, we have restated the segment splits for the comparative prior periods in line with the revised allocations, to give a clear comparison with the current period. Commentary within this section refers to changes from the restated segment numbers.
Our SBG business segment designs, develops, markets and distributes a broad portfolio of games through our digital network architecture. Our SBG customers include UK licensed betting offices (“LBOs”), casinos, gaming hall operators, bingo operators and regulated operators of lotteries, as well as government-affiliated operators.
Our Virtual Sports business segment designs, develops, markets and distributes ultra-high-definition games that create an always-on sports wagering experience. Our Virtual Sports customers include virtual sports retail and digital operators, including regulated betting operators, lotteries, casinos, online operators and other gaming and lottery operators in the UK, continental Europe, Africa, Asia and North America. Our Interactive business segment (reported as part of Virtual Sports) comprises the offering of our SBG and Virtual Sports content via our remote gaming servers.
Our Acquired Businesses design, develop, market and distribute a broad portfolio of games through our digital network architecture. In addition, it operates analog gaming and amusement machines for certain customers, including UK pubs, adult gaming centers, motorway service stations and holiday resorts.
Revenue
We generate revenue in threefour principal ways: i) on a participation basis, ii) on a fixed rental fee basis, andiii) through product sales and iv) through software license fees. Participation revenue generally includes a right to receive a share of our customers’ gaming revenue, generated from (i) our Virtual Sports products placed with operators; (ii) our SBG terminals placed in gaming and lottery venues; (iii) licensing our game content and intellectual property to third parties; and (iv) our games on third-party online gaming platforms that are interoperable with our game servers.
The revenue recognition processes we applied prior to adoptiontypically as a share of ASC 606 align with the recognition and measurement guidancenet win but sometimes as a share of the new standard. Therefore, adoption of ASC 606 did not require a cumulative adjustment to opening equity.handle or “coin in” which represents the total amount wagered.
SBG
Revenue from SBG terminals, access to our content and SBG platform, including electronic table gaming products is recognized based upon a contracted percentage of the operator’s net winnings from the terminals’ daily use. Where this is not the case, revenue is based upon a fixed daily or weekly usage fee. We recognize revenue from these arrangements in accordance with the series guidance in ASC 606 over time on a daily basis over the term of the arrangement, or when not specified over the expected customer relationship period. Hardware sales take the form of a transfer of ownership of our developed gaming terminals, and are recognized at a point in time upon delivery.
Virtual Sports
Virtual sports retail revenue, which includes the provision of virtual sports content and services to retail betting outlets, and virtual sports online and mobile revenue, which includes the provision of virtual sports content and services to mobile and online operators, is based upon a contracted percentage of the operator’s net winnings or a fixed rental fee. We recognize revenue for these fees over time on a daily or weekly basis in accordance with the series guidance in ASC 606 over the term of the arrangement. These arrangements also typically include a perpetual license billed up front, granted to the customer for access to our gaming platform and content. As these up-front bills represent payment for future services, revenue from the licensing of perpetual licenses is recognized ratably over time, or when not specified, over the expected customer relationship period. Revenue from the development of bespoke games licensed on a perpetual basis to mobile and online operators is recognized at a point in time on delivery and acceptance by the customer.
Acquired Businesses
Revenue from gaming and amusement terminals, access to our content and SBG platform, including electronic table gaming products is recognized based upon a contracted percentage of the operator’s net winnings from the terminals’ daily use. Where this is not the case, particularly in the pub rental sector, revenue is based upon a fixed daily or weekly usage fee. We recognize revenue from these arrangements in accordance with the series guidance in ASC 606 over time on a daily basis over the term of the arrangement, or when not specified over the expected customer relationship period. Hardware sales take the form of a transfer of ownership of our developed gaming terminals, and are recognized at a point in time upon delivery.
Geographic Range
Geographically, more than halfthe majority of our revenue is derived from, and more than halfthe majority of our non-current assets are attributedattributable to, our UK operations, with theoperations. The remainder of our revenue is derived from, and non-current assets attributedattributable to, Italy, Greece and the rest of the world.world (including North America).
For the twelve months ended December 31, 2019,2022, we earnedderived approximately 68%73% of our revenue from the UK (including customers headquartered in the UK 13% inbut whose revenue is generated globally), 8% from Greece, 11% in Italy and the remaining 8%19% across the rest of the world. During the twelve months ended December 31, 2018,2021, we earnedderived approximately 63%71%, 17%, 13%9% and 7%20% of our revenue infrom those regions, respectively.
As of December 31, 2022, our non-current assets (excluding goodwill) were attributable as follows: 78% to the UK, 6% to Greece and 16% across the rest of the world.
Foreign Exchange
Our results are affected by changes in foreign currency exchange rates as a result of the translation of foreign functional currencies into our reporting currency and the re-measurement of foreign currency transactions and balances. The impact of foreign currency exchange rate fluctuations represents the difference between current rates and prior-period rates applied to current activity. The largest geographic region in which we operatethe largest portion of our business is operated is the UK and the British pound (“GBP”) is considered to be our functional currency. Our reporting currency is the U.S. dollar (“USD”). Our results are translated from our functional currency of GBP into the reporting currency of USD using average rates for profit and loss transactions and applicable spot rates for period-end balances. The effect of translating our functional currency into our reporting currency, as well as translating the results of foreign subsidiaries that have a different functional currency into our functional currency, is reported separately in Accumulated Other Comprehensive Income.
During the twelve months ended December 31, 2019,2022, we derived approximately 32%27% of our revenue from sales to customers outside the UK, compared to 37%29% during the twelve months ended December 31, 2018.2021.
In the section “Results of Operations” below, currency impacts shown have been calculated as the current-period average GBP:USD rate less the equivalent average rate in the prior period, multiplied by the current period amount in our functional currency (GBP). The remaining difference, referred to as functional currency at constant rate, is calculated as the difference in our functional currency, multiplied by the prior-period average GBP:USD rate. This is not a U.S. GAAP measure, but is one which management believes gives a clearer indication of results. In the tables below, variances in particular line items from period to period exclude currency translation movements, and currency translation impacts are shown independently.
Non-GAAP Financial Measures
We use certain financial measures that are not compliant with U.S. GAAP (“Non-GAAP financial measures”), including EBITDA and Adjusted EBITDA, to analyze our operating performance. In this discussion and analysis, we present certain non-GAAP financial measures, define and explain these measures and provide reconciliations to the most comparable U.S. GAAP measures. See “Non-GAAP Financial Measures” below.
| 37 |
Results of Operations
The following discussion and analysis of our results of operations has been organized in the following manner:
| ||
We changed our financial year-end from September 30 to December 31, effective for the fiscal year ended December 31, 2019, with our previous fiscal year-end was September 30, 2018. Subsequent to this change in financial year, we filed a transition report on Form 10-Q, covering the transition period of October 1, 2018 to December 31, 2018. As a result, we have provided results for the twelve-month period ended December 31, 2018 for comparative purposes. The results for the twelve months ended December 31, 2018 are unaudited.
The three-month financial periods presented consist of a 92-day period for each of 2018 and 2017. The balance sheet date for both 2018 and 2017 is December 31. Each of the foregoing periods is herein referred to as a “three-month period.”
Our results are affected by changes in foreign currency exchange rates, primarily between our functional currency (GBP) and our reporting currency (USD). InDuring the twelve-month periods ended December 31, 20192022 and 2018,December 31, 2021, the average GBP:USD rates were 1.28for the twelve-month period 1.23 and 1.34,1.37, respectively. In
The following discussion and analysis of our results of operations has been organized in the three-month periods ended December 31, 2018 and 2017, the average GBP: USD rate was 1.29 and 1.34, respectively.following manner:
| ● | a discussion and analysis of the Company’s results of operations for the twelve-month period ended December 31, 2022, compared to the same period in 2021; and | |
| ● | a discussion and analysis of the results of operations for each of the Company’s segments (Gaming, Virtual Sports, Interactive and Leisure) for the twelve-month periods ended December 31, 2022, compared to the same period in 2021, including KPI analysis. |
In the discussion and analysis below, certain data may vary from the amounts presented in our consolidated financial statements due to rounding. Year-on-year comparisons may not be meaningful due to COVID-19 impacts in prior period, as noted above.
For all reported variances, refer to the overall company and segment tables shown below. All variances discussed in the overall company and segment results are on a functional currency (at constant rate) basis, which excludes the impact of any changes in foreign currency exchange rates.
Overall Company Results
Twelve Months ended December 31, 20192022, compared to Twelve Months ended December 31, 20182021
| For the Twelve-Month | Variance | |||||||||||||||||||||||||||||||||||||||||||||||||||
| Period ended | Functional | |||||||||||||||||||||||||||||||||||||||||||||||||||
| Audited | Unaudited | Currency at | For the Twelve-Month | Variance | ||||||||||||||||||||||||||||||||||||||||||||||||
| Dec 31, | Dec 31, | Variance | Constant | Functional | Currency | Period ended | 2022 vs 2021 | |||||||||||||||||||||||||||||||||||||||||||||
| (In millions) | 2019 | 2018 | 2019 vs 2018 | rate | Currency | Movement | Dec 31, 2022 | Dec 31, 2021 | Variance Attributable to Currency Movement | Variance on a Functional currency basis | Total Functional Currency Variance % | Total Reported Variance % | ||||||||||||||||||||||||||||||||||||||||
| Revenue: | ||||||||||||||||||||||||||||||||||||||||||||||||||||
| Service | $ | 134.9 | $ | 130.6 | $ | 4.3 | 3.3 | % | $ | 10.2 | 7.8 | % | $ | (5.9 | ) | $ | 251.8 | $ | 183.3 | $ | (29.1 | ) | $ | 97.5 | 53.2 | % | 37.3 | % | ||||||||||||||||||||||||
| Hardware | 18.5 | 10.1 | 8.4 | 82.7 | % | 9.2 | 92.0 | % | (0.8 | ) | ||||||||||||||||||||||||||||||||||||||||||
| Product | 33.6 | 25.6 | (4.2 | ) | 12.3 | 48.0 | % | 31.4 | % | |||||||||||||||||||||||||||||||||||||||||||
| Total revenue | 153.4 | 140.7 | 12.7 | 9.0 | % | 19.4 | 13.8 | % | (6.8 | ) | 285.4 | 208.9 | (33.3 | ) | 109.8 | 52.6 | % | 36.6 | % | |||||||||||||||||||||||||||||||||
| Cost of sales, excluding depreciation and amortization: | ||||||||||||||||||||||||||||||||||||||||||||||||||||
| Cost of service | (23.5 | ) | (23.4 | ) | (0.1 | ) | 0.4 | % | (1.2 | ) | 4.9 | % | 1.1 | |||||||||||||||||||||||||||||||||||||||
| Cost of hardware | (12.6 | ) | (7.9 | ) | (4.7 | ) | 59.9 | % | (5.4 | ) | 69.6 | % | 0.7 | |||||||||||||||||||||||||||||||||||||||
| Cost of Sales, excluding depreciation and amortization: | ||||||||||||||||||||||||||||||||||||||||||||||||||||
| Cost of Service | (49.3 | ) | (34.3 | ) | 5.9 | (21.0 | ) | 61.3 | % | 43.9 | % | |||||||||||||||||||||||||||||||||||||||||
| Cost of Product | (22.7 | ) | (16.4 | ) | 2.9 | (9.2 | ) | 55.7 | % | 38.2 | % | |||||||||||||||||||||||||||||||||||||||||
| Selling, general and administrative expenses | (72.6 | ) | (59.0 | ) | (13.6 | ) | 23.0 | % | (16.8 | ) | 28.4 | % | 3.2 | (115.6 | ) | (97.2 | ) | 13.6 | (32.0 | ) | 33.0 | % | 18.9 | % | ||||||||||||||||||||||||||||
| Stock-based compensation | (9.0 | ) | (5.8 | ) | (3.2 | ) | 55.0 | % | (3.6 | ) | 61.6 | % | 0.4 | (10.8 | ) | (13.0 | ) | 1.2 | 1.0 | (7.8 | )% | (17.2 | )% | |||||||||||||||||||||||||||||
| Impairment expense | - | (7.7 | ) | 7.7 | (100.0 | )% | 7.9 | (100.0 | )% | (0.2 | ) | |||||||||||||||||||||||||||||||||||||||||
| Acquisition and integration related transaction expenses | (6.7 | ) | (0.3 | ) | (6.4 | ) | 1821.9 | % | (7.0 | ) | 1973.8 | % | 0.7 | (0.5 | ) | (1.6 | ) | 0.1 | 1.0 | (63.4 | )% | (67.6 | )% | |||||||||||||||||||||||||||||
| Depreciation and amortization | (42.0 | ) | (41.9 | ) | (0.1 | ) | 0.3 | % | (2.0 | ) | 4.8 | % | 1.9 | (37.6 | ) | (47.0 | ) | 4.2 | 5.2 | (11.1 | )% | (20.0 | )% | |||||||||||||||||||||||||||||
| Net operating Income (Loss) | (13.0 | ) | (5.3 | ) | (7.7 | ) | 147.0 | % | (8.6 | ) | 159.9 | % | 0.9 | 48.9 | (0.6 | ) | (5.4 | ) | 54.9 | (30632.3 | )% | (8714.8 | )% | |||||||||||||||||||||||||||||
| Other income (expense) | ||||||||||||||||||||||||||||||||||||||||||||||||||||
| Interest income | 0.1 | 0.2 | (0.1 | ) | (67.3 | )% | (0.1 | ) | (66.4 | )% | (0.0 | ) | ||||||||||||||||||||||||||||||||||||||||
| Interest expense | (27.8 | ) | (19.8 | ) | (8.0 | ) | 40.2 | % | (9.3 | ) | 47.0 | % | 1.3 | |||||||||||||||||||||||||||||||||||||||
| Change in fair value of earnout liability | (2.3 | ) | 5.7 | (8.0 | ) | (139.6 | )% | (8.0 | ) | (142.0 | )% | (0.0 | ) | |||||||||||||||||||||||||||||||||||||||
| Change in fair value of derivative liability | 3.0 | (4.9 | ) | 7.9 | (160.1 | )% | 8.3 | (161.3 | )% | (0.4 | ) | |||||||||||||||||||||||||||||||||||||||||
| Interest expense, net | (25.4 | ) | (44.3 | ) | 3.2 | 15.7 | (35.7 | )% | (42.7 | )% | ||||||||||||||||||||||||||||||||||||||||||
| Change in fair value of warrant liability | (4.1 | ) | 20.7 | (24.8 | ) | (119.6 | )% | (24.3 | ) | (119.4 | )% | (0.5 | ) | - | 0.9 | - | (0.9 | ) | (100.0 | )% | (100.0 | )% | ||||||||||||||||||||||||||||||
| Loss from equity method investee | (0.1 | ) | - | (0.1 | ) | N/A | (0.1 | ) | N/A | 0.0 | ||||||||||||||||||||||||||||||||||||||||||
| Profit on disposal of trade & assets | 0.9 | - | (0.0 | ) | 0.9 | N/A | N/A | |||||||||||||||||||||||||||||||||||||||||||||
| Other finance income (expense) | 3.2 | 3.2 | (0.0 | ) | (0.2 | )% | 0.1 | 2.1 | % | (0.1 | ) | 1.1 | 5.7 | (0.1 | ) | (4.5 | ) | (78.0 | )% | (80.2 | )% | |||||||||||||||||||||||||||||||
| Total other income (expense), net | (28.0 | ) | 5.1 | (33.0 | ) | (650.6 | )% | (33.3 | ) | (733.8 | )% | 0.3 | (23.4 | ) | (37.7 | ) | 3.1 | 11.2 | (29.2 | )% | (38.0 | )% | ||||||||||||||||||||||||||||||
| Net (loss) income from continuing operations before income taxes | (41.0 | ) | (0.2 | ) | (40.8 | ) | NM | (1) | (42.0 | ) | NM | (1) | 1.2 | |||||||||||||||||||||||||||||||||||||||
| Net Income (loss) from continuing operations before income taxes | 25.5 | (38.3 | ) | (2.3 | ) | 66.1 | (177.4 | )% | (166.6 | )% | ||||||||||||||||||||||||||||||||||||||||||
| Income tax expense | (0.1) | (0.2 | ) | 0.1 | (57.0 | )% | 0.1 | (48.1 | )% | 0.0 | (3.2 | ) | 1.6 | 0.4 | (5.3 | ) | (329.4 | )% | (303.3 | )% | ||||||||||||||||||||||||||||||||
| Net (loss) income | $ | (41.1 | ) | $ | (0.4 | ) | $ | (40.7 | ) | NM | (1) | $ | (41.9 | ) | NM | (1) | $ | 1.2 | ||||||||||||||||||||||||||||||||||
| Net Income (Loss) | $ | 22.3 | $ | (36.7 | ) | $ | (1.9 | ) | $ | 60.9 | (170.5 | )% | (160.7 | )% | ||||||||||||||||||||||||||||||||||||||
| Exchange Rate - $ to £ | 1.28 | 1.34 | 1.23 | 1.37 | ||||||||||||||||||||||||||||||||||||||||||||||||
See “Segments Results” below for a more detailed explanation of the significant changes in our components of revenue within the individual segment results of operations.
Revenue
Consolidated Reported Revenue by Segment
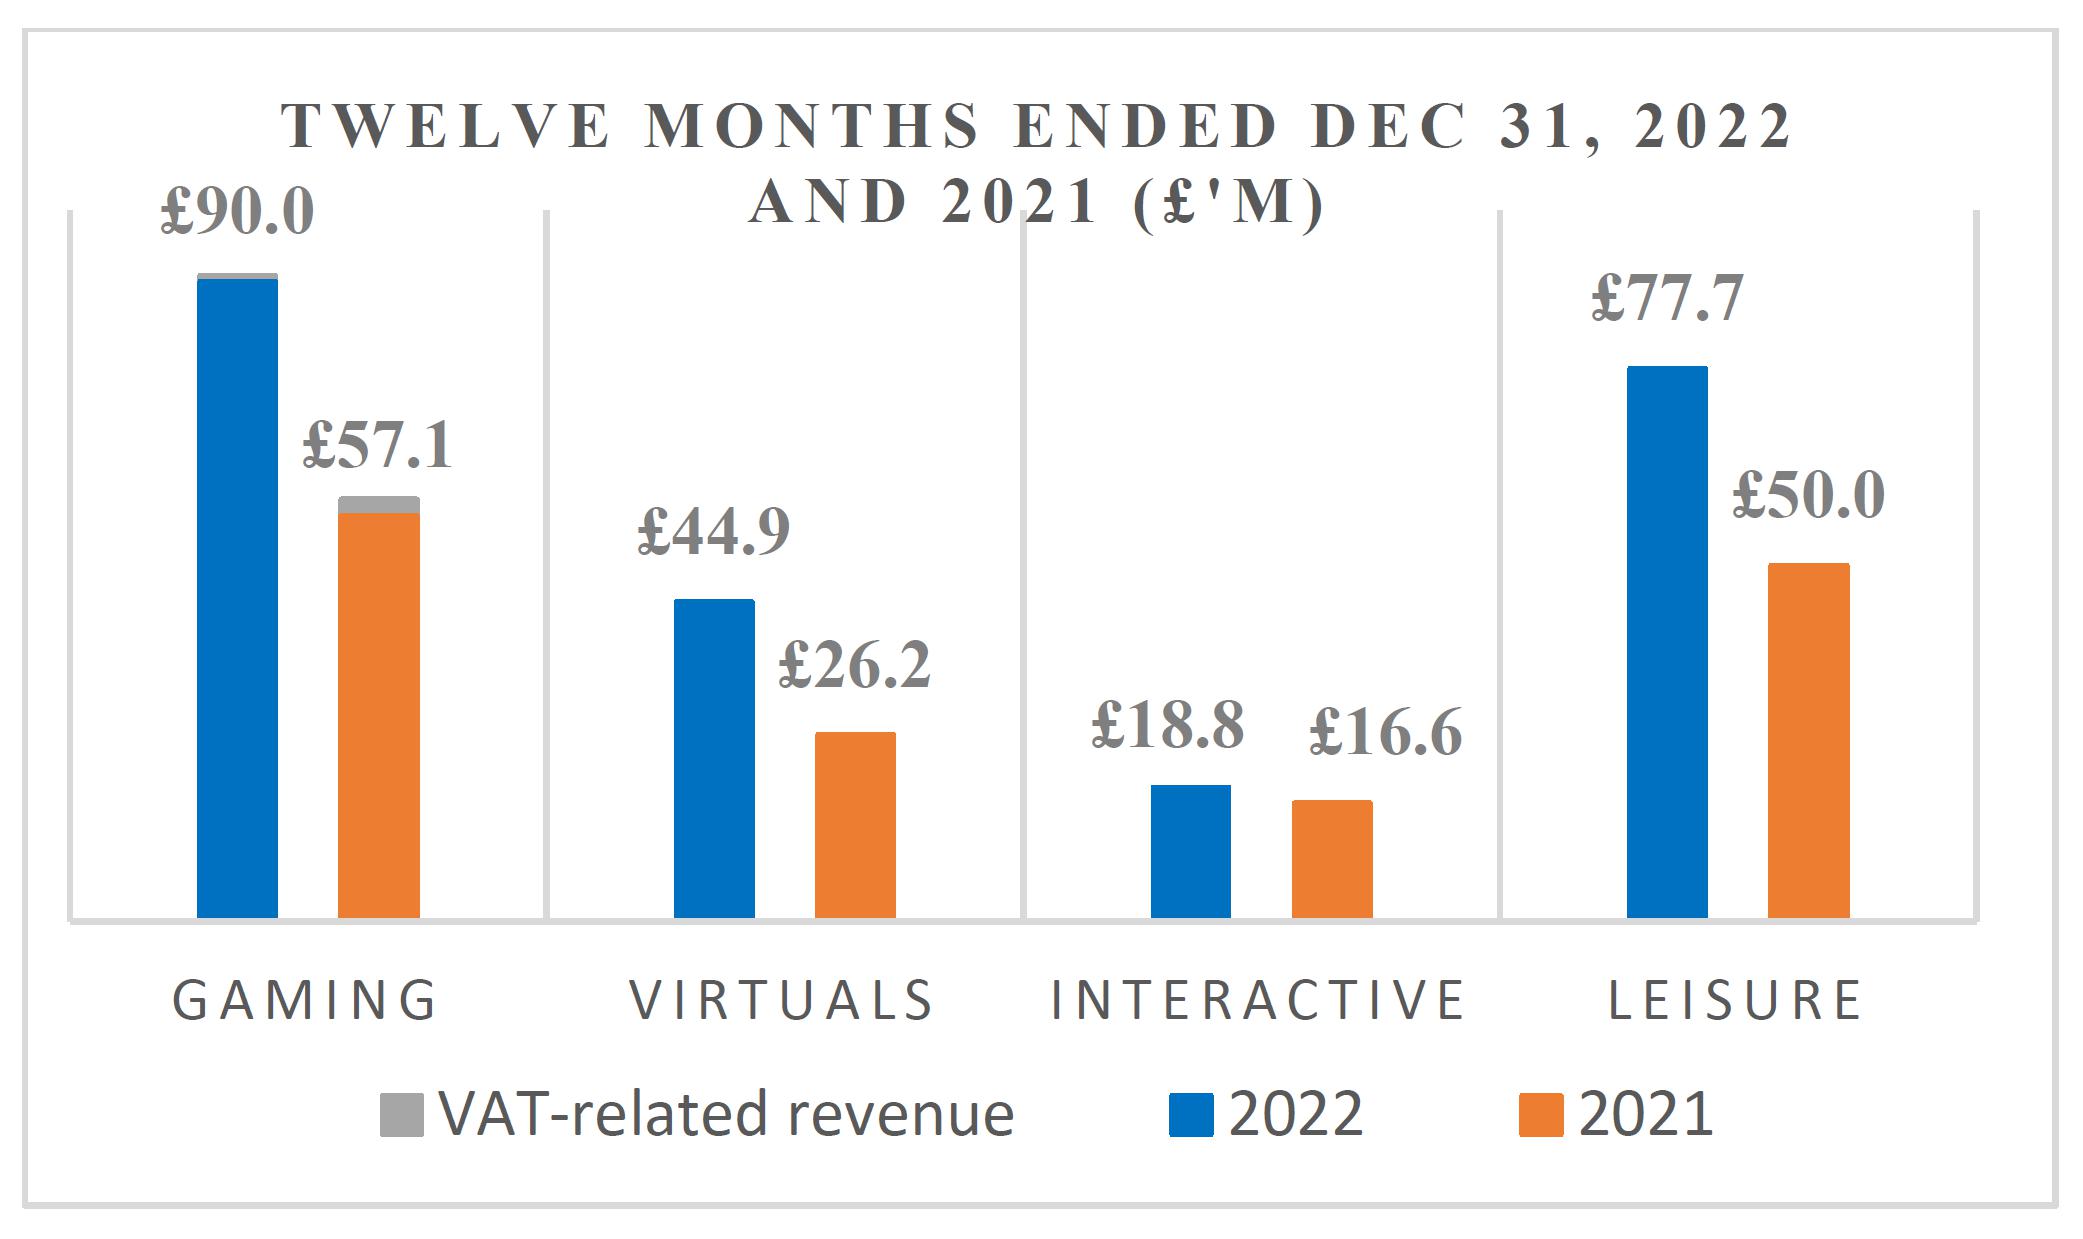
| ● | VAT-related revenue for the twelve-months ended December 31, 2022 was $1.0 million, and for the twelve-months ended December 31, 2021 was $3.1 million. |
“VAT-related revenue” are payments from UK customers related to our contractual revenue share of their value-added tax rebate.
For the twelve months ended December 31, 2022, revenue on a functional currency (at constant rate) basis increased by $109.8 million, or 53%.
For the twelve-month period, Leisure and Gaming service revenue grew by $38.4 million and $30.4 million, respectively, predominately due to COVID-19 related closures and restrictions in the first six months of the prior year. Virtual Sports and Interactive grew by $25.7 million and $3.0 million, respectively, with $22.6 million of the Virtuals Sports increase from Online and $3.1 million from Retail.
| 38 |
Total reported revenue
Cost of Sales, excluding depreciation and amortization
Cost of sales, excluding depreciation and amortization, for the twelve months ended December 31, 20192022, increased by $12.7$30.2 million, or 9.0%,60%. The increase was driven by Cost of Service of $21.0 million due to $153.4 million on a reported basis. Adverse currency movements accounted for $6.8 million. On a functional currency at constant rate basis, revenue increased by $19.4 million, or 13.8%, with service revenue increasing by $10.2 million and hardware revenue increasing by $9.2 million. The changeCOVID-19 related closures in total reported revenue was comprised of a decrease of $18.8 million in SBG revenue, a decrease of $0.4 million in Virtual Sports revenue, offset by an increase in revenue of $32.9 million from the new Acquired Businesses segment. This was offset by $1.0 million in intercompany eliminations.
SBG revenue, which is included in total reported revenue, above, decreased by $15.0 million on a functional currency at constant rate basis, or 14.5%, comprised of a reduction in service revenue of $19.0 millionprior period, and a $4.0$9.2 million increase in hardware sales.
SBG service revenue decreased by $22.1 million on a reported basis, of which $3.1 million was attributable to adverse currency movements. On a functional currency at constant rate basis, SBG service revenue decreased by $19.0 million, or 20.4%, to $71.0 million. This was primarily due to a decrease in revenue in the UK LBO sector of $16.2 million, of which $15.6 million was driven by the Triennial Implementation and $0.5 million due to the expiry of a service contract. Additionally, there was a revenue reduction in the Greek sector of $0.9 million driven by a reduction in software license sales of $6.0 million, partly offset by the continued terminal rollout which drove additional income of $5.1 million. Revenue in the Italian sector decreased by $2.2 million due mainly to a 1.7% tax rate increase on gross stakes driving a $2.9 million reduction as well as a decline in gross win per unit per day that resulted in a $0.2 million revenue decline. This was partly offset by $0.5 million from additional unit volume, $0.3 million from an increase in license sales and $0.2 million from a full year of revenue share terms changes with two major customers.
SBG hardware revenue increased by $3.4 million to $13.5 million, on a reported basis, despite adverse currency movements of $0.7 million. On a functional currency at constant rate basis, SBG hardware revenue increased by $4.0 million. The increase in hardware revenue was driven by 328 “Flex” cabinet sales to two major customers in the UK Bingo & AGC sectors of $2.5 million, the sale of 116 ValorTM terminals in the North American sector of $1.7 million, additional sales of 467 SSBTs in the UK LBO sector of $2.0 million, the sale of 32 Flex terminals to a UK LBO customer of $0.3 million and 75 Sabre HydraTM sales to a major customer in the UK ETG sector of $1.3 million. These were partly offset by nil margin sales of 600 “Flex” cabinet sales to a major UK LBO customer of $4.0 million.
Virtual Sports reported revenue decreased by $0.4 million. A $1.7 million decrease occurred due to adverse currency movements. On a constant currency basis, Virtual Sports revenue increased by $1.3 million, or 3.5%, of which $2.1 million was driven by an increase in Virtual Sports land-based and Scheduled Online Virtual recurring revenue and $0.4 million was driven by an increase in Interactive recurring revenue. There was an additional $0.9 million increase from non-recurring revenue. This was partly offset by $1.3 million from a major customer that experienced a decline in retail venues, the rephasing of an annual contract and a decline in general trading as well as $0.8 million due to a reduction in revenue from long-term Virtual Sports licenses that have now come to an end.
Acquired Businesses revenue accounted for $27.6 million of service revenue and $5.3 million of hardware revenue, reflecting its ownership by the Company for the period from October 1, 2019 through December 31, 2019. $8.6 million was generated from rental fees from Category C gaming machines within the Pub business in the UK, which includes 8,590 Category C digital and analog gaming machines. An additional $5.6 million in revenue was generated through the UK leisure parks business and $6.2 million generated from machine rentals to UK MSAs and AGCs.
Cost of sales, excluding depreciation and amortizationProduct.
Cost of sales, excluding depreciation and amortization, which includes machine cost of sales, consumables, content royalties and connectivity costs, increased by $4.8 million, or 15.4%, on a reported basis, to $36.1 million. On a functional currency at constant rate basis, cost of sales increased by $6.5 million, or 20.9%. Of this increase, $1.5 million was attributable to an increase in SBG hardware; gross margin for SBG hardware increased from 22.3% to 32.5% in the period, primarily due to sales of the ValorTM cabinet and additional ETGs, which yield higher gross profits per machine, $7.3 million was attributable to the acquisition of the Acquired Businesses (comprised of $3.5 million in service costs and $3.8 million in hardware costs), offset by a decrease in cost of service for Virtual Sports of $1.3 million. This was partly offset by favorable currency movements of $1.7 million.
Selling, general and administrative expenses
Selling, general and administrative (“SG&A&A”) expenses for the twelve months ended December 31, 2022 increased by $13.6$32.0 million, or 23.0%, on a reported basis, to $72.6 million, This included $3.2 million of favorable currency movements. On a functional currency at constant rate basis, SG&A increased by $16.8 million, or 28.4%33%. This
The increase was driven primarily by incremental selling, general and administrative expenses of $20.1 million from Acquired Businesses. This was partly offset by labor savings of $4.0 million (of which $4.9 million was made in conjunction with Post Triennial Implementation), facilities cost savings of $1.1 million, IT-related cost savings of $0.5 million and other cost savings of $0.2 million. This was partly offset by anthe increase in the costsstaff cost of group restructure of $0.5 million (removed from Adjusted EBITDA) and a decrease in net labor capitalization and manufacturing recoveries of $1.7$29.2 million, due to mixthe return of projectsfurloughed staff and lower factory throughputreturn to full pay for the current period as a resultwell as wage inflation particularly increases in the ‘UK’s national living wage’ of fewer machines being built.6.6% (The National Living Wage is an obligatory minimum wage payable to workers in the United Kingdom).
Stock-based compensation
During the yeartwelve months ended December 31, 2019,2022, the Company recorded an expenseexpenses of $9.0$10.8 million, with respectcompared to outstanding awards. Of this expense, $6.0expenses of $13.0 million, related to costs from awards made underfor the 2016 Long Term Incentive Plan, $2.8 million from awards made under the 2018 Plan and $0.3 million related to costs from the vesting of awards in December 2019. The entirety of this cost related to recurring costs, with the 2018 Plan awards impacted by movements in the stock price between the award granting date and May 14, 2019, the date the scheme was formally approved by stockholders. Following approval, the cost was no longer impacted by stock price movements being charged by the same method as all other award plans. During the yeartwelve months ended December 31, 2018, the charge for stock-based compensation was $5.8 million. Of this expense, $5.6 million2021. All expenses related to costs fromoutstanding awards, made underbut the 2016 Long Term Incentive Plan and $0.2twelve months ended December 31, 2021, included $1.4 million from awards made underof shares that fully vested on the 2018 Plan. The entiretydate of this cost is related to recurring costs.grant.
Acquisition and integration related transaction expenses
Acquisition related transaction expenses increased by $6.4During the twelve months ended December 31, 2022, the Company recorded an expense of $0.5 million, on a reported basis,compared to $6.7 million. The entiretyan expense of $1.6 million, for the 2019 and 2018 period expenses weretwelve months ended December 31, 2021.
Expenses in both years related to work in respectintegration costs for the Company’s acquisition of potential acquisitions, with the 2019 expensesboth Gaming Technology Group of Novomatic UK Ltd., and acquisition costs of Sportech Lotteries, LLC as well as costs relating to the acquisition and third-party integration fees linked exclusively to the acquisition and integration of NTG.potential acquisitions.
Impairment expense
Impairment expense decreased by $7.7 million as there was no charge in the current period, but a $7.7 million expense in the prior period. This expense in the prior period was considered to be outside the normal course of business. Following a review of key strategic plans and therefore future priority areas by the Office of the Executive Chairman, the carrying value of these assets were deemed to be in excess of their current fair value.
Depreciation and amortization
Depreciation and amortization increaseddecreased for the twelve-month period by $0.1 million, or 0.3%, on a reported basis, to $42.0$5.2 million. This included the impact of favorable currency movements of $1.9 million.
On a functional currency at constant rate basis, depreciation and amortization increased by $2.0 million, or 4.8%. This increase was mostly driven by incrementalGaming and Leisure with reductions of $4.0 million and $1.0 million. The decrease in Gaming was due to a decrease in software amortization as software becomes fully amortized and machine depreciation and amortizationas machines in Greece become fully depreciated.
Net operating income/(loss)
During the twelve-month period, net operating income was $48.9 million, an increase of $5.9 million from Acquired Businesses. This was partially offset by a $4.2 million decrease of depreciation and amortization$54.9 million. These increases were attributable primarily to the increases in SBG and Virtual Sports. This wasrevenue driven by lower machinethe COVID-19 closures and machine-relatedrestrictions in 2021, as well as growth in online revenue and the decrease in depreciation, of $3.8 million and lower amortization of $0.4 million, driven by lower amortization of platforms and games. The machine and machine-related depreciation decrease was driven by lower depreciation in the UK ($4.3 million) and Italy ($1.2 million) due to machines being fully depreciated, which was partly offset by additional depreciation in Greece of $1.7 million due to the additional volume of machines.
Net operating loss
During the period, net operating loss increased by $7.7 million from a loss of $5.3 million to a loss of $13.0 million on a reported basis. On a functional currency at constant rate basis, net operating loss increased by $8.6 million, mainly due to thean increase in revenue, more than offset by increases in costCost of sales and SG&A expenses, including a $0.9 million favorable currency movement. The net impact of the Triennial Implementation in the UK for the period (included in the above) was $8.7 million.expenses.
Interest expense, net
Interest expense, increasednet decreased by $8.1$15.7 million in the twelve-month period ended December 31, 2022, which was due to the refinancing in the previous year with savings due to $27.8 million, on a reported basis. Of the $27.8 million, $16.4 million related tolower debt interest and $9.4of $0.6 million, related to thelower debt fee amortization of capitalized debt fees. $5.4 million of the $16.4$0.9 million and $0.8the $14.1 million write-off of the $9.4 million related to the new debt with the remaining amountsfees relating to the previous debt including a $7.3 million expense writing off the remainder of the debt fees capitalized under the previous debt. Of the $8.1 million increase in the current year, $1.3 million was due to a favorable currency movement. On a functional currency at a constant rate basis, interest expense increased $9.3 million, or 47.0%, compared to the prior year. This was due to higher amortization of capitalized debt fees of $9.0 million (including the expense of $7.3 million as a result of the debt refinancing in connection with the acquisition of the Acquired Businesses in the year), higher debt interest costs of $4.3 million and favorable bank currency movements of $0.5 million were offset by savings of $4.8 million of PIK interest (no longer incurred following the debt refinancing in August 2018).
Change in fair value of earnout liability
Due solely to changes in the share price ($6.51 at March 25, 2019 and $4.80 at December 31, 2018) the charge in the year ended December 31, 2019 from a change in the fair value of earnout liability was $2.3 million. On March 25, 2019, the shares relating to the earnout liability were issued. In the prior year, due to changes in share price, the corresponding figure was a $5.7 million gain.
Change in fair value of derivative liability
Change in fair value of derivative liability decreased by $7.9 million, on a reported basis, to a $3.0 million credit for the year ended December 31, 2019, arising from the fair valuing of the cross-currency swaps executed in August 2018 in connection with the debt refinancing of the Company. This represents the unhedged amount of the cross-currency swap. For the year ended December 31, 2018, the change in fair value of derivative liability was a $4.9 million charge. Of this, $6.5 million represented the unhedged amount of the cross-currency swap with a $1.6 million gain for derivative awards which were converted to stock-based compensation awards in March 2018. On October 1, 2019 as part of the refinancing of the group, the cross-currency swaps were terminated.
Change in fair value of warrant liability
DueWith the expiration of the warrants on December 23, 2021, the liability and the requirement to changesrestate to fair value ceased to exist. For the twelve months ended December 31, 2021, the change in the valuationfair value of the warrant liability resulted in a gain of $0.9 million.
Gain on disposal of business
For the expense recorded intwelve-months ended December 31, 2022, gain on disposal of business was $0.9 million due to the year increased from $20.7 million income to $4.1 million loss.sale of part of our Italian Gaming operations (see Gaming key events for more information).
Other finance income
Other finance income for the yeartwelve months ended December 31, 20192022, was a credit of $3.2$1.1 million unchanged from the prior year. Changes in exchange rates resulted ingain. This compares to a loss of $3.3 million in retranslating the debt balance. This was offset by a $3.2$5.7 million gain fromfor the GBP:USD cross-currency swap entered intotwelve months ended December 31, 2021. The year-on-year movements relate solely to mitigate this impact, accounted for under hedge accounting, and a $0.1 million higher pension interest gain.the retranslation of the principal balance of our senior debt facilities in place in the previous year.
| 39 |
Income tax expense
Our effective tax rate for the periodtwelve months ended December 31, 20192022 was 0.2%(12.9%), compared to 4.2% for the twelve months ended December 31, 2021.
Deferred Tax
We recorded a valuation allowance against all of our deferred tax assets as of both December 31, 2022, and December 31, 2021. We intend to continue maintaining a full valuation allowance on our effectivedeferred tax rateassets until there is sufficient evidence to support the reversal of all or some portion of these allowances. However, given our current earnings and anticipated future earnings, we believe that there is a reasonable possibility that within the next 12 months, sufficient positive evidence may become available to allow us to reach a conclusion that a significant portion of the valuation allowance will no longer be needed. Release of the valuation allowance would result in the recognition of certain deferred tax assets and a decrease to income tax expense for the period ended December 31, 2018 was 1.0%.the release is recorded. However, the exact timing and amount of the valuation allowance release are subject to change on the basis of the level of profitability that we are able to actually achieve.
Net lossIncome/ (loss)
On a reported basis, net loss was $41.1 million compared to a net loss of $0.4 million in the prior period. This was mainly due to the decrease in operating income driven by the increase in acquisition and integration related transaction expenses, plus increases in interest expense, change in fair value of earnout liability and change in fair value of warrant liability. This was partly offset by a $7.9 million positive change in fair value of derivative liabilities.
Twelve Months ended December 31, 2019 compared to Twelve Months ended December 31, 2018 (unaudited) – Server Based Gaming Segment
We generate revenue from our SBG business segment through product sales (both hardware and software) and long-term participation agreements, which include access to our SBG platform and selection of game titles, usually over a term of between three and five years but longer in certain territories. Our participation contracts are typically structured to pay us a percentage of net win (defined as net revenue to our operator customers, after deducting player winnings, free bets or plays and any relevant regulatory levies) from SBG terminals placed in our customers’ facilities, which include retail outlets, casinos and other gaming operations, or from SBG gaming software used by customers’ players through mobile or online devices. Typically, we recognize revenue from these arrangements on a daily basis over the term of the contract.
Revenue growth for our SBG business is principally driven by the number of operator customers we have, the number of SBG machines in operation, the net win performance of the machines and the net win percentage that we receive pursuant to our contracts with our customers.
SBG Segment, Key Performance Indicators
For the Twelve-Month Period ended | Variance | |||||||||||||||
| Audited | Unaudited | |||||||||||||||
| Dec 31, | Dec 31, | 2019 vs 2018 | ||||||||||||||
| SBG | 2019 | 2018 | % | |||||||||||||
| End of period installed base (# of terminals) (1) | 32,698 | 34,577 | (1,879 | ) | (5.4 | )% | ||||||||||
| Average installed base (# of terminals) (2) | 34,151 | 32,371 | 1,780 | 5.5 | % | |||||||||||
| Customer Gross Win per unit per day (3) | £ | 84.05 | £ | 111.34 | £ | (27.29 | ) | (24.5 | )% | |||||||
| Customer Net Win per unit per day (3) | £ | 59.69 | £ | 79.28 | £ | (19.59 | ) | (24.7 | )% | |||||||
| Inspired Blended Participation Rate | 6.2 | % | 6.1 | % | 0.1 | % | ||||||||||
In the table above:
“End of Period Installed Base” is equal to the number of deployed SBG terminals at the end of each period that have been placed on a participation basis. SBG participation revenue, which comprises the majority of SBG service revenue, is directly related to the terminal installed base. This is the medium by which customers generate revenue and distribute a revenue share to the Company. To the extent all other “KPI “and certain other factors” being equal” remain constant, the larger the installed base, the higher the Company’s revenue will be for that period. Management gives careful consideration to this KPI in terms of driving growth across the segment.
Revenue is derived from the performance of the installed base as described by the Gross and Net Win KPIs.
If the End of Period Installed Base is materially different from the Average Installed Base (described below), we believe this gives an indication as to potential future performance. The End of Period Installed Base is particularly useful for assessing new customers or sectors, to indicate the progress being made with respect to entering new territories or jurisdictions.
“Average Installed Base” is the average number of deployed SBG terminals during the period. Therefore, it is more closely aligned to revenue in the period. This measure is particularly useful for assessing existing customers or sectors to provide comparisons of historical size and performance.
“Customer Gross Win per unit per day” is a KPI used by our internal decision makers to (i) assess impact on the Company’s revenue, (ii) determine changes in the strength of the overall market and (iii) evaluate the impacts of regulatory change and our new content releases on our customers. Customer Gross Win per unit per day is the average per unit cash generated across all SBG terminals in which the Company takes a participation revenue share across all territories in the period, defined as the difference between the amounts staked less winnings to players divided by the Average Installed Base in the period, then divided by the number of days in the period.
SBG revenue share income accrued in the period is derived from Customer Gross Win accrued in the period after deducting gaming taxes (defined as a regulatory levy paid by the Customer to government bodies) and applying the Company’s contractual revenue share percentage.
Our internal decision makers believe Customer Gross Win measures are meaningful because they represent a view of customer operating performance that is unaffected by our revenue share percentage and allow management to (1) readily view operating trends, (2) perform analytical comparisons and benchmarking between customers and (3) identify strategies to improve operating performance in the different sectors in which we operate.
“Customer Net Win per unit per day” is Customer Gross Win per unit per day after giving effect to the deduction of gaming taxes.
“Inspired Blended Participation Rate” is the Company’s average revenue share percentage across all terminals where revenue is earned on a participation basis, weighted by Customer Net Win per unit per day.
Our overall SBG revenue from terminals placed on a participation basis can therefore be described as the product of the Average Installed Base, the Customer Net Win per unit per day, the number of days in the period, and the Inspired Blended Participation Rate, to give “participation revenue”.
SBG Segment, key events that affected results for the Twelve Months ended December 31, 2019
During the twelve-month period, Customer Gross Win per unit per day in the total UK sector (including non-LBO UK sectors) decreased by 24.9%. Thisnet income was due mainly to the Triennial Implementation in the UK. The revenue impact$22.3 million, an increase of this regulatory change was in line with our expectations.
During the period, an additional 1,152 SSBTs were sold and deployed in the UK LBO sector, of which 526 were sold in the fourth quarter. In addition to hardware sales margin, these terminals also generate a recurring service fee.
During the third quarter of 2019, the Company secured an extension to supply hardware, platform, content and service into the UK LBO sector with our largest customer for an additional three years. This agreement runs to the end of 2022 and includes minimal capital expenditure in exchange for a slight reduction in revenue share versus current terms.
In the UK Casino sector, we sold 278 “Flex” B3 terminals split between two major customers. These terminals will also generate a recurring software rental fee and content revenue share to the Company in future periods.
In the UK Electronic Table Games (ETG) sector, we sold 205 Sabre Hydra TM terminals to a major Casino customer with a further 150 on the order book for the second part of 2020.
During the period, first time sales were recorded in the North American sector. Hardware sales of 116 ValorTM terminals were made in Illinois.
We were awarded a further 580 contracted terminals in Greece, 380 of which are our new “Valor VIP” cabinet bringing the total number of our contracted terminals in Greece to 8,940. Our SBG rollout into the Greek sector continued with a further 2,106 terminals being deployed on site.. Despite increased density, the performance of our Greek terminals continues to be strong relative to our competitors.
In Italy, customer Net Win per unit per day (in EUR) decreased by €13, or 29.3%,$60.9 million year-over-year, primarily due to an increase in the average revenue tax of 1.7% from 6.9% in 2018 to 8.6% in 2019 as well as a decline in Gross Win per unit per day (EUR).
Our end of period Installed Base of terminals showednet operating income $54.9 million, a decrease of 1,879, or 5.4%, to 32,698. This was due to 700 shop closures (representingin interest expense, net $15.7 million, a decrease of 2,800 terminals) by a major customer in the UK LBO sector resulting from the Triennial Implementation, however this happened in the thirdother finance income ($4.5 million) and fourth quarters and therefore had less of an impact on the average installed base. Growth of over 2,100 VLT’s in the Greek sector partly offset the decline in the UK.
Customer Gross Win per unit per day (in our functional currency, GBP) decreased by 24.5% across the entire estate, driven mainly by the reduction in maximum permitted bets on B2 gaming machines in the UK and the impact of our SBG installations in Greece, as our Greek machines return a lower daily Customer Gross Win compared to our UK machines. These impacts, along with a 1.7% average increase in income tax expense of ($5.3 million).
Segment Results (for the Italian revenue tax rate, partly offset by reduced tax in the UK LBO sector post triennial, led to a Net Win per unit per day decrease on total SBG of 24.7%. Our blended participation rate increased by 0.1% to 6.2% in 2019.
SBG Segment, Twelve Monthstwelve months ended December 31, 20192022, compared to Twelve Monthsthe twelve months ended December 31, 20182021)
Server Based Gaming
| For the Twelve-Month | Variance | |||||||||||||||||||||||||||
| Period ended | Functional | |||||||||||||||||||||||||||
| Audited | Unaudited | Currency at | ||||||||||||||||||||||||||
| Dec 31, | Dec 31, | Variance | Constant | Functional | Currency | |||||||||||||||||||||||
| (In millions) | 2019 | 2018 | 2019 vs 2018 | rate | Currency | Movement | ||||||||||||||||||||||
| Revenue: | ||||||||||||||||||||||||||||
| Service | $ | 71.0 | $ | 93.2 | $ | (22.1 | ) | (23.8 | )% | $ | (19.0 | ) | (20.4 | )% | $ | (3.1 | ) | |||||||||||
| Hardware | 13.5 | 10.1 | 3.4 | 33.5 | % | 4.0 | 40.4 | % | (0.7 | ) | ||||||||||||||||||
| Total revenue | 84.5 | 103.3 | (18.8 | ) | (18.2 | )% | (15.0 | ) | (14.5 | )% | (3.8 | ) | ||||||||||||||||
| Cost of sales, excluding depreciation and amortization: | ||||||||||||||||||||||||||||
| Cost of service | (17.6 | ) | (18.8 | ) | 1.2 | (6.6 | )% | 0.1 | (0.7 | )% | 1.1 | |||||||||||||||||
| Cost of hardware | (9.1 | ) | (7.9 | ) | (1.2 | ) | 15.9 | % | (1.5 | ) | 18.8 | % | 0.2 | |||||||||||||||
| Total cost of sales | (26.7 | ) | (26.7 | ) | (0.0 | ) | 0.0 | % | (1.3 | ) | 5.0 | % | 1.3 | |||||||||||||||
| Selling, general and administrative expenses | (23.6 | ) | (30.8 | ) | 7.2 | (23.2 | )% | 6.0 | (19.5 | )% | 1.1 | |||||||||||||||||
| Impairment expense | - | (4.7 | ) | 4.7 | (100.0 | )% | 4.8 | (100.0 | )% | (0.1 | ) | |||||||||||||||||
| Stock-based compensation | (1.7 | ) | (1.1 | ) | (0.6 | ) | 56.3 | % | (0.7 | ) | 63.1 | % | 0.1 | |||||||||||||||
| Depreciation and amortization | (29.1 | ) | (34.3 | ) | 5.2 | (15.1 | )% | 3.8 | (11.2 | )% | 1.3 | |||||||||||||||||
| Net operating Income (Loss) | $ | 3.4 | $ | 5.7 | $ | (2.3 | ) | (41.0 | )% | $ | (2.3 | ) | (40.7 | )% | $ | (0.0 | ) | |||||||||||
| Exchange Rate - $ to £ | 1.28 | 1.34 | ||||||||||||||||||||||||||
SBG segment revenue
In the period revenue decreased by $18.8 million, to $84.5 million, on a reported basis. Adverse currency movements accounted for $3.8 million. On a functional currency at constant rate basis, SBG revenue decreased by $15.0 million, or 14.5%.
Service revenue decreased by $22.1 million on a reported basis, of which $3.1 million was attributable to adverse currency movements. On a functional currency at constant rate basis, SBG service revenue decreased by $19.0 million, or 20.4%, to $71.0 million. This was primarily due to a decrease in revenue in the UK LBO sector of $16.2 million, of which $15.6 million was driven by the Triennial Implementation and $0.5 million due to the expiring of a service contract.
Additionally, there was a reduction in the Greek sector of $0.9 million driven by a reduction in software license sales of $6.0 million, partly offset by the continued terminal rollout which drove additional income of $5.2 million.
Revenue in the Italian sector decreased by $2.2 million on a functional currency at constant rate basis due mainly to a 1.7% tax rate increase on gross stakes driving a $2.9 million reduction as well as a decline in gross win per unit per day that resulted in a $0.2 million revenue decline. This was partly offset by $0.5 million from additional unit volume, $0.3 million from an increase in license sales and $0.2 million from a full year of revenue share terms changes with two major customers. Revenue in UK Other increased by $0.5 million due to a one-off contract sale during the period of $0.7 million and additional revenue of $0.2 million driven by terminal upgrades with one customer, partly offset by an expiry of a service contract of $0.2 million and lower ETG software sales of $0.2 million.
UK LBO Customer Gross Win per unit per day decreased by 24.9% due to the Triennial Implementation. The revenue impact of this regulatory change was in line with our expectations, improving consecutively each quarter since the Triennial Implementation launched on April 1, 2019. The decline in Gross Win for the fourth quarter was 21.1%, a significant improvement over the third quarter impact of 37.5% and the second quarter impact of 41.1%. The vast improvement in the fourth quarter is a result of 700 closures of the lower end shops in our largest customer and new game content going live across the full UK LBO estate.
Hardware revenue increased by $3.4 million to $13.5 million, on a reported basis, despite adverse currency movements of $0.7 million. On a functional currency at constant rate basis, SBG hardware revenue increased by $4.0 million. The increase in hardware revenue was driven by 328 “Flex” cabinet sales to two major customers in the UK Bingo & AGC sectors of $2.5 million, our first 116 terminal sale of the ValorTM cabinet in the North American sector of $1.7 million, additional sales of 467 SSBTs in the UK LBO sector of $2.0 million, the sale of 32 Flex terminals to a UK LBO customer of $0.3 million and 75 “Sabre Hydra” sales to a major customer in the UK ETG sector of $1.3 million. These are partly offset by nil margin sales of 600 “Flex” cabinet sales to a major UK LBO of $4.0 million.
SBG segment operating income. Cost of sales (excluding depreciation and amortization) remained flat, on a reported basis. Favorable currency movements of $1.3 million offset a $1.3 million increase in cost of sales on a functional currency at constant rate basis.
The above was driven by an increase in hardware cost of sales of $1.5 million due to Flex sales in the UK Bingo & AGC sectors of $2.2 million, SSBT & Flex sales in the UK LBO sector of $1.9 million, ValorTM sales in North America of $0.9 million and Sabre HydraTM sales in the ETG sector of $0.6 million. These were partly offset by nil margin Flex sales in the UK LBO sector of $4.0 million from the previous period that did not recur in 2019.
Service costs decreased by $0.1 million on a functional currency at constant rate basis. This was driven by a reduction in UK consumables of $1.0 million due to the Triennial Implementation and lower spares costs and content costs in Italy of $0.6 million, mostly offset by an increase in Greek SBG service costs of $1.0 million driven by the increase in terminals as the Greece rollout continued and increased UK LBO content costs of $0.5 million.
SG&A expenses decreased by $7.2 million to $23.6 million, on a reported basis. This included $1.1 million of favorable currency movements. This resulted in a functional currency at constant rate decrease of $6.0 million attributable to staff-related cost savings of $5.8 million (of which approximately $4.4 million was made in conjunction with the Triennial Implementation), facilities cost savings of $0.5 million, lower IT-related costs of $0.4 million driven by lower headcount, lower costs of group restructure of $0.2 million and other cost savings of $0.8 million. This was partly offset by $1.9 million lower labor capitalization and manufacturing recoveries due to lower headcount, mix of projects and lower factory throughput as a result of fewer machines being built in the period.
An impairment expense in the prior period, considered to be outside of the normal course of business, amounted to $4.7 million, due to the review of key strategic areas by the Office of the Executive Chairman. This resulted in a functional currency at constant rate decrease of $4.7 million.
Depreciation and amortization decreased by $5.2 million, to $29.1 million on a reported basis. Of this amount, $1.3 million was due to favorable currency movements. On a functional currency at constant rate basis, the decrease was $3.8 million, from lower machine and machine-related depreciation. The lower machine and machine-related depreciation was driven by lower depreciation in the UK ($4.3 million) and Italy ($1.2 million) due to machines being fully depreciated, partly offset by the additional machine and machine-related depreciation in Greece of $1.7 million due to the additional terminals in the Greek sector.
Operating income decreased by $2.3 million, to $3.4 million, on a reported basis. On a functional currency at constant rate basis, SBG operating income increased by $2.3 million. This was primarily due to the decrease in revenue, partly offset by lower SG&A expenses, impairment expense and depreciation and amortization.
SBG Segment, Recurring Revenue
Set forth below is a breakdown of our SBG recurring revenue. SBG recurring revenue consists principally of SBG participation revenue.
| For the Twelve-Month Period ended | ||||||||||||||||
| Audited | Unaudited | Variance | ||||||||||||||
| Dec 31, | Dec 31, | 2019 vs 2018 | ||||||||||||||
| (In £ millions) | 2019 | 2018 | % | |||||||||||||
| SBG Recurring Revenue | £ | 66.0 | £ | 77.2 | £ | (11.2 | ) | (14.5 | )% | |||||||
| Total SBG Revenue | ||||||||||||||||
| SBG Participation Revenue | £ | 46.2 | £ | 57.5 | £ | (11.3 | ) | (19.6 | )% | |||||||
| SBG Other Fixed Fee Recurring Revenue | £ | 1.3 | £ | 1.9 | £ | (0.5 | ) | (27.6 | )% | |||||||
| Total SBG Recurring Revenue | £ | 47.6 | £ | 59.4 | £ | (11.8 | ) | (19.9 | )% | |||||||
| SBG Recurring Revenue as a Percentage of Total SBG Revenue | 72.1 | % | 76.9 | % | (4.8 | )% | ||||||||||
In the table above:
“SBG Participation Revenue” includes our share of revenue generated from (i) our SBG terminals placed in gaming and lottery venues; and (ii) licensing of our game content and intellectual property to third parties.
“SBG Other Fixed Fee Recurring Revenue” includes service revenue in which the Company earns a periodic fixed fee on a contracted basis.
“Total SBG Recurring Revenue” is equal to SBG Participation Revenue plus SBG Other Fixed Fee Recurring Revenue.
SBG Segment, Service Revenue by Region
Set forth below is a breakdown of our SBG service revenue by geographic region. SBG service revenue consists principally of SBG participation revenue.
| For the Twelve-Month | Variance | |||||||||||||||||||||||||||
| Period ended | Functional | |||||||||||||||||||||||||||
| Audited | Unaudited | Currency | ||||||||||||||||||||||||||
| Server Based Gaming Service Revenue by Region | Dec 31, | Dec 31, | Variance | at Constant | Functional | Currency | ||||||||||||||||||||||
| (In millions) | 2019 | 2018 | 2019 vs 2018 | rate | Currency | Movement | ||||||||||||||||||||||
| Service Revenue: | ||||||||||||||||||||||||||||
| UK LBO | $ | 39.1 | $ | 57.0 | $ | (17.9 | ) | (31.5 | )% | $ | (16.2 | ) | (28.4 | )% | $ | (1.8 | ) | |||||||||||
| UK Other | 6.0 | 5.8 | 0.2 | 4.0 | % | 0.5 | 8.8 | % | (0.3 | ) | ||||||||||||||||||
| Italy | 7.9 | 10.5 | (2.6 | ) | (24.4 | )% | (2.2 | ) | (21.3 | )% | (0.3 | ) | ||||||||||||||||
| Greece | 17.4 | 19.0 | (1.6 | ) | (8.6 | )% | (0.9 | ) | (4.6 | )% | (0.8 | ) | ||||||||||||||||
| Rest of the World | 0.7 | 0.9 | (0.2 | ) | (26.1 | )% | (0.2 | ) | (22.6 | )% | (0.0 | ) | ||||||||||||||||
| Total service revenue | $ | 71.0 | $ | 93.2 | $ | (22.1 | ) | (23.8 | )% | $ | (19.0 | ) | (20.4 | )% | $ | (3.2 | ) | |||||||||||
| Exchange Rate - $ to £ | 1.28 | 1.34 | ||||||||||||||||||||||||||
Results of Operations –
Twelve Months ended December 31, 2018 compared to Twelve Months ended December 31, 2019 –
Virtual Sports Segment
Our Virtual Sports products create a form of simulated sports betting in both a streaming and on-demand environment, overcoming the relative infrequency of live sporting events on which players can wager. We generate revenue from our Virtual Sports segment by licensing to our operator customers the software related to our Virtual Sports products, which consists of a complex graphics and networking software package that provides fixed-odds wagering on an ultra-high definition computer rendering of a virtual sporting event, such as soccer or boxing. Our customers pay us for the use of this software through either a fixed license fee per period, or on a participation basis based on the volume of customer net win. We also generate revenue by providing upfront services to our customers. Revenue growth for our Virtual Sports segment is driven by the number of customers, the number of player end-points and the customer net win attributable to our products.
Our customers for Virtual Sports include regulated betting operators, lotteries, casinos, online operators and other gaming and lottery operators in the UK, continental Europe, Asia, Africa and North America. Virtual Sports can be adapted to function in a sports betting, lottery, or gaming environment and is therefore available to a wide range of customers in both public and private implementations.
Virtual Sports Segment, Key Performance Indicators
| For the Twelve-Month Period ended | ||||||||||||||||
| Audited | Unaudited | Variance | ||||||||||||||
| Dec 31, | Dec 31, | 2019 vs 2018 | ||||||||||||||
| Virtuals | 2019 | 2018 | % | |||||||||||||
| No. of Live Customers at the end of the period | 111 | 100 | 11 | 11.0 | % | |||||||||||
| Average No. of Live Customers | 105 | 93 | 12 | 12.7 | % | |||||||||||
| Total Revenue (£'m) | £ | 29.0 | £ | 28.0 | £ | 1.0 | 3.5 | % | ||||||||
| Total Virtual Sports Recurring Revenue (£'m) | £ | 26.1 | £ | 25.5 | £ | 0.7 | 2.6 | % | ||||||||
| Total Revenue £'m - Retail | £ | 16.2 | £ | 17.2 | £ | (1.0 | ) | (6.0 | )% | |||||||
| Total Revenue £'m - Scheduled Online Virtuals | £ | 10.0 | £ | 8.3 | £ | 1.7 | 20.6 | % | ||||||||
| Total Revenue £'m - Interactive | £ | 2.8 | £ | 2.5 | £ | 0.3 | 12.5 | % | ||||||||
| Average Revenue Per Customer per day (£) | £ | 756 | £ | 823 | £ | (67 | ) | (8.2 | )% | |||||||
In the table above:
“No. of Live Customers at the end of the period” and “Average No. of Live Customers” represent the number of customers from which there is Virtual Sports revenue at the end of the period and the average number of customers from which there is Virtual Sports revenue during the period, respectively.
“Total Revenue (£000)” represents total revenue for the Virtual Sports segment, including recurring and upfront service revenue. Total revenue is also divided between “Total Revenue (£000) – Retail,” which consists of revenue earned through players wagering at Virtual Sports venues, “Total Revenue (£000) – Scheduled Virtuals,” which consists of revenue earned through players wagering on Virtual Sports online, and “Total Revenue (£000) – Mobile RGS,” which consists of revenue earned through our Mobile RGS product.
“Average Revenue per Customer per day” represents total revenue for the Virtual Sports segment in the period, divided by the Average No. of Live Customers, divided by the number of days in the period.
Virtual Sports Segment, Recurring Revenue
| For the Twelve-Month Period ended | ||||||||||||||||
| Audited | Unaudited | Variance | ||||||||||||||
| Dec 31, | Dec 31, | 2019 vs 2018 | ||||||||||||||
| (In £ millions) | 2019 | 2018 | % | |||||||||||||
| Virtual Sports Recurring Revenue | ||||||||||||||||
| Total Virtual Sports Revenue | £ | 29.0 | £ | 28.0 | £ | 1.0 | 3.5 | % | ||||||||
| Recurring Revenue - Retail and Scheduled Online Virtuals | £ | 23.5 | £ | 22.4 | £ | 1.1 | 4.9 | % | ||||||||
| Recurring Revenue - Interactive | £ | 2.7 | £ | 2.4 | £ | 0.3 | 12.9 | % | ||||||||
| Total Virtual Sports Recurring Revenue | £ | 26.2 | £ | 24.8 | £ | 1.4 | 5.7 | % | ||||||||
| Virtual Sports Recurring Revenue as a Percentage of Total Virtual Sports Revenue | 90.4 | % | 88.6 | % | 1.9 | % | ||||||||||
For definitions of the terms used in the table above, see the definitions provided above.
Virtual Sports segment, key events that affected results for the Twelve Months ended December 31, 2019
US
In the second phase of our Pennsylvania strategy we launched our proprietary Derby CashTM Horse Racing product in over 8,500 venues in November. This has shown significant year on year growth since launch.
During the period we signed a new contract with British Columbia Lottery Corporation to supply Virtuals on demand, slots and table content via our proprietary Virgo platform.
We have signed an exclusive worldwide license deal with the NFL Alumni to utilize the name, brand, image, persona and likeness of the NFLA members to be commercially used in virtual football games
In our Virtual Interactive division, we launched with Bet365 in New Jersey, a key launch for our US strategy.
In the Interactive division we have deployed our proprietary V-Play On-Demand and slot content to Caesars and Golden Nugget, New Jersey and Lotto Quebec, Canada. Performance has been strong since launch.
Europe
During the year we renewed our contract with Bet365 for a further three years to provide scheduled Virtuals online with the world’s largest online sports betting company with over 35 million customers worldwide.
In UK Retail, we deployed our Rush Bingo product on a dedicated channel to the Betfred estate of approximately 1,600 venues, which has seen significant growth throughout the year.
In Ireland Retail we deployed a fourth channel of Horse Racing with Boylesports across the full estate, this is driving year on year growth.
In the UK and Ireland, we launched our Quick 6 Bingo and two-minute Power Spin Roulette products across the full Paddy Power estate of over 750 venues We also renewed the Flutter Group contract for a further three years including Paddy Power and Betfair brands.
Our Virtual Interactive division launched our proprietary V-Play BasketballTM product with Bet Victor which has become very popular. We also deployed our proprietary 1st Down TM and Head 2 Head Football TM products with Bet365 on two additional channels and launched two streams of our V Play FootballTM product with The Stars Group brand Betstars.
During the second quarter, our Interactive division launched new content, including Bear MoneyTM and Book of the IrishTM, across the estate, which have performed strongly. In the third quarter we launched new content, Rainbow CashpotsTM and Mighty Hot WildsTM, which have both performed well. In the final quarter we launched our first product under the licensing deal with Jaromir Jagr, Jagr’s Super SlotTM and three additional key titles, Book of ChristmasTM, Desperado’s WildTM and Mega CherryTM that have all performed well.
Rest of World
We launched Rush Football 2TM with the Moroccan Lottery via the Intralot platform in approximately 200 venues and increased to 400 venues by the end of the year. The Moroccan venues are amongst our most successful worldwide and the addition of these extra venues has driven growth in the quarter and is expected to drive growth through 2020.
Awards
In February, the Gaming International Awards were held at ICE 2019 and Inspired was named Virtual Supplier of the Year.
The EGR B2B awards were held in June where Inspired was awarded Virtual Sports Supplier of the Year.
The Average Number of Live Customers during the twelve-month period increased by twelve overall, from 93 to 105, including 17 new Interactive customers.
Virtual Sports segment, Twelve Months ended December 31, 2019 compared to Twelve Months ended December 31, 2018
| Virtual Sports | For the Twelve-Month | Variance | ||||||||||||||||||||||||||
| Period ended | Functional | |||||||||||||||||||||||||||
| Audited | Unaudited | Currency at | ||||||||||||||||||||||||||
| Dec 31, | Dec 31, | Variance | Constant | Functional | Currency | |||||||||||||||||||||||
| (In millions) | 2019 | 2018 | 2019 vs 2018 | rate | Currency | Movement | ||||||||||||||||||||||
| Service Revenue | $ | 37.0 | $ | 37.4 | $ | (0.4 | ) | (1.0 | )% | $ | 1.3 | 3.5 | % | $ | (1.7 | ) | ||||||||||||
| Cost of Service | (3.2 | ) | (4.6 | ) | 1.4 | (30.9 | )% | 1.3 | (27.6 | )% | 0.2 | |||||||||||||||||
| Selling, general and administrative expenses | (8.7 | ) | (11.3 | ) | 2.6 | (22.8 | )% | 2.3 | (19.9 | )% | 0.3 | |||||||||||||||||
| Impairment expense | - | (3.0 | ) | 3.0 | (100.0 | )% | 3.0 | (100.0 | )% | (0.0 | ) | |||||||||||||||||
| Stock-based compensation | (1.4 | ) | (1.0 | ) | (0.4 | ) | 42.9 | % | (0.5 | ) | 49.4 | % | 0.1 | |||||||||||||||
| Depreciation and amortization | (5.5 | ) | (6.1 | ) | 0.7 | (10.7 | )% | 0.4 | (6.3 | )% | 0.3 | |||||||||||||||||
| Net operating Income (Loss) | $ | 18.2 | $ | 11.5 | $ | 6.8 | 59.5 | % | $ | 7.8 | 68.4 | % | $ | (1.0 | ) | |||||||||||||
| Exchange Rate - $ to £ | 1.28 | 1.34 | ||||||||||||||||||||||||||
Virtual Sports segment revenue. In the period, on a reported revenue basis, revenue decreased by $0.4 million with a $1.7 million decrease from adverse currency movement. On a functional currency at constant rate basis, Virtual Sports revenue increased by $1.3 million, or 3.5%, driven by a $2.1 increase in Virtual Sports land-based and Schedule Online Virtual recurring revenue. This consisted of growth in Scheduled Online Virtuals of $1.1 million, followed by UK and Ireland retail increasing $0.9 million, $0.3 million from Belgium and Denmark retail and $0.4 million from new business in Morocco. This was offset by a $0.4 million decline in Italy and a $0.2 million decline in Finland from the changing of a fixed price contract.
Interactive revenue in the period increased by $0.4 million due to new customers and content launches. This was offset by adverse results from the point of consumption tax increase in the UK, regulatory changes in Sweden and uncontrollable external delays in new territories from longer than expected regulatory requirements and testing processes.
A further $0.9 million of Virtual Sports growth in the year was driven by non-recurring revenue consisting of $0.7 million from the recognition of historical revenues previously unreported from a major customer and $0.2 million from an increase in one-time sales. This was partly offset by $1.3 million from a major customer that experienced a decline in retail venues, the rephasing of an annual contract and a decline in trading as well as $0.8 million due to a reduction in revenue from long-term Virtual Sports licenses that have now come to an end.
Virtual Sports segment operating income. Cost of service decreased by $1.4 million to $3.2 million on a reported basis. Of this decrease, $0.2 million arose from favorable currency movements. On a functional currency at constant rate basis, cost of service decreased by $1.3 million, due to lower third party royalty payments primarily driven by lower revenues in the year from a major customer and a decline in royalties.
SG&A expenses decreased by $2.6 million, on a reported basis. Of this decrease, $0.3 million arose from favorable currency movements. This resulted in a functional currency at constant rate decrease of $2.3 million in the period largely driven by staff-related cost savings of $0.7 million and lower Italian tax-related costs of $0.5 million.
Depreciation and amortization decreased by $0.7 million to $5.5 million, on a reported basis. Of this increase, 0.3 million arose from favorable currency movements. This resulted in a functional currency at constant rate decrease of $0.4 million, driven by additional depreciation of platforms and games going live including Tyson, World Leaders and Rush Bingo.
Operating profit increased by $6.8 million on a reported basis to $18.2 million. On a functional currency at constant rate basis, operating profit increased by $7.8 million driven by an increase in revenue, a decrease in cost of service, lower SG&A expenses and lower impairment expense. This was partly offset by a $1.0 million decrease from adverse currency movements.
48
Acquired Businesses segment, key events that affected results for the Three Months ended December 31, 2019 (since consummation of acquisition)
We generate revenue from our Acquired Businesses segment through the manufacturing, marketing,sales and rentalrentals of our gaming machines and gaming software. We manufacture gaming machines for rental to UK pubs, adult gaming centers, bowling alleys, motorway service stations, and UK leisure parks, as well as for sale.machines. We receive rental fees for machines, typically on ain conjunction with long-term contract basis,contracts, on both a participation and fixed fee basis, with our digital Category C pub machines typically contracted on a fixed fee basis. Our participation contracts are typically structured to pay us a percentage of net win (defined as net revenue to our operator customers, after deducting player winnings, free bets or plays and any relevant regulatory levies) from gaming terminals placed in our customers’ facilities. Typically, we recognize revenue from these arrangements on a daily basis over the term of the contract.
The Acquired Businesses also generate revenue from UK leisure parks, where we supply gaming arcades, as well as non-gaming amusement machines. In addition, we also supply non-gaming amusement machines in pubs and other facilities on a fixed rental basis.
Revenue growth for our Acquired BusinessesGaming business is principally driven by changes in (i) the number of operator customers we have, (ii) the number of gamingGaming machines in operation, (iii) the net win performance of the machines and (iv) the increase in weekly rental incomenet win percentage that we receive pursuant to our contracts with our customers.
Acquired Businesses segment,Gaming, Key Performance Indicators
| For the Three-Month Period ended | ||||||||||||||||
| Audited | Unaudited | Variance | ||||||||||||||
| Dec 31, | Dec 31, | 2019 vs 2018 | ||||||||||||||
| Acquired Business | 2019 | 2018 | % | |||||||||||||
| Pub Digital Cat C Gaming Machines - Average installed base (# of terminals) | 5,413 | 3,769 | 1,644 | 43.6 | % | |||||||||||
| Inspired Pubs Revenue per Digital Cat C Gaming Machine per week | £ | 68.46 | £ | 61.43 | £ | 7.03 | 11.4 | % | ||||||||
| Pub Analogue Digital Cat C Gaming Machines - Average installed base (# of terminals) | 3,177 | 4,615 | (1,438 | ) | (31.2 | )% | ||||||||||
| Inspired Pubs Revenue per Analogue Cat C Gaming Machine per week | £ | 42.81 | £ | 42.14 | £ | 0.67 | 1.6 | % | ||||||||
| End of Period % of Digital Cat C Gaming Machines in Pub Market | 66.2 | % | 47.7 | % | 18.5 | % | ||||||||||
| Total Leisure Parks Revenue (Gaming and Non Gaming) (£'m) | £ | 4.3 | £ | 3.8 | £ | 0.6 | 14.6 | % | ||||||||
| AGC and MSA Gaming Machines - Average installed base (# of terminals)(1) | 4,948 | 5,955 | (1,007 | ) | (16.9 | )% | ||||||||||
| Inspired AGC and MSA Revenue per Gaming Machine per week | £ | 75.09 | £ | 61.26 | £ | 13.83 | 22.6 | % | ||||||||
| (1) Adult Gaming Centers and Motorway Service Area machines | ||||||||||||||||
For the Twelve-Month Period ended | Variance 2022 vs 2021 | |||||||||||||||
| Gaming | Dec 31, 2022 | Dec 31, 2021 | % | |||||||||||||
| End of period installed base (# of terminals) (3) | 35,003 | 31,891 | 3,112 | 9.8 | % | |||||||||||
| Total Gaming - Average installed base (# of terminals) (3) | 34,781 | 31,894 | 2,886 | 9.0 | % | |||||||||||
| Participation - Average installed base (# of terminals) (3) | 31,268 | 29,189 | 2,079 | 7.1 | % | |||||||||||
| Fixed Rental - Average installed base (# of terminals) | 3,512 | 2,705 | 807 | 29.8 | % | |||||||||||
| Service Only - Average installed base (# of terminals) | 16,854 | 21,563 | (4,709 | ) | (21.8 | )% | ||||||||||
| Customer Gross Win per unit per day (1) (2) (3) | £ | 91.0 | £ | 50.7 | £ | 40.4 | 79.7 | % | ||||||||
| Customer Net Win per unit per day (1) (2) (3) | £ | 66.5 | £ | 37.7 | £ | 28.7 | 76.2 | % | ||||||||
| Inspired Blended Participation Rate | 5.7 | % | 6.4 | % | (0.7 | )% | (10.9 | )% | ||||||||
| Inspired Fixed Rental Revenue per Gaming Machine per week (2) | £ | 47.8 | £ | 26.3 | £ | 21.4 | 81.4 | % | ||||||||
| Inspired Service Rental Revenue per Gaming Machine per week (2) | £ | 4.7 | £ | 3.4 | £ | 1.3 | 36.9 | % | ||||||||
| Gaming Long term license amortization (£’m) | £ | 4.3 | £ | 5.0 | £ | (0.7 | ) | (13.9 | )% | |||||||
| Number of Machine sales | 2,927 | 3,372 | (545 | ) | (16.2 | )% | ||||||||||
| Average selling price per terminal | £ | 7,918 | £ | 4,436 | £ | 3,482 | 78.85 | % | ||||||||
| (1) | Includes all SBG terminals in which the Company takes a participation revenue share across all territories. |
| (2) | Includes all days of the year, including the days during which the Gaming terminals were not operating due to COVID-19 closures. |
| (3) | Includes circa 2,500 of lottery terminals (zero in the prior year) where the share is on handle instead of net win. |
In the table above:
“End of Period Installed Base” is equal to the number of deployed Gaming terminals at the end of each period that have been placed on a participation or fixed rental basis. Gaming participation revenue, which comprises the majority of Gaming Service revenue, is directly related to the participation terminal installed base. This is the medium by which our customers generate revenue and distribute a revenue share to the Company. To the extent all other KPIs and certain other factors remain constant, the larger the installed base, the higher the Company’s revenue would be for a given period. Management gives careful consideration to this KPI in terms of driving growth across the segment. This does not include Service Only terminals.
Revenue is derived from the performance of the installed base as described by the Gross and Net Win KPIs.
| 40 |
If the End of Period Installed Base is materially different from the Average Installed Base (described below), we believe this gives an indication as to potential future performance. We believe the End of Period Installed Base is particularly useful for assessing new customers or markets, to indicate the progress being made with respect to entering new territories or jurisdictions.
“Total Gaming - Average Installed Base” is the average number of deployed Gaming terminals during the period split by Participation terminals and Fixed Rental terminals. Therefore, it is more closely aligned to revenue in the period. We believe this measure is particularly useful for assessing existing customers or markets to provide comparisons of historical size and performance. This does not include Service Only terminals.
“Participation - Average Installed Base” is the average number of deployed Gaming terminals that generated revenue on a participation basis.
“Fixed Rental - Average Installed Base” is the average number of deployed Gaming terminals that generated revenue on a fixed rental basis.
“Service Only - Average Installed Base” is the average number of terminals that generated revenue on a Service only basis.
“Customer Gross Win per unit per day” is a KPI used by our management to (i) assess impact on the Company’s revenue, (ii) determine changes in the performance of the overall market and (iii) evaluate the impacts of regulatory change and our new content releases on our customers. Customer Gross Win per unit per day is the average per unit cash generated across all Gaming terminals in which the Company takes a participation revenue share across all territories in the period, defined as the difference between the amounts staked less winnings to players divided by the Average Installed Base in the period, then divided by the number of days in the period.
Gaming revenue accrued in the period is derived from Customer Gross Win accrued in the period after deducting gaming taxes (defined as a regulatory levy paid by the Customer to government bodies) and applying the Company’s contractual revenue share percentage.
Our management believes Customer Gross Win measures are meaningful because they represent a view of customer operating performance that is unaffected by our revenue share percentage and allow management to (1) readily view operating trends, (2) perform analytical comparisons and benchmarking between customers and (3) identify strategies to improve operating performance in the different markets in which we operate.
“Customer Net Win per unit per day” is Customer Gross Win per unit per day after giving effect to the deduction of gaming taxes.
“Inspired Blended Participation Rate” is the Company’s average revenue share percentage across all participation terminals where revenue is earned on a participation basis, weighted by Customer Net Win per unit per day.
“Inspired Fixed Rental Revenue per Gaming Machine per week” is the Company’s average fixed rental amount across all fixed rental terminals where revenue is generated on a fixed fee basis, per unit per week.
“Inspired Service Rental Revenue per Gaming Machine per week” is the Company’s average service rental amount across all service only rental terminals where revenue is generated on a service only fixed fee basis, per unit per week.
“Gaming Long term license amortization” is the upfront license fee per terminal which is typically spread over the life of the terminal.
Our overall Gaming revenue from terminals placed on a participation basis can therefore be calculated as the product of the Participation - Average Installed Base, the Customer Net Win per unit per day, the number of days in the period, and the Inspired Blended Participation Rate, which is equal to “Participation Revenue”.
“Number of Machine sales” is the number of terminals sold during the period.
“Average selling price per terminal” is the total revenue in GBP of the Gaming terminals sold divided by the “number of Machine sales”.
| 41 |
Gaming, Recurring Revenue
Set forth below is a breakdown of our Gaming recurring revenue. Gaming recurring revenue principally consists of Gaming participation revenue and fixed rental revenue.
For the Twelve-Month Period ended | Variance 2022 vs 2021 | |||||||||||||||
| (In £ millions) | Dec 31, 2022 | Dec 31, 2021 | % | |||||||||||||
| Gaming Recurring Revenue | ||||||||||||||||
| Total Gaming Revenue | £ | 90.8 | £ | 59.4 | £ | 31.5 | 53.0 | % | ||||||||
| Gaming Participation Revenue | £ | 43.0 | £ | 27.7 | £ | 15.3 | 55.3 | % | ||||||||
| Gaming Other Fixed Fee Recurring Revenue | £ | 12.8 | £ | 6.9 | £ | 5.9 | 85.6 | % | ||||||||
| Gaming Long-term license amortization | £ | 4.3 | £ | 5.2 | £ | (0.8 | ) | (16.1 | )% | |||||||
| Total Gaming Recurring Revenue * | £ | 60.2 | £ | 39.8 | £ | 20.4 | 51.3 | % | ||||||||
| Gaming Recurring Revenue as a % of Total Gaming Revenue † | 66.3 | % | 67.0 | % | (0.8 | )% | ||||||||||
| Total Gaming excluding VAT-related revenue | £ | 90.0 | £ | 57.1 | ||||||||||||
| Gaming Recurring Revenue as a % of Total Gaming Revenue (excluding VAT-related revenue) | 66.9 | % | 69.7 | % | ||||||||||||
| * | Does not reflect VAT-related revenue. |
| † | Total Gaming Revenue for the twelve-month period ended December 31, 2022 and 2021, includes £0.8 million and £2.3 million, respectively of VAT-related revenue, which is not reflected in Gaming Recurring Revenue for that period. Excluding VAT-related revenue, Gaming Recurring Revenue was 67% and 70%, respectively of Total Gaming Revenue for such period. |
| Note – For the twelve-months ending December 31, 2022, there has been some recharacterization between Gaming Participation Revenue and Other Fixed fee revenue to ensure consistency with similar items across the Group. No changes to prior year. |
In the table above:
“Gaming Participation Revenue” includes our share of revenue generated from (i) our Gaming terminals placed in gaming and lottery venues; and (ii) licensing of our game content and intellectual property to third parties.
“Gaming Other Fixed Fee Recurring Revenue” includes service revenue in which the Company earns a periodic fixed fee on a contracted basis.
“Gaming Long term license amortization” – see the definition provided above.
“Total Gaming Recurring Revenue” is equal to Gaming Participation Revenue plus Gaming Other Fixed Fee Recurring Revenue.
Gaming, Service Revenue by Region
Set forth below is a breakdown of our Gaming service revenue by geographic region. Gaming Service revenue consists principally of Gaming participation revenue, Gaming other fixed fee revenue, Gaming long-term license amortization and Gaming other non-recurring revenue. See “Gaming Segment Revenue” below for a discussion of gaming service revenue between the periods under review.
| 42 |
| For the Twelve-Month | ||||||||||||||||||||
| Period ended | Variance | |||||||||||||||||||
| (In millions) | Dec 31, 2022 | Dec 31, 2021 | 2022 vs 2021 | Total Functional Currency % | ||||||||||||||||
| Service Revenue: | ||||||||||||||||||||
| UK LBO | $ | 40.7 | $ | 30.3 | $ | 10.4 | 34.2 | % | 49.4 | % | ||||||||||
| UK VAT - Related Income | 1.0 | 3.1 | $ | (2.1 | ) | (66.9 | )% | (65.5 | )% | |||||||||||
| UK Other | 12.1 | 7.9 | 4.2 | 52.6 | % | 69.0 | % | |||||||||||||
| Italy | 2.7 | 2.2 | 0.5 | 24.4 | % | 37.7 | % | |||||||||||||
| Greece | 18.1 | 14.9 | 3.2 | 21.6 | % | 35.1 | % | |||||||||||||
| Rest of the World | 0.7 | 0.4 | 0.4 | 96.1 | % | 114.0 | % | |||||||||||||
| Lotteries | 5.1 | - | 5.1 | NA | NA | |||||||||||||||
| Total Service revenue | $ | 80.4 | $ | 58.8 | $ | 21.6 | 36.8 | % | 51.8 | % | ||||||||||
| Exchange Rate - $ to £ | 1.24 | 1.37 | ||||||||||||||||||
Note: Exchange rate in the table is calculated by dividing the USD total service revenue by the GBP total service revenue, therefore this could be slightly different from the average rate during the period depending on timing of transactions.
Gaming, key events
Total Gaming Customer Gross Win per unit per day (in our functional currency, GBP) for the twelve-months ended December 31, 2022, increased by £40.4, or 80%, to £91.0. Much of the increase is driven by retail venues being closed during the first quarter of 2021 and part of the second quarter as a result of COVID-19 restrictions. Another factor was our first year recognizing the newly acquired Lottery business, which includes just under 2,500 lottery terminals (zero in the prior year) where the share is on handle instead of net win and achieves Gross Win per unit per day figures above the average of the remaining Gaming sector.
The overall participation rate for our installed base decreased from 6.4% for the twelve months ended December 31, 2021, to 5.7% in 2022. The decrease was due mainly to the new Lottery business, which delivers high gross win values at lower participation terms than the average of the remaining Gaming sector. The Lottery business operates close to 2,500 terminals in various locations in the Dominican Republic and has an agreement for the supply of these terminals until March 9, 2035. The twelve months of trading delivered $5.1 million of participation revenue.
Inspired rolled out new content across the UK LBO estate during the months of April and May 2022, which resulted in Gaming Customer Gross Win per unit per day increasing by 4.8% from the second half of 2021 to the second half of 2022 (This comparison is used rather than full year to help separate the impact of Covid closure in the first half of 2021).
| 43 |
During the twelve-months ended December 31, 2022, Inspired recognized contractual performance bonuses of $2.0 million within UK LBO segment. The bonus payments were triggered by strong year-on-year growth in Gaming Customer Gross Win per shop.
At the end of the second quarter of 2022, Inspired secured a five-year contract extension for service and content fees with one of its largest UK LBO customers. Over 400 “Vantage” terminals will go on trial during the first quarter of 2023 with the full roll out plan expected to commence in the fourth quarter of 2023, expecting to be complete by the end of first quarter of 2024.
During the fourth quarter of 2022, Inspired’s two other major UK LBO customers signed up for new five-year and four-year contracts respectively. Both customers will refresh their estate with the new “Vantage” terminal on their own capital expenditure, all installations are expected to be complete by the end of 2023.
During the twelve-month period, Inspired upgraded its Non-LBO UK gaming estate with the installation of 460 “Flex” and 700 “Prismatic” terminals through a combination of outright sales and lease agreements. In the Dutch gaming market, Inspired continued its strong relationship with a major customer, delivering outright sales of over 360 digital terminals, which included 100 in the third quarter and 160 in the fourth quarter.
In the UK Casino market, Inspired installed 183 “Sabre Hydra” terminals into venues which completed the full machine order of over 200 machines with a major customer.
In the North America market, Inspired sold 186 “Valor” terminals across a number of customers in Illinois. The total sales since launch in December 2019 are now over 880 terminals.
Inspired delivered its second machine order to Western Canada Lottery Corporation (WCLC), our second jurisdiction in North America. Inspired completed the outright sale of 820 “Valor Clamshell” terminals in the fourth quarter 2022 which represents the highest single machine order. As part of the agreement, Inspired will take back the original 100 “Valor” terminals in the second quarter of 2023, these terminals will either redeployed in North America or converted for another market.
During 2022, Inspired delivered the final 308 “Valor” terminals of a total 500-terminal award to OPAP (Greece) which include an upfront license fee, this takes Inspired’s contracted volumes to 9,440. Inspired rolled out new content during the third quarter, which has resulted in double-digit growth in Gaming Customer Gross Win per unit per day when compared to the second quarter.
In the Italian market, Inspired has transitioned to a content and platform supplier only model beginning January 1, 2022, driving significant operating expense savings. Inspired sold a large portion of its business to a major machine operator, including customer contracts and “in country” staff.
Gaming, Results of Operations
For the Twelve-Month Period ended | Variance 2022 vs 2021 | |||||||||||||||||||||||
| (In millions) | Dec 31, 2022 | Dec 31, 2021 | Variance Attributable to Currency Movement | Variance on a Functional currency basis | Total Functional Currency Variance % | Total Reported Variance % | ||||||||||||||||||
| Revenue: | ||||||||||||||||||||||||
| Service | $ | 80.4 | $ | 58.8 | $ | (8.8 | ) | $ | 30.4 | 51.8 | % | 36.8 | % | |||||||||||
| Product | 31.3 | 22.6 | $ | (4.0 | ) | 12.7 | 56.0 | % | 38.4 | % | ||||||||||||||
| Total revenue | 111.7 | 81.4 | (12.8 | ) | 43.1 | 53.0 | % | 37.2 | % | |||||||||||||||
| Cost of Sales, excluding depreciation and amortization: | ||||||||||||||||||||||||
| Cost of Service | (19.3 | ) | (12.8 | ) | $ | 2.3 | (8.8 | ) | 69.2 | % | 51.3 | % | ||||||||||||
| Cost of Product | (21.0 | ) | (14.4 | ) | $ | 2.7 | (9.3 | ) | 64.5 | % | 45.8 | % | ||||||||||||
| Total cost of sales | (40.3 | ) | (27.2 | ) | 5.0 | (18.1 | ) | 66.7 | % | 48.4 | % | |||||||||||||
| Selling, general and administrative expenses | (30.1 | ) | (28.1 | ) | $ | 3.6 | (5.6 | ) | 19.7 | % | 7.2 | % | ||||||||||||
| Stock-based compensation | (1.6 | ) | (1.8 | ) | $ | 0.2 | 0.0 | (0.9 | )% | (11.1 | )% | |||||||||||||
| Depreciation and amortization | (16.6 | ) | (22.5 | ) | $ | 2.0 | 4.0 | (17.8 | )% | (26.3 | )% | |||||||||||||
| Net operating Income (Loss) | $ | 23.1 | $ | 1.8 | $ | (2.1 | ) | $ | 23.4 | 1227.4 | % | 1156.3 | % | |||||||||||
| Profit on disposal of trade & assets | 0.9 | - | - | 0.9 | N/A | N/A | ||||||||||||||||||
| Net Income (Loss) | $ | 24.0 | $ | 1.8 | $ | (2.1 | ) | $ | 24.3 | 1280.2 | % | 1205.7 | % | |||||||||||
| Exchange Rate - $ to £ | 1.23 | 1.37 | ||||||||||||||||||||||
| 44 |
Note: Exchange rate in the table is calculated by dividing the USD total revenue by the GBP total revenue, therefore this could be slightly different from the average rate during the period depending on timing of transactions.
All variances discussed in the Gaming results below are on a functional currency (at constant rate) basis, which excludes the impact of any changes in foreign currency exchange rates.
Gaming Revenue
During the twelve-month period, Gaming revenue increased by $43.1 million, or 53%, this was driven by a $30.4 million increase in Service revenue and $12.7 million increase in Product revenue.
The increase in Gaming Service revenue was driven by $20.4 million from the UK market, $5.2 million from the Greek market and $0.9 million from the Italian market, as all venues were open for the entire period compared to the prior period when the majority of the UK estate, all Greece retail venues and all Italy retail venues were shut for some of the period and had restrictions for the remaining. $5.6 million of the increase was due to the addition of the new Lotteries market and $0.4 million from the rest of the world. This was offset by lower VAT-related revenue of $2.1 million.
Product revenue increase was primarily driven by higher Product sales of $9.3 million in North America, $3.3 million of UK sales and $2.0 million of higher spare sales, partly offset by lower sales of $2.1 million in Italy.
Gaming Operating Income
Operating income increased for the twelve-month period by $23.4 million. This increase was primarily due to the increase in revenues of $43.1 million and decrease in depreciation of $4.0 million, primarily due to the decrease in software amortization as software became fully amortized and due to a decrease in machine depreciation, as machines in Greece become fully depreciated. This was partially offset by an increase of Cost of sales of $18.1 million and increase of $5.6 million in SG&A, as staff returned from furlough or to full salary.
Gaming Net Income
For the twelve-month period, Net income increased by $24.3 million, from an income of $1.8 million to an income of $24.0 million. This was due to the increase in Operating income and a $0.9 million profit from the disposal of trade and assets from the sale of part of the Italian VLT operations (see Gaming key events for more information).
Virtual Sports
We generate revenue from our Virtual Sports segment through the licensing of our products. We receive fees in exchange for the licensing of our products, typically on a long-term contract basis, on a participation basis. Our participation contracts are typically structured to pay us a percentage of net win (defined as net revenue to our operator customers, after deducting player winnings, free bets or plays and other promotional costs and any relevant regulatory levies) from Virtual Sports content placed on our customers’ websites or in our customers’ facilities. Typically, we recognize revenue from these arrangements on a daily basis over the term of the contract.
| 45 |
Revenue growth for our Virtual Sports segment is principally driven by the number of customers we have, the net win performance of the games and the net win percentage that we receive pursuant to our contracts with our customers.
Virtual Sports, Key Performance Indicators
For the Twelve-Month Period ended | Variance 2022 vs 2021 | |||||||||||||||
| Virtuals | Dec 31, 2022 | Dec 31, 2021 | % | |||||||||||||
| No. of Live Customers at the end of the period | 66 | 61 | 5 | 8.2 | % | |||||||||||
| Average No. of Live Customers | 65 | 60 | 5 | 8.9 | % | |||||||||||
| Total Revenue (£’m) | £ | 44.9 | £ | 26.2 | £ | 18.7 | 71.4 | % | ||||||||
| Total Revenue £’m - Retail | £ | 9.5 | £ | 7.2 | £ | 2.2 | 31.2 | % | ||||||||
| Total Revenue £’m - Online Virtuals | £ | 35.4 | £ | 19.0 | £ | 16.5 | 86.7 | % | ||||||||
In the table above:
“No. of Live Customers at the end of the period” and “Average No. of Live Customers” represent the number of customers from which there is Virtual Sports revenue at the end of the period and the average number of customers from which there is Virtual Sports revenue during the period, respectively.
“Total Revenue (£m)” represents total revenue for the Virtual Sports segment, including recurring and upfront service revenue. Total revenue is also divided between “Total Revenue (£m) – Retail,” which consists of revenue earned through players wagering at Virtual Sports venues, “Total Revenue (£m) – Online Virtuals,” which consists of revenue earned through players wagering on Virtual Sports online.
Virtual Sports, Recurring Revenue
Set forth below is a breakdown of our Virtual Sports recurring revenue, which consists of Retail Virtuals and Online Virtuals recurring revenue as well as long-term license amortization. See “Virtual Sports Segment Revenue” below for a discussion of Virtual Sports Service revenue between the periods under review.
| For the Twelve-Month Period ended | Variance 2022 vs 2021 | |||||||||||||||
| (In £ millions) | Dec 31, 2022 | Dec 31, 2021 | % | |||||||||||||
| Virtual Sports Recurring Revenue | ||||||||||||||||
| Total Virtual Sports Revenue | £ | 44.9 | £ | 26.2 | £ | 18.7 | 71.2 | % | ||||||||
| Recurring Revenue - Retail Virtuals | £ | 9.2 | £ | 6.8 | £ | 2.4 | 34.8 | % | ||||||||
| Recurring Revenue - Online Virtuals | £ | 35.1 | £ | 18.1 | £ | 17.0 | 93.6 | % | ||||||||
| Total Virtual Sports Long-term license amortization | £ | 0.5 | £ | 0.8 | £ | (0.3 | ) | (34.6 | )% | |||||||
| Total Virtual Sports Recurring Revenue | £ | 44.8 | £ | 25.7 | £ | 19.0 | 73.9 | % | ||||||||
| Virtual Sports Recurring Revenue as a Percentage of Total Virtual Sports Revenue | 99.7 | % | 98.1 | % | 1.6 | % | ||||||||||
| 46 |
“Recurring Revenue” includes our share of revenue generated from (i) our Virtual Sports products placed with operators; (ii) licensing our game content and intellectual property to third parties; and (iii) our games on third-party online gaming platforms that are interoperable with our game servers.
“Virtual Sports Long term license amortization” is the upfront license fee which is typically spread over the life of the contract.
Virtual Sports, key events
During the period, we launched Virtual Horse racing with the DC Lottery into their lottery locations.
New contracts were signed with Scientific Games for Virtual Sports content to be sold to Netherlands Lottery (NLO), Goldbet covering the provision of Virtual Sports into both their retail and online channels in Italy and a contract for Class 4 VLT games in Ladbrokes Belgium retail.
We signed a long-term extension to our contract with Betfred covering the provision of Virtual Sports into their retail LBO estate in the UK. In addition, we signed contract term extensions with Bet Victor, Sisal (Italy), Niké, spol. s r.o (Slovakia) and additional territories were added to our contract with Kaizen Gaming.
A new Virtuals Plug and Play contract was signed with Morocco Lottery and launched, plus an extension to the retail contract.
We launched Virtuals Women’s Soccer to coincide with UEFA Women’s Euro 2022. We also launched Matchday multi-stream with one of our biggest online customers and Matchday Ultra 2 and Soccer Ultra 2 with SNAI (Italy) retail and online, and optimized OPAP retail schedule increasing the frequency of events and added product enhancements.
We also signed a long-term extension to our contract with 49’s.
Virtual Sports, Results of Operations
For the Twelve-Month Period ended | Variance 2022 vs 2021 | |||||||||||||||||||||||
| (In millions) | Dec 31, 2022 | Dec 31, 2021 | Variance Attributable to Currency Movement | Variance on a Functional currency basis | Total Functional Currency Variance % | Total Reported Variance % | ||||||||||||||||||
| Service Revenue | $ | 55.1 | $ | 36.0 | $ | (6.6 | ) | $ | 25.7 | 71.4 | % | 53.2 | % | |||||||||||
| Cost of Service | (2.4 | ) | (1.9 | ) | 0.3 | (0.8 | ) | (44.5 | )% | 29.4 | % | |||||||||||||
| Selling, general and administrative expenses | (6.9 | ) | (7.1 | ) | 0.8 | (0.6 | ) | 8.9 | % | (2.6 | )% | |||||||||||||
| Stock-based compensation | (0.7 | ) | (0.8 | ) | 0.1 | 0.0 | (2.1 | )% | (12.5 | )% | ||||||||||||||
| Depreciation and amortization | (2.6 | ) | (3.4 | ) | 0.3 | 0.5 | (14.4 | )% | (23.5 | )% | ||||||||||||||
| Net operating Income (Loss) | $ | 42.5 | $ | 22.8 | $ | (5.1 | ) | $ | 24.7 | 108.4 | % | 86.1 | % | |||||||||||
| Exchange Rate - $ to £ | 1.23 | 1.37 | ||||||||||||||||||||||
Note: Exchange rate in the table is calculated by dividing the USD service revenue by the GBP service revenue, therefore this could be slightly different from the average rate during the period depending on timing of transactions.
All variances discussed in the Virtual Sports results below are on a functional currency (at constant rate) basis, which excludes the impact of any changes in foreign currency exchange rates.
Virtual Sports revenue
During the twelve-month period, revenue increased by $25.7 million, or 71%. This increase was driven by $22.6 million increase in Online Virtuals, primarily driven by the growth from our existing online customers along with expanding jurisdictions, as well as increases in Retail Virtuals of $3.1 million, due to retail venues being open for the whole of the period compared to the prior period.
Virtual Sports operating income
Operating income increased by $25.3 million in the twelve-month period. This increase was primarily due to the increase in revenue of $25.7 million and a decrease in depreciation and amortization of $0.5 million, partly offset by an increase of $0.8 million of cost of sales.
Interactive
We generate revenue from our Interactive segment through the licensing of our products. Typically, we receive fees in exchange for the licensing of our products, on a long-term contract basis, on a participation basis. Our participation contracts are usually structured to pay us a percentage of net win (defined as net revenue to our operator customers, after deducting player winnings, free bets or plays and other promotional costs and any relevant regulatory levies) from Interactive content placed on our customers’ websites. Typically, we recognize revenue from these arrangements on a daily basis over the term of the contract.
| 47 |
Revenue growth for our Interactive segment is principally driven by the number of customers we have, the number of live games, the net win performance of the games and the net win percentage that we receive pursuant to our contracts with our customers.
Interactive, Key Performance Indicators
For the Twelve-Month Period ended | Variance 2022 vs 2021 | |||||||||||||||
| Interactive | Dec 31, 2022 | Dec 31, 2021 | % | |||||||||||||
| No. of Live Customers at the end of the period | 130 | 109 | 21 | 19.3 | % | |||||||||||
| Average No. of Live Customers | 125 | 100 | 25 | 24.5 | % | |||||||||||
| No. of Live Games at the end of the period | 270 | 232 | 38 | 16.4 | % | |||||||||||
| Average No. of Live Games | 254 | 216 | 38 | 17.6 | % | |||||||||||
| Total Revenue (£’m) | £ | 18.8 | £ | 16.6 | £ | 2.2 | 13.0 | % | ||||||||
In the table above:
“No. of Live Customers at the end of the period” and “Average No. of Live Customers” represent the number of customers from which there is Interactive revenue at the end of the period and the average number of customers from which there is Interactive revenue during the period, respectively.
“No. of Live Games at the end of the period” and “Average No. of Live Games” represents the number of games from which there is Interactive revenue at the end of the period and the average number of games from which there is Interactive revenue during the period, respectively.
“Total Revenue (£m)” represents total revenue for the Interactive segment, including recurring and upfront service revenue.
Interactive, Recurring Revenue
All Interactive revenue in both years was recurring.
Interactive, key events
During the period ended December 31, 2022, we undertook 49 new brand launches, 24 during the first half of 2022 and 25 during the second half of 2022. We expanded territories with Bet365, BetMGM and Gamesys in Ontario, along with DraftKings in New Jersey, Connecticut and Pennsylvania and Rush Street Interactive in Michigan and Pennsylvania. We also expanded into Pennsylvania with BetMGM.
We deployed 34 new games in the year, 20 new games in the first half of the year, including Big Egyptian Fortune TM and Big Wheel Bonus TM and 14 new games in the second half, including Cops N Robbers Big Money TM and Santa Linking TM.
Loto-Quebec launched our first iLottery title with Pharaon Reaction TM in the first half of 2022 and followed up with a second title in the second half of 2022.
| 48 |
Interactive, Results of Operations
| For the Twelve-Month Period ended | Variance 2022 vs 2021 | |||||||||||||||||||||||
| (In millions) | Dec 31, 2022 | Dec 31, 2021 | Variance Attributable to Currency Movement | Variance on a Functional currency basis | Total Functional Currency Variance % | Total Reported Variance % | ||||||||||||||||||
| Service Revenue | $ | 23.1 | $ | 22.8 | $ | (2.7 | ) | $ | 3.0 | 13.0 | % | 1.2 | % | |||||||||||
| Cost of Service | (3.7 | ) | (3.7 | ) | 0.4 | (0.4 | ) | 10.0 | % | (1.3 | )% | |||||||||||||
| Selling, general and administrative expenses | (7.1 | ) | (6.1 | ) | 0.8 | (1.9 | ) | 30.9 | % | 17.1 | % | |||||||||||||
| Stock-based compensation | (0.7 | ) | (0.6 | ) | 0.1 | (0.2 | ) | 30.2 | % | 16.7 | % | |||||||||||||
| Depreciation and amortization | (2.9 | ) | (3.2 | ) | 0.3 | (0.0 | ) | 1.2 | % | (9.4 | )% | |||||||||||||
| Net operating Income (Loss) | $ | 8.7 | $ | 9.2 | $ | (1.0 | ) | $ | 0.5 | 5.3 | % | (5.5 | )% | |||||||||||
| Exchange Rate - $ to £ | 1.23 | 1.37 | ||||||||||||||||||||||
Note: Exchange rate in the table is calculated by dividing the USD service revenue by the GBP service revenue, therefore this could be slightly different from the average rate during the period depending on timing of transactions.
All variances discussed in the Interactive results below are on a functional currency (at constant rate) basis, which excludes the impact of any changes in foreign currency exchange rates.
Interactive revenue
During twelve-month period, revenue increased by $3.0 million, primarily driven by recurring revenue growth due to the consistent launch of new content across the estate, growth in the customer base in new, emerging and core markets and increased promotional activity through exclusive deals with tier-one customers.
Interactive operating income
Operating income for the twelve-month period increased by $0.5 million. This increase was driven by the increase in revenue, partially offset by a $1.9 million increase in SG&A expenses driven by the investment in the segment to help drive revenues and for staff returning from furlough and to full pay.
Leisure
We typically generate revenue from our Leisure segment through the supply of our gaming and amusement machines. We receive rental fees for machines, typically on a long-term contract basis, on both a participation and fixed fee basis. Our participation contracts are usually structured to pay us a percentage of net win (defined as net revenue to our operator customers, after deducting player winnings, free bets or plays, any relevant regulatory levies and minimum fixed incomes where applicable) from machines placed in our customers’ facilities. We generally recognize revenue from these arrangements on a daily basis over the term of the contract.
Revenue growth for our Leisure segment is principally driven by the number of customers we have, the number of machines in operation, the net win performance of the machines and the net win percentage that we receive pursuant to our contracts with our customers.
| 49 |
Leisure, Key Performance Indicators
For the Twelve-Month Period ended | Variance 2022 vs 2021 | |||||||||||||||
| Leisure | Dec 31, 2022 | Dec 31, 2021 | % | |||||||||||||
| End of period installed base Gaming machines (# of terminals) | 11,008 | 11,418 | (410 | ) | (3.6 | )% | ||||||||||
| Average installed base Gaming machines (# of terminals) | 10,960 | 11,576 | (616 | ) | (5.3 | )% | ||||||||||
| End of period installed base Other (# of terminals) | 4,646 | 6,838 | (2,192 | ) | (32.1 | )% | ||||||||||
| Average installed base Other (# of terminals) | 5,306 | 7,080 | (1,774 | ) | (25.1 | )% | ||||||||||
| Pub Digital Gaming Machines - Average installed base (# of terminals) | 6,102 | 6,087 | 15 | 0.2 | % | |||||||||||
| Pub Analogue Gaming Machines - Average installed base (# of terminals) | 1,334 | 2,092 | (759 | ) | (36.3 | )% | ||||||||||
| MSA and Bingo Gaming Machines - Average installed base (# of terminals)(1) | 3,216 | 3,204 | 11 | 0.4 | % | |||||||||||
| Inspired Leisure Revenue per Gaming Machine per week | £ | 64.3 | £ | 36.9 | £ | 27.4 | 74.3 | % | ||||||||
| Inspired Pub Digital Revenue per Gaming Machine per week | £ | 68.6 | £ | 36.2 | £ | 32.4 | 89.5 | % | ||||||||
| Inspired Pub Analogue Revenue per Gaming Machine per week | £ | 38.3 | £ | 22.5 | £ | 15.9 | 70.7 | % | ||||||||
| Inspired MSA and Bingo Revenue per Gaming Machine per week | £ | 91.0 | £ | 50.3 | £ | 40.7 | 81.0 | % | ||||||||
| Inspired Other Revenue per Machine per week | £ | 19.7 | £ | 11.0 | £ | 8.7 | 78.7 | % | ||||||||
| Total Holiday Parks Revenue (Gaming and Non Gaming) (£’m) | £ | 30.0 | £ | 21.1 | £ | 8.9 | 42 | % | ||||||||
| (1) | Motorway Service Area machines |
In the table above:
“End of period installed base Gaming” and Average“Average installed base Gaming” represent the number of gaming machines installed (excluding Holiday Park machines) that are Category B and Category C only, from which there is participation or rental revenue at the end of the period or as an average over the periodperiod.
“End of period installed base Other” and “Average installed base Other” represent the number of all other category machines installed (excluding Holiday Park machines) from which there is participation or rental revenue at the end of the period or as an average over the period.
“Revenue per machine unit per weekweek” represents the average weekly participation or rental revenue recognized by Inspired during the period.
Leisure, Recurring Revenue
Set forth below is a breakdown of our Leisure recurring revenue which consists principally of Leisure participation revenue and Leisure other fixed fee revenue. See “Leisure Segment Revenue” below for a discussion of leisure service revenue between the periods under review.
For the Twelve-Month Period ended | Variance 2022 vs 2021 | |||||||||||||||
| (In £ millions) | Dec 31, 2022 | Dec 31, 2021 | % | |||||||||||||
| Leisure Recurring Revenue | ||||||||||||||||
| Total Leisure Revenue | £ | 77.7 | £ | 50.0 | £ | 27.7 | 55.3 | % | ||||||||
| Total Leisure Recurring Revenue | £ | 75.4 | £ | 47.9 | £ | 27.6 | 57.6 | % | ||||||||
| Leisure Recurring Revenue as a Percentage of Total Leisure Revenue | 97.1 | % | 95.7 | % | 1.4 | % | ||||||||||
| 50 |
The % Digital Cat C represents the percentage of the Company’s UK pub gaming machine estate located with that is digital.
Acquired Businesses segment,Leisure, key events that affected results for
During the Twelve Monthstwelve-month period ended December 31, 20192022 the holiday parks business delivered record sales and we successfully contracted another Butlins site, which started earning income in January 2023 making Inspired the sole supplier of amusement and gaming machines for Butlins for the next seven years, and we secured a new five-year deal with Haven.
On October 1, 2019,In the Company completed the acquisitionPubs sector we successfully renewed our contract with Greene King for a further three years and increased our share of the Gaming Technology Group (“NTG”) of Novomatic UK Ltd.,estate from 36% to 42%. We signed a division of Novomatic Group, a leading international supplier of gaming equipmentthree-year extension with Mitchells and solutions. As per ASC 280, the Company reports the results of this acquisitionButler and were reappointed as a business segment denoted as “Acquired Businesses.” Becausesupplier to Marstons for a further four years. We also divested our prize vend assets in the Company completedestate to allow focus on core gaming products with increased margins, which is the transactionreason for the decline in Other installed base year on October 1, 2019, it can only reportyear.
During the results since that date, which comprisesyear we have deployed several new titles across the three months ended December 31, 2019.pubs estate, including ‘Cops n Robbers Bank Buster’, Space Invaders, ‘Centurion’ ‘Gold Cash Freespins’ and “Party Time Pub Addition’ demonstrating our commitment to leveraging Inspired’s successful game portfolio for the pub sector.
Acquired Businesses segment, Three Months ended December 31, 2019
| Acquired Business | For the Three- Month Period ended | |||
| Unaudited Dec 31, | ||||
| (In millions) | 2019 | |||
| Revenue: | ||||
| Service | $ | 27.6 | ||
| Hardware | 5.3 | |||
| Total revenue | 32.9 | |||
| Cost of sales, excluding depreciation and amortization: | ||||
| Cost of service | (3.5 | ) | ||
| Cost of hardware | (3.8 | ) | ||
| Total cost of sales | (7.3 | ) | ||
| Gross Profit | ||||
| Service | 24.1 | |||
| Hardware | 1.5 | |||
| Total gross profit | 25.6 | |||
| Selling, general and administrative expenses | (20.1 | ) | ||
| Stock-based compensation | - | |||
| Depreciation and amortization | (5.9 | ) | ||
| Net operating Income (Loss) | $ | (0.4 | ) | |
| Exchange Rate - $ to £ | 1.29 | |||
Leisure, Results of Operations
For the Twelve-Month Period ended | Variance 2022 vs 2021 | |||||||||||||||||||||||
| (In millions) | Dec 31, 2022 | Dec 31, 2021 | Variance Attributable to Currency Movement | Variance on a Functional currency basis | Total Functional Currency Variance % | Total Reported Variance % | ||||||||||||||||||
| Revenue: | ||||||||||||||||||||||||
| Service | $ | 93.2 | $ | 65.7 | $ | (10.9 | ) | $ | 38.4 | 58.4 | % | 41.8 | % | |||||||||||
| Product | 2.3 | 3.0 | (0.3 | ) | (0.4 | ) | (14.0 | )% | (23.1 | )% | ||||||||||||||
| Total revenue | 95.5 | 68.7 | (11.2 | ) | 38.0 | 55.3 | % | 39.0 | % | |||||||||||||||
| Cost of Sales, excluding depreciation and amortization: | ||||||||||||||||||||||||
| Cost of Service | (23.9 | ) | (15.9 | ) | 2.9 | (10.9 | ) | 69.0 | % | 50.6 | % | |||||||||||||
| Cost of Product | (1.7 | ) | (2.0 | ) | 0.2 | 0.1 | (6.2 | )% | (14.3 | )% | ||||||||||||||
| Total cost of sales | (25.6 | ) | (17.9 | ) | 3.1 | (10.8 | ) | 60.5 | % | 43.3 | % | |||||||||||||
| Selling, general and administrative expenses | (45.8 | ) | (35.1 | ) | 5.2 | (15.9 | ) | 45.1 | % | 30.3 | % | |||||||||||||
| Stock-based compensation | (0.6 | ) | (0.6 | ) | 0.1 | (0.1 | ) | 11.7 | % | 0.0 | % | |||||||||||||
| Depreciation and amortization | (13.5 | ) | (16.1 | ) | 1.6 | 1.0 | (6.3 | )% | (16.1 | )% | ||||||||||||||
| Net operating Income (Loss) | 10.0 | (1.0 | ) | $ | (1.3 | ) | $ | 12.3 | N/A | N/A | ||||||||||||||
| Exchange Rate - $ to £ | 1.23 | 1.37 | ||||||||||||||||||||||
Note: Exchange rate in the table is calculated by dividing the USD total revenue by the GBP total revenue, therefore this could be slightly different from the average rate during the period depending on timing of transactions.
All variances discussed in the Leisure results below are on a functional currency (at constant rate) basis, which excludes the impact of any changes in foreign currency exchange rates.
Acquired Businesses SegmentLeisure Revenue
InFor the fourth quarter,twelve-month period, revenue was $32.9increased by $38.0 million, of which $27.6 million was service revenueor 55%, respectively, as our business benefitted from no COVID-19 closures and $5.3 million was hardware revenue stemming fromfewer social distancing restrictions and growth in Service revenue.
Service revenue increased by $38.4 million, driven by all markets being open for the digital pub conversion and the strong fourth quarter in the leisure parks.
Acquired Businesses Service Revenue was $27.6 million in the fourth quarter, of which approximately $8.6 million was generated from Category C gaming machines within the Pub business. The Company’s average installed base within the Pub business included 8,590 Category C gaming machines. Digital gaming machines accounted for 66.2%whole of the total Category C gaming machines atperiod, particularly Pubs ($14.1 million), Holiday parks ($12.3 million), Motorway service areas ($8.1 million) and Bingo Halls ($2.3 million).
Leisure Operating Income/ (Loss)
Operating income for the endtwelve-month period improved by $12.3 million, from a loss of the quarter, which$1.0 million to income of $10.0 million. This was an increase from 60.8% atprimarily due to the beginning of the quarter. This reflects the continued conversion of Category C gaming machines from analogue to digital in the UK Pub estate. The increase in the Company’s digital machine base continues to drive revenue per gaming machine per week, which has demonstrated sequential growth on a quarterly basisas venues reopened and averaged £59.63 in the quarter, an increase of approximately 13.0% over the prior year comparable period.
The Leisure business includes Leisure Parks, MSAs, Adult Gaming Centers (“AGCs”) and Bowling AlleysCOVID-19 restrictions were removed, as well as software license fees associated with one-time hardware sales. Leisure parks contributed approximately $5.6 milliona reduction in revenue, which was strong for the fourth quarter, typically a weaker quarter as the summer holiday park season ends. Revenue from MSAs and AGCs was $6.2 million in the quarter and included 4,948 machines on a rental basis, generating an average of £75.09 per gaming machine per week. This represented an increase of approximately 22.6% over the prior year comparable period. Software license fees associated with hardware sales was $1.6 million in the quarter.
Acquired Businesses Hardware Revenue was $5.3 million and includes the sale of 673 machines, primarily in the digital sector with the Prismatic cabinet.
Acquired Businesses segment operating income. Operating income reflects cost of goods of $7.3 million (comprised of manufacturing costs, content royalties, spare parts, distribution costs, and certain gaming taxes), SG&A expenses of $20.1 million which includes service network costs, facilities, and staffing, and depreciation and amortization of $5.9 million, reflecting capitalized game development$1.0 million. This was partially offset by increases in Cost of sales ($10.8 million) and machine deployment levels.
Capital expenditures forSG&A expenses ($15.9 million), due to staff returning from furlough and to full pay and in the period totaled $5.1 million, comprised primarily of approximately $2.3 millionlater months from the continuing digitization ofincrease in the UK pub estate, $0.9 million in new machines for the MSA and AGC estates and $1.0 million of capitalized software development costs.national living wage.
| 51 |
Non-GAAP Financial Measures
We use certain non-GAAP financial measures, including EBITDA and Adjusted EBITDA, to analyze our operating performance. We use these financial measures to manage our business on a day-to-day basis. We believe that these measures are also commonly used in our industry to measure performance. For these reasons, we believe that these non-GAAP financial measures provide expanded insight into our business, in addition to standard U.S. GAAP financial measures. There are no specific rules or regulations for defining and using non-GAAP financial measures, and as a result the measures we use may not be comparable to measures used by other companies, even if they have similar labels. The presentation of non-GAAP financial information should not be considered in isolation from, or as a substitute for, or superior to, financial information prepared and presented in accordance with U.S. GAAP. You should consider our non-GAAP financial measures in conjunction with our U.S. GAAP financial measures.
We define our non-GAAP financial measures as follows:
EBITDA is defined as net lossincome (loss) excluding depreciation and amortization, interest expense, interest income and income tax expense.
Adjusted EBITDA is defined as net lossincome (loss) excluding depreciation and amortization, interest expense, interest income and income tax expense, and other additional exclusions and adjustments. Such additional excluded amounts include stock-based compensation U.S. GAAP charges where the associated liability is expected to be settled in stock, and changes in the value of warrant or earnout liabilities and income and expenditure in relation to legacy portions of the business (being those portions where trading no longer occurs) including closed defined benefit pension schemes. Additional adjustments are made for items considered outside the normal course of business, including (1) restructuring costs, which include charges attributable to employee severance, management changes, restructuring, dual running costs, costs related to facility closures and integration costs, (2) merger and acquisition costs and (3) gains or losses not in the ordinary course of business. This does not include any adjustments related to COVID-19.
We believe Adjusted EBITDA, when considered along with other performance measures, is a particularly useful performance measure, because it focuses on certain operating drivers of the business, including sales growth, operating costs, selling and administrative expense and other operating income and expense. We believe Adjusted EBITDA can provide a more complete understanding of our operating results and the trends to which we are subject, and an enhanced overall understanding of our financial performance and prospects for the future. Adjusted EBITDA is not intended to be a measure of liquidity or cash flows from operations or a measure comparable to net income or loss, because it does not take into account certain aspects of our operating performance (for example, it excludes non-recurring gains and losses which are not deemed to be a normal part of underlying business activities). Our use of Adjusted EBITDA may not be comparable to the use by other companies of similarly termed measures. Management compensates for these limitations by using Adjusted EBITDA as only one of several measures for evaluating our operating performance. In addition, capital expenditures, which affect depreciation and amortization, interest expense, and income tax benefit (expense), are evaluated separately by management.
Adjusted Revenue (Revenue Excluding Nil Margin Hardware Sales) is defined as revenue excluding hardware sales that are sold at nil margin with the intention of securing longer term recurring revenue streams.
Functional Currency at Constant rate. Currency impacts showndiscussed have been calculated as the current-period average GBP: USD rate less the equivalent average rate in the prior period, multiplied by the current period amount in our functional currency (GBP). The remaining difference, referred to as functional currency at constant rate, is calculated as the difference in our functional currency, multiplied by the prior-period average GBP: USD rate, as a proxy for functional currency at constant rate movement.
Currency Movement represents the difference between the results in our reporting currency (USD) and the results on a functional currency at(at constant raterate) basis.
Reconciliations from net loss, as shown in our Consolidated Statements of Operations and Comprehensive Loss,Income (Loss), to Adjusted EBITDA are shown below.
| 52 |
Reconciliation to Adjusted EBITDA by segment for the Twelve Months ended December 31, 2022
| For the Twelve-Month Period ended | ||||||||
| Unaudited | Unaudited | |||||||
| Dec 31, | Dec 31, | |||||||
| (In millions) | 2019 | 2018 | ||||||
| Net loss | $ | (41.1 | ) | $ | (0.4 | ) | ||
| Items Relating to Legacy Activities: | ||||||||
| Pension charges (1) | 0.6 | 0.5 | ||||||
| Costs relating to former operations (2) | - | 0.0 | ||||||
| Litigation Settlement | - | 1.4 | ||||||
| Items outside the normal course of business: | ||||||||
| Costs of group restructure (3) | 3.3 | 1.5 | ||||||
| Acquisition and integration related transaction expenses (4) | 6.7 | 0.3 | ||||||
| Italian tax related costs relating to prior years | 0.4 | 0.9 | ||||||
| Stock-based compensation expense | 9.0 | 5.8 | ||||||
| Impairment expense | - | 7.7 | ||||||
| Depreciation and amortization | 42.0 | 41.9 | ||||||
| Total other expense (income), net | 28.0 | (5.1 | ) | |||||
| Income tax | 0.1 | 0.2 | ||||||
| Adjusted EBITDA | $ | 49.0 | $ | 54.7 | ||||
| Adjusted EBITDA | £ | 38.2 | £ | 41.0 | ||||
| Exchange Rate - $ to £ (5) | 1.28 | 1.33 | ||||||
| For the Twelve-Month Period ended Dec 31, 2022 | ||||||||||||||||||||||||||
| (In millions) | Statutory Heading | Total | Gaming | Virtual Sports | Interactive | Leisure | Corporate | |||||||||||||||||||
| Net Income/ (loss) | Net Income | $ | 22.3 | $ | 24.0 | $ | 42.5 | $ | 8.7 | $ | 10.0 | $ | (62.9 | ) | ||||||||||||
| Items Relating to Legacy Activities: | ||||||||||||||||||||||||||
| Pension charges (1) | SG&A | $ | 0.7 | 0.7 | ||||||||||||||||||||||
| Items outside the normal course of business: | ||||||||||||||||||||||||||
| Acquisition and integration related transaction expenses (2) | SG&A | $ | 0.5 | - | 0.5 | |||||||||||||||||||||
| Acquisition and integration related transaction expenses (2) | Cost of Sale | $ | 0.6 | 0.3 | 0.3 | - | ||||||||||||||||||||
| Litigation Settlement (3) | SG&A | $ | 0.5 | 0.5 | - | |||||||||||||||||||||
| Stock-based compensation expense (4) | Stock-based compensation expense | $ | 10.8 | 1.6 | 0.7 | 0.7 | 0.6 | 7.2 | ||||||||||||||||||
| Depreciation and amortization (4) | Depreciation and amortization | $ | 37.6 | 16.6 | 2.6 | 2.9 | 13.5 | 2.0 | ||||||||||||||||||
| Interest expense net (4) | Interest expense net | $ | 25.4 | 25.4 | ||||||||||||||||||||||
| Profit on disposal of trade & assets (5) | Profit on disposal of trade & assets | $ | (0.9 | ) | (0.9 | ) | - | |||||||||||||||||||
| Other finance expenses / (income) (4) | Other finance expenses / (income) | $ | (1.1 | ) | (1.1 | ) | ||||||||||||||||||||
| Income tax (4) | Income tax | $ | 3.2 | 3.2 | ||||||||||||||||||||||
| Adjusted EBITDA | $ | 99.6 | $ | 41.6 | $ | 46.3 | $ | 12.3 | $ | 24.4 | $ | (25.0 | ) | |||||||||||||
| Adjusted EBITDA | £ | 80.8 | £ | 33.6 | £ | 37.7 | £ | 10.0 | £ | 19.9 | £ | (20.4 | ) | |||||||||||||
| Exchange Rate - $ to £ (6) | 1.23 | |||||||||||||||||||||||||
Note: Certain unallocated corporate function costs have not been allocated to the Company’s reportable operating segments because these costs are not allocable and to do so would not be practical; these are shown in the Corporate category.
| 53 |
Reconciliation to Adjusted EBITDA by segment for the Twelve Months ended December 31, 2021
| For the Twelve-Month Period ended Dec 31,2021 | ||||||||||||||||||||||||||
| (In millions) | Statutory Heading | Total | Gaming | Virtual Sports | Interactive | Leisure | Corporate | |||||||||||||||||||
| Net Income/ (loss) | $ | (36.7 | ) | $ | 1.8 | $ | 22.8 | $ | 9.2 | $ | (1.0 | ) | $ | (69.5 | ) | |||||||||||
| Items Relating to Legacy Activities: | ||||||||||||||||||||||||||
| Pension charges (1) | SG&A | 0.8 | 0.8 | |||||||||||||||||||||||
| Items outside the normal course of business: | ||||||||||||||||||||||||||
| Acquisition and integration related transaction expenses (2) | SG&A | 1.6 | 1.6 | |||||||||||||||||||||||
| Refinancing of Company Debt (7) | SG&A | 0.8 | 0.8 | |||||||||||||||||||||||
| Italian tax related costs relating to prior years (8) | SG&A | 1.4 | 1.4 | - | ||||||||||||||||||||||
| Stock-based compensation expense (4) | Stock-based compensation expense | 13.0 | 1.8 | 0.8 | 0.6 | 0.6 | 9.2 | |||||||||||||||||||
| Depreciation and amortization (4) | Depreciation and amortization | 47.0 | 22.5 | 3.4 | 3.2 | 16.1 | 1.8 | |||||||||||||||||||
| Interest expense net (4) | Interest expense net | 44.3 | 44.3 | |||||||||||||||||||||||
| Change in fair value of warrant liability (4) | Change in fair value of warrant liability | (0.9 | ) | (0.9 | ) | |||||||||||||||||||||
| Other finance expenses / (income) (4) | Other finance expenses / (income) | (5.7 | ) | (5.7 | ) | |||||||||||||||||||||
| Income tax (4) | Income tax | (1.6 | ) | (1.6 | ) | |||||||||||||||||||||
| Adjusted EBITDA | $ | 64.0 | $ | 26.1 | $ | 28.4 | $ | 13.0 | $ | 15.7 | $ | (19.2 | ) | |||||||||||||
| Adjusted EBITDA | £ | 46.7 | £ | 19.2 | £ | 20.6 | £ | 9.5 | £ | 11.4 | £ | (14.0 | ) | |||||||||||||
| Exchange Rate - $ to £ (6) | 1.37 | |||||||||||||||||||||||||
Note: Certain unallocated corporate function costs have not been allocated to the Company’s reportable operating segments because these costs are not allocable and to do so would not be practical; these are shown in the Corporate category.
Notes to table:Adjusted EBITDA reconciliation tables above:
| (1) | “Pension charges” are profit and loss charges included within selling, general and administrative expenses, relating to a defined benefit scheme which was closed to new entrants in 1999 and to future accrual in 2010. As well as the amortization of net loss, the figure also includes charges relating to the Pension Protection Fund (which were historically borne by the pension scheme) and a small amount of associated professional services expenses. These costs are included within |
| (2) |
| Acquisition and integration related transaction expenses, are as described above in the Results of Operations line item discussions. For 2022 this includes a write-off of inventory items related to the integration of Gaming Technology Group of Novomatic UK Ltd. | ||
| (3) | “Litigation Settlement” refers to full and final settlement of a contractual dispute relating to a Development Services and Management Agreement. |
| 54 |
| (4) | Stock-based compensation expense, Depreciation and amortization, Total other expense, |
| (5) | “Profit on disposal of trade & assets” — In January 2022, the Company sold its Italian VLT business, including all terminals and other assets, staff costs and facilities and contracts to a non-connected party, recognizing a profit on this disposal. |
| (6) | Exchange rate in the table is calculated by dividing the USD Adjusted EBITDA by the GBP Adjusted EBITDA, therefore this could be slightly different from the average rate during the period depending on timing of transactions. |
| (7) | In May 2021, the Company refinanced its debt. These are outside of the write off of old debt fees recognized in the interest line. |
| (8) | “Italian tax related costs relating to prior years invoicing” relate to a settlement with the Italian Tax Authorities in respect of an audit for the period 2015-2017 in respect of the historic VAT treatment of supplies. |
Reconciliation to Adjusted Revenue
| For the Twelve-Month Period ended | ||||||||
| Audited | Unaudited | |||||||
| Dec 31, | Dec 31, | |||||||
| (In millions) | 2019 | 2018 | ||||||
| Net revenues | $ | 153.4 | $ | 140.7 | ||||
| Less Nil Margin Sales | - | (4.0 | ) | |||||
| Adjusted Revenue | $ | 153.4 | $ | 136.7 | ||||
| Adjusted Revenue | £ | 119.7 | £ | 102.3 | ||||
| Exchange Rate - $ to £ | $ | 1.28 | $ | 1.34 | ||||
We believe that accounting for nil margin hardware sales in conformance with U.S. GAAP can result in a distorted presentation of our revenue and growth. Therefore, we use Revenue Excluding Nil Margin Sales, or Adjusted Revenue, to internally analyze our operating performance.
Liquidity and Capital Resources
YearTwelve Months ended December 31, 20192022, compared to YearTwelve Months ended December 31, 20182021
| Year Ended | Variance | |||||||||||
| Dec 31, | Dec 31, | |||||||||||
| (in millions) | 2019 | 2018 | 2019 to 2018 | |||||||||
| Net (loss) income | $ | (41.1 | ) | $ | (0.4 | ) | $ | (40.7 | ) | |||
| Non-cash interest expense including amortization of fees | 9.0 | 5.4 | 3.6 | |||||||||
| Change in fair value of derivative, warrant and earnout liabilities and stock-based compensation expense | 12.4 | (15.6 | ) | 28.0 | ||||||||
| Impairment expense | - | 7.7 | (7.7 | ) | ||||||||
| Foreign currency translation on senior bank debt and cross currency swaps | (2.8 | ) | (2.7 | ) | (0.1 | ) | ||||||
| Depreciation and amortization (incl RoU assets) | 43.0 | 41.9 | 1.1 | |||||||||
| Other net cash generated/(utilized) by operating activities | 10.2 | (0.9 | ) | 11.1 | ||||||||
| Net cash provided by operating activities | 30.7 | 35.2 | (4.5 | ) | ||||||||
| Net cash used in investing activites | (133.4 | ) | (42.8 | ) | (90.6 | ) | ||||||
| Net cash generated by financing activities | 113.5 | 12.4 | 101.1 | |||||||||
| Effect of exchange rates on cash | 2.3 | 0.1 | 2.2 | |||||||||
| Net increase in cash and cash equivalents | $ | 13.1 | $ | 5.0 | $ | 8.1 | ||||||
Cash Flow Summary - A Two Year Comparative
| Twelve Months ended | Variance | |||||||||||
| (in millions) | Dec 31, 2022 | Dec 31, 2021 | 2022 to 2021 | |||||||||
| Net profit/(loss) | $ | 22.3 | $ | (36.7 | ) | $ | 59.0 | |||||
| Amortization of debt fees | 1.8 | 17.2 | (15.4 | ) | ||||||||
| Change in fair value of derivative and warrant liabilities and stock-based compensation expense | 11.5 | 13.6 | (2.1 | ) | ||||||||
| Foreign currency translation on senior bank debt and cross currency swaps | 0.0 | (4.6 | ) | 4.6 | ||||||||
| Depreciation and amortization (incl RoU assets) | 40.0 | 50.3 | (10.3 | ) | ||||||||
| Other net cash utilized by operating activities | (40.9 | ) | (33.6 | ) | (7.3 | ) | ||||||
| Net cash provided by operating activities | 34.7 | 6.2 | 28.5 | |||||||||
| Net cash used in investing activities | (40.4 | ) | (37.9 | ) | (2.5 | ) | ||||||
| Net cash used/(generated) by financing activities | (11.0 | ) | 31.2 | (42.2 | ) | |||||||
| Effect of exchange rates on cash | (6.1 | ) | 1.2 | (7.3 | ) | |||||||
| Net decrease in cash and cash equivalents | $ | (22.8 | ) | $ | 0.7 | $ | (23.5 | ) | ||||
Net cash provided by operating activities.activities In
For the year,twelve months ended December 31, 2022, net cash inflow provided by operating activities was $30.7$34.7 million, compared to $35.2a $6.2 million inflow infor the prior year,twelve months ended December 31, 2021, representing a $4.5$28.5 million decreaseincrease in cash generation. This increase was driven primarily by trading levels through increases in our online businesses and the worldwide trading restrictions in the previous year resulting from the COVID-19 pandemic.
Non-cash interest expense increased by $3.6 million to $9.0 million. The current period’s non-cash interest expense related to amortizationAmortization of debt fees incurred in relationdecreased by $15.4 million, to $1.8 million, due to the businessreduction in the level of capitalized debt fees after May 2021 following the Company’s refinancing in August 2018of its debt and in October 2019 with the subsequent extinguishment$14.4 million write off of all unamortizedthe remaining debt fees from August 2018 following the October 2019 refinancing. The prior year’s expense related to PIK interest charged on the debt held prior to the refinancing in August 2018 with amortization of debt fees only from the point of the business refinancing in August 2018.previous financing arrangement.
Change in the fair value of derivative warrant and earnoutwarrant liabilities and stock-based compensation expense increaseddecreased by $28.0$2.1 million, from an outflow of $15.6$13.6 million to an inflow of $12.4$11.5 million. Movements in the market value of the stock price resulted in an $8.0 million higher earnout inflow in the current period, a $3.2 million higher inflow relating toA lower stock-based compensation expense ($2.2 million) and a $1.6 million higher inflowlower gain relating to derivative liabilities. These wereterminated cross currency swaps ($0.8 million) was partly offset by a $9.5 million higher outflow relating to cross currency swaps. The expense relating to the changemovements in the fair value of the warrant liability increased by $24.8 millionliabilities in the prior year from income of $20.7 million to an expense of $4.1 million.($0.9 million).
ForeignFollowing the refinancing in May 2021, there has been no foreign currency translation on oursenior bank debt and cross currency swaps. In the twelve months ended December 31, 2021, the foreign currency translation on senior bank debt and cross currency swaps following the refinancing on October 1, 2019 resulted in a loss in the year of $2.8$4.6 million as a result of the movement in exchange rates during the current period, comparedperiod.
Depreciation and amortization decreased by $10.3 million, to a loss$40.0 million, with reductions of $2.7$4.4 million in the prior year.
Depreciation,machine depreciation, $5.0 million in amortization and impairment increased by $1.1 million to a charge of $43.0 million due to aintangible assets and $1.0 million in amortization charge on operating lease liabilities with small increases in machine and intangible asset charges largely offset by lower amortization on development costs and licenses. The operating lease liability amortization relates to the application of ASC842 and was not applied to the prior year.right of use assets.
Other net cash generatedutilized by operating activities increased by $11.1$7.3 million, to a $40.9 million outflow. The relative movements between the twelve months ended December 31, 2022 and the twelve months ended December 31, 2021 resulted in a $17.6 million outflow through increased inventory holding as Inspired made the strategic decision to secure components and protect sales in a challenging global supply chain market and a $7.0 million increase in receivables due to timing of sales. These were offset by relative favorable movements between the twelve months ended December 31, 2022 and the twelve months ended December 31, 2021 for prepayments and accrued income of $10.2 million inflow. The strong performance compareddue to lower trading levels at the prior year was driven by several factors. Lower capital spending, partly as a resultstart of the Triennial Implementation and favorable timing of supplier payments improved cash inflow by $6.6 million whilst lower inventory levels contributed $3.3 million. Improved collection of accounts receivable in the currentprevious year, benefitted cash inflow by $3.8 million along with favorable movements ininterest accruals of $8.3m (including timing on$5.0 million following the debt interest paymentsrefinancing in May 2021 and trade payables and accruals of $6.1 million). This was partly offset by an expected reversal of the deferred revenue creditor $12.7 million with the prior year benefitting from the build and roll out of the second phase of Greece machines.$1.9 million.
| 55 |
Included within net cash provided by operating activities were $6.1 million of payments relating to the transaction expenses and $3.3 million of payments relating to restructuring costs. This compares to $0.7 million of payments relating to transaction expenses in the prior year.
Net cash used in investing activities. activities
Net cash usedutilized in investing activities increased by $90.6$2.5 million, to $133.4 million. The increase was due to the acquisition of NTG in October 2019 for $105.9$40.4 million including cash acquired, which was offset by a $14.8 million reduction in the level oftwelve months ended December 31, 2022. This was driven by higher spend on plant, property and equipment versus(an $9.6 million increase compared to 2021) and capitalized software (a $4.8 million increase compared to 2021) due to spending in the priorprevious year being low as a result of the pandemic. These were largely offset by the $12.5 million acquisition of Sportech Lotteries, LLC on December 31, 2021 for which the twelve months ended December 31, 2022 included the Greece roll out and Flex 4k terminal build.final payment of $0.6 million.
Net cash (used)/generated by financing activities. activitiesNet
During the twelve months ended December 31, 2022, net cash generatedutilized by financing activities was $113.5$11.0 million, in 2019, compared$10.4 million of which related to $12.4the Company’s repurchase of its common shares under the Share Repurchase Program and $0.6 million inof which related to finance lease spend. During the prior year. Thetwelve months ended December 31, 2021, financing activities generated $31.2 million of cash following the receipt of $30.5 million proceeds from the warrant exercise and a net $1.3 million from the refinancing in the current year produced an inflowMay 2021 after payment of $255.3associated fees less a spend of $0.6 million after associated debt fees with repayment of the previous debt of $144.2 million. Movements in the level of revolver drawn resulted in a $2.8 million inflow and aon finance lease payment resulted in a $0.4 million outflow. The prior year refinancing generated an inflow of $135.0 million after associated debt fees with a $109.3 million repayment of the previous debt. Revolver repayments led to a $12.8 million outflow with finance leases being a $0.5 million outflow.leases.
Funding Needs and Sources
As of December 31, 2019, the Company’s cash on hand was $29.1 million and the Company had working capital of $15.7 million. As of December 31, 2019, $5.0 million of our cash on hand had arisen from our operations in Greece and was being held in local accounts. In the ordinary course of business, we seek, from time to time, to transfer funds earned in Greece to our accounts outside of Greece. However, Greece imposes capital controls that can delay or prevent the flow of capital out of the country. The Company recorded net losses of $37.0 million, $4.7 million and $20.6 million for the year ended December 31, 2019, the three months ended December 31, 2018 and the year ended September 30, 2019, respectively. Net losses include non-cash stock-based compensation of $9.0 million, $1.6 million and $7.4 million for the year ended December 31, 2019, the three months ended December 31, 2018 and the year ended September 30, 2019, respectively. Historically, the Company has generally had positive cash flows from operating activities and has relied on a combination of cash flows provided by operations and the incurrence of debt and/or the refinancing of existing debt to fund its obligations. Working capital of $15.7 million includes a non-cash settled item of $10.1 million of deferred income. Management currently believes that, absent any long term COVID-19 impact, the Company’s cash balances on hand, cash flows expected to be generated from operations, ability to control and defer capital projects and amounts available from the Company’s external borrowings will be sufficient to fund the Company’s net cash requirements through March 2021.
54
The outbreak of COVID-19 adds uncertainty that may ultimately impact on the Company’s ability to meet its covenant compliance and its ability to carry on as a going concern. Management believes that the going concern basis of preparation remains appropriate given the mitigating effect of liquidity preservation actions taken in light of the current COVID-19 control measures which are in place.
To fund our obligations, historically we have historically relied on a combination of cash flows provided by operations and the incurrence of additional debt or the refinancing of existing debt. As of December 31, 2019,2022, we had liquidity consisting of $29.1$25.0 million in cash and cash equivalents plusand a further $23.8$24.1 million of an undrawn revolver facility. This compares to $16.0$47.8 million of cash and cash equivalents plusas of December 31, 2021, with a further $9.3$27.0 million of an undrawn revolver facility at the end of the prior year.facilities undrawn. We had a working capital inflowoutflow of $8.7$40.9 million in 2019,for the twelve months ended December 31, 2022, compared to a $0.9$33.6 million outflow infor the prior period. twelve months ended December 31, 2021.
The level of our working capital surplus or deficit varies with the level of machine production we are undertaking and our capitalization.capitalization as well as the seasonality evident in some of the businesses. In periods with minimal machine volumes and capital spend, our working capital is typically more stable. In periods where significant numbers of machines are being produced, the levels of inventory and creditors are typically higher than typical and there is a natural timing difference between converting the stock into sellable or capitalized plant and settling payments to suppliers. These factors, along with movements in trading activity levels which were seen during 2021 following the COVID-19 closures, can result in significant working capital volatility. In periods of low activity, our working capital volatility is reduced. Working capital is reviewed and managed with the aim of ensuring that current liabilities are covered by the level of cash held and the expected level of short-term receipts.
Significant amountsSome of our business operations require cash flows from operations arise from our operations in Greece.to be held within the machines. As of December 31, 2019, $5.02022, $2.5 million of our $29.1$25.0 million of cash and cash equivalents had arisen in Greecewere held as operational floats within the machines. At December 31, 2021, $2.7 million of our $47.8 million of cash and was beingcash equivalents were held in our Greek bank accounts. Inas operational floats within the ordinary course of business, we seek from time to time to transfer funds earned in Greece to accounts of ours outside Greece. However, up until September 1, 2019, Greece imposed capital controlsmachines
Management currently believes that sometimes complicated, delayed or prevented the flow of capital out of that country. Historically, we have always been able to complete such transfers. Since September 1, 2019, capital controls are no longer in place.
The Company has undertaken a review of its operations in order to enable it to reduce its global costs and to more effectively align its resources with its business priorities. In connection with this review, the Company is in the process of consolidating and relocating certain of its operations in the UK and has implemented, and expects to continue to implement, a related reduction in headcount. These changes continue the Company’s prior cost control efforts. Office consolidation expenses arecash balances on hand, cash flows expected to amountbe generated from operations, and the ability to approximately $8.7 million in total, as we expectcontrol and defer capital projects will be sufficient to incur approximately $3.0 million of capital investment forfund the new office, and approximately $5.7 million of one-time costs to exit offices. These figures include costs relating to staff redundancy, relocation allowances, travel supplements, dual running costs, recruitment fees of replacement hires and dilapidating old facilities. We expect the majority of these costs to be incurred by the end of the first quarter next year.Company’s net cash requirements through March 2024.
| 56 |
Long Term and Other Debt
| (In millions) | December 31, 2019 | December 31, 2018 | ||||||||||||||
| Cash held | £ | 22.0 | $ | 29.1 | £ | 12.5 | $ | 16.0 | ||||||||
| Revolver drawn | (2.0 | ) | (2.6 | ) | - | - | ||||||||||
| Original principal senior debt | (216.5 | ) | (286.0 | ) | (109.6 | ) | (140.0 | ) | ||||||||
| Cash interest accrued | (4.2 | ) | (5.5 | ) | - | - | ||||||||||
| Finance lease creditors | (0.1 | ) | (0.1 | ) | (0.3 | ) | (0.4 | ) | ||||||||
| Total | £ | (200.8 | ) | $ | (265.2 | ) | £ | (97.5 | ) | $ | (124.5 | ) | ||||
On October 1, 2019, pursuant to the Share Purchase Agreement, dated as of June 11, 2019 (the “SPA”), by and between Inspired Gaming (UK) Limited, a subsidiary of the Company (the “Buyer”), and Novomatic UK Ltd., (the “Seller”), the Buyer completed its acquisition from the Seller of (i) all of the outstanding equity interests of each of (a) Astra Games Ltd, (b) Bell-Fruit Group Limited, (c) Gamestec Leisure Limited, (d) Harlequin Gaming Limited, and (e) Playnation Limited, and (ii) 40% of the outstanding equity interests of Innov8 Gaming Limited (“Innov8”, and the entities described in clauses (i) and (ii), together with certain of their subsidiaries, the “Acquired Companies” and the transactions contemplated by the SPA, the “Acquisition”). The Acquired Companies comprised the Seller’s Gaming Technology Group. The consideration for the Acquisition totaled approximately €104.6 million (USD $120.0 million) in cash.
| (In millions) | December 31, 2022 | December 31, 2021 | ||||||||||||||
| Cash held | £ | 20.8 | $ | 25.0 | £ | 35.4 | $ | 47.8 | ||||||||
| Original principal senior debt | (235.0 | ) | (282.9 | ) | (235.0 | ) | (316.7 | ) | ||||||||
| Cash interest accrued | (1.5 | ) | (1.8 | ) | (1.6 | ) | (2.1 | ) | ||||||||
| Finance lease creditors | (1.8 | ) | (2.2 | ) | (2.1 | ) | (2.8 | ) | ||||||||
| Total | £ | (217.6 | ) | $ | (261.9 | ) | £ | (203.3 | ) | $ | (273.8 | ) | ||||
In connection with the Acquisition, on September 27, 2019, Gaming Acquisitions Limited, together with Inspired Entertainment, Inc. (“Inspired”), and certain other direct and indirect wholly-owned subsidiaries of Inspired, entered into a Senior Facilities Agreement with Lucid Agency Services Limited, as agent, Nomura International plc and Macquarie Corporate Holdings Pty Limited (UK Branch) as arrangers and/or bookrunners and each lender party thereto (the “Lenders”), pursuant to which the Lenders agreed to provide, subject to certain conditions, two tranches of senior secured term loans (the “Term Loans”), in an original principal amount of £140.0 million and €90.0 million, respectively and a secured revolving facility loan in an original principal amount of £20.0 million. Proceeds from the Term Loans were used, among other things, to pay the purchase price of the Acquisition and to refinance existing indebtedness of the Company.
The new term loans have a 5-year duration and are repayable in full on October 1, 2024. The £140.0 million loan carries a cash interest rate of 7.25% plus 3-month LIBOR, the €90.0 million loan carries a cash interest rate of 6.75% plus a 3-month EUROLIBOR. The £20.0 million revolving credit facility is available until September 1, 2024 and carries a cash interest rate on any utilization at 5.50% plus 3-month LIBOR, with any unutilized amount carrying a cash interest cost at 30% of the applicable margin on the revolving credit facility loan.
In connection with the refinancing on October 1, 2019, the existing three-year, fixed-rate, cross-currency swaps were terminated and the remaining capitalized debt fees totaling $7.3 million expensed. Debt fees of approximately $16.1 million were incurred and capitalized as part of the refinancing as relating to the costs incurred in obtaining the new term loan facilities. These fees will be amortized over the length of the new term loans.
The Company’s previous debt which had been in place since the refinancing in August 2018 provided the business with debt facilities of senior notes of $140.0 million and a revolving credit facility of £7.5 million (equivalent to approximately $9.9 million). The senior notes had a 5-year duration, carrying a cash interest rate of 9% plus 3-month LIBOR, and the revolving credit facility had a 3-year duration carrying a cash interest rate on any utilization at 4% plus 3-month LIBOR. Any unutilized amount carried a 1.4% cash interest cost. In connection with this refinancing, the Company entered into a three-year, fixed-rate, cross-currency swap. All the Company’s previous debt and cross-currency swaps were terminated and repaid on October 1, 2019 when the new debt was put in place. For further information regarding the new external borrowings and the swap, see Note 12 to the Consolidated Financial Statements, “Long Term and Other Debt”.
As of December 31, 2019, the Company had bank facilities of £160.0 million and €90.0 million (equivalent to approximately $312.4 million), consisting of senior term loan facilities of £140.0 million and €90.0 million (equivalent to $184.9 million and $101.1 million respectively) and a revolving credit facility of £20.0 million (equivalent to approximately $26.4 million). As of December 31, 2019, the £140.0 million term loan facility had a cash interest rate on outstanding borrowings equal to the base rate margin of 7.25% per annum, plus 3-month LIBOR which at December 31, 2019 was the equivalent of 8.08% per annum. The €90.0 million term loan facility had a cash interest rate on outstanding borrowings equal to the base rate margin of 6.75% per annum, plus 3-month EUROLIBOR which at December 31, 2019 was the equivalent of 6.75% per annum. Both term loan facilities are scheduled to mature on October 1, 2024.
As of December 31, 2018, the Company had bank facilities of £117.1 million (equivalent to approximately $149.6 million), consisting of a senior term loan facility of £109.6 million (equivalent to $140.0 million) and a revolving credit facility of £7.5 million (equivalent to approximately $9.6 million). As of December 31, 2018, the term loan facility imposed a cash interest rate on outstanding borrowings equal to the base rate margin of 9.00% per annum, plus 3-month LIBOR which at December 31, 2018 was the equivalent of 11.39% per annum which under the cross-currency swaps executed was reduced to a rate of 10.87%.
As of December 31, 2019, the Company had aggregate borrowings under the revolving credit facility of £2.0 million (equivalent to $2.6 million). As of December 31, 2019, the revolving credit facility imposed a cash interest rate on outstanding borrowings equal to the base rate margin of 5.50% per annum, plus LIBOR, and the current rate at which cash interest accrued was 6.21% per annum. In addition, a commitment fee was payable with respect to unutilized borrowing capacity at a rate of 1.65% per annum. The revolving credit facility is scheduled to mature on September 1, 2024.
As of December 31, 2018, the Company had no aggregate borrowings under the revolving credit facility, which at this date carried a cash interest rate on any utilization at 4% plus 3-month LIBOR, with any unutilized amount carrying a 1.4% cash interest cost. This facility was terminated at the time of the refinancing on October 1, 2019.
In addition to the revolving credit facility borrowings described above, as of December 31, 2018 further amounts under the facility have been used for the Company’s VAT Duty Deferment guarantee and the Company’s credit card program. The amount used as of December 31, 2018 was $0.2 million. There was no use of the facility at December 31, 2019 for the Company’s VAT Duty Deferment guarantee or credit card program.
Debt issuance fees were capitalized at the time the debt was issued. As of December 31, 2019, the amount of debt issuance fees capitalized was $16.3 million, including $12.2 million of original issue discount and $2.3 million of structuring fees with the remainder being professional fees incurred from the refinancing. Of the total debt issuance fees capitalized, $0.8 million had been charged by December 31, 2019.
Debt Covenants
Under our debt facilities in place as of December 31, 20192022, we are not subject to covenant testing at quarterly intervals. Theon the Senior Secured Notes. We are, however, subject to covenant testing is set at the level of Inspired Entertainment Inc., the ultimate holding company, and consistson our Super Senior Revolving Credit Facility which requires the Company to maintain a maximum consolidated senior secured net leverage ratio of a test on Leverage (Consolidated Total Net Debt/Consolidated Pro Forma EBITDA) and a test6.25x on the level of capital expenditure. These are measured under U.S. GAAP. Leverage is tested at quarterly intervals commencing ontest date for the relevant period ending June 30, 20202021, stepping down to 6.0x on March 31, 2022, 5.75x on March 31, 2023 and capital expenditure5.50x from March 31, 2024 and thereafter (the “RCF Financial Covenant”). The RCF Financial Covenant is calculated as the ratio of consolidated senior secured net debt to consolidated pro forma EBITDA (defined as net loss excluding depreciation and amortization, interest expense, interest income and income tax expense) for the 12-month period preceding the relevant quarterly testing date and is tested annually commencingquarterly on a rolling basis, subject to the Initial Facility (as defined in the RCF Agreement) being drawn on the relevant test date. The RCF Financial Covenant does not include a minimum interest coverage ratio or other financial covenants. Covenant testing at December 31, 2019.2022 showed covenant compliance.
Under our debt facilities in place as of December 31, 2018, we were subject to covenant testing at quarterly intervals. The covenant testing is set at the level of Inspired Entertainment Inc., the ultimate holding company, and consists of a test on Leverage (Consolidated Total Debt/Consolidated Adjusted EBITDA) and a test of the Fixed Charge Coverage Ratio (Net Cash Provided by Operating Activities/Calculation of Consolidated Fixed Charges). These are measured under U.S. GAAP. In addition to the quarterly tests, there was the requirement that the minimum liquidity not be less than $5.0 million. With the refinancing of the Company on October 1, 2019, these tests were replaced by a revised set of covenant tests and for the period ending 30 September, 2019 these tests were not required to be performed.
There were no breaches of the debt covenants in the periods ended December 31, 2019 and2022 or December 31, 2018.2021.
Liens and Encumbrances
As of December 31, 2019,2022, our senior bank debt was secured by the imposition of a fixed and floating charge in favor of the lender over all the assets of the Company and certain of the Company’s subsidiaries.
Share Repurchases
The Board of Directors has authorized that the Company may use up to $25.0 million to repurchase Inspired shares of common stock, subject to repurchases being effected on or before May 10, 2025. Management has discretion as to whether to repurchase shares of the Company and as of December 31, 2022, an aggregate of $10.5 million of our shares of common stock had been repurchased.
Contractual Obligations
As of December 31, 2019,2022, our contractual obligations were as follows:
| Less than | More than | |||||||||||||||||||||||||||||||||||||||
| Contractual Obligations (in millions) | Total | Less than 1 yr | 1-3 years | 3-5 years | More than 5 yrs | Total | 1 yr | 1-2 years | 3-5 years | 5 yrs | ||||||||||||||||||||||||||||||
| Operating activities | ||||||||||||||||||||||||||||||||||||||||
| Interest on long term debt | $ | 110.3 | $ | 22.0 | $ | 44.2 | $ | 44.2 | $ | - | $ | 77.9 | $ | 22.2 | $ | 44.6 | $ | 11.1 | $ | - | ||||||||||||||||||||
| Financing activities | ||||||||||||||||||||||||||||||||||||||||
| Revolver repayment | 2.7 | 2.7 | - | - | - | |||||||||||||||||||||||||||||||||||
| Senior bank debt - principal repayment | 286.0 | - | - | 286.0 | - | 282.9 | - | - | 282.9 | - | ||||||||||||||||||||||||||||||
| Finance lease payments | 0.1 | 0.1 | - | - | - | 2.2 | 1.0 | 1.2 | - | - | ||||||||||||||||||||||||||||||
| Operating lease payments | 8.9 | 3.6 | 3.5 | 1.7 | - | 8.7 | 2.8 | 3.3 | 1.2 | 1.4 | ||||||||||||||||||||||||||||||
| Interest on non-utilisation fees | 2.2 | 0.5 | 0.9 | 0.8 | - | |||||||||||||||||||||||||||||||||||
| Interest on non-utilization fees | 1.0 | 0.3 | 0.7 | - | - | |||||||||||||||||||||||||||||||||||
| Total | $ | 410.1 | $ | 28.9 | $ | 48.6 | $ | 332.6 | $ | - | $ | 372.7 | $ | 26.3 | $ | 49.8 | $ | 295.2 | $ | 1.4 | ||||||||||||||||||||
Recent US Tax Law Changes
In light of the recent US tax reforms and specifically those around GILTI (Global Intangible Low Taxed Income), we may be required to pay additional US corporate income tax beginning in the year ending December 31, 2021 due to the location of assets and tax losses brought forward in the UK.
Off-Balance Sheet Arrangements
As of December 31, 2019,2022, there were no off-balance sheet arrangements, as defined in Item 303(a)(4)(ii) of Regulation S-K, promulgated by the U.S. Securities and Exchange Commission.
Three Months ended December 31, 2018 compared to Three Months ended December 31, 2017
| For the Three-Month Period ended | ||||||||||||||||||||||||||||
| Unaudited | Unaudited | Functional | Variance | |||||||||||||||||||||||||
| (In thousands) | Dec 31, 2018 | Dec 31, 2017 | Variance 2018 vs 2017 | Currency at Constant rate | Functional Currency | Currency Movement | ||||||||||||||||||||||
| Revenue: | ||||||||||||||||||||||||||||
| Service | $ | 30,046 | $ | 30,367 | ($ | 321 | ) | (1.1 | %) | $ | 1,028 | 3.4 | % | ($ | 1,348 | ) | ||||||||||||
| Hardware | 686 | 1,020 | (334 | ) | (32.8 | %) | (294 | ) | (28.8 | %) | (41 | ) | ||||||||||||||||
| Total revenue | 30,732 | 31,387 | (655 | ) | (2.1 | %) | 734 | 2.3 | % | (1,389 | ) | |||||||||||||||||
| Cost of sales, excluding depreciation and amortization: | ||||||||||||||||||||||||||||
| Cost of service | (5,977 | ) | (5,196 | ) | (780 | ) | 15.0 | % | (1,050 | ) | 20.2 | % | 270 | |||||||||||||||
| Cost of hardware | (593 | ) | (906 | ) | 313 | (34.5 | %) | 277 | (30.7 | %) | 35 | |||||||||||||||||
| Selling, general and administrative expenses | (15,267 | ) | (16,374 | ) | 1,107 | (6.8 | %) | 431 | (2.6 | %) | 676 | |||||||||||||||||
| Stock-based compensation | (1,615 | ) | (3,198 | ) | 1,583 | (49.5 | %) | 1,504 | (47.1 | %) | 80 | |||||||||||||||||
| Acquisition related transaction expenses | (74 | ) | (574 | ) | 500 | (87.1 | %) | 493 | (86.3 | %) | 6 | |||||||||||||||||
| Depreciation and amortization | (9,589 | ) | (9,560 | ) | (30 | ) | 0.3 | % | (448 | ) | 4.7 | % | 418 | |||||||||||||||
| Net operating Income (Loss) | (2,383 | ) | (4,421 | ) | 2,038 | 46.1 | % | 1,941 | (43.8 | %) | 97 | |||||||||||||||||
| Other income (expense) | ||||||||||||||||||||||||||||
| Interest income | 32 | 38 | (6 | ) | (15.7 | %) | (4 | ) | (11.5 | %) | (2 | ) | ||||||||||||||||
| Interest expense | (4,111 | ) | (4,906 | ) | 796 | (16.2 | %) | 705 | (14.4 | %) | 90 | |||||||||||||||||
| Change in fair value of earnout liability | 1,668 | 4,657 | (2,990 | ) | (64.2 | %) | (2,921 | ) | (62.5 | %) | (69 | ) | ||||||||||||||||
| Change in fair value of derivative liability | 852 | 319 | 533 | 167.3 | % | 584 | 182.9 | % | (51 | ) | ||||||||||||||||||
| Change in fair value of warrant liability | 6,305 | 19,471 | (13,166 | ) | (58.4 | %) | (8,391 | ) | (55.7 | %) | (456 | ) | ||||||||||||||||
| Other finance income (costs) | (731 | ) | 191 | (922 | ) | (482.9 | %) | (971 | ) | (507.9 | %) | 48 | ||||||||||||||||
| Total other income (expense), net | 4,015 | 19,770 | (15,754 | ) | 79.7 | % | (15,295 | ) | (77.7 | %) | (459 | ) | ||||||||||||||||
| Net income (loss) from continuing operations before income taxes | 1,632 | 15,349 | (13,717 | ) | (89.4 | %) | (13,354 | ) | (146.3 | %) | (362 | ) | ||||||||||||||||
| Income tax expense | (56 | ) | (33 | ) | (23 | ) | 69.2 | % | (26 | ) | 79.3 | % | 3 | |||||||||||||||
| Net income (loss) | $ | 1,576 | $ | 15,316 | ($ | 13,740 | ) | (85.7 | %) | ($ | 9,083 | ) | (144.5 | %) | $ | (359 | ) | |||||||||||
| Exchange Rate - $ to £ | 1.29 | 1.34 | ||||||||||||||||||||||||||
| Effective Tax Rate | 1.2 | % | 0.8 | % | ||||||||||||||||||||||||
58
Revenue
Total revenue for the period ended December 31, 2018 decreased by $0.7 million, or 2.1%, to $30.7 million. Adverse currency movements accounted for $1.4 million of the decrease. On a functional currency at constant rate basis, revenue increased by $0.7 million, or 2.3% on a functional currency basis, with service revenue increasing $1.0 million and hardware revenue decreasing by $0.3 million.
SBG revenue, which is included in total revenue, above, increased by $0.7 million on a functional currency at constant rate basis, or 3.0% on a functional currency basis, comprised of growth in service revenue of $1.0 million offset by a reduction in hardware sales of $0.3 million.
On a functional currency at constant rate basis SBG service revenue increased by $1.0 million, or 4.5% on a functional currency basis, due to growth in the Italian sector of $0.9 million. In addition, growth in Greece drove revenue increases of $0.6 million, due to the continued rollout into the Greek sector which drove additional participation revenue of $1.2 million and other recurring revenue of $0.6 million. This was partly offset by a $1.2 million reduction in software license sales compared to the prior period.
The decrease in hardware revenue was driven by lower hardware sales in the UK sector of $0.3 million.
Virtual Sports revenue remained unchanged on a functional currency at constant rate basis, due to growth in Finland and Italy of $0.2 million and $0.2 million, respectively. Growth was negatively affected by $0.2 million due to a reduction in revenue from long-term Virtual Sports licenses that have now expired and $0.1 million from lower interactive game sales.
Cost of sales, excluding depreciation and amortization
Cost of sales, excluding depreciation and amortization, which includes machine cost of sales, consumables, content royalties and connectivity costs, increased by $0.5 million, or 7.7%, on a reported basis, to $6.6 million. Of this increase, $0.3 million arose from favorable currency movements. On a functional currency at constant rate basis, cost of sales increased by $0.8 million, or 12.7% on a functional currency basis.
On a functional currency at constant rate basis cost of service increased by $1.1 million, or 20.2% on a functional currency basis, due to increasing SBG costs. This was driven by an increase in Greece SBG service costs of $0.8 million and an increase in Italy SBG service costs of $0.3 million.
On a functional currency at constant rate basis cost of hardware decreased by $0.3 million, or 30.7% on a functional currency basis, due to lower hardware sales in the UK sector.
Selling, general and administrative expenses
SG&A expenses decreased by $1.1 million, or 6.8%, on a reported basis, to $15.3 million. Of this decrease, $0.7 million arose from favorable currency movements. On a functional currency at constant rate basis, SG&A expenses decreased by $0.4 million, or 2.6% on a functional currency basis. This decrease was driven by staff related cost savings of $1.8 million, facilities and insurance cost savings of $0.1 million and legal cost savings of $0.1 million. These savings were offset by an increase in Italian tax related costs relating to prior years invoicing of $0.9 million (removed from Adjusted EBITDA) and a decrease in net labor capitalization and manufacturing recoveries of $0.8 million due to mix of projects and lower factory throughput as a result of fewer machines being built in the quarter.
Stock-based compensation
During the three months ended December 31, 2018, the Company recorded an expense of $1.6 million with respect to outstanding awards. Of this cost, $1.7 million related to recurring costs and a $0.1 million credit was due to changes in the stock price from $6.10 at September 30, 2018 to $4.80 at December 31, 2018. During the three months ended December 31, 2017, there was a $3.2 million charge for stock-based compensation which included a $2.1 million charge relating to the cancellation of awards under the Company’s First Incentive Plan covering 1,076,272 shares.
Acquisition related transaction expenses
Acquisition related transaction expenses decreased by $0.5 million in the period to $0.1 million. All of the 2018 and 2017 period expenses were related to work with respect to potential acquisitions.
Depreciation and amortization
Depreciation and amortization remained unchanged in the period at $9.6 million. This was impacted by favorable currency movements of $0.4 million.
On a functional currency at constant rate basis, depreciation and amortization increased by $0.4 million, or 4.7% on a functional currency basis. This increase was driven by additional amortization in connection with new platforms and games going live on SBG of $0.4 million. The additional machine depreciation was driven by the continued terminal rollout in the Greek sector of $0.9 million, partly offset by lower depreciation in the UK ($0.6 million) and Italy ($0.1 million) due to machines being fully depreciated.
Net operating loss
During the period on a reported basis, net operating loss improved from a loss of $4.4 million to a loss of $2.4 million. This improvement was partly driven by a $0.1 million favorable currency movement. On a functional currency at constant rate basis, net operating loss decreased by $1.9 million, mainly due to an increase in revenue, a reduction in stock-based compensation, acquisition related transaction and SG&A expenses, partly offset by higher cost of sales and depreciation and amortization.
Interest expense
Interest expense decreased by $0.8 million in the period, to $4.1 million, on a reported basis. Of this variance, $1.0 million was due to lower interest charges on the new debt funding following the refinancing in August 2018 and a further $0.3 million arose from currency retranslations of bank accounts. These were partly offset by a $0.5 million charge in the current period relating to amortization of debt fees following the refinancing.
Change in fair value of earnout liability
Due solely to changes in the share price ($4.80 at December 31, 2018 and $6.10 at September 30, 2018) the credit in the three months ended December 31, 2018 from a change in the fair value of earnout liability was $1.7 million. In the prior period, due to changes in share price and as a result of changes relating to six specific countries (China, Colombia, Greece, Norway, Spain and Ukraine) the corresponding figure was a $4.7 million credit.
Change in fair value of derivative liability
Change in fair value of derivative liability increased by $0.5 million, to a $0.9 million credit for the three months ended December 31, 2018 arising from the fair valuing of the cross-currency swaps executed in August 2018 on the refinancing of the company. For the three months ended December 31, 2017 the change in fair value of derivative liability was a $0.3 million credit for derivative awards which were converted to stock-based compensation awards in March 2018.
Change in fair value of warrant liability
Due to changes in the valuation of the warrant liability, the income recorded in the period decreased from $19.5 million to $6.3 million.
Other finance costs
Other finance costs for the period ended December 31, 2018 were $0.7 million, $0.9 million higher than the previous period. Changes in exchange rates resulted in a charge of $2.9 million in retranslating the debt balance. This was offset by a $1.9 million credit from the GBP: USD cross currency swap entered into to mitigate this impact, accounted for under hedge accounting, and a $0.2 million pension interest credit which was in line with the previous period.
Income tax expense
Our effective tax rate for the period ending December 31, 2018 was (1.2)%, and our effective tax rate for the period ending December 31, 2017 was (0.8)%.
Net income
On a reported basis, net income decreased by $13.7 million from net income of $15.3 million to net income of $1.6 million in the period ended December 31, 2018. This variance was partly due to an adverse currency movement of $0.4 million. On a functional currency at constant rate basis net income decreased by $13.4 million, mainly due to the change in fair value of warrant liability, increase in other finance costs and the change in fair value of earnout liability. This was offset by the improvement in net operating loss, the change in fair value of derivative liability and the decrease in interest expense.
Three Months ended December 31, 2018 compared to Three Months ended December 31, 2017 –
Server Based Gaming Segment
SBG segment, Key Performance Indicators
| For the Three-Month Period ended | ||||||||||||||||
| Unaudited | Unaudited | |||||||||||||||
| Dec 31, | Dec 31, | Variance | ||||||||||||||
| SBG | 2018 | 2017 | 2018 vs 2017 | |||||||||||||
| End of period installed base (# of terminals) | 34,578 | 29,985 | 4,593 | 15.3 | % | |||||||||||
| Average installed base (# of terminals) | 33,811 | 29,310 | 4,500 | 15.4 | % | |||||||||||
| Customer Gross Win per unit per day (1) | £ | 109.62 | £ | 115.92 | (£ | 6.30 | ) | (5.4 | %) | |||||||
| Customer Net Win per unit per day (1) | £ | 77.71 | £ | 82.93 | (£ | 5.21 | ) | (6.3 | %) | |||||||
| Inspired Blended Participation Rate | 6.2 | % | 6.1 | % | 0.1 | % | ||||||||||
(1) Includes all SBG terminals in which the company takes a participation revenue share across all territories
SBG segment, key events that affected results for the Three Months ended December 31, 2018
Our SBG rollout into the Greek sector continued during the period with a further 1,300 being deployed on site and live. The total installed base of our contracted 8,360 terminals in Greece is now over 6,800 as of December 31, 2018. The performance of our Greek terminals continues to be strong against our competitors.
In Italy, customer Gross Win per unit per day (in EUR) increased by 16.9% across all customers compared to the same period last year due to new content releases. This was partly offset by a tax that reduced Net Win per unit per day growth to 14.6%.
During the period, an additional 125 Self Service Betting Terminals (“SSBTs”) were sold and deployed in the UK sector. In addition to the hardware sale margin these terminals also generate an ongoing recurring service fee.
In the UK Casino sector, we secured an agreement for the sale of 158 “Flex” B3 terminals to a major customer.
In the UK Electronic Table Games (ETG) sector, we secured an agreement for the sale of 108 “Sabre Hydra” terminals to a major Casino customer.
Overall, the size of our Average Installed Base increased 15.4%, to 33,811, due to our continued terminal rollout in Greece and growth from new contract awards in the UK LBO estate. Customer Gross Win per unit per day (in our functional currency, GBP) decreased by 5.4% across the entire estate, driven by the impact of our SBG installations in Greece, as our Greek machines return a lower daily Customer Gross Win compared to our UK machines. Our blended participation rate increased 0.1% to 6.2% due to an increased proportion of Greece installed base.
SBG segment, key events that affected results for the Three Months ended December 31, 2017
Our SBG rollout into the Greek sector continued during this period, with approximately 3,400 terminals installed as of December 31, 2017.
During the period, we launched our new SBG cabinet the “Flex 4K” with trials in two of our major UK LBO customers and contracted for the hardware sale of a further 600 Flex 4K terminals to our second largest UK LBO customer.
In addition to the comparable period in 2016, 223 SSBTs were sold and deployed in the UK sector. These provide recurring service revenue.
SBG Segment, Three Months ended December 31, 2018 compared to Three Months ended December 31, 2017
| Server Based Gaming | For the Three-Month Period ended | Variance | ||||||||||||||||||||||||||
| Unaudited | Unaudited | |||||||||||||||||||||||||||
| (In thousands) | Dec 31, 2018 | Dec 31, 2017 | Variance 2018 vs 2017 |
Currency at Constant rate | Functional Currency | Currency Movement | ||||||||||||||||||||||
| Revenue: | ||||||||||||||||||||||||||||
| Service | $ | 21,816 | $ | 21,808.6 | $ | 8 | 0.0 | % | $ | 984 | 4.5 | % | ($ | 976 | ) | |||||||||||||
| Hardware | 686 | 1,020 | (334 | ) | (32.8 | %) | (294 | ) | (28.8 | %) | (41 | ) | ||||||||||||||||
| Total revenue | 22,502 | 22,829 | (327 | ) | (1.4 | %) | 690 | 3.0 | % | (1,017 | ) | |||||||||||||||||
| Cost of sales, excluding depreciation and amortization: | ||||||||||||||||||||||||||||
| Cost of service | (4,900 | ) | (4,053 | ) | (847 | ) | 20.9 | % | (1,067 | ) | 26.3 | % | 220 | |||||||||||||||
| Cost of hardware | (593 | ) | (906 | ) | 313 | (34.5 | %) | 277 | (30.7 | %) | 35 | |||||||||||||||||
| Total cost of sales | (5,493 | ) | (4,959 | ) | (534 | ) | 10.8 | % | (789 | ) | 15.9 | % | 255 | |||||||||||||||
| Selling, general and administrative expenses | (6,913 | ) | (8,147 | ) | 1,234 | (15.1 | %) | 936 | (11.5 | %) | 298 | |||||||||||||||||
| Stock-based compensation | (113 | ) | (65 | ) | (48 | ) | 73.8 | % | (53 | ) | 82.0 | % | 5 | |||||||||||||||
| Depreciation and amortization | (7,784 | ) | (7,607 | ) | (177 | ) | 2.3 | % | (529 | ) | 7.0 | % | 352 | |||||||||||||||
| Net operating profit | $ | 2,199 | $ | 2,051 | $ | 148 | 7.2 | % | $ | 254 | 12.4 | % | ($ | 107 | ) | |||||||||||||
| Exchange Rate - $ to £ | 1.29 | 1.34 | ||||||||||||||||||||||||||
63
SBG segment revenue. In the period revenue decreased by $0.3 million, to $22.5 million, on a reported basis. This decrease was due to adverse currency movements of $1.0 million. On a functional currency at constant rate basis, SBG revenue increased by $0.7 million, or 3.0% on a functional currency basis.
Service revenue remained consistent, on a reported basis. This is due to adverse currency movements of $1.0 million. On a functional currency at constant rate basis, SBG service revenue increased by $1.0 million, or 4.5% on a functional currency basis, to $21.8 million. This was due to an increase in the Italian sector of $0.9 million due to the growth in both Gross and Net Wins and the Greek sector of $0.6 million, driven by the continued rollout in Greece. This was partly offset by a decrease in service revenue in UK LBO of $0.4 million primarily due to the expiry of a customer service contract.
The continued rollout into the Greek sector drove additional participation revenue of $1.2 million and other recurring revenue of $0.6 million. This was partly offset by a $1.2 million reduction in software license sales compared to the prior period.
During the period there was a small reduction in UK LBO Customer Gross Win per unit per day due to the rollout of 1,200 additional terminals. These machines were placed into lower performing sites, therefore reducing the average Customer Gross Win per unit per day but driving additional revenue.
Hardware revenue decreased by $0.3 million to $0.7 million, on a reported basis. On a functional currency at constant rate basis, SBG hardware revenue decreased by $0.3 million, principally due to lower SSBTs terminal sales in the UK sector of $0.3 million.
SBG segment operating income. Cost of sales (excluding depreciation and amortization) increased by $0.5 million to $5.5 million, on a reported basis. This variance was impacted by favorable currency movements of $0.3 million. On a functional currency at constant rate basis, cost of sales increased by $0.8 million. This was principally due to an increase in service costs of $1.1 million due to Greek SBG service costs of $0.8 million, driven by the increase in terminals as the Greece rollout continues, and an increase in cost of service in Italy of $0.3 million.
SG&A expenses decreased by $1.2 million to $6.9 million, on a reported basis. Of this variance, $0.3 million arose from favorable currency movements. This resulted in a functional currency at constant rate decrease of $0.9 million driven by staff related cost savings of $1.1 million, offset by $0.3 million driven by lower manufacturing recoveries due to lower factory throughput.
Depreciation and amortization increased by $0.2 million to $7.8 million on a reported basis. Of this amount, $0.4 million arose due to favorable currency movements. On a functional currency at constant rate basis, the increase was $0.5 million, driven by $0.3 million from additional amortization and $0.1 million of additional machine and machine related depreciation. The additional amortization was driven by new projects going live in the UK and Greek sectors. The additional machine and machine related depreciation was driven by the continued terminal rollout in the Greek sector of $0.9 million, partly offset by lower depreciation in the UK ($0.6 million) and Italy ($0.1 million) due to machines being fully depreciated.
SBG operating profit increased by $0.1 million to $2.2 million, on a reported basis. Of this variance, $0.1 million arose from adverse currency movements. On a functional currency at constant rate basis, SBG operating profit increased by $0.3 million. This was primarily due to the increase in revenue and decrease in SG&A, partly offset by higher cost of sales and additional depreciation and amortization.
SBG segment, Recurring Revenue
Set forth below is a breakdown of our SBG recurring revenue. SBG recurring revenue consists principally of SBG participation revenue.
| For the Three-Month Period ended | ||||||||||||||||
| Unaudited Dec 31, | Unaudited Dec 31, | Variance 2018 vs 2017 | ||||||||||||||
| SBG Recurring Revenue | 2018 | 2017 | % | |||||||||||||
| Total SBG Revenue | £ | 17,504 | £ | 16,991 | £ | 514 | 3.0 | % | ||||||||
| SBG Participation Revenue (£’000) | £ | 15,055 | £ | 13,614 | £ | 1,441 | 10.6 | % | ||||||||
| SBG Other Fixed Fee Recurring Revenue (£’000) | £ | 239 | £ | 253 | (£ | 14 | ) | (5.4 | %) | |||||||
| Total SBG Recurring Revenue (£’000) | £ | 15,295 | £ | 13,867 | £ | 1,427 | 10.3 | % | ||||||||
| SBG Recurring Revenue as a Percentage of Total SBG Revenue | 87.4 | % | 81.6 | % | 5.8 | % | ||||||||||
SBG segment, Service Revenue by Region
Set forth below is a breakdown of our SBG service revenue by geographic region. SBG service revenue consists principally of SBG participation revenue.
| Server Based Gaming Service Revenue by Region | For the Three-Month Period ended | |||||||||||||||||||||||||||
| Unaudited Dec 31, | Unaudited Dec 31, | Variance | Variance | |||||||||||||||||||||||||
| (In thousands) | 2018 | 2017 | 2018 vs 2017 | Functional Currency at Constant rate | Functional Currency | Currency Movement | ||||||||||||||||||||||
| Service Revenue: | ||||||||||||||||||||||||||||
| UK LBO | $ | 13,630 | $ | 14,281 | ($ | 651 | ) | (4.6 | %) | ($ | 57 | ) | (0.4 | %) | ($ | 594 | ) | |||||||||||
| UK Other | 1,254 | $ | 1,719 | (465 | ) | (27.0 | %) | (408 | ) | (23.7 | %) | (57 | ) | |||||||||||||||
| Italy | 2,911 | $ | 2,108 | 803 | 38.1 | % | 937 | 44.4 | % | (134 | ) | |||||||||||||||||
| Greece | 3,834 | $ | 3,432 | 402 | 11.7 | % | 585 | 17.1 | % | (183 | ) | |||||||||||||||||
| Rest of the World | 187 | $ | 268 | (81 | ) | (30.4 | %) | (73 | ) | (27.3 | %) | (8 | ) | |||||||||||||||
| Total service revenue | $ | 21,816 | $ | 21,809 | $ | 8 | 0.0 | % | $ | 984 | 4.5 | % | ($ | 976 | ) | |||||||||||||
| Exchange Rate - $ to £ | 1.29 | 1.34 | ||||||||||||||||||||||||||
65
Virtual Sports Segment, Three Months ended December 31, 2018 compared to Three Months ended December 31, 2017
Virtual Sports segment, Key Performance Indicators
| For the Three-Month Period ended | ||||||||||||||||
| Virtuals | Unaudited Dec 31, | Unaudited Dec 31, | Variance 2018 vs 2017 | |||||||||||||
| 2018 | 2017 | % | ||||||||||||||
| No. of Live Customers at the end of the period | 100 | 86 | 14 | 16.3 | % | |||||||||||
| Average No. of Live Customers | 96 | 83 | 13 | 15.7 | % | |||||||||||
| Total Revenue (£’000) | £ | 6,404 | £ | 6,371 | £ | 33 | 0.5 | % | ||||||||
| Total Revenue £’000 - Retail | £ | 3,831 | £ | 3,812 | £ | 19 | 0.5 | % | ||||||||
| Total Revenue £’000 - Scheduled Online Virtuals | £ | 2,109 | £ | 1,887 | £ | 222 | 11.7 | % | ||||||||
| Total Revenue £’000 - Interactive | £ | 464 | £ | 672 | (£ | 208 | ) | (30.9 | %) | |||||||
| Average Revenue Per Customer per day (£) | £ | 725 | £ | 834 | (£ | 109 | ) | (13.1 | %) | |||||||
| For the Three-Month Period ended | ||||||||||||||||
Unaudited Dec 31, | Unaudited Dec 31, | Variance 2018 vs 2017 | ||||||||||||||
| Virtual Sports Recurring Revenue | 2018 | 2017 | ||||||||||||||
| Total Virtual Sports Revenue (£'000) | £ | 6,404 | £ | 6,371 | £ | 33 | 0.5 | % | ||||||||
| Recurring Revenue (£'000) - Retail and Scheduled Online Virtuals | £ | 5,358 | £ | 4,976 | £ | 382 | 7.7 | % | ||||||||
| Recurring Revenue (£'000) - Interactive | £ | 524 | £ | 572 | (£ | 48 | ) | (8.3 | %) | |||||||
| Total Virtual Sports Recurring Revenue (£'000) | £ | 5,883 | £ | 5,548 | £ | 334 | 6.0 | % | ||||||||
| Virtual Sports Recurring Revenue as a Percentage of Total Virtual Sports Revenue | 91.9 | % | 87.1 | % | 4.8 | % | ||||||||||
Virtual Sports segment, key events that affected results for the Three Months ended December 31, 2018
In Greece we deployed our latest Football product, Matchday, across the full estate of over 3,400 venues.
Our largest customer in Italy launched our latest Football product Matchday Gold designed specifically for the territory on both retail and online platforms.
The Average Number of Live Customers during the period increased by 13, from 83 to 96. Including the launch of eight new Interactive customers, five of which were launched via the NYX platform and three via the Playtech platform including BGO, Buzz Bingo and Sun Bingo, taking our Average Number of Live Interactive Customers for the period to 31.
Overall revenue per customer has decreased during the period, this is due to a sharp increase in customers in the quarter with revenues expected to increase throughout 2019.
Virtual Sports segment, key events that affected results for the Three Months ended December 31, 2017
As of December 31, 2017, OPAP offered our Virtual Sports product in over 4,000 retail venues following launch in April 2017.
During the 2017 quarterly period, our Virtual Sports products continued to grow in Poland through the retail venues and online channels of Fortuna, Central Europe’s largest betting operator.
By the end of the 2017 quarterly period, our Interactive business was live with 16 customers, having launched ten new customers since December 31, 2016, including Betfair, Grosvenor Casino (part of the Rank Group), Bwin, Sportingbet, VideoSlots, and a variety of Betsson brands.
Virtual Sports segment, Three Months ended December 31, 2018 compared to Three Months ended December 31, 2017
| Virtual Sports | For the Three-Month Period ended | Variance | Variance | |||||||||||||||||||||||||
| (In thousands) | Unaudited Dec 31, 2018 | Unaudited Dec 31, 2017 | 2018 vs 2017 | Functional Currency at Constant rate | Functional Currency | Currency Movement | ||||||||||||||||||||||
| Service Revenue | $ | 8,230 | $ | 8,558 | ($ | 328 | ) | (3.8 | %) | $ | 44 | 0.5 | % | ($ | 372 | ) | ||||||||||||
| Cost of Service | (1,077 | ) | (1,143 | ) | 67 | (5.8 | %) | 16 | (1.4 | %) | 50 | |||||||||||||||||
| Selling, general and administrative expenses | (3,296 | ) | (2,721 | ) | (575 | ) | 21.1 | % | (735 | ) | 27.0 | % | 160 | |||||||||||||||
| Stock-based compensation | (83 | ) | (79 | ) | (4 | ) | 5.1 | % | (7 | ) | 9.0 | % | 3 | |||||||||||||||
| Depreciation and amortization | (1,376 | ) | (1,600 | ) | 224 | (14.0 | %) | 162 | (10.1 | %) | 62 | |||||||||||||||||
| Net operating profit | $ | 2,398 | $ | 3,016 | ($ | 617 | ) | (20.5 | %) | ($ | 520 | ) | (17.2 | %) | ($ | 97 | ) | |||||||||||
| Exchange Rate - $ to £ | 1.29 | 1.34 | ||||||||||||||||||||||||||
Virtual Sports segment revenue. In the period revenue decreased by $0.3 million on a reported basis. Of this decrease, $0.4 million arose from adverse currency movements. On a functional currency at constant rate basis, Virtual Sports revenue remained unchanged at $8.2 million.
While revenue remained unchanged, $0.4 million was driven by an increase in Virtual Sports land-based and online recurring revenue, due to new customer revenue in Finland of $0.2 million as well as continued growth in Italy of $0.2 million. Total revenue growth was negatively affected by $0.2 million due to a reduction in revenue from long-term Virtual Sports licenses that have now come to an end and lower Interactive revenue due to lower one-off game sales of $0.1 million.
Virtual Sports segment operating income. Cost of service decreased by $0.1 million to $1.1 million, on a reported basis. Of this decrease, $0.1 million arose from favorable currency movements. On a functional currency at constant rate basis, cost of service remained the same as prior period.
SG&A expenses increased by $0.6 million, on a reported basis. Of this increase, $0.2 million arose from favorable currency movements. This resulted in a functional currency at constant rate increase of $0.7 million, which was primarily due to $0.9 million higher Italian tax related costs relating to prior years (removed from Adjusted EBITDA). This was partly offset by staff related savings of $0.3 million.
Depreciation and amortization decreased by $0.2 million to $1.4 million, on a reported basis. Of this decrease, $0.1 million arose from favorable currency movements. This resulted in a functional currency at constant rate decrease of $0.2 million, driven by lower depreciation of platforms and games due to fully depreciated games, including Rush Football.
Operating profit decreased by $0.6 million on a reported basis to $2.4 million. Of this decrease, $0.1 million arose from adverse currency movements. On a functional currency at constant rate basis, this represented a decrease of $0.5 million. This was primarily due to additional SG&A expenses, offset by lower depreciation and amortization.
Reconciliations from net loss, as shown in our Consolidated Statements of Operations and Comprehensive Loss, to Adjusted EBITDA are shown below.
Reconciliation to Adjusted EBITDA
| For the Three-Month Period ended | ||||||||
| (In thousands) | Unaudited Dec 31, 2018 | Unaudited Dec 31, 2017 | ||||||
| Net income | $ | 1,576 | $ | 15,316 | ||||
| Items Relating to Legacy Activities: | ||||||||
| Pension charges | 88 | 140 | ||||||
| Costs relating to former operations | 7 | 5 | ||||||
| Items outside the normal course of business: | ||||||||
| Costs of group restructure | 605 | 780 | ||||||
| Transaction fees | 74 | 574 | ||||||
| Italian tax related costs relating to prior year | 875 | - | ||||||
| Stock-based compensation expense | 1,615 | 3,198 | ||||||
| Depreciation and amortization | 9,589 | 9,560 | ||||||
| Total other income, net | (4,015 | ) | (19,770 | ) | ||||
| Income tax | 56 | 33 | ||||||
| Adjusted EBITDA | $ | 10,470 | $ | 9,836 | ||||
| Adjusted EBITDA | £ | 8,155 | £ | 7,325 | ||||
| Exchange Rate - $ to £ | 1.28 | 1.34 | ||||||
Notes to table:
(1) “Pension charges” are profit and loss charges included within selling, general and administrative expenses, relating to a defined benefit scheme which was closed to new entrants in 1999 and to future accrual in 2010. As well as the amortization of net loss, the figure also includes charges relating to the Pension Protection Fund (which were historically borne by the pension scheme) and a small amount of associated professional services expenses. These costs are included within Central Functions.
(2) “Costs relating to former operations” refers to gains and losses from our Mexican SBG division, which ceased trading prior to the years shown in the consolidated financial statements included in this report. This affects Server Based Gaming results.
(3) “Costs of group restructure” include redundancy costs, Payments In Lieu of Notice costs and any associated employer taxes. To qualify as being an adjusting item, costs must be part of a large restructuring project, which will net save ongoing future costs.
(4) “Italian tax related costs relating to prior years invoicing” relate to VAT charges and associated costs, relating to prior years, imposed on our Virtual Sports segment following changes in interpretation of legislation and an ongoing VAT audit.
(5) Transaction fees, Stock-based compensation expense, Depreciation and amortization, Total other income, net and Income tax are as described above in the Results of Operations line item discussions.
(6) Exchange rate in the table is calculated by dividing the USD Adjusted EBITDA by the GBP Adjusted EBITDA, therefore this could be slightly different from the average rate during the period depending on timing of transactions
Reconciliation to Adjusted Revenue
| For the Three-Month Period ended | ||||||||
| (In thousands) | Unaudited Dec 31, 2018 | Unaudited Dec 31, 2017 | ||||||
| Net revenues | $ | 30,732 | $ | 31,387 | ||||
| Less Nil Margin Sales | - | - | ||||||
| Adjusted Revenue | $ | 30,732 | $ | 31,387 | ||||
| Adjusted Revenue | £ | 23,908 | £ | 23,374 | ||||
| Exchange Rate - $ to £ | $ | 1.29 | $ | 1.34 | ||||
We believe that accounting for nil margin hardware sales in conformance with U.S. GAAP can result in a distorted presentation of our revenue and growth. Therefore, we use Revenue Excluding Nil Margin Sales, or Adjusted Revenue, to internally analyze our operating performance. A reconciliation from revenue, as shown in our Consolidated Statements of Operations and Comprehensive Loss included elsewhere in this report, to Adjusted Revenue is shown above.
Liquidity and Capital Resources
Three Months ended December 31, 2018 compared to Three Months ended December 31, 2017
| Period Ended | Variance | |||||||||||
| (in thousands) | Dec 31, 2018 | Dec 31, 2017 | 2018 to 2017 | |||||||||
| Net income | $ | 1,576 | $ | 15,316 | ($ | 13,740 | ) | |||||
| Non-cash interest expense including amortization of fees | 522 | 1,924 | (1,402 | ) | ||||||||
| Change in fair value of derivative, warrant and earnout liabilities and | (7,210 | ) | (21,557 | ) | 14,347 | |||||||
| stock-based compensation expense | ||||||||||||
| Foreign currency translation on senior bank debt and cross currency swaps | 673 | 0 | 673 | |||||||||
| Depreciation and amortization | 9,589 | 9,560 | 29 | |||||||||
| Other net cash utilized by operating activities | (4,254 | ) | (5,352 | ) | 1,098 | |||||||
| Net cash provided by operating activities | 896 | (109 | ) | 1,005 | ||||||||
| Net cash used in investing activities | (6,631 | ) | (6,813 | ) | 182 | |||||||
| Net cash used in financing activities | (578 | ) | (1,810 | ) | 1,232 | |||||||
| Effect of exchange rates on cash | (150 | ) | (307 | ) | 157 | |||||||
| Net (decrease)/increase in cash and cash equivalents | ($ | 6,463 | ) | ($ | 9,039 | ) | $ | 2,576 | ||||
Net cash provided by operating activities. In the period, net cash inflow generated by operating activities was $0.9 million, compared to a $0.1 million outflow in the prior period, representing a $1.0 million improvement in cash generation.
Non-cash interest expense decreased by $1.4 million, to $0.5 million. The current period’s non-cash interest expense related to amortization of debt fees incurred in relation to the business refinancing in August 2018 whereas the prior period’s expense related to PIK interest charged on the debt held prior to the refinancing.
Change in fair value of derivative, warrant and earnout liabilities and stock-based compensation expense decreased by $14.4 million from an outflow of $21.6 million to an outflow of $7.2 million. Movements in the market value of the stock price resulted in a $3.0 million lower earnout outflow in the current period which was partly offset by a $1.3 million movement in stock-based compensation expense and a $0.9 million movement in the fair valuation of the cross-currency swaps executed in August 2018 on the new debt. The income relating to the change in the fair value of the warrant liability reduced by $13.2 million in the period to $6.3 million.
Foreign currency translation on senior bank debt and cross currency swaps following the refinancing of the Group on August 14, 2018 resulted in a charge in the period of $0.7 million as a result of the movement in exchange rates during the current period.
Depreciation, amortization and impairment remained constant at $9.6 million.
Other net cash utilized by operating activities decreased by $1.1 million, to a $4.3 million outflow. This decrease was largely due to movements in income accruals of $2.0 million and other creditors of $3.2 million which were partly offset by movements in deferred revenue creditor levels of $3.5 million. The movement in income accruals related to a one-off increase at the end of the prior period and the movement in other creditors relates to the unwind in the debt interest accrual in the prior period reflecting the timing of interest payments under the previous debt financing structure. The prior year also showed an increase in deferred revenue creditor levels due to the roll out of machines into Greece, whereas in the current period it has reduced as it is recognized through the profit and loss account.
The current period’s outflow contains an additional UK payroll payment of $1.9 million as compared to the previous period due to timing. This is expected to reverse in the next period. A bonus payment of $0.8 million was also made in the current period. The prior year’s quarter had the normal level of payroll runs and no bonus payment.
Net cash used in investing activities. Net cash used in investing activities decreased by approximately $0.2 million, to $6.6 million. The decrease was attributable to lower levels of spending on capital software compared to the prior year.
Net cash used by financing activities. In the current period, net cash used by financing activities decreased by $1.2 million, to a $0.6 million outflow. This was due to the prior period making a debt repayment of $7.7 million but also increasing the level of revolver utilization by $6.0 million. The current period has incurred $0.5 million of debt fee payments relating to the refinancing in August 2018.
Long Term and Other Debt
| (In thousands) | December 31, 2018 | December 31, 2017 | ||||||||||||||
| Cash held | £ | 12,521 | $ | 15,988 | £ | 8,139 | $ | 10,989 | ||||||||
| Revolver drawn | - | - | (10,000 | ) | (13,502 | ) | ||||||||||
| Original principal senior debt | (109,641 | ) | (140,000 | ) | (72,500 | ) | (97,890 | ) | ||||||||
| Compounded PIK interest | - | - | (9,193 | ) | (12,412 | ) | ||||||||||
| PIK interest accrued | - | - | (486 | ) | (656 | ) | ||||||||||
| Cash interest accrued | (39 | ) | (50 | ) | (636 | ) | (859 | ) | ||||||||
| Finance lease creditors | (338 | ) | (432 | ) | (712 | ) | (962 | ) | ||||||||
| Total | (£ | 97,497 | ) | ($ | 124,493 | ) | (£ | 85,388 | ) | ($ | 115,292 | ) | ||||
Off-Balance Sheet Arrangements
As of December 31, 2018, there were no off-balance sheet arrangements, as defined in Item 303(a)(4)(ii) of Regulation S-K.
Critical Accounting Policies and Accounting Estimates
The preparation of our unaudited condensedaudited consolidated financial statements in conformity with accounting principles generally accepted in the United States (“U.S. GAAP”) requires management to make estimates and assumptions. We exercise considerable judgment with respect to establishing sound accounting policies and in making estimates and assumptions that affect the reported amounts of our assets and liabilities, our recognition of revenue and expenses, and our disclosure of commitments and contingencies at the date of the consolidated financial statements. On an on-going basis, we evaluate our estimates and judgments. We base our estimates and judgments on a variety of factors, including our historical experience, knowledge of our business and industry and current and expected economic conditions, that are believed to be reasonable under the circumstances, the results of which form the basis for making judgments about the carrying values of assets and liabilities that are not readily apparent from other sources. We periodically re-evaluate our estimates and assumptions with respect to these judgments and modify our approach when circumstances indicate that modifications are necessary. While we believe that the factors we evaluate provide us with a meaningful basis for establishing and applying sound accounting policies, we cannot guarantee that the results will always be accurate. Since the determination of these estimates requires the exercise of judgment, actual results could differ from such estimates.
For a discussion of other recently issued accounting standards, and assessments as to their impacts on the Company, see Nature of Operations, Management’s Plans and Summary of Significant Accounting Policies, Note 1 to the consolidated financial statements included elsewhere in this report.
| 57 |
ITEM 7A. QUANTITATIVE AND QUALITATIVE DISCLOSURES ABOUT MARKET RISK
Our principal market risks are our exposure to changes in interest rates and foreign currency exchange rates.
Interest Rate Risk
We haveFollowing the Company’s refinancing of its debt in May 2021, the external borrowings that are subject to the risk of higher interest charges associated with increases in interest rates. As of December 31, 2019, we had £140.0£235.0 million ($184.9282.9 million) are provided at a fixed rate. Therefore, movements in rates such as LIBOR do not impact on the current borrowings and €90.0 million ($101.1 million) of senior bank debtthe only fluctuation that is subjectexpected to a floating interest rate chargebe reported will be that can vary withsolely caused by movements in the 3-month LIBORexchange rates between the Company’s functional currency and the 3-month EUROLIBOR rates. If the floating interest rates increased by 1%, the additional interest charge would be approximately $1.8 million. If the floating interest rates increased by 5%, the additional interest charge would be approximately $8.8 million.its reporting currency.
Foreign Currency Exchange Rate Risk
Our operations are conducted in various countries around the world, and we receive revenue and pay expenses from these operations in a number of different currencies. As such, our earnings are subject to movements in foreign currency exchange rates when transactions are denominated in (i) currencies other than GBP, which is our functional currency, or (ii) the functional currencies of our subsidiaries, which is not necessarily GBP. To estimate our foreign currency exchange rate risk, we identify material Euro and US Dollar trading and balance sheet amounts and recalculate the result using a 10% movement in the GBP:US Dollar exchange rate. For the trading figures the 10% movement is based on the average exchange rate throughout the reported period and for the balance sheet figures the 10% movement is based on the exchange rate used at December 31, 2022.
Excluding intercompany balances, our Euro functional currency net liabilitiesassets total approximately $86.3$0.4 million, and our US Dollar functional currency net liabilitiesassets total approximately $9.5$4.6 million. We use a sensitivity analysis model to measure the impact of a 10% adverse movement of foreign currency exchange rates against the US Dollar. A hypothetical 10% adverse change in the value of the Euro and the US Dollar relative to GBP as of December 31, 20192022, would result in favorable translation adjustments of approximately $7.7$0.0 million and $1.0$0.5 million, respectively, recorded in other comprehensive loss.
Included within our trading results are earnings outside of our functional currency. Retained earningsgains from Euro based entities earned in Euros and retained losses from USD based entities earned in US Dollars in the periodtwelve months ended December 31, 20192022, were €0.5€13.4 million and $21.6$12.3 million, respectively. A hypothetical 10% adverse change in the value of the Euro and the US Dollar relative to GBP as of December 31, 20192022, would result in translation adjustments of approximately $0.1$1.3 million favorable and $2.0$1.1 million unfavorable, respectively, recorded in trading operations.
The majority of the Company’s trading is in GBP, the functional currency, although the reporting currency of the Company is the US Dollar. As such, changes in the GBP:USD exchange rate have an effect on the Company’s results. A 10% weakening of GBP against the US Dollar would change the trading operational results unfavorably by approximately $1.8$2.2 million and would result in unfavorable translation adjustments of approximately $3.9$7.4 million, recorded in other comprehensive loss.
For further information regarding the new external borrowings, see Note 1213 to the Consolidated Financial Statements, “Long Term and Other Debt”.
| 58 |
ITEM 8. FINANCIAL STATEMENTS AND SUPPLEMENTARY FINANCIAL DATA.Financial Statements and Supplementary Data.
Our financial statements are set forth below following the signature page.in Item 15 below.
ITEMItem 9. CHANGES IN AND DISAGREEMENTS WITH ACCOUNTANTS.Changes in and Disagreements With Accountants on Accounting and Financial Disclosure.
None.
ITEMItem 9A. CONTROLS AND PROCEDURES.Controls and Procedures.
Evaluation of Disclosure Controls and Procedures.
Disclosure controls and procedures are controls and other procedures designed to ensure that information required to be disclosed in our reports filed or submitted under the Exchange Act is recorded, processed, summarized, and reported within the time periods specified in the SEC’s rules and forms. Disclosure controls and procedures include, without limitation, controls and procedures designed to ensure that information required to be disclosed in our reports filed or submitted under the Exchange Act is accumulated and communicated to management, including our Executive Chairman and our Chief Financial Officer (together, the “Certifying Officers”), or persons performing similar functions, as appropriate, to allow timely decisions regarding required disclosure. Under the supervision and with the participation of our management, including our Certifying Officers, we carried out an evaluation of the effectiveness of the design and operation of our disclosure controls and procedures as defined in Rules 13a-15(e) and 15d-15(e) under the Exchange Act.
As a result of Based on this evaluation, the deficiencies noted below that, in the aggregate led to a material weakness in our internal control over financial reporting disclosed below, which management believes arose as a result of several unusual events including but not limited to the present COVID-19 outbreak, our Certifying Officers have concluded that ourthe Company’s disclosure controls and procedures at December 31, 2022 were not effective, atdue to the reasonable assurance level as of December 31, 2019.material weaknesses described below.
Notwithstanding the identifiedIn light of these material weakness and management’s assessmentweaknesses, we performed additional analyses as deemed necessary to ensure that our internal control over financial reporting was not effective as of December 31, 2019,statements were prepared in accordance with U.S. generally accepted accounting principles. Accordingly, management believes that the consolidated financial statements and related disclosures included in this Annual Report on Form 10-K present fairly present, in all material respects our financial condition,position, results of operations, and cash flows as of and for the periods presented in accordance with generally accepted accounting principles.presented.
Management’s Report on Internal Control Over Financial Reporting
As required by the SEC rules and regulations for the implementation as Part of Section 404 of the Sarbanes-Oxley Act of 2002 our(“SOX”)
Our management is responsible for establishing and maintaining adequate internal control over financial reporting. Insofar as the Company is subject to Section 404(b) of SOX, this Annual Report on Form 10-K includes an opinion by our external auditors on the effectiveness of our internal control over financial reporting at December 31, 2022 in addition to management’s assessment of the effectiveness of internal control over financial reporting under the requirements of Section 404(a) of SOX. Our internal control over financial reporting is designed to provide reasonable assurance regarding the reliability of financial reporting and the preparation of our consolidated financial statements for external reporting purposes in accordance with U.S. GAAP. Our internal control over financial reporting includes those policies and procedures that:
(1) pertain to the maintenance of records that, in reasonable detail, accurately and fairly reflect the transactions and dispositions of the assets of our Company;
(2) provide reasonable assurance that transactions are recorded as necessary to permit the preparation of consolidated financial statements in accordance with U.S. GAAP, and that our receipts and expenditures are being made only in accordance with authorizations of our management and directors; and
| 59 |
(3) provide reasonable assurance regarding prevention or timely detection of any unauthorized acquisition, use or disposition of our assets that could have a material effect on the consolidated financial statements.
Because of its inherent limitations, internal
Internal control over financial reporting may not prevent or detect errors or misstatements in our consolidated financial statements. Also, projections of any evaluation of effectiveness to future periods are subject to the risk that controls may become inadequate because of changes in conditions, or that the degree or compliance with the policies or procedures may deteriorate.
Management has assessed the effectiveness of ourthe Company’s internal control over financial reporting as of December 31, 2019. In making this assessment, management used2022 based on the criteria set forth in 2013 by the Committee of Sponsoring Organizations of the Treadway Commission (COSO) in Internal Control — Integrated Framework (2013).Control-Integrated Framework. Based on this evaluation, management identified the following deficiencies inthat assessment, our internal control over financial reporting as describedat December 31, 2022 was not effective, based upon the material weaknesses discussed below.
In connection with the audit of our consolidated financial statements and related disclosures as of and for the year ended December 31, 2019, we identified certain misstatements in our draft year-end footnote disclosures provided to them which were not individually material but which in aggregate led to a material weakness in our internal control over financial reporting. All significant identified errors have been corrected. A material weakness is defined as a deficiency, or combination of deficiencies, in internal control over financial reporting such that there is a reasonable possibility that a material misstatement of annual or interim financial statements will not be prevented or detected and corrected on a timely basis. The material weakness did not result
Remediation of Previously Reported Material Weakness
As previously disclosed in any identified misstatements to the current financial statements or footnote disclosures and there were no changes to previously released financial statements or footnote disclosures apart from two immaterial account reclassifications, one on the balance sheet and one on the statementItem 9A of cash flows. Management has concluded that the misstatements in our footnote disclosures were the result of several unusual events occurring during the fourth quarter 2019 and/or during the related accounting closing and reporting period leading up to our Annual Report on Form 10-K including office closures due toForm10-K for the COVID-19 outbreak, a significant acquisition, first time adoption of accounting standards and which, in the aggregate, contributed to a breakdown in related controls over footnote disclosure review. As a result of the material weakness, management concluded that our internal control over financial reporting was not effective as ofyear ended December 31, 2019.
In addition,2021, management has identified a material weakness in internal controls relatedcontrol over financial reporting relating to an ineffective risk assessment and response process (the “Risk Assessment and Response Material Weakness”). Namely, the Company had not established an effective control environment due to the ineffective design and implementation of certain process controls, including management review controls. These controls pertain to accounting for warrants, as describedestimates, account reconciliations, and approval processes of some of the Company’s significant accounts. These deficiencies represented material weaknesses in Note 1 to the Notes to Consolidated Financial Statements entitled “Restatement of Previously Reported Information”.
As a non-accelerated filer, the Company is not required to include in this report a report on the effectiveness ofCompany’s internal control over financial reporting byas there was a reasonable possibility that a material misstatement with respect to certain of the Company’s independent registered public accounting firm.significant accounts and disclosures would not be prevented or detected on a timely basis. Factors contributing to the Risk Assessment and Response Material Weakness included the fact that during 2021, the Company centralized all its finance functions into one location and implemented a new Enterprise Resource Planning (“ERP”) system which went live much later in the year than initially planned, as it had to be put on hold due to the impact that the COVID-19 pandemic had on the Company. As a result, there was insufficient time prior to year-end to implement or operate certain controls which were newly designed or re-designed as a result of the impact of the ERP implementation. The Company had also been without its Chief Financial Officer for a period of time due to illness, which required a redistribution of roles and responsibilities, including those related to controls.
73
RemediationWe have remediated this previously reported Risk Assessment and Response Material Weakness by (1) establishing an executive steering committee to monitor the remediation of Material Weakness
Our Boardthe underlying control deficiencies, (2) hiring an additional SOX specialist in June 2022 to support the Chief Financial Officer and Director of DirectorsFinance, (3) increasing the use our outsourced SOX service provider to assist in all aspects of our SOX program, (4) providing one-on-one training to control owners who are part of our broader accounting and management takeoperations teams on control execution and related documentation and evidence, (5) re-mapping internal control over financial reporting to risks and financial statement assertions, (6) remediating previously identified control gaps or deficient controls by implementing newly designed controls and/or enhancing the integrityoperation and/or underlying evidence of our financial statements seriously. Prospectivelyexisting controls, (7) expanding business process narratives with enhanced details of process flows and in particular whilecontrols, and (8) enhancing the current remote working conditions associated with the COVID-19 outbreak remain in effect, Management intends to ensure that all reviews are fully completed prior to issuing the draft financial statements to our external auditors (or where possible make it clear this is the case) . Management will also add an additional third-party external reviewdocumentation of the financial statementsexecution of management review controls. The Company completed its testing of the effectiveness of the remediated, newly designed, and re-designed controls and, other than those relating to the process prior to submission moving forward. At this time, we cannot provide assurancematerial weaknesses identified below, noted no material control deficiencies. As a result, management concluded that these remediation efforts will be successful or that ourthe Risk Assessment and Response Material Weakness was remediated as of December 31, 2022.
| 60 |
Identified Material Weaknesses and Remediation
Segregation of Duties
Management has identified internal control overdeficiencies due to IT program and data changes affecting the Company’s financial reporting willIT applications and underlying accounting records, not being identified, tested, authorized, and implemented appropriately to validate that data produced by its relevant IT system(s) was complete and accurate. Automated process-level controls and manual controls that are dependent upon the information derived from such financially relevant systems were also determined to be effectiveineffective as a result of these efforts. In addition, we continue to evaluatesuch deficiency and work to improve our internal control over financial reporting relatedthere was not appropriate segregation of duties that would adequately restrict user and privileged access to the identified deficienciesfinancially relevant systems and data to the appropriate Company personnel. Management has concluded that led, in aggregate,the likelihood that these deficient controls would fail to prevent or detect a material misstatement is a reasonable possibility and rise to a material weakness in the aggregate.
Management is planning to remediate the design of segregation of duties incompatibilities during 2023 by changing access levels, and reviewers, and updating policies. Despite this deficiency, Management is not aware of any resulting financial statement misstatements and, additionally, management may determinehas undertaken a retrospective analysis of 2022 transactions of individuals with such incompatibilities and our analysis indicates that none of the changes made was incorrect or inappropriate.
Holiday Park Cash Collections
Management has identified a deficiency in one aspect of our cash collection process related to take additional measuresthe completeness and accuracy (risk of understatement) of our recording of cash collection amounts relating to address control deficienciesour holiday park business in that the process for reviewing and approving cash receipts was not consistently documented or determineimplemented.
Despite this deficiency, management is not aware of any resulting financial statement misstatements or cash count discrepancies and management is planning to modifyremediate the material weakness during 2023 by implementing new or enhanced controls around cash collections at holiday parks.
Contract Approvals
Management has identified a deficiency related to the design and operation of the Company’s contract review and approval process in relation to certain contract amendments.
Despite this deficiency, Management is not aware of any resulting financial statement misstatements or inappropriate contract terms and management is planning to remediate the material weakness during 2023 by implementing new or enhanced controls around contracting with customers, specifically as it relates to contract amendments.
With respect to each of the above, management has begun the remediation plan described above.process, however the material weaknesses cannot be considered fully remediated until it is demonstrated that the new or enhanced controls and other impacted or dependent controls have operated effectively for a sufficient period of time.
Changes in Internal Control Over Financial Reporting
Except for the changes noted above regardingin connection with the initiatives to remediate material weakness and the implementation of internal controls over lease accounting and revenue recognition related to our implementation of ASU No. 2016-02, Leases (Topic 842) and ASC 606, Revenue Recognition, respectively,weaknesses, there have been no other changes in our internal control over financial reporting (as such term is defined in Rules 13a-15(f) and 15d-15(f) of the Exchange Act) during the most recent fiscal quarter that have materially affected, or are reasonably likely to materially affect, our internal control over financial reporting.
| 61 |
REPORT OF INDEPENDENT REGISTERED PUBLIC ACCOUNTING FIRM ON INTERNAL CONTROL OVER FINANCIAL REPORTING
To the Shareholders and Board of Directors of
Inspired Entertainment, Inc. and Subsidiaries
Adverse Opinion on Internal Control over Financial Reporting
We have audited Inspired Entertainment, Inc. and Subsidiaries’ (the “Company”) internal control over financial reporting as of December 31, 2022, based on criteria established in Internal Control-Integrated Framework (2013) issued by the circumstancesCommittee of Sponsoring Organizations of the Treadway Commission. In our opinion, because of the effect of the material weakness described in the following paragraph on the achievement of the objectives of the control criteria, the Company has not maintained effective internal control over financial reporting as of December 31, 2022, based on criteria established in Internal Control-Integrated Framework (2013) issued by the Committee of Sponsoring Organizations of the Treadway Commission.
A material weakness is a control deficiency, or combination of deficiencies, in internal control over financial reporting, such that led tothere is a reasonable possibility that a material misstatement of the restatement of ourCompany’s annual or interim financial statements describedwill not be prevented or detected on a timely basis. The following material weakness has been identified and included in this“Management’s Annual Report on Form 10-K hadInternal Control Over Financial Reporting”:
The Company did not yet been identified. Due solelydesign and/or implement program change management and user access controls to ensure:
IT program and data changes affecting the Company’s financial IT applications & underlying accounting records, are identified, tested, authorized and implemented appropriately to validate that data produced by its relevant IT system(s) were complete and accurate. Automated process-level controls and manual controls that are dependent upon the information derived from such financially relevant systems were also determined to be ineffective as a result of such deficiency and appropriate segregation of duties that would adequately restrict user and privileged access to the eventsfinancially relevant systems and data to the appropriate Company personnel.
The Company has not designed an effective control related to the completeness and accuracy of cash collection amounts input to the Company’s records in the Leisure Segment.
The Company has not designed effective controls over the contract approval process relating to revenue contracts, including contracts involving royalty rates.
These deficiencies represent material weaknesses in the Company’s internal control over financial reporting as there is a reasonable possibility that leda material misstatement with respect to the Company’s significant accounts and disclosures will not be prevented or detected on a timely basis.
This material weakness was considered in determining the nature, timing and extent of audit tests applied in our restatementaudit of ourthe fiscal December 31, 2022 consolidated financial statements, and this report does not affect our report dated March 16, 2023 on those financial statements.
We have also audited, in accordance with the standards of the Public Company Accounting Oversight Board (United States) (“PCAOB”), the consolidated balance sheets as of December 31, 2022 and 2022 and the related consolidated statements of operations and comprehensive (loss) income, stockholders’ deficit and cash flows for each of the three years in the period ended December 31, 2022 of the Company and our report dated March 16, 2023 expressed an unqualified opinion on those financial statements.
| 62 |
Basis for Opinion
The Company’s management has also identifiedis responsible for maintaining effective internal control over financial reporting, and for its assessment of the effectiveness of internal control over financial reporting, included in the accompanying “Management Annual Report on Internal Control Over Financial Reporting”. Our responsibility is to express an opinion on the Company’s internal control over financial reporting based on our audit. We are a public accounting firm registered with the PCAOB and are required to be independent with respect to the Company in accordance with the U.S. federal securities laws and the applicable rules and regulations of the Securities and Exchange Commission and the PCAOB.
We conducted our audit in accordance with the standards of the PCAOB. Those standards require that we plan and perform the audit to obtain reasonable assurance about whether effective internal control over financial reporting was maintained in all material respects. Our audit of internal control over financial reporting included obtaining an understanding of internal control over financial reporting, assessing the risk that a material weakness exists, and testing and evaluating the design and operating effectiveness of internal control based on the assessed risk. Our audit also included performing such other procedures as we considered necessary in the circumstances. We believe that our audit provides a reasonable basis for our opinion.
Definition and Limitations of Internal Control over Financial Reporting
A company’s internal controls relatedcontrol over financial reporting is a process designed to provide reasonable assurance regarding the reliability of financial reporting and the preparation of financial statements for external purposes in accordance with generally accepted accounting principles. A company’s internal control over financial reporting includes those policies and procedures that (1) pertain to the maintenance of records that, in reasonable detail, accurately and fairly reflect the transactions and dispositions of the assets of the company; (2) provide reasonable assurance that transactions are recorded as necessary to permit preparation of financial statements in accordance with generally accepted accounting for warrants, as describedprinciples, and that receipts and expenditures of the company are being made only in Note 1accordance with authorizations of management and directors of the company; and (3) provide reasonable assurance regarding prevention or timely detection of unauthorized acquisition, use, or disposition of the company’s assets that could have a material effect on the financial statements.
Because of the inherent limitations, internal control over financial reporting may not prevent or detect misstatements. Also, projections of any evaluation of effectiveness to future periods are subject to the Notes to Consolidated Financial Statements entitled “Restatementrisk that controls may become inadequate because of Previously Reported Information”.changes in conditions, or that degree of compliance with the policies or procedures may deteriorate.
Marcum LLP
New York, NY
March 16, 2023
ITEMItem 9B. OTHER INFORMATION.Other Information.
None.
On March 26, 2020, Lorne Weil, our Executive Chairman, voluntarily withdrew his Employment Agreement, dated January 31, 2020, from consideration at our upcoming annual meeting of stockholders. Mr. Weil remains employed under his original employment agreement, dated January 16, 2017, as amended.
Item 9C. Disclosure Regarding Foreign Jurisdictions that Prevent Inspections.
In addition, the Office of the Executive Chairman have consented to temporary reductions in base pay calculated on a percentage basis on each of the tiered stacks of the executive’s salary ranging from 0% for the portion under £25,000 to 33.3% for the over £300,000 portion, as follows:None.
Letters for Messrs. Weil, Pierce, Silvers and Baker and Ms. Damon are attached as exhibits hereto, temporarily modifying their written contracts. The Company continues to explore additional cost saving measures.
74
ITEMItem 10. DIRECTORS, EXECUTIVE OFFICERS AND CORPORATE GOVERNANCE.Directors, Executive Officers and Corporate Governance.
The information called for by this item is incorporated herein by reference to our definitive proxy statement relating to our 20202023 Annual Meeting of Stockholders, which will be filed with the SEC. If such proxy statement is not filed on or before April 29, 2020,May 1, 2023, the information called for by this item will be filed as part of an amendment to this Annual Report on Form 10-K on or before such date.
ITEMItem 11. EXECUTIVE COMPENSATION.Executive Compensation.
The information called for by this item is incorporated herein by reference to our definitive proxy statement relating to our 20202023 Annual Meeting of Stockholders, which will be filed with the SEC. If such proxy statement is not filed on or before April 29, 2020,May 1, 2023, the information called for by this item will be filed as part of an amendment to this Annual Report on Form 10-K on or before such date.
ITEMItem 12. SECURITY OWNERSHIP OF CERTAIN BENEFICIAL OWNERS AND MANAGEMENT AND RELATED STOCKHOLDER MATTERS.Security Ownership of Certain Beneficial Owners and Management and Related Stockholder Matters.
The information called for by this item is incorporated herein by reference to our definitive proxy statement relating to our 20202023 Annual Meeting of Stockholders, which will be filed with the SEC. If such proxy statement is not filed on or before April 29, 2020,May 1, 2023, the information called for by this item will be filed as part of an amendment to this Annual Report on Form 10-K on or before such date.
ITEMItem 13. CERTAIN RELATIONSHIPS AND RELATED TRANSACTIONS, AND DIRECTOR INDEPENDENCE.Certain Relationships and Related Transactions, and Director Independence.
The information called for by this item is incorporated herein by reference to our definitive proxy statement relating to our 20202023 Annual Meeting of Stockholders, which will be filed with the SEC. If such proxy statement is not filed on or before April 29, 2020,May 1, 2023, the information called for by this item will be filed as part of an amendment to this Annual Report on Form 10-K on or before such date.
ITEMItem 14. PRINCIPAL ACCOUNTING FEES AND SERVICES.Principal Accountant Fees and Services.
The information called for by this item is incorporated herein by reference to our definitive proxy statement relating to our 20202023 Annual Meeting of Stockholders, which will be filed with the SEC. If such proxy statement is not filed on or before April 29, 2020,May 1, 2023, the information called for by this item will be filed as part of an amendment to this Annual Report on Form 10-K on or before such date.
Item 15. EXHIBITS, FINANCIAL STATEMENT SCHEDULES.Exhibits and Financial Statement Schedules.
| (a) | The following documents are filed as part of this report: |
| (1) | Financial Statements. The required consolidated financial statements and notes thereto are presented starting on page F-1 of this report. |
| (2) | Financial Statement Schedules. All financial statement schedules are omitted because they are not applicable or the amounts are immaterial and not required, or the required information is presented in the consolidated financial statements and notes thereto presented starting on page F-1 of this report. |
| (b) | Exhibits listed on page |
| 64 |
INSPIRED ENTERTAINMENT, INC. AND SUBSIDIARIES
INDEX TO CONSOLIDATED FINANCIAL STATEMENTS
AS OF DECEMBER 31, 20192022 AND SEPTEMBER 30, 2018 AND2021
FOR THE PERIODS ENDED DECEMBER 31, 2019, DECEMBER 31, 2018 AND SEPTEMBER 30, 2018
| F-1 |
REPORT OF INDEPENDENT REGISTERED PUBLIC ACCOUNTING FIRM
To the Shareholders and Board of Directors of
Inspired Entertainment, Inc. and Subsidiaries
Opinion on the Financial Statements
We have audited the accompanying consolidated balance sheets of Inspired Entertainment, Inc. and Subsidiaries (the “Company”) as of December 31, 20192022 and September 30, 2018 ,2021, the related consolidated statements of operations and comprehensive (loss) income,loss (income), stockholders’ deficitequity and cash flows for each of the yearthree years in the period ended December 31, 2019, for the three months ended December 31, 2018 and for the year ended September 30, 2018,2022, and the related notes (collectively referred to as the “financial statements”). In our opinion, the financial statements present fairly, in all material respects, the financial position of the Company as of December 31, 20192022 and September 30, 2018,2021, and the results of its operations and its cash flows for each of the yearthree years in the period ended December 31, 2019, for the three months ended December 31, 2018 and for the year ended September 30, 2018,2022, in conformity with accounting principles generally accepted in the United States of America.
AdoptionWe also have audited, in accordance with the standards of Newthe Public Company Accounting Standards- ASU No. 2016-02Oversight Board (United States) (“PCAOB”), the Company’s internal control over financial reporting as of March 16, 2023, based on the criteria established in Internal Control - Integrated Framework issued by the Committee of Sponsoring Organizations of the Treadway Commission (COSO) in 2013, expressed an adverse opinion on the effectiveness of the Company’s internal control over financial reporting because of the existence of material weaknesses.
As discussed in Note 1 to the financial statements, the Company has changed its method of accounting for leases in 2019 due to the adoption of ASU No. 2016-02, Leases (Topic 842), as amended, effective January 1, 2019 using the modified retrospective approach.
Basis for Opinion
These financial statements are the responsibility of the Company'sCompany’s management. Our responsibility is to express an opinion on the Company'sCompany’s financial statements based on our audits. We are a public accounting firm registered with the Public Company Accounting Oversight Board (United States) ("PCAOB")PCAOB and are required to be independent with respect to the Company in accordance with the U.S. federal securities laws and the applicable rules and regulations of the Securities and Exchange Commission and the PCAOB.
We conducted our audits in accordance with the standards of the PCAOB and in accordance with auditing standards generally accepted in the United States of America.PCAOB. Those standards require that we plan and perform the audits to obtain reasonable assurance about whether the financial statements are free of material misstatement, whether due to error or fraud. The Company is not required to have, nor were we engaged to perform, an audit of its internal control over financial reporting. As part of our audits we are required to obtain an understanding of internal control over financial reporting but not for the purpose of expressing an opinion on the effectiveness of the Company's internal control over financial reporting. Accordingly, we express no such opinion.
Our audits included performing procedures to assess the risks of material misstatement of the financial statements, whether due to error or fraud, and performing procedures that respond to those risks. Such procedures included examining, on a test basis, evidence regarding the amounts and disclosures in the financial statements. Our audits also included evaluating the accounting principles used and significant estimates made by management, as well as evaluating the overall presentation of the financial statements. We believe that our audits provide a reasonable basis for our opinion.
Critical Audit Matters
The critical audit matters communicated below are matters arising from the current period audit of the financial statements that were communicated or required to be communicated to the audit committee and that: (1) relate to accounts or disclosures that are material to the financial statements and (2) involved our especially challenging, subjective, or complex judgments. The communication of critical audit matters does not alter in any way our opinion on the financial statements, taken as a whole, and we are not, by communicating the critical audit matters below, providing separate opinions on the critical audit matters or on the accounts or disclosures to which they relate.
| F-2 |
Revenue Recognition – Use of IT Systems to track and invoice revenue and the determination of the various promises in the arrangement
Certain of the Company’s revenue contracts with customers include multiple promises (such as hardware, software and maintenance, among others). The Company is required to evaluate whether each promise represents a performance obligation. The evaluation of whether promises are both capable of being distinct in the context of a contract (and thus constitute performance obligations) can require significant judgment and could change the amount of revenue recognized in a given period.
We identified the determination of performance obligations for contracts with higher contract values as a critical audit matter because of the judgments and estimates management makes to evaluate such contracts and the impact of such judgments on the amount of revenue recognized in a given period. This required a high degree of auditor judgment and an increased extent of testing.
Addressing the matter involved performing procedures and evaluation of audit evidence that included, among others
| ● | Evaluating contract terms and conditions, |
| ● | Reviewing and assessing the methodology applied and testing the reliability and mathematical accuracy of the underlying data and calculations, |
| ● | Testing management’s identification of performance obligations by evaluating whether the promises were both capable of being distinct and distinct within the context of the contract, including reading the selected contracts and inquiring of certain of the Company’s accounting and operations personnel to understand the nature of the promises and how they are delivered to the customer, and |
| ● | Evaluating and concluding on the reasonableness of management’s judgments and estimates. |
| F-3 |
We involved IT professionals with specialized skills and knowledge, who assisted in evaluating the sufficiency of the audit evidence obtained related to:
| ● | General IT controls and IT application controls for the relevant IT systems used to gather and process data, |
| ● | The transfer of information among the different systems used to gather the data, and |
| ● | The configuration and change management controls for the reports that were used from the various systems to determine the amount of revenue recognized. |
Capitalization of Internally and Externally Developed Software
The Company classifies software development costs as either internal use software or external use software, any costs incurred during preliminary project stages are expensed as incurred; direct costs incurred during the application development stages are capitalized; and costs incurred during the post-implementation/operation stages are expensed. Once the software is placed in operation, the Company amortizes the capitalized cost of the software over its economic useful life, which ranges from two to five years. During the year ended December 31, 2022, the Company capitalized approximately $18,438,000 of software development costs.
We identified the evaluation of the Company’s capitalization of internal direct labor costs as a critical audit matter. There were inherent challenges in obtaining an understanding of the structure of systems and processes used to capture the large volumes of internal direct labor data. Furthermore, subjective judgement was required to evaluate the relevant data that was captured and aggregated, and to assess the sufficiency of the audit evidence obtained.
The primary procedures we performed to address this critical audit matter included the following. We involved IT professionals with specialized skills and knowledge, who assisted in evaluating the sufficiency of the audit evidence obtained related to:
| ● | General IT controls and IT application controls for the relevant IT systems used to gather and process data, |
| ● | The transfer of information among the different systems used to gather the data, and |
| ● | The configuration and change management controls for the reports that were used from the various systems to determine the amount of internal direct labor costs to capitalize. |
In addition, we evaluated, on a sample basis, the Company’s manual aggregation of information from various IT systems, to determine the sufficiency of the audit evidence obtained, by:
| ● | Inspecting the capital project codes to assess that the nature of the activity is capitalized in accordance with U.S. generally accepted accounting principles, |
| ● | Comparing salary and wage information for capitalized internal direct labor costs to employee human resource documents and system profiles, |
| ● | Comparing the hours of capitalized internal direct labor to the hours recorded to capital activities on the employees’ timesheets, |
| ● | Inquiring of employees and project managers as to the accuracy of the hours reflected as capital activities on the employee timesheets, and |
| ● | Evaluating the methodology used to determine the labor rates and comparing the cost types, dates incurred, and amounts of labor costs used to derive the labor rates to data from the source systems. |
/s/ Marcum llp
Marcum llpLLP
We have served as the Company’s auditor since 2016
New York, NY
March 16, 2023
| F-4 |
Melville, NY
March 30, 2020, except for the effects of the restatement discussed in Note 1 as to which the date is May 7, 2021.
INSPIRED ENTERTAINMENT, INC. AND SUBSIDIARIES
CONSOLIDATED BALANCE SHEETS
(in millions, except share data)
| December 31, 2019 | September 30, 2018 | |||||||
| Assets | ||||||||
| Cash | $ | 29.1 | $ | 22.5 | ||||
| Accounts receivable, net | 24.2 | 14.3 | ||||||
| Inventory, net | 18.8 | 5.2 | ||||||
| Fair value of hedging instrument | — | 0.8 | ||||||
| Prepaid expenses and other current assets | 23.2 | 15.8 | ||||||
| Total current assets | 95.3 | 58.6 | ||||||
| Property and equipment, net | 79.3 | 45.7 | ||||||
| Software development costs, net | 46.9 | 40.0 | ||||||
| Other acquired intangible assets subject to amortization, net | 9.9 | 5.7 | ||||||
| Goodwill | 80.9 | 45.8 | ||||||
| Right of use asset | 9.4 | — | ||||||
| Investment | 0.6 | — | ||||||
| Other assets | 5.1 | 12.1 | ||||||
| Total assets | $ | 327.4 | $ | 207.9 | ||||
| Liabilities and Stockholders’ Deficit | ||||||||
| Current liabilities | ||||||||
| Accounts payable | $ | 22.2 | $ | 14.4 | ||||
| Accrued expenses | 31.2 | 14.3 | ||||||
| Earnout liability | — | 8.0 | ||||||
| Corporate tax and other current taxes payable | 6.6 | 2.0 | ||||||
| Deferred revenue, current | 10.1 | 9.2 | ||||||
| Operating lease liabilities | 3.6 | — | ||||||
| Other current liabilities | 1.9 | 3.9 | ||||||
| Warrant liability | 9.8 | 12.0 | ||||||
| Current portion of long-term debt | 2.6 | — | ||||||
| Current portion of finance lease liabilities | 0.1 | 0.5 | ||||||
| Total current liabilities | 88.1 | 64.3 | ||||||
| Long-term debt | 270.5 | 131.2 | ||||||
| Finance lease liabilities, net of current portion | — | 0.1 | ||||||
| Deferred revenue, net of current portion | 17.7 | 23.9 | ||||||
| Derivative liability | — | 7.8 | ||||||
| Operating lease liabilities | 5.2 | — | ||||||
| Other long-term liabilities | 5.2 | 5.1 | ||||||
| Total liabilities | 386.7 | 232.4 | ||||||
| Commitments and contingencies | ||||||||
| Stockholders’ deficit | ||||||||
| Preferred stock; $0.0001 par value; 1,000,000 shares authorized | — | — | ||||||
| Series A Junior Participating Preferred stock; $0.0001 par value; 1,000,000 shares authorized; 49,000 shares designated; no shares issued and outstanding at December 31, 2019 and September 30, 2018 | — | — | ||||||
| Common stock; $0.0001 par value; 49,000,000 shares authorized; 22,230,768 shares and 20,860,591 shares issued and outstanding at December 31, 2019 and September 30, 2018, respectively | — | — | ||||||
| Additional paid in capital | 320.6 | 302.5 | ||||||
| Accumulated other comprehensive income | 45.1 | 58.5 | ||||||
| Accumulated deficit | (425.0 | ) | (385.5 | ) | ||||
| Total stockholders’ deficit | (59.3 | ) | (24.5 | ) | ||||
| Total liabilities and stockholders’ deficit | $ | 327.4 | $ | 207.9 | ||||
| December 31, | December 31, | |||||||
| 2022 | 2021 | |||||||
| Assets | ||||||||
| Cash | $ | 25.0 | $ | 47.8 | ||||
| Accounts receivable, net | 40.5 | 31.7 | ||||||
| Inventory, net | 31.0 | 16.9 | ||||||
| Prepaid expenses and other current assets | 32.1 | 30.0 | ||||||
| Total current assets | 128.6 | 126.4 | ||||||
| Property and equipment, net | 44.7 | 50.9 | ||||||
| Software development costs, net | 35.8 | 35.6 | ||||||
| Other acquired intangible assets subject to amortization, net | 14.7 | 18.9 | ||||||
| Goodwill | 73.9 | 82.7 | ||||||
| Operating lease right of use asset | 8.3 | 10.1 | ||||||
| Other assets | 3.4 | 7.1 | ||||||
| Total assets | $ | 309.4 | $ | 331.7 | ||||
| Liabilities and Stockholders’ Deficit | ||||||||
| Current liabilities | ||||||||
| Accounts payable | $ | 25.7 | $ | 20.8 | ||||
| Accrued expenses | 28.5 | 32.6 | ||||||
| Corporate tax and other current taxes payable | 9.3 | 12.3 | ||||||
| Deferred revenue, current | 4.8 | 7.7 | ||||||
| Operating lease liabilities | 2.8 | 3.3 | ||||||
| Other current liabilities | 2.6 | 3.9 | ||||||
| Current portion of finance lease liabilities | 1.0 | 0.9 | ||||||
| Total current liabilities | 74.7 | 81.5 | ||||||
| Long-term debt | 277.6 | 309.0 | ||||||
| Finance lease liabilities, net of current portion | 1.2 | 1.9 | ||||||
| Deferred revenue, net of current portion | 3.7 | 6.8 | ||||||
| Operating lease liabilities | 5.9 | 7.4 | ||||||
| Other long-term liabilities | 4.0 | 3.1 | ||||||
| Total liabilities | 367.1 | 409.7 | ||||||
| Commitments and contingencies | - | - | ||||||
| Stockholders’ deficit | ||||||||
| Preferred stock; $ par value; shares authorized | — | — | ||||||
| Common stock; $ par value; shares authorized; shares and shares issued and outstanding at December 31, 2022 and December 31, 2021, respectively | — | — | ||||||
| Additional paid in capital | 378.2 | 372.3 | ||||||
| Accumulated other comprehensive income | 46.3 | 43.8 | ||||||
| Accumulated deficit | (482.2 | ) | (494.1 | ) | ||||
| Total stockholders’ deficit | (57.7 | ) | (78.0 | ) | ||||
| Total liabilities and stockholders’ deficit | $ | 309.4 | $ | 331.7 | ||||
The accompanying notes are an integral part of these consolidated financial statements.
| F-5 |
INSPIRED ENTERTAINMENT, INC. AND SUBSIDIARIES
CONSOLIDATED STATEMENTS OF OPERATIONS AND COMPREHENSIVE INCOME (LOSS) INCOME
(in millions, except share and per share data)
Year | Three Months Ended December 31, 2018 | Year Ended | ||||||||||
| Revenue: | ||||||||||||
| Service | $ | 134.9 | $ | 30.0 | $ | 130.9 | ||||||
| Hardware | 18.5 | 0.7 | 10.5 | |||||||||
| Total revenue | 153.4 | 30.7 | 141.4 | |||||||||
| Cost of sales, excluding depreciation and amortization: | ||||||||||||
| Cost of service | (23.5 | ) | (6.0 | ) | (22.6 | ) | ||||||
| Cost of hardware | (12.6 | ) | (0.6 | ) | (8.2 | ) | ||||||
| Selling, general and administrative expenses | (72.6 | ) | (15.3 | ) | (60.1 | ) | ||||||
| Stock-based compensation expense | (9.0 | ) | (1.6 | ) | (7.4 | ) | ||||||
| Impairment expense | — | — | (7.7 | ) | ||||||||
| Acquisition and integration related transaction expenses | (6.7 | ) | (0.1 | ) | (0.9 | ) | ||||||
| Depreciation and amortization | (42.0 | ) | (9.5 | ) | (41.8 | ) | ||||||
| Net operating loss | (13.0 | ) | (2.4 | ) | (7.3 | ) | ||||||
| Other (expense) income | ||||||||||||
| Interest income | 0.1 | — | 0.2 | |||||||||
| Interest expense | (27.8 | ) | (4.1 | ) | (20.6 | ) | ||||||
| Change in fair value of earnout liability | (2.3 | ) | 1.7 | 8.7 | ||||||||
| Change in fair value of derivative liability | 3.0 | 0.8 | (5.5 | ) | ||||||||
| Change in fair value of warrant liability | (4.1 | ) | 6.3 | 33.9 | ||||||||
| Loss from equity method investee | (0.1 | ) | — | — | ||||||||
| Other finance income (expense) | 3.2 | (0.7 | ) | 4.1 | ||||||||
| Total other (expense) income, net | (28.0 | ) | 4.0 | 20.8 | ||||||||
| (Loss) income before income taxes | (41.0 | ) | 1.6 | 13.5 | ||||||||
| Income tax expense | (0.1 | ) | — | (0.2 | ) | |||||||
| Net (loss) income | (41.1 | ) | 1.6 | 13.3 | ||||||||
| Other comprehensive (loss)/income: | ||||||||||||
| Foreign currency translation (loss) gain | (2.4 | ) | — | 0.2 | ||||||||
| Change in fair value of hedging instrument | 2.9 | 2.6 | 0.3 | |||||||||
| Reclassification of gain on hedging instrument to comprehensive income | (4.4 | ) | (2.4 | ) | (0.3 | ) | ||||||
| Actuarial (losses) gains on pension plan | (6.9 | ) | (2.8 | ) | 5.2 | |||||||
| Other comprehensive (loss)/income | (10.8 | ) | (2.6 | ) | 5.4 | |||||||
| Comprehensive (loss) income | $ | (51.9 | ) | $ | (1.0 | ) | $ | 18.7 | ||||
| Net (loss) income per common share – basic | $ | (1.88 | ) | $ | 0.08 | $ | 0.64 | |||||
| Net (loss) income per common share - diluted | $ | (1.88 | ) | $ | 0.07 | $ | 0.59 | |||||
| Weighted average number of shares outstanding during the period – basic | 21,892,964 | 20,861,130 | 20,754,549 | |||||||||
| Weighted average number of shares outstanding during the period – diluted | 21,892,964 | 23,327,008 | 22,545,238 | |||||||||
Year Ended December 31, 2022 | Year Ended December 31, 2021 | Year Ended December 31, 2020 | ||||||||||
| Revenue: | ||||||||||||
| Service | $ | 251.8 | $ | 183.3 | $ | 178.7 | ||||||
| Product sales | 33.6 | 25.6 | 21.1 | |||||||||
| Total revenue | 285.4 | 208.9 | 199.8 | |||||||||
| Cost of sales: | ||||||||||||
| Cost of service (1) | (49.3 | ) | (34.3 | ) | (30.1 | ) | ||||||
| Cost of product sales | (22.7 | ) | (16.4 | ) | (14.4 | ) | ||||||
| Selling, general and administrative expenses | (126.4 | ) | (110.2 | ) | (89.6 | ) | ||||||
| Acquisition and integration related transaction expenses | (0.5 | ) | (1.6 | ) | (7.0 | ) | ||||||
| Depreciation and amortization | (37.6 | ) | (47.0 | ) | (52.3 | ) | ||||||
| Net operating income (loss) | 48.9 | (0.6 | ) | 6.4 | ||||||||
| Other expense | ||||||||||||
| Interest expense, net | (25.4 | ) | (44.3 | ) | (30.0 | ) | ||||||
| Change in fair value of warrant liability | — | 0.9 | (3.2 | ) | ||||||||
| Gain on disposal of business | 0.9 | — | — | |||||||||
| Loss from equity method investee | — | — | (0.5 | ) | ||||||||
| Other finance income (expense) | 1.1 | 5.7 | (4.7 | ) | ||||||||
| Total other expense, net | (23.4 | ) | (37.7 | ) | (38.4 | ) | ||||||
| Income (loss) before income taxes | 25.5 | (38.3 | ) | (32.0 | ) | |||||||
| Income tax (expense) benefit | (3.2 | ) | 1.6 | (0.4 | ) | |||||||
| Net income (loss) | 22.3 | (36.7 | ) | (32.4 | ) | |||||||
| Other comprehensive income (loss): | ||||||||||||
| Foreign currency translation gain (loss) | 8.2 | 0.4 | (5.4 | ) | ||||||||
| Change in fair value of hedging instrument | — | 0.3 | (2.9 | ) | ||||||||
| Reclassification of loss (gain) on hedging instrument to comprehensive income | 0.7 | 1.5 | 1.5 | |||||||||
| Actuarial (losses) gains on pension plan | (6.4 | ) | 10.5 | (7.2 | ) | |||||||
| Other comprehensive income (loss) | 2.5 | 12.7 | (14.0 | ) | ||||||||
| Comprehensive income (loss) | $ | 24.8 | $ | (24.0 | ) | $ | (46.4 | ) | ||||
| Net income (loss) per common share – basic | $ | 0.84 | $ | (1.60 | ) | $ | (1.45 | ) | ||||
| Net income (loss) per common share – diluted | $ | 0.77 | $ | (1.60 | ) | $ | (1.45 | ) | ||||
| Weighted average number of shares outstanding during the year – basic | 26,446,374 | 22,897,997 | 22,399,333 | |||||||||
| Weighted average number of shares outstanding during the year – diluted | 29,035,785 | 22,897,997 | 22,399,333 | |||||||||
| Supplemental disclosure of stock-based compensation expense | ||||||||||||
| Stock-based compensation included in: | ||||||||||||
| Selling, general and administrative expenses | $ | (10.8 | ) | $ | (13.0 | ) | $ | (4.8 | ) | |||
| (1) | Excluding depreciation and amortization |
The accompanying notes are an integral part of these consolidated financial statements.
| F-6 |
INSPIRED ENTERTAINMENT, INC. AND SUBSIDIARIES
CONSOLIDATED STATEMENTS OF STOCKHOLDERS’ DEFICIT
(in millions, except share data)
| Common stock | Additional paid in | Accumulated other comprehensive | Accumulated | Total stockholders’ | ||||||||||||||||||||
| Shares | Amount | capital | income | deficit | deficit | |||||||||||||||||||
| Balance at October 1, 2017 | 20,402,602 | $ | — | $ | 297.5 | $ | 53.1 | $ | (398.8 | ) | $ | (48.2 | ) | |||||||||||
| Foreign currency translation adjustments | — | — | — | 0.2 | — | 0.2 | ||||||||||||||||||
| Actuarial gains on pension plan | — | — | — | 5.2 | — | 5.2 | ||||||||||||||||||
| Change in fair value of hedging instrument | — | — | — | 0.3 | — | 0.3 | ||||||||||||||||||
| Reclassification of gain on hedging instrument to comprehensive income | — | — | — | (0.3 | ) | — | (0.3 | ) | ||||||||||||||||
| Shares issued on exercise of warrants | 50 | — | — | — | — | — | ||||||||||||||||||
| Shares of RSAs that vested and shares issued upon net settlement of RSUs | 457,939 | — | (1.1 | ) | — | — | (1.1 | ) | ||||||||||||||||
| Reclassification of RSUs from derivative liability due to stockholder approval of equity plan | — | — | 2.8 | — | — | 2.8 | ||||||||||||||||||
| Stock-based compensation expense | — | — | 4.8 | — | — | 4.8 | ||||||||||||||||||
| Reclassification of RSUs to derivative liability due to modification | — | — | (1.5 | ) | — | — | (1.5 | ) | ||||||||||||||||
| Net income | — | — | — | — | 13.3 | (20.6 | ) | |||||||||||||||||
| Balance as of September 30, 2018 | 20,860,591 | — | 302.5 | 58.5 | (385.5 | ) | (24.5 | ) | ||||||||||||||||
| Actuarial losses on pension plan | — | — | — | (2.8 | ) | — | (2.8 | ) | ||||||||||||||||
| Change in fair value of hedging instrument | — | — | — | 2.6 | — | 2.6 | ||||||||||||||||||
| Reclassification of gain on hedging instrument to comprehensive income | — | — | — | (2.4 | ) | — | (2.4 | ) | ||||||||||||||||
| Shares issued upon net settlement of RSUs | 9,806 | — | — | — | — | — | ||||||||||||||||||
| Stock-based compensation expense | — | — | 1.4 | — | — | 1.4 | ||||||||||||||||||
| Net income | — | — | — | — | 1.6 | 1.6 | ||||||||||||||||||
| Balance as of December 31, 2018 | 20,870,397 | — | 303.9 | 55.9 | (383.9 | ) | (24.1 | ) | ||||||||||||||||
| Foreign currency translation adjustments | — | — | — | (2.4 | ) | — | (2.4 | ) | ||||||||||||||||
| Actuarial losses on pension plan | — | — | — | (6.9 | ) | — | (6.9 | ) | ||||||||||||||||
| Change in fair value of hedging instrument | — | — | — | 2.9 | — | 2.9 | ||||||||||||||||||
| Reclassification of gain on hedging instrument to comprehensive income | — | — | — | (4.4 | ) | — | (4.4 | ) | ||||||||||||||||
| Conversion of awards previously classified as derivatives | — | — | 0.8 | — | — | 0.8 | ||||||||||||||||||
| Shares issued in earnout | 1,323,558 | — | 8.6 | — | — | 8.6 | ||||||||||||||||||
| Shares issued upon net settlement of RSUs | 36,813 | — | (0.9 | ) | — | — | (0.9 | ) | ||||||||||||||||
| Stock-based compensation expense | — | — | 8.2 | — | — | 8.2 | ||||||||||||||||||
| Net loss | — | — | — | — | (41.1 | ) | (41.1 | ) | ||||||||||||||||
| Balance as of December 31, 2019 | 22,230,768 | $ | — | $ | 320.6 | $ | 45.1 | $ | (425.0 | ) | $ | (59.3 | ) | |||||||||||
| Accumulated | ||||||||||||||||||||||||
| Additional | other | Total | ||||||||||||||||||||||
| Common stock | paid in | comprehensive | Accumulated | stockholders’ | ||||||||||||||||||||
| Shares | Amount | capital | income | deficit | deficit | |||||||||||||||||||
| Balance as of January 1, 2020 | 22,230,768 | $ | — | $ | 320.6 | $ | 45.1 | $ | (425.0 | ) | $ | (59.3 | ) | |||||||||||
| Foreign currency translation adjustments | — | — | — | (5.4 | ) | — | (5.4 | ) | ||||||||||||||||
| Actuarial losses on pension plan | — | — | — | (7.2 | ) | — | (7.2 | ) | ||||||||||||||||
| Change in fair value of hedging instrument | — | — | — | (2.9 | ) | — | (2.9 | ) | ||||||||||||||||
| Reclassification of loss on hedging instrument to comprehensive income | — | — | — | 1.5 | — | 1.5 | ||||||||||||||||||
| Shares issued in settlement of RSUs | 192,058 | — | (0.7 | ) | — | — | (0.7 | ) | ||||||||||||||||
| Shares issued under ESPP | 7,649 | — | — | — | — | — | ||||||||||||||||||
| Stock-based compensation expense | — | — | 4.7 | — | — | 4.7 | ||||||||||||||||||
| Net loss | — | — | — | — | (32.4 | ) | (32.4 | ) | ||||||||||||||||
| Balance as of December 31, 2020 | 22,430,475 | — | 324.6 | 31.1 | (457.4 | ) | (101.7 | ) | ||||||||||||||||
| Foreign currency translation adjustments | — | — | — | 0.4 | — | 0.4 | ||||||||||||||||||
| Actuarial gains on pension plan | — | — | — | 10.5 | — | 10.5 | ||||||||||||||||||
| Change in fair value of hedging instrument | — | — | — | 0.3 | — | 0.3 | ||||||||||||||||||
| Reclassification of loss on hedging instrument to comprehensive income | — | — | — | 1.5 | — | 1.5 | ||||||||||||||||||
| Shares issued in settlement of RSUs | 324,122 | — | (6.4 | ) | — | — | (6.4 | ) | ||||||||||||||||
| Shares issued upon exercise of warrants | 3,678,965 | — | 42.4 | — | — | 42.4 | ||||||||||||||||||
| Stock-based compensation expense | — | — | 11.7 | — | — | 11.7 | ||||||||||||||||||
| Net loss | — | — | — | — | (36.7 | ) | (36.7 | ) | ||||||||||||||||
| Balance as of December 31, 2021 | 26,433,562 | — | 372.3 | 43.8 | (494.1 | ) | (78.0 | ) | ||||||||||||||||
| Balance | 26,433,562 | — | 372.3 | 43.8 | (494.1 | ) | (78.0 | ) | ||||||||||||||||
| Foreign currency translation adjustments | — | — | — | 8.2 | — | 8.2 | ||||||||||||||||||
| Actuarial losses on pension plan | — | — | — | (6.4 | ) | — | (6.4 | ) | ||||||||||||||||
| Reclassification of loss on hedging instrument to comprehensive income | — | — | — | 0.7 | — | 0.7 | ||||||||||||||||||
| Shares issued in settlement of RSUs | 543,294 | — | (4.1 | ) | — | — | (4.1 | ) | ||||||||||||||||
| Repurchases of common stock | (1,067,340 | ) | — | — | — | (10.4 | ) | (10.4 | ) | |||||||||||||||
| Stock-based compensation expense | — | — | 10.0 | — | — | 10.0 | ||||||||||||||||||
| Net income | — | — | — | — | 22.3 | 22.3 | ||||||||||||||||||
| Net income (loss) | — | — | — | — | 22.3 | 22.3 | ||||||||||||||||||
| Balance as of December 31, 2022 | 25,909,516 | $ | — | $ | 378.2 | $ | 46.3 | $ | (482.2 | ) | $ | (57.7 | ) | |||||||||||
| Balance | 25,909,516 | $ | — | $ | 378.2 | $ | 46.3 | $ | (482.2) | ) | $ | (57.7) | ||||||||||||
The accompanying notes are an integral part of these consolidated financial statements.
| F-7 |
INSPIRED ENTERTAINMENT, INC. AND SUBSIDIARIES
CONSOLIDATED STATEMENTS OF CASH FLOWS
(in millions)
Year Ended | Three Months Ended December 31, 2018 | Year Ended | Year Ended December 31, 2022 | Year Ended December 31, 2021 | Year Ended December 31, 2020 | |||||||||||||||||||
| Cash flows from operating activities: | ||||||||||||||||||||||||
| Net (loss) income | $ | (41.1 | ) | $ | 1.6 | $ | 13.3 | |||||||||||||||||
| Adjustments to reconcile net loss to net cash provided by operating activities: | ||||||||||||||||||||||||
| Net income (loss) | $ | 22.3 | $ | (36.7 | ) | $ | (32.4 | ) | ||||||||||||||||
| Adjustments to reconcile net income (loss) to net cash provided by operating activities: | ||||||||||||||||||||||||
| Depreciation and amortization | 42.0 | 9.5 | 41.8 | 37.6 | 47.0 | 52.3 | ||||||||||||||||||
| Amortization of right of use asset | 1.0 | — | — | 2.4 | 3.3 | 3.6 | ||||||||||||||||||
| Stock-based compensation expense | 9.0 | 1.6 | 7.1 | 10.8 | 13.0 | 4.8 | ||||||||||||||||||
| Change in fair value of derivative liability | (3.0 | ) | (0.8 | ) | 5.5 | |||||||||||||||||||
| Change in fair value of earnout liability | 2.3 | (1.7 | ) | (8.7 | ) | |||||||||||||||||||
| Impairment expense | — | — | 7.7 | |||||||||||||||||||||
| Foreign currency translation on senior bank debt | 0.8 | 2.9 | (3.4 | ) | ||||||||||||||||||||
| Foreign currency translation on cross currency swaps | (3.6 | ) | (2.2 | ) | — | |||||||||||||||||||
| Impairment of investment in equity method investee | — | — | 0.7 | |||||||||||||||||||||
| Unrealized transactional currency gain/loss on senior bank debt | — | (4.6 | ) | 5.6 | ||||||||||||||||||||
| Change in fair value of warrant liability | 4.1 | 6.3 | 33.9 | — | (0.9 | ) | 3.2 | |||||||||||||||||
| Reclassification of loss on hedging instrument to comprehensive income | 0.7 | 1.5 | 0.9 | |||||||||||||||||||||
| Non-cash interest expense relating to senior debt | 9.0 | 0.5 | 6.8 | 1.8 | 17.2 | 3.4 | ||||||||||||||||||
| Changes in assets and liabilities: | ||||||||||||||||||||||||
| Accounts receivable | 3.3 | 2.5 | 5.3 | (12.0 | ) | (4.9 | ) | (2.9 | ) | |||||||||||||||
| Inventory | 2.0 | — | (0.4 | ) | (16.0 | ) | 1.6 | 1.3 | ||||||||||||||||
| Prepaid expenses and other assets | 3.3 | 0.7 | 1.2 | (3.8 | ) | (13.9 | ) | 8.8 | ||||||||||||||||
| Corporate tax and other current taxes payable | (3.6 | ) | (0.1 | ) | (1.9 | ) | (6.7 | ) | (9.9 | ) | 6.6 | |||||||||||||
| Accounts payable | 6.9 | (3.6 | ) | (4.1 | ) | 7.5 | 2.8 | (4.8 | ) | |||||||||||||||
| Deferred revenues and customer prepayment | (9.5 | ) | (0.5 | ) | 6.5 | (5.2 | ) | (6.7 | ) | (5.7 | ) | |||||||||||||
| Accrued expenses | 7.2 | (1.6 | ) | (2.8 | ) | 0.8 | 0.7 | 10.9 | ||||||||||||||||
| Operating lease liabilities | (1.3 | ) | — | — | (2.6 | ) | (2.9 | ) | (2.8 | ) | ||||||||||||||
| Other long-term liabilities | 1.9 | (1.7 | ) | (5.8 | ) | (2.9 | ) | (0.4 | ) | (0.6 | ) | |||||||||||||
| Net cash provided by operating activities | 30.7 | 0.8 | 34.2 | 34.7 | 6.2 | 52.9 | ||||||||||||||||||
| Cash flows from investing activities: | ||||||||||||||||||||||||
| Purchases of property and equipment | (10.5 | ) | (3.2 | ) | (24.8 | ) | (21.2 | ) | (11.6 | ) | (15.4 | ) | ||||||||||||
| Cash paid for NTG Acquisition | (105.9 | ) | — | — | ||||||||||||||||||||
| Acquisition of subsidiary company assets | (0.6 | ) | (12.5 | ) | — | |||||||||||||||||||
| Purchases of capital software | (17.0 | ) | (3.4 | ) | (18.1 | ) | (18.6 | ) | (13.8 | ) | (14.5 | ) | ||||||||||||
| Net cash used in investing activities | (133.4 | ) | (6.6 | ) | (42.9 | ) | (40.4 | ) | (37.9 | ) | (29.9 | ) | ||||||||||||
| Cash flows from financing activities: | ||||||||||||||||||||||||
| Proceeds from issuance of long-term debt | 270.6 | — | 140.0 | — | 333.1 | — | ||||||||||||||||||
| Proceeds from issuance of revolver | 2.8 | — | — | |||||||||||||||||||||
| Repurchase of common stock | (10.4 | ) | — | — | ||||||||||||||||||||
| Proceeds from exercise of warrants | — | 30.5 | — | |||||||||||||||||||||
| Repayments of revolver and long-term debt, including exit premium | (144.2 | ) | — | (123.7 | ) | — | (320.6 | ) | (4.2 | ) | ||||||||||||||
| Payment of financing costs | (15.2 | ) | (0.5 | ) | (4.6 | ) | ||||||||||||||||||
| Repayments of capital leases | (0.5 | ) | (0.1 | ) | (0.5 | ) | ||||||||||||||||||
| Net cash provided by (used in) financing activities | 113.5 | (0.6 | ) | 11.2 | ||||||||||||||||||||
| Payment of debt issuance costs | — | (9.1 | ) | (3.1 | ) | |||||||||||||||||||
| Cash paid in connection with terminated interest rate swaps | — | (2.1 | ) | — | ||||||||||||||||||||
| Repayments of finance leases | (0.6 | ) | (0.6 | ) | (0.9 | ) | ||||||||||||||||||
| Net cash (used in) provided by financing activities | (11.0 | ) | 31.2 | (8.2 | ) | |||||||||||||||||||
| Effect of exchange rate changes on cash | 2.3 | (0.1 | ) | — | (6.1 | ) | 1.2 | 3.2 | ||||||||||||||||
| Net increase (decrease) in cash | 13.1 | (6.5 | ) | 2.5 | ||||||||||||||||||||
| Net increase in cash | (22.8 | ) | 0.7 | 18.0 | ||||||||||||||||||||
| Cash, beginning of period | 16.0 | 22.5 | 20.0 | 47.8 | 47.1 | 29.1 | ||||||||||||||||||
| Cash, end of period | $ | 29.1 | $ | 16.0 | $ | 22.5 | $ | 25.0 | $ | 47.8 | $ | 47.1 | ||||||||||||
| Supplemental cash flow disclosures | ||||||||||||||||||||||||
| Cash paid during the period for interest | $ | 12.6 | $ | 4.1 | $ | 16.7 | $ | 23.0 | $ | 30.8 | $ | 13.3 | ||||||||||||
| Cash paid during the period for income taxes | $ | — | $ | — | $ | — | $ | — | $ | 1.2 | $ | 0.2 | ||||||||||||
| Cash paid during the period for operating leases | $ | 2.2 | $ | — | $ | — | $ | 4.3 | $ | 4.4 | $ | 3.3 | ||||||||||||
| Supplemental disclosure of noncash investing and financing activities | ||||||||||||||||||||||||
| Additional paid in capital from net settlement of RSUs | $ | (0.9 | ) | $ | — | $ | (1.1 | ) | $ | (4.1 | ) | $ | (6.4 | ) | $ | (0.7 | ) | |||||||
| Lease liabilities arising from obtaining right of use assets | $ | (9.6 | ) | $ | — | $ | — | $ | (1.8 | ) | $ | — | $ | (6.8 | ) | |||||||||
| Additional paid in capital reclassified to derivative liability | $ | — | $ | — | $ | (1.5 | ) | |||||||||||||||||
| Additional paid in capital reclassified from derivative liability | $ | — | $ | — | $ | 2.8 | ||||||||||||||||||
| Derivative liability reclassified to accrued expenses | $ | — | $ | — | $ | 0.1 | ||||||||||||||||||
| Senior debt exit premium | $ | — | $ | — | $ | 4.2 | ||||||||||||||||||
| Adjustment to customer relationships intangible asset arising from adjustment to fair value of assets acquired | $ | (0.9 | ) | $ | — | $ | — | |||||||||||||||||
| Adjustment to goodwill arising from adjustment to fair value of assets acquired | $ | — | $ | — | $ | (0.2 | ) | |||||||||||||||||
| Property and equipment acquired through finance lease | $ | — | $ | 2.6 | $ | 1.5 | ||||||||||||||||||
| Property and equipment transferred to inventory | $ | 0.8 | $ | 1.3 | $ | — | ||||||||||||||||||
| Capitalized interest payments | $ | — | $ | — | $ | 10.6 | ||||||||||||||||||
| Assets arising from asset retirement obligations | $ | — | $ | — | $ | 1.0 | ||||||||||||||||||
The accompanying notes are an integral part of these condensed consolidated financial statements.
| F-8 |
INSPIRED ENTERTAINMENT, INC. AND SUBSIDIARIES
NOTES TO CONSOLIDATED FINANCIAL STATEMENTS
AS OF DECEMBER 31, 20192022 AND SEPTEMBER 30, 20182021, AND
FOR THE PERIODSYEARS ENDED
DECEMBER 31, 2019, DECEMBER 31, 20182022, 2021 AND SEPTEMBER 30, 20182020
| 1. | Nature of Operations, Management’s Plans and Summary of Significant Accounting Policies |
Company Description and Nature of Operations
Inspired Entertainment, Inc. (the “Company,” “we,” “our,” and “us”) isWe are a global business-to-business gaming technology company, supplying Server Based Gaming (“SBG”)content, platform, gaming terminals and Virtual Sports (which includes Interactive) systemsother products and services to online and land-based regulated lottery, betting and gaming operators worldwide through an “omni-channel”a broad range of distribution strategy.channels, predominantly on a business-to-business basis. We provide end-to-end digital gaming solutions (i) on our own proprietary and secure network, which accommodates a wide range of devices, including land-based gaming machine terminals, mobile devices such as smartphones and tablets and online computer applications and social applications.(ii) through third party networks. Our content and other products can be found through the consumer-facing portals of our interactive customers and, through our land-based customers, in licensed betting offices, adult gaming centers, pubs, bingo halls, airports, motorway service areas and leisure parks.
The Company was incorporated in Delaware on May 30, 2014 under the name Hydra Industries Acquisition Corp. (“Hydra”) as a “blank check company” for the purpose of acquiring, through a merger, capital stock exchange, asset acquisition, stock purchase, reorganization, recapitalization or other similar business transaction, one or more operating businesses. On December 23, 2016 (the “Closing Date”), the Company acquired Inspired Gaming Group (“Inspired”), pursuant to a share sale agreement dated as of July 13, 2016 (the “Sale Agreement”). The transaction was accounted for as a reverse merger where Inspired was the acquirer and Hydra was the acquired company. In connection with the acquisition, we changed our name from Hydra to Inspired Entertainment, Inc. We refer to the acquisition and the other transactions contemplated by the Sale Agreement, collectively, as the “Business Combination” or the “Merger.”
On October 1, 2019, the Company completed the acquisition of the Gaming Technology Group of Novomatic UK Ltd., a division of Novomatic Group, a leading international supplier of gaming equipment and solutions (the “NTG Acquisition”).
Management Liquidity Plans
As of December 31, 2019,2022, the Company’s cash on hand was $29.1$25.0 million, and the Company had working capital in addition to cash of $7.2$28.9 million. As of December 31, 2019, $5.0 million of our cash on hand had arisen from our operations in Greece and was being held in local accounts. In the ordinary course of business, we seek, from time to time, to transfer funds earned in Greece to our accounts outside of Greece. However, Greece imposes capital controls that can delay or prevent the flow of capital out of the country. The Company recorded net lossesincome of $41.1$22.3 million and net incomelosses of $1.6$36.7 million and $13.3$32.4 million for the year ended December 31, 2019, the three months ended December 31, 20182022, 2021 and the year ended September 30, 2018,2020, respectively. Net income/losses include excess capital expenditure, excluding the acquisition of subsidiary assets, over depreciation and income include non-cash stock-based compensationamortization, of $9.0 million, $1.6 million and $7.4$2.2 million for the year ended December 31, 2019,2022, and excess depreciation and amortization over capital expenditure, excluding the three monthsacquisition of subsidiary assets, of $21.4 million and $22.4 million for the year ended December 31, 20182021 and 2020, respectively, non-cash stock-based compensation of $ million, $ million and $ million for the year ended September 30, 2018,December 31, 2022, 2021 and 2020, respectively, and non-cash changes in fair value of warrant liability of $4.1$0.0 million, loss, $6.3$0.9 million incomegain and $33.9$3.2 million incomelosses for the year ended December 31, 2019, the three months ended December 31, 20182022, 2021, and the year ended September 30, 2018,2020, respectively. Historically, the Company has generally had positive cash flows from operating activities and has relied on a combination of cash flows provided by operations and the incurrence of debt and/or the refinancing of existing debt to fund its obligations. Cash flows provided by operations amounted to $34.7 million, $6.2 million and $52.9 million for the year ended December 31, 2022, 2021 and 2020 respectively, with the change year on year due to land based operations being subject to lockdown restrictions for part of the year ended December 31, 2021. Working capital of $7.2$53.9 million includes a non-cash settled item of $10.1$4.8 million of deferred income. Management currently believes that, absent any long term COVID-19long-term coronavirus (“COVID-19”) impact (see below), the Company’s cash balances on hand, cash flows expected to be generated from operations, ability to control and defer capital projects and amounts available from the Company’s external borrowings will be sufficient to fund the Company’s net cash requirements through March 2021.2024.
Our business is being and will continue to be adversely affected by the rapidly expanding nature of the coronavirus (COVID-19) pandemic. All venues offering land-based gaming, including our products, are closed for an indeterminate period of timeThere have been no COVID-19 restrictions in the jurisdictions in which we operate through governmental mandate. In addition, the extent of a significant economic impact from the pandemic may result in a decrease in the willingness or ability of consumers to engage in gambling activities. Land-based customers globally,United Kingdom since July 2021 and the United States, United Kingdom,social distancing measures throughout Greece and Italy specifically, are impacted by the COVID-19 pandemic due to the closure of venues. There is also a possibility that player behavior may change following any resolutionno longer in force as of the pandemic, including that consumers may spend less time or wager smaller amounts at gambling facilities. The pandemic is adversely affecting a broad rangesecond quarter of our operations, including our ability to obtain and ship our products, our ability to continue to develop new products and services and the ability of our customers to pay outstanding amounts due to us. As a result of the significant reductions in revenue and other changes to our business, at least in the short term (which also affects other companies in our industry), we are working to protect our existing available liquidity by pro-actively managing capital expenditures and working capital as well as identifying both immediate and longer term opportunities for cost savings.2022.
| F-9 |
We expect, due to closures of land-based venues, that there could be a meaningful increase in our online revenues from slots and virtual sports but it is not possible to quantify any potential impact at this time. Prior to any COVID-19 impact, we would have expected this part of our business to account for approximately 10% of Company revenue during 2020.
As part of these efforts to preserve liquidity, the Company drew all remaining availability (£18.0 million ($23.8 million using rates prevailing at December 31, 2019)) under its £20 million ($26.4 million using rates prevailing at December 31, 2019) revolving credit facility on March 13, 2020.
INSPIRED ENTERTAINMENT, INC. AND SUBSIDIARIES
NOTES TO CONSOLIDATED FINANCIAL STATEMENTS
AS OF DECEMBER 31, 2022 AND 2021, AND FOR THE YEARS ENDED
DECEMBER 31, 2022, 2021 AND 2020
Basis of Presentation
The accompanying consolidated financial statements of the Company have been prepared in accordance with accounting principles generally accepted in the United States of America (“U.S. GAAP”).
On September 24, 2018, the Board of Directors approved a change in the Company’s fiscal year end from September 30 to December 31 commencing with the year ending December 31, 2019. As such, our fiscal year 2018 comprised the twelve-month period ended September 30, 2018, the three-month period from October 1, 2018 to December 31, 2018 was a transitional period and our fiscal year 2019 comprised the twelve-month period ended December 31, 2019.
Restatement of Previously Reported Information
On April 12, 2021, the Securities and Exchange Commission (the “SEC”) released a public statement (the “Public Statement”) informing market participants that warrants issued by special purpose acquisition companies (“SPACs”) may require classification as a liability of the entity measured at fair value, with changes in fair value each period reported in earnings.
As of December 31, 2019 and September 30, 2018, the Company had 19,079,130 outstanding warrants to purchase an aggregate of 9,539,565 shares of the Company’s common stock, which includes 7,999,900 warrants originally issued as part of the initial public offering (the “IPO”) (the “Public Warrants”) and 11,079,230 warrants issued in private placements in connection with the IPO and the Merger (the “Private Placement Warrants”) (see note 16). The Company has previously classified its Public Warrants and Private Placement Warrants (collectively, the “warrants”) as equity.
The SEC’s Public Statement discussed “certain features of warrants issued in SPAC transactions” that “may be common across many entities.” The Public Statement indicated that when one or more of such features is included in a warrant, the warrant “should be classified as a liability measured at fair value, with changes in fair value each period reported in earnings.” Following consideration of the guidance in the Public Statement, and after consultation with the Company’s independent registered public accounting firm, Management has concluded that the warrants do not meet the conditions to be classified in equity and instead, the warrants meet the definition of a derivative under ASC 815, under which the Company should record the warrants as liabilities on the Company's balance sheet.
Management has determined that information previously reported in the Annual Report on Form 10-K of the Company, filed with the SEC on March 30, 2020, should no longer be relied upon due to changes required for alignment with the SEC’s Public Statement. Information contained within this Annual Report has been restated in line with this determination. The adjustments to the financial statement items for the affected periods are as follows:
| As Previously Reported | Adjustments | As Restated | ||||||||||
| (in millions, except per share data) | ||||||||||||
| Consolidated Balance Sheet as of October 1, 2017 | ||||||||||||
| Warrant liability | $ | — | $ | 45.9 | $ | 45.9 | ||||||
| Additional paid in capital | 323.5 | (26.0 | ) | 297.5 | ||||||||
| Accumulated deficit | (378.9 | ) | (19.9 | ) | (398.8 | ) | ||||||
| Consolidated Statement of Operations and Comprehensive (Loss) Income for the year ended September 30, 2018 | ||||||||||||
| Change in fair value of warrant liability | $ | — | $ | 33.9 | $ | 33.9 | ||||||
| Net (loss) income | (20.6 | ) | 33.9 | 13.3 | ||||||||
| Comprehensive (loss) income | (15.2 | ) | 33.9 | 18.7 | ||||||||
| Net (loss) income per common share – basic | $ | (0.99 | ) | $ | 1.63 | $ | 0.64 | |||||
| Net (loss) income per common share - diluted | (0.99 | ) | 1.58 | 0.59 | ||||||||
| Consolidated Balance Sheet as of September 30, 2018 | ||||||||||||
| Warrant liability | $ | — | $ | 12.0 | $ | 12.0 | ||||||
| Additional paid in capital | 328.5 | (26.0 | ) | 302.5 | ||||||||
| Accumulated deficit | (399.5 | ) | 14.0 | (385.5 | ) | |||||||
| Consolidated Statement of Operations and Comprehensive (Loss) Income for the three months ended December 31, 2018 | ||||||||||||
| Change in fair value of warrant liability | $ | — | $ | 6.3 | $ | 6.3 | ||||||
| Net (loss) income | (4.7 | ) | 6.3 | 1.6 | ||||||||
| Comprehensive loss | (7.3 | ) | 6.3 | (1.0 | ) | |||||||
| Net (loss) income per common share – basic | $ | (0.23 | ) | $ | 0.31 | $ | 0.08 | |||||
| Net (loss) income per common share - diluted | (0.23 | ) | 0.30 | 0.07 | ||||||||
| Consolidated Balance Sheet as of December 31, 2018 | ||||||||||||
| Warrant liability | $ | — | $ | 5.7 | $ | 5.7 | ||||||
| Additional paid in capital | 329.9 | (26.0 | ) | 303.9 | ||||||||
| Accumulated deficit | (404.2 | ) | 20.3 | (383.9 | ) | |||||||
| Consolidated Statement of Operations and Comprehensive Loss for the year ended December 31, 2019 | ||||||||||||
| Change in fair value of warrant liability | $ | — | $ | (4.1 | ) | $ | (4.1 | ) | ||||
| Net loss | (37.0 | ) | (4.1 | ) | (41.1 | ) | ||||||
| Comprehensive loss | (47.8 | ) | (4.1 | ) | (51.9 | ) | ||||||
| Net loss per common share – basic and diluted | $ | (1.69 | ) | $ | (0.19 | ) | $ | (1.88 | ) | |||
| Consolidated Balance Sheet as of December 31, 2019 | ||||||||||||
| Warrant liability | $ | — | $ | 9.8 | $ | 9.8 | ||||||
| Additional paid in capital | 346.6 | (26.0 | ) | 320.6 | ||||||||
| Accumulated deficit | (441.2 | ) | 16.2 | (425.0 | ) | |||||||
Principles of Consolidation
All monetary values set forth in these consolidated financial statements are in US Dollars (“USD”) unless otherwise stated herein. The accompanying consolidated financial statements include the results of the Company and its wholly owned subsidiaries. All significant intercompany balances and transactions have been eliminated in consolidation.
INSPIRED ENTERTAINMENT, INC. AND SUBSIDIARIES
NOTES TO CONSOLIDATED FINANCIAL STATEMENTS
AS OF DECEMBER 31, 2019 AND SEPTEMBER 30, 2018 AND
FOR THE PERIODS ENDED
DECEMBER 31, 2019, DECEMBER 31, 2018 AND SEPTEMBER 30, 2018
Foreign Currency Translation
For most of our operations, the British pound (“GBP”) is our functional currency. Our reporting currency is the USD. We also have operations where the local currency is the functional currency, including our operations in mainland Europe and SouthNorth America. Assets and liabilities of foreign operations are translated at period-end rates of exchange, equity is translated at historical rates of exchange and results of operations are translated at the average rates of exchange for the period. Gains or losses resulting from translating the foreign currency financial statements are recorded as a separate component of accumulated other comprehensive lossincome in stockholders’ deficit. Gains or losses resulting from foreign currency transactions are included in selling,Selling, general and administrative expenses, interest incomeInterest expense, net and Other finance (expense) and other finance (costs) income in the consolidated statementsConsolidated Statement of operations.Operations and Comprehensive Income (Loss).
Use of Estimates
The preparation of consolidated financial statements in conformity with U.S. GAAP requires management to make estimates and judgments that affect the reported amounts of assets and liabilities and the disclosure of contingent assets and liabilities at the date of the consolidated financial statements and the reported amounts of revenues and expenses during the reporting period. On an ongoing basis, management evaluates these estimates, including those related to the revenue recognition for contracts involving software and non-software elements, allowance for doubtful accounts, inventory reserve for net realizable value, currency swaps, valuation of hedging activities, goodwill and intangible assets, useful lives of long-lived assets, stock-based compensation, valuation allowances on deferred taxes, earnoutwarrant liability, pension liability, commitments and contingencies and litigation, among others. Management bases its estimates on historical experience and on various other assumptions that are believed to be reasonable under the circumstances. We regularly evaluate these significant factors and make adjustments when facts and circumstances dictate. Actual results may differ from these estimates.
| F-10 |
INSPIRED ENTERTAINMENT, INC. AND SUBSIDIARIES
NOTES TO CONSOLIDATED FINANCIAL STATEMENTS
AS OF DECEMBER 31, 2022 AND 2021, AND FOR THE YEARS ENDED
DECEMBER 31, 2022, 2021 AND 2020
Cash
We deposit cash with financial institutions that management believes are of high credit quality. Substantially all of the Company’s cash is held outside of the U.S. Included within the cash balance of $25.0 million is $2.5 million of cash floats held on site at holiday parks.
Accounts Receivable
Accounts receivable are recorded at the invoiced amount and do not bear interest. Our standard credit terms are net 30 to 60 days. The allowance for doubtful accounts is our best estimate of the amount of probable credit losses in our existing accounts receivable. Changes in circumstances relating to the collectability of accounts receivable may result in the need to increase or decrease our allowance for doubtful accounts in the future. We determine the allowance based on historical experience, current market trends, and our customers’ financial condition. We continually review our allowance for doubtful accounts. Past due balances and other higher risk amounts are reviewed individually for collectability. Account balances are charged against the allowance after all collection efforts have been exhausted and the potential for recovery is considered remote.
Under certain contracts, the timing of our invoices does not coincide with revenue recognized under the contract. We have unbilled accounts receivable which represent revenue recorded in excess of amounts invoiced under the contract and generally become billable at contractually specified dates. These amounts consist primarily of revenue from our share of net winnings earned on a daily basis where the billing period does not fall on the last day of the period. We had $15.3$18.2 million and $10.8$17.4 million of unbilled accounts receivable as of December 31, 20192022 and September 30, 2018,December 31, 2021, respectively.
Our standard credit terms are net 30 to 60 days. From time to time, we allow for certain digital customers to pay on an enhanced revenue share basis for the software license whereby the customer pays an incremental revenue share percentage over a specific period of time. We consider these types of arrangements to be extended payment terms as the full consideration for the arrangement may not be received until several years after the date of the sale depending on the net winnings from the game or application.Inventories
Inventories
Inventories consist primarily of component parts and related parts used in gaming terminals. Inventories are stated at the lower of cost or net realizable value, using the weighted average costfirst-in-first-out method. We determine the lower of cost or net realizable value of our inventory based on estimates of potentially excess and obsolete inventories after considering historical and forecasted demand and average selling prices. Demand for gaming terminals and parts inventory is also subject to technological obsolescence. Cost includes all direct costs and an appropriate proportion of fixed and variable overheads.
INSPIRED ENTERTAINMENT, INC. AND SUBSIDIARIES
NOTES TO CONSOLIDATED FINANCIAL STATEMENTS
AS OF DECEMBER 31, 2019 AND SEPTEMBER 30, 2018 AND
FOR THE PERIODS ENDED
DECEMBER 31, 2019, DECEMBER 31, 2018 AND SEPTEMBER 30, 2018
Property and Equipment
Property and equipment are recorded at cost, and when placed into service, depreciated and amortized to their residual values using the straight-line method over the estimated useful lives of the related assets as follows:
Schedule of Property and Equipment Estimated Useful Lives
| Leasehold property | Shorter of the useful life or the life of the lease | |
| Server based gaming terminals | 2 – 7 years | |
| Plant and machinery and fixtures and fittings | 3 – 10 years | |
| Computer equipment | 3 – 5 years |
Our policy is to periodically review the estimated useful lives of our fixed assets. We also assess the recoverability of long-lived assets (or asset groups) whenever events or changes in circumstances indicate that the carrying amount of such an asset (or asset groups) may not be recoverable.
Repairs and maintenance costs are expensed as incurred. Upon retirement or sale, the cost of assets disposed and the related accumulated depreciation are written off and any resulting gain or loss is credited or charged to income.
| F-11 |
INSPIRED ENTERTAINMENT, INC. AND SUBSIDIARIES
NOTES TO CONSOLIDATED FINANCIAL STATEMENTS
AS OF DECEMBER 31, 2022 AND 2021, AND FOR THE YEARS ENDED
DECEMBER 31, 2022, 2021 AND 2020
Software Development Costs
We classify software development costs as either internal use software or external use software. We account for costs incurred to develop internal use software in accordance with Accounting Standards Codification (“ASC”) ASC 350-40, Internal Use Software. Consequently, any costs incurred during preliminary project stages are expensed; direct costs incurred during the application development stages are capitalized; and costs incurred during the post-implementation/operation stages are expensed. Once the software is placed in operation, we amortize the capitalized internal use software cost over its estimated economic useful life, which range from two to five years.
We purchase, license and incur costs to develop external use software to be used in the products we sell or provide to customers. Such costs are capitalized under ASC 985-20, Costs of Software to Be Sold Leased or Marketed. Costs incurred in creating software are expensed when incurred as Selling, General and Administrative Expenses until technological feasibility has been established, after which costs are capitalized up to the date the software is available for general release to customers. We capitalize the payments made for software that we purchase or license for use in our products that has previously met the technological feasibility criteria prior to our purchase or license. Annual amortization of capitalized external use software development costs is recorded over the estimated economic life, which is two to five years.
Research and development costs are expensed as incurred. Researchincurred, with the exception of research and development related primarily to software product development costs, which is expensed until technological feasibility has been established. Total research and development costs amounted to $16.1 million, $13.8 million and $15.0 million in the years ended December 31, 2022, 2021 and 2020, respectively. Research and development costs amounting to $3.8$1.5 million, $0.8$3.1 million and $4.8$3.9 million were expensed to Selling, general and administrative expenses during the year ended December 31, 2019,2022, 2021 and 2020, respectively. Research and development costs amounting to $14.6 million, $10.7 million and $11.1 million were capitalized during the three monthsyear ended December 31, 20182022, 2021 and the year ended September 30, 2018,2020, respectively. Employee related costs associated with related product development are included in Selling, Generalgeneral and Administrative Expensesadministrative expenses in the consolidated statementsConsolidated Statement of operationsOperations and comprehensive loss.Comprehensive Income (Loss).
Goodwill and Other Acquired Intangible Assets
Our principal acquired intangible assets relate to goodwill, trademarks and customer relationships. Goodwill represents the excess purchase price over the fair value of the identifiable net assets acquired in a business combination, and has increased in the year due to the NTG acquisition (see Note 2).combination. Trademarks and customer relationships were originally recorded at their fair values in connection with business combinations.combinations, and increased in 2021 due to the acquisition of 100% of the membership interests of Sportech Lotteries, LLC (see Note 2).
Goodwill and other intangible assets with indefinite useful lives are not amortized, but instead are tested for impairment at least annually. Intangible assets with finite lives are amortized on a straight-line basis over three to tenthirteen years to their estimated residual values and reviewed for impairment. Factors considered when assigning useful lives include legal, regulatory and contractual provisions, product obsolescence, demand, competition and other economic factors.
INSPIRED ENTERTAINMENT, INC. AND SUBSIDIARIES
NOTES TO CONSOLIDATED FINANCIAL STATEMENTS
AS OF DECEMBER 31, 2019 AND SEPTEMBER 30, 2018 AND
FOR THE PERIODS ENDED
DECEMBER 31, 2019, DECEMBER 31, 2018 AND SEPTEMBER 30, 2018
Impairment of Goodwill and Long-Lived Assets
We test for goodwill impairment at least annually on the last day of our fiscal period, and whenever other facts and circumstances indicate that the carrying value may not be recoverable. For goodwill impairment evaluations, we first make a qualitative assessment to determine if goodwill is likely to be impaired. If it is more-likely-than-not that a reporting unit’s fair value is less than its carrying value, we then compare the fair value of the reporting unit to its respective carrying amount. Goodwill is carried, and therefore tested, at the reporting unit level. We have threefour segments Server Basedwhich are considered to represent reporting units, Gaming, Virtual Sports, Interactive and Acquired Businesses,Leisure, as detailed in Note 28.27. If the fair value of the reporting unit is less than its carrying amount, the amount of the impairment loss, if any, will be measured by comparing the implied fair value of goodwill to its carrying amount and would be charged to operations as an impairment loss. A mixture of qualitative test wasand quantitative tests were carried out as of December 31, 2019, December 31, 20182022 and September 30, 20182021 and no impairment was required at any of these dates.
We assess the recoverability of long-lived assets and intangible assets with finite useful lives whenever events arise or circumstances change that indicate the carrying amount of an asset may not be recoverable. Recoverability of long-lived assets (or asset groups) to be held and used is measured by a comparison of the carrying amount of the asset (or asset group) to the expected net future undiscounted cash flows to be generated by that asset (or asset group) or, for identifiable intangibles with finite useful lives, by determining whether the amortization of the intangible asset balance over its remaining life can be recovered through expected net future undiscounted cash flows. The amount of impairment of other long-lived assets and intangible assets with finite lives is measured by the amount by which the carrying amount of the asset exceeds the fair market value of the asset. As a result of the Company’s change in strategic direction of certain of its operations, the Company determined that certain of its long-lived and other assets were impaired as of September 30, 2018. Accordingly, the Company recorded an impairment charge of $7.7 million for the year ended September 30, 2018, which consisted of $4.9 million of software, $1.9 million of prepaid expenses and other current assets, $0.6 million of unbilled accounts receivable and $0.3 million of trade receivables.
| F-12 |
INSPIRED ENTERTAINMENT, INC. AND SUBSIDIARIES
NOTES TO CONSOLIDATED FINANCIAL STATEMENTS
AS OF DECEMBER 31, 2022 AND 2021, AND FOR THE YEARS ENDED
DECEMBER 31, 2022, 2021 AND 2020
Equity Method Investment
For investments in entities over which the Company exercises significant influence, but which do not meet the requirements for consolidation, the Company uses the equity method of accounting. On October 1, 2019, the Company acquired a 40% noncontrolling interest in Innov8 Gaming Limited in connection with the Acquisition (see Note 2)., and in April 2020 this interest was disposed of. The value of the Company’s equity method investment was $0.7$0.7 million as of December 31, 2019.2019, and was impaired to $Nil in March 2020 prior to disposal. The Company’s share of earnings from its equity method investee, which was not material forincluding the year ended December 31, 2019,impairment, is presented in lossLoss from equity method investee in the consolidated statementsConsolidated Statement of operations.Operations and Comprehensive Income (Loss).
The Company evaluates its equity method investmentinvestments for impairment whenever events or changes in circumstances indicate that the carrying amounts of such investment may not be recoverable. The difference between the carrying value of the equity method investment and its estimated fair value is recognized as an impairment charge when the loss in value is deemed other-than-temporary. Since April 2020, the Company has had no equity method investments and has therefore recognized no impairments.
Deferred Revenue and Deferred Cost of Sales excluding depreciation and amortization
Deferred revenue arises from the timing differences between the shipment or installation of gaming terminals and systems products and the satisfaction of all revenue recognition criteria consistent with our revenue recognition policy, as well as prepayment of contracts which are recognized ratably over a service period, such as maintenance or licensing fees. Deferred cost of sales, excluding depreciation and amortization, recorded as prepaid expenses and other assets, consists of the direct costs associated with the manufacture of gaming equipment and systems products for which revenue has been deferred. Amounts expected to be recognized as revenue within the 12 months following the balance sheet date are classified as deferred revenue in current liabilities. Amounts not expected to be recognized as revenue within the 12 months following the balance sheet date are classified as deferred revenue, net of current portion.
Debt IssueIssuance Costs
Debt issuance costs incurred in connection with the Company’s debt are capitalized and amortized as interest expense over the term of the related debt. The Company presents debt issuance costs as a reduction from the carrying amount of debt. Only costs that are wholly attributable to obtaining the related debt finance are treated as debt issuance costs. Any other costs are expensesexpensed to the Consolidated Statement of Operations and Comprehensive LossIncome (Loss) as part of Acquisition and integration related transaction expenses.
Value Added Tax
The Company is subject to Value Added Tax (“VAT”) in some locations. The amount of VAT liability is determined by applying the applicable tax rate to the invoiced amount of goods and services sold less VAT paid on purchases made with the relevant supporting invoices. VAT is collected from customers by the Company on behalf of the tax authorities and is therefore not charged to the consolidated statementsConsolidated Statement of operations.Operations and Comprehensive Income (Loss).
INSPIRED ENTERTAINMENT, INC. AND SUBSIDIARIES
NOTES TO CONSOLIDATED FINANCIAL STATEMENTS
AS OF DECEMBER 31, 2019 AND SEPTEMBER 30, 2018 AND
FOR THE PERIODS ENDED
DECEMBER 31, 2019, DECEMBER 31, 2018 AND SEPTEMBER 30, 2018
Common Stock Purchase Warrants and Derivative Financial Instruments
The Company reviews any common stock purchase warrants and other freestanding derivative financial instruments at each balance sheet date and classifies them on the consolidated balance sheet as:
| a) | Equity if they (i) require physical settlement (full or net-share | |
| b) | Assets or liabilities if they (i) require net-cash settlement (including a requirement to net cash settle the contract if an event occurs and if that event is outside the Company’s control), or (ii) give the counterparty a choice of net-cash settlement or settlement in shares |
| F-13 |
The Company assesses classification of its common stock purchase warrants and other freestanding derivatives atINSPIRED ENTERTAINMENT, INC. AND SUBSIDIARIES
NOTES TO CONSOLIDATED FINANCIAL STATEMENTS
AS OF DECEMBER 31, 2022 AND 2021, AND FOR THE YEARS ENDED
DECEMBER 31, 2022, 2021 AND 2020
At each reporting date, to determinethe Company determines whether a change in classification between assets and liabilities is required.
During the year ending December 31, 2021, (i) an aggregate of shares of common stock were issued pursuant to the exercise of Public Warrants and (ii) an aggregate of shares of common stock were issued pursuant to the exercise (on a cashless basis) of Private Warrants. There were no warrants outstanding as of December 31, 2021 or December 31, 2022.
At December 31, 2019, and September 30, 2018,2020, the Company considered that the warrants did not meet the criteria for equity classification and must be recorded as liabilities. As the warrants meetmet the definition of a derivative as contemplated in ASC 815, the warrants arewere measured at fair value at inception and at each reporting date in accordance with ASC 820, Fair Value Measurement, with changes in fair value recognized in the Consolidated Statements of Operations and Comprehensive LossIncome (Loss) in the period of change. The Company also determined that its obligation to settle certain awards in either cash or stock satisfied the criteria for classification as a derivative financial instrument at December 31, 2019 and September 30, 2018 (see Note 17).
From time to time we enter into foreign currency forward contracts to mitigate the risk associated with cash payments required to be made in non-functional currencies or to mitigate the risk associated with cash to be received in non-functional currencies.
Accounting Policy for Derivative Instruments and Hedging Activities
FASB ASC 815, Derivatives and Hedging (“ASC 815”), provides the disclosure requirements for derivatives and hedging activities with the intent to provide users of financial statements with an enhanced understanding of: (a) how and why an entity uses derivative instruments, (b) how the entity accounts for derivative instruments and related hedged items, and (c) how derivative instruments and related hedged items affect an entity’s financial position, financial performance, and cash flows. Further, qualitative disclosures are required that explain the Company’s objectives and strategies for using derivatives, as well as quantitative disclosures about the fair value of and gains and losses on derivative instruments, and disclosures about credit-risk-related contingent features in derivative instruments.
As required by ASC 815, the Company records all derivatives on the balance sheet at fair value. The accounting for changes in the fair value of derivatives depends on the intended use of the derivative, whether the Company has elected to designate a derivative in a hedging relationship and apply hedge accounting and whether the hedging relationship has satisfied the criteria necessary to apply hedge accounting. Derivatives designated and qualifying as a hedge of the exposure to changes in the fair value of an asset, liability, or firm commitment attributable to a particular risk, such as interest rate risk, are considered fair value hedges. Derivatives designated and qualifying as a hedge of the exposure to variability in expected future cash flows, or other types of forecasted transactions, are considered cash flow hedges. Derivatives may also be designated as hedges of the foreign currency exposure of a net investment in a foreign operation. Hedge accounting generally provides for the matching of the timing of gain or loss recognition on the hedging instrument with the recognition of the changes in the fair value of the hedged asset or liability that are attributable to the hedged risk in a fair value hedge or the earnings effect of the hedged forecasted transactions in a cash flow hedge. The Company may enter into derivative contracts that are intended to economically hedge certain of its risk, even though hedge accounting does not apply or the Company elects not to apply hedge accounting.
In accordance with the FASB’s fair value measurement guidance in ASU 2011-04, “Fair Value Measurements,” the Company made an accounting policy election to measure the credit risk of its derivative financial instruments that are subject to master netting agreements on a net basis by counterparty portfolio.
Revenue Recognition
The Company adopted Accounting Standards Codification (“ASC”) 606 – Revenue from Contracts with Customers” (“ASC 606”) as of January 1, 2019 using the modified retrospective method. This method allows the Company to apply ASC 606 to new contracts entered into after January 1, 2019, and to its existing contracts for which revenue earned through December 31, 2018 has been recognized under the guidance in effect prior to the effective date of ASC 606. The revenue recognition processes the Company applied prior to adoption of ASC 606 align with the recognition and measurement guidance of the new standard, therefore adoption of ASC 606 did not require a cumulative adjustment to opening equity.
INSPIRED ENTERTAINMENT, INC. AND SUBSIDIARIES
NOTES TO CONSOLIDATED FINANCIAL STATEMENTS
AS OF DECEMBER 31, 2019 AND SEPTEMBER 30, 2018 AND
FOR THE PERIODS ENDED
DECEMBER 31, 2019, DECEMBER 31, 2018 AND SEPTEMBER 30, 2018
Under ASC 606, a performance obligation is a promise within a contract to transfer a distinct good or service, or a series of distinct goods and services, to a customer. Revenue is recognized when performance obligations are satisfied and the customer obtains control of promised goods or services. The amount of revenue recognized reflects the consideration to which the Company expects to be entitled to receive in exchange for goods or services. Under the standard, a contract’s transaction price is allocated to each distinct performance obligation. To determine revenue recognition for arrangements that the Company determines are within the scope of ASC 606, the Company performs the following five steps:
| 1. | identify the contracts with a customer; | |
| 2. | identify the performance obligations within the contract, including whether they are distinct and capable of being distinct in the context of the contract; |
| F-14 |
INSPIRED ENTERTAINMENT, INC. AND SUBSIDIARIES
NOTES TO CONSOLIDATED FINANCIAL STATEMENTS
AS OF DECEMBER 31, 2022 AND 2021, AND FOR THE YEARS ENDED
DECEMBER 31, 2022, 2021 AND 2020
| 3. | determine the transaction price; |
| 4. | allocate the transaction price to the performance obligations in the contract; and | |
| 5. | recognize revenue when, or as, the Company satisfies each performance obligation. |
Step 1 – Identify the contract
The Company identifies contracts with its customers when all parties have approved the contract and are committed to perform their respective obligations, when each party’s rights and the payment terms regarding the goods or services to be transferred can be identified. The contract must also have commercial substance, and it must be probable that the Company will collect the consideration to which it will be entitled.
Contracts entered into at or near the same time with the same customer or related parties of the customer are accounted for as one contract if any of the following criteria are met:
| a. | Contracts were negotiated as a single commercial package (including whether a contract would be loss-making without taking into account the consideration received under another contract) | |
| b. | Consideration in one contract depends on the other contract | |
| c. | Goods or services (or some of the goods or services) are a single performance obligation. |
Step 2 – Identify performance obligations
Performance obligations are identified by considering whether a good or service is distinct. The Company considers a good or service to be distinct only when the customer can benefit from it either on its own or together with other resources that are readily available, and when the promise to transfer the good or service to the customer is separately identifiable from other promises in the contract.
The Company applies the series guidance to its performance obligations where the following criteria apply:
| a. | Each distinct good or service in the series meets the criteria to be a performance obligation satisfied over time. | |
| b. | The same method would be used to measure progress toward complete satisfaction of the performance obligation to transfer each distinct good or service in the series to the customer. |
Step 3 – Determine the transaction price
The Company considers all amounts to which it has rights in exchange for the goods or services transferred in determining the transaction price. This includes fixed and variable consideration. Typically, consideration is stated in the contract with the customer.
The Company assesses usage-based fees to determine whether they qualify as variable consideration. It also considers the impact of any liquidated damages clauses or service level agreements.
Where the Company’s performance obligations are determined to be a series, variable consideration is not estimated upfront in accordance with the exception allowed by ASC 606.
INSPIRED ENTERTAINMENT, INC. AND SUBSIDIARIES
NOTES TO CONSOLIDATED FINANCIAL STATEMENTS
AS OF DECEMBER 31, 2019 AND SEPTEMBER 30, 2018 AND
FOR THE PERIODS ENDED
DECEMBER 31, 2019, DECEMBER 31, 2018 AND SEPTEMBER 30, 2018
Where non-refundable upfront fees are included in the Company’s contracts with customer, the Company considers whether or not they represent payment for a transferred good or service. Where they represent payment for future goods or services, the Company further considers whether they represent a material right.
| F-15 |
INSPIRED ENTERTAINMENT, INC. AND SUBSIDIARIES
NOTES TO CONSOLIDATED FINANCIAL STATEMENTS
AS OF DECEMBER 31, 2022 AND 2021, AND FOR THE YEARS ENDED
DECEMBER 31, 2022, 2021 AND 2020
Step 4 – Allocate the transaction price
The Company allocates a transaction price to each performance obligation based on the relative standalone selling prices of the goods or services being provided. Where a contract includes multiple performance obligations, the Company determines the standalone selling price at contract inception of the distinct good or service underlying each performance obligation in the contract and allocates the transaction price in proportion to those standalone selling prices. Where possible, the Company uses the price charged for the good or service to other customers in similar circumstances as evidence of standalone selling price. Where this is not possible, the standalone selling price is estimated by experienced management using the best available judgement.
With respect to performance obligations that are considered to be a series, where appropriate and where the required criteria are met, variable consideration is allocated entirely to a distinct good or service that is part of a series.
Step 5 – Recognize revenue
The Company recognizes revenue over time for performance obligations that meet one of the following criteria:
| a. | The customer simultaneously receives and consumes the benefits provided by the Company’s performance as the Company performs. | |
| b. | The Company’s performance creates or enhances an asset that the customer controls as the asset is created or enhanced. | |
| c. | The Company’s performance does not create an asset with an alternative use to the Company, and the Company has an enforceable right to payment for performance completed to date |
Revenue for the Company’s remaining performance obligations that do not meet one of the above criteria is recognized at the point at which the customer obtains control of the good or service.
Server Based Gaming Revenue
Revenue from SBGGaming terminals, access to our content and SBG platform, including electronic table gaming products is recognized in accordance with the criteria set forth in ASC 606 and is usually based upon a contracted percentage of the operator’s net winnings from the terminals’ daily use. Where this is not the case, including in the case of maintenance only contracts on self-serve betting terminals, revenue is based upon a fixed daily or weekly usage fee. We recognize revenue from these arrangements in accordance with the series guidance over time on a daily basis over the term of the arrangement, or when not specified over the expected customer relationship period. Performance obligations under these arrangements may include the delivery and installation of our SBG terminals for use over a term, as well as service obligations related to hardwareterminal repairs and server based content and maintenance. Consideration with respect to these performance obligations typically takes the form of usage based fees, billed at the end of a set period (usually monthly) and due typically 30 days from the date of the invoice.
We sometimes bill for SBG arrangements up front in order to help fund our working capital and development requirements, or at the request of a customer. Upfront fees on SBG arrangements are deferred and recognized ratably over time, or when not specified over the expected customer relationship period, where they represent payment for future goods and services. In the case where we receive upfront fees pursuant to which there are no further obligations and no undelivered elements, we will recognize the upfront fees upon delivery. Upfront fees are normally billed upon signing of the relevant agreement, and become due and payable at set times thereafter. HardwareTerminal sales take the form of a transfer of ownership of our developed gaming terminals, and are recognized as Product Sales at a point in time upon deliverysuch time as control passes to the customer as they are considered to meet the required criteria to be considered distinct. Payment for hardwareterminal sales is typically due a set number of days after delivery.
SBGGaming arrangements typically include service level agreements, consisting of a specified amount of ‘uptime’ with financial penalties for breaches in excess of specified levels.
| F-16 |
INSPIRED ENTERTAINMENT, INC. AND SUBSIDIARIES
NOTES TO CONSOLIDATED FINANCIAL STATEMENTS
AS OF DECEMBER 31, 20192022 AND SEPTEMBER 30, 20182021, AND
FOR THE PERIODSYEARS ENDED
DECEMBER 31, 2019, DECEMBER 31, 20182022, 2021 AND SEPTEMBER 30, 20182020
Virtual Sports Revenue
Revenue from licensing of our gaming software is recognized in accordance with the criteria set forth in ASC 606. Virtual sports retail revenue, which includes the provision of virtual sports content and services to retail betting outlets, and virtual sports online and mobile revenue, which includes the provision of virtual sports content and services to mobile and online operators, is usually based upon a contracted percentage of the operator’s net winnings or, occasionally, a fixed rental fee. We recognize revenue for these fees over time on a daily or weekly basis in over the term of the arrangement.arrangement, or, where appropriate when the contracted percentages vary prospectively with total operator’s net winnings generated, we estimate the amount of variable consideration to which we will be entitled, up to and including the date at which the contracted percentages reset, and recognize this estimated consideration over time. Consideration with respect to these performance obligations typically takes the form of usage based fees, billed at the end of a set period (usually monthly) and due typically 30 days from the date of the invoice.
These arrangements also typicallymay include a perpetual license billed up front, granted to the customer for access to our gaming platform and content. As these up front bills represent payment for future services, revenue from the licensing of perpetual licenses is recognized ratably over time, or when not specified, over the expected customer relationship period. Upfront fees are normally billed upon signing of the relevant agreement, and become due and payable at set times thereafter.
Revenue from the development of bespoke games licensed on a perpetual basis to mobile and online operators is recognized at a point in time on delivery and acceptance by the customer. We have no ongoing service obligations subsequent to customer acceptance of our bespoke games, and they meet the criteria to be considered as distinct. Payment for bespoke games is typically due a set number of days after delivery.
Virtual Sports arrangements typicallymay include service level agreements, consisting of a specified amount of ‘uptime’ with financial penalties for breaches in excess of specified levels.
Acquired BusinessesInteractive Revenue
RevenueInteractive revenue, which includes slot and table game offerings from the Acquired Businessesour Gaming segment, comprises of a number of different streams, recognized as follow:
Acquired Businesses earn revenue from bothwell as interactive-only content, via our remote gaming machine terminals and amusement machine terminals. Revenue from terminals and access to our content and platform is recognized in accordance with the criteria set forth in ASC 606 andservers, is based upon a contracted percentage of the operator’s net winnings from the terminals’ daily use, or a fixed daily or weekly usagerental fee. We recognize revenue fromfor these arrangements in accordance with the series guidancefees over time on a daily or weekly basis over the term of the arrangement, or, where appropriate when not specifiedthe contracted percentages vary prospectively with total operator’s net winnings generated, we estimate the amount of variable consideration to which we will be entitled, up to and including the date at which the contracted percentages reset, and recognize this estimated consideration over the expected customer relationship period. Performance obligations under these arrangements may include the delivery and installation of our terminals for use over a term, as well as service obligations related to hardware repairs and content and maintenance. Sometimes these services are also offered without the supply of a terminal.time. Consideration with respect to these performance obligations typically takes the form of usage based fees, billed at the end of a set period (usually monthly) and due typically 30 days from the date of the invoice.
Certain salesLeisure Revenue
The Leisure segment earns revenue from providing gaming machine terminals and amusement machine terminals to pubs, holiday resorts and amusement arcades, both standalone and within motorway service stations. Revenue from these activities is based upon a contracted percentage of the operator’s net winnings from the terminals’ daily use, or a fixed daily or weekly rental fee.
We jointly operate arcades within holiday resorts with the resort owners. Revenue is based on a contractually agreed share of takings. We also wholly operate a number of gaming arcades within certain motorway service stations.
We recognize revenue from these arrangements, in accordance with the series guidance as set forth in ASC 606, over time over the term of the arrangement, or when not specified over the expected customer relationship period. All revenue is recognized in the period that the machine cash collections occur, with adjustments to account for the movement of income uncollected in the specific period.
Performance obligations under these arrangements may include the delivery and installation of our terminals for use over a term, as well as service obligations related to terminal repairs and content and maintenance. Consideration with respect to these performance obligations typically takes the form of usage based fees, billed at the end of a set period (usually monthly) and due typically 30 days from the date of the invoice.
We also provide terminal and component repair revenue,spares management services to third parties, including customers. Revenue in respect to these services takes the form of fixed fee, either per machine or per time period, and sales of spare parts areis recognized at the point in time when control transfers to the customer, which is normally upon delivery and acceptance by the customer. Payment for point-in-time revenue is typically due a set number of days after delivery.
We also provide terminal and spares management services to third parties. Revenue with respect to these services takes the form of both fixed and variable consideration. Where possible, variable consideration is estimatedcustomer, or at the contract inception and allocated to the performance obligations to which it relates. Revenue is recognized over time in line with the customers’ use of the service.
Revenue from licensing of our gaming software is earned via usage-based royalties, billed at the end of a set period (usually monthly) and due typically 30 days from the date of the invoice.point that services are rendered. This revenue is recognized over time as the usage occurs.Service Revenue when included as part of a larger performance obligation, and as Product Sales when it is offered as a separate distinct performance obligation. Revenue is invoiced in arrears and settled within 30 days.
| F-17 |
INSPIRED ENTERTAINMENT, INC. AND SUBSIDIARIES
NOTES TO CONSOLIDATED FINANCIAL STATEMENTS
AS OF DECEMBER 31, 2022 AND 2021, AND FOR THE YEARS ENDED
DECEMBER 31, 2022, 2021 AND 2020
Disaggregation of revenue
Information on disaggregation of revenue is included in Note 28,26, “Segment Reporting and Geographic Information.”
Shipping and Handling Costs
Shipping and handling costs for products sales and hardwareterminals related to subscription services are included in cost of sales, excluding depreciation and amortization for all periods presented.
NOTES TO CONSOLIDATED FINANCIAL STATEMENTS
AS OF DECEMBER 31, 2019 AND SEPTEMBER 30, 2018 AND
FOR THE PERIODS ENDED
DECEMBER 31, 2019, DECEMBER 31, 2018 AND SEPTEMBER 30, 2018
Share-Based Payment Arrangements
The Company accounts for stock-based compensation in accordance with ASC 718, “Compensation - Stock Compensation” (“ASC 718”). ASC 718 requires generally that all equity awards be accounted for at their “fair value.” This fair value is measured on the grant date for stock-settled awards, and at subsequent exercise or settlement for cash-settled awards.awards.. Fair value is equal to the underlying value of the stock for “full-value” awards such as restricted stock and restricted stock units that have time vesting conditions, and stock options and performance shares that have market conditions are valued using an option-pricing model with traditional inputs for “appreciation” awards.
Costs equal to these fair values are recognized ratably over the requisite service period based on the number of awards that are expected to vest, or in the period of grant for awards that vest immediately and have no future service condition. The Company accounts for forfeitures as they occur. For awards that vest over time, previously recognized compensation cost is reversed if the service or performance conditions are not satisfied and the award is forfeited.
Subsequent modifications to outstanding awards result in incremental cost if the fair value is increased as a result of the modification. The incremental cost is charged over the estimated derived service period.
Income Taxes
Income taxes are accounted for under the asset and liability method. Our provision for income taxes is principally based on current period income (loss), changes in deferred tax assets and liabilities and changes in estimates with regard to uncertain tax positions. We estimate current tax expense and assess temporary differences resulting from differing treatments of items for tax and accounting purposes using enacted tax rates in effect for each taxing jurisdiction in which we operate for the period in which those temporary differences are expected to be recovered or settled. These differences result in deferred tax assets and liabilities. Our total deferred tax assets are principally comprised of depreciation and net operating loss carry forwards.
Significant management judgment is required to assess the likelihood that deferred tax assets will be recovered from future taxable income. In assessing the realizability of these deferred tax assets, management considers whether it is more likely than not that some portion or all of the deferred tax assets will be realized. Management makes this assessment on a jurisdiction by jurisdiction basis considering the historical trend of taxable losses, projected future taxable income and the reversal of deferred tax liabilities.
We evaluate income tax uncertainties, assess the probability of the ultimate settlement with the applicable taxing authority and records an amount based on that assessment. Interest and penalties, if any, associated with uncertain tax positions are included in income tax expense.
Comprehensive Loss
We include and separately classify in comprehensive loss unrealized gains and losses and hedges from our foreign currency translation adjustments, gains or losses associated with pension or other post-retirement benefits, prior service costs or credits associated with pension or other post-retirement benefits and transition assets or obligations associated with pension or other post-retirement benefits.
| F-18 |
Leases
In February 2016, the FASB issued ASU 2016-02, Leases (Topic 842), followed in July 2018 by ASU 2018-10, Codification Improvements to Topic 842 Leases, and ASU 2018-11, Leases (Topic 842): Targeted Improvements. Under the new transition method, an entity initially applies the new leases standard at the adoption date and recognizes a cumulative-effect adjustment to the opening balance of retained earnings in the period of adoption. As a result of this adoption and the required disclosures, the Company revised its accounting policy for leases as stated below. The guidance is effective for all public business entities and certain not-for-profit entities in fiscal years beginning after December 15, 2018, and for all other entities in fiscal years beginning after December 15, 2020. Early adoption is permitted. As the Company was an emerging growth company until December 31, 2019 and elected to use the extended transition period for complying with any new or revised financial accounting standards provided pursuant to Section 13(a) of the Exchange Act, it adopted the standard as of January 1, 2019 on December 31, 2019.
We elected to adopt the package of practical expedients to not reassess prior conclusions related to contracts containing leases, lease classification and initial direct costs, along with the practical expedient to use hindsight when determining the lease term.
INSPIRED ENTERTAINMENT, INC. AND SUBSIDIARIES
NOTES TO CONSOLIDATED FINANCIAL STATEMENTS
AS OF DECEMBER 31, 20192022 AND SEPTEMBER 30, 20182021, AND
FOR THE PERIODSYEARS ENDED
DECEMBER 31, 2019, DECEMBER 31, 20182022, 2021 AND SEPTEMBER 30, 20182020
Leases
We determine if an arrangement is a lease at inception of the arrangement. Once it is determined that an arrangement is, or contains, a lease, that determination should only be reassessed if the legal arrangement is modified. Changes to assumptions such as market-based factors do not trigger a reassessment. Determining whether a contract contains a lease requires judgement. In general, arrangements are considered to be a lease when all of the following apply:
| ● | it conveys the right to control the use of an identified asset for a period of time in exchange for consideration; |
| ● | we have substantially all economic benefits from the use of the asset; and |
| ● | we can direct the use of the identified asset. |
The terms of a lease arrangement determine how a lease is classified and the resulting income statement recognition. When the terms of a lease effectively transfer control of the underlying asset, the lease represents an in substance financed purchase (sale) of an asset and the lease is classified as a finance lease by the lessee and a sales-type lease by the lessor. When a lease does not effectively transfer control of the underlying asset to the lessee, but the lessor obtains a guarantee for the value of the asset from a third party, the lessor would classify a lease as a direct financing lease. All other leases are classified as operating leases.
Where a lease contains more than one component, the consideration in the contract is allocated on a relative standalone price basis to the separate lease components and the non-lease components.
Leases – the Company as lessee
As of December 31, 2019, our impact resulting from recognition of operating leases was as follows:
Lease assets and lease liabilities are recognized based on the present value of the future minimum lease payments over the lease term at commencement date. As our operating leases do not provide an implicit rate, we use our incremental borrowing rate based on the information available aton the date that we adopted Topic 842, January 1, 2019 or commencement date, if later, in determining the present value of future payments. Finance leases are included using the rate implicit in the lease. The lease ROU asset includes any lease payment made and initial direct costs incurred. Our operating lease terms may include options to extend or terminate the lease which are included in the measurement of the ROU assets and lease liabilities when it is reasonably certain that we will exercise that option.
| F-19 |
INSPIRED ENTERTAINMENT, INC. AND SUBSIDIARIES
NOTES TO CONSOLIDATED FINANCIAL STATEMENTS
AS OF DECEMBER 31, 2022 AND 2021, AND FOR THE YEARS ENDED
DECEMBER 31, 2022, 2021 AND 2020
The lease expense for minimum operating lease payments is recognized on a straight-line basis over the lease term. Finance lease assets are amortized straight-line over their useful life where the lease transfers ownership of the underlying asset, or to the earlier of the end of the useful life of the asset and the end of the lease term where ownership is not transferred. Interest on finance leases is recognized as the amount that results in a constant periodic discount rate on the remaining balance of the liability.
We have operating lease agreements with lease and non-lease components. The Company did not make the election to treat the lease and non-lease components as a single component and considers the non-lease components as a separate unit of account.
The Company has elected not to apply the recognition requirements of ASC 842 to short-term operating leases. We recognize the lease payments for short-term leases on a straight-line basis over the lease term and variable lease payments in the period in which the obligation for those payments is incurred
Leases – the Company as lessor
The Company’s lease arrangements are a mixture of sales-type leases and operating leases.
Sales-type lease receivables are recognized based on the net investment in the lease, at the present value of future minimum lease payments receivable over the lease term, plus any guaranteed residual value of the underlying asset, at the commencement date.
The discount rate used in determining the present value of the future minimum lease payments is the rate implicit in the lease. This is calculated using the fair value of the underlying asset and the present value of any unguaranteed residual value.
INSPIRED ENTERTAINMENT, INC. AND SUBSIDIARIES
NOTES TO CONSOLIDATED FINANCIAL STATEMENTS
AS OF DECEMBER 31, 2019 AND SEPTEMBER 30, 2018 AND
FOR THE PERIODS ENDED
DECEMBER 31, 2019, DECEMBER 31, 2018 AND SEPTEMBER 30, 2018
The underlying asset is derecognized at the point of inception and a selling profit is recognized at lease commencement. Subsequent interest income is recognized over the term of the lease, at an amount that produces a constant periodic discount rate on the remaining balance of the net investment in the lease.
For operating leases, we continue to recognize the underlying asset. Lease income is recognized on a straight-line basis over the lease term.
| F-20 |
INSPIRED ENTERTAINMENT, INC. AND SUBSIDIARIES
NOTES TO CONSOLIDATED FINANCIAL STATEMENTS
AS OF DECEMBER 31, 2022 AND 2021, AND FOR THE YEARS ENDED
DECEMBER 31, 2022, 2021 AND 2020
Recently Issued Accounting Standards
In June 2016, the FASB issued ASU No. 2016-13, “Financial Instruments – Credit Losses (Topic 326): Measurement of Credit Losses on Financial Instruments” (“ASU 2016-13”). In November 2018, the FASB issued ASU 2018-19, "Codification“Codification Improvements to Topic 326, Financial Instruments - Credit Losses"Losses” (“ASU 2018-19”) and in November 2019, the FASB issued ASU 2019-11, “Codification Improvements to Topic 326, Financial Instruments - Credit Losses” (“ASU 2019-11”). ASU 2016-13 affects loans, debt securities, trade receivables, and any other financial assets that have the contractual right to receive cash. ASU 2016-13 requires an entity to recognize expected credit losses rather than incurred losses for financial assets. The guidance will be effective beginning on January 1, 2023, including interim periods within that year and requires a modified retrospective transition approach through a cumulative-effect adjustment to retained earnings as of the beginning of the period of adoption. Under the modified retrospective method of adoption, prior year reported results are not restated. TheWe have evaluated the effect of this guidance and the adoption of ASU 2016-13 is not expected to have a material impact on the Company’s financial statement presentation or disclosures.
In July 2017,October 2021, the FASB issued ASU No. 2017-11, “Earnings Per Share2021-08, “Business Combinations (Topic 260); Distinguishing805): Accounting for Contract Assets and Contract Liabilities from Equity (Topic 480); Derivatives and Hedging (Topic 815): (Part I) Accounting for Certain Financial InstrumentsContracts with Down Round Features; (Part II) Replacement of the Indefinite Deferral for Mandatorily Redeemable Financial Instruments of Certain Nonpublic Entities and Certain Mandatorily Redeemable Noncontrolling Interests with a Scope Exception”Customers” (“ASU 2017-11”2021-08”). ASU 2017-11 allows companies to exclude2021-08 requires that an acquiring entity recognizes and measures contract assets and liabilities acquired in a down round feature when determining whether a financial instrument (or embedded conversion feature) is considered indexed tobusiness combination in accordance with Topic 606. At the entity’s own stock. As a result, financial instruments (or embedded conversion features) with down round features may no longeracquisition date, an acquirer should account for the related revenue contracts as if it had originated the contracts. The guidance will be required to be accounted for as derivative liabilities. A company will recognize the value of a down round feature only when it is triggered and the strike price has been adjusted downward. For equity-classified freestanding financial instruments, an entity will treat the value of the effect of the down round as a dividend and a reduction of income available to common shareholders in computing basic earnings per share. For convertible instruments with embedded conversion features containing down round provisions, entities will recognize the value of the down round as a beneficial conversion discount to be amortized to earnings. ASU 2017-11 is effective for fiscal years beginning after December 15, 2019, andon January 1, 2023, including interim periods within fiscal years beginning after December 15, 2020. Early adoption is permitted. The guidance in ASU 2017-11 canthat year, and should be applied using a fullprospectively to business combinations occurring on or modified retrospective approach.after the effective date. The adoption of ASU 2017-11 is2021-08 will not expected to have anya material impact on the Company’s financial statement presentation or disclosures.
| F-21 |
In August 2017, the FASB issued ASU 2017-12, “Targeted Improvements to Accounting for Hedging Activities” (“ASU 2017-12”) to simplify the application of hedge accounting guidance and improve the financial reporting of hedging relationships to better portray the economic results of an entity’s risk management activities in its financial statements. In addition, ASU 2017-12 requires an entity to present the earnings effect of the hedging instrument in the same income statement line item in which the earnings effect of the hedged item is reported. The transition guidance provides companies with the option of early adopting the new standard using a modified retrospective transition method in any interim period after issuance of the update, or alternatively requires adoption for fiscal years beginning after December 15, 2019. This adoption method requires companies to recognize the cumulative effect of initially applying the guidance as an adjustment to accumulated other comprehensive income with a corresponding adjustment to the opening balance of retained earnings as of the beginning of the fiscal year that an entity adopts the update. The adoption of ASU 2017-12 is not expected to have any impact on the Company’s financial statement presentation or disclosures.
On October 1, 2019, the Company’s subsidiary, Inspired Gaming (UK) Limited, completed the acquisition of the Gaming Technology Group of Novomatic UK Ltd. pursuant to the Share Purchase Agreement, dated as of June 11, 2019 (the “SPA”), comprising: (i) all of the outstanding equity interests of each of (a) Astra Games Ltd, (b) Bell-Fruit Group Limited, (c) Gamestec Leisure Limited, (d) Harlequin Gaming Limited, and (e) Playnation Limited, and (ii) 60% of the outstanding equity interests of Innov8 Gaming Limited (“Innov8”, and together with the entities described in clause (i) and certain of their subsidiaries, the “Acquired Businesses” and the transactions contemplated by the SPA, the “NTG Acquisition”). The consideration for the NTG Acquisition totaled approximately €107.0 million ($116.6 million) in cash, which was financed by the Senior Facilities Agreement discussed in Note 13.
Simultaneous with the closing of the NTG Acquisition, Inspired transferred a portion of the equity interests it had acquired in Innov8 to the then-minority equity holders of Innov8 in exchange for the renegotiation of certain funding commitments. As a result, Inspired currently holds approximately 40% of the outstanding equity interests of Innov8.
The NTG Acquisition is expected to add increased scale to our business, while supplementing key technologies and content within our existing portfolio.
INSPIRED ENTERTAINMENT, INC. AND SUBSIDIARIES
NOTES TO CONSOLIDATED FINANCIAL STATEMENTS
AS OF DECEMBER 31, 20192021 AND SEPTEMBER 30, 20182020, AND
FOR THE PERIODSYEARS ENDED
DECEMBER 31, 2019, DECEMBER 31, 20182021, 2020 AND SEPTEMBER 30, 20182019
| 2. | Acquisitions and Disposals |
In January 2022, the Company sold its Italian VLT business, including all terminal and other assets, staff costs and facilities and contracts, to a non-connected party for total proceeds of €1.1 million ($1.2 million), recognizing a profit on disposal of €0.8 million ($0.9 million). The allocationCompany continues to serve these Italian markets in the form of the purchase price is summarized as follows (in millions):provision of platform and games.
| Purchase Price | £ | 94.7 | ||
| Foreign exchange rate at October 1, 2019 | 1.23 | |||
| Adjusted purchase price in US dollars | $ | 116.6 | ||
| Allocated to: | ||||
| Cash | $ | 8.4 | ||
| Receivables | 20.5 | |||
| Inventories | 14.6 | |||
| Prepaid expenses and other | 1.4 | |||
| Property and equipment | 49.3 | |||
| Software development costs | 7.1 | |||
| Other assets | 1.4 | |||
| Accounts payable, accrued expenses and other current liabilities | (22.7 | ) | ||
| Income taxes payable | (1.9 | ) | ||
| Long-term debt | (0.1 | ) | ||
| Other long-term liabilities | (1.6 | ) | ||
| Net assets acquired | 76.4 | |||
| Excess of purchase price over net assets acquired before allocation to identifiable intangible assets and goodwill | $ | 40.2 |
The fair value of property and equipment was determined usingOn December 31, 2021, the indirect cost approach which utilizes fixed asset record information including historical costs, acquisition dates, and asset descriptions and applying asset category specific nationally recognized indices to the historical cost of each asset to derive replacement cost new less depreciation. Management has also made the initial determination that all other assets and liabilitiesCompany acquired are primarily estimated to be stated at their fair values, which approximates their recorded cost. Management has made an initial determination that approximately $8.1 million100% of the excessmembership interests of the purchase price over the net assets acquired should be allocated to identifiable intangible assets.Sportech Lotteries, LLC, which has since been renamed Inspired Entertainment Lotteries, LLC. The unidentified excessCompany concluded that Inspired Entertainment Lotteries, LLC’s contract with its only customer represented substantially all of the purchase price over the fair value of the netgross assets acquired has been recorded as goodwill.
| Amount | Estimated Useful Life (Years) | |||||
| Corporate trade names and domains | $ | 3.7 | 10 | |||
| Customer contracts and relationships | 4.4 | 10 | ||||
| Intangible Assets | 8.1 | |||||
| Goodwill | 32.1 | |||||
| $ | 40.2 | |||||
Inand, in accordance with ASC 805, identifiabledetermined that the asset set did not comprise a business. The Company therefore applied asset acquisition accounting to the transaction, and recorded the acquisition of the customer contract as an intangible assets are required to be measured at fair value.asset in the amount of $12.3 million. The intangible assets identified were valued using the income approach, either through the discounted cash flow method, the relief from royalty method or the excess earnings method. Determining fair value requires significant judgment concerning the assumptions used in the valuation model, including discount rates, the amount and timing of expected future cash flows and growth rates, as well as expected royalty rates, which are based on the estimated rates at which similar assets are being licensed in the marketplace. The estimated weighted averageasset will be amortized over its remaining useful life of the new intangible assets identified is 1013.2 years.
Goodwill arising from the NTG Acquisition mainly consists of the synergies of an ongoing business. Goodwill and intangible assets are tested for impairment on an annual basis or sooner, if an event occurs or circumstances change that indicate that the carrying amount of the goodwill or intangible asset may not be recoverable. The Company incurred advisor fees, legal and other costs related to the NTG Acquisition of $6.7 million, which excludes the costs of refinance that have been deducted from the senior debt as debt issuance costs and which have been recognized in operating expenses in the accompanying consolidated statement of operations duringDuring the year ended December 31, 2019.
Asset valuations included in previous SEC filings were based on a preliminary assessment, which has since been updated to an actual assessment. As2022, as a result certainof revisions made to management’s preliminary assessments, the Company recognized an additional $0.9 million long-term receivable related to Inspired Entertainment Lotteries, LLC, and reduced the value of the customer contract intangible asset valuations are now revised as follows; Software development costs $6.0 million to $7.1 million, Other assets $1.5 million to $1.4 million, Corporate trade names and domains $3.2 million to $3.7 million, Customer contracts and relationships $9.2 million to $4.4 million, Goodwill $28.8 million to $32.1 million.accordingly.
| F-22 |
INSPIRED ENTERTAINMENT, INC. AND SUBSIDIARIES
NOTES TO CONSOLIDATED FINANCIAL STATEMENTS
AS OF DECEMBER 31, 20192022 AND SEPTEMBER 30, 20182021, AND
FOR THE PERIODSYEARS ENDED
DECEMBER 31, 2019, DECEMBER 31, 20182022, 2021 AND SEPTEMBER 30, 20182020
Total revenues and loss from operations from October 1, 2019 (the acquisition date) through December 31, 2019 amounted to $31.0 million and $(0.4) million, respectively, and is included in the consolidated statements of operations and comprehensive income.
Pro Forma Information (Unaudited)
The following unaudited consolidated pro forma information gives effect to the transaction contemplated by the NTG Acquisition as if such transaction had occurred on January 1, 2018. The following pro forma information is presented for illustration purposes only and is not necessarily indicative of the results that would have been attained had the acquisition been completed on January 1, 2018, nor is it indicative of results that may occur in any future periods.
| Year Ended December 31, 2019 | Year Ended December 31, 2018 | |||||||
| (in millions) | ||||||||
| Revenues | $ | 265.2 | $ | 274.3 | ||||
| Net operating loss | $ | (5.8 | ) | $ | (21.6 | ) | ||
| Net loss | $ | (33.8 | ) | $ | (39.9 | ) | ||
| Loss per share: | ||||||||
| Basic and diluted | $ | (1.54 | ) | $ | (1.91 | ) | ||
| Weighted average shares outstanding: | ||||||||
| Basic and diluted | 21,892,964 | 20,859,407 | ||||||
| 3. | Accounts Receivable |
Accounts receivable consist of the following:
Schedule of Accounts Receivable
| December 31, 2019 | September 30, 2018 | December 31, 2022 | December 31, 2021 | |||||||||||||
| (in millions) | (in millions) | |||||||||||||||
| Trade receivables | $ | 24.5 | $ | 17.8 | $ | 44.6 | $ | 36.2 | ||||||||
| Less: long-term receivable recorded in other assets | (1.5 | ) | (2.2 | ) | (3.0 | ) | (3.5 | ) | ||||||||
| Finance lease receivables | 1.5 | — | 0.2 | 0.7 | ||||||||||||
| Receivables from affiliate | 0.4 | — | ||||||||||||||
| Other receivables | 0.2 | 0.1 | ||||||||||||||
| Allowance for doubtful accounts | (0.9 | ) | (1.4 | ) | (1.3 | ) | (1.7 | ) | ||||||||
| Total accounts receivable, net | $ | 24.2 | $ | 14.3 | $ | 40.5 | $ | 31.7 | ||||||||
Changes in the allowance for doubtful accounts are as follows:
Schedule of Changes in Allowance for Doubtful Accounts
| December 31, 2019 | September 30, 2018 | December 31, 2022 | December 31, 2021 | |||||||||||||
| (in millions) | (in millions) | |||||||||||||||
| Beginning balance | $ | (1.5 | ) | $ | (2.0 | ) | $ | (1.7 | ) | $ | (2.3 | ) | ||||
| Provision for doubtful accounts | (0.1 | ) | (1.1 | ) | ||||||||||||
| Additional provision for doubtful accounts | (0.2 | ) | (0.6 | ) | ||||||||||||
| Recoveries | — | 0.5 | — | 0.1 | ||||||||||||
| Write offs | 0.8 | 1.1 | 0.4 | 1.1 | ||||||||||||
| Foreign currency translation adjustments | (0.1 | ) | 0.1 | 0.2 | — | |||||||||||
| Ending balance | $ | (0.9 | ) | $ | (1.4 | ) | $ | (1.3 | ) | $ | (1.7 | ) | ||||
INSPIRED ENTERTAINMENT, INC. AND SUBSIDIARIES
NOTES TO CONSOLIDATED FINANCIAL STATEMENTS
AS OF DECEMBER 31, 2019 AND SEPTEMBER 30, 2018 AND
FOR THE PERIODS ENDED
DECEMBER 31, 2019, DECEMBER 31, 2018 AND SEPTEMBER 30, 2018
| 4. | Inventory |
Inventory consists of the following:
Schedule of Inventory
| December 31, 2019 | September 30, 2018 | December 31, 2022 | December 31, 2021 | |||||||||||||
| (in millions) | (in millions) | |||||||||||||||
| Component parts | $ | 12.7 | $ | 3.6 | $ | 21.4 | $ | 10.8 | ||||||||
| Work in progress | 2.1 | — | 3.6 | 1.6 | ||||||||||||
| Finished goods | 4.0 | 1.6 | 6.0 | 4.5 | ||||||||||||
| Total inventories | $ | 18.8 | $ | 5.2 | $ | 31.0 | $ | 16.9 | ||||||||
Component parts include parts for gaming terminals. Included in component partsinventory are reserves for excess and slow-moving inventory of $0.9$2.5 million and $0.5$2.0 million as of December 31, 20192022 and September 30, 2018,2021, respectively. Our finished goods inventory primarily consists of gaming terminals which are ready for sale.
| F-23 |
INSPIRED ENTERTAINMENT, INC. AND SUBSIDIARIES
NOTES TO CONSOLIDATED FINANCIAL STATEMENTS
AS OF DECEMBER 31, 2022 AND 2021, AND FOR THE YEARS ENDED
DECEMBER 31, 2022, 2021 AND 2020
| 5. | Prepaid Expenses and Other Assets |
Prepaid expenses and other assets consist of the following:
Schedule of Prepaid Expenses and Other Assets
| December 31, 2019 | September 30, 2018 | December 31, 2022 | December 31, 2021 | |||||||||||||
| (in millions) | (in millions) | |||||||||||||||
| Prepaid expenses and other assets | $ | 7.9 | $ | 5.0 | $ | 13.9 | $ | 12.3 | ||||||||
| Unbilled accounts receivable | 15.3 | 10.8 | 18.2 | 17.4 | ||||||||||||
| Corporate tax and other current taxes receivable | — | 0.3 | ||||||||||||||
| Total prepaid expenses and other assets | $ | 23.2 | $ | 15.8 | $ | 32.1 | $ | 30.0 | ||||||||
| 6. | Property and Equipment, net |
Schedule of Property and Equipment
| December 31, 2019 | September 30, 2018 | December 31, 2022 | December 31, 2021 | |||||||||||||
| (in millions) | (in millions) | |||||||||||||||
| Short-term leasehold property | $ | 0.9 | $ | 0.4 | $ | 3.1 | $ | 3.2 | ||||||||
| Video lottery terminals | 165.6 | 121.7 | ||||||||||||||
| Construction in progress | 0.8 | — | ||||||||||||||
| Server based gaming terminals | 167.9 | 178.8 | ||||||||||||||
| Computer equipment | 1.5 | 8.7 | 10.9 | 10.6 | ||||||||||||
| Plant and machinery | 13.3 | 2.5 | 3.9 | 4.1 | ||||||||||||
| 182.1 | 133.3 | |||||||||||||||
| Property and equipment, gross | 185.8 | 196.7 | ||||||||||||||
| Less: accumulated depreciation and amortization | (102.8 | ) | (87.6 | ) | (141.1 | ) | (145.8 | ) | ||||||||
| $ | 79.3 | $ | 45.7 | |||||||||||||
| Property and equipment, net | $ | 44.7 | $ | 50.9 | ||||||||||||
Depreciation and amortization expense amounted to $21.7$21.6 million, $4.8$25.9 million and $20.3$29.9 million for the yearyears ended December 31, 2019, the three months ended December 31, 20182022, 2021 and the year ended September 30, 2018,2020, respectively.
| 7. | Software Development Costs, net |
Software development costs, net consisted of the following:
Schedule of Software Development Costs
| December 31, 2022 | December 31, 2021 | |||||||
| (in millions) | ||||||||
| Software development costs | $ | 161.4 | $ | 160.9 | ||||
| Less: accumulated amortization | (125.6 | ) | (125.3 | ) | ||||
| Software development Costs, net | $ | 35.8 | $ | 35.6 | ||||
| December 31, 2019 | September 30, 2018 | |||||||
| (in millions) | ||||||||
| Software development costs | $ | 129.9 | $ | 100.9 | ||||
| Less: accumulated amortization | (83.0 | ) | (60.9 | ) | ||||
| $ | 46.9 | $ | 40.0 | |||||
INSPIRED ENTERTAINMENT, INC. AND SUBSIDIARIES
NOTES TO CONSOLIDATED FINANCIAL STATEMENTS
AS OF DECEMBER 31, 2019 AND SEPTEMBER 30, 2018 AND
FOR THE PERIODS ENDED
DECEMBER 31, 2019, DECEMBER 31, 2018 AND SEPTEMBER 30, 2018
During the yearyears ended December 31, 2019, the three months ended December 31, 20182022 and the year ended September 30, 2018,2021, the Company capitalized $23.5 million, $3.6$18.5 million and $17.7$13.6 million of software development costs, respectively. Amounts in the above table include $0.9$3.4 million and $1.3$2.2 million of internal use software atas of December 31, 20192022 and September 30, 2018,2021, respectively.
The total amount of software costs amortized was $16.4$14.0 million, $3.9$20.0 million and $18.1$20.0 million for the yearyears ended December 31, 2019, the three months ended December 31, 20182022, 2021, and the year ended September 30, 2018,2020, respectively. Software costs written down to net realizable value amounted to $0.4$0.4 million, $0.0$0.2 million and $5.4$0.0 million for the yearyears ended December 31, 2019, the three months ended December 31, 20182022, 2021 and the year ended September 30, 2018,2020, respectively. The $5.4 million for the year ended September 30, 2018 includes $0.5 million recorded as amortization expense incurred during the normal course of business and $4.9 million recorded as a one-time impairment expense. The weighted average amortization period was 3.03.4 years, 3.13.3 years and 3.13.2 years for the yearyears ended December 31, 2019, the three months ended December2022, 2021 and 2020, respectively.
| F-24 |
INSPIRED ENTERTAINMENT, INC. AND SUBSIDIARIES
NOTES TO CONSOLIDATED FINANCIAL STATEMENTS
AS OF DECEMBER 31, 2018 and the year ended September 30, 2018, respectively.2022 AND 2021, AND FOR THE YEARS ENDED
DECEMBER 31, 2022, 2021 AND 2020
The estimated software amortization expense for the years ending December 31 are as follows:
Schedule of Estimated Software Amortization Expense
| Year ending December 31, (in millions) | ||||
| 2023 | $ | 14.1 | ||
| 2024 | 10.8 | |||
| 2025 | 6.5 | |||
| 2026 | 3.5 | |||
| 2027 | 0.8 | |||
| Thereafter | 0.1 | |||
| Total | $ | 35.8 | ||
| Year ending December 31, (in millions) | ||||
| 2020 | $ | 19.2 | ||
| 2021 | 14.4 | |||
| 2022 | 7.6 | |||
| 2023 | 3.5 | |||
| 2024 | 2.0 | |||
| Thereafter | 0.2 | |||
| Total | $ | 46.9 | ||
| 8. | Intangible Assets and Goodwill |
The following tables present certain information regarding our intangible assets. Amortizable intangible assets are being amortized on a straight-line basis over their estimated useful lives of ten to thirteen years with no estimated residual values, which materially approximates the expected pattern of use.
Schedule of Intangible Assets
| December 31, 2019 | September 30, 2018 | December 31, 2022 | December 31, 2021 | |||||||||||||
| (in millions) | (in millions) | |||||||||||||||
| Trademarks | $ | 21.6 | $ | 17.6 | $ | 19.8 | $ | 22.1 | ||||||||
| Customer relationships | 20.1 | 15.1 | 28.5 | 32.7 | ||||||||||||
| 41.7 | 32.7 | |||||||||||||||
| Intangible assets, gross | 48.3 | 54.8 | ||||||||||||||
| Less: accumulated amortization | (31.8 | ) | (27.0 | ) | (33.6 | ) | (35.9 | ) | ||||||||
| $ | 9.9 | $ | 5.7 | |||||||||||||
| Intangible assets, net | $ | 14.7 | $ | 18.9 | ||||||||||||
Aggregate intangible asset amortization expense amounted to $3.5$1.6 million, $0.8$0.9 million and $3.4$2.4 million for the yearyears ended December 31, 2019, the three months ended December 31, 20182022, 2021 and the year ended September 30, 2018,2020, respectively.
The estimated intangible asset amortization expense for the years ending December 31 are as follows:
Schedule of Estimated Intangible Asset Amortization Expense
| Year ending December 31, (in millions) | ||||
| 2023 | $ | 1.6 | ||
| 2024 | 1.6 | |||
| 2025 | 1.6 | |||
| 2026 | 1.6 | |||
| 2027 | 1.5 | |||
| Thereafter | 6.8 | |||
| Total | $ | 14.7 | ||
Goodwill
Goodwill is summarized as follows:
Schedule of Goodwill
| December 31, 2022 | December 31, 2021 | |||||||
| (in millions) | ||||||||
| Balance at beginning of period | $ | 82.7 | $ | 83.7 | ||||
| Foreign currency translation adjustments | (8.8 | ) | (1.0 | ) | ||||
| Ending balance | $ | 73.9 | $ | 82.7 | ||||
| F-25 |
| Year ending December 31, (in millions) | ||||
| 2020 | $ | 2.4 | ||
| 2021 | 0.8 | |||
| 2022 | 0.8 | |||
| 2023 | 0.8 | |||
| 2024 | 0.8 | |||
| Thereafter | 4.3 | |||
| Total | $ | 9.9 | ||
INSPIRED ENTERTAINMENT, INC. AND SUBSIDIARIES
NOTES TO CONSOLIDATED FINANCIAL STATEMENTS
AS OF DECEMBER 31, 20192022 AND SEPTEMBER 30, 20182021, AND
FOR THE PERIODSYEARS ENDED
DECEMBER 31, 2019, DECEMBER 31, 20182022, 2021 AND SEPTEMBER 30, 20182020
Goodwill
Goodwill is summarized as follows:
| December 31, 2019 | September 30, 2018 | |||||||
| (in millions) | ||||||||
| Balance at beginning of period | $ | 44.9 | $ | 47.1 | ||||
| Foreign currency translation adjustments | 3.9 | (1.3 | ) | |||||
| Acquisition of NTG | 32.1 | — | ||||||
| Ending balance | $ | 80.9 | $ | 45.8 | ||||
| 9. | Other Assets |
Other assets consist of the following:
Schedule of Other Assets
| December 31, 2019 | September 30, 2018 | |||||||||||||||
| (in millions) | December 31, 2022 | December 31, 2021 | ||||||||||||||
| (in millions) | ||||||||||||||||
| Long term finance lease receivable | 1.0 | — | $ | 0.2 | $ | 0.3 | ||||||||||
| Pension asset | — | 3.0 | ||||||||||||||
| Long term receivables | 1.5 | 2.2 | 3.0 | 3.5 | ||||||||||||
| Pension surplus | — | 5.3 | ||||||||||||||
| Long term prepaid expenses and other assets | 2.6 | 4.6 | 0.2 | 0.3 | ||||||||||||
| $ | 5.1 | $ | 12.1 | |||||||||||||
| Total | $ | 3.4 | $ | 7.1 | ||||||||||||
| 10. | Accrued Expenses |
Accrued expenses consist of the following:
Schedule of Accrued Expenses
| December 31, 2019 | September 30, 2018 | |||||||
| (in millions) | ||||||||
| Direct costs of sales | $ | 5.5 | $ | 4.4 | ||||
| Payroll and related costs | 4.4 | 3.1 | ||||||
| Accrued corporate cost expenses | 1.6 | 3.2 | ||||||
| Interest payable - cash | 5.5 | 0.1 | ||||||
| Asset retirement obligations | 2.0 | 0.5 | ||||||
| Acquisition consideration | 2.5 | — | ||||||
| Contract termination costs | 0.1 | — | ||||||
| Other creditors | 9.6 | 3.0 | ||||||
| $ | 31.2 | $ | 14.3 | |||||
| December 31, 2022 | December 31, 2021 | |||||||
| (in millions) | ||||||||
| Payroll and related costs | $ | 10.2 | $ | 8.0 | ||||
| Cost of sales including inventory | 9.1 | 12.4 | ||||||
| Non-current asset costs | 2.2 | 0.7 | ||||||
| Interest payable - cash | 1.8 | 2.0 | ||||||
| Selling, general and administrative costs | 1.7 | 2.5 | ||||||
| Tax and professional fees | 1.7 | 2.8 | ||||||
| Asset retirement obligations and other property related costs | 1.5 | 3.5 | ||||||
| Other creditors | 0.3 | 0.7 | ||||||
| Accrued expenses, net | $ | 28.5 | $ | 32.6 | ||||
INSPIRED ENTERTAINMENT, INC. AND SUBSIDIARIES
NOTES TO CONSOLIDATED FINANCIAL STATEMENTS
AS OF DECEMBERThe analysis of the prior year expenses has been recharacterized to ensure consistency with the current year categorization. The recharacterization has no impact on the previously reported total accrued expenses as of December 31, 2019 AND SEPTEMBER 30, 2018 AND2021.
FOR THE PERIODS ENDED
DECEMBER 31, 2019, DECEMBER 31, 2018 AND SEPTEMBER 30, 2018
| 11. | Contract Liabilities and Other Disclosures |
The following table summarizes the changes in contract liabilities:related balances:
Schedule of Contract Related Balances
| Deferred Income | ||||
| (in millions) | ||||
| Balance at October 1, 2017 | $ | (27.3 | ) | |
| Revenue recognized | 10.6 | |||
| Revenue deferred | (16.9 | ) | ||
| Foreign currency translation adjustments | 0.5 | |||
| Balance at September 30, 2018 | $ | (33.1 | ) | |
| Revenue recognized | 3.0 | |||
| Revenue deferred | (2.4 | ) | ||
| Foreign currency translation adjustments | 0.5 | |||
| Balance at December 31, 2018 | $ | (32.0 | ) | |
| Revenue recognized | 13.5 | |||
| Revenue deferred | (11.0 | ) | ||
| Acquisitions | (0.4 | ) | ||
| Foreign currency translation adjustments | 2.1 | |||
| Balance at December 31, 2019 | $ | (27.8 | ) | |
| Accounts Receivable | Unbilled Accounts Receivable | Deferred Income | Customer Prepayments and Deposits | |||||||||||||
| (in millions) | ||||||||||||||||
| At December 31, 2022 | $ | 44.6 | $ | 18.2 | $ | (8.5 | ) | $ | (2.4 | ) | ||||||
| At December 31, 2021 | $ | 36.2 | $ | 17.4 | $ | (14.5 | ) | $ | (3.9 | ) | ||||||
| At December 31, 2020 | $ | 30.4 | $ | 8.2 | $ | (22.9 | ) | $ | (1.6 | ) | ||||||
Revenue recognized that was included in the deferred income balance at the beginning of the period amounted to $9.6$7.9 million, $2.7$10.9 million and $7.7$10.3 million for the yearyears ended December 31, 2019, the three months ended December2022, 2021 and 2020, respectively.
| F-26 |
INSPIRED ENTERTAINMENT, INC. AND SUBSIDIARIES
NOTES TO CONSOLIDATED FINANCIAL STATEMENTS
AS OF DECEMBER 31, 2018 and the year ended September 30, 2018, respectively.2022 AND 2021, AND FOR THE YEARS ENDED
DECEMBER 31, 2022, 2021 AND 2020
The following table summarizes contract related balances (other than deferred income disclosed above):
| Accounts Receivable | Unbilled Accounts Receivable | Customer Prepayments and Deposits | ||||||||||
| (in millions) | ||||||||||||
| At September 30, 2018 | $ | 17.8 | $ | 10.8 | $ | (3.7 | ) | |||||
| At December 31, 2019 | $ | 24.5 | $ | 15.3 | $ | (1.9 | ) | |||||
| 12. | Other Liabilities |
Other liabilities consist of the following:
Schedule of Other Liabilities
| December 31, 2022 | December 31, 2021 | |||||||
| (in millions) | ||||||||
| Customer prepayments and deposits | $ | 2.4 | $ | 3.9 | ||||
| Foreign exchange contract liabilities | 0.2 | — | ||||||
| Total other liabilities, current | 2.6 | 3.9 | ||||||
| Asset retirement obligations | 1.1 | 1.8 | ||||||
| Other creditors | 0.8 | 1.3 | ||||||
| Pension liability | 2.1 | — | ||||||
| Total other liabilities, long-term | 4.0 | 3.1 | ||||||
| Total other liabilities | $ | 6.6 | $ | 7.0 | ||||
| December 31, 2019 | September 30, 2018 | |||||||
| (in millions) | ||||||||
| Customer prepayments and deposits | $ | 1.9 | $ | 3.7 | ||||
| Fair value of hedging instrument | — | 0.2 | ||||||
| Total other liabilities, current | 1.9 | 3.9 | ||||||
| Other payables, net of current portion | — | 0.5 | ||||||
| Asset retirement obligations | 2.1 | 0.4 | ||||||
| Pension liability | 3.1 | — | ||||||
| Senior debt exit premium | — | 4.2 | ||||||
| Total other liabilities, long-term | 5.2 | 5.1 | ||||||
| $ | 7.1 | $ | 9.0 | |||||
| 13. | Long Term and Other Debt |
Senior Secured Notes
On May 20, 2021, Inspired Entertainment (Financing) PLC, a wholly owned subsidiary of the Company, issued £235.0 million ($282.9 million, as translated at December 31, 2022) aggregate principal amount of its 7.875% senior secured notes due 2026 (the “Senior Secured Notes”). The Senior Secured Notes bear interest at a rate of 7.875% per annum and mature on June 1, 2026. Interest is payable on the Senior Secured Notes on June 1 and December 1 of each year, commencing on December 1, 2021
The Senior Secured Notes and related guarantees were issued under an indenture (the “Indenture”), among Inspired Entertainment (Financing) PLC, as issuer, the Company and certain English and U.S. subsidiaries of the Company, as guarantors (collectively and together with the Company, the “Guarantors”), GLAS Trustees Limited, as trustee, GLAS Trust Corporation Limited, as security agent and GLAS Trust Company LLC as paying agent, transfer agent and registrar. The terms of the Senior Secured Notes and related guarantees are governed by the Indenture.
The Senior Secured Notes are fully and unconditionally guaranteed on a senior secured first-priority basis by the Guarantors on a joint and several basis. The Senior Secured Notes and related guarantees are secured, subject to certain permitted collateral liens, on a first-priority basis by substantially all assets of the Guarantors and all claims of the Inspired Entertainment (Financing) PLC under an intercompany loan to Gaming Acquisitions Limited, a private limited liability company incorporated under the laws of England and Wales and an indirect wholly-owned subsidiary of the Company (“GAL”), of the proceeds of the offering of the Senior Secured Notes.
| F-27 |
INSPIRED ENTERTAINMENT, INC. AND SUBSIDIARIES
NOTES TO CONSOLIDATED FINANCIAL STATEMENTS
AS OF DECEMBER 31, 20192022 AND SEPTEMBER 30, 20182021, AND
FOR THE PERIODSYEARS ENDED
DECEMBER 31, 2019, DECEMBER 31, 20182022, 2021 AND SEPTEMBER 30, 20182020
The Indenture contains incurrence covenants that limit the ability of the Company and the Company’s restricted subsidiaries to, among other things, (i) incur or guarantee additional debt and issue certain preferred stock of restricted subsidiaries; (ii) create or incur certain liens; (iii) make restricted payments, including dividends or distributions to the Company’s stockholders or repurchase the Company’s stock; (iv) prepay or redeem subordinated debt; (v) make certain investments, including participating joint ventures; (vi) create encumbrances or restrictions on the payment of dividends or other distributions by restricted subsidiaries; (vii) sell assets, or consolidate or merge with or into other companies; (viii) sell or transfer all or substantially all of the Company’s assets or those of the Company’s subsidiaries on a consolidated basis; (ix) engage in certain transactions with affiliates; and (x) create unrestricted subsidiaries. Certain of these covenants will be suspended if and for so long as the Senior Secured Notes have investment grade ratings from any two of Moody’s Investors Service, Inc., Standard & Poor’s Investors Ratings Services and Fitch Ratings, Inc. These covenants are subject to exceptions and qualifications as set forth in the Indenture.
Inspired Entertainment (Financing) PLC may redeem the Senior Secured Notes, in whole or in part, at any time and from time to time prior to June 1, 2023, at a redemption price equal to 100% of the principal amount thereof, plus a “make-whole” premium as set forth in the Indenture and form of the Senior Secured Notes, plus accrued and unpaid interest, if any, to, but excluding, the redemption date. Inspired Entertainment (Financing) PLC may also redeem the Senior Secured Notes, in whole or in part, at any time and from time to time on or after June 1, 2023, at the redemption prices set forth in the Indenture and form of the Senior Secured Notes, plus accrued and unpaid interest, if any, to, but excluding, the redemption date. In addition, at any time prior to June 1, 2023, Inspired Entertainment (Financing) PLC may redeem up to 40% of the original aggregate principal amount of the Senior Secured Notes with the net cash proceeds of one or more equity offerings, as described in the Indenture, at a redemption price equal to 107.875% of the principal amount thereof, plus accrued and unpaid interest, if any, to, but excluding, the redemption date. At any time prior to June 1, 2023, Inspired Entertainment (Financing) PLC may redeem up to 10% of the aggregate principal amount of the Senior Secured Notes within each 12-month period at a redemption price equal to 103% of the aggregate principal amount of the Senior Secured Notes, plus accrued and unpaid interest, if any, to, but excluding, the redemption date.
Senior Facilities AgreementRevolving Credit Facility
In connection with the NTG Acquisition,issuance of the Senior Secured Notes on September 27, 2019,May 20, 2021, the Company together withand certain of our direct and indirect wholly-owned subsidiaries, entered into a Super Senior Revolving Credit Facility Agreement (the “RCF Agreement”) with Global Loan Agency Services Limited, as agent, Barclays Bank plc (“Barclays”) and Macquarie Corporate Holdings Pty Limited (UK Branch) (“Macquarie UK” and together with Barclays, the “Arrangers”) as arrangers and each lender party thereto (the “Lenders”), pursuant to which the Lenders agreed to provide, subject to certain conditions, a secured revolving facility loan in an original principal amount of £20 million ($24.1 million) under which certain of our subsidiaries are able to draw funds (the “RCF Loan”). The RCF Loans will terminate on November 20, 2025.
The funding of the RCF Loan is subject to customary conditions set forth in the RCF Agreement. The undrawn commitment of each Lender under the RCF Loan will automatically terminate, unless previously terminated by the Company, on October 20, 2025.
The RCF Loans will bear interest at a rate per annum equal to (i) SONIA for borrowings in sterling, (ii) LIBOR (or, on and after December 31, 2021, SOFR) for borrowings in dollars, or (iii) EURIBOR for borrowings in Euro, as applicable, plus, in each case, a margin (based on the Company’s consolidated senior secured net leverage ratio) ranging from 4.25% to 4.75% per annum. With respect to the RCF Loan, a commitment fee of 30% of the then applicable margin is payable at any time on any unutilized portion of the RCF Loan.
The RCF Agreement contains various covenants (which include restrictions regarding the incurrence of liens, the incurrence of indebtedness by the Company’s subsidiaries and fundamental changes, subject in each case to certain exceptions), representations, warranties, limitations and events of default (which include non-payment, breach of obligations under the financing documents, cross-default, insolvency and litigation) customary for similar facilities for similarly rated borrowers and subject to customary carve-outs and grace periods. Following the occurrence of an event of default which has not been waived or remedied, the Lenders who represent more than 66.67% of total commitments under the RCF may, subject to the terms of an intercreditor agreement (which governs the relationship between the Lenders and the holders of the Senior Secured Notes), instruct the agent to (i) accelerate the RCF Loans, (ii) instruct the security agent to enforce the transaction security and/or (iii) exercise any other remedies available to the Lenders.
| F-28 |
INSPIRED ENTERTAINMENT, INC. AND SUBSIDIARIES
NOTES TO CONSOLIDATED FINANCIAL STATEMENTS
AS OF DECEMBER 31, 2022 AND 2021, AND FOR THE YEARS ENDED
DECEMBER 31, 2022, 2021 AND 2020
The RCF Agreement requires that the Company maintain a maximum consolidated senior secured net leverage ratio of 6.25x on the test date for the relevant period ending June 30, 2021, stepping down to 6.0x on March 31, 2022, 5.75x on March 31, 2023 and 5.50x from March 31, 2024 and thereafter (the “RCF Financial Covenant”). The RCF Financial Covenant is calculated as the ratio of consolidated senior secured net debt to consolidated pro forma EBITDA (defined as net income (loss) excluding depreciation and amortization, interest expense, interest income and income tax expense) for the 12-month period preceding the relevant quarterly testing date and is tested quarterly on a rolling basis, subject to the Initial Facility (as defined in the RCF Agreement) being drawn on the relevant test date. The RCF Agreement does not include a minimum interest coverage ratio or other financial covenants.
The outstanding principal amount of each advance under the RCF Loans is payable on the last day of the interest period relating to such advance, unless such advance is rolled over on a cashless basis in accordance with customary rollover provisions contained in the RCF Agreement, with a final repayment on November 20, 2025.
Termination of Prior Financing
The Company’s previous debt consisted of two tranches of senior secured term loans in a principal amount of £145.8 million ($175.5 million) with a cash interest rate of 8.25% plus 3-month LIBOR and €93.1 million ($99.4 million) with a cash interest rate of 7.75% plus 3-month EURIBOR, respectively and a secured revolving facility loan in a principal amount of £20.0 million ($24.1 million) with a cash interest rate on any utilization of 6.50% plus 3-month LIBOR (the “Prior Financing”)..
In connection with the issuance of the Senior Secured Notes and the entry into the RCF Agreement, on May 20, 2021, the Prior Financing was repaid in full and the senior facilities agreement (dated September 27, 2019, as amended and restated on June 25, 2020, (the “Prior SFA) see below) relating to the Prior Financing was terminated. No prepayment premium applied to the repayment (although customary break cost provisions applied). Debt fees of $14.4 million were expensed to the Consolidated Statements of Operations and Consolidated Income (Loss) within Interest Expense as part of the repayment. In addition, on May 19, 2021, we terminated the interest rate swaps relating to the Prior Financing and applicable termination fees were settled on May 20, 2021 (see Note 14).
Senior Facilities Agreement
The Company’s Prior SFA (which was with Lucid Agency Services Limited, as agent, Nomura International plc and Macquarie Corporate Holdings Pty Limited (UK Branch) as arrangers and/or bookrunnersbookrunners) was entered into in connection with the Company’s acquisition of the Gaming Technology Group of Novomatic UK Ltd on October 1, 2019, and, each lender party thereto (the “Lenders”), pursuant to which the Lenders agreed to provide,provided for, subject to certain conditions, two tranches of senior secured term loans, (the “Term Loans”), in an original principal amount of £140.0£140.0 million ($172.5168.6 million) and €90.0€90.0 million ($98.196.1 million), respectively and a secured revolving facility loan in an original principal amount of £20.0£20.0 million ($24.624.1 million). OnThe term loans, which were funded on October 1, 2019, the debt was funded and proceeds from the Term Loans were used to, among other things, pay the purchase price of the NTG Acquisition and to refinance existing indebtedness of the Company under the Note Purchase Agreement andCompany’s prior Facility described below.indebtedness.
The new facilities are subject to covenant testing. These tests comprise a leverage ratio (consolidated total net debt/consolidated pro forma EBITDA) and a capital expenditure level. The leverage ratio is tested quarterly with the first test date being June 30, 2020. The capital expenditure level is tested annually with the first test date being December 31, 2019. There is also an annual excess cash flow calculation required, which, if positive and over certain de minimis limits, could require early prepayment of part of the facilities.
The Term Loans have a 5-year duration and are repayable in full on October 1, 2024. The £140.0term loan for £140.0 million ($184.9168.6 million) loan carriesinitially carried a cash interest rate of 7.25% plus 3-month LIBOR, and the €90.0term loan for €90.0 million ($101.196.1 million) loan carriesinitially carried a cash interest rate of 6.75% plus a 3-month EUROLIBOR.EURIBOR. The £20.0£20.0 million ($26.424.1 million) revolving credit facility is available until September 1, 2024 and carriesinitially carried a cash interest rate on any utilization at 5.50% plus 3-month LIBOR, with any unutilized amount initially carrying a cash interest cost at 30% of the applicable margin on the revolving credit facility loan.
| F-29 |
Termination of Note Purchase Agreement
INSPIRED ENTERTAINMENT, INC. AND SUBSIDIARIES
NOTES TO CONSOLIDATED FINANCIAL STATEMENTS
AS OF DECEMBER 31, 2022 AND 2021, AND FOR THE YEARS ENDED
DECEMBER 31, 2022, 2021 AND 2020
The provisions from the June 2020 amendments to the Prior SFA included, among other things, (i) capitalizing certain interest payments that fell due on April 1, 2020, (ii) resetting the applicable leverage and Prior Credit Facility
The Company’s previous debt included $140.0 million of senior notes issuedcapital expenditure financial covenants, removing certain applicable rating requirements, (iii) allowing the Company and its subsidiaries to incur additional indebtedness under the UK Coronavirus Large Business Interruption Loan Scheme under a Note Purchase Agreement and Guaranty dated August 13, 2018 (the “NPA”) with a 5-year duration and a cash interest ratestand-alone facility, which may rank pari passu or junior to the facilities under the Prior SFA, in an amount not exceeding £ million ($ million), (iv) removing certain applicable rating requirements, (v) limiting the ability of 9% plus 3-month LIBOR borrowings and a revolving credit facility agreement dated August 13, 2018 (the ” Prior Facility”) with a 3-year duration and a cash interest rate on any utilization at 4% plus 3-month LIBOR, with any unutilized amount carrying a 1.4% cash interest cost. In addition, the Company also had a 3-year, fixed-rate, cross-currency swapand its subsidiaries to incur additional indebtedness, including by reducing the amount of general indebtedness the Company and its subsidiaries are permitted to incur and removing the ability to incur senior secured, second lien and unsecured indebtedness in an amount not exceeding the aggregate of
The terminationconsolidated total net leverage financial covenant summarized further below, plus (B) an amount equal to the greater of £16.0 million ($19.2 million) and 25% of the Company’s prior existing indebtedness carried a prepayment premium of 3.00%consolidated pro forma EBITDA of the Company and its subsidiaries for the relevant period (as defined, but disregarding, for the purposes of calculating the usage of such cap, any financial indebtedness applied to refinancing other financial indebtedness, together with any related interest, fees, costs and expenses), (vi) increasing the margin applicable to the Facilities (as defined) by 1%, and adding an additional payment-in-kind margin of payable on any principal amounts outstanding under Facility B (as defined in the Prior SFA) after September 24, 2021 (the “Relevant Date”), (vii) adding an exit fee payable by the Company with respect to any repayment or prepayment of Facility B after the Relevant Date at the time of such repayment or prepayment in an amount equal to of the principal amount of Facility B being repaid or prepaid, (viii) removing any ability to carry forward or $4.2 million, which is includedcarry back any unused allowance under the applicable capital expenditure financial covenant and (ix) granting certain additional information rights to the lenders under the Prior SFA, including the provision of a budget, and certain board observation rights until December 31, 2022. All other material terms of the SFA remained unchanged in other long-term liabilitiesall material respects.
In consideration for the amendments listed above, the Company agreed to pay the lenders an amendment fee equal to 1% of the Total Commitments (as defined in the comparative period in the accompanying consolidated balance sheet. No prepayment premium appliedPrior SFA).The amendment fee was payable to the Company’s previous revolving facility Agreement. In addition, on October 1, 2019,lenders pro rata to their commitments under the Company terminatedPrior SFA.
The modification to the 3-year, fixed-rate, cross-currency swapPrior SFA was not considered to be substantial in accordance with Topic 470-50 and wrote off previouslywas therefore not treated as a debt extinguishment. The amendment fees, amounting to $3.1 million, were associated with the modified debt instrument and were to be amortized along with the existing unamortized debt issuance costs amountingcosts. Fees payable to $7.3third parties were expensed as incurred, resulting in $1.0 million charged to interest expense for the year ended December 31, 2020.
| F-30 |
INSPIRED ENTERTAINMENT, INC. AND SUBSIDIARIES
NOTES TO CONSOLIDATED FINANCIAL STATEMENTS
AS OF DECEMBER 31, 2022 AND 2021, AND FOR THE YEARS ENDED
DECEMBER 31, 2022, 2021 AND 2020
Outstanding Debt and CapitalFinance Leases
The following reflects outstanding debt and capitalfinance leases as of the dates indicated below:
Schedule of Outstanding Debt and Finance Leases
| Principal | Unamortized deferred financing charge | Book value, December 31, 2019 | Principal | Unamortized deferred financing charge | Book value, December 31, 2022 | |||||||||||||||||||
| (in millions) | (in millions) | |||||||||||||||||||||||
| Senior bank debt | $ | 288.6 | $ | (15.5 | ) | $ | 273.1 | $ | 282.9 | $ | (5.3 | ) | $ | 277.6 | ||||||||||
| Finance lease liabilities | 0.1 | — | 0.1 | 2.2 | — | 2.2 | ||||||||||||||||||
| Total long-term debt outstanding | 288.7 | (15.5 | ) | 273.2 | 285.1 | (5.3 | ) | 279.8 | ||||||||||||||||
| Less: current portion of long-term debt | (2.7 | ) | — | (2.7 | ) | (1.0 | ) | — | (1.0 | ) | ||||||||||||||
| Long-term debt, excluding current portion | $ | 286.0 | $ | (15.5 | ) | $ | 270.5 | $ | 284.1 | $ | (5.3 | ) | $ | 278.8 | ||||||||||
| Principal | Unamortized deferred financing charge | Book value, December 31, 2021 | ||||||||||
| (in millions) | ||||||||||||
| Senior bank debt | $ | 316.7 | $ | (7.7 | ) | $ | 309.0 | |||||
| Finance lease liabilities | 2.8 | — | 2.8 | |||||||||
| Total long-term debt outstanding | 319.5 | (7.7 | ) | $ | 311.8 | |||||||
| Less: current portion of long-term debt | (0.9 | ) | — | (0.9 | ) | |||||||
| Long-term debt, excluding current portion | $ | 318.6 | $ | (7.7 | ) | $ | 310.9 | |||||
INSPIRED ENTERTAINMENT, INC. AND SUBSIDIARIES
NOTES TO CONSOLIDATED FINANCIAL STATEMENTS
AS OF DECEMBER 31, 2019 AND SEPTEMBER 30, 2018 AND
FOR THE PERIODS ENDED
DECEMBER 31, 2019, DECEMBER 31, 2018 AND SEPTEMBER 30, 2018
| Principal | Unamortized deferred financing charge | Book value, September 30, 2018 | ||||||||||
| (in millions) | ||||||||||||
| Senior bank debt | $ | 140.0 | $ | (8.8 | ) | $ | 131.2 | |||||
| Finance lease liabilities | 0.6 | — | 0.6 | |||||||||
| Total long-term debt outstanding | 140.6 | (8.8 | ) | $ | 131.8 | |||||||
| Less: current portion of long-term debt | (0.5 | ) | — | (0.5 | ) | |||||||
| Long-term debt, excluding current portion | $ | 140.1 | $ | (8.8 | ) | $ | 131.3 | |||||
The Company is in compliance with all relevant financial covenants and the long-term debt portion is correctly classified as such in line with the underlying agreements.
Long term debt as of December 31, 20192022 matures as follows:
Schedule of Maturities of Long-term Debt
| Fiscal period: | Senior bank debt | Capital leases and hire purchase contract | Total | Senior bank debt | Finance leases | Total | ||||||||||||||||||
| (in millions) | (in millions) | |||||||||||||||||||||||
| 2020 | $ | 2.6 | $ | 0.1 | $ | 2.7 | ||||||||||||||||||
| 2021 | — | — | — | |||||||||||||||||||||
| 2022 | — | — | — | |||||||||||||||||||||
| 2023 | — | — | — | $ | — | $ | 1.0 | $ | 1.0 | |||||||||||||||
| 2024 | 286.0 | — | 286.0 | — | 0.7 | 0.7 | ||||||||||||||||||
| 2025 | — | 0.5 | 0.5 | |||||||||||||||||||||
| 2026 | 282.9 | — | 282.9 | |||||||||||||||||||||
| 2027 | — | — | — | |||||||||||||||||||||
| Total | $ | 288.6 | $ | 0.1 | $ | 288.7 | $ | 282.9 | $ | 2.2 | $ | 285.1 | ||||||||||||
| 14. | Derivatives and Hedging Activities |
TheOn January 15, 2020, the Company was partyentered into two interest rate swaps with UBS AG designed to protect the Company against adverse fluctuations in interest rates by reducing its exposure to variability in cash flows on a 3-year, fixed-rate, cross-currency swap with Nomura Global Financial Products Inc. which swapped the principal and interest payments that would be payable in USD under the NPA to Euros (“EUR”), in part, and GBP, in part. Specifically, with respect to the principal payments 1/3portion of the payments would be swapped from USD to EUR and 2/3previous floating rate debt facilities. The swaps fixed the variable interest rate of the payments from USD to GBP. Additionally, with respect to thedebt facilities and provided protection over potential interest payments 1/3 would be swapped from USD to GBP and 2/3 from USD to EUR. The swap provided forrate increases by providing a foreign exchangefixed rate of $1.13935 USD per €1 EURinterest payment in return. The interest rate swaps were for £95.0 million ($114.4 million) at a fixed rate of 0.9255% based on the 6-month LIBOR rate and $1.27565 USD per £1 GBP.for €60.0 million ($64.1 million) at a fixed rate of 0.102% based on the 6-month EURIBOR rate.
In connection with the issuance of the Senior Secured Notes and the entry into the Senior FacilitiesRCF Agreement, on October 1, 2019,May 19, 2021, the Company terminated the 3-year, fixed-rate, cross-currency swapits two interest rate swaps. The termination fees were settled on May 20, 2021, for £1.3 million ($1.9 million) and received a settlement of $1.5 million.€0.1 million ($0.2 million), respectively.
| F-31 |
INSPIRED ENTERTAINMENT, INC. AND SUBSIDIARIES
NOTES TO CONSOLIDATED FINANCIAL STATEMENTS
AS OF DECEMBER 31, 2022 AND 2021, AND FOR THE YEARS ENDED
DECEMBER 31, 2022, 2021 AND 2020
Hedges of Multiple Risks
The Company had variable-rate borrowings denominatedCompany’s objectives in currencies other than its functional currency. As a result, the Company was exposed to fluctuations in both the underlying variableusing interest rate and the foreign currency of the borrowing against its functional currency, GBP. The Company used derivatives including cross-currencywere to add stability to interest rate swaps,and to manage its exposure to fluctuations ininterest rate movements. To accomplish this objective, the variable borrowing rate and the GBP-USD exchange rate. Cross-currencyCompany primarily used interest rate swaps as part of its interest rate risk management strategy. Interest rate swaps designated as cash flow hedges involve exchanging fixed rate interestthe receipt of variable amounts from a counterparty in exchange for the Company making fixed-rate payments for floating rate interest receipts bothover the life of which will occur at the GBP-USD forwardagreements without exchange rates in effect upon entering intoof the instrument. The Companyunderlying notional amount.
For derivatives designated these derivativesand that qualify as cash flow hedges of both interest rate and foreign exchange risks.
For derivatives designated and that qualified as cash flow hedges of both interest rate risk and foreign exchange risk, the gain or loss on the derivative wasis recorded in Accumulated Other Comprehensive Income and subsequently reclassified into interest expense in the periodssame period(s) during which the hedged transaction affected earnings withinaffects earnings. Amounts reported in Accumulated Other Comprehensive Income related to derivatives will be reclassified to interest expense as interest payments are made on the same income statement line itemCompany’s variable-rate debt. During the next twelve months, the Company estimates that an additional $0.3 million will be reclassified as the earnings effectan increase to interest expense.
As of the hedged transaction.
INSPIRED ENTERTAINMENT, INC. AND SUBSIDIARIES
NOTES TO CONSOLIDATED FINANCIAL STATEMENTS
AS OF DECEMBERDecember 31, 2019 AND SEPTEMBER 30, 2018 AND
FOR THE PERIODS ENDED
DECEMBER 31, 2019, DECEMBER 31, 2018 AND SEPTEMBER 30, 2018
The2022 and 2021, the Company did not have any derivatives asderivatives. Losses reclassified from accumulated other comprehensive income into interest expense in the consolidated statements of operations and income (loss) for the year ended December 31, 2022 amounted to $0.7 million.
As of December 31, 2019. As of September 30, 2018,2020, the Company had the following outstanding interest rate derivatives that were designated as cash flow hedges that were used to hedge bothof interest rate risk and foreign exchange risk:
Schedule of Outstanding Derivatives Designated as Cash Flow Hedges
| Interest Rate Derivative | Number of Instruments | Notional | ||
| Interest rate swaps | 2 | £95.0 million ($114.4 million) at a fixed rate of 0.9255% based on the 6-month LIBOR rate and €60.0 million ($64.1 million) at a fixed rate of 0.102% based on the 6 month EURIBOR rate |
| F-32 |
| Foreign Currency Derivative | Number of Instruments | Pay Fixed Notional | Receive Floating Notional | |||||||
| (in millions) | ||||||||||
| Cross currency interest rate swaps | 1 | GBP | 36.6 | USD | 46.7 | |||||
Non-designated Hedges
Derivatives not designated as hedges were not speculative and were used to manage the Company’s exposure to interest rate movements and other identified risks but did not meet the strict hedge accounting requirements. Changes in the fair value of derivatives not designated in hedging relationships were recorded directly in earnings.
As of September 30, 2018, the Company had the following outstanding derivatives that were not designated as hedges in qualifying hedging relationships:
| Foreign Currency Derivative | Number of Instruments | Pay Fixed Notional | Receive Floating Notional | |||||||
| (in millions) | (in millions) | |||||||||
| Cross currency interest rate swaps | 1 | EUR | 81.9 | USD | 93.3 | |||||
The table below presents the fair value of the Company’s derivative financial instruments as well as their classification in the consolidated balance sheet as of September 30, 2018.
| Balance Sheet Classification | Asset Derivatives Fair Value | Balance Sheet Classification | Liability Derivatives Fair Value | |||||||||
| (in millions) | (in millions) | |||||||||||
| Derivatives designated as hedging instruments: | ||||||||||||
| Interest Rate and Foreign Exchange Products | Fair Value of Hedging Instruments | $ | 0.8 | Derivative Liability | $ | (3.4 | ) | |||||
| Total derivatives designated as hedging instruments | $ | 0.8 | $ | (3.4 | ) | |||||||
| Derivatives not designated as hedging instruments: | ||||||||||||
| Interest Rate and Foreign Exchange Products | Fair Value of Hedging Instruments | $ | — | Derivative Liability | $ | (4.4 | ) | |||||
| Total derivatives not designated as hedging instruments | $ | — | $ | (4.4 | ) | |||||||
INSPIRED ENTERTAINMENT, INC. AND SUBSIDIARIES
NOTES TO CONSOLIDATED FINANCIAL STATEMENTS
AS OF DECEMBER 31, 20192022 AND SEPTEMBER 30, 20182021, AND
FOR THE PERIODSYEARS ENDED
DECEMBER 31, 2019, DECEMBER 31, 20182022, 2021 AND SEPTEMBER 30, 20182020
The table below presents the effect of fair value and cash flow hedge accounting on accumulated other comprehensive income for the year ended December 31, 2019.2021.
Schedule of Accumulated Other Comprehensive Income
| Amount of Gain Recognized in Other Comprehensive Income on Derivative | Location of Gain Reclassified from Accumulated Other Comprehensive Income into Income | Amount of Gain/(Loss) | Location of Gain/(Loss) | |||||||||||||||||
| (in millions) | (in millions) | (in millions) | (in millions) | |||||||||||||||||
| Interest Rate and Foreign Exchange Products | $ | 2.9 | Interest Expense | $ | 1.2 | |||||||||||||||
| Foreign Currency Remeasurement | 3.2 | |||||||||||||||||||
| Interest Rate Products | $ | 0.3 | Interest Expense | $ | (1.5 | ) | ||||||||||||||
| Total | $ | 2.9 | $ | 4.4 | $ | 0.3 | $ | (1.5 | ) | |||||||||||
The table below presents the effect of fair value and cash flow hedge accounting on accumulated other comprehensive income for the three months ended December 31, 2018.
| Amount of Gain Recognized in Other Comprehensive Income on Derivative | Location of Gain Reclassified from Accumulated Other Comprehensive Income into Income | |||||||||
| (in millions) | (in millions) | |||||||||
| Interest Rate and Foreign Exchange Products | $ | 2.6 | Interest Expense | $ | 0.4 | |||||
| Foreign Currency Remeasurement | 1.9 | |||||||||
| Total | $ | 2.6 | $ | 2.3 | ||||||
The table below presents the effect of fair value and cash flow hedge accounting on accumulated other comprehensive income for the year ended September 30, 2018.December 31, 2020.
| Amount of Gain Recognized in Other Comprehensive Income on Derivative | Location of Gain Reclassified from Accumulated Other Comprehensive Income into Income | Amount of Gain/(Loss) | Location of Gain/(Loss) | |||||||||||||||||
| (in millions) | (in millions) | (in millions) | (in millions) | |||||||||||||||||
| Interest Rate and Foreign Exchange Products | $ | 0.3 | Interest Expense | $ | — | |||||||||||||||
| Foreign Currency Remeasurement | 0.3 | |||||||||||||||||||
| Interest Rate Products | $ | (2.9 | ) | Interest Expense | $ | (1.5 | ) | |||||||||||||
| Total | $ | 0.3 | $ | 0.3 | $ | (2.9 | ) | $ | (1.5 | ) | ||||||||||
The table below presents the effect of the Company’s derivative financial instruments on the consolidated statements of operations for the year ended December 31, 2019.2021.
Schedule of Consolidated Statements of Operations
| Interest Expense | Foreign Currency Remeasurement | Interest Expense | ||||||||||
| (in millions) | (in millions) | |||||||||||
| Total amounts of income and expense line items presented in the statement of operations and comprehensive loss in which the effects of fair value or cash flow hedges are recorded | $ | 27.8 | $ | (3.2 | ) | $ | 44.3 | |||||
| Gain/(loss) on cash flow hedging relationships in Subtopic 815-20 | $ | 1.2 | $ | 3.2 | $ | (1.5 | ) | |||||
INSPIRED ENTERTAINMENT, INC. AND SUBSIDIARIES
NOTES TO CONSOLIDATED FINANCIAL STATEMENTS
AS OF DECEMBER 31, 2019 AND SEPTEMBER 30, 2018 AND
FOR THE PERIODS ENDED
DECEMBER 31, 2019, DECEMBER 31, 2018 AND SEPTEMBER 30, 2018
The table below presents the effect of the Company’s derivative financial instruments on the consolidated statements of operations for the three months ended December 31, 2018.
| Interest Expense | Foreign Currency Remeasurement | |||||||
| (in millions) | ||||||||
| Total amounts of income and expense line items presented in the statement of operations and comprehensive loss in which the effects of fair value or cash flow hedges are recorded | $ | 4.1 | $ | 0.7 | ||||
| Gain/(loss) on cash flow hedging relationships in Subtopic 815-20 | $ | 0.4 | $ | 2.0 | ||||
The table below presents the effect of the Company’s derivative financial instruments on the consolidated statements of operations for the year ended September 30, 2018.
| Interest Expense | Foreign Currency Remeasurement | |||||||
| (in millions) | ||||||||
| Total amounts of income and expense line items presented in the statement of operations and comprehensive loss in which the effects of fair value or cash flow hedges are recorded | $ | 20.6 | $ | 20.6 | ||||
| Gain/(loss) on cash flow hedging relationships in Subtopic 815-20 | $ | — | $ | 0.3 | ||||
The table below presents the effect of the Company’s derivative financial instruments that are not designated as hedging instruments in the consolidated statements of operations for the year ended December 31, 2019.2020.
| Interest Expense | ||||
| (in millions) | ||||
| Total amounts of income and expense line items presented in the statement of operations and comprehensive loss in which the effects of fair value or cash flow hedges are recorded | $ | 30.0 | ||
| Gain/(loss) on cash flow hedging relationships in Subtopic 815-20 | $ | (1.5 | ) | |
| F-33 |
| Derivatives Not Designated as Hedging Instruments under Subtopic 815-20 | Location of Income Recognized in | Amount of Income Recognized in Income on Derivative | ||||
| (in millions) | ||||||
| Interest Rate and Foreign Exchange Products | Change in fair value of derivative liability | $ | 2.9 | |||
INSPIRED ENTERTAINMENT, INC. AND SUBSIDIARIES
NOTES TO CONSOLIDATED FINANCIAL STATEMENTS
AS OF DECEMBER 31, 20192022 AND SEPTEMBER 30, 20182021, AND
FOR THE PERIODSYEARS ENDED
DECEMBER 31, 2019, DECEMBER 31, 20182022, 2021 AND SEPTEMBER 30, 20182020
The table below presents the effect of the Company’s derivative financial instruments that are not designated as hedging instruments in the consolidated statements of operations for the three months ended December 31, 2018.
| Derivatives Not Designated as Hedging Instruments under Subtopic 815-20 | Location of | Amount of Income Recognized in Income on Derivative | ||||
| (in millions) | ||||||
| Interest Rate and Foreign Exchange Products | Change in fair value of derivative liability | $ | 0.8 | |||
The table below presents the effect of the Company’s derivative financial instruments that are not designated as hedging instruments in the consolidated statements of operations for the year ended September 30, 2018.
| Derivatives Not Designated as Hedging Instruments under Subtopic 815-20 | Location of | Amount of Loss Recognized in Income on Derivative | ||||
| (in millions) | ||||||
| Interest Rate and Foreign Exchange Products | Change in fair value of derivative liability | $ | (7.4 | ) | ||
The table below presents a gross presentation, the effects of offsetting, and a net presentation of the Company’s derivatives as of September 30, 2018. The net amounts of derivative assets or liabilities can be reconciled to the tabular disclosure of fair value. The tabular disclosure of fair value provides the location that derivative assets and liabilities are presented on the consolidated balance sheets.
The ISDA Master Agreement between Gaming Acquisitions Limited and Nomura Global Financial Products, Inc. was documented using the 2002 Form and the ISDA standard set-off provision in Section 6(f) of the ISDA Master Agreement apply to both parties and was only modified to include Affiliates of the Payee. There was no CSA and thus there was no collateral posting. The only other security for the ISDA included a guaranty of Nomura’s obligations from Nomura Holdings, Inc. and with respect to Gaming Acquisitions Limited, its obligations under the ISDA was cross-collateralized with the debt obligations under the Credit Agreement in the same pool of collateral that supported the debt obligations.
| Offsetting of Derivative Assets | ||||||||||||||||||||||||
| September 30, 2018 | ||||||||||||||||||||||||
| Gross Amounts Not Offset in the Statement of Financial Position | ||||||||||||||||||||||||
| Gross Amounts of Recognized Assets | Gross Amounts Offset in the Statement of Financial Position | Net Amounts of Assets presented in the Statement of Financial Position | Financial Instruments | Cash Collateral Received | Net Amount | |||||||||||||||||||
| (in millions) | ||||||||||||||||||||||||
| Fair value of hedging instrument | $ | 0.8 | $ | — | $ | 0.8 | $ | — | $ | — | $ | — | ||||||||||||
| Offsetting of Derivative Liabilities | ||||||||||||||||||||||||
| September 30, 2018 | ||||||||||||||||||||||||
| Gross Amounts Not Offset in the Statement of Financial Position | ||||||||||||||||||||||||
| Gross Amounts of Recognized Liabilities | Gross Amounts Offset in the Statement of Financial Position | Net Amounts of Liabilities presented in the Statement of Financial Position | Financial Instruments | Cash Collateral Received | Net Amount | |||||||||||||||||||
| (in millions) | ||||||||||||||||||||||||
| Fair value of hedging instrument | $ | 7.8 | $ | — | $ | 7.8 | $ | — | $ | — | $ | — | ||||||||||||
INSPIRED ENTERTAINMENT, INC. AND SUBSIDIARIES
NOTES TO CONSOLIDATED FINANCIAL STATEMENTS
AS OF DECEMBER 31, 2019 AND SEPTEMBER 30, 2018 AND
FOR THE PERIODS ENDED
DECEMBER 31, 2019, DECEMBER 31, 2018 AND SEPTEMBER 30, 2018
| 15. | Fair Value Measurements |
Fair value is defined as the exchange price that would be received for an asset or paid to transfer a liability (an exit price) in the principal or most advantageous market for the asset and liability in an orderly transaction between market participants at the measurement date. We estimate the fair value of our assets and liabilities utilizing an established three-level hierarchy. The hierarchy is based upon the transparency of inputs to the valuation of an asset or liability as of the measurement date as follows:
| Level 1: | Quoted prices in active markets for identical assets or liabilities. | |
| Level 2: | Observable inputs other than Level 1 prices, such as quoted prices for similar assets or liabilities, quoted prices in markets with insufficient volume or infrequent transactions (less active markets), or model-derived valuations in which all significant inputs are observable or can be derived principally from or corroborated with observable market data for substantially the full term of the assets or liabilities. Level 2 inputs also include non-binding market consensus prices that can be corroborated with observable market data, as well as quoted prices that were adjusted for security-specific restrictions. | |
| Level 3: | Unobservable inputs that are supported by little or no market activity that are significant to the fair value of the asset or liability. Level 3 inputs also include non-binding market consensus prices or non-binding broker quotes that are unable to be corroborated with observable market data. |
The fair value of our financial assets and liabilities is determined by reference to market data and other valuation techniques as appropriate. We believe the fair value of our financial instruments approximates their recorded values.
For each period, derivative financial instrument assets and liabilities measured at fair value on a recurring basis are included in the financial statements as per the table below.
Schedule of Derivative Financial Instrument Assets and Liabilities Measured at Fair Value on Recurring Basis
| December 31, | December 31, | |||||||||||
| Level | 2022 | 2021 | ||||||||||
| (in millions) | ||||||||||||
| Long term receivable (included in other assets) | 2 | $ | 3.0 | $ | 3.5 | |||||||
| F-34 |
| December 31, | September 30, | |||||||||
| Level | 2019 | 2018 | ||||||||
| (in millions) | ||||||||||
| Earnout liability (see Note 16) | 3 | $ | — | $ | 8.0 | |||||
| Derivative liability (see Notes 14 and 17) | 2 | $ | — | $ | 7.8 | |||||
| Long term receivable (included in other assets) | 2 | $ | 1.5 | $ | 2.2 | |||||
| Private Placement Warrants (included in warrant liability) | 2 | $ | 6.4 | $ | 8.4 | |||||
| Public Warrants (included in warrant liability) | 1 | $ | 3.4 | $ | 3.6 | |||||
INSPIRED ENTERTAINMENT, INC. AND SUBSIDIARIES
NOTES TO CONSOLIDATED FINANCIAL STATEMENTS
AS OF DECEMBER 31, 2022 AND 2021, AND FOR THE YEARS ENDED
DECEMBER 31, 2022, 2021 AND 2020
The fair value of our long-term senior debt as of December 31, 2022, was $261.0 million, based upon quoted prices in the marketplace, which are considered Level 2 inputs.
Level 3 liabilities are valued using unobservable inputs to the valuation methodology that are significant to the measurement of the fair value of the derivative liabilities. For fair value measurements categorized within Level 3 of the fair value hierarchy, the Company’s principal financial officer, who reports to the principal executive officer, determines its valuation policies and procedures. The development and determination of the unobservable inputs for Level 3 fair value measurements and fair value calculations are the responsibility of the Company’s Principal Financial Officer and approved by the Principal Executive Officer.
Level 3 financial liabilities consisted of the earnout liability for which there was no current market for these securities such that the determination of fair value required significant judgment or estimation. Changes in fair value measurements categorized within Level 3 of the fair value hierarchy are analyzed each period based on changes in estimates or assumptions and recorded as appropriate (see Note 16).
At December 31, 20192022 and September 30, 2018,December 31, 2021, there were no Level 3 inputs, and no transfers in or out of Level 3 from other levels in the fair value hierarchy.
INSPIRED ENTERTAINMENT, INC. AND SUBSIDIARIES
NOTES TO CONSOLIDATED FINANCIAL STATEMENTS
AS OF DECEMBER 31, 2019 AND SEPTEMBER 30, 2018 AND
FOR THE PERIODS ENDED
DECEMBER 31, 2019, DECEMBER 31, 2018 AND SEPTEMBER 30, 2018
| 16. |
An earnout payment of up to 2,500,000 shares of the Company’s common stock, subject to certain customary anti-dilution adjustments (the “Earnout Consideration”), was payable pursuant to the Sale Agreement to the previous owners of Inspired based on the financial performance of the Company’s businesses in six specific countries, China, Colombia, Greece, Norway, Spain and Ukraine (collectively, the “Earnout Jurisdictions”), as measured by earnings before interest, taxes, depreciation and amortization (“EBITDA”) for the twelve months ended September 30, 2018 (the “Earnout Period”), with the maximum earnout payment of 2,500,000 shares issuable if such EBITDA results with respect to the Earnout Jurisdictions was equal to or greater than £15,000. Based on the EBITDA results for such fiscal year with respect to the Earnout Jurisdictions, the Company issued 1,323,558 shares of common stock as Earnout Consideration in March 2019, resulting in an aggregate amount of $8.6 million recorded upon the settlement of the earnout liability, with a corresponding credit to stockholders’ deficit.
The following table provides a reconciliation of the beginning and ending balances for the earnout liability measured using significant unobservable inputs (Level 3):
| (in millions) | ||||
| Balance – October 1, 2017 | $ | 16.7 | ||
| Change in fair value of earnout liability | (8.7 | ) | ||
| Balance – September 30, 2018 | $ | 8.0 | ||
| Balance – January 1, 2019 | $ | 6.3 | ||
| Change in fair value of earnout liability | 2.3 | |||
| Settlement of earnout liability | (8.6 | ) | ||
| Balance – December 31, 2019 | $ | — | ||
All movements in the balance of the earnout liability were due to movements in the price of the Company’s common stock.
The Company’s 2018 Omnibus Incentive Plan (the “2018 Plan”) was adopted by the Company’s Board of Directors in September 2018 subject to approval by the Company’s stockholders, which was obtained in May 2019. Initial awards covering an aggregate of 542,770 restricted stock units (“RSUs”) were approved under the 2018 Plan with respect to fiscal 2018 to members of management and other participants with a three-year vesting schedule (i.e., one-third vesting on each of December 31, 2019, 2020 and 2021). These awards, which were subject to cancellation in the event stockholders did not approve the 2018 Plan during 2019, were initially classified as a derivative liability due to the grant terms containing a commitment by the Company to make a liquidated damages payment to the participants in cash (with respect to the value of one-third of the award) in the event stockholders did not approve the 2018 Plan by the first scheduled vesting date. Such obligation was eliminated upon stockholder approval of the 2018 Plan being obtained, which resulted in the liability being reclassified to additional paid in capital at the fair value amount of $0.8 million during the year ended December 31, 2019.
In addition, the awards of RSUs that were granted under the Company’s Second Long-Term Incentive Plan (“Second Incentive Plan”) prior to approval by the Company’s stockholders, which was obtained in March 2018, were initially classified as a derivative liability due to the Company’s obligation to settle those awards in cash in the event stockholders did not approve the plan. The awards under the Second Incentive Plan included RSUs approved at the time of the Merger and RSUs approved in December 2017 for the Company’s Executive Chairman and Chief Strategy Officer in connection with the cancellation of awards of restricted stock they received under the Company’s 2016 Long-Term Incentive Plan (the “First Incentive Plan”). The awards of RSUs to such executives under the Second Incentive Plan were considered a modification that resulted in the original classification of their awards as an equity instrument being switched to a liability instrument, and in $1.5 million of previously recognized compensation expense being reclassified from additional paid in capital to derivative liability. The derivative liability associated with awards under the Second Incentive Plan was eliminated upon stockholder approval, and the liability was reclassified to additional paid in capital at the fair value amount of $2.8 million during the year ended September 30, 2018.
See Note 14, “Derivatives and Hedging Activities,” for a discussion of the Company’s cross-currency swap.
INSPIRED ENTERTAINMENT, INC. AND SUBSIDIARIES
NOTES TO CONSOLIDATED FINANCIAL STATEMENTS
AS OF DECEMBER 31, 2019 AND SEPTEMBER 30, 2018 AND
FOR THE PERIODS ENDED
DECEMBER 31, 2019, DECEMBER 31, 2018 AND SEPTEMBER 30, 2018
Preferred Stock
The Company is authorized to issue shares of preferred stock with a par value of $0.0001 $per share in one or more series. The Company’s Board of Directors is authorized to fix the voting rights, if any, designations, powers, preferences, the relative, participating, optional or other special rights and any qualifications, limitations and restrictions thereof, applicable to the shares of each series. At December 31, 20192022 and September 30, 2018,December 31, 2021, there were shares of preferred stock issued or outstanding.
Series A Preferred Stock
On August 13, 2017, in connection with the “stockholder rights plan” discussed below, the Company’s Board of Directors approved a Certificate of Designation of Series A Junior Participating Preferred Stock, which designates the rights, preferences and privileges of 49,000 shares of a series of the Company’s preferred stock, par value $0.0001 per share, designated as Series A Junior Participating Preferred Stock (the “Series A Preferred Stock”). The Certificate of Designation was filed with the Delaware Secretary of State and became effective on August 14, 2017.
Each share of Series A Preferred Stock, if issued, will not be redeemable, and will entitle the holder thereof to cumulative quarterly dividend payments equal to the greater of (1) $1.00 or (2) 1,000 times the aggregate per share amount of all cash dividends, plus 1,000 times the aggregate per share amount (payable in kind) of all non-cash dividends or other distributions other than a dividend payable in shares of common stock of the Company. Each share of Series A Preferred Stock shall entitle the holder to 1,000 votes on all matters submitted to a vote of shareholders. The Series A Preferred Stock will entitle the holder thereof to receive $1,000 per share, plus any accrued and unpaid dividends thereon, upon liquidation and, if shares of common stock are exchanged via merger, consolidation or a similar transaction, will entitle the holder thereof to a per share payment equal to $1,000 per share.
The Series A Preferred Stock will rank junior to all other series of preferred stock as to the payment of dividends and the distribution of assets, whether or not upon the dissolution, liquidation or winding up of the Company.
Stockholder Rights Plan
On August 13, 2017, the Board of Directors of the Company adopted a stockholder rights plan and declared a distribution of one right (“Right”) for each outstanding share of the Company’s common stock to stockholders of record at the close of business on August 25, 2017 (the “Record Date”). Each Right entitles its holder, under the circumstances described below, to purchase from the Company one one-thousandth of a share of Series A Preferred Stock of the Company at an exercise price of $45.00 per Right, subject to adjustment. The terms of the Rights are set forth in a Rights Agreement, dated as of August 13, 2017 (the “Rights Agreement”), by and between the Company and Continental Stock Transfer & Trust Company, as rights agent. The Rights Agreement was approved by the Company’s stockholders at the Company’s annual meeting held on March 7, 2018.
The Rights are transferable with and only with the underlying shares of common stock. New Rights will attach to any shares of common stock that become outstanding after the Record Date and prior to the earlier of the distribution time and the expiration time.
Subject to certain exceptions, the Rights become exercisable and trade separately from the common stock only upon the “distribution time,” which occurs upon the earlier of:
The Rights are not exercisable until the distribution time.
Unless earlier redeemed or exchanged by the Company as described below, the Rights will expire at the close of business on August 12, 2020.
INSPIRED ENTERTAINMENT, INC. AND SUBSIDIARIES
NOTES TO CONSOLIDATED FINANCIAL STATEMENTS
AS OF DECEMBER 31, 2019 AND SEPTEMBER 30, 2018 AND
FOR THE PERIODS ENDED
DECEMBER 31, 2019, DECEMBER 31, 2018 AND SEPTEMBER 30, 2018
In the event that a person or group becomes an acquiring person (a “flip-in event”), each holder of a Right (other than any acquiring person and certain related parties, whose Rights automatically become null and void) will have the right to receive, upon exercise, common stock having a value equal to two times the exercise price of the Right. If an insufficient number of shares of common stock is available for issuance, then the Company’s board of directors would be required to substitute cash, property or other securities of the Company for common stock. The Rights may not be exercised following a flip-in event while the Company has the ability to cause the Rights to be redeemed.
In general, the Company may redeem the Rights in whole, but not in part, at a price of $0.01 per Right (subject to adjustment and payable in cash, common stock or other consideration deemed appropriate by the Company’s Board of Directors) at any time until ten days following the stock acquisition date. Immediately upon the action of the Board of Directors authorizing any redemption, the Rights will terminate and the only right of the holders of Rights will be to receive the redemption price.
At any time after there is an acquiring person and prior to the acquisition by the acquiring person of 50% or more of the outstanding shares of common stock, the Company may exchange the Rights (other than Rights owned by the acquiring person which will have become void), in whole or in part, at an exchange ratio of one share of common stock, or one one-thousandth of a share of Series A Preferred Stock (or of a share of a class or series of the Company’s preferred stock having equivalent rights, preferences and privileges), per Right (subject to adjustment).
Until a Right is exercised, its holder will have no rights as a stockholder of the Company, including, without limitation, the right to vote or to receive dividends.
Common Stock
The Company is authorized to issue shares of common stock, par value $0.0001 $per share. Holders of the Company’s common stock are entitled to one vote for each common share.share.
Warrants
As of December 31, 2019 and September 30, 2018,2020, the Company had 19,079,130 outstanding warrants to purchase an aggregate of 9,539,565 shares of the Company’s common stock, which includes included 7,999,900 warrants originally issued as part of the initial public offering (the “IPO”) (the “Public Warrants”) and 11,079,230 warrants issued in private placements in connection with the IPO and the Merger (the “Private Placement Warrants”). The warrants became exercisable 30 days after the closing of the Merger and had an expiration date of December 23, 2021. Each warrant entitlesentitled its holder to purchase one-half of one share of the Company’s common stock at an exercise price of $11.50$11.50 per whole share and will expire on December 23, 2021.share. The warrants maywere able to be exercised only for a whole number of shares of common stock. No fractional shares will be issued upon exercise of the warrants. The warrants became exercisable 30 days after the Closing Date. The Company may redeem the Public Warrants at a price of $0.01 per warrant if the last sale price of the common stock equals or exceeds $24.00 per share for any 20 trading days within a 30-trading day period. The Company may not redeem the Private Placement Warrants so long as they are held by the initial purchaser or such purchasers’ permitted transferees; if held by other persons, the Private Placement Warrants will be redeemable by the Company and exercisable by such holders on the same basis as the Public Warrants.
As of December 31, 2019, and September 30, 2018,2020, the warrants meetmet the definition of a derivative under ASC 815 and arewere classified as a liability measured at fair value, with changes in fair value each period reported in earnings.
During the year ending December 31, 2021, (i) an aggregate of shares of common stock were issued pursuant to the exercise of Public Warrants and (ii) an aggregate of shares of common stock were issued pursuant to the exercise (on a cashless basis) of Private Warrants. There were no warrants outstanding as of December 31, 2022 or 2021.
| 17. | Stock-Based Compensation |
The Company’s stock-based compensation plans authorize awards of RSUs,restricted stock units (“RSUs”), stock options and other equity-related awards. In May 2019, in conjunction withThe Company’s 2021 Omnibus Incentive Plan (“2021 Plan”) was adopted by the Company’s Board of Directors on April 12, 2021 and approved by our stockholders approvingon May 11, 2021. The 2021 Plan succeeds the Company’s 2018 Omnibus Incentive Plan (the “2018 Plan”) such that shares subject to the 2018 Plan, which authorizesPlan’s unused reserve (e.g., as a totalresult of 2,550,000 sharestermination or forfeiture of awards) are instead rolled over to be issued pursuant to awards thereunder, the balances available for awards under the Company’s2021 Plan. The Company has two other predecessor plans, (i.e., the First2016 Long-Term Incentive Plan and the Second Long-Term Incentive Plan)Plan (collectively, the “Prior Plans”), whose available balances were terminated.terminated in connection with approval of the 2018 Plan. Although outstanding awards under the Prior Plans remain governed by the terms of the Prior Plans, no new awards willmay be granted or become available for grant under the Prior Plans.
Awards granted under the 2018 Plan prior to stockholder approval being obtained in May 2019 consisted of: (1) the 542,770 RSUs approved for management and other participants with respect to fiscal 2018 as to which the contingent cash-settlement feature lapsed upon approval of the 2018 Plan by stockholders (see Note 17, “Derivative Liability”) and (2) 572,346 RSUs approved for management and other participants with respect to fiscal 2019 comprised of two components: (i) 50% represent performance-based target RSUs that require both attainment of Company performance criteria for 2019 (i.e., Adjusted EBITDA) and the participants remaining employed for a three-year service period (under the terms of the award, the specific number of shares that could become eligible to vest would range from 0% to 200% of the target award depending on the level of satisfaction of the Company performance criteria); and (ii) 50% represent service-based RSUs that vest over a period of three years. In addition, an aggregate of 111,500 RSUs were awarded during the year ended December 31, 2019 (following approval of the 2018 Plan by stockholders) as new hire or special recognition grants.
INSPIRED ENTERTAINMENT, INC. AND SUBSIDIARIES
NOTES TO CONSOLIDATED FINANCIAL STATEMENTS
AS OF DECEMBER 31, 2019 AND SEPTEMBER 30, 2018 AND
FOR THE PERIODS ENDED
DECEMBER 31, 2019, DECEMBER 31, 2018 AND SEPTEMBER 30, 2018
As of December 31, 2019,2022, there were ; (ii) 939,947 shares subject to outstanding awards under the 2018 Plan, including 281,736 shares subject to performance-based target awards (the Company has preliminarily determined thatand shares subject to awards as to which the 2019 performance criteria for these performanceapplicable vesting conditions have been met which remain subject to deferred settlement; and (iii) shares subject to outstanding awards will beunder the Prior Plans as to which the applicable vesting conditions have been met at a level of approximately 87% of the target award, such that approximately 13% of the target award would not become eligiblewhich remain subject to vest).deferred settlement. As of December 31, 2019,2022, there were 1,336,737 shares available for new awards under the 2021 Plan (which includes shares rolled over from the 2018 PlanPlan) and no shares available for new awards under the Prior Plans. All awards consistoutstanding as of December 31, 2022 consisted of RSUs (including time-based RSUs, performance-based RSUs and Restricted Stock.stock price based RSUs).
| F-35 |
INSPIRED ENTERTAINMENT, INC. AND SUBSIDIARIES
NOTES TO CONSOLIDATED FINANCIAL STATEMENTS
AS OF DECEMBER 31, 2022 AND 2021, AND FOR THE YEARS ENDED
DECEMBER 31, 2022, 2021 AND 2020
The Company also has an employee stock purchase plan (“ESPP”) that authorizes the issuance of up to an aggregate of shares of common stock pursuant to purchases thereunder by employees. The ESPP, which was approved by stockholders in July 2017, is administered by the Compensation Committee which has discretion to designate the length of offering periods and other terms subject to the requirements of the ESPP. Offerings may also be under the ESPP’s subplan for UK-based employees (the “Subplan”) which was adopted in June 2022 and is designed to meet the requirements of a sharesave scheme under UK law. The Company began a twelve-month offering periodterms applicable to the offerings approved in 2022 under the ESPP and Subplan are described below. Based on June 3, 2019enrollments in these offerings, the Company estimates that authorizesapproximately shares will be purchased ( shares under the ESPP and under the Subplan).
The offering period approved in 2022 for the ESPP is for a period of twelve months (ending in October 2023), eligible employees tomay contribute up to of their base compensation, to purchase a maximum of shares may be purchased per participant, the purchase price will be equal to of the lower of the closing price of the common stock at the beginning of the offering period (the applicable closing price was $) and the end of the offering period and shares will be purchased on the last day of the offering period. Under the offering approved for the Subplan, eligible employees may contribute a maximum amount of £350 per month through payroll deductions over a period at a discountedof three years (through October 2025), the purchase price that will be equal to of the lower of: (i) the closing price at the beginning of the common stock on the day prior to commencement of the enrollment window for the offering period and (ii) the(the applicable closing price atwas $), and participants have a period of six months following the end of the offering period. The Company estimates that approximately 10,000to elect to purchase shares will be purchased during this offering period. or receive a refund.
As of December 31, 2019,2022, a total of 475,400 shares remainremained available for purchase under the ESPP. A total of shares were issued under the ESPP in 2020 (at a purchase price of $ per share) and shares were issued under the ESPP in 2021 or 2022.
Schedule of Restricted Stock Unit Activity
| Number of Shares | Weighted Average Grant Date Fair Value Per Share | |||||||
| Unvested Outstanding at January 1, 2019 | 2,251,059 | $ | 6.19 | |||||
| Granted | 746,522 | $ | 6.53 | |||||
| Forfeited | (13,353 | ) | $ | (6.81 | ) | |||
| Vested | (1,412,264 | ) | $ | (6.10 | ) | |||
| Unvested Outstanding at December 31, 2019 | 1,571,964 | $ | 6.43 | |||||
| Number of Shares | Weighted Average Grant Date Fair Value Per Share | |||||||
| Unvested Outstanding at January 1, 2022 | 2,039,254 | $ | 8.60 | |||||
| Granted (1) | 543,178 | $ | 14.36 | |||||
| Forfeited | (55,198 | ) | $ | (11.06 | ) | |||
| Vested (2) | (879,690 | ) | $ | (7.18 | ) | |||
| Unvested Outstanding at December 31, 2022 | 1,647,544 | $ | 11.11 | |||||
| (1) | The RSUs that were granted during the year ended December 31, 2022 included: (a) RSUs under the Board’s compensation program for non-employee directors which vest during the year of grant and, at the election of the participant, may remain unsettled until the director leaves the Company; and (b) RSUs under an incentive program for management and other personnel, as to which one-half was in the form of performance-based RSUs that are conditioned on attainment of performance criteria for fiscal year 2022 and subject to a time-based service period through December 31, 2024 and the other one-half vests in installments through December 31, 2024. |
| (2) | The RSUs that vested during the year ended December 31, 2022 included: (a) RSUs that are subject to deferred settlement terms; and (b) RSUs that were settled on a net share basis on or about December 30, 2022, resulting in shares being issued in and withheld for taxes (the processing of the issuance and delivery of such shares occurred partially in December 2022 (as to shares) and partially in January 2023 (as to shares)). |
The Company issued and withhelda total of shares for taxes in connection with the vesting and settlement of RSUs during the year ended December 31, 2019 as follows: (1) 60,1862022 in net settlement of RSUs which included an aggregate of shares in settlement of RSUs that had been granted uponvested during the closing of the Business Combination settled on December 23, 2019, resulting in 36,813 shares being issued and 23,373 withheld for taxes; and (2) 273,316 RSUs that had been granted under the 2018 Plan vestedprior year on December 31, 2019, resulting2021.
The weighted average grant date fair value of awards granted for years ended December 31, 2022, December 31, 2021 and December 31, 2020 amounted to $, $and $, respectively. The vesting date value of RSUs vesting for years ended December 31, 2022, December 31, 2021 and December 31, 2020 amounted to $million, $million and $million, respectively.There was no income tax benefit recognized related to awards that vested during the years ended December 31, 2022, 2021, and 2020 , respectively as there is a full valuation allowance in 166,959 shares being issued and 106,357 withheld for taxes (the processing ofplace against the issuance and delivery of such 166,959 shares did not occur until January 2020)RSU scheme’s deferred tax asset.
Stock-based compensation is recognized as an expense on a straight-line basis over the requisite service period, which is generally the vesting period. For performance awards that are contingent upon the Company achieving certain pre-determined financial performance targets, compensation expense is calculated based on the number of shares expected to vest after assessing the probability that the performance criteria will be met. Determining the probability of achieving a performance target requires estimates and judgment. The modification ofFor market-based awards that are contingent upon the Company’s stock achieving certain awards held by two executive officerspre-determined price targets, compensation expense is calculated based upon the determination of the Company in December 2017 resulted in $2.1 million of incremental compensation cost being recognized asfair value of the modification date.awards as derived through multiple running of the Monte Carlo valuation model, with the fair value recognized on a straight-line basis over the requisite service period. The requisite service period for awards to employees is generally satisfied over a vesting period of three years (and one year for non-employee directors). The Company accounts for forfeitures as they occur. For stock purchase rights under the Company’s ESPP (including its subplan), the Company estimates fair value using the Black-Scholes option pricing model on the dates of grant, with the compensation expense recognized over the requisite service period.
| F-36 |
INSPIRED ENTERTAINMENT, INC. AND SUBSIDIARIES
NOTES TO CONSOLIDATED FINANCIAL STATEMENTS
AS OF DECEMBER 31, 2022 AND 2021, AND FOR THE YEARS ENDED
DECEMBER 31, 2022, 2021 AND 2020
Schedule of Stock Based Compensation Expense
Year | Three Months Ended December 31, | Year Ended | ||||||||||
| 2019 | 2018 | 2018 | ||||||||||
| (in millions) | ||||||||||||
| RSAs and RSUs | $ | 8.7 | $ | 1.6 | $ | 5.0 | ||||||
| Modification of awards | — | — | 2.1 | |||||||||
| Payroll taxes on vesting of RSUs | 0.3 | — | 0.3 | |||||||||
| $ | 9.0 | $ | 1.6 | $ | 7.4 | |||||||
| Year Ended December 31, 2022 | Year Ended December 31, 2021 | Year Ended December 31, 2020 | ||||||||||
| (in millions) | ||||||||||||
| Restricted Stock and RSUs | $ | $ | $ | |||||||||
| Payroll taxes on vesting of RSUs | ||||||||||||
| $ | $ | $ | ||||||||||
INSPIRED ENTERTAINMENT, INC. AND SUBSIDIARIES
NOTES TO CONSOLIDATED FINANCIAL STATEMENTS
AS OF DECEMBER 31, 2019 AND SEPTEMBER 30, 2018 AND
FOR THE PERIODS ENDED
DECEMBER 31, 2019, DECEMBER 31, 2018 AND SEPTEMBER 30, 2018
Total unrecognized compensation expense related to unvested stock awards and unvested RSUs at December 31, 20192022 amounts to $6.5$ million and is expected to be recognized over a weighted average period of 2.0 years.
| 18. | Accumulated Other Comprehensive Loss (Income) |
The accumulated balances for each classification of comprehensive loss (income) are presented below:
Schedule of Accumulated Other Comprehensive Loss (Income)
| Foreign Currency Translation Adjustments | Change in Fair Value of Hedging Instrument | Unrecognized Pension Benefit Costs | Accumulated Other Comprehensive (Income) | |||||||||||||
| (in millions) | ||||||||||||||||
| Balance at October 1, 2017 | $ | (78.6 | ) | $ | — | $ | 25.5 | $ | (53.1 | ) | ||||||
| Change during the period | (0.3 | ) | 0.1 | (5.2 | ) | (5.4 | ) | |||||||||
| Balance at September 30, 2018 | (78.9 | ) | 0.1 | 20.3 | (58.5 | ) | ||||||||||
| Change during the period | — | (0.2 | ) | 2.8 | 2.6 | |||||||||||
| Balance at December 31, 2018 | (78.9 | ) | (0.1 | ) | 23.1 | (55.9 | ) | |||||||||
| Change during the period | 2.4 | 1.5 | 6.9 | 10.8 | ||||||||||||
| Balance at December 31, 2019 | $ | (76.5 | ) | $ | 1.4 | $ | 30.0 | $ | (45.1 | ) | ||||||
| Foreign Currency Translation Adjustments | Change in Fair Value of Hedging Instrument | Unrecognized Pension Benefit Costs | Accumulated Other Comprehensive (Income) | |||||||||||||
| (in millions) | ||||||||||||||||
| Balance at January 1, 2020 | $ | (76.5 | ) | $ | 1.4 | $ | 30.0 | $ | (45.1 | ) | ||||||
| Change during the period | 5.4 | 1.4 | 7.2 | 14.0 | ||||||||||||
| Balance at December 31, 2020 | (71.1 | ) | 2.8 | 37.2 | (31.1 | ) | ||||||||||
| Change during the period | (0.4 | ) | (1.8 | ) | (10.5 | ) | (12.7 | ) | ||||||||
| Balance at December 31, 2021 | (71.5 | ) | 1.0 | 26.7 | (43.8 | ) | ||||||||||
| Change during the period | (8.2 | ) | (0.7 | ) | 6.4 | (2.5 | ) | |||||||||
| Balance at December 31, 2022 | $ | (79.7 | ) | $ | 0.3 | $ | 33.1 | $ | (46.3 | ) | ||||||
Included within accumulated other comprehensive income is an amount of $1.4$0.3 million relating to the change in fair value of discontinued hedging instruments. These instruments were discontinued during the year as part of the termination of the hedging instrument, as described further in note 14. This amount will be amortized as a charge to income over the life of the original instrument, to August 2021instruments, in accordance with US GAAP.
| 19. | Net |
Basic income/loss per share (“EPS”) is computed by dividing net income/loss availableattributable to common stockholders by the weighted average number of common shares outstanding during the period, excluding the effects of any potentially dilutive securities. Diluted EPS gives effect to all dilutive potential shares of common stock outstanding during the period, including stock options, restricted stock, RSUs and warrants, using the treasury stock method, and convertible debt or convertible preferred stock, using the if-converted method. Diluted EPS excludes all dilutive potential of shares of common stock if their effect ismethod, unless the inclusion would be anti-dilutive.
Schedule of Anti-dilutive Securities Excluded from Computation of Earnings per Share
| Year Ended December 31, 2022 | Year Ended December 31, 2021 | Year Ended December 31, 2020 | ||||||||||
| RSUs | 382,500 | 3,622,904 | 3,522,140 | |||||||||
| Unvested Restricted Stock | — | — | 624,116 | |||||||||
| Stock Warrants | — | — | 9,539,565 | |||||||||
| Anti-dilutive securities | 382,500 | 3,622,904 | 13,685,821 | |||||||||
Schedule of Numerators and Denominators of the Basic and Diluted EPS Computations
| Income (Numerator) | Shares (Denominator) | Per-Share Amount, Year Ended December 31, 2022 | ||||||||||
| (in millions) | ||||||||||||
| Basic EPS | ||||||||||||
| Income available to common stockholders | $ | 22.3 | 26,446,374 | $ | 0.84 | |||||||
| Effect of Dilutive Securities | ||||||||||||
| RSUs | 2,589,411 | |||||||||||
| Diluted EPS | ||||||||||||
| Income available to common stockholders | $ | 22.3 | $ | 29,035,785 | $ | 0.77 | ||||||
| F-37 |
| Year Ended December 31, | Three Months Ended December 31, | Year Ended September 30, | ||||||||||
| 2019 | 2018 | 2018 | ||||||||||
| Earnout Shares | — | — | — | |||||||||
| RSUs | 2,744,842 | — | — | |||||||||
| Unvested Restricted Stock | 624,116 | 624,116 | 624,116 | |||||||||
| Stock Warrants | 9,539,565 | 9,539,565 | 9,539,565 | |||||||||
| 12,908,523 | 10,163,681 | 10,163,681 | ||||||||||
INSPIRED ENTERTAINMENT, INC. AND SUBSIDIARIES
NOTES TO CONSOLIDATED FINANCIAL STATEMENTS
AS OF DECEMBER 31, 20192022 AND SEPTEMBER 30, 20182021, AND
FOR THE PERIODSYEARS ENDED
DECEMBER 31, 2019, DECEMBER 31, 20182022, 2021 AND SEPTEMBER 30, 20182020
| 20. |
On May 10, 2022, the Board of Directors authorized the Company to use up to $25.0 million to repurchase Inspired common shares (such amount being exclusive of any fees, commissions or other expenses), subject to repurchases being effected on or before May 10, 2025 (the “Share Repurchase Program”). Management has discretion as to whether to repurchase shares of the Company.
During the year ended December 31, 2022, the Company repurchased shares under the Share Repurchase Program for gross payments of approximately $10.5 million, which were canceled and retired during the year ended December 31, 2022. As of December 31, 2022, approximately $14.6 million remained available for future repurchases under the Share Repurchase Program.
Refer Part II, Item 5 of this report for further details regarding shares repurchased during the three months ended December 31, 2022.
| 21. | Other Finance (Expense) Income |
Other finance (expense) income (costs) consisted of the following:
Schedule of Other Finance Income (expense)
| Year Ended December 31, | Three Months Ended December 31, | Year Ended September 30, | ||||||||||||||||||||||
| 2019 | 2018 | 2018 | Year Ended December 31, 2022 | Year Ended December 31, 2021 | Year Ended December 31, 2020 | |||||||||||||||||||
| (in millions) | (in millions) | |||||||||||||||||||||||
| Pension interest cost | $ | (2.7 | ) | $ | (0.7 | ) | $ | (3.0 | ) | $ | (2.1 | ) | $ | (1.6 | ) | $ | (2.2 | ) | ||||||
| Expected return on pension plan assets | 3.5 | 0.9 | 3.7 | 3.2 | 2.7 | 3.1 | ||||||||||||||||||
| Foreign currency translation on senior bank debt | (0.8 | ) | (2.9 | ) | 3.4 | — | 4.6 | (5.6 | ) | |||||||||||||||
| Foreign currency remeasurement on hedging instrument | 3.2 | 2.0 | — | |||||||||||||||||||||
| $ | 3.2 | $ | (0.7 | ) | $ | 4.1 | ||||||||||||||||||
| Other finance income (Costs) | $ | 1.1 | $ | 5.7 | $ | (4.7 | ) | |||||||||||||||||
| 22. | Income Taxes |
The following compriseseffective tax rates for the lossyears ended December 31, 2022 and 2021 were 12.6% and 4.2% respectively. For the year ended December 31, 2022, the Company’s effective tax rate differs from the federal statutory rate primarily due to losses in certain jurisdictions where the Company presently has recorded a valuation allowance against the related tax benefit as well as an inclusion for global intangible low-taxed income. For the year ended December 31, 2021, the Company’s effective tax rate differs from the federal statutory rate primarily due to losses in certain jurisdictions where the Company presently has recorded a valuation allowance against the related tax benefit and non-deductible officer’s compensation.
The components of earnings (loss) before income taxes:taxes on the Company’s consolidated statement of operations by the United States and foreign jurisdictions were as follows:
Schedule of Earnings (Loss) Before Income Tax
| December 31, | December 31, | September 30, | ||||||||||
| 2019 | 2018 | 2018 | ||||||||||
| (in millions) | ||||||||||||
| UK | $ | (23.3 | ) | $ | (3.7 | ) | $ | (18.9 | ) | |||
| North America | (19.3 | ) | 5.5 | 32.8 | ||||||||
| Mainland Europe | 1.9 | 0.3 | (0.2 | ) | ||||||||
| South America | (0.3 | ) | (0.5 | ) | (0.2 | ) | ||||||
| Total (loss) income before income taxes | $ | (41.0 | ) | $ | 1.6 | $ | 13.5 | |||||
Year Ended December 31, 2022 | Year Ended December 31, 2021 | Year Ended December 31, 2020 | ||||||||||
| (in millions) | ||||||||||||
| United States | $ | (14.1 | ) | $ | (13.5 | ) | $ | (14.4 | ) | |||
| Foreign jurisdictions | 39.6 | ) | (24.8 | ) | (17.6 | ) | ||||||
| Total earnings (loss) before income taxes | $ | 25.5 | $ | (38.3 | ) | $ | (32.0 | ) | ||||
The incomeIncome tax expense consistedprovision (benefit), as reflected in the Company’s consolidated statement of operations, consists of the following:
Schedule of Provision for Income Taxes
Year Ended December 31, 2022 | Year Ended December 31, 2021 | Year Ended December 31, 2020 | ||||||||||
| (in millions) | ||||||||||||
| Current provision (benefit) | ||||||||||||
| Federal | $ | 1.6 | $ | — | $ | — | ||||||
| State | 0.2 | — | — | |||||||||
| Foreign | 1.4 | (1.6 | ) | 0.4 | ||||||||
| Total current | $ | 3.2 | $ | (1.6 | ) | $ | 0.4 | |||||
| Year Ended December 31, 2022 | Year Ended December 31, 2021 | Year Ended December 31, 2020 | ||||||||||
| (in millions) | ||||||||||||
| Deferred provision (benefit) | ||||||||||||
| Federal | $ | — | $ | — | $ | — | ||||||
| State | — | — | — | |||||||||
| Foreign | — | — | — | |||||||||
| Total deferred | $ | — | $ | — | $ | — | ||||||
| F-38 |
| Year Ended December 31, | Three Months Ended December 31, | Year Ended September 30, | ||||||||||
| 2019 | 2018 | 2018 | ||||||||||
| (in millions) | ||||||||||||
| Income tax expense: | ||||||||||||
| Current | ||||||||||||
| UK | $ | — | $ | — | $ | — | ||||||
| Mainland Europe | 0.1 | — | 0.2 | |||||||||
| South America | — | — | — | |||||||||
| Total current taxes | $ | 0.1 | $ | — | $ | 0.2 | ||||||
INSPIRED ENTERTAINMENT, INC. AND SUBSIDIARIES
NOTES TO CONSOLIDATED FINANCIAL STATEMENTS
AS OF DECEMBER 31, 2022 AND 2021, AND FOR THE YEARS ENDED
DECEMBER 31, 2022, 2021 AND 2020
The differences between the federal statutory tax rate and our effective rate are reflected in the following table for the years ended December 31, 2022, 2021 and 2020:
Schedule of Differences Between the Federal Statutory Tax Rate and our Effective Rate
December 31, 2022 | December 31, 2021 | December 31, 2020 | ||||||||||
| (in millions) | ||||||||||||
| Statutory income tax | 21.0 | % | 21.0 | % | 21.0 | % | ||||||
| State taxes (net of federal) | 0.8 | % | 0.0 | % | 0.0 | % | ||||||
| Non-deductible officers’ compensation | 6.7 | % | (5.4 | )% | 0.0 | % | ||||||
| Global intangible low-taxed income | 32.4 | % | 0.0 | % | 0.0 | % | ||||||
| Other permanent differences | (0.7 | )% | (1.5 | )% | (6.2 | )% | ||||||
| Effect of rates different than statutory | (2.0 | )% | (4.0 | )% | 0.5 | % | ||||||
| Non-creditable withholding taxes | 4.2 | % | 0.0 | % | 0.0 | % | ||||||
| Foreign tax true ups | (0.1 | )% | 4.6 | % | 0.1 | % | ||||||
| Research and development tax credits | (1.1 | )% | 0.3 | % | 0.0 | )% | ||||||
| Change in valuation allowance | (48.6 | )% | (10.8 | )% | (16.6 | )% | ||||||
| Effective income tax rate | 12.6 | % | 4.2 | % | (1.2 | )% | ||||||
The net deferred tax assets and liabilities arising from temporary differences are as follows:
Schedule of Deferred Tax Assets and Liabilities
| December 31, | December 31, | |||||||
| 2022 | 2021 | |||||||
| (in millions) | ||||||||
| Depreciation | $ | 52.3 | $ | 71.4 | ||||
| Net operating losses | 22.9 | 31.6 | ||||||
| Other temporary differences | 3.1 | 4.4 | ||||||
| Intangible Assets | 0.7 | 0.0 | ||||||
| Right of Use Liability | 2.2 | 0.0 | ||||||
| Total gross deferred tax assets | 81.2 | 107.4 | ||||||
| Valuation allowance balance | (79.1 | ) | (104.5 | ) | ||||
| Gross deferred tax assets | 2.1 | 2.9 | ||||||
| Intangible assets | 0.0 | (0.3 | ) | |||||
| Other temporary differences | 0.0 | (2.6 | ) | |||||
| Right of Use Asset | (2.1 | ) | 0.0 | |||||
| Gross deferred tax liabilities | (2.1 | ) | (2.9 | ) | ||||
| Net deferred tax assets | $ | — | $ | — | ||||
Changes in the valuation allowance are as follows:
Schedule of Changes in the Valuation Allowance
December 31, 2022 | December 31, 2021 | |||||||
| (in millions) | ||||||||
| Beginning balance | $ | 104.5 | $ | 76.4 | ||||
| (Decrease) increase | (25.4 | ) | 28.1 | |||||
| Reversal of allowance | — | — | ||||||
| Ending balance | $ | 79.1 | $ | 104.5 | ||||
As of December 31, 2022 and 2021, the Company has $9.0 million and $39.5 million, respectively, of gross federal net operating loss carry forwards, these losses have an unlimited carry forward. The cumulative state net operating losses as of December 31, 2022 are $58.4 million, which begin to expire in 2026. The utilization of both the Company’s federal and state net operating losses may be subject to a limitation in the future due to the “change of ownership provisions” under Section 382 of the Internal Revenue Code. As of December 31, 2022, the Company has not had an ownership change under Section 382.
| December 31, | September 30, | |||||||
| 2019 | 2018 | |||||||
| (in millions) | ||||||||
| Depreciation | $ | 41.8 | $ | 32.1 | ||||
| Net operating losses | 23.5 | 23.1 | ||||||
| Other temporary differences | 4.5 | 2.5 | ||||||
| Total deferred tax assets | 69.8 | 57.7 | ||||||
| Valuation allowance balance | (65.7 | ) | (54.9 | ) | ||||
| Net deferred tax assets | 4.1 | 2.8 | ||||||
| Deferred tax liabilities | ||||||||
| Intangible assets | (2.5 | ) | (1.0 | ) | ||||
| Other temporary differences | (1.6 | ) | (1.8 | ) | ||||
| Net deferred tax liabilities | $ | — | $ | — | ||||
INSPIRED ENTERTAINMENT, INC. AND SUBSIDIARIES
NOTES TO CONSOLIDATED FINANCIAL STATEMENTS
AS OF DECEMBERAs of December 31, 2019 AND SEPTEMBER 30, 2018 AND
FOR THE PERIODS ENDED
DECEMBER 31, 2019, DECEMBER 31, 2018 AND SEPTEMBER 30, 20182022 and 2021, the Company also has gross net operating losses in foreign jurisdictions, primarily the United Kingdom, totalling $74.5 million and $83.2 million, respectively. The majority of these net operating losses have an unlimited carry forward period.
The differences between the US statutory tax rate and our effective rate are reflected in the following table:
| December 31, | December 31, | September 30, | ||||||||||
| 2019 | 2018 | 2018 | ||||||||||
| Statutory income tax | 21.0 | % | 21.0 | % | 24.5 | % | ||||||
| State taxes (net of federal) | 3.3 | % | 6.5 | % | 4.9 | % | ||||||
| Tax effect of permanent differences | (11.9 | )% | 89.6 | % | 61.1 | % | ||||||
| Effect of foreign taxes | (1.5 | )% | (3.7 | )% | (8.4 | )% | ||||||
| True ups | 3.2 | % | (6.3 | )% | — | |||||||
| Rate change | (0.5 | )% | (14.2 | )% | (9.0 | )% | ||||||
| Valuation allowance | (13.8 | )% | (89.5 | )% | (71.7 | )% | ||||||
| Effective income tax rate | (0.2 | )% | 3.4 | % | 1.4 | % | ||||||
TheCompany recorded a valuation allowance onagainst all of our deferred tax assets has been determined by considering all available evidence,as of both positive and negative, in order to ascertain whether it is more likely than not that carried forward deferred tax assets will be realized. The Company has a total potential net deferred tax asset carried forward of $65.7 million at December 31, 2019.
In assessing the realizability of deferred tax assets, management considers whether it is more likely than not that some portion or all of the deferred income tax assets will not be realized. The ultimate realization of deferred income tax assets is dependent upon the generation of future taxable income during the periods in which those temporary differences become deductible. Management considered the scheduled reversal of deferred income tax liabilities, projected future taxable income,2022, and tax planning strategies in making this assessment. Based on the consideration of these items, management determined that it is more likely than not that the Company will not realize the deferred income tax asset balances and therefore, recordedDecember 31, 2021. We intend to continue maintaining a full valuation allowance on our deferred tax assets until there is sufficient evidence to support the reversal of $65.7 millionall or some portion of these allowances. However, given our current earnings and anticipated future earnings, we believe that there is a reasonable possibility that within the next 12 months, sufficient positive evidence may become available to allow us to reach a conclusion that a significant portion of the valuation allowance will no longer be needed. Release of the valuation allowance would result in the recognition of certain deferred tax assets and a decrease to income tax expense for the period the release is recorded. However, the exact timing and amount of the valuation allowance release are subject to change on the basis of the level of profitability that we are able to actually achieve. The valuation allowance we recorded as of December 31, 2019.
Currently, there are no U.S. federal, state or foreign jurisdiction tax audits pending. The Company’s corporate U.S. federal2022 and state tax returns from 2016 to 2018 remain subject to examination by tax authorities and the Company’s foreign tax returns from 2012 to 2018 remain subject to examination by tax authorities.
In addition to the UK, the Company is subject to taxation in the US, and in certain foreign jurisdictions (primarily in Europe), where the total of non-UK taxes payable for the year ended December 31, 2019 is $23.1 thousand.2021 was $79.1 million and $104.5 million, respectively.
The Company has not recognized deferred tax liabilities in respect of unremitted earnings that are considered indefinitely reinvested in foreign subsidiaries.
The utilization We do not provide for taxes on our undistributed earnings of foreign subsidiaries that have not been previously taxed because we intend to invest such undistributed earnings indefinitely outside of the United States.
Currently, there are no federal, state or foreign jurisdiction tax audits pending. The Company’s pre-Merger net operating losses iscorporate federal and state tax returns from 2019 to 2021 remain subject to a limitation dueexamination by tax authorities and the Company’s foreign tax returns from 2014 to 2021 remain subject to examination by tax authorities.
In accordance with ASC 740, the “changeCompany has evaluated its tax positions to determine if there are any uncertain tax positions. As of ownership provisions” under Section 382 of the Internal Revenue Code and similar state provisions.
HG Vora Special Opportunities Master Fund, Ltd. (“HGV Fund”), which purchased the promissory notes issued under the NPA (see Note 13), owns approximately 16.3% of our common stock and warrants to purchase additional shares. HGV Fund is also a stockholder and investor in Leisure Acquisition Corp., a special purpose acquisition company affiliated with two members of our management. Interest expense paid to HGV Fund with respect to the promissory notes for the year ended December 31, 2019,2021 and 2022, the three months ended December 31, 2018Company has no unrecognized tax benefits for uncertain tax positions and has no accrued interest or penalties related to uncertain tax positions. The Company does not anticipate any material change in the year ended September 30, 2018 amounted to $12.3 million, $4.1 million and $2.1 million, respectively. The promissory notes undertotal amount of unrecognized tax benefits will occur within the NPA were repaid on October 1, 2019 (see Note 13).next twelve months.
| F-39 |
INSPIRED ENTERTAINMENT, INC. AND SUBSIDIARIES
NOTES TO CONSOLIDATED FINANCIAL STATEMENTS
AS OF DECEMBER 31, 20192022 AND SEPTEMBER 30, 20182021, AND
FOR THE PERIODSYEARS ENDED
DECEMBER 31, 2019, DECEMBER 31, 20182022, 2021 AND SEPTEMBER 30, 20182020
| 23. | Related Parties |
Macquarie Corporate Holdings Pty Limited (UK Branch) (“Macquarie UK”) is, (an arranger and lending party under our RCF Agreement), and Macquarie Capital (Europe) Limited (“Macquarie EUR”), (an arranger and initial purchaser of our Senior Secured Notes), are affiliates of MIHI LLC, which beneficially owned approximately 11.7% of our common stock as of December 31, 2022, and 11.4% of our common stock as of December 31, 2021. Macquarie UK was also one of the lending parties with respect to our senior secured term loansthe Prior Financing and its associated revolving credit facility under our senior facilities agreement dated September 27, 2019 (see Note 13). The portionfacility. Macquarie UK did not hold any of the total loans of $288.6 million under these facilities held by Macquarie UKCompany’s aggregate senior debt at December 31, 2019 was $25.8 million and the interest2022 or December 31, 2021. Interest expense payable to Macquarie UK for the years ended December 31, 2022, 2021 and 2020 amounted to $0.0 million, $0.9 million and $2.2 million, respectively. In addition, Macquarie EUR received $0.6 million of $5.5 million of fees paid in connection with the issuance of the Senior Secured Notes and the RCF in the year ended December 31, 2019,2021, and Macquarie UK received $0.3 million of a total $3.1 million of amendment fees paid with respect to the three monthsPrior Financing in the year ended December 31, 2018 and the year ended September 30, 2018 amounted to $0.5 million, $0.0 million and $0.0 million, respectively. Macquarie UK’s affiliate, MIHI LLC, which was a co-sponsor of our IPO, owns approximately 13.1% of our common stock and warrants to purchase additional shares.2020. MIHI LLC is also a party to thea stockholders agreement that we entered into onwith the Company and other stockholders, dated December 23, 2016, in connectionpursuant to which, subject to certain conditions, MIHI LLC, jointly with the closing of our Business Combination under which it and the Hydra Industries Sponsor LLC, are permitted to jointly designate two directors to be nominated for election as directors of the Board. Company at any annual or special meeting of stockholders at which directors are to be elected, until such time as MIHI LLC and Hydra Industries Sponsor LLC in the aggregate hold less than of the outstanding shares of the Company.
Amounts owed by Innov8 at December 31, 2019 amountedHG Vora Special Opportunities Master Fund Limited (“HG Vora”) (a purchaser of our Senior Secured Notes issued on May 20, 2021) was a significant stockholder until October 12, 2021. Interest expense payable to $0.9 million and revenue receivable from Innov8HG Vora while a related party for the year ended December 31, 20192021 amounted to $0.4$1.7 million.
We occupied office space leased by
On December 31, 2021, the Company entered into a company affiliatedconsultancy agreement with Richard Weil, the brother of A. Lorne Weil, our Executive Chairman, Hydra Management LLC, and incurred amounts monthlyunder which he received a success fee in maintenance expenses primarilythe amount of $0.1 million for the leaseservices he provided in connection with our acquisition of the office. Expenditures amounted to $0.1 millionSportech Lotteries, LLC. The success fee was paid during the year ended December 31, 2019 less than $0.1 million during2022. Under the three months ended December 31, 2018agreement, as extended in November 2022, he will provide consulting services relating to the lottery in the Dominican Republic through to June 30, 2023 at a rate of $10,000 per month and, $0.1 millionwith respect to such services, the aggregate amount incurred by the Company in consulting fees for the year ended September 30, 2018.December 31, 2022 was $0.1 million.
We incurred certain offering expenses in connection with an underwritten public offering of shares held by a significant stockholder, the Landgame Trust, which closed on June 1, 2021, as to which our expenses were reimbursed by the stockholder. For the year ended December 31, 2021, the aggregate amount invoiced for reimbursement was $0.2 million. The stockholder sold an aggregate of shares in the offering (including shares subject to an over-allotment option that was exercised in full) at an offering price of $ per share, less underwriting discounts and commissions of $ per share. One of the participating underwriters in the offering was Macquarie Capital (USA) Inc., an affiliate of MIHI LLC (see paragraph above), pursuant to which it purchased of the shares including shares subject to the over-allotment option.
The Company held a 40% non-controlling equity interest in Innov8 Gaming Limited (“Innov8”) from October 2019 until April 2020 when the Company disposed of its interest. Revenue earned from Innov8 while a related party for the year ended December 31, 2020 amounted to $0.6 million and purchases from Innov8 while a related party for the year ended December 31, 2020 amounted to $0.2 million. The value of the investment was impaired by $0.7 million to $Nil in March 2020 prior to disposal.
| 24. | Leases |
The Company as Lessee
The Company is party to operating leases with third parties with respect to various real estate and vehicles. Real estate leases typically include a lease (of the property) and a non-lease (provision of services) component which are accounted for separately. Where lease costs are variable due to future rent reviews, these are treated as part of the lease asset and lease liabilities as they are considered to qualify as variable lease costs which are subject to an index or rate. These costs are included at the amount prior to any reviews, as it is not permitted to estimate future rent reviews. Where real estate leases contain an option to terminate, any period beyond the option date is only included as part of the lease term if the Company is reasonably certain not to exercise the option. Vehicle leases typically contain a lease (of the vehicle) and a non-lease (provision of services) component which are accounted for separately.
The leases have remaining terms of 1 to 2010 years.
AtDuring the years to December 31, 20192021 and 2020, certain concessions were granted with respect to the Company’s operating leases in light of Covid-19. These took the form of lease extensions, where nothing was paid for a period of time with that same period of time and payments added onto the lease at the end, payment holidays, where payments were deferred until a later date, but with no lease extension, and discounted payments, where payments were reduced and not repaid either at a later date or through lease extensions. The Company is partyelected to an agreement that grants ituse the rightpractical expedient granted by the FASB and account for the concessions as if they were part of the enforceable rights and obligations of the parties under the existing lease contract for all affected operating leases. Lease extensions and discounted payments were accounted using the ‘cash basis’ approach, with the lease liability and right-of-use asset continuing to enter intobe accounted for as if payments were still being made under the original terms of the lease. Payment holidays were accounted for using the ‘remeasurement consistent with resolving a formal 12.5 yearcontingency’ approach, which involved remeasuring the liability and the right-of-use asset and continuing to recognize the total cost of the lease on a property once practical completion of certain works atstraight line basis over the property has been achieved. Relatedperiod to this, thewhich it relates.
| F-40 |
INSPIRED ENTERTAINMENT, INC. AND SUBSIDIARIES
NOTES TO CONSOLIDATED FINANCIAL STATEMENTS
AS OF DECEMBER 31, 2022 AND 2021, AND FOR THE YEARS ENDED
DECEMBER 31, 2022, 2021 AND 2020
The Company is paying for fit out works at the propertyalso party to finance leases with third parties with respect to gaming machines. The leases have remaining terms of between 24 and has recognized an asset in the course of construction as part of Property and Equipment amounting to $0.8 million.36 months.
The components of lease expense were as follows:
Schedule of Lease Expense
| Year Ended December 31, | Three Months Ended December 31, | Year Ended September 30, | Year Ended December 31, 2022 | Year Ended December 31, 2021 | Year Ended December 31, 2020 | |||||||||||||||||||
| 2019 | 2018 | 2018 | (in millions) | |||||||||||||||||||||
| (in millions) | ||||||||||||||||||||||||
| Finance lease costs: | ||||||||||||||||||||||||
| Depreciation | $ | 0.9 | $ | 0.5 | $ | 0.1 | ||||||||||||||||||
| Interest | 0.2 | 0.2 | 0.1 | |||||||||||||||||||||
| Operating lease costs | $ | 2.1 | $ | 0.6 | $ | 1.6 | 4.0 | 4.4 | 4.3 | |||||||||||||||
| Short-term lease costs | 0.9 | — | — | 1.2 | 1.3 | 1.5 | ||||||||||||||||||
| Variable lease costs | 0.7 | — | — | 4.3 | 2.9 | 1.7 | ||||||||||||||||||
| Total | $ | 3.7 | $ | 0.6 | $ | 1.6 | $ | 10.6 | $ | 9.3 | $ | 7.7 | ||||||||||||
| December 31, 2022 | December 31, 2021 | |||||||
| Weighted average remaining lease term – finance leases | 29.8 months | 39.1 months | ||||||
| Weighted average remaining lease term – operating leases | 68.5 months | 69.4 months | ||||||
| Weighted average discount rate – finance leases | 9.0 | % | 8.9 | % | ||||
| Weighted average discount rate – operating leases | 8.9 | % | 8.7 | % | ||||
INSPIRED ENTERTAINMENT, INC. AND SUBSIDIARIESAssets leased under finance leases had a cost of $2.3 million and $4.2 million at December 31, 2022 and 2021, respectively, and accumulated depreciation associated with these assets was $1.2 million and $0.6 million at December 31, 2022 and 2021, respectively.
NOTES TO CONSOLIDATED FINANCIAL STATEMENTS
AS OF DECEMBER 31, 2019 AND SEPTEMBER 30, 2018 AND
FOR THE PERIODS ENDED
DECEMBER 31, 2019, DECEMBER 31, 2018 AND SEPTEMBER 30, 2018
Future minimum finance lease payments as of December 31, 20192022 were as follows:
Schedule of Future Minimum Finance Lease Payments
| Year ending December 31, (in millions) | ||||
| 2023 | $ | 1.2 | ||
| 2024 | 0.9 | |||
| 2025 | 0.5 | |||
| 2026 | — | |||
| 2027 | — | |||
| Thereafter | — | |||
| Total future minimum lease payments | 2.6 | |||
| Less: imputed interest | (0.4 | ) | ||
| Total | $ | 2.2 | ||
Future minimum operating lease payments as of December 31, 2022 were as follows:
Schedule of Future Minimum Operating Lease Payments
| Year ending December 31, (in millions) | ||||
| 2023 | $ | 3.0 | ||
| 2024 | 2.5 | |||
| 2025 | 1.4 | |||
| 2026 | 0.9 | |||
| 2027 | 0.7 | |||
| Thereafter | 2.7 | |||
| Total future minimum lease payments | 11.2 | |||
| Less: imputed interest | (2.5 | ) | ||
| Total | $ | 8.7 | ||
| F-41 |
| Year ending December 31, (in millions) | ||||
| 2020 | $ | 3.8 | ||
| 2021 | 2.7 | |||
| 2022 | 1.4 | |||
| 2023 | 0.8 | |||
| 2024 | 0.6 | |||
| Thereafter | 1.1 | |||
| Total future minimum lease payments | 10.4 | |||
| Less: imputed interest | (1.6 | ) | ||
| Total | $ | 8.8 | ||
INSPIRED ENTERTAINMENT, INC. AND SUBSIDIARIES
NOTES TO CONSOLIDATED FINANCIAL STATEMENTS
AS OF DECEMBER 31, 2022 AND 2021, AND FOR THE YEARS ENDED
DECEMBER 31, 2022, 2021 AND 2020
The Company as Lessor
The Company is party to leases with third parties with respect to various gaming machines. Gaming machine leases typically include a lease (of the machine) and a non-lease (provision of software services) component.component, both of which are included in the amounts disclosed.
The leases have remaining terms of 13 to 3 years.36 months.
As ofDuring the years to December 31, 2019, assets recorded2021 and 2020, the Company granted concessions to customers in the form of lease extensions granted during the lockdown period, where nothing was paid during the concession period, with that same period of time and payments added onto the lease at the end. The Company elected to use the practical expedient granted by the FASB and account for the concessions as if they were part of the enforceable rights and obligations of the parties under the existing lease contract for all affected leases.
Assets leased under operating leases were $4.1had a cost of $5.3 million and $6.8 million at December 31, 2022 and 2021, respectively, and accumulated depreciation associated with finance leasesthese assets was $0.3 million.$3.6 million and $2.8 million at December 31, 2022 and 2021, respectively. Depreciation expense for the year ended December 31, 20192022, 2021 and 2020 amounted to $0.3 million.$1.5 million, $1.4 million and $1.5 million, respectively.
The components of lease income were as follows:
Schedule of Lease Income
| Year Ended December 31, | Three Months Ended December 31, | Year Ended September 30, | ||||||||||||||||||||||
| 2019 | 2018 | 2018 | Year Ended December 31, 2022 | Year Ended December 31, 2021 | Year Ended December 31, 2020 | |||||||||||||||||||
| (in millions) | (in millions) | |||||||||||||||||||||||
| Interest receivable from sales type leases | $ | 0.1 | $ | $ | $ | — | $ | — | $ | 0.1 | ||||||||||||||
| Operating lease income | 0.9 | 8.3 | 3.3 | 2.3 | ||||||||||||||||||||
| Profit recognized at commencement date of sales type leases | 0.3 | — | — | |||||||||||||||||||||
| Variable income from sales type leases | 0.3 | — | 0.1 | 0.7 | ||||||||||||||||||||
| Total | $ | 1.3 | $ | $ | $ | 8.6 | $ | 3.4 | $ | 3.1 | ||||||||||||||
Future minimum sales type lease receivables as of December 31, 20192022 were as follows:
Schedule of Future Minimum Sales Type Lease Receivables
| Year ending December 31, (in millions) | ||||||||
| 2020 | $ | 1.5 | ||||||
| 2021 | 0.6 | |||||||
| 2022 | 0.4 | |||||||
| 2023 | 0.1 | $ | 0.3 | |||||
| 2024 | 0.1 | |||||||
| 2025 | 0.1 | |||||||
| 2026 | — | |||||||
| 2027 | — | |||||||
| Total future minimum lease receivables | 2.6 | 0.5 | ||||||
| Less: imputed interest | (0.1 | ) | (0.1 | ) | ||||
| Total | $ | 2.5 | $ | 0.4 | ||||
Future minimum operating lease receivables as of December 31, 20192022 were as follows:
Schedule of Future Minimum Operating Type Lease Receivables
| Year ending December 31, (in millions) | ||||
| 2023 | $ | 8.2 | ||
| 2024 | 5.2 | |||
| 2025 | 2.6 | |||
| 2026 | — | |||
| 2027 | — | |||
| Total future minimum lease receivables | $ | 16.0 | ||
| F-42 |
| Year ending December 31, (in millions) | ||||
| 2020 | $ | 3.9 | ||
| 2021 | 3.7 | |||
| 2022 | 1.4 | |||
| Total future minimum lease receivables | $ | 9.0 | ||
INSPIRED ENTERTAINMENT, INC. AND SUBSIDIARIES
NOTES TO CONSOLIDATED FINANCIAL STATEMENTS
AS OF DECEMBER 31, 20192022 AND SEPTEMBER 30, 20182021, AND
FOR THE PERIODSYEARS ENDED
DECEMBER 31, 2019, DECEMBER 31, 20182022, 2021 AND SEPTEMBER 30, 20182020
| 25. | Commitments and Contingencies |
Employment Agreements
We are party to employment agreements with our executive officers and other employees of the Company and our subsidiaries which contain, among other terms, provisions relating to severance and notice requirements.
Legal Matters
From time to time, the Company may become involved in lawsuits and legal matters arising in the ordinary course of business. While the Company believes that, currently, it has no such matters that are material, there can be no assurance that existing or new matters arising in the ordinary course of business will not have a material adverse effect on the Company’s business, financial condition or results of operations.
| 26. | Pension Plan |
We operate a defined contribution plan in the US and both defined benefit and defined contributionscontribution pension schemes in the UK. The defined contribution scheme assets are held separately from those of the Company in an independently administered fund. The defined contribution pension cost charge represents contributions payable by the Company and amounted to $2.1$2.9 million, $0.4$2.4 million and $2.0$2.3 million for the year ended December 31, 2019, the three months ended December 31, 20182022, 2021 and the year ended September 30, 2018,2020, respectively. Contributions totaling $0.5 million, $0.3$1.2 million and $0.2$0.8 million were payable to the fund as at December 31, 2019, December 31, 20182022 and September 30, 2018,2021, respectively.
The defined benefit sectionscheme has been closed to new entrants since April 1, 1999 and closed to future accruals for services rendered to the Company for the entire financial statement periods presented in these consolidated financial statements. Retirement benefits are generally based on a portion of an employee’s pensionable earnings during years prior to 2010.
The latest triennial actuarial valuation of the scheme as at March 31, 20182021 was finalized in May 2019.June 2022. The actuarial valuation revealed that the statutory funding objective was not met, i.e. there were insufficient assets to cover the Scheme’s Technical Provisions and there was a funding shortfall of £5.6£8.2 million ($7.49.9 million) at the valuation date. Under the Recovery Plan and Schedule of Contributions agreed between the Trustee and the Company on March 15, 2019, June 28, 2022, it was agreed that no further deficit reductionthe shortfall will be met by contributions shall be made toof £0.9 million ($1.1 million) for each the scheme, except in the event that the scheme funding level does not progress as expected, in which case contingent contributions would be made subject to an agreed maximum amount. Atyears ended December 31 2019, it was determined that contingent contributions2021, 2022, 2023 and 2024, of $1.1£0.7 million will be payable during($0.8 million) for the year ended December 31, 2020.2025 and of £0.5 million ($0.6 million) for the period January 1, 2026 to October 31, 2026. The funding levelCompany will also make expense contributions of £0.3 million ($0.4 million) per annum for the scheme will next be tested againstperiod covered by the expected position as at December 31, 2020 to determine whether contingent contributions are payable over the year to December 31, 2021.Recovery Plan and Schedule of Contributions.
| F-43 |
INSPIRED ENTERTAINMENT, INC. AND SUBSIDIARIES
NOTES TO CONSOLIDATED FINANCIAL STATEMENTS
AS OF DECEMBER 31, 2022 AND 2021, AND FOR THE YEARS ENDED
DECEMBER 31, 2022, 2021 AND 2020
The trustee has made an allowance for the pension scheme liability profile when deciding the investment strategy of the pension scheme. Since the pension scheme is closed to new entrants and ceased future accrual with effect from March 31, 2010, it has continued to mature gradually. Therefore, the trustee reviews the investment strategy regularly to check whether any changes are needed. When considering the investment strategy, the trustee has taken into account the effect of any possible increases in the deficit reduction contributions on the financial position of the Company, and the extent to which the Company will be able to bear these changes.
The scheme’s investment policy is to maximize long-term financial return commensurate with security and minimizing risk.risk, with an objective of achieving a return of around 3% per annum above the return on UK Government bonds. This is achieved by holding a portfolio of marketable investments that avoids over-concentration of investment and spreads assets both over industries and geographies. In setting investment strategy, the trustees considered the lowest risk strategy that they could adopt in relation to the scheme’s liabilities and designed an asset allocation to achieve a higher return while maintaining a cautious approach to meeting the scheme’s liabilities. The trustees undertook a reviewundertake periodic reviews of the investment strategy and tooktake advice from their investment advisors. They consideredconsider a full range of asset classes, the risks and rewards of a range of alternative asset allocation strategies, the suitability of each asset class and the need for appropriate diversification. The pension scheme has implemented a new investment strategy over the year to reduce risk without adversely affecting return. The current strategy is to hold 22%12% in a diversified growth fund, 12%24% in diversified credit, 15%18% in a equity-linked bonds,liability-driven investment funds, 6% in acredit-linked liability-driven investment fundfunds and 45%40% in a buy-in policy.
INSPIRED ENTERTAINMENT, INC. AND SUBSIDIARIES
NOTES TO CONSOLIDATED FINANCIAL STATEMENTS
AS OF DECEMBER 31, 2019 AND SEPTEMBER 30, 2018 AND
FOR THE PERIODS ENDED
DECEMBER 31, 2019, DECEMBER 31, 2018 AND SEPTEMBER 30, 2018
Our pension benefit costs are calculated using various actuarial assumptions and methodologies. These assumptions include discount rates, inflation, expected returns on plan assets, mortality rates and other factors. The assumptions used in recording the obligations under our plans represent our best estimates, and we believe that they are reasonable, based on information as to historical experience and performance as well as other factors that might cause future expectations to differ from past trends. Differences in actual experience or changes in assumptions may affect our pension obligations and future expense. The principal factors contributing to actuarial gains and losses each year are (1) changes in the discount rate used to value pension benefit obligations as of the measurement date and (2) differences between the expected and the actual return on plan assets.
Our valuation methodologies used for pension assets measured at fair value are as follows. There have been no changes in the methodologies used at December 31, 2019,2022 and December 31, 2018 and September 30, 2018.2021.
The diversified fund is valued at fair value by using the net asset value (“NAV”) of shares held by the plan at the year end. The NAV of the diversified fund is not publicly quoted. The majority of the underlying securities have observable Level 1 or 2 pricing inputs, including quoted prices for similar assets in active or non-active markets. ASC 820, Fair Value Measurements and Disclosures, allows NAV per share to serve as a practical expedient to estimate the fair value of the diversified fund. ASC 820 also states that where NAV is allowed to be used as an estimate of fair value, if the reporting entity has the ability to redeem its investment at NAV as of the measurement date, that investment shall be categorized as a Level II fair value measurement. If the investment cannot be redeemed at the measurement date, but may be redeemable in the future, but at an uncertain date, the investment shall be categorized as a Level 3 fair value measurement.
As of December 31, 2019,2022 and December 31, 2018 and September 30, 2018,2021, the diversified fund was redeemable at NAV as of the measurement dates and, therefore, classified as Level 2.
With respect to the buy-in contract, it was agreed during the year ended September 27, 2014, that 281 pensioners of the plan would be insured by means of a pensioner buy-in. The liabilities and assets in respect of insured pensioners are assumed to match for the purposes of ASC 715, Pensions - Retirement Benefits, disclosures (i.e. the full benefits have been insured). The approach adopted has therefore been to include within the total value of assets, an amount equal to the calculated total liability value of the insured pensioners on the actuarial assumptions adopted for ASC 715 purposes. The buy-in contract is, therefore, classified as Level 3.
| F-44 |
INSPIRED ENTERTAINMENT, INC. AND SUBSIDIARIES
NOTES TO CONSOLIDATED FINANCIAL STATEMENTS
AS OF DECEMBER 31, 2022 AND 2021, AND FOR THE YEARS ENDED
DECEMBER 31, 2022, 2021 AND 2020
The following table sets forth the combined funded status of the pension plans and their reconciliation to the related amounts recognized in our consolidated financial statements at the respective measurement dates:
Schedule of Pension Plans and their Reconciliation
December 31, 2019 | September 30, 2018 | December 31, 2022 | December 31, 2021 | |||||||||||||
| (in millions) | (in millions) | |||||||||||||||
| Change in benefit obligation: | ||||||||||||||||
| Benefit obligation at beginning of period | $ | 94.1 | $ | 105.9 | $ | 114.7 | $ | 127.8 | ||||||||
| Interest cost | 2.7 | 2.9 | 2.1 | 1.6 | ||||||||||||
| Prior service cost | — | 0.5 | ||||||||||||||
| Actuarial (gain)/loss | 14.1 | (8.3 | ) | |||||||||||||
| Actuarial (gain) loss | (35.5 | ) | (9.8 | ) | ||||||||||||
| Benefits paid | (4.2 | ) | (2.6 | ) | (3.5 | ) | (3.5 | ) | ||||||||
| Foreign currency translation adjustments | 3.7 | (2.6 | ) | (10.4 | ) | (1.4 | ) | |||||||||
| Benefit obligation at end of period | $ | 110.4 | $ | 95.8 | $ | 67.4 | $ | 114.7 | ||||||||
| Change in plan assets: | ||||||||||||||||
| Fair value of plan assets at beginning of period | $ | 97.4 | $ | 102.5 | $ | 117.7 | $ | 118.7 | ||||||||
| Actual gain/(loss) on plan assets | 10.3 | 0.7 | ||||||||||||||
| Actual (loss) gain on plan assets | (39.1 | ) | 2.5 | |||||||||||||
| Employer contributions | 0.2 | 3.3 | 1.4 | 1.5 | ||||||||||||
| Benefits paid | (4.2 | ) | (2.6 | ) | (3.5 | ) | (3.5 | ) | ||||||||
| Foreign currency translation adjustments | 3.6 | (2.8 | ) | (11.2 | ) | (1.5 | ) | |||||||||
| Fair value of assets at end of period | $ | 107.3 | $ | 101.1 | $ | 65.3 | $ | 117.7 | ||||||||
| Amount recognized in the consolidated balance sheets: | ||||||||||||||||
| Overfunded (Unfunded) status (non-current) | $ | (3.1 | ) | $ | 5.3 | |||||||||||
| (Unfunded) Overfunded status (non-current) | $ | (2.1 | ) | $ | 3.0 | |||||||||||
| Net amount recognized | $ | (3.1 | ) | $ | 5.3 | $ | (2.1 | ) | $ | 3.0 | ||||||
INSPIRED ENTERTAINMENT, INC. AND SUBSIDIARIES
NOTES TO CONSOLIDATED FINANCIAL STATEMENTS
AS OF DECEMBER 31, 2019 AND SEPTEMBER 30, 2018 AND
FOR THE PERIODS ENDED
DECEMBER 31, 2019, DECEMBER 31, 2018 AND SEPTEMBER 30, 2018
The following table presents the components of our net periodic pension benefit(benefit) cost:
Schedule of Defined Benefit Plans
December 31, 2019 | September 30, 2018 | Year Ended December 31, 2022 | Year Ended December 31, 2021 | Year Ended December 31, 2020 | ||||||||||||||||
| (in millions) | (in millions) | |||||||||||||||||||
| Components of net periodic pension benefit cost: | ||||||||||||||||||||
| Components of net periodic pension (benefit) cost: | ||||||||||||||||||||
| Interest cost | $ | 2.7 | $ | 3.0 | $ | 2.1 | $ | 1.6 | $ | 2.2 | ||||||||||
| Expected return on plan assets | (3.5 | ) | (3.7 | ) | (3.2 | ) | (2.7 | ) | (3.1 | ) | ||||||||||
| Amortization of net loss | 0.3 | 0.4 | 0.5 | 0.9 | 0.6 | |||||||||||||||
| Net periodic (benefit) cost | $ | (0.5 | ) | $ | (0.3 | ) | $ | (0.6 | ) | $ | (0.2 | ) | $ | (0.3 | ) | |||||
The accumulated benefit obligation for all defined benefit pension plans was $110.4$67.4 million and $95.8$114.7 million as of December 31, 20192022 and September 30, 2018,December 31, 2021, respectively. The (underfunded) overfunded (underfunded) status of our defined benefit pension plans recorded as an asset/liabilitya (liability) asset in our consolidated balance sheets as of December 31, 20192022 and September 30, 2018December 31, 2021 was $(3.1)$(2.1) million and $5.3$3.0 million, respectively.
The estimated net loss, net transition asset (obligation) and prior service cost for the plan that will be amortized from accumulated other comprehensive income into net periodic pension cost over the next fiscal year are $0.6$0.9 million, $nil$nil and $nil,$nil, respectively.
The fair value of the plan assets at December 31, 20192022 by asset category is presented below:
Schedule of Fair Value of Plan Assets
| Level 1 | Level 2 | Level 3 | Total | |||||||||||||
| (in millions) | ||||||||||||||||
| Diversified fund | $ | — | $ | 40.7 | $ | — | $ | 40.7 | ||||||||
| Buy-in contract | — | — | 24.3 | 24.3 | ||||||||||||
| Cash and other current assets | 0.3 | — | — | 0.3 | ||||||||||||
| Total | $ | 0.3 | $ | 40.7 | $ | 24.3 | $ | 65.3 | ||||||||
| F-45 |
| Level 1 | Level 2 | Level 3 | Total | |||||||||||||
| (in millions) | ||||||||||||||||
| Diversified fund | $ | — | $ | 68.0 | $ | — | $ | 68.0 | ||||||||
| Buy-in contract | — | — | 38.8 | 38.8 | ||||||||||||
| Cash | 0.5 | — | — | 0.5 | ||||||||||||
| Total | $ | 0.5 | $ | 68.0 | $ | 38.8 | $ | 107.3 | ||||||||
INSPIRED ENTERTAINMENT, INC. AND SUBSIDIARIES
NOTES TO CONSOLIDATED FINANCIAL STATEMENTS
AS OF DECEMBER 31, 2022 AND 2021, AND FOR THE YEARS ENDED
DECEMBER 31, 2022, 2021 AND 2020
The fair value of the plan assets at September 30, 2018December 31, 2021 by asset category is presented below:
| Level 1 | Level 2 | Level 3 | Total | Level 1 | Level 2 | Level 3 | Total | |||||||||||||||||||||||||
| (in millions) | (in millions) | |||||||||||||||||||||||||||||||
| Diversified fund | $ | — | $ | 63.9 | $ | — | $ | 63.9 | $ | — | $ | 79.1 | $ | — | $ | 79.1 | ||||||||||||||||
| Buy-in contract | — | — | 36.6 | 36.6 | — | — | 38.1 | 38.1 | ||||||||||||||||||||||||
| Cash | 0.6 | — | — | 0.6 | 0.5 | — | — | 0.5 | ||||||||||||||||||||||||
| Total | $ | 0.6 | $ | 63.9 | $ | 36.6 | $ | 101.1 | $ | 0.5 | $ | 79.1 | $ | 38.1 | $ | 117.7 | ||||||||||||||||
The table below presents the weighted-average actuarial assumptions used to determine the benefit obligation and net periodic benefit cost for the Plan.
Schedule of Benefit Obligation and Net Periodic Benefit Cost for Plan
December 31, | September 30, | December 31, 2022 | December 31, 2021 | |||||||||||||
| Discount rate | 2.10 | % | 2.90 | % | 5.00 | % | 2.00 | % | ||||||||
| Expected return on assets | 3.00 | % | 3.70 | % | 5.70 | % | 3.00 | % | ||||||||
| RPI inflation | 3.00 | % | 3.20 | % | 3.13 | % | 3.25 | % | ||||||||
| CPI inflation | 2.10 | % | 2.20 | % | ||||||||||||
| CPI inflation – pre 2030 | 2.13 | % | 2.25 | % | ||||||||||||
| CPI inflation – post 2030 | 2.93 | % | 3.05 | % | ||||||||||||
| Pension increases – pre-2006 service | 2.90 | % | 3.10 | % | 2.90 | % | 3.15 | % | ||||||||
| Pension increases – post-2006 service | 2.10 | % | 2.20 | % | 1.89 | % | 2.20 | % | ||||||||
| Pension increases – post 1988 GMP – pre 2030 | 1.83 | % | 2.10 | % | ||||||||||||
| Pension increases – post 1988 GMP – post 2030 | 2.21 | % | 2.60 | % | ||||||||||||
The following benefit payments are expected to be paid:
Schedule of Benefit Payments are Expected to Be Paid
| (in millions) | ||||
| 2020 | $ | 2.7 | ||
| 2021 | $ | 2.8 | ||
| 2022 | $ | 2.9 | ||
| 2023 | $ | 3.1 | ||
| 2023 | $ | 3.1 | ||
| Thereafter | $ | 19.3 | ||
| (in millions) | ||||
| 2023 | $ | 3.2 | ||
| 2024 | $ | 2.8 | ||
| 2025 | $ | 3.2 | ||
| 2026 | $ | 3.3 | ||
| 2027 | $ | 3.6 | ||
| 2028 to 2032 | $ | 20.5 | ||
INSPIRED ENTERTAINMENT, INC. AND SUBSIDIARIES
NOTES TO CONSOLIDATED FINANCIAL STATEMENTS
AS OF DECEMBER 31, 2019 AND SEPTEMBER 30, 2018 AND
FOR THE PERIODS ENDED
DECEMBER 31, 2019, DECEMBER 31, 2018 AND SEPTEMBER 30, 2018
| 27. | Segment Reporting and Geographic Information |
Operating segments are identified as components of an enterprise for which separate and discrete financial information is available and is used by the chief operating decision maker, or decision-making group, in making decisions on how to allocate resources and assess performance. The Company’s chief decision-maker is the Office of the Executive Chairman.
The Company’s chief decision-maker reviews financial information presented on a consolidated basis, accompanied by disaggregated information about revenue and operating profit by operatingreporting unit. This information is used for purposes of allocating resources and evaluating financial performance.
The Company operates its business along threefour operating segments, which are segregated based on the basis of revenue stream: Service Based Gaming, Virtual Sports, (which includes Interactive)Interactive and Acquired Businesses.Leisure. The Company believes this method of segment reporting reflects both the way its business segments are managed and the way the performance of each segment is evaluated.
The accounting policies of the segments are the same as those described in the “Summary of Significant Accounting Policies.”
| F-46 |
INSPIRED ENTERTAINMENT, INC. AND SUBSIDIARIES
NOTES TO CONSOLIDATED FINANCIAL STATEMENTS
AS OF DECEMBER 31, 2022 AND 2021, AND FOR THE YEARS ENDED
DECEMBER 31, 2022, 2021 AND 2020
The following tables present revenue, cost of sales, excluding depreciation and amortization, selling, general and administrative expenses, depreciation and amortization, stock-based compensation expense and acquisition related transaction expenses, operating profit/(loss), total assets and total capital expenditures for the periodsyears ended December 31, 2019,2022, December 31, 20182021 and September 30, 2018,December 31, 2020, respectively, by business segment. Certain unallocated corporate function costs have not been allocated to the Company’s reportable operating segments because these costs are not allocable and to do so would not be practical. Corporate function costs consist primarily of selling, general and administrative expenses, depreciation and amortization, capital expenditures, right of use assets, cash, prepaid expenses and property and equipment and software development costs relating to corporate/shared functions. All acquisition and integration related transaction expenses are allocated as corporate function costs.
As a result of improved processes that have allowed us to more accurately allocate costs between reporting segments, we have reclassified the previously reported segment allocation of selling, general and administrative expenses and stock-based compensation expense for the year ended September 30, 2018.
Segment Information
Schedule of Segment Reporting Information by Segment
Year Ended December 31, 20192022
| Gaming | Virtual Sports | Interactive | Leisure | Corporate Functions | Total | |||||||||||||||||||
| (in millions) | ||||||||||||||||||||||||
| Revenue: | ||||||||||||||||||||||||
| Service | $ | 80.4 | $ | 55.1 | $ | 23.1 | $ | 93.2 | $ | — | $ | 251.8 | ||||||||||||
| Product sales | 31.3 | — | — | 2.3 | — | 33.6 | ||||||||||||||||||
| Total revenue | 111.7 | 55.1 | 23.1 | 95.5 | — | 285.4 | ||||||||||||||||||
| Cost of sales, excluding depreciation and amortization: | ||||||||||||||||||||||||
| Cost of service | (19.3 | ) | (2.4 | ) | (3.7 | ) | (23.9 | ) | — | (49.3 | ) | |||||||||||||
| Cost of product sales | (21.0 | ) | — | — | (1.7 | ) | — | (22.7 | ) | |||||||||||||||
| Selling, general and administrative expenses | (30.1 | ) | (6.9 | ) | (7.1 | ) | (45.8 | ) | (25.7 | ) | (115.6 | ) | ||||||||||||
| Stock-based compensation expense | (1.6 | ) | (0.7 | ) | (0.7 | ) | (0.6 | ) | (7.2 | ) | (10.8 | ) | ||||||||||||
| Acquisition and integration related transaction expenses | — | — | — | — | (0.5 | ) | (0.5 | ) | ||||||||||||||||
| Depreciation and amortization | (16.6 | ) | (2.6 | ) | (2.9 | ) | (13.5 | ) | (2.0 | ) | (37.6 | ) | ||||||||||||
| Segment operating income (loss) | 23.1 | 42.5 | 8.7 | 10.0 | (35.4 | ) | 48.9 | |||||||||||||||||
| Net operating income | $ | 48.9 | ||||||||||||||||||||||
| Total assets at December 31, 2022 | $ | 107.8 | $ | 59.4 | $ | 15.1 | $ | 81.0 | $ | 46.1 | $ | 309.4 | ||||||||||||
| Total goodwill at December 31, 2022 | $ | 1.3 | $ | 42.3 | $ | 0.4 | $ | 29.9 | $ | — | $ | 73.9 | ||||||||||||
| Total capital expenditures for the year ended December 31, 2022 | $ | 16.7 | $ | 4.0 | $ | 5.3 | $ | 10.5 | $ | 3.6 | $ | 40.1 | ||||||||||||
Year Ended December 31, 2021
| Gaming | Virtual Sports | Interactive | Leisure | Corporate Functions | Total | |||||||||||||||||||
| (in millions) | ||||||||||||||||||||||||
| Revenue: | ||||||||||||||||||||||||
| Service | $ | 58.8 | $ | 36.0 | $ | 22.8 | $ | 65.7 | $ | — | $ | 183.3 | ||||||||||||
| Product sales | 22.6 | — | — | 3.0 | — | 25.6 | ||||||||||||||||||
| Total revenue | 81.4 | 36.0 | 22.8 | 68.7 | — | 208.9 | ||||||||||||||||||
| Cost of sales, excluding depreciation and amortization: | �� | |||||||||||||||||||||||
| Cost of service | (12.8 | ) | (1.9 | ) | (3.7 | ) | (15.9 | ) | — | (34.3 | ) | |||||||||||||
| Cost of product sales | (14.4 | ) | — | — | (2.0 | ) | — | (16.4 | ) | |||||||||||||||
| Selling, general and administrative expenses | (28.1 | ) | (7.1 | ) | (6.1 | ) | (35.1 | ) | (20.8 | ) | (97.2 | ) | ||||||||||||
| Stock-based compensation expense | (1.8 | ) | (0.8 | ) | (0.6 | ) | (0.6 | ) | (9.2 | ) | (13.0 | ) | ||||||||||||
| Acquisition and integration related transaction expenses | — | — | — | — | (1.6 | ) | (1.6 | ) | ||||||||||||||||
| Depreciation and amortization | (22.5 | ) | (3.4 | ) | (3.2 | ) | (16.1 | ) | (1.8 | ) | (47.0 | ) | ||||||||||||
| Segment operating income (loss) | 1.8 | 22.8 | 9.2 | (1.0 | ) | (33.4 | ) | (0.6 | ) | |||||||||||||||
| Net operating loss | $ | (0.6 | ) | |||||||||||||||||||||
| Total assets at December 31, 2021 | $ | 100.5 | $ | 61.6 | $ | 12.3 | $ | 85.7 | $ | 71.6 | $ | 331.7 | ||||||||||||
| Total goodwill at December 31, 2021 | $ | 1.4 | $ | 47.4 | $ | 0.4 | $ | 33.5 | $ | — | $ | 82.7 | ||||||||||||
| Total capital expenditures for the year ended December 31, 2021 | $ | 10.9 | $ | 3.3 | $ | 3.7 | $ | 8.9 | $ | 1.4 | $ | 28.2 | ||||||||||||
| F-47 |
Server Based | Virtual Sports | Acquired Businesses | Intergroup Eliminations | Corporate Functions | Total | |||||||||||||||||||
| (in millions) | ||||||||||||||||||||||||
| Revenue: | ||||||||||||||||||||||||
| Service | $ | 71.0 | $ | 37.0 | $ | 27.6 | $ | (0.7 | ) | $ | — | $ | 134.9 | |||||||||||
| Hardware | 13.5 | — | 5.3 | (0.3 | ) | — | 18.5 | |||||||||||||||||
| Total revenue | 84.5 | 37.0 | 32.9 | (1.0 | ) | — | 153.4 | |||||||||||||||||
| Cost of sales, excluding depreciation and amortization: | ||||||||||||||||||||||||
| Cost of service | (17.6 | ) | (3.2 | ) | (3.4 | ) | 0.7 | — | (23.5 | ) | ||||||||||||||
| Cost of hardware | (9.1 | ) | — | (3.8 | ) | 0.3 | — | (12.6 | ) | |||||||||||||||
| Selling, general and administrative expenses | (23.6 | ) | (8.7 | ) | (20.1 | ) | — | (20.2 | ) | (72.6 | ) | |||||||||||||
| Stock-based compensation expense | (1.7 | ) | (1.4 | ) | — | — | (5.9 | ) | (9.0 | ) | ||||||||||||||
| Acquisition and integration related transaction expenses | — | — | — | — | (6.7 | ) | (6.7 | ) | ||||||||||||||||
| Depreciation and amortization | (29.1 | ) | (5.5 | ) | (6.0 | ) | — | (1.4 | ) | (42.0 | ) | |||||||||||||
| Segment operating income (loss) | 3.4 | 18.2 | (0.4 | ) | — | (34.2 | ) | (13.0 | ) | |||||||||||||||
| Net operating loss | $ | (13.0 | ) | |||||||||||||||||||||
| Total assets at December 31, 2019 | $ | 80.8 | $ | 66.8 | $ | 156.7 | $ | — | $ | 23.1 | $ | 327.4 | ||||||||||||
| Total goodwill at December 31, 2019 | $ | — | $ | 46.4 | $ | 34.5 | $ | — | $ | — | $ | 80.9 | ||||||||||||
| Total capital expenditures for the year ended December 31, 2019 | $ | 12.3 | $ | 5.9 | $ | 4.4 | $ | — | $ | 2.6 | $ | 25.2 | ||||||||||||
INSPIRED ENTERTAINMENT, INC. AND SUBSIDIARIES
NOTES TO CONSOLIDATED FINANCIAL STATEMENTS
AS OF DECEMBER 31, 20192022 AND SEPTEMBER 30, 20182021, AND
FOR THE PERIODSYEARS ENDED
DECEMBER 31, 2019, DECEMBER 31, 20182022, 2021 AND SEPTEMBER 30, 20182020
Three MonthsYear Ended December 31, 20182020
| Server Based Gaming | Virtual Sports | Corporate Functions | Total | Gaming | Virtual Sports | Interactive | Leisure | Corporate Functions | Total | |||||||||||||||||||||||||||||||
| (in millions) | (in millions) | |||||||||||||||||||||||||||||||||||||||
| Revenue: | �� | |||||||||||||||||||||||||||||||||||||||
| Service | $ | 21.8 | $ | 8.2 | $ | — | $ | 30.0 | $ | 92.2 | $ | 32.4 | $ | 13.3 | $ | 40.8 | $ | — | $ | 178.7 | ||||||||||||||||||||
| Hardware | 0.7 | — | — | 0.7 | ||||||||||||||||||||||||||||||||||||
| Product sales | 18.3 | — | — | 2.8 | — | 21.1 | ||||||||||||||||||||||||||||||||||
| Total revenue | 22.5 | 8.2 | — | 30.7 | 110.5 | 32.4 | 13.3 | 43.6 | — | 199.8 | ||||||||||||||||||||||||||||||
| Cost of sales, excluding depreciation and amortization: | ||||||||||||||||||||||||||||||||||||||||
| Cost of service | (4.9 | ) | (1.1 | ) | — | (6.0 | ) | (15.7 | ) | (2.9 | ) | (1.9 | ) | (9.6 | ) | — | (30.1 | ) | ||||||||||||||||||||||
| Cost of hardware | (0.6 | ) | — | — | (0.6 | ) | ||||||||||||||||||||||||||||||||||
| Cost of product sales | (12.4 | ) | — | — | (2.0 | ) | — | (14.4 | ) | |||||||||||||||||||||||||||||||
| Selling, general and administrative expenses | (6.9 | ) | (3.2 | ) | (5.2 | ) | (15.3 | ) | (24.5 | ) | (4.4 | ) | (3.9 | ) | (30.8 | ) | (21.2 | ) | (84.8 | ) | ||||||||||||||||||||
| Stock-based compensation expense | (0.1 | ) | (0.1 | ) | (1.4 | ) | (1.6 | ) | (0.8 | ) | (0.4 | ) | (0.3 | ) | (0.1 | ) | (3.2 | ) | (4.8 | ) | ||||||||||||||||||||
| Acquisition related transaction expenses | — | — | (0.1 | ) | (0.1 | ) | ||||||||||||||||||||||||||||||||||
| Acquisition and integration related transaction expenses | — | — | — | — | (7.0 | ) | (7.0 | ) | ||||||||||||||||||||||||||||||||
| Depreciation and amortization | (7.8 | ) | (1.4 | ) | (0.3 | ) | (9.5 | ) | (27.6 | ) | (3.7 | ) | (2.3 | ) | (16.9 | ) | (1.8 | ) | (52.3 | ) | ||||||||||||||||||||
| Segment operating income (loss) | 2.2 | 2.4 | (7.0 | ) | (2.4 | ) | 29.5 | 21.0 | 4.9 | ) | (15.8 | ) | (33.2 | ) | 6.4 | |||||||||||||||||||||||||
| Net operating loss | $ | (2.4 | ) | $ | 6.4 | |||||||||||||||||||||||||||||||||||
| Total assets at December 31, 2018 | $ | 93.0 | $ | 68.1 | $ | 25.6 | $ | 186.7 | ||||||||||||||||||||||||||||||||
| Total goodwill at December 31, 2018 | $ | — | $ | 44.9 | $ | — | $ | 44.9 | ||||||||||||||||||||||||||||||||
| Total capital expenditures for the three months ended December 31, 2018 | $ | 2.1 | $ | 1.2 | $ | 0.1 | $ | 3.4 | ||||||||||||||||||||||||||||||||
| Total capital expenditures for the year ended December 31, 2020 | $ | 8.9 | $ | 4.8 | $ | 2.7 | $ | 8.7 | $ | 4.9 | $ | 30.0 | ||||||||||||||||||||||||||||
INSPIRED ENTERTAINMENT, INC. AND SUBSIDIARIES
NOTES TO CONSOLIDATED FINANCIAL STATEMENTS
AS OF DECEMBER 31, 2019 AND SEPTEMBER 30, 2018 AND
FOR THE PERIODS ENDED
DECEMBER 31, 2019, DECEMBER 31, 2018 AND SEPTEMBER 30, 2018
Year Ended September 30, 2018
| Server Based Gaming | Virtual Sports | Corporate Functions | Total | |||||||||||||
| (in millions) | ||||||||||||||||
| Revenue: | ||||||||||||||||
| Service | $ | 93.1 | $ | 37.8 | $ | — | $ | 130.9 | ||||||||
| Hardware | 10.5 | — | — | 10.5 | ||||||||||||
| Total revenue | 103.6 | 37.8 | — | 141.4 | ||||||||||||
| Cost of sales, excluding depreciation and amortization: | ||||||||||||||||
| Cost of service | (18.0 | ) | (4.6 | ) | — | (22.6 | ) | |||||||||
| Cost of hardware | (8.2 | ) | — | — | (8.2 | ) | ||||||||||
| Selling, general and administrative expenses | (32.1 | ) | (10.7 | ) | (17.3 | ) | (60.1 | ) | ||||||||
| Stock-based compensation expense | (0.9 | ) | (0.8 | ) | (5.7 | ) | (7.4 | ) | ||||||||
| Impairment expense | (4.7 | ) | (3.0 | ) | — | (7.7 | ) | |||||||||
| Acquisition and integration related transaction expenses | — | — | (0.9 | ) | (0.9 | ) | ||||||||||
| Depreciation and amortization | (34.1 | ) | (6.3 | ) | (1.4 | ) | (41.8 | ) | ||||||||
| Segment operating income (loss) | 5.6 | 12.4 | (25.3 | ) | (7.3 | ) | ||||||||||
| Net operating loss | $ | (7.3 | ) | |||||||||||||
| Total assets at September 30, 2018 | $ | 103.4 | $ | 69.5 | $ | 35.0 | $ | 207.9 | ||||||||
| Total goodwill at September 30, 2018 | $ | — | $ | 45.8 | $ | — | $ | 45.8 | ||||||||
| Total capital expenditures for the year ended September 30, 2018 | $ | 35.3 | $ | 6.8 | $ | 0.2 | $ | 42.3 | ||||||||
Geographic Information
Geographic information for revenue is set forth below:
Schedule of Geographic Information
| Year Ended December 31, 2019 | Three Months Ended December 31, 2018 | Year Ended September 30, 2018 | Year Ended December 31, 2022 | Year Ended December 31, 2021 | Year Ended December 31, 2020 | |||||||||||||||||||
| (in millions) | (in millions) | |||||||||||||||||||||||
| Total revenue | ||||||||||||||||||||||||
| UK | $ | 103.7 | $ | 18.6 | $ | 89.6 | $ | 209.5 | $ | 149.1 | $ | 152.3 | ||||||||||||
| Greece | 20.7 | 4.8 | 23.4 | 22.9 | 18.6 | 17.0 | ||||||||||||||||||
| Italy | 16.2 | 5.1 | 18.6 | |||||||||||||||||||||
| Rest of world | 12.8 | 2.2 | 9.8 | 53.0 | 41.2 | 30.5 | ||||||||||||||||||
| Total | $ | 153.4 | $ | 30.7 | $ | 141.4 | $ | 285.4 | $ | 208.9 | $ | 199.8 | ||||||||||||
| Total revenue | $ | 285.4 | $ | 208.9 | $ | 199.8 | ||||||||||||||||||
UK revenue includes revenue from customers headquartered in the UK, but whose revenue is generated globally.
Geographic information of our non-current assets excluding goodwill is set forth below:
| Year Ended December 31, 2019 | Three Months Ended December 31, 2018 | Year Ended September 30, 2018 | December 31, 2022 | December 31, 2021 | ||||||||||||||||
| (in millions) | (in millions) | |||||||||||||||||||
| UK | $ | 116.1 | $ | 52.8 | $ | 60.0 | $ | 83.2 | $ | 90.0 | ||||||||||
| Greece | 26.5 | 32.8 | 36.2 | 6.7 | 11.6 | |||||||||||||||
| Italy | 2.3 | 3.0 | 3.4 | |||||||||||||||||
| Rest of world | 6.3 | 4.1 | 3.9 | 17.0 | 21.0 | |||||||||||||||
| Total | $ | 151.2 | $ | 92.7 | $ | 103.5 | $ | 106.9 | $ | 122.6 | ||||||||||
| Total non- current assets excluding goodwill | $ | 106.9 | $ | 122.6 | ||||||||||||||||
Software development costs are included as attributable to the market in which they are utilized.
| F-48 |
INSPIRED ENTERTAINMENT, INC. AND SUBSIDIARIES
NOTES TO CONSOLIDATED FINANCIAL STATEMENTS
AS OF DECEMBER 31, 20192022 AND SEPTEMBER 30, 20182021, AND
FOR THE PERIODSYEARS ENDED
DECEMBER 31, 2019, DECEMBER 31, 20182022, 2021 AND SEPTEMBER 30, 20182020
| 28. | Customer Concentration |
During the year ended December 31, 2019, two customers2022, one customer represented at least 10% of revenues, accounting for 14% and 13% of the Company’s revenues. This customer was served by the Virtual Sports and Interactive segments. During the three monthsyear ended December 31, 2018, three2021, no customers represented at least 10% of revenues. During the year ended December 31, 2020, one customer represented at least 10% of revenues, accounting for 25%, 16% and 11%22% of the Company’s revenues. During the year ended September 30, 2018, three customers represented at least 10% of revenues, accounting for 24%, 17% and 13% of the Company’s revenues. All these customers wereThis customer was served by both the Server Based Gaming, and Virtual Sports and Interactive segments.
At December 31, 2019, no customers2022, there was one customer that represented at least 10% of the Company’s accounts receivable. At September 30, 2018, three customers represented at least 10% of accounts receivable, accounting for 15%, 13% and 12%24% of the Company’s accounts receivable. At December, 2021, there were no customers that represented at least 10% of the Company’s accounts receivable.
| 29. | Subsequent Events |
The Company evaluates subsequent events and transactions that occur after the balance sheet date up to the date that the financial statements were issued. Other than as described below, theThe Company did not identify subsequent events that would have required adjustment or disclosure in the consolidated financial statements.
| F-49 |
As a result of the vesting on December 31, 2019 of 273,316 RSUs that had been granted under the Company’s 2018 Plan, the Company issued a total of 166,959 net shares to participants in January 2020 and withheld the balance for taxes.
On January 15, 2020, the Company entered into two interest rate swaps with UBS AG designed to protect the Company against adverse fluctuations in interest rates by reducing its exposure to variability in cash flows on a portion of the current floating rate debt facilities. The swaps fix the variable interest rate of the current debt facilities and provide protection over potential interest rate increases by providing a fixed rate of interest payment in return. These interest rate swaps are for £95 million at a fixed rate of 0.9255% based on the 6-month LIBOR rate and for €60 million at a fixed rate of 0.102% based on the 6 month EUROLIBOR rate and are effective until maturity on October 1, 2023.
As a result of the spread of COVID-19 coronavirus outbreak and subsequent government controls across the territories in which the Company operates (including, but not limited to, the United States, United Kingdom, Greece and Italy) economic uncertainties have arisen which will negatively impact future revenues, at least in the short term, while our customers’ respective land-based venues are closed. Market conditions could remain volatile for some months, and financial impacts could occur, including impairments to receivables, inventory, goodwill and other long lived assets including assets held by the pension scheme, where it is possible that the funded status of the plan recognized on the balance sheet has deteriorated if post balance sheet experience is taken into account. As at the date of filing, indications are that the value of the pension scheme benefit obligation has decreased to a greater extent to that of the assets, with the result that, if reported now, the scheme would recognize an overfunded status. Market conditions remain volatile, however, and any associated actuarial loss (or gain) over the fiscal year to December 31, 2020 will be added to the net actuarial loss (or gain) in accumulated other comprehensive income and amortized over future fiscal years. The potential impact across all asset categories is currently unknown, and will depend, primarily, on the extent of the length of controls.Item 16. Form 10-K Summary.
None.
On March 26, 2020, Lorne Weil, the Executive Chairman of the Company, voluntarily withdrew his Employment Agreement, dated January 31, 2020, from consideration at our upcoming annual meeting of stockholders. Mr. Weil remains employed under his original employment agreement, dated January 16, 2017, as amended.
Exhibits
In addition, the Office of the Executive Chairman and other executives have consented to temporary reductions in base pay calculated on a percentage basis on each of the tiered stacks of the executive’s salary ranging from 0% for the portion under £25,000 to 33.3% for the over £300,000 portion, including as follows:
| (c) |
| Exhibit Number |
| 65 |
| 66 |
| 67 |
| Exhibit Number | Description | |
| Non-Employee Director Compensation Policy (as amended and restated) (incorporated herein by reference to Exhibit 10.1 to the Quarterly Report on Form 10-Q of the Company, filed with the SEC on May 10, 2022). | ||
| 21.1* | Subsidiaries of the Company. | |
| 23.1* | Consent of Marcum LLP. | |
| 31.1* | Section 302 Certification of Principal Executive Officer. | |
| 31.2* | Section 302 Certification of Principal Financial Officer. | |
| 32.1** | Section 906 Certification of Principal Executive Officer. | |
| 32.2** | Section 906 Certification of Principal Financial Officer. | |
| 101.INS* | Inline XBRL Instance Document | |
| 101.SCH* | Inline XBRL Taxonomy Schema | |
| 101.CAL* | Inline XBRL Taxonomy Calculation Linkbase | |
| 101.DEF* | Inline XBRL Taxonomy Definition Linkbase | |
| 101.LAB* | Inline XBRL Taxonomy Label Linkbase | |
| 101.PRE* | Inline XBRL Taxonomy Presentation Linkbase |
| # | ||
| Indicates management contract or compensatory plan. | ||
| * | Filed herewith. | |
| ** | ||
| Furnished herewith. | ||
| 68 |
None.
Pursuant to the requirements of Section 13 or 15(d) of the Securities Exchange Act of 1934, the registrant has duly caused this report to be signed on its behalf by the undersigned, thereunto duly authorized.
| INSPIRED ENTERTAINMENT, INC. | ||
| Date: | By: | /s/ A. Lorne Weil |
| A. Lorne Weil | ||
Executive Chairman | ||
| (Principal Executive Officer) | ||
Pursuant to the requirements of the Securities Exchange Act of 1934, this report has been signed below by the following persons on behalf of the registrant and in the capacities and on the dates indicated.
| Date: | /s/ A. Lorne Weil | |
| A. Lorne Weil, Executive Chairman | ||
| Date: | /s/ Stewart F.B. Baker | |
| Stewart F.B. Baker, Chief Financial Officer | ||
| (Principal Financial and Accounting Officer) | ||
| Date: | /s/ Michael R. Chambrello | |
| Michael R. Chambrello, Director | ||
| Date: | /s/ Ira H. Raphaelson | |
| Ira H. Raphaelson, Director | ||
| Date: | /s/ Desirée G. Rogers | |
| Desirée G. Rogers, Director | ||
| Date: | /s/ Steven M. Saferin | |
| Steven M. Saferin, Director | ||
| Date: | /s/ Katja Tautscher | |
| Katja Tautscher, Director | ||
| Date: | /s/ John M. Vandemore | |
| John M. Vandemore, Director |
| 69 |
80