
UNITED STATES
SECURITIES AND EXCHANGE COMMISSION
Washington, D.C. 20549
FORM 10-K/A
(Amendment No. 1)FORM 10-K
(Mark One)
☒ | ANNUAL REPORT PURSUANT TO SECTION 13 OR 15(d) OF THE SECURITIES EXCHANGE ACT OF 1934 |
For the fiscal year ended December 31 2020, 2023
OR
☐ | TRANSITION REPORT PURSUANT TO SECTION 13 OR 15(d) OF THE SECURITIES EXCHANGE ACT OF 1934 FOR THE TRANSITION PERIOD For the transition period from _______________________ to ____________________________________________ |
Commission File Number 001-38076
Emerald Holding, Inc.
(Exact name of Registrant as specified in its Charter)
Delaware | 42-1775077 |
(State or other jurisdiction of incorporation or organization) | (I.R.S. Employer Identification No.) |
100 Broadway, 14th Floor New York, NY | 10005 |
(Address of principal executive offices) | (Zip Code) |
Registrant’s telephone number, including area code: (949) (949) 226-5700
Securities registered pursuant to Section 12(b) of the Act:
Title of each class | Trading Symbol(s) | Name of each exchange on which registered | ||
Common Stock, par value $0.01 per share | EEX | New York Stock Exchange |
Securities registered pursuant to Section 12(g) of the Act: None
Indicate by check mark if the Registrant is a well-known seasoned issuer, as defined in Rule 405 of the Securities Act. Yes☐No☒
Indicate by check mark if the Registrant is not required to file reports pursuant to Section 13 or 15(d) of the Act. Yes☐No☒
Indicate by check mark whether the Registrant: (1) has filed all reports required to be filed by Section 13 or 15(d) of the Securities Exchange Act of 1934 during the preceding 12 months (or for such shorter period that the Registrant was required to file such reports), and (2) has been subject to such filing requirements for the past 90 days. Yes☒No☐
Indicate by check mark whether the Registrant has submitted electronically every Interactive Data File required to be submitted pursuant to Rule 405 of Regulation S-T (§232.405 of this chapter) during the preceding 12 months (or for such shorter period that the Registrant was required to submit such files). Yes☒No☐
Indicate by check mark whether the registrant is a large accelerated filer, an accelerated filer, a non-accelerated filer, smaller reporting company, or an emerging growth company. See the definitions of “large accelerated filer,” “accelerated filer,” “smaller reporting company,” and “emerging growth company” in Rule 12b-2 of the Exchange Act.
Large accelerated filer |
|
|
| ||||
|
| ☐ |
| Accelerated filer |
| ☒ | |
Non-accelerated filer | ☐ | Smaller reporting company | ☐ | ||||
Emerging growth company |
| ||||||
If an emerging growth company, indicate by check mark if the registrant has elected not to use the extended transition period for complying with any new or revised financial accounting standards provided pursuant to Section 13(a) of the Exchange Act. ☒☐
Indicate by check mark whether the registrant has filed a report on and attestation to its management’s assessment of the effectiveness of its internal control over financial reporting under Section 404(b) of the Sarbanes-Oxley Act (15 U.S.C. 7262(b)) by the registered public accounting firm that prepared or issued its audit report. ☒
If securities are registered pursuant to Section 12(b) of the Act, indicate by check mark whether the financial statements of the registrant included in the filing reflect the correction of an error to previously issued financial statements. ☐
Indicate by check mark whether any of those error corrections are restatements that required a recovery analysis of incentive-based compensation received by any of the registrant’s executive officers during the relevant recovery period pursuant to §240.10D-1(b). ☐
Indicate by check mark whether the Registrant is a shell company (as defined in Rule 12b-2 of the Exchange Act). YES☐NO☒
The aggregate market value of the Common Stock held by non-affiliates of the Registrant, based on the closing price of the shares of Common Stock on The New York Stock Exchange on June 30, 2020,2023, the last business day of the Registrant’s most recently completed second quarter, was $75,136,193.$61.8 million.
47,552,52547,804,437 shares of the Registrant's voting stock,Registrant’s Common Stock, which were held by the Registrant’s executive officers and directors and by certain investment funds affiliated with or managed by Onex Partners as of June 30, 20202023 have been excluded from this numbercalculation in that these persons or entities may be deemed affiliates of the registrant. This assumption regarding affiliate status is not necessarily a conclusive determination for other purposes.
The number of shares of Registrant’s Common Stock outstanding as of February 18, 202129, 2024 was 72,373,230.63,030,742.
DOCUMENTS INCORPORATED BY REFERENCE
Portions of the Registrant’s Definitive Proxy Statement relating to the 20212024 Annual Meeting of Stockholders, are incorporated by reference into Part III of this Report. The Registrant’s Definitive Proxy Statement will be filed with the Securities and Exchange Commission within 120 days of the registrant’s fiscal year ended December 31, 2020.2023.
Table of Contents
EXPLANATORY NOTE
Emerald Holding, Inc. (the “Company”) is filing this Amendment No. 1 to its Annual Report on Form 10-K/A for the fiscal year ended December 31, 2020 (this “Amendment No. 1”), as originally filed with the U.S. Securities and Exchange Commission (the “SEC”) on February 23, 2021 (the “Original Form 10-K”) to amend and restate the Company’s Annual Report on Form 10-K, as further described below.
This amended and restated report on Form 10-K/A is presented as of the filing date of the Original Form 10-K and does not reflect events occurring after that date, or modify or update disclosures in any way other than as required to reflect the restatement described below. Accordingly, this Amendment No. 1 on Form 10-K/A should be read in conjunction with our filings with the SEC subsequent to the date on which we filed the Original Form 10-K.
The Company is filing this Amendment No. 1 on Form 10-K/A to reflect restatements to the Company’s audited consolidated financial statements as of and for the year ended December 31, 2020 and relevant unaudited condensed consolidated financial information for the 2020 quarterly periods to correct errors in the Company’s accounting for its 7% Series A Convertible Participating Preferred Stock (the “redeemable convertible preferred stock”). Subsequent to the issuance of the Original Form 10-K, the Company determined that its accounting for its redeemable convertible preferred stock as a component of stockholders’ equity, as reported in its consolidated financial statements presented in the Original Form 10-K, instead of reflecting such redeemable convertible preferred stock as temporary equity, resulted in an error based on the application of accounting principles generally accepted in the United States (“GAAP”). This error resulted in additional-paid-in-capital and stockholders’ equity being overstated and temporary equity being understated starting with the quarter ended June 30, 2020 through the quarter ended June 30, 2021, including as of and for the year ended December 31, 2020. During each of those annual and interim periods, the Company accounted for the redeemable convertible preferred stock as stockholders’ equity and reduced the income attributable to the common stockholders by the amount of the cumulative, undeclared dividends associated with the redeemable convertible preferred stock in accordance with GAAP for preferred stock classified as stockholders’ equity. As a result of incorrectly accounting for the redeemable convertible preferred stock as permanent equity, the Company also did not accrete the carrying amount of the redeemable convertible preferred stock to the redemption value when the redeemable convertible preferred stock first becomes redeemable, which resulted in an understatement of accretion and an overstatement (understatement) of net income (loss) attributable to common shareholders.
This Amendment No. 1 on Form 10-K/A sets forth the Original Form 10-K in its entirety, as amended to reflect the restatement. Among other things, forward-looking statements made in the Original Form 10-K have not been revised to reflect events that occurred or facts that became known to the Company after the filing of the Original Form 10-K, and such forward-looking statements should be read in their historical context.
The following items have been amended as a result of the restatement:
|
|
Page | |
|
|
|
|
|
|
|
|
|
|
i
In accordance with applicable SEC rules, this Amendment No. 1 on Form 10-K/A includes an updated signature page, certifications of our Chief Executive Officer and Chief Financial Officer in Exhibits 31.1, 31.2 and 32.1 as required by Rule 12b-15, and a Consent of Independent Registered Public Accounting Firm as Exhibit 23.1.
The Company is also filing an amended Quarterly Report on Form 10-Q/A for each of the quarterly periods ended March 31, 2021 and June 30, 2021 to restate the previously issued interim condensed consolidated financial statements due to the accounting matter described above.
In connection with the restatement, the Company has also corrected an error that the Company previously determined to be immaterial within the 2020 quarterly condensed consolidated financial information.
Refer to Note 1, Description of Business and Summary of Significant Accounting Policies, of Notes to Consolidated Financial Statements of this Form 10-K/A for additional information and for the summary of the accounting impacts of these adjustments to the Company’s consolidated financial statements.
As a result of the restatement, the Company has concluded its disclosure controls and procedures and internal control over financial reporting were not effective as of December 31, 2020 due to a material weakness in the Company's internal control over financial reporting as of December 31, 2020 and its disclosure controls and procedures were not effective as of June 30, 2020 and September 30, 2020. See additional discussion included in Part II, Item 9A of this Amended Annual Report.
ii
Table of Contents
| ||
| ||
Item 1. | 2 | |
Item 1A. |
| |
Item 1B. | 24 | |
Item 1C. | 24 | |
Item 2. |
| |
Item 3. |
| |
Item 4. |
| |
PART II | ||
Item 5. |
| |
Item 6. | 27 | |
Item 7. | Management’s Discussion and Analysis of Financial Condition and Results of Operations | 32 |
Item 7A. |
| |
Item 8. |
| |
Item 9. | Changes in and Disagreements With Accountants on Accounting and Financial Disclosure |
|
Item 9A. |
| |
Item 9B. |
| |
Item 9C. | Disclosure Regarding Foreign Jurisdictions that Prevent Inspections | 127 |
| ||
PART III | ||
Item 10. |
| |
Item 11. |
| |
Item 12. | Security Ownership of Certain Beneficial Owners and Management and Related Stockholder Matters |
|
Item 13. | Certain Relationships and Related Transactions, and Director Independence |
|
Item 14. |
| |
PART IV | ||
Item 15. |
| |
Item 16. |
|
iii
CAUTIONARY NOTE REGARDING FORWARD-LOOKING STATEMENTS
This Annual Report on Form 10-K/A10-K contains forward-looking statements within the meaning of the U.S. Private Securities Litigation Reform Act of 1995. You can generally identify forward-looking statements by our use of forward-looking terminology such as “anticipate,” “believe,” “continue,” “could,” “estimate,” “expect,” “intend,” “may,” “might,” “plan,” “potential,” “predict,” “seek” or “should,” or the negative thereof or other variations thereon or comparable terminology. In particular, statements about general economic conditions, or more specifically about the markets in which we operate, including growth of our various markets, and our expectations, beliefs, plans, strategies, objectives, prospects, assumptions or future events or performance contained in this report are forward-looking statements.
We have based these forward-looking statements on our current expectations, assumptions, estimates and projections. While we believe these expectations, assumptions, estimates and projections are reasonable, such forward-looking statements are only predictions and involve known and unknown risks and uncertainties, many of which are beyond our control. These and other important factors, including the severe ongoing impact of the COVID-19 pandemictrends and the other risk factors discussed in this report under the heading “Management’s Discussion and Analysis of Financial Condition and Results of Operations,” may cause our actual results, performance or achievements to differ materially from any future results, performance or achievements expressed or implied by these forward-looking statements, or could affect the trading price of our common stock on the New York Stock Exchange. Some of the factors that could cause actual results to differ materially from those expressed or implied by the forward-looking statements include, but are not limited to, those discussed in Part I, Item 1A of this Form 10-K/A10-K under the heading “Risk Factors,” which are incorporated herein by reference.
Given these risks and uncertainties, you are cautioned not to place undue reliance on such forward-looking statements. The forward-looking statements contained in this report are not guarantees of future performance and our actual results of operations, financial condition and liquidity, and the development of the industry in which we operate, may differ materially from the forward-looking statements contained in this report. In addition, even if our results of operations, financial condition and liquidity, and events in the industry in which we operate, are consistent with the forward-looking statements contained in this report, they may not be predictive of results or developments in future periods.
Any forward-looking statement that we make in this Annual Report on Form 10-K/A10-K speaks only as of the date of such statement. Except as required by law, we do not undertake any obligation to update or revise, or to publicly announce any update or revision to, any of the forward-looking statements, whether as a result of new information, future events or otherwise, after the date of this report.
Except where the context requires otherwise, references in this Annual Report on Form 10-K/A10-K to “Emerald”, “the Company”, “we”, “us”, and “our” refer to Emerald Holding, Inc., formerly known as Emerald Expositions Events, Inc., together with its consolidated subsidiaries. In this Annual Report on Form 10-K/A,10-K, when we refer to our fiscal years, we refer to the year number, as in “2020,“2023,” which refers to our fiscal year ended December 31, 2020.2023.
1
PART I
Item 1. Business.
BUSINESS
Our Company
Emerald is a leading operator of business-to-business (“B2B”) trade shows in the United States. Leveraging our shows as key market-driven platforms, we combine—within and around our events—a broad array ofintegrate live events, media content, industry insights, digital tools, and data-focused solutions to create uniquely rich experiences for our customers. We have been recognized with many awards and accolades that reflect our industry leadership as well as the importancee-commerce platforms into three complementary business lines – Connections, Content and Commerce.
Our Connections division consists of our shows to the exhibitors and attendees we serve.
Oura collection of leading B2B trade show franchises, which typically hold market-leading positions within their respective industry verticals, with significant brand value established over a long period of time. Each
Our Content division consists of B2B print publications and digital media products that complement our shows is typically held at least annually, with certain franchises offering multiple editions per year. As our shows are frequently the largestexisting trade show properties. These print and most well attended in their respectivedigital media products provide industry verticals, we are able to attract high-quality attendees, including those who have the authority to make purchasing decisions on the spot or subsequent to the show. The participation of these qualified attendees makes our trade shows compelling events for our exhibitors, further reinforcing the leading positions of our trade shows within their respective industry verticals. specific business news and information across 20 sectors, facilitating year-round customer contact, new customer acquisition and content marketing vehicles.
Our attendees use our shows to fulfill procurement needs, source new suppliers, reconnect with existing suppliers, identify trends, learn about new products and network with industry peers, which we believe are factors that make our shows difficult to replace. Our portfolio of trade shows is well-balanced and diversified across both industry sectors and customers. The scale and qualified attendance at our trade shows translates into an exceptional value proposition for participants, resulting in a self-reinforcing “network effect” whereby the participation of high-value attendees and exhibitors drives high participant loyalty and predictable, recurring revenue streams.
In addition to organizing our trade shows, conferences and other events, we also operate content and content-marketing websites and related digital products, and produce publications, each of which is aligned with a specific event sector. We also offerCommerce division offers B2B ecommercee-commerce and digital merchandising solutions, serving the needs of manufacturers and retailers through our recently-acquired Elastic Suite platform. In additionand Bulletin platforms, which create a digital year-round transactional platform for use by Emerald’s customers, regardless of location.
We also generate a substantial amount of first-party data across our events, content, and e-commerce platforms. We continue to their respective revenues, thesedevelop products supportand processes based on our livefirst-party data assets to enhance the customer experience, by providing actionable insights and measurable results through metrics such as content impressions, lead capture rates, conversion rates and transaction value per customer. Our efforts to provide customers with a clearer picture of the return on investment they receive from Emerald’s events should help incentivize customers to deploy more marketing dollars with Emerald, ultimately driving higher revenue per customer. The data we generate should also create efficiencies within Emerald’s sales efforts by delivering year-round channels for customer acquisitionenabling cross-selling of events, content, and development. e-commerce opportunities, contributing to lower sales costs and higher margins.
Our History
In June 2013, certain investment funds managed by an affiliate of Onex Corporation (such funds, collectively with Onex Partners V LP, “Onex”) acquired our business from an affiliate of Nielsen Holdings N.V. (the “Onex Acquisition”). We have since focused on expanding our portfolio of leading events organically, complemented by an increased focus on acquisitions. Since the Onex Acquisition, we have acquired and integrated 2026 industry-leading, high-quality events and complementary businesses of various sizes for aggregate consideration of approximately $716$934 million.
In June 2020, we entered into an investment agreement with Onex Partners V LP (“Onex Partners V”), pursuant to which we agreed to issue to Onex Partners V, in a private placement transaction, 47,058,332 shares of our 7% Series A Convertible Participating Preferred Stock (the “redeemable“redeemable convertible preferred stock”stock”) for a purchase price of $5.60 per share (the “Series A Price per Share”), for which we received aggregate proceeds of approximately $252.0 million, net of fees and estimated expenses of $11.6 million. In conjunction with the investment agreement with Onex Partners V, we announced a rights offering to holders of our outstanding common stock of one non-transferable subscription right for each share of our common stock held, with each right entitling the holder to purchase one share of redeemable convertible preferred stock at the Series A Price per Share, backstopped by Onex Partners V (the “Onex Backstop”). The rights offering was completed in July of 2020. We received net proceeds of approximately $9.7 million from this rights offering. Pursuant to the Onex Backstop, on August 13, 2020, an additional 22,660,587 shares of redeemable convertible preferred stock were sold to Onex in exchange for proceeds of approximately $121.3 million, net of fees and expenses of $5.6 million.
2
As of December 31, 2020,2023, Onex owned 47,058,332 shares of our common stock, representing 65.2%74.8% of our outstanding common stock. In addition, as of December 31, 2020, after giving effect to the Onex Backstop2023, Onex owned 69,718,919 shares of our redeemable convertible preferred stock,, representing 161,891,916which combined, represents 183,697,428 shares of our common stock on an as-converted basis, after accounting for the accumulated accreting return at a rate per annum equal to 7% on the accreted liquidation preference and paid in-kind. Onex’s beneficial ownership of our common stock, on an as-converted basis, is approximately 85.6%90.5%.
In 2020, we completed two acquisitions. In December,2023, we acquired EDspaces,Lodestone Events, the education industry’s primary conferenceproducers of the Overland Expo series of vehicle-based, adventure travel consumer shows throughout the US. Overland Expo is a premier event series for do-it-yourself adventure travel enthusiasts, with hundreds of classes for 4-wheel-drive enthusiasts and adventure motorcyclists, inspirational programs, speakers, and trainers from all over the world. The acquisition supports the Company’s strategic expansion into the growing business to consumer (B2C) event focusedspace specifically in high growth markets like the increasing demand for outdoor experiences.
Products and Services
Emerald goes to market across three distinct business lines, Connections, Content and Commerce. Each provides a distinct portfolio of products and services that are integral to Emerald’s growth and profitability.
Connections
Our Connections division consists of our collection of leading B2B trade show franchises, which typically hold market-leading positions within their respective industry verticals, with significant brand value established over a long period of time. Each of our shows is typically held at least annually, with certain franchises offering multiple editions per year. Our shows are frequently the preeminent event, drawing the highest attendance in their respective industry verticals. As a result, we are able to attract high-quality attendees, including those who have the authority to make purchasing decisions on the futurespot or subsequent to the show. The participation of learning environments.these qualified buyers makes our trade shows compelling events for our exhibitors, offering them an efficient platform for high quality lead generation. Revenue in this segment is generated from the production of trade shows and conference events, including booth space sales, registration fees and sponsorship fees.
On December 31, 2020,Our attendees use our shows for a variety of reasons, most notably to fulfill procurement needs, source new suppliers and reconnect with existing suppliers, identify trends, learn about new products and network with industry peers. We believe that these factors help demonstrate that our in-person shows are paramount and difficult to replace. Our portfolio of trade shows is well-balanced and diversified across both industry sectors and customers. The scale and qualified attendance at our trade shows translates into an exceptional value proposition for participants, resulting in a self-reinforcing “network effect,” whereby the participation of high-value attendees and exhibitors drives high participant loyalty and predictable, recurring revenue streams.
We categorize our diversified portfolio of events according to seven industry verticals:
Design, Renovation & Construction
Our Design, Renovation & Construction vertical is targeted toward commercial-scale design and construction, with buyers and sellers frequently transacting in high unit counts for uses in projects such as hotels and senior living facilities. Industries served include kitchen & bath, hospitality, senior living, healthcare, education, general construction and more. Examples of our events produced in this category include:
☐ Boutique Design | ☐ Hospitality Design Expo (“HD Expo”) |
☐ Environments for Aging Expo & Conference (“EFA”) | ☐ ICFF (previously International Contemporary Furniture Fair) |
☐ Healthcare Design Expo & Conference (“HCD”) | ☐ Kitchen & Bath Industry Show (“KBIS”) |
☐ EDspaces | ☐ Connecting Point Marketing Group hosted buyer events |
3
Food
Our Food vertical brings together retailers, restaurateurs, and suppliers across specialty food categories, including the fast-growing pizza and Latin specialty food categories. International Pizza Expo is one of the largest events serving this popular sector, and Cocina Sabrosa is the largest and only national Latin food expo in the United States. Examples of our events produced in this category include:
☐ Cocina Sabrosa | ☐ Pizza Expo |
☐ Pizza & Pasta Northeast |
Home, Gift & General Merchandise
Our Home, Gift & General Merchandise vertical connects product manufacturers and retailers through premiere events and insightful content for the market’s most on-trend consumer products and merchandise. Through these invaluable connections and content, Emerald unites a vast global network of buyers and suppliers, offering unparalleled access to one of the world’s most extensive selections of merchandise. Events produced in this category include:
☐ ASD Market Week (“ASD”) | ☐ NY NOW |
☐ International Gift Exposition in the Smokies (“IGES”) |
Technology, Advertising & Marketing
Our Technology, Advertising & Marketing vertical is a market-leading portfolio of events and resources dedicated to advertising and harnessing the power of next-generation digital media and marketing technology. The growing group of business sectors served includes advertising, automotive, intelligent traceability technology, business technology integration, communications, ecommerce, connected home technology, and more. Some examples of our events produced in this category include:
☐ Advertising Week (“AW”) | ☐ B2B Marketing Exchange |
☐ Commercial Integrator | ☐ CEDIA |
☐ Digital Dealer | ☐ Prosper |
☐ Retail Innovation Conference & Expo (“RICE”) | ☐ RFID |
☐ Total Tech Summit |
Industrial
Demonstrating leadership across established and emerging industries through collaborative B2B events and insightful forums. Perhaps the most diverse group of industry sectors served by Emerald, our expertise across the industrial category is unmatched in both content and events. The growing range of business sectors includes photography, security, hospitality, home medical, US Military, paving, fasteners, farming & agricultural supplies largely serving the cannabis industry, and more. Examples of our events produced in this category include:
4
☐ Campus Safety | ☐ MJBiz |
☐ Fastener | ☐ Security Sales & Integration |
☐ Modern Day Marine | ☐ National Pavement Expo |
☐ Medtrade | ☐ reMind |
☐ Wedding & Portrait Photographers International |
Luxury
Our Luxury vertical provides dynamic and profitable marketplaces that emulate the highest level of artistic expression and showcase the most exceptional curation of upscale, luxury and designer products. Emerald’s luxury market of events unites an elite community of renowned heritage brands, emerging design talent, the finest retailers and award-winning media from around the globe. Examples of our events produced in this category include:
☐ Couture | ☐ JA New York |
☐ Las Vegas Antique Jewelry & Watch Show | ☐ The Original Miami Beach Antique Show (“OMBAS”) |
Sports & Outdoor
Our Sports & Outdoor vertical includes industry-leading wholesale and consumer events with globally recognizable brands, highlighting the latest products and innovations and attracting a diverse audience. Our premiere events serve the growing markets of surf, swimwear, lifestyle apparel, winter sports, outdoor recreation and overlanding, mountaineering, adventuring, camping, sports merchandise licensing, and professional sports fan experiences. Examples of our events produced in this category include:
☐ Active Collective | ☐ Swim Collective |
☐ NBACon | ☐ Outdoor Retailer (“OR”) |
☐ Overland Expo | ☐ Surf Expo |
☐ Sports Licensing and Tailgate Show |
Content
Our Content division consists of B2B print publications and digital media products that complement our existing trade show properties. These print and digital media products provide industry specific business news and information across 20 sectors, facilitating year-round customer contact, new customer generation and content marketing vehicles. Leveraging our industry-leading trade shows allows us to create unique and timely editorials in the sectors we acquired PlumRiver Technologies (“PlumRiver”), an international providerserve. We plan to continue to invest in product development to ensure our advertisers have new and effective ways to engage our audiences. We are also expanding our content portfolio to support audience acquisition across a wider array of sectors and constituencies served by our trade shows, conferences, and other events. Revenue in this segment primarily consists of advertising sales for industry publications and digital products.
Commerce
Our Commerce division largely offers software-as-a-service technology that enables year-round B2B buying and selling through itsour Elastic Suite platform. Elastic Suite’s platform streamlines the wholesale buying process for both brands and retail buyers, creating a digital year-round transactional platformBulletin platforms for use by Emerald’s customers. We believe this acquisition will accelerate Emerald’s strategy to provide 365-day-per-year engagement for its customer basecustomers, regardless of location by expanding its digital commerce capabilities and providing its customers with transactional functionality, including enterprise-level integration to brands’ ERP systems, allowing customers to manage orders, real-time inventory, and product merchandising. PlumRiver is integrated with leading manufacturers and retailers across numerous industries, most notably in the outdoor, surf, cycling, footwear and sporting goods verticals, and is expected to complement Emerald’s portfolio of leading show brands including Outdoor Retailer and Surf Expo, among others. PlumRiver’slocation. Elastic Suite’s B2B platform bridges the gap between sellers’ order processing systems and allows brands to sell directly to their buyers using print-free digital product catalogs and merchandising technology, enabling brands to increase their efficiency, effectiveness, sustainability and profitability. We believe these platforms will accelerate
Products5
Emerald’s strategy to provide 365-day-per-year engagement for our customer base, by expanding our digital commerce capabilities and Services
We operateproviding our customers with transactional functionality. Elastic Suite is integrated with leading trade shows in multiple attractive, fragmented industry sectors that represent significant portions of the U.S. economymanufacturers and serve a large and diverse set of global exhibitors and attendees. This fragmentation of exhibitors and attendees is an especially important characteristic of the trade show industry. In markets characterized by diverse groups of buyers and sellers, trade shows offer a great opportunity for interaction between large numbers of participants on both sides of a potential transaction (a “many-to-many” environment) within a short period of time, thus enhancing the value delivered to all trade show participants. Further, the highly fragmented nature of our markets enhances the stability of our entire platform as the loss of any single exhibitor or attendee is unlikely to cause other exhibitors or attendees to derive less value from and cease participating in a show.
We typically generate the significant majority of our revenue through the live events that we operate, with the remaining revenue generated by other marketing services, including digital media and print publications that complement our event propertiesretailers across numerous industries, most notably in the industry sectors we serve. The ongoing COVID-19 pandemicoutdoor, home appliance and its consequences forced us to cancel or postpone a significant portion of our event calendar beginning in March 2020 through the end of the yearelectronics, surf, cycling, footwear and the first half of 2021. As a result, only 75% of our revenue for the year ended December 31, 2020 was generated through in person events, and 25% from virtual events other marketing services. By contrast, we generated 92% of our revenue for the year ended December 31, 2019 through the live events that we operated. The remaining 8% of our revenue for the year ended December 31, 2019 was generated from other marketing services. Each of our other marketing services products allows us to remain in close contact with, and market to, our existing event audiences throughout the year.
Trade Shows & Other Events
The following is a summary and example of several of our trade shows and other events by sector and a discussion of our complementary products.
Retail
Spanning a vast market of products, our retail experiences cover merchandising, licensing, sourcing, and marketing to enable professionals to shop intelligently, make informed decisions, and meet consumer demands. Buying customers are able to discover rare finds and big sellers in a complete marketplace of options, along with new brands, potential partners, and beneficial seminars across popular and profitable categories. Events producedsporting goods verticals. Revenue in this category include:segment consists of subscription revenue, implementation fees and professional services.
|
|
|
|
|
|
|
|
Design & Construction
Our shows in the Design & Construction industry sector catering to the construction, hospitality, and interior design sectors serving the hotel, resort, retail, healthcare facilities, restaurant, bar, spa, and in-store marketing categories. Targeted attendees include interior designers, architects, owners and operators, developers, and specifiers and purchasers working within these industries. This sector is well-suited for trade shows because design and construction are highly visual and tactile processes, requiring the in-person experience and interaction provided by trade shows. By aggregating a wide range of products under one roof, these trade shows save time and expense for designers and other attendees who would otherwise have to independently visit hundreds of showrooms that may be located in different cities. Examples of our events produced in this category include:
|
|
|
|
|
|
Technology
With technology expanding at a rapid pace, professionals in every aspect of commerce—from engineering to electronics, and visual arts to security—must stay on top of the latest advancements to help them stay informed, efficient, and competitive. Our technology events provide experiences that connect businesses of all sizes with innovative products, operational strategies, and integration opportunities to drive new business, increased profits, and streamlined processes. Through exciting show floors, thought leadership, and networking events, decision-makers in these industries can thrive in the midst of digital progress and change. Some examples of our events produced in this category include:Reportable Segments
|
|
|
|
|
|
Equipment
Our equipment experiences outfit aerospace, construction, industrial, medical, and hospitality professionals with the tools and resources necessary to operate, build, and repair structures, vehicles, and devices of every kind. These events and surrounding platforms serve as a marketplace featuring vendors and innovative products and services, as well as educational centers, supporting a wide array of industries. Examples of our events produced in this category include:
|
|
|
|
|
|
Safety
Seeking the innovations to ensure physical and cyber security, these experiences prepare professionals with advanced systems, training, and networking. With an integration of events and media, representatives and decision-makers from leading-edge companies have access to key resources year-round. Examples of our events produced in this category include:
|
|
|
Other Marketing Services
Other Marketing Services consist of print publications and digital media products that complement our trade show properties, which generated 20.6% of our revenues for the year ended December 31, 2020. These print and digital media products are closely aligned with several of our events across the portfolio categories, facilitating year-round customer contact, new customer generation and content marketing vehicles. Some examples of these products are:
|
|
|
|
|
|
Reportable Segments
As described in Note 1, Description of Business and Summary of Significant Accounting Policies and Note 18, Segment Information, in the notes to our audited consolidated financial statements included elsewhere in this Annual Report on Form 10-K/A, the determination of10-K, effective October 31, 2023, our business is organized into one reportable segments issegment, consistent with the information provided to our Chief Executive Officer, who is considered the chief operating decision-maker ("CODM"(“CODM”). The CODM evaluates performance based on the results of six executive brand portfolios,our Connections, Content and Commerce business lines (collectively, the “three C’s”), which represent our sixthree operating segments. Based on an evaluationThe Connections segment is primarily comprised of economic similaritiesEmerald’s trade shows and the nature of services and types of customers, four of these operating segments have been aggregated into two reportable segments, the Commerce reportable segment and the Design and Technology reportable segment.other live events. The remaining threetwo operating segments do not meet the quantitative thresholds to be considered reportable operating segments and are included in the “All Other” category. In addition, we have a Corporate-Level Activities“Corporate-Level Activities” category consisting of finance, legal, information technology and administrative functions.
Prior year disclosures below have been updated to reflect the new reportable segment structure described in Note 18, Segment Information. The following discussion provides additional detailed disclosure for the twoone reportable segments, the All Other“All Other” category and the Corporate-Level Activity“Corporate-Level Activity” category:
Commerce:Connections: This segment includes all of Emerald’s trade shows and other live events and services covering merchandising, licensing, retail sourcing and marketing to enable professionals to make informed decisions and meet consumer demands.
Design and Technology: This segment includes events and services that support a wide variety of industries connecting businesses and professionals with products, operational strategies, and integrationprovide exhibitors opportunities to drive new businessinfluence their market, engage with significant buyers, generate incremental sales and streamline processes and creative solutions.expand their brand’s awareness in their industry.
All Other: This category consists of Emerald’s remaining operating segments, which provide diverse eventsmedia services and servicese-commerce software solutions, but are not aggregated with the reportable segments.segment. Each of the operating segments in the All Other category represents less than 10% of consolidated revenue and doesdo not meet the criteria to be a separate reportable segment.
Corporate-Level Activity: This category consists of Emerald’s finance, legal, information technology and administrative functions.function.
Competition
The trade show industry is highly fragmented, with approximately 9,400 B2B trade shows held per year in the United States according to the Center for Exhibition Industry Research, of which a majority are owned by industry associations, according to Advanced Market Research. Individual trade shows typically compete for attendees and exhibitors only against the other trade shows that are relevant to their industry vertical. The level of competition each of our trade shows faces therefore varies by industry vertical. In addition, PlumRiver’sthe Elastic Suite platform competesplatforms compete with several other well-capitalized software-as-a-service technology platforms.
Other well-established for-profit companies competing in the U.S. trade show industry include Reed Exhibitions, Informa Exhibitions and Clarion Events.
Seasonality
As is typical for the trade show industry, our business has historically been seasonal, with our pre-COVID revenue recognized from trade shows typically reaching its highest level during the first quarterand third quarters of each calendar year, and its trough during the fourth quarter, largelyentirely due to the timing of our trade shows. In 2019, 40%, 28%, 22%As a result of the MJBiz and 10%Advertising Week acquisitions at the end of 2021 and during the second quarter of 2022, respectively, our trade showseasonality trend shifted, where revenue was generatednow typically reaches its highest level during the first second, third and fourth quarters respectively. In 2020, 98%of each calendar year, entirely due to the timing of our trade show revenue was generated during the first quarter because substantially all of our in-person events were cancelled beginning in March 2020 and through December 31, 2020.live events.
6
Intellectual Property
Our intellectual property and proprietary rights are important to our business. We undertake tobusiness and we strategically and proactively develop our intellectual property portfolio by registering our trademarks. We currentlytrademarks and rely primarily on trademark laws to protect our intellectual property rights. We do not own, but have a license to use, certain trademarks belonging to an industry associationassociations in connection with our Kitchen & Bath Industry ShowKBIS and CEDIA Expo. The KBIS license runs through 20282043 and the CEDIA Expo license continues in perpetuity. We also license certain intellectual property from the NBA in connection with producing NBA Con. See “Risk Factors—Risks Related to our Intellectual Property and Information Technology” for further discussion relating to our trademarks.
Human Capital Resources
At Emerald, we consider our employees to be the foundation of our growth and success. As such, our future depends in large part on our ability to attract, retain, and motivate qualified and diverse personnel.
As of December 31, 2020,2023, we had 542673 full-time employees. Our management team principally works from our New York City headquarters (60(62 employees) and our Southern California corporate offices (111(49 employees), with members of our sales team distributedlocated throughout the United States, mainly nearStates. As of December 31, 2023, our senior management team was 50% female and our overall employee population was 63% female.
Career development at Emerald is fostered through ongoing employee feedback, performance reviews and employee satisfaction surveys. These surveys regularly solicit employees’ to help Emerald track the geographic markets they serve.progress and well-being of our workforce. In addition to monthly town halls conducted by our full-timeCEO, which foster transparent and consistent communication throughout the Company, Emerald hosts an annual company-wide, in-person conference called ACE (Agility, Commitment and Excellence). ACE brings together team members from around the world to reconnect face-to-face, and take part in presentations from top executives and smaller breakout sessions that focus on Emerald’s new business ventures and strategic roadmap. ACE concludes with an employee award presentation which recognizes individuals chosen by their peers as true leaders.
Emerald’s corporate culture and benefits offerings are also designed to meet the wide range of needs of our workforce including:
These resources are intended to support the physical, emotional and financial well-being of our employees.
In order to protect our workforce from the outbreak of COVID-19, in March 2020, Emerald transitioned all of our employees to a remote/work-from-home arrangement, and as of November 2021, we also utilize staffing agenciespermanently adopted a hybrid work structure whereby employees have the flexibility to fill temporary staffing needs onwork from home and come into the office to maximize in-person collaboration. As we have resumed in-person events, we have prioritized the health and safety of our employees as well as our exhibitors and attendees, taking extensive COVID-19 protective measures.
Providing all our employees with the resources to develop their talents, develop their careers and reach their goals is a top priority at Emerald. To enable this, the Company provides numerous opportunities for employees to expand their professional and personal development, including unlimited access to Skillsoft’s online platform which
7
provides continuous learning and career enhancement resources coupled with formal sales development and training from a professional sales coach. In addition, we have implemented a manager effectiveness training program and formalized an event-by-event basis.employee mentorship program.
We areEmerald is not involved in any material disputes with our employees and we believe that relations with our employees are good. None of our employees are subject to collective bargaining agreements with unions. However, some facilities where we hold our trade shows require our decorators to use unionized labor.
In orderCommitment to protectCorporate Sustainability and Governance
Emerald is dedicated to advancing its Environmental, Social and Governance practices across the organization. This commitment and purpose fuels our workforce frominnovation, drives our collaboration, and creates lasting value for our customers, employees, shareholders, and the outbreakcommunities in which we live, work, and do business. To that end, we are committed to minimizing our environmental impact with the goal of COVID-19, in March 2020 we transitioned substantially allreducing the environmental footprint of our employeesevents. In partnership with the global Net Zero Carbon Events initiative, Emerald has taken the Net Zero Carbon Events pledge to chart a remote/work-from-home arrangement.path towards net zero carbon emissions by 2050, with an interim goal to reduce greenhouse gas emissions by 50% by 2030. As part of December 31, 2020, mostthis pledge, we have undertaken efforts to identify and prioritize actions to reduce greenhouse gas emissions, including energy management, water conservation, materials management, food and beverage waste reduction, sustainable procurement, stakeholder management and employee engagement initiatives. Emerald continues to gather and track key event metrics to measure the environmental impact of our employees continue to work remotely,events and 13 employees remained furloughed. As we resume in-person events on a limited basisbenchmark success against our pledged goals. We also collaborate with key partners and suppliers throughout the event industry, including venues, hotels, and general service contractors in markets where such events are permitted, we have prioritized the health and safety of exhibitors, attendees and our employees, taking extensive COVID protective measures. We consider our employees to be the foundation for our growth and success. As such, our future success depends in large part on our ability to attract, train, retain, and motivate qualified personnel. The growth and developmentfurtherance of our workforcesustainability initiatives.
Equally important to Emerald is creating an integral part of our success. We are also committed to developing and fostering aemployee experience that fosters the Company’s culture of diversityrespect and inclusion and know that a company’sinclusion. Emerald knows its ultimate success is directly linked to its ability to identify and hire talented individuals from all backgrounds and perspectives.perspectives, and we are committed to developing and fostering a culture of diversity and inclusion. By welcoming the diverse perspectives and experiences of our employees, we all share in the creation of a more vibrant, unified, and engaging place to work. In early 2022, we formed an official Diversity, Equity and Inclusion Committee, made up of employees from throughout the organization, to help Emerald build upon our existing programs and maintain best practices to foster a diverse and inclusive work environment.
To further these goals, we offerEmerald partners with the non-profit OneTen which cultivates economic opportunities for Black talent in the United States with a goal of providing one million jobs to Black individuals within the next ten years. We have also eliminated the college-degree requirement for a range of positions to expand the application process to include candidates with more diverse backgrounds, skills, and experiences. Further, all personnel are required to attend training programs focused on unconscious bias training and interview skills.
In addition to company-wide initiatives, many of our employees:trade shows sponsor ESG related initiatives, such as:
• Advertising Week Africa’s work with Education Africa resulting in a successful effort to build a security fence around a school for 1200 children; • Overland Expo’s fund raising partnership with the Overland Expo Foundation, a not for profit 501(c)(3) that funds organizations and individuals who help protect and advance the overland community. • Elastic and Overland Expo’s commitment to B2B print elimination programs. Elastic has dedicated a number of resources related to print savings. This includes the creation of a B2B Print Elimination Whitepaper and, in partnership with Environmental Protection Network, the development of a tool to estimate the global environmental impact of eliminating printed B2B sales catalogues. • Participating in The COUTURE Diversity Action Council, which strives to be a catalyst for addressing the issues that have contributed to the lack of diversity within the fine jewelry industry; and • Several shows creating networking events for women and diverse speaker forums. Emerald is committed to sound corporate governance and effective leadership practices to ensure that the Company delivers the best results for its stakeholders. We believe that the composition and professional background of our board and our executive leadership team are well-balanced and position the Company for long term growth. 8 Insurance |
|
|
|
|
|
|
|
|
|
|
Insurance
We maintain insurance policies to cover the principal risks associated with our business, including event cancellation, business interruption, workers’ compensation, directors’ and officers’ liability, cyber security, product liability, auto, property, and umbrella and excess liability insurance. All of our insurance policies are with third-party carriers and syndicates with financial ratings of AA- or better. We believe the premiums, deductibles, coverage limits and scope of coverage under such policies are reasonable and appropriate for our business. Event cancellation insurance provides coverage that allows us to refund a proportionate share, relative to the compromised enforced attendance reduction or show closure, of the deposits and booth and sponsorship fees paid to us by exhibitors in the event that we are forced to cancel a trade show or other event for reasons covered by the policies, such as natural disasters, communicable disease, terrorism, or venue closures. Business interruption insurance provides further coverage for our office property leases in cases where we are not able to conduct ongoing business, including sales and event planning. The continued availability of appropriate insurance policies on commercially reasonable terms is important to our ability to operate our business and to maintain our reputation.
Further, Emerald maintainsOur event cancellation insurance topolicies protect against losses due to the unavoidable cancellation, postponement, relocation and enforced reduced attendance at events due to certain covered events.causes. Specifically, Emerald is insured for losses due tothe policies covering calendar years 2020 and 2021, these causes included event cancellationscancellation caused by the outbreak of communicable diseases, including COVID-19. However, coverage for the outbreak of communicable disease, including COVID-19, is not included in our event cancellation insurance policies for policy years beginning in 2022. In addition, coverage for each of our event cancellation insurance policies extends to include additional promotional and marketing expenses necessarily incurred by us should a covered loss occur. This insuranceThese policies also includesinclude a terrorism endorsement covering an act of terrorism and/or threat of terrorism directed at the insured event or within the United States or its territories.
The aggregate limit under thesefor our renewed 2024 primary event cancellation insurance policiespolicy is approximately $191.1 million in 2020 and $191.4 million in 2021 if losses arise for reasons within the scope of this policy. In addition to this primary policy, Emerald maintains$100.0 million. We have also obtained a similar separate event cancellation insurance policy for the Surf Expo Summer 2020Winter 2024 and Surf Expo Winter 2021Summer 2024 shows, with a coverage limit of $6.0approximately $7.6 million and $7.7$7.8 million, respectively.
On August 3, 2022, we reached an agreement to settle outstanding insurance litigation relating to event cancellation insurance for each respective event. The Company is inproceeds of $148.6 million. During the processyear ended December 31, 2022, we recorded other income, net of pursuing claims under these$182.8 million related to event cancellation insurance policiesclaim and settlement proceeds deemed to offsetbe realizable by our management team. All of the financial impactother income, net for the year ended December 31, 2022 was received during the period. We received payments of cancelled$95.3 million from our insurance carrier to recover the lost revenues, net of costs saved, of the affected trade shows during the year ended December 31, 2021 and postponed eventswe concluded that the receipt of $17.8 million of additional insurance proceeds was realizable as a result of COVID-19. As of December 31, 2020,2020. As a result, during the year ended December 31, 2021, we have received proceedsreported other income, net of $89.2$77.4 million to recognize the amount that was recovered from the insurance company. Further, in respect of claims filed under ourSeptember 2023, we reached an agreement to settle the last remaining outstanding insurance litigation relating to Surf Expo event cancellation insurance policies. To date, we have submitted $167.4 million in claims for impacted or cancelled events previously scheduled to take place in 2020. There is no guarantee or assurance as to the amount or timing of future recoveries from Emerald’s event cancellation insurance policies.proceeds for $2.8 million.
See “Management’s Discussion and Analysis of Financial Condition and Results of Operations—Liquidity and Capital Resources” for further discussion relating to our event cancellation insurance coverage and proceeds received under the Company’s policy.policies.
Available Information
Our Annual Reports on Form 10-K, Quarterly Reports on Form 10-Q, Current Reports on Form 8-K, and amendments to reports filed pursuant to Sections 13(a) and 15(d) of the Exchange Act, are filed with the SEC. We are subject to the informational requirements of the Exchange Act and file or furnish reports, proxy statements and other information with the SEC. Such reports and other information filed by us with the SEC are available free of charge on our website at investor.emeraldx.com when such reports are made available on the SEC’s website. The SEC maintains an Internet site that contains reports, proxy and information statements and other information regarding issuers that file electronically with the SEC at www.sec.gov. The contents of these websites are not incorporated into this filing. Further, our references to the URLs for these websites are intended to be inactive textual references only.
9
Item 1A. Risk Factors.
RISK FACTORS
Investing in our common stock involves a high degree of risk. You should carefully consider the following factors, as well as other information contained in this Annual Report on Form 10-K/A,10-K, in evaluating our Company and business. If any of the following risks occur, our business, results of operations, and financial condition may be materially adversely affected.
Risks Relating to Our BusinessIndustry and IndustryMacroeconomic Conditions
General economic conditions may have an adverse impact on the industry sectors in which our trade shows, conferences and other events operate and therefore may negatively affect demand for exhibition space and attendance at our trade shows, conferences and other events.
Our business depends upon the ability and willingness of companies to attend our shows, and such attendance is sensitive to general economic conditions and corporate spending patterns. Consequently, in addition to general domestic and global economic conditions affecting our business, certain industry-specific conditions could affect our trade shows, conferences and other events. The global COVID-19 pandemic has hadlonger a recession or economic downturn continues, or the longer a particular industry sector is impacted by macroeconomic headwinds, the more likely it becomes that our customers reduce their marketing and advertising or procurement budgets. Any material decrease in marketing or procurement budgets could reduce the demand for exhibition space or reduce attendance at our trade shows, conferences and other events, which could have a material detrimental impactadverse effect on our business, financial condition, cash flows and results of operations.
Inflationary pressures and liquidity,increased interest rates could negatively impact demand for exhibition space, attendance at our tradeshows, conferences, events, and profitability
We and our customers may also be adversely affected by the impact of the rise of interest rates and sustained inflationary conditions. Throughout 2022 and the first half of 2023, the Federal Reserve approved almost a dozen interest increases to as high as 5.50% in July 2023. Additionally, inflation influences interest rates, which in turn impact the fair value of our investments and yields on new investments as well as increasing our financing costs. While inflation has not historically had a material effect on our business, results of operations, or financial condition, if our costs were to become subject to significant inflationary pressures, we may not be able to fully offset such impacthigher costs. Our inability or failure to do so could worsenharm our business, results of operations and last for an unknown periodfinancial condition. Operating expenses, including cost of time.labor, are impacted to a certain degree by the inflation rate as well.
Our operations, business and financial results have been, and may in the future be, materially impacted by COVID-19 or future public health emergencies, including outbreaks of communicable disease or other public health emergency.
The global spread ofCompany’s operations and operating results were materially impacted by the COVID-19 pandemic, has been severe and rapidly-evolving, withthe actions taken by governments public institutions and other organizations imposing or recommending, and businesses and individuals implementing, restrictions on various activities or other actionsaround the world to combat its spread.the virus had a significant negative impact on our live events, which depend on our ability to hold such in-person events and the willingness of exhibitors and attendees to attend. These restrictions includegovernmental actions included limitations and bans on travel or transportation; limitations on the size of gatherings; closures of work facilities, public buildings and businesses; cancellation of events, including trade shows, conferences and meetings; and quarantines and lock-downs.lockdowns. The pandemic and its consequences forced us to cancel or postpone a substantial portion of our event calendar for 2020 and the first half of 2021. These cancellations and postponements have had, and will continueIf similar actions were to have, a severely negative impact onbe taken in response to future public health emergencies, our business, operations, and financial results.results could be negatively impacted. While we operated a full slate of events in both 2022 and 2023, exhibitor participation and attendance at some of our trade shows was still below pre-pandemic levels. The extent to which the ongoing pandemicCOVID-19 continues to impact our business, operations, and financial results, including the duration and magnitude of such effects, will depend on numerous evolving factors that we may not be able to accurately predict or assess, including the durationadvent of new variants; government, social and scopebusiness restrictions on in-person events; the availability, adoption and efficacy of vaccines and treatments; and the effect of the pandemic; the negative impact it will havepandemic on global and regional economies and economic activity, including the duration and magnitude of its impact on the industry sectors in which our trade shows, conferences and other events operate; its short and longer-termlong term general economic conditions. The impact on our customers’ marketing, advertising or procurement budgetsof
10
COVID-19 could also cause a long-term reduction in the willingness of exhibitors and their willingness or abilityattendees to travel to our events; actions that federal, stateevents, which could have a material adverse effect on our business, financial condition, cash flows and results of operations.
Attendance at our shows could decline as a result of disruptions in global or local governments take in response to the pandemic, including limitingtravel conditions, such as congestion at airports, adverse weather or banning travelfear of communicable diseases such as COVID-19.
The number of attendees and large gatherings; quarantine requirements; effectiveness and distribution of vaccinations; and how quickly economies, travel activity, and demand for face-to-faceexhibitors at our trade shows conferencesmay be affected by a variety of factors that are outside our control. Because many attendees and other events recover afterexhibitors travel to our trade shows via airplane, factors that depress the pandemic subsides.
More specifically, the COVID-19 pandemic has subjectedability or desire of attendees and exhibitors to travel to our business, operations and financial condition to a number of risks,trade shows, including, but not limited to, those discussed below:
|
|
|
|
|
COVID-19, and the volatile regional and global economic conditions stemming from the pandemic, as well as reactions to future pandemics or resurgences of COVID-19, could also precipitate or aggravate the other risks we face, which in turn could materially adversely affect our business, financial condition, liquidity,cash flows and results of operations (including revenues and profitability) and/or stock price. Further, COVID-19 may also affectoperations. While we are generally insured against direct losses resulting from event cancellations due to circumstances outside of our operating and financial resultsreasonable control, our event cancellation insurance policies for policy years beginning in a manner that is not presently known to us or that we currently2022 do not considerinclude coverage for losses due to present significant risks to our operations. In these dynamic circumstances, there may be developments outside our control requiring us to adjust our operating plan.
During 2020, we recorded noncash adjustments to our recorded asset balance for certain intangible assets, and we may be required to record further such adjustment in future periods thatthe outbreak of communicable disease, including COVID-19, which could significantly impact our operating results.
Our balance sheet includes significant intangible assets, including trade names, goodwill and other acquired intangible assets. The determination of related estimated useful lives and whether these assets have been impaired involves significant judgment and subjective assessments, including as to our future business performance, and is subject to factors and events over which we have no control. The continued impact of COVID-19a material adverse effect on our business, slower growth rates, the introductionfinancial condition, cash flows and results of new competition into our marketsoperations.
Increased spending on digital marketing and advertising, or other external or macroeconomic factorsmarketing channels, could impairreduce the value of our intangible assets if they create market conditions that adversely affect the competitiveness of our business. Further, declines in our market capitalization may be an indicator that the carrying values of our intangible assets or goodwill exceed their fair values, which could lead to potential impairments that could impact our operating results. For the year ended December 31, 2020 we recorded non-cash goodwill impairments of $603.4 million and non-cash intangible asset impairments of $60.9 million and $15.9 million for certainamount spent on in-person trade names and certain customer relationships, respectively. For the year ended December 31, 2019, we recorded non-cash goodwill impairments of $69.4 million and non-cash intangible asset impairments of $8.7 million and $8.3 million for certain customer relationships and certain trade names, respectively. There can be no assurance that we will not record further impairment charges in future periods.shows.
The success of each of our trade shows depends on the reputationwillingness of that show’s brand.
Our exhibitorscompanies to continue committing marketing budget allocations towards in-person shows and attendees primarily know us bylive events. Alternative channels for marketing spend such as digital, social media and telemarketing could draw marketing budgets away from in-person trade shows and live events. Moreover, digital marketing and social media have experienced meaningful growth over the names oflast several years and, although we have not observed a material decline in demand for our trade shows that operate in their specific industry sector rather than by our corporate brand name, Emerald. In addition,as a single brand name is sometimes used for shows that occur more than once a year; for example, the brand name “ASD Market Week” is used at our ASD Market Week March and ASD Market Week August shows, the brand name “NY NOW” is used at our NY NOW Summer and NY NOW Winter shows, and the brand name Outdoor Retailer is used for the Outdoor Retailer Summer Market and Outdoor Retailer + Snow Show versionsresult of the show. Ifincreasing use of the imageinternet and social media for advertising and marketing, the increasing influence of online marketing and any resulting reductions or reputationeliminations of one or more of these shows is tarnished, it could impact the number of exhibitors and attendees attending that show or shows. A decline in one ofbudgets our largerparticipants allocate to our trade shows could have a material adverse effect on our business, financial condition, cash flows and results of operations.
Risks Relating to Our Business and Operations
Our inability to secure or retain desirable dates and locations for our trade shows could have a material effect on our business, financial condition, cash flows and results of operations.
The datesdate and location of a trade show can impact its profitability, prospects and prospects.
Thethe demand and competition for desirable dates and locations for our trade shows is high. Consistent with industry practice, we typically maintain multi-year non-binding reservations for dates at our trade show venues. Aside from a nominal deposit in some cases, we do not pay for these reservations, and, while they generally entitle us to a last look before the venue is rented to a third party during the reservation period,reservations. However, these reservations are not binding on the facility owners until we execute a definitive contract with the owner.owners and we are not always provided notice before the venue is rented to a third party during the reservation period. We typically sign contracts that guarantee the right to specific dates at venues only one or two years in advance. Therefore, our multi-year reservations may not lead to binding contracts with facility owners. Consistency in location and all other aspects of our trade shows is important to maintaining a high retention rate from year to year, and we rely on our highly loyal customer base for the success of our shows. Moving major shows to new cities, such as the move of Outdoor RetailerOR from Denver, Colorado to Salt Lake City, Utah to Denver, Colorado in January 2018,2023, can adversely affect customer behavior. Similarly, significant timing and frequency changes, such as the move of Outdoor RetailerOR Winter Market from January 2024 to November 2019 to January 20202024 and the shift from a three-show to two-show format for Outdoor RetailerOR in 2019, can also result in unanticipated customer reactions. ExternalOur business has from time to time been negatively impacted by these moves and changes in scheduling. In addition, external factors such as legislation and government policies at the local or state level, including policy related to social, political and economic issues, may depressweaken the desire of exhibitors and attendees to attend our trade shows held in certain locations. Our inabilitylocations, or cause us to secure or retain desirable dates and locations formove our trade shows.
11
The success of each of our trade shows could have a material effectdepends on our business, financial condition, cash flowsthe strong reputation of that show’s brand.
Our exhibitors and resultsattendees primarily know us by the names of operations.
Attendance at our shows could decline as a result of disruptions in global or local travel conditions, such as congestion at airports, the risk of or an actual terrorist action, adverse weather or fear of communicable diseases.
The number of attendees and exhibitors at our trade shows may be affectedthat operate in their specific industry sector rather than by our corporate brand name, Emerald. In addition, a varietysingle brand name is sometimes used for shows that occur more than once a year. For example, the brand name “ASD Market Week” is used at our ASD Market Week March and ASD Market Week August shows. If the image or reputation of factors that are outsideone or more of these shows is tarnished, it could impact the number of exhibitors and attendees attending those shows. A decline in one of our control. Because many attendees and exhibitors travel to our tradelarger shows via airplane, factors that depress the ability or desire of attendees and exhibitors to travel to our trade shows, including, but not limited to: an increased frequency of flight delays or accidents; outbreaks of contagious disease, such as the COVID-19 pandemic; increased costs associated with air travel; actual or threatened terrorist attacks; the imposition of heightened security standards or bans on visitors from particular countries outside the United States; or acts of nature, such as earthquakes, storms and other natural disasters, could have a material adverse effect on our business, financial condition, cash flows and results of operations. For example, in addition to the impact of the COVID-19 pandemic, we experienced disruptions to ISS Orlando, Surf Expo and ICFF South Florida during the third quarter of 2017 as a result of the impact of Hurricane Irma, cancelled ISS Orlando and Surf Expo during the third quarter of 2019 as a result of Hurricane Dorian, and may be forced to cancel or re-locate future trade shows in the event of other natural or man-made disasters. While we are generally insured against direct losses resulting from event cancellations due to circumstances outside of our reasonable control, one or more of the factors described above could cause a long-term reduction in the willingness of exhibitors and attendees to travel to attend our trade shows, which could have a material adverse effect on our business, financial condition, cash flows and results of operations.
We may fail to accurately monitor or respond to changing market trends and adapt our trade show portfolio accordingly.
Our success depends in part upon our ability to monitor changing market trends and to adapt our trade shows, acquire existing trade shows or launch new trade shows to meet the evolving needs of existing and emerging target audiences. The process of researching, developing, launching and establishing profitability for a new trade show may lead to initial operating losses. While we did not launch any new in-person events in 2020 due to the impact of COVID-19, we launched five new events in 2019, and expect to continue to launch new events in future periods. Our efforts to adapt our trade shows, or to introduce new trade shows into our portfolio, in response to our perception of changing market trends, may not succeed, which could have a material adverse effect on our business, financial condition, cash flows and results of operations.
If we fail to attract leading brands as exhibitors in, or high-quality attendees to, our trade shows, we may lose the benefit of the self-reinforcing “network effect” that many of our shows enjoy today.
The leading brands represented by our exhibitors attract attendees who, in many cases, have authority to make purchasing decisions, or who offer other benefits (such as publicity or press coverage) by virtue of their attendance. The presence of these exhibitors and attendees creates the self-reinforcing “network effect” that benefits our
business; however, if representatives of leading brands decide for any reason not to participate in our trade shows, the number and quality of attendees could decline, which could lead to a rapid decline in the results of one or more trade shows and have an adverse effect on our business, financial condition, cash flows and results of operations.
We may not fully realize the expected results and/fail to accurately monitor or operating efficiencies associated withrespond to changing market trends and adapt our strategic initiatives or restructuring programs, which may have an adverse impact on our business.trade show portfolio accordingly.
We depend on
Our success depends in part upon our ability to evolvemonitor changing market trends and grow, and as changes into adapt our business environment occur, we may adjust our business plans by introducingtrade shows, acquire existing trade shows or launch new strategic initiatives or restructuring programstrade shows to meet these changes. Recently introduced strategic initiatives include our efforts to: (i) implement event plansthe evolving needs of existing and emerging target audiences. The process of researching, developing, launching, relaunching and establishing profitability for a new trade show may lead to standardize marketing and sales planning across our event portfolio, (ii) introduce value-based pricinginitial operating losses. Our strategy is to launch new trade shows from time to time in order to improve transparency and customer satisfaction while driving yield improvement, and (iii) enhancetake advantage of these trends. Our efforts to adapt our data analytics capabilitiestrade shows, or to developintroduce new commercial insights. If we aretrade shows into our portfolio, in response to our perception of changing market trends, may not able to effectively executesucceed, which could have a material adverse effect on our strategic initiatives, if we do not adequately leverage technology to improve operating efficiencies or if we are unable to develop the data analytics capabilities needed to generate actionable commercial insights, our business, performance may be impacted, which may negatively impact our financial condition, cash flows and results of operations.
We may face increased competition from existing trade show operators or new competitors.
Although the trade show market is highly fragmented, we currently face increased competition in certain of our industry sectors. Further, our high profit margins and low start-up costs could encourage new operators to enter the trade show business. Both existing and new competitors present an alternative to our product offerings, and if competition increases or others are successful in attracting away our exhibitors and attendees, it could have a material adverse effect on our business, financial condition, cash flows and results of operations.
A significant portion of our revenue ishas historically been generated by a concentrated number of our top five trade shows.
We have historically depended on a concentrated number of our top five trade shows to generate a significant portion of our revenues. For the year ended December 31, 2019,2022, which is the last year in which our operations were not negativelymaterially impacted by the COVID-19 pandemic, our top five shows were KBIS, ASD Market Week March, ASD Market Week August, Outdoor Retail Summer Market and NY NOW Summer. For the year ended December 31, 2020, these shows represented 19.3%29% of our total revenues. For the year ended December 31, 2019,2023, these shows represented 29.8%generated 28% of our total revenues. Notwithstanding the fact that ASD Market Week and NY NOW represent multiple product categories and that all ofrevenue. While we continue to make efforts to diversify our top five shows are highly diversified by customer,business, a significant decline in the performance or prospects of any one of these significantour top trade shows could have a material adverse effect on our business, financial condition, results of operations and cash flows.
Our exhibitors
We may choosenot fully realize the expected results and/or operating efficiencies associated with our strategic initiatives or restructuring programs, which may have an adverse impact on our business.
We depend on our ability to use an increasing portionevolve and grow, and as changes in our business environment occur, we may adjust our business plans by introducing new strategic initiatives or restructuring programs to meet these changes. Recent strategic initiatives include our efforts to (i) implement various sales effectiveness initiatives to improve productivity of theirour sales efforts, (ii) establish three dedicated divisions focused on Connections, Content and
12
Commerce, (iii) implement event plans to standardize marketing and advertising budgetssales planning across our event portfolio, (iv) introduce value-based pricing in order to fund online initiatives or otherwise reduce the amount of money they have availableimprove transparency and customer satisfaction while driving yield improvement, and (v) enhance our data analytics capabilities to spend in connection with our trade shows.
Our trade shows generally have high NSF renewal rates, anddevelop new commercial insights. If we expectare not able to continue to derive the substantial majority of our revenues from selling booth space to exhibitors. Although we have not observed a decline in demand for our trade shows as a result of the increasing use of the internet and social media for advertising and marketing, the increasing influence of online marketing and any resulting reductions of the budgets our participants allocate to our trade shows could have a material adverse effecteffectively execute on our strategic initiatives, if we do not adequately leverage technology to improve operating efficiencies or if we are unable to develop the data analytics capabilities needed to generate actionable commercial insights, our business performance may be impacted, which may negatively impact our financial condition cash flows and results of operations.
The PlumRiver Acquisition presents business, financial, and integration risks.
On December 31, 2020, we completed the PlumRiver Acquisition. The PlumRiver Acquisition expands our business into a new business line through its Elastic Suite software-as-a-service technology with digital commerce capabilities, which involves a number of financial, accounting, managerial, operational, integration, compliance and other risks and challenges. The PlumRiver Acquisition entails important risks, including the risk that the PlumRiver business could under-perform relative to our expectations and the purchase price for the acquisition or not perform in accordance with our anticipated timetable, or we could fail to operate such business profitably; the risk that we
are unable to successfully integrate PlumRiver’s operations and employees and realize its benefits, including the potential impact of the consummation of the proposed transaction on relationships, including with customers, employees and competitors; changes in general economic, business and political conditions which affect the PlumRiver business, including significant competition in the marketplace.
We intend to continue to be acquisitive, and our acquisition growth strategy entails risk.
Our acquisition growth strategy entails risk and our future acquisitions may not be successful.
We may explore opportunities to purchase or invest in other businesses or assets that we believe will complement, enhance or expand our current business or that might otherwise offer us growth opportunities. Any transactions we identify may entail various risks, including, among others:
• the risks inherent in identifying desirable acquisition candidates, including management time spent away from running our core business and external costs associated with identifying such acquisition candidates; • the risk that we turn out to be wrong with respect to selecting and consummating what we had believed to be accretive acquisitions; • the risk of overpaying for a particular acquisition; • the risks of failing to successfully integrate acquisitions and retain the key employees and/or customers of acquired businesses; • the risks inherent in expanding into new lines of business, including our expansion into the digital commerce software-as-a-service business through the acquisition of PlumRiver, LLC (“PlumRiver”) which included the Elastic Suite product, and our recent acquisition of Bulletin Inc., a digital wholesale platform connecting brands and buyers; • the risks inherent in expanding our existing business into new categories or industries, including our recent expansion into the highly regulated cannabis industry through the acquisition of MJBiz; • the risks inherent in expanding into consumer events through our acquisition of the Overland Expo outdoor adventure events from Lodestone; • the risks relating to potential unknown liabilities of acquired businesses; • the cultural, execution, currency, tax and other risks associated with international expansion including our recent acquisition of Advertising Week and any future further expansion; and • the risks associated with financing an acquisition, which may involve diluting our existing stockholders, reducing our liquidity or incurring additional debt, which in turn could result in increased debt service costs and/or a requirement to comply with certain financial or other covenants. |
|
|
|
|
|
|
|
|
|
|
|
|
|
|
In furtherance of our strategy of growth through acquisitions, we routinely review and conduct investigations of potential acquisitions, some of which may be material. When we believe a favorable opportunity exists, we typically seek to enter into discussions with target shows or sellers regarding the possibility of such acquisitions. At any given time, we may be in discussions with one or more counterparties. There can be no assurances that any such negotiations will lead to definitive agreements, or if such agreements are reached, that any transactions would be consummatedconsummated.
The acquisition of MJBiz may subject us to new regulatory, business and financial risks relating to the cannabis industry.
On December 31, 2021, we completed the acquisition of MJBiz. MJBiz publishes MJBiz Daily, a leading publication addressing business, regulatory, operational, and legal issues relevant to the cannabis and hemp industries, and also sponsors the annual MJBizCon, a trade event and conference for the cannabis industry and an annual educational conference in San Diego for the scientific community focused on research, testing, and lab services in the cannabis industry. Although we do not grow, sell or distribute cannabis products, and sale and distribution of cannabis
13
products are not permitted at MJBiz-sponsored events, our connection with businesses that serve the cannabis industry could subject us to regulatory, financial, operational and reputational risks and challenges.
Under U.S. federal law, and more specifically the Controlled Substances Act (“CSA”), the cultivation, processing, distribution, sale, advertisement, and possession of cannabis are illegal, notwithstanding the legalization of sales for medicinal or adult recreational use in many individual states. As a result, federal law enforcement authorities, or authorities in certain U.S. jurisdictions that criminalize the processing, sale or possession of cannabis products, may seek to bring criminal actions against exhibitors, attendees or subscribers to MJBiz’s events and publications. If our exhibitors or customers are found to be violating applicable state or federal law relating to cannabis, they may be subject not only to criminal charges and convictions, but also to forfeiture of property, significant fines and penalties, disgorgement of profits, administrative sanctions, cessation of business activities, or civil liabilities arising from proceedings initiated by either government entities or private citizens. Further, the perception that businesses that participate in MJBiz events or subscribe to or advertise in MJBiz publications are engaged in or promoting socially undesirable activity could have an adverse impact on our overall corporate reputation. In addition, the breadth of federal conspiracy and aiding and abetting statutes could potentially subject us to prosecution for aiding and abetting or conspiring to violate the CSA by virtue of our sponsoring events or publications that are directed to businesses that directly or indirectly service the cannabis industry. Any of these actions or consequences could have a material adverse effect on our business, operating results or financial condition, particularly if law enforcement authorities seek to treat MJBiz as participating directly in the cannabis industry.
We rely on digital media and print publications to stay in close contact with, and market to, our existing event audiences.
Our ability to effectively engage with target audiences for our events depends in part on our ability to generate engaging and informative content for our other marketing services, including our digital media and print publication properties. The media industry is highly competitive and continues to evolve rapidly, with an increasing number of alternative methods for the production and delivery of content. If we are unable to generate timely and relevant content for our audiences, exploit new and existing technologies to distinguish our digital media and print publications from those of our competitors, or adapt to new distribution methods in order to provide enhanced user experiences, both our other marketing services and event revenues could decline, which may have a material adverse effect on our business, financial condition, cash flows and results of operations.
A loss or disruption of the services from one or more of the limited number of outside contractors who specialize in decoration, facility set-up and other services in connection with our trade shows could harm our business.
We, and to a greater extent, our exhibitors, use a limited number of outside contractors for decoration, facility set-up and other services in connection with our trade shows, and we and our exhibitors rely on the availability, capability and willingness of these contractors to provide services on a timely basis and on favorable economic and other terms. Notwithstanding our long-term contracts with many of these contractors, many factors outside our control could harm these relationships and the availability, capability or willingness of these contractors to provide these services on acceptable terms. The partial or complete loss of services from these contractors, or a significant adverse change in our or our exhibitors’ relationships with any of these contractors, could result in service delays, reputational
damage and/or added costs that could harm our business and customer relationships to the extent we or our exhibitors are unable to replace them in a timely or cost-effective fashion, which could have a material adverse effect on our business, financial condition, cash flows and results of operations.
In addition, some facilities where we hold our trade shows require decorators, facility set-up and other service providers to use unionized labor. Any union strikes or work stoppages could result in delays in launching or running our trade shows and other events held at such facilities, reputational damage and/or added costs, which could have a material adverse effect on our business, financial condition, cash flows and results of operations.
The industry associations that sponsor and market certain of our trade shows could cease to do so effectively or could be replaced or supplemented by new industry associations who do not sponsor or market our trade shows.
We often enter into long-term sponsorship agreements with industry associations whereby the industry association endorses and markets our trade show to its members, typically in exchange for a percentage of the trade
14
show’s revenue. Our success depends, in part, on our continued relationships with these industry associations and our ability to enter into similar relationships with other industry associations. Although we frequently enter into long-term agreements with these counterparties, these relationships remain subject to various risks, including, among others:
• failure of an industry trade association to renew a sponsorship agreement upon its expiration; • termination of a sponsorship agreement by an industry trade association in specified circumstances; • the willingness, ability and effectiveness of an industry trade association to market our trade shows to its members; • dissolution of an industry trade association and/or the failure of a new industry trade association to support us; and • the ability on the part of an industry trade association to organize a trade show itself. |
|
|
|
|
|
|
|
|
|
|
Any disruptions or impediments in these existing relationships, or the inability to establish a new relationship, could have a material adverse effect on our business, financial condition, cash flows and results of operations.
We do not own certain of the trade shows that we operate or certain trademarks associated with some of our shows.
The risks associated with our relationships with industry trade associations or other third-party sponsors of our events are particularly applicable in the case of KBIS, which is owned by the National Kitchen and Bath Association, and in the case of CEDIA and our Military trade shows, which are the trade shows in our portfolio where the show trademarks are owned by an industry association or other third party and not by us. Any material disruption to our relationship with these third parties could have a material adverse impact on the revenue stream from these trade shows.
The infringement or invalidation of proprietary rights could have an adverse effect on our business.
We rely on trademark, trade secret and copyright laws in the United States and on company policies and confidentiality agreements with our employees, consultants, advisors and collaborators to protect our proprietary rights, including with respect to the names of our trade shows, our exhibitor and attendee contact databases and other intellectual property rights. Our confidentiality agreements may not provide adequate protection of our proprietary rights in the event of unauthorized use or disclosure of our proprietary information or if our proprietary information otherwise becomes known, or is independently developed, by competitors. Failure to obtain or maintain adequate protection of our intellectual property rights for any reason could have a material adverse effect on our business. We rely on our trademarks, trade names and brand names to distinguish our trade shows from those of our competitors, and have registered and applied to register many of these trademarks. We cannot assure you that our trademark applications will be approved or that our federal registrations will be upheld if challenged. Third parties may oppose our applications or otherwise challenge our use of our trademarks through administrative processes or litigation. In the event that our trademarks are successfully challenged, we could be forced to rebrand our products
and/or services, which could result in the loss of brand recognition and could require us to devote resources to advertising and marketing new brands, and we may face reputational damage and incur costs associated with defending any such oppositions or litigation. Further, we cannot assure you that competitors will not infringe upon our trademarks, or that we will identify all such infringements or have adequate resources to properly enforce our trademarks.
We face risks associated with event cancellations or other interruptions to our business, which theour insurance we maintain may not fully cover.
We maintain business interruption, event cancellation, casualty, general commercial and umbrella and excess liability insurance, as well as policies relating to workers’ compensation, director and officer insurance, property and product liability insurance, and cyber security insurance. Our insurance policies may not cover all risks associated with the operation of our business and may not be sufficient to offset the costs of all losses, lost sales or increased costs experienced during business interruptions or event cancellations. For example, in addition to the ongoing impact of the COVID-19, pandemic, we previously experienced disruptions to ISS Orlando, Surf Expo and ICFF Southseveral events held in Florida during the third quarter of 2017 as a result of the impact of Hurricane Irma, cancelled ISS Orlando and Surf Expo during the third quarter of 2019 as a result of Hurricane Dorian,due to hurricanes, and we may be forced to cancel future trade shows in the event of other natural or man-made disasters. Our recent claims history due to COVID-19, combined with the increased frequency of natural disasters due to climate change or other factors, has resulted in increased event cancellation insurance premiums and higher deductibles, and we cannot guarantee that such premium increases will not continue in the future or that event cancellation insurancewe will be available to effectively cover all of our businesses. In addition, many of our trade shows are held in government-owned facilities, including three that are held on military bases operated by the U.S. government. These governmental entities may have the right to exclude us from the venues, or may not give us executed venue contracts until immediately prior to a scheduled trade show. While we are insured against losses arising from event cancellations, we are not reimbursed for any property that is discarded or destroyed or that we are required to replace because our existing assets are temporarily inaccessible. Such losses could have a negative impact on our business.
Certain events can also lead to reputational harm which could have a long-term negative impact on a trade show that would not be mitigated by insurance coverage. For some risks, we may not obtain insurance if we believe the cost of available insurance is excessive relative to the risks presented. As a result of market conditions, premiums and deductibles for certain insurance policies can increase substantially and, in some instances, certain insurance policies may become unavailable or available only for reduced amounts of coverage. As a result, we may not be able to renew our insurance policies or procure other desirable insurance on commercially reasonablereasonably terms, if at all. Further, while we have been able to secure event cancellation insurance for the calendar year 2023, this insurance policy does not include coverage for event cancellations due to the outbreak of communicable disease, including COVID-19. Losses and liabilities from uninsured or underinsured events and delay in the payment of insurance proceeds could have a material adverse effect on our financial condition and results of operations.
Failure to establish and maintain effective internal control over financial reporting could have a material adverse effect on our business and stock price.
We are required to comply with the SEC’s rules implementing Sections 302 and 404 of the Sarbanes-Oxley Act, which require management to certify financial and other information in our quarterly and annual reports, provide an annual management report on the effectiveness of internal control over financial reporting and include the attestation form from our independent registered public accounting firm. If we do not develop and maintain effective internal controls, our independent registered public accounting firm may issue a report that is adverse, which would be required if there are material weaknesses in our internal control over financial reporting.
In connection with becoming a public company, we undertook various actions to enable us to develop and maintain effective internal controls, such as building compliance and testing processes, and hiring additional accounting or internal audit staff or consultants. We have hired a third-party service provider to assist us with execution and management of our internal audit function. Testing and maintaining internal control over financial reporting can divert our management’s attention from other matters that are important to the operation of our business. Additionally, when evaluating our internal control over financial reporting, we may identify material weaknesses that we may not be able to remediate on a timely basis. If we identify any material weaknesses in our internal control over financial reporting and conclude that our internal control over financial reporting is not effective, or if our independent registered public accounting firm is unable to express an unqualified opinion as to the effectiveness of our internal control over financial reporting, investors may lose confidence in the accuracy and completeness of our financial
15
reports and the market price of our common stock could be negatively affected, and we could become subject to investigations by the New York Stock Exchange, the SEC or other regulatory authorities, which could require additional financial and management resources. In addition, if we fail to remedy any material weakness, our financial statements could be inaccurate and we could face restricted access to capital markets.
Because we no longer qualify as an “emerging growth company” as defined in the JOBS Act as of December 31, 2022, we have increased our legal and financial compliance costs, and management and other personnel are required to divert increased attention from operations and other business matters to devote substantial time to the public company reporting requirements that apply to us as an accelerated filer. If we do not comply with our public reporting requirements, the market price of our stock could decline and we could be subject to sanctions or investigations by the New York Stock Exchange, the SEC or other regulatory authorities, which would result in additional financial and management resources.
We have identified in the past material weaknesses in our internal control over financial reporting. If we are unable to develop and maintain effective internal control over financial reporting, we may not be able to accurately report our financial results in a timely manner, which may adversely affect investor confidence in us; materially and adversely affect our business and operating results; and expose us to potential litigation.
A material weakness is a deficiency, or a combination of deficiencies, in internal control over financial reporting such that there is a reasonable possibility that a material misstatement of our annual or interim consolidated financial statements will not be prevented or detected and corrected on a timely basis. Specifically, we did not design and maintain effective controls related to the evaluation of the impact of the arrangement’s terms and conditions on the accounting and reporting for preferred stock instruments. This material weakness resulted in the restatement of our previously filed consolidated financial statements as of and for the year ended December 31, 2020, as well as the quarterly condensed consolidated financial information for the 2020 interim periods ended June 30, September 30, and December 31, 2020 related to temporary equity, permanent equity, additional paid in capital, accretion to redemption value of redeemable convertible preferred stock, net loss and comprehensive loss attributable to common shareholders, loss per share and the related disclosures. Additionally, this material weakness could result in misstatements of the aforementioned account balances or disclosures that would result in a material misstatement to the annual or interim consolidated financial statements that would not be prevented or detected.
Effective internal control over financial reporting is necessary for us to provide reliable financial reports and prevent fraud. During the year ended December 31, 2022, we undertook efforts to remediate the material weaknesses. These remediation measures can be time consuming and costly. In order to remediate the material weakness, we have expended resources to enhance the design of our control activities related to the evaluation of the impact of the terms and conditions on the accounting and reporting for preferred stock issuances and recognizing payment obligations payable to third parties upon recognition of insurance claim proceeds.
If we identify any new material weaknesses in the future, we may be unable to maintain compliance with the requirements of securities laws, stock exchange listing rules, or debt instrument covenants regarding timely filing of information; we could lose access to sources of capital or liquidity; and investors may lose confidence in our financial reporting and our stock price may decline as a result. Though we have resolved existing material weaknesses as of December 31, 2022, we cannot assure you that the measures we may take in the future will be sufficient to avoid or remediate potential future material weaknesses.
As a result of the material weaknesses and the related restatements previously identified, and other matters raised or that may in the future be identified, we face potential for adverse regulatory consequences, including investigations, penalties or suspensions by the SEC or the New York Stock Exchange, litigation or other disputes which may include, among others, claims invoking the federal and state securities laws, contractual claims or other claims arising from the restatements and material weakness in our internal control over financial reporting and the preparation of our consolidated financial statements. As of the date of this filing, we have no knowledge of any such regulatory consequences, litigation, claim or dispute. However, we can provide no assurance that such regulatory consequences, litigation, claim or dispute will not arise in the future. Any such regulatory consequences, litigation, claim or dispute, whether successful or not, could subject us to additional costs, divert the attention of our management, or impair our reputation. Each of these consequences could have a material adverse effect on our business, results of operations and financial condition.
16
During 2021 and 2022, we recorded noncash adjustments to our recorded asset balance for certain intangible assets, and we may be required to record further such adjustment in future periods that could significantly impact our operating results.
Our balance sheet includes significant intangible assets, including trade names, goodwill and other acquired intangible assets. The determination of related estimated useful lives and whether these assets have been impaired involves significant judgment and subjective assessments, including as to our future business performance, and is subject to factors and events over which we have no control. The impact of potential new COVID-19 variants or other communicable disease outbreaks on our business, slower growth rates, the introduction of new competition into our markets or other external or macroeconomic factors could impair the value of our intangible assets if they create market conditions that adversely affect the competitiveness of our business. Further, declines in our market capitalization may be an indicator that the carrying values of our intangible assets or goodwill exceed their fair values, which could lead to potential impairments that could impact our operating results. For the year ended December 31, 2022, we recorded non-cash goodwill impairments of $6.3 million and non-cash intangible asset impairments of $1.6 million for certain trade names. For the year ended December 31, 2021, we recorded non-cash goodwill impairments of $7.2 million and non-cash intangible asset impairments of $21.0 million and $11.7 million for certain customer relationships and certain trade names, respectively. There can be no assurance that we will not record further impairment charges in future periods.
Changes in our income tax rates or other indirect taxes may affect our future financial results.
Our future effective income tax rates may be favorably or unfavorably affected by unanticipated changes in the valuation of our deferred tax assets and liabilities, by changes in our stock price, or by changes in tax laws or their interpretation, including the Tax Cuts and Jobs Act enacted in December 2017. The Tax Cuts and Jobs Act introduced significant changes to U.S. income tax law. Accounting for the income tax effects of the Tax Cuts and Jobs Act has required significant judgments and estimates as well as accumulation of information not previously provided for in U.S. tax law. In addition, we are subject to the examination of our income tax returns by the Internal Revenue Service and other tax authorities. We regularly assess the likelihood of adverse outcomes resulting from these examinations to determine the adequacy of our provision for income taxes. These continuous examinations may result in unforeseen tax-related liabilities, which may harm our future financial results.
On August 16, 2022, President Biden signed the Inflation Reduction Act of 2022 (“IRA”) into law. The IRA establishes a 15% corporate minimum tax effective for taxable years beginning after December 31, 2022, and imposes a 1% excise tax on the repurchase after December 31, 2022 of stock by publicly traded corporations. We currently do not expect the tax-related provisions of the IRA to have a material impact on our financial results.
The loss of key management personnel or other company talent could have an adverse effect on our business.
We rely on certain key management personnel in the operation of our businesses. While we maintain long-term and emergency transition plans for key management personnel and believe we could either identify internal candidates or attract outside candidates to fill any vacancy created by the loss of any key management personnel, the loss of one or more of our key management personnel could have a negative impact on our businesses.
Risks Relating to our Indebtedness
Our significant indebtedness could adversely affect our financial condition and limit our ability to raise additional capital to fund our operations.
We have a significant amount of indebtedness. As of December 31, 2020,2023, we had $525.2$413.3 million of term loan borrowings outstanding under theour Amended and Restated Term Loan Facility,Senior Secured Credit Facilities, with $149.0$109.0 million in additional borrowing capacity under the revolving portion of our Amended and Restated RevolvingSenior Secured Credit Facility (as defined below)Facilities (after giving effect to $1.0 million of outstanding letters of credit).
Our high level of indebtedness could have important consequences to us, including: limiting our ability to obtain additional financing to fund future working capital, capital expenditures, investments or acquisitions or other general
17 corporate requirements; requiring a substantial portion of our cash flows to be dedicated to debt service payments instead of other purposes, thereby reducing the amount of cash flows available for working capital, capital expenditures, investments or acquisitions or other general corporate purposes; increasing our vulnerability to adverse changes in general economic, industry and competitive conditions; exposing us to the risk of increased interest rates as borrowings under our Amended and Restated Senior Secured Credit Facilities (to the extent not hedged) bear interest at variable rates, including increases or changes resulting from the replacement or unavailability of LIBOR, which could further adversely impact our cash flows; limiting our flexibility in planning for and reacting to changes in our business and the industry in which we compete; restricting us from making strategic acquisitions or causing us to make non-strategic divestitures; impairing or restricting our ability to repay or refinance borrowings under the Amended and Restated Senior Secured Credit Facilities; impairing our ability to obtain additional financing in the future; and increasing our cost of borrowing. |
|
|
|
|
|
|
|
|
|
|
|
|
|
|
|
|
|
|
Any one of these limitations could have a material effect on our business, financial condition, cash flows, results of operations and ability to satisfy our obligations in respect of our outstanding debt.
Despite our current debt levels, we may incur substantially more indebtedness, which could further exacerbate the risks associated with our substantial leverage.
We and our subsidiaries may be able to incur additional indebtedness in the future, which may be secured. While our Amended and Restated Senior Secured Credit Facilities limit our ability and the ability of our subsidiaries to incur additional indebtedness, these restrictions are subject to a number of qualifications and exceptions and thus, notwithstanding these restrictions, we may still be able to incur substantially more debt. In addition, provided that no default or event of default (as defined in the Amended and RestatedExtended Senior Secured Credit Facilities) has occurred and is continuing, we have the option to request to add one or more incremental term loan or revolving credit facilities or increase commitments under the Amended and RestatedExtended Revolving Credit Facility by an aggregate amount of the sum of (X) (i) if the incremental loans are first lien loans, an amount such that the first lien net leverage ratio does not exceed 4.00:1.00, (ii) if the incremental loans are junior lien loans, an amount such that the secured net leverage ratio does not exceed 4.00:1.00, (iii) if the incremental loans are unsecured, either the total net leverage ratio does not exceed 5.00:1.00 or the fixed charge coverage ratio is not less than 2.00:1.00, or, in each case, if the incremental loans are incurred with a permitted acquisition, an amount such that the applicable leverage ratio will not increase as a result of the permitted acquisition (on a pro forma basis giving effect to the incremental loans); plus (Y) an amount equal to certain prior voluntary prepayments, loan buybacks and commitment reductions of loans under the Amended and Restated Senior Secured Credit Facilities, plus (Z) an amount equal to the greater of $160 million and 100% of Consolidated EBITDA (as defined in the Amended and Restated Senior Secured Credit Facilities).Facility. As of December 31, 2020,2023, we had $525.2$413.3 million of borrowings outstanding under the Amended and RestatedExtended Term Loan Facility, with $149.0$109.0 million in additional borrowing capacity under the Amended and RestatedExtended Revolving Credit Facility (after giving effect to $1.0 million of outstanding letters of credit). To the extent that we incur additional indebtedness, the risks that we now face related to our substantial indebtedness could increase.
The covenants in our Amended and Restated Senior Secured Credit Facilities impose restrictions that may limit our operating and financial flexibility.
Our Amended and Restated Senior Secured Credit Facilities contain, a number ofand any future debt agreements may contain, significant restrictions and covenants that limit our ability among other things, to:
|
|
|
|
|
|
|
|
|
|
|
|
|
|
|
|
|
|
|
|
|
|
|
|
to operate our business, including restrictions on our ability to incur additional indebtedness; pay dividends, repurchase or redeem our capital stock; prepay, redeem or repurchase specified indebtedness; create certain liens; sell, transfer or otherwise convey certain assets; consolidate, merger or transfer all or substantially all of our assets, make certain investments; engage in transactions with affiliates, and enter into new lines of business. In addition, the Amended and RestatedExtended Revolving Credit Facility also contains a financial covenant requiring us to comply with a 5.50 to 1.00 total first lien net secured leverage ratio test. This financial covenant is tested quarterly if the aggregate amount of revolving loans, swingline loans and letters of credit outstanding under the Amended and RestatedExtended Revolving Credit Facility (net of up to $10.0 million of outstanding letters of credit) exceeds 35% of the total commitments thereunder.
TheseAs a result of these covenants, could materially and adversely affect our ability to financerespond to changes in business and economic conditions and engage in beneficial transactions, including to obtain additional financing as needed, may be limited. Further, our future operations or capital needs. Furthermore, they may restrict our ability to expand and pursue our business strategies and otherwise conduct our business. Our ability to complycompliance with these covenants may be affected by circumstances and events beyond our control, such as prevailing economic conditions and changes in regulations, and we cannot assure you that we will be able to comply with such covenants. These restrictions also limit our ability to obtain future financings to withstand a future downturn in our business or the economy in general. In addition, complying with these covenants may also cause us to take actions that may make it more difficult for us to successfully execute our business strategy and compete against companies that are not subject to such restrictions.
control. A breach of any covenant in our Amended and Restated Senior Secured Credit Facilities or the agreements and indentures governing any other indebtedness that we may have outstanding from time to time wouldof these covenants could result in a default under that agreement or indenture after any applicable grace periods. A default, if not waived,our debt agreements, which could result in acceleration ofpermit the debt outstanding underholders to accelerate our obligation to repay the agreement and in a default with respect to, and an acceleration of, the debt outstanding under other debt agreements.debt. If that occurs, we may not be able to make all of the required payments or borrow sufficient funds to refinance such debt. Even if new financing were available at that time, it may not be on terms that
18
are acceptable to us or terms as favorable as our current agreements. If our debt is in default for any reason, our business, results of operations and financial condition could be materially and adversely affected.
Regulatory and Technology Risks
We face continually evolving cybersecurity and similar risks, which could result in loss, disclosure, theft, destruction or misappropriation of, or access to, our confidential information and cause disruption to our business, damage to our brands and reputation, legal exposure and financial losses.
We and third parties on our behalf, collect and store, including by electronic means, certain personal, proprietary and other sensitive information, including payment card information that is provided to us through registration on our websites or otherwise in communication or interaction with us. These activities require the use of centralized data storage, including through third-party service providers. Data maintained in electronic form is always subject to the risk of security incidents, including breach, compromise, intrusion, tampering, theft, misappropriation or other malicious activity, all of which are continuing to occur in our industry, as well as the industries of our exhibitors, vendors and suppliers. Unauthorized access to or security breaches of our systems could result in the loss of data, loss of business, severe reputational damage adversely affecting customer or investor confidence, diversion of our management’s attention, litigation, indemnity obligations, damages for contract breach, penalties for violation of applicable laws or regulations and significant costs for remediation that may include liability for stolen or lost assets or information and repair of system damage that may have been caused and other liabilities. Further, an actual or perceived security incident, such as penetration of our or our third-party vendors’ networks, affecting personal or other sensitive information could subject us to business and litigation risk (e.g., under the California Consumer Privacy Act), or damage our reputation, including with exhibitors, sponsors and attendees. In addition, we are exposed to potentially heightened liability pursuant to the new SEC disclosure rules regarding material cybersecurity incidents. Exposure as a result of any of the above factors could have a material negative effect on our business and results of operations.
As our business evolves digitally, we are using data more and more in our business operations. A cyber breach or loss of sensitive or valuable data, content or intellectual property could mean a loss of reputation and trust, losses for our shareholders, fines, regulatory reprimands and business interruption. Managing these impacts could be disruptive and could cause reputational damage if handled inadequately.
Our ability to safeguard such personal information, business information, and other sensitive information is important to our business. We take these matters seriously and take significant steps to protect our stored information, including the implementation of systems and processes to thwart malicious activity and invest in protecting and securing our information. These protections are costly and require ongoing monitoring and updating as technologies change and efforts to overcome security measures become more sophisticated, including as a result of increasingly sophisticated AI tools becoming available. Further, we exercise only limited control over our third-party vendors, which increases our vulnerability to problems with services they provide.
Our information technology systems, including our Enterprise Resource Planning (“ERP”) business management system, could be disrupted.
The efficient operation of our business depends on our information technology systems. We rely on our information technology systems and certain third-party providers to effectively manage our business data, communications, vendor relationships, order entry and fulfillment and other business and financial processes. We also rely on internet service providers, mobile networks and other third-party systems to operate our business. We are currently in the process of reviewing and updating our information technology systems and processes in order to enhance our data analytics capability. This implementation process will consume time and resources and may not result in our desired outcome or improved financial performance. Our failure to properly and efficiently implement our information technology systems, or the failure of our information technology systems to perform as we anticipate, could disrupt our business and could result in transaction errors, processing inefficiencies and the loss of revenue and customers, causing our business and results of operations to suffer. In addition, our information technology systems may be vulnerable to damage or interruption from circumstances beyond our control, including fire, natural disasters,
19
power outages, systems failures and viruses. While we maintain disaster recovery plans, any such damage or interruption could have a material adverse effect on our business.
We are subject to governmental regulation including a variety of U.S. and international privacy and consumer protection laws, and any failure to comply with these regulations may have a material negative effect on our business and results of our operations.
We are subject to substantial governmental regulations affecting the use of certain types of data in our business. These include, but are not limited to, data privacy and protection laws, regulations, policies, and contractual obligations that apply to the collection, transmission, storage, security, processing, retention, and use of personally identifiable information or personal data, which among other things, impose certain requirements relating to the privacy and security of such information.
The data protection landscape is rapidly evolving in the United States, the European Union and elsewhere, including the European Union’s General Data Privacy Regulation (“GDPR”). As our operations and business grow, we may become subject to or affected by new or additional data protection laws and regulations and face increased scrutiny or attention from regulatory authorities. Substantial expenses and operational changes may be required in connection with maintaining compliance with such laws, and even an unsuccessful challenge by customers or regulatory authorities of our activities could result in adverse publicity and could require a costly response from and defense by us. In addition, certain privacy laws are still subject to a high degree of uncertainty as to their interpretation, application and impact, and may require extensive system and operational changes, be difficult to implement, increase our operating costs, adversely impact the cost or attractiveness of the products or services we offer, or result in adverse publicity and harm our reputation. State-specific data privacy laws and regulations continue to evolve and each state imposes different requirements. For example, the California Consumer Privacy Act imposes certain legal obligations on our use and processing of personal information related to California residents and gives residents the right to bring certain actions against companies. Further, there are several legislative proposals in the United States, at both the federal and state level, that could impose new privacy and security obligations. Complying with emerging and changing requirements may cause us to incur substantial costs and make enhancements to relevant data practices. Noncompliance could result in significant penalties or legal liability having an adverse effect on our operations and financials.
We do not own certain of the trade shows and events that we operate or certain trademarks associated with some of our shows and therefore rely on ongoing license agreements with certain third parties.
The risks associated with some of our relationships with industry trade associations or other third-party sponsors of our events such as KBIS (which is owned by the National Kitchen and Bath Association), CEDIA, our Military trade shows, and NBA CON, which are the trade shows or events in our portfolio where the trademarks are owned by an industry association or other third party and not by us. Any material disruption to our relationship with these third parties could have a material adverse impact on the revenue stream from these trade shows or events. In addition, any of these third party owners may allege that we have breached a license agreement, whether with or without merit, and accordingly seek to terminate our license. If successful, this could result in our loss of the right to use the licensed intellectual property, which could adversely affect the success of our trade shows’ and events.
The infringement or invalidation of proprietary rights could have an adverse effect on our business.
We rely on trademark, trade secret and copyright laws in the United States and abroad to protect our proprietary rights, including with respect to the names of our trade shows and publications. Failure to obtain or maintain adequate protection of our intellectual property rights for any reason could have a material adverse effect on our business. Our trademarks, trade names and brand names distinguish our trade shows from those of our competitors and we have registered and applied to register many of these trademarks to prevent others from using or capitalizing our names. There can be no assurance that our trademark applications will be approved or that our federal registrations will be upheld if challenged. Third parties may oppose our applications or otherwise challenge our use of our trademarks through administrative processes or costly litigation which if successful, could force us to rebrand our products and/or services resulting in the loss of brand recognition. Further, there can be no assurance that competitors will not infringe upon our trademarks, or that we will identify all such infringements or have adequate resources to properly enforce our trademarks.
20
We have begun to use certain artificial intelligence (“AI”) technologies in our business, and challenges with properly managing its use could result in reputational harm, legal liability, and financial cost.
Uncertainty around new and evolving AI use, including generative AI, may require additional investment to develop responsible use frameworks, develop or license proprietary content and develop new approaches and processes to attribute or compensate content creators, which could be costly. We currently use artificial intelligence applications embedded in third party-platforms on a relatively limited basis. For example, we use Photoshop, which provides AI capabilities in generating or editing images. The use or adoption of new and emerging technologies may increase our exposure to intellectual property claims, and the availability of copyright and other intellectual property protection for AI-generated material is uncertain. While we continue to develop an AI strategy for internal frameworks of use, if we do not properly manage and track AI use, this could result in reputational harm and legal liability resulting in financial cost and expense.
Risks Relating to Ownership of Our Common StockSecurities
The price of our common stock has fluctuated substantially over the past several monthsfrom time to time and may continue to fluctuate substantially in the future.
Our stock price has been, and may continue to be, subject to significant fluctuations, and has decreased significantly in recent months from historical trading levels as a result of a variety of factors, some of which are beyond our control.control, such as volatility in the stock markets and the effects of COVID-19. We may fail to meet the expectations of our stockholders or securities analysts at some point in the future, and our stock price could decline furtherin the future as a result. This volatility and the size of Onex’s investment in our equity securities may prevent you from being able to sell your common stock at or above the price you paid for your common stock. Additionally, further declines in our stock price could require further goodwill writedowns.write-downs.
In addition, the stock markets in general have experienced extreme volatility recently that has often been unrelated to the operating performance of particular companies. These broad market fluctuations may adversely affect the trading price of our common stock. Securities class action litigation has often been instituted against companies following periods of volatility in the overall market and in the market price of a company’s securities. Such litigation, if instituted against us, could result in substantial costs, divert our management’s attention and resources and harm our business, operating results and financial condition.
Because Onex controls the majority of our equity securities, it may control all major corporate decisions and its interests may conflict with the interests of other holders of our equity securities.
As of December 31, 2020,2023, Onex owned 47,058,332 shares of our common stock, representing 65.8%74.8% of our outstanding common stock. In addition, as of December 31, 2020,2023, Onex owned 69,718,919 shares of our redeemable convertible preferred stock, representing 161,891,916 stock. Together, Onex owned shares of our common stock and Onex owned shares of our redeemable convertible preferred stock, on an as-converted basis, represent 183,697,428 shares of our common stock, after accounting for the accumulated accreting return at a rate per annum equal to 7% on the accreted liquidation preference and paid in-kind.in-kind dividends paid. Onex’s beneficial ownership of our common stock, on an as-converted basis, is approximately 85.6%90.5%.
The holders of our redeemable convertible preferred stock have the right to approve certain matters, including (i) amendments to our organizational documents in a mannerwhich may be adverse to the Series A Preferred Stock, (ii) the creation or issuance of senior or parity equity securities or (iii) the issuance of any convertible indebtedness, other class of preferred stock or other equity securities in each case with rights to payments or distributions in which the redeemable convertible preferred stock would not participate on a pro-rata, as-converted basis. In addition, for so long as the redeemable convertible preferred stock represents more than 30% of the outstanding common stock on an as-converted basis, without the approval of a majority of the directors elected by the holders of the redeemable convertible preferred stock, we may not (i) incur new indebtedness to the extent certain financial metrics are not satisfied, (ii) redeem or repurchase any equity securities junior to the redeemable convertible preferred stock, (iii) enter into any agreement for the acquisition or disposition of assets or businesses involving a purchase price in excess of $100 million, (iv) hire or terminate the chief executive officer of the Company or (v) make a voluntary filing for bankruptcy or commence a dissolution of the Company. Holders of our redeemable convertible preferred stock also have the right, for so long as
21
the outstanding redeemable convertible preferred stock represents specified percentages of our outstanding common stock on an as-converted basis, to elect up to five members of our Board of Directors.
Accordingly, for so long as Onex continues to hold the majority of our equity securities, Onex will exercise a controlling influence over our business and affairs and will have the power to determine all matters submitted to a vote of our stockholders, including the election of directors and approval of significant corporate transactions such as amendments to our certificate of incorporation, mergers and the sale of all or substantially all of our assets. Onex could cause corporate actions to be taken that conflict with the interests of our other stockholders. This concentration of ownership could have the effect of deterring or preventing a change in control transaction that might otherwise be beneficial to our stockholders. In addition, Onex may in the future own businesses that directly compete with ours.
Future stock issuances or sales, including as a result of commonthe conversion of our redeemable convertible preferred stock, may cause dilution to our existing shareholders andcould adversely affect the market price of our common stock.
The market price of our common stock could decline as a result of sales of a large number of our common stock in the market, or the sale of securities convertible into a large number of our common stock. The perception that these sales could occur may also depress the market price of our common stock. As of December 31, 20202023, we had outstanding 71,445,99271,402,907 shares of redeemable convertible preferred stock with an aggregate liquidation preference of approximately $14.1$492.6 million, after accounting for the accumulated accreting return at a rate per annum equal to 7% on the accreted liquidation preference and paid in-kind. TheIf we do not pay dividends on the redeemable convertible preferred stock in cash, the aggregate accreting return will increase the number of shares of common stock issuable upon the conversion of the redeemable convertible preferred stock,, which may result in a further decrease in the market value of our common stock. In addition, the terms of the redeemable convertible preferred stock provide that the conversion price may be reduced, which would result in the shares of redeemable convertible preferred stock being convertible into additional common stock upon certain events, including distributions on our common stock or issuances of additional common stock or equity-linked securities, at a price less than the then-applicable conversion price. The issuance of common stock upon conversion of the redeemable convertible preferred stock would result in immediate dilution to existing holders of our common stock, which dilution could be substantial. In addition, the market price of our common stock may be adversely affected by such factors as whether the market price is near or above the conversion price, which could make conversion of the shares of redeemable convertible preferred stock more likely.
Further, the redeemable convertible preferred stock ranks senior to our common stock, which could affect the value of the common stock on liquidation or on a change in control transaction. Additionally, any convertible or exchangeable securities that we issue in the future may have rights, preferences and privileges more favorable than those of our common stock, and may result in dilution to owners of our common stock. Because our decision to issue additional debt or equity securities in any future offering will depend on market conditions and other factors beyond our control, we cannot predict or estimate the amount, timing or nature of our future issuances. Also, we cannot predict the effect, if any, of future issuances of our common stock on the market price of our common stock.
Our directors who have relationships with Onex may have conflicts of interest with respect to matters involving us.
Two of our tennine directors are affiliated with Onex. These persons have fiduciary duties to both us and Onex. As a result, they may have real or apparent conflicts of interest on matters affecting both us and Onex, which in some circumstances may have interests adverse to ours. Onex is in the business of making or advising on investments in companies and may hold, and may from time to time in the future acquire, interests in, or provide advice to, businesses that directly or indirectly compete with certain portions of our business or that are suppliers or customers of ours. In addition, as a result of Onex’Onex’s ownership interest, conflicts of interest could arise with respect to transactions involving business dealings between us and Onex including potential acquisitions of businesses or properties, the issuance of additional securities, the payment of dividends by us and other matters. In January 2018, Onex completed its acquisition of SMG Holdings Inc. (“SMG”), a leading global manager of convention centers, stadiums, arenas, theaters, performing arts centers and other venues. SMG subsequently merged with AEG Facilities, LLC to form ASM Global (“ASM”). Certain of our events are staged in ASM managed venues and two of our directors affiliated with Onex are also directors of ASM. In November 2020, Onex committed to invest more than $300 million in Convex
22
Group Limited (“Convex”). Convex is the lead underwriter of Emerald’s 2022, 2023 and 2024 event cancellation insurance policy.
In addition, our amended and restated certificate of incorporation provides that the doctrine of “corporate opportunity” does not apply with respect to us, to Onex or certain related parties or any of our directors who are employees of Onex or its affiliates such that Onex and its affiliates are permitted to invest in competing businesses or do business with our customers. Under the amended and restated certificate of incorporation, subject to the limitations set forth therein, Onex is not required to tell us about a corporate opportunity, may pursue that opportunity for itself or it may direct that opportunity to another person without liability to our stockholders. To the extent they invest in such other businesses, Onex may have differing interests than our other stockholders.
We are a “controlled company” within the meaning of the rules of the New York Stock Exchange and, as a result, rely on exemptions from certain corporate governance requirements.
Onex owns the majority of our outstanding common stock. As a result, we are a “controlled company” within the meaning of the New York Stock Exchange corporate governance standards. Arules. As a controlled company, of which more than 50% ofwe have the combined voting power is held by an individual, a group or another company is a “controlled company” within the meaning of the rules of the New York Stock Exchange and mayright to elect not to comply with certain corporate governance requirements of the New York Stock Exchange, including:
|
|
|
|
|
|
• | the requirement for an annual performance evaluation |
We currently rely on certain of the exemptions listed above. nominating and corporate governance committee and compensation committee.
Accordingly, while weour board currently havehas a majority of independent directors, our nominating and corporate governance and compensation committees do not consist entirely of independent directors. The independence standards are intended to ensure that directors who meet those standards are free of any conflicting interest that could influence their actions as directors. Accordingly,As a result, our shareholdersstockholders will not have the same protectionsprotection afforded to stockholders of companies that are subject to all of the corporate governance requirements of the New York Stock Exchange. In addition, Rule 10C-1 under the Securities Exchange Act of 1934, as amended (the “Exchange Act”), as adopted by the national securities exchanges, requires, among other things, that:
|
|
|
|
|
|
As a “controlled company”, we are not subject to these compensation committee independence requirements, and accordingly, our shareholders will not have the same protections afforded to stockholders of companies that are subject to these compensation committee independence requirements.
Taking advantage of the reduced disclosure requirements applicable to “emerging growth companies” may make our common stock less attractive to investors.
The Jumpstart Our Business Startups Act of 2012 (the “JOBS Act”) provides that, so long as a company qualifies as an “emerging growth company,” it will, among other things:
|
|
|
|
|
|
|
|
We intend to continue to take advantage of each of the exemptions described above. We have irrevocably elected not to take advantage of the extension of time to comply with new or revised financial accounting standards available under Section 107(b) of the JOBS Act. We could be an emerging growth company for up to five years following our 2017 IPO. We cannot predict if investors will find our common stock less attractive if we elect to rely on these exemptions, or if taking advantage of these exemptions will result in less active trading or more volatility in the price of our common stock.
Failure to establish and maintain effective internal control over financial reporting could have a material adverse effect on our business and stock price.
We are required to comply with the SEC’s rules and regulations implementing Sections 302 and 404 of the Sarbanes-Oxley Act, which require management to certify financial and other information in our quarterly and annual reports and provide an annual management report on the effectiveness of internal control over financial reporting. As an emerging growth company, our independent registered public accounting firm will not be required to attest to the effectiveness of our internal control over financial reporting until the earlier of the fiscal year ended December 31, 2022 or the date we are no longer an emerging growth company. At such time, our independent
registered public accounting firm may issue a report that is adverse, which would be required if there are material weaknesses in our internal control over financial reporting.
In connection with becoming a public company, we have undertaken various actions, and will need to take additional actions, such as implementing numerous internal controls and hiring additional accounting or internal audit staff or consultants. We have hired a third-party service provider to assist us with implementation of our internal audit function. Testing and maintaining internal control over financial reporting can divert our management’s attention from other matters that are important to the operation of our business. Additionally, when evaluating our internal control over financial reporting, we may identify material weaknesses that we may not be able to remediate on a timely basis. If we identify any material weaknessesAnti-takeover provisions in our internal control over financial reporting and conclude that our internal control over financial reporting is not effective, or if our independent registered public accounting firm is unable to express an unqualified opinion as to the effectiveness of our internal control over financial reporting once we are no longer an emerging growth company, investors may lose confidence in the accuracy and completeness of our financial reports and the market price of our common stock could be negatively affected, and we could become subject to investigations by the New York Stock Exchange, the SEC or other regulatory authorities, which could require additional financial and management resources. In addition, if we fail to remedy any material weakness, our financial statements could be inaccurate and we could face restricted access to capital markets.
We have identified a material weakness in our internal control over financial reporting. If we are unable to develop and maintain effective internal control over financial reporting, we may not be able to accurately report our financial results in a timely manner, which may adversely affect investor confidence in us; materially and adversely affect our business and operating results; and expose us to potential litigation.
A material weakness is a deficiency, or a combination of deficiencies, in internal control over financial reporting such that there is a reasonable possibility that a material misstatement of our annual or interim consolidated financial statements will not be prevented or detected and corrected on a timely basis.
Specifically, we did not design and maintain effective controls related to the evaluation of the impact of the arrangement’s terms and conditions on the accounting and reporting for preferred stock instruments. This material weakness resulted in the restatement of our previously filed consolidated financial statements as of and for the year ended December 31, 2020, as well as the quarterly condensed consolidated financial information for the 2020 interim periods ended June 30, September 30, and December 31, 2020 related to temporary equity, permanent equity, additional paid in capital, accretion to redemption value of redeemable convertible preferred stock, net loss and comprehensive loss attributable to common shareholders, loss per share and the related disclosures. Additionally, this material weakness could result in misstatements of the aforementioned account balances or disclosures that would result in a material misstatement to the annual or interim consolidated financial statements that would not be prevented or detected.
Effective internal control over financial reporting is necessary for us to provide reliable financial reports and prevent fraud. We continue to evaluate steps to remediate the material weakness. These remediation measures may be time consuming and costly and there is no assurance that these initiatives will ultimately have the intended effects.
In order to remediate the material weakness, we plan to enhance the design of our control activities related to the evaluation of the impact of the terms and conditions on the accounting and reporting for preferred stock issuances.
If we are not able to remediate the material weakness, or if we identify any new material weaknesses in the future, we may be unable to maintain compliance with the requirements of securities laws, stock exchange listing rules, or debt instrument covenants regarding timely filing of information; we could lose access to sources of capital or liquidity; and investors may lose confidence in our financial reporting and our stock price may decline as a result. Though we are taking steps to remediate the material weakness, we cannot assure you that the measures we have taken to date, or any measures we may take in the future, will be sufficient to remediate the material weakness or avoid potential future material weaknesses.
As a result of the material weakness and the related restatements due to the change in the accounting for redeemable convertible preferred stock from permanent to temporary equity, and other matters raised or that may in the future be identified, we face potential for adverse regulatory consequences, including investigations, penalties or suspensions by the SEC or the New York Stock Exchange, litigation or other disputes which may include, among others, claims invoking the federal and state securities laws, contractual claims or other claims arising from the restatements and material weakness in our internal control over financial reporting and the preparation of our consolidated financial statements. As of the date of this Amendment, we have no knowledge of any such regulatory consequences, litigation, claim or dispute. However, we can provide no assurance that such regulatory consequences, litigation, claim or dispute will not arise in the future. Any such regulatory consequences, litigation, claim or dispute, whether successful or not, could subject us to additional costs, divert the attention of our management, or impair our reputation. Each of these consequences could have a material adverse effect on our business, results of operations and financial condition.
Some provisions of our charter documents and Delaware law may have anti-takeover effects that could discourage an acquisitiona change of us by others, even if an acquisition would be beneficial tocontrol of our stockholders, and may prevent attempts bycompany or a change in our stockholders to replace or remove our current management.management
Provisions in ourOur amended and restated certificate of incorporation, as amended, and our second amended and restated bylaws, as well as provisions ofand the Delaware General Corporation Law (the “DGCL”), could make it more difficult forcontain provisions that might discourage, delay or prevent a third party to acquire usmerger, acquisition, or increase the cost of acquiring us, even if doing so would benefit ourother change in control that stockholders may consider favorable, including in transactions in which stockholders might otherwise receive a premium for their shares. These provisions may also prevent or frustrate attempts by our stockholders to replace or remove our management. Among other things, our amended and restated certificate of incorporation and amended and restated bylaws:
| • authorize the issuance of blank check preferred stock that our board of directors could issue in order to increase the number of outstanding shares and discourage a takeover attempt; • divide our board of directors into three classes with staggered three-year terms; • limit the ability of stockholders to remove directors to permit removals only “for cause” once Onex ceases to own more than 50% of all our outstanding common stock; • prohibit our stockholders from calling a special meeting of stockholders once Onex ceases to own more than 50% of all our outstanding common stock; • prohibit stockholder action by written consent once Onex ceases to own more than 50% of all our outstanding common stock, which will require that all stockholder actions be taken at a duly called meeting of our stockholders; 23 • provide that our board of directors is expressly authorized to adopt, alter, or repeal our second amended and restated bylaws; • provide, subject to limited exceptions, that the Court of Chancery of the State of Delaware will be the exclusive forum for substantially all disputes between us and our stockholders; • establish advance notice requirements for nominations for election to our board of directors or for proposing matters that can be acted upon by stockholders at stockholder meetings; and • require the approval of holders of at least two-thirds of the outstanding shares of common stock to amend our amended and restated bylaws and certain provisions of our amended and restated certificate of incorporation if Onex ceases to own more than 50% of all our outstanding common stock.
|
|
|
|
|
|
|
|
|
|
|
|
|
|
|
|
|
|
These anti-takeover defenses could discourage, delay or prevent a transaction involving a change in control of our company. These provisions could also discourage proxy contests and make it more difficult for you and other stockholders to elect directors of your choosing and cause us to take corporate actions other than those you desire.
General Risk Factors
At any given point in time, general economic conditions may have an adverse impact on the industry sectors in which our trade shows, conferences and other events operate, and therefore may negatively affect demand for exhibition space and attendance at our trade shows, conferences and other events.
Our results are influenced by domestic as well as global general economic conditions because we draw exhibitors and attendees from around the world, such as the severe impact in 2020 from the COVID-19 pandemic. However, we are affected to a larger degree by conditions within the individual industry sectors in which our trade shows, conferences and other events operate. The longer a recession or economic downturn continues, the more likely it becomes that our customers may reduce their marketing and advertising or procurement budgets. Any material decrease in marketing or procurement budgets could reduce the demand for exhibition space or reduce attendance at our trade shows, conferences and other events which could have a material adverse effect on our business, financial condition, cash flows and results of operations.
Changes in our income tax rates or other indirect taxes may affect our future financial results.
Our future effective income tax rates may be favorably or unfavorably affected by unanticipated changes in the valuation of our deferred tax assets and liabilities, by changes in our stock price, or by changes in tax laws or their interpretation, including the Tax Cuts and Jobs Act enacted in December 2017. The Tax Cuts and Jobs Act introduced significant changes to U.S. income tax law. Accounting for the income tax effects of the Tax Cuts and Jobs Act has required significant judgments and estimates as well as accumulation of information not previously provided for in U.S. tax law. As additional regulatory or accounting guidance related to the Tax Cuts and Jobs Act is issued, our analysis may change, which could materially affect our tax obligations and effective tax rate. In addition, we are subject to the continuous examination of our income tax returns by the Internal Revenue Service and other tax authorities. We regularly assess the likelihood of adverse outcomes resulting from these examinations to determine the adequacy of our provision for income taxes. These continuous examinations may result in unforeseen tax-related liabilities, which may harm our future financial results.
Our information technology systems, including our ERP business management system, could be disrupted.
The efficient operation of our business depends on our information technology systems. We rely on our information technology systems and certain third-party providers to effectively manage our business data, communications, vendor relationships, order entry and fulfillment and other business and financial processes. We also rely on internet service providers, mobile networks and other third-party systems to operate our business. We are currently in the process of reviewing and updating our information technology systems and processes in order to enhance our data analytics capability. This implementation process will consume time and resources and may not result in our desired outcome or improved financial performance. Our failure to properly and efficiently implement our information technology systems, or the failure of our information technology systems to perform as we anticipate, could disrupt our business and could result in transaction errors, processing inefficiencies and the loss of revenue and customers, causing our business and results of operations to suffer. In addition, our information technology systems may be vulnerable to damage or interruption from circumstances beyond our control, including fire, natural disasters, power outages, systems failures and viruses. While we maintain disaster recovery plans, any such damage or interruption could have a material adverse effect on our business.
We could fail to protect certain employee or customer data.
We, and third-party providers on our behalf, collect and retain certain employee and customer data, including personally identifiable information, and, in some cases, credit card data. Our various information technology systems enter, process, summarize and report such data. The integrity and protection of such data is critical to our business, and our customers and employees have an expectation that we will adequately protect their personal information. Public attention regarding the use of personal information and data transfer has increased in recent years, and the regulatory environment governing information, security and privacy laws, as well as the requirements imposed on us by the credit card industry, are increasingly demanding and continue to evolve rapidly. The changing nature of privacy laws in the U.S., the European Union and elsewhere, including the European Union’s General Data Privacy Regulation (“GDPR”), which became effective in May 2018, and the California Consumer Privacy Act, which became effective in January 2020, could impact our processing of personal and sensitive information of our employees, vendors and customers. The GDPR introduced new fines and penalties for a breach of requirements,
which may result in significant fines of up to 4% of annual global revenues, or €20.0 million, whichever is greater. Maintaining compliance with applicable information security and privacy regulations could increase our operating costs and require significant management time and attention. Failure to comply with such regulations may subject us to negative publicity, government scrutiny or remedies that may harm our business, including fines or demands that we modify or cease existing business practices. We rely on third-party vendors to, among other things, host our websites, customer databases and billing system. Any errors, failures, interruptions or delays experienced in connection with these third-party technologies and information services or our own systems could negatively impact our relationships with customers, adversely affect our brands and business and expose us to third-party liabilities. We exercise limited control over these third-party vendors, which increases our vulnerability to problems with services they provide. Furthermore, a compromised data system or the intentional, inadvertent or negligent release or disclosure of data by us or our third-party providers could result in theft, loss, or fraudulent or unlawful use of customer, employee or company data, any of which could harm our reputation and/or result in costs, fines or lawsuits, which could materially adversely affect our financial condition and operating results.
Item 1B. Unresolved Staff Comments.
None.
Item 1C. Cybersecurity.
Cybersecurity Risk Management and Strategy
Cybersecurity is an important part of our overall risk management systems and processes and an area of focus for our Board and management. We have developed and implemented an enterprise-wide information security program designed to identify, protect, detect, and respond to and manage reasonably foreseeable cybersecurity risks and threats. To protect our information systems from cybersecurity and privacy threats, we use various security tools that help prevent, identify, escalate, investigate, resolve, and recover from identified vulnerabilities and security incidents in a timely manner. These include, but are not limited to, internal reporting, monitoring and detection tools; an internal continuous pen testing program; and a third-party pen testing program to allow security researchers to assist us in identifying vulnerabilities in our products before they are exploited by malicious threat actors. We also maintain a third-party security program to identify, prioritize, assess, mitigate, and remediate third party risks; however, we rely on the third parties we use to implement security programs commensurate with their risk, and we cannot ensure in all circumstances that their efforts will be successful. Emerald's third-party security program is designed to mitigate cybersecurity risks associated with external service providers. This program includes conducting rigorous security assessments of potential third-party partners before onboarding, ensuring they meet our high standards for cybersecurity.
We regularly assess risks from cybersecurity and technology threats and monitor our information systems for potential vulnerabilities. We use widely adopted risk quantification models including those described in National Institute of Standards and Technology (NIST) special publications as well as the FAIR Institute’s Factor Analysis of Information Risk (FAIR) methodology for Quantifying and Managing Risk to identify, measure and prioritize cybersecurity and technology risks and develop related security controls and safeguards. We conduct regular reviews and tests of our information security program and also leverage audits by our internal audit team, tabletop exercises, penetration and vulnerability testing, red team exercises, simulations, and other exercises to evaluate the effectiveness of our information security program and improve our security measures and planning. We also engage an external firm to assist in our annual Payment Card Industry Data Security Standard (PCI DSS) self-attestation of compliance, as well as third-party penetration testing of our cardholder environment and related systems. We continuously enhance our cybersecurity measures by providing ongoing training for our employees, including simulated phishing exercises, to ensure they are fully prepared to address potential threats. The results of these assessments are reported to the Audit Committee as discussed below under “--Cybersecurity Governance.”
24
In the last ten years, we have not experienced any material cybersecurity incidents, and expenses incurred from cybersecurity incidents were immaterial. For a discussion of whether and how any risks from cybersecurity threats, including as a result of any previous cybersecurity incidents, have materially affected or are reasonably likely to materially affect us, including our business strategy, results of operations or financial condition, refer to Item 1A. Risk Factors – “We face continually evolving cybersecurity and similar risks, which could result in loss, disclosure, theft, destruction or misappropriation of, or access to, our confidential information and cause disruption to our business, damage to our brands and reputation, legal exposure and financial losses,” which is incorporated by reference into this Item 1C.
Cybersecurity Governance
The Board oversees our annual enterprise risk assessment, where we assess key risks within the Company, including security and technology risks and cybersecurity threats. Specifically, our Audit Committee is responsible for the oversight of risks from cybersecurity threats and receives regular updates from senior management including our Chief Information Officer and Director of Cyber Security, on various cybersecurity matters, including risk assessments, mitigation strategies, areas of emerging risks, incidents and industry trends, and other areas of importance. Our cybersecurity protocol requires that the Chair of the Audit Committee and senior management be immediately notified upon any cybersecurity incident.
Our Chief Information Officer, who has over 20 years of experience in the cybersecurity and information security space, leads our global information security team responsible for overseeing the Emerald information security program. We also have a Director of Cyber Security who brings 24 years of experience in the information technology field, including 15 years of direct experience in cybersecurity. In addition, the team members who support our information security program have relevant educational and industry experience, including holding similar positions at large technology companies. This team has primary responsibility for our overall cybersecurity risk management program and supervises both our internal cybersecurity personnel and our retained external cybersecurity consultants. The teams provide regular reports to senior management and other relevant teams on various cybersecurity threats, assessments, and findings.
Item 2. Properties.
We have fivetwo key offices located in New York, New York;York and San Juan Capistrano, California; Alpharetta, Georgia; Denver, Colorado; and Culver City, California. We also have several other smaller office locations throughout the United States, including in White Plains, New York; Hasbrouck Heights, New Jersey;Lakewood, Colorado; and Rye, New Hampshire; Framingham, Massachusetts; Blue Ash, Ohio; Louisville, Kentucky; and State College, Pennsylvania.Hampshire. We lease our offices from third parties on market terms and, in some cases following an acquisition, through transition services agreements with the applicable seller.
Item 3. Legal Proceedings.
From time to time, we may be involved in general legal disputes arising in the ordinary course of our business. We are not currently involved in legal proceedings that could reasonably be expected to have a material adverse effect on our business, financial condition or results of operations. Refer to Note 16, Commitments and Contingencies, in the notes to the consolidated financial statements included elsewhere in this Annual Report on Form 10-K/A10-K for additional information regarding our legal proceedings.
Item 4. Mine Safety Disclosures.
None.
25
PART II
Item 5. Market for Registrant’s Common Equity, Related Stockholder Matters and Issuer Purchases of Equity Securities.
Market Information for Common Stock and Holders of Record
Our common stock has been listed on the New York Stock Exchange since April 28, 2017 and trades under the symbol "EEX"“EEX”. The approximate number of record holders of our common stock on February 18, 202129, 2024 was 40.32. Because many of our shares of common stock are held by brokers and other institutions on behalf of stockholders, we are unable to estimate the total number of stockholders represented by these record holders.
Issuer Purchases of Equity Securities
In October 2020, we announced thatNovember 2023, our Board of Directors hadapproved an extension and expansion of our previously announced share repurchase program, which allows for the repurchase of $25.0 million of our common stock through December 31, 2024, subject to early termination or extension by the Board of Directors. This approval extends and expands the previously authorized a $20$20.0 million share repurchase program.program that was effective through December 31, 2023. Share repurchases under the extended plan may be made from time to time through and including December 31, 2021,2024, subject to early termination or extension by our Board of Directors. The share repurchase program may be suspended or discontinued at any time without notice. There is no minimum number of shares that we are required to repurchase. Shares may be purchased from time to time in the open market, including pursuant to one or more Rule 10b5-1 purchase plans that we may enter into from time to time, or in privately negotiated transactions. Such purchases will be at times and in amounts as we deem appropriate, based on factors such as market conditions, legal requirements and other business considerations.
In July 2019,October 2022, we announced that our Board of Directors had authorized a $30an extension and expansion of our previously authorized $20.0 million share repurchase program. Share repurchases may be made from time to time through and including July 31, 2020, subject to early termination or extension by the Board of Directors, through open-market purchases, either with or without a 10b5-1 plan, block transactions, privately negotiated purchases or otherwise. The repurchase program may be suspended or discontinued at any time without notice. There is no minimum number of shares that we are required to repurchase and the timing and amount of any shares repurchased under the program will depend on a variety of factors, including available liquidity, general market and economic conditions, regulatory requirements, capital structure optimization, valuation metrics and other factors. This share repurchase program was discontinued in the first quarter of 2020.
In November 2018, we announced that our Board of Directors had authorized a $20 million share repurchase program. Share repurchases under this program were authorized through December 31, 2019. There were no remaining amounts available to repurchase shares related to the share repurchase plan announced in November 2018 at December 31, 2019.2023.
The following table presents our purchases of common stock during the fourth quarter ended December 31, 2020,2023, as part of the publicly announced share repurchase program:
(Dollars in millions, except per share data) |
| Total Number |
|
| Average Price |
|
| Approximate |
| |||
October 1, 2023 - October 31, 2023 |
|
| — |
|
| $ | — |
|
| $ | 3.0 |
|
November 1, 2023 - November 30, 2023 |
|
| — |
|
|
| — |
|
|
| 25.0 |
|
December 1, 2023 - December 31, 2023 |
|
| — |
|
|
| — |
|
|
| 25.0 |
|
Total |
|
| — |
|
|
|
|
|
|
| ||
(Dollars in millions, except per share data) |
| Total Number of Shares Purchased as Part of Publicly Announced Program |
|
| Average Price Paid Per Share |
|
| Approximate Dollar Value of Shares That May Yet Be Purchased Under the Program |
| |||
October 1, 2020 - October 31, 2020 |
|
| 78,661 |
|
| $ | 2.75 |
|
| $ | 19.8 |
|
November 1, 2020 - November 30, 2020 |
|
| — |
|
|
| — |
|
|
| 19.8 |
|
December 1, 2020 - December 31, 2020 |
|
| 125,176 |
|
|
| 4.50 |
|
|
| 19.2 |
|
Total |
|
| 203,837 |
|
|
|
|
|
|
|
|
|
Stock Performance Graph
The following performance graph and related information shall not be deemed “soliciting material” or “filed” with the SEC, nor shall such information be incorporated by reference into any future filing under the Securities Act of 1933, or the Securities Exchange Act of 1934, each as amended, except to the extent that it is specifically incorporated by reference into such filing.
The following graph compares the yearly percentage change in the cumulative total stockholder return on our common stock with corresponding changes in the cumulative total returns of the Russell 2000 Index and our peer groups for the period from April 28, 2017, the first day our stock began trading on the New York Stock Exchange,December 31, 2018 through December 31, 2020.2023. The comparison assumes an initial investment of $100 at the close of business on April 28, 2017December 31, 2018 in our stock and in each of the indices and also assumes the reinvestment of dividends where applicable.applicable. This historical performance is not necessarily indicative of future performance.
26
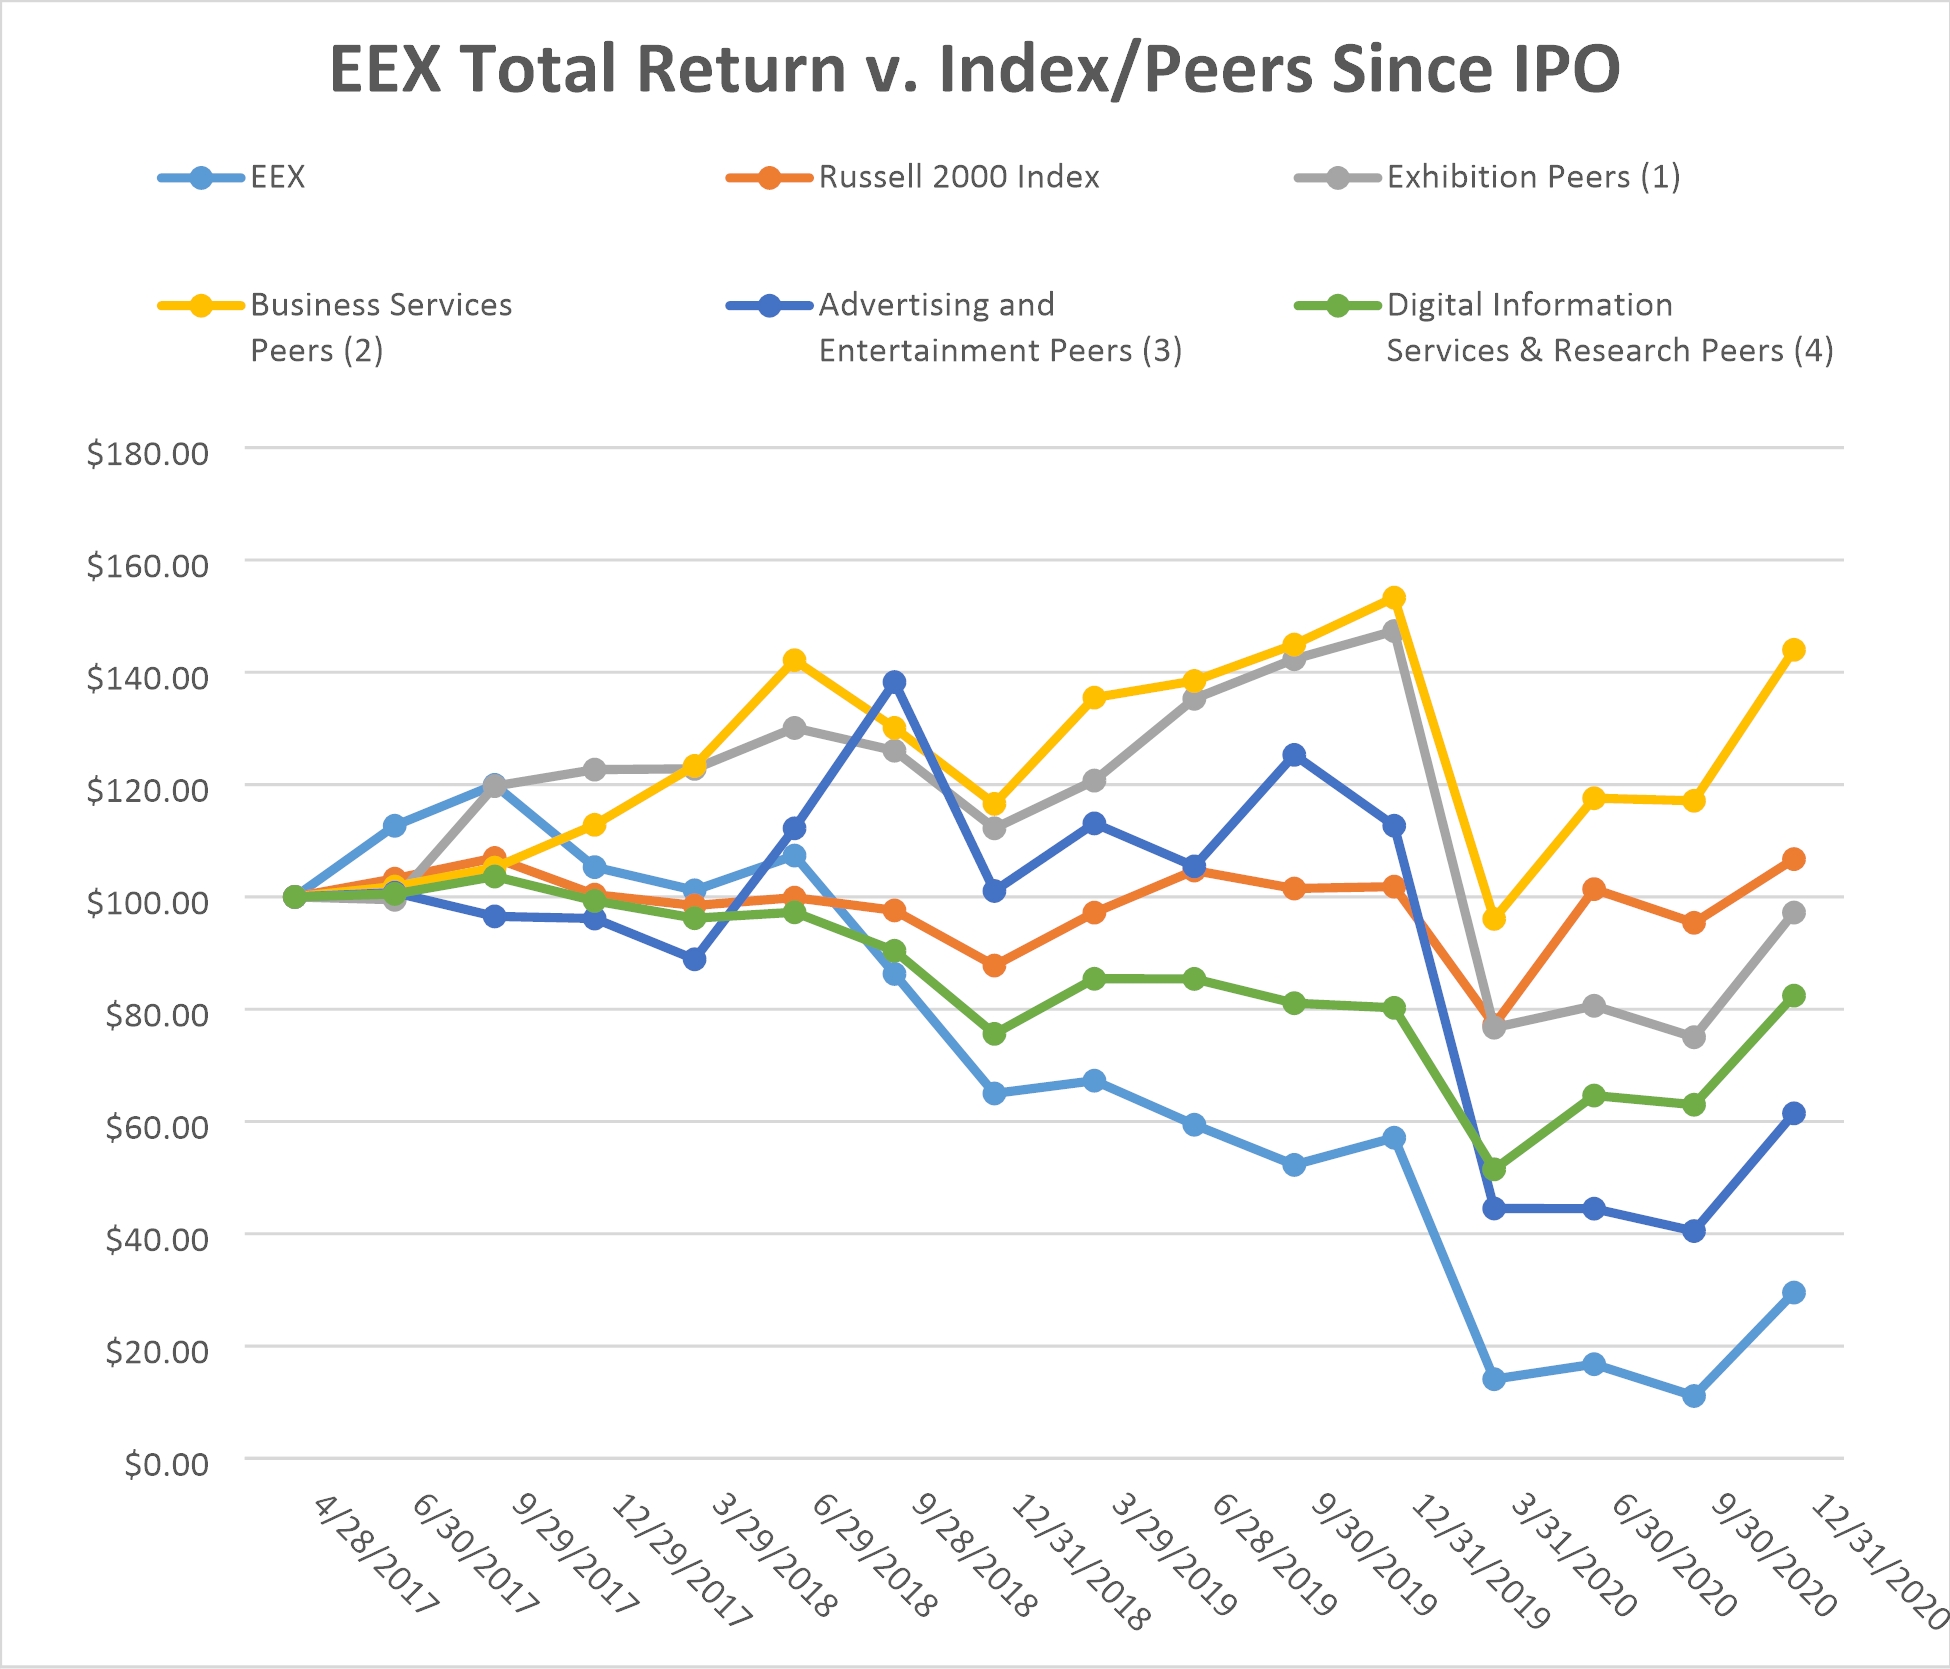
|
|
|
|
|
|
| (4) Digital Information Services & Research Peers include Gartner, Inc., IHS Markit Ltd., John Wiley & Sons, Inc. and Nielsen Holdings plc. |
Item 6. Selected Financial Data.
The following table presents selected consolidated financial data for the periods and at the dates indicated. The selected consolidated financial data as of December 31, 2023, 2022, 2021, 2020 2019, 2018, 2017 and 2016,2019, and for the years ended December 31, 2023, 2022, 2021, 2020 2019, 2018, 2017 and 2016,2019, have been derived from our audited consolidated financial statements. The following table has been updated to reflectThis financial data should be read in conjunction with the restatement of the Company’s previously issued consolidated financial statements, asrelated notes, “Management’s Discussion and Analysis of Financial Condition and for the year ended December 31, 2020 as further described in Note 1, DescriptionResults of BusinessOperations” and Summary of Significant Accounting Policies, in the notes to our audited consolidatedother financial statements includedinformation appearing elsewhere in this Amended Annual Report on Form 10-K/A.10-K.
The following information should be read in conjunction with “Management’s Discussion and Analysis of Financial Condition and Results of Operations”, “Business” and our consolidated financial statements and related accompanying notes included elsewhere in this Annual Report on Form 10-K/A.
10-K.
|
| Year Ended December 31, |
| |||||||||||||||||
|
| 2020(1) (As Restated) |
|
| 2019(1) |
|
| 2018(1) |
|
| 2017(1) |
|
| 2016(1) |
| |||||
| (dollars in millions, share data in thousands except earnings per share) |
| ||||||||||||||||||
Statement of (loss) income and comprehensive (loss) income data: |
|
|
|
|
|
|
|
|
|
|
|
|
|
|
|
|
|
|
|
|
Revenue |
| $ | 127.4 |
|
| $ | 360.9 |
|
| $ | 380.7 |
|
| $ | 341.7 |
|
| $ | 323.7 |
|
Other income |
|
| 107.0 |
|
|
| 6.1 |
|
|
| — |
|
|
| 6.5 |
|
|
| — |
|
Cost of revenues |
|
| 57.6 |
|
|
| 120.2 |
|
|
| 112.1 |
|
|
| 95.0 |
|
|
| 84.4 |
|
Selling, general and administrative expenses(2) |
|
| 118.6 |
|
|
| 133.4 |
|
|
| 121.8 |
|
|
| 121.9 |
|
|
| 98.9 |
|
Depreciation and amortization expense |
|
| 48.6 |
|
| �� | 52.0 |
|
|
| 46.8 |
|
|
| 43.2 |
|
|
| 40.0 |
|
Goodwill impairments(3) |
|
| 603.4 |
|
|
| 69.1 |
|
|
| — |
|
|
| — |
|
|
| — |
|
Intangible asset impairments(4) |
|
| 76.8 |
|
|
| 17.0 |
|
|
| 104.3 |
|
|
| — |
|
|
| — |
|
Operating (loss) income |
|
| (670.6 | ) |
|
| (24.7 | ) |
|
| (4.3 | ) |
|
| 88.1 |
|
|
| 100.4 |
|
Interest expense |
|
| 20.6 |
|
|
| 30.3 |
|
|
| 29.1 |
|
|
| 38.3 |
|
|
| 51.4 |
|
Loss on extinguishment of debt(5) |
|
| — |
|
|
| — |
|
|
| — |
|
|
| 3.0 |
|
|
| 12.8 |
|
(Loss) income before income taxes |
|
| (691.2 | ) |
|
| (55.0 | ) |
|
| (33.4 | ) |
|
| 46.8 |
|
|
| 36.2 |
|
(Benefit from) provision for income taxes |
|
| (57.6 | ) |
|
| (5.0 | ) |
|
| (8.3 | ) |
|
| (35.0 | ) |
|
| 14.0 |
|
Net (loss) income and comprehensive (loss) income |
|
| (633.6 | ) |
|
| (50.0 | ) |
|
| (25.1 | ) |
|
| 81.8 |
|
|
| 22.2 |
|
Accretion to redemption value of redeemable convertible preferred stock (6) |
|
| (15.6 | ) |
|
| — |
|
|
| — |
|
|
| — |
|
|
| — |
|
Net (loss) income and comprehensive (loss) income attributable to Emerald Holding, Inc. common stockholders |
| $ | (649.2 | ) |
| $ | (50.0 | ) |
| $ | (25.1 | ) |
| $ | 81.8 |
|
| $ | 22.2 |
|
|
|
|
|
|
|
|
|
|
|
|
|
|
|
|
|
|
|
|
|
|
Net (loss) income per share attributable to common stockholders |
|
|
|
|
|
|
|
|
|
|
|
|
|
|
|
|
|
|
|
|
Basic |
| $ | (9.09 | ) |
| $ | (0.70 | ) |
| $ | (0.34 | ) |
| $ | 1.19 |
|
| $ | 0.36 |
|
Diluted |
| $ | (9.09 | ) |
| $ | (0.70 | ) |
| $ | (0.34 | ) |
| $ | 1.13 |
|
| $ | 0.35 |
|
Weighted average common shares outstanding |
|
|
|
|
|
|
|
|
|
|
|
|
|
|
|
|
|
|
|
|
Basic |
|
| 71,431 |
|
|
| 71,719 |
|
|
| 72,887 |
|
|
| 68,912 |
|
|
| 61,859 |
|
Diluted |
|
| 71,431 |
|
|
| 71,719 |
|
|
| 72,887 |
|
|
| 72,116 |
|
|
| 63,294 |
|
Dividends declared per common share |
| $ | 0.0750 |
|
| $ | 0.2975 |
|
| $ | 0.2875 |
|
| $ | 0.2100 |
|
| $ | — |
|
|
|
|
|
|
|
|
|
|
|
|
|
|
|
|
|
|
|
|
|
|
Statement of cash flows data: |
|
|
|
|
|
|
|
|
|
|
|
|
|
|
|
|
|
|
|
|
Net cash (used in) provided by operating activities |
| $ | (37.1 | ) |
| $ | 67.8 |
|
| $ | 103.9 |
|
| $ | 110.8 |
|
| $ | 93.0 |
|
Net cash used in investing activities |
| $ | (37.3 | ) |
| $ | (16.7 | ) |
| $ | (74.7 | ) |
| $ | (95.5 | ) |
| $ | (51.9 | ) |
Net cash provided by (used in) financing activities |
| $ | 360.1 |
|
| $ | (62.0 | ) |
| $ | (19.6 | ) |
| $ | (19.3 | ) |
| $ | (42.5 | ) |
27
|
|
|
|
| Year Ended December 31, |
| ||||||||||||||
|
| 2023(1) |
|
| 2022(1) |
|
| 2021(1) |
|
| 2020(1) |
|
| 2019(1) |
| |||||
| (dollars in millions, share data in thousands except earnings per share) |
| ||||||||||||||||||
Statement of (loss) income and comprehensive |
|
|
|
|
|
|
|
|
|
|
|
|
|
|
| |||||
Revenue |
| $ | 382.8 |
|
| $ | 325.9 |
|
| $ | 145.5 |
|
| $ | 127.4 |
|
| $ | 360.9 |
|
Other income, net |
|
| 2.8 |
|
|
| 182.8 |
|
|
| 77.4 |
|
|
| 107.0 |
|
|
| 6.1 |
|
Cost of revenues |
|
| 137.6 |
|
|
| 116.5 |
|
|
| 57.1 |
|
|
| 57.6 |
|
|
| 120.2 |
|
Selling, general and administrative |
|
| 168.3 |
|
|
| 145.0 |
|
|
| 143.0 |
|
|
| 118.6 |
|
|
| 133.4 |
|
Depreciation and amortization expense |
|
| 45.0 |
|
|
| 59.5 |
|
|
| 47.6 |
|
|
| 48.6 |
|
|
| 52.0 |
|
Goodwill impairment charge(3) |
|
| — |
|
|
| 6.3 |
|
|
| 7.2 |
|
|
| 603.4 |
|
|
| 69.1 |
|
Intangible asset impairment charge(4) |
|
| — |
|
|
| 1.6 |
|
|
| 32.7 |
|
|
| 76.8 |
|
|
| 17.0 |
|
Operating income (loss) |
|
| 34.7 |
|
|
| 179.8 |
|
|
| (64.7 | ) |
|
| (670.6 | ) |
|
| (24.7 | ) |
Interest expense |
|
| 43.3 |
|
|
| 24.5 |
|
|
| 15.9 |
|
|
| 20.6 |
|
|
| 30.3 |
|
Interest income |
|
| 8.2 |
|
|
| 2.7 |
|
|
| 0.1 |
|
|
| 0.1 |
|
|
| — |
|
Loss on extinguishment of debt(5) |
|
| 2.3 |
|
|
| — |
|
|
| — |
|
|
| — |
|
|
| — |
|
Other expense |
|
| — |
|
|
| — |
|
|
| 0.1 |
|
|
| 0.1 |
|
|
| — |
|
Loss on disposal of fixed assets |
|
| 0.2 |
|
|
| — |
|
|
| 0.4 |
|
|
| — |
|
|
| — |
|
(Loss) income before income taxes |
|
| (2.9 | ) |
|
| 158.0 |
|
|
| (81.0 | ) |
|
| (691.2 | ) |
|
| (55.0 | ) |
Provision for (benefit from) income taxes |
|
| 5.3 |
|
|
| 27.2 |
|
|
| (1.3 | ) |
|
| (57.6 | ) |
|
| (5.0 | ) |
Net (loss) income and comprehensive |
|
| (8.2 | ) |
|
| 130.8 |
|
|
| (79.7 | ) |
|
| (633.6 | ) |
|
| (50.0 | ) |
Accretion to redemption value |
|
| (42.0 | ) |
|
| (38.8 | ) |
|
| (35.6 | ) |
|
| (15.6 | ) |
|
| — |
|
Participation rights on if-converted basis |
|
| — |
|
|
| (60.2 | ) |
|
| — |
|
|
| — |
|
|
| — |
|
Net (loss) income and comprehensive |
| $ | (50.2 | ) |
| $ | 31.8 |
|
| $ | (115.3 | ) |
| $ | (649.2 | ) |
| $ | (50.0 | ) |
|
|
|
|
|
|
|
|
|
|
|
|
|
|
| ||||||
Net (loss) income per share attributable |
|
|
|
|
|
|
|
|
|
|
|
|
|
|
| |||||
Basic |
| $ | (0.78 | ) |
| $ | 0.46 |
|
| $ | (1.62 | ) |
| $ | (9.09 | ) |
| $ | (0.70 | ) |
Diluted |
| $ | (0.78 | ) |
| $ | 0.46 |
|
| $ | (1.62 | ) |
| $ | (9.09 | ) |
| $ | (0.70 | ) |
Weighted average common shares |
|
|
|
|
|
|
|
|
|
|
|
|
|
|
| |||||
Basic |
|
| 63,959 |
|
|
| 69,002 |
|
|
| 71,309 |
|
|
| 71,431 |
|
|
| 71,719 |
|
Diluted |
|
| 63,959 |
|
|
| 69,148 |
|
|
| 71,309 |
|
|
| 71,431 |
|
|
| 71,719 |
|
Dividends declared per common share |
| $ | — |
|
| $ | — |
|
| $ | — |
|
| $ | 0.0750 |
|
| $ | 0.2975 |
|
|
|
|
|
|
|
|
|
|
|
|
|
|
|
| ||||||
Statement of cash flows data: |
|
|
|
|
|
|
|
|
|
|
|
|
|
|
| |||||
Net cash provided by (used in) |
| $ | 40.3 |
|
| $ | 175.1 |
|
| $ | 90.0 |
|
| $ | (37.1 | ) |
| $ | 67.8 |
|
Net cash used in investing activities |
| $ | (21.0 | ) |
| $ | (47.9 | ) |
| $ | (131.9 | ) |
| $ | (37.3 | ) |
| $ | (16.7 | ) |
Net cash (used in) provided by |
| $ | (54.2 | ) |
| $ | (119.3 | ) |
| $ | (22.2 | ) |
| $ | 360.1 |
|
| $ | (62.0 | ) |
28
|
| As of December 31, |
| |||||||||||||||||
|
| 2023 |
|
| 2022 |
|
| 2021 |
|
| 2020 |
|
| 2019 |
| |||||
|
|
|
|
| (dollars in millions) |
| ||||||||||||||
Balance sheet data: |
|
|
|
|
|
|
|
|
|
|
|
|
|
|
| |||||
Cash and cash equivalents |
| $ | 204.2 |
|
| $ | 239.1 |
|
| $ | 231.2 |
|
| $ | 295.3 |
|
| $ | 9.6 |
|
Total assets(7) |
| $ | 1,053.9 |
|
| $ | 1,098.4 |
|
| $ | 1,062.4 |
|
| $ | 1,054.4 |
|
| $ | 1,471.7 |
|
Total debt(8) |
| $ | 413.3 |
|
| $ | 415.3 |
|
| $ | 519.7 |
|
| $ | 525.2 |
|
| $ | 535.4 |
|
Total liabilities |
| $ | 649.3 |
|
| $ | 659.1 |
|
| $ | 749.5 |
|
| $ | 659.9 |
|
| $ | 831.5 |
|
29
30
|
| As of December 31, |
| |||||||||||||||||
|
| 2020 (As Restated) |
|
| 2019 |
|
| 2018 |
|
| 2017 |
|
| 2016 |
| |||||
|
| (dollars in millions) |
| |||||||||||||||||
Balance sheet data: |
|
|
|
|
|
|
|
|
|
|
|
|
|
|
|
|
|
|
|
|
Cash and cash equivalents |
| $ | 295.3 |
|
| $ | 9.6 |
|
| $ | 20.5 |
|
| $ | 10.9 |
|
| $ | 14.9 |
|
Total assets(7) |
| $ | 1,054.4 |
|
| $ | 1,471.7 |
|
| $ | 1,580.0 |
|
| $ | 1,637.9 |
|
| $ | 1,572.5 |
|
Total debt(8) |
| $ | 525.2 |
|
| $ | 535.4 |
|
| $ | 569.9 |
|
| $ | 554.2 |
|
| $ | 702.1 |
|
Total liabilities |
| $ | 659.9 |
|
| $ | 831.5 |
|
| $ | 871.7 |
|
| $ | 876.7 |
|
| $ | 1,044.8 |
|
|
|
|
|
|
|
|
|
|
|
|
|
|
|
|
|
Quarterly Results of Operations (Unaudited)
The following table sets forth our unaudited condensed quarterly consolidated statements of (loss) income and comprehensive (loss) income data for each of the eight quarterly periods ended December 31, 2020.2023 and 2022. The information for each of these quarters has been prepared on the same basis as the audited annual consolidated financial statements included elsewhere in this Annual Report on Form 10-K/A10-K and, in our opinion, includes all adjustments, consisting only of normal recurring adjustments, necessary for the fair statement of the results of operations for these periods. This information should be read in conjunction with our consolidated financial statements and related notes included elsewhere in this Annual Report on Form 10-K/A.10-K. These quarterly results are not necessarily indicative of our operating results for a full year or any future period. The following table has been updated to reflect the impact of the restatement, as further described in Note 1, Description of Business and Summary of Significant Accounting Policies, and Note 20, Unaudited Quarterly Financial Data, in the notes to our audited consolidated financial statements included elsewhere in this Amended Annual Report on Form 10-K/A, on the unaudited interim financial statements as of and for the quarters ended June 30, 2020, September 30, 2020 and December 31, 2020. As a result of the restatement, the tables also reflect the revision to correct for a previously identified Q1 2020 error in goodwill impairments that management had previously concluded was not material to the previously issued consolidated financial statements and had therefore been initially corrected for as an out of period adjustment in Q4 2020.
|
| Quarter Ended | |||||||||||||||||||||||||||||||
|
| Dec. 31, |
|
| Sept. 30, |
|
| Jun. 30, |
|
| Mar. 31, |
|
| Dec. 31, |
|
| Sept. 30, |
|
| Jun. 30, |
|
| Mar. 31, |
|
| ||||||||
|
| (unaudited) | |||||||||||||||||||||||||||||||
|
| (dollars in millions, share data in thousands except earnings per share) | |||||||||||||||||||||||||||||||
Statement of (loss) income and |
|
|
|
|
|
|
|
|
|
|
|
|
|
|
|
|
|
|
|
|
|
|
|
|
| ||||||||
Revenues |
| $ | 101.5 |
|
| $ | 72.5 |
|
| $ | 86.5 |
|
| $ | 122.3 |
|
| $ | 93.6 |
|
| $ | 62.4 |
|
| $ | 71.4 |
|
| $ | 98.5 |
|
|
Other income, net |
|
| — |
|
|
| 2.8 |
|
|
| — |
|
|
| — |
|
|
| — |
|
|
| 151.0 |
|
|
| 8.1 |
|
|
| 23.7 |
|
|
Cost of revenues |
|
| 35.7 |
|
|
| 25.9 |
|
|
| 32.8 |
|
|
| 43.2 |
|
|
| 33.2 |
|
|
| 22.7 |
|
|
| 26.4 |
|
|
| 34.2 |
|
|
Selling, general and administrative |
|
| 36.1 |
|
|
| 41.6 |
|
|
| 41.8 |
|
|
| 48.8 |
|
|
| 17.4 |
|
|
| 48.7 |
|
|
| 32.3 |
|
|
| 46.6 |
|
|
Depreciation and amortization |
|
| 9.8 |
|
|
| 8.8 |
|
|
| 12.9 |
|
|
| 13.5 |
|
|
| 16.5 |
|
|
| 14.7 |
|
|
| 14.0 |
|
|
| 14.3 |
|
|
Goodwill impairment charge |
|
| — |
|
|
| — |
|
|
| — |
|
|
| — |
|
|
| — |
|
|
| — |
|
|
| — |
|
|
| 6.3 |
|
|
Intangible asset impairment charge |
|
| — |
|
|
| — |
|
|
| — |
|
|
| — |
|
|
| — |
|
|
| — |
|
|
| — |
|
|
| 1.6 |
|
|
Operating income (loss) |
|
| 19.9 |
|
|
| (1.0 | ) |
|
| (1.0 | ) |
|
| 16.8 |
|
|
| 26.5 |
|
|
| 127.3 |
|
|
| 6.8 |
|
|
| 19.2 |
|
|
Interest expense |
|
| 11.8 |
|
|
| 12.1 |
|
|
| 11.4 |
|
|
| 8.0 |
|
|
| 9.0 |
|
|
| 6.8 |
|
|
| 4.8 |
|
|
| 3.9 |
|
|
Interest income |
|
| 3.2 |
|
|
| 1.6 |
|
|
| 2.3 |
|
|
| 1.1 |
|
|
| 1.7 |
|
|
| 0.8 |
|
|
| 0.2 |
|
|
| — |
|
|
Loss on extinguishment of debt |
|
|
|
|
| — |
|
|
| 2.3 |
|
|
| — |
|
|
| — |
|
|
| — |
|
|
| — |
|
|
| — |
|
| |
Other (income) expense |
|
| (0.1 | ) |
|
| 0.1 |
|
|
| 0.1 |
|
|
| (0.1 | ) |
|
| (0.1 | ) |
|
| 0.1 |
|
|
| — |
|
|
| — |
|
|
Loss on disposal of fixed assets |
|
| — |
|
|
| — |
|
|
| — |
|
|
| 0.2 |
|
|
| — |
|
|
| — |
|
|
| — |
|
|
| — |
|
|
Income (loss) before income |
|
| 11.4 |
|
|
| (11.6 | ) |
|
| (12.5 | ) |
|
| 9.8 |
|
|
| 19.3 |
|
|
| 121.2 |
|
|
| 2.2 |
|
|
| 15.3 |
|
|
Provision for (benefit from) income |
|
| 29.3 |
|
|
| (22.3 | ) |
|
| (4.4 | ) |
|
| 2.7 |
|
|
| (3.1 | ) |
|
| 28.2 |
|
|
| 2.9 |
|
|
| (0.8 | ) |
|
Net (loss) income and |
|
| (17.9 | ) |
|
| 10.7 |
|
|
| (8.1 | ) |
|
| 7.1 |
|
|
| 22.4 |
|
|
| 93.0 |
|
|
| (0.7 | ) |
|
| 16.1 |
|
|
Accretion to redemption value |
|
| (10.8 | ) |
|
| (10.7 | ) |
|
| (10.4 | ) |
|
| (10.1 | ) |
|
| (10.1 | ) |
|
| (9.9 | ) |
|
| (9.6 | ) |
|
| (9.2 | ) |
|
Participation rights on |
|
| — |
|
|
| — |
|
|
| — |
|
|
| — |
|
|
| (8.2 | ) |
|
| (54.7 | ) |
|
| — |
|
|
| (4.4 | ) |
|
Net (loss) income and |
| $ | (28.7 | ) |
| $ | 0.0 |
|
| $ | (18.5 | ) |
| $ | (3.0 | ) |
| $ | 4.1 |
|
| $ | 28.4 |
|
| $ | (10.3 | ) |
| $ | 2.5 |
|
|
|
|
|
|
|
|
|
|
|
|
|
|
|
|
|
|
|
|
|
|
|
|
|
|
|
| ||||||||
Basic (loss) earnings per share |
| $ | (0.45 | ) |
| $ | 0.00 |
|
| $ | (0.29 | ) |
| $ | (0.04 | ) |
| $ | 0.06 |
|
| $ | 0.42 |
|
| $ | (0.15 | ) |
| $ | 0.04 |
|
|
Diluted (loss) earnings per share |
| $ | (0.45 | ) |
| $ | 0.00 |
|
| $ | (0.29 | ) |
| $ | (0.04 | ) |
| $ | 0.06 |
|
| $ | 0.41 |
|
| $ | (0.15 | ) |
| $ | 0.04 |
|
|
Basic weighted average common |
|
| 63,601 |
|
|
| 63,586 |
|
|
| 62,868 |
|
|
| 67,280 |
|
|
| 67,599 |
|
|
| 68,433 |
|
|
| 69,816 |
|
|
| 70,171 |
|
|
Diluted weighted average common |
|
| 63,601 |
|
|
| 63,586 |
|
|
| 62,868 |
|
|
| 67,280 |
|
|
| 67,943 |
|
|
| 68,643 |
|
|
| 69,816 |
|
|
| 70,280 |
|
|
|
|
|
|
|
|
|
|
|
|
|
|
|
|
|
|
|
|
|
|
|
|
|
|
|
| ||||||||
Dividend declared per common share |
| $ | — |
|
| $ | — |
|
| $ | — |
|
| $ | — |
|
| $ | — |
|
| $ | — |
|
| $ | — |
|
| $ | — |
|
|
|
| Quarter Ended |
| |||||||||||||||||||||||||||||
|
| Dec. 31, 2020 (As Restated) |
|
| Sept. 30, 2020 |
|
| Jun. 30, 2020 |
|
| Mar. 31, 2020 (As Revised) |
|
| Dec. 31, 2019 |
|
| Sept. 30, 2019 |
|
| Jun. 30, 2019 |
|
| Mar. 31, 2019 |
| ||||||||
|
| (unaudited) |
| |||||||||||||||||||||||||||||
|
| (dollars in millions, share data in thousands except earnings per share) |
|
|
| |||||||||||||||||||||||||||
Statement of (loss) income and comprehensive (loss) income data: |
|
|
|
|
|
|
|
|
|
|
|
|
|
|
|
|
|
|
|
|
|
|
|
|
|
|
|
|
|
|
|
|
Revenues |
| $ | 12.2 |
|
| $ | 8.5 |
|
| $ | 7.0 |
|
| $ | 99.7 |
|
| $ | 44.9 |
|
| $ | 75.6 |
|
| $ | 103.0 |
|
| $ | 137.4 |
|
Other income |
|
| 42.7 |
|
|
| 16.1 |
|
|
| 48.2 |
|
|
| — |
|
|
| — |
|
|
| 6.1 |
|
|
| — |
|
|
| — |
|
Cost of revenues |
|
| 10.5 |
|
|
| 4.3 |
|
|
| (0.8 | ) |
|
| 43.6 |
|
|
| 17.4 |
|
|
| 24.6 |
|
|
| 32.3 |
|
|
| 45.9 |
|
Selling, general and administrative expenses |
|
| 29.8 |
|
|
| 25.6 |
|
|
| 25.1 |
|
|
| 38.1 |
|
|
| 31.4 |
|
|
| 33.7 |
|
|
| 33.1 |
|
|
| 35.1 |
|
Depreciation and amortization expense |
|
| 11.4 |
|
|
| 12.2 |
|
|
| 12.2 |
|
|
| 12.8 |
|
|
| 12.8 |
|
|
| 12.9 |
|
|
| 13.2 |
|
|
| 13.2 |
|
Goodwill impairments |
|
| 15.2 |
|
|
| — |
|
|
| — |
|
|
| 588.2 |
|
|
| 59.8 |
|
|
| 9.3 |
|
|
|
|
|
|
|
|
|
Intangible asset impairments |
|
| 17.4 |
|
|
| — |
|
|
| — |
|
|
| 59.4 |
|
|
| — |
|
|
| 17.0 |
|
|
| — |
|
|
| — |
|
Operating (loss) income |
|
| (29.4 | ) |
|
| (17.5 | ) |
|
| 18.7 |
|
|
| (642.4 | ) |
|
| (76.5 | ) |
|
| (15.8 | ) |
|
| 24.4 |
|
|
| 43.2 |
|
Interest expense |
|
| 4.1 |
|
|
| 4.2 |
|
|
| 5.6 |
|
|
| 6.7 |
|
|
| 7.0 |
|
|
| 7.5 |
|
|
| 7.8 |
|
|
| 8.0 |
|
(Loss) income before income taxes |
|
| (33.5 | ) |
|
| (21.7 | ) |
|
| 13.1 |
|
|
| (649.1 | ) |
|
| (83.5 | ) |
|
| (23.3 | ) |
|
| 16.6 |
|
|
| 35.2 |
|
Provision for (benefit from) income taxes |
|
| 0.4 |
|
|
| (6.4 | ) |
|
| 3.2 |
|
|
| (54.8 | ) |
|
| (15.3 | ) |
|
| (3.6 | ) |
|
| 5.2 |
|
|
| 8.7 |
|
Net (loss) income and comprehensive (loss) income |
|
| (33.9 | ) |
|
| (15.3 | ) |
|
| 9.9 |
|
|
| (594.3 | ) |
|
| (68.2 | ) |
|
| (19.7 | ) |
|
| 11.4 |
|
|
| 26.5 |
|
Accretion to redemption value of redeemable convertible preferred stock |
|
| (8.5 | ) |
|
| (7.0 | ) |
|
| (0.1 | ) |
|
|
|
|
|
|
|
|
|
|
|
|
|
|
|
|
|
|
|
|
Participation rights on if-converted basis |
|
| — |
|
|
| — |
|
|
| (0.2 | ) |
|
| — |
|
|
| — |
|
|
| — |
|
|
| — |
|
|
| — |
|
Net (loss) income and comprehensive (loss) income attributable to Emerald Holding, Inc. common stockholders |
| $ | (42.4 | ) |
| $ | (22.3 | ) |
| $ | 9.6 |
|
| $ | (594.3 | ) |
| $ | (68.2 | ) |
| $ | (19.7 | ) |
| $ | 11.4 |
|
| $ | 26.5 |
|
|
|
|
|
|
|
|
|
|
|
|
|
|
|
|
|
|
|
|
|
|
|
|
|
|
|
|
|
|
|
|
|
|
Basic (loss) earnings per share |
| $ | (0.59 | ) |
| $ | (0.31 | ) |
| $ | 0.13 |
|
| $ | (8.33 | ) |
| $ | (0.96 | ) |
| $ | (0.27 | ) |
| $ | 0.16 |
|
| $ | 0.37 |
|
Diluted (loss) earnings per share |
| $ | (0.59 | ) |
| $ | (0.31 | ) |
| $ | 0.13 |
|
| $ | (8.33 | ) |
| $ | (0.96 | ) |
| $ | (0.27 | ) |
| $ | 0.16 |
|
| $ | 0.36 |
|
Basic weighted average common shares outstanding |
|
| 71,413 |
|
|
| 71,484 |
|
|
| 71,444 |
|
|
| 71,381 |
|
|
| 71,349 |
|
|
| 71,796 |
|
|
| 71,905 |
|
|
| 71,825 |
|
Diluted weighted average common shares outstanding |
|
| 71,413 |
|
|
| 71,484 |
|
|
| 71,470 |
|
|
| 71,381 |
|
|
| 71,349 |
|
|
| 71,796 |
|
|
| 72,965 |
|
|
| 73,029 |
|
|
|
|
|
|
|
|
|
|
|
|
|
|
|
|
|
|
|
|
|
|
|
|
|
|
|
|
|
|
|
|
|
|
Dividend declared per common share |
| $ | — |
|
| $ | — |
|
| $ | — |
|
| $ | 0.0750 |
|
| $ | 0.0750 |
|
| $ | 0.0750 |
|
| $ | 0.0750 |
|
| $ | 0.0725 |
|
31
Item 7. Management’s Discussion and Analysis of Financial Condition and Results of Operations.
MANAGEMENT’S DISCUSSION AND ANALYSIS OF
FINANCIAL CONDITION AND RESULTS OF OPERATIONS
This discussion and analysis of the financial condition and results of our operations should be read in conjunction with “Item 6. Selected Financial and Operating Data” and our consolidated financial statements and related notes of Emerald Holding, Inc. included in Item 15 of this Annual Report on Form 10-K/A.10-K. You should review the “Item 1A. Risk Factors” section of this filing for a discussion of important factors that could cause actual results to differ materially from the results described in or implied by any forward-looking statements contained in the following discussion and analysis.
Overview and Background
Emerald is a leading operator of business-to-business trade shows in the United States. Leveraging our shows as key market-driven platforms, we combine our events with effective industry insights, digital tools, and data-focused solutions to create uniquely rich experiences. Emerald strives to build its customers’ businesses by creating opportunities that deliver tangible results.
The following information has been adjusted to reflect the restatement of our consolidated financial statements as described in the “Explanatory Note” at the beginning of this Amended Annual Report and in Note 1, Description of Business and Summary of Significant Accounting Policies, in the Notes to the Consolidated Financial Statements of this Amended Annual Report.
All of our trade show franchises typically hold market-leading positions within their respective industry verticals, with significant brand value established over a long period of time. Each of our shows is heldscheduled to stage at least annually, with certain franchises offering multiple editions per year. As our shows are frequently the largest and most well attended in their respective industry, verticals, we are able to attract high-quality attendees, including those who have the authority to make purchasing decisions on the spot or subsequent to the show. The participation of these attendees makes our trade shows “must-attend” events for our exhibitors, further reinforcing the leading positions of our trade shows within their respective industry verticals. Our attendees use our shows to fulfill procurement needs, source new suppliers, reconnect with existing suppliers, identify trends, learn about new products and network with industry peers, which we believe are factors that make our shows difficult to replace with non-face-to-face events. Our portfolio of trade shows is well-balanced and diversified across both industry sectors and customers.
In addition to organizing our trade shows, conferences and other events, we also operate content and content-marketing websites, and related digital products, and produce publications, each of which is aligned with a specific sector for which we organize an event. We also offer B2Bbusiness-to-business commerce and digital merchandising solutions, serving the needs of manufacturers and retailers, through our recently acquired Elastic Suite and Flex platforms.platform. In addition to their respective revenues, these products complement our live events and provide us year-round channels of customer acquisition and development.
Organic Growth Drivers
We are primarily focused on generating organic growth by understanding and leveraging the drivers for increased exhibitor and attendee participation at trade shows and providing year-round services that provide incremental value to those customers. Creating new opportunities for exhibitors to influence their market, engage with significant buyers, generate incremental sales and expand their brand’s awareness in their industry builds further demand for exhibit space and strengthens the value proposition of a trade show, which generally allowingallows us to modestly increase booth space pricing annually across our portfolio. At the same time, our trade shows provide attendees with the opportunity to enhance their industry connectivity, develop relationships with targeted suppliers and distributors, discover new products, learn about new industry developments, celebrate their industry’s achievements and, in certain cases, obtain continuing professional education credits, which we believe increases their propensity to return and, consequently, drives high recurring participation among our exhibitors. By investing in and promoting these tangible and return-on-investment linked outcomes, we believe we will be able to continue to
enhance the value proposition for our exhibitors and attendees alike, thereby driving strong demand and premium pricing for exhibit space, sponsorship opportunities and attendee registration.
32
Acquisitions
We are also focused on growing our national footprint through the acquisition of high-quality events that are leaders in their specific industry verticals. Since the Onex Acquisition in June 2013, we have completed 2026 strategic acquisitions, with purchase prices, excluding the $335.0 million acquisition of GLM,George Little Management in 2014, ranging from approximately $5.0 million to approximately $46.0$120.0 million, excluding the $24.0 million of contingent payment which was not earned by the acquired entity, and annual revenues ranging from approximately $1.3 million to approximately $15.1$25.6 million. Historically, we have completed acquisitions at EBITDAearnings before interest, taxes, depreciation, and amortization (“EBITDA”) purchase multiples that are typically in the mid-to-high single digits. Our acquisitions have historically been structured as asset deals that have resulted in the generation of long-lived tax assets, which in turn have reduced our purchase multiples when incorporating the value of the created tax assets. In the future, we intend to look for acquisitions with similarly attractive valuation multiples.
Transactions Affecting Recent Periods
Acquisitions
We completed the following acquisitions during the periods presented in this Management’s Discussion and Analysis of Financial Condition and Results of Operations:
We completed the following acquisition in January 2024:
Refinancing Transactions
On February 2, 2023, our wholly-owned subsidiary, Emerald X, Inc. (“Emerald X”) entered into a Fifth Amendment (the “RCF Amendment”) to its Amended and Restated Credit Agreement (such credit agreement, the “Amended and Restated Credit Agreement”). The RCF Amendment increased the aggregate amount of all revolving commitments under the Amended and Restated Credit Agreement from $100.4 million to $110.0 million. The increased revolving commitments have completedthe same terms as the existing revolving commitments. The RCF Amendment did not change any other material terms of the Amended and Restated Credit Agreement.
On June 12, 2023, (the “Term Loan Amendment Effective Date”), Emerald X entered into a Sixth Amendment (the “Term Loan Amendment”) to its existing Amended and Restated Credit Agreement. The Term Loan Amendment, which was entered into with a syndicate of lenders and Bank of America, N.A., as administrative agent, extended the
33
maturity of the term loans outstanding under the Amended and Restated Credit Agreement (such extended term loan facility, the “Extended Term Loan Facility”) from May 22, 2024 to May 22, 2026. The aggregate outstanding principal amount of the Extended Term Loan Facility was approximately $415.3 million as of the Term Loan Amendment Effective Date. The Term Loan Amendment also replaced the interest rate applicable to the term loans with a rate equal to, at the option of Emerald X, (i) the Term Secured Overnight Financing Rate (“Term SOFR”) plus 5.00% per annum plus a credit spread adjustment of 0.10% per annum or (ii) an alternate base rate (“ABR”) plus 4.00% per annum. Prior to the Term Loan Amendment, the interest rate applicable to the term loans was a rate equal to, at the option of Emerald X, (i) LIBOR plus 2.75% or 2.50% per annum, depending on Emerald X’s first lien net leverage ratio or (ii) ABR plus 1.75% or 1.50% per annum, depending on Emerald X’s first lien net leverage ratio. In addition, the Term Loan Amendment reset scheduled quarterly payments, each equal to 0.25% of the original principal amount of the Extended Term Loan Facility. Further, the Term Loan Amendment modified the prepayment provisions so that, upon the occurrence of a repricing transaction, subject to certain specified exceptions, Emerald X will have to pay a prepayment fee of 2%, in the event of a repricing transaction occurring within the first twelve months after the Term Loan Amendment Effective Date, or 1%, in the event of a repricing transaction occurring on a date that is between twelve months after the Term Loan Amendment Effective Date and eighteen months after the Term Loan Amendment Effective Date. No prepayment premium is payable for prepayments made after the eighteen month anniversary of the Term Loan Amendment Effective Date.
For more information regarding these refinancing transactions, see Note 7, Debt, to the audited financial statements included elsewhere in this Annual Report on Form 10-K.
Redeemable Preferred Stock
Dividends
Each share of redeemable convertible preferred stock will accumulate dividends at a rate per annum equal to 7% of the accreted liquidation preference, compounding quarterly by adding to the accreted liquidation preference until July 1, 2023, and thereafter, at the Company’s option, paid either in cash or by adding to the accreted liquidation preference. During the year ended December 31, 2023, the Company recorded accretion of $16.7 million with respect to the redeemable convertible preferred stock, bringing the aggregate liquidation preference to $492.6 million as of December 31, 2023. During the year ended December 31, 2022, the Company recorded accretion of $31.8 million with respect to the redeemable convertible preferred stock, bringing the aggregate liquidation preference to $475.9 million as of December 31, 2022. During the year ended December 31, 2021, the redeemable convertible preferred stock accumulated $29.8 million worth of dividends, bringing the aggregate accreted liquidation preference to $444.1 million as of December 31, 2021. Holders of redeemable convertible preferred stock are described as follows:also entitled to participate in and receive any dividends declared or paid on the Company’s common stock on an as-converted basis, and no dividends may be paid to holders of common stock unless the aggregate accreted liquidation preference on the redeemable convertible preferred stock has been paid or holders of a majority of the outstanding redeemable convertible preferred stock have consented to such dividend.
The Company’s Board of Directors approved the payment in cash of a dividend on the Company’s redeemable convertible preferred stock (the “Preferred Stock” and such dividend, the “Preferred Cash Dividend”) for the periods ending September 30, 2023, and December 31, 2023, respectively, and the Company paid the Preferred Stock Cash Dividend for a total of $17.2 million, or $0.12 per share, to preferred stock holders including Onex-related entities.
34
|
|
|
|
|
|
|
|
|
|
|
|
|
|
|
|
|
|
|
|
|
|
|
|
|
|
|
|
|
|
|
|
|
|
|
|
|
|
|
|
|
Trends and Other Factors Affecting Our Business
There are a number of existing and developing factors and trends which impact the performance of our business, and the comparability of our results from year to year and from quarter to quarter, including:
|
|
|
|
|
|
|
|
|
|
How We Assess the Performance of Our Business
In assessing the performance of our business, we consider a variety of performance and financial measures. The key indicators of the financial condition and operating performance of our business are revenues, Organic revenue,
35
cost of revenues, selling, general and administrative expenses, interest expense, depreciation and amortization, income taxes, Adjusted EBITDA Adjusted Net Income and Free Cash Flow.
Basis of Presentation
As described in Note 1, Description of Business and Summary of Significant Accounting Policies and Note 18, Segment Information,, in the notes to our audited consolidated financial statements included elsewhere in this Annual Report on Form 10-K/A, we made certain changes in 2019 that changed the determination of10-K, effective October 31, 2023, our business is organized into a single reportable segments. These changes were made to besegment, consistent with the information provided to our Chief Executive Officer, who is considered the chief operating decision-maker ("CODM"(“CODM”). The CODM evaluates performance based on the results of six executive brand portfolios,our Connections, Content and Commerce business lines (collectively, the “three C’s”), which represent our sixthree operating segments. Based on an evaluationThe Connections segment is primarily comprised of economic similaritiesEmerald’s trade shows and the natureother live events. Neither of services and types of customers, four of these operating segments have been aggregated into two reportable segments, the Commerce reportable segment and the Design and Technology reportable segment. The remaining two operating segments do not meetmeets the quantitative thresholds to be considered a reportable operating segmentssegment and are included in the “All Other” category. In addition, we have a Corporate-Level Activities“Corporate-Level Activities” category consisting of finance, legal, information technology and administrative functions. Prior year disclosures below have been updated to reflect the new reportable segment structure described in Note 18, Segment Information.
The following discussion provides additional detailed disclosure for the twoone reportable segments,segment, the All Other“All Other” category and the Corporate-Level Activity“Corporate-Level Activity” category:
Commerce:
Design and Technology: This segment includes events and services that support a wide variety of industries connecting businesses and professionals with products, operational strategies, and integrationprovide exhibitors opportunities to drive new businessinfluence their market, engage with significant buyers, generate incremental sales and streamline processes and creative solutions.expand their brand’s awareness in their industry.
Revenues
Revenues
We generate revenues primarily from selling trade show exhibit space to exhibitors on a per square foot basis. Other trade show revenue streams include sponsorship, fees forconferences, sponsorships, ancillary exhibition servicesfees and attendee registration fees. Exhibitors contract for their booth space and sponsorships up to a year in advance of the trade show. Fees are typically invoiced and collected in full prior to the trade show or event. Additionally, we generate revenue through conferences, digital media and print publications that complement our trade shows. We also engage third-party sales agents to support our marketing efforts. More than 95% of our salesOther marketing service revenue contracts are made by our employees, with less than 5% made by third-party sales agents.invoiced and recognized in the period the advertising services are delivered. Typically, the fees we charge are collected after the publications are issued.
We define “organic“Organic revenue growth” and “organic“Organic revenue decline” as the growth or decline, respectively, in our revenue from one period to the next, adjusted for the revenue impact of: (i) acquisitions and dispositions, (ii) discontinued events and (iii) material show scheduling adjustments and (iv) event cancellations for which the Company has received, or expects to receive, claim proceeds from its event cancellation insurance policy.adjustments. We disclose changes in Organic revenue because we believe it assists investors and analysts in comparing Emerald’s operating performance across reporting periods on a consistent basis by excluding items that we do not believe reflect a true comparison of the trends of the existing event calendar given changes in timing or strategy. Management and Emerald’s boardour Board of directorsDirectors evaluate changes in Organic revenuesrevenue to understand underlying revenue trends of its events. Organic revenue is not defined under GAAP, and has limitations as an analytical tool, and you should not consider such measure either in isolation or as a substitute for analyzing our results as reported under GAAP. Some of these limitations include that Organic revenue reflects certain adjustments that we consider not to be indicative of
our ongoing operating performance. Because not all companies use identical calculations, our presentation of Organic revenue may not be comparable to other similarly titled measures used by other companies.
36
Organic Revenue
Organic revenue is a supplemental non-GAAP financial measure of performance and is not based on any standardized methodology prescribed by GAAP. Organic revenue should not be considered in isolation or as an alternative to revenues or other measures determined in accordance with GAAP. Also, Organic revenuesrevenue is not necessarily comparable to similarly titled measures used by other companies.
The most directly comparable GAAP measure to Organic revenue is revenues. For a reconciliation of Organic revenues to revenues as reported, see footnoteFootnote 6 to the table under the heading “Results of Operations - Operations—Comparison of the Year Ended December 31, 20202023 to the Year Ended December 31, 2019”2022”.
Other Income
We maintain event cancellation insurance to protect against losses due the unavoidable cancellation, postponement, relocation and enforced reduced attendance at events due to certain covered causes. Specifically,causes, including losses caused by natural disasters such as hurricanes. While these causes includeincluded event cancellation caused by the outbreak of communicable diseases, including COVID-19, as well asfor the years ended December 31, 2021 and 2020, Emerald’s renewed event cancellation insurance policies beginning with policy year 2022 do not cover losses due to event cancellations caused by natural disasters such as hurricanes.the outbreak of communicable diseases, including COVID-19. Our Other Income is primarily comprised of received or confirmed event cancellation insurance claim and insurance litigation settlement proceeds.
Cost of Revenues
• Decorating Expenses. We work with general service contractors to both set up communal areas of our trade shows and provide services to our exhibitors, who primarily contract directly with the general service contractors. We will usually select a single general service contractor for an entire show, although it is possible to bid out packages of work within a single show on a piecemeal basis to different task-specific specialists. Decorating expenses represented 19%, 17%, and 16% of our total cost of revenues for the years ended December 31, 2023, 2022 and 2021, respectively, and 7%, 6%, and 6% of our total revenues for each of the years ended December 31, 2023, 2022 and 2021, respectively. • Sponsorship Costs. We often enter into long-term sponsorship agreements with industry trade associations whereby the industry trade association endorses and markets the show to its members in exchange for a percentage of the show’s revenue. Sponsorship costs represented 13%, 13%, and 9% of our total cost of revenues for the years ended December 31, 2023, 2022 and 2021, respectively, and 5%, 5%, and 3% of our total revenues for the year ended December 31, 2023, 2022 and 2021, respectively. • Venue Costs. Venue costs represent rental costs for the venues, usually convention centers or hotels, where we host our trade shows. Given that convention centers are typically owned by local governments who have a vested interest in stimulating business activity in and attracting tourism to their cities, venue costs typically represent a small percentage of our total cost of revenues. Venue costs represented 12%, 11%, and 13% of our total cost of revenues for the years ended December 31, 2023, 2022 and 2021, respectively, and 4%, 4%, and 5% of our total revenues for each of the years ended December 31, 2023, 2022 and 2021, respectively. • Costs of Other Marketing Services. Costs of other marketing services represent paper, printing, postage, contributor and other costs related to digital media and print publications. Costs of other marketing services represented 5%, 6%, and 10% of our total cost of revenues for each of the years ended December 31, 2023, 2022 and 2021, respectively, and 2%, 2%, and 4% of our total revenues for each of the years ended December 31, 2023, 2022 and 2021, respectively. • Other Event-Related Expenses. Other event-related costs include temporary labor for services such as security, shuttle buses, speaker fees, food and beverage expenses and event cancellation insurance. Other event-related expenses represented 35%, 27%, and 51% of our total cost of revenues for the years ended December 31, 2023, 2022 and 2021, respectively, and 13%, 10%, and 20% of our total revenues for the year ended December 31, 2023, 2022 and 2021, respectively. 37 |
|
|
|
|
|
|
|
|
|
Selling, General and Administrative Expenses
| • Labor Costs. Labor costs represent the cost of employees who are involved in sales, marketing, planning and administrative activities. The actual on-site set-up of the events is contracted out to third-party vendors and is included in cost of revenues. Labor costs represented 64%, 72%, and 67% of our total selling, general and administrative expenses for the years ended December 31, 2023, 2022 and 2021, respectively, and 28%, 32%, and 66% of our total revenues for each of the years ended December 31, 2023, 2022 and 2021, respectively. • Miscellaneous Expenses. Miscellaneous expenses are comprised of a variety of other expenses, including advertising and marketing costs, promotion costs, credit card fees, travel expenses, printing costs, office supplies and office rental expense. Direct trade show costs are recorded in cost of revenues. All other costs are recorded in selling, general and administrative expenses. Miscellaneous expenses represented 36%, 28%, and 33% of our total selling, general and administrative expenses, for the years ended December 31, 2023, 2022 and 2021, respectively, and 16%, 13%, and 32% of our total revenues for the years ended December 31, 2023, 2022 and 2021, respectively.
|
|
|
|
Interest Expense
Interest expense principally represents interest payments and refinancingcertain other fees paid to lenders under our lenders. On May 22, 2017, we refinanced our senior secured credit facilities with the Amended and Restated Senior Secured Credit Facilities (the “2017 Refinancing”)(as amended, for the portion of the year ended December 31, 2023 after the Term Loan Amendment Effective Date, by the Term Loan Amendment). We further amended the Amended and Restated Senior Secured Credit Facilities in November 2017 to reduce the applicable interest rates.Interest expense for the years ended December 31, 2020, 20192022 and 20182021, and for the portion of 2023 prior to the Term Loan Amendment Effective Date, principally represented interest paid in respect of our Amended and Restated Senior Secured Credit Facilities.Facilities (as amended and in effect during the applicable period).
Depreciation and Amortization
We have historically grown our business through acquisitions and, in doing so, have acquired significant intangible assets, the value of some of which is amortized over time. These acquired intangible assets, unless determined to be indefinite-lived, are amortized over extended periods of tenthree to thirty years from the date of each acquisition for reporting under accounting principles generally accepted in the United States of America (“GAAP”) purposes, or fifteen years for tax purposes. This amortization expense reduces our taxable income. During 2018, we changed certain of our trade name intangibles assets from indefinite-lived to definite-lived assets, with estimated useful lives of between 10 and 30 years. As a result of the change in estimated useful lives of certain of our trade name intangible assets, we recorded $5.2 million, $5.9 million and $1.0 million in additional amortization expense for the years ended December 31, 2020, 2019 and 2018, respectively. Depreciation expense relates to property and equipment and represented approximatelyless than 1% of our total revenues for the year ended December 31, 20202023, and less thanapproximately 1% of our total revenues for each of the years ended December 31, 20192022 and 2018.2021.
Income Taxes
Income tax expense consists of U.S. federal, state, local and localforeign taxes based on income in the jurisdictions in which we operate.
We used substantially all of our federal NOL carryforwards during 2017, and therefore our income tax payment obligations increased during 2018, notwithstanding the overall reduction in federal corporate tax rates as a result of the Tax Cuts and Jobs Act (“Tax Act”), and 2019. We also record deferred tax charges or benefits primarily associated with our utilization or generation of net operating loss carryforwards and book-to-tax differences related to amortization of goodwill, amortization of intangiblesintangible assets, depreciation, stock-based compensation charges, 163(j) interest expense limitation and deferred financing costs.
The Tax Act significantly revised the U.S. corporate income tax law by, among other things, decreasing the federal corporate income tax rate from 35% to 21% effective January 1, 2018.
Cash Flow Model
We typically have favorable cash flow characteristics, as described below (see “—Liquidity“Liquidity and Capital Resources—Cash Flows”), as a result of our high profit margins, low capital expenditures and consistentlyconsistent negative working capital. capital, excluding cash on hand. Our working capital, excluding cash on hand, is negative asdue to the fact that our current assets are generally lower than our current liabilities. Current assets primarily include accounts receivable and prepaid expenses, while current liabilities primarily include accounts payableborrowings under our Amended and Restated Revolving Credit Facility (“Revolving Credit Facility”) and deferred revenues. Cash received prior to an event is recorded as deferred revenue on our balance sheet and recognized as revenue upon completion of each trade show. The implication of having negative working capital, excluding cash on hand, is that changes in working capital represent a source of cash as our business grows. As a result of COVID-19, the accounts receivable and deferred revenue balances related to cancelled events have been reclassified to Cancelled event
38
liabilities in the condensed consolidated balance sheets, as the net amount represents balances which we expect will be refunded to our customers. While we believe that our business interruption insurance proceeds will largely mitigate this liability, cash outflows for customer refunds will likely exceed insurance claim settlement cash inflows for the foreseeable future.
The primary driver for our negative working capital, excluding cash on hand, is the sales cycle for a trade show, which typically begins during the twelve months prior to a show. In the interim period between the current show and the following show, we continue to sell to new and past exhibitors and collect payments on contracted exhibit space. Most of ourOur exhibitors pay in full in advance of each trade show, whereas the bulk of direct expenses are paid close to or after the show. Cash deposits start to be received as early as twelve months prior to a show taking place and the balance of booth space fees are typically received in cash one month prior to a show taking place. This highly efficient cash flow model, where cash is received in advance of expenses to be paid, creates a working capital benefit.
Free Cash Flow
In addition to net cash provided by operating activities presented in accordance with GAAP, we present Free Cash Flow because we believe it is a useful indicator of liquidity that provides information to our management and investors about the amount of cash generated from our core operations that, after capital expenditures, can be used for the repayment of indebtedness, paying of dividends, repurchasing of shares of our common stock and strategic initiatives, including investing in our business and making strategic acquisitions.
Free Cash Flow is a supplemental non-GAAP financial measure of liquidity and is not based on any standardized methodology prescribed by GAAP. Free Cash Flow should not be considered in isolation or as an alternative to net cash provided by operating activities or other measures determined in accordance with GAAP. Also, Free Cash Flow is not necessarily comparable to similarly titled measures used by other companies.
The most directly comparable GAAP measure to Free Cash Flow is net cash provided by operating activities. For a reconciliation of Free Cash Flow to net cash provided by operating activities, see footnote 6Footnote 5 to the table under the heading “Results of Operations - Operations—Comparison of the Year Ended December 31, 20202023 to the Year Ended December 31, 2019”2022”.
Adjusted EBITDA
Adjusted EBITDA is a key measure of our performance. We define Adjusted EBITDA as net loss(loss) income before (i) interest expense, (ii) provision for (benefit from) income tax benefit,taxes, (iii) goodwill impairments, (iv) intangible asset impairments, (v) depreciation and amortization, (iv)(vi) stock-based compensation, (v)(vii) deferred revenue adjustment (vi) goodwill and other intangible asset impairment charge, (vii) material show scheduling adjustments, and (viii) other items that management believeswe believe are not part of our core operations. We present Adjusted EBITDA because we believe it assists investors and analysts in comparing our operating performance across reporting periods on a consistent basis by excluding items that we do not believe are indicative of our core operating performance.
Management and our boardBoard of directorsDirectors use Adjusted EBITDA to assess our financial performance and believe it is helpful in highlighting trends because it excludes the results of decisions that are outside the control of management, while other performance metrics can differ significantly depending on long-term strategic decisions regarding capital structure, the tax jurisdictions in which we operate and capital investments. We reference Adjusted
EBITDA frequently in our decision-making because it provides supplemental information that facilitates internal comparisons to the historical operating performance of prior periods.
Adjusted EBITDA is not defined under GAAP and has limitations as an analytical tool, and you should not consider such measure either in isolation or as a substitute for analyzing our results as reported under GAAP. Some of these limitations include that Adjusted EBITDA excludes certain normal recurring expenses and one-time cash adjustments that we consider not to be indicative of our ongoing operating performance. Because not all companies use identical calculations, our presentation of Adjusted EBITDA may not be comparable to other similarly titled measures used by other companies.
The most directly comparable GAAP measure to Adjusted EBITDA is net loss.(loss) income. For a reconciliation of Adjusted EBITDA to net loss,(loss) income, see footnoteFootnote 4 to the table under the heading “Results of Operations - Operations—Comparison of the Year Ended December 31, 20202023 to the Year Ended December 31, 2019”2022”.
Adjusted Net Income39
Results of Operations
Our presentationComparison of Adjusted Net Income adjusts net loss for (i) stock-based compensation, (ii) deferred revenue, (iii) goodwill and other intangible asset impairment charges, (iv) other items that management believes are not partthe Year Ended December 31, 2023 to the Year Ended December 31, 2022
The tables in this section summarize key components of our coreresults of operations (v) amortizationfor the periods indicated.
|
| Year Ended December 31, |
|
|
|
|
|
|
| |||||||
|
| 2023 |
|
| 2022 |
|
| Variance $ |
|
| Variance % |
| ||||
|
| (dollars in millions) |
| |||||||||||||
Statement of (loss) income and comprehensive |
|
|
|
|
|
|
|
|
|
|
|
| ||||
Revenues |
| $ | 382.8 |
|
| $ | 325.9 |
|
| $ | 56.9 |
|
|
| 17.5 | % |
Other income, net |
|
| 2.8 |
|
|
| 182.8 |
|
|
| (180.0 | ) |
|
| (98.5 | )% |
Cost of revenues |
|
| 137.6 |
|
|
| 116.5 |
|
|
| 21.1 |
|
|
| 18.1 | % |
Selling, general and administrative expenses(1) |
|
| 168.3 |
|
|
| 145.0 |
|
|
| 23.3 |
|
|
| 16.1 | % |
Depreciation and amortization expense |
|
| 45.0 |
|
|
| 59.5 |
|
|
| (14.5 | ) |
|
| (24.4 | )% |
Goodwill impairments(2) |
|
| — |
|
|
| 6.3 |
|
|
| (6.3 | ) |
|
| (100.0 | )% |
Intangible asset impairments(3) |
|
| — |
|
|
| 1.6 |
|
|
| (1.6 | ) |
|
| (100.0 | )% |
Operating income |
|
| 34.7 |
|
|
| 179.8 |
|
|
| (145.1 | ) |
| NM |
| |
Interest expense |
|
| 43.3 |
|
|
| 24.5 |
|
|
| 18.8 |
|
|
| 76.7 | % |
Interest income |
|
| 8.2 |
|
|
| 2.7 |
|
|
| 5.5 |
|
|
| 203.7 | % |
Loss on extinguishment of debt |
|
| 2.3 |
|
|
| — |
|
|
| 2.3 |
|
|
| 100.0 | % |
Loss on disposal of fixed assets |
|
| 0.2 |
|
|
| — |
|
|
| 0.2 |
|
|
| 100.0 | % |
(Loss) income before income taxes |
|
| (2.9 | ) |
|
| 158.0 |
|
|
| (160.9 | ) |
| NM |
| |
Provision for income taxes |
|
| 5.3 |
|
|
| 27.2 |
|
|
| (21.9 | ) |
| NM |
| |
Net (loss) income and comprehensive (loss) income |
| $ | (8.2 | ) |
| $ | 130.8 |
|
| $ | (139.0 | ) |
| NM |
| |
|
|
|
|
|
|
|
|
|
|
|
| |||||
Other financial data (unaudited): |
|
|
|
|
|
|
|
|
|
|
|
| ||||
Adjusted EBITDA(4) |
| $ | 97.8 |
|
| $ | 239.6 |
|
| $ | (141.8 | ) |
|
| (59.2 | )% |
Free Cash Flow(5) |
| $ | 28.8 |
|
| $ | 164.8 |
|
| $ | (136.0 | ) |
|
| (82.5 | )% |
Organic revenue(6) |
| $ | 370.1 |
|
| $ | 323.1 |
|
| $ | 47.0 |
|
|
| 14.5 | % |
We use Adjusted Net Income as a supplemental metric to evaluate our business’s performanceintegration costs, including legal, audit and advisory fees. Also included in a way that also considers our ability to generate profit withoutselling, general and administrative expenses for each of the impact of certain items. For example, it is useful to excludeyears ended December 31, 2023 and 2022 were stock-based compensation expenses becauseof $7.8 million and $5.8 million, respectively.
Adjusted Net Incomeand is not defined under GAAP and has limitations as an analytical tool, and youbased on any standardized methodology prescribed by GAAP. Adjusted EBITDA should not consider such measure eitherbe considered in isolation or as an alternativealternatives to net (loss) income, cash flows from operating activities or other measures determined in accordance with GAAP. BecauseAlso, Adjusted EBITDA is not all companies use identical calculations, our presentation of Adjusted Net Income may not benecessarily comparable to other similarly titled measures usedpresented by other companies. The most directly comparable GAAP measure to Adjusted Net Income is net loss.
The most directly comparable GAAP measure to Adjusted Net Income is net loss. For a reconciliation of Adjusted Net Income to net loss, see footnote 5 to the table under the heading “Results of Operations—Comparison of the Year Ended December 31, 2020 to the Year Ended December 31, 2019”.40
Results of Operations
Comparison of the Year Ended December 31, 2020 to the Year Ended December 31, 2019
The tables in this section summarize key components of our results of operations for the periods indicated.
|
| Year Ended December 31, |
|
|
|
|
|
|
|
|
| |||||
|
| 2020 |
|
| 2019 |
|
| Variance $ |
|
| Variance % |
| ||||
|
| (dollars in millions) |
| |||||||||||||
Statement of loss and comprehensive loss data: |
|
|
|
|
|
|
|
|
|
|
|
|
|
|
|
|
Revenues |
| $ | 127.4 |
|
| $ | 360.9 |
|
| $ | (233.5 | ) |
|
| (64.7 | )% |
Other income |
|
| 107.0 |
|
|
| 6.1 |
|
|
| 100.9 |
|
| NM |
| |
Cost of revenues |
|
| 57.6 |
|
|
| 120.2 |
|
|
| (62.6 | ) |
|
| (52.1 | )% |
Selling, general and administrative expenses(1) |
|
| 118.6 |
|
|
| 133.4 |
|
|
| (14.8 | ) |
|
| (11.1 | )% |
Depreciation and amortization expense |
|
| 48.6 |
|
|
| 52.0 |
|
|
| (3.4 | ) |
|
| (6.5 | )% |
Goodwill impairments(2) |
|
| 603.4 |
|
|
| 69.1 |
|
|
| 534.3 |
|
| NM |
| |
Intangible asset impairments(3) |
|
| 76.8 |
|
|
| 17.0 |
|
|
| 59.8 |
|
| NM |
| |
Operating loss |
|
| (670.6 | ) |
|
| (24.7 | ) |
|
| (645.9 | ) |
| NM |
| |
Interest expense |
|
| 20.6 |
|
|
| 30.3 |
|
|
| (9.7 | ) |
|
| (32.0 | )% |
Loss before income taxes |
|
| (691.2 | ) |
|
| (55.0 | ) |
|
| (636.2 | ) |
| NM |
| |
Benefit from income taxes |
|
| (57.6 | ) |
|
| (5.0 | ) |
|
| (52.6 | ) |
| NM |
| |
Net loss and comprehensive loss |
| $ | (633.6 | ) |
| $ | (50.0 | ) |
| $ | (583.6 | ) |
| NM |
| |
|
|
|
|
|
|
|
|
|
|
|
|
|
|
|
|
|
Other financial data (unaudited): |
|
|
|
|
|
|
|
|
|
|
|
|
|
|
|
|
Adjusted EBITDA(4) |
| $ | 71.9 |
|
| $ | 127.8 |
|
| $ | (55.9 | ) |
|
| (43.7 | )% |
Adjusted Net Income(5) |
| $ | 40.4 |
|
| $ | 67.3 |
|
| $ | (26.9 | ) |
|
| (40.0 | )% |
Free Cash Flow(6) |
| $ | (41.1 | ) |
| $ | 63.9 |
|
| $ | (105.0 | ) |
| NM |
| |
|
|
|
|
|
|
|
|
We define Adjusted EBITDA as net loss(loss) income before (i) interest expense, (including unrealized loss on interest rate swap and floor, net, (ii) provision for periods prior to the expiration of our interest rate swap), (ii) loss on extinguishment of debt,(benefit from) income taxes, (iii) income tax expense, (iv) goodwill impairments, (v)(iv) intangible asset impairments, (vi)(v) depreciation and amortization, (vii)(vi) stock-based compensation, (viii)(vii) deferred revenue adjustment and (ix)(viii) other items that management believeswe believe are not part of our core operations. We present Adjusted EBITDA because we believe it assists investors and analysts in comparing our operating performance across reporting periods on a consistent basis by excluding items that we do not believe are indicative of our core operating performance. Management and our boardBoard of directorsDirectors use Adjusted EBITDA to assess our financial performance and believe they areit is helpful in highlighting trends because it excludes the results of decisions that are outside the control of our management, while other performance metrics can differ significantly depending on long-term strategic decisions regarding capital structure, the tax jurisdictions in which we operate and capital investments. We reference Adjusted EBITDA frequently in our decision-making because it provides supplemental information that facilitates internal comparisons to the historical operating performance of prior periods. Adjusted EBITDA is not defined under GAAP and has limitations as an analytical tool, and you should not consider such measure either in isolation or as a substitute for analyzing our results as reported under GAAP. Some of these limitations include that Adjusted EBITDA excludes certain normal recurring expenses and one-time cash adjustments that we consider not to be indicative of our ongoing operative performance. Because not all companies use identical calculations, our presentation of Adjusted EBITDA may not be comparable to other similarly titled measures used by other companies.
|
| Year Ended December 31, |
| |||||
|
| 2023 |
|
| 2022 |
| ||
|
| (unaudited) |
| |||||
|
| (dollars in millions) |
| |||||
Net (loss) income |
| $ | (8.2 | ) |
| $ | 130.8 |
|
Add (Deduct): |
|
|
|
|
|
| ||
Interest expense, net |
|
| 35.1 |
|
|
| 21.8 |
|
Loss on extinguishment of debt |
|
| 2.3 |
|
|
| — |
|
Provision for (benefit from) income taxes |
|
| 5.3 |
|
|
| 27.2 |
|
Goodwill impairments(a) |
|
| — |
|
|
| 6.3 |
|
Intangible asset impairments(b) |
|
| — |
|
|
| 1.6 |
|
Depreciation and amortization expense |
|
| 45.0 |
|
|
| 59.5 |
|
Stock-based compensation expense(c) |
|
| 7.8 |
|
|
| 5.8 |
|
Deferred revenue adjustment(d) |
|
| — |
|
|
| 0.6 |
|
Other items(e) |
|
| 10.5 |
|
|
| (14.0 | ) |
Adjusted EBITDA |
| $ | 97.8 |
|
| $ | 239.6 |
|
Deduct: |
|
|
|
|
|
| ||
Event cancellation insurance proceeds |
|
| 2.8 |
|
|
| 182.8 |
|
Adjusted EBITDA excluding event cancellation insurance proceeds |
| $ | 95.0 |
|
| $ | 56.8 |
|
|
| Year Ended December 31, |
|
| |||||
|
| 2020 |
|
| 2019 |
|
| ||
|
| (unaudited) |
|
| |||||
|
| (dollars in millions) |
|
| |||||
Net loss |
| $ | (633.6 | ) |
| $ | (50.0 | ) |
|
Add (Deduct): |
|
|
|
|
|
|
|
|
|
Interest expense |
|
| 20.6 |
|
|
| 30.3 |
|
|
Benefit from income taxes |
|
| (57.6 | ) |
|
| (5.0 | ) |
|
Goodwill impairments(a) |
|
| 603.4 |
|
|
| 69.1 |
|
|
Intangible asset impairments(b) |
|
| 76.8 |
|
|
| 17.0 |
|
|
Depreciation and amortization |
|
| 48.6 |
|
|
| 52.0 |
|
|
Stock-based compensation expense(c) |
|
| 6.7 |
|
|
| 7.7 |
|
|
Deferred revenue adjustment(d) |
|
| - |
|
|
| 0.3 |
|
|
Other items(e) |
|
| 7.0 |
|
|
| 6.4 |
|
|
Adjusted EBITDA |
| $ | 71.9 |
|
| $ | 127.8 |
|
|
|
|
|
|
|
|
|
|
|
|
|
|
We use Adjusted Net Income as a supplemental metric to evaluate our business’s performance in a way that also considers our ability to generate profit without the impact of certain items.
For example, we exclude the amortization of intangible assets and certain discrete costs, including deferred revenue adjustments, impairments anda one-time severance expense of $1.5 million; (iii) $2.6 million in acquisition-related transaction costs (including professionaland (iv) $4.1 million in non-recurring legal, audit and consulting fees. Other items for the year ended December 31, 2022 included: (i) $33.3 million in gains related to the remeasurement of contingent consideration; (ii) $6.1 million in restructuring-related transition costs, including $3.0 million in non-cash lease abandonment charges; (iii) $3.6 million in
41
Adjusted Net Income is not defined under GAAPcommon stock and has limitations as an analytical tool,strategic initiatives, including investing in our business and you should not consider such measure either in isolation or as an alternative to net loss, cash flows from operating activities or other measures determined in accordance with GAAP. The most directly comparable GAAP measure to Adjusted Net Income is net loss. Because not all companies use identical calculations, our presentation of Adjusted Net Income may not be comparable to other similarly titled measures used by other companies.
|
| Year ended December 31 |
| |||||
|
| 2020 |
|
| 2019 |
| ||
|
| (unaudited) |
| |||||
|
| (dollars in millions) |
| |||||
Net loss |
| $ | (633.6 | ) |
| $ | (50.0 | ) |
Add (Deduct): |
|
|
|
|
|
|
|
|
Stock-based compensation expense(a) |
|
| 6.7 |
|
|
| 7.7 |
|
Deferred revenue adjustment(b) |
|
| — |
|
|
| 0.3 |
|
Goodwill impairments(c) |
|
| 603.4 |
|
|
| 69.1 |
|
Intangible asset impairments(d) |
|
| 76.8 |
|
|
| 17.0 |
|
Other items(e) |
|
| 7.0 |
|
|
| 6.4 |
|
Amortization of deferred financing fees and discount |
|
| 1.5 |
|
|
| 1.4 |
|
Amortization of acquired intangible assets(f) |
|
| 46.0 |
|
|
| 49.6 |
|
Tax adjustments related to non-GAAP adjustments(g) |
|
| (67.4 | ) |
|
| (34.2 | ) |
Adjusted Net Income |
| $ | 40.4 |
|
| $ | 67.3 |
|
|
|
|
|
|
|
|
|
|
|
|
|
|
|
|
|
making strategic acquisitions. Free Cash Flow is a supplemental non-GAAP financial measure of liquidity and is not based on any standardized methodology prescribed by GAAP. Free Cash Flow should not be considered in isolation or as an alternative to cash flows from operating activities or other measures determined in accordance with GAAP. Also, Free Cash Flow is not necessarily comparable to similarly titled measures used by other companies.
|
| Year Ended December 31, |
| |||||
|
| 2020 |
|
| 2019 |
| ||
|
| (unaudited) |
| |||||
|
| (dollars in millions) |
| |||||
Net Cash (Used in) Provided by Operating Activities |
| $ | (37.1 | ) |
| $ | 67.8 |
|
Less: |
|
|
|
|
|
|
|
|
Capital expenditures |
|
| 4.0 |
|
|
| 3.9 |
|
Free Cash Flow |
| $ | (41.1 | ) |
| $ | 63.9 |
|
|
| Year Ended December 31, |
| |||||
|
| 2023 |
|
| 2022 |
| ||
|
| (unaudited) |
| |||||
|
| (dollars in millions) |
| |||||
Net Cash Provided by Operating Activities |
| $ | 40.3 |
|
| $ | 175.1 |
|
Less: |
|
|
|
|
|
| ||
Capital expenditures |
|
| 11.5 |
|
|
| 10.3 |
|
Free Cash Flow |
| $ | 28.8 |
|
| $ | 164.8 |
|
Organic revenue is a supplemental non-GAAP financial measure of performance and is not based on any standardized methodology prescribed by GAAP. Organic revenue should not be considered in isolation or as an alternative to revenues or other measures determined in accordance with GAAP. Also, Organic revenuesrevenue is not necessarily comparable to similarly titled measures used by other companies.
|
| Year |
|
| Change |
| ||||||||||
|
| 2023 |
|
| 2022 |
|
| $ |
|
| % |
| ||||
|
| (unaudited) |
| |||||||||||||
|
| (dollars in millions) |
| |||||||||||||
Revenues |
| $ | 382.8 |
|
| $ | 325.9 |
|
| $ | 56.9 |
|
|
| 17.5 | % |
Add (deduct): |
|
|
|
|
|
|
|
|
|
|
|
| ||||
Acquisition revenues |
|
| (12.7 | ) |
|
| — |
|
|
|
|
|
|
| ||
Discontinued events |
|
| — |
|
|
| (2.8 | ) |
|
|
|
|
|
| ||
Organic revenue |
| $ | 370.1 |
|
| $ | 323.1 |
|
| $ | 47.0 |
|
|
| 14.5 | % |
Revenues
|
| Year Ended December 31, |
| Change |
| ||||||||
|
| 2020 |
| 2019 |
| $ |
| % |
| ||||
|
| (unaudited) (dollars in millions) |
| ||||||||||
Revenues |
| $ | 127.4 |
| $ | 360.9 |
| $ | (233.5 | ) |
| (64.7 | %) |
Add (deduct): |
|
|
|
|
|
|
|
|
|
|
|
|
|
Acquisition revenues |
|
| (7.2 | ) |
| — |
|
|
|
|
|
|
|
Discontinued events |
|
| — |
|
| (6.7 | ) |
|
|
|
|
|
|
COVID-19 cancellations(1) |
|
| — |
|
| (230.6 | ) |
|
|
|
|
|
|
Organic revenues |
| $ | 120.2 |
| $ | 123.6 |
| $ | (3.4 | ) |
| (2.8 | %) |
|
|
Revenues
Total revenues of $127.4$382.8 million for the year ended December 31, 2020 decreased $233.52023 increased $56.9 million, or 64.7%17.5%, from $360.9$325.9 million for the year ended December 31, 2019.2022. See “Commerce Segment – Revenues,” “Design and Technology Segment – “Connections Segment—Revenues,” and “All Other Category – Category—Revenues” below for a discussion of the factors contributing to the changes in total revenues.
Other Income, net
Total other income, net of $107.0$2.8 million for the year ended December 31, 2023 decreased $180.0 million, from $182.8 million for the year ended December 31, 2022. See “Connections Segment—Other Income, net” and
42
“Corporate—Other Income, net” below for a discussion of the factors contributing to the changes in total other income, net.
Cost of Revenues
Total cost of revenues of $137.6 million for fiscal 20202023 increased by $100.9$21.1 million, or 18.1%, from $6.1$116.5 million for fiscal 2019.2022. See “Commerce Segment – “Connections Segment—Cost of Revenues,” “Design and Technology Segment – Cost of Revenues” and “All Other Category – Category—Cost of Revenues” below for a discussion of the factors contributing to the changes in total cost of revenues.
Cost of Revenues
Total cost of revenues of $57.6 million for fiscal 2020 decreased by 52.1%, or $62.6 million, from $120.2 million for fiscal 2019. See “Commerce Segment – Cost of Revenues,” “Design and Technology Segment – Cost of Revenues” and “All Other Category – Cost of Revenues” below for a discussion of the factors contributing to the changes in total cost of revenues.
Selling, General and Administrative Expenses
Total selling, general and administrative expenses consist primarily of compensation and employee-related costs, sales commissions and incentive plans, stock-based compensation expense, marketing expenses, information technology expenses, travel expenses, facilities costs, consulting fees and public reporting costs. Total selling, general and administrative expenses of $118.6$168.3 million for the year ended December 31, 2020 decreased $14.82023 increased $23.3 million, or 11.1%16.1%, from $133.4$145.0 million for the year ended December 31, 2019.2022. See “Commerce Segment – Selling, General and Administrative Expenses”, “Design and Technology Segment – “Connections Segment—Selling, General and Administrative Expenses”, “All Other category – category—Selling, General and Administrative Expenses” and “Corporate - “Corporate—Selling, General and Administrative Expenses” below for a discussion of the factors contributing to the changes in total selling, general and administrative expenses.
Depreciation and Amortization Expense
Total depreciation and amortization expense of $48.6$45.0 million for the year ended December 31, 20202023 decreased $3.4$14.5 million, or 6.5%24.4%, from $52.0$59.5 million for the year ended December 31, 2019.2022. See “Commerce Segment – Depreciation and Amortization Expense,” “Design and Technology Segment – “Connections Segment—Depreciation and Amortization Expense,” “All Other Category – Category—Depreciation and Amortization Expense” and “Corporate – “Corporate—Depreciation and Amortization Expense” below for a discussion of the factors contributing to the changes in total depreciation and amortization expense.
Goodwill Impairments
As a result of the COVID-19 pandemic and the measures implemented to prevent its spread, duringchanges in our operating segments in the first quarter of 2020,2022, we determined that the COVID-19 outbreak would continue to have a material negative impact on our financial results even following the time when the outbreak is contained. These factors, as well as uncertainty around when we would be able to resume normal operations, caused a significant and prolonged decline in our stock price, resulting in our market capitalization falling below the Company’s carrying value. As a result, we determined that a triggering event occurred and performed a quantitative assessment of the Company’s fair value as of March 31, 2020. In connection with this assessment management recorded a $588.2 million non-cash charge related to the impairment of goodwill. In addition, as a result of our annual goodwill impairment assessment managementand recorded an additional $15.2a $6.3 million non-cash charge related to the impairment of goodwill as of OctoberJanuary 31, 2020. 2022. There were no charges related to impairment of goodwill recorded during the year ended December 31, 2023.
In connection withIntangible Asset Impairments
As a result of the re-evaluationidentification of our operating segments and reporting units due to changes in our internal financial reporting structure, managementan interim impairment trigger for one of its indefinite-lived intangible assets during the first quarter of 2022, the Company performed the annual goodwillan impairment assessment and recorded a $59.8$1.6 million non-cash charge related to the impairment of goodwill. The impairment consisted of the write-down of goodwill, equal to the excess carrying value of goodwill above fair value, of one or more reporting units included in our Commerce and Design and Technology segments and the All Other category. In addition, during the third quarter of 2019, we recognized a non-cash goodwill impairment charge of $9.3 million, as a result of a triggering event caused by reduced performance expectations in the current year. See “Commerce Segment – Goodwill Impairments,” “Design and Technology Segment – Goodwill Impairments” and “All Other Category—Goodwill Impairments” below for further discussion of goodwill impairments.
Intangible Asset Impairments
Due to the triggering event in the first quarter of 2020 described above, management performed impairment assessments of our long-lived assets and indefinite-lived assets. The assessments resulted in the recognition of a non-cash impairment charge of $59.4 million, which included non-cash impairment charges for certain of our long-lived customer relationship and trade name intangible assets, and certain of ouran indefinite-lived trade name asset as of January 31, 2022. There were no charges related to impairment of intangible assets of $13.2 million and $46.2 million, respectively. As a result of our annual impairment assessment as of October 31, management recorded a non-cash impairment charge of $17.4 million, which included non-cash impairment charges for certain of our long-lived customer relationship and trade name intangible assets, and certain of our indefinite-lived trade name
intangible assets of $16.8 million and $0.6 million, respectively.
Due to the triggering event in the third quarter of 2019 caused by reduced performance expectations during the year, management performed impairment assessments of our long-lived assets and indefinite-lived intangible assets. These assessments resulted in the recognition of a non-cash impairment charge of $17.0 million, which included non-cash impairment charges for certain of our customer relationship intangible assets and trade name intangible assets of $8.7 million and $8.3 million, respectively. See “Commerce Segment – Intangible Asset Impairments”, “Design and Technology Segment – Intangible Asset Impairments” and “All Other Category –Intangible Asset Impairments” below for further discussion of total intangible asset impairments.
Commerce Segment
|
| Year Ended December 31, |
|
|
|
|
|
|
|
|
| |||||
|
| 2020 |
|
| 2019 |
|
| Variance $ |
|
| Variance % |
| ||||
|
| (dollars in millions) |
| |||||||||||||
|
|
|
|
|
|
|
|
|
|
|
|
|
|
|
|
|
Revenues |
| $ | 56.9 |
|
| $ | 184.7 |
|
| $ | (127.8 | ) |
|
| (69.2 | )% |
Other income |
|
| 70.3 |
|
|
| 6.1 |
|
|
| 64.2 |
|
| NM |
| |
Cost of revenues |
|
| 24.6 |
|
|
| 49.4 |
|
|
| (24.8 | ) |
|
| (50.2 | )% |
Selling, general and administrative expenses |
|
| 27.8 |
|
|
| 37.2 |
|
|
| (9.4 | ) |
|
| (25.3 | )% |
Depreciation and amortization expense |
|
| 21.9 |
|
|
| 26.9 |
|
|
| (5.0 | ) |
|
| (18.6 | )% |
Goodwill impairments |
|
| 367.5 |
|
|
| 41.9 |
|
|
| 325.6 |
|
| NM |
| |
Intangible asset impairments |
|
| 45.9 |
|
|
| 0.7 |
|
|
| 45.2 |
|
| NM |
| |
Operating (loss) income |
| $ | (360.5 | ) |
| $ | 34.7 |
|
| $ | (395.2 | ) |
| NM |
| |
Revenues
During the year ended December 31, 2020, revenues for the Commerce segment2023.
Interest Expense
Total interest expense of $56.9 million decreased by $127.8 million, or 69.2% from $184.7$43.3 million for the year ended December 31, 2019. The primary driver of the decline was the cancellation of several first quarter and all but one subsequent live event scheduled in 2020 due to COVID-19. These cancelled events represented $126.2 million in prior year revenues. The remaining $1.2 million decline in revenues was primarily attributable to a decline of 3.9% for the events that staged during the first quarter as well as one event that staged in the fourth quarter of 2020, lower other marketing services revenue and several small discontinued events, offset by revenues generated by the launch of new virtual events.
Other Income
Other Income of $70.3 million was recorded for the Commerce reportable segment related to event cancellation insurance claims proceeds, of which $61.3 million was received and $9.0 million was confirmed by the insurance provider during the year ended December 31, 2020. All $9.0 million of insurance receivables as of December 31, 2020 were received in January 2021.
During the third quarter of 2019, as a result of Hurricane Dorian, our Surf Expo and Impressions Expo Orlando (“ISS Orlando”) shows were forced to be cancelled. Emerald carries cancellation insurance to mitigate losses caused by natural disasters and received a settlement of $6.1 million to offset the lost revenues from the affected trade shows. As a result, Other income of $6.1 million attributable to the Commerce segment was recorded in the consolidated statements of loss and comprehensive loss for the year ended December 31, 2019 to recognize the amount recovered from the insurance company. We also maintained supplemental insurance to mitigate the losses of our exhibitors for out-of-pocket expenses incurred in connection with the cancelled shows. We received $10.1 million under this policy which was fully paid to participating exhibitors during 2019.
Cost of Revenues
During the year ended December 31, 2020, cost of revenues of $24.6 million for the Commerce segment decreased by $24.82023 increased $18.8 million, or 50.2%76.7%, from $49.4$24.5 million for the year ended December 31, 2019. The primary driver2022. See “Corporate—Interest Expense” below for a discussion of the decline wasfactors contributing to the cancellationchanges in total interest expense.
Interest Income
Total interest income of several first quarter and all but one subsequent live event scheduled in 2020 due to COVID-19. These cancelled events represented $24.2 million in prior year cost of revenues.
Selling, General and Administrative Expenses
During the year ended December 31, 2020, selling, general and administrative expenses of $27.8 million for the Commerce segment decreased by $9.4 million or 25.3% from $37.2$8.2 million for the year ended December 31, 2019. T2023 increased $5.5 million, or 203.7%, from $2.7 million for the year ended December 31, 2022. See “Corporate—Interest Income” below for a discussion of the factors contributing to the changes in total interest income.
he43
Loss on Extinguishment of Debt
See “Corporate—Loss on Extinguishment of Debt” below for a discussion of the factors contributing to the changes in total loss on extinguishment of debt.
Connections Segment
|
| Year Ended December 31, |
|
|
|
|
|
|
| |||||||
|
| 2023 |
|
| 2022 |
|
| Variance $ |
|
| Variance % |
| ||||
|
| (dollars in millions) |
| |||||||||||||
Revenues |
| $ | 340.2 |
|
| $ | 282.6 |
|
| $ | 57.6 |
|
|
| 20.4 | % |
Other income, net |
|
| 2.8 |
|
|
| 34.2 |
|
|
| (31.4 | ) |
|
| (91.8 | )% |
Cost of revenues |
|
| 128.0 |
|
|
| 106.9 |
|
|
| 21.1 |
|
|
| 19.7 | % |
Selling, general and administrative expenses |
|
| 79.4 |
|
|
| 77.2 |
|
|
| 2.2 |
|
|
| 2.8 | % |
Depreciation and amortization expense |
|
| 34.8 |
|
|
| 50.7 |
|
|
| (15.9 | ) |
|
| (31.4 | )% |
Goodwill impairments |
|
| — |
|
|
| 6.0 |
|
|
| (6.0 | ) |
| NM |
| |
Intangible asset impairments |
|
| — |
|
|
| 1.6 |
|
|
| (1.6 | ) |
| NM |
| |
Operating income |
| $ | 100.8 |
|
| $ | 74.4 |
|
| $ | 26.4 |
|
|
| 35.5 | % |
Revenues
During the year ended December 31, 2023, revenues for the Connections segment of $340.2 million increased by $57.6 million, or 20.4% from $282.6 million for the year ended December 31, 2022. The primary driver of the increase was organic revenue growth of $47.7 million, or 17.0%, from $279.8 million in fiscal year 2022 to $327.5 million in the current year. This growth was comprised of a recurring revenues increase of $41.8 million, or 15.0%, to $320.6 million in the current year from $278.8 million in fiscal year 2022 and $5.9 million from new event launches in the current year. Acquisitions generated incremental revenues of $12.7 million during fiscal year 2023. These increases were partially offset by $2.8 million in prior year revenues from discontinued events.
Other Income, net
Other income, net of $2.8 million and $34.2 million was recorded for the Connections segment related to event cancellation insurance proceeds during the years ended December 31, 2023 and 2022, respectively. All of the $2.8 million and $34.2 million of other income, net, for the Connections segment was received during the years ended December 31, 2023 and 2022, respectively.
Cost of Revenues
During the year ended December 31, 2023, cost of revenues for the Connections reportable segment increased $21.1 million, or 19.7%, to $128.0 million from $106.9 million for the year ended December 31, 2022. This growth was comprised of an increase in cost of recurring revenues of $10.8 million, or 10.3%, to $115.0 million in the current year from $104.2 million in fiscal year 2022, and an increase of $5.7 million in cost of revenues from new event launches in the current year. Acquisitions generated incremental cost of revenues of $6.3 million during fiscal year 2023. These increases were partially offset by a decrease of $1.7 million from prior year cost of revenues relating to discontinued events.
Selling, General and Administrative Expenses
During the year ended December 31, 2023 selling, general and administrative expenses for the Connections reportable segment increased $2.2 million, or 2.8%, to $79.4 million from $77.2 million for the comparable period in 2022. The increase was primarily comprised of lower compensation and employee-related costs due to a combinationthe acquisition of permanent staff reductions and furloughs, and lower travel and promotional expenses related to the cancelled events. Lower credit card fees related to the cancelled events generated additional cost reductions. Lodestone, which added incremental expense of $2.1 million.
44
Depreciation and Amortization Expense
Depreciation and amortization expense attributable to the CommerceConnections segment of $21.9$34.8 million for the year ended December 31, 20202023 decreased $5.0$15.9 million, or 18.6%31.4%, from $26.9$50.7 million for the year ended December 31, 2019.2022. The decrease was due to the full amortization of intangible assets acquired in the formation of Emerald in June 2013 as well as lower amortization on the definite-lived trade name and customer relationship intangible assets which were impaired inassociated with the first and fourth quarters of 2020.MJBiz acquisition.
Goodwill Impairments
During 2020, we2022, the Company recorded $367.5 million non-cash goodwill impairment chargesimpairments of $6.0 million in connection with reporting units under the CommerceConnections segment in relation to our interim andits annual impairment assessments.assessment. Refer to the consolidated goodwill impairment discussion under the heading, Goodwill ImpairmentImpairments, above in this Management’s Discussion and Analysis of Financial Condition and Results of Operations for further discussion on goodwill impairment.
During 2019, we recorded a $36.3 million non-cash charge in connection with our annual goodwill assessment that was related to reporting units under the Commerce segment in connection with the re-evaluation of our internal financial reporting structure. In addition, during the third quarter of 2019, we recognized a non-cash goodwill impairment charge of $5.6 million, related to reporting units under the Commerce segment, as a result of a triggering event caused by reduced performance expectations for the year.
Intangible Asset Impairments
In connection with the triggering event in the first quarter of 2020 described above, we performed impairment assessments of long-lived assets and indefinite-lived assets and recorded non-cash impairment charges related to long-lived assets and indefinite-lived intangible assets under the Commerce segment of $6.7 million and $24.0 million, respectively. In relation to our annual impairment assessment performed as of October 31, we recorded additional non-cash impairment charges related to related to long-lived assets under the Commerce segment of $15.2 million. During 2020, we recorded total non-cash impairment charges related to long-lived assets and indefinite-lived intangible assets under the Commerce segment of $21.9 million and $24.0 million, respectively.
In connection with the triggering event in the third quarter of 2019 described above,our 2022 annual impairment assessment, we performed impairment assessments of long-lived assets and indefinite-lived intangible assets and recognizedrecorded a non-cash impairment charge related to indefinite-livedof $1.6 million for intangible assets under the Commerce segment of $0.7 million.
Design and Technology Segment
|
| Year Ended December 31, |
|
|
|
|
|
|
|
|
| |||||
|
| 2020 |
|
| 2019 |
|
| Variance $ |
|
| Variance % |
| ||||
|
| (dollars in millions) |
| |||||||||||||
|
|
|
|
|
|
|
|
|
|
|
|
|
|
|
|
|
Revenues |
| $ | 51.2 |
|
| $ | 139.9 |
|
| $ | (88.7 | ) |
|
| (63.4 | )% |
Other income |
|
| 32.5 |
|
|
| — |
|
|
| 32.5 |
|
| NM |
| |
Cost of revenues |
|
| 25.7 |
|
|
| 53.9 |
|
|
| (28.2 | ) |
|
| (52.3 | )% |
Selling, general and administrative expenses |
|
| 23.0 |
|
|
| 30.2 |
|
|
| (7.2 | ) |
|
| (23.8 | )% |
Depreciation and amortization expense |
|
| 16.4 |
|
|
| 19.2 |
|
|
| (2.8 | ) |
|
| (14.6 | )% |
Goodwill impairments |
|
| 205.7 |
|
|
| 24.0 |
|
|
| 181.7 |
|
| NM |
| |
Intangible asset impairments |
|
| 24.9 |
|
|
| 7.9 |
|
|
| 17.0 |
|
| NM |
| |
Operating (loss) income |
| $ | (212.0 | ) |
| $ | 4.7 |
|
| $ | (249.2 | ) |
| NM |
| |
Revenues
During the year ended December 31, 2020, revenues for the Design and Technology segment of $51.2 million decreased by $88.7 million, or 63.4%, from $139.9 million for the year ended December 31, 2019. The primary driver of the decline was the cancellation of several first quarter and substantially all subsequent live events scheduled in 2020 due to COVID-19. These cancelled events represented $86.9 million in prior year revenues. The remaining $1.8 million decline in revenues was primarily attributable to several small discontinued events and a decline of 1.0% for the events that staged during the first quarter in the Design and Technology segment, offset by revenues generated by the launch of new virtual events.
Other Income
Other Income of $32.5 million was recorded for the Design and Technology reportable segment related to event cancellation insurance claims proceeds, of which $24.8 million was received and $7.7 million was confirmed by the insurance provider during the year ended December 31, 2020. All $7.7 million of insurance receivables as of December 31, 2020 were received in January 2021.
Cost of Revenues
During the year ended December 31, 2020, cost of revenues for the Design and Technology segment of $25.7 million decreased by $28.2 million, or 52.3%, from $53.9 million for the year ended December 31, 2019. The primary driver of the decline was the cancellation of several first quarter and substantially all subsequent live events scheduled in 2020 due to COVID-19. These cancelled events represented $29.3 million in prior year cost of revenues. This decline was offset by increased costs related to live events that staged in the first quarter and the launch of several new virtual events.
Selling, General and Administrative Expenses
During the year ended December 31, 2020, selling, general and administrative expenses for the Design and Technology segment of $23.0 million decreased by $7.2 million, or 23.8%, from $30.2 million for the year ended December 31, 2019. The decrease was primarily comprised of lower promotional expenses related to the cancelled events, lower compensation and employee-related costs due to a combination of permanent staff reductions and furloughs, and lower travel. Lower credit card fees related to the cancelled events generated additional cost reductions.
Depreciation and Amortization Expense
During the year ended December 31, 2020, depreciation and amortization expense for the Design and Technology segment of $16.4 million decreased $2.8 million, or 14.6%, from $19.2 million for the year ended December 31, 2019. The decrease was due to lower amortization on the definite-lived trade name and customer relationship intangible assets which were impaired in the first and fourth quarters of 2020.
Goodwill Impairments
During 2020, we recorded $205.7 million non-cash goodwill impairment charges in connection with reporting units under the Design and Technology segment in relation to our interim and annual impairment assessments. Connections segment. Refer to the consolidated goodwillintangible assets impairment discussion under the heading, Goodwill ImpairmentIntangible Asset Impairments, above in this Management’s Discussion and Analysis of Financial Condition and Results of Operations for further discussion on goodwill impairment.
During the third quarter of 2019, we recognized a non-cash goodwill impairment charge of $3.2 million, related to reporting units under the Design and Technology segment, as a result of a triggering event caused by reduced performance expectations for the year. In addition, we recorded a $20.8 million non-cash goodwill impairment charge in connection with our annual goodwill impairment assessment that was related to reporting units under the Design and Technology segment in connection with the re-evaluation of our internal financial reporting structure during 2019.
Intangible Asset Impairments
In connection with the triggering event in the first quarter of 2020, described above, we performed impairment assessments of long-lived assets and indefinite-lived assets and recorded non-cash impairment charges related to long-lived assets and indefinite-lived intangible assets under the Design and Technology segment of $5.7 million and $17.0 million, respectively. In relation to our annual impairment assessment performed as of October 31, we recorded additional non-cash impairment charges of $1.6 million and $0.6 million, in connection with long-lived assets and indefinite-lived intangible assets, respectively, under the Design and Technology segment. During 2020, we recorded total non-cash impairment charges related to long-lived assets and indefinite-lived intangible assets under the Design and Technology segment of $7.3 million and $17.6 million, respectively.
In connection with the triggering event in the third quarter of 2019 described above, we performed impairment assessments of long-lived assets and indefinite-lived intangible assets, and recognized non-cash impairment charges related to indefinite-lived trade name intangible assets, long-lived trade name and customer relationship intangible assets allocated to the Design and Technology segment of $3.6 million and $4.3 million, respectively.
All Other Category
|
| Year Ended December 31, |
|
|
|
|
|
|
| |||||||
|
| 2023 |
|
| 2022 |
|
| Variance $ |
|
| Variance % |
| ||||
|
| (dollars in millions) |
| |||||||||||||
Revenues |
| $ | 42.6 |
|
| $ | 43.3 |
|
| $ | (0.7 | ) |
|
| (1.6 | )% |
Cost of revenues |
|
| 9.6 |
|
|
| 9.6 |
|
|
| - |
|
| NM |
| |
Selling, general and administrative expenses |
|
| 29.4 |
|
|
| 34.2 |
|
|
| (4.8 | ) |
|
| (14.0 | )% |
Depreciation and amortization expense |
|
| 7.2 |
|
|
| 4.3 |
|
|
| 2.9 |
|
|
| 67.4 | % |
Goodwill impairments |
|
| — |
|
|
| 0.3 |
|
|
| (0.3 | ) |
|
| (100.0 | )% |
Operating loss |
| $ | (3.6 | ) |
| $ | (5.1 | ) |
| $ | 1.5 |
|
| NM |
| |
Revenues
|
| Year Ended December 31, |
|
|
|
|
|
|
|
|
| |||||
|
| 2020 |
|
| 2019 |
|
| Variance $ |
|
| Variance % |
| ||||
|
| (dollars in millions) |
| |||||||||||||
|
|
|
|
|
|
|
|
|
|
|
|
|
|
|
|
|
Revenues |
| $ | 19.3 |
|
| $ | 36.3 |
|
| $ | (17.0 | ) |
|
| (46.8 | )% |
Other income |
|
| 4.2 |
|
|
| — |
|
|
| 4.2 |
|
| NM |
| |
Cost of revenues |
|
| 7.3 |
|
|
| 16.9 |
|
|
| (9.6 | ) |
|
| (56.8 | )% |
Selling, general and administrative expenses |
|
| 13.3 |
|
|
| 10.3 |
|
|
| 3.0 |
|
|
| 29.1 | % |
Depreciation and amortization expense |
|
| 7.4 |
|
|
| 3.5 |
|
|
| 3.9 |
|
|
| 111.4 | % |
Goodwill impairments |
|
| 30.2 |
|
|
| 3.2 |
|
|
| 27.0 |
|
| NM |
| |
Intangible asset impairments |
|
| 6.0 |
|
|
| 8.4 |
|
|
| (2.4 | ) |
|
| (28.6 | )% |
Operating loss |
| $ | (40.7 | ) |
| $ | (6.0 | ) |
| $ | (34.7 | ) |
|
| 578.3 | % |
Revenues
During the year ended December 31, 2020,2023, revenue attributable to the All Other category of $19.3$42.6 million decreased by $17.0$0.7 million, or 46.8%1.6%, from $36.3$43.3 million for the year ended December 31, 2019. 2022. The primary driverdecrease in revenues was comprised of a $4.4 million, or 15.8% and a decrease in content revenues to $23.5 million in the current year from $27.9 million in fiscal year 2022, primarily related to lower print and digital advertising revenues in the technology sector, partially offset by a $3.7 million, or 24.0%, increase in commerce revenues to $19.1 million in the current year from $15.4 million in fiscal year 2022. The increase in commerce revenues was attributable to the continued growth of the decline was the cancellation of several first quarter and substantially all subsequent live events scheduled in 2020 due to COVID-19. These cancelled events represented $19.3 million in prior year revenues. In addition, lower revenues from several discontinued brands and several events that staged in the first quarter contributed to the decline. These decreases were offset by incremental revenues from the G3 acquisition, which closed in November 2019.Elastic Suite e-commerce business.
Other Income
Other Income of $4.2 million was recorded for All Other category related to event cancellation insurance claims proceeds, of which $3.0 million was received and $1.2 million was confirmed by the insurance provider during the year ended December 31, 2020. All $1.2 million of insurance receivables as of December 31, 2020 were received in January 2021.
Cost of Revenues
During the year ended December 31, 2020,2023, cost of revenues attributable to the All Other category remained flat compared to the prior year at $9.6 million. Cost of $7.3revenues related to our content business of $4.7 million during the current year decreased by $9.6$0.4 million, or 56.8%7.8%, from $16.9 million for the year ended December 31, 2019. These cancelled events represented $7.7$5.1 million in priorfiscal year cost2022 primarily as a result of revenues. In addition, discontinued print and digital publications contributed to the decrease inlower revenues described above. This decline was offset by cost of revenues forrelated to our commerce business of $4.9 million during the All Other category.current year, which increased $0.4 million, or 8.9%, from $4.5 million in fiscal year 2022. The increase in commerce cost of revenues was attributable to the continued growth of the Elastic Suite e-commerce business.
45
Selling, General and Administrative Expenses
During the year ended December 31, 2020,2023, selling, general and administrative expenses for the All Other category of $13.3$29.4 million increaseddecreased by $3.9$4.8 million, or 29.1%14.0%, from $10.3$34.2 million for the year ended December 31, 2019.2022. The increasedecrease in selling, general and administrative expense was primarily comprised of $4.5 million in incremental expense related to the 2019 acquisition of G3, offsetdriven by savings comprised of lower promotional expenses related to the cancelled events, lower compensationsalary and employee-related costs due to a combination of permanent staff reductionsbenefits, contractual labor and furloughs, and lower travel.consulting expenses.
Depreciation and Amortization Expense
Depreciation and amortization expense for the All Other category of $7.4$7.2 million for the year ended December 31, 20202023 increased $3.9$2.9 million, or 111.4%67.4%, from $3.5$4.3 million for the year ended December 31, 2019.2022. The increase was attributabledue to higher long-lived intangible asset amortization of software development costs related to the G3 acquisition.our commerce business.
Goodwill Impairments
During 2020, we2022, the Company recorded $30.2 million in non-cash goodwill impairment chargesimpairments of $0.3 million in connection with reporting units under the All Other category in relation to our interim andits annual impairment assessments.assessment. Refer to the consolidated goodwill impairment discussion under the heading, Goodwill ImpairmentImpairments, above in this Management’s Discussion and Analysis of Financial Condition and Results of Operations for further discussion on goodwill impairment.
We recorded a $2.8 million non-cash charge in connection with our annual goodwill impairment assessment that was related to reporting units under the All Corporate
|
| Year Ended December 31, |
|
|
|
|
|
|
| |||||||
|
| 2023 |
|
| 2022 |
|
| Variance $ |
|
| Variance % |
| ||||
|
| (dollars in millions) |
| |||||||||||||
Other income, net |
| $ | — |
|
| $ | 148.6 |
|
| $ | (148.6 | ) |
| NM |
| |
Selling, general and administrative expenses |
|
| 59.5 |
|
|
| 33.6 |
|
|
| 25.9 |
|
|
| 77.1 | % |
Depreciation and amortization expense |
|
| 3.0 |
|
|
| 4.5 |
|
|
| (1.5 | ) |
|
| (33.3 | )% |
Operating (loss) income |
| $ | (62.5 | ) |
| $ | 110.5 |
|
| $ | (173.0 | ) |
| NM |
| |
Other category in 2019. In addition, during the third quarter of 2019, we recognized a non-cash goodwill impairment charge of $0.4 million, related to reporting units under the All Other category, as a result of a triggering event caused by reduced performance expectations for the year.
Intangible Asset Impairments
In connection with the triggering event in the first quarter of 2020 described above, we performed impairment assessments of long-lived assets and indefinite-lived assets and recorded non-cash impairment charges related to
long-lived assets and indefinite-lived intangible assets under the All Other category of $0.8 million and $5.2 million, respectively.Income, net
In connection with the triggering event described above, we performed impairment assessments of long-lived assets and indefinite-lived intangible assets during the third quarter of 2019, and recognized non-cash impairment charges related to indefinite-lived trade name intangible assets, long-lived trade name and customer relationship intangible assets under the All Other category of $0.6 million and $7.8 million, respectively.
Corporate
|
| Year Ended December 31, |
|
|
|
|
|
|
|
|
| |||||
|
| 2020 |
|
| 2019 |
|
| Variance $ |
|
| Variance % |
| ||||
|
| (dollars in millions) |
| |||||||||||||
|
|
|
|
|
|
|
|
|
|
|
|
|
|
|
|
|
Selling, general and administrative expenses |
| $ | 54.5 |
|
| $ | 55.6 |
|
| $ | (1.1 | ) |
|
| (2.0 | )% |
Depreciation and amortization expense |
|
| 2.9 |
|
|
| 2.5 |
|
|
| 0.4 |
|
|
| 16.0 | % |
Total operating expenses |
| $ | 57.4 |
|
| $ | 58.1 |
|
| $ | (0.7 | ) |
|
| (1.2 | )% |
Selling, General and Administrative Expenses
During the year ended December 31, 2020,2022, other income, net for the Corporate category was $148.6 million and was related to a one-time insurance litigation settlement. The one-time settlement payment was not specifically attributable to any of our outstanding event cancellation insurance claims and therefore was not recorded at the segment level.
Selling, General and Administrative Expenses
During the year ended December 31, 2023, selling, general and administrative expenses of $54.5$59.5 million for corporate-level activity decreasedthe Corporate category increased by $1.1$25.9 million, or 2.0%77.1%, from $55.6$33.6 million for the year ended December 31, 2019. 2022. The increase in selling, general and administrative expense was primarily driven by the impact in the current year of $33.3 million in prior year non-cash gains related to the remeasurement of contingent consideration liabilities, partially offset by a decrease of $7.9 million relating to insurance litigation settlement expenses incurred in fiscal year 2022.
Depreciation and Amortization Expense
Depreciation and amortization expense relating to corporate-level activitythe Corporate category of $2.9$3.0 million for the year ended December 31, 2020 increased 0.42023 decreased $1.5 million, or 16%33.3%, from $2.5$4.5 million for the year ended December 31, 2019.2022. The decrease was related to lower loss on disposal of fixed assets related to office closures which occurred in fiscal year 2022.
Interest Expense; Benefit fromInterest Income; Loss on Extinguishment of Debt; Provision for Income Taxes; Net Loss;(Loss) Income and Comprehensive (Loss) Income; Adjusted EBITDA; Adjusted Net IncomeEBITDA
46
Interest Expense
Interest expense of $20.6$43.3 million for the year ended December 31, 2020 decreased $9.72023 increased $18.8 million, or 32%76.7%, from $30.3$24.5 million for the year ended December 31, 2019.2022. The decreaseincrease was primarily attributable to a decreasean increase in the variable interest rate on the term loan portion of our Amended and Restated Senior Secured Credit Facilities (as amended by the Term Loan Facility,Amendment), for which the average rate during 20202023 was 3.28%8.98%, compared to 5.02%4.26% during 2019, and a $0.2 million decrease in interest expense related to borrowings under the Amended and Restated Revolving Credit Facility.2022.
Benefit fromInterest Income Taxes
For the years ended December 31, 2020 and 2019, we recorded a benefit fromInterest income taxes of $57.6 million and $5.0 million, respectively. The increase in our benefit from income taxes of $52.6$8.2 million for the year ended December 31, 20202023 increased $5.5 million, from $2.7 million for the year ended December 31, 2022. The increase was primarily attributable to an increase in our cash balance due to the receipt of event cancellation insurance claim and insurance litigation settlement proceeds at the end of 2022 as well as rising interest rates throughout fiscal year 2023.
Loss on Extinguishment of Debt
Loss on extinguishment of debt of $2.3 million was recognized during the year ended December 31, 2023 as a result of the Term Loan Amendment on June 12, 2023. The loss on extinguishment of debt was comprised of $2.1 million of original issuance discount (“OID”) related to the Extended Term Loan Facility and $0.2 million of previously capitalized OID and debt issuance costs, allocated to lenders in the syndicate whose balances were extinguished in conjunction with the Term Loan Amendment.
Provision for Income Taxes
For the years ended December 31, 2023 and 2022, we recorded a provision for income taxes of $5.3 million and $27.2 million, respectively. The decrease in our provision for income taxes of $21.9 million for the year ended December 31, 2023 compared to the prior year was primarily attributable to the impact of goodwill impairmentslower other income, net from event cancellation insurance claim and operating losses incurred as a result of the COVID-19 pandemic.insurance litigation settlement proceeds during 2023, partially offset by higher income generated by our operations.
Net Loss(Loss) Income and Comprehensive (Loss) Income
Net loss and comprehensive loss of $633.6$8.2 million for the year ended December 31, 2020 increased $583.62023 decreased $139.0 million from net lossincome and comprehensive income of $50.0$130.8 million for the year ended December 31, 2019.2022. The key drivers of the increasedecrease were lower other income, net related to event cancellation insurance claim and insurance litigation settlement proceeds and higher interest expense, net, offset in net loss werepart by higher revenues as a result of the increases in non-cashcontinued recovery from the COVID-19 pandemic and business acquisitions, lower provision for income taxes, lower depreciation and amortization expense and the absence of any goodwill and intangible asset impairment charges and lower revenue, partly offset by increases in other income, lower operating costs, decreased corporate overhead, lower depreciation and amortization costs, decreased interest costs and higher benefits from income taxes described above.during 2023.
Adjusted EBITDA
Total Adjusted EBITDA of $71.9$97.8 million for the year ended December 31, 20202023 decreased $55.9$141.8 million, or 43.7%59.2%, from $127.8$239.6 million for the year ended December 31, 2019.2022. The decrease in Adjusted EBITDA was primarily attributable to lower other income, net related to the $583.6 million increasedecrease in net loss described above, an increase in the deduction for benefits from income taxes of $52.6 millionevent cancellation insurance claim and decreases in addbacks of $9.7 million for interest expense and $3.4 million for depreciation and amortization. These decreases wereinsurance litigation settlement proceeds received during 2023, partially offset by benefitsthe increased profits generated from our legacy business as it continues to recover from the increase in combined non-cash goodwillimpacts of the COVID-19 pandemic and intangible asset impairment charges addback of $594.1 million.profits generated by our recent acquisitions.
Adjusted EBITDA is a financial measure that is not calculated in accordance with GAAP. For a discussion of our presentation of Adjusted EBITDA, see footnoteFootnote 4 to the table under the heading “Results of Operations - Operations—Comparison of the Year Ended December 31, 20202023 to the Year Ended December 31, 2019”2022”.
Adjusted Net Income47
Adjusted Net Income for the year ended December 31, 2020
Results of $40.4 million decreased $26.9 million, or 40.0%, from $67.3 million for the year ended December 31, 2019. The drivers of the decrease in Adjusted Net Income were the same as those for the decrease in Adjusted EBITDA. In addition, Adjusted Net Income declined as a result of the absence of add-backs for interest and depreciation and amortization expenses. Adjusted Net Income benefited from a $15.7 million increase in the tax effect of non-GAAP adjustments versus the prior year.
Adjusted Net Income is a financial measure that is not calculated in accordance with GAAP. For a discussion of our presentation of Adjusted Net Income, see footnote 5 to the table under the heading “Results of Operations - Comparison of the Year Ended December 31, 2020 to the Year Ended December 31, 2019.”
Comparison of the Year Ended December 31, 20192022 to the Year Ended December 31, 20182021
The tables in this section summarize key components of our results of operations for the periods indicated.
|
| Year Ended December 31, |
|
|
|
|
|
|
| |||||||
|
| 2022 |
|
| 2021 |
|
| Variance $ |
|
| Variance % |
| ||||
|
| (dollars in millions) |
| |||||||||||||
Statement of income (loss) and comprehensive |
|
|
|
|
|
|
|
|
|
|
|
| ||||
Revenues |
| $ | 325.9 |
|
| $ | 145.5 |
|
| $ | 180.4 |
|
|
| 124.0 | % |
Other income |
|
| 182.8 |
|
|
| 77.4 |
|
|
| 105.4 |
|
|
| 136.2 | % |
Cost of revenues |
|
| 116.5 |
|
|
| 57.1 |
|
|
| 59.4 |
|
|
| 104.0 | % |
Selling, general and administrative expenses(1) |
|
| 145.0 |
|
|
| 143.0 |
|
|
| 2.0 |
|
|
| 1.4 | % |
Depreciation and amortization expense |
|
| 59.5 |
|
|
| 47.6 |
|
|
| 11.9 |
|
|
| 25.0 | % |
Goodwill impairments(2) |
|
| 6.3 |
|
|
| 7.2 |
|
|
| (0.9 | ) |
|
| (12.5 | )% |
Intangible asset impairments(3) |
|
| 1.6 |
|
|
| 32.7 |
|
|
| (31.1 | ) |
|
| (95.1 | )% |
Operating income (loss) |
|
| 179.8 |
|
|
| (64.7 | ) |
|
| 244.5 |
|
| NM |
| |
Interest expense |
|
| 24.5 |
|
|
| 15.9 |
|
|
| 8.6 |
|
|
| 54.1 | % |
Interest income |
|
| 2.7 |
|
|
| 0.1 |
|
|
| 2.6 |
|
|
| 2600.0 | % |
Other expense |
|
| — |
|
|
| 0.1 |
|
|
| (0.1 | ) |
|
| (100.0 | )% |
Loss on disposal of fixed assets |
|
| — |
|
|
| 0.4 |
|
|
| (0.4 | ) |
| NM |
| |
Income (loss) before income taxes |
|
| 158.0 |
|
|
| (81.0 | ) |
|
| 239.0 |
|
|
| (295.1 | )% |
Provision for (benefit from) income taxes |
|
| 27.2 |
|
|
| (1.3 | ) |
|
| 28.5 |
|
|
| (2192.3 | )% |
Net income (loss) and comprehensive income (loss) |
| $ | 130.8 |
|
| $ | (79.7 | ) |
| $ | 210.5 |
|
|
| (264.1 | )% |
|
|
|
|
|
|
|
|
|
|
|
| |||||
Other financial data (unaudited): |
|
|
|
|
|
|
|
|
|
|
|
| ||||
Adjusted EBITDA(4) |
| $ | 239.6 |
|
| $ | 44.1 |
|
| $ | 195.5 |
|
|
| 443.3 | % |
Free Cash Flow(5) |
| $ | 164.8 |
|
| $ | 83.4 |
|
| $ | 81.4 |
|
| NM |
| |
Organic Revenue (6) |
| $ | 205.1 |
|
| $ | 145.5 |
|
| $ | 59.6 |
|
|
| 41.0 | % |
48
|
| Year Ended December 31, |
| |||||
|
| 2022 |
|
| 2021 |
| ||
|
| (unaudited) |
| |||||
|
| (dollars in millions) |
| |||||
Net income (loss) |
| $ | 130.8 |
|
| $ | (79.7 | ) |
Add (Deduct): |
|
|
|
|
|
| ||
Interest expense, net |
|
| 21.8 |
|
|
| 15.8 |
|
Provision for (benefit from) income taxes |
|
| 27.2 |
|
|
| (1.3 | ) |
Goodwill impairments(a) |
|
| 6.3 |
|
|
| 7.2 |
|
Intangible asset impairment(b) |
|
| 1.6 |
|
|
| 32.7 |
|
Depreciation and amortization expense |
|
| 59.5 |
|
|
| 47.6 |
|
Stock-based compensation expense(c) |
|
| 5.8 |
|
|
| 10.4 |
|
Deferred revenue adjustment(d) |
|
| 0.6 |
|
|
| 2.0 |
|
Other items(e) |
|
| (14.0 | ) |
|
| 9.4 |
|
Adjusted EBITDA |
| $ | 239.6 |
|
| $ | 44.1 |
|
Deduct: |
|
|
|
|
|
| ||
Event cancellation insurance proceeds |
|
| 182.8 |
|
|
| 77.4 |
|
Adjusted EBITDA excluding event cancellation insurance proceeds |
| $ | 56.8 |
|
| $ | (33.3 | ) |
|
| Year Ended December 31, |
|
|
|
|
|
|
|
|
| |||||
|
| 2019 |
|
| 2018 |
|
| Variance $ |
|
| Variance % |
| ||||
|
| (dollars in millions) |
| |||||||||||||
Statement of (loss) income and comprehensive (loss) income data: |
|
|
|
|
|
|
|
|
|
|
|
|
|
|
|
|
Revenues |
| $ | 360.9 |
|
| $ | 380.7 |
|
| $ | (19.8 | ) |
|
| (5.2 | %) |
Other income |
|
| 6.1 |
|
|
| — |
|
|
| 6.1 |
|
| NM |
| |
Cost of revenues |
|
| 120.2 |
|
|
| 112.1 |
|
|
| 8.1 |
|
|
| 7.2 | % |
Selling, general and administrative expenses(1) |
|
| 133.4 |
|
|
| 121.8 |
|
|
| 11.6 |
|
|
| 9.5 | % |
Depreciation and amortization expense |
|
| 52.0 |
|
|
| 46.8 |
|
|
| 5.2 |
|
|
| 11.1 | % |
Goodwill impairments(2) |
|
| 69.1 |
|
|
| — |
|
|
| 69.1 |
|
| NM |
| |
Intangible asset impairments(3) |
|
| 17.0 |
|
|
| 104.3 |
|
|
| (87.3 | ) |
| NM |
| |
Operating loss |
|
| (24.7 | ) |
|
| (4.3 | ) |
|
| (20.4 | ) |
|
| 474.4 | % |
Interest expense |
|
| 30.3 |
|
|
| 29.1 |
|
|
| 1.2 |
|
|
| 4.1 | % |
Loss before income taxes |
|
| (55.0 | ) |
|
| (33.4 | ) |
|
| (21.6 | ) |
|
| 4.7 |
|
Benefit from income taxes |
|
| (5.0 | ) |
|
| (8.3 | ) |
|
| 3.3 |
|
|
| (39.8 | %) |
Net loss and comprehensive loss |
| $ | (50.0 | ) |
| $ | (25.1 | ) |
| $ | (24.9 | ) |
|
| 99.2 | % |
|
|
|
|
|
|
|
|
|
|
|
|
|
|
|
|
|
Other financial data (unaudited): |
|
|
|
|
|
|
|
|
|
|
|
|
|
|
|
|
Adjusted EBITDA(2) |
| $ | 162.9 |
|
| $ | 157.9 |
|
| $ | 5.0 |
|
|
| 3.2 | % |
Adjusted Net Income(3) |
| $ | 100.2 |
|
| $ | 80.3 |
|
| $ | 19.9 |
|
|
| 24.8 | % |
Free Cash Flow(4) |
| $ | 100.4 |
|
| $ | 107.8 |
|
| $ | (7.4 | ) |
|
| (6.9 | )% |
49
|
| Year Ended December 31, |
| |||||
|
| 2022 |
|
| 2021 |
| ||
|
| (unaudited) |
| |||||
|
| (dollars in millions) |
| |||||
Net Cash Provided by Operating Activities |
| $ | 175.1 |
|
| $ | 90.0 |
|
Less: |
|
|
|
|
|
| ||
Capital expenditures |
|
| 10.3 |
|
|
| 6.6 |
|
Free Cash Flow |
| $ | 164.8 |
|
| $ | 83.4 |
|
|
|
|
|
|
|
|
|
|
| Year Ended December 31, |
|
| |||||
|
| 2019 |
|
| 2018 |
|
| ||
|
| (unaudited) |
|
| |||||
|
| (dollars in millions) |
|
| |||||
Net loss |
| $ | (50.0 | ) |
| $ | (25.1 | ) |
|
Add (Deduct): |
|
|
|
|
|
|
|
|
|
Interest expense |
|
| 30.3 |
|
|
| 29.1 |
|
|
Benefit from income taxes |
|
| (5.0 | ) |
|
| (8.3 | ) |
|
Goodwill impairments(a) |
|
| 69.1 |
|
|
| — |
|
|
Intangible asset impairment(b) |
|
| 17.0 |
|
|
| 104.3 |
|
|
Depreciation and amortization expense |
|
| 52.0 |
|
|
| 46.8 |
|
|
Stock-based compensation expense(c) |
|
| 7.7 |
|
|
| 6.1 |
|
|
Deferred revenue adjustment(d) |
|
| 0.3 |
|
|
| 0.8 |
|
|
Other items(e) |
|
| 6.4 |
|
|
| 9.2 |
|
|
Adjusted EBITDA |
| $ | 127.8 |
|
| $ | 162.9 |
|
|
|
|
|
|
|
|
|
|
|
|
|
|
|
| Year ended December 31 |
| |||||
|
| 2019 |
|
| 2018 |
| ||
|
| (unaudited) |
| |||||
|
| (dollars in millions) |
| |||||
Net loss |
| $ | (50.0 | ) |
| $ | (25.1 | ) |
Add (Deduct): |
|
|
|
|
|
|
|
|
Stock-based compensation expense(a) |
|
| 7.7 |
|
|
| 6.1 |
|
Deferred revenue adjustment(b) |
|
| 0.3 |
|
|
| 0.8 |
|
Goodwill impairments(c) |
|
| 69.1 |
|
|
| — |
|
Intangible asset impairment(d) |
|
| 17.0 |
|
|
| 104.3 |
|
Other items(e) |
|
| 6.4 |
|
|
| 9.2 |
|
Amortization of deferred financing fees and discount |
|
| 1.4 |
|
|
| 1.7 |
|
Amortization of acquired intangible assets(f) |
|
| 49.6 |
|
|
| 44.6 |
|
Tax adjustments related to non-GAAP adjustments(g) |
|
| (34.2 | ) |
|
| (41.4 | ) |
Adjusted Net Income |
| $ | 67.3 |
|
| $ | 100.2 |
|
|
|
|
|
|
|
|
|
|
|
|
|
|
|
|
|
|
| Year Ended December 31, |
| |||||
|
| 2019 |
|
| 2018 |
| ||
|
| (unaudited) |
| |||||
|
| (dollars in millions) |
| |||||
Net Cash Provided by Operating Activities |
| $ | 67.8 |
|
| $ | 103.9 |
|
Less: |
|
|
|
|
|
|
|
|
Capital expenditures |
|
| 3.9 |
|
|
| 3.5 |
|
Free Cash Flow |
| $ | 63.9 |
|
| $ | 100.4 |
|
Organic revenue is a supplemental non-GAAP financial measure thatof performance and is not calculatedbased on any standardized methodology prescribed by GAAP. Organic revenue should not be considered in isolation or as an alternative to revenues or other measures determined in accordance with GAAP. For a discussion of our presentation ofAlso, Organic revenue see footnote 6is not necessarily comparable to similarly titled measures used by other companies.
|
| Year |
|
| Change |
| ||||||||||
|
| 2022 |
|
| 2021 |
|
| $ |
|
| % |
| ||||
|
| (unaudited) |
| |||||||||||||
|
| (dollars in millions) |
| |||||||||||||
Revenues |
| $ | 325.9 |
|
| $ | 145.5 |
|
| $ | 180.4 |
|
|
| 124.0 | % |
Add (deduct): |
|
|
|
|
|
|
|
|
|
|
|
| ||||
Acquisition revenues |
|
| (44.8 | ) |
|
| — |
|
|
|
|
|
|
| ||
COVID-19 cancellations(1) |
|
| (76.0 | ) |
|
| — |
|
|
|
|
|
|
| ||
Organic revenues |
| $ | 205.1 |
|
| $ | 145.5 |
|
| $ | 59.6 |
|
|
| 41.0 | % |
Revenues
|
| Year Ended December 31, |
| Change |
| ||||||||
|
| 2019 |
| 2018 |
| $ |
| % |
| ||||
|
| (unaudited) (dollars in millions) |
| ||||||||||
Revenues |
| $ | 360.9 |
| $ | 380.7 |
| $ | (19.8 | ) |
| (5.2 | %) |
Add (deduct): |
|
|
|
|
|
|
|
|
|
|
|
|
|
Acquisition revenues |
|
| (10.2 | ) |
| - |
|
|
|
|
|
|
|
Other(1) |
|
| 7.1 |
|
| - |
|
|
|
|
|
|
|
Discontinued events |
|
| - |
|
| (11.7 | ) |
|
|
|
|
|
|
Organic revenues |
| $ | 357.8 |
| $ | 369.0 |
| $ | (11.2 | ) |
| (3.0 | %) |
|
|
Revenues
Total revenues of $360.9$325.9 million for the year ended December 31, 2019 decreased $19.82022 increased $180.4 million, or 5.2%124.0%, from $380.7$145.5 million for the year ended December 31, 2018.2021. See “Commerce Segment – Revenues,” “Design and Technology“Connections Segment – Revenues,” and “All Other Category – Revenues” below for a discussion of the factors contributing to the changes in total revenuesrevenues.
Other Income, net
Total other income, net of $182.8 million for fiscal 2022 increased by $105.4 million, from $77.4 million for fiscal 2021. See “Connections Segment – Other Income, net”, “All Other Category – Other Income, net” and “Corporate – Other Income, net” below for a discussion of the factors contributing to the changes in total other income, net.
50
Cost of Revenues
Total cost of revenues of $120.2$116.5 million for fiscal 20192022 increased by 7.2%$59.4 million, or 104.0%, or $8.1 million, from $112.1$57.1 million for fiscal 2018.2021. See “Commerce“Connections Segment – Cost of Revenues,” “Design and Technology Segment – Cost of Revenues” and “All Other Category – Cost of Revenues” below for a discussion of the factors contributing to the changes in total cost of revenues.revenues.
Selling, General and Administrative Expenses
Total selling, general and administrative expenses consist primarily of compensation and employee-related costs, sales commissions and incentive plans, stock-based compensation expense, marketing expenses, information technology expenses, travel expenses, facilities costs, consulting fees and public reporting costs. Total selling, general and administrative expenses of $133.4$145.0 million for the year ended December 31, 20192022 increased $11.6$2.0 million, or 9.5%1.4%, from $121.8$143.0 million for the year ended December 31, 2018.2021. See “Commerce Segment – Selling, General and Administrative Expenses”, “Design and Technology“Connections Segment – Selling, General and Administrative Expenses”, “All Other category – Selling, General and Administrative Expenses” and “Corporate - “Corporate—Selling, General and Administrative Expenses” below for a discussion of the factors contributing to the changes in total selling, general and administrative expenses.expenses.
Depreciation and Amortization Expense
Total depreciation and amortization expense of $52.0$59.5 million for the year ended December 31, 20192022 increased $5.2$11.9 million, or 11.1%25.0%, from $46.8$47.6 million for the year ended December 31, 2018.2021. See “Commerce Segment – Depreciation and Amortization Expense,” “Design and Technology“Connections Segment – Depreciation and Amortization Expense,” “All Other Category – Depreciation and Amortization Expense” and “Corporate – Depreciation and Amortization Expense” below for a discussion of the factors contributing to the changes in total depreciation and amortization expense.expense.
Goodwill Impairments
In connection withAs a result of the re-evaluation ofchanges in our operating segments and reporting units due to changes in our internal financial reporting structure, managementthe first quarter of 2022, we performed the annuala goodwill impairment assessment and recorded a $59.8$6.3 million non-cash charge related to the impairment of goodwill. The impairment consistedgoodwill as of the write-down of goodwill, equal to the excess carrying value of goodwill above fair value, of one or more reporting units included in our Commerce and Design and Technology segments and the All Other category. In addition, during the third quarter of 2019, we recognized a non-cash goodwill impairment charge of $9.3 million, asJanuary 31, 2022.
As a result of our annual goodwill impairment assessment, management recorded a triggering event caused by reduced performance expectations in$7.2 million non-cash charge related to the current year. See “Commerce Segment – Goodwill Impairments,” “Design and Technology Segment – Goodwill Impairments” and “All Other Category—Goodwill Impairments” below for further discussionimpairment of goodwill impairments. as of October 31, 2021.
Intangible Asset Impairments
Due toAs a result of the triggering event described above, management performedidentification of an interim impairment assessmentstrigger for one of our long-lived assets andits indefinite-lived intangible assets during the thirdfirst quarter of 2019. These assessments resulted in2022, the recognitionCompany performed an impairment assessment and recorded a $1.6 million non-cash charge related to the impairment of an indefinite-lived trade name asset as of January 31, 2022.
As a result of our annual impairment assessment as of October 31, 2021, we recorded a non-cash impairment charge of $17.0$32.7 million, which included non-cash impairment charges of $21.0 million and $11.7 million for certain of our customer relationship intangible assets and definite-lived trade name intangible assets of $8.7 millionnames, and $8.3 million,certain indefinite-lived trade names, respectively.
51
Connections Segment
|
| Year Ended December 31, |
|
|
|
|
|
|
| |||||||
|
| 2022 |
|
| 2021 |
|
| Variance $ |
|
| Variance % |
| ||||
|
| (dollars in millions) |
| |||||||||||||
Revenues |
| $ | 282.6 |
|
| $ | 106.7 |
|
| $ | 175.9 |
|
|
| 164.9 | % |
Other income |
|
| 34.2 |
|
|
| 77.4 |
|
|
| (43.2 | ) |
|
| (55.8 | )% |
Cost of revenues |
|
| 106.9 |
|
|
| 51.2 |
|
|
| 55.7 |
|
|
| 108.8 | % |
Selling, general and administrative expenses |
|
| 77.2 |
|
|
| 53.0 |
|
|
| 24.2 |
|
|
| 45.7 | % |
Depreciation and amortization expense |
|
| 50.7 |
|
|
| 42.2 |
|
|
| 8.5 |
|
|
| 20.1 | % |
Goodwill impairments |
|
| 6.0 |
|
|
| 7.0 |
|
|
| (1.0 | ) |
|
| (14.3 | )% |
Intangible asset impairments |
|
| 1.6 |
|
|
| 32.7 |
|
|
| (31.1 | ) |
|
| (95.1 | )% |
Operating income (loss) |
| $ | 74.4 |
|
| $ | (2.0 | ) |
| $ | 76.4 |
|
| NM |
| |
Revenues
During the year ended December 31, 2018, we recorded a $104.3 million non-cash impairment charge related to certain of its trade names and customer relationship intangible assets. The impairment charge was due to a decline in fair value compared to the carrying value of the respective trade names and customer relationship intangible assets, which were driven by changes in forecasted revenues and gross profits and minor adjustments to the valuation assumptions around future royalty and discount rates. See “Commerce Segment – Intangible Asset Impairments”, “Design and Technology Segment – Intangible Asset Impairments” and “All Other Category –Intangible Asset Impairments” below for further discussion of total intangible asset impairments.
Commerce Segment
|
| Year Ended December 31, |
|
|
|
|
|
|
|
|
| |||||
|
| 2019 |
|
| 2018 |
|
| Variance $ |
|
| Variance % |
| ||||
|
| (dollars in millions) |
| |||||||||||||
|
|
|
|
|
|
|
|
|
|
|
|
|
|
|
|
|
Revenues |
| $ | 184.7 |
|
| $ | 215.9 |
|
| $ | (31.2 | ) |
|
| (14.5 | )% |
Other income |
|
| 6.1 |
|
|
| — |
|
|
| 6.1 |
|
| NM |
| |
Cost of revenues |
|
| 49.4 |
|
|
| 49.9 |
|
|
| (0.5 | ) |
|
| (1.0 | )% |
Selling, general and administrative expenses |
|
| 37.2 |
|
|
| 37.7 |
|
|
| (0.5 | ) |
|
| (1.3 | )% |
Depreciation and amortization expense |
|
| 26.9 |
|
|
| 25.1 |
|
|
| 1.8 |
|
|
| 7.2 | % |
Goodwill impairments |
|
| 41.9 |
|
|
| — |
|
|
| 41.9 |
|
| NM |
| |
Intangible asset impairments |
|
| 0.7 |
|
|
| 58.4 |
|
|
| (57.7 | ) |
| NM |
| |
Operating income |
| $ | 28.6 |
|
| $ | 44.8 |
|
| $ | (16.2 | ) |
|
| (36.2 | )% |
Revenues
During the year ended December 31, 2019,2022, revenues for the CommerceConnections segment of $184.7$282.6 million decreasedincreased by $31.2$175.9 million, or 14.5%164.9% from $215.9$106.7 million for the year ended December 31, 2018.2021. The decreaseprimary driver of the increase was related$76.0 million from events that staged in 2022 but were cancelled in 2021 due to discontinued events of $11.0 million, which were primarily driven by the decision to cancel the 2019 Outdoor Retailer Winter Market and combine it with the January 2020 Outdoor Retailer Snow Show, as well as the decision not to stage Interbike 2019.COVID-19. In addition, Commercerecurring revenues declinedincreased by $7.1$51.7 million, as a result of the cancellation of Surf Expo and ISS Orlando dueor 50.2%, from $102.9 million in fiscal year 2021 to Hurricane Dorian. We recorded the $6.1$154.6 million cancellation insurance settlement related to these events as Other income in the Commerce segmentfiscal year 2022 and new launches generated revenues of $6.6 million. New acquisitions generated incremental revenues of $41.6 million during the year. The remaining $13.1 million decline was primarily attributable to organic decreases which were driven by a 7.8% year-over-year decline in net square footage of exhibit space (“NSF”) sold, which was slightly offset by a 1.8% increase in yield.fiscal year 2022.
Other Income
During the third quarter of 2019, as a result of Hurricane Dorian, our Surf Expo and Impressions Expo Orlando (“ISS Orlando”) shows were forced to be cancelled. Emerald carries cancellation insurance to mitigate losses caused by natural disasters and received a settlement of $6.1 million to offset the lost revenues from the affected trade shows. As a result, Other income of $6.1$34.2 million attributable to the Commerce segment was recorded infor the consolidated statements of loss and comprehensive loss forConnections segment related to event cancellation insurance proceeds during the year ended December 31, 20192022. All $34.2 million was received during 2022.
Other income of $77.4 million was recorded for the Connections segment related to recognizeevent cancellation insurance proceeds during the amount recovered from the insurance company. We also maintained supplemental insurance to mitigate the losses of our exhibitors for out-of-pocket expenses incurred in connection with the cancelled shows. Weyear ended December 31, 2021. All $57.5 million was received $10.1 million under this policy which was fully paid to participating exhibitors during 2019. 2021.
Cost of Revenues
During the year ended December 31, 2019,2022, cost of revenues of $49.4 million for the CommerceConnections reportable segment decreased by $0.5increased $55.7 million, or 1.0%108.8%, to $106.9 million from $49.9$51.2 million for the year ended December 31, 2018.2021. The decreaseprimary driver of the increase was relatedcost of revenues of $23.8 million from events that staged in 2022 but were cancelled in 2021 due to savings on discontinued eventsCOVID-19. In addition, recurring cost of $3.1revenues increased by $12.5 million, as well as $1.0or 27.8%, from $44.9 million in savings relatedfiscal year 2021 to the cancellation$57.4 million in fiscal year 2022 and new launches generated cost of Surf Expo and ISS Orlando. These declines were partially offset byrevenues of $4.8 million. New acquisitions generated incremental costscost of our 2019 show-improvement initiatives, which were focused on severalrevenues of our largest brands within the Commerce segment.$14.6 million during fiscal year 2022.
Selling, General and Administrative Expenses
During the year ended December 31, 2019,2022 selling, general and administrative expenses of $37.2for the Connections reportable segment increased $24.2 million, or 45.7%, to $77.2 million from $53.0 million for 2021. The increase was primarily related to higher compensation, benefits, travel and promotional expense attributable to resuming a full schedule of events in 2022 and higher sales commissions and credit card fees related to higher revenues.
Depreciation and Amortization Expense
Depreciation and amortization expense attributable to the CommerceConnections segment decreased by $0.5 million or 1.3% from $37.7of $50.7 million for the year ended December 31, 2018.
Depreciation and Amortization Expense
Depreciation and amortization expense attributable to the Commerce segment of $26.92022 increased $8.5 million, or 20.1%, from $42.2 million for the year ended December 31, 20192021. The increase was due to higher amortization on the definite-lived trade name and customer relationship intangible assets associated with the MJBiz and Advertising Week acquisitions.
52
Goodwill Impairments
During the first quarter of 2022, we recorded non-cash goodwill impairment charges of $6.0 million in connection with reporting units under the Connections segment in relation to our interim impairment assessment.
In connection with our 2021 annual impairment assessment, we recorded a $7.0 million non-cash goodwill impairment charge related to reporting units under the Connections segment.
Refer to the consolidated goodwill impairment discussion under the heading, Goodwill Impairments, above in this Management’s Discussion and Analysis of Financial Condition and Results of Operations for further discussion on goodwill impairment.
Intangible Asset Impairments
In connection with our 2022 interim impairment assessment, we recorded a non-cash impairment charge of $1.6 million for intangible assets related to the Connections segment.
In connection with our 2021 annual impairment assessment, we recorded a non-cash impairment charge of $32.7 million for intangible assets related to the Connections segment.
All Other Category
|
| Year Ended December 31, |
|
|
|
|
|
|
| |||||||
|
| 2022 |
|
| 2021 |
|
| Variance $ |
|
| Variance % |
| ||||
|
| (dollars in millions) |
| |||||||||||||
Revenues |
| $ | 43.3 |
|
| $ | 38.8 |
|
| $ | 4.5 |
|
|
| 11.6 | % |
Cost of revenues |
|
| 9.6 |
|
|
| 5.9 |
|
|
| 3.7 |
|
|
| 62.7 | % |
Selling, general and administrative expenses |
|
| 34.2 |
|
|
| 28.4 |
|
|
| 5.8 |
|
|
| 20.4 | % |
Depreciation and amortization expense |
|
| 4.3 |
|
|
| 3.1 |
|
|
| 1.2 |
|
|
| 38.7 | % |
Goodwill impairments |
|
| 0.3 |
|
|
| 0.2 |
|
|
| 0.1 |
|
| NM |
| |
Operating (loss) income |
| $ | (5.1 | ) |
| $ | 1.2 |
|
| $ | (6.3 | ) |
| NM |
| |
Revenues
During the year ended December 31, 2022, revenues for the All Other category of $43.3 million increased $1.8by $4.5 million, or 7.2%11.6%, from $25.1$38.8 million for the year ended December 31, 2018. The increase was due to additional amortization on the trade name intangible assets for which we adjusted the estimated useful life in the fourth quarter of 2018, offset by lower amortization for brands that were fully written off in the prior year.
Goodwill Impairments
We recorded a $36.3 million non-cash charge in connection with our annual goodwill assessment that was2021. Revenues related to reporting units under the Commerce segmentour commerce business of $15.4 million during fiscal year 2022 increased by $4.4 million, or 39.4%, from $11.0 million in connection with the re-evaluation of our internal financial reporting structure during 2019. In addition, during the third quarter of 2019, we recognized a non-cash goodwill impairment charge of $5.6 million, related to reporting units under the Commerce segment,fiscal year 2021, as a result of a triggering event caused by reduced performance expectations for the year.
Intangible Asset Impairments
In connection with the triggering event described above, we performed impairment assessments of long-lived assetsgrowth in our Elastic Suite e-commerce business and indefinite-lived intangible assets during the third quarter of 2019, and recognized a non-cash impairment chargerevenues related to indefinite-lived intangible assets under the Commerce segmentour content business of $0.7 million. $27.9 million during fiscal year 2022 increased by $0.2 million, or 0.7%, from $27.7 million in fiscal year 2021.
Cost of Revenues
During the year ended December 31, 2018, we also recorded a $58.4 million non-cash impairment charge related to certain of our trade names and customer relationship intangible assets under the Commerce segment. The impairment charge was due to a decline in fair value compared to the carrying value of the respective trade names and customer relationship intangible assets, which were driven by changes in forecasted revenues and gross profits and minor adjustments to the valuation assumptions around future royalty and discount rates.
Design and Technology Segment
|
| Year Ended December 31, |
|
|
|
|
|
|
|
|
| |||||
|
| 2019 |
|
| 2018 |
|
| Variance $ |
|
| Variance % |
| ||||
|
| (dollars in millions) |
| |||||||||||||
|
|
|
|
|
|
|
|
|
|
|
|
|
|
|
|
|
Revenues |
| $ | 139.9 |
|
| $ | 127.8 |
|
| $ | 12.1 |
|
|
| 9.5 | % |
Cost of revenues |
|
| 53.9 |
|
|
| 46.8 |
|
|
| 7.1 |
|
|
| 15.2 | % |
Selling, general and administrative expenses |
|
| 30.2 |
|
|
| 25.0 |
|
|
| 5.2 |
|
|
| 20.8 | % |
Depreciation and amortization expense |
|
| 19.2 |
|
|
| 14.9 |
|
|
| 4.3 |
|
|
| 28.9 | % |
Goodwill impairments |
|
| 24.0 |
|
|
| — |
|
|
| 24.0 |
|
| NM |
| |
Intangible asset impairments |
|
| 7.9 |
|
|
| 16.2 |
|
|
| (8.3 | ) |
| NM |
| |
Operating income |
| $ | 4.7 |
|
| $ | 24.9 |
|
| $ | (20.2 | ) |
|
| (81.1 | )% |
Revenues
During the year ended December 31, 2019, revenues for the Design and Technology segment of $139.9 million increased by $12.1 million, or 9.5%, from $127.8 million for the year ended December 31, 2018. The increase was related to incremental revenues of $10.2 million from our 2018 acquisitions of the Technology Brands and BDNY (collectively, the “2018 acquisitions”) and organic growth of $3.9 million which was driven by a 2.8% increase in yield, partially offset by a 1.2% decline in net square feet. These increases were further offset by a $0.6 million decline related to several small discontinued events.
Cost of Revenues
During the year ended December 31, 2019, cost of revenues for the Design and Technology segment of $53.9 million increased by $7.1 million, or 15.2%, from $46.8 million for the year ended December 31, 2018. The increase reflected $4.2 million in incremental expense related to the 2018 acquisitions and $3.5 million related to incremental costs of shows that grew during the year, as well as the additional costs of our 2019 show-improvement initiatives, which focused on several of our largest brands within the Design and Technology segment. These increases were partially offset by $0.6 million in savings related to several small discontinued events.
Selling, General and Administrative Expenses
During the year ended December 31, 2019, selling, general and administrative expenses for the Design and Technology segment of $30.2 million increased by $5.2 million, or 20.8%, from $25.0 million for the year ended December 31, 2018. The increase was primarily comprised of $5.0 million in incremental expense related to the 2018 acquisitions.
Depreciation and Amortization Expense
During the year ended December 31, 2019, depreciation and amortization expense for the Design and Technology segment of $19.2 million increased $4.3 million, or 28.9%, from $14.9 million for the year ended December 31, 2018. The increase was primarily attributable to incremental amortization related to the 2018 acquisitions as well as increased amortization on the trade name intangible assets for which we adjusted the estimated useful life in the fourth quarter of 2018.
Goodwill Impairments
We recorded a $20.8 million non-cash charge in connection with our annual goodwill impairment assessment that was related to reporting units under the Design and Technology segment in connection with the re-evaluation of our internal financial reporting structure during 2019. In addition, during the third quarter of 2019, we recognized a non-cash goodwill impairment charge of $3.2 million, related to reporting units under the Design and Technology segment, as a result of a triggering event caused by reduced performance expectations for the year.
Intangible Asset Impairments
Due to the triggering event described above, we performed impairment assessments of long-lived assets and indefinite-lived intangible assets during the third quarter of 2019, and recognized non-cash impairment charges related to indefinite-lived trade name intangible assets, long-lived trade name and customer relationship intangible assets allocated to the Design and Technology segment of $3.6 million and $4.3 million, respectively. During the year ended December 31, 2018, we recorded a $16.2 million non-cash impairment charge related to certain trade names and customer relationship intangible assets allocated to the Design and Technology segment. The impairment charge was due to a decline in fair value compared to the carrying value of the respective trade names and customer relationship intangible assets, which were driven by changes in forecasted revenues and gross profits and minor adjustments to the valuation assumptions around future royalty and discount rates.
All Other Category
|
| Year Ended December 31, |
|
|
|
|
|
|
|
|
| |||||
|
| 2019 |
|
| 2018 |
|
| Variance $ |
|
| Variance % |
| ||||
|
| (dollars in millions) |
| |||||||||||||
|
|
|
|
|
|
|
|
|
|
|
|
|
|
|
|
|
Revenues |
| $ | 36.3 |
|
| $ | 37.0 |
|
| $ | (0.7 | ) |
|
| (1.9 | %) |
Cost of revenues |
|
| 16.9 |
|
|
| 14.8 |
|
|
| 2.1 |
|
|
| 14.2 | % |
Selling, general and administrative expenses |
|
| 10.3 |
|
|
| 9.6 |
|
|
| 0.7 |
|
|
| 7.3 | % |
Depreciation and amortization expense |
|
| 3.5 |
|
|
| 4.6 |
|
|
| (1.1 | ) |
|
| (23.9 | %) |
Goodwill impairments |
|
| 3.2 |
|
|
| — |
|
|
| 3.2 |
|
| NM |
| |
Intangible asset impairments |
|
| 8.4 |
|
|
| 29.7 |
|
|
| (21.3 | ) |
| NM |
| |
Operating loss |
| $ | (6.0 | ) |
| $ | (21.7 | ) |
| $ | 15.7 |
|
| NM |
| |
Revenues
During the year ended December 31, 2019, revenue attributable to the All Other category of $36.3 million decreased by $0.7 million, or 1.9%, from $37.0 million for the year ended December 31, 2018. The decrease was related to an organic decline of $1.8 million, which was partially offset by incremental revenues of $1.2 million from our 2019 acquisition of G3.
Cost of Revenues
During the year ended December 31, 2019,2022, cost of revenues for the All Other category of $9.6 million increased by $2.1$3.7 million, or 14.2%62.7%, from $14.8$5.9 million for the year ended December 31, 2018. The increase primarily reflected incremental costs2021. Cost of revenues related to our commerce business of $4.5 million during fiscal year 2022 increased by $3.3 million, or 275.0%, from $1.2 million in fiscal year 2021 due to the continued growth of our 2019 show-improvement initiatives.Elastic Suite e-commerce business and cost of revenues related to our content business of $5.1 million during fiscal year 2022 increased by $0.4 million, or 8.5%, from $4.7 million in fiscal year 2021.
Selling, General and Administrative Expenses
During the year ended December 31, 2019,2022, selling, general and administrative expenses for the All Other category of $10.3$34.2 million increased by $0.7$5.8 million, or 7.3%20.4%, from $9.6$28.4 million for the year ended December 31, 2018.2021. The increase was primarily comprised of $0.8 million in incrementalattributable to higher compensation, benefits, travel and consulting expense relatedattributable to the 2019 acquisitioncontinued ramp of G3. our commerce business.
53
Depreciation and Amortization Expense
DepreciationDuring the year ended December 31, 2022, depreciation and amortization expense for the All Other category of $3.5$4.3 million increased $1.2 million, or 38.7%, from $3.1 million for the year ended December 31, 20192021. The increase was due to higher amortization of software development costs related to our commerce business.
Goodwill Impairments
During the year ended December 31, 2022, we recorded $0.3 million in non-cash goodwill impairment charges in connection with reporting units under the All Other category in relation to our interim impairment assessment.
During the year ended December 31, 2021, we recorded $0.2 million in non-cash goodwill impairment charges in connection with reporting units under the All Other category in relation to our annual impairment assessment.
Refer to the consolidated goodwill impairment discussion under the heading, Goodwill Impairment, above in this Management’s Discussion and Analysis of Financial Condition and Results of Operations for further discussion on goodwill impairment.
Corporate
|
| Year Ended December 31, |
|
|
|
|
|
|
| |||||||
|
| 2022 |
|
| 2021 |
|
| Variance $ |
|
| Variance % |
| ||||
|
| (dollars in millions) |
| |||||||||||||
Other income, net |
| $ | 148.6 |
|
| $ | — |
|
| $ | 148.6 |
|
| NM |
| |
Selling, general and administrative expenses |
|
| 33.6 |
|
|
| 61.6 |
|
|
| (28.0 | ) |
|
| (45.5 | )% |
Depreciation and amortization expense |
|
| 4.5 |
|
|
| 2.3 |
|
|
| 2.2 |
|
|
| 95.7 | % |
Operating income (loss) |
| $ | 110.5 |
|
| $ | (63.9 | ) |
| $ | 174.4 |
|
|
| (272.9 | )% |
Other Income, net
During the year ended December 31, 2022, other income, net for the Corporate category was $148.6 million and was related to a one-time insurance litigation settlement. The one-time settlement payment was not specifically attributable to any of our outstanding event cancellation insurance claims and therefore was not recorded at the segment level.
Selling, General and Administrative Expenses
During the year ended December 31, 2022, selling, general and administrative expenses of $33.6 million for corporate-level activity decreased $1.1by $28.0 million, or 23.9%45.5%, from $4.6$61.6 million for the year ended December 31, 2018.2021. The decrease was attributable to lower amortization for brands that were fully written off in the prior year.
Goodwill Impairments
We recorded a $2.8 million non-cash charge in connection with our annual goodwill impairment assessment that was related to reporting units under the All Other category. In addition, during the third quarter of 2019, we recognized a non-cash goodwill impairment charge of $0.4 million, related to reporting units under the All Other category, as a result of a triggering event caused by reduced performance expectations for the year.
Intangible Asset Impairments
Due to the triggering event described above, we performed impairment assessments of long-lived assets and indefinite-lived intangible assets during the third quarter of 2019, and recognized non-cash impairment charges related to indefinite-lived trade name intangible assets, long-lived trade name and customer relationship intangible assets under the All Other category of $0.6 million and $7.8 million, respectively. During the year ended December 31, 2018, we recorded a $29.7 million non-cash impairment charge related to certain trade names and customer relationship intangible assets allocated to the All Other category. The impairment charge was due to a decline in fair value compared to the carrying value of the respective trade names and customer relationship intangible assets, which were driven by changes in forecasted revenues and gross profits and minor adjustments to the valuation assumptions around future royalty and discount rates.
Corporate
|
| Year Ended December 31, |
|
|
|
|
|
|
|
|
| |||||
|
| 2019 |
|
| 2018 |
|
| Variance $ |
|
| Variance % |
| ||||
|
| (dollars in millions) |
| |||||||||||||
|
|
|
|
|
|
|
|
|
|
|
|
|
|
|
|
|
Selling, general and administrative expenses |
| $ | 55.6 |
|
| $ | 49.5 |
|
| $ | 6.1 |
|
|
| 12.3 | % |
Depreciation and amortization expense |
|
| 2.5 |
|
|
| 2.2 |
|
|
| 0.3 |
|
|
| 13.6 | % |
Total operating expenses |
| $ | 58.1 |
|
| $ | 51.7 |
|
| $ | 6.4 |
|
|
| 12.4 | % |
Selling, General and Administrative Expenses
During the year ended December 31, 2019, selling, general and administrative expenses of $55.6 million for corporate-level activity increased by $6.1 million, or 12.3%, from $49.5 million for the year ended December 31, 2018. The increaseexpense was primarily comprised of incremental expensedriven by $33.3 million in non-cash gains related to new senior management costs and incremental investments in 2019 and future events. the remeasurement of contingent consideration liabilities.
Depreciation and Amortization Expense
Depreciation and amortization expense relating to corporate-level activity of $2.5$4.5 million for the year ended December 31, 20192022 increased $0.3$2.2 million, or 13.6%95.7%, from $2.2$2.3 million for the year ended December 31, 2018.2021. The increase was related to loss on disposal of fixed assets related to office closures which occurred in fiscal year 2022.
Interest Expense; Loss on Disposal of Fixed Assets; Benefit from Income Taxes; Net Loss and Comprehensive Loss; Adjusted EBITDA; Adjusted Net IncomeEBITDA
Interest Expense
Interest expense of $30.3$24.5 million for the year ended December 31, 20192022 increased $1.2$8.6 million, or 4.1%54.1%, from $29.1$15.9 million for the year ended December 31, 2018.2021. The increase was primarily attributable to an increase in the
54
variable interest rate on our Amended and Restated Term Loan Facility, for which the average rate during 20192022 was 5.02%4.26%, compared to 4.76%2.60% during 2018, and a $0.5 million increase in interest expense related to borrowings under the Amended and Restated Revolving Credit Facility attributable to higher outstanding indebtedness during 2019.2021.
Benefit fromInterest Income Taxes
For the years ended December 31, 2019 and 2018, we recorded a benefit fromInterest income taxes of $5.0 million and $8.3 million, respectively. The decrease in our benefit from income taxes of $3.1$2.7 million for the year ended December 31, 20192022 increased $2.6 million, from $0.1 million for the year ended December 31, 2021. The increase was primarily attributable to an increase in our cash balance due to the receipt of event cancellation insurance claim and insurance litigation settlement proceeds as well as rising interest rates throughout 2022.
Loss on Disposal of Fixed Assets
Loss on Disposal of Fixed Assets for the year ended December 31, 2022 decreased 100.0% from $0.4 million for the year ended December 31, 2021. The decrease was primarily attributable to the disposal of leasehold improvements and other fixed assets associated with two office operating leases the Company abandoned during fiscal year 2021.
Provision for (benefit from) Income Taxes
For the years ended December 31, 2022 and 2021, we recorded a provision for income taxes of $27.2 million and a benefit from income taxes of $1.3 million, respectively. The increase in our provision for income taxes of $28.5 million for the year ended December 31, 2022 compared to the prior year was primarily attributable to the tax effectimpact of goodwill impairments
that are not deductible,higher other income, net from event cancellation insurance claim and to a lesser extent, the relative mix of operations in and among various U.S. state and local jurisdictions, partially offset by the increase in loss before income taxes in 2019.insurance litigation settlement proceeds.
Net LossIncome (Loss) and Comprehensive Income (Loss)
Net lossincome and comprehensive income of $50.0$130.8 million for the year ended December 31, 20192022 increased $24.9$210.5 million or 99.2%, from net loss and comprehensive loss of $25.1$79.7 million for the year ended December 31, 2018.2021. The key drivers of the increase in net lossincome and comprehensive income were the declineshigher revenues attributable to executing a full schedule of events in organic revenues, higher operating costs, increased corporate overhead2022, the increase in other income, net related to event cancellation insurance claim and lower benefits from income taxes described above. These declines were partly offset by lower combinedinsurance litigation settlement proceeds during 2022 and decreases in non-cash goodwill and intangible asset impairment charges. charges, partly offset by higher cost of revenues, depreciation and amortization and interest expenses as well as the increase in provision for income taxes described above.
Adjusted EBITDA
Total Adjusted EBITDA of $127.8$239.6 million for the year ended December 31, 2019 decreased $35.12022 increased $195.5 million, or 21.5%443.3%, from $162.9$44.1 million for the year ended December 31, 2018.2021. The decreaseincrease in Adjusted EBITDA was primarily attributable to higher other income, net related to event cancellation insurance claim and insurance litigation settlement proceeds as well as the $25.0 million increaseprofits generated from executing a full schedule of events in net loss described above and $17.9 million lower combined non-cash goodwill and intangible asset impairment charges. These decreases were partially offset by benefits from the increase in depreciation and amortization addback of $5.3 million and the decrease of $3.1 million in the deduction for benefit from income taxes. 2022.
Adjusted EBITDA is a financial measure that is not calculated in accordance with GAAP. For a discussion of our presentation of Adjusted EBITDA, see footnoteFootnote 4 to the table under the heading “Results of Operations - Operations—Comparison of the Year Ended December 31, 20202022 to the Year Ended December 31, 2019.”
Adjusted Net Income
Adjusted Net Income for the year ended December 31, 2019 of $67.3 million decreased $32.9 million, or 32.8%, from $100.2 million for the year ended December 31, 2018. The drivers of the decrease in Adjusted Net Income were the same as those for the decrease in Adjusted EBITDA. In addition, Adjusted Net Income declined as a result of the absence of higher add-backs for interest and depreciation and amortization expenses. Adjusted Net Income benefited from a $7.2 million decline in the tax effect of non-GAAP adjustments versus the prior year.
Adjusted Net Income is a financial measure that is not calculated in accordance with GAAP. For a discussion of our presentation of Adjusted Net Income, see footnote 5 to the table under the heading “Results of Operations - Comparison of the Year Ended December 31, 2020 to the Year Ended December 31, 2019.”2021”.
Liquidity and Capital Resources
Liquidity describes the ability of a company to generate sufficient cash flows to meet the cash requirements of its business operations, including working capital needs, debt service, acquisitions, other commitments and contractual obligations. We consider liquidity in terms of cash flows from operations and their sufficiency to fund our operating and investing activities.
In March 2020, the World Health Organization categorized the Coronavirus Disease 2019 (“COVID-19”) as a pandemic,Impact of COVID-19 Pandemic and the President of the United States declared the COVID-19 outbreak a national emergency. In conjunction with this declarationRelated Insurance Coverage
55
The unprecedented and therapid spread of COVID-19 acrossand the United States, recommendationsrelated government restrictions and mandates were handed down by various local, state and federal government agencies regarding social distancing containment areas and against large gatherings. In addition, travel restrictions were imposed bymeasures implemented in the United States and foreign governments, and by companies with respect to their employees, and various event venues announced indefinite closures. As a result of these and various other factors, management madethroughout the decision to cancel nearly all of our face-to-face events scheduledworld significantly impacted Emerald’s business from mid-March 2020 through the end of 2020. In addition, beginningfiscal year 2021. Late in October 2020 management announced the cancellation or postponementsecond quarter of several2021, we began to see positive impacts of successful vaccination rollouts in many countries, with social distancing restrictions easing and live events that were scheduled forresuming in the firstUnited States. In the second half of 2021. The2021, Emerald’s live events business experienced a meaningful restart with the successful execution of 56 in-person events, serving more than 129,000 attendees and 7,500 exhibiting companies. We have since been able to stage a full slate of events in each of 2022 and 2023, successfully trading 124 and 141 in-person events, respectively, and serving approximately 393,000 and 516,000 attendees and 17,800 and 21,000 exhibiting companies, respectively. While we have been able to resume our full schedule of events, the ongoing effects of COVID-19 on our operations and event calendar have had, and willmay continue to have, a material negative impact on itsour financial results and liquidity, and such negative impact may continue beyond the containment of such outbreak.
liquidity. The assumptions used to estimate our liquidity are subject to greater uncertainty because we have never previously cancelled or postponed all upcoming events for a period of multiple months due to a pandemic where the timing for resolution and ultimate impact of the pandemic remains uncertain. Management cannot at present estimatepredict with certainty (i) when we will be able to resume full or partial event operations and, once resumed, (ii) whether event exhibitors and attendees will attend our events.events in numbers similar to pre-pandemic editions. Therefore, current estimates of revenues and the associated impact on liquidity could differ materiallysignificantly in the future. Therefore, current estimates
On August 3, 2022, we reached an agreement to settle outstanding insurance litigation relating to event cancellation insurance for proceeds of revenues and the associated impact on liquidity could differ materially in the future. As a consequence, management cannot estimate with a high degree of certainty the ultimate impact on our business, financial condition or near or longer term financial or operational results.$148.6 million. During the yearyears ended December 31, 2020,2023, 2022 and 2021, we implemented several actionsrecorded other income, net of $2.8 million, $182.8 million and $77.4 million, respectively, related to preserve cashevent cancellation insurance claim and strengthensettlement proceeds deemed to be realizable by our liquidity position, including, but not limited to:management. All such amounts were received during the respective periods in which they were recorded.
|
|
|
|
|
|
|
|
|
|
|
|
Further, Emerald maintains event cancellation insurance to protect against losses due to the unavoidable cancellation, postponement, relocation and enforced reduced attendance at events due to certain covered events. Specifically, for the policies covering calendar years 2021 and 2020, Emerald iswas insured for losses due to event cancellations caused by the outbreak of communicable diseases, including COVID-19.
The aggregate limit under these However, Emerald’s renewed event cancellation insurance policies for the policy years beginning in 2022 do not cover losses due to event cancellations caused by the outbreak of communicable diseases, including COVID-19. In addition, coverage for each of our event cancellation insurance policies extends to include additional promotional and marketing expenses necessarily incurred by us should a covered loss occur. These policies also include a terrorism endorsement covering an act of terrorism and/or threat of terrorism directed at the insured event or within the United States or its territories. The aggregate limit for our renewed 2023 and 2022 primary event cancellation insurance policy is approximately $191.1$100.0 million in 2020 and $191.4 million in 2021for each year, if losses arise for reasons within the scope of this policy. In addition to this primary policy, Emerald maintainsthese policies. We also obtained a similar separate event cancellation insurance policy for the Surf Expo Summer 2020Winter 2023 and Surf Expo Winter 2021Summer 2023 shows, with a coverage limit of $6.0$8.4 million and $7.7$6.9 million for each respective event.
We are in the process of pursuing claims under these insurance policies to offset the financial impact of cancelled and postponedhave obtained similar coverage for events as a result of COVID-19. During the year ended December 31, 2020, we recorded Other income of $107.0 million related to event cancellation insurance claim proceeds deemed to be realizable by management. staged during 2024.
OfCredit Facility Amendments
On February 2, 2023, Emerald X entered into a Fifth Amendment (the “RCF Amendment”) to its Amended and Restated Credit Agreement, which amended the $107.0 million in other income, $89.2 million was received in 2020previously existing Amended and $17.8 million was received in January 2021. These proceeds represent an interim payment in respectRestated Credit Agreement, dated as of the $167.4 million in event cancellation insurance claims filed in relationMay 22, 2017, as amended prior to events cancelled during the year ended December 31, 2020. These claims are subject to review and adjustment. There is no guarantee or assurance as to the amount or timing of future recoveries from Emerald’s event cancellation insurance policy.
On March 27, 2020, the U.S. government enacted the Coronavirus Aid, Relief, and Economic Security Act (“CARES Act”), which provides for the ability of employers to delay payment of employer payroll taxes during 2020 after the date of enactment. Asthe RCF Amendment. The RCF Amendment increased the aggregate amount of all revolving commitments under the Amended and Restated Credit Agreement from $100.4 million to $110.0 million (such facility, as amended by the RCF Amendment, the “Extended Revolving Credit Facility”). The increased revolving commitments have the same terms as the existing revolving commitments. The RCF Amendment did not change any other material terms of the Amended and Restated Credit Agreement.
On June 12, 2023, Emerald X entered into a result,Sixth Amendment (the “Term Loan Amendment”) to the payment approximately $2.0 millionAmended and Restated Credit Agreement, The Term Loan Amendment extended the maturity of our employer payroll taxes otherwise due in 2020 will be delayed,the term loans outstanding under the Amended and Restated Credit Agreement (the extended term loan facility, the “Extended Term Loan Facility”) from May 22, 2024 to May 22, 2026. The Term Loan Amendment replaced the interest rate applicable to the term loans under the Amended and Restated Credit Agreement with 50% due by December 31, 2021a rate equal to, at the option of Emerald X, (i) the Term Secured Overnight Financing Rate (“Term SOFR”) plus 5.00% per annum plus a credit spread adjustment of 0.10% per annum or (ii) an alternate base rate (“ABR”) plus 4.00% per annum. Prior to the Term Loan Amendment, the interest rate applicable to the term loans under the Amended and Restated Credit Agreement was a rate equal to, at the remaining 50% due by December 31, 2022. option of Emerald X (i) LIBOR plus 2.75% or 2.50% per annum, depending on Emerald X’s first lien net leverage ratio or (ii) ABR plus 1.75% or 1.50% per annum, depending on Emerald X’s first lien net leverage ratio. The Term Loan Amendment additionally reset scheduled quarterly payments, each equal to 0.25% of the original principal amount of the Extended Term Loan Facility.
56
As of December 31, 2020,2023, we had $525.2$402.9 million of borrowings outstanding under the Amended and RestatedExtended Term Loan Facility, which includedwas recorded net of unamortized discount of $8.9 million, and net of unamortized deferred financing fees of $2.0 million and unamortized original issue discount of $2.5 million, with an additional $149.0 million available to borrow (after giving effect to $1.0 million letters of credit outstanding) under the Amended and Restated Revolving Credit Facility.$1.5 million. Borrowings under our Amended and RestatedExtended Term Loan Facility are subject to mandatory prepayments under specified circumstances, including 50.0%50% of Excess Cash Flow, subject to step-downs to 25% and 0% of excess cash flow at certain leverage based thresholds, and with 100% of the net cash proceeds of asset sales and casualty events in excess of certain thresholds (subject to certain reinvestment rights). If these thresholds are triggered, we would be required to make these mandatory prepayments. See “--Long-Term Debt-Amended and Restated Senior Secured Credit Facilities”“—Long-Term Debt” below for more detail regarding the terms of our Amended and Restated Senior Secured Credit Facilities.
Based on our return to positive operating cash flows, current cash position and assumptions regarding the impact of COVID-19, as well as revolving commitments available to us under the Amended and Restated Senior Secured Credit Facilities, we believe that our current financial resources will be sufficient to fund the Company's liquidity requirements for the next twelve months.
Dividend Policy
We paid a dividend of $0.07 per share in each of the second, third and fourth quarters of 2017 and the first quarter of 2018 and $0.0725 per share in each of the second, third and fourth quarters of 2018. We paid a dividend of $0.0725 per share in first quarter of 2019 and $0.0750 per share in each of the second, third and fourth quarters of 2019 and first quarter of 2020. On March 20, 2020, due to the negative impact of COVID-19 on our business, our Board of Directors temporarily suspended the Company’sour regular quarterly cash dividend on its common stock. The payment of any such dividend in future quarters is subject to the discretion of our boardBoard of directorsDirectors and depending upon our results of operations, cash requirements, financial condition, contractual restrictions, restrictions imposed by applicable laws and other factors that our boardBoard of directorsDirectors may deem relevant, and the amount of any future dividend payment may be changed or terminated in the future at any time and for any reason without advance notice.
Our business is conducted through our subsidiaries. Dividends, distributions and other payments from, and cash generated by, our subsidiaries will be our principal sources of cash to repay indebtedness, fund operations and pay dividends. Accordingly, our ability to pay dividends to our stockholders is dependent on the earnings and distributions of funds from our subsidiaries. In addition, the covenants in the agreements governing our existing indebtedness, including the Amended and Restated Senior Secured Credit Facilities, significantly restrict the ability of our subsidiaries to pay dividends or otherwise transfer assets to us. See “—Long-Term Debt”, “Risk Factors—Risks Relating to Ownership of Our Common Stock—Because we are a holding company with no operations of our own, we rely on dividends, distributions, and transfers of funds from our subsidiaries” and “Risk Factors—Risks Relating to Ownership of Our Common Stock—We cannot assure you that we will continue to pay dividends on our common stock, and our indebtedness could limit our ability to pay dividends on our common stock.”
Each share of our outstanding redeemable convertible preferred stock accumulates dividends at a rate per annum equal to 7% of the accreted liquidation preference, which compounds quarterly by adding to the accreted liquidation preference until July 1, 2023 and thereafter, at our option, may be paid either in cash or by adding to the accreted liquidation preference. For each of the quarterly periods ended September 30, 2023 and December 31, 2023, we elected to pay dividends on the redeemable convertible preferred stock in cash. The aggregate amount of such dividends was $8.6 million in each of the quarterly periods ended September 30 and December 31, 2023. We may elect the form of future quarterly dividends on a quarter-by-quarter basis. There can be no assurance that we will continue to pay such quarterly dividends in cash in future periods.
Share Repurchases
Our boardIn November 2023, our Board of directorsDirectors approved aan extension and expansion of our previously-announced share repurchase program, allowing for the repurchase of up to $25.0 million of our common stock through December 31, 2024, subject to early termination or extension by the Board of Directors. This approval extends and expands the previously authorized $20.0 million share repurchase program in the fourth quarter of 2018 and a $30.0 million share repurchase program in the third quarter of 2019. We settled the repurchase of 853,557 and 1,627,248 shares of our common stock for $8.3 million and $19.4 million during the years endedthat was effective through December 31, 2019, and 2018, respectively. There were no remaining amounts available for2023. Share repurchases under the $20.0 million share repurchase program approved in the fourth quarter of 2018 and the $30.0 million share repurchase program approved in the third quarter of 2019 was discontinued in the first quarter of 2020.
On October 5, 2020, our Board authorized and approved a new $20.0 million share repurchase program. Share repurchasesextended plan may be made from time to time through and including December 31, 2021,2024, subject to early termination or extension by theour Board throughof Directors. The share repurchase program may be suspended or discontinued at any time without notice. There is no minimum number of shares that we are required to repurchase. Shares may be purchased from time to time in the open market, purchases, block transactions,including pursuant to one or more Rule 10b5-1 purchase plans that we may enter into from time to time, or in privately negotiated transactions. Such purchases or otherwise. will be at times and in amounts as we deem appropriate, based on factors such as market conditions, legal requirements and other business considerations.
57
We settled the repurchaserepurchased an aggregate of 203,8375,064,140 shares of our common stock for $0.8$16.9 million under the share repurchase program during the year ended December 31, 2020. As of December 31, 2020, there2023. There was $19.2$25.0 million remaining available to repurchase shares pursuant tofor share repurchases under the share repurchase program publicly announcedas of December 31, 2023.
During the year ended December 31, 2022, we repurchased an aggregate of 2,882,841 shares of common stock for $10.4 million under the repurchase program as then in the third quarter of 2020.effect.
58
Cash Flows
The following table summarizes the changes to our cash flows for the periods presented:
|
| Year Ended December 31, |
| |||||||||
|
| 2023 |
|
| 2022 |
|
| 2021 |
| |||
|
| (unaudited) |
| |||||||||
Statement of Cash Flows Data |
| (dollars in millions) |
| |||||||||
Net cash provided by operating activities |
| $ | 40.3 |
|
| $ | 175.1 |
|
| $ | 90.0 |
|
Net cash used in investing activities |
| $ | (21.0 | ) |
| $ | (47.9 | ) |
| $ | (131.9 | ) |
Net cash (used in) financing activities |
| $ | (54.2 | ) |
| $ | (119.3 | ) |
| $ | (22.2 | ) |
|
| Year Ended December 31, |
| |||||||||
|
| 2020 |
|
| 2019 |
|
| 2018 |
| |||
|
| (unaudited) |
| |||||||||
Statement of Cash Flows Data |
| (dollars in millions) |
| |||||||||
Net cash (used in) provided by operating activities |
| $ | (37.1 | ) |
| $ | 67.8 |
|
| $ | 103.9 |
|
Net cash used in investing activities |
| $ | (37.3 | ) |
| $ | (16.7 | ) |
| $ | (74.7 | ) |
Net cash provided by (used in) financing activities |
| $ | 360.1 |
|
| $ | (62.0 | ) |
| $ | (19.6 | ) |
Operating Activities
Operating activities consist primarily of net loss(loss) income adjusted for noncash items that include goodwill and intangible asset impairments, depreciation and amortization, deferred income taxes, amortization of deferred financing fees and debt discount, share-based compensation, plus the effect of changes during the period in our working capital.
Net cash used in operating activities for the year ended December 31, 2020 decreased $104.9 million to $37.1 million used in operating activities, from $67.8 million provided by operating activities during the year ended December 31, 2019. The decrease was primarily due to a $583.6 million increase in net loss and a $70.1 million increase in cash used for working capital. These were partially offset by a $548.8 million increase in non-cash reconciling adjustments driven by increases in non-cash goodwill and intangible asset impairment charges of $534.3 million and $59.8 million, respectively, partly offset by decreases of $42.7 million for deferred income taxes and $3.4 million for depreciation and amortization. Net cash provided by operating activities for the year ended December 31, 20192023 decreased $36.1$134.8 million or 34.7%, to $67.8$40.3 million, from $103.9$175.1 million during the year ended December 31, 2018.2022. The decrease was primarily due to a $24.9$139.0 million increasedecrease in net (loss) income to a net loss of $8.2 million in fiscal year 2023 from net income of $130.8 million in fiscal year 2022, primarily as a result of event cancellation insurance claim and a $6.1insurance litigation settlement proceeds during the prior year as well as higher cash used for working capital of $8.2 million during 2023. The increase in cash used for working capital.capital was primarily due to the current year payment of liabilities related to the receipt of event cancellation insurance claim proceeds and insurance litigation settlement proceeds in fiscal year 2022. These decreases to cash provided by operating activities were partiallypartly offset by a $5.1$12.4 million increase in non-cash adjustments to net loss in 2023.The increase in non-cash adjustments to net loss was primarily attributable to a $31.0 million reduction during the current year in gains from remeasurement of contingent consideration, current year loss on debt extinguishment of $2.3 million and a $2.0 million increase in stock-based compensation offset by a $14.5 million decrease in depreciation and amortization expense as well as the lack of any goodwill or intangible asset impairment add-backs in the current fiscal year.
Net cash provided by operating activities for the year ended December 31, 2022 increased $85.1 million to $175.1 million provided by operating activities, from $90.0 million provided by operating activities during the year ended December 31, 2021. The increase was primarily driven by a $210.5 million increase in net income to net income of $130.8 million from net loss of $79.7 million during the year ended December 31, 2021 as a result of event cancellation insurance claim proceeds during the current year. This increase was partly offset by an increase in cash used for working capital of $68.9 million and a decrease in non-cash reconciling adjustments.adjustments of $56.5 million. The working capital decline represented cash used for working capital of $4.4 million in the current year from cash generated by working capital of $64.5 million during the year ended December 31 2021. The working capital decline was primarily attributable to lower cash from deferred revenues of $37.6 million, and $17.8 million lower cash inflows from insurance receivables. While the increase in deferred revenues during 2022 is a sign of Emerald's continued recovery from the COVID-19 pandemic, the increase in sales in the second half of 2021 generated a more significant increase in the prior year. In addition, lower cash inflows from accounts payable during 2022 was a result of an unusually low accounts payable and other current liabilities balance at the end of 2020, which was a result of low business activities due to COVID-19. Our return to staging live events in the second half of 2021 resulted in an unusually significant increase in accounts payable and other current liabilities during 2021. Our operations have continued to return to a more normal cadence during 2022, resulting in lower cash from accounts payable and other current liabilities in the current year. Non-cash adjustments declined $56.5 million to non-cash adjustments of $48.7 million in the current year from $105.2 million during the year December 31, 2021. The decline in non-cash adjustments was driven by remeasurement of contingent consideration and lower intangible asset impairment partly offset by an increase in depreciation and amortization driven by the amortization of intangible assets primarily related to the 2021 acquisitions. Net income (loss) and non-cash adjustments to net income generated $179.5 million in cash during the year ended December 31, 2022 compared to $25.5 million in cash generated during the prior year. The primary driver of this increase was an increase in net income (loss) of $210.5 million offset by a lower add-back for intangible asset impairment and higher non-cash adjustment related to the gain from remeasurement of contingent consideration.
59
Investing Activities
Investing activities consist of business acquisitions and purchases of other productive assets, investments in information technology and capital expenditures to furnish or upgrade our offices.
Net cash used in investing activities for the year ended December 31, 2020 increased $20.62023 decreased $26.9 million or 123.4%, to $37.3$21.0 million from $16.7$47.9 million in the year ended December 31, 2019.2022. The increasedecrease was primarily due to increaseda decrease in aggregate cash used for business acquisitions during the year ended December 31, 20202023 of $9.5 million compared to $37.6 million in the prior year. InThe Company completed one and two business acquisitions in the yearyears ended December 31, 2020, we completed two acquisitions for cash consideration of $33.3 million, while during the year ended December 31, 2019, we completed one acquisition in the prior year for aggregate cash consideration of $12.8 million. 2023 and 2022, respectively.
Net cash used in investing activities for the year ended December 31, 20192022 decreased $58.0$84.0 million or 77.6%, to $16.7$47.9 million from $74.7$131.9 million in the year ended December 31, 2018.2021. The decrease was primarily due to a decrease in aggregate cash used for business acquisitions during the year ended December 31, 2022 of $37.6 million compared to $125.3 million during the year ended December 31, 2021. The Company completed two business acquisitions in each of the years ended December 31, 2022 and 2021. See Note 4, Business Acquisitions, in the notes to the audited consolidated financial statements included elsewhere in this Annual Report on Form 10-K/A10-K for additional information with respect to the acquisitions. We have minimal capital expenditure requirements. Capital expenditures totaled $4.0$11.5 million, $3.9$10.3 million and $3.5$6.6 million in the years ended December 31, 2020, 20192023, 2022 and 2018,2021, respectively.
Financing Activities
Financing activities primarily consist of borrowing and repayments on our debt to fund business acquisitions and our operations.
Net cash provided byused in financing activities for the year ended December 31, 20202023 was $360.1$54.2 million, comprised of $382.7payment of an aggregate of $17.2 million of net proceeds for issuance ofcash dividends on our outstanding redeemable convertible preferred stock, partly offset by $10.0$16.9 million in share repurchases associated with our share repurchase programs, payment of $12.5 million of original issuance discount and $2.0 million in debt issuance costs related to the Term Loan Amendment, $3.7 million in payments of contingent consideration related to business acquisitions and $2.1 million in repayments net of borrowingsprincipal on our Extended Term Loan Facility.
Net cash used in financing activities for the year ended December 31, 2022 was $119.3 million, comprised of $104.2 million in repayments of principal on our Amended and Restated Senior Revolving Credit Facility, $5.4Term Loan Facilities, $10.4 million in share repurchases associated with our share repurchase programs, $4.4 million in payments of contingent consideration related to business acquisitions and $0.4 million of fees paid associated with the Fourth Amendment to our Amended and Restated Credit Agreement. Net cash dividend payments, $0.9used in financing activities for the year ended December 31, 2021 was $22.2 million, comprised of $12.4 million in share repurchases associated with our publicly announced share repurchase programs, $5.7 million in repayments of principal on our Amended and Restated Term Loan Facilities and a $0.8$4.2 million paymentin payments of deferredcontingent consideration related to a business acquisition. Net cash used in financing activities for the year ended December 31, 2019 was $62.0 million, comprised of $46.0 million in repayments of borrowings on our Amended and Restated Senior Revolving Credit Facility, $21.3 million in quarterly cash dividend payments,acquisitions.$8.3 million in share repurchases associated with our publicly announced share repurchase programs, $5.7 million in repayments of principal on our Amended and Restated Term Loan Facilities and a $1.0 million payment of deferred consideration related to a business acquisition. These were offset by net proceeds of $16.0 million borrowings on our Amended and Restated Senior Revolving Credit Facility and $4.3 million in proceeds from common stock issuances related to the exercise of employee equity awards. Net cash used in financing activities for the year ended December 31, 2018 was $19.6 million, comprised of a $25.7 million repayment of principal on our Amended and Restated Term Loan Facility, $21.0 million in quarterly cash dividend payments and $19.4 million in share repurchases associated with our publicly announced share repurchase program. These were offset by net proceeds of $40.0 million borrowings on our Amended and Restated Senior Revolving Credit Facilities and $6.5 million in proceeds from common stock issuances related to the exercise of employee equity awards.
Free Cash Flow
Free Cash Flow of negative $41.1$28.8 million for the year ended December 31, 20202023 decreased $105.0$136.0 million, from inflow of $63.9$164.8 million for the year ended December 31, 2019.2022. Free Cash Flow of $63.9$164.8 million for the year ended December 31, 2019 decreased $36.52022 increased $81.4 million, or 36.4% from $100.4$83.4 million for the year ended December 31, 2018. Free Cash Flow of $100.4 million for the year ended December 31, 2018 decreased $7.4 million, or 6.9% from $107.8 million for the year ended December 31, 2017. 2021.
Free Cash Flow is a financial measure that is not calculated in accordance with GAAP. For a discussion of our presentation of Free Cash Flow, see footnote 6Footnote 5 to the table under the heading “Results of Operations - Operations—Comparison of the Year Ended December 31, 20202023 to the Year Ended December 31, 2019”2022”.
Interest Rate Swap and Floor
In March 2014, we entered into forward interest rate swap and floor contracts with the Royal Bank of Canada, which modified our exposure to interest rate risk by effectively converting $100.0 million of floating-rate borrowings under our Term Loan Facility to a fixed rate basis, thus reducing the impact of interest rate changes on future interest expense. The interest rate swap and floor had an effective date of December 31, 2015 and through December 31, 2018. The contract expired and was fully settled on December 31, 2018.
The interest rate swap and floor contracts were not designated as effective hedges for accounting purposes. Accordingly, we marked to market the interest rate swap and floor quarterly with the unrealized gain or loss recognized in unrealized net loss on interest swap and floor in our consolidated statements of lossand comprehensive loss, and the net liability included in accounts payable and other current liabilities and other noncurrent liabilities in the consolidated balance sheets.
For the years ended December 31, 2020 and 2019, we recorded no realized or unrealized gains or losses on our former interest rate swap and floor agreement. For the year ended December 31, 2018 we recorded a realized net loss of $0.5 million and an unrealized gain of $0.8 million on our interest rate swap and floor agreement in the consolidated statement of lossand comprehensive loss. The impact of the gains and losses on the interest rate swap and floor agreement is recorded in interest expense. The interest rate swap and floor contracts have been designated
as Level 2 financial instruments. Due to the expiration and full settlement of the interest rate swap and floor contracts in 2018, there is no liability outstanding at December 31, 2020 and 2019.
Off-Balance Sheet Commitments
We are not party to, and do not typically enter into any, off-balance sheet arrangements.
60
Long-Term Debt
Amended and Restated Senior Secured Credit Facilities
On October 28, 2016,Our wholly-owned subsidiary, Emerald X, Inc., formerly known as (“Emerald Events Holding, Inc., entered intoX”) is a third amendmentparty to our then-existingboth a senior secured credit facilities to (i) borrow an additional $200.0 million of term loans under the term loan facility to fund the redemption of $200.0 million in aggregate principal amount of the Company’s 9.000% Senior Notes and (ii) increase commitments under thea senior secured revolving credit facility, by $10.0 millionin each case entered into with a syndicate of lenders and Bank of America, N.A., as administrative agent, pursuant to a total of $100.0 million. On May 8, 2017, using the net proceeds to us from the IPO, we prepaid $159.2 million of borrowings outstanding under the then-existing term loan facility.
On May 22, 2017, Emerald X, Inc. amended and restated our then-existing senior secured credit facilities; the Amended and Restated Senior Secured Credit Facilities now consistdescribed below.
2023 Amendment to Term Loan Facility
On June 12, 2023 (the “Term Loan Amendment Effective Date”), Emerald X entered into a Sixth Amendment (the “Term Loan Amendment”) to its existing Amended and Restated Credit Agreement (such credit agreement, the “Amended and Restated Credit Agreement”). The Term Loan Amendment, which was entered into with a syndicate of (i)lenders and Bank of America, N.A., as administrative agent, extended the maturity of the term loans outstanding under the Amended and Restated Term Loan Facility, a seven-year $565.0 million senior securedCredit Agreement (such extended term loan facility, scheduled to mature on May 22, 2024 (the “Amended and Restatedthe “Extended Term Loan Facility”) and (ii)from May 22, 2024 to May 22, 2026.
The aggregate outstanding principal amount of the Amended and Restated Revolving Credit Facility, a $150.0 million senior secured revolving credit facility, scheduled to mature on May 23, 2022 (the “Amended and Restated Revolving Credit Facility” and, together with the Amended and RestatedExtended Term Loan Facility was approximately $415.3 million as of the “Amended and Restated Senior Secured Credit Facilities”). On November 27, 2017, Emerald X, Inc. entered into the Refinancing Agreement and FirstTerm Loan Amendment to our Amended and Restated Credit Facilities to reduceEffective Date. The Term Loan Amendment also replaced the interest rate applicable to the term loans under the Amended and Restated Credit Agreement with a rate equal to, at the option of Emerald X, (i) the Term Secured Overnight Financing Rate (“Term SOFR”) plus 5.00% per annum plus a credit spread adjustment of 0.10% per annum or (ii) an alternate base rate (“ABR”) plus 4.00% per annum. Prior to the Term Loan Facility by 0.25% and on November 29, 2017,Amendment, the interest rate applicable to the term loans was a rate equal to, at the option of Emerald X, Inc. entered into(i) LIBOR plus 2.75% or 2.50% per annum, depending on Emerald X’s first lien net leverage ratio or (ii) ABR plus 1.75% or 1.50% per annum, depending on Emerald X’s first lien net leverage ratio.
The Term Loan Amendment additionally reset scheduled quarterly payments, each equal to 0.25% of the Repricing Agreementoriginal principal amount of the Extended Term Loan Facility. Further, the Term Loan Amendment modified the prepayment provisions so that, upon the occurrence of a repricing transaction, subject to certain specified exceptions, Emerald X will have to pay a prepayment fee of 2%, in the event of a repricing transaction occurring within the first twelve months after the Term Loan Amendment Effective Date, or 1%, in the event of a repricing transaction occurring on a date that is between twelve months after the Term Loan Amendment Effective Date and Secondeighteen months after the Term Loan Amendment Effective Date. No prepayment premium is payable for prepayments made after the eighteen month anniversary of the Term Loan Amendment Effective Date.
On December 28, 2022, Emerald X voluntarily prepaid $100.0 million of outstanding term loans. Prior to such prepayment, the Amended and Restated Credit Agreement required repayment of the term loans outstanding thereunder in equal quarterly installments of 0.25% of the original $565.0 million of borrowings, with the balance due at maturity.. As a result of the term loan prepayment described above, no further amortization payments were required until the Term Loan Amendment reset scheduled quarterly payments on the $415.3 million in principal amount of Term Loans outstanding as of the Term Loan Amendment Effective Date.
Subject to reducecertain customary exceptions and limitations, Emerald X is also required to prepay amounts outstanding under the interest rate applicableExtended Term Loan Facility under specified circumstances, including 50.0% of Excess Cash Flow (“ECF”), subject to step-downs to 25% and 0% of excess cash flow at certain leverage based thresholds, and with 100% of the net cash proceeds of asset sales and casualty events in excess of certain thresholds (subject to certain reinvestment rights).
2023 Amendment to Revolving Credit Facility
On February 2, 2023, Emerald X entered into a Fifth Amendment (the “RCF Amendment”) to the Amended and Restated Credit Agreement. The RCF Amendment increased the aggregate amount of all revolving commitments under the Amended and Restated Credit Agreement from $100.4 million to $110.0 million. The increased revolving
61
commitments have the same terms as the existing revolving commitments. The RCF Amendment did not change any other material terms of the Amended and Restated Credit Agreement.
2022 Amendment to Revolving Credit Facility
On December 21, 2022, Emerald X entered into a Fourth Amendment to the Amended and Restated Credit Agreement (the “Fourth Amendment”), by and among Emerald X, the guarantors party thereto, the lenders party thereto and Bank of America, N.A., as administrative agent, which extended the maturity of $100.4 million of then-existing revolving commitments under the Amended and Restated Credit Agreement (the revolving credit facility, as so extended, the “Extended Revolving Facility”) from November 23, 2023 to the earlier to occur of (i) May 23, 2026 and (ii) the day that is 91 days prior to the scheduled final maturity date of all outstanding term loans under the Amended and Restated Revolving Credit Agreement by 0.25%having an aggregate principal amount equal to or greater than the greater of (x) $75.0 million and (y) 100% of the Company’s Consolidated EBITDA (calculated on a pro forma basis).
FollowingThe Fourth Amendment also replaced the November 2017 repricing, loansLIBOR interest rate benchmark with a Term Secured Overnight Financing Rate (“Term SOFR”) interest rate benchmark for borrowings under the Extended Revolving Facility.
Accordingly, the Amended and Restated Senior Secured Credit FacilitiesAgreement allows the Borrower to choose from the following two interest rate options for revolver borrowings:
| a Under the |
|
|
The Amended and Restated Senior Secured Credit Facilities also include an uncommitted incremental facility which, subjectAgreement, Emerald X is required to certain conditions, provides for additional term loanspay a quarterly commitment fee in respect of the sum of:
|
|
|
|
|
|
| an amount equal to |
|
|
The Amended and Restated Revolving Credit Facility is subject to payment of a commitment fee of 0.50% per annum, calculated on the unused portion of the facility, which may beis reduced to 0.375% upon achievement of a Total First Lien Net Leverage Ratio of 3.50 to 1.00. Upon the issuance of letters of credit under the Amended and Restated Senior SecuredExtended Revolving Credit Facilities,Facility, Emerald X Inc. is required to pay fronting fees, customary issuance and administration fees and a letter of credit fee equal to the then-applicable margin (as determined by reference to LIBOR)SOFR) for the Amended and RestatedExtended Revolving Credit Facility.
The Amended and Restated Term Loan Facility requires scheduled quarterly payments, each equal to 0.25%Guarantees; Collateral; Covenants; Events of the original principal amount of the loans made under the Amended and Restated Term Loan Facility on May 22, 2017.Default
The Amended and Restated Senior Secured Credit Facilities requires certain mandatory prepayments of outstanding loans under the Amended and Restated Term Loan Facility, subject to certain exceptions, based on (i) a percentage of net cash proceeds of certain asset sales and casualty and condemnation events in excess of certain thresholds (subject to certain reinvestment rights), (ii) net cash proceeds of any issuance of debt, excluding permitted debt issuances and (iii) a percentage of Excess Cash Flow (as defined in the Amended and Restated Senior Secured Credit Facilities) in excess of certain thresholds during a fiscal year.
Subject to certain customary exceptions and limitations, allAll obligations under the Amended and Restated Senior Secured Credit Facilities are guaranteed by Expo Event Midco, Inc. (“EEM”)Emerald X’s direct parent company and, subject to certain exceptions, by all of Emerald X, Inc.’sX’s direct and indirect wholly-ownedwholly owned domestic subsidiaries. As of December 31, 2023, all of Emerald X’s domestic subsidiaries and suchEmerald X’s direct parent have provided guarantees.
Subject to certain limitations, the obligations under the Amended and the related guaranteesRestated Senior Secured Credit Facilities are secured by a perfected first priority security interest in substantially all tangible and intangible assets owned by Emerald X Inc. or by any guarantor.
The Amended and Restated Senior Secured Credit Facilities contain a number of customary incurrence-based covenants imposing certain restrictions on our business, including limitations on indebtedness; limitations on liens; limitations on certain fundamental changes (including, without limitation, mergers, consolidations, liquidations and dissolutions); limitations on asset sales; limitations on dividends and other restricted payments; limitations on investments, loans and advances; limitations on certain repayments of subordinated indebtedness; limitations on transactions with affiliates; limitations on changes in fiscal periods; limitations on agreements restricting liens and/or dividends; and limitations on changes in lines of business.
Certain of these incurrence-based covenants restrict, subject to various exceptions, our ability to take certain actions (such as incurring additional secured and unsecured indebtedness, making certain investments and paying certain dividends) unless we meet certain minimum Fixed Charge Coverage Ratio or maximum Total First Lien Net Leverage Ratio and/or Total Net Secured Leverage Ratio standards. These ratios are calculated on the basis of our Acquisition Adjusted EBITDA (which is defined as “Consolidated EBITDA” in the credit agreement governing the Amended and Restated Senior Secured Credit Facilities), calculated on a trailing four-quarter basis.
62
In addition, the Amended and RestatedExtended Revolving Credit Facility contains a financial maintenance covenant (the “Financial Covenant”) requiring Emerald X Inc. to comply with a 5.50 to 1.00 Total First Lien Net Leverage Ratio, which is defined as the ratio of Consolidated Total Debt (as defined in the Amended and Restated Senior Secured Credit Facilities)Agreement) secured on a first lien basis, net of unrestricted cash and cash equivalents (“Total First Lien Net Debt”) to Acquisition Adjusted EBITDA. This financial covenant is tested quarterly only if the aggregate amount of revolving loans, swingline loans and letters of credit outstanding under the Amended and RestatedExtended Revolving Credit Facility (net of up to $10.0 million of outstanding letters of credit) exceeds 35% of the total commitments thereunder. We were not required to test the Financial Covenant at December 31, 2020.2023 or 2022.
Events of default under the Amended and Restated Senior Secured Credit Facilities include, among others, nonpayment of principal when due; nonpayment of interest, fees or other amounts; cross-defaults; covenant defaults; material inaccuracy of representations and warranties; certain bankruptcy and insolvency events; material unsatisfied or unstayed judgments; certain ERISA events; change of control; or actual or asserted invalidity of any guarantee or security document.
As of December 31, 2020,2023, we were in compliance with the terms of the Amended and Restated Senior Secured Credit Facilities.
Modifications to our Debt Agreements
We may, from time to time, repurchase or otherwise retire or extend our debt and/or take other steps to reduce our debt, lower our interest payments or otherwise improve our financial position. These actions may include open market debt repurchases, negotiated repurchases, other retirements of outstanding debt and/or opportunistic refinancing, amendment or repricing of debt. The amount of debt that may be repurchased or otherwise retired or refinanced, if any, will depend on market conditions, trading levels of our debt, our cash position, compliance with debt covenants and other considerations. Our affiliates may also purchase our debt from time to time, through open market purchases or other transactions. In such cases, our debt may not be retired, in which case we would continue to pay interest in accordance with the terms of the debt, and we would continue to reflect the debt as outstanding in our consolidated balance sheets.
Contractual Obligations and Commercial Commitments
The table below summarizes our contractual obligations as of December 31, 2020.2023.
|
| Payments Due By Period |
| |||||||||||||||||
|
| Total |
|
| Less Than |
|
| 1-3 Years |
|
| 3-5 Years |
|
| More Than |
| |||||
|
| (dollars in millions) |
| |||||||||||||||||
Contractual obligations(1) |
| $ | 73.1 |
|
| $ | 42.0 |
|
| $ | 30.8 |
|
| $ | 0.3 |
|
| $ | — |
|
Long-term debt obligations(2) |
|
| 413.3 |
|
|
| 4.2 |
|
|
| 409.1 |
|
|
| — |
|
|
| — |
|
Short-term debt obligations(3) |
|
| — |
|
|
| — |
|
|
| — |
|
|
| — |
|
|
| — |
|
Operating lease obligations(4) |
|
| 13.9 |
|
|
| 4.0 |
|
|
| 9.4 |
|
|
| 0.5 |
|
|
| — |
|
Interest on long-term debt obligations(5) |
|
| 103.7 |
|
|
| 43.8 |
|
|
| 59.9 |
|
|
| — |
|
|
| — |
|
Totals: |
| $ | 604.0 |
|
| $ | 94.0 |
|
| $ | 509.2 |
|
| $ | 0.8 |
|
| $ | — |
|
|
| Payments Due By Period |
| |||||||||||||||||
|
| Total |
|
| Less Than 1 Year |
|
| 1-3 Years |
|
| 3-5 Years |
|
| More Than 5 Years |
| |||||
|
| (dollars in millions) |
| |||||||||||||||||
Contractual obligations(1) |
| $ | 53.4 |
|
| $ | 27.2 |
|
| $ | 26.1 |
|
| $ | 0.1 |
|
| $ | — |
|
Long-term debt obligations(2) |
|
| 525.3 |
|
|
| 5.7 |
|
|
| 519.6 |
|
|
| — |
|
|
| — |
|
Short-term debt obligations(3) |
|
| — |
|
|
| — |
|
|
| — |
|
|
| — |
|
|
| — |
|
Operating lease obligations(4) |
|
| 20.2 |
|
|
| 4.3 |
|
|
| 10.6 |
|
|
| 5.3 |
|
|
| — |
|
Interest on long-term debt obligations(5) |
|
| 47.0 |
|
|
| 14.0 |
|
|
| 33.0 |
|
|
| — |
|
|
| — |
|
Totals: |
| $ | 645.9 |
|
| $ | 51.2 |
|
| $ | 589.3 |
|
| $ | 5.4 |
|
| $ | — |
|
63
|
|
|
|
|
|
|
|
|
|
Critical Accounting Policies and Estimates
The preparation of financial statements in conformity with accounting principles generally accepted in the United States requires the appropriate application of certain accounting policies, some of which require us to make estimates and assumptions about future events and their impact on amounts reported in our consolidated financial statements. Since future events and their impact cannot be determined with absolute certainty, the actual results will inevitably differ from our estimates.
We believe the application of our accounting policies, and the estimates inherently required therein, are reasonable. Our accounting policies and estimates are reevaluated on an ongoing basis and adjustments are made when facts and circumstances dictate a change.
The policies and estimates discussed below involve the selection or application of alternative accounting policies that are material to our consolidated financial statements. With respect to critical accounting policies, even a
relatively minor variance between actual and expected experience can potentially have a materially favorable or unfavorable impact on subsequent results of operations.
Our accounting policies are more fully described in Note 1, Description of Business and Summary of Significant Accounting Policies,, in the notes to our audited consolidated financial statements included elsewhere in this Annual Report on Form 10-K/A. Management10-K. Our management has discussed the selection of these critical accounting policies and estimates with members of our boardBoard of directors.Directors.
We have certain accounting policies that require more significant management judgementjudgment and estimates than others. These include our accounting policies with respect to revenue recognition, goodwill and indefinite-lived intangibles, definite-lived intangibles, share-based compensation and accounting for income taxes, which are more fully described below.
Revenue Recognition Deferred Revenue and Allowance for Credit Losses
Trade Shows and Other Events RevenueConnections
A significant portion of ourthe Company’s annual revenue is generated from the Connections segment through the production of trade shows and conference events, including booth space sales, registration fees and sponsorship fees. We recognize revenueRevenue from the Company’s trade shows and other events is recognized in the period the trade show or conference occurs. The ongoing COVID-19 pandemic and its consequences forced us to cancel a significant portion of our in-person events beginning in March 2020 through the end of the year and the first half of 2021. As a result, 75% of our revenue for the year ended December 31, 2020 was generated through live events 4% from virtual events and 21% from non-virtual event other marketing services. Trade show and other event revenues represented approximately 79%, 92% and 93% of total revenues forstages as the years ended December 31, 2020, 2019 and 2018, respectively.Company’s performance obligations have been satisfied. Exhibitors contract for their booth space and sponsorships up to a year in advance of the trade show. Fees are typically invoiced and collected in-full prior to the trade show or event and deferred until the event takes place and all promised services have been provided and performance obligations are met. Similarly, attendees register and are typically qualified for attendance prior to the show staging. Attendee registration revenues are also collected prior to the show and deferred until the show stages. Revenue is recognized when our customer receives the benefit of the promised services and all performance obligations are met. Revenue is recognized at an amount that reflects the consideration we expect to receive in exchange for those services. Customers receive the benefit of our services over the course of each trade show or other event for our trade shows and conference events. We recognized $101.2 million, $331.1 million and $353.8 million of tradeTrade show and other event revenue on a consolidated basisevents generated approximately 89%, 87% and 73% of revenues for the years ended December 31, 2020, 20192023, 2022 and 2018,2021, respectively.
Content
Revenues from the Company’s Content category primarily consist of advertising sales for digital products and industry publications that complement the event properties in each industry sector as well as custom content agency revenues. These revenues are recognized in the period in which the digital products are provided or publications are issued or when the custom content is delivered to the customer. Typically, the fees charged are collected after the digital products are provided, the publications are issued or the custom content is delivered. Content category revenues generated approximately 6%, 8% and 19% of revenues for the years ended December 31, 2023, 2022 and 2021, respectively.
Commerce
Revenues from the Commerce category primarily consist of sales from the Company’s software-as-a-service Elastic Suite platform. Revenue consists of subscription revenue, implementation fees and professional services. Fees associated with implementation are deferred and recognized over the expected customer life, which is four years. Subscription revenue is generally recognized over the term of the contract. The Company’s contracts associated with the subscription software and services are generally three-year terms with one-year renewals. Subscription software and services revenues generated approximately 5%, 5% and 8% of revenues for the years ended December 31, 2023, 2022 and 2021, respectively.
64
Because we collect our booth space, sponsorship and attendee registration revenue prior to the trade show staging, we do not incur substantial bad debt expense, or have exposure to credit losses with relation to these revenue streams. Any trade show related receivables outstanding 60 days following the month in which a trade show stages are fully reserved for in the allowance for doubtful accounts for periods before 2020 and allowance for credit losses in 2020. Bad debt expense is recognized in the consolidated statements of loss(loss) income and comprehensive loss(loss) income as selling, general and administrative expense. Accounts receivable are presented on the face of the consolidated balance sheet, net of an allowance for doubtful accounts for periods before 2020 and allowance for credit losses in 2020.
Other Marketing Services Revenue
The remaining portion of our revenues primarily consist of advertising sales for industry publications2023 and digital products, which are recognized in the period in which the publications are issuedor digital products are provided. Typically, the fees we charge are collected after the publications are issued. We recognized $26.2 million, $30.2 million and $26.9 million of other marketing services revenue for the years ended December 31, 2020, 2019 and 2018, respectively.
Deferred Revenue
Our deferred revenues generally consist of booth space sales, registration fees and sponsorship fees that are invoiced prior to the trade show or other event. Total deferred revenues, including the current and non-current portions, were $48.6 million and $187.3 million, as of December 31, 2020 and 2019, respectively.As a result of the measures to prevent the spread of COVID-19, we have experienced an unprecedented low level of booth space sales, registration fees and sponsorship fees and the associated cash received for future trade shows. In addition, we cancelled all but one of the trade shows and other events which had been scheduled to stage in the second half of
March 2020 through December 2020, as well as, cancelled or postponed several trade shows and other events in the first half of 2021, which led to a significant decrease in deferred revenues.2022.
Segment informationBusiness Combinations
Operating segments are components of an enterprise for which discrete financial reporting information is available that is evaluated regularly by the chief operating decision maker (“CODM”) in deciding how to allocate resources and in assessing performance. We routinely evaluate whether our operating segments continue to reflect the way the CODM evaluates the business. The determination is based on: (1) how our CODM evaluates the performance of the business, including resource allocation decisions, and (2) whether discrete financial information for each operating segment is available. We consider our Chief Executive Officer to be our CODM. Due to the appointmentUpon acquisition of a new Chief Executive Officerbusiness, management prepares a purchase price allocation to record the acquired entity’s tangible and subsequent changes tointangible assets and liabilities. The goodwill recorded reflects the internal structurefuture cash flow expectations for the acquired businesses’ market positions in their respective industries, synergies and assembled workforce. The fair values of Emerald’s operations and executive management responsibilities during the fourth quarter of 2019, we identifiedacquired customer-relationship intangibles are estimated using a change in operating and reportable segments.discounted cash flow analysis. The CODM evaluates performance based on the results of six executive brand portfolios, which represent six operating segments. Due to economic similarities and the nature of services, fulfillment processes of those services and types of customers, four of these operating segments are aggregated into two reportable segments, the Commerce and the Design and Technology reportable segments. Three operating segments do not meet the quantitative thresholds of a reportable segment and did not meet the aggregation criteria set forth in ASC 280, Segment Reporting, as of December 31, 2020 and as such are referred to as “All Other.” Refer to Note 18, Segment Information,significant assumptions used in the notes todiscounted cash flow analysis include future cash flows, growth rates, discount rates, and tax rates. These assumptions are used in developing the consolidated financial statements included elsewhere in this Annual Report on Form 10-K/A for additional information regarding our reportable segments.present value of future cash flow projections which are the basis of the fair value calculation.
Goodwill and Indefinite-Lived Intangible Assets
Goodwill
Goodwill is recorded as the difference, if any, between the aggregate consideration paid for an acquisition and the fair value of the assets acquired and liabilities assumed resulting from acquisitions. Goodwill is not amortized but instead tested for impairment at least annually or more frequently should an event or circumstances indicate that a reduction in the fair value of thea reporting unit may have occurred. We test for impairment on October 31 of each year, or more frequently if events and circumstances warrant. Such events and circumstances may be a significant change in our business climate, economic and industry trends, legal factors, negative operating performance indicators, significant competition or changes in strategy. Given a change in operating segments occurred in the fourth quarter of 2019, we determined there were multiple reporting units as of October 31, 2019. We perform our goodwill impairment test at the reporting unit level, using a fair value method based on management’s judgments and assumptions or third party valuations. The fair value of a reporting unit refers to the price that would be expected to be received to sell the reporting unit in an orderly transaction between market participants at the measurement date. See Note 18, Segment Information, in the notes to the audited consolidated financial statements included elsewhere in this Annual Report on Form 10-K/A for additional information with respect to our reportable segments.
In testing goodwill for impairment, we first assess qualitative factors to determine whether the existence of events or circumstances leads to a determination that it is more likely than not that the fair value of a reporting unit is less than its carrying amount. If, after assessing the totality of events or circumstances, we determine it is not more likely than not that the fair value of a reporting unit is less than its carrying amount, then additional impairment testing is not required. If the carrying amount of goodwill exceeds the fair value, an impairment loss is recognized in an amount equal to the excess of the carrying amount over the fair value of the reporting unit. We would also be required to reduce the carrying amounts of the related assets on our balance sheet.
Determining the fair value of a reporting unit requires the application of judgment and involves the use of significant estimates and assumptions including, projections of future cash flows, revenue growthincluding forecasted revenues, EBITDA margins, discount rates, weighted average cost ofdebt free net working capital, forecasting future sales and expenses, selecting appropriate discount ratescapital expenditures and other factors which can be affected by changes in business climate, economic conditions, the competitive environment and other factors. We base these fair value estimates on assumptions our management believes to be reasonable but which are unpredictable and inherently uncertain. A change in underlying assumptions would cause a change in the results of the tests and, as such, could cause fair value to be less than the carrying amounts and result in an impairment of goodwill in the future. Additionally, if actual results are not consistent with the estimates and assumptions or if there are significant changes to our planned strategy, it may cause fair value to be less than the carrying amounts and result in additional impairments of goodwill in the future. We corroborate the reasonableness of the total fair value of the reporting unit withby assessing the implied control premium based on our market capitalization. Our market capitalization is calculated using the number of
shares outstanding and stock price of our publicly traded shares. In the event of a goodwill impairment, we would be required to record an impairment, which would impact earnings and reduce the carrying amounts of goodwill on the consolidated balance sheet.
We also consider the amount of headroom for our reporting units when determining whether an impairment existed. Headroom is the difference between the fair value of a reporting unit and its carrying value. In performing our annual impairment analysis as of October 31, 2020,2023, the fair values of the reporting units which were not impaired exceeded their carrying values by amounts ranging from zero4.2% to 150%241.5%. Reporting units in which the fair value exceeded carrying value by less than 10% included $25.6 million of goodwill. Of the $404.3$553.9 million of goodwill, the carrying value equals the fair value for $62.7 millionno reporting units as of October 31, 2020.2023. Thefair values of the respective
65
reporting units were determined primarily by discounting estimated future cash flows, which were determined based on revenue and expense long-term growth assumptions ranging from negative1.0% growth of 20.0% to 3.0% growth, of 5.0%, at a weighted average cost of capital (discount rate)discount rate ranging from 12.9%13.0% to 14.5%15.5%.
The discount rate and long-term growth rate used to determine the fair value of the reporting unit, which exceeded carrying value by less than 10%, were 13.7% and 3.0%, respectively. Changes in these assumptions would have a significant impact on the valuation model. Holding all other assumptions constant, a hypothetical 100 basis point increase in the discount rate assumption would decrease the fair value of the reporting unit by approximately 10.8%, which would result in a hypothetical impairment charge. Holding all other assumptions constant, a hypothetical 100 basis point decrease in the long-term growth rate assumption would decrease the fair value of the reporting unit by approximately 5.4%, which would not result in a hypothetical impairment charge.
Accordingly, a relatively small change in the underlying assumptions, including if the financial performance of the reporting unit does not meet expectations in future years or a decline occurs in the market price of our publicly traded stock, may cause a change in the results of the impairment assessment in future periods and, as such, could result in an impairment of goodwill, for which the carrying amount is $404.3$553.9 million as of December 31, 2020. 2023.The aggregate remaining goodwill carrying value of reporting units with impairment was $404.3 million as of December 31, 2020.
Indefinite-Lived Intangible Assets
The annual evaluation for impairment of indefinite-lived intangible assets is a two-step process. The first step is to perform a qualitative impairment assessment. If this qualitative assessment indicates that, more likely than not, the indefinite lived intangible assets are not impaired, then no further testing is performed. If the qualitative assessment indicates that, more likely than not, the indefinite lived intangible assets are impaired, then the fair value of the indefinite lived intangible assets must be calculated. If the carrying value exceeds the fair value, an impairment loss is recorded for that excess.
Indefinite-lived intangible assets are not amortized but instead tested for impairment at least annually or more frequently should an event or circumstances indicate that a reduction in fair value may have occurred. We test for impairment on October 31 of each year, or more frequently if events and circumstances warrant. Such events and circumstances may be a significant change in our business climate, economic and industry trends, legal factors, negative operating performance indicators, significant competition or changes in strategy. We perform testing of indefinite-lived intangible assets, other than goodwill, at the asset group level using the relief from royalty method. If the carrying value exceeds the fair value, an impairment loss is recorded for that excess.We would also be required to reduce the carrying amounts of the related assets on our balance sheet.
See Note 6, Intangible Assets and Goodwill, in the notes to the consolidated financial statements included elsewhere in this Annual Report on Form 10-K/A10-K for additional information with respect to goodwill and indefinite-lived intangible assets.
Definite-Lived Intangible Assets
Definite-lived intangible assets consist of certain trade names, acquired technology, customer relationships and other amortized intangible assets. The definite-livedDefinite-lived intangible assets are being amortized over their estimated useful lives.lives based on the pattern of expected economic benefit. Intangible assets with finite lives are stated at cost, less accumulated amortization and impairment losses, if any. These intangible assets are amortized on a straight-line basis over the following estimated useful lives, which are reviewed each reporting period:
| ||||
Estimated
| Weighted
| |||
Customer relationship intangibles |
| 9 years | ||
Definite-lived trade names |
|
| ||
Acquired technology |
|
| ||
|
|
| ||
Computer software | 1-7 years | 4 years | ||
With respect to business acquisitions, the fair values of acquired definite-lived intangibles are estimated using a relief from royalty method.the income approach. Input assumptions regardingincluding future cash flows, growth rates, attrition rates, royalty rates, discount rates, tax rates and tax ratesamortization benefits are used in developing the present value of future cash flow projections are the basis of the fair value calculations.
66
Impairment of Long-Lived Assets
We review long-lived assets, including tangible assets and other intangible assets with definitive lives, for impairment whenever events or changes in circumstances indicate that the carrying amount of the assets may not be recoverable. We conduct our long-lived asset impairment analysis by grouping assets and liabilities at the lowest level for which identifiable cash flows are largely independent of the cash flows of other assets and liabilities and evaluate the asset group against the sum of the undiscounted future cash flows. If the undiscounted cash flows do not indicate the carrying amount of the asset group is recoverable, an impairment is measured as the amount by which the carrying amount of the asset group exceeds its fair value based on the discounted cash flow analysis. If the carrying amount of an intangible asset exceeds its fair value, we recognize an impairment loss in an amount equal to that excess.We would also be required to reduce the carrying amounts of the related assets on our balance sheet.
See Note 6, Intangible Assets and Goodwill, in the notes to the consolidated financial statements included elsewhere in this Annual Report on Form 10-K/A10-K for additional information with respect to impairments of long-lived assets.
Stock-Based Compensation
We use share-based compensation, including stock options and restricted stock units, to provide long-term performance incentives for our employees and non-employee directors. We calculate stock-based compensation expense for each vesting tranche of stock options using the Black-Scholes option pricing model and recognize such costs, net of forfeitures, within the consolidated statements of loss(loss) income and comprehensive loss;(loss) income; however, no expense is recognized for awards that do not ultimately vest. The determination of the grant date fair value of stock options using an option-pricing model is affected by a number of assumptions, such as the fair value of the underlying stock, our expected stock price volatility over the expected term of the options, stock option forfeiture behaviors, risk-free interest rates and expected dividends, which we estimated as follows:
| • Fair Value of our Common Stock — The fair value per share of common stock for purposes of determining share-based compensation is the closing price of our common stock as reported on the New York Stock Exchange on the applicable grant date. • Expected Term — The expected option term represents the period of time the option is expected to be outstanding. The simplified method is used to estimate the term as we do not have sufficient exercise history to calculate the expected term of stock options. • Volatility — The expected volatility is based on considering our limited publicly traded stock price and historical average volatilities of similar publicly traded companies corresponding to the expected term of the awards. • Risk-Free Rate — The risk-free rate is based on the yields of United States Treasury securities with maturities similar to the expected term of stock option for each stock option grant. • Forfeiture Rate — Estimates of pre-vesting forfeitures, or forfeiture rates, were based on our internal analysis, which primarily considers the award recipients’ position within the Company. • Dividend Yield — Prior to the IPO, we had never declared or paid any cash dividends and had no intention to pay cash dividends. Consequently, we used an expected dividend yield of zero with respect to pre-IPO options. In connection with our IPO, we adopted a policy of paying quarterly cash dividends on our common stock. Our post-IPO stock option grants include an expected dividend yield which is commensurate with the annual dividends we had been paying since the IPO, until the dividend was suspended in the first quarter of 2020.
|
|
|
|
|
|
|
|
|
|
|
|
See Note 12, Stock-Based Compensation, in the notes to the consolidated financial statements included elsewhere in this Annual Report on Form 10-K/A10-K for additional information with respect to stock-based compensation.
Income Taxes
We provide for income taxes utilizing the asset and liability method of accounting. Under this method, deferred income taxes are recorded to reflect the tax consequences in future years of differences between the tax basesbasis of assets and liabilities and their financial reporting amounts at each balance sheet date, based on enacted tax laws and statutory
67
tax rates applicable to the periods in which the differences are expected to affect taxable income. If it is determined that it is more likely than not that future tax benefits associated with a deferred tax asset will not be realized, a valuation allowance is provided. The effect on deferred tax assets and liabilities of a change in the tax rates is recognized in the consolidated statements of loss(loss) income and comprehensive loss(loss) income as an adjustment to income tax expense in the period that includes the enactment date.
We record a liability for unrecognized tax benefits resulting from uncertain tax positions taken or expected to be taken in a tax return. We recognize interest and penalties, if any, related to unrecognized tax benefits in income tax expense. See Note 15, Income Taxes, in the notes to our audited consolidated financial statements included elsewhere in this Annual Report on Form 10-K/A.10-K.
68
Item 7A. Quantitative and Qualitative Disclosures About Market Risk.
Market risk is the potential loss arising from adverse changes in market rates and prices. Our primary exposure to market risk is interest rate risk associated with our Amended and Restated Senior Secured Credit Facilities. See “Management’s Discussion and Analysis of Financial Condition and Results of Operations—Long-Term Debt—Amended and Restated Senior Secured Credit Facilities” for further description of our Amended and Restated Senior Secured Credit Facilities. As of December 31, 2020,2023, we had $525.2$413.3 million of variable rate term loan borrowings outstanding under our Amended and Restated Senior Secured Credit Facilities and no variable rate borrowings outstanding under our Amended and Restated Revolving Credit Facility with respect to which we are exposed to interest rate risk. Holding other variables constant and assuming no interest rate hedging, a 0.25% increase in the average interest rate on our variable rate indebtedness would have resulted in a $1.3$1.0 million increase in annual interest expense based on the amount of borrowings outstanding as of December 31, 2020.2023.
In March 2014, we entered into forward interest rate swap and floor contracts with the Royal Bank of Canada, which modify our exposure to interest rate risk by effectively converting $100.0 million of floating-rate borrowings under our Term Loan Facility to a fixed rate basis, thus reducing the impact of interest-rate changes on future interest expense, which expired on December 31, 2018. The swap agreement involved the receipt of floating rate amounts at three-month LIBOR in exchange for fixed rate interest payments at 2.705% over the life of the agreement without an exchange of the underlying principal amount of $100.0 million. In the event that the three-month LIBOR rate dropped below 1.25%, the interest rate floor contract required us to make variable payments based on an underlying principal amount of $100.0 million and the differential between the three-month LIBOR rate and 1.25%. The interest rate swap and floor had an effective date of December 31, 2015 and was settled on the last business day of each month of March, June, September and December, beginning March 31, 2016 through December 31, 2018. We have not entered into a new forward interest rate swap and floor contract to hedge any portion of our Amended and Restated Senior Secured Credit Facilities subsequent to expiration on December 31, 2018.
Our former interest rate swap and floor contracts were not designated as effective hedges for accounting purposes. Accordingly, during the year ended December 31, 2018 we marked to market the interest rate swap and floor quarterly with the unrealized and realized gain or loss recognized in interest expense, in the consolidated statements of loss and comprehensive loss and the net liability was included in other current liabilities and other noncurrent liabilities in the consolidated balance sheets.
For the years ended December 31, 2020 and 2019 we recorded no unrealized or realized gains or losses on our former interest rate swap and floor agreement. For the year ended December 31, 2018 we recorded an unrealized gain of $0.8 million and a realized net loss of $0.5 million on our interest rate swap and floor agreement in the consolidated statement of loss and comprehensive loss. The impact of the gains and losses on the interest rate swap and floor agreement were recorded in interest expense. The interest rate swap and floor contracts were designated as Level 2 financial instruments. At December 31, 2020 and 2019 the liability related to the swap and floor financial instruments was zero.
Inflation rates may impact the financial statements and operating results in several areas. Inflation influences interest rates, which in turn impact the fair value of our investments and yields on new investments. Operating expenses, including payrolls, are impacted to a certain degree by the inflation rate. We do not believe that inflation has had a material effect on our results of operations for the periods presented.
However, recent economic trends have resulted in inflationary conditions, including pressure on wages, and sustained inflationary conditions in future periods could affect our business.
69
Item 8. Financial Statements and Supplementary Data.
INDEX TO CONSOLIDATED FINANCIAL STATEMENTS
Report of Independent Registered Public Accounting Firm (PCAOB ID: 238) |
|
Consolidated Balance Sheets as of December 31, |
|
| |
| |
| |
| |
| |
|
70
Report of Independent Registered Public Accounting Firm
To the Board of Directors and Stockholders of Emerald Holding, Inc.
OpinionOpinions on the Financial Statements and Internal Control over Financial Reporting
We have audited the accompanying consolidated balance sheets of Emerald Holding, Inc. and its subsidiaries (the “Company”) as of December 31, 20202023 and 2019,2022, and the related consolidated statements of loss(loss) income and comprehensive loss,(loss) income, of redeemable convertible preferred stock and stockholders’ equity (deficit)deficit and of cash flows for each of the three years in the period ended December 31, 2020,2023, including the related notes and financial statement schedules listed in the accompanying index (collectively referred to as the “consolidated financial statements”). We also have audited the Company's internal control over financial reporting as of December 31, 2023, based on criteria established in Internal Control - Integrated Framework (2013) issued by the Committee of Sponsoring Organizations of the Treadway Commission (COSO).
In our opinion, the consolidated financial statements referred to above present fairly, in all material respects, the financial position of the Company as of December 31, 20202023 and 2019,2022, and the results of its operations and its cash flows for each of the three years in the period ended December 31, 20202023 in conformity with accounting principles generally accepted in the United States of America. Also in our opinion, the Company maintained, in all material respects, effective internal control over financial reporting as of December 31, 2023, based on criteria established in Internal Control - Integrated Framework (2013) issued by the COSO.
Restatement of Previously Issued Financial StatementsBasis for Opinions
As discussed in Note 1 to theThe Company's management is responsible for these consolidated financial statements, the Company has restatedfor maintaining effective internal control over financial reporting, and for its 2020 financial statements to correct errors.
Change in Accounting Principle
As discussed in Note 8 to the consolidated financial statements, the Company changed the manner in which it accounts for leases in 2019.
Basis for Opinion
These consolidated financial statements are the responsibilityassessment of the Company’s management.effectiveness of internal control over financial reporting, included in Management’s Report on Internal Control over Financial Reporting appearing under Item 9A. Our responsibility is to express an opinionopinions on the Company’s consolidated financial statements and on the Company's internal control over financial reporting based on our audits. We are a public accounting firm registered with the Public Company Accounting Oversight Board (United States) (PCAOB) and are required to be independent with respect to the Company in accordance with the U.S. federal securities laws and the applicable rules and regulations of the Securities and Exchange Commission and the PCAOB.
We conducted our audits of these consolidated financial statements in accordance with the standards of the PCAOB. Those standards require that we plan and perform the audits to obtain reasonable assurance about whether the consolidated financial statements are free of material misstatement, whether due to error or fraud. The Company is not required to have, nor were we engaged to perform, an audit of its internal control over financial reporting. As part of our audits we are required to obtain an understanding offraud, and whether effective internal control over financial reporting but not for the purpose of expressing an opinion on the effectivenesswas maintained in all material respects.
Our audits of the Company's internal control overconsolidated financial reporting. Accordingly, we express no such opinion.
Our auditsstatements included performing procedures to assess the risks of material misstatement of the consolidated financial statements, whether due to error or fraud, and performing procedures that respond to those risks. Such procedures included examining, on a test basis, evidence regarding the amounts and disclosures in the consolidated financial statements. Our audits also included evaluating the accounting principles used and significant estimates made by management, as well as evaluating the overall presentation of the consolidated financial statements. Our audit of internal control over financial reporting included obtaining an understanding of internal control over financial reporting, assessing the risk that a material weakness exists, and testing and evaluating the design and operating effectiveness of internal control based on the assessed risk. Our audits also included performing such other procedures as we considered necessary in the circumstances. We believe that our audits provide a reasonable basis for our opinion.opinions.
/s/ PricewaterhouseCoopers LLPDefinition and Limitations of Internal Control over Financial Reporting
Irvine, California
February 23, 2021, exceptA company’s internal control over financial reporting is a process designed to provide reasonable assurance regarding the reliability of financial reporting and the preparation of financial statements for external purposes in accordance with generally accepted accounting principles. A company’s internal control over financial reporting includes those policies and procedures that (i) pertain to the effectsmaintenance of records that, in reasonable detail, accurately and fairly reflect the transactions and dispositions of the restatement discussedassets of the company; (ii) provide reasonable assurance that transactions are recorded as necessary to permit preparation of financial statements in Note 1accordance with generally accepted accounting principles, and that receipts and expenditures of the company are being made
71
only in accordance with authorizations of management and directors of the company; and (iii) provide reasonable assurance regarding prevention or timely detection of unauthorized acquisition, use, or disposition of the company’s assets that could have a material effect on the financial statements.
Because of its inherent limitations, internal control over financial reporting may not prevent or detect misstatements. Also, projections of any evaluation of effectiveness to future periods are subject to the risk that controls may become inadequate because of changes in conditions, or that the degree of compliance with the policies or procedures may deteriorate.
Critical Audit Matters
The critical audit matters communicated below are matters arising from the current period audit of the consolidated financial statements that were communicated or required to be communicated to the audit committee and that (i) relate to accounts or disclosures that are material to the consolidated financial statements and Note 1 to(ii) involved our especially challenging, subjective, or complex judgments. The communication of critical audit matters does not alter in any way our opinion on the consolidated financial statement Schedule I,statements, taken as a whole, and we are not, by communicating the critical audit matters below, providing separate opinions on the critical audit matters or on the accounts or disclosures to which the date is November 5, 2021they relate.
Goodwill Impairment Assessments – Certain Reporting Units
As described in Notes 1 and 6 to the consolidated financial statements, the Company’s consolidated goodwill balance was $553.9 million as of December 31, 2023, of which a portion relates to certain reporting units. Management tests goodwill for impairment on October 31 of each year, or more frequently should an event or a change in circumstances occur that would indicate the carrying value may be impaired. If the carrying amount of a reporting unit exceeds its fair value, an impairment is recorded equal to the amount by which the carrying value exceeds the fair value, up to the amount of goodwill associated with the reporting unit. During the fourth quarter of 2023, the Company changed its operating segments which resulted in a change in reporting units. Under accounting standards, management is required to perform an impairment assessment of the Company’s prior reporting units immediately prior to the change in reporting units and immediately after the change on the Company’s new reporting units. Due to the change in reporting units, management performed a quantitative assessment of the fair value of the Company’s prior and new reporting units as of October 31, 2023 using an income approach, and no goodwill impairment was recorded. Determining the fair value of a reporting unit requires the application of judgment and involves the use of significant estimates and assumptions including, projections of future cash flows, which include forecasted revenue, earnings before interest, taxes, depreciation, and amortization (EBITDA) margin, discount rate, debt free net working capital, capital expenditures and other factors which can be affected by changes in business climate, economic conditions, the competitive environment and other factors.
The principal considerations for our determination that performing procedures relating to the goodwill impairment assessments of certain reporting units is a critical audit matter are (i) the significant judgment by management when developing the fair value estimate of certain reporting units; (ii) a high degree of auditor judgment, subjectivity, and effort in performing procedures and evaluating management’s significant assumptions related to forecasted revenues, EBITDA margins, discount rates, debt free net working capital, and capital expenditures with respect to each of the certain reporting units when considered applicable; and (iii) the audit effort involved the use of professionals with specialized skill and knowledge.
Addressing the matter involved performing procedures and evaluating audit evidence in connection with forming our overall opinion on the consolidated financial statements. These procedures included testing the effectiveness of controls relating to management’s goodwill impairment assessments, including controls over the valuation of certain reporting units. These procedures also included, among others (i) testing management’s process for developing the fair value estimate of certain reporting units; (ii) evaluating the appropriateness of the income approach used by management; (iii) testing the completeness and accuracy of underlying data used in the income approach; and (iv) evaluating the reasonableness of the significant assumptions used by management related to forecasted revenues, EBITDA margins, discount rates, debt free net working capital, and capital expenditures with respect to each of the certain reporting units when considered applicable. Evaluating management’s assumptions related to forecasted revenues, EBITDA margins, debt free net working capital, and capital expenditures involved evaluating whether the assumptions used by management were reasonable considering (i) the current and past performance of certain
72
reporting units; (ii) whether these assumptions were consistent with evidence obtained in other areas of the audit; and (iii) for forecasted revenues, EBITDA margins, and capital expenditures, whether the assumptions were consistent with industry data. Professionals with specialized skill and knowledge were used to assist in evaluating the appropriateness of the income approach and the reasonableness of the discount rate assumption.
Indefinite-Lived Intangible Asset Impairment Assessment - A Certain Indefinite-Lived Trade Name
As described in Notes 1 and 6 to the consolidated financial statements, the Company’s indefinite-lived intangible assets consist of trade names. The Company’s consolidated indefinite-lived trade names balance was $52.6 million as of December 31, 2023, of which a portion relates to a certain indefinite-lived trade name. Indefinite-lived intangible assets are tested annually for impairment at October 31, or between annual tests if the Company becomes aware of an event or a change in circumstances that would indicate the carrying value of an asset group may be impaired. The fair value of the trade name is then compared to the carrying value of each trade name. If the carrying amount of the trade name exceeds its fair value, an impairment loss would be reported. On October 31, 2023, management performed a quantitative analysis for the annual impairment assessment for indefinite-lived intangible assets and no impairments were identified. The fair values of the Company’s indefinite-lived trade name asset groups are calculated by management using a form of the income approach referred to as the “relief from royalty payments” method. Determining the fair value of an indefinite-lived intangible asset group requires the application of judgment and involves the use of significant estimates and assumptions, including projections of future cash flows, which include forecasted revenue, EBITDA margin, discount rate, tax rate, and royalty rate.
The principal considerations for our determination that performing procedures relating to the indefinite-lived intangible asset impairment assessment of a certain indefinite-lived trade name is a critical audit matter are (i) the significant judgment by management when developing the fair value estimate of a certain indefinite-lived trade name; (ii) a high degree of auditor judgment, subjectivity, and effort in performing procedures and evaluating management’s significant assumptions related to forecasted revenues, EBITDA margins, the discount rate, and the royalty rate; and (iii) the audit effort involved the use of professionals with specialized skill and knowledge.
Addressing the matter involved performing procedures and evaluating audit evidence in connection with forming our overall opinion on the consolidated financial statements. These procedures included testing the effectiveness of controls relating to management’s indefinite-lived intangible asset impairment assessments, including controls over the valuation of a certain indefinite-lived trade name. These procedures also included, among others (i) testing management’s process for developing the fair value estimate of a certain indefinite-lived trade name; (ii) evaluating the appropriateness of the relief from royalty payments method used by management; (iii) testing the completeness and accuracy of underlying data used in the relief from royalty payments method; and (iv) evaluating the reasonableness of the significant assumptions used by management related to forecasted revenues, EBITDA margins, the discount rate, and the royalty rate. Evaluating management’s assumptions related to forecasted revenues and EBITDA margins involved evaluating whether the assumptions used by management were reasonable considering (i) the current and past performance of the brand associated with a certain indefinite-lived trade name; (ii) the consistency with industry data; and (iii) whether these assumptions were consistent with evidence obtained in other areas of the audit. Professionals with specialized skill and knowledge were used to assist in evaluating the appropriateness of the relief from royalty payments method and the reasonableness of the discount rate and royalty rate assumptions.
/s/ PricewaterhouseCoopers LLP
Irvine, California
March 4, 2024
We have served as the Company'sCompany’s auditor since 2015.
73
Emerald Holding, Inc.
Consolidated Balance Sheets
December 31, 20202023 and 20192022
(dollars in millions, share data in thousands, except par value) |
| 2023 |
|
| 2022 |
| ||
Assets |
|
|
|
|
|
| ||
Current assets |
|
|
|
|
|
| ||
Cash and cash equivalents |
| $ | 204.2 |
|
| $ | 239.1 |
|
Trade and other receivables, net of allowances of $1.4 million |
|
| 85.2 |
|
|
| 74.9 |
|
Prepaid expenses and other current assets |
|
| 21.5 |
|
|
| 17.8 |
|
Total current assets |
|
| 310.9 |
|
|
| 331.8 |
|
Noncurrent assets |
|
|
|
|
|
| ||
Property and equipment, net |
|
| 1.5 |
|
|
| 2.2 |
|
Intangible assets, net |
|
| 175.1 |
|
|
| 204.8 |
|
Goodwill, net |
|
| 553.9 |
|
|
| 545.5 |
|
Right-of-use lease assets |
|
| 8.8 |
|
|
| 10.6 |
|
Other noncurrent assets |
|
| 3.7 |
|
|
| 3.5 |
|
Total assets |
| $ | 1,053.9 |
|
| $ | 1,098.4 |
|
Liabilities, Redeemable Convertible Preferred Stock and Stockholders’ Deficit |
|
|
|
|
|
| ||
Current liabilities |
|
|
|
|
|
| ||
Accounts payable and other current liabilities |
| $ | 46.6 |
|
| $ | 58.1 |
|
Income tax payable |
|
| 0.2 |
|
|
| 1.2 |
|
Cancelled event liabilities |
|
| 0.6 |
|
|
| 3.3 |
|
Deferred revenues |
|
| 174.3 |
|
|
| 151.2 |
|
Contingent consideration |
|
| 0.2 |
|
|
| 3.5 |
|
Right-of-use lease liabilities, current portion |
|
| 4.0 |
|
|
| 4.9 |
|
Term loan, current portion |
|
| 4.2 |
|
|
| — |
|
Total current liabilities |
|
| 230.1 |
|
|
| 222.2 |
|
Noncurrent liabilities |
|
|
|
|
|
| ||
Term loan, net of discount and deferred financing fees |
|
| 398.7 |
|
|
| 413.9 |
|
Deferred tax liabilities, net |
|
| 3.1 |
|
|
| 1.8 |
|
Right-of-use lease liabilities, noncurrent portion |
|
| 8.9 |
|
|
| 10.4 |
|
Other noncurrent liabilities |
|
| 8.5 |
|
|
| 10.8 |
|
Total liabilities |
|
| 649.3 |
|
|
| 659.1 |
|
Commitments and contingencies (Note 16) |
|
|
|
|
|
| ||
Redeemable convertible preferred stock |
|
|
|
|
|
| ||
7% Series A Convertible Participating Preferred Stock, |
|
| 497.1 |
|
|
| 472.4 |
|
Stockholders’ deficit |
|
|
|
|
|
| ||
Common stock, $0.01 par value; authorized shares at December 31, 2023 |
|
| 0.6 |
|
|
| 0.7 |
|
Additional paid-in capital |
|
| 559.2 |
|
|
| 610.3 |
|
Accumulated deficit |
|
| (652.3 | ) |
|
| (644.1 | ) |
Total stockholders’ deficit |
|
| (92.5 | ) |
|
| (33.1 | ) |
Total liabilities, redeemable convertible preferred stock and |
| $ | 1,053.9 |
|
| $ | 1,098.4 |
|
The accompanying notes are an integral part of these consolidated financial statements.
74
Emerald Holding, Inc.
Consolidated Statements of (Loss) Income and Comprehensive (Loss) Income
(dollars in millions, share data in thousands, except par value) |
| 2020 (As Restated) |
|
| 2019 |
| ||
Assets |
|
|
|
|
|
|
|
|
Current assets |
|
|
|
|
|
|
|
|
Cash and cash equivalents |
| $ | 295.3 |
|
| $ | 9.6 |
|
Trade and other receivables, net of allowances of $1.1 million and $0.7 million, as of December 31, 2020 and 2019, respectively |
|
| 30.7 |
|
|
| 60.1 |
|
Insurance receivables |
|
| 17.8 |
|
|
| — |
|
Prepaid expenses |
|
| 8.5 |
|
|
| 24.0 |
|
Total current assets |
|
| 352.3 |
|
|
| 93.7 |
|
Noncurrent assets |
|
|
|
|
|
|
|
|
Property and equipment, net |
|
| 3.9 |
|
|
| 4.2 |
|
Intangible assets, net |
|
| 275.0 |
|
|
| 373.8 |
|
Goodwill |
|
| 404.3 |
|
|
| 980.3 |
|
Right-of-use lease assets |
|
| 16.0 |
|
|
| 18.3 |
|
Other noncurrent assets |
|
| 2.9 |
|
|
| 1.4 |
|
Total assets |
| $ | 1,054.4 |
|
| $ | 1,471.7 |
|
Liabilities, Redeemable Convertible Preferred Stock and Stockholders’ Equity (Deficit) |
|
|
|
|
|
|
|
|
Current liabilities |
|
|
|
|
|
|
|
|
Accounts payable and other current liabilities |
| $ | 31.1 |
|
| $ | 22.2 |
|
Cancelled event liabilities |
|
| 25.9 |
|
|
| — |
|
Deferred revenues |
|
| 48.6 |
|
|
| 187.3 |
|
Revolving credit facility |
|
| — |
|
|
| 10.0 |
|
Right-of-use lease liabilities, current portion |
|
| 4.3 |
|
|
| 4.1 |
|
Term loan, current portion |
|
| 5.7 |
|
|
| 5.7 |
|
Total current liabilities |
|
| 115.6 |
|
|
| 229.3 |
|
Noncurrent liabilities |
|
|
|
|
|
|
|
|
Term loan, net of discount and deferred financing fees |
|
| 515.3 |
|
|
| 519.7 |
|
Deferred tax liabilities, net |
|
| 1.9 |
|
|
| 60.0 |
|
Right-of-use lease liabilities, noncurrent portion |
|
| 13.4 |
|
|
| 15.7 |
|
Other noncurrent liabilities |
|
| 13.7 |
|
|
| 6.8 |
|
Total liabilities |
|
| 659.9 |
|
|
| 831.5 |
|
Commitments and contingencies (Note 16) |
|
|
|
|
|
|
|
|
Redeemable convertible preferred stock |
|
|
|
|
|
|
|
|
7% Series A Convertible Participating Preferred Stock, $0.01 par value; authorized shares at December 31, 2020 and 2019: 80,000; 71,445 and 0 shares issued and outstanding; aggregate liquidation preference $414.4 and 0 at December 31, 2020 and 2019, respectively |
| 398.3 |
|
|
| — |
| |
Stockholders’ equity (deficit) |
|
|
|
|
|
|
|
|
Common stock, $0.01 par value; authorized shares at December 31, 2020 and 2019: 800,000; 72,195 and 71,352 shares issued and outstanding at December 31, 2020 and 2019, respectively |
|
| 0.7 |
|
|
| 0.7 |
|
Additional paid-in capital |
|
| 690.7 |
|
|
| 701.1 |
|
Accumulated deficit |
|
| (695.2 | ) |
|
| (61.6 | ) |
Total stockholders’ equity (deficit) |
|
| (3.8 | ) |
|
| 640.2 |
|
Total liabilities, redeemable convertible preferred stock and stockholders’ equity (deficit) |
| $ | 1,054.4 |
|
| $ | 1,471.7 |
|
Years Ended December 31, 2023, 2022 and 2021
(dollars in millions, share data in thousands except loss per share) |
| 2023 |
|
| 2022 |
|
| 2021 |
| |||
Revenues |
| $ | 382.8 |
|
| $ | 325.9 |
|
| $ | 145.5 |
|
Other income, net |
|
| 2.8 |
|
|
| 182.8 |
|
|
| 77.4 |
|
Cost of revenues |
|
| 137.6 |
|
|
| 116.5 |
|
|
| 57.1 |
|
Selling, general and administrative expense |
|
| 168.3 |
|
|
| 145.0 |
|
|
| 143.0 |
|
Depreciation and amortization expense |
|
| 45.0 |
|
|
| 59.5 |
|
|
| 47.6 |
|
Goodwill impairment charge |
|
| — |
|
|
| 6.3 |
|
|
| 7.2 |
|
Intangible asset impairment charge |
|
| — |
|
|
| 1.6 |
|
|
| 32.7 |
|
Operating income (loss) |
|
| 34.7 |
|
|
| 179.8 |
|
|
| (64.7 | ) |
Interest expense |
|
| 43.3 |
|
|
| 24.5 |
|
|
| 15.9 |
|
Interest income |
|
| 8.2 |
|
|
| 2.7 |
|
|
| 0.1 |
|
Loss on extinguishment of debt |
|
| 2.3 |
|
|
| — |
|
|
| — |
|
Other expense |
|
| — |
|
|
| — |
|
|
| 0.1 |
|
Loss on disposal of fixed assets |
|
| 0.2 |
|
|
| — |
|
|
| 0.4 |
|
(Loss) income before income taxes |
|
| (2.9 | ) |
|
| 158.0 |
|
|
| (81.0 | ) |
Provision for (benefit from) income taxes |
|
| 5.3 |
|
|
| 27.2 |
|
|
| (1.3 | ) |
Net (loss) income and comprehensive |
| $ | (8.2 | ) |
| $ | 130.8 |
|
| $ | (79.7 | ) |
Accretion to redemption value of redeemable convertible preferred stock |
|
| (42.0 | ) |
|
| (38.8 | ) |
|
| (35.6 | ) |
Participation rights on if-converted basis |
|
| — |
|
|
| (60.2 | ) |
|
| — |
|
Net (loss) income and comprehensive (loss) income |
| $ | (50.2 | ) |
| $ | 31.8 |
|
| $ | (115.3 | ) |
Basic (loss) income per share |
| $ | (0.78 | ) |
| $ | 0.46 |
|
| $ | (1.62 | ) |
Diluted (loss) income per share |
| $ | (0.78 | ) |
| $ | 0.46 |
|
| $ | (1.62 | ) |
Basic weighted average common shares outstanding |
|
| 63,959 |
|
|
| 69,002 |
|
|
| 71,309 |
|
Diluted weighted average common shares outstanding |
|
| 63,959 |
|
|
| 69,148 |
|
|
| 71,309 |
|
|
|
|
|
|
|
|
|
|
| |||
The accompanying notes are an integral part of these consolidated financial statements.
75
Emerald Holding, Inc.
Consolidated Statements of Loss and Comprehensive Loss
Years Ended December 31, 2020, 2019 and 2018
(dollars in millions, share data in thousands except earnings per share) |
| 2020 (As Restated) |
|
| 2019 |
|
| 2018 |
| |||
Revenues |
| $ | 127.4 |
|
| $ | 360.9 |
|
| $ | 380.7 |
|
Other income |
|
| 107.0 |
|
|
| 6.1 |
|
|
| — |
|
Cost of revenues |
|
| 57.6 |
|
|
| 120.2 |
|
|
| 112.1 |
|
Selling, general and administrative expense |
|
| 118.6 |
|
|
| 133.4 |
|
|
| 121.8 |
|
Depreciation and amortization expense |
|
| 48.6 |
|
|
| 52.0 |
|
|
| 46.8 |
|
Goodwill impairments |
|
| 603.4 |
|
|
| 69.1 |
|
|
| — |
|
Intangible asset impairments |
|
| 76.8 |
|
|
| 17.0 |
|
|
| 104.3 |
|
Operating loss |
|
| (670.6 | ) |
|
| (24.7 | ) |
|
| (4.3 | ) |
Interest expense |
|
| 20.6 |
|
|
| 30.3 |
|
|
| 29.1 |
|
Loss before income taxes |
|
| (691.2 | ) |
|
| (55.0 | ) |
|
| (33.4 | ) |
Benefit from income taxes |
|
| (57.6 | ) |
|
| (5.0 | ) |
|
| (8.3 | ) |
Net loss and comprehensive loss |
|
| (633.6 | ) |
|
| (50.0 | ) |
|
| (25.1 | ) |
Accretion to redemption value of redeemable convertible preferred stock |
|
| (15.6 | ) |
|
| — |
|
|
| — |
|
Net loss and comprehensive loss attributable to Emerald Holding, Inc. common stockholders |
| $ | (649.2 | ) |
| $ | (50.0 | ) |
| $ | (25.1 | ) |
|
|
|
|
|
|
|
|
|
|
|
|
|
Basic loss per share |
| $ | (9.09 | ) |
| $ | (0.70 | ) |
| $ | (0.34 | ) |
Diluted loss per share |
| $ | (9.09 | ) |
| $ | (0.70 | ) |
| $ | (0.34 | ) |
Basic weighted average common shares outstanding |
|
| 71,431 |
|
|
| 71,719 |
|
|
| 72,887 |
|
Diluted weighted average common shares outstanding |
|
| 71,431 |
|
|
| 71,719 |
|
|
| 72,887 |
|
|
|
|
|
|
|
|
|
|
|
|
|
|
Emerald Holding, Inc.
Consolidated Statements of Redeemable Convertible Preferred Stock and Stockholders’ Equity (Deficit)Deficit
Years Ended December 31, 2020, 20192023, 2022 and 2018
|
|
|
|
|
|
|
|
|
|
| Total Emerald Holding, Inc Stockholder's Equity (Deficit) |
| |||||||||||||||||
|
| Redeemable Convertible Preferred Stock |
|
|
| Common Stock |
|
| Additional Paid-in |
|
| (Accumulated Deficit) Retained |
|
| Total Stockholders’ Equity |
| |||||||||||||
(shares in thousands; dollars in millions) |
| Shares |
|
| Amount |
|
|
| Shares |
|
| Amount |
|
| Capital |
|
| Earnings |
|
| (Deficit) |
| |||||||
Balances at December 31, 2017 |
|
| — |
|
| $ | — |
|
|
|
| 72,604 |
|
| $ | 0.7 |
|
| $ | 677.1 |
|
| $ | 83.4 |
|
| $ | 761.2 |
|
Stock-based compensation |
|
| — |
|
|
| — |
|
|
|
| 13 |
|
|
| — |
|
|
| 6.1 |
|
|
| — |
|
|
| 6.1 |
|
Dividends on common stock |
|
| — |
|
|
| — |
|
|
|
| — |
|
|
| — |
|
|
| — |
|
|
| (21.0 | ) |
|
| (21.0 | ) |
Issuance of common stock under equity plans |
|
| — |
|
|
| — |
|
|
|
| 601 |
|
|
| — |
|
|
| 6.5 |
|
|
| — |
|
|
| 6.5 |
|
Repurchase of common stock |
|
| — |
|
|
| — |
|
|
|
| (1,627 | ) |
|
| — |
|
|
| — |
|
|
| (19.4 | ) |
|
| (19.4 | ) |
Net loss and comprehensive loss |
|
| — |
|
|
| — |
|
|
|
| — |
|
|
| — |
|
|
| — |
|
|
| (25.1 | ) |
|
| (25.1 | ) |
Balances at December 31, 2018 |
|
| — |
|
| $ | — |
|
|
|
| 71,591 |
|
| $ | 0.7 |
|
| $ | 689.7 |
|
| $ | 17.9 |
|
| $ | 708.3 |
|
Stock-based compensation |
|
| — |
|
|
| — |
|
|
|
| 77 |
|
|
| — |
|
|
| 7.2 |
|
|
| — |
|
|
| 7.2 |
|
Dividends on common stock |
|
| — |
|
|
| — |
|
|
|
| — |
|
|
| — |
|
|
| — |
|
|
| (21.3 | ) |
|
| (21.3 | ) |
Issuance of common stock under equity plans |
|
| — |
|
|
| — |
|
|
|
| 537 |
|
|
| — |
|
|
| 4.3 |
|
|
| — |
|
|
| 4.3 |
|
Repurchase of common stock |
|
| — |
|
|
| — |
|
|
|
| (853 | ) |
|
| — |
|
|
| (0.1 | ) |
|
| (8.2 | ) |
|
| (8.3 | ) |
Net loss and comprehensive loss |
|
| — |
|
|
| — |
|
|
|
| — |
|
|
| — |
|
|
| — |
|
|
| (50.0 | ) |
|
| (50.0 | ) |
Balances at December 31, 2019 |
|
| — |
|
| $ | — |
|
|
|
| 71,352 |
|
| $ | 0.7 |
|
| $ | 701.1 |
|
| $ | (61.6 | ) |
| $ | 640.2 |
|
Stock-based compensation |
|
| — |
|
|
| — |
|
|
|
| 207 |
|
|
| — |
|
|
| 6.9 |
|
|
| — |
|
|
| 6.9 |
|
Dividends on common stock |
|
| — |
|
|
| — |
|
|
|
| — |
|
|
| — |
|
|
| (5.4 | ) |
|
| — |
|
|
| (5.4 | ) |
Issuance of common stock under equity plans |
|
| — |
|
|
| — |
|
|
|
| 46 |
|
|
| — |
|
|
| 0.2 |
|
|
| — |
|
|
| 0.2 |
|
Issuance of common stock for acquisition |
|
| — |
|
|
| — |
|
|
|
| 806 |
|
|
| — |
|
|
| 4.4 |
|
|
| — |
|
|
| 4.4 |
|
Issuance of redeemable convertible preferred stock, net of offering costs |
|
| 71,446 |
|
|
| 382.7 |
|
|
|
| — |
|
|
| — |
|
|
| — |
|
|
| — |
|
|
| — |
|
Accretion to redemption value of redeemable convertible preferred stock |
|
| — |
|
|
| 15.6 |
|
|
|
| — |
|
|
| — |
|
|
| (15.6 | ) |
|
| — |
|
|
| (15.6 | ) |
Redeemable convertible preferred stock conversion |
|
| (1 | ) |
|
| — |
|
|
|
| 2 |
|
|
| — |
|
|
| — |
|
|
| — |
|
|
| — |
|
Repurchase of common stock |
|
| — |
|
|
| — |
|
|
|
| (218 | ) |
|
| — |
|
|
| (0.9 | ) |
|
| — |
|
|
| (0.9 | ) |
Net loss and comprehensive loss |
|
| — |
|
|
| — |
|
|
|
| — |
|
|
| — |
|
|
| — |
|
|
| (633.6 | ) |
|
| (633.6 | ) |
Balances at December 31, 2020 (As Restated) |
|
| 71,445 |
|
| $ | 398.3 |
|
|
|
| 72,195 |
|
| $ | 0.7 |
|
| $ | 690.7 |
|
| $ | (695.2 | ) |
| $ | (3.8 | ) |
The accompanying notes are an integral part of these consolidated financial statements.2021
Emerald Holding, Inc.
Consolidated Statements of Cash Flows
Years Ended December 31, 2020, 2019 and 2018
(in millions) |
| 2020 |
|
| 2019 |
|
| 2018 |
| |||
Operating activities |
|
|
|
|
|
|
|
|
|
|
|
|
Net loss |
| $ | (633.6 | ) |
| $ | (50.0 | ) |
| $ | (25.1 | ) |
Adjustments to reconcile net loss to net cash (used in) provided by operating activities: |
|
|
|
|
|
|
|
|
|
|
|
|
Stock-based compensation |
|
| 6.7 |
|
|
| 7.7 |
|
|
| 6.1 |
|
Provision for credit losses |
|
| 0.7 |
|
|
| — |
|
|
| — |
|
Provision for doubtful accounts |
|
| — |
|
|
| 0.6 |
|
|
| 0.5 |
|
Depreciation and amortization |
|
| 48.6 |
|
|
| 52.0 |
|
|
| 46.8 |
|
Goodwill impairments |
|
| 603.4 |
|
|
| 69.1 |
|
|
| — |
|
Intangible asset impairments |
|
| 76.8 |
|
|
| 17.0 |
|
|
| 104 |
|
Non-cash operating lease expense |
|
| 3.3 |
|
|
| 3.2 |
|
|
| — |
|
Amortization of deferred financing fees and debt discount |
|
| 1.5 |
|
|
| 1.4 |
|
|
| 1.7 |
|
Unrealized gain on interest rate swap and floor |
|
| — |
|
|
| — |
|
|
| (0.8 | ) |
Deferred income taxes |
|
| (58.1 | ) |
|
| (15.4 | ) |
|
| (24.8 | ) |
Remeasurement of contingent consideration |
|
| 1.5 |
|
|
| — |
|
|
| 0.5 |
|
Changes in operating assets and liabilities, net of effect of businesses acquired: |
|
|
|
|
|
|
|
|
|
|
|
|
Trade and other receivables |
|
| 30.6 |
|
|
| 3.4 |
|
|
| 1.0 |
|
Insurance receivables |
|
| (17.8 | ) |
|
| — |
|
|
| — |
|
Prepaid expenses |
|
| 15.6 |
|
|
| (4.2 | ) |
|
| 3.7 |
|
Other noncurrent assets |
|
| (1.8 | ) |
|
| 0.1 |
|
|
| — |
|
Accounts payable and other current liabilities |
|
| 5.7 |
|
|
| (7.1 | ) |
|
| 4.4 |
|
Cancelled event liabilities |
|
| 25.9 |
|
|
| — |
|
|
| — |
|
Deferred revenues |
|
| (140.0 | ) |
|
| (6.4 | ) |
|
| (12.3 | ) |
Operating lease liabilities |
|
| (3.2 | ) |
|
| (3.2 | ) |
|
| — |
|
Other noncurrent liabilities |
|
| (2.9 | ) |
|
| (0.4 | ) |
|
| (2.1 | ) |
Net cash (used in) provided by operating activities |
|
| (37.1 | ) |
|
| 67.8 |
|
|
| 103.9 |
|
Investing activities |
|
|
|
|
|
|
|
|
|
|
|
|
Acquisition of businesses, net of cash acquired |
|
| (33.3 | ) |
|
| (12.8 | ) |
|
| (71.2 | ) |
Purchases of property and equipment |
|
| (0.9 | ) |
|
| (1.6 | ) |
|
| (0.8 | ) |
Purchases of intangible assets |
|
| (3.1 | ) |
|
| (2.3 | ) |
|
| (2.7 | ) |
Net cash used in investing activities |
|
| (37.3 | ) |
|
| (16.7 | ) |
|
| (74.7 | ) |
Financing activities |
|
|
|
|
|
|
|
|
|
|
|
|
Payment of deferred consideration for acquisition of businesses |
|
| (0.8 | ) |
|
| (1.0 | ) |
|
| — |
|
Proceeds from borrowings on revolving credit facility |
|
| 95.0 |
|
|
| 16.0 |
|
|
| 50.0 |
|
Repayment of revolving credit facility |
|
| (105.0 | ) |
|
| (46.0 | ) |
|
| (10.0 | ) |
Repayment of principal on term loan |
|
| (5.7 | ) |
|
| (5.7 | ) |
|
| (25.7 | ) |
Cash dividends paid |
|
| (5.4 | ) |
|
| (21.3 | ) |
|
| (21.0 | ) |
Repurchase of common stock |
|
| (0.9 | ) |
|
| (8.3 | ) |
|
| (19.4 | ) |
Proceeds from issuance of redeemable convertible preferred stock |
|
| 400.1 |
|
|
| — |
|
|
| — |
|
Payment of redeemable convertible preferred stock offering costs |
|
| (17.4 | ) |
|
| — |
|
|
| — |
|
Proceeds from issuance of common stock under equity plans |
|
| 0.2 |
|
|
| 4.3 |
|
|
| 6.5 |
|
Net cash provided by (used in) financing activities |
|
| 360.1 |
|
|
| (62.0 | ) |
|
| (19.6 | ) |
Net increase (decrease) in cash and cash equivalents |
|
| 285.7 |
|
|
| (10.9 | ) |
|
| 9.6 |
|
Cash and cash equivalents |
|
|
|
|
|
|
|
|
|
|
|
|
Beginning of year |
|
| 9.6 |
|
|
| 20.5 |
|
|
| 10.9 |
|
End of year |
| $ | 295.3 |
|
| $ | 9.6 |
|
| $ | 20.5 |
|
Supplemental disclosures of cash flow information |
|
|
|
|
|
|
|
|
|
|
|
|
Cash paid for income taxes |
| $ | 1.1 |
|
| $ | 11.9 |
|
| $ | 14.8 |
|
Cash paid for interest |
| $ | 18.5 |
|
| $ | 28.8 |
|
| $ | 28.5 |
|
|
|
|
|
|
|
|
|
|
|
|
|
|
Supplemental schedule of non-cash investing and financing activities |
|
|
|
|
|
|
|
|
|
|
|
|
Contingent consideration related to 2020 acquisitions |
| $ | 10.4 |
|
| $ | — |
|
| $ | — |
|
Deferred payment related to 2020 acquisitions |
| $ | 2.0 |
|
| $ | — |
|
| $ | — |
|
Contingent consideration related to 2019 acquisition |
| $ | 2.9 |
|
| $ | 4.3 |
|
| $ | — |
|
Fair value of common stock issued related to 2020 acquisition |
| $ | 4.4 |
|
| $ | — |
|
| $ | — |
|
|
|
|
|
|
|
|
|
| Total Emerald Holding, Inc. Stockholders’ Deficit |
| |||||||||||||||||||
|
| Redeemable Convertible |
|
|
| Common Stock |
|
| Additional |
|
| Accumulated |
|
| Total |
| |||||||||||||
(shares in thousands; dollars in millions) |
| Shares |
|
| Amount |
|
|
| Shares |
|
| Amount |
|
| Capital |
|
| Deficit |
|
| Deficit |
| |||||||
Balances at December 31, 2020 |
|
| 71,445 |
|
| $ | 398.3 |
|
|
|
| 72,195 |
|
| $ | 0.7 |
|
| $ | 690.7 |
|
| $ | (695.2 | ) |
| $ | (3.8 | ) |
Stock-based compensation |
|
| — |
|
|
| — |
|
|
|
| 283 |
|
|
| — |
|
|
| 10.4 |
|
|
| — |
|
|
| 10.4 |
|
Issuance of common stock under equity plans |
|
| — |
|
|
| — |
|
|
|
| 42 |
|
|
| — |
|
|
| 0.1 |
|
|
| — |
|
|
| 0.1 |
|
Accretion to redemption value of redeemable convertible preferred stock |
|
| — |
|
|
| 35.6 |
|
|
|
| — |
|
|
| — |
|
|
| (35.6 | ) |
|
| — |
|
|
| (35.6 | ) |
Redeemable convertible preferred stock conversion |
|
| (3 | ) |
|
| — |
|
|
|
| 4 |
|
|
| — |
|
|
| — |
|
|
| — |
|
|
| — |
|
Repurchase of common stock |
|
| — |
|
|
| — |
|
|
|
| (2,498 | ) |
|
| — |
|
|
| (12.4 | ) |
|
| — |
|
|
| (12.4 | ) |
Net loss and comprehensive |
|
| — |
|
|
| — |
|
|
|
| — |
|
|
| — |
|
|
| — |
|
|
| (79.7 | ) |
|
| (79.7 | ) |
Balances at December 31, 2021 |
|
| 71,442 |
|
| $ | 433.9 |
|
|
|
| 70,026 |
|
| $ | 0.7 |
|
| $ | 653.2 |
|
| $ | (774.9 | ) |
| $ | (121.0 | ) |
Stock-based compensation |
|
| — |
|
|
| — |
|
|
|
| 362 |
|
|
| — |
|
|
| 5.9 |
|
|
| — |
|
|
| 5.9 |
|
Issuance of common stock under equity plans |
|
| — |
|
|
| — |
|
|
|
| 37 |
|
|
| — |
|
|
| 0.1 |
|
|
| — |
|
|
| 0.1 |
|
Accretion to redemption value of redeemable convertible preferred stock |
|
| — |
|
|
| 38.8 |
|
|
|
| — |
|
|
| — |
|
|
| (38.8 | ) |
|
| — |
|
|
| (38.8 | ) |
Redeemable convertible preferred stock conversion |
|
| (25 | ) |
|
| (0.3 | ) |
|
|
| 46 |
|
|
| — |
|
|
| 0.3 |
|
|
| — |
|
|
| 0.3 |
|
Repurchase of common stock |
|
| — |
|
|
| — |
|
|
|
| (2,883 | ) |
|
| — |
|
|
| (10.4 | ) |
|
| — |
|
|
| (10.4 | ) |
Net income and comprehensive |
|
| — |
|
|
| — |
|
|
|
| — |
|
|
| — |
|
|
| — |
|
|
| 130.8 |
|
|
| 130.8 |
|
Balances at December 31, 2022 |
|
| 71,417 |
|
| $ | 472.4 |
|
|
|
| 67,588 |
|
| $ | 0.7 |
|
| $ | 610.3 |
|
| $ | (644.1 | ) |
| $ | (33.1 | ) |
Stock-based compensation |
|
| — |
|
|
| — |
|
|
|
| 312 |
|
|
| — |
|
|
| 7.4 |
|
|
| — |
|
|
| 7.4 |
|
Issuance of common stock under equity plans |
|
| — |
|
|
| — |
|
|
|
| 53 |
|
|
| — |
|
|
| 0.2 |
|
|
| — |
|
|
| 0.2 |
|
Accretion to redemption value of redeemable convertible preferred stock |
|
| — |
|
|
| 42.0 |
|
|
|
| — |
|
|
| — |
|
|
| (42.0 | ) |
|
| — |
|
|
| (42.0 | ) |
Redeemable convertible preferred stock conversion |
|
| (14 | ) |
|
| (0.1 | ) |
|
|
| 26 |
|
|
| — |
|
|
| 0.1 |
|
|
| — |
|
|
| 0.1 |
|
Repurchase of common stock |
|
| — |
|
|
| — |
|
|
|
| (5,064 | ) |
|
| (0.1 | ) |
|
| (16.8 | ) |
|
| — |
|
|
| (16.9 | ) |
Preferred stock cash dividend |
|
| — |
|
|
| (17.2 | ) |
|
|
| — |
|
|
| — |
|
|
| — |
|
|
| — |
|
|
| — |
|
Net loss and comprehensive |
|
| — |
|
|
| — |
|
|
|
| — |
|
|
| — |
|
|
| — |
|
|
| (8.2 | ) |
|
| (8.2 | ) |
Balances at December 31, 2023 |
|
| 71,403 |
|
| $ | 497.1 |
|
|
|
| 62,915 |
|
| $ | 0.6 |
|
| $ | 559.2 |
|
| $ | (652.3 | ) |
| $ | (92.5 | ) |
The accompanying notes are an integral part of these consolidated financial statements.
76
Emerald Holding, Inc.
Consolidated Statements of Cash Flows
Years Ended December 31, 2023, 2022 and 2021
(in millions) |
| 2023 |
|
| 2022 |
|
| 2021 |
| |||
Operating activities |
|
|
|
|
|
|
|
|
| |||
Net (loss) income |
| $ | (8.2 | ) |
| $ | 130.8 |
|
| $ | (79.7 | ) |
Adjustments to reconcile net (loss) income to net cash provided |
|
|
|
|
|
|
|
|
| |||
Stock-based compensation |
|
| 7.8 |
|
|
| 5.8 |
|
|
| 10.4 |
|
Allowance for credit losses |
|
| 0.3 |
|
|
| 0.4 |
|
|
| 0.4 |
|
Depreciation and amortization |
|
| 45.0 |
|
|
| 59.5 |
|
|
| 47.6 |
|
Goodwill impairments |
|
| — |
|
|
| 6.3 |
|
|
| 7.2 |
|
Intangible asset impairments |
|
| — |
|
|
| 1.6 |
|
|
| 32.7 |
|
Loss on disposal of fixed assets |
|
| 0.2 |
|
|
| — |
|
|
| 0.5 |
|
Non-cash operating lease expense |
|
| 2.6 |
|
|
| 3.4 |
|
|
| 3.3 |
|
Amortization of deferred financing fees and debt discount |
|
| 3.0 |
|
|
| 1.7 |
|
|
| 1.5 |
|
Loss on lease abandonment |
|
| 0.9 |
|
|
| 3.0 |
|
|
| — |
|
Loss on extinguishment of debt |
|
| 2.3 |
|
|
| — |
|
|
| — |
|
Deferred income taxes |
|
| 1.3 |
|
|
| 0.3 |
|
|
| (0.4 | ) |
Remeasurement of contingent consideration |
|
| (2.3 | ) |
|
| (33.3 | ) |
|
| 2.0 |
|
Changes in operating assets and liabilities, net of effect of |
|
|
|
|
|
|
|
|
| |||
Trade and other receivables |
|
| (8.6 | ) |
|
| (24.9 | ) |
|
| (15.6 | ) |
Insurance receivables |
|
| — |
|
|
| — |
|
|
| 17.8 |
|
Prepaid expenses and other current assets |
|
| (1.9 | ) |
|
| (4.8 | ) |
|
| (3.7 | ) |
Other noncurrent assets |
|
| (0.4 | ) |
|
| (0.1 | ) |
|
| 0.1 |
|
Accounts payable and other current liabilities |
|
| (11.0 | ) |
|
| 6.2 |
|
|
| 20.8 |
|
Cancelled event liabilities |
|
| (2.7 | ) |
|
| (6.5 | ) |
|
| (16.1 | ) |
Contingent consideration |
|
| — |
|
|
| (2.1 | ) |
|
| — |
|
Income tax payable |
|
| (2.7 | ) |
|
| 1.4 |
|
|
| 0.2 |
|
Deferred revenues |
|
| 19.5 |
|
|
| 29.9 |
|
|
| 67.5 |
|
Operating lease liabilities |
|
| (4.1 | ) |
|
| (4.7 | ) |
|
| (2.0 | ) |
Other noncurrent liabilities |
|
| (0.7 | ) |
|
| 1.2 |
|
|
| (4.5 | ) |
Net cash provided by operating activities |
|
| 40.3 |
|
|
| 175.1 |
|
|
| 90.0 |
|
Investing activities |
|
|
|
|
|
|
|
|
| |||
Acquisition of businesses, net of cash acquired |
|
| (9.5 | ) |
|
| (37.6 | ) |
|
| (125.3 | ) |
Purchase of marketable securities |
|
| — |
|
|
| (50.0 | ) |
|
| — |
|
Proceeds from maturity of marketable securities |
|
| — |
|
|
| 50.0 |
|
|
| — |
|
Purchases of property and equipment |
|
| (0.6 | ) |
|
| (1.8 | ) |
|
| (1.5 | ) |
Purchases of intangible assets |
|
| (10.9 | ) |
|
| (8.5 | ) |
|
| (5.1 | ) |
Net cash used in investing activities |
|
| (21.0 | ) |
|
| (47.9 | ) |
|
| (131.9 | ) |
Financing activities |
|
|
|
|
|
|
|
|
| |||
Payment of deferred consideration for acquisition of businesses |
|
| — |
|
|
| — |
|
|
| (4.2 | ) |
Payment of contingent consideration for acquisition of businesses |
|
| (3.7 | ) |
|
| (4.4 | ) |
|
| — |
|
Repayment of principal on Amended and Restated Term Loan Facility |
|
| (239.4 | ) |
|
| (104.2 | ) |
|
| (5.7 | ) |
Proceeds from Extended Term Loan Facility |
|
| 239.4 |
|
|
| — |
|
|
| — |
|
Repayment of principal on Extended Term Loan Facility |
|
| (2.1 | ) |
|
| — |
|
|
| — |
|
Original issuance discount |
|
| (12.5 | ) |
|
| — |
|
|
| — |
|
Fees paid for debt issuance |
|
| (2.0 | ) |
|
| (0.4 | ) |
|
| — |
|
Repurchase of common stock |
|
| (16.9 | ) |
|
| (10.4 | ) |
|
| (12.4 | ) |
Preferred stock cash dividend |
|
| (17.2 | ) |
|
| — |
|
|
| — |
|
Proceeds from issuance of common stock under equity plans |
|
| 0.2 |
|
|
| 0.1 |
|
|
| 0.1 |
|
Net cash used in financing activities |
|
| (54.2 | ) |
|
| (119.3 | ) |
|
| (22.2 | ) |
Net (decrease) increase in cash and cash equivalents |
|
| (34.9 | ) |
|
| 7.9 |
|
|
| (64.1 | ) |
Cash and cash equivalents |
|
|
|
|
|
|
|
|
| |||
Beginning of year |
|
| 239.1 |
|
|
| 231.2 |
|
|
| 295.3 |
|
End of year |
| $ | 204.2 |
|
| $ | 239.1 |
|
| $ | 231.2 |
|
The accompanying notes are an integral part of these consolidated financial statements.
77
Emerald Holding, Inc.
Consolidated Statements of Cash Flows (Continued)
Years Ended December 31, 2023, 2022 and 2021
(in millions) |
| 2023 |
|
| 2022 |
|
| 2021 |
| |||
Supplemental disclosures of cash flow information |
|
|
|
|
|
|
|
|
| |||
Cash paid for income taxes |
| $ | 6.9 |
|
| $ | 25.6 |
|
| $ | 0.2 |
|
Cash paid for interest |
| $ | 38.1 |
|
| $ | 22.5 |
|
| $ | 13.8 |
|
|
|
|
|
|
|
|
|
| ||||
Supplemental schedule of non-cash investing and financing activities |
|
|
|
|
|
|
|
|
| |||
Contingent consideration related to 2023 acquisition |
| $ | 0.7 |
|
| $ | — |
|
| $ | — |
|
Contingent consideration related to 2022 acquisitions |
| $ | — |
|
| $ | 6.9 |
|
| $ | — |
|
Contingent consideration related to 2021 acquisitions |
| $ | — |
|
| $ | 8.9 |
|
| $ | 24.0 |
|
Amended and Restated Term Loan Facility |
| $ | (175.9 | ) |
| $ | — |
|
| $ | — |
|
Extended Term Loan Facility |
| $ | 175.9 |
|
| $ | — |
|
| $ | — |
|
The accompanying notes are an integral part of these consolidated financial statements.
78
Emerald Holding, Inc.
Notes to Consolidated Financial Statements
Note 1. Description of Business and Summary of Significant Accounting Policies
Emerald Holding, Inc. (“Emerald” or “the Company”) is a corporation formed on April 26, 2013, under the laws of the State of Delaware. Emerald is majority owned by investment funds managed by an affiliate of Onex Partners Manager LP (“Onex Partners”).
The Company is a leading operator of large business-to-business (“B2B”) trade shows in the United States (“U.S.”). The Company operates in a number of broadly-defined industry sectors: Retail; Design; Technology; Equipment; and Safety & Security. Each of the Company’s events are typically held at least once per year and provide a venue for exhibitors to launch new products, develop sales leads and promote their brands.
In addition to organizing trade shows, conferences and other events (collectively, “Events”), the Company operates websites and related digital products, and produces publications, each of which is aligned with a specific sector for which it organizes an event. The Company also offers B2B ecommercee-commerce and digital merchandising solutions to manufacturers and retailers, through its recently acquired Elastic Suite and FlexBulletin platforms.
Initial Public Offering
On May 3, 2017, the Company completed the initial public offering (“IPO”) of its common stock. The Company sold a total of 10,333,333 shares of common stock, for total net proceeds to the Company of approximately $159.1 million after deducting underwriting discounts and commissions and expenses associated with the offering of $16.5 million. The Company used all of its proceeds from the offering plus cash on hand to prepay $159.2 million of borrowings outstanding under the credit agreement, dated as of June 17, 2013, as amended (the “Term Loan Facility”) (as then in effect).
Basis of Presentation
The consolidated financial statements include the operations of the Company and its wholly-owned subsidiaries. These consolidated financial statements are presented in conformity with accounting principles generally accepted in the United States of America (“U.S. GAAP”). All intercompany transactions, accounts and profits, if any, have been eliminated in the consolidated financial statements.
The Company had no items of other comprehensive loss;(loss) income; as such, its comprehensive loss(loss) income is the same as net loss(loss) income for all periods presented.
RestatementResults of Consolidated Financial Statements
Subsequent to the original issuance of the Company’s consolidated financial statements as of andour reportable segments for the yearyears ended December 31, 2020,2023, 2022 and 2021 reflect the Company identified a material errorupdated segment presentation discussed below in its accounting for its 7% Series A Redeemable Convertible Participating Preferred Stock (“Note 18, redeemable convertible preferred stockSegment Information”), as further described below. As a result, the Company has restated the accompanying 2020 consolidated financial statements.
Reclassifications
Certain reclassifications have been made to correct for such errors.
As a result of the Company’s reassessment of the accounting for its redeemable convertible preferred stock, it was determined that, pursuantprior year amounts to conform to the terms of the Certificate of Designations relating to the redeemable convertible preferred stock, owners of the redeemable convertible preferred stock have the right to sell, and if such right is exercised, the Company has the obligation to redeem, the redeemable convertible preferred stock in certain circumstances that are not solely in the control of the Company. Because the events that may trigger redemption of the redeemable convertible preferred stock are not solely within the Company’s control, the Company has concluded that the amount allocated to the redeemable convertible preferred stock should be presented as temporary equity in the Company’s consolidated balance sheet rather than as permanent equity. As a result of incorrectly accounting for the redeemable convertible preferred stock as permanent equity, the Company did not accrete the carrying amount of the redeemable convertible preferred stock to the redemption value when the redeemable convertible preferred stock was probable of becoming redeemable, resulting in an understatement of the accretion of the carrying value of the redeemable convertible preferred stock by $15.6 million and a corresponding overstatement of additional paid-in capital. This error resulted in additional-paid-in-capital and stockholders’ equity being overstated and temporary equity being understated starting with the original issuance date of the redeemable convertible preferred stock in June 2020. In addition, the Company accounted for the redeemable convertible preferred stock as stockholders’ equity and calculated the income attributable to the redeemable convertible preferred stock based solely on adjustments for cumulative undeclared dividends and other participation rights in accordance with accounting principles generally accepted in the United States (“GAAP”) for preferred stock classified as stockholders’ equity. The error resulted in an understatement of the net loss and comprehensive loss attributable to Emerald Holding, Inc. common stockholders of $1.5 million for the year ended December 31, 2020 due to the excess of the $15.6 million amount of accretion of the redeemable convertible preferred stock to its redemption value over the $14.1 million in cumulative undeclared dividends accumulated on the redeemable convertible preferred stock during the period.current year’s presentation.
The following tables reflect the impact of the restatement to the specific line items presented in the Company’s previously reported consolidated financial statements as of and for the year ended December 31, 2020. (dollars in millions, share data in thousands, except earnings per share and share par value):
|
| December 31, 2020 |
| ||||||||||
|
| As Originally Reported |
|
| Adjustments |
|
| As Restated |
| ||||
Consolidated Balance Sheet |
|
|
|
|
|
|
|
|
|
|
|
| |
Redeemable convertible preferred stock |
|
|
|
|
|
|
|
|
|
|
|
| |
7% Series A Convertible Participating Preferred stock, $0.01 par value; authorized shares at December 31, 2020 and 2019: 80,000; 71,445 and 0 shares issued and outstanding: aggregate liquidation preference $414.4 million and 0 at December 31, 2020 and 2019, respectively |
|
| — |
|
| 398.3 |
|
| 398.3 |
| |||
Stockholders’ equity (deficit) |
|
|
|
|
|
|
|
|
|
|
|
| |
7% Series A Convertible Participating Preferred stock, $0.01 par value; authorized shares at December 31, 2020 and 2019: 80,000; 71,445 and 0 shares issued and outstanding: aggregate liquidation preference $414.4 million and 0 at December 31, 2020 and 2019, respectively |
| 0.7 |
|
|
| (0.7 | ) |
|
| — |
| ||
Additional paid-in capital |
|
| 1,088.3 |
|
|
| (397.6 | ) |
|
| 690.7 |
| |
Total stockholders’ equity (deficit) |
|
| 394.5 |
|
|
| (398.3 | ) |
|
| (3.8 | ) | |
Total liabilities, redeemable convertible preferred stock and stockholders’ equity (deficit) |
| $ | 1,054.4 |
|
| $ | — |
|
| $ | 1,054.4 |
| |
|
| December 31, 2020 |
| |||||||||
|
| As Originally Reported |
|
| Adjustments (a) |
|
| As Restated |
| |||
Consolidated Statements of Loss and Comprehensive Loss |
|
|
|
|
|
|
|
|
|
|
|
|
Accretion to redemption value of redeemable convertible preferred stock (a) |
|
| (14.1 | ) |
|
| (1.5 | ) |
|
| (15.6 | ) |
Net loss and comprehensive loss attributable to Emerald Holding, Inc. common stockholders |
| $ | (647.7 | ) |
| $ | (1.5 | ) |
| $ | (649.2 | ) |
|
|
|
|
|
|
|
|
|
|
|
|
|
Basic loss per share |
| $ | (9.07 | ) |
| $ | (0.02 | ) |
| $ | (9.09 | ) |
Diluted loss per share |
| $ | (9.07 | ) |
| $ | (0.02 | ) |
| $ | (9.09 | ) |
|
|
|
|
|
|
|
|
|
|
|
|
| Total Emerald Holding, Inc. Stockholder's Equity (Deficit) |
| |||||||||||||||||||||||||
Consolidated Statements of Redeemable Convertible Preferred Stock and Stockholders' Equity (Deficit) As Originally Reported |
|
|
|
|
|
|
|
|
|
| Preferred Stock |
|
| Common Stock |
|
| Additional Paid-in |
|
| Accumulated |
|
| Total Stockholders’ Equity |
| |||||||||||||
(shares in thousands; dollars in millions) |
|
|
|
|
|
|
|
|
|
| Shares |
|
| Amount |
|
| Shares |
|
| Amount |
|
| Capital |
|
| Deficit |
|
| (Deficit) |
| |||||||
Balances at December 31, 2019 |
|
|
|
|
|
|
|
|
|
|
| — |
|
| $ | — |
|
|
| 71,352 |
|
| $ | 0.7 |
|
| $ | 701.1 |
|
| $ | (61.6 | ) |
| $ | 640.2 |
|
Stock-based compensation |
|
|
|
|
|
|
|
|
|
|
| — |
|
|
| — |
|
|
| 207 |
|
|
| — |
|
|
| 6.9 |
|
|
| — |
|
|
| 6.9 |
|
Dividends on common stock |
|
|
|
|
|
|
|
|
|
|
| — |
|
|
| — |
|
|
| — |
|
|
| — |
|
|
| (5.4 | ) |
|
| — |
|
|
| (5.4 | ) |
Issuance of common stock under equity plans |
|
|
|
|
|
|
|
|
|
|
| — |
|
|
| — |
|
|
| 46 |
|
|
| — |
|
|
| 0.2 |
|
|
| — |
|
|
| 0.2 |
|
Issuance of common stock for acquisition |
|
|
|
|
|
|
|
|
|
|
| — |
|
|
| — |
|
|
| 806 |
|
|
| — |
|
|
| 4.4 |
|
|
| — |
|
|
| 4.4 |
|
Issuance of redeemable convertible preferred stock, net of offering costs |
|
|
|
|
|
|
|
|
|
|
| 71,446 |
|
|
| 0.7 |
|
|
| — |
|
|
| — |
|
|
| 382.0 |
|
|
| — |
|
|
| 382.7 |
|
Redeemable convertible preferred stock conversion |
|
|
|
|
|
|
|
|
|
|
| (1 | ) |
|
| — |
|
|
| 2 |
|
|
| — |
|
|
| — |
|
|
| — |
|
|
| — |
|
Repurchase of common stock |
|
|
|
|
|
|
|
|
|
|
| — |
|
|
| — |
|
|
| (218 | ) |
|
| — |
|
|
| (0.9 | ) |
|
| — |
|
|
| (0.9 | ) |
Net loss and comprehensive loss |
|
|
|
|
|
|
|
|
|
|
| — |
|
|
| — |
|
|
| — |
|
|
| — |
|
|
| — |
|
|
| (633.6 | ) |
|
| (633.6 | ) |
Balances at December 31, 2020 |
|
|
|
|
|
|
|
|
|
|
| 71,445 |
|
| $ | 0.7 |
|
|
| 72,195 |
|
| $ | 0.7 |
|
| $ | 1,088.3 |
|
| $ | (695.2 | ) |
| $ | 394.5 |
|
|
|
|
|
|
|
|
|
|
|
|
|
|
|
|
|
|
|
|
|
|
|
|
|
|
|
|
|
|
|
|
|
|
|
|
|
|
|
Adjustments |
| Redeemable Convertible Preferred Stock |
|
|
| Preferred Stock |
|
| Common Stock |
|
| Additional Paid-in |
|
| Accumulated |
|
| Total Stockholders’ Equity |
| ||||||||||||||||||
(shares in thousands; dollars in millions) |
| Shares |
|
| Amount |
|
|
| Shares |
|
| Amount |
|
| Shares |
|
| Amount |
|
| Capital |
|
| Deficit |
|
| (Deficit) |
| |||||||||
Issuance of redeemable convertible preferred stock, net of offering costs |
|
| 71,446 |
|
|
| 382.7 |
|
|
|
| (71,446 | ) |
|
| (0.7 | ) |
|
| — |
|
|
| — |
|
|
| (382.0 | ) |
|
| — |
|
|
| (382.7 | ) |
Accretion to redemption value of redeemable convertible preferred stock |
|
| — |
|
|
| 15.6 |
|
|
|
| — |
|
|
| — |
|
|
| — |
|
|
| — |
|
|
| (15.6 | ) |
|
| — |
|
|
| (15.6 | ) |
Redeemable convertible preferred stock conversion |
|
| (1 | ) |
|
| — |
|
|
|
| 1 |
|
|
| — |
|
|
| — |
|
|
| — |
|
|
| — |
|
|
| — |
|
|
| — |
|
Balances at December 31, 2020 |
|
| 71,445 |
|
| $ | 398.3 |
|
|
|
| (71,445 | ) |
| $ | (0.7 | ) |
|
| — |
|
| $ | — |
|
| $ | (397.6 | ) |
| $ | — |
|
| $ | (398.3 | ) |
|
|
|
|
|
|
|
|
|
|
|
|
|
|
|
|
|
|
|
|
|
|
|
|
|
|
|
|
|
|
|
|
|
|
|
|
|
|
|
|
|
|
|
|
| Total Emerald Holding, Inc. Stockholders' Equity (Deficit) |
| |||||||||||||||||||||
Consolidated Statements of Redeemable Convertible Preferred Stock and Stockholders' Equity (Deficit ) (As Restated) |
| Redeemable Convertible Preferred Stock |
|
|
|
|
| Common Stock |
|
| Additional Paid-in |
|
| Accumulated |
|
| Total Stockholders’ Equity |
| |||||||||||||||
(shares in thousands; dollars in millions) |
| Shares |
|
| Amount |
|
|
|
|
|
|
| Shares |
|
| Amount |
|
| Capital |
|
| Deficit |
|
| (Deficit) |
| |||||||
Balances at December 31, 2019 |
|
| — |
|
| $ | — |
|
|
|
|
|
|
|
| 71,352 |
|
| $ | 0.7 |
|
| $ | 701.1 |
|
| $ | (61.6 | ) |
| $ | 640.2 |
|
Stock-based compensation |
|
| — |
|
|
| — |
|
|
|
|
|
|
|
| 207 |
|
|
| — |
|
|
| 6.9 |
|
|
| — |
|
|
| 6.9 |
|
Dividends on common stock |
|
| — |
|
|
| — |
|
|
|
|
|
|
|
| — |
|
|
| — |
|
|
| (5.4 | ) |
|
| — |
|
|
| (5.4 | ) |
Issuance of common stock under equity plans |
|
| — |
|
|
| — |
|
|
|
|
|
|
|
| 46 |
|
|
| — |
|
|
| 0.2 |
|
|
| — |
|
|
| 0.2 |
|
Issuance of common stock for acquisition |
|
| — |
|
|
| — |
|
|
|
|
|
|
|
| 806 |
|
|
| — |
|
|
| 4.4 |
|
|
| — |
|
|
| 4.4 |
|
Issuance of redeemable convertible preferred stock, net of offering costs |
|
| 71,446 |
|
|
| 382.7 |
|
|
|
|
|
|
|
| — |
|
|
| — |
|
|
| — |
|
|
| — |
|
|
| — |
|
Accretion to redemption value of redeemable convertible preferred stock |
|
| — |
|
|
| 15.6 |
|
|
|
|
|
|
|
| — |
|
|
| — |
|
|
| (15.6 | ) |
|
| — |
|
|
| (15.6 | ) |
Redeemable convertible preferred stock conversion |
|
| (1 | ) |
|
| — |
|
|
|
|
|
|
|
| 2 |
|
|
| — |
|
|
| — |
|
|
| — |
|
|
| — |
|
Repurchase of common stock |
|
| — |
|
|
| — |
|
|
|
|
|
|
|
| (218 | ) |
|
| — |
|
|
| (0.9 | ) |
|
| — |
|
|
| (0.9 | ) |
Net loss and comprehensive loss |
|
| — |
|
|
| — |
|
|
|
|
|
|
|
| — |
|
|
| — |
|
|
| — |
|
|
| (633.6 | ) |
|
| (633.6 | ) |
Balances at December 31, 2020 (As Restated) |
|
| 71,445 |
|
| $ | 398.3 |
|
|
|
|
|
|
|
| 72,195 |
|
| $ | 0.7 |
|
| $ | 690.7 |
|
| $ | (695.2 | ) |
| $ | (3.8 | ) |
The applicable Notes to the Company’s consolidated financial statements have been updated to reflect the restatement. A summary of the accounting impact of these adjustments to the Company’s condensed consolidated financial information as of and for the related interim periods is provided in Note 20, Unaudited Quarterly Financial Data.
Liquidity Position and Management’s Plans
In March 2020, the World Health Organization categorized the Coronavirus Disease 2019 (“COVID-19”) as a pandemic, and the President of the United States declared the COVID-19 outbreak a national emergency. In conjunction with this declaration and the spread of COVID-19 across the United States, recommendations and mandates were handed down by various local, state and federal government agencies regarding social distancing, containment areas and against large gatherings, as well as quarantine requirements. In addition, travel restrictions were imposed by the United States and foreign governments, and by companies with respect to their employees, and various event venues announced indefinite closures. As a result of these and various other factors, management made the decision to cancel substantially all of the Company’s face-to-face events scheduled through the end of 2020. In addition, beginning in October 2020 management announced the cancellation or postponement of several live events that were scheduled for the first half of 2021. The ongoing effects of COVID-19 on the Company’s operations and event calendar have had, and will continue to have, a material negative impact on its financial results and liquidity, and such negative impact may continue beyond the containment of such outbreak.
The assumptions used to estimate the Company’s liquidity are subject to greater uncertainty because the Company has never previously cancelled all upcoming events for a period of multiple months due to a pandemic where the timing for resolution and ultimate impact of the pandemic remains uncertain. Management cannot estimate with certainty (i) when the Company will be able to resume full or partial event operations and, once resumed, (ii) whether event exhibitors and attendees will attend the Company’s events. Therefore, current estimates of revenues and the associated impact on liquidity could differ materially in the future. During the year ended December 31, 2020, the Company implemented several actions to preserve cash and strengthen its liquidity position, including, but not limited to:
|
|
|
|
|
|
|
|
|
|
|
|
Further, Emerald maintains event cancellation insurance to protect against losses due to the unavoidable cancellation, postponement, relocation and enforced reduced attendance at events due to certain covered events. Specifically, Emerald is insured for losses due to event cancellations caused by the outbreak of communicable diseases, including COVID-19.
The aggregate limit under these event cancellation insurance policies is approximately $191.1 million in 2020 and $191.4 million in 2021 if losses arise for reasons within the scope of this policy. In addition to this primary policy, Emerald maintains a separate event cancellation insurance policy for the Surf Expo Summer 2020 and Surf Expo Winter 2021 shows, with a coverage limit of $6.0 million and $7.7 million, for each respective event.
The Company is in the process of pursuing claims under these insurance policies to offset the financial impact of cancelled events as a result of COVID-19. During the year ended December 31, 2020, the Company recorded Other income of $107.0 million related to event cancellation insurance claim proceeds deemed to be realizable. Of the $107.0 million in Other income, $89.2 million was received in 2020 and $17.8 million was received in January 2021. These proceeds represent an interim payment in respect of the $167.4 million in event cancellation insurance claims filed in relation to events cancelled during the year ended December 31, 2020. These outstanding claims are subject to review and adjustment. There is no guarantee or assurance as to the amount or timing of future recoveries from Emerald’s event cancellation insurance policy.
On March 27, 2020, the U.S. government enacted the Coronavirus Aid, Relief, and Economic Security Act (“CARES Act”), which provides for the ability of employers to delay payment of employer payroll taxes during 2020 after the date of enactment. As a result, the payment of approximately $2.0 million of employer payroll taxes otherwise due in 2020 was delayed, with 50% due by December 31, 2021 and the remaining 50% due by December 31, 2022.
As of December 31, 2020, the Company had $525.2 million of borrowings outstanding under the Amended and Restated Term Loan Facility and 0 borrowings outstanding under the Revolving Credit Facility.
Based on these actions, assumptions regarding the impact of COVID-19, and expected insurance recoveries, management believes that the Company’s current financial resources will be sufficient to fund its liquidity requirements for the next twelve months.
As of December 31, 2020, the Company was in compliance with the covenants contained in the Amended and Restated Senior Secured Credit Facilities.
Use of Estimates
The preparation of financial statements in conformity with U.S. GAAP requires management to make estimates and assumptionsjudgments that affect the amounts reported amounts of assets and liabilities,disclosed in the disclosure of contingent assets and liabilities at the date of theconsolidated financial statements and accompanying notes. Actual results could differ materially from those estimates. On an ongoing basis, the reported amount of revenuesCompany evaluates its estimates and expenses during the reporting periods. Significant estimates include, butjudgments compared to historical experience and expected trends. The COVID-19 pandemic and related effects are not limited to, allowances for doubtful accounts for periods before 2020, allowance for credit losses in 2020, useful lives of intangible assets, long-lived assetdynamic and goodwill impairmentsongoing, and assumptions used in valuing the Company’s allocation of purchase price, including acquired deferred revenues, intangible assets and goodwill, deferred taxes and stock-based compensation expense. In March 2020, the COVID-19 outbreak was declared a pandemic. While the nature of the situation is dynamic, the Company has considered theits impact when developing its estimates and assumptions. Actual results and outcomes may differ from management's estimates and assumptions.
Cash and Cash Equivalents
The Company maintains its cash in bank deposit accounts and in money market mutual funds, which at times may exceed federally insured limits. TheAs of December 31, 2023 and 2022, the Company held $291.1$177.0 million and $91.6 million of money market mutual funds, as of December 31, 2020,respectively, which are highly liquid and quoted in active markets. The Company considers cash deposits in banks and money market mutual funds with original maturities at purchase of three months or less to be cash equivalents. AtAs of December 31, 20202023 and 2019,2022, amounts receivable from credit card processors, totaling $0.2$0.4 million and $0.8$0.3 million, respectively, are considered cash equivalents because they are short-term, highly liquid in nature and they are typically converted to cash within three days of the sales transaction.
79
Marketable Securities
The Company purchased $50.0 million in marketable securities during the year ended December 31, 2022. These matured during the same year and therefore the Company no longer held any marketable securities as of December 31, 2022, and did not purchase any marketable securities in the year ended December 31, 2023. Therefore, there were no unrealized holding gains or losses at December 31, 2023 or December 31, 2022. The Company has in the past held, and may from time to time, hold marketable securities that consist of certificates of deposit with financial institutions with maturities over three months and up to one year. These have historically been classified as marketable debt securities as their underlying investments primarily consist of corporate debt securities. These certificates of deposits have readily ascertainable values as they can be readily purchased or sold using established markets. These investments are generally classified as available-for-sale and reported at fair value. Fair value is generally based on available market information including quoted broker or dealer quotations, or other observable inputs.
The Company may invest its marketable securities in high-quality commercial financial instruments.
Fair Value Measurements
Fair value is the price that would be received to sell an asset or paid to transfer a liability in an orderly transaction between market participants at the measurement date. U.S. GAAP provides an established hierarchy and framework for inputs used to measure fair value. The fair value hierarchy gives the highest priority to inputs using quoted prices in active markets for identical assets or liabilities (Level 1) and the lowest priority to unobservable inputs (Level 3). Inputs are broadly defined as assumptions market participants would use in pricing an asset or liability. There are three levels of inputs that may be used to measure fair value:
| • Level 1 – includes financial instruments for which there are quoted market prices in active markets for identical assets or liabilities. • Level 2 – includes financial instruments for which there are observable market-based inputs for similar assets or liabilities that are corroborated by market data. • Level 3 – includes financial instruments for which unobservable inputs that are not corroborated by market datawhich fair value is derived from valuation techniques in which one or more significant inputs are unobservable, including the Company’s own assumptions.
|
|
|
|
|
|
Assets and liabilities measured at fair value are classified based on the lowest level of input that is significant to the fair value measurement. The inputs to the determination of fair value are based upon the best information in the circumstances and may require significant management judgment or estimation. A significant adjustment to a Level 2 input could result in the Level 2 measurement becoming a Level 3 measurement.
The Company’s contingent consideration liabilities related to the 2020 Acquisitionsacquisitions made in 2023, 2022 and 2019 Acquisition2021 are classified as Level 3 liabilities, which are measured at fair value based on significant unobservable inputs and re-measured to an updated fair value at each reporting period. Refer to Note 9, Fair Value Measurements, for further information related to the Company’s contingent consideration.
The Company’s market-based share award liabilities are classified as Level 3 liabilities, which are measured at fair value, and are re-measured to an updated fair value at each reporting period. Refer to Note 12, Stock-basedStock-Based Compensation, for further information related to the Company’s market-based based share awards.
The Company’s money market mutual funds are quoted in an active market and classified as Level 1 assets, which are measured at fair value based on the closing price of these assets as of the reporting date. Refer to Note 9, Fair Value Measurements, for further information related to the Company’s money market mutual funds.
80
Financial Instruments
The Company’s financial instruments consist primarily of cash and cash equivalents, accounts receivable, accounts payable and certain accrued liabilities. Accounts receivable, accounts payable and certain accrued liabilities are carried at cost, which management believes approximates fair value because of the short-term maturity of these instruments. Cash and cash equivalents are recorded at fair value. Financial instruments also include the Company’s revolving credit facility and senior term loan with third party financial institutions.
Cash and cash equivalents, accounts receivable, and the revolving credit facility and term loan potentially subject the Company to concentrations of credit risk. To minimize the risk of credit loss for cash and cash equivalents, these
financial instruments are primarily held with large, reputable financial institutions in the United States. As of December 31, 20202023 and 2019,2022, the Company’s uninsured cash and cash equivalents balances totaled $295.0$204.2 million and $9.3239.1 million, respectively. The Company held $291.1 million of the cash and cash equivalents balance in money market mutual funds as of December 31, 2020. As of December 31, 20202023 and 2019,2022, the Company’s trade receivables balances totaled $30.7$85.2 million and $60.174.9 million, respectively. No single customer accounts for more than 10% of gross accounts receivable as of December 31, 20202023 or 2019.2022. As of December 31, 2020,2023 and 2022, an allowance for credit losses was recorded to account for potential credit losses. As of December 31, 2019, an allowance for doubtful accounts was recorded to account for potential bad debts. Credit risk with respect to trade receivables is low due to the Company’s large customer base dispersed across different industries.
As of December 31, 20202023 and 2019,2022, the fair value and carrying value of the Company’s debt is summarized in the following table:
|
| December 31, 2023 |
| |||||
(in millions) |
| Fair |
|
| Carrying |
| ||
Extended Term Loan Facility, with |
| $ | 415.0 |
|
| $ | 413.3 |
|
Total |
| $ | 415.0 |
|
| $ | 413.3 |
|
|
| December 31, 2020 |
|
| December 31, 2022 |
| ||||||||||
(in millions) |
| Fair Value |
|
| Carrying Value |
|
| Fair |
|
| Carrying |
| ||||
Amended and Restated Term Loan Facility, with interest at LIBOR plus 2.50% (equal to 2.65%) at period end, including short-term portion |
| $ | 491.1 |
|
| $ | 523.3 |
| ||||||||
Amended and Restated Term Loan Facility, with |
| $ | 404.9 |
|
| $ | 415.3 |
| ||||||||
Total |
| $ | 491.1 |
|
| $ | 523.3 |
|
| $ | 404.9 |
|
| $ | 415.3 |
|
|
| December 31, 2019 |
| |||||
(in millions) |
| Fair Value |
|
| Carrying Value |
| ||
Amended and Restated Term Loan Facility, with interest at LIBOR plus 2.75% (equal to 4.55%) at period end, including short-term portion |
| $ | 504.3 |
|
| $ | 528.4 |
|
Revolving Credit Facility, with interest at LIBOR plus 2.75% (equal to 4.52%) at period end |
|
| 9.5 |
|
|
| 10.0 |
|
Total |
| $ | 513.8 |
|
| $ | 538.4 |
|
The difference between the carrying value and fair value of the Company’s variable-rate term loan is due to the difference between the period-end market interest rates and the projected market interest rates over the term of the loan, as well as the financial performance of the Company since the issuance of the debt. In addition, the carrying value is net of discounts. The Company estimated the fair value of its variable-rate debt using observable market-based inputs that are corroborated by market data (Level 2 inputs).
Redeemable Convertible Preferred Stock
The Company records all shares of its redeemable convertible preferred stock at their respective fair values less issuance costs on the dates of issuance. The Company has classified its redeemable convertible preferred stock as temporary equity on the consolidated balance sheet due to redemption rights that are deemed outside of the Company’s control. As discussed in Note 11, Stockholder’s Equity (Deficit) and Redeemable Convertible Preferred Stock, the redeemable convertible preferred stock was deemed to be probable of becoming redeemable as of December 31, 2020, for accounting purposes, and therefore the carrying value of the redeemable convertible preferred stock is required to be remeasured to its redemption value. The Company has adopted an accounting policy to accrete changes in the redemption value of the redeemable convertible preferred stock from the date of issuance to the date the redemption features first become exercisable using the effective interest method. Accretion to redemption value is recorded as a deemed dividend to the redeemable convertible preferred stock, with a corresponding charge to additional paid in capital in the absence of retained earnings.
Derivative Instruments
In March 2014, the Company, through Emerald X, Inc., formerly known as Emerald Expositions Holding, Inc., an intermediate holding company of Emerald, entered into forward interest rate contracts to manage and reduce its interest rate risk. The Company marked-to-market its interest rate contracts quarterly with both the unrealized and
realized gains or losses included in interest expense in the consolidated statements of loss and comprehensive loss. Due to the expiration of the Company’s forward interest rate contract on December 31, 2018, there was 0 liability recorded as of December 31, 2020 and 2019.See Note 7, Debt, for additional discussion of the Company’s interest rate swap and floor arrangements.
Trade and Other Receivables
The Company extends non-interest bearing trade credit to its customers in the ordinary course of business which is not collateralized. Accounts receivable are presented on the face of the consolidated balance sheets, net of allowance for credit losses, during the year ended December 31, 2020 and net of an allowance for doubtful accounts, during the year ended December 31, 2019.losses. The Company monitors collections and payments from its customers and maintains an allowance based upon applying an expected credit loss rate to receivables based on the historical loss rate from similar higher risk customers adjusted for current conditions, including any specific customer collection issues identified, and forecasts of economic conditions. In determining the allowance for doubtful accounts, the Company analyzed the aging of accounts receivable, historical bad debts, customer creditworthiness and current economic trends.
81
Prepaid Expenses
Prepaid expenses are primarily comprised of prepaid event costs. The Company pays certain direct event costs, such as facility rental deposits and insurance costs, in advance of the event. Such costs are deferred in prepaid expenses on the consolidated balance sheets when paid and reported on the consolidated statements of loss(loss) income and comprehensive loss(loss) income as cost of revenues upon the staging of the event.
Property and Equipment
Property and equipment is carried at cost less accumulated depreciation and impairment losses, if any. Property and equipment is depreciated on a straight-line basis over the estimated useful lives of 1 to 10 years (shorter of economic useful life or lease term) for leasehold improvements and 1 to 10 years for equipment, which includes computer hardware and office furniture.
Definite-lived Intangible Assets
Definite-lived intangible assets consist of certain trade names, acquired technology, customer relationships and other amortized intangible assets. Definite-lived intangible assets are amortized over their estimated useful lives based on the pattern of expected economic benefit. Intangible assets with finite lives are stated at cost, less accumulated amortization and impairment losses, if any.
Estimated | Weighted | |||
Customer relationship intangibles | 2-10 years | 9 years | ||
Definite-lived trade names | 2-30 years | 21 years | ||
Acquired technology | 1.5-7 years | 6 years | ||
Acquired content | 5.5-7 years | 6 years | ||
Computer software | 1-7 years | 4 years |
Refer to Note 6, Intangible Assets and Goodwill, for definite-lived intangible asset impairments recorded during the years ended December 31, 2023, 2022 and 2021.
Impairment of Long-Lived Assets Other than Goodwill and Indefinite-Lived IntangiblesIntangible Assets
Long-lived assets other than goodwill and indefinite-lived intangible assets, held and used by the Company, including property and equipment and long-lived intangible assets, are reviewed for impairment whenever events or changes in circumstances indicate that the carrying amount of the assets may not be recoverable. The Company conducts the long-lived asset impairment analysis at the asset group level. The Company evaluates recoverability of assets to be held and used by comparing the carrying amount of an asset to the future net undiscounted cash flows expected to be generated by the asset to determine if the carrying value is not recoverable. If the carrying value is not recoverable, the Company fair values the asset and compares the resulting amount to the carrying value. If the asset is considered to be impaired, the impairment loss is measured as the amount by which the carrying amount of the asset exceeds its fair value. Refer to Note 6, Intangible Assets and Goodwill, for long-lived assets other than goodwill and indefinite-lived intangible assets impairments recorded during the years ended December 31, 2023, 2022 and 2021.
Indefinite-Lived Intangible Assets
The Company’s indefinite-lived intangiblesintangible assets consist of trade names. Indefinite-lived intangible assets are tested annually for impairment at October 31, or between annual tests if the Company becomes aware of an event or a change in circumstances that would indicate the carrying value of an asset group may be impaired. The Company conducts its impairment analysis by grouping assets and liabilities at the lowest level for which identifiable cash flows are largely independent of the cash flows of other assets and liabilities and has determined it has multiple asset groups that are typically at the trade show brand level. The Company has the option to first assess qualitative factors to determine whether it is more likely than not that an indefinite-lived intangible asset group is impaired. To perform a qualitative assessment, the Company must identify and evaluate changes in economic, industry and entity-specific events and circumstances that could affect the significant inputs used to determine the fair value of an indefinite-lived
82
intangible asset group. If the result of the qualitative analysis indicates it is more likely than not that an indefinite-lived intangible asset group is impaired, a fair value calculation will be performed to measure the amount of impairment losses to be recognized, if any.
The fair values of the Company’s indefinite-lived trade name asset groups are calculated using a form of the income approach referred to as the “relief from royalty payments” method. The royalty rates are estimated using evidence of identifiable transactions in the marketplace involving the licensing of trade names similar to those owned by the Company. The fair value of the trade name is then compared to the carrying value of each trade name. If the carrying amount of the trade name exceeds its fair value, an impairment loss would be reported. Determining the fair value of an indefinite-lived intangible asset group requires the application of judgment and involves the use of significant estimates and assumptions. These estimates and assumptions, including projections of future cash flows, which include forecasted revenue, growth rates, weighted average cost of capital,EBITDA margin, discount rate, tax rate, and royalty rates.rate. The Company bases its fair value estimates on assumptions it believes to be reasonable, but which are unpredictable and inherently uncertain. Actual future results may differ
from the estimates. Refer to Note 6, Intangible Assets and Goodwill, for the indefinite-lived intangible asset impairments recorded during the years ended December 31, 2020, 20192023, 2022 and 2018.2021.
Goodwill
Definite-lived Intangible Assets
Definite-lived intangible assets consist of customer relationships, acquired technology, certain trade names, and computer software. Intangible assets with finite lives are stated at cost, less accumulated amortization and impairment losses, if any. These intangible assets are amortized on a straight-line basis over the following estimated useful lives, which are reviewed each reporting period:
|
| |||
|
|
| ||
|
|
| ||
|
|
| ||
|
|
|
Refer to Note 6, Intangible Assets and Goodwill, for definite-lived intangible asset impairments recorded during the years ended December 31, 2020, 2019 and 2018.
Impairment of Long-Lived Assets Other than Goodwill and Indefinite-Lived Intangible Assets
Long-lived assets other than goodwill and indefinite-lived intangible assets, held and used by the Company, including property and equipment and long-lived intangible assets, are reviewed for impairment whenever events or changes in circumstances indicate that the carrying amount of the assets may not be recoverable. The Company conducts the long-lived asset impairment analysis at the asset group level. The Company evaluates recoverability of assets to be held and used by comparing the carrying amount of an asset to the future net undiscounted cash flows expected to be generated by the asset to determine if the carrying value is not recoverable. If the carrying value is not recoverable, the Company fair values the asset and compares the resulting amount to the carrying value. If the asset is considered to be impaired, the impairment loss is measured as the amount by which the carrying amount of the asset exceeds its fair value.Refer to Note 6, Intangible Assets and Goodwill, for long-lived assets other than goodwill and indefinite-lived intangible assets impairments recorded during the years ended December 31, 2020, 2019 and 2018.
Goodwill
Goodwill is recorded as the difference, if any, between the aggregate consideration paid for an acquisition and the fair value of the assets acquired and liabilities assumed. Goodwill is not amortized, but instead is tested for impairment. The Company tests for impairment on October 31 of each year, or more frequently should an event or a change in circumstances occur that would indicate the carrying value may be impaired. Such events and circumstances may be a significant change in business climate, economic and industry trends, legal factors, negative operating performance indicators, significant competition or changes in strategy. The Company performs its goodwill impairment test at the reporting unit level. In goodwill impairment tests prior to October 31, 2019, the Company determined it operated under one reporting unit. Given a change in operating segments that occurred in the fourth quarter of 2019, the Company determined there were multiple reporting units as of October 31, 2019. Refer to Note 18, Segment Information, for information regarding the Company’s reportable segments.
The Company’s goodwill impairment analysis is performed, and related impairment charges recorded, after the impairment analysis and recognition of impairment charges for long-lived assets other than goodwill and indefinite-lived intangible assets. In testing goodwill for impairment, the Company first assesses qualitative factors to determine whether the existence of events or circumstances leads to a determination that it is more likely than not that the fair value of a reporting unit is less than its carrying amount. If, after assessing the totality of events or circumstances, the Company determines it is not more likely than not that the fair value of a reporting unit is less than its carrying amount, then additional impairment testing is not required. When the Company determines a fair value test is necessary, it estimates the fair value of a reporting unit and compares the result with its carrying amount, including goodwill. If the carrying amount of a reporting unit exceeds its fair value, an impairment is
recorded equal to the amount by which the carrying value exceeds the fair value, up to the amount of goodwill associated with the reporting unit.
Determining the fair value of a reporting unit requires the application of judgment and involves the use of significant estimates and assumptions including, projections of future cash flows, which include forecasted revenue, growth rates, weighted average cost ofEBITDA margin, discount rate, debt free net working capital, selecting appropriate discount ratescapital expenditures and other factors which can be affected by changes in business climate, economic conditions, the competitive environment and other factors. The Company bases these fair value estimates on assumptions management believes to be reasonable but which are unpredictable and inherently uncertain. A change in underlying assumptions would cause a change in the results of the tests and, as such, could cause fair value to be less than the carrying amounts and result in an impairment of goodwill in the future. Additionally, if actual results are not consistent with the estimates and assumptions or if there are significant changes to the Company’s planned strategy, it may cause the fair value of the reporting unit to be less than its carrying amount and result in additional impairments of goodwill in the future. The Company corroborates the reasonableness of the total fair value of the reporting units withby assessing the implied control premium based on the Company’s market capitalization. The Company’s market capitalization is calculated using the relevant shares outstanding and stock price of the Company’s publicly traded shares. In the event of a goodwill impairment, the Company would be required to record an impairment, which would impact earnings and reduce the carrying amounts of goodwill on the consolidated balance sheet.Refer to Note 6, Intangible Assets and Goodwill, for the goodwill impairment recorded during the years ended December 31, 20202023, 2022 and 2019.2021.
83
Contingent Consideration
Some of the Company’s acquisition agreements include contingent consideration arrangements, which are generally based on the achievement of future performance thresholds. For each transaction, the Company estimates the fair value of contingent consideration payments as part of the initial purchase price and records the estimated fair value of contingent consideration as a liability.
The Company considers several factors when determining that contingent consideration liabilities are part of the purchase price, including the following: (1) the valuation of its acquisitions is not supported solely by the initial consideration paid, (2) the former shareholders of acquired companies that remain as key employees receive compensation other than contingent consideration payments at a reasonable level compared with the compensation of the Company’s other key employees and (3) contingent consideration payments are not affected by employment termination.
The Company reviews and assesses the estimated fair value of contingent consideration on a quarterly basis, and the updated fair value could differ materially from the initial estimates. Adjustments to the estimated fair value of contingent consideration are reported in selling, general and administrative expense in the consolidated statements of loss(loss) income and comprehensive loss. There is $13.3(loss) income. As of December 31, 2023 and 2022, the Company’s contingent consideration balances totaled $6.9 million and $4.3$12.3 million, respectively. Contingent consideration of contingent consideration outstanding at$0.2 million and $3.5 million as of December 31, 20202023 and 2019, respectively.2022, respectively, are included within Contingent consideration in the consolidated balance sheets and Contingent consideration of $6.7 million and $8.8 million, respectively, are included within other noncurrent liabilities in the consolidated balance sheets. Refer to Note 9, Fair Value Measurements, for further information related to the Company’s contingent consideration.
Revenue Recognition and Deferred Revenue
Revenue is recognized as the customer receives the benefit of the promised services and performance obligations are satisfied. Revenue is recognized at an amount that reflects the consideration the Company expects to receive in exchange for those services. Refer to Note 3, Revenues, for further information related to the Company’s revenues.
Trade Shows and Other EventsConnections
A significant portion of the Company’s annual revenue is generated from the Connections segment through the production of trade shows and conference events, including booth space sales, registration fees and sponsorship fees. Revenue from the Company’s trade shows and other events is recognized in the period the trade show or other event stages as the Company’s performance obligations have been satisfied. AsExhibitors contract for their booth space and sponsorships up to a resultyear in advance of the COVID-19 related show cancellations described above, trade show revenues declined significantly during the year ended December 31, 2020.show. Trade show and other events generated approximately 79%89%, 92%87% and 93%73% of revenues for the years ended December 31, 2020, 20192023, 2022 and 2018,2021, respectively.
Other Marketing Services
Content
Revenues from the Company’s other marketing servicesContent category primarily consist of advertising sales for digital products and industry publications that complement the event properties in each industry sector.sector as well as custom content agency revenues. These revenues are recognized in the period in which the digital products are provided or publications are issued.Other marketing servicesissued or when the custom content is delivered to the customer. Typically, the fees charged are collected after the digital products are provided, the publications are issued or the custom content is delivered. Content category revenues generated approximately 21%6%, 8%8% and 7%19% of revenues for the years ended December 31, 2020, 20192023, 2022 and 2018,2021, respectively.
Commerce
Revenues from the Commerce category primarily consist of sales from the Company’s software-as-a-service Elastic Suite platform. Revenue consists of subscription revenue, implementation fees and professional services. Fees associated with implementation are deferred and recognized over the expected customer life, which is four years. Subscription revenue is generally recognized over the term of the contract. The Company’s contracts associated with the subscription software and services are generally three-year terms with one-year renewals. Subscription software
84
and services revenues generated approximately 5%, 5% and 8% of revenues for the years ended December 31, 2023, 2022 and 2021, respectively.
Deferred Revenue
The Company typically invoices and collects payment in-full from customers prior to the staging of a trade show or other event and records deferred revenues in the consolidated balance sheets until the staging of the trade show or other event. As of December 31, 20202023 and 2019,2022, the Company had current deferred revenues of $48.6$174.3 million and $187.3$151.2 million, respectively, of which, $25.6$54.7 million and $53.0$53.3 million, are included in accounts receivable on the consolidated balance sheets as of December 31, 20202023 and 2019,2022, respectively.
As a result of the measures to prevent the spread of COVID-19, the Company has experienced an unprecedented low level of booth space sales, registration fees and sponsorship fees and the associated cash received for future trade shows. In addition, the Company cancelled all but one trade shows and other events which had been scheduled to stage in the second half of March 2020 through December 31, 2020, as well as postponing and cancelling several trade shows and other events in the first half of 2021, which led to a significant decrease in deferred revenues.
Other Income
As a result of the measures enacted in March 2020 to prevent the spread of COVID-19 across the United States, management made the decision to cancel substantially all of the Company’s face-to-face events scheduled through the end of 2020. As noted previously,In addition, beginning in October 2020, management announced the cancellation or postponement of numerous live events that were scheduled for the first half of 2021, including all but several relatively small live events staging in the first six months of 2021. In the second half of 2021, due to the continued effects of COVID-19 related issues such as international travel restrictions, certain events were cancelled or experienced reduced attendance. The Company maintainsmaintained event cancellation insurance to protect against losses due to the unavoidable cancellation, postponement, relocation and enforced reduced attendance at events due to certain covered events, including event cancellations caused by the outbreak of communicable diseases, including COVID-19. TheEmerald’s renewed event cancellation insurance policies beginning with policy year 2022 do not cover losses due to event cancellations caused by the outbreak of communicable diseases, including COVID-19. During the year ended December 31, 2023, the Company reported other income, net of $2.8 million related to event cancellation insurance claim proceeds received during the year ended 2023 in the consolidated statements of (loss) income and comprehensive (loss) income. On August 3, 2022, the Company reached an agreement to settle outstanding insurance litigation relating to event cancellation insurance for proceeds of $148.6 million. In total, the Company received payments of $89.2$182.8 million from its insurance carrier to recover the lost revenues, net of costs saved, of the affected 2021 and 2020 trade shows during the year ended December 31, 2020 and management concluded that the receipt of $17.8 million of additional insurance proceeds was realizable as of December 31, 2020.2022. As a result, during the year ended December 31, 2020,2022, the Company reported other income, net of $107.0$182.8 million to recognize the amount that was recovered from the insurance company in the consolidated statements of loss(loss) income and comprehensive loss.
During the third quarter of 2019, as a result of Hurricane Dorian, the Company’s Surf Expo and Imprinted Sportswear Show - Orlando (“ISS Orlando”) shows were forced to be cancelled.(loss) income. The Company carries cancellation insurance to mitigate losses caused by natural disasters and received payments of $6.1$95.3 million from its insurance carrier to recover the lost revenues, fromnet of costs saved, of the affected trade shows.shows during the year ended December 31, 2021. As a result, during the year ended December 31, 2019,2021, the Company recordedreported other income, net of $6.1$77.4 millionto recognize the amount that was recovered from the insurance company in the consolidated statements of loss(loss) income and comprehensive loss. The Company also maintained supplemental insurance to mitigate the losses of the Company's exhibitors for out-of-pocket expenses incurred in connection with the cancelled shows. The Company received $10.1 million under this policy which was fully paid to participating exhibitors during 2019.(loss) income.
Deferred Financing Fees and Debt Discount
Costs relating to debt issuance have been deferred and are amortized over the terms of the underlying debt instruments using the effective interest method for the Extended Term Loan Facility and Amended and Restated Term Loan Facility and the straight-line method for the Amended and Restated Revolving Credit Facility. Debt discount is recorded as a contra-liability and is amortized over the term of the underlying debt instrument, using the effective interest method.
Segment Reporting
Operating segments are components of an enterprise for which discrete financial reporting information is available that is evaluated regularly by the chief operating decision maker (“CODM”) in deciding how to allocate resources and in assessing performance. Following the June 2019 appointment of the Company’s chief executive officer, whoEmerald’s Chief Executive Officer (“CEO”) is considered the CODM,CODM. Effective October 31, 2023, Emerald’s management structure was reorganized and the Company changed thediscrete financial reporting structure, ininformation regularly provided to the fourth quarterCODM to facilitate his allocation of 2019, which resulted inresources and assessment of performance was updated to reflect the new structure. As a result, there was a change in reporting segments. The CODM evaluates performance and allocates resources based on the results of 6 executive brand portfolios, which represent the Company’s 6three operating segments. Based on an evaluationThe Connections segment is the only operating segment which meets the criteria to be classified as a reportable segment. The Connections reportable segment includes all of economic similarities, 4Emerald’s trade shows and other live events. The other two operating segments, are aggregated into 2 reportable segments, the Commercewhich provide diverse
85
media services and the Design and Technology reportable segments. NaN operating segmentse-commerce software solutions, do not meet the quantitative thresholds of a reportable operating segment and did not meet the aggregation criteria set forth in Accounting Standards Codification 280 (“ASC 280,280”), Segment Reporting, as of December 31, 20202023 and as such are referred to as “All Other.”Refer to Note 18, Segment Information, for information regarding the Company’s reportable segments.
Advertising and Marketing Costs
Advertising and marketing costs are expensed as incurred and are reflected as selling, general and administrative expenses in the consolidated statements of loss(loss) income and comprehensive loss.(loss) income. These costs include all brand advertising, telemarketing, direct mail and other sales promotion expenses associated with the Company’s trade shows, conference events, digital media, Elastic Suite platform and publications. Advertising and marketing costs totaled $6.7$9.6 million, $17.0$10.1 million and $15.3$6.3 million for the years ended December 31, 2020, 20192023, 2022 and 2018,2021, respectively.
Stock-Based Compensation
The Company uses share-based compensation, including stock options and restricted stock units, to provide long-term performance incentives for its employees and non-employee directors. Stock-based compensation expense is calculated for each vesting tranche of stock options using the Black-Scholes option pricing model. The expense is recognized, net of forfeitures, within the consolidated statements of loss(loss) income and comprehensive loss;(loss) income; however, no expense is recognized for awards that do not ultimately vest. The determination of the grant date fair value of stock options using an option-pricing model is affected by a number of assumptions, such as the fair value of the underlying stock, Emerald’s expected stock price volatility over the expected term of the options, stock option forfeiture behaviors, risk-free interest rates and expected dividends, which are estimated as follows:
| • Fair Value of Common Stock —The fair value per share of common stock for purposes of determining share-based compensation is the closing price of the Company’s common stock as reported on the New York Stock Exchange on the applicable grant date. • Expected Term —The expected option term represents the period of time the option is expected to be outstanding. The Company uses the simplified method to estimate the term since the Company does not have sufficient exercise history to calculate the expected term of stock options. • Volatility —The expected volatility is based on considering the Company’s limited publicly traded stock price and historical average volatilities of similar publicly traded companies corresponding to the expected term of the awards. • Risk-Free Rate —The risk-free rate is based on the yields of United States Treasury securities with maturities similar to the expected term of stock option for each stock option grant. • Forfeiture Rate —Estimates of pre-vesting forfeitures, or forfeiture rates, are based on an internal analysis, which primarily considers the award recipients’ position within the Company. • Dividend Yield —Prior to the IPO, the Company had never declared or paid any cash dividends and had no intention to pay cash dividends. Consequently, an expected dividend yield of zero was used with respect to pre-IPO options. In connection with the IPO, the Company adopted a policy of paying quarterly cash dividends on common stock. Post-IPO stock option grants include an expected dividend yield which is commensurate with the annual dividends the Company declared and paid dividends on its common stock until the first quarter of 2020 when the dividend was suspended.
|
|
|
|
|
|
|
|
|
|
|
|
The Company granted Restricted Stock Units (“RSUs”), that contain service and, in certain instances, performance conditions to certain executives and employees, which are equity-classified awards. The Company recognizes cumulative stock-based compensation expense for the portion of the awards for which the service period and performance conditions, as applicable, are probable of being satisfied. The grant date fair value of stock-based awards is recognized as expense over the requisite service period on the graded-vesting method.
86
Market-based Share Awards
The Company granted performance-based market condition share awards to two senior executives in 2019 and one senior executive in 2020 under the 2017 Omnibus Equity Plan. During 2020, one of the performance-based market condition share awards granted in 2019 was forfeited. These awards are classified as liabilities, which are measured at fair value, and are re-measured to an updated fair value at each reporting period. The fair value of performance-based market condition share awards is estimated using a risk-neutral Monte Carlo simulation model. The Company recognizes expense for performance-based market condition share awards over the derived service period for each tranche. The Company recognizes stock-based compensation expense for awards subject to market-based vesting conditions regardless of whether it becomes probable that these conditions will be achieved or not, and stock-based compensation expense for any such awards may be reversed if vesting does not occur and the employee terminates employment before the ten year term expires, except that upon a termination of employment other than for cause, or upon a termination for good reason within three months prior to the earlier of the execution of an agreement resulting in a change in control or the date of a change in control, any unvested shares subject to the performance-based market condition share award shall remain eligible to vest in accordance with the performance-based market condition share award agreement’s vesting conditions. Refer to Note 12, Stock-Based Compensation, for further information regarding the Company’s performance-based market condition share awards.
Redeemable Convertible Preferred Stock
The Company records redeemable convertible preferred stock at fair value on the dates of issuance, net of issuance costs. The Company classifies its redeemable convertible preferred stock as mezzanine equity outside of stockholders’ deficit when the stock contains contingent redemption features that are not solely within the Company’s control. Each share of redeemable convertible preferred stock accumulated dividends at a rate per annum equal to 7% of the accreted liquidation preference, compounding quarterly by adding to the accreted liquidation preference until July 1, 2023 and thereafter, at the Company’s option, paid either in cash or by adding to the accreted liquidation preference. For each of the quarterly periods ended September 30, 2023 and December 31, 2023, the Company elected to pay dividends on the redeemable convertible preferred stock in cash.
The Company has the right to redeem all, but not less than all, of the redeemable convertible preferred stock on or after June 29, 2026 for a cash purchase price equal to (a) on or after the six-year anniversary thereof, 105% of the accreted liquidation preference, (b) on or after the seven-year anniversary thereof, 103% of the accreted liquidation preference or (c) on or after the eight-year anniversary thereof, the accreted liquidation preference. In addition, if there is a change of control transaction involving the Company prior to the six-year anniversary of the First Closing Date, the Company has the right to redeem all, but not less than all, of the redeemable convertible preferred stock for a cash purchase price equal to the accreted liquidation preference plus the net present value of the additional amount by which the accreted liquidation preference would have otherwise increased from the date of such redemption through the sixth anniversary of the closing.
Income Taxes
The Company provides for income taxes utilizing the asset and liability method of accounting. Under this method, deferred income taxes are recorded to reflect the tax consequences in future years of differences between the tax basis of assets and liabilities and their financial reporting amounts at each balance sheet date, based on enacted tax laws and statutory tax rates applicable to the periods in which the differences are expected to affect taxable income. If it is determined that it is more likely than not that future tax benefits associated with a deferred tax asset will not be realized, a valuation allowance is provided. The effect on deferred tax assets and liabilities of a change in the tax rates is recognized in the consolidated statements of loss(loss) income and comprehensive loss(loss) income as an adjustment to income tax expense in the period that includes the enactment date.
The Company records a liability for unrecognized tax benefits resulting from uncertain tax positions taken or expected to be taken in a tax return. The Company recognizes interest and penalties, if any, related to unrecognized tax benefits in income tax expense. Refer to Note 15, Income Taxes, for further information related to the Company’s income taxes.
87
Net (Loss) Income Attributable to Common Stockholders
Basic and diluted net (loss) income per share attributable to common stockholders is presented in conformity with the two-class method required for participating securities. The Company considers all redeemable convertible preferred stock to be a participating security. Under the two-class method, the net loss attributable to common stockholders is not allocated to the redeemable convertible preferred stock as the holders of the Company’s redeemable convertible preferred stock do not have a contractual obligation to share in the losses.
Under the two-class method, basic net (loss) income per share attributable to common stockholders is computed by dividing the net (loss) income attributable to common stockholders by the weighted-average number of shares of common stock outstanding during the period.
Diluted earnings per share attributable to common stockholders adjusts basic earnings per share for the potentially dilutive impact of stock options, restricted stock units (“RSUs”) and redeemable convertible preferred stock. In periods where the Company has reported a loss, all potentially dilutive securities are antidilutive, and accordingly, basic net loss per share equals diluted net loss per share.
Note 2. Recently AdoptedAdoption of New Accounting Pronouncements
In August 2018,October 2021, the Financial Accounting Standards BoardFASB issued ASU 2021-08 (“FASB”ASU 2021-08”) issued Accounting Standard (“ASU”) 2018-15, Customer's, Accounting for Implementation Costs IncurredContract Assets and Contract Liabilities from Contracts with Customers, creating an exception to the recognition and measurement principles in ASC 805, Business Combinations. The amendments require an acquirer to use the guidance in ASC 606, Revenue from Contracts with Customers, rather than using fair value, when recognizing and measuring contract assets and contract liabilities related to customer contracts assumed in a Cloud Computing Arrangement That Is a Service Contract (“business combination. This guidance is effective for fiscal years beginning after December 15, 2022, and for interim periods within that year. Early adoption is permitted and the amendments in ASU 2018-15”). The objective2021-08 should be applied to business combinations occurring during the year of the standard is to align the requirements for capitalizing implementation costs incurred in a hosting arrangement that is a service contract with the requirements for
capitalizing implementation costs incurred to develop or obtain internal-use software over the term of the hosting arrangement, starting when the module or component of the hosting arrangement is ready for its intended use.adoption. The Company adopted ASU 2018-15 on January 1, 20202021-08 in October 2021 and the adoption did notnot have a material impact on the Company’s consolidated financial statements.
In August 2018, the FASB issued ASU 2018-13, Fair Value Measurement (Topic 820): Disclosure Framework, which modifies existing and includes new disclosure requirements on fair value measurements (“ASU 2018-13”). The Company adopted ASU 2018-13 on January 1, 2020 and the adoption did not have an impact on the Company’s consolidated financial statements.
In June 2016, the FASB issued ASU 2016-13, Financial Instruments - Credit Losses (Topic 326): Measurement of Credit Losses on Financial Instruments (“ASU 2016-13”). ASU 2016-13 modifies how an entity accounts for credit losses for most financial assets and certain other instruments and requires entities to estimate expected credit losses for trade receivables. The Company adopted ASU 2016-13 on January 1, 2020 and the adoption did not have a material impact on the Company’s consolidated financial statements.
Recently Issued Accounting Pronouncements
In December 2019, the FASB issued ASU 2019-12, Income Taxes (Topic 740) Simplifying the Accounting for Income Taxes (“ASU 2019-12”). ASU 2019-12 simplifies the accounting for income taxes by removing certain exceptions and adding further guidance to simplify the accounting for income taxes. The standard removes certain exceptions related to intra-period tax allocations, the methodology for calculating income taxes in interim periods and the recognition of deferred taxes for investments. The standard also clarifies and amends existing guidance to reduce complexity in certain areas, including recognizing deferred taxes for tax goodwill and allocating taxes to members of a consolidated group. ASU 2019-12 is effective for fiscal years beginning after December 15, 2020, including interim periods within those fiscal years. Early adoption is permitted, including adoption in an interim period. The Company does not expectadopted ASU 2019-12 on January 1, 2021 and the adoption of this accounting standard will did not have a material impact on the Company’s consolidated financial statements.
Recently Issued Accounting Pronouncements
In March 2020,November 2023, the FASB issued ASU 2020-04, Reference Rate Reform2023-07, Segment Reporting (Topic 848) Facilitation of the Effects of Reference Rate Reform on Financial Reporting280) Improvements to Reportable Segment Disclosures (“ASU 2020-04”2023-07”). ASU 2020-04 provides optional guidance for a limited2023-07 requires disclosure of significant segment expenses that are regularly provided to the chief operating decision maker and included within the segment measure of profit or loss. The standard is required to be applied retrospectively to prior periods presented, based on the significant segment expense categories identified and disclosed in the period of time to ease the potential burden of accountingadoption. ASU 2023-07 is effective for (or recognizing the effects of) reference rate reform. ASU 2020-04 was further amended in January 2021 by ASU 2021-01, Reference Rate Reform (Topic 848): Scope (“ASU 2021-01”). ASU 2021-01 clarifies certain optional expedients in ASU 2020-04 that may be applied to derivatives that are affected by the discounting transition. The amendments in ASU 2020-04, including ASU 2021-01, are effective upon issuance throughfiscal years beginning after December 31, 202215, 2023, and may be applied prospectively to contract modifications made and hedging relationships entered into on or beforeinterim periods within fiscal years beginning after December 31, 2022.15, 2024. Early adoption is permitted. The Company does not expectis currently evaluating the impact the adoption of these accounting standards will have a material impact on the disclosures within the Company’s consolidated financial statements.
In December 2023, the FASB issued ASU 2023-09, Income Taxes (Topic 740): Improvements to Income Tax Disclosures (“ASU 2023-09”). ASU 2023-09 requires disclosure of disaggregated information about a reporting entity’s effective tax rate reconciliation as well as information on income taxes paid. The standard is intended to benefit investors by providing more detailed income tax disclosures that would be useful in making capital allocation decisions and applies to all entities subject to income taxes. The standard should be applied on a prospective basis
88
although retrospective application is permitted. ASU 2023-09 is effective for fiscal years beginning after December 15, 2024. Early adoption is permitted. The Company is currently evaluating the impact the adoption will have on the disclosures within the Company’s consolidated financial statements.
There have been no other new accounting pronouncements that are expected to have a significant impact on the Company’s consolidated financial statements.
Note 3. Revenues
Impact of COVID-19
The global COVID-19 pandemic has had, and will continue to have, a severe and unprecedented impact on the world. Measures to prevent its spread, including government-imposed restrictions on large gatherings, indefinite closures of event venues, “shelter in place” health orders and travel restrictions have had a significant effect on the production ofsignificantly impacted the Company’s trade shows and other events. Due torevenues from mid-March 2020 through the measures governments and private organizations implemented in order to stem the spreadend of COVID-19, the Company cancelled all but one trade shows and other events which had been scheduled to stagefiscal year 2021. Late in the second halfquarter of March 2020 through December 2020, as well as,2021, the cancellationCompany began to see the positive impacts of successful vaccination rollouts throughout the United States, with social distancing restrictions easing and postponement of several trade shows and otherlive events inresuming. As a result, the first half of 2021.
These actions have had an unprecedented and materially adverse impact on the Company’s revenues and financial position. The lengthCompany was able to stage all of the travel restrictions141 and social distancing measures to prevent124 in-person events scheduled during the spread of COVID-19 is uncertain.years ended December 31, 2023 and 2022, respectively, and 56 in-person events during the year ended December 31, 2021.
Revenue Recognition and Deferred Revenue
Revenue is recognized as the customer receives the benefit of the promised services and performance obligations are satisfied. Revenue is recognized at an amount that reflects the consideration the Company expects to receive in exchange for those services. Customers generally receive the benefit of the Company’s services upon the staging of each trade show or conference event and over the subscription period for access to the Company’s subscription software and services. Fees are typically invoiced and collected in-full prior to the trade show or event.
A significant portion of the Company’s annual revenue is generated from the Connections segment primarily related to the production of trade shows and conference events (collectively, “trade shows”), including booth space sales, registration fees and sponsorship fees. The Company recognizes revenue in the period the trade show occurs. The ongoing COVID-19 pandemicTrade show and its consequences forced the Company to cancel a significant portion of the Company’s in personother events beginning in March 2020 through the end of the year and the first half of 2021. As a result, 75% of the Company’s revenue for the year ended December 31, 2020 was generated through live events, 4% from virtual events and 21% from non-virtual event other marketing services. Trade show revenues represented approximately 63%89%, 92%87% and 93%73% of total revenues for the years ended December 31, 2020, 20192023, 2022 and 2018,2021, respectively.
Other marketing servicesContent revenues primarily consist of advertising sales for digital products and industry publications that complement the event properties, custom content agency revenues and subscription fees for educational and e-learning services. Advertising sales and custom content revenues are recognized in the period in which the custom content and digital products are provided or publications are issued. Subscription fees for educational and e-learning services are billed and collected at the subscription date. Typically, the fees charged are collected after the custom content and digital products are delivered or publications are issued.
Commerce revenues primarily consist of software-as-a-service subscription revenue, implementation fees and professional services. Fees associated with implementation are deferred and recognized over the expected customer life, which is four years. Subscription revenue is generally recognized over the term of the contract.
Deferred revenues typicallygenerally consist of booth space sales, registration fees and sponsorship fees that are invoiced prior to a trade show.show, as well as upfront payments for software subscription fees, professional services and implementation fees for the Company’s subscription software and services. Current deferred revenues are reported as deferred revenues on the consolidated balance sheets and were $48.6$174.3 million and $187.3$151.2 million as of December 31, 20202023 and 2019,2022, respectively. Long-term deferred revenues as of December 31, 20202023 and 20192022 were 0$0.9 million and $0.1$1.4 million, respectively, and are reported as other noncurrent liabilities on the consolidated balance sheets. Total deferred revenues, including the current and non-currentnoncurrent portions, were $48.6$175.2 million and $187.4$152.6 million, as of December 31, 20202023 and 2019,2022, respectively. As a result of the measures to prevent the spread of COVID-19, the Company has experienced an unprecedented low level of booth space sales, registration fees and sponsorship fees and the associated cash received for future trade shows. In addition, the Company cancelled all but one trade show and other events which had been scheduled to stage in the second half of March 2020 through December 2020, as well as, cancellation and postponement of several trade shows and other events in the first half of 2021, which led to a significant decrease in deferred revenues.
The accounts receivable and deferred revenue balances related to cancelled events have been reclassified to cancelled event liabilities in the consolidated balance sheets as the nettotal amount represents balances which are expected to be refunded to customers. As of December 31, 2023, cancelled event liabilities of $0.6 million represents $0.5 million of deferred revenues for cancelled trade shows and $0.1 million of related accounts receivable credits reclassified to
89
cancelled event liabilities in the consolidated balance sheets. As of December 31, 2022, cancelled event liabilities of $3.3 million represents $0.8 million of deferred revenues for cancelled trade shows and $2.5 million of related accounts receivable credits reclassified to cancelled event liabilities in the consolidated balance sheets.
The following table represents the deferred revenue activity for the years ended December 31, 2020, 20192023, 2022 and 2018,2021, respectively:
|
| Year Ended December 31, |
|
|
|
| ||||||||||||||||||
(in millions) |
| 2020 |
|
| 2019 |
|
| 2018 |
|
| 2023 |
|
| 2022 |
|
| 2021 |
| ||||||
Balance at beginning of period |
| $ | 187.4 |
|
| $ | 192.4 |
|
| $ | 194.5 |
|
| $ | 152.6 |
|
| $ | 118.3 |
|
| $ | 48.6 |
|
Invoiced during the period |
|
| 167.2 |
|
|
| 302.2 |
|
|
| 205.6 |
| ||||||||||||
Consideration earned during the period |
|
| (91.7 | ) |
|
| (308.6 | ) |
|
| (324.0 | ) |
|
| (148.2 | ) |
|
| (271.0 | ) |
|
| (123.1 | ) |
Invoiced during the period |
|
| 122.0 |
|
|
| 302.1 |
|
|
| 308.1 |
| ||||||||||||
Attributable to show cancellations |
|
| (170.3 | ) |
|
| — |
|
|
| — |
|
|
| — |
|
|
| — |
|
|
| (14.6 | ) |
Additions related to business combinations |
|
| 1.2 |
|
|
| 1.5 |
|
|
| 13.8 |
|
|
| 3.6 |
|
|
| 3.1 |
|
|
| 1.8 |
|
Balance at end of period |
| $ | 48.6 |
|
| $ | 187.4 |
|
| $ | 192.4 |
|
| $ | 175.2 |
|
| $ | 152.6 |
|
| $ | 118.3 |
|
Performance Obligations
Revenue forFor the Company’s trade shows and other events, sales are deferred and recognized when performance obligations under the terms of a contract with the Company’s customercustomers are satisfied, which is typically inat the periodcompletion of a show or event. Revenue is measured as the trade show occurs. Revenue foramount of consideration the Company earns upon completion of its performance obligations.
For the Company’s subscription software and services, the Company may enter into contracts with customers that include multiple performance obligations, which are generally capable of being distinct. Fees associated with implementation and related professional services are deferred and recognized over the expected customer life, which is four years. Subscription revenue is recognized over the term of the contract. The Company’s contracts associated with the subscription software and services are generally three-year terms with one-year renewals following the initial three-year term.
For the Company’s other marketing services, revenues are deferred and recognized when performance obligations under the terms of a contract with the
Company’s customercustomers are satisfied. This generally occurs in the period in which the publications are issuedor the advertising services are provided.issued. Revenue is measured as the amount of consideration the Company expects to receiveearns upon completion of its performance obligations.
The Company applies a practical expedient which allows the exclusion of disclosure information regarding remaining performance obligations if the performance obligation is part of a contract that has an expected duration of one year or less. The Company’s performance obligations greater than one year are immaterial. were $0.9 million as of December 31, 2023.
Disaggregation of Revenue
The following table represents revenues disaggregated by type:
|
| Year Ended December 31, |
| |||||||||
|
| 2023 |
|
| 2022 |
|
| 2021 |
| |||
Revenues |
| (in millions) |
| |||||||||
Connections |
| $ | 340.2 |
|
| $ | 282.6 |
|
| $ | 106.7 |
|
Content |
|
| 23.5 |
|
|
| 27.9 |
|
|
| 27.7 |
|
Commerce |
|
| 19.1 |
|
|
| 15.4 |
|
|
| 11.1 |
|
Total revenues |
| $ | 382.8 |
|
| $ | 325.9 |
|
| $ | 145.5 |
|
|
| Reportable Segment |
|
|
|
|
|
|
|
|
| |||||
|
| Commerce |
|
| Design and Technology |
|
| All Other |
|
| Total |
| ||||
Year Ended December 31, 2020 |
| (in millions) |
| |||||||||||||
Trade shows |
| $ | 49.3 |
|
| $ | 28.7 |
|
| $ | 2.3 |
|
| $ | 80.3 |
|
Other events |
|
| 2.2 |
|
|
| 7.5 |
|
|
| 11.2 |
|
|
| 20.9 |
|
Other marketing services |
|
| 5.4 |
|
|
| 15.0 |
|
|
| 5.8 |
|
|
| 26.2 |
|
Total revenues |
| $ | 56.9 |
|
| $ | 51.2 |
|
| $ | 19.3 |
|
| $ | 127.4 |
|
Year Ended December 31, 2019 |
|
|
|
|
|
|
|
|
|
|
|
|
|
|
|
|
Trade shows |
| $ | 177.4 |
|
| $ | 106.9 |
|
| $ | 7.2 |
|
| $ | 291.5 |
|
Other events |
|
| 0.6 |
|
|
| 12.8 |
|
|
| 25.8 |
|
|
| 39.2 |
|
Other marketing services |
|
| 6.7 |
|
|
| 20.2 |
|
|
| 3.3 |
|
|
| 30.2 |
|
Total revenues |
| $ | 184.7 |
|
| $ | 139.9 |
|
| $ | 36.3 |
|
| $ | 360.9 |
|
Year Ended December 31, 2018 |
|
|
|
|
|
|
|
|
|
|
|
|
|
|
|
|
Trade shows |
| $ | 207.2 |
|
| $ | 102.4 |
|
| $ | 9.3 |
|
| $ | 318.9 |
|
Other events |
|
| 0.9 |
|
|
| 9.6 |
|
|
| 24.4 |
|
|
| 34.9 |
|
Other marketing services |
|
| 7.8 |
|
|
| 15.8 |
|
|
| 3.3 |
|
|
| 26.9 |
|
Total revenues |
| $ | 215.9 |
|
| $ | 127.8 |
|
| $ | 37.0 |
|
| $ | 380.7 |
|
90
Contract Balances
Due to the nature ofThe Company’s contract assets are primarily sales commissions incurred in connection with the Company’s revenue from contracts with customers,subscription software and services, which are expensed over the expected customer relationship period. As of December 31, 2023 and 2022, the Company does not have material contract assets that fall under the scope of ASC Topic 606, Revenue from Contracts with Customers. assets.
Contract liabilities primarilygenerally consist of booth space sales, registration fees, and sponsorship fees that are collected prior to the trade show or other event.event and subscription revenue, implementation fees and professional services associated with the Company’s subscription software and services. Contract liabilities less than one year from the date of the performance obligation are reported on the consolidated balance sheets as deferred revenues. Contract liabilities greater than one year from the date of the performance obligation are reported on the consolidated balance sheets in other noncurrent liabilities.
The Company incursCompany’s sales commissionscommission costs incurred in connection with sales of booth space, registration fees and sponsorshipssponsorship fees at the Company’s trade shows and other events and with sales of advertising for industry publications. The Company’s contracts with customerspublications are generally short term, as sales generallytypically begin up to one year prior to the date of the trade shows.shows and other events. The Company expects the period benefittedbenefited by each commission to be less than one year, and as a result, the Company expenses sales commissions associated with trade shows, other events and other marketing services as incurred. Sales commissions are reported on the consolidated statements of loss(loss) income and comprehensive loss(loss) income as selling, general and administrative expenses. expense.
Accounts Receivable
The Company monitors collections and payments from its customers and maintains an allowance based upon applying an expected credit loss rate to receivables based on the historical loss rate from similar higher risk customers adjusted for current conditions, including any specific customer collection issues identified, and forecasts of economic conditions. Delinquent account balances are written off after management has determined that the likelihood of collection is remote. The activities in this account, including write-offs and the current-period provision for expected credit losses for the year ended December 31, 2023 were $0.4 million and $0.3 million, respectively. The activities in this account for the years ended December 31, 2022 and 2021 were not material.
Contract Estimates and Judgments
The Company’s revenues generallytrade show, other event and other marketing sales revenue contracts do not require significant estimates or judgments based on the nature of the Company’s contracts. The sales price in the Company’s contracts are fixed and stated on the face of the contract. All consideration from contracts is included in the transaction price. The Company’s contracts with multiple performance obligations are considered to be fulfilled upon the completion of each trade show, publication issuance
or as advertising services are provided, as applicable.The Company’s contracts consist of subscription revenue, implementation fees and professional services. Fees associated with implementation and professional services are deferred and recognized over the expected customer life, which is four years. Subscription revenue is recognized over the term of the contract. The Company’s contracts associated with the subscription software and services are generally three-year terms with one-year renewals. The Company’s contracts do not include material variable consideration.
Note 4. Business Acquisitions
The Company acquired certain assets and assumed certain liabilities of one company in 2023 (the “2023 Acquisition”), two companies in 20202022 (the “2020“2022 Acquisitions”), one company in 2019 (the “2019 Acquisition”) and two companies in 20182021 (the “2018“2021 Acquisitions”) as described below. Each transaction qualified as an acquisition of a business and was accounted for as a business combination.
TheThe Company recorded goodwill of $27.4$8.4 million and $12.9$31.5 million for the business acquisitions in the years ended December 31, 20202023 and 2019,2022, respectively. In the view of management, the goodwill recorded reflects the future cash flow expectations for the acquired businesses’ market positions in their respective trade show industries, synergies and assembled workforce. Substantially all of the goodwill recorded is expected to be deductible for income tax purposes. The fair values of acquired customer-relationship intangibles are estimated using a discounted cash flow analysis. SignificantThe significant assumptions usedin the discounted cash flow analysis include future cash flows, growth
91
rates, discount rates, and tax ratesrates. These assumptions are used in developing the present value of future cash flow projections which are the basis of the fair value calculation.
2020 Acquisitions2023 Acquisition
PlumRiver TechnologiesLodestone Events (“PlumRiver”Lodestone”)
On December 31, 2020, inIn furtherance of the Company’s strategy to provide year-round engagement for its customer base and to expand its digital commerce capabilities,into the growing business-to-consumer event space, the Company acquiredexecuted an asset purchase agreement on January 9, 2023 to acquire certain assets and assumedassume certain liabilities associated with PlumRiverof the business known as Lodestone for a total estimated purchase price of $46.4$10.2 million, which included an initial cash payment of $30.0$9.5 million $4.4 million in stock, a working capital adjustment of approximately $1.1 million, a deferred payment of $2.0 million, which is due to be paid in 2022, and contingent consideration with an estimated fair value of $10.0$0.7 million. The contingent consideration liability related to the acquisition of Lodestone consists of three components with totala potential future payments of $11.0 million including (i) Up to $2.0 millionforpayment based on Lodestone’s average annual EBITDA during the achievement of a technological milestoneperiod from January 1, 2025 through December 31, 2026. The payment is expected to be paidsettled in the second quarter of 2021, (ii) Up to $2.0 million for2027. As of December 31, 2023, the successful onboardingestimated fair value of qualified customers expected to be paid in the fourth quartercontingent consideration was $0.8 million. Lodestone produces the Overland Expo series of 2021 and (iii) Up to $7.0 million for the achievement of revenue targets expected to be paid in the first quarter of 2023.vehicle-based, adventure travel consumer shows. The acquisition was financed with cash on hand and the issuance of 805,948 shares of the Company’s common stock.from operations.
External acquisition costs of $1.4$0.4 million were expensed as incurred and included in selling, general and administrative expenses in the consolidated statements of loss(loss) income and comprehensive loss.(loss) income. There was 0$9.0 million of revenue orand $4.4 million of net income generated from the acquisition of Lodestone during the 2020 post-acquisition period.year ended December 31, 2023. Goodwill was calculated as the excess of the purchase price over the estimated fair values of acquired assets and intangible assets offset by liabilities acquired, and is primarily attributable to the future economic benefits from synergies expected to arise due to certain cost savings, operating efficiencies and other strategic benefits. Substantially all of the goodwill recorded is expected to be deductible for income tax purposes.
Identified intangible assets associated with Lodestone included trade name and customer relationship intangible assets of $1.1 million and $2.3 million, respectively. The weighted-average amortization period of the trade name intangible assets acquired was 5.0 years. The weighted-average amortization period of the customer relationship intangible assets acquired was 6.0 years. There is no assumed residual value for the acquired trade name and customer relationship intangible assets. The measurement period is expected to closefor the acquisition closed in the firstsecond quarter of 2021.2023.
The following table summarizes the fair value of the acquired assets and liabilities on the acquisition date:
(in millions) |
| January 9, |
| |
Trade and other receivables |
| $ | 1.8 |
|
Prepaid expenses and other current assets |
|
| 0.2 |
|
Goodwill |
|
| 8.4 |
|
Intangible assets |
|
| 3.4 |
|
Deferred revenues |
|
| (3.6 | ) |
Purchase price, including working capital adjustment |
| $ | 10.2 |
|
2022 Acquisitions
(in millions) |
| December 31, 2020 |
| |
Trade and other receivables |
| $ | 1.9 |
|
Goodwill |
|
| 25.3 |
|
Intangible assets |
|
| 20.0 |
|
Accounts payable and other current liabilities |
|
| (0.3 | ) |
Deferred revenues |
|
| (0.5 | ) |
Purchase price, including working capital adjustment |
| $ | 46.4 |
|
Bulletin, Inc. (“Bulletin”)
EDspaces
In line withfurtherance of the Company’s strategic growth initiatives, on December 21, 2020,strategy to combine both in-person and e-commerce offerings, the Company acquiredexecuted an asset purchase agreement on July 11, 2022 to acquire certain assets and assumedassume certain liabilities associated with EDspacesof the business known as Bulletin for a total estimated purchase price of $3.6$9.9 million, which included a negative working capital adjustmentan initial cash payment of approximately $1.0$8.9 million and contingent consideration with an estimated fair value of $0.4
$1.0million. The contingent consideration isliability related to the acquisition of Bulletin of $1.0 million, consists of a potential payment based upon exceeding revenue targets andon the 2026 Bulletin EBITDA. The 2026 payment is expected to be paidsettled in 2023.the second quarter of 2027. As of December 31, 2023, the estimated fair value of the contingent consideration was $0.9 million. Bulletin is an online wholesale market for retail where brands, buyers and designers gather to connect and discover new products. The acquisition was financed with cash from operations.
NaN material external acquisition costs were incurred and there was 0 revenue during the 2020 post-acquisition period and the net loss generated from the acquisition during the 2020 post-acquisition period was not material. The measurement period was closed in the fourth quarter of 2020.92
(in millions) |
| December 21, 2020 |
| |
Goodwill |
| $ | 2.1 |
|
Intangible assets |
|
| 2.2 |
|
Deferred revenues |
|
| (0.7 | ) |
Purchase price, including working capital adjustment |
| $ | 3.6 |
|
2019 Acquisition
G3 Communications (“G3”)
In line with the Company’s strategic growth initiatives, on November 1, 2019, the Company acquired certain assets and assumed certain liabilities associated with G3 for a total purchase price of $15.7 million, which included a negative working capital adjustment of approximately $1.4 million and contingent consideration of $4.3 million.
The contingent consideration is based upon a multiple of estimated EBITDA and is payable on March 31, 2022. The acquisition was financed with cash from operations and a draw of $5.0 million on the Company’s revolving credit facility.
External acquisition costs of $0.4$1.1 million were expensed as incurred and included in selling, general and administrative expenses in the consolidated statements of loss(loss) income and comprehensive loss.(loss) income. The Bulletin acquisition generated a net loss of $1.8 million during the year ended December 31, 2022. The revenue and net income generated from the acquisitionby Bulletin during the 2019 post-acquisition periodyear ended December 31, 2022, was $1.3not material. Goodwill was calculated as the excess of the purchase price over the estimated fair values of acquired assets and intangible assets acquired offset by liabilities acquired and is primarily attributable to the future economic benefits expected to arise from synergies expected to arise due to certain cost savings, operating efficiencies and other strategic benefits. Substantially all of the goodwill recorded is expected to be deductible for income tax purposes.
Identified intangible assets associated with Bulletin included acquired technology and trade name intangible assets of $2.0 million and $0.2$0.1 million, respectively. The measurementweighted-average amortization period of the acquired technology was closed in3.0 years. The weighted-average amortization period of the fourth quarter of 2019.trade name intangible assets acquired was 3.0 years. There is no assumed residual value for the acquired technology and trade name intangible assets.
The following table summarizes the fair value of the acquired assets and liabilities aton the dateacquisition date:
(in millions) |
| July 11, |
| |
Trade receivables and prepaid expenses |
| $ | 0.4 |
|
Goodwill |
|
| 7.9 |
|
Intangible assets |
|
| 2.1 |
|
Accounts payable and other current liabilities |
|
| (0.5 | ) |
Purchase price |
| $ | 9.9 |
|
Advertising Week
In furtherance of acquisition:
(in millions) |
| November 1, 2019 |
| |
Prepaid expenses |
|
| 0.3 |
|
Goodwill |
|
| 12.9 |
|
Intangible assets |
|
| 4.0 |
|
Deferred revenues |
|
| (1.5 | ) |
Purchase price, including working capital adjustment |
| $ | 15.7 |
|
2018 Acquisitions
Boutique Design New York (“BDNY”)
In line with the Company’s strategy to provide year-round engagement and optimize its portfolio within strategic growth initiatives, on October 15, 2018,industries, the Company acquired certainexecuted an asset purchase agreement on June 21, 2022 to acquire all the assets and assumedassume certain liabilities associated with BDNY and associated trade shows and related assetsof the business known as Advertising Week from ST Media Group International, Inc. and Hospitality Media Group, LLC,Stillwell Partners for a total estimated purchase price of $45.1$34.3 million, which included a negative working capital adjustmentan initial cash payment of approximately $8.7$28.4 million and deferred paymentscontingent consideration with an estimated fair value of $1.8$5.9 million. The deferred payments are related to a Joint Venture Interest Redemption Agreement and Marketing Services Agreement between the American Hotel and Lodging Association, New York State Hospitality & Tourism Association, Inc. and Hotel Association of New York City, Inc.. As of December 31, 2019, $0.7 million2023, the estimated fair value of the deferred paymentcontingent consideration was $4.9 million. Advertising Week is included in accounts payablea global event and other current liabilitiesthought leadership platform focused on marketing, media, technology, and $0.1 million is included in other noncurrent liabilities in the consolidated balance sheets.culture. The acquisition was financed with cash from operationsoperations.
Identified intangible assets associated with Advertising Week included trade name, customer relationship and a drawcontent intangible assets of $5.4 million, $5.9 million and $1.1 million, respectively. The weighted-average amortization period of the trade names acquired was 15.0 years. The weighted-average amortization period of the customer relationship intangible assets acquired was 10.0 years, based on the Company’s revolving credit facility.expected pattern of economic benefit used to calculate their fair value. The weighted-average amortization period of the content intangible assets acquired was 7.0 years. There is no assumed residual value for the acquired content, trade names, or customer relationships.
The contingent consideration liability related to the acquisition of Advertising Week in the amount of $5.9 million as of the acquisition date, consists of two potential payments: the 2023 payment and the 2026 payment. The 2023 payment is based on a multiple of 2023 EBITDA growth from a specified EBITDA target. The Advertising Week business did not achieve growth from the specified EBITDA target in fiscal year 2023 and therefore will not receive the 2023 payment. The 2026 payment is based on a range of multiples, which are dependent upon the acquisition’s 5-year compounded annual EBITDA growth rate from 2021 through 2026, being applied to the average annual EBITDA growth in calendar years 2024, 2025 and 2026, from a specified EBITDA target, less the 2023 payment. The 2026 payment will be settled in the second quarter of 2027. The 2023 and 2026 payments are not capped as they are based on increases in EBITDA. Therefore, there is no pre-determined upper limit to the undiscounted range.
External acquisition costs of $0.7$0.6 million were expensed as incurred and included in selling, general and administrative expenses in the consolidated statements of loss(loss) income and comprehensive loss. The(loss) income. There was $14.6 million of revenue and $2.2 million of net income generated from the acquisition of Advertising Week during the 2018 post-acquisition periodyear ended December 31, 2022. Goodwill was $12.7 millioncalculated as the excess of the purchase price over the estimated fair values of acquired assets and $3.1 million, respectively. The measurement period was closed inintangible assets acquired offset by liabilities acquired and is primarily attributable to the fourth quarterfuture
93
economic benefits expected to arise from synergies expected to arise due to certain cost savings, operating efficiencies and other strategic benefits. Substantially all of 2018.the goodwill recorded is expected to be deductible for income tax purposes.
The following table summarizes the fair value of the acquired assets and liabilities aton the dateacquisition date:
(in millions) |
| June 21, |
| |
Trade and other receivables |
| $ | 3.8 |
|
Prepaid expenses and other current assets |
|
| 0.3 |
|
Goodwill |
|
| 23.6 |
|
Intangible assets |
|
| 12.4 |
|
Right-of-use lease asset |
|
| 1.2 |
|
Accounts payable and other current liabilities |
|
| (2.7 | ) |
Deferred revenues |
|
| (3.1 | ) |
Right-of-use lease liability |
|
| (1.2 | ) |
Purchase price |
| $ | 34.3 |
|
2021 Acquisitions
MJBiz
In furtherance of acquisition:
(in millions) |
| October 15, 2018 |
| |
Trade and other receivables |
| $ | 1.5 |
|
Prepaid expenses |
|
| 1.9 |
|
Goodwill |
|
| 29.2 |
|
Intangible assets |
|
| 24.6 |
|
Deferred revenues |
|
| (12.1 | ) |
Purchase price, including working capital adjustment |
| $ | 45.1 |
|
Technology Brands
In line with the Company’s strategicstrategy to provide year-round engagement and to expand into one of the highest growth initiatives, on August 20, 2018,business sectors in North America, the Company acquiredexecuted an asset purchase agreement on December 31, 2021 to acquire certain assets and assumedassume certain liabilities associated with a technology event and a group of complementary technology intelligence brands serving the residential, commercial and security integrator markets from EH Publishing, Inc.,MJBiz for a total estimated purchase price of $27.8$142.2 million, which included a negative working capital adjustmentan initial cash payment of approximately $0.5$118.2 million and contingent consideration with an estimated fair value of $24.0 million. MJBiz is an event producer and content platform serving the cannabis industry. The acquisition of the technology event, Total Tech Summit, and related brands CEPro, Commercial Integrator, Security Sales & Integration, and Campus Safety (collectively, “the Technology Brands”) was financed with cash from operations.
Identified intangible assets associated with MJBiz included trade name and customer relationship intangible assets of $7.1 million and $23.3 million, respectively. The weighted-average amortization period of the trade names acquired was 10.0 years. The weighted-average amortization period of the customer relationships acquired was 5.0 years, based on the expected pattern of economic benefit used to calculate their fair value. There is no assumed residual value for the acquired trade names or customer relationships.
External acquisition costs of $0.6$1.0 million were expensed as incurred and included in selling, general and administrative expenses in the consolidated statements of loss(loss) income and comprehensive loss.(loss) income.There was no revenue or net income (loss) generated from the acquisition of MJBiz during 2021. Goodwill was calculated as the excess of the purchase price over the estimated fair values of acquired assets and intangible assets acquired offset by liabilities acquired and is primarily attributable to the future economic benefits expected to arise from synergies expected to arise due to certain cost savings, operating efficiencies and other strategic benefits. Substantially all of the goodwill recorded is expected to be deductible for income tax purposes.
During the first quarter of 2022, the Company finalized its analysis of the purchase accounting, including gaining a better understanding of historical MJBizCon registration revenue and its impact on the valuation model. The final analysis of the registration revenue and the associated revision to the average EBITDA growth estimate for MJBiz resulted in an $8.9 million increase in the estimated contingent consideration liability. The measurement period closed in the first quarter of 2022.
The Company’s purchase price allocation and measurement period adjustment for the MJBiz acquisition is presented below:
94
(in millions) |
| Fair Value |
|
| Non-Cash |
|
| Fair Value |
| |||
Trade and other receivables |
| $ | 0.6 |
|
| $ | — |
|
| $ | 0.6 |
|
Prepaid expenses |
|
| 0.1 |
|
|
| — |
|
|
| 0.1 |
|
Goodwill |
|
| 113.8 |
|
| 6.0 |
|
|
| 119.8 |
| |
Intangible Assets |
|
| 30.4 |
|
|
| 2.9 |
|
|
| 33.3 |
|
Deferred Revenues |
|
| (1.3 | ) |
|
| — |
|
|
| (1.3 | ) |
Other current liabilities |
|
| (1.4 | ) |
|
| — |
|
|
| (1.4 | ) |
Purchase price |
| $ | 142.2 |
|
| $ | 8.9 |
|
| $ | 151.1 |
|
|
|
|
|
|
|
|
|
|
| |||
(1) During the first quarter of 2022, the Company recorded a non-cash adjustment to reflect a measurement period adjustment. Upon finalizing the analysis of the average EBITDA growth estimate, including gaining a better understanding of historical MJBizCon registration revenue trends, the estimated contingent consideration liability increased by $8.9 million, from approximately $24.0 million to $32.9 million. Such change resulted in an increase to Goodwill of $6.0 million and an increase in Intangible Assets of $2.9 million in the Connections reportable segment. |
| |||||||||||
Sue Bryce Education and The Portrait Masters
In furtherance of the Company’s strategy to provide year-round engagement for its customer base and to expand its subscription services offerings, the Company executed an asset purchase agreement on April 1, 2021 to acquire certain assets and assume certain liabilities associated with Sue Bryce Education and The Portrait Masters for a total estimated purchase price of $7.7 million, which included an initial cash payment of $6.9 million and contingent consideration with an estimated fair value of $0.8 million. Sue Bryce Education and The Portrait Masters is a subscription-based photography business education and e-learning service with a photography conference. The acquisition was financed with cash from operations.
Identified intangible assets associated with the Sue Bryce Education and The Portrait Masters included customer relationship, content, non-compete agreements and trade name intangible assets of $1.9 million, $1.5 million, $1.2 million and $0.3 million, respectively. The weighted-average amortization periods of the customer relationships, content, non-compete agreements and trade name intangible assets were 3 years, 5.5 years, 5 years and 10 years, respectively. There is no assumed residual value for the acquired customer relationships, content, non-compete agreements or trade name intangible assets.
External acquisition costs of $0.1 million were expensed as incurred and included in selling, general and administrative expenses in the consolidated statements of (loss) income and comprehensive (loss) income.There was $3.3 million of revenue and $0.3 million of net income generated from the acquisition of Sue Bryce Education and The Portrait Masters during the 2018 post-acquisition periodyear ended December 31, 2021. Goodwill was $5.4 millioncalculated as the excess of the purchase price over the estimated fair values of acquired assets and $0.9 million, respectively.intangible assets acquired offset by liabilities acquired and is primarily attributable to the future economic benefits expected to arise from synergies expected to arise due to certain cost savings, operating efficiencies and other strategic benefits. Substantially all of the goodwill recorded is expected to be deductible for income tax purposes. The measurement period was closed in the fourthsecond quarter of 2018.2021.
The following table summarizes the fair value of the acquired assets and liabilities aton the date of acquisition:acquisition date:
(in millions) |
| April 1, |
| |
Goodwill |
| $ | 3.3 |
|
Intangible assets |
|
| 4.9 |
|
Deferred revenues |
|
| (0.5 | ) |
Purchase price, including working capital adjustment |
| $ | 7.7 |
|
(in millions) |
| August 20, 2018 |
| |
Prepaid expenses and other assets |
| $ | 1.5 |
|
Goodwill |
|
| 14.2 |
|
Intangible assets |
|
| 14.2 |
|
Deferred revenues |
|
| (1.7 | ) |
Other current liabilities |
|
| (0.4 | ) |
Purchase price, including working capital adjustment |
| $ | 27.8 |
|
95
Supplemental Pro-Forma Financial Information
Supplemental information on an unaudited pro-forma basis, is reflected as if each of the 20202023, 2022 and 20192021 acquisitions had occurred at the beginning of the year prior to the year in which each acquisition closed, after giving effect to certain pro-forma adjustments primarily related to the amortization of acquired intangible assets and interest expense. The unaudited pro-forma supplemental information is based on estimates and assumptions that the Company believes are reasonable. The supplemental unaudited pro-forma financial information is presented for comparative purposes and is not necessarily indicative of what the Company’s financial position or results of operations actually would have been had the Company completed the acquisitions at the dates indicated, nor is it intended to project the future financial position or operating results of the combined companies. Further, the
supplemental unaudited pro-forma information has not been adjusted for show timing differences or discontinued events.
|
| Year Ended December 31, |
| |||||||||
|
| 2023 |
|
| 2022 |
|
| 2021 |
| |||
(in millions) |
| (Unaudited) |
| |||||||||
Pro-forma revenues(1) |
|
|
|
|
|
|
|
|
| |||
Lodestone |
| $ | — |
|
| $ | 6.4 |
|
| $ | 1.6 |
|
Advertising Week |
|
| — |
|
|
| 5.5 |
|
|
| 12.8 |
|
MJBiz |
|
| — |
|
|
| — |
|
|
| 26.9 |
|
Sue Bryce Education and The Portrait Masters |
|
| — |
|
|
| — |
|
|
| 1.0 |
|
Emerald revenue |
|
| 382.8 |
|
|
| 325.9 |
|
|
| 145.5 |
|
Total pro-forma revenues |
| $ | 382.8 |
|
| $ | 337.8 |
|
| $ | 187.8 |
|
|
|
|
|
|
|
|
|
|
| |||
Pro-forma net (loss) income |
|
|
|
|
|
|
|
|
| |||
Lodestone |
| $ | — |
|
| $ | 0.5 |
|
| $ | (1.4 | ) |
Bulletin |
|
| — |
|
|
| (2.1 | ) |
|
| (3.4 | ) |
Advertising Week |
|
| — |
|
|
| (0.7 | ) |
|
| 1.2 |
|
MJBiz |
|
| — |
|
|
| — |
|
|
| 5.2 |
|
Sue Bryce Education and The Portrait Masters |
|
| — |
|
|
| — |
|
|
| 0.3 |
|
Emerald net (loss) income |
|
| (8.2 | ) |
|
| 130.8 |
|
|
| (79.7 | ) |
Total pro-forma net (loss) income |
| $ | (8.2 | ) |
| $ | 128.5 |
|
| $ | (77.8 | ) |
(1) Pro-forma revenues from the Bulletin acquisition were not material to the years ended December 31, 2022, and 2021, respectively. |
| |||||||||||
|
| Year ended December 31, |
| |||||
|
| 2020 |
|
| 2019 |
| ||
(in millions) |
| (Unaudited) |
| |||||
Pro-forma revenues |
| $ | 138.6 |
|
| $ | 382.4 |
|
Pro-forma net loss |
| $ | (634.9 | ) |
| $ | (71.6 | ) |
Note 5. Property and Equipment
Property and equipment, net, consisted of the following:
|
| December 31, |
|
| December 31, |
| ||||||||||
(in millions) |
| 2020 |
|
| 2019 |
|
| 2023 |
|
| 2022 |
| ||||
Furniture, equipment and other |
| $ | 6.4 |
|
| $ | 5.8 |
|
| $ | 5.2 |
|
| $ | 4.8 |
|
Leasehold improvements |
|
| 3.2 |
|
|
| 3.0 |
|
|
| 1.0 |
|
|
| 1.0 |
|
|
| $ | 9.6 |
|
| $ | 8.8 |
|
| $ | 6.2 |
|
| $ | 5.8 |
|
Less: Accumulated depreciation |
|
| (5.7 | ) |
|
| (4.6 | ) |
|
| (4.7 | ) |
|
| (3.6 | ) |
Property and equipment, net |
| $ | 3.9 |
|
| $ | 4.2 |
|
| $ | 1.5 |
|
| $ | 2.2 |
|
Depreciation expense related to property and equipment for the years ended December 31, 2020, 20192023, 2022 and 20182021 was $1.3$1.0 million, $1.1$1.6 million and $1.0$1.3 million, respectively. Losses on disposals were not material for the years ended December 31, 2020, 2019 and 2018.
Note 6. Intangible Assets and Goodwill
Intangible Assets, Net
Intangible assets, net consist of the following:
(in millions) |
| Indefinite- lived trade names |
|
| Customer relationship intangibles |
|
| Definite- lived trade names |
|
| Purchased Technology |
|
| Computer software |
|
| Capitalized software in progress |
|
| Total Intangible Assets |
| |||||||
Gross carrying amount at December 31, 2019 |
| $ | 112.7 |
|
| $ | 390.4 |
|
| $ | 105.6 |
|
| $ | — |
|
| $ | 10.6 |
|
| $ | 1.3 |
|
| $ | 620.6 |
|
Accumulated amortization |
|
| — |
|
|
| (231.9 | ) |
|
| (6.9 | ) |
|
| — |
|
|
| (8.0 | ) |
|
| — |
|
|
| (246.8 | ) |
Net carrying amount at December 31, 2019 |
| $ | 112.7 |
|
| $ | 158.5 |
|
| $ | 98.7 |
|
| $ | — |
|
| $ | 2.6 |
|
| $ | 1.3 |
|
| $ | 373.8 |
|
|
|
|
|
|
|
|
|
|
|
|
|
|
|
|
|
|
|
|
|
|
|
|
|
|
|
|
|
|
Gross carrying amount at December 31, 2020 |
| $ | 65.9 |
|
| $ | 369.0 |
|
| $ | 91.1 |
|
| $ | 6.2 |
|
| $ | 12.3 |
|
| $ | 2.5 |
|
| $ | 547.0 |
|
Accumulated amortization |
|
| — |
|
|
| (253.4 | ) |
|
| (9.1 | ) |
|
| — |
|
|
| (9.5 | ) |
|
| — |
|
|
| (272.0 | ) |
Net carrying amount at December 31, 2020 |
| $ | 65.9 |
|
| $ | 115.6 |
|
| $ | 82.0 |
|
| $ | 6.2 |
|
| $ | 2.8 |
|
| $ | 2.5 |
|
| $ | 275.0 |
|
96
(in millions) |
| Indefinite- |
|
| Customer |
|
| Definite- |
|
| Acquired |
|
| Acquired |
|
| Computer |
|
| Capitalized |
|
| Total |
| ||||||||
Gross carrying |
| $ | 52.6 |
|
| $ | 365.4 |
|
| $ | 91.1 |
|
| $ | 8.4 |
|
| $ | 2.6 |
|
| $ | 36.9 |
|
| $ | 1.6 |
|
| $ | 558.6 |
|
Accumulated amortization |
|
| — |
|
|
| (336.7 | ) |
|
| (22.6 | ) |
|
| (4.7 | ) |
|
| (1.0 | ) |
|
| (18.5 | ) |
|
| — |
|
|
| (383.5 | ) |
Net carrying |
| $ | 52.6 |
|
| $ | 28.7 |
|
| $ | 68.5 |
|
| $ | 3.7 |
|
| $ | 1.6 |
|
| $ | 18.4 |
|
| $ | 1.6 |
|
| $ | 175.1 |
|
|
|
|
|
|
|
|
|
|
|
|
|
|
|
|
|
|
|
|
|
|
|
|
|
| ||||||||
Gross carrying |
| $ | 52.6 |
|
| $ | 363.1 |
|
| $ | 90.0 |
|
| $ | 8.4 |
|
| $ | 2.6 |
|
| $ | 25.5 |
|
| $ | 2.1 |
|
| $ | 544.3 |
|
Accumulated amortization |
|
| — |
|
|
| (306.2 | ) |
|
| (17.2 | ) |
|
| (2.2 | ) |
|
| (0.6 | ) |
|
| (13.3 | ) |
|
| — |
|
|
| (339.5 | ) |
Net carrying |
| $ | 52.6 |
|
| $ | 56.9 |
|
| $ | 72.8 |
|
| $ | 6.2 |
|
| $ | 2.0 |
|
| $ | 12.2 |
|
| $ | 2.1 |
|
| $ | 204.8 |
|
Amortization expense for the years ended December 31, 2020, 20192023, 2022 and 20182021 was $47.3$44.0 million, $51.0$56.1 million and $45.8$46.2 million, respectively.
Future amortization expense is estimated to be as follows for each of the five following years and thereafter ending December 31:
(in millions) |
|
|
|
|
|
|
| |
2021 |
| $ | 45.6 |
| ||||
2022 |
|
| 43.5 |
| ||||
2023 |
|
| 30.9 |
| ||||
2024 |
|
| 12.5 |
|
|
| 25.0 |
|
2025 |
|
| 9.5 |
|
|
| 20.0 |
|
2026 |
|
| 15.3 |
| ||||
2027 |
|
| 10.5 |
| ||||
2028 |
|
| 6.0 |
| ||||
Thereafter |
|
| 64.6 |
|
|
| 44.0 |
|
|
| $ | 206.6 |
|
| $ | 120.8 |
|
The Company recorded impairments during the year ended December 31, 2020 of $60.9 million for trade names and $15.9 million for customer relationships, which is presented in the accompanying consolidated statements of loss and comprehensive loss asThere were no intangible asset impairments. The Company recorded impairments during the year ended December 31, 2019 of $8.3 million for trade names and $8.7 million for customer relationships, which is presented in the accompanying consolidated statements of loss and comprehensive loss as intangible asset impairments. The Company recorded impairments during the year ended December 31, 2018, of $90.6 million for trade names and $13.7 million for customer relationships, which is presented in the accompanying consolidated statements of loss and comprehensive loss as intangible asset impairment.
Impairment of Indefinite-Lived Intangible Assets
2020 Impairments
The Company performed a quantitative analysis for its annual impairment test for indefinite-lived intangible assets on October 31. The quantitative analysis utilized the “relief from royalty payments” method with assumptions that are considered level 3 inputs and concluded one indefinite-lived trade name asset group had a fair value in excess of its carrying value. As a result, during the fourth quarter of 2020, the Company recorded an impairment of $0.6 million related to an indefinite-lived trade name intangible asset.The impairment is reported in intangible asset impairments on the consolidated statements of loss and comprehensive loss.The indefinite-lived intangible asset impaired during the fourth quarter of 2020 had a remaining fair value of $1.0 million as of October 31, 2020.
During the first quarter of 2020, as a result of the COVID-19 pandemic, and the measures implemented to prevent its spread, management made the decision to cancel or postpone all of the Company’s face-to-face events scheduled through the remainder of 2020. As such, in the first quarter of 2020, management revised its forecast for the future performance of several trade show brands. Management determined these circumstances to be a triggering event and an indicator it was more likely than not that the carrying amount of certain of its indefinite-lived intangible asset groups exceeded their fair value. The Company performed a quantitative analysis and concluded certain of its indefinite-lived trade names had a fair value below the carrying values. As a result, the Company recorded an impairment of $46.2 million during the first quarter of 2020. The decline in fair value in certain indefinite-lived intangible assets compared to the carrying value is the result of changes in forecasted revenues and expenses. The impairment is reported in intangible asset impairments on the consolidated statements of loss and comprehensive loss.
The Company recorded total impairments of $46.8 million for the year ended December 31, 2020 related to certain indefinite-lived trade names. Indefinite-lived intangible2023. Intangible asset impairments in the Commerce and Design and Technology reportable segments were $24.1 million and $17.6 million, respectively, during the year ended December 31, 2020.
2019 Impairments
During the third quarter of 2019, the Company revised its forecast for the future performance of several trade show brands as the Company’s revenue expectations and pacing reflected a decline compared to the 2019 forecast due to the underperformance of these brands and an expected decrease in EBITDA driven by planned investments in technology and the execution of events. Management determined this to be a triggering event and an indicator it was
more likely than not that the carrying amount of certain of its indefinite-lived intangible asset groups exceeded their fair value. The Company performed a quantitative analysis and concluded that certain of its indefinite-lived trade names had a fair value below the carrying value. As a result, the Company recorded an impairment of $4.9 million during the year ended December 31, 2019. The decline in fair value in certain indefinite-lived intangible assets groups compared to the carrying value is the result of changes in forecasted revenues and expenses. The impairment is reported in intangible asset impairments on the consolidated statements of loss and comprehensive loss. In connection with its annual impairment test, the Company concluded each of its indefinite-lived trade name intangible assets had a fair value in excess of their carrying value. The indefinite-lived intangible assets impaired during 2019 had a remaining fair value of $10.0 million as of December 31, 2019.
Indefinite-lived intangible asset impairments in the Commerce and Design and Technology reportable segments were $0.7 million and $3.6 million, respectively, during the year ended December 31, 2019.
2018 Impairments
During the fourth quarter of 2018, the Company identified triggering events associated with the performance of several trade show brands that led management to determine that it was not more likely than not that the carrying amount of certain of its indefinite-lived intangible asset groups would be recovered. As a result of the qualitative analysis performed, the Company deemed it necessary to perform the quantitative analysis for certain asset groups. The Company performed the quantitative analysis and concluded that certain of its asset groups had a fair value below the carrying value. Accordingly, the Company recorded an impairment of $90.6 million for the year ended December 31, 2018 related to2022, included non-cash impairments of $1.6 million for indefinite-lived trade names intangible assets. Intangible asset impairments for the year ended December 31, 2021, included non-cash impairments of $21.0 million and $11.7 million for certain customer relationship and definite-lived trade names. The declinename intangible assets, and certain indefinite-lived trade names, respectively. All intangible asset impairments are presented in fair value compared to the carrying valueconsolidated statements of the asset groups is the result of changes in forecasted revenues(loss) income and expenses and adjustments to the valuation assumptions around future royalty and discount rates.comprehensive (loss) income as intangible impairments.
Impairment of Long-Lived Assets Other than Goodwill and Indefinite-Lived Intangible Assets
20202023 Impairments
During the year ended December 31, 2023, there were no triggering events or changes in circumstances that would indicate the carrying value of the Company’s long-lived assets other than goodwill are not recoverable. As such, no quantitative assessment for impairment was required during the year.
2022 Impairments
During the first quarter of 2020, as2022, the Company identified an interim impairment trigger for two of its definite-lived intangible assets. As a result, of the COVID-19 pandemicCompany performed a recoverability analysis on the definite-lived intangible assets and determined that the measures implemented to prevent its spread described above, management revised its forecast forcarrying value was recoverable. No additional triggering events or changes in circumstances
97
that would indicate the future performancecarrying value of the Company’s asset groups. The revised forecastlong-lived assets other than goodwill are not recoverable occurred for the remainder of the year ended December 31, 2022. As such, no quantitative assessment for impairment was required during the year.
2021 Impairments
During the fourth quarter of 2021, through the fiscal year 2022 budgeting process, the Company became aware of changes in circumstances which indicated the carrying value of certain definite-lived trade namesname and customer relationshipsrelationship intangible assets may not be recoverable. The Company evaluated the recoverability of the related intangible assets to be held and used by using level 3 inputs and comparing the carrying amount of an asset to the future net undiscounted cash flows expected to be generated by the asset to determine if the carrying value is not recoverable. The recoverability test indicated that certain of the customer relationship intangible assets and definite-lived trade names were impaired. As a result, the Company recorded an impairment of $13.2 million during the first quarter of 2020.
In connection with the impairment of certain of the Company’s indefinite-lived trade name intangible assets as of October 31, 2020, the Company performed a recoverability test on the relatedcertain asset groups containing definite-lived intangible assets. The Company evaluated the recoverability of the related intangible assets to be held and used by using level 3 inputs and comparing the carrying amount of the asset to the future net undiscounted cash flows expected to be generated by the asset to determine if the carrying value is not recoverable. The recoverability test indicated that certain of theone trade name intangible asset and one customer relationship intangible assets and definite-lived trade namesasset were impaired. As a result, the Company recorded an impairment, based on a measurementtrade name and customer relationship intangible asset impairments of fair value of those assets using an income approach, of $16.7 million.$12.6 million and $8.4 million, respectively, during the year ended December 31, 2021. The long-lived assets impaired during the fourth quarter of 20202021 had a remaining fair value of $25.0 million as of October 31, 2020. The long-lived asset impairments are reported in intangible asset impairments on the consolidated statements of loss and comprehensive loss.zero.
The Company recorded total impairments of $29.9$21.0 million to certain long-lived trade name and customer relationship intangible assets for the year ended December 31, 20202021 related to certain long-livedthe Connections reportable segment.
Impairment of Indefinite-Lived Intangible Assets
2023 Impairments
The Company performed a quantitative analysis for its annual impairment assessment for indefinite-lived intangible assets on October 31, 2023. The quantitative analysis utilized the “relief from royalty payments” method with assumptions that are considered level 3 inputs and concluded that each of the indefinite-lived trade namesname asset groups had fair values in excess of their carrying values as of October 31, 2023, and customer relationshiptherefore no impairments were identified.
2022 Impairments
During the first quarter of 2022, the Company identified an interim impairment trigger for three of its indefinite-lived intangible assets. Long-livedAs a result, the Company performed a quantitative analysis utilizing the “relief from royalty payments” method with assumptions that are considered level 3 inputs. As a result of the January 31, 2022 impairment assessment, the Company recorded an impairment of $1.6 million for one indefinite-lived trade name intangible asset. The impairment is reported in intangible asset impairments in the Commerceconsolidated statements of (loss) income and Designcomprehensive (loss) income.
The Company performed a quantitative analysis for its annual impairment assessment for indefinite-lived intangible assets on October 31, 2022. The quantitative analysis utilized the “relief from royalty payments” method with assumptions that are considered level 3 inputs and Technology reportable segmentsconcluded that each of the indefinite-lived trade name asset groups had fair values in excess of their carrying values as of October 31, 2022, and therefore no impairments were $21.7identified.
The Company recorded total impairments of $1.6 million and $7.2 million, respectively, duringto a certain indefinite-lived trade name intangible asset for the year ended December 31, 2020.
2019 Impairments2022. These impairments all related to certain indefinite-lived trade name intangible assets in the Connections reportable segment.
During the third quarter of 2019, the Company became aware of changes in circumstances, including its revised forecast for the future performance of several trade show brands as the Company’s revenue expectations and pacing reflected a decline compared to the 2019 forecast due to the underperformance of these brands and an expected decrease in EBITDA driven by planned investments in technology and the execution of events, which indicated the carrying value of certain trade names and customer relationships may not be recoverable. 2021 Impairments
The Company evaluated the recoverability of the relatedperformed a quantitative analysis for its annual impairment assessment for indefinite-lived intangible assets to be held and used by usingon October 31, 2021. The quantitative analysis utilized the “relief from royalty payments” method with assumptions that are considered level 3 inputs and comparing the carrying amount of anconcluded five indefinite-lived trade name asset to the future net undiscounted cash flows expected to be generated by the asset to determine if thegroups had a carrying value is not recoverable. The recoverability test indicated that certainin excess of the customer relationship intangible assets and definite-lived trade names were impaired.its fair value. As a result, during the fourth quarter of 2021, the Company recorded an impairment based on a measurement of fair value$11.7 million related to indefinite-lived trade name intangible assets. The impairment is reported in intangible asset impairments in the consolidated statements of those assets using an(loss) income approach of $12.1 million during the year ended December 31, 2019.and comprehensive (loss) income. The long-lived
98
indefinite-lived intangible assets impaired during 2019the fourth quarter of 2021 had a remaining fair value of $2.2$24.7 million as of DecemberOctober 31, 2019. 2021.
The long-lived assetCompany recorded impairments are reported inof $11.7 million to certain indefinite-lived trade name intangible asset impairments on the consolidated statements of loss and comprehensive loss.
Long-lived asset impairments in the Commerce and Design and Technology reportable segments were 0 and $4.3 million, respectively, duringassets for the year ended December 31, 2019.
2018 Impairments
In connection with the impairment of2021. These impairments all related to certain of the Company’sindefinite-lived trade name intangible assets as of October 31, 2018,in the Company performed a recoverability test on the related asset groups containing definite-lived intangible assets. The recoverability test indicated that certain customer relationship assets were impaired, which resulted in an impairment of $13.7 million during the year ended December 31, 2018.Connections reportable segment.
Goodwill
The table below summarizes the changes in the carrying amount of goodwill for each reportable segment:
|
| Reportable Segment |
|
|
|
|
|
|
|
|
|
| Reportable Segment |
|
|
|
|
|
|
|
|
| ||||||||||||||||||||||||||
(in millions) |
| Commerce |
|
| Design and Technology |
|
| All Other |
|
| Total |
|
| Commerce |
|
| Commerce |
|
| Design & |
|
| Design, |
|
| Connections |
|
| All Other |
|
| All Other |
|
| Total |
| ||||||||||||
Balance at December 31, 2018 |
|
| — |
|
|
| — |
|
|
| — |
|
| $ | 1,036.5 |
| ||||||||||||||||||||||||||||||||
Allocation of goodwill to segments |
|
| 640.3 |
|
|
| 361.3 |
|
|
| 34.9 |
|
|
| 1,036.5 |
| ||||||||||||||||||||||||||||||||
Balance at December 31, 2021 |
| $ | 337.5 |
|
| $ | — |
|
| $ | 133.7 |
|
| $ | — |
|
| $ | — |
|
| $ | — |
|
| $ | 43.0 |
|
| $ | 514.2 |
| ||||||||||||||||
Acquired goodwill |
|
| — |
|
|
| — |
|
|
| 12.9 |
|
|
| 12.9 |
|
|
| — |
|
|
| 7.9 |
|
|
| — |
|
|
| 23.6 |
|
|
| — |
|
|
| — |
|
|
| — |
|
|
| 31.5 |
|
Transfers |
|
| (337.5 | ) |
|
| 342.2 |
|
|
| (133.7 | ) |
|
| 142.9 |
|
|
| — |
|
|
| — |
|
|
| (13.9 | ) |
|
| — |
| ||||||||||||||||
Impairments |
|
| (41.9 | ) |
|
| (24.0 | ) |
|
| (3.2 | ) |
|
| (69.1 | ) |
|
| — |
|
|
| — |
|
|
| — |
|
|
| (5.8 | ) |
|
| — |
|
|
| — |
|
|
| (0.5 | ) |
|
| (6.3 | ) |
Balance at December 31, 2019 |
| $ | 598.4 |
|
| $ | 337.3 |
|
| $ | 44.6 |
|
| $ | 980.3 |
| ||||||||||||||||||||||||||||||||
Measurement period adjustment |
|
| — |
|
|
| 6.0 |
|
|
| — |
|
|
| 0.1 |
|
|
| — |
|
|
| — |
|
|
| — |
|
|
| 6.1 |
| ||||||||||||||||
Balance at December 31, 2022 |
| $ | — |
|
| $ | 356.1 |
|
| $ | — |
|
| $ | 160.8 |
|
| $ | — |
|
| $ | — |
|
| $ | 28.6 |
|
| $ | 545.5 |
| ||||||||||||||||
Acquired goodwill |
|
| — |
|
|
| 2.1 |
|
|
| 25.3 |
|
|
| 27.4 |
|
|
| — |
|
|
| — |
|
|
| — |
|
|
| — |
|
|
| 8.4 |
|
|
| — |
|
|
| — |
|
|
| 8.4 |
|
Impairments |
|
| (367.5 | ) |
|
| (205.7 | ) |
|
| (30.2 | ) |
|
| (603.4 | ) | ||||||||||||||||||||||||||||||||
Balance at December 31, 2020 |
| $ | 230.9 |
|
| $ | 133.7 |
|
| $ | 39.7 |
|
| $ | 404.3 |
| ||||||||||||||||||||||||||||||||
Transfers |
|
| — |
|
|
| (356.1 | ) |
|
| — |
|
|
| (160.8 | ) |
|
| 509.9 |
|
|
| 35.6 |
|
|
| (28.6 | ) |
|
| — |
| ||||||||||||||||
Balance at December 31, 2023 |
| $ | — |
|
| $ | — |
|
| $ | — |
|
| $ | — |
|
| $ | 518.3 |
|
| $ | 35.6 |
|
| $ | — |
|
| $ | 553.9 |
| ||||||||||||||||
|
|
|
|
|
|
|
|
|
|
|
|
|
|
|
|
|
|
|
| |||||||||||||||||||||||||||||
Impairment of Goodwill
2020 Impairments2023 Impairment
During the firstfourth quarter of 2020, the impact of COVID-19 on the travel and events industry, Emerald’s cancellation of all live events through the end of July as well as uncertainty around when2023, the Company would be ablechanged its operating segments which resulted in a change in reporting units. Under accounting standards, the Company is required to resumeperform an impairment assessment of its normal operations, causedprior reporting units immediately prior to the change in reporting units and immediately after the change on its new reporting units. To the extent that a significant and prolonged decline inprior reporting unit was separated into more than one reporting unit, the Company’s stock price, resulting inallocation of goodwill between the market capitalizationcomponents of the Company falling below its carrying value. As a result, management determined that a triggering event had occurred as it was more likely than not that the carrying values of all the Company’sold reporting units exceededwas determined based on their relative fair values. Accordingly,value. Due to the change in reporting units, the Company performed a quantitative assessment of the Company’s fair value of goodwillits prior and new reporting units as of MarchOctober 31, 20202023 using an income approach with assumptions that are considered level 3 inputs and concluded that the carryingfair value of severalall prior and new reporting unitsunit exceeded their respective fair values, resulting in a goodwill impairment of $588.2 million during the first quarter of 2020.carrying values. The fair values of the respectiveprior and new reporting units were determined primarily by discounting estimated future cash flows, which were determined based
on revenue and expense growth assumptions ranging from negative growth of 20.0% to growth of 5.0%, at a weighted average cost of capital (discount rate) ranging from 12.9% to 14.5%.
During the fourth quarter of 2020, in connection with the Company’s annual impairment assessment, the Company performed a quantitative assessment of the Company’s fair value of goodwill using an income approach with assumptions that are considered level 3 inputs and concluded that the carrying value of certain reporting units exceeded their respective fair values, resulting in a goodwill impairment of $15.2 million. The fair values of the respective reporting units were determined primarily by discounting estimated future cash flows, which were determined based on revenueforecasted revenues, EBITDA margins, debt free net working capital, capital expenditures and expense growth assumptionsother factors, at a discount rate ranging from negative 50.0%13.0% to 5.0%, at a weighted average cost15.5%. As of capital (discount rate) ranging from 10.9%the date of the Company’s assessment, there were no reporting units where the fair value of the reporting unit was equal to 11.5%. its carrying value. Reporting units where fair value exceeded carrying value by less than 10% included $25.6 million of goodwill.
The CompanyNo goodwill impairment was recorded total goodwill impairmentsin connection with the Company’s annual impairment assessment as of $603.4 million for the year ended DecemberOctober 31, 2020. Goodwill impairments in the Commerce, Design and Technology and All Other reportable segments were $367.5 million, $205.7 million and $30.2 million, respectively, during the year ended December 31, 2020.2023.
The Company also considers the amount of headroom for a reporting unit when determining whether an impairment exists. Headroom is the difference between the fair value of a reporting unit and its carrying value. In performing the annual impairment analysis as of October 31, 2020,2023, the Company determined that the carrying amount of certain
99
reporting units did not exceed their respective fair values. Based on the results of the impairment test performed as of October 31, 2023, the fair values of the reporting units exceeded their carrying value between 4.2% and 241.5%.
2022 Impairments
During the first quarter of 2022, the Company changed its operating segments which resulted in a change in reporting units. Under accounting standards, the Company is required to perform an impairment assessment of its prior reporting units immediately prior to the change in reporting units and immediately after the change on its new reporting units. To the extent that a prior reporting unit was separated into more than one reporting unit, the allocation of goodwill between the components of the old reporting units was determined based on their relative fair value. The Company had recently completed its annual impairment assessment on October 31, 2021 for its old reporting units. As of this interim impairment assessment, reporting units where fair value exceeded carrying value by less than 5% included $214.6 million of goodwill. Due to the change in reporting units, the Company performed a quantitative assessment of the fair value of its prior and new reporting units as of January 31, 2022 using an income approach with assumptions that are considered level 3 inputs and concluded that the carrying value of one reporting unit exceeded its respective fair value, resulting in goodwill impairments of $6.0 million and $0.3 million related to the Connections reportable segment and All Other category, respectively. The fair values of the respective reporting units were determined by discounting estimated future cash flows, which were determined based on revenue, long-term growth assumptions ranging from zero to 3.0%, at a discount rate ranging from 12.8% to 15.5%. As of the date of the Company’s assessment, reporting units where the fair value of the reporting unit was equal to its carrying value contained $3.1 million of goodwill.
No goodwill impairment was recorded in connection with the Company’s annual impairment assessment as of October 31, 2022.
The Company also considers the amount of headroom for a reporting unit when determining whether an impairment exists. Headroom is the difference between the fair value of a reporting unit and its carrying value. In performing the annual impairment analysis as of October 31, 2022, the Company determined that the carrying amount of certain reporting units did not exceed their respective fair values. Based on the results of the impairment test performed as of October 31, 2020,2022, the fair values of the reporting units exceeded their carrying value between 053.2% and 150%1,809.5%. Of the $404.3 million of goodwill, the carrying value of reporting units with less than 5% headroom is $62.7 million as of October 31, 2020.
2019 Impairments
2021 Impairments
During the thirdfourth quarter of 2019, the Company revised its forecast for future performance and issued revised guidance to the investment community causing an extended decline2021, in connection with the Company’s stock price resulting in the market capitalization of the Company falling below the carrying value of its single reporting unit. Accordingly,annual impairment assessment, the Company performed a quantitative assessment of the Company’s fair value of goodwill as of August 31, 2019 using income and market approaches with assumptions that are considered level 3 inputs and concluded that the Company’s carrying value of goodwill exceeded the Company’s fair value, resulting in a goodwill impairment of $9.3 million during the third quarter of 2019.
During the fourth quarter of 2019, the Company had a change in operating segments which resulted in a change in reporting units. The Company reassigned goodwill to the updated reporting units using a relative fair value approach. The Company performed a quantitative assessment of the Company’s fair value of goodwill as of October 31, 2019 using an income approach with assumptions that are considered level 3 inputs and concluded that the carrying value of severalone reporting unitsunit exceeded theirits respective fair values,value, resulting in a goodwill impairmentimpairments of $59.8 million.$7.0 million and $0.2 million related to the Connections segments and All Other category, respectively. Thefair values of the respective reporting units were determined primarily by discounting estimated future cash flows, which were determined based on revenue, and expenselong-term growth assumptions ranging from negative 10.0%zero to 5.0%growth of 3.5%, at a weighted average cost of capital (discount rate)discount rate ranging from 8.8%12.0% to 10.5%13.5%. Of the $514.2 million of goodwill, the carrying value equaled the fair value for $6.7 million as of October 31, 2021.
The Company recordedalso considers the amount of headroom for a reporting unit when determining whether an impairment exists. Headroom is the difference between the fair value of a reporting unit and its carrying value. In performing the annual impairment analysis as of October 31, 2021, the Company determined that the carrying amount of certain reporting units did not exceed their respective fair values. Based on the results of the impairment test performed as of October 31, 2021, the fair values of the reporting units exceeded their carrying value between zero and 458%. Of the $400.7 million of goodwill, impairments during the year ended Decembercarrying value of reporting units with less than 5% headroom was $90.4 million as of October 31, 2019, of $69.1 million, which is reported in the consolidated statements of loss and comprehensive loss as goodwill impairments.2021.
NaN goodwill impairments were recorded for the year ended December 31, 2018.
TotalTotal accumulated goodwill impairments are $672.5$686.0 million through December 31, 2020.2023.
100
Note 7. Debt
Debt is comprised of the following indebtedness to various lenders:
(in millions) |
| December 31, |
|
| December 31, |
| ||
Extended Term Loan Facility, with |
| $ | 402.9 |
|
| $ | — |
|
Amended and Restated Term Loan Facility, with |
|
| — |
|
|
| 413.9 |
|
Less: Current maturities |
|
| 4.2 |
|
|
| — |
|
Long-term debt, net of current maturities, debt |
| $ | 398.7 |
|
| $ | 413.9 |
|
(in millions) |
| December 31, 2020 |
|
| December 31, 2019 |
| ||
Amended and Restated Term Loan Facility, with interest at LIBOR plus 2.50% and 2.75% as of December 31, 2020 and 2019, respectively, (equal to 2.65% and 4.55% at December 31, 2020 and 2019, respectively) due 2024, net(a) |
| $ | 521.0 |
|
| $ | 525.4 |
|
Less: Current maturities |
|
| 5.7 |
|
|
| 5.7 |
|
Long-term debt, net of current maturities, debt discount and deferred financing fees |
| $ | 515.3 |
|
| $ | 519.7 |
|
The Extended Term Loan Facility (as defined below), scheduled to mature on May 22, 2026, was recorded net of unamortized discount of $8.9 |
|
Amended and Restated Senior Secured Credit Facilitiesnet of unamortized deferred financing fees of $1.5
On February 14, 2020, Emerald Events Holding, Inc., million as of December 31, 2023. The fair market value of the borrowerCompany’s debt under the Amended and Restated Senior Secured Credit Facilities,Extended Term Loan Facility was renamed Emerald X, Inc (“Emerald X”). $415.0 million as of December 31, 2023.
Term Loan Facility
On June 12, 2023, (the “Term Loan Amendment Effective Date”) Emerald X, Inc. (“Emerald X”), a seven-year $565.0 million senior securedwholly-owned subsidiary of the Company, entered into a Sixth Amendment (the “Term Loan Amendment”) to its Amended and Restated Credit Agreement by and among Emerald X, as Borrower, the guarantors party thereto, the lenders party thereto and Bank of America, N.A., as administrative agent, which amends that certain Amended and Restated Credit Agreement, dated as of May 22, 2017 (as amended from time to time, the “Amended and Restated Credit Agreement”). The Term Loan Amendment extended the maturity of the term loans outstanding under the Amended and Restated Credit Agreement (such term loan facility, scheduledas effect prior to mature on May 22, 2024 (thethe Term Loan Amendment Effective Date, the “Amended and Restated Term Loan Facility”, and as extended by the Term Loan Amendment, the “Extended Term Loan Facility”) from May 22, 2024 to May 22, 2026. The aggregate outstanding principal amount of the Extended Term Loan Facility was approximately $415.3 million as of the Term Loan Amendment Effective Date. Of the $415.3 million, $175.9 million was funded through a non-cash rollover from existing lenders and $an Amended and Restated Revolving Credit Facility (as defined below).239.4 million was funded through cash transactions.
The Amended and Restated Senior Secured Credit Facilities allows forTerm Loan Amendment replaced the interest rate applicable to the term loans with a rate equal to, at the option of Emerald X, Inc.(i) the Term Secured Overnight Financing Rate (“Term SOFR”) plus 5.00% per annum plus a credit spread adjustment of 0.10% per annum or (ii) an alternate base rate (“ABR”) plus 4.00% per annum. Prior to choose from the following twoTerm Loan Amendment, the interest rate options:
|
|
or
|
|
The spread, or applicable margin, was 1.75% for ABR loans and 2.75% for LIBOR loans through August 6, 2020. Beginning in the first quarter of 2018, (i) the applicable margin steps down by 0.25% if Emerald X, Inc.’s Total First Lien Net Leverage Ratio (as defined in(i) LIBOR plus 2.75% or 2.50% per annum, depending on Emerald X’s first lien net leverage ratio or (ii) ABR plus 1.75% or 1.50% per annum, depending on Emerald X’s first lien net leverage ratio. The effective interest rate at December 31, 2023 and December 31, 2022 was 11.66% and 6.89%, respectively.
The Extended Term Loan Facility proceeds of $415.3 million, net of $12.5 million of original issuance discount (“OID”), were used to repay the Amendedpreviously outstanding principal and Restated Senior Secured Credit Facilities) is lower than 2.75 to 1.00 and (ii) the applicable margininterest under the Amended and Restated Revolving Credit Facility (but not the Amended and Restated Term Loan Facility) steps down by an additional 0.25% ifFacility and third party fees of $3.5 million. Of the $12.5 million of OID paid, $2.1 million was recognized as loss on extinguishment of debt and $10.4 million will be amortized over the life of the Extended Term Loan Facility using the effective interest method. Of the $3.5 million in third party fees, $2.1 million was recognized as interest expense and $1.4 million will be amortized over the life of the Extended Term Loan Facility using the effective interest
101
method. As of December 31, 2023, there were no unpaid debt issuance costs. The loss on extinguishment of debt of $2.3 million for the year ended December 31, 2023, included $2.1 million of OID related to the Extended Term Loan Facility and $0.2 million of previously capitalized OID and debt issuance costs which were allocated to lenders whose balances were extinguished.
The Term Loan Amendment also reset scheduled quarterly payments, each equal to 0.25% of the original principal amount of the Extended Term Loan Facility. Further, the Term Loan Amendment modified the prepayment provisions so that, upon the occurrence of a repricing transaction, subject to certain specified exceptions, Emerald X Inc.’s Total First Lien Net Leverage Ratiowill have to pay a prepayment fee of 2%, in the event of a repricing transaction occurring within the first twelve months after the Term Loan Amendment Effective Date, or 1%, in the event of a repricing transaction occurring on a date that is less than 2.50 to 1.00. As a resultbetween twelve months after the Term Loan Amendment Effective Date and eighteen months after the Term Loan Amendment Effective Date. No prepayment premium is payable for prepayments made after the eighteen month anniversary of Company’s Total First Lien Net Leverage Ratio decreasing below 2.50 to 1.00 (as defined below), from August 7, 2020 throughthe Term Loan Amendment Effective Date. Emerald X made no voluntary prepayments on the Extended Term Loan Facility during the year ended December 31, 2020, borrowings2023.
The Amended and Restated Term Loan Facility previously required repayment in equal quarterly installments of 0.25% of the original principal amount, with the balance due at maturity. During the year ended December 31, 2022, Emerald X made a voluntary prepayment of $100.0 million on the Amended and Restated Term Loan Facility. The $100.0 million voluntary prepayment was made in first order of maturity and therefore settled all future quarterly installments until the Term Loan Amendment reset the scheduled quarterly payment obligation.
Revolving Credit Facility
On February 2, 2023, Emerald X entered into a Fifth Amendment (the “RCF Amendment”) to its Amended and Restated Credit Agreement. The RCF Amendment increased the aggregate amount of all revolving commitments under the RevolvingAmended and Restated Credit Facility were subjectAgreement from $100.4 million to an interest rate equal$110.0 million. The increased revolving commitments have the same terms as the previously existing revolving commitments. The RCF Amendment did not change any other material terms of the Amended and Restated Credit Agreement. The Company paid $0.6 million in financing fees related to LIBOR plus 2.25% or ABR plus 1.25%.the RCF Amendment during the first quarter of 2023.
Emerald X Inc. is required to pay a quarterly commitment fee in respect of the unutilized revolving commitments under the Amended and Restated Revolving Credit FacilityAgreement in an amount equal to 0.50%0.50% per annum, calculated on the unused portion of the facility, which may beis reduced to 0.375%0.375% upon achievement of a Total First Lien Ratio of 3.50 to 1.50.1.00. Upon the issuance of letters of credit under the Amended and Restated Revolving Credit Facility,Agreement, Emerald X Inc. is required to pay fronting fees, customary issuance and administration fees and a letter of credit fee equal to the then-applicable margin (as determined by reference to LIBOR)Term SOFR) for the Amended and Restated Revolving Credit Facility.Agreement.
Emerald X Inc. had 0 and $10.0 million inno outstanding borrowings under the revolving portion of its Amended and Restated Revolving Credit FacilityAgreement as of December 31, 20202023 and 2019, respectively.2022. Emerald X Inc. had $1.0$1.0 million in stand-by letters of credit issuancesoutstanding under the revolving portion of its Amended and Restated Revolving Credit Facility and its Revolving Credit FacilityAgreement as of December 31, 20202023 and 2019.For2022. During the periodyears ended August 6, 2020,December 31, 2023 and 2022, revolving borrowings under the RevolvingAmended and Restated Credit FacilityAgreement were subject to an interest rate equal to LIBORTerm SOFR plus 2.75%2.25% or ABR plus 1.75%1.25%. As a result of Company’s Total First Lien Net Leverage Ratio decreasing below 2.50 to 1.00 (as defined in the Amended and Restated Senior Secured Credit Facilities), from August 7, 2020 through December 31, 2020, borrowings under the Revolving Credit Facility were subject to an interest rate equal to LIBOR plus 2.25% or ABR plus 1.25%.
Payments and Commitment Reductions
The Amended and Restated Term Loan Facility requires repayment in equal quarterly installments of 0.25% of the $565.0 million, with the balance due at maturity. Installment payments on the Amended and Restated Term Loan Facility are due on the last business day of each quarter, commencing on September 29, 2017.
Subject to the certain customary exceptions and limitations,2023, Emerald X Inc. is required to prepay amounts outstandinghad $109.0 million in additional revolving borrowing capacity under the Amended and Restated Term Loan Facility under specified circumstances, including 50.0%Credit Agreement (after giving effect to $1.0 million of Excess Cash Flow (“ECF”), subject to step-downs to 25% and 0%outstanding letters of excess cash flow at certain leverage based thresholds, and with 100% of the net cash proceeds of asset sales and casualty events in excess of certain thresholds (subject to certain reinvestment rights)credit).
Emerald X, Inc. made 0 voluntary repayments on the Amended and Restated Term Loan Facility during the years ended December 31, 2020 and 2019. Emerald X, Inc. may prepay the loans in whole or part without premium or penalty.
Guarantees; Collateral; Covenants; Events of Default
All obligations under the Amended and Restated Senior Secured FacilityCredit Facilities are guaranteed by Emerald X, Inc.’sX’s direct parent company and, subject to certain exceptions, by all of Emerald X, Inc.’sX’s direct and indirect wholly owned domestic subsidiaries. As of December 31, 2020,2023, all of Emerald X, Inc.’sX’s domestic subsidiaries and Emerald X, Inc.’sX’s direct parent have provided guarantees.
Subject to certain limitations, the obligations under the Amended and Restated Senior Secured Credit Facilities are secured by a perfected first priority security interest in substantially all tangible and intangible assets owned by Emerald X Inc. or by any guarantor.
102
The Amended and Restated Senior Secured Credit Facilities contain customary incurrence-based negative covenants, including limitations on indebtedness; limitations on liens; limitations on certain fundamental changes (including, without limitation, mergers, consolidations, liquidations and dissolutions); limitations on asset sales; limitations on dividends and other restricted payments; limitations on investments, loans and advances; limitations on repayments of subordinated indebtedness; limitations on transactions with affiliates; limitations on changes in fiscal periods; limitations on agreements restricting liens and/or dividends; and limitations on changes in lines of business. In addition, the Amended and RestatedExtended Revolving Credit Facility contains a financial covenant requiring Emerald X Inc. to comply with a 5.50 to 1.00 total first lien net secured leverage ratio test. This financial covenant is tested quarterly only if the aggregate amount of revolving loans, swingline loans and letters of credit outstanding under the Amended and RestatedExtended Revolving Credit Facility (net of up to $10.0$10.0 million of outstanding letters of credit) exceeds 35%35% of the total commitments thereunder. As of December 31, 2020,2023, this financial covenant has not been triggered and Emerald X Inc. was in compliance with all covenants under the Amended and Restated Senior Secured Credit Facilities.
Events of default under the Amended and Restated Senior Secured Credit Facilities include, among others, nonpayment of principal when due; nonpayment of interest, fees or other amounts; cross-defaults; covenant defaults; material inaccuracy of representations and warranties; certain bankruptcy and insolvency events; material unsatisfied or unstated judgments; certain ERISA events; change of control; or actual or asserted invalidity of any
guarantee or security document. There were no events of default under the Amended and Restated Senior Secured Credit Facilities through December 31, 2020.2023.
During the yearyears ended December 31, 2020,2023, 2022 and 2021, Emerald X Inc. borrowed $95.0 million and repaid $105.0 million onmade no revolving loan borrowings or revolving loan repayments under the Amended and Restated Revolving Credit Facility. During the year ended December 31, 2019, Emerald X, Inc. made borrowings of $16.0 million and repayments of $46.0 million on the Amended and Restated Revolving Credit Facility. During the year ended December 31, 2018, Emerald X, Inc. made borrowings of $50.0 million and repayments of $10.0 million on the Revolving Credit Facility.Agreement.
Interest Expense
Interest expense reported in the consolidated statements of loss(loss) income and comprehensive loss consist(loss) income consists of the following:
|
| Year Ended December 31, |
| |||||||||
(in millions) |
| 2023 |
|
| 2022 |
|
| 2021 |
| |||
Extended Term Loan Facility |
| $ | 23.8 |
|
| $ | — |
|
| $ | — |
|
Amended and Restated Term Loan Facility |
|
| 13.9 |
|
|
| 22.3 |
|
|
| 13.8 |
|
Term Loan Amendment third party fees |
|
| 2.1 |
|
|
| — |
|
|
| — |
|
Non-cash interest for amortization of debt discount |
|
| 3.0 |
|
|
| 1.7 |
|
|
| 1.5 |
|
Revolving credit facility interest and commitment fees |
|
| 0.5 |
|
|
| 0.5 |
|
|
| 0.6 |
|
Total interest expense |
| $ | 43.3 |
|
| $ | 24.5 |
|
| $ | 15.9 |
|
|
| Year ended December 31, |
| |||||||||
(in millions) |
| 2020 |
|
| 2019 |
|
| 2018 |
| |||
Senior secured term loan |
| $ | 17.6 |
|
| $ | 27.2 |
|
| $ | 26.5 |
|
Non-cash interest for amortization of debt discount and debt issuance costs |
|
| 1.5 |
|
|
| 1.4 |
|
|
| 1.7 |
|
Realized and unrealized gain on interest rate swap and floor, net |
|
| — |
|
|
| — |
|
|
| (0.3 | ) |
Revolving credit facility interest and commitment fees |
|
| 1.5 |
|
|
| 1.7 |
|
|
| 1.2 |
|
|
| $ | 20.6 |
|
| $ | 30.3 |
|
| $ | 29.1 |
|
Interest Rate Swap and Floor
In March 2014, the Company entered into forward interest rate swap and floor contracts to manage and reduce its interest rate risk. The Company’s interest rate swap and floor had an effective date of December 31, 2015 through December 31, 2018. The Company realized losses of 0, 0 and $0.5 million during the years ended December 31, 2020, 2019 and 2018, respectively, representing the differential between the three-month LIBOR rate and the 2.705% interest rate swap and floor, on the principal amount of $100.0 million. The Company marked-to-market its interest rate contracts quarterly with the unrealized and realized gains and losses included in interest expense in the consolidated statements of loss and comprehensive loss. For the years ended December 31, 2020, 2019 and 2018, the Company recorded an unrealized gain of 0, 0 and $0.8 million, respectively. Due to the expiration of the interest rate swap and floor contracts, there is 0 liability recorded as of December 31, 2020 and 2019.
Note 8. Leases
The Company accounts for leases in accordance with ASC Topic 842: Leases, which was adopted on January 1, 2019. Leases. The Company determines if an arrangement is or contains a lease at contract inception. The Company'sCompany’s leases consist of operating leases for office space and certain equipment. The Company does not have any financing leases. For arrangements where the Company is the lessee, a right-of-use lease asset, representing the underlying asset during the lease term, and a right-of-use lease liability, representing the payment obligation arising from the lease, are reported on the balance sheet at lease commencement based on the present value of the payment obligation. Right-of-use lease assets also include any initial direct costs incurred and any lease payments made at or before the lease commencement date, less lease incentives received. The Company'sCompany’s leases have a remaining contractual term of 1 year years to 75 years, some of which include options to extend the lease term for up to five years and options to terminate. The options to extend certain lease terms or terminate certain leases are at the sole discretion of the Company. As the Company is not reasonably certain that it will exercise these options, none of the options to modify the lease terms are included in the Company’s right-of-use lease assets and right-of-use lease liabilities as of December 31, 2020.2023. The Company’s weighted-average remaining lease term was 5.33.5 years and 6.13.9 years as of December 31, 20202023 and 2019,2022, respectively.
103
Short-term operating leases with a contractual term of 12 months or less are not reported on the balance sheet, but instead are expensed as incurred and included as selling, general and administrative expense on the consolidated statements of loss(loss) income and comprehensive loss(loss) income and are considered rent expense. Short-term operating lease costs were not material for the yearyears ended December 31, 2020.2023, 2022 and 2021, respectively. Leases with a duration of less than one month are not included in rent expense. Operating lease cost is recognized on a straight-line basis over the related lease term. Rent expense was $4.2$4.2 million, $4.4$7.5 million, and $4.0$5.2 million for the years ended December 31, 2020, 20192023, 2022 and 2018,2021, respectively. The Company reported $1.2 million, $1.2 million and $1.1$1.2 million in rent expense on the consolidated statements of loss(loss) income and comprehensive loss(loss) income as cost of revenues for the years ended December 31, 2023, 2022 and $3.02021 and $3.0 million, $3.2$6.3 million, and $2.9$4.0 million in rent expense on the consolidated statements of loss(loss) income and comprehensive loss(loss) income as selling, general and administrative expense for the years ended December 31, 2020, 20192023, 2022 and 2018,2021, respectively. During the years ended December 31, 2023 and 2022, the Company recorded $0.9 million and $3.0 million, respectively, of loss on lease abandonment for operating lease ROU assets related to offices closed in 2023 and 2022, respectively, which are reported on the consolidated statements of (loss) income and comprehensive (loss) income as selling, general and administrative expense. The Company did not record a loss on lease abandonment during the year ended December 31, 2021.
Certain of the Company'sCompany’s lease agreements include variable lease payments. Variable lease costs were $0.2$0.2 million for the each of the years ended December 31, 20202023, 2022 and 2019.2021.
Maturities of right-of-use lease liabilities for the remaining five years and thereafter as of December 31, 20202023 were as follows:
(in millions) |
| December 31, |
| |
2024 |
| $ | 4.0 |
|
2025 |
|
| 4.0 |
|
2026 |
|
| 3.8 |
|
2027 |
|
| 1.6 |
|
2028 |
|
| 0.4 |
|
Thereafter |
|
| 0.1 |
|
Minimum lease payments |
| $ | 13.9 |
|
Less: Imputed interest |
|
| (1.0 | ) |
Present value of minimum lease payments |
| $ | 12.9 |
|
(in millions) |
| December 31, 2020 |
| |
2021 |
| $ | 4.3 |
|
2022 |
|
| 3.8 |
|
2023 |
|
| 3.8 |
|
2024 |
|
| 3.0 |
|
2025 |
|
| 2.3 |
|
Thereafter |
|
| 3.0 |
|
Minimum lease payments |
| $ | 20.2 |
|
Less: Imputed interest |
|
| (2.5 | ) |
Present value of minimum lease payments |
| $ | 17.7 |
|
Supplemental cash flow and other information related to leases waswere as follows:
|
| December 31, |
| |||||
(in millions) |
| 2020 |
|
| 2019 |
| ||
Cash paid for amounts included in the measurement of right-of-use lease liabilities: |
|
|
|
|
|
|
|
|
Cash paid reported as operating activities on the consolidated statements of cash flows |
| $ | 4.1 |
|
| $ | 4.0 |
|
Right-of-use lease assets obtained in exchange for new right-of-use lease liabilities |
| $ | 1.5 |
|
| $ | 1.9 |
|
|
| December 31, |
| |||||||||
(in millions) |
| 2023 |
|
| 2022 |
|
| 2021 |
| |||
Cash paid for amounts included in the measurement of |
|
|
|
|
|
|
|
|
| |||
Cash paid reported as operating activities on the |
| $ | 4.6 |
|
| $ | 5.4 |
|
| $ | 4.1 |
|
Right-of-use lease assets obtained in exchange for new |
| $ | 1.9 |
|
| $ | 1.9 |
|
| $ | 3.4 |
|
The discount rate implicit within the Company’s leases is generally not determinable; therefore, the Company determined the discount rate based on its incremental collateralized borrowing rate using the portfolio approach. The Company’s weighted-average discount rate used to measure right-of-use lease liabilities was 4.49%5.1% and 4.8% as of December 31, 2020.2023 and 2022, respectively.
Note 9. Fair Value Measurements
As of December 31, 2020 and 2019,2023, the Company’s assets and liabilities measured at fair value on a recurring basis are categorized in the tablestable below:
|
| December 31, 2020 |
| |||||||||||||
|
| Total |
|
| Level 1 |
|
| Level 2 |
|
| Level 3 |
| ||||
Assets |
|
|
|
|
|
|
|
|
|
|
|
|
|
|
|
|
Cash and cash equivalents: |
|
|
|
|
|
|
|
|
|
|
|
|
|
|
|
|
Cash and cash equivalents |
| $ | 4.2 |
|
| $ | 4.2 |
|
| $ | — |
|
| $ | — |
|
Money market mutual funds(a) |
|
| 291.1 |
|
|
| 291.1 |
|
|
| 0 |
|
|
| 0 |
|
Total assets at fair value |
| $ | 295.3 |
|
| $ | 295.3 |
|
| $ | 0 |
|
| $ | 0 |
|
|
|
|
|
|
|
|
|
|
|
|
|
|
|
|
|
|
Liabilities |
|
|
|
|
|
|
|
|
|
|
|
|
|
|
|
|
Market-based share awards liability(b) |
| $ | 0.4 |
|
| $ | 0 |
|
| $ | 0 |
|
| $ | 0.4 |
|
Contingent consideration(b) |
|
| 13.3 |
|
|
| 0 |
|
|
| 0 |
|
|
| 13.3 |
|
Total liabilities at fair value |
| $ | 13.7 |
|
| $ | 0 |
|
| $ | 0 |
|
| $ | 13.7 |
|
104
|
| December 31, 2023 |
| |||||||||||||
(in millions) |
| Total |
|
| Level 1 |
|
| Level 2 |
|
| Level 3 |
| ||||
Assets |
|
|
|
|
|
|
|
|
|
|
|
| ||||
Cash and cash equivalents |
| $ | 27.2 |
|
| $ | 27.2 |
|
| $ | — |
|
| $ | — |
|
Money market mutual funds(a) |
|
| 177.0 |
|
|
| 177.0 |
|
|
| — |
|
|
| — |
|
Total assets at fair value |
| $ | 204.2 |
|
| $ | 204.2 |
|
| $ | — |
|
| $ | — |
|
|
|
|
|
|
|
|
|
|
|
|
| |||||
Liabilities |
|
|
|
|
|
|
|
|
|
|
|
| ||||
Market-based share awards liability(b) |
| $ | 0.8 |
|
| $ | — |
|
| $ | — |
|
| $ | 0.8 |
|
Contingent consideration(b) |
|
| 6.9 |
|
|
| — |
|
|
| — |
|
|
| 6.9 |
|
Total liabilities at fair value |
| $ | 7.7 |
|
| $ | — |
|
| $ | — |
|
| $ | 7.7 |
|
|
| December 31, 2019 |
| |||||||||||||
|
| Total |
|
| Level 1 |
|
| Level 2 |
|
| Level 3 |
| ||||
Assets |
|
|
|
|
|
|
|
|
|
|
|
|
|
|
|
|
Cash and cash equivalents |
| $ | 9.6 |
|
| $ | 9.6 |
|
| $ | 0 |
|
| $ | 0 |
|
Total assets at fair value |
| $ | 9.6 |
|
| $ | 9.6 |
|
| $ | 0 |
|
| $ | 0 |
|
|
|
|
|
|
|
|
|
|
|
|
|
|
|
|
|
|
Liabilities |
|
|
|
|
|
|
|
|
|
|
|
|
|
|
|
|
Market-based share awards liability(b) |
| $ | 0.6 |
|
| $ | 0 |
|
| $ | 0 |
|
| $ | 0.6 |
|
Contingent consideration(b) |
|
| 4.3 |
|
|
| 0 |
|
|
| 0 |
|
|
| 4.3 |
|
Total liabilities at fair value |
| $ | 4.9 |
|
| $ | 0 |
|
| $ | 0 |
|
| $ | 4.9 |
|
|
|
|
|
As of December 31, 20202022, the Company’s assets and 2019, the Company had $13.3 million and $4.3 million, respectively, in contingent consideration liabilities measured at fair value. value on a recurring basis are categorized in the table below:
|
| December 31, 2022 |
| |||||||||||||
(in millions) |
| Total |
|
| Level 1 |
|
| Level 2 |
|
| Level 3 |
| ||||
Assets |
|
|
|
|
|
|
|
|
|
|
|
| ||||
Cash and cash equivalents |
| $ | 147.5 |
|
| $ | 147.5 |
|
| $ | — |
|
| $ | — |
|
Money market mutual funds(a) |
|
| 91.6 |
|
|
| 91.6 |
|
|
| — |
|
|
| — |
|
Total assets at fair value |
| $ | 239.1 |
|
| $ | 239.1 |
|
| $ | — |
|
| $ | — |
|
|
|
|
|
|
|
|
|
|
|
|
| |||||
Liabilities |
|
|
|
|
|
|
|
|
|
|
|
| ||||
Market-based share awards liability(b) |
| $ | 0.4 |
|
| $ | — |
|
| $ | — |
|
| $ | 0.4 |
|
Contingent consideration(b) |
|
| 12.3 |
|
|
| — |
|
|
| — |
|
|
| 12.3 |
|
Total liabilities at fair value |
| $ | 12.7 |
|
| $ | — |
|
| $ | — |
|
| $ | 12.7 |
|
The contingent consideration liability of $13.3$6.9 million as of December 31, 20202023 consists of liabilities of $3.8$0.2 million, $2.9$0.1 million and $6.6$6.6 million, which are expected to be settledpaid in 2021,2024, 2025 and 2027, respectively.
105
As of December 31, 2023 and 2022, and 2023, respectively.
Contingentthe contingent consideration liability related to the acquisition of PlumRiver amounted to $10.0Advertising Week was $4.9 million and $6.9 million, respectively, which consisted of two potential payments, the 2023 payment and the 2026 payment. During 2023, the specified EBITDA target for the 2023 payment was not met and therefore this amount as of December 31, 2020, which consisted of $1.9 million for2023 represents the achievement of a technological milestone expected to be paid in 2021, $1.8 million for the successful onboarding of qualified customers expected to be paid in 2021 and $6.3 million for the achievement of revenue targetsestimated 2026 payment. The 2026 payment is expected to be paid in 2023. The $6.3 million PlumRiver contingent consideration liability was measured based on significant unobservable inputs and probability weightings measured using a Monte Carlo simulation and will be remeasured on a recurring basis. The unobservable inputs used in calculating this amount include probability weighted estimates regardingrange of multiples, which are dependent upon the likelihood of achieving revenue targets for the acquisition. The $1.9 million and $1.8 million PlumRiver contingent consideration liabilities were measured using a discountacquisition’s 5-year compounded annual EBITDA growth rate based on the Company’s credit spread and the risk-free rate.
Contingent consideration relatedfrom 2021 through 2026, being applied to the G3 acquisition amounted to $2.8 millionaverage annual EBITDA growth in calendar years 2024, 2025 and $4.3 million as of December 31, 2020 and 2019, respectively, and2026, from a specified EBITDA target, less the 2023 payment. The 2026 payment is expected to be settled in 2022.the second quarter of 2027. The unobservable inputs used2026 payment is not capped as it is based on increases in calculatingEBITDA. Therefore, there is no pre-determined upper limit to the undiscounted range.
During 2022, the average EBITDA growth targets for the MJBiz contingent consideration include probability weighted estimates regarding a multiple of the estimated EBITDA for the G3 acquisition. The liability is re-measured to fair value each reporting period using the Company’s most recent internal operational budget. The determination ofwere not met and therefore the fair value of the contingent consideration liabilities could change in future periods based uponliability was zero as of December 31, 2022.
Contingent consideration related to the Company’s ongoing evaluationother acquisitions amounted to $2.0 million and $1.6 million as of December 31, 2023 and 2022, respectively. These contingent payments are based on the estimated EBITDA.achievement of various revenue or EBITDA growth metrics. The Company expects to pay $0.2 million, $0.1 million and $1.7 million, in 2024, 2025 and 2027, respectively, related to these contingent consideration liabilities as of December 31, 2023. The Company paid $3.7 million in contingent consideration during the second quarter of 2023 in relation to the Company’s acquisition of PlumRiver. The contingent consideration paid during the first quarter of 2023 in relation to the Company’s acquisition of EDspaces was not material.
The Company’s contingent consideration liabilities are remeasured based on the methodologies described above at the end of each reporting period. As a result of the
Company’sthese remeasurements, during 2020,2023, 2022 and 2021, the Company recorded a $1.5$2.4 million and $33.6 million decrease in the fair value of its contingent consideration liabilities and a $2.3 million increase in the fair value of its contingent consideration liabilities, respectively, which is included in selling, general and administrative expense in the consolidated statements of loss(loss) income and comprehensive loss.
Contingent consideration related to the EDspaces acquisition amounted to $0.4 million as of December 31, 2020 and is expected to be settled in 2023. The EDspaces contingent consideration was measured using a discount rate based on the Company’s specific pretax cost of debt.
(loss) income. The determination of the fair value of the contingent consideration liabilities could change in future periods. Any such changes in fair value will be reported in selling, general and administrative expense in the consolidated statements of loss(loss) income and comprehensive loss.(loss) income.
The table below summarizes the changes in fair value of the Company’s contingent consideration liabilities during the years ended December 31, 2023, 2022 and 2021:
|
|
|
| |||||||||
(in millions) |
| 2023 |
|
| 2022 |
|
| 2021 |
| |||
Balance at beginning of period |
| $ | 12.3 |
|
| $ | 36.2 |
|
| $ | 13.3 |
|
Payment of contingent consideration |
|
| (3.7 | ) |
|
| (6.5 | ) |
|
| (4.2 | ) |
Fair value remeasurement adjustments |
|
| (2.4 | ) |
|
| (33.6 | ) |
|
| 2.3 |
|
Business acquisition |
|
| 0.7 |
|
|
| 6.9 |
|
|
| 24.8 |
|
Measurement period adjustment |
|
| — |
|
|
| 8.9 |
|
|
| — |
|
Contingent compensation |
|
| — |
|
|
| 0.4 |
|
|
| — |
|
Balance at end of period |
| $ | 6.9 |
|
| $ | 12.3 |
|
| $ | 36.2 |
|
The market-based share award liability was $0.4$0.8 million and $0.6$0.4 million as of December 31, 20202023 and 2019,2022, respectively. DuringChanges in the year ended December 31, 2020, the Company recorded a $0.2 million decrease in fair value of the market-based share award liability which is included in selling, general and administrative expense in the consolidated statements of loss(loss) income and comprehensive loss.(loss) income. The determination of the fair value of the market-based share award liability could change in future periods. See Note 12, Stock-Based Compensation, for additional information with respect to the market-based share awards.
Note 10. Related-Party Transactions
Investment funds affiliated with Onex Corporation (“Onex”) owned approximately 65.2%74.8% of the Company’s outstanding common stock at December 31, 2020.2023. In addition, as of December 31, 2020,2023, after giving effect to the Onex owned 69,718,919 shares of the Company’s Preferred Stock,redeemable convertible preferred stock, representing 161,891,916183,697,428 shares of the Company’s common stock on an as-converted basis, after considering for the accumulated accreting return
106
at a rate per annum equal to 7%7% on the accreted liquidation preference and paid in-kind. Onex’s beneficial ownership of the Company’s common stock, on an as-converted basis, is approximately 85.6%90.5%. Affiliates of Onex ownsCorporation held a majority equity48.0% ownership position in SMG Holdings, Inc.ASM Global (“SMG”ASM”), including SMG Food & Beverage, LLC, a wholly-owned subsidiary of SMG,ASM, which the Company has contracted with for catering services at certain of the Company’s trade shows. SMG subsequently merged with AEG Facilities, LLC to form ASM Globalshows and events and a 96.0% ownership position in Convex Group Ltd. (“ASM”Convex”)., which is one of the insurers in the syndicate that provides the Company’s insurance coverage. Additionally, certain of the Company’s future trade shows and other events may be held at facilities managed by ASM. During the years ended December 31, 2023 and 2022, nine and seven events were staged at ASM-managed venues, respectively. The Company made paymentspaid to ASM aggregate fees, inclusive of 0, $0.6certain concessions, equal to $1.3 million, $1.4 million and $0.1$0.6 million to ASM during the years ended December 31, 2020, 20192023, 2022 and 2018,2021, respectively. These payments are included in cost of revenues in the consolidated statements of loss(loss) income and comprehensive loss.(loss) income. The Company has 0 amountshad $0.3 million and zero fees due to ASM as of December 31, 20202023 and 2019.2022, respectively. The Company made payments of $0.8 million, $0.3 million and $0.2 million to Convex during the years ended December 31, 2023, 2022 and 2021, respectively. The Company had $0.3 million and zero due to Convex as of December 31, 2023 and 2022, respectively.
Note 11. Stockholders’ Equity (Deficit)Deficit and Redeemable Convertible Preferred Stock
Common Stock Issuances
On May 3, 2017, the Company completed the initial public offering of its common stock and the Company’s stock began trading on the New York Stock Exchange under the symbol “EEX”. The Company sold a total of 10,333,333 shares of common stock.
Redeemable Convertible Preferred Stock
On June 10, 2020, the Company entered into an investment agreement (the “Investment Agreement”) with Onex Partners V LP (“Onex”), pursuant to which the Company agreed to (i) issue to an affiliate of Onex, in a private placement transaction (the “Initial Private Placement”), 47,058,332 shares of redeemable convertible preferred stock for a purchase price of $5.60$5.60 per share and (ii) effect a rights offering (“Rights Offering”) to holders of its outstanding common stock of one non-transferable subscription right for each share of the Company’s common stock held, with each right entitling the holder to purchase one share of redeemable convertible preferred stock at the Series A Price per share. Onex agreed to purchase (the “Onex Backstop”) any and all redeemable convertible preferred stock not subscribed for in the Rights Offering by stockholders other than affiliates of Onex at the Series A Price per share. On June 29, 2020 (the “First Closing Date”), Emerald received proceeds of $252.0$252.0 million, net of fees and expenses of $11.6$11.6 million, from the sale of redeemable convertible preferred stock to Onex in the Initial Private Placement. Emerald used $50.0$50.0 million of the net proceeds from the sale of redeemable convertible preferred stock to repay outstanding debt under the Revolving Credit Facility and expects to use the remaining proceeds for general corporate purposes,
including organic and acquisition growth initiatives. The Rights Offering subscription period started and ended on July 7, 2020 and July 22, 2020, respectively. On July 24, 2020, the Company issued a further 1,727,427 shares of redeemable convertible preferred stock pursuant to the Rights Offering and received proceeds of approximately $9.7$9.7 million. Pursuant to the Onex Backstop, on August 13, 2020, an additional 22,660,587 shares of redeemable convertible preferred stock were sold to Onex in exchange for approximately $121.3$121.3 million, net of fees and estimated expenses of $5.6$5.6 million. The rights of the redeemable convertible preferred stock are summarized below.
Liquidation Preference
Upon liquidation or dissolution of the Company, the holders of redeemable convertible preferred stock are entitled to receive the greater of (a) the accreted liquidation preference, and (b) the amount the holders of redeemable convertible preferred stock would have received if they had converted their redeemable convertible preferred stock into common stock immediately prior to such liquidation or dissolution.
Dividends
EachEach share of redeemable convertible preferred stock will accumulate dividends at a rate per annum equal to 7%7% of the accreted liquidation preference, compounding quarterly,by adding to the accreted liquidation preference until July 1, 2023, and thereafter, at the Company’s option, paid either in cash or by adding to the accreted liquidation
107
preference. During the year ended December 31, 2020,2023, the Company recorded accretion of $16.7 million with respect to the redeemable convertible preferred stock, bringing the aggregate liquidation preference to $492.6 million as of December 31, 2023. During the year ended December 31, 2022, the redeemable convertible preferred stock accumulated $14.1$31.8 million worth of dividends, bringing the aggregate accreted liquidation preference to $414.4$475.9 million as of December 31, 2020. 2022.
The Company’s Board of Directors approved the payment in cash of a dividend on the Company’s redeemable convertible preferred stock (the “Preferred Stock” and such dividend, the “Preferred Cash Dividend”) for each of the periods ending September 30, 2023, and December 31, 2023, respectively, and the Company paid Preferred Stock Cash Dividends for a total of $8.6 million, or $0.12 per share, in each such period. Of this amount, approximately $8.4 million in the aggregate was paid to Onex-related entities in each such period.
Holders of redeemable convertible preferred stock are also entitled to participate in and receive any dividends declared or paid on the Company’s common stock on an as-converted basis, and no dividends may be paid to holders of common stock unless the aggregate accreted liquidation preference on the redeemable convertible preferred stock has been paid or holders of a majority of the outstanding redeemable convertible preferred stock have consented to such dividends.
There were no preferred stock dividends declared or paid for the years ended December 31, 2022 and 2021. The following is a summary of the preferred stock dividends paid for the year ended December 31, 2023:
|
| 2023 |
| |||||||||||||
|
| Q1 |
|
| Q2 |
|
| Q3 |
|
| Q4 |
| ||||
|
| (dollars in millions, except per share values) |
| |||||||||||||
Dividend declared on |
|
| — |
|
|
| — |
|
| August 1, 2023 |
|
| November 3, 2023 |
| ||
Stockholders of record on |
|
| — |
|
|
| — |
|
| August 1, 2023 |
|
| November 3, 2023 |
| ||
Dividend paid on |
|
| — |
|
|
| — |
|
| September 29, 2023 |
|
| December 28, 2023 |
| ||
Dividend per share |
| $ | — |
|
| $ | — |
|
| $ | 0.1200 |
|
| $ | 0.1200 |
|
Cash dividend paid |
| $ | — |
|
| $ | — |
|
| $ | 8.6 |
|
| $ | 8.6 |
|
Conversion Features
Shares of the redeemable convertible preferred stock may be converted at the option of the holder into a number of shares of common stock equal to (a) the amount of the accreted liquidation preference, divided by (b) the applicable conversion price. Each share of redeemable convertible preferred stock hashad an initial liquidation preference of $5.60$5.60 and willwere initially be convertible into approximately 1.59 shares of common stock, which is equivalent to the initial liquidation preference per share of $5.60$5.60 divided by the initial conversion price of $3.52$3.52 per share. The conversion price is subject to customary anti-dilution adjustments upon the occurrence of certain events, including downward adjustment in the event the Company issues securities, subject to exceptions, at a price that is lower than the fair market value of such securities.
If, at any time following the third anniversary of the First Closing Date the closing price per share of the Company’s common stock exceeds 175%175% of the then-applicable conversion price for at least 20 consecutive trading days, the Company may, at its option, and subject to certain liquidity conditions, cause any or all of the then outstandingthen-outstanding shares of redeemable convertible preferred stock to be converted automatically into common stock at the then applicablethen-applicable conversion price.
Redemption Features
The Company has the right to redeem all, but not less than all, of the redeemable convertible preferred stockon or after June 29, 2026 for a cash purchase price equal to (a) on or after the six-year anniversary thereof, 105%of the First Closing Date, 105% of the accreted liquidation preference, (b) on or after the seven-year anniversary thereof, 103%of the First Closing Date, 103% of the accreted liquidation preference or (c) on or after the eight-year anniversary thereof,of the First Closing Date, the accreted liquidation preference. In addition, if there is a change of control transaction involving the Company prior to the six-year anniversary of the First Closing Date, the Company has the right to redeem all, but not less than all, of the redeemable convertible preferred stock for a cash purchase price equal to the accreted liquidation preference plus the
108
net present value of the additional amount by which the accreted liquidation preference would have otherwise increased from the date of such redemption through the sixth anniversary of the closing.First Closing Date. If, after the Company ceases to have a controlling stockholder group, there is a change of control transaction involving the Company, holders of redeemable convertible preferred stock
may elect to (x) convert their redeemable convertible preferred stock into shares of common stock at the then currentthen-current conversion price or (y) require the Company to redeem the redeemable convertible preferred stock for cash, at a price per share equal to the then-unpaid accreted liquidation preference. Although only Unaffiliated Directors (as defined below) can be involved in any decisions with respect to the Company’s rights to exercise the redemption features, the holders of the redeemable convertible preferred stock control the majority of the votes through representation on the board of directors. Therefore, the redeemable convertible preferred stock is required to be accreted to its redemption price on the date the redemption option first becomes exercisable. For the fiscal yearyears ending December 31, 2020,2023 and 2022, the Company recorded $15.6$42.0 million and $38.8 million, respectively, in deemed dividends, representing the accretion of the redeemable convertible preferred stock to the redemption value.
Voting Rights
Certain matters will require the approval of holders of a majority of the redeemable convertible preferred stock, including (i) amendments to the Company’s organizational documents in a manner adverse to the redeemable convertible preferred stock, (ii) the creation or issuance of senior or parity equity securities or (iii) the issuance of any convertible indebtedness, other class of redeemable convertible preferred stock or other equity securities in each case with rights to payments or distributions in which the redeemable convertible preferred stock would not participate on a pro-rata, as-converted basis.
In addition, for so long as the redeemable convertible preferred stock represents more than 30%30% of the outstanding common stock on an as-converted basis, without the approval of a majority of the directors elected by the holders of the redeemable convertible preferred stock, the Company may not (i) incur new indebtedness to the extent certain financial metrics are not satisfied, (ii) redeem or repurchase any equity securities junior to the redeemable convertible preferred stock, (iii) enter into any agreement for the acquisition or disposition of assets or businesses involving a purchase price in excess of $100$100 million, (iv) hire or terminate the chief executive officer of the Company or (v) make a voluntary filing for bankruptcy or commence a dissolution of the Company.
For so long as the redeemable convertible preferred stock represents a minimum percentage of the outstanding shares of common stock on an as-converted basis as set forth in the Certificate of Designations relating to the redeemable convertible preferred stock, the holders of the redeemable convertible preferred stock shall have the right to appoint up to 5five members of the Company’s Board of Directors (the “Board”).
All decisions of the Company’s Board with respect to the exercise or waiver of the Company’s rights relating to the redeemable convertible preferred stock shall be determined by a majority of the Company’s directors that are not employees of the Company or affiliated with Onex (“Unaffiliated Directors”), or a committee of Unaffiliated Directors.
As part of the transactions contemplated by the Investment Agreement, the Company and Onex entered into a Registration Rights Agreement whereby Onex is entitled to certain demand and piggyback registration rights in respect of the redeemable convertible preferred stock and the shares of common stock issuable upon conversion thereof.
109
Dividends
Dividends
The following is a summary of theThere were no dividends paid or declared with respect to the Company’s common stock for the years endingended December 31, 2020, 20192023, 2022 and 2018:2021.
|
| 2020 |
| |||||||||||||
|
| Q1 |
|
| Q2 |
|
| Q3 |
|
| Q4 |
| ||||
|
| (dollars in millions, except per share values) |
| |||||||||||||
Dividend declared on |
| February 7, 2020 |
|
|
| — |
|
|
| — |
|
|
| — |
| |
Stockholders of record on |
| February 21, 2020 |
|
|
| — |
|
|
| — |
|
|
| — |
| |
Dividend paid on |
| March 6, 2020 |
|
|
| — |
|
|
| — |
|
|
| — |
| |
Dividend per share |
| $ | 0.0750 |
|
| $ | — |
|
| $ | — |
|
| $ | — |
|
Cash dividend paid |
| $ | 5.4 |
|
| $ | — |
|
| $ | — |
|
| $ | — |
|
|
|
|
|
|
|
|
|
|
|
|
|
|
|
|
|
|
|
| 2019 |
| |||||||||||||
|
| Q1 |
|
| Q2 |
|
| Q3 |
|
| Q4 |
| ||||
|
| (dollars in millions, except per share values) |
| |||||||||||||
Dividend declared on |
| February 5, 2019 |
|
| April 30, 2019 |
|
| July 30, 2019 |
|
| October 31, 2019 |
| ||||
Stockholders of record on |
| February 19, 2019 |
|
| May 14, 2019 |
|
| August 13, 2019 |
|
| November 14, 2019 |
| ||||
Dividend paid on |
| March 5, 2019 |
|
| May 28, 2019 |
|
| August 27, 2019 |
|
| November 27, 2019 |
| ||||
Dividend per share |
| $ | 0.0725 |
|
| $ | 0.0750 |
|
| $ | 0.0750 |
|
| $ | 0.0750 |
|
Cash dividend paid |
| $ | 5.2 |
|
| $ | 5.4 |
|
| $ | 5.4 |
|
| $ | 5.3 |
|
|
|
|
|
|
|
|
|
|
|
|
|
|
|
|
|
|
|
| 2018 |
| |||||||||||||
|
| Q1 |
|
| Q2 |
|
| Q3 |
|
| Q4 |
| ||||
|
| (dollars in millions, except per share values) |
| |||||||||||||
Dividend declared on |
| January 26, 2018 |
|
| May 1, 2018 |
|
| July 31, 2018 |
|
| October 26, 2018 |
| ||||
Stockholders of record on |
| February 9, 2018 |
|
| May 15, 2018 |
|
| August 14, 2018 |
|
| November 14, 2018 |
| ||||
Dividend paid on |
| February 23, 2018 |
|
| May 29, 2018 |
|
| August 28, 2018 |
|
| November 26, 2018 |
| ||||
Dividend per share |
| $ | 0.0700 |
|
| $ | 0.0725 |
|
| $ | 0.0725 |
|
| $ | 0.0725 |
|
Cash dividend paid |
| $ | 5.1 |
|
| $ | 5.3 |
|
| $ | 5.3 |
|
| $ | 5.3 |
|
Share Repurchases
October 2020November 2023 Share Repurchase Program Extension and Expansion (“November 2023 Share Repurchase Program”)
In October 2020,November 2023, the Company’s Board authorizedapproved an extension and approved a $20.0 millionexpansion of its share repurchase program. Underprogram, which allows for the termsrepurchase of $25.0 million of the October 2020 Share Repurchase Program, the Company may, from time to time, purchase shares of itsCompany’s common stock for an aggregate purchase price not to exceed $20.0 million through December 31, 2021,2024, subject to early termination or extension by the Board. The Company did not repurchase any shares during the year ended December 31, 2023 under this extension and expansion; however, the Company repurchased 5,064,140 shares for $16.9 million during the year ended December 31, 2023 under the October 2022 Share Repurchase Program described below. There was $25.0 million remaining available for share repurchases under the November 2023 Share Repurchase Program as of December 31, 2023. The share repurchase program may be suspended or discontinued at any time without notice. The Company settled
October 2022 Share Repurchase Program Extension and Expansion (“October 2022 Share Repurchase Program”)
On October 26, 2022, the Company’s Board approved an extension and expansion of its share repurchase program, which allows for the repurchase of 203,837 shares for $0.8$20.0 million duringof the year endedCompany’s common stock through December 31, 2020 under this repurchase program. There was $19.2 million remaining available for share repurchases under the October 2020 Share Repurchase Program as of December 31, 2020.
July 2019 Share Repurchase Program
In July 2019, the Company’s Board authorized and approved a $30.0 million share repurchase program. Under the terms of the July 2019 Share Repurchase Program, the Company had the ability to repurchase shares through open market purchases (either with or without a 10b5-1 plan), block transactions, privately negotiated purchases or otherwise, through July 31, 2020,2023, subject to early termination or extension by the Board. The July 2019 Share Repurchase Program did not obligateAs described above, the Company to purchase any specific number of shares. The Company settled the repurchase of 14,988 shares and 810,120repurchased 5,064,140 shares for $0.1 million and $7.7 million during the years ended December 31, 2020 and 2019, respectively, under this repurchase program. The July 2019 Share Repurchase was suspended in the first quarter of 2020 and there were 0 remaining available for share repurchases under the July 2019 Share Repurchase Program as of December 31, 2020.
November 2018 Share Repurchase Program
On November 20, 2018, the Company’s Board authorized a $20.0 share repurchase program. Under the terms of the November 2018 Share Repurchase Program, the Company has the ability to repurchase shares through open market purchases (either with or without a 10b5-1 plan), block transactions, privately negotiated purchases or otherwise, through December 31, 2019. The November 2018 Share Repurchase Program did not require the Company to acquire any specific number of shares. Pursuant to the November 2018 Share Repurchase Program, the Company settled the repurchase of 43,437 shares for $0.6$16.9 million during the year ended December 31, 2019 and 1,627,2482023 under this repurchase program. The Company settled the repurchase of 21,393 shares for $19.4$0.1 million during the year ended December 31, 2018. There were 0 remaining amounts available2022 under this repurchase program, and a further 2,861,448 shares for share repurchases as of December 31, 2020$10.3 million pursuant to the Company’s November 2018October 2020 Share Repurchase Program.Program, during the year ended December 31, 2022.
October 2020 Share Repurchase Program
In October 2020, the Company’s Board authorized and approved a $20.0 million share repurchase program. In October 2021, the Company’s Board approved the extension and expansion of the October 2020 Share Repurchase Program, which allowed for the repurchase of an additional $20.0 million of the Company’s common stock through December 31, 2022. The Company repurchased 2,861,448 shares for $10.3 million during the year ended December 31, 2022 under this repurchase program, as described above. The Company settled the repurchase of 2,498,118 shares for $12.4 million during the year ended December 31, 2021 under this repurchase program.
Note 12. Stock-Based Compensation
Employee Benefit Plans
2013 Stock Option Plan (“the 2013(the “2013 Plan”) and 2017 Omnibus Equity Plan (“the 2017(the “2017 Plan”)
Effective June 17, 2013, the Company’s Board approved the adoption of the Expo Event Holdco, Inc. 2013 Stock Option Plan. A total of 22,187,125 shares were available for grant under the 2013 Plan as of December 31, 2019. However, followingFollowing the Company’s IPO, the 2013 Plan is no longer used for future grants.granting new awards. Vesting of all option grants begins at the first anniversary of the date of grant. Options granted under the 2013 Plan vest 20%20% per year over five years.years.
In April 2017, the Company adoptedBoard approved the 2017 Plan. The Company’s stockholders approved the 2017 Plan and it became effective in connection with the Company’s initial public offering. Under the 2017 Plan, the Company may grant incentive stock options, non-statutory stock options, restricted stock, restricted stock units (“RSUs”) and stock appreciation rights, dividend equivalent rights, share awards and performance-based awards to employees, directors or consultants. The Company has initially reserved 5,000,000 shares of its common stock for issuance under the 2017 Plan. During 2021, the 2017 Plan was amended and restated principally to provide for an increase in the number of shares of the Company’s common stock reserved for issuance under the 2017 Plan by 13,000,000 shares. During 2023, the 2017 Plan was further amended and restated principally to provide for an increase in the number of shares of the
110
Company’s common stock reserved for issuance under the 2017 Plan by 4,900,000 shares. A total of 1,335,8652,133,774 shares were available for future grant under the 2017 Plan as of December 31, 2020.2023.
The Board of Directors determines eligibility, vesting schedules and exercise prices for award grants. Option grants have a contractual term of 10 years from the date of grant. Under the 2017 Plan, the options have beenare granted with the exercise price being equal to or greater than the fair market value of the Company’s common stock at the date of grant.
Vesting of all option grants begins at the first anniversary of the date of grant.grant date. Options granted under the 2017 Plan vest pro rata over a term of either three, four or four years.five years.
2019 Employee Stock Purchase Plan (the “ESPP”)
In January 2019, the Company’s Board approved the ESPP, which was approved by the Company’s stockholders in May 2019. The ESPP requires that participating employees must be employed for at least 20 hours per week, have completed at least 6 months of service, and have compensation (as defined in the ESPP) not greater than $150,000$150,000 in the 12-month period before the enrollment date to be eligible to participate in the ESPP. Under the ESPP, eligible employees will receive a 10%10% discount from the lesser of the closing price on the first day of the offering period and the closing price on the purchase date. The Company reserved 500,000 shares of its common stock for issuance under the ESPP.
ESPP expense recognized by the Company was 0tnot material for the years ended December 31, 20202023, 2022 and 2019 and was 0 for the year ended2021. As of December 31, 2018. The Company’s initial ESPP offering period began in February 2019 and ended in August 2019. The2023, the Company has issued 8,426141,804 shares to employees in August 2019 atunder the end of the initial ESPP offering period. The Company’s second ESPP offering period began in August 2019 and ended in February 2020.ESPP.
The Company issued 8,212 shares to employees in February 2020 at the end of the second ESPP offering period.The Company’s third ESPP offering period began in February 2020 and ended in August 2020. The Company issued 19,406 shares to employees in August 2020 at the end of the third ESPP offering period. The Company’s fourth ESPP offering period began in August 2020 and will end in February 2021.
Stock Options
The fair value of stock options is estimated on the grant date using the Black-Scholes option pricing model using the following assumptions:
|
| Year Ended December 31, 2019 |
|
| Year Ended December 31, 2023 |
| ||||||||
|
| Range |
| Weighted-Average |
|
| Range |
|
| Weighted-Average |
| |||
Expected volatility |
| 21.7% to 23.2% |
|
|
|
|
| 34.7% to 38.6% |
|
|
|
| ||
Dividend yield |
| 2.2% to 2.3% |
|
|
|
|
|
| — |
|
|
|
| |
Risk-free interest rate |
| 1.9% to 2.5% |
|
|
|
|
| 3.5% to 4.5% |
|
|
|
| ||
Expected term (in years) |
| 6.5 to 7.0 |
|
|
|
|
| 5.5 to 7.5 |
|
|
|
| ||
Weighted-average fair value at grant date |
|
|
| $ | 2.36 |
|
|
|
| $ | 1.49 |
| ||
|
|
|
|
|
|
|
|
|
|
|
|
| ||
|
| Year Ended December 31, 2018 |
|
| Year Ended December 31, 2022 |
| ||||||||
|
| Range |
| Weighted-Average |
|
| Range |
|
| Weighted-Average |
| |||
Expected volatility |
| 23.6% to 25.1% |
|
|
|
|
| 31.5% to 34.5% |
|
|
|
| ||
Dividend yield |
| 1.3% to 1.7% |
|
|
|
|
|
| — |
|
|
|
| |
Risk-free interest rate |
| 2.5% to 3.0% |
|
|
|
|
| 1.4% to 3.7% |
|
|
|
| ||
Expected term (in years) |
| 5.5 to 7.0 |
|
|
|
|
| 5.5 to 9.1 |
|
|
|
| ||
Weighted-average fair value at grant date |
|
|
| $ | 4.76 |
|
|
|
| $ | 1.09 |
| ||
|
|
|
|
|
|
|
|
|
|
|
| |||
|
| Year Ended December 31, 2021 |
| |||||||||||
|
| Range |
|
| Weighted-Average |
| ||||||||
Expected volatility |
| 29.0% to 38.4% |
|
|
|
| ||||||||
Dividend yield |
|
| — |
|
|
|
| |||||||
Risk-free interest rate |
| 0.4% to 1.4% |
|
|
|
| ||||||||
Expected term (in years) |
| 5.5 to 7.5 |
|
|
|
| ||||||||
Weighted-average fair value at grant date |
|
|
| $ | 1.47 |
| ||||||||
There were 07,195,786 stock options granted during the year ended December 31, 2020.2023. There were 6,231,142 stock options vested and exercisable at December 31, 2023.
111
There were 990,000 and 11,969,828 stock options granted during the years ended December 31, 2022 and 2021, respectively. There were 4,959,488 and 2,602,368 stock options vested and exercisable at December 31, 2022 and 2021, respectively.
Stock option activity for the yearsyear ended December 31, 2020 and 20192023 was as follows:
|
|
|
|
|
| Weighted-Average |
|
|
|
|
| |||||
|
| Number of Options |
|
| Exercise Price per Option |
|
| Remaining Contractual Term |
|
| Aggregate Intrinsic Value |
| ||||
|
| (thousands) |
|
|
|
|
|
| (years) |
|
| (millions) |
| |||
Outstanding at December 31, 2018 |
|
| 7,085 |
|
| $ | 12.62 |
|
|
| 5.0 |
|
| $ | 13.0 |
|
Granted |
|
| 987 |
|
|
| 12.29 |
|
|
|
|
|
|
|
|
|
Exercised |
|
| (528 | ) |
|
| 8.00 |
|
|
|
|
|
|
|
|
|
Forfeited |
|
| (393 | ) |
|
| 15.83 |
|
|
|
|
|
|
|
|
|
Outstanding at December 31, 2019 |
|
| 7,151 |
|
| $ | 12.74 |
|
|
| 4.4 |
|
| $ | 5.8 |
|
Granted |
|
| — |
|
|
| — |
|
|
|
|
|
|
|
|
|
Exercised |
|
| (9 | ) |
|
| 8.00 |
|
|
|
|
|
|
|
|
|
Forfeited |
|
| (3,163 | ) |
|
| 11.57 |
|
|
|
|
|
|
|
|
|
Outstanding at December 31, 2020 |
|
| 3,978 |
|
| $ | 13.68 |
|
|
| 4.7 |
|
| $ | — |
|
Exercisable at December 31, 2020 |
|
| 2,965 |
|
| $ | 12.87 |
|
|
| 3.6 |
|
| $ | — |
|
|
|
|
|
| Weighted-Average |
|
|
|
| |||||||
|
| Number of |
|
| Exercise |
|
| Remaining |
|
| Aggregate |
| ||||
|
| (thousands) |
|
|
|
|
| (years) |
|
| (millions) |
| ||||
Outstanding at December 31, 2022 |
|
| 14,555 |
|
| $ | 7.90 |
|
|
| 7.1 |
|
| $ | — |
|
Granted |
|
| 7,196 |
|
|
| 3.82 |
|
|
|
|
|
|
| ||
Exercised |
|
| (32 | ) |
|
| 4.66 |
|
|
|
|
|
|
| ||
Forfeited/Expired |
|
| (1,928 | ) |
|
| 9.70 |
|
|
|
|
|
|
| ||
Outstanding at December 31, 2023 |
|
| 19,791 |
|
| $ | 6.25 |
|
|
| 7.4 |
|
| $ | 15.7 |
|
Exercisable at December 31, 2023 |
|
| 6,231 |
|
| $ | 8.89 |
|
|
| 5.7 |
|
| $ | 0.1 |
|
Information regarding fully vested and expected to vest stock options as of December 31, 20202023 was as follows:
Exercise Price |
|
| Number of Options (share data in thousands) |
|
| Weighted Average Remaining Contractual Life (years) |
| |||
$ | 8.00 |
|
|
| 956 |
|
|
| 1.94 |
|
$ | 10.40 |
|
|
| 149 |
|
|
| 2.96 |
|
$ | 11.41 |
|
|
| 44 |
|
|
| 8.43 |
|
$ | 12.00 |
|
|
| 543 |
|
|
| 2.29 |
|
$ | 12.47 |
|
|
| 576 |
|
|
| 8.12 |
|
$ | 13.03 |
|
|
| 8 |
|
|
| 5.12 |
|
$ | 14.13 |
|
|
| 42 |
|
|
| 7.82 |
|
$ | 16.00 |
|
|
| 496 |
|
|
| 2.27 |
|
$ | 16.50 |
|
|
| 595 |
|
|
| 7.61 |
|
$ | 22.08 |
|
|
| 524 |
|
|
| 6.90 |
|
$ | 22.66 |
|
|
| 45 |
|
|
| 0.21 |
|
|
|
|
|
| 3,978 |
|
|
|
|
|
Exercise Price |
| Number of |
|
| Weighted |
| ||
|
| (share data in thousands) |
|
| (years) |
| ||
$2.87 - $5.02 |
|
| 7,247 |
|
|
| 8.01 |
|
$5.07 - $7.61 |
|
| 7,236 |
|
|
| 6.70 |
|
$8.00 - $12.00 |
|
| 3,987 |
|
|
| 5.17 |
|
$12.47 - $18.71 |
|
| 932 |
|
|
| 3.98 |
|
$22.08 - $33.12 |
|
| 389 |
|
|
| 3.82 |
|
|
|
| 19,791 |
|
|
|
| |
The aggregate intrinsic value is the amount by which the fair value of the common stock exceeded the exercise price of the options at December 31, 2020,2023, for those options for which the market price was in excess of the exercise price.
The Company recognizes cumulative stock-based compensation expense for the portion of the awards for which the service period and performance conditions, as applicable, areis probable of being satisfied. TheDuring the years ended December 31, 2023, 2022 and 2021, the Company recorded stock-based compensation expense forrelated to stock option grants for the years ended December 31, 2020, 2019 and 2018options of $1.8$6.2 million, $3.4$3.8 million and $3.2$6.4 million, respectively, which is included in selling, general and administrative expenses in the consolidated statements of loss(loss) income and comprehensive loss.(loss) income. The related deferred tax benefit for stock-based compensation recognized was $1.6$1.9 million, $1.7$1.0 million and $0.5$1.5 million for the years ended December 31, 2020, 2019,2023, 2022 and 2018,2021, respectively.
There were 2,965,108 stock options vested and exercisable at December 31, 2020. The totalaggregate weighted average grant date fair value of sharesstock options vested during the years ended December 31, 2020, 20192023, 2022 and 2018 based on weighted average grant date fair value2021 was $3.0$3.7 million, $2.7$4.9 million and $3.6$1.8 million, respectively. There was a total of $1.1$12.5 million unrecognized stock-based compensation expense at December 31, 20202023 related to unvested stock options expected to be recognized over a weighted-average period of 0.8 years2.7. years.
Restricted Stock Units
The Company grants RSUs that contain service and, in certain instances, performance conditions to certain executives and employees. The Company recognizes cumulative stock-based compensation expense for the portion of the awards for which the service period and performance conditions, as applicable, areis probable of being satisfied. Stock-based compensation expense related to RSUs recognized in the years ended December 31, 2020, 20192023, 2022 and 20182021 was $5.4$1.2 million, $3.7$1.9 million and $2.9$4.0 million, respectively.
112
RSU activity for the yearsyear ended December 31, 2020 and 20192023 was as follows:
|
| Number of RSUs (share data in thousands) |
|
| Weighted Average Grant Date Fair Value per Share |
| ||||||||||
Unvested balance, December 31, 2018 |
|
| 403 |
|
| $ | 20.91 |
| ||||||||
(share data in thousands, except per share data) |
| Number of |
|
| Weighted Average |
| ||||||||||
Unvested balance, December 31, 2022 |
|
| 878 |
|
| $ | 6.87 |
| ||||||||
Granted |
|
| 508 |
|
|
| 12.30 |
|
|
| 115 |
|
|
| 3.93 |
|
Forfeited |
|
| (128 | ) |
|
| 17.43 |
|
|
| (36 | ) |
|
| 9.80 |
|
Vested |
|
| (115 | ) |
|
| 21.05 |
|
|
| (416 | ) |
|
| 7.03 |
|
Unvested balance, December 31, 2019 |
|
| 668 |
|
| $ | 15.00 |
| ||||||||
Granted |
|
| 1,143 |
|
|
| 8.53 |
| ||||||||
Forfeited |
|
| (233 | ) |
|
| 10.31 |
| ||||||||
Vested |
|
| (274 | ) |
|
| 11.76 |
| ||||||||
Unvested balance, December 31, 2020 |
|
| 1,303 |
|
| $ | 10.31 |
| ||||||||
Unvested balance, December 31, 2023 |
|
| 541 |
|
| $ | 5.95 |
| ||||||||
There was a total of $6.7$0.8 million unrecognized stock-based compensation expense at December 31, 20202023 related to unvested RSUs expected to be recognized over a weighted-average period of 2.71.2 years.
Market-based Share Awards
In January 2020, the Company granted performance-based market condition share awards to one senior executive under the 2017 Omnibus Equity Plan, which entitle this employee the right to receive shares of common stock equal to a maximum value of $4.9$4.9 million in the aggregate, upon achievement of specified targeted share prices measured over sixty days within a ninety dayninety-day trading period. The performance-based market condition share awards granted in January 2020 remain unvested with an estimated weighted average conversion threshold of $21.09$21.09 per share, which would result in an estimated 45,718 shares of common stock to be issued upon vesting. Each of the estimated 45,718 shares of common stock has a weighted-average grant date fair value of $24.53$24.53 per share.
In June 2019, the Company granted performance-based market condition share awards to two senior executives under the 2017 Omnibus Equity Plan, which entitlesentitle these employees to the right to receive shares of common stock equal to a maximum value of $16.9$16.9 million, in the aggregate, upon achievement of specified targeted share prices measured over sixty days within a ninety-day trading period. In December 2019, the performance-based market condition share awards for one of these senior executive was increased, which increased the maximum value of the performance-based market condition share awards to $18.9$18.9 million, in the aggregate. During the year ended December 31, 2020, performance-based market condition share awards with maximum value of $14.0$14.0 million, with an estimated 157,677 shares of common stock that would have been issued were forfeited. The remaining June 2019 award entitle this employee the right to receive shares of common stock equal to a maximum value of $4.9 million in the aggregate, upon achievement of specified targeted share prices measured over sixty days within a ninety-day trading period.
Stock-basedAs of December 31, 2023, all outstanding performance-based market condition share awards remain unvested with an estimated weighted average conversion threshold of $21.08 per share, which would result in an estimated 78,041 shares of common stock to be issued upon vesting. Each of the estimated 78,041 shares of common stock have a weighted-average grant date fair value of $24.77 per share.
The Company recorded stock-based compensation expense related to performance-based market condition share awards recognized in theof $0.4 year ended December 31, 2020 was a reduction of expense of $0.5 million, zeroandzero, respectively, for the years ended December 31, 20192023, 2022 and 2018 was $0.6 million and 0, respectively.2021.
As of December 31, 2020,2023, the Company has performance-based market condition share awards outstanding with a maximum value of $9.8$9.8 million, in the aggregate, upon achievement of specified targeted share prices measured over sixty days within a ninety-day trading period to two senior executives. As of December 31, 2020,2023, all outstanding performance-based market condition share awards remain unvested with an estimated weighted average conversion threshold of $21.08$21.08 per share, which would result in an estimated 78,041 shares of common stock to be issued upon vesting. Each of the estimated 78,041 shares of common stock has a weighted-average grant date fair value of $24.77$24.77 per share. The performance-based market condition share awards consist of 4four tranches with 4four separate specified award values that become payable upon achievement of the specified closing share price targets, which range from $18.00$18.00 per share to $24.00$24.00 per share. If the applicable targeted closing share price is attained over sixty days during a ninety-day trading period, that tranche of the award vests and the employees holding the awards receive shares of common stock equal to the specified award values (calculated based on the closing price per share on the trading day
113
on which the relevant vesting condition was satisfied). In connection with the vesting, if any, of
each award tranche, the Company expects to issue new shares of common stock to settle the vested awards. The total number of shares that will be awarded upon vesting will depend on the closing price per share on the trading day on which the relevant vesting condition is satisfied. These performance-based market condition share awards have a contractual term of ten years.years.
The performance-based market condition awards are classified as liability awards, which are measured at fair value, and are re-measuredremeasured to an updated fair value at each reporting period. As of December 31, 20202023 and 2019,2022, the liability for these awards was $0.4$0.8 million and $0.6$0.4 million, respectively, and is reported on the consolidated balance sheets in other noncurrent liabilities. The fair value of performance-based market condition share awards is estimated on the grant date using a risk-neutral Monte Carlo simulation model. The grant dateaggregate fair value of the awards at the grant date was $1.9$1.9 million. The aggregate fair value of the awards as of December 31, 20202023 and 20192022 was $2.0$1.3 million and $4.0$0.5 million, respectively. The Company recognizes expense for performance-based market condition share awards over the derived service period for each tranche. TheAs of December 31, 2023, the weighted average remaining service period is 2.6 years.4.0 years in aggregate. The Company recognizes stock-based compensation expense for awards subject to market-based vesting conditions regardless of whether it becomes probable that these conditions will be achieved or not, and stock-based compensation expense for any such awards may be reversed if vesting does not occur and the employee terminates employment before the ten year term expires, except that upon a termination of employment other than for cause, or upon a termination for good reason within three months prior to the earlier of the execution of an agreement resulting in a change in control or the date of a change in control, any unvested shares subject to the performance-based market condition share award shall remain eligible to vest in accordance with the performance-based market condition share award agreement’s vesting conditions, including in the event of a change in control.
The weighted average assumptions used in determining the fair value for the performance-based market condition share awards granted during the yearin 2020 and 2019 and remeasured at December 31, 20202023 were as follows:
|
| Grant Date |
|
| December 31, 2020 |
|
| Grant Date |
|
| December 31, |
| ||
Expected volatility |
| 41.74% |
|
| 57.50% |
|
|
| 41.7 | % |
|
| 66.2 | % |
Dividend yield |
| 1.09% |
|
| 0.00% |
|
|
| 1.1 | % |
|
| — |
|
Risk-free interest rate |
| 1.26% |
|
| 0.82% |
|
|
| 1.3 | % |
|
| 3.9 | % |
The weighted-average expected term of the Company’s performance-based market condition share awards was 3.7 years at grant date, which represents the weighted-average of the derived service periods for the share awards.
Note 13. Earnings Per Share
Basicearnings per share is computed using the weighted-average number of common shares outstanding during the period. Diluted earnings per share is computed using the weighted-average number of common shares outstanding during the period, plus the dilutive effect of outstanding options, using the treasury stock method and the average market price of the Company’s common stock during the applicable period. Certain shares related to some of the Company’s outstanding employee share awards were excluded from the computation of diluted earnings per share because they were antidilutive in the periods presented but could be dilutive in the future. Performance-based market condition share awards are considered contingently issuable shares, which would be included in the denominator for earnings per share if the applicable market conditions have been achieved, and the inclusion of any performance-based market condition share awards is dilutive for the respective reporting periods.
Diluted earnings per share is computed using the weighted-average number of common shares outstanding during the period, plus the dilutive effect of outstanding options, using the treasury stock method and the average market price of the Company's common stock during the applicable period. Certain shares related to some of the Company's outstanding employee share awards were excluded from the computation of diluted earnings per share because they were antidilutive in the periods presented but could be dilutive in the future. Performance-based market condition share awards are considered contingently issuable shares, which would be included in the denominator for earnings per share if the applicable market conditions have been achieved, and the inclusion of any performance-basedperformance based market condition share awards is dilutive for the respective reporting periods. For the years ended December 31, 2020, 20192023, 2022 and 2018,2021, unvested performance-based market condition share awards were excluded from the calculation of diluted
114
earnings per share because the market conditions had not been met. There were 71,444,93271,402,907 redeemable convertible preferred stock shares outstanding which were convertible into 117,720,360139,939,471 shares of common stock at December 31, 2020.2023. These potentially dilutivepreferred stock shares were anti-dilutive for the yearyears ended December 31, 20202023, 2022 and 2021 and are therefore excluded from the diluted loss(loss) income per common share calculation.
The details of the computation of basic and diluted earnings(loss) income per common share are as follows:
|
| Year Ended December 31, |
| |||||||||
(dollars in millions, share data in thousands except earnings per share) |
| 2023 |
|
| 2022 |
|
| 2021 |
| |||
Net (loss) income and comprehensive (loss) income |
| $ | (8.2 | ) |
| $ | 130.8 |
|
| $ | (79.7 | ) |
Accretion to redemption value of redeemable |
|
| (42.0 | ) |
|
| (38.8 | ) |
|
| (35.6 | ) |
Participation rights on if-converted basis |
|
| — |
|
|
| (60.2 | ) |
|
| — |
|
Net (loss) income and comprehensive (loss) income |
| $ | (50.2 | ) |
| $ | 31.8 |
|
| $ | (115.3 | ) |
Weighted average common shares outstanding |
|
| 63,959 |
|
|
| 69,002 |
|
|
| 71,309 |
|
Basic (loss) income per share |
| $ | (0.78 | ) |
| $ | 0.46 |
|
| $ | (1.62 | ) |
Net (loss) income and comprehensive (loss) income |
| $ | (50.2 | ) |
| $ | 31.8 |
|
| $ | (115.3 | ) |
Diluted effect of stock options |
|
| — |
|
|
| 146 |
|
|
| — |
|
Diluted weighted average common shares |
|
| 63,959 |
|
|
| 69,148 |
|
|
| 71,309 |
|
Diluted (loss) income per share |
| $ | (0.78 | ) |
| $ | 0.46 |
|
| $ | (1.62 | ) |
Anti-dilutive employee share awards excluded |
|
| 19,704 |
|
|
| 14,858 |
|
|
| 15,023 |
|
|
| Year Ended December 31, |
| |||||||||
(dollars in millions, share data in thousands except earnings per share) |
| 2020 (As Restated) |
|
| 2019 |
|
| 2018 |
| |||
Net loss and comprehensive loss attributable to Emerald Holding, Inc. |
| $ | (633.6 | ) |
| $ | (50.0 | ) |
| $ | (25.1 | ) |
Accretion to redemption value of redeemable convertible preferred stock |
|
| (15.6 | ) |
|
| — |
|
|
| — |
|
Net loss and comprehensive loss attributable to Emerald Holding, Inc. common stockholders |
| $ | (649.2 | ) |
| $ | (50.0 | ) |
| $ | (25.1 | ) |
Weighted average common shares outstanding |
|
| 71,431 |
|
|
| 71,719 |
|
|
| 72,887 |
|
Basic loss per share |
| $ | (9.09 | ) |
| $ | (0.70 | ) |
| $ | (0.34 | ) |
Net loss and comprehensive loss attributable to Emerald Holding, Inc. common stockholders |
| $ | (649.2 | ) |
| $ | (50.0 | ) |
| $ | (25.1 | ) |
Diluted effect of stock options |
|
| — |
|
|
| — |
|
|
| — |
|
Diluted weighted average common shares outstanding |
|
| 71,431 |
|
|
| 71,719 |
|
|
| 72,887 |
|
Diluted (loss) earnings per share |
| $ | (9.09 | ) |
| $ | (0.70 | ) |
| $ | (0.34 | ) |
Anti-dilutive shares excluded from diluted earnings per share calculation |
|
| 5,196 |
|
|
| 4,996 |
|
|
| 1,609 |
|
Note 14. Defined Contribution Plans
The Company has a 401(k) savings plan, the Emerald Expositions, LLC 401(k) Savings Plan (the “Emerald Plan”), that was formed on January 1, 2014. The Company matches 50%50% of up to 6%6% of an eligible plan participant’s compensation for the contribution period. In March 2020, the Company suspended the Company’s 401(k) match for all participants. The Company’s 401(k) match was reinstated in August 2021. For each of the years ended December 31, 2020, 20192023, 2022 and 2018,2021, the Company recorded compensation expense of $0.2$1.8 million, $1.1$1.6 million and $1.0$1.3 million, respectively, for the employer matching contribution.
115
Note 15. Income Taxes
On December 22, 2017, the Tax CutsThe Company’s (loss) income before income taxes expense (benefit) from its United States and Jobs Act (the “Tax Act”) was signed into law, making significant changes to taxation of U.S. business entities. The Tax Act reduced the U.S. corporate income tax rate from 35% to 21%, provided for accelerated deductions for capital asset additions, imposed limitations on certain tax deductions (e.g., meals & entertainment, executive compensation, interest, etc.), eliminated the corporate alternative minimum tax, and included numerous other provisions.foreign operations are as follows:
|
| Year Ended December 31, |
| |||||||||
(in millions) |
| 2023 |
|
| 2022 |
|
| 2021 |
| |||
United States |
| $ | (3.0 | ) |
| $ | 158.2 |
|
| $ | (82.1 | ) |
Foreign |
|
| 0.1 |
|
|
| (0.2 | ) |
|
| 1.1 |
|
Total |
| $ | (2.9 | ) |
| $ | 158.0 |
|
| $ | (81.0 | ) |
In connection with the Tax Act, the SEC issued Staff Accounting Bulletin No. 118, Income Tax Accounting Implications of the Tax Cuts and Jobs Act (“SAB 118”), to provide guidance to companies that had not completed their accounting for the income tax effects of the Tax Act. Under SAB 118, companies were permitted to record provisional amounts to the extent reasonable estimates could be made. Additionally, upon obtaining, preparing, or analyzing additional information (including computations), companies were permitted to record additional tax effects and adjustments to previously recorded provisional amounts within one year from the enactment date of the Tax Act.
The Company’s current and deferred income tax benefitsprovision (benefit) were as follows:
|
| Year Ended December 31, |
| |||||||||
(in millions) |
| 2023 |
|
| 2022 |
|
| 2021 |
| |||
Current |
|
|
|
|
|
|
|
|
| |||
Federal |
| $ | 2.4 |
|
| $ | 20.8 |
|
| $ | (1.4 | ) |
State and local |
|
| 1.6 |
|
|
| 6.1 |
|
|
| 0.2 |
|
Foreign |
|
| — |
|
|
| — |
|
|
| 0.3 |
|
|
| 4.0 |
|
|
| 26.9 |
|
|
| (0.9 | ) | |
Deferred |
|
|
|
|
|
|
|
|
| |||
Federal |
|
| 1.8 |
|
|
| 0.2 |
|
|
| (0.2 | ) |
State and local |
|
| (0.5 | ) |
|
| 0.2 |
|
|
| (0.2 | ) |
Foreign |
|
| — |
|
|
| (0.1 | ) |
|
| — |
|
|
| 1.3 |
|
|
| 0.3 |
|
|
| (0.4 | ) | |
Total provision for (benefit from) income taxes |
| $ | 5.3 |
|
| $ | 27.2 |
|
| $ | (1.3 | ) |
|
| December 31, |
| |||||||||
(in millions) |
| 2020 |
|
| 2019 |
|
| 2018 |
| |||
Current |
|
|
|
|
|
|
|
|
|
|
|
|
Federal |
| $ | 0.3 |
|
| $ | 7.8 |
|
| $ | 11.5 |
|
State and local |
|
| 0.2 |
|
|
| 2.6 |
|
|
| 5.0 |
|
|
|
| 0.5 |
|
|
| 10.4 |
|
|
| 16.5 |
|
Deferred |
|
|
|
|
|
|
|
|
|
|
|
|
Federal |
|
| (44.6 | ) |
|
| (11.1 | ) |
|
| (19.1 | ) |
State and local |
|
| (13.5 | ) |
|
| (4.3 | ) |
|
| (5.7 | ) |
|
|
| (58.1 | ) |
|
| (15.4 | ) |
|
| (24.8 | ) |
Total benefit from income taxes |
| $ | (57.6 | ) |
| $ | (5.0 | ) |
| $ | (8.3 | ) |
The differences between income taxes expected at U.S. statutory income tax rates and the income tax provision (benefit) are set forth below:
|
| December 31, |
|
| Year Ended December 31, |
| ||||||||||||||||||
(in millions) |
| 2020 |
|
| 2019 |
|
| 2018 |
|
| 2023 |
|
| 2022 |
|
| 2021 |
| ||||||
Loss before income taxes |
| $ | (691.2 | ) |
| $ | (55.0 | ) |
| $ | (33.4 | ) | ||||||||||||
(Loss) income before income taxes |
| $ | (2.9 | ) |
| $ | 158.0 |
|
| $ | (81.0 | ) | ||||||||||||
U.S. statutory tax rate |
|
| 21.0 | % |
|
| 21.0 | % |
|
| 21.0 | % |
|
| 21.0 | % |
|
| 21.0 | % |
|
| 21.0 | % |
Taxes at the U.S. statutory rate |
|
| (145.2 | ) |
|
| (11.5 | ) |
|
| (7.0 | ) |
|
| (0.6 | ) |
|
| 33.2 |
|
|
| (17.0 | ) |
Tax effected differences |
|
|
|
|
|
|
|
|
|
|
|
|
|
|
|
|
|
|
| |||||
State and local taxes, net of federal benefit |
|
| (13.0 | ) |
|
| (0.8 | ) |
|
| (1.7 | ) |
|
| 0.8 |
|
|
| 7.3 |
|
|
| (3.2 | ) |
Excess tax deductions on share-based payments |
|
| 0.5 |
|
|
| 0.3 |
|
|
| (0.9 | ) | ||||||||||||
Share-based payments |
|
| 0.3 |
|
|
| 0.6 |
|
|
| 0.5 |
| ||||||||||||
Nondeductible goodwill impairment |
|
| 76.6 |
|
|
| 7.2 |
|
|
| — |
|
|
| — |
|
|
| 1.1 |
|
|
| 0.9 |
|
Change in valuation allowance |
|
| 3.7 |
|
|
| (16.5 | ) |
|
| 18.7 |
| ||||||||||||
Return to provision adjustments |
|
| (0.1 | ) |
|
| (0.1 | ) |
|
| (1.4 | ) |
|
| 0.3 |
|
|
| 0.1 |
|
|
| 0.1 |
|
Change in valuation allowance |
|
| 25.6 |
|
|
| — |
|
|
| — |
| ||||||||||||
Change in tax rates |
|
| (2.3 | ) |
|
| (0.6 | ) |
|
| 1.2 |
|
|
| 0.5 |
|
|
| 0.3 |
|
|
| (0.4 | ) |
Adjustments under SAB 118 |
|
| — |
|
|
| — |
|
|
| (0.2 | ) | ||||||||||||
Change in uncertain tax positions |
|
| — |
|
|
| — |
|
|
| 1.2 |
|
|
| — |
|
|
| — |
|
|
| (1.3 | ) |
Nondeductible expenses |
|
| 0.3 |
|
|
| 0.4 |
|
|
| 0.3 |
|
|
| 0.4 |
|
|
| 1.1 |
|
|
| 0.3 |
|
Other, net |
|
| — |
|
|
| 0.1 |
|
|
| 0.2 |
|
|
| (0.1 | ) |
|
| — |
|
|
| 0.1 |
|
Total benefit from income taxes |
| $ | (57.6 | ) |
| $ | (5.0 | ) |
| $ | (8.3 | ) | ||||||||||||
Total provision for (benefit from) income taxes |
| $ | 5.3 |
|
| $ | 27.2 |
|
| $ | (1.3 | ) | ||||||||||||
In addition to certain nondeductible expenses recorded by the Company (e.g., portions of the goodwill impairments recorded during the years ended December 31, 2020 and 2019) and changes in valuation allowances recorded during the year ended December 31, 2020, theThe fluctuations of the Company’s income tax benefits and effective tax rates between the years ended December 31, 2020, 20192023, 2022 and 20182021, are primarily attributable to certain nondeductible expenses recorded by the Company (e.g., portion of the goodwill impairment charges that is nondeductible for tax purposes recorded during the years ended December 31, 2022 and 2021). Additionally, changes in the relative mix of the Company'sCompany’s operations in and among various U.S. state and local jurisdictions that impact the Company'sCompany’s state and local income tax provision expenses, in additionbenefit. Due to a lack of available sources of future taxable income, the state and local blended tax rates applied in the measurementCompany recorded a full valuation allowance against its net balance of its deferred tax assets and liabilities.assets.
116
The income tax effects of temporary differences between the book value and tax basis of assets and liabilities are as follows:
|
| December 31, |
|
| December 31, |
| ||||||||||
(in millions) |
| 2020 |
|
| 2019 |
|
| 2023 |
|
| 2022 |
| ||||
Deferred tax assets |
|
|
|
|
|
|
|
|
|
|
|
|
|
| ||
Net operating loss carryforwards |
| $ | 0.2 |
|
| $ | 0.2 |
|
| $ | 1.0 |
|
| $ | 0.3 |
|
Deferred compensation |
|
| 1.8 |
|
|
| 1.3 |
|
|
| 0.6 |
|
|
| 1.8 |
|
Stock-based compensation |
|
| 6.9 |
|
|
| 6.2 |
|
|
| 9.6 |
|
|
| 8.6 |
|
Fixed asset depreciation |
|
| — |
|
|
| 0.1 |
|
|
| 0.2 |
|
|
| — |
|
Lease liabilities |
|
| 4.5 |
|
|
| 5.2 |
|
|
| 3.2 |
|
|
| 3.9 |
|
Accrued expenses |
|
| 0.6 |
|
|
| 0.2 |
|
|
| 0.2 |
|
|
| 1.0 |
|
Goodwill and intangible assets |
|
| 13.2 |
|
|
| — |
|
|
| 8.6 |
|
|
| 14.4 |
|
Section 163(j) interest carryover |
|
| 6.7 |
|
|
| — |
| ||||||||
Other assets |
|
| 0.8 |
|
|
| 0.3 |
|
|
| 0.6 |
|
|
| 0.2 |
|
Deferred tax assets |
|
| 28.0 |
|
|
| 13.5 |
| ||||||||
Valuation allowance |
|
| (25.8 | ) |
|
| (0.2 | ) | ||||||||
Net deferred tax assets |
|
| 2.2 |
|
|
| 13.3 |
| ||||||||
Total deferred tax assets |
|
| 30.7 |
|
|
| 30.2 |
| ||||||||
|
|
|
|
|
|
|
|
|
|
|
|
|
|
| ||
Deferred tax liabilities |
|
|
|
|
|
|
|
|
|
|
|
|
|
| ||
Goodwill and intangible assets |
|
| — |
|
|
| (68.5 | ) | ||||||||
Right-of-use lease assets |
|
| (2.1 | ) |
|
| (2.7 | ) | ||||||||
Fixed asset depreciation |
|
| (0.1 | ) |
|
| — |
|
|
| — |
|
|
| (1.3 | ) |
Right-of-use lease assets |
|
| (4.0 | ) |
|
| (4.8 | ) | ||||||||
Net deferred tax liability |
| $ | (1.9 | ) |
| $ | (60.0 | ) | ||||||||
Total deferred tax liabilities |
|
| (2.1 | ) |
|
| (4.0 | ) | ||||||||
|
|
|
|
|
|
| ||||||||||
Valuation allowance |
|
| (31.7 | ) |
|
| (28.0 | ) | ||||||||
Deferred tax liabilities, net |
| $ | (3.1 | ) |
| $ | (1.8 | ) | ||||||||
|
|
|
|
|
|
|
|
|
|
|
|
|
|
| ||
Recognized as |
|
|
|
|
|
|
|
|
|
|
|
|
|
| ||
Deferred income taxes, current |
| $ | — |
|
| $ | — |
| ||||||||
Deferred income taxes, noncurrent |
|
| (1.9 | ) |
|
| (60.0 | ) |
| $ | (3.1 | ) |
| $ | (1.8 | ) |
|
| $ | (1.9 | ) |
| $ | (60.0 | ) | ||||||||
In assessing the realization of the deferred tax assets, the Company considers whether it is more likely than not that some portion of all of the deferred tax assets will not be realized. The ultimate realization of deferred tax assets is dependent upon the generation of future taxable income during the periods in which temporary differences representing net future deductible amounts become deductible. TheDue to lack of available sources of taxable income, the Company considers the scheduled reversal ofrecorded a full valuation allowance against its net deferred tax liabilities, projected future taxable income and tax planning strategies in making this assessment. After consideration of all of the information available, the Company believes that significantassets as sufficient uncertainty exists with respect toregarding the future realization of these assets. As of December 31, 2023 and 2022, the deferred tax assets and has therefore establishedCompany recorded a valuation allowance of $25.8$31.7 million forand $28.0 million, respectively. The increase in the year ended December 31, 2020 on deferred tax assets that are more-likely-than-notvaluation allowance was due to not be realized.Section 163(j) interest carryover, which was partially offset by book-to-tax differences related to goodwill and intangible assets.
As of December 31, 20202023 and 2019,2022, the Company had zero U.S. federal net operating loss carryforwards. As of December 31, 2023 and 2022, the Company had U.S. state net operating loss carryforwards of $2.7 million. $16.0 million and $2.7 million, respectively. The U.S. state net operating loss carryforward begins to expire in 2025. The Company does not have any income tax credit carryforwards.
The following table summarizes the changes to the gross unrecognized tax benefits for the years ended December 31, 2020, 2019,2023, 2022 and 2018:2021:
|
| December 31, |
|
| December 31, |
| ||||||||||||||||||
(in millions) |
| 2020 |
|
| 2019 |
|
| 2018 |
|
| 2023 |
|
| 2022 |
|
| 2021 |
| ||||||
Gross unrecognized tax benefits, beginning of period |
| $ | 1.1 |
|
| $ | 1.1 |
|
| $ | 1.7 |
|
| $ | — |
|
| $ | — |
|
| $ | 1.1 |
|
Decreases related to prior year tax positions |
|
| — |
|
|
| — |
|
|
| (1.7 | ) |
|
| — |
|
|
| — |
|
|
| (1.1 | ) |
Increases related to current year tax provisions |
|
| — |
|
|
| — |
|
|
| 1.1 |
|
|
| — |
|
|
| — |
|
|
| — |
|
Gross unrecognized tax benefits, end of period |
| $ | 1.1 |
|
| $ | 1.1 |
|
| $ | 1.1 |
|
| $ | — |
|
| $ | — |
|
| $ | — |
|
For the years ended December 31, 2020, 2019,2023, 2022 and 2018,2021, interest and penalties were not significant. The Company records interest and penalties on unrecognized tax benefits within the benefit from income taxes in the consolidated statements of loss(loss) income and comprehensive loss.(loss) income.
117
If the balance of gross unrecognized tax benefits of $1.1 million asAs of December 31, 2020 were realized in a future period, this would result in a2023, the Company does not have unrecognized tax benefit of $1.1 million within the provision for income taxes at such time.benefits. The Company does not expect that there are any material changes to its unrecognized tax benefits that are reasonably possible to occur withinchange significantly over the coming year.next 12 months.
The Company is subject to U.S. federal income tax and various state and local taxes in numerous jurisdictions. The Company’s federal tax returns for 20172020 through 20202023 years remain open for examination by the IRS. In most cases, the Company’s state tax returns for 20172020 through 20202023 remain open and are subject to income tax examinations by state taxing authorities.
Note 16. Commitments and Contingencies
Operating Leases and Other Contractual Obligations
The Company has entered into operating leases for office space and office equipment and other contractual obligations primarily to secure venues for the Company’s trade shows and events. These agreements are not unilaterally cancelable by the Company, are legally enforceable and specify fixed or minimum amounts or quantities of goods or services at fixed or minimum prices.
The amounts presented below represent the future minimum annual payments under the Company’s operating leases and other contractual obligations that have initial or remaining non-cancelable terms in excess of one year as of December 31, 2020:2023:
|
| Years Ending December 31, |
|
| Years Ending December 31, |
| ||||||||||||||||||||||||||||||||||||||||||||||||||
(in millions) |
| 2021 |
|
| 2022 |
|
| 2023 |
|
| 2024 |
|
| 2025 |
|
| Thereafter |
|
| Total |
|
| 2024 |
|
| 2025 |
|
| 2026 |
|
| 2027 |
|
| 2028 |
|
| Thereafter |
|
| Total |
| ||||||||||||||
Operating leases |
| $ | 4.3 |
|
| $ | 3.8 |
|
| $ | 3.8 |
|
| $ | 3.0 |
|
| $ | 2.3 |
|
| $ | 3.0 |
|
| $ | 20.2 |
|
| $ | 4.0 |
|
| $ | 4.0 |
|
| $ | 3.8 |
|
| $ | 1.6 |
|
| $ | 0.4 |
|
| $ | 0.1 |
|
| $ | 13.9 |
|
Other contractual obligations |
|
| 24.6 |
|
|
| 18.2 |
|
|
| 3.8 |
|
|
| 0.9 |
|
|
| 0.1 |
|
|
| — |
|
|
| 47.6 |
|
|
| 42.0 |
|
|
| 20.6 |
|
|
| 9.4 |
|
|
| 0.8 |
|
|
| 0.3 |
|
|
| — |
|
|
| 73.1 |
|
|
| $ | 28.9 |
|
| $ | 22.0 |
|
| $ | 7.6 |
|
| $ | 3.9 |
|
| $ | 2.4 |
|
| $ | 3.0 |
|
| $ | 67.8 |
|
| $ | 46.0 |
|
| $ | 24.6 |
|
| $ | 13.2 |
|
| $ | 2.4 |
|
| $ | 0.7 |
|
| $ | 0.1 |
|
| $ | 87.0 |
|
Rent expense incurred under operating leases was $4.2$4.2 million, $4.4$7.5 million and $4.0$5.2 million for the years ended December 31, 2020, 20192023, 2022 and 2018,2021, respectively.
Litigation
The Company is subject to litigation and other claims in the ordinary course of business. The Company records an accrual for loss contingencies for legal proceedings when it believes that an unfavorable outcome is both probable and the amount or range of any possible loss is reasonably estimable. The Company did not record an accrual for loss contingencies associated with legal proceedings as of December 31, 20202023 and 2019.2022. In the opinion of management,the Company is not presently a party to any material litigation and management is not aware of any pending or threatened litigation against the Company that would have a material adverse impact on the Company’s business, consolidated balance sheets, results of operations or cash flows.
Other Commitments and Contingencies
Refer to Note 9, Fair Value Measurements, for further discussion on the contingent considerationconsiderations related to the Company’s acquisition of PlumRiver, EDspacesLodestone, Bulletin, Advertising Week, MJBiz, and G3.AV-IQ.
Note 17. Accounts payable and other current liabilities
Accounts payable and other current liabilities consisted of the following:
|
| December 31, |
| |||||
(in millions) |
| 2023 |
|
| 2022 |
| ||
Trade payables |
| $ | 24.1 |
|
| $ | 20.4 |
|
Other current liabilities |
|
| 9.3 |
|
|
| 14.7 |
|
Accrued event costs |
|
| 6.7 |
|
|
| 11.7 |
|
Accrued personnel costs |
|
| 6.5 |
|
|
| 11.3 |
|
Total accounts payable and other current liabilities |
| $ | 46.6 |
|
| $ | 58.1 |
|
|
| December 31, |
| |||||
(in millions) |
| 2020 |
|
| 2019 |
| ||
Accrued personnel costs |
| $ | 12.7 |
|
| $ | 8.3 |
|
Accrued event costs |
|
| 7.3 |
|
|
| 3.8 |
|
Contingent consideration |
|
| 3.7 |
|
|
| — |
|
Other current liabilities |
|
| 3.6 |
|
|
| 4.3 |
|
Trade payables |
|
| 3.8 |
|
|
| 5.7 |
|
Accrued interest |
|
| — |
|
|
| 0.1 |
|
Total accounts payable and other current liabilities |
| $ | 31.1 |
|
| $ | 22.2 |
|
118
Note 18. Segment Information
The Company routinely evaluates whether its operating and reportable segments continue to reflect the way the CODM evaluates the business. The determination is based on: (1) how the Company’s CODM evaluates the performance of the business, including resource allocation decisions, and (2) whether discrete financial information for each operating segment is available. The Company considers its Chief Executive Officer to be its CODM. Due
Effective October 31, 2023, the Company’s management was reorganized and the discrete financial reporting information regularly provided to the Company’s appointmentCODM to facilitate his allocation of resources and assessment of performance was updated to reflect the new structure. As a new Chief Executive Officer and subsequent revisions to the structure of Emerald’s operations and executive management responsibilities during the fourth quarter of 2019, the Company identifiedresult, there was a change in operating and reportablereporting segments. The financial information presented below reflects reportable segments for all periods presented, including prior year financial information.
The CODM evaluates performance based on the results of 6 executive brand portfolios,three business lines, which represent the Company’s 6three operating segments. The brands managed byConnections segment is the Company’sonly operating segment managerswhich meets the criteria to be classified as a reportable segment. The Connections reportable segment includes all of Emerald’s trade shows and other live events. The other two operating segments, which provide diverse media services and e-commerce software solutions, do not necessarily align with specific industry sectors. Due to economic similarities and the nature of services, fulfillment processes of those services and types of customers, 4 operating segments are aggregated into 2 reportable segments, the Commerce and the Design and Technology reportable segments. In addition, 2 operating segments did not meet the quantitative thresholds of a reportable segment and did not meet the aggregation criteria set forth in Accounting Standards Codification 280 (“ASC 280,280”), Segment Reporting. Therefore, results for these operating segmentsReporting, as of December 31, 2023 and as such are included in the rows labeled "All Other" in the tables below for all periods presented. referred to as “All Other.”Each of the brand portfolios generate revenues through the production of trade show events, including booth space sales, registration fees and sponsorship fees. In addition, the segments generate revenues from marketing activities, including digital and print media.
Operating segment performance is evaluated by the Company’s CODM based on revenues and Adjusted EBITDA, a non-GAAP measure, defined as EBITDA exclusive of general corporate expenses, stock-based compensation expense, impairments and other items. These adjustments are primarily related to items that are managed on a consolidated basis at the corporate level. The exclusion of such charges from each segment is consistent with how the CODM evaluates segment performance.
The following table presents a reconciliation of reportable segment revenues, other income, and Adjusted EBITDA to net (loss) income:
|
| Years Ended December 31, |
| |||||||||
(in millions) |
| 2020 |
|
| 2019 |
|
| 2018 |
| |||
Revenues |
|
|
|
|
|
|
|
|
|
|
|
|
Commerce |
| $ | 56.9 |
|
| $ | 184.7 |
|
| $ | 215.9 |
|
Design and Technology |
|
| 51.2 |
|
|
| 139.9 |
|
|
| 127.8 |
|
All Other |
|
| 19.3 |
|
|
| 36.3 |
|
|
| 37.0 |
|
Total revenues |
| $ | 127.4 |
|
| $ | 360.9 |
|
| $ | 380.7 |
|
|
|
|
|
|
|
|
|
|
|
|
|
|
Other Income |
|
|
|
|
|
|
|
|
|
|
|
|
Commerce |
| $ | 70.3 |
|
| $ | 6.1 |
|
| $ | — |
|
Design and Technology |
|
| 32.5 |
|
|
| — |
|
|
| — |
|
All Other |
|
| 4.2 |
|
|
| — |
|
|
| — |
|
Total other income |
| $ | 107.0 |
|
| $ | 6.1 |
|
| $ | — |
|
|
|
|
|
|
|
|
|
|
|
|
|
|
Adjusted EBITDA |
|
|
|
|
|
|
|
|
|
|
|
|
Commerce |
| $ | 74.8 |
|
| $ | 104.2 |
|
| $ | 128.3 |
|
Design and Technology |
|
| 35.1 |
|
|
| 55.7 |
|
|
| 56.0 |
|
All Other |
|
| 2.9 |
|
|
| 9.2 |
|
|
| 12.5 |
|
Subtotal adjusted EBITDA |
| $ | 112.8 |
|
| $ | 169.1 |
|
| $ | 196.8 |
|
|
|
|
|
|
|
|
|
|
|
|
|
|
General corporate expenses |
|
| (40.9 | ) |
|
| (41.3 | ) |
|
| (33.9 | ) |
Interest expense |
|
| (20.6 | ) |
|
| (30.3 | ) |
|
| (29.1 | ) |
Goodwill impairments |
|
| (603.4 | ) |
|
| (69.1 | ) |
|
| — |
|
Intangible asset impairments |
|
| (76.8 | ) |
|
| (17.0 | ) |
|
| (104.3 | ) |
Depreciation and amortization |
|
| (48.6 | ) |
|
| (52.0 | ) |
|
| (46.8 | ) |
Stock-based compensation |
|
| (6.7 | ) |
|
| (7.7 | ) |
|
| (6.1 | ) |
Deferred revenue adjustment |
|
| — |
|
|
| (0.3 | ) |
|
| (0.8 | ) |
Other |
|
| (7.0 | ) |
|
| (6.4 | ) |
|
| (9.2 | ) |
Loss before income taxes |
| $ | (691.2 | ) |
| $ | (55.0 | ) |
| $ | (33.4 | ) |
119
|
| Years Ended December 31, |
| |||||||||
(in millions) |
| 2023(1) |
|
| 2022(1) |
|
| 2021(1,2) |
| |||
Revenues |
|
|
|
|
|
|
|
|
| |||
Connections |
| $ | 340.2 |
|
| $ | 282.6 |
|
| $ | 106.7 |
|
All Other |
|
| 42.6 |
|
|
| 43.3 |
|
|
| 38.8 |
|
Total revenues |
| $ | 382.8 |
|
| $ | 325.9 |
|
| $ | 145.5 |
|
|
|
|
|
|
|
|
|
|
| |||
Other income, net |
|
|
|
|
|
|
|
|
| |||
Connections |
| $ | 2.8 |
|
| $ | 34.2 |
|
| $ | 77.4 |
|
All Other |
|
| — |
|
|
| — |
|
|
| — |
|
Total other income, net |
| $ | 2.8 |
|
| $ | 34.2 |
|
| $ | 77.4 |
|
|
|
|
|
|
|
|
|
|
| |||
Adjusted EBITDA |
|
|
|
|
|
|
|
|
| |||
Connections |
| $ | 136.8 |
|
| $ | 133.0 |
|
| $ | 80.0 |
|
All Other |
|
| 3.6 |
|
|
| 0.2 |
|
|
| 6.3 |
|
Subtotal Adjusted EBITDA |
| $ | 140.4 |
|
| $ | 133.2 |
|
| $ | 86.3 |
|
|
|
|
|
|
|
|
|
|
| |||
General corporate and other expenses |
| $ | (42.6 | ) |
| $ | (42.2 | ) |
| $ | (42.2 | ) |
Other Income, net(3) |
|
| — |
|
|
| 148.6 |
|
|
| — |
|
Interest expense, net |
|
| (35.1 | ) |
|
| (21.8 | ) |
|
| (15.8 | ) |
Loss on extinguishment of debt |
|
| (2.3 | ) |
|
| — |
|
|
| — |
|
Goodwill impairment charge |
|
| — |
|
|
| (6.3 | ) |
|
| (7.2 | ) |
Intangible asset impairment charge |
|
| — |
|
|
| (1.6 | ) |
|
| (32.7 | ) |
Depreciation and amortization expense |
|
| (45.0 | ) |
|
| (59.5 | ) |
|
| (47.6 | ) |
Stock-based compensation expense |
|
| (7.8 | ) |
|
| (5.8 | ) |
|
| (10.4 | ) |
Deferred revenue adjustment |
|
| — |
|
|
| (0.6 | ) |
|
| (2.0 | ) |
Other items |
|
| (10.5 | ) |
|
| 14.0 |
|
|
| (9.4 | ) |
(Loss) income before income taxes |
| $ | (2.9 | ) |
| $ | 158.0 |
|
| $ | (81.0 | ) |
|
| |||||||||||
(1) Current and prior years segment disclosures reflect the new reportable segment structure. |
| |||||||||||
(2) For the year ended December 31, 2021, the Content segment generated revenues and adjusted EBITDA of $27.7 million and $7.6 million, respectively. |
| |||||||||||
(3) On August 3, 2022, the Company reached an agreement for a one-time settlement of outstanding insurance litigation relating to event cancellation insurance for proceeds of $148.6 million. The one-time settlement payment was not specifically attributable to any of the Company’s outstanding event cancellation insurance claims and therefore was not recorded at the segment level. The other income, net related to this one-time settlement is not indicative of any one segment’s performance and is not included in the measure of segment profit and loss analyzed by the CODM on a regular basis. |
| |||||||||||
The Company’s CODM does not receive information with a measure of total assets or capital expenditures for each operating segment as this information is not used for the evaluation of executive brand portfoliooperating segment performance as the Company’s operations are not capital intensive. Capital expenditure information is provided to the CODM on a consolidated basis. Therefore, the Company has not provided asset and capital expenditure information by reportable segment. For the years ended December 31, 2020, 20192023, 2022 and 2018,2021, substantially all revenues were derived from transactions in the United States.
Note 19. Subsequent EventEvents
The Company evaluatedevaluates subsequent events through February 23, 2021,up until the date the consolidated financial statements wereare issued.
Events Subsequent to Original Issuance of Consolidated Financial Statements (Unaudited)
In connection with the reissuance of the consolidated financial statements,On January 19, 2024, the Company has evaluated subsequent events through November 5, 2021,purchased the date the consolidated financial statements were available to be reissued.
Sue Bryce Education and The Portrait Masters Acquisition
On April 1, 2021, the Company acquired certainassociated assets and liabilities of Sue Bryce EducationHotel Interactive, a live events company specializing in hosted buyer events in the hotel, hospitality, food service and healthcare and senior living space. The Portrait Masters for purchase price consideration of the transaction was approximately $6.9$13.0 million plus future contingent payments based on achievement of certain financial performance metrics.business performance. The Company funded this transaction with cash on hand.from operations. The initial
120
Note 20. Unaudited Quarterly Financial Data
As discussed in Note 1, Descriptionaccounting and fair value measurements of Businessassets acquired and Summary of Significant Accounting Policies,liabilities assumed necessary to develop the Company identified a material error in the accounting for its redeemable convertible preferred stock commencing in the quarter ended June 30, 2020, whichpurchase price allocation has resulted in the restatement of the Company’s consolidated financial statements as of and for the year ended December 31, 2020, as well as the quarterly condensed consolidated financial information for the 2020 interim periods commencing June 30, 2020 included below. In connection with such restatements, the Company is also revising its quarterly condensed consolidated financial information as of and for the quarter ended March 31, 2020 to correct for a previously identified Q1 2020 error in goodwill impairment that management had previously concluded was not material to the previously issued condensed consolidated financial statements and had therefore been initially corrected for as an out of period adjustment in Q4 2020.The following tables represent the restated and revised condensed consolidated financial information, and the reconciliations of the as originally reported amounts to the restated and revised amounts. Certain line items within the previously reported condensed consolidated financial information have been excluded as they were not impacted. Neither the restatement or the revision had a net impact to cash flows provided by (used in) operating, investing or financing activities in the condensed consolidated Statements of Cash Flows for any of the impacted periods.completed.
The amounts originally reported were derived from the Company’s Quarterly Reports on Form 10-Q for the interim periods ended March 31, 2020, June 30, 2020 and September 30, 2020 as well as the Original Form 10-K filed with the SEC on February 23, 2021. The restatement for the three and six months ended June 30, 2020, will be effected through the filing of the amended condensed consolidated financial statements for the second quarter 2021 Quarterly Report on Form 10-Q/A and the restatement for the three and nine months ended September 30, 2020, will be effected through the filing of the condensed consolidated financial statements for the third quarter 2021 in the Company’s Quarterly Report on Form 10-Q.121
During the three months ended June 30, 2020 and September 30, 2020, there is no difference in the amounts previously reported as net loss and comprehensive loss attributable to Emerald Holding, Inc. common stockholders in the condensed consolidated statement of loss and comprehensive loss as the cumulative undeclared dividends used in the original calculation equals the amount of accretion of the redeemable convertible preferred stock to its redemption value in the updated calculation.
|
| Quarter Ended |
| |||||||||||||||||||||||||||||
|
| Dec. 31, 2020 (As Restated) |
|
| Sept. 30, 2020 |
|
| Jun. 30, 2020 |
|
| Mar. 31, 2020 (As Revised) |
|
| Dec. 31, 2019 |
|
| Sept. 30, 2019 |
|
| Jun. 30, 2019 |
|
| Mar. 31, 2019 |
| ||||||||
Condensed consolidated statement of (loss) income and comprehensive (loss) income |
| (unaudited) (dollars in millions, share data in thousands except earnings per share) |
| |||||||||||||||||||||||||||||
Goodwill impairments |
|
| 15.2 |
|
|
| — |
|
|
| — |
|
|
| 588.2 |
|
|
| 59.8 |
|
|
| 9.3 |
|
|
| — |
|
|
| — |
|
Operating (loss) income |
|
| (29.4 | ) |
|
| (17.5 | ) |
|
| 18.7 |
|
|
| (642.4 | ) |
|
| (76.5 | ) |
|
| (15.8 | ) |
|
| 24.4 |
|
|
| 43.2 |
|
(Loss) income before income taxes |
|
| (33.5 | ) |
|
| (21.7 | ) |
|
| 13.1 |
|
|
| (649.1 | ) |
|
| (83.5 | ) |
|
| (23.3 | ) |
|
| 16.6 |
|
|
| 35.2 |
|
Net (loss) income and comprehensive (loss) income |
|
| (33.9 | ) |
|
| (15.3 | ) |
|
| 9.9 |
|
|
| (594.3 | ) |
|
| (68.2 | ) |
|
| (19.7 | ) |
|
| 11.4 |
|
|
| 26.5 |
|
Accretion to redemption value of redeemable convertible preferred stock |
|
| (8.5 | ) |
|
| (7.0 | ) |
|
| (0.1 | ) |
|
|
|
|
|
|
|
|
|
|
|
|
|
|
|
|
|
|
|
|
Participation rights on if-converted basis |
|
|
|
|
|
|
|
|
|
| (0.2 | ) |
|
| — |
|
|
| — |
|
|
| — |
|
|
| — |
|
|
| — |
|
Net (loss) income and comprehensive (loss) income attributable to Emerald Holding, Inc. common stockholders |
| $ | (42.4 | ) |
| $ | (22.3 | ) |
| $ | 9.6 |
|
| $ | (594.3 | ) |
| $ | (68.2 | ) |
| $ | (19.7 | ) |
| $ | 11.4 |
|
| $ | 26.5 |
|
|
|
|
|
|
|
|
|
|
|
|
|
|
|
|
|
|
|
|
|
|
|
|
|
|
|
|
|
|
|
|
|
|
Basic (loss) earnings per share |
| $ | (0.59 | ) |
| $ | (0.31 | ) |
| $ | 0.13 |
|
| $ | (8.33 | ) |
| $ | (0.96 | ) |
| $ | (0.27 | ) |
| $ | 0.16 |
|
| $ | 0.37 |
|
Diluted (loss) earnings per share |
| $ | (0.59 | ) |
| $ | (0.31 | ) |
| $ | 0.13 |
|
| $ | (8.33 | ) |
| $ | (0.96 | ) |
| $ | (0.27 | ) |
| $ | 0.16 |
|
| $ | 0.36 |
|
Basic weighted average common shares outstanding |
|
| 71,413 |
|
|
| 71,484 |
|
|
| 71,444 |
|
|
| 71,381 |
|
|
| 71,349 |
|
|
| 71,796 |
|
|
| 71,905 |
|
|
| 71,825 |
|
Diluted weighted average common shares outstanding |
|
| 71,413 |
|
|
| 71,484 |
|
|
| 71,470 |
|
|
| 71,381 |
|
|
| 71,349 |
|
|
| 71,796 |
|
|
| 72,965 |
|
|
| 73,029 |
|
Condensed Consolidated Balance Sheets |
| Dec. 31, 2020 (As Restated) |
|
| Sept. 30, 2020 (As Restated) |
|
| Jun. 30, 2020 (As Restated) |
|
| Mar. 31, 2020 (As Revised) |
|
| Dec. 31, 2019 |
|
| Sept. 30, 2019 |
|
| Jun. 30, 2019 |
|
| Mar. 31, 2019 |
| ||||||||
(dollars in millions, share data in thousands, except par value) |
| (unaudited) |
| |||||||||||||||||||||||||||||
Goodwill |
|
| 404.3 |
|
|
| 392.1 |
|
|
| 392.1 |
|
|
| 392.1 |
|
|
| 980.3 |
|
|
| 1,027.2 |
|
|
| 1,036.5 |
|
|
| 1,036.5 |
|
Total assets |
| $ | 1,054.4 |
|
| $ | 1,083.1 |
|
| $ | 1,019.3 |
|
| $ | 836.9 |
|
| $ | 1,471.7 |
|
| $ | 1,534.3 |
|
| $ | 1,571.4 |
|
| $ | 1,598.9 |
|
Liabilities, Redeemable Convertible Preferred Stock and Stockholders’ Equity (Deficit) |
|
|
|
|
|
|
|
|
|
|
|
|
|
|
|
|
|
|
|
|
|
|
|
|
|
|
|
|
|
|
|
|
Redeemable convertible preferred stock |
|
|
|
|
|
|
|
|
|
|
|
|
|
|
|
|
|
|
|
|
|
|
|
|
|
|
|
|
|
|
|
|
7% Series A Convertible Participating Preferred stock, $0.01 par value |
|
| 398.3 |
|
| 389.8 |
|
| 252.1 |
|
|
| — |
|
|
| — |
|
|
| — |
|
|
| — |
|
|
| — |
| ||
Stockholders’ equity (deficit) |
|
|
|
|
|
|
|
|
|
|
|
|
|
|
|
|
|
|
|
|
|
|
|
|
|
|
|
|
|
|
|
|
Additional paid-in capital |
|
| 690.7 |
|
|
| 693.8 |
|
|
| 698.9 |
|
|
| 697.9 |
|
|
| 701.1 |
|
|
| 698.4 |
|
|
| 696.7 |
|
|
| 693.1 |
|
(Accumulated deficit) Retained Earnings |
|
| (695.2 | ) |
|
| (661.4 | ) |
|
| (646.1 | ) |
|
| (656.0 | ) |
|
| (61.6 | ) |
|
| 15.8 |
|
|
| 44.6 |
|
|
| 39.1 |
|
Total stockholders' equity (deficit) |
|
| (3.8 | ) |
|
| 33.1 |
|
|
| 53.5 |
|
|
| 42.6 |
|
|
| 640.2 |
|
|
| 714.9 |
|
|
| 742.0 |
|
|
| 732.9 |
|
Total liabilities, redeemable convertible preferred stock and stockholders’ equity (deficit) |
| $ | 1,054.4 |
|
| $ | 1,083.1 |
|
| $ | 1,019.3 |
|
| $ | 836.9 |
|
| $ | 1,471.7 |
|
| $ | 1,534.3 |
|
| $ | 1,571.4 |
|
| $ | 1,598.9 |
|
Condensed Consolidated Balance Sheet |
| September 30, 2020 |
| |||||||||
|
| As Originally Reported |
|
| Adjustments |
|
| As Restated |
| |||
(dollars in millions, share data in thousands, except par value) |
| (unaudited) |
| |||||||||
Goodwill |
|
| 416.3 |
|
|
| (24.2 | ) |
|
| 392.1 |
|
Total assets |
| $ | 1,107.3 |
|
| $ | (24.2 | ) |
| $ | 1,083.1 |
|
Liabilities, Redeemable Convertible Preferred Stock and Stockholders’ Equity |
|
|
|
|
|
|
|
|
|
|
|
|
Redeemable convertible preferred stock |
|
|
|
|
|
|
|
|
|
|
|
|
7% Series A Convertible Participating Preferred Stock, $0.01 par value; 80,000 authorized shares; 71,446 shares issued and outstanding; aggregate liquidation preference $407.3 million |
|
| — |
|
|
| 389.8 |
|
|
| 389.8 |
|
Stockholders’ equity |
|
|
|
|
|
|
|
|
|
|
|
|
Preferred stock, $0.01 par value |
|
| 0.7 |
|
|
| (0.7 | ) |
|
| — |
|
Additional paid-in capital |
|
| 1,082.9 |
|
|
| (389.1 | ) |
|
| 693.8 |
|
Accumulated deficit |
|
| (637.2 | ) |
|
| (24.2 | ) |
|
| (661.4 | ) |
Total stockholders’ equity |
|
| 447.1 |
|
|
| (413.3 | ) |
|
| 33.1 |
|
Total liabilities, redeemable convertible preferred stock and stockholders’ equity |
| $ | 1,107.3 |
|
| $ | (24.2 | ) |
| $ | 1,083.1 |
|
Condensed Consolidated Balance Sheet |
| June 30, 2020 |
|
| |||||||||
|
| As Originally Reported |
|
| Adjustments |
|
| As Restated |
|
| |||
(dollars in millions, share data in thousands, except par value) |
| (unaudited) |
|
| |||||||||
Assets |
|
|
|
|
|
|
|
|
|
|
|
|
|
Goodwill |
|
| 416.3 |
|
|
| (24.2 | ) |
|
| 392.1 |
|
|
Total assets |
| $ | 1,043.5 |
|
| $ | (24.2 | ) |
| $ | 1,019.3 |
|
|
Liabilities, Redeemable Convertible Preferred Stock and Stockholders’ Equity |
|
|
|
|
|
|
|
|
|
|
|
|
|
Redeemable convertible preferred stock |
|
|
|
|
|
|
|
|
|
|
|
|
|
7% Series A Convertible Participating Preferred Stock, $0.01 par value; 80,000 authorized shares; 47,058 shares issued and outstanding; aggregate liquidation preference $236.6 million |
|
|
|
|
| 252.1 |
|
| 252.1 |
|
| ||
Stockholders’ equity |
|
|
|
|
|
|
|
|
|
|
|
|
|
Preferred stock, $0.01 par value |
|
| 0.5 |
|
|
| (0.5 | ) |
|
| — |
|
|
Additional paid-in capital |
|
| 950.5 |
|
|
| (251.6 | ) |
|
| 698.9 |
|
|
Accumulated deficit |
|
| (621.9 | ) |
|
| (24.2 | ) |
|
| (646.1 | ) |
|
Total stockholders’ equity |
|
| 329.8 |
|
|
| (276.3 | ) |
|
| 53.5 |
|
|
Total liabilities, redeemable convertible preferred stock and stockholders’ equity |
| $ | 1,043.5 |
|
| $ | (24.2 | ) |
| $ | 1,019.3 |
|
|
Condensed Consolidated Balance Sheet |
| March 31, 2020 |
| |||||||||
|
| As Originally Reported |
|
| Adjustments |
|
| As Revised |
| |||
(dollars in millions, share data in thousands, except par value) |
| (unaudited) |
| |||||||||
Goodwill |
|
| 416.3 |
|
|
| (24.2 | ) |
|
| 392.1 |
|
Total assets |
| $ | 861.1 |
|
| $ | (24.2 | ) |
| $ | 836.9 |
|
Liabilities and Stockholders’ Equity |
|
|
|
|
|
|
|
|
|
|
|
|
Stockholders’ equity |
|
|
|
|
|
|
|
|
|
|
|
|
Accumulated deficit |
|
| (631.8 | ) |
|
| (24.2 | ) |
|
| (656.0 | ) |
Total stockholders’ equity |
|
| 66.8 |
|
|
| (24.2 | ) |
|
| 42.6 |
|
Total liabilities and stockholders’ equity |
| $ | 861.1 |
|
| $ | (24.2 | ) |
| $ | 836.9 |
|
Condensed consolidated statement of loss and comprehensive loss |
| Three Months Ended March 31, 2020 |
| |||||||||
|
| As Originally Reported |
|
| Adjustments |
|
| As Revised |
| |||
(dollars in millions, share data in thousands except earnings per share) |
| (unaudited) |
| |||||||||
Goodwill impairments |
|
| 564.0 |
|
|
| 24.2 |
|
|
| 588.2 |
|
Operating loss |
|
| (618.2 | ) |
|
| (24.2 | ) |
|
| (642.4 | ) |
Loss before income taxes |
|
| (624.9 | ) |
|
| (24.2 | ) |
|
| (649.1 | ) |
Net loss and comprehensive loss |
|
| (570.1 | ) |
|
| (24.2 | ) |
|
| (594.3 | ) |
Net loss and comprehensive loss attributable to Emerald Holding, Inc. common |
| $ | (570.1 | ) |
| $ | (24.2 | ) |
| $ | (594.3 | ) |
|
|
|
|
|
|
|
|
|
|
|
|
|
Basic loss per share |
| $ | (7.99 | ) |
| $ | (0.34 | ) |
| $ | (8.33 | ) |
Diluted loss per share |
| $ | (7.99 | ) |
| $ | (0.34 | ) |
| $ | (8.33 | ) |
Basic weighted average common shares outstanding |
|
| 71,381 |
|
|
| 71,381 |
|
|
| 71,381 |
|
Diluted weighted average common shares outstanding |
|
| 71,381 |
|
|
| 71,381 |
|
|
| 71,381 |
|
Condensed consolidated statement of loss and comprehensive loss |
| Three Months Ended December 31, 2020 |
| |||||||||
|
| As Originally Reported |
|
| Adjustments |
|
| As Restated |
| |||
(dollars in millions, share data in thousands except earnings per share) |
| (unaudited) |
| |||||||||
Goodwill impairments |
|
| 39.4 |
|
|
| (24.2 | ) |
|
| 15.2 |
|
Operating loss |
|
| (53.6 | ) |
|
| 24.2 |
|
|
| (29.4 | ) |
Loss before income taxes |
|
| (57.7 | ) |
|
| 24.2 |
|
|
| (33.5 | ) |
Net loss and comprehensive loss |
|
| (58.1 | ) |
|
| 24.2 |
|
|
| (33.9 | ) |
Accretion to redemption value of redeemable convertible preferred stock |
|
| (7.0 | ) |
|
| (1.5 | ) |
|
| (8.5 | ) |
Net loss and comprehensive loss attributable to Emerald Holding, Inc. common |
| $ | (65.1 | ) |
| $ | 22.7 |
|
| $ | (42.4 | ) |
|
|
|
|
|
|
|
|
|
|
|
|
|
Basic loss per share |
| $ | (0.91 | ) |
| $ | 0.32 |
|
| $ | (0.59 | ) |
Diluted loss per share |
| $ | (0.91 | ) |
| $ | 0.32 |
|
| $ | (0.59 | ) |
Basic weighted average common shares outstanding |
|
| 71,413 |
|
|
| 71,413 |
|
|
| 71,413 |
|
Diluted weighted average common shares outstanding |
|
| 71,413 |
|
|
| 71,413 |
|
|
| 71,413 |
|
Emerald Holding, Inc. (parent company only)
Schedule I – Condensed Financial Information of Registrant
Condensed Balance Sheets
December 31, 20202023 and 20192022
(dollars in millions, share data in thousands except par value) |
| 2023 |
|
| 2022 |
| ||
Assets |
|
|
|
|
|
| ||
Current assets |
|
|
|
|
|
| ||
Receivable from related parties |
| $ | — |
|
| $ | — |
|
Total current assets |
|
| — |
|
|
| — |
|
Noncurrent assets |
|
|
|
|
|
| ||
Long term receivable from related parties |
|
| — |
|
|
| — |
|
Investment in subsidiaries |
|
| 404.6 |
|
|
| 439.3 |
|
Total assets |
| $ | 404.6 |
|
| $ | 439.3 |
|
Liabilities, Redeemable Convertible Preferred Stock and Stockholders’ Deficit |
|
|
|
|
|
| ||
Current liabilities |
|
|
|
|
|
| ||
Payable to subsidiary |
| $ | — |
|
| $ | — |
|
Total current liabilities |
|
| — |
|
|
| — |
|
Noncurrent liabilities |
|
|
|
|
|
| ||
Long term payable to subsidiary |
|
| — |
|
|
| — |
|
Total liabilities |
| $ | — |
|
| $ | — |
|
Redeemable convertible preferred stock |
|
|
|
|
|
| ||
7% Series A Convertible Participating Preferred Stock, |
|
| 497.1 |
|
|
| 472.4 |
|
Stockholders’ deficit |
|
|
|
|
|
| ||
Common stock, $0.01 par value; authorized shares at December 31, 2023 |
|
| 0.6 |
|
|
| 0.7 |
|
Additional paid-in capital |
|
| 559.2 |
|
|
| 610.3 |
|
Accumulated deficit |
|
| (652.3 | ) |
|
| (644.1 | ) |
Total stockholders’ deficit |
|
| (92.5 | ) |
|
| (33.1 | ) |
Total liabilities, redeemable convertible preferred stock |
| $ | 404.6 |
|
| $ | 439.3 |
|
(dollars in millions, share data in thousands except par value) |
| 2020 (As Restated) |
|
| 2019 |
| ||
Assets |
|
|
|
|
|
|
|
|
Current assets |
|
|
|
|
|
|
|
|
Receivable from related parties |
| $ | — |
|
| $ | — |
|
Total current assets |
|
| — |
|
|
| — |
|
Noncurrent assets |
|
|
|
|
|
|
|
|
Long term receivable from related parties |
|
| — |
|
|
| — |
|
Investment in subsidiaries |
|
| 394.5 |
|
|
| 640.2 |
|
Total assets |
| $ | 394.5 |
|
| $ | 640.2 |
|
Liabilities, Redeemable Convertible Preferred Stock and Stockholders’ Equity (Deficit) |
|
|
|
|
|
|
|
|
Current liabilities |
|
|
|
|
|
|
|
|
Payable to subsidiary |
| $ | — |
|
| $ | — |
|
Total current liabilities |
|
| — |
|
|
| — |
|
Noncurrent liabilities |
|
|
|
|
|
|
|
|
Long term payable to subsidiary |
|
| — |
|
|
| — |
|
Total liabilities |
| $ | — |
|
| $ | — |
|
Redeemable convertible preferred stock |
|
|
|
|
|
|
|
|
7% Series A Convertible Participating Preferred Stock, $0.01 par value; authorized shares at December 31, 2020 and 2019: 80,000; 71,445 and 0 shares issued and outstanding; aggregate liquidation preference $414.4 and 0 at December 31, 2020 and 2019, respectively |
|
| 398.3 |
|
|
| — |
|
Stockholders’ equity (deficit) |
|
|
|
|
|
|
|
|
Common stock, $0.01 par value; authorized shares at December 31, 2020 and 2019: 800,000; 72,195 and 71,352 issued and outstanding shares at December 31, 2020 and 2019, respectively |
|
| 0.7 |
|
|
| 0.7 |
|
Additional paid-in capital |
|
| 690.7 |
|
|
| 701.1 |
|
Accumulated deficit |
|
| (695.2 | ) |
|
| (61.6 | ) |
Total stockholders’ equity (deficit) |
| $ | (3.8 | ) |
| $ | 640.2 |
|
Total liabilities, redeemable convertible preferred stock and stockholders' equity (deficit) |
| $ | 394.5 |
|
| $ | 640.2 |
|
122
Emerald Holding, Inc. (parent company only)
Schedule I – Condensed Financial Information of Registrant
Condensed Statements of Loss(Loss) Income and Comprehensive Loss(Loss) Income
December 31, 2020, 20192023, 2022 and 20182021
(dollars in millions) |
| 2023 |
|
| 2022 |
|
| 2021 |
| |||
Revenues |
| $ | — |
|
| $ | — |
|
| $ | — |
|
Other income, net |
|
| — |
|
|
| — |
|
|
| — |
|
Cost of revenues |
|
| — |
|
|
| — |
|
|
| — |
|
Selling, general and administrative expense |
|
| — |
|
|
| — |
|
|
| — |
|
Depreciation and amortization expense |
|
| — |
|
|
| — |
|
|
| — |
|
Goodwill impairment charge |
|
| — |
|
|
| — |
|
|
| — |
|
Intangible asset impairment charge |
|
| — |
|
|
| — |
|
|
| — |
|
Operating income (loss) |
|
| — |
|
|
| — |
|
|
| — |
|
Interest expense |
|
| — |
|
|
| — |
|
|
| — |
|
Interest income |
|
| — |
|
|
| — |
|
|
| — |
|
Loss on extinguishment of debt |
|
| — |
|
|
| — |
|
|
| — |
|
Other expense |
|
| — |
|
|
| — |
|
|
| — |
|
Loss on disposal of fixed assets |
|
| — |
|
|
| — |
|
|
| — |
|
(Loss) income before income taxes |
|
| — |
|
|
| — |
|
|
| — |
|
Provision for (benefit from) income taxes |
|
| — |
|
|
| — |
|
|
| — |
|
Earnings before equity in net (loss) income and |
|
| — |
|
|
| — |
|
|
| — |
|
Equity in net (losses) income and comprehensive (losses) |
|
| (8.2 | ) |
|
| 130.8 |
|
|
| (79.7 | ) |
Accretion to redemption value of redeemable |
|
| (42.0 | ) |
|
| (38.8 | ) |
|
| (35.6 | ) |
Participation rights on if-converted basis |
|
| — |
|
|
| (60.2 | ) |
|
| — |
|
Net (loss) income and comprehensive (loss) income |
| $ | (50.2 | ) |
| $ | 31.8 |
|
| $ | (115.3 | ) |
(dollars in millions) |
| 2020 (As Restated) |
|
| 2019 |
|
| 2018 |
| |||
Revenues |
| $ | — |
|
| $ | — |
|
| $ | — |
|
Other income |
|
| — |
|
|
| — |
|
|
| — |
|
Cost of revenues |
|
| — |
|
|
| — |
|
|
| — |
|
Selling, general and administrative expense |
|
| — |
|
|
| — |
|
|
| — |
|
Depreciation and amortization expense |
|
| — |
|
|
| — |
|
|
| — |
|
Goodwill impairments |
|
|
|
|
|
|
|
|
|
|
|
|
Intangible asset impairments |
|
| — |
|
|
| — |
|
|
| — |
|
Operating (loss) income |
|
| — |
|
|
| — |
|
|
| — |
|
Interest expense |
|
| — |
|
|
| — |
|
|
| — |
|
Income (loss) before income taxes |
|
| — |
|
|
| — |
|
|
| — |
|
Provision for (benefit from) income taxes |
|
| — |
|
|
| — |
|
|
| — |
|
Earnings before equity in net loss and comprehensive loss of subsidiaries |
|
| — |
|
|
| — |
|
|
| — |
|
Equity in net losses and comprehensive losses of subsidiaries |
|
| (633.6 | ) |
|
| (50.0 | ) |
|
| (25.1 | ) |
Net loss and comprehensive loss |
| $ | (633.6 | ) |
| $ | (50.0 | ) |
| $ | (25.1 | ) |
123
Emerald Holding, Inc. (parent company only)
Schedule I – Condensed Financial Information of Registrant
Notes to Condensed Financial Statements
December 31, 2020, 20192023, 2022 and 20182021
1. Basis of Presentation
In the parent-company-only financial statements, Emerald Holding, Inc.’s investment in subsidiaries is stated at cost plus equity in undistributed earnings of subsidiaries since the date of acquisition. The parent-company-only financial statements should be read in conjunction with the Company’s consolidated financial statements, including Note 1, Description of Business and Summary of Significant Accounting Policies,which describes the restatement reflected within the Company’s consolidated financial statements that is also reflected in these parent company only condensed financial statements. A condensed statement of cash flows was not presented because Emerald Holding, Inc.’s net operating activities have no cash impact and there were no investing or financing cash flow activities during the fiscal years ended December 31, 2020, 20192023, 2022 and 2018.2021.
Income taxes and non-cash stock-based compensation have been allocated to the Company’s subsidiaries for the fiscal years ended December 31, 2020, 20192023, 2022 and 2018.2021.
Redeemable Convertible Preferred Stock
The Company records redeemable convertible preferred stock at fair value on the dates of issuance, net of issuance costs. The Company classifies its redeemable convertible preferred stock as mezzanine equity outside of stockholders’ deficit when the stock contains contingent redemption features that are not solely within the Company’s control. Each share of redeemable convertible preferred stock will accumulate dividends at a rate per annum equal to 7% of the accreted liquidation preference, compounding quarterly by adding to the accreted liquidation preference until July 1, 2023 and thereafter, at the Company’s option, paid either in cash or by adding to the accreted liquidation preference. For each of the quarterly periods ending September 30, 2023 and December 31, 2023, the Company elected to pay dividends on the redeemable convertible preferred stock in cash, in an aggregate amount of $8.6 million for each such quarterly period.
The Company has the right to redeem all, but not less than all, of the redeemable convertible preferred stock on or after June 29, 2026 for a cash purchase price equal to (a) on or after the six-year anniversary thereof, 105% of the accreted liquidation preference, (b) on or after the seven-year anniversary thereof, 103% of the accreted liquidation preference or (c) on or after the eight-year anniversary thereof, the accreted liquidation preference. In addition, if there is a change of control transaction involving the Company prior to the six-year anniversary of the First Closing Date, the Company has the right to redeem all, but not less than all, of the redeemable convertible preferred stock for a cash purchase price equal to the accreted liquidation preference plus the net present value of the additional amount by which the accreted liquidation preference would have otherwise increased from the date of such redemption through the sixth anniversary of the closing.
2. Guarantees and Restrictions
On February 14, 2020, Emerald Expositions Holding, Inc., the borrower under the Amended and Restated Senior Secured Credit Facilities, was renamedThe Company’s wholly owned subsidiary, Emerald X, Inc. (“Emerald X”). On May 22, 2017, Emerald X entered into, is the borrower under the Amended and Restated Senior Secured Credit Facilities, by and among Expo Event Midco, Inc. (“EEM”), Emerald X and Emerald X’s subsidiaries as guarantors, various lenders from time to time party thereto and Bank of America, N.A., as administrative agent.agent, as amended from time to time. The Amended and Restated Senior Secured Credit Facilities include restrictions on the ability of Emerald X and its restricted subsidiaries to incur additional liens and indebtedness, make investments and dispositions, pay dividends and make intercompany loans and advances or enter into other transactions, among other restrictions, in each case subject to certain exceptions. Under the Amended and Restated Senior Secured Credit Facilities, Emerald X is permitted to pay dividends so long as immediately after giving effect thereto, no default or event of default had occurred and was continuing, (a) up to an amount equal to, (i) a basket that builds based on 50%50% of Emerald X’s Consolidated Net Income (as defined in the Amended and Restated Senior Secured Credit Facilities) and certain other amounts, subject to various conditions including compliance with a fixed charge coverage ratio of 2.0 to 1.0 and (b) in certain additional limited amounts, subject to certain exceptions set forth in the Amended and Restated Senior Secured Credit Facilities.
124
Since the restricted net assets of Emerald X and its subsidiaries exceed 25%25% of the consolidated net assets of the Company and its subsidiaries, the accompanying condensed parent company financial statements have been prepared in accordance with Rule 12-04, Schedule 1 of Regulation S-X. This information should be read in conjunction with the accompanying consolidated financial statements.
125
Emerald Holding, Inc.
Schedule II – Valuation and Qualifying Accounts
|
|
|
|
|
|
|
|
|
| Additions |
|
|
|
|
|
|
|
|
|
|
|
|
|
|
|
| Additions |
|
|
|
|
|
|
| ||||||||||||||
|
| Balance at Beginning of Period |
|
| Reclassification |
|
| Charged to Costs & Expenses |
|
| Charged to Other Accounts |
|
| Deductions |
|
| Balance at End of Period |
|
| Balance at |
|
| Reclassification |
|
| Charged to |
|
| Charged to |
|
| Deductions |
|
| Balance at |
| ||||||||||||
Description |
| (in millions) |
|
| (in millions) |
| ||||||||||||||||||||||||||||||||||||||||||
Year Ended December 31, 2020: |
|
|
|
|
|
|
|
|
|
|
|
|
|
|
|
|
|
|
|
|
|
|
|
| ||||||||||||||||||||||||
Year Ended December 31, 2023: |
|
|
|
|
|
|
|
|
|
|
|
|
|
|
|
|
|
| ||||||||||||||||||||||||||||||
Allowance for credit losses |
| $ | — |
|
|
| 0.7 |
|
|
| 0.7 |
|
|
| — |
|
|
| (0.3 | ) |
| $ | 1.1 |
|
| $ | 1.5 |
|
|
| — |
|
|
| 0.3 |
|
|
| — |
|
|
| (0.4 | ) |
| $ | 1.4 |
|
Deferred tax asset valuation allowance |
| $ | 28.0 |
|
|
| — |
|
|
| — |
|
|
| 3.7 |
|
|
| — |
|
| $ | 31.7 |
| ||||||||||||||||||||||||
|
|
|
|
|
|
|
|
|
|
|
|
|
|
|
|
| ||||||||||||||||||||||||||||||||
Year Ended December 31, 2022: |
|
|
|
|
|
|
|
|
|
|
|
|
|
|
|
|
|
| ||||||||||||||||||||||||||||||
Allowance for credit losses |
| $ | 1.2 |
|
|
| — |
|
|
| 0.4 |
|
|
| — |
|
|
| (0.1 | ) |
| $ | 1.5 |
| ||||||||||||||||||||||||
Deferred tax asset valuation allowance |
| $ | 44.5 |
|
|
| — |
|
|
| — |
|
|
| (16.5 | ) |
|
| — |
|
| $ | 28.0 |
| ||||||||||||||||||||||||
|
|
|
|
|
|
|
|
|
|
|
|
|
|
|
|
| ||||||||||||||||||||||||||||||||
Year Ended December 31, 2021: |
|
|
|
|
|
|
|
|
|
|
|
|
|
|
|
|
|
| ||||||||||||||||||||||||||||||
Allowance for doubtful accounts |
| $ | 0.7 |
|
|
| (0.7 | ) |
|
| — |
|
|
| 0 |
|
|
| — |
|
| $ | — |
|
| $ | 1.1 |
|
|
| — |
|
|
| 0.4 |
|
|
| — |
|
|
| (0.3 | ) |
| $ | 1.2 |
|
Deferred tax asset valuation allowance |
| $ | 0.2 |
|
|
| — |
|
|
| 0 |
|
|
| 25.6 |
|
|
| — |
|
| $ | 25.8 |
|
| $ | 25.8 |
|
|
| — |
|
|
| — |
|
|
| 18.7 |
|
|
| — |
|
| $ | 44.5 |
|
|
|
|
|
|
|
|
|
|
|
|
|
|
|
|
|
|
|
|
|
|
|
|
|
| ||||||||||||||||||||||||
Year Ended December 31, 2019: |
|
|
|
|
|
|
|
|
|
|
|
|
|
|
|
|
|
|
|
|
|
|
|
| ||||||||||||||||||||||||
Allowance for doubtful accounts |
| $ | 0.9 |
|
|
| — |
|
|
| 0.5 |
|
|
| 0 |
|
|
| (0.7 | ) |
| $ | 0.7 |
| ||||||||||||||||||||||||
Deferred tax asset valuation allowance |
| $ | 0.2 |
|
|
| — |
|
|
| 0 |
|
|
| 0 |
|
|
| — |
|
| $ | 0.2 |
| ||||||||||||||||||||||||
|
|
|
|
|
|
|
|
|
|
|
|
|
|
|
|
|
|
|
|
|
|
|
|
| ||||||||||||||||||||||||
Year Ended December 31, 2018: |
|
|
|
|
|
|
|
|
|
|
|
|
|
|
|
|
|
|
|
|
|
|
|
| ||||||||||||||||||||||||
Allowance for doubtful accounts |
| $ | 0.8 |
|
|
| — |
|
|
| 0.6 |
|
|
| 0 |
|
|
| (0.5 | ) |
| $ | 0.9 |
| ||||||||||||||||||||||||
Deferred tax asset valuation allowance |
| $ | 0.3 |
|
|
| — |
|
|
| 0 |
|
|
| (0.1 | ) |
|
| — |
|
| $ | 0.2 |
| ||||||||||||||||||||||||
Item 9. Changes in and Disagreements With Accountants on Accounting and Financial Disclosure.
None.
Item 9A. Controls and Procedures.
Evaluation of Disclosure Controls and Procedures
The Company maintains disclosure controls and procedures (as defined in Exchange Act Rules 13a-15(e) and 15(d)-15(e)15d-15(e)) that are designed to ensureprovide reasonable assurance that information required to be disclosed in the Company's reports filed or submitted under the Exchange Act is recorded, processed, summarized and reported within the time periods specified in the SEC's rules and forms, and that such information is accumulated and communicated to the Company's management, including the Chief Executive Officer and the Chief Financial Officer, as appropriate to allow timely decisions regarding required disclosure. In designing and evaluating the disclosure controls and procedures, management recognized that controls and procedures, no matter how well designed and operated, can provide only reasonable assurance of achieving the desired control objectives. Further, because of the inherent limitations in all control systems, no evaluation of controls can provide absolute assurance that misstatements due to error or fraud will not occur or that all control issues and instances of fraud, if any, within the Company will be detected.
As of the end of the period covered by this report, management, under the supervision of the Company's Chief Executive Officer and Chief Financial Officer, evaluated the effectiveness of the design and operation of the Company's disclosure controls and procedures. AtBased on the time of the Original Form 10-K, the Company’sevaluation, our Chief Executive Officer and the Chief Financial Officer had concluded that as of December 31, 20202023 the disclosure controls and procedures were effective at the reasonable assurance level. However, management has subsequently determined the disclosure controls and procedures were not effective at the reasonable assurance level due to a material weakness in internal control over financial reporting related to the evaluation of the impact of the arrangement’s terms and conditions on the accounting and reporting for preferred stock instruments that existed as of December 31, 2020.
Restated Management’s Report on Internal Control over Financial Reporting
The Company’s management is responsible for establishing and maintaining adequate internal control over financial reporting, as defined in RuleRules 13a-15(f) and 15d-15(f) under the Securities Exchange Act of 1934, as amended. Internal control over financial reporting is a process designed by, or under the supervision of, the Company's Chief Executive Officer and Chief Financial Officer and effected by the Company's board of directors, management and other personnel to provide reasonable assurance regarding the reliability of financial reporting and the preparation of financial statements for external purposes in accordance with generally accepted accounting principles and includes those policies and procedures that:
126 ▪ pertain to the maintenance of records that in reasonable detail accurately and fairly reflect the transactions and dispositions of the assets of the Company; ▪ provide reasonable assurance that transactions are recorded as necessary to permit preparation of financial statements in accordance with generally accepted accounting principles, and that receipts and expenditures of the Company are being made only in accordance with authorizations of management and directors of the Company; and ▪ provide reasonable assurance regarding prevention or timely detection of unauthorized acquisition, use or disposition of the Company’s assets that could have a material effect on the financial statements.
|
|
|
|
|
|
The Company’s management assessed the effectiveness of its internal control over financial reporting as of December 31, 2020.2023. In making this assessment, management used the criteria set forth by the Committee of Sponsoring Organizations of the Treadway Commission (COSO) in Internal Control — Integrated Framework (2013).
A material weakness is a deficiency, or a combination of deficiencies, in internal control over financial reporting, such that there is a reasonable possibility that a material misstatement of the company's annual or interim financial statements will not be prevented or detected on a timely basis.
The Company did not design and maintain effective controls related toBased on the evaluation, of the impact of the arrangement’s terms and conditions on the accounting and reporting for preferred stock instruments. This material weakness resulted in the restatement of the Company’s previously filed consolidated financial statements as of and for the year ended December 31, 2020, as well as the quarterly condensed consolidated financial information for the 2020 interim periods ended June 30, September 30, and December 31, 2020, related to temporary equity, permanent equity, additional paid in capital, accretion to redemption value of redeemable convertible preferred stock, net loss and comprehensive loss attributable to common shareholders, loss per share and the related disclosures. Additionally, this material weakness could result in misstatements of the aforementioned account balances or disclosures that would result in a material misstatement to the annual or interim consolidated financial statements that would not be prevented or detected.
On February 23, 2021, the Company filed the Original Form 10-K. At that time, itsour management including the Chief Executive Officer and the Chief Financial Officer, had performed an evaluation and concluded that the Company’s internal control over financial reporting was effective as of December 31, 2020. Subsequent to that evaluation, management concluded that2023.
The effectiveness of the Company did not maintain effectiveCompany’s internal control over financial reporting as of December 31, 2020 due to the material weakness in its internal control over financial reporting described above. Accordingly, the Company’s management2023 has restated its report on internal control over financial reporting.
This Annual Report on Form 10-K/A does not include, and we are not required to include,been audited by PricewaterhouseCoopers LLP, an attestation report of our independent registered public accounting firm, on the effectiveness of our internal control over financial reporting pursuant to Section 404 for as long as we remain an “emerging growth company” as definedstated in the JOBS Act.their report appearing under “Item 8. Financial Statements and Supplementary Data”.
Remediation Plan for the Material Weakness
In order to remediate the material weakness, the Company’s management plans to enhance the design of its control activities related to the evaluation of the impact of the terms and conditions on the accounting and reporting for preferred stock issuances. The material weakness cannot be considered remediated until the newly designed controls operate for a sufficient period of time and management has concluded, through testing, that these controls are operating effectively.
Changes in Internal Control over Financial Reporting
There have been no changes in our internal control over financial reporting identified in management'smanagement’s evaluation pursuant to Rules 13a-15(d) or 15d-15(d) of the Exchange Act during the Company’s fourth fiscal quarter of 20202023 that materially affected, or are reasonably likely to materially affect, the Company’s internal control over financial reporting.
Item 9B. Other Information.
None.(a) Form 8-K Disclosures
Separation and Release Agreements
As disclosed by the Company in its Current Report Form 8-K filed by the Company on February 16, 2024, Mr. Brian Field and Ms. Stacey Sayetta will each be departing from their respective role with the Company. In connection with his anticipated departure on April 13, 2024, on March 3, 2024, the Company and Mr. Field entered into a separation and release agreement providing for, subject to Mr. Field’s delivery of an irrevocable general release of claims against the Company, separation payments and benefits substantially consistent with those set forth the employment agreement between the Company and Mr. Field dated May 22, 2019, as amended, and the equity award agreements in respect of equity awards held by Mr. Field at the time of his departure, as well as certain additional benefits. These payments and benefits include, generally: (i) $788,750 in base salary and bonus separation payments, payable over 12 months, (ii) subsidized COBRA payments for 12 months, (iii) accelerated vesting of approximately 77% of the portion of the equity awards that would have vested in the normal course in the next 12 months; and (iv) extended exercisability of vested stock options for 1 year. Mr. Field will continue to be obligated to comply with the restrictive covenants set forth in his employment agreement and the applicable equity award agreements. In connection with her anticipated departure on March 16, 2024, on March 3, 2024, the Company and Ms. Sayetta entered into a separation and release agreement providing for, subject to Ms. Sayetta’s delivery of an irrevocable general release of claims against the Company, separation payments and benefits set forth in the employment offer letter between the Company and Ms. Sayetta dated September 28, 2021 and the equity award agreements in respect of equity awards held by Ms. Sayetta at the time of her departure, as well as certain additional benefits. These payments and benefits include, generally: (i) $262,500 as a separation payment, payable in a lump sum, (ii) $350,000 in base salary separation payments, payable over 12 months, (iii) subsidized COBRA payments for 12 months, (iv) accelerated vesting of approximately 27% of the portion of the equity awards that would have vested in the normal course in the next 12 months; and (v) extended exercisability of vested stock options for 1 year. Ms. Sayetta would continue to be obligated to comply with the restrictive covenants set forth in her employment agreement and the applicable equity award agreements.
127
Retention Bonuses
On March 1, 2024, Board of Directors (the “Board”) of Emerald Holding, Inc. (the “Company”) and the Compensation Committee (the “Committee”) of the Board approved retention bonuses to Hervé Sedky, David Doft and Issa Jouaneh, in the aggregate amount of $945,000, $702,000, and $607,500, respectively (the “Retention Bonuses”). The Retention Bonuses will be paid to each executive, in two substantially equal installments, in March 2024 and January 2025, with each installment being subject to forfeiture and repayment in the event the executive does not continue employment with the Company through December 31, 2024, in respect of the first installment, and December 31, 2025, in respect of the second installment. In the event that, prior to an installment’s vesting date, the recipient’s employment is terminated by the Company without Cause or by the executive for Good Reason (as such terms are defined in the executive’s employment agreement), that installment of the Retention Bonus will no longer be forfeitable. In the event of a termination by the Company for Cause or by the executive for any reason other than Good Reason prior to an applicable vesting date, the gross amount of the Retention Bonus previously paid to the executive for that installment, will be subject to forfeiture and repayment by the executive. In the event of a change of control of the Company (as defined consistent with what is considered a “change in control” of the Company under the terms of the Company’s 2017 Omnibus Equity Plan), the executive will be considered to have earned the full amount of the Retention Bonus, and any installments not previously paid will be paid at the time of the change of control.
(b) Rule 10b5-1 Trading Plans
During the three months ended December 31, 2023, none of the Company’s directors or executive officers have informed us that they have adopted, modified, or terminated a contract, instruction or written plan for the purchase or sale of Company securities intended to satisfy the affirmative defense conditions Rule 10b5-1(c) or a non-Rule 10b5-1 trading arrangement.
Item 9C. Disclosure Regarding Foreign Jurisdictions that Prevent Inspections.
Not applicable.
128
PART III
Item 10. Directors, Executive Officers and Corporate Governance.
The information required by this item will be included in our definitive proxy statement for the 20212024 Annual Meeting of Stockholders and is incorporated herein by reference. We will file such definitive proxy statement with the SEC pursuant to Regulation 14A within 120 days after our fiscal year ended December 31, 2020.2023.
Item 11. Executive Compensation.
The information required by this item will be included in our definitive proxy statement for the 20212024 Annual Meeting of Stockholders and is incorporated herein by reference. We will file such definitive proxy statement with the SEC pursuant to Regulation 14A within 120 days after our fiscal year ended December 31, 2020.2023.
Item 12. Security Ownership of Certain Beneficial Owners and Management and Related Stockholder Matters.
The information required by this item will be included in our definitive proxy statement for the 20212024 Annual Meeting of Stockholders and is incorporated herein by reference. We will file such definitive proxy statement with the SEC pursuant to Regulation 14A within 120 days after our fiscal year ended December 31, 2020.2023.
The information required by this item will be included in our definitive proxy statement for the 20212024 Annual Meeting of Stockholders and is incorporated herein by reference. We will file such definitive proxy statement with the SEC pursuant to Regulation 14A within 120 days after our fiscal year ended December 31, 2020.2023.
Item 14. Principal Accountant Fees and Services
The information required by this item will be included in our definitive proxy statement for the 20212024 Annual Meeting of Stockholders and is incorporated herein by reference. We will file such definitive proxy statement with the SEC pursuant to Regulation 14A within 120 days after our fiscal year ended December 31, 2020.2023.
129
PART IV
Item 15. Exhibits, Financial Statement Schedules.
The following documents are filed as part of this Annual Report on Form 10-K/A:10-K:
(a)(1) and (a)(2)The financial statements set forth in the Index to Consolidated Financial Statements and the Consolidated Financial Statement Schedules are filed as part of this Annual Report on Form 10-K included in Item 8. (a)(3) and (b) The exhibits listed in the accompanying Exhibit Index are filed as part of this Annual Report on Form 10-K and either filed herewith or incorporated by reference herein, as applicable. Item 16. Form 10-K Summary. None. 130 Exhibit Index
131
132
133
134
135
* Filed herewith. + Management compensatory plan or arrangement. †Portions of this exhibit are redacted pursuant to Item 601(b)(2)(ii) of Regulation S-K. 136 SIGNATURE
Pursuant to the requirements of Section 13 or 15(d) of the Securities Exchange Act of 1934, as amended, the Registrant has duly caused this
POWER OF ATTORNEY
Pursuant to the requirements of the Securities Exchange Act of 1934, as amended, this Annual Report on Form 10-K has been signed below by the following persons on behalf of the Registrant in the capacities and on the dates indicated.
137 | ||||||||||||||||||||||||||||||||||||||||||||||||||||||||||||||||||||||||||||||||||||||||||||||||||||||||||||||||||||||||||||||||||||||||||||||||||||||||||||||||||||||||||||||||||||||||||||||||||||||||||||||||||||||||||||||||||||||||||||||||||||||||||||||||||||||||||||||||||||||||||||||||||||||||||||||||||||||||||||||||||||||||||||||||||||||||||||||||||||||||||||||||||||||||||||||||||||||||||||||||||||||||||||||||||||||||||||||||||||||||||||||||||||||||||||||||||||||||||||||||||||||||||||||||||||||||||||||||||||||||||||||||||||||||||||||||||||||||||||||||||||||||||||||||||||||||||||||||||||||||||||||||||||||||||||||||||||||||||||||||||||||||||||||