UNITED STATES
SECURITIES AND EXCHANGE COMMISSION
Washington, D.C. 20549
Form 10-K/A
(Amendment No. 1)10-K
(Mark One)
|
| | | | |
þ☑ | | ANNUAL REPORT PURSUANT TO SECTION 18 OR 15(d) OF THE SECURITIES EXCHANGE ACT OF 1934 |
| | | | | |
| | | For the Fiscal Year Ended | December 31, 20182019 | |
OR
|
| | | | |
o☐ | | TRANSITION REPORT PURSUANT TO SECTION 13 OR 15(d) OF THE SECURITIES EXCHANGE ACT OF 1934 |
| | | | | |
| | | For the transition period from to |
Commission file number 001-38142
DELEK US HOLDINGS, INC.INC.
(Exact name of registrant as specified in its charter)
|
| | | | |
| | Delaware | | 35-2581557 |
| | (State or other jurisdiction of incorporation or organization) | (I.R.S. Employer Identification No.) |
| | | |
| |
| |
| |
| |
| |
| 7102 Commerce Way | Brentwood | Tennessee | 37027 |
| (Address of principal executive offices) | | | (Zip Code) |
7102 Commerce Way, Brentwood, Tennessee 37027
(Address of principal executive offices)615(Zip Code))
(615) 771-6701
(Registrant’s telephone number, including area code)
Not Applicable
(Former name, former address and former fiscal year, if changed since last report)
Securities registered pursuant to Section 12(b) of the Act:
|
| | |
| Title of each class | Trading Symbol(s)Symbol | Name of each exchange on which registered |
| | |
Common Stock, $0.01 par value $0.01 | DK | New York Stock Exchange |
Securities registered pursuant to Section 12(g) of the Act:
None
Indicate by check mark if the registrant is a well-known seasoned issuer, as defined in Rule 405 of the Securities Act. Yes Yesþ No☑ oNo ☐
Indicate by check mark if the registrant is not required to file reports pursuant to Section 13 or Section 15(d) of the Act. Yes☐ oNo Noþ☑
Indicate by check mark whether the registrant (1) has filed all reports required to be filed by Section 13 or 15(d) of the Securities Exchange Act of 1934 during the preceding 12 months (or for such shorter period that the registrant was required to file such reports), and (2) has been subject to such filing requirements for the past 90 days. Yes þ No☑ No o☐
Indicate by check mark whether the registrant has submitted electronically every Interactive Data File required to be submitted pursuant to Rule 405 of Regulation S-T (Section 232.405 of this chapter) during the preceding 12 months (or for such shorter period that the registrant was required to submit such files). Yes þ☑ No o☐
Indicate by check mark whether the registrant is a large accelerated filer, an accelerated filer, a non-accelerated filer, a smaller reporting company, or an emerging growth company. See the definitions of "large“large accelerated filer," "accelerated” “accelerated filer," "smaller” “smaller reporting company,"” and "emerging growth company" in Rule 12b-2 of the Exchange Act.:
Large accelerated filer þAccelerated filer o |
| | | | | | | | | |
| Large accelerated filer | ☑ | Accelerated filer | ☐ | Non-accelerated fileroSmaller reporting companyo Emerging growth company o | ☐ | Smaller reporting company | ☐ | Emerging growth company | ☐ |
If an emerging growth company, indicate by check mark if the registrant has elected not to use the extended transition period for complying with any new or revised financial accounting standards provided pursuant to Section 13(a) of the Exchange Act. o☐
Indicate by check mark whether the registrant is a shell company (as defined in Rule 12b-2 of the Act). Yes ☐ No o☑No þ
The aggregate market value of the common stock held by non-affiliates as of June 30, 20182019 was approximately $4,173,499,366,$3,646,155,246, based upon the closing sale price of the registrant's common stock on the New York Stock Exchange on that date. For purposes of this calculation only, all directors and officers subject to Section 16(b) of the Securities Exchange Act of 1934 and 10% stockholders are deemed to be affiliates.
At February 22, 2019,21, 2020, there were 78,006,53773,414,200 shares of the registrant's common stock, $.01 par value, outstanding (excluding securities held by, or for the account of, the Company or its subsidiaries).
Documents incorporated by reference
Portions of the registrant's definitive Proxy Statement to be delivered to stockholders in connection with the 20192020 Annual Meeting of Stockholders, which will be filed with the Securities and Exchange Commission within 120 days after December 31, 2018,2019, are incorporated by reference into Part III of this Annual Report on Form 10-K.
Explanatory Note
Delek US Holdings, Inc. (the "Company") is filing this Amendment No. 1 on Form 10-K/A ("Amendment No. 1") to its Annual Report on Form 10-K for the year ended December 31, 2018, filed with the Securities and Exchange Commission on March 1, 2019 (the “Form 10-K”), to revise Ernst & Young LLP's reports on the Company's consolidated financial statements and internal control over financial reporting.
The report on the financial statements has been revised to remove a reference to "the financial statement schedule listed in the Index at Item 15(a)", which was not included on the Form 10-K as it was not required. Additionally, the language included in the report on the financial statements under the paragraph titled "Basis for Opinion" has also been revised to remove the reference to the schedule. No change has been made to Ernst & Young LLP’s opinion that the financial statements of Delek US Holdings, Inc. present fairly, in all material respects, the consolidated financial position of the Company at December 31, 2018 and 2017, and the consolidated results of its operations and its cash flows for each of the three years in the period ended December 31, 2018, in conformity with U.S. generally accepted accounting principles.
The report on internal control over financial reporting has been revised to remove the reference to the financial statement schedule cited in the above paragraph. No change has been made to Ernst & Young LLP’s opinion that Delek US Holdings, Inc. maintained, in all material respects, effective internal control over financial reporting as of December 31, 2018, based on the Committee of Sponsoring Organizations of the Treadway Commission ("COSO") criteria.
Additionally, we have updated Item 15(a), the index to the financial statements and other language as applicable to remove references to the financial statement schedule. No other changes have been made to any of the disclosures in the Form 10-K. This Amendment No. 1 refers to the original filing date of the Form 10-K, does not reflect events that may have occurred subsequent to the original filing date, and does not modify or update in any way disclosures made in the Form 10-K, except as set forth above.
As required by Rule 12b-15 under the Securities Exchange Act of 1934, currently-dated certifications from the Company’s Chief Executive Officer and Chief Financial Officer have been included as exhibits to this Amendment No. 1.
Delek US Holdings, Inc.
Annual Report on Form 10-K
For the Annual Period Ending December 31, 20182019
Delek US Holdings, Inc. is a registrant pursuant to the Securities Act of 1933 and is listed on the New York Stock Exchange ("NYSE") under NYSE:DK.the ticker symbol "DK." Effective July 1, 2017 (the "Effective Time"), we acquired the outstanding common stock of Alon (previously listed under NYSE: ALJ)USA Energy, Inc. ("Alon") (the "Delek/Alon Merger", as further discussed in Note 3 of the consolidated financial statements included in Item 8, Financial Statements and Supplementary Data, of this Annual Report on Form 10-K ),10-K), resulting in a new post-combination consolidated registrant renamed as Delek US Holdings, Inc. (“New Delek”), with Alon and the previous Delek US Holdings, Inc. (“Old Delek”) surviving as wholly-owned subsidiaries. New Delek is the successor issuer to Old Delek and Alon pursuant to Rule 12g-3(c) under the Securities Exchange Act of 1934, as amended (the "Exchange Act"). In addition, as a result of the Delek/Alon Merger, the shares of common stock of Old Delek and Alon were delisted from the New York Stock Exchange in July 2017, and their respective reporting obligations under the Exchange Act were terminated.
Unless otherwise noted or the context requires otherwise, the disclosures and financial information included in this report for the periods prior to July 1, 2017 reflect that of Old Delek, and the disclosures and financial information included in this report for the periods beginning July 1, 2017 reflect that of New Delek. The terms "we," "our," "us," "Delek" and the "Company" are used in this report to refer to Old Delek and its consolidated subsidiaries for the periods prior to July 1, 2017, and New Delek and its consolidated subsidiaries for the periods on or after July 1, 2017, unless otherwise noted. Our business consists of three operating segments: refining, logistics and retail.
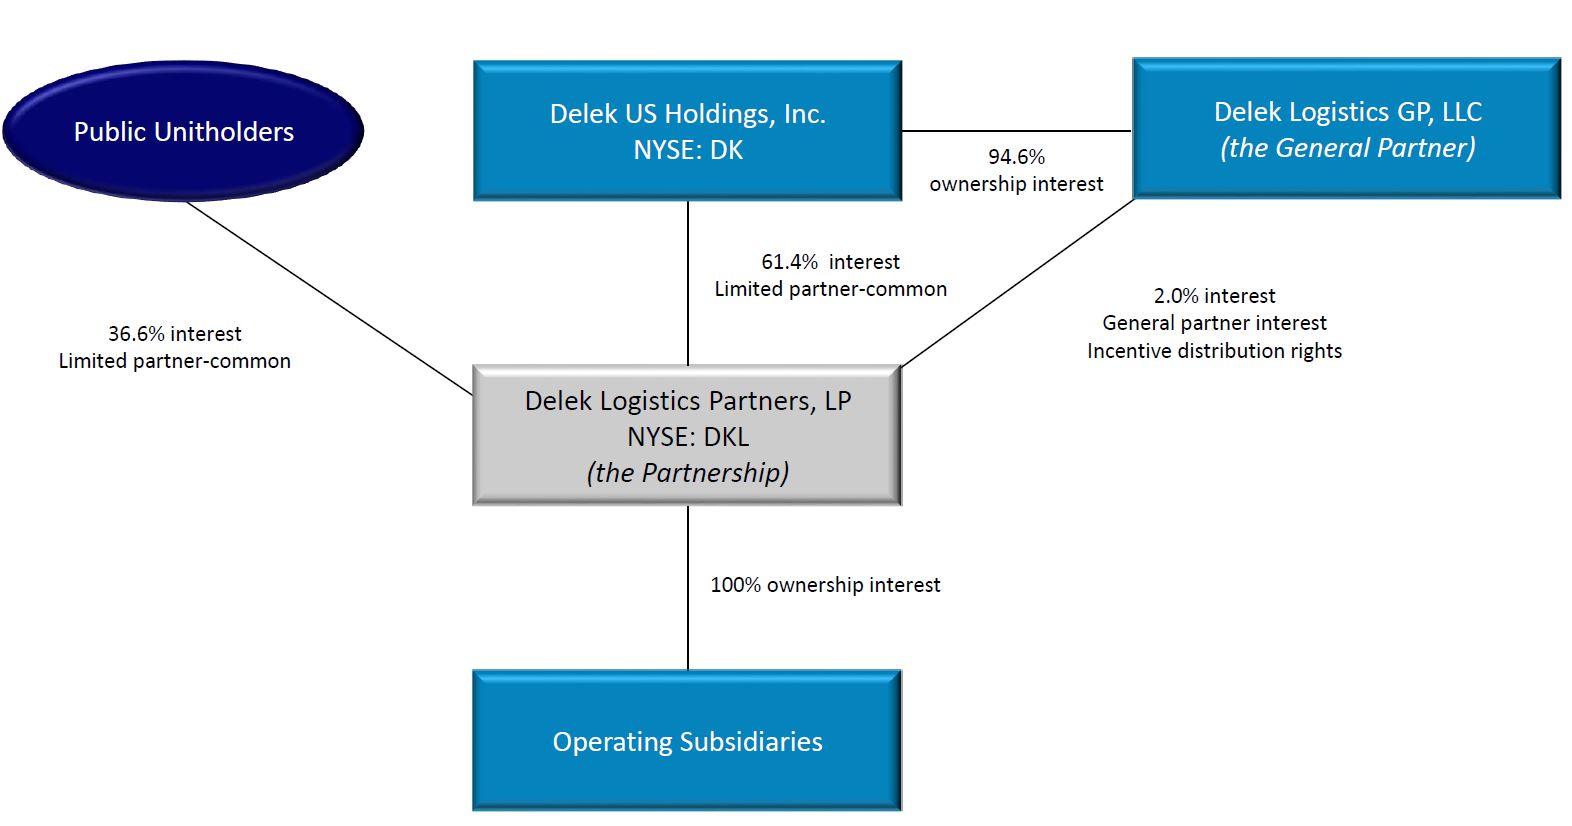
As of December 31, 2018,2019, we owned a 61.4% limited partner interest in Delek Logistics Partners, LP ("Delek Logistics"), a publicly-traded master limited partnership that we formed in April 2012, and a 94.6% interest in Delek Logistics GP, LLC ("Logistics GP"), which owns the entire 2.0% general partner interest in Delek Logistics. By virtue of the Delek/Alon Merger, we acquired an 81.6% limited partner interest in Alon USA Partners, LP (the "Alon Partnership"), then a publicly-traded limited partnership, as well as 100% interest in Alon USA Partners GP, LLC (the “Alon General Partner”). The Alon General Partner owns 100% of the general partner interest in the Alon Partnership, which is a non-economic interest. On February 7, 2018, we acquired the remaining outstanding units in the Alon Partnership whereby the owners of those units received a fixed exchange ratio of 0.49 shares of Delek Common Stock for each limited partner unit of the Alon Partnership, resulting in the issuance of approximately 5.6 million shares to the public unitholders of the Alon Partnership.
Statements in this Annual Report on Form 10-K, other than purely historical information, including statements regarding our plans, strategies, objectives, beliefs, expectations and intentions are forward-looking statements. These forward-looking statements generally are identified by the words "may," "will," "should," "could," "would," "predicts," "intends," "believes," "expects," "plans," "scheduled," "goal," "anticipates," "estimates" and similar expressions. Forward-looking statements are based on current expectations and assumptions that are subject to risks and uncertainties, including those discussed below and in Item 1A, Risk Factors, which may cause actual results to differ materially from the forward-looking statements. See also "Forward-Looking Statements" included in Item 7, Management's Discussion and Analysis of Financial Condition and Results of Operations, of this Annual Report on Form 10-K.
See the “Glossary of Terms” beginning on page 4 of this Annual Report on Form 10-K for definitions of certain business and industry terms used herein. Available Information
Our Internet website address is www.DelekUS.com. Information contained on our website is not part of this Annual Report on Form 10-K. Our annual reports, on Form 10-K, quarterly reports on Form 10-Q, current reports on Form 8-Kproxy and information statements, and any amendments to such reportsdocuments are filed electronically with or furnished to the Securities and Exchange Commission (“SEC”) and are available on our Internet website in the “Investor Relations” section, free of charge, as soon as reasonably practicable after we file or furnish such material to the SEC. We also post our Governance Guidelines, Code of Business Conduct & Ethics and the charters of our Board of Directors’ committees in the “Corporate Governance” section of our website, accessible by navigating to the “About Us” section on our Internet website. Our governanceWe will provide any of these documents are available in print to any stockholder that makes a written request to the Secretary, Delek US Holdings, Inc., 7102 Commerce Way, Brentwood, Tennessee 37027. Our reports, proxy and information statements, and other information regarding issuers are filed electronically with the SEC, and may be accessed at http://www.sec.gov.
Glossary of Terms
The following are definitions of certain industry terms used in this Annual Report on Form 10-K:
Alkylation Unit - A refinery unit utilizing an acid catalyst to combine smaller hydrocarbon molecules to form larger molecules in the gasoline boiling range to produce a high octane gasoline blendstock, which is referred to as alkylate.
Barrel - A unit of volumetric measurement equivalent to 42 U.S. gallons.
Biodiesel - A renewable fuel produced from vegetable oils or animal fats that can be blended with petroleum-derived diesel to produce biodiesel blends for use in diesel engines. Pure biodiesel is referred to as B100, whereas blends of biodiesel are referenced by how much biodiesel is in the blend (e.g., a B5 blend contains five volume percent biodiesel and 95 volume percent ULSD).
Blendstocks - Various products or intermediate streams that are combined with other components of similar type and distillation range to produce finished gasoline, diesel fuel or other refined products. Blendstocks may include natural gasoline, hydrotreated Fluid Catalytic Cracking Unit gasoline, alkylate, ethanol, reformate, butane, diesel, biodiesel, kerosene, light cycle oil or slurry, among others.
Bpd/bpd - Barrels per calendar day.
Brent Crude (Brent) - aA light, sweet crude oil, though not as light as WTI. Brent is the leading global price benchmark for Atlantic basin crude oils.oil.
CBOB - Motor gasoline blending components intended for blending with oxygenates, such as ethanol, to produce finished conventional motor gasoline.
CERCLA - Comprehensive Environmental Response, Compensation and Liability ActAct.
Colonial Pipeline - A pipeline owned and operated by the Colonial Pipeline Company that originates near Houston, Texas and terminates near New York, New York, connecting the U.S. refinery region of the Gulf Coast with customers throughout the southern and eastern United States.
Complexity Index - A measure of secondary conversion capacity of a refinery relative to its primary distillation capacity used to quantify and rank the complexity of various refineries. Generally, more complex refineries have a higher index number.
Contribution margin - Net revenues less costs of materials and other and operating expenses, excluding depreciation and amortization.
Crack spread - The crack spread is a measure of the difference between market prices for crude oil and refined products and is commonly used proxy within the industry to estimate or identify trends in refining margins.
Crude Distillation Capacity, Nameplate Capacity or Production Capacity - The maximum sustainable capacity for a refinery or process unit for a given feedstock quality and severity level, measured in barrels per day.
Cushing - Cushing, OklahomaOklahoma.
Delayed Coking Unit (Coker) - A refinery unit that processes ("cracks") heavy oils, such as the bottom cuts of crude oil from the crude or vacuum units, to produce blendstocks for light transportation fuels or feedstocks for other units and petroleum coke.
Direct operating expenses - Ooperatingperating expenses attributed to the respective segment.
EISA - Energy Independence and Security Act of 2007.
Enterprise Pipeline System - aA major product pipeline transport system that reaches from the Gulf Coast into the northeastern United States.
EPA - The Environmental Protection Agency.
Ethanol - An oxygenated blendstock that is blended with sub-grade (CBOB) or conventional gasoline to produce a finished gasoline.
E-10 - A 90% gasoline-10% ethanol blend.
E-15 - An 85% gasoline-15% ethanol blend.
E-85 - A blend of gasoline and 70%-85% ethanol.
Feedstocks - Crude oil and petroleum products used as inputs in refining processes.
FERC - The Federal Energy Regulatory Commission.
FIFO - First-in, first-out inventory accounting method.
Fluid Catalytic Cracking Unit or FCC Unit - A refinery unit that uses fluidized catalyst at high temperatures to crack large hydrocarbon molecules into smaller, higher-valued molecules (LPG, gasoline, LCO, etc.).
Feedstocks - Crude oil and petroleum products used as inputs in refining processes.
Gulf Coast 2-1-1 crack spread - A crack spread, expressed in dollars per barrel, reflecting the approximate gross margin resulting from processing, or "cracking", one barrel of crude oil into one-half barrel of gasoline and one-half barrel of high sulfur diesel, utilizing the market prices of LLS crude oil, Gulf Coast Pipeline conventional gasoline and Gulf Coast Pipeline No. 2 Heating Oil.
Gulf Coast 3-2-1 crack spread - A crack spread, expressed in dollars per barrel, reflecting the approximate gross margin resulting from processing, or "cracking", one barrel of crude oil into two-thirds barrel of gasoline and one-third barrel of ultra-low sulfur diesel, utilizing the market prices of WTI crude oil, Gulf Coast Pipeline conventional gasoline and Gulf Coast Pipeline ultra-low sulfur diesel.
Gulf Coast 5-3-2 crack spread - A crack spread, expressed in dollars per barrel, reflecting the approximate gross margin resulting from processing, or "cracking", one barrel of crude oil into three-fifths barrel of gasoline and two-fifths barrel of high sulfur diesel, utilizing the market prices of WTI crude oil, Gulf Coast Pipeline CBOB and Gulf Coast Pipeline No. 2 Heating Oil.
Gulf Coast Pipeline CBOB - A grade of gasoline blendstock that must be blended with 10% biofuels in order to be marketed as Regular Unleaded at retail locations.
Gulf Coast Pipeline No. 2 Heating Oil - A petroleum distillate that can be used as either a diesel fuel or a fuel oil. This is the standard by which other Gulf Coast distillate products (such as ultra-low sulfur diesel) are priced.
Gulf Coast Region - Commonly referred to as PADD III, includes the states of Texas, Arkansas, Louisiana, Mississippi, Alabama and New Mexico.
HLS - Heavy Louisiana Sweet crude oil; typical API gravity of 33° and sulfur content of 0.35%.
Hydrotreating Unit - A refinery unit that removes sulfur and other contaminants from hydrocarbons at high temperatures and moderate to high pressure in the presence of catalysts and hydrogen. When used to process fuels, this unit reduces the sulfur dioxide emissions from these fuels.
Isomerization Unit - A refinery unit altering the arrangement of a molecule in the presence of a catalyst and hydrogen to produce a more valuable molecule, typically used to increase the octane of gasoline blendstocks.
Jobbers - Retail stations owned by third parties that sell products purchased from or through us.
LPGLIFO - Liquefied petroleum gas.Last-in, first-out inventory accounting method.
Light/Medium/Heavy Crude Oil - Terms used to describe the relative densities of crude oil, normally represented by their API gravities. Light crude oils (those having relatively high API gravities) may be refined into a greater amountnumber of valuable products and are typically more expensive than a heavier crude oil.
LLS - Louisiana Light Sweet crude oil; typical API gravity of 38° and sulfur content of 0.34%.
LPG- Liquefied petroleum gas.
LSR - Light straight run naphtha.
LIFO - Last-in, first-out inventory accounting method.
Mid-Continent Region - Commonly referred to as PADD II, includes the states of North Dakota, South Dakota, Nebraska, Kansas, Oklahoma, Minnesota, Iowa, Missouri, Wisconsin, Illinois, Michigan, Indiana, Ohio, Kentucky and Tennessee.
Midland - Midland, TexasTexas.
MMBTU - One Million British Thermal Units.
MSCF/d - Abbreviation for a thousand standard cubic feet per day, a common measure for volume of natural gas.
Naphtha - A hydrocarbon fraction that is used as a gasoline blending component, a feedstock for reforming and as a petrochemical feedstock.
NGL- Natural gas liquids.
New York Mercantile Exchange (NYMEX) - A commodities futures exchange.
NGL- Natural gas liquids.
OSHA - theThe Occupational Safety and Health Administration.
Petroleum Administration for Defense District (PADD) - Any of five regions in the United States as set forth by the Department of Energy and used throughout the oil industry for geographic reference. Our refineries operate in PADD III, commonly referred to as the Gulf Coast Region.
Petroleum Coke - A coal-like substance produced as a byproduct during the Delayed Coking refining process.
Per barrel of sales - Ccalculatedalculated by dividing the applicable income statement line item (operating margin or operating expenses) by the total barrels sold during the period.
PPB - partsParts per billion.
PPM - partsParts per million.
RCRA - Resource Conservation and Recovery Act.
Refining margin, refined product margin - Refining margin or refined product margin is measured as the difference between net refining revenues and total refining cost of materials and other and is used as a metric to assess a refinery's product margins against market crack spread trends.
Reforming Unit - A refinery unit that uses high temperature, moderate pressure and catalyst to create petrochemical feedstocks, high octane gasoline blendstocks and hydrogen.
Renewable Fuels Standard 2 (RFS-2) - An EPA regulation promulgated pursuant to the EISA, which requires most refineries to blend increasing amounts of renewable fuels (including biodiesel and ethanol) with refined products.
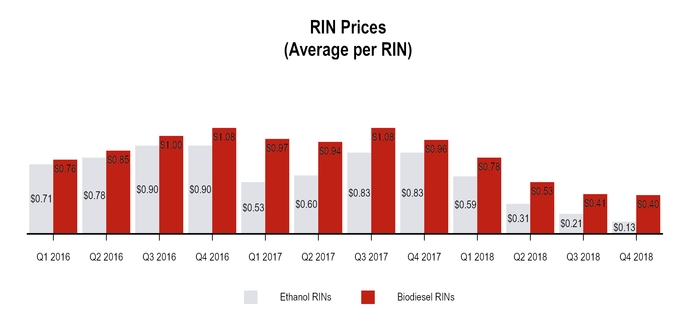
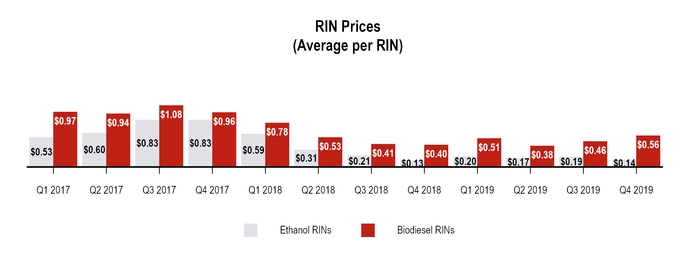
Renewable Identification Number (RIN) - aA renewable fuel credit used to satisfy requirements for blending renewable fuels under RFS-2.
Roofing flux - An asphalt-like product used to make roofing shingles for the housing industry.
Straight run - productProduct produced off of the crude or vacuum unit and not further processed.
Sweet/Sour crude oil - Terms used to describe the relative sulfur content of crude oil. Sweet crude oil is relatively low in sulfur content; sour crude oil is relatively high in sulfur content. Sweet crude oil requires less processing to remove sulfur and is typically more expensive than sour crude oil.
Throughput - The quantity of crude oil and feedstocks processed through a refinery or a refinery unit.
Turnaround - A periodic shutdown of refinery process units to perform routine maintenance to restore the operation of the equipment to its former level of performance. Turnaround activities normally include cleaning, inspection, refurbishment, and repair and replacement of equipment and piping. It is also common to use turnaround periods to change catalysts or to implement capital project improvements.
Ultra-Low Sulfur Diesel (ULSD) - Diesel fuel produced with a lower sulfur content (15 ppm) to reduce sulfur dioxide emissions. ULSD is the only diesel fuel that may be used for on-road and most other applications in the U.S.
UST - Underground storage tank.
Vacuum Distillation Unit - A refinery unit that distills heavy crude oils under deep vacuum to allow their separation without coking.
West Texas Intermediate Crude Oil (WTI) - A light, sweet crude oil characterized by an API gravity between 38° and 44° and a sulfur content of less than 0.4 wt% that is used as a benchmark for other crude oils.oil.
West Texas Sour Crude Oil (WTS) - A sour crude oil, characterized by an API gravity between 30° and 33° and a sulfur content of approximately 1.28 wt% that is used as a benchmark for other sour crudes.crude.
PART I
ITEMS 1 and 2. BUSINESS and PROPERTIES
Company Overview
We are an integrated downstream energy business focused on petroleum refining (the "Refining" segment), the transportation, storage and wholesale distribution of crude oil, intermediate and refined products (the "Logistics" segment) and convenience store retailing.retailing (the "Retail" segment). Delek US Holdings, Inc., a Delaware corporation formed in 2016 (a successor to the original Delek US Holdings, Inc. which was a Delaware corporation originally formed in 2001), operates through its consolidated subsidiaries, which include Delek US Energy, Inc. (and its subsidiaries) ("Delek Energy") and Alon USA Energy, Inc. ("Alon") as previously defined) (and its subsidiaries).
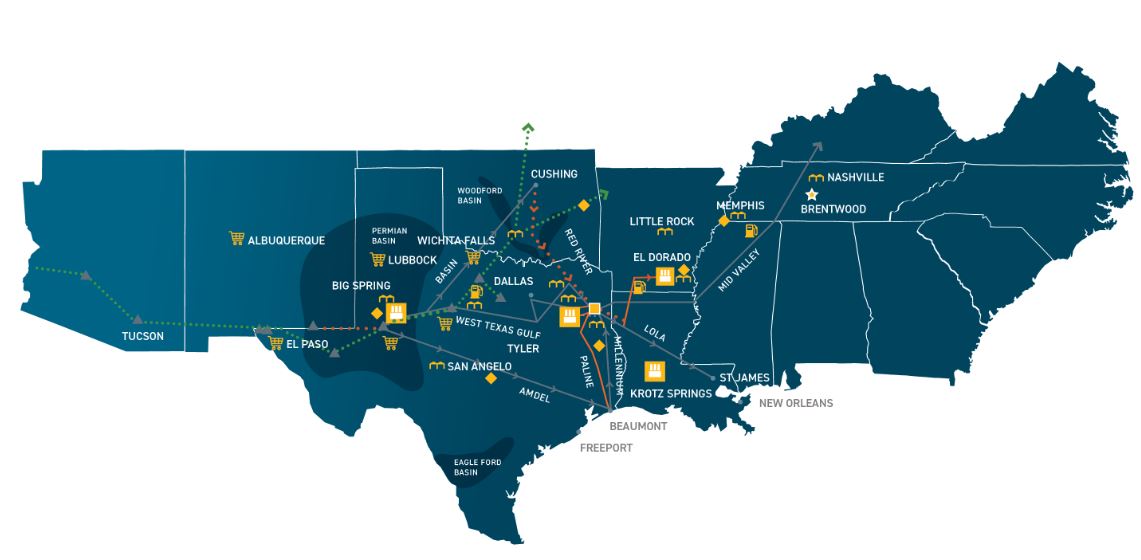
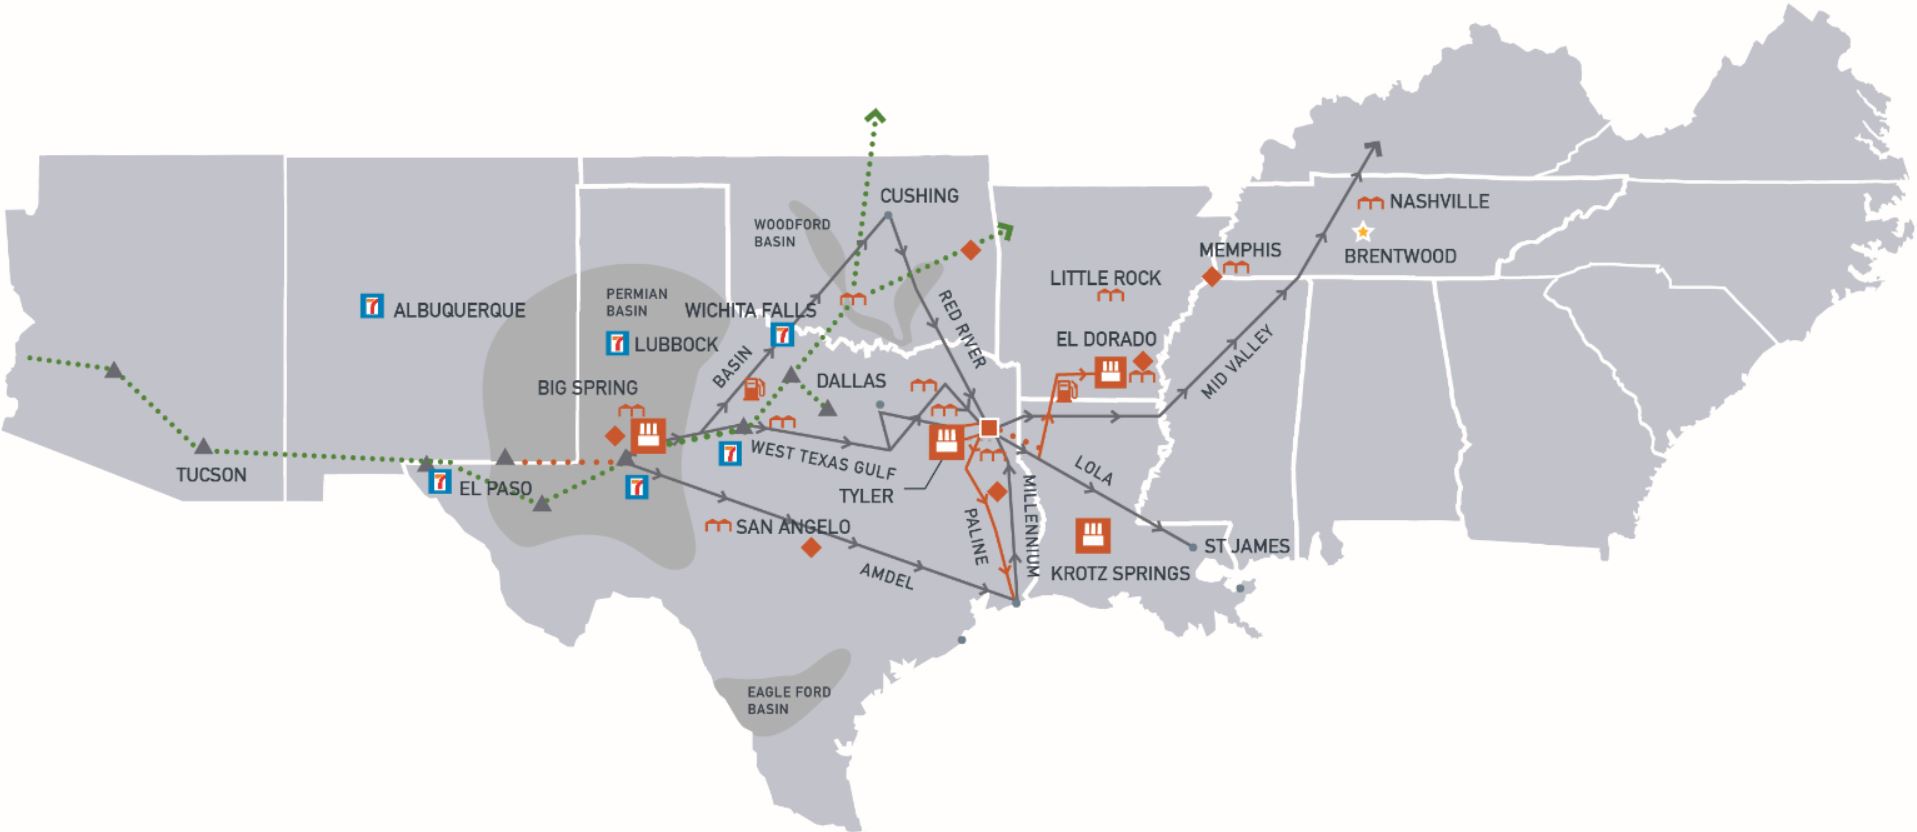
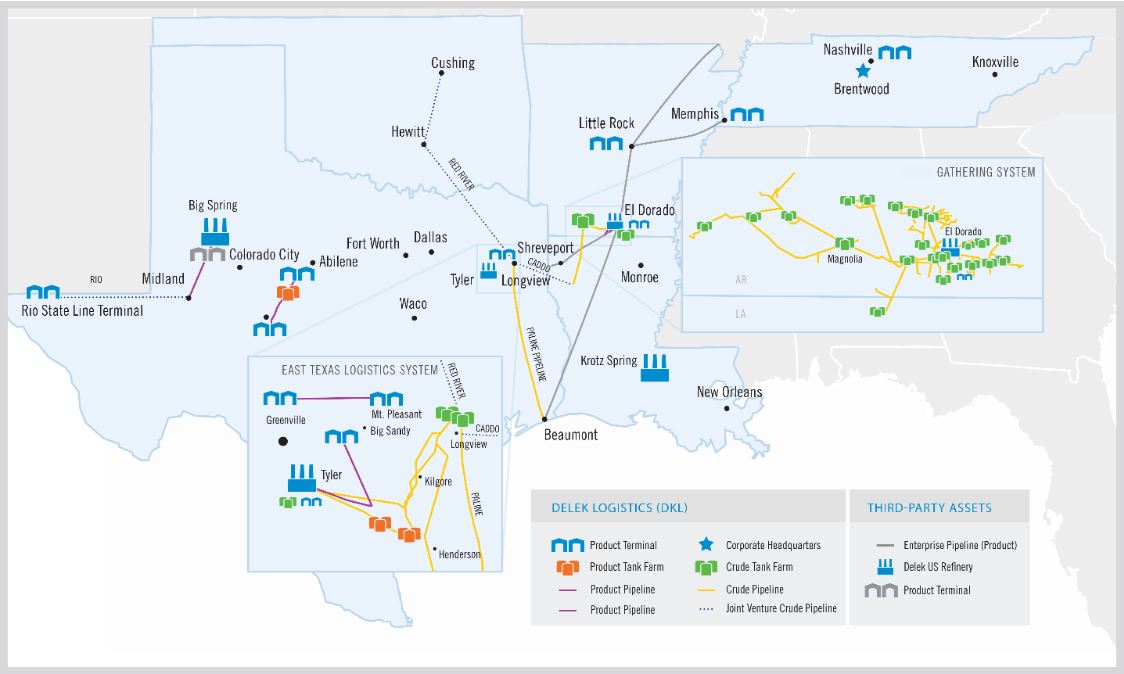
The following map outlines the geography of our integrated downstream energy structure as of December 31, 2019:
|
| | | | |
| Refining | | Logistics | | Retail |
| 302,000 barrels per day ("bpd") total capacity: | | 10 terminals | | 252 stores as of December 31, 2019 |
| Tyler, TX | | Approximately 1,640 miles of pipeline (1) | | Southwest U.S. locations |
| El Dorado, AR | | 11.4 million barrels of storage capacity | | Primary source of fuel is Big Spring, TX refinery |
| Big Spring, TX | | Crude oil pipeline joint ventures: | | |
| Krotz Springs, LA | | Red River Pipeline Company LLC ("Red River") | | |
| WTI primary crude oil supply - 260,000 bpd | | Caddo Pipeline LLC ("CP LLC") | | |
| Biodiesel facilities with 40 million gallons total annual capacity: | | Andeavor Logistics RIO Pipeline LLC ("Andeavor Logistics") | | |
| Crossett, AR | | West Texas wholesale: | | |
| Cleburne, TX | | Sale of refined products through terminals | | |
| New Albany, MS | | | | |
| |
(1) | Includes approximately 240 miles of leased capacity.
|
The refining segment processes crude oilprincipal activities of our Refining, Logistics and Retail segments are described below:
|
| |
| Refining Segment | |
| Inputs: | crude oil and other purchased feedstocks |
| Products: | transportation motor fuels, including various grades of gasoline, diesel fuel and aviation fuel, asphalt and other petroleum-based products |
| Nameplate Capacity (bpd): | 302,000 |
| Primary Refinery Operations (and bpd capacity): | |
| Tyler, Texas refinery (the "Tyler refinery") | 75,000 |
| El Dorado, Arkansas refinery (the "El Dorado refinery") | 80,000 |
| Big Spring, Texas refinery (the "Big Spring refinery") | 73,000 |
| Krotz Springs, Louisiana refinery (the "Krotz Springs refinery") | 74,000 |
| Other Refinery Operations/Assets: | |
| Renewables facilities | approximately 40 million gallons of annual biodiesel production capacity across three facilities located in Crossett, Arkansas, Cleburne, Texas and New Albany, Mississippi |
| Bakersfield, California refinery assets | non-operating |
| Primary Distribution Channels: | |
| Tyler refinery | majority of production is distributed through a refined products terminal located at the refinery that is owned and operated by our logistics segment to supply the local market in the east Texas area |
| El Dorado refinery | majority of production is shipped into the Enterprise Pipeline System and our logistics segment's El Dorado Pipeline system to supply a combination of pipeline bulk sales and wholesale rack sales at terminal locations along the pipeline in Louisiana, Arkansas, Tennessee, Missouri and Indiana |
| Big Spring refinery | signification portion of production is distributed across the refinery truck terminal into local markets and by pipeline through various terminals to supply Delek or Alon branded retail sites focused on Central and West Texas, Oklahoma, New Mexico and Arizona |
| Krotz Springs refinery | majority of production is distributed through pipeline and barge bulk sales and wholesale rack sales at terminals located on the Colonial Pipeline system in the southeastern United States |
|
| |
| Logistics Segment | |
| Primary Operations: | owns and operates crude oil and refined products logistics and marketing assets for the use in providing logistics and marketing services to customers; the primary customer is Delek and inter-company revenues and costs are eliminated in consolidation |
| Fee-Based Revenue Sources: | gathering, transporting and storing crude oil and for marketing, distributing, transporting and storing intermediate and refined products in select regions of the southeastern United States and West Texas for both our refining segment and third parties |
| Other Revenue Sources: | sales of wholesale products in the West Texas market |
| Owned or Leased Pipeline Capacities (in approximate miles): | |
| Crude oil transportation pipelines | 400 |
| Refined product pipelines | 450 |
Crude oil gathering system (1) | 700 |
| Other Logistics Assets/Facilities: | |
| Gathering system crude oil capacity, intermediate and refined products storage tanks | 9.9 million barrels of active shell capacity |
| Other storage tanks | various other storage tanks located at our terminals |
| Terminals | operates ten light product distribution terminals located in Tennessee, Texas, Oklahoma and Arkansas |
| Joint venture investments | strategic investments in pipelines/pipeline systems servicing various areas including the Permian Basin |
(1)In addition to the manufacture of transportation motor fuels, including various grades of gasoline, diesel fuel and aviation fuel, asphalt and other petroleum-based products that are distributed through owned and third-party product terminals. The refining segment had a combined nameplate capacity of 302,000 bpd, including the 75,000 bpd Tyler, Texas refinery (the "Tyler refinery"), the 80,000 bpd El Dorado, Arkansas refinery (the "El Dorado refinery"), the 73,000 bpd Big Spring, Texas refinery (the "Big Spring refinery"), and the 74,000 bpd Krotz Springs, Louisiana refinery (the "Krotz Springs refinery"). The Tyler refinery sells the majority of its production through a refined products terminal located at the refinery that is owned and operated by our logistics segment to supply the local market in the east Texas area. The El Dorado refinery sells a portion of its production through a refined products terminal located at the refinery, which is owned and operated by our logistics segment, but the majority of the refinery's production is shipped into the Enterprise Pipeline System and our logistics segment's El Dorado Pipeline system to supply a combination of pipeline bulk sales and wholesale rack sales at terminal locations along the pipeline in Louisiana, Arkansas, Tennessee, Missouri and Indiana. The Big Spring refinery sells a portion of its production across the refinery truck terminal into local markets and by pipeline through various terminals to supply Alon branded retail sites, including our retail segment convenience stores. Our distribution of transportation fuels produced at our Big Spring refinery is focused on central and west Texas, Oklahoma, New Mexico and Arizona. The Krotz Springs refinery sells the majority of its product through pipeline and barge bulk sales and wholesale rack sales at terminals located on the Colonial Pipeline system in the southeastern United States. The refining segment also owns and operates two biodiesel facilities involved in the production of biodiesel fuels and related activities located in Crossett, Arkansas and Cleburne, Texas.
Logistics
Our logistics segment gathers, transports and stores crude oil and markets, distributes, transports and stores refined products in select regions of the southeastern United States and west Texas for both our refining segment and third parties. The logistics segment's pipelines and transportation business owns or leases capacity on approximately 400 miles of crude oil transportation pipelines, approximately 450 miles of refined product pipelines, an approximately 600-mile700-mile crude oil gathering system, and associated crude oil storage tanks with an aggregate of approximately 9.6 million barrels of active shell capacity. Our logistics segment owns and operates nine light product terminals and markets light products using third-party terminals. Ourour logistics segment is also managing the construction of the 200-mileapproximately 250-mile gathering system in the Permian Basin connecting to our Big Spring, Texas terminal and will operate the gathering system as it is completed. As of December 31, 2018,2019, approximately 50177 miles of the gathering system were completed and operational. See further discussion in our 'Recent Strategic Developments' section below.
Retail
As
.
|
| |
| Retail Segment | |
| Number of Stores at December 31, 2019 (owned and leased): | 252 |
| Geographic Areas Served: | Central and West Texas and New Mexico |
| Branding: | Delek (under "DK") and Alon branding on certain locations which will continue to increase as we re-brand existing 7-Eleven locations (1) |
| Fuel Offerings at Retail Locations: | various grades of gasoline and diesel under the DK or Alon brand name, primarily sourced by our Big Spring refinery |
| Merchandise Offerings at Convenience Store Retail Locations: | food products, food service, tobacco products, non-alcoholic and alcoholic beverages, general merchandise as well as money orders |
(1)In November 2018, Delek's retail segment includes the operations of 279 owned and leased convenience store sites located primarily in central and west Texas and New Mexico. Our convenience stores typically offer various grades of gasoline and diesel under the Alon brand name and food products, food service, tobacco products, non-alcoholic and alcoholic beverages, general merchandise as well as money orders to the public, primarily under the 7-Eleven and Alon brand names pursuant towe terminated a license agreement with 7-Eleven, Inc. which gives us a perpetual license to use the 7-Eleven trademark, service name and trade name in west Texas and a majority of the counties in New Mexico in connection with our retail store operations. In November 2018, we terminated the license agreement with 7-Eleven, Inc. and the terms of such termination require the removal ofmust remove all 7-Eleven branding on a store-by-store basis by the earlier of December 31, 2021 or the date upon which our last 7-Eleven store is de-identified or closed.2021. Merchandise sales at our convenience store sites will continue to be sold under the 7-Eleven brand name until 7-Eleven branding is removed in accordance with the terms of such termination. See further discussion in our 'Recent Strategic Developments' section below.
The following map outlines the geography of our integrated downstream energy structure asat each convenience store site. As of December 31, 2018 :2019, we had removed the 7-Eleven brand name at 57 of our store locations.
Significant Acquisition and Dispositions
Historically, we have grown through acquisitions in all of our segments. Our business strategy has been focused on growing our integrated business model that allows us to participate in all phases of the downstream production process, from transporting crude oil to our refineries for processing into refined products to selling fuel to customers. This growth may come from acquisitions as well as investments in our existing businesses, as we continue to broaden our existing geographic presence and integrated business model. Our strategy also includes evaluating certain under-performing and non-core business lines and assets and divesting of those when doing so helps us achieve our strategic objectives.
Significant Acquisitions
Effective July 1, 2017, we acquired all of the outstanding stock of Alon (the "Delek/Alon Merger"). See further discussion in Note 3 of our consolidated financial statements included in Item 8, Financial Statements and Supplementary Data, of this Annual Report on Form 10-K. The Delek/Alon Merger continues to have a significant impact on our revenue and profitability as well as earnings per share, our net asset position, our purchasing position in the marketplace, our footprint in the refining industry, especially in the Gulf Coast Region and Permian Basin, and our ability to secure financing.
Below is a tabular summary of our significant acquisitions over the last five years, and 2019 to date:including the Delek/Alon Merger:
|
| | | | | | |
| Date | | Acquired Company/Assets | | Acquired From | | Approximate Purchase Price(1) |
| | | | | | | |
| | | | | | | |
February 2014 | | The Crossett Facility, a biodiesel plant in Crossett, Arkansas | | Pinnacle Biofuels, Inc. | | $11.1 million |
October 2014 | | The Greenville-Mount Pleasant Assets, a light products terminal in Mount Pleasant, Texas, a light products storage facility in Greenville, Texas and a 76-mile pipeline connecting the locations. | | An affiliate of Magellan Midstream Partners, L.P. | | $11.1 million |
December 2014 | | FTT, a transport company that primarily hauls crude oil and asphalt by truck, including 130 trucks and 210 trailers. | | Frank Thompson Transport, Inc. | | $12.0 million |
| May 2015 | | 33.7 million shares of common stock of Alon, representing approximatelyPurchased 48% of the outstanding common stock of Alon at the time of investment.Alon. | | Alon Israel Oil Company, Ltd. | | $575.8 million |
| July 2017 | | Purchased the remaining approximately 53% ownership in Alon that Delek did not already own, in an all-stock transaction. | | Shareholders of Alon USA Energy, Inc. | | $530.7 million |
September 2017 | | The Big Spring Pipeline, an approximate 40-mile pipeline and related ancillary assets, which originates in Big Spring, Texas and terminates in Midland, Texas. | | Plains Pipeline, L.P. | | $9.0 million |
| February 2018 | | Purchased the remaining 18.4% ownership in the Alon Partnership that Delek did not already own, in an all-equity transaction. | | Limited partnerLP unit holders of the Alon PartnershipUSA Partners, LP | | $184.7 million |
| May 2019 | | Acquired a 33% membership interest in Red River Pipeline Joint Venture. | | Plains Pipeline, L.P. | | $124.7 million |
| July 2019 | | Acquired a 15% membership interest in Wink to Webster ("WWP"), Joint Venture. | | Wink to Webster Pipeline LLC | | $145.6 million |
| |
(1) | Includes amounts paid through the date of this Annual Report on Form 10-K, excluding transaction costs. Excludes future commitments on the WWP Joint Venture, where total capital investments are expected to be $340 million to $380 million by the time construction of the pipeline is completed. |
(1)Excludes transaction costs
Significant Dispositions
2018 Disposal of California Discontinued Entities
During the third quarter 2017, we committed to a plan to sell certain assets associated with our Paramount and Long Beach, California refineries and Alon's California renewable fuels facility, (collectively, the "California Discontinued Entities"), which were originally acquired as part of the Delek/Alon Merger. As a result of this decision and commitment to a plan, and because it was made within three months of the Delek/Alon Merger, we met the requirements under ASC 205-20 and ASC 360 to report the results of the California Discontinued Entities as discontinued operations and to classify the California Discontinued Entities as a group of assets held for sale. Accordingly, the assets and related liabilities associated with these discontinued operations were classified as held for sale as of December 31, 2017.
On March 16, 2018, Delek sold to World Energy, LLC ("World Energy") (i) all of Delek’s membership interests in AltAirthe California renewable fuels facility ("AltAir") (ii) certain refining assets and other related assets located in Paramount, California and (iii) certain associated tank farm and pipeline assets and other related assets located in California. Upon final settlement, Delek expects to receive net cashThe sale involved initial proceeds of approximately $85.2 million, subject todue at closing, a post-closingsubsequent working capital settlement Delek’sas well as contingent proceeds for Delek's pro rata portion of the expectedany biodiesel tax credit for 2017 and certain customary adjustments. The sale resulted in a loss on sale of discontinued operations totaling approximately $41.4 million during the year ended December 31, 2018. Of the total expected proceeds, $70.4 million was received in March 2018 ($14.9 million of which were included in net cash flows from investingcredits ("BTC") relating to AltAir activities in discontinued operations), with2018 earned through the remainder expected to be collected upon final settlement. Insale date in connection with the re-enactment of the 2018 BTC that occurred in December 2019, and other final adjustments on retained contingent liabilities. After the resolution of contingencies in 2019, total proceeds were $93.3 million and we recognized a $33.3 million loss on the sale the remaining assets and liabilities associated with the sold operations that were not(pre-tax), $41.4 million (pre-tax) of which we recognized in 2018. See further discussion in Note 8 of our consolidated financial statements included in the assetsItem 8, Financial Statements and liabilities acquired/assumed by the buyer were reclassified into assets and liabilities held and used (relating to continuing operations) and are presented as such in our December 31, 2018 balance sheet.Supplementary Data, of this Annual Report on Form 10-K).
The transaction to dispose of certain assets and liabilities associated with our Long Beach, California refinery to Bridge Point Long Beach, LLC closed July 17, 2018 resulting in initial cash proceeds of approximately $14.5 million, net of expenses.expenses, and resulting in a gain on sale of discontinued operations of approximately $1.4 million during the third quarter of 2018. In 2019, we settled remaining contingencies resulting in a gain on sale of discontinued operations of approximately $1.9 million net of tax. See further discussion in Note 8 of our consolidated financial statements included in Item 8, Financial Statements and Supplementary Data, of this Annual Report on Form 10-K.
Business and Properties
Asphalt Terminals
May 2018 Sale of Asphalt Assets
On May 21, 2018, we sold certain assets and operations of four asphalt terminals (included in Delek's corporate/other segment), as well as an equity method investment in an additional asphalt terminal, to an affiliate of Andeavor. This transaction includes asphalt terminal assetslocated in Bakersfield, Mojave and Elk Grove, California and Phoenix, Arizona, as well as Delek’sour 50% equity interest in the Paramount-Nevada Asphalt Company, LLC joint venture that operatesoperated an asphalt terminal located in Fernley, Nevada. TheNevada, to an affiliate of Andeavor (prior to its acquisition by Marathon Petroleum). As a result of this transaction, resulted inwe received net proceeds of approximately $110.8 million, inclusive of the $75.0 million base proceeds as well as certain preliminary working capital adjustments. The assets associated with the owned terminals met the definition of held for sale pursuant to Accounting Standards Codification ("ASC") 360, Property, Plant and Equipment ("ASC 360") as of February 1, 2018, but did not meet the definition of discontinued operations pursuant to ASC 205-20, Presentation of Financial Statements - Discontinued Operations ("ASC 205-20") as the sale of these asphalt assets does not represent a strategic shift that will have a major effect on the entity's operations and financial results. Accordingly, depreciation ceased as of February 1, 2018, and the associated assets to be sold were reclassified to assets held for sale as of that date and were written down to the estimated fair value less costs to sell, resulting in an impairment loss on assets held for sale of $27.5 million for the year ended December 31, 2018. In connection with the completion of the sale transaction, we recognized a gain of approximately $13.3 million in results of continuing operations on the accompanying consolidated income statement. See further discussion in Note 8 of our consolidated financial statements included in Item 8, Financial Statements and Supplementary Data, of this Annual Report on Form 10-K.
Recent Strategic Developments
Effective July 1, 2017,Midstream Investments
Since the previous Delek US Holdings, Inc. ("Old Delek") merged with Alon USA Energy, Inc. ("Alon") resulting in a new post-combination consolidated registrant ("New Delek"), with Alon and Old Delek surviving as wholly-owned subsidiaries of New Delek (the "Delek/Alon Merger"). The Delek/Alon Merger, resulted in total stock consideration paid of approximately $509.0 million consisting of approximately 19.3 million incremental shares of common stock of New Delek ("New Delek Common Stock"). See further discussion in Note 3 of our consolidated financial statements included in Item 8, Financial Statements and Supplementary Data, of this Annual Report on Form 10-K. The Delek/Alon Merger continues to have a significant impact on our revenue and profitability as well as earnings per share, our net asset position, our purchasing position in the marketplace, our footprint in the refining industry, especially in the Gulf Coast Region/Permian Basin, and our ability to go to market and secure financing, and we have captured significant synergies and continue to realize synergies from our combined operations.
Since December 31, 2017, we have focused efforts on developing a 200-mile250-mile gathering system in the Permian Basin connectingwith existing connectivity to our Big Spring, Texas terminal.refinery as well as a third party pipeline system accessing Colorado City and future direct connectivity to Midland. This gathering system will provideprovides Delek with access to crude directly from wellheads which willwe expect to provide improvement in refining performance and cost structure while also providing a foundation for building a new midstream income source. As of December 31, 2018,2019, approximately 50177 miles of the gathering system were completed and operational.
Additionally, in September 2018,2019, we made strategic midstream investments in pipeline joint ventures. In May 2019, Delek announced plans forLogistics, acquired a joint venture33% membership interest in Red River Pipeline Company LLC (the "Red River Pipeline Joint Venture") with Energy Transfer, LP (NYSE: ET)Plains Pipeline, L.P. (“Energy Transfer”Plains”), Magellan Midstream Partners, L.P. (NYSE: MMP) (“Magellan”. The Red River Pipeline Joint Venture is proceeding with an expansion project to increase the capacity of the pipeline from 150,000 barrels per day to 235,000 barrels per day. Additionally, in July 2019, we acquired a 15% ownership interest in Wink to Webster Pipeline LLC (the "WWP Joint Venture"), and MPLX LP (NYSE: MPLX) (“MPLX”). The WWP Joint Venture intends to construct and operate a 600-mile common carrier pipeline to transport crude oil pipeline system from the Permian BasinWink, Texas to Webster, Texas along with certain pipelines from Webster, Texas to other destinations in the Texas Gulf Coast region. We continuearea that are expected to work with our prospective partnersspan approximately 650 miles at completion (expected to evaluate potential options for the development of the long-haul pipeline, including the possible combination of our project with another announced project.be completed by 2022).
Retail Optimization and Rebranding
In our retail segment, we are actively implementing strategic initiatives to reduce our reliance on external brands and to optimize the performance of our portfolio of stores. We are rollinghave rolled out our own branding initiatives which we will optimize in our current geographic areas as well as emerging markets. As a resultpart of these efforts, we elected to terminate the 7-Eleven licensing agreement (as discussed above) with the current intention to re-brand these stores with our own brand to capitalize on and build our brand recognition in the applicable regions. Additionally, we sold 15 under-performing or non-strategic store locations during the fourth quarter of 2018 and have plans to sell 28 additional30 stores during the first quarter of 2019. While the proceeds and resultant gains on sale of such related assets were not significant to our financial results, as of and for the year ended December 31, 2018, removing these stores from our portfolio enables us to better focus our retail management and operational efforts on individual store performance, strategic optimization and growth opportunities which may include not only rebranding but possibly also expansion initiatives.
Other Strategic Developments
In addition to the significant initiatives/developmentsthose described above, we entered into several other strategic transactions in order to improve our financial position or enhance shareholder value since December 31, 2017.value. See further discussion regarding our specific Strategic Goals and Recent Developments in the 'Executive Summary and Strategic Overview' section located in Item 7, Management's Discussion and Analysis, of this Annual Report on Form 10-K.
Information About Our Segments
Delek operates in three reportable operating segments: the refining segment, the logistics segment and the retail segment, which are discussed below. Additional segment and financial information is contained in our segment results included in Item 7, Management's Discussion and Analysis of Financial Condition and Results of Operations, and in Note 4, Segment Data, of our consolidated financial statements included in Item 8, Financial Statements and Supplementary Data, of this Annual Report on Form 10-K.
Overview
We own and operate four independent refineries located in Tyler, Texas, El Dorado, Arkansas, Big Spring, Texas and Krotz Springs, Louisiana, currently representing a combined 302,000 bpd of crude throughput capacity. Our refining system produces a variety of petroleum-based products used in transportation and industrial markets, which are sold to a wide range of customers located principally in inland, domestic markets and which comply with current Environmental Protection Agency ("EPA") clean fuels standards. All four of these refineries are located in the U.S. Gulf Coast ("Gulf Coast") Region (PADD III), which is one of the five Petroleum Administration for Defense District ("PADD") regional zones established by the U.S. Department of Energy where refined products are produced and sold. Refined product prices generally differ among each of the five PADDs.
Our refining segment also includes twothree biodiesel facilities we own and operate that are engaged in the production of biodiesel fuels and related activities, located in Crossett, Arkansas, Cleburne, Texas and Cleburne, Texas.New Albany, Mississippi.
Refining System Feedstock Purchases
We purchase more crude oil than our refineries process, generally through a combination of long-term acreage dedication agreements and short-term crude oil purchase agreements. This provides us with the opportunity to optimize the supply cost to the refineries while also maximizing the value of the volumes purchased directly from oil producers. The majority of the crude oil we purchase is sourced from inland domestic sources, primarily in areas of Texas, Arkansas, and Louisiana, although we can also purchase crude delivered via rail from other regions, including Oklahoma and Canada. Existing agreements with third-party pipelines and DKLDelek Logistics allow us to deliver approximately 205,000 barrels per day of crude oil from westWest Texas directly to our refineries. Typically, approximately 260,000 barrels per day of the crude oil we deliver to our four operating refineries is priced as a differential to the price of West Texas Intermediate (“WTI”) crude oil. In most cases, the differential is established in the month prior to the month in which the crude oil is delivered to the refineries for processing.
Refining System Production Slate
Our refining system processes a combination of light sweet and medium sour crude oils,oil, which, when refined, results in a product mix consisting principally of higher-value transportation fuels such as gasoline, distillate and jet fuel. A lesser portion of our overall production consists of residual products, including paving asphalt, roofing flux and other products with industrial applications.
Refined Product Sales and Distribution
Our refineries sell products on a wholesale and branded basis to inter-company and third-party customers located in Texas, Oklahoma, New Mexico, Arizona, Arkansas, Tennessee and the Ohio River Valley, including Gulf Coast markets and areas along the Enterprise Pipeline System and along the Colonial Pipeline System, through terminals and exchanges.
Refining Segment Seasonality
Demand for gasoline and asphalt products is generally higher during the summer months than during the winter months due to seasonal increases in motor vehicle traffic and road and home construction. Varying vapor pressure requirements between the summer and winter months also tighten summer gasoline supply. As a result, the operating results of our refining segment are generally lower for the first and fourth quarters of the calendar year.
Refining Segment Competition
The refining industry is highly competitive and includes fully integrated national and multinational oil companies engaged in many segments of the petroleum business, including exploration, production, transportation, refining, marketing and retail fuel and convenience stores, along with independent refiners. Our principal competitors are petroleum refiners in the Mid-Continent and Gulf Coast Regions, in addition to wholesale distributors operating in these markets.
The principal competitive factors affecting our refinery operations are crude oil and other feedstock costs, the differential in price between various grades of crude oil, refinery product margins, refinery reliability and efficiency, refinery product mix, and distribution and transportation costs.
Our Tyler refinery has a nameplate crude throughput capacity of 75,000 bpd. The refinery site consists of approximately 600 contiguous acres of land that we own in Tyler, Texas and adjacent areas, of which the main plant and associated tank farms adjacent to the refinery sit on approximately 100 acres.
The Tyler refinery is designed to process mainly light, sweet crude oil, which is typically a higher quality of crude than heavier sour crudes.crude. The Tyler refinery has access to crude oil pipeline systems that allow us access to east Texas, westWest Texas and, to a limited extent, Gulf of Mexico and foreign crude oils.oil. Most of the crude supplied to the Tyler refinery is delivered by third-party pipelines and through pipelines owned by our logistics segment.
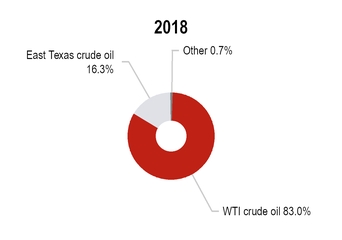
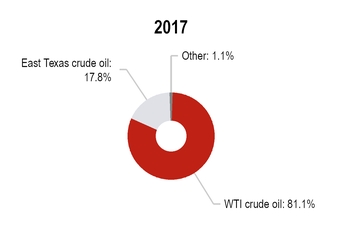
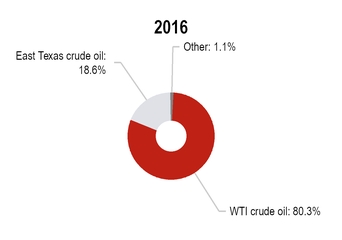
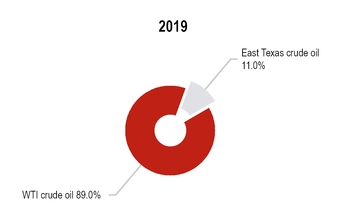
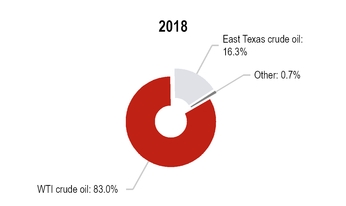
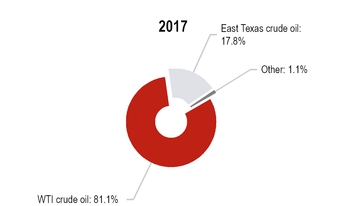
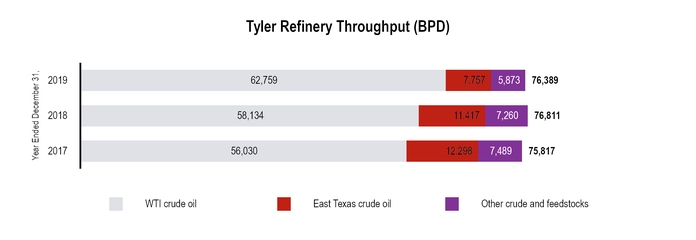
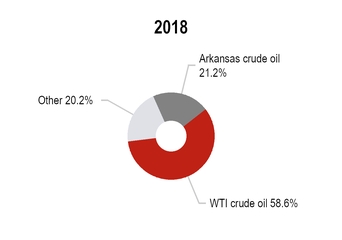
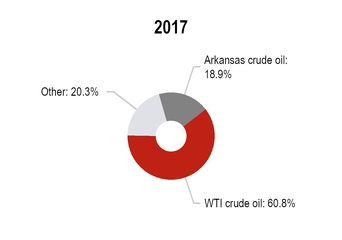
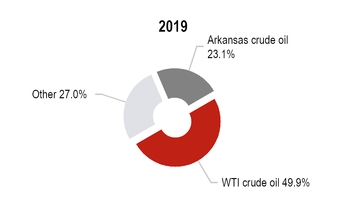
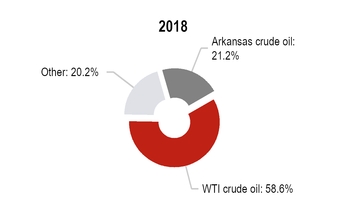
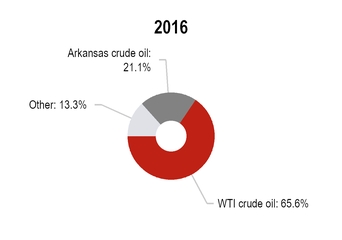
The charts below set forth information concerning crude oil received based on purchases at the Tyler refinery for the years ended December 31, 2019, 2018 2017 and 2016:2017:
Major processes at our Tyler refinery include crude distillation, vacuum distillation, naphtha reforming, naphtha and diesel hydrotreating, fluid catalytic cracking, alkylation, and delayed coking. The Tyler refinery has a Complexity Index of 8.7.
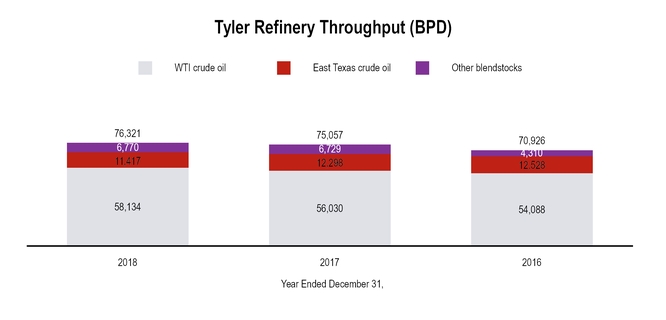
The chart below sets forth information concerning the throughput at the Tyler refinery:
The Tyler refinery primarily produces two grades of gasoline (E10 premium 93 and E10 regular 87), as well as aviation gasoline. Diesel and jet fuel products produced at the Tyler refinery include military specification jet fuel, commercial jet fuel and ultra-low sulfur diesel. The Tyler refinery offers both E-10 and biodiesel blended products. In addition to higher-value gasoline and distillate fuels, the Tyler refinery produces small quantities of propane, refinery grade propylene and butanes, petroleum coke, slurry oil, sulfur and other blendstocks. The Tyler refinery produces both low-sulfur gasoline and ultra-low sulfur diesel fuel, both on-road and off-road, pursuant to the current EPA clean fuels standards.
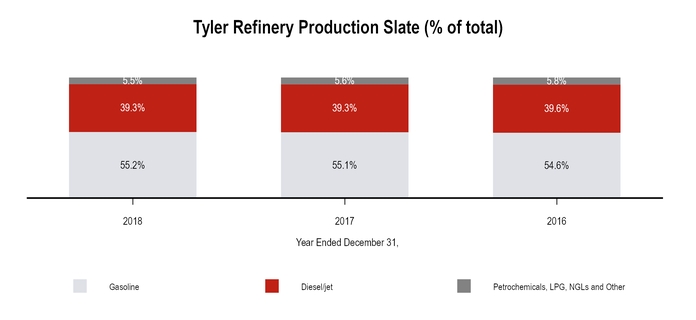
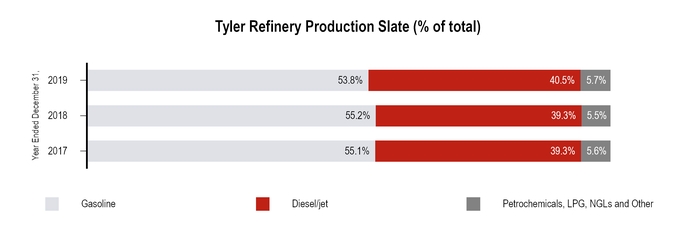
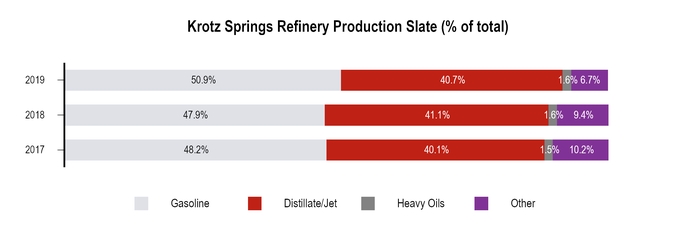
The chart below sets forth information concerning the Tyler refinery's production slate:
The Tyler refinery is currently the only major distributor of a full range of refined petroleum products within a radius of approximately 100 miles of its location. The vast majority of our transportation fuels and other products produced at the Tyler refinery are sold directly from a refined products terminal owned by Delek Logistics and located at the refinery. We believe this allows our customers to benefit from lower transportation costs compared to alternative sources. Our customers include major oil companies, independent refiners and marketers, jobbers, distributors in the U.S. and Mexico, utility and transportation companies, the U.S. government and independent retail fuel operators.
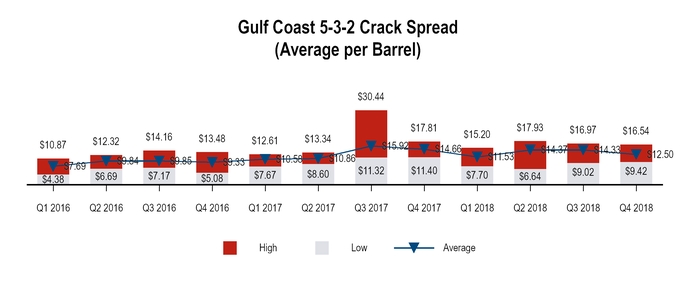
Taking into account the Tyler refinery's crude and refined product slate, as well as the refinery's location near the Gulf Coast Region, we apply the Gulf Coast 5-3-2 crack spread to calculate the approximate refined product margin resulting from processing one barrel of crude oil into three-fifths barrel of gasoline and two-fifths barrel of high sulfur diesel.
Our El Dorado refinery has a nameplate crude throughput capacity of 80,000 bpd. The refinery site consists of approximately 460 acres of land that we own in El Dorado, Arkansas, of which the main plant and associated tank farms adjacent to the refinery sit on approximately 335 acres. The El Dorado refinery is the largest refinery in Arkansas, and represents more than 90% of state-wide refining capacity.
The El Dorado refinery is designed mainly to process a wide variety of crude oil, ranging from light sweet to heavy sour. The refinery receives crude by several delivery points, including from local sources as well as other third-party pipelines that connect directly into Delek Logistics' El Dorado Pipeline System, which runs from Magnolia, Arkansas, to the El Dorado refinery (the "El Dorado Pipeline System"), and rail at third-party terminals.
We also purchase crude oil for the El Dorado refinery from inland sources in east and westWest Texas, as well as in south Arkansas and north Louisiana through a crude oil gathering system owned and operated by Delek Logistics (the "SALA Gathering System").
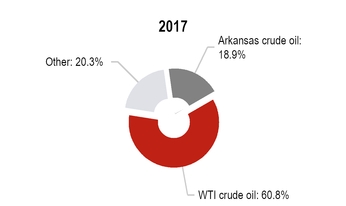
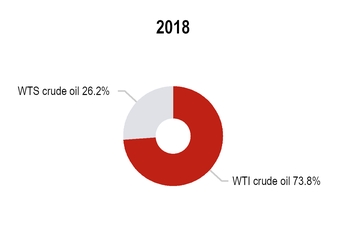
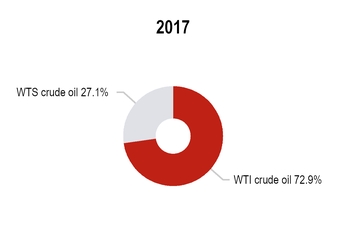
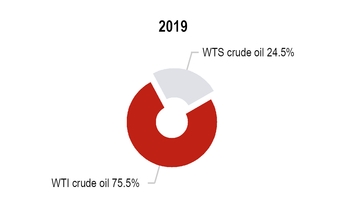
The charts below set forth information concerning crude oil received at the El Dorado refinery for the years ended December 31, 2019, 2018 2017 and 2016:2017:
Major processes at our El Dorado refinery include crude distillation, vacuum distillation, naphtha isomerization and reforming, naphtha and diesel hydrotreating, gas oil hydrotreating, fluid catalytic cracking and alkylation. The El Dorado refinery has a Complexity Index of 10.2.
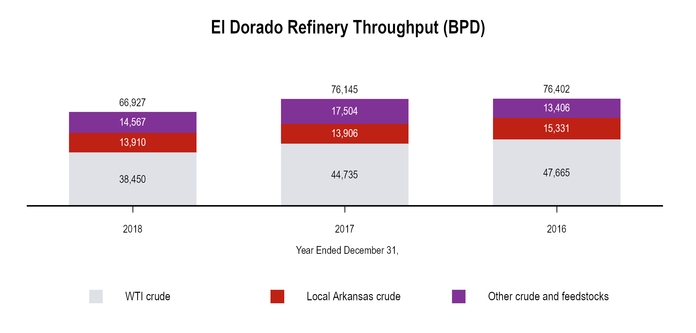
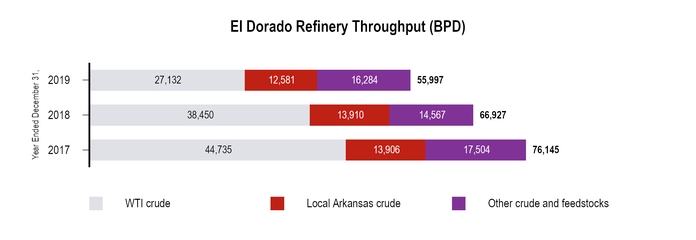
The chart below sets forth information concerning the throughput at the El Dorado refinery:
The El Dorado refinery produces a wide range of refined products, from multiple grades (E-10 premium 93 and E-10 regular 87) of gasoline and ultra-low sulfur diesel fuels, liquefied petroleum gas ("LPG"), refinery grade propylene and a variety of asphalt products, including paving grade asphalt and roofing flux. The El Dorado refinery offers both E-10 and biodiesel blended products. The El Dorado refinery produces both low-sulfur gasoline and ultra-low sulfur diesel fuel, both on-road and off-road, pursuant to the current EPA clean fuels standards.
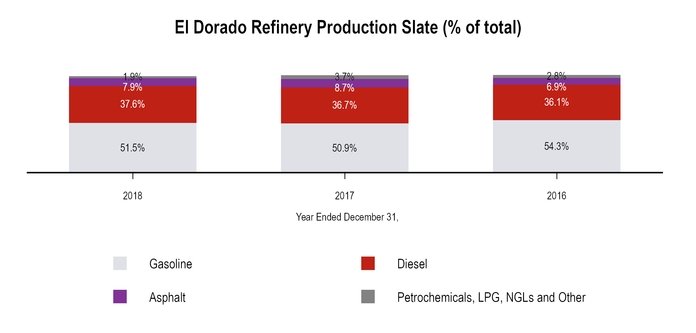
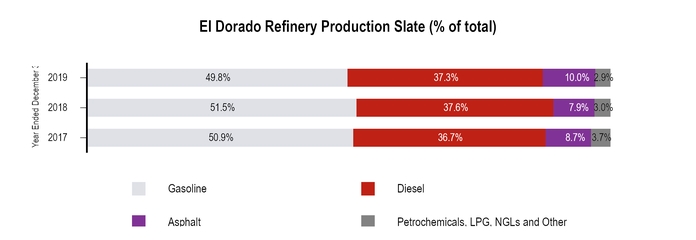
The chart below sets forth information concerning the El Dorado refinery's production slate:
Products manufactured at the El Dorado refinery are sold to wholesalers and retailers through spot sales, commercial sales contracts and exchange agreements in markets in Arkansas, Memphis, Tennessee and north into the Ohio River Valley region as well as in Mexico. The El Dorado refinery connection via the logistics segment to the Enterprise Pipeline System is a key means of product distribution for the refinery, because it provides access to third-party terminals in multiple Mid-Continent markets located adjacent to the system, including Shreveport, Louisiana, North Little Rock, Arkansas, Memphis, Tennessee, and Cape Girardeau, Missouri. The El Dorado refinery also supplies products to these markets through product exchanges on the Colonial Pipeline.
The crude oil and product slate flexibility of the El Dorado refinery allows us to take advantage of changes in the crude oil and product markets; therefore, we anticipate that the quantities and varieties of crude oil processed and products manufactured at the El Dorado refinery will continue to vary. While there is variability in the crude slate and the product output at the El Dorado refinery, we compare our per barrel refined product margin to the Gulf Coast 5-3-2 crack spread because we believe it to be the most closely aligned benchmark.
Our Big Spring refinery has a nameplate crude throughput capacity of 73,000 bpd and is located on 1,306 acres of land that we own in the Permian Basin in westWest Texas. The main plant and associated tank farms adjacent to the refinery sit on approximately 330 acres. It is the closest refinery to Midland, Texas ("Midland"), which allows us to efficiently source West Texas Sour ("WTS") and WTI Midland crudes.crude. Additionally, the Big Spring refinery has the ability to source locally-trucked crudescrude as well as crudescrude locally gathered from our own developing gathering system, which enables us to better control quality and eliminate the cost of transporting the crude supply from Midland.
The Big Spring refinery is designed to process a variety of crudes,crude, ranging from light sweet to medium sour, with the flexibility to convert its production to one or the other based on market pricing conditions. Our Big Spring refinery receives WTS and WTI crudescrude by truck from local gathering systems and regional common carrier pipelines. Other feedstocks, including butane, isobutane and asphalt blending components, are delivered by truck and railcar. A majority of the natural gas we use to run the refinery is delivered by a pipeline in which we own a majority interest.
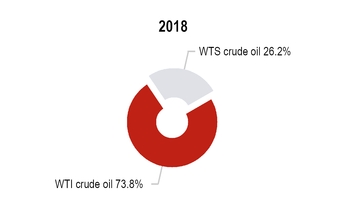
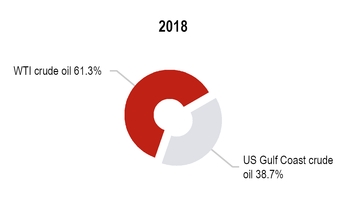
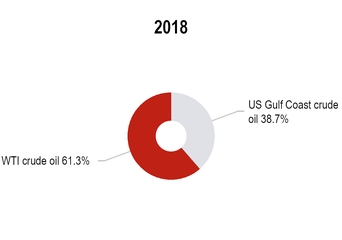
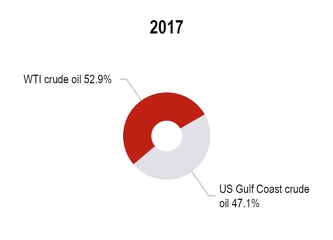
The charts below set forth information concerning crude oil received at the Big Spring refinery for the yearyears ended December 31, 2019, 2018 as compared toand the six months ended December 31, 2017 (the period since the Delek/Alon Merger):
Major processes at our Big Spring refinery include crude distillation, vacuum distillation, naphtha reforming, naphtha and diesel hydrotreating, aromatic extraction, propane deasphalting,de-asphalting, fluid catalytic cracking, and alkylation. The Big Spring refinery has a Complexity Index of 10.5.
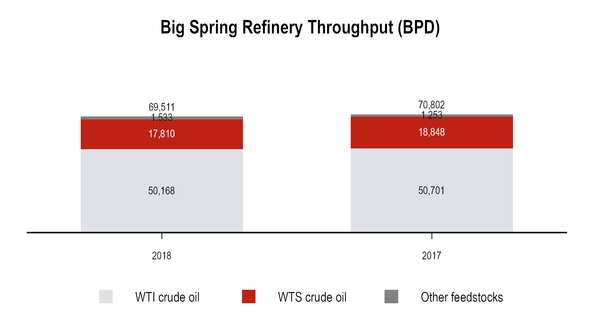
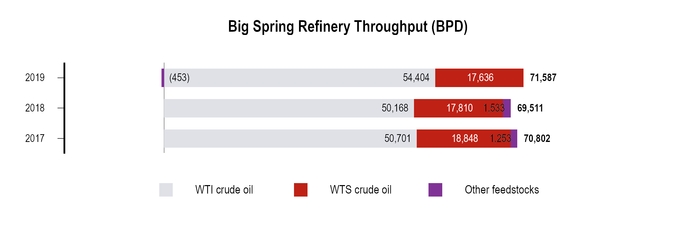
The chart below sets forth information concerning the throughput at the Big Spring refinery for the yearyears ended December 31, 2019, 2018 as compared toand the six months ended December 31, 2017 (the period since the Delek/Alon Merger):
The Big Spring refinery primarily produces two grades of gasoline (E10 premium 91 and E10 regular 87). Diesel and jet fuel products produced at the Big Spring refinery include military specification jet fuel, commercial jet fuel and ultra-low sulfur diesel. We also produce propane, propylene, certain aromatics, specialty solvents and benzene for use as petrochemical feedstocks, and asphalt along with other by-products such as sulfur and carbon black oil. The Big Spring refinery produces both low-sulfur gasoline and ultra-low sulfur diesel fuel, both on-road and off-road, pursuant to current EPA clean fuels standards, and certain boutique fuels supplied to the El Paso, Texas, and Phoenix, Arizona, markets.
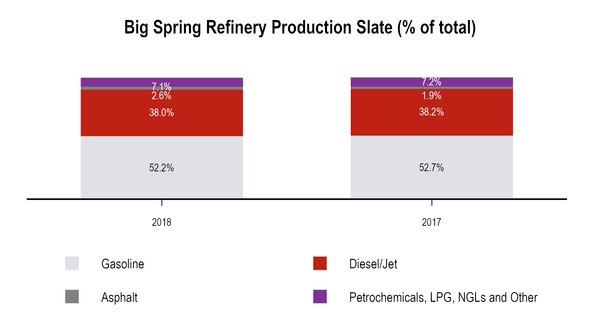
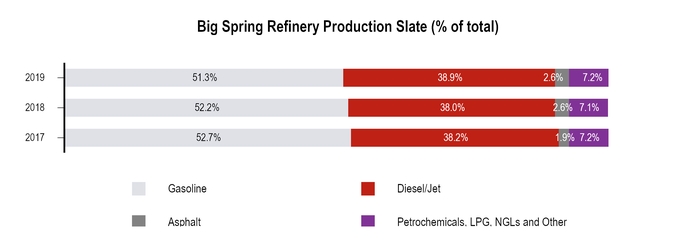
The chart below sets forth information concerning the Big Spring refinery's production slate for the year ended December 31, 2019, 2018 as compared toand the six months ended December 31, 2017 (the period since the Delek/Alon Merger):
Our Big Spring refinery sells products in both the wholesale rack and bulk markets. We sell motor fuels under both the Alon brand and on an unbranded basis through various terminals to supply numerous locations, including the convenience stores in Delek's retail segment. We sell transportation fuel production in excess of our branded and unbranded marketing needs through bulk sales and exchange channels entered into with various oil companies and trading companies which are transported through a product pipeline network or truck deliveries, depending on location, and through terminals located in Texas (Abilene, Wichita Falls, El Paso), Arizona (Tucson, Phoenix), and New Mexico (Albuquerque, Moriarty).
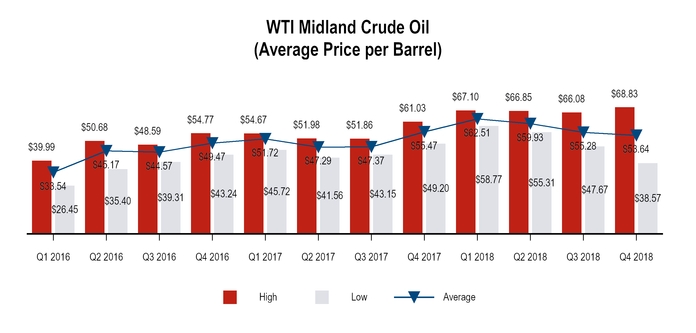
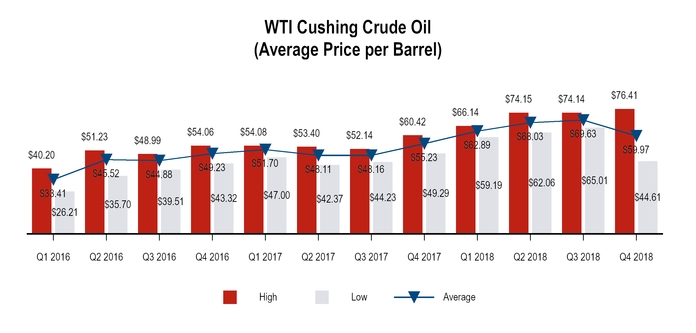
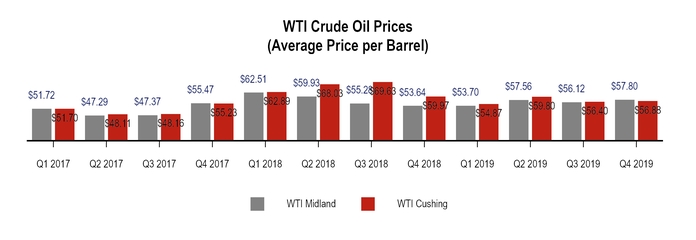
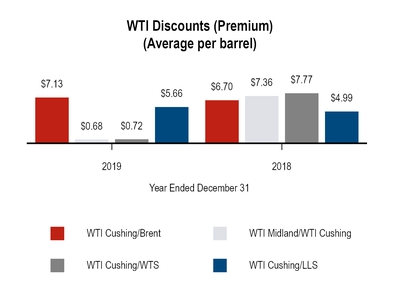
For our Big Spring refinery, we compare our per barrel refined product margin to the Gulf Coast 3-2-1 crack spread, which is the approximate refined product margin resulting from processing one barrel of crude oil into two-thirds barrel of gasoline and one-third barrel of ultra low sulfur diesel. Our Big Spring refinery is capable of processing substantial volumes of both sour crude oil or sweet crude oil, which we optimize based on price differentials. We measure the cost advantage of refining sour crude oil by calculating the difference between the price of WTI Cushing crude oil and the price of WTS, a medium, sour crude oil, taking into account differences in production yield. We refer to this differential as the WTI Cushing/WTS, or sweet/sour, spread. A widening of the sweet/sour spread can favorably influence the operating margin for our Big Spring refinery. The WTI Cushing less WTI Midland spread represents the differential between the average per barrel price of WTI Cushing crude oil and the average per barrel price of WTI Midland crude oil.
Our Krotz Springs refinery has a nameplate crude throughput capacity of 74,000 bpd, and is located on 381 acres of land that we own on the Atchafalaya River in central Louisiana. The main plant and associated tank farms adjacent to the refinery sit on approximately 250 acres. This location provides access to crude from barge, pipeline, railcar and truck. This combination of logistics assets provides us with diversified access to locally-sourced, domestic and foreign crudes.crude.
The Krotz Springs refinery is designed mainly to process light sweet crude oil. We are capable of receiving WTI Midland, Louisiana Light Sweet (“LLS”), Heavy Louisiana Sweet (“HLS”) and foreign crudescrude from the EMPCo “Northline System”Northline System (the "Northline System") and the Crimson Pipeline. The Northline System delivers LLS, HLS and foreign crude oilsoil from the St. James, Louisiana, crude oil terminalling complex. The Crimson Pipeline connects the Krotz Spring refinery to the Baton Rouge, Louisiana area. Additionally, the Krotz Springs refinery has the ability to receive crude oil sourced from westWest Texas. WTI crude oil is transported through the Energy Transfer Amdel pipeline to the Nederland terminal located near the Gulf Coast and from there is transported to the Krotz Springs refinery by barge via the Intracoastal Canal and the Atchafalaya River. The Energy Transfer Amdel pipeline agreement will terminate at the end of February 2020. The Krotz Springs refinery also receives approximately 20% of its crude by barge and truck from inland Louisiana and Mississippi and other locations.
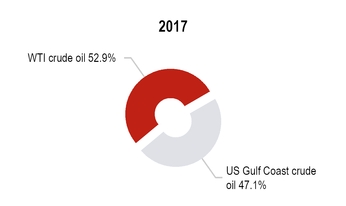
The charts below set forth information concerning crude oil received at the Krotz Springs refinery for the yearyears ended December 31, 2019, 2018 as compared toand the six months ended December 31, 2017 (the period since the Delek/Alon Merger):
Major processes at the Krotz Springs refinery include crude distillation, vacuum distillation, naphtha hydrotreating, naphtha isomerization and reforming, and gas oil/residual catalytic cracking to minimize low quality black oil production and to produce higher light product yields. The Krotz Springs refinery has a Complexity Index of 8.4.8.8. Additionally, in April 2019, the Krotz Springs refinery is constructingcompleted construction of an alkylation unit with anticipated 6,000-bpd capacity that is designed to combine isobutane and butylene into alkylate and enable multiple grades of gasoline to be produced, including premium octane gasoline. It is expected to be completed and placed in service during the second quarter of 2019.
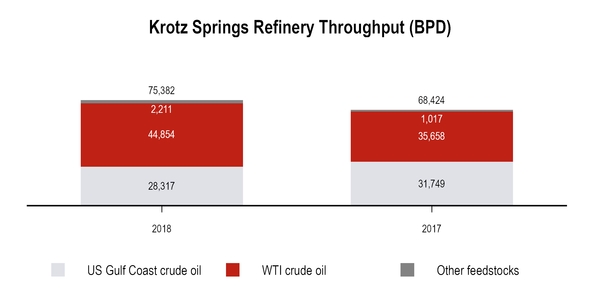
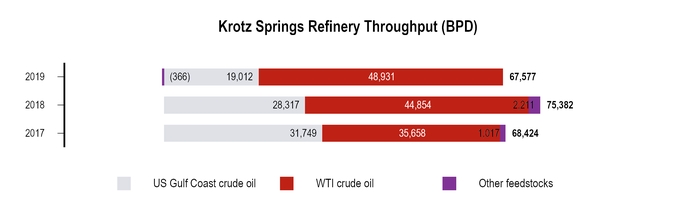
The chart below sets forth information concerning the throughput at the Krotz Springs refinery for the yearyears ended December 31, 2019, 2018 as compared toand the six months ended December 31, 2017 (the period since the Delek/Alon Merger):
The Krotz Springs refinery produces CBOB 84 grade gasoline as well as high sulfur diesel, light cycle oil, jet fuel, petrochemical feedstocks, LPG and slurry oil. The Krotz Springs refinery produces low-sulfur gasoline, pursuant to the current EPA clean fuels standards.
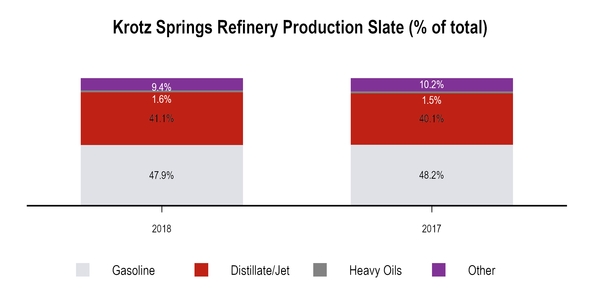
The chart below sets forth information concerning the Krotz Springs refinery's production slate for the yearyears ended December 31, 2019, 2018 as compared toand the six months ended December 31, 2017 (the period since the Delek/Alon Merger):
The Krotz Springs refinery markets transportation fuel substantially through bulk sales and exchange channels. These bulk sales and exchange arrangements are entered into with various oil companies and trading companies and are transported to markets on the Mississippi River and the Atchafalaya River as well as to the Colonial Pipeline.
For our Krotz Springs refinery, we compare our per barrel refined product margin to the Gulf Coast 2-1-1 high sulfur diesel crack spread, which is the approximate refined product margin calculated assuming that one barrel of LLS crude oil is converted into one-half barrel of Gulf Coast conventional gasoline and one-half barrel of Gulf Coast high sulfur diesel. The Krotz Springs refinery has the capability to process substantial volumes of sweet crude oilsoil to produce a high percentage of refined light products.
Overview
Our logistics segment consists of Delek Logistics, a publicly-traded master limited partnership, and its subsidiaries. Our consolidated financial statements include its consolidated financial results. As of December 31, 2018,2019, we owned a 61.4% limited partner interest in Delek Logistics, and a 94.6% interest in Delek Logistics GP, which owns both the entire 2.0% general partner interest in Delek Logistics and all of the incentive distribution rights. Delek Logistics is a variable interest entity as defined under United States generally accepted accounting principles ("GAAP"). Intercompany transactions with Delek Logistics and its subsidiaries are eliminated in our consolidated financial statements.
Our logistics segment generates revenue and contribution margin, which we define as net sales less cost of materials and other and operating expenses, by charging fees for gathering, transporting, offloading and storing crude oil; for storing intermediate products and feedstocks; for distributing, transporting and storing refined products; and for wholesale marketing. A substantial majority of the logistics segment's existing assets are both integral to and dependent on the successful operation of our refining segment's assets, as the logistics segment gathers, transports and stores crude oil, and markets, distributes, transports and stores refined products in select regions of the southeastern United States and east Texas primarily in support of the Tyler and El Dorado refineries, and in centralCentral and westWest Texas and New Mexico, primarily in support of the Big Spring refinery. In addition to intercompany services, the logistics segment also provides some crude oil, intermediate and refined products transportation services for, and terminalling and marketing services to, third parties primarily in Texas, New Mexico, Tennessee and Arkansas.
The following provides an overview of our logistics segment owns ten light product distribution terminals, one in each of Nashvilleassets and Memphis, Tennessee; Tyler, Big Sandy, San Angelo, Abileneoperations:
Business and Mount Pleasant ,Texas; Duncan, Oklahoma; and North Little Rock and El Dorado, Arkansas. Properties
The logistics segment network includes the following locations/properties:
|
| | |
| Terminal Locations | Pipelines (owned or leased) | Storage Tanks Locations |
| Tennessee | Louisiana and Arkansas | Tennessee |
| Nashville | SALA Gathering System | Nashville |
| Memphis | El Dorado Pipeline System | Memphis |
| Texas | Magnolia Pipeline System | Arkansas |
| Tyler | Tennessee | North Little Rock |
| Big Sandy | Memphis Pipeline | El Dorado |
| San Angelo | Texas | Texas |
| Abilene | Paline Pipeline System | Tyler |
| Mount Pleasant | McMurrey Pipeline System | Greenville |
| Arkansas | Nettleton Pipeline | Big Sandy |
| North Little Rock | Tyler-Big Sandy Product Pipeline | Big Spring |
| El Dorado | Greenville-Mount Pleasant Pipeline | San Angelo |
| Oklahoma | Big Spring Pipeline (and adjacent pipelines) | Abilene |
| Duncan | Talco Pipeline | Mount Pleasant |
| | |
All of the above propertiesproperties/assets are located on real property owned by Delek and its subsidiaries. The logistics segment also owns the El Dorado Pipeline System, the Magnolia Pipeline System and the SALA Gathering System, which is comprised of 600 miles of crude oil gathering lines, which are located in Louisiana and Arkansas. The logistics segment owns the McMurrey Pipeline System, the Nettleton Pipeline, the Tyler-Big Sandy Product Pipeline, the Paline Pipeline System, the Greenville-Mount Pleasant Pipeline, the Big Spring Pipeline, and certain crude and finished product pipelines at or adjacent to the Big Spring Refinery,Additionally, all of which are located in Texas. All of the pipeline systems set forth above run across fee owned land, leased land, easements and rights-of-way. The logistics segment also owns storage tanks in El Dorado and North Little Rock, Arkansas; Memphis and Nashville, Tennessee; and Tyler, Greenville, Big Sandy, Big Spring, San Angelo, Abilene and Mount Pleasant, Texas and a fleet of trucks and trailers used to transport crude oil, asphalt and other hydrocarbon products.
The following provides an overview of our logistics segment assets and operations:
Logistics Segment - Wholesale Marketing and Terminalling
The logistics segment's wholesale marketing and terminalling business provides wholesale marketing and terminalling services to the refining segment and to independent third parties from whom it receives fees for marketing, transporting, storing and terminalling refined products and to whom it wholesale markets refined products. It generates revenue by (i) providing marketing services for the refined products output of the Tyler and Big Spring refineries, (ii) engaging in wholesale activity at owned terminals in Abilene and San Angelo, Texas, as well as at terminals owned by third parties in Texas, whereby it purchases light products for sale and exchange to third parties, and (iii) providing terminalling services to independent third parties and the refining segment. Three terminals, located in El Dorado, Arkansas, Memphis, Tennessee and North Little Rock, Arkansas, throughput refined product produced at the El Dorado refinery. Three terminals, located in Tyler, Big Sandy and Mount Pleasant Texas, throughput refined product produced at the Tyler refinery.
Logistics Segment - Pipelines and Transportation
The logistics segment's pipelines and transportation business owns or leases capacity on approximately 400 miles of operable crude oil transportation pipelines, approximately 450 miles of refined product pipelines, an approximately 600-mile700-mile crude oil gathering system and associated crude oil storage tanks with an aggregate of approximately 9.69.9 million barrels of active shell capacity. These assets are primarily divided into the following operating systems:
the LionEl Dorado Pipeline System, which transports crude oil to, and refined products from the El Dorado refinery (the "Lion Pipeline System");System;
the SALA Gathering System, which gathers and transports crude oil production in southern Arkansas and northern Louisiana, primarily for the El Dorado refinery;
the Paline Pipeline System, which primarily transports crude oil from Longview, Texas to third-party facilities in Nederland, Texas;
the East Texas Crude Logistics System, which currently transports a portion of the crude oil delivered to the Tyler refinery (the "East Texas Crude Logistics System");
the Tyler-Big Sandy Product Pipeline, which is a pipeline between the Tyler refinery and the Big Sandy Terminal;
the Tyler Tanks;
the El Dorado Tanks;
the Greenville-Mount Pleasant Pipeline and Greenville Storage Facility;
the North Little Rock Tanks;
the El Dorado Rail Offloading Racks;
the Tyler Crude Tank;
the Talco Crude Pipeline;
the Memphis Pipeline;
the Big Spring Pipeline;
Big Spring Truck Unloading Station; and
Big Spring Tanks
In addition to these operating systems, the logistics segment owns or leases approximately 125123 tractors and 166174 trailers used to haul primarily crude oil and other products for related and third parties.
Joint Ventures
The logistics segment owns a portion of twothree joint ventures (accounted for as equity method investments) that have constructed logistics assets, which serve third parties and the refining segment. These assets include the following:
a 50% interest in an 80-mile crude oil pipeline with a capacity of 80,000 bpd that originates in Longview, Texas, with destinations in the Shreveport, Louisiana area (the "Caddo Pipeline") and;a 33% interest in a 109-mile crude oil pipeline with an initial capacity of 80,000 bpd, that originates in north Loving County, Texas near the Texas-New Mexico border and terminates in Midland, Texas ("the RIO Pipeline"). |
| | |
| JV Name | Ownership Interest | Description |
| Andeavor Logistics | 33% | Joint venture operates a 109-mile crude oil pipeline with a capacity of 120,000 bpd, that originates in north Loving County, Texas near the Texas-New Mexico border and terminates in Midland, Texas ("RIO Pipeline") |
| CP LLC | 50% | Joint venture operates an 80-mile crude oil pipeline with a capacity of 80,000 bpd that originates in Longview, Texas, with destinations in the Shreveport, Louisiana area ("Caddo Pipeline") |
| Red River | 33% | Joint venture operates a 16-inch crude oil pipeline between Cushing, Oklahoma and Longview, Texas with current capacity of 150,000 bpd and planned expansion to 235,000 bpd in 2020 ("Red River Pipeline") |
The RIO Pipeline project began operations in September 2016 and the Caddo Pipeline began operations in January 2017.
Logistics Segment Supply Agreement
A large portion ofDuring the year ended December 31, 2017, Delek Logistics purchased petroleum products for sale by the logistics segment in west Texas were purchased from Noble Petro, Inc. ("Noble Petro") during 2017. Under this arrangement, we had limited direct exposure to risks associated with fluctuating prices for these refined products duepursuant to the short periodterms of time between the purchase and resale ofa supply contract with Noble Petro. Delek Logistics then marketed these refined products.petroleum products to third parties. As of January 1, 2018, these regular sales of product by Noble
Petro to us concluded.concluded, as the supply contract expired in December 2017. Following expiration of the contract with Noble Petro, Delek Logistics is currently purchasingpurchased products from Delek and third parties at our Abilene and San Angelo terminals. To facilitate these purchases, Delek Logistics has constructed a pipeline into our Abilene Terminal to receive product from the pipeline owned by Holly Energy Partners, L.P. (NYSE: HEP) through which Delek shipsshipped product that iswas produced at the Big Spring refinery.Refinery. Delek Logistics is currently constructing a connection to a Magellan Midstream Partners, L.P. ("Magellan") pipeline that will allow Magellan to supply our Abilene and San Angelo terminals with product transported from the Gulf Coast. Delek Logistics also has active connections to the Magellan Orion Pipeline that enable us to ship product to our terminals and to acquire product from other shippers. Products purchased from Delek are generally based on daily market prices at the time of purchase limiting exposure to fluctuating prices. Products purchased from third parties are generally based on market prices at the time of purchase requiring price hedging risk management activities between the time of purchase and sale. Existing price risk hedging programs have been adjusted to correspond to the volume of product purchased from third parties.
Logistics Segment Operating Agreements With Delek
Delek Logistics has a number of long-term, fee-based commercial agreements with Delek and its subsidiaries that, among other things, establish fees for certain administrative and operational services provided by Delek and its subsidiaries to Delek Logistics, provide certain indemnification obligations and establish terms for fee-based commercial agreements for Delek Logistics to provide certain pipeline transportation, terminal throughput, finished product marketing and storage services to Delek. Most of these agreements have an initial term ranging from five to ten years, which may be extended for various renewal terms at the option of Delek. The current terms for agreements effective in November 2012 extend through March 2024. In the case of the marketing agreement with Delek, the initial term has been extended through 2026. Each of these agreements requires Delek or a Delek subsidiary to pay for certain minimum volume commitments or certain minimum storage capacities. Delek Logistics also entered into an agreement to manage the construction of the 200-mile250-mile gathering system in the Permian Basin connecting to our Big Spring, Texas terminal and to operate the gathering system as it is completed. That agreement extends through December 2022.
Logistics Segment Customers
In addition to certain of our subsidiaries, our logistics segment has various types of customers, including major oil companies, independent refiners and marketers, jobbers, distributors, utility and transportation companies and independent retail fuel operators.
Logistics Segment Seasonality
The volume and throughput of crude oil and refined products transported through our pipelines and sold through our terminals and to third parties is directly affected by the level of supply and demand for all of such products in the markets served directly or indirectly by our assets. Supply and demand for such products fluctuates during the calendar year. Demand for gasoline, for example, is generally higher during the summer months than during the winter months due to seasonal increases in motor vehicle traffic. Varying vapor pressure requirements between the summer and winter months also tighten summer gasoline supply. In addition, our refining segment often performs planned maintenance during the winter, when demand for their products is lower. Accordingly, these factors can diminish the demand for crude oil or finished products by our customers, and therefore limit our volumes or throughput during these periods, and we expect that our operating results will generally be lower during the first and fourth quarters of the calendar year.
Logistics Segment Competition
Our logistics segment faces competition for the transportation of crude oil from other pipeline owners whose pipelines (i) may have a location advantage over our pipelines, (ii) may be able to transport more desirable crude oil to third parties, (iii) may be able to transport crude oil or finished product at a lower tariff, or (iv) may be able to store more crude oil or finished product. In addition, the wholesale marketing and terminalling business in general is also very competitive. Our owned refined product terminals, as well as the other third-party terminals we use to sell refined products, compete with other independent terminal operators as well as integrated oil companies on the basis of terminal location, price, versatility and services provided. The costs associated with transporting products from a loading terminal to end users limit the geographic size of the market that can be competitively served by any terminal.
Logistics Segment Activity
The following table summarizes our activity in the wholesale marketing and terminalling portion of our logistics segment:
|
| | | | | | | | | |
| | | Year Ended December 31, |
| | | 2018 |
| 2017 |
| 2016 |
| Operating Information: | | | | | | |
| West Texas marketing throughputs (average bpd) | | 13,323 |
| | 13,817 |
| | 13,257 |
|
Terminalling throughputs (average bpd) (1) | | 155,193 |
| | 124,488 |
| | 122,350 |
|
| East Texas marketing throughputs (average bpd) | | 77,487 |
| | 73,655 |
| | 68,131 |
|
|
| | | | | | | | | |
| Wholesale Marketing and Terminalling |
| | | Year Ended December 31, |
| | | 2019 |
| 2018 |
| 2017 |
| Operating Information: Throughputs (average bpd) | | | | | | |
| West Texas marketing | | 11,075 |
| | 13,323 |
| | 13,817 |
|
Terminalling(1) | | 160,075 |
| | 161,284 |
| | 124,488 |
|
| East Texas marketing | | 74,206 |
| | 77,487 |
| | 73,655 |
|
Big Spring marketing(2) | | 82,695 |
| | 81,117 |
| | — |
|
| |
(1) | Consists of terminalling throughputs at our Tyler, Big Sandy and Mount Pleasant, Texas, El Dorado and North Little Rock, Arkansas and Memphis and Nashville, Tennessee terminals. |
| |
(2) | Throughputs for the year ended December 31, 2018 are for the 306 days we marketed certain finished products produced at or sold from the Big Spring Refinery following the execution of the Big Spring Marketing Agreement, effective March 1, 2018. |
The following table summarizes our most significant activity in the pipelines and transportation portion of our logistics segment:
| | | Pipelines and Transportation | | Pipelines and Transportation |
| | | Year Ended December 31, | | Year Ended December 31, |
| | | 2018 | | 2017 | | 2016 | | 2019 | | 2018 | | 2017 |
| Throughputs (average bpd) | | | | | | | |
| Operating Information: Throughputs (average bpd) | | | | | | | |
| Lion Pipeline System: | | | | | | | | | | | | |
| Crude pipelines (non-gathered) | | 51,992 |
| | 59,362 |
| | 56,555 |
| | 42,918 |
| | 51,992 |
| | 59,362 |
|
| Refined products pipelines to Enterprise Systems | | 45,728 |
| | 51,927 |
| | 52,071 |
| |
| Refined products pipelines to Enterprise Pipelines Systems | | | 37,716 |
| | 45,728 |
| | 51,927 |
|
| SALA Gathering System | | 16,571 |
| | 15,871 | | 17,756 |
| | 21,869 |
| | 16,571 | | 15,871 |
|
| East Texas Crude Logistics System | | 15,696 |
| | 15,780 |
| | 12,735 |
| | 19,927 |
| | 15,696 |
| | 15,780 |
|
Overview
Prior to November 2016, we owned and/or operated convenience store sites primarily under the Mapco brand (inclusive of the related legal entities, the "Retail Entities", as further defined in Note 2 of our consolidated financial statements included in Item 8, Financial Statements and Supplementary Data, of this Annual Report on Form 10-K). The Retail Entities were sold in November 2016. The operating results for the Retail Entities, in all periods up until and including the date of the sale, were reclassified to discontinued operations and are no longer reported as part of Delek's retail segment.
As a result of the Delek/Alon Merger on July 1, 2017 (and subsequent retail activities), Delek's retail segment includes the operations of 279 owned and leased convenience store sites located primarily in central and westas described below:
|
| | | |
| Retail Segment Properties/Locations |
Number of Merchandise and Fuel Stores (owned and leased) (1) | 252 |
|
Number of Leased Locations (1) | 118 |
|
Minimum Lease Payments Due 2020 (in millions) (1) |
| $6.9 |
|
| Fuel Offerings | Various grades of gasoline and diesel under the DK or Alon brand names |
| Merchandise Offerings | Food service, tobacco products, non-alcoholic and alcoholic beverages, general merchandise as well as money orders to the public |
Convenience Store Branding (2) | Delek (under "DK") and Alon branding on certain locations which will continue to increase as we re-brand existing 7-Eleven locations |
| Locations | Central and West Texas and New Mexico |
(1) As of which 134 locations are leased, with approximately $5.7 million of minimum lease payments due duringDecember 31, 2019. Our convenience stores typically offer various grades of gasoline and diesel under the Alon brand name and food products, food service, tobacco products, non-alcoholic and alcoholic beverages, general merchandise as well as money orders to the public, primarily under the 7-Eleven and Alon brands.
| |
(2) | In November 2018, we terminated a license agreement with 7-Eleven, Inc. and must remove all 7-Eleven branding on a store-by-store basis by December 31, 2021. See further discussion below. |
We believe that we have established strong market presence in the major retail markets in which we operate. Our retail strategy employs localized marketing tactics that account for the unique demographic characteristics of each region that we serve. We introduce customized product offerings and promotional strategies to address the unique tastes and preferences of our customers on a market-by-market basis. Furthermore, we are actively implementing strategic initiatives to optimize our performance across our retail stores and reduce our reliance on external brand recognition, while developing and optimizing the use of our own brands and evaluating retail opportunities in current and emerging geographic and strategic markets. As a result of these efforts, in November 2018, we terminated thea license agreement with 7-Eleven, Inc. and the terms of such termination require the removal of all 7-Eleven branding on a store-by-store basis by the earlier of December 31, 2021 or the date upon which our last 7-Eleven store is de-identified or closed.2021. Merchandise sales at our convenience store sites will continue to be sold under the 7-Eleven brand name until 7-Eleven branding is removed in accordance withpursuant to the termstermination. As of such termination.December 31, 2019, we had removed the 7-Eleven brand name at 57 of our store locations. Additionally, we closed 15 under-performing or non-strategic store locations during the fourth quarter of 2018 and have plans to close 28 additional30 stores during the first quarter of 2019.
Fuel Operations
For the year ended December 31, 20182019 fuel revenues were 62.4%62.6% of total net sales for our retail segment.
The following table highlights certain information regarding our fuel operations for the yearyears ended December 31, 2019, 2018 as compared toand the six months ended December 31, 2017 (the period since the Delek/Alon Merger):
| | | Fuel Operations | | Fuel Operations |
| | | Year ended December 31, 2018 | | Period from July 1, 2017 through December 31, 2017 | | Year Ended December 31, 2019 | | Year ended December 31, 2018 | | Period from July 1, 2017 through December 31, 2017 |
| Number of fuel stores (end of period) | | 271 |
| | 293 |
| | 247 |
| | 271 |
| | 293 |
|
| Average number of fuel stores (during period) | | 271 |
| | 293 |
| | 259 |
| | 271 |
| | 293 |
|
| Total fuel revenue (in thousands) | | $ | 571,596 |
| | $ | 251,781 |
| | $ | 524,866 |
| | $ | 571,596 |
| | $ | 251,781 |
|
| Retail fuel revenues (thousands of gallons) | | 217,118 |
| | 107,599 |
| | 214,094 |
| | 217,118 |
| | 107,599 |
|
| Average retail gallons per store (based on average number of stores) (thousands of gallons) | | 801 |
| | 367 |
| | 827 |
| | 801 |
| | 367 |
|
| Retail fuel margin ($ per gallon) | | $ | 0.24 |
| | $ | 0.19 |
| | $ | 0.28 |
| | $ | 0.24 |
| | $ | 0.19 |
|
Substantially all of the motor fuel sold through our retail segment is supplied by our Big Spring refinery, which is transferred to the retail segment at prices substantially determined by reference to recent published commodity pricing information.
Merchandise Operations
For the year ended December 31, 2018,2019, our merchandise revenues were 37.0%37.4% of total net sales for our retail segment.
The following table highlights certain information regarding our merchandise operations for the yearyears ended December 31, 2019, 2018 as compared toand the six months ended December 31, 2017 (the period since the Delek/Alon Merger):
| | | Merchandise Operations | | Merchandise Operations |
| | | Year ended December 31, 2018 | | Period from July 1, 2017 through December 31, 2017 | | Year Ended December 31, 2019 | | Year ended December 31, 2018 | | Period from July 1, 2017 through December 31, 2017 |
| Number of merchandise stores (end of period) | | 279 |
| | 302 |
| | 252 |
| | 279 |
| | 302 |
|
| Average number of merchandise stores (during period) | | 295 |
| | 302 |
| | 266 |
| | 295 |
| | 302 |
|
| Merchandise margin percentage | | 30.9 | % | | 30.7 | % | | 30.8 | % | | 30.9 | % | | 30.7 | % |
| Total merchandise revenues (in thousands) | | $ | 339,000 |
| | $ | 174,600 |
| | $ | 313,100 |
| | $ | 339,000 |
| | $ | 174,600 |
|
| Average merchandise sales per store (in thousands) | | $ | 275 |
| | $ | 578 |
| | $ | 1,177 |
| | $ | 1,149 |
| | $ | 578 |
|
Retail Segment Seasonality
Demand for gasoline and convenience merchandise is generally higher during the summer months than during the winter months due to seasonal increases in motor vehicle traffic. As a result, the operating results of our retail segment are generally lower for the first quarter of the calendar year. Weather conditions in our operating area also have a significant effect on our operating results. Customers are more likely to purchase higher profit margin items at our retail fuel and convenience stores, such as fast foods, fountain drinks and other beverages, and moreas well as additional gasoline, during the spring and summer months.
Retail Segment Competition
The retail fuel and convenience store business is highly competitive. We compete on a store-by-store basis with other independent convenience store chains, independent owner-operators, major petroleum companies, supermarkets, drug stores, discount stores, club stores, mass merchants, fast food operations and other retail outlets. Major competitive factors affecting us include location, ease of access, pricing, timely deliveries, product and service selections, customer service, fuel brands, store appearance, cleanliness and safety. We believe we are able to compete effectively in the markets in which we operate because our geographic concentration allows us to improve buying power with our vendors. Our retail segment strategy centers on operating a high concentration of sites in a similar geographic region to promote operational efficiencies. Finally, we believe that leveraging the integration between our retail and refining segments provides advantageous fuel supply to our retail stores. Our major retail competitors include Chevron, Murphy USA, Sunoco LP (Stripes® brand), Alimentation Couche-Tard Inc. (Circle K® brand and CST brand), AndeavorMarathon Petroleum and various other independent operators.
Information Technology
In 2018,2019, we continued our efforts to improve several areas of information technology ("IT"), including infrastructure, security and enterprise software systems. Much of the effort was dictated by merger and acquisition activity that took place beginning in late 2016, with the divestiture of the Retail Entities' assets, and again in mid-year 2017 with the Delek/Alon Merger. With the divestiture of the Retail Entities (as previously defined, including MAPCO), opportunities were takenactivity. We also worked to reduce network complexity and to eliminate and consolidate obsolete software applications. Following the Delek/Alon Merger, we also undertook the opportunity to consolidate the financial systems into SAP. During 2018, we implemented Rightangle Logistics Software Application, which is a comprehensive commodities trading and risk management solution, to better manage our reporting and management of risk around commodity purchases and sales. We expect to undertake additional work in 2019 to continuously improve our business continuity to reduce both RecoverRecovery Time Objectives (RTO) and Recovery Point Objectives (RPO).Objectives. In addition, significant steps will bewere made to consolidate and move toward a consistent, scalable IT reference architecture. This,We have continued to enhance our cybersecurity posture within both of our IT and Operating Technology and Control Network environments. These efforts, coupled with actions to reduce the number and complexity of systems, willare expected to enable growth, maximize our IT investment, and improve our overall security posture. We will continueAlso in 2019, we began development of an Enterprise Information Management and Master Data Governance vision, intended to increase the efficiency, security, and effectiveness of our data use as a company. Additionally, we continued to leverage our retail experience to improve data assurance and to continue to comply in all respectscompliance with Payment Card Industry (PCI) requirements, while adding new functionality to support enhanced store performance reporting and use of advanced retail technologies. We are continuously evaluatingFinally, we continued to consistently evaluate and improvingimprove the confidentiality, integrity, and availability of our information and technology assets.”
Governmental Regulation and Environmental Matters
Rate Regulation of Petroleum Pipelines
The rates and terms and conditions of service on certain of our pipelines are subject to regulation by the Federal Energy Regulatory Commission ("FERC"), under the Interstate Commerce Act (the “ICA”), and by the state regulatory commissions in the states in which we transport crude oil, intermediate and refined products. Certain of our pipeline systems are subject to such regulation and have filed tariffs with the appropriate authorities. We also comply with the reporting requirements for these pipelines. OtherSome of our pipelinesother pipeline systems have received a waiver from application of the FERC's tariff requirements, but comply with other applicable regulatory requirements.requirements
The FERC regulates interstate transportation under the ICA, the Energy Policy Act of 1992 and the rules and regulations promulgated under those laws. The ICA, and its implementing regulations, require that tariff rates for interstate service on oil pipelines, including pipelines that transport crude oil, intermediate and refined products in interstate commerce (collectively referred to as “petroleum pipelines”), be just and reasonable and non-discriminatory, and that such rates and terms and conditions of service be filed with the FERC. Under the ICA, shippers may challenge new or existing rates or services. The FERC is authorized to suspend the effectiveness of a challenged rate for up to seven months, though rates are typically not suspended for the maximum allowable period. Our tariff rates are typically contractually subject to increase or decrease on July 1 of each year, by the amount of any change in various inflation-based indices, including the FERC oil pipeline index, the consumer price index and the producer price index; provided, however, that in no event will the fees be adjusted below the amount initially set forth in the applicable agreement.
Environmental Health and Safety
We are subject to extensive federal, state and local environmental and safety laws and regulations enforced by various agencies, including the EPA, the United States Department of Transportation (the "DOT"), and the Occupational Safety and Health Administration ("OSHA"), as well as numerous state, regional and local environmental, safety and pipeline agencies.
These laws and regulations govern the discharge of materials into the environment, waste management practices, pollution prevention measures and the composition of the fuels we produce, as well as the safe operation of our plants, pipelines and trucks, and the safety of our workers and the public. Numerous permits or other authorizations are required under these laws and regulations for the operation of our refineries, renewable fuel facilities, terminals, pipelines, underground storage tanks ("USTs"), trucks, rail cars and related operations, and may be subject to revocation, modification and renewal.
These laws and permits raise potential exposure to future claims and lawsuits involving environmental and safety matters, which could include soil and water contamination, air pollution, personal injury and property damage allegedly caused by substances which we manufactured, handled, used, released or disposed of, transported, or that relate to pre-existing conditions for which we have assumed responsibility. We believe that our current operations are in substantial compliance with existing environmental and safety requirements. However, there have been and will continue to be ongoing discussions about environmental and safety matters between us and federal and state authorities, including notices of violations, citations and other enforcement actions, some of which have resulted, or may result in, changes to operating procedures and in capital expenditures. While it is often difficult to quantify future environmental or safety related expenditures, we anticipate that continuing capital investments and changes in operating procedures will be required for the foreseeable future to comply with existing and new requirements, as well as evolving interpretations and more strict enforcement of existing laws and regulations. We anticipate that compliance with environmental, health and safety regulations will require us to spend approximately $93.2$64.5 million and $41.9$52.4 million in capital costs in 20192020 and 2020,2021, respectively. These estimates do not include amounts related to capital investments that management has deemed to be strategic investments. These amounts could materially change as a result of governmental and regulatory actions.
We generate wastes that may be subject to the Resource Conservation and Recovery Act ("RCRA") and comparable state and local requirements. The EPA and various state agencies have limited the approved methods of managing, transporting, recycling and disposal of hazardous and certain non-hazardous wastes. Our refineries are large quantity generators of hazardous waste and require hazardous waste
permits issued by the EPA or state agencies. Our other facilities, such as terminals and renewable fuel plants, generate lesser quantities of hazardous wastes.
The Comprehensive Environmental Response, Compensation and Liability Act, also known as Superfund, imposes liability, without regard to fault or the legality of the original conduct, on certain classes of persons who are considered to be responsible for the release of a hazardous substance into the environment. Analogous state laws impose similar responsibilities and liabilities on responsible parties. In the course of our ordinary operations, our various businesses generate waste, some of which falls within the statutory definition of a hazardous substance and some of which may have been disposed of at sites that may require future cleanup under Superfund. At this time, our El Dorado refinery has been named as a minor potentially responsible party at one Superfund site, for which we believe future costs will not be material.
As of December 31, 2018,2019, we have recorded an environmental liability of approximately $143.3$146.1 million, primarily related to the estimated probable costs of remediating, or otherwise addressing, certain environmental issues of a non-capital nature at the Tyler, El Dorado, Big Spring, Krotz Springs and California refineries as well as terminals, some of which we no longer own. This liability includes estimated costs for ongoing investigation and remediation efforts, which were already being performed by the former operators of the refineries and terminals prior to our acquisition of those facilities, for known contamination of soil and groundwater, as well as estimated costs for additional issues which have been identified subsequent to the acquisitions.
Approximately $3.8$8.2 million of the total liability is expected to be expended over the next 12 months, with most of the balance expended by 2032, although some costs may extend up to 30 years. In the future, we could be required to extend the expected remediation period or undertake additional investigations of our refineries, pipelines and terminal facilities, which could result in additional remediation liabilities.
Our operations are subject to certain requirements of the Federal Clean Air Act (“CAA”), as well as related state and local laws and regulations governing air emission. Certain CAA regulatory programs applicable to our refineries, terminals and other operations require capital expenditures for the installation of air pollution control devices, operational procedures to minimize emissions and monitoring and reporting of emissions. Our Big Spring refinery has been negotiating an agreement with EPA for over 10 years under EPA’s National Petroleum Refinery Initiative regarding alleged historical violations of the CAA. A Consent Decree resolving these alleged historical violations for the Big Spring refineryconsent decree was lodged withentered in the United States District Court for the Northern District of Texas onin June 6, 2017 and we expect that Consent Decree2019 resolving alleged historical violations of the CAA at our Big Spring refinery. In addition to become final in early 2019 when amendments to the Consent Decree are lodged. An amendment to the Consent Decree was agreed upon by the Delek and the EPA/DOJ in late 2018 and was executed by Delek. However, the amendment to the Consent Decree was not executed by the EPA/United States Departmenta civil penalty of Justice (the "DOJ") and lodged due to the government shutdown. Once the amendment is lodged and entered, the Consent Decree will require payment of a $0.5 million civil penalty andthat we paid in June 2019, the Company will be required to expend capital expenditures for pollution control equipment that may be significant over the next 10 years.
In 2015, EPA finalized reductions in the National Ambient Air Quality Standard (NAAQS)("NAAQS") for ozone, from 75 ppb to 70 ppb. Our Tyler refinery is located in an area that had the potential to be reclassified as non-attainment with the new standard. However, this area has not been classified as non-attainment with the new standard, so we do not anticipate an impact at our Tyler refinery. If air quality near our facilities worsens in the future, it is possible that these area(s) could be reclassified as non-attainment for the new ozone standard which could require Delek to install additional air pollution control equipment for ozone forming emissions in the future. Additionally, the new standard could change the formulation of gasoline we make for use in some areas. We do not believe such capital expenditures, or the changes in our operation, will result in a material adverse effect on our business, financial condition or results of operations.
On December 1, 2015, the EPA published final rules under the Risk and Technology Review provisions of the Clean Air Act to further regulate refinery air emissions through additional New Source Performance Standard ("NSPS") and Maximum Achievable Control Technology requirements (the “Refinery Sector Rules”). Subsequent amendments and clarifications to the rule have been published by the EPA. Refineries have up to three years from the effective date of the final rule to come into compliance with certain requirements of the rule, while other aspects of the rule require compliance to be achieved at a sooneran earlier date. Additionally, the new rules will require changes to the way we operate, shut-down, start-up and maintain some process units. These rules also require that we monitor property line benzene concentrations beginning in January 2018 and provide the results to the EPA quarterly, which will make the results available to the public beginning in 2019. Even though the concentrations are not expected to exceed regulatory or health basedhealth-based standards, the availability of such data may increase the likelihood of lawsuits against our refineries by the local public or organized public interest groups. Delek hasWe have obtained 1-year compliance extensions to certain provisions of the rule. These rules require capital expenditures for additional controls at our refineries’ relief systems, flares, tanks, other sources at our refineries, and a coker located at the Tyler refinery. Most of the capital cost needed to comply with these new rules has already been spent. We do not anticipate that any additional capital costs or future operating costs will be material, and do not believe compliance will affect our production capacities or have a material adverse effect upon our business, financial condition or results of operations. We expect to meet all deadlines (as extended) for compliance.
On December 11, 2018,19, 2019, the EPA finalized the renewable fuel obligation for 20192020 at 10.97%11.56%. The required ethanol volumes exceed the 10% ethanol “blendwall”, requiring increased usage of higher ethanol blends such as E15 and E85. We are unable to blend sufficient quantities of ethanol and biodiesel to meet our renewable fuel obligations and have to purchase RINs, primarily for our El Dorado and Krotz Springs refineries. In early 2017, the EPA granted hardship waiver petitions for the El Dorado and Krotz Springs refineries exempting them from the requirements of the renewable fuel standard ("RIN Waivers") for the 2016 calendar year. In March 2018, the El Dorado and Krotz Springs refineries both received approval from the EPA for a small refinery exemption from the requirements of the renewable fuel standardRIN Waivers for the 2017 calendar year. We have also applied for waivers fromDuring the 2017 requirements forfirst quarter 2019, the Tyler and Big Spring refineries as well asreceived RIN Waivers for the 2017 calendar year, which had an immaterial impact on our results of operations. During the third quarter of 2019, the Tyler, El Dorado and Krotz Springs refineries received approval from the EPA for RIN Waivers for the 2018 requirements for all four of our refineries but
there is no assurance the EPA will grant such waivers. Recent opposition to hardship waivers may succeed in delaying or curtailing the waiver applications for our refineries.calendar year.
The EPA issued final rules for gasoline formulation that required the reduction of annual average benzene content by July 1, 2012. ItIn the past, it has been necessary for us to purchase credits in the past to fully comply with these content requirements for the Tyler refinery. However, with the addition of the Big Spring and Krotz Springs refineries, we believe we will self-generate most, if not all, credits that are required.
The EPA finalized Tier 3 gasoline sulfur standards in March 2014. The final Tier 3 rule required a reduction in annual average gasoline sulfur content from 30 ppm to 10 ppm while retaining the maximum per-gallon sulfur content of 80 ppm. Refineries were required to comply with the 10 ppm
sulfur standard by January 1, 2017, but the final rule provided a three-year waiver period, to January 1, 2020, for small volume refineries that processed less than 75,000 barrels per day of crude oil in 2012. In April 2016, EPA issued a revised rule requiring small volume refineries that increase their annual average crude oil processing above the 75,000 barrel per day level to comply with the Tier 3 requirements within 30 months from the time that processing level was exceeded. We have not exceeded the 75,000 barrel per day crude oil processing level at any of our refineries during this period, and all of our refineries met the criteria for the waiver for its full duration. We have spent $12.0 million to date through the end of 2018, and expect to spend an additional $19.8 million in 2019 in order to comply with the Tier 3 regulations by January 1, 2020. Compliance is not expected to have a material adverse effect on our business, financial condition, or results of operations.
Our operations are also subject to the Federal Clean Water Act (“CWA”), the Oil Pollution Act of 1990 (“OPA-90”) and comparable state and local requirements. The CWA, and similar laws, prohibit any discharge into surface waters, ground waters, injection wells and publicly-owned treatment works, except as allowed by pre-treatment permits and National Pollutant Discharge Elimination System (“NPDES”) permits issued by federal, state and local governmental agencies. The OPA-90 prohibits the discharge of oil into "Waters of the U.S." and requires that affected facilities have plans in place to respond to spills and other discharges. The CWA also regulates filling or discharges to wetlands and other "Waters of the U.S." In 2015, the EPA, in conjunction with the Army Corps of Engineers, issued a final rule regardingexpanding the definition of “Waters of the U.S.,” The rule, which expanded the regulatory reach of the existing clean water regulations. As a result of subsequentwas subject to litigation, and judicial stays, and a final rule adopted on February 6, 2018, adding an applicability date to delay the effectiveness of the 2015 rule until February 6, 2020, the 2015 rule is currentlywas repealed in effect in certain states while the prior regulatory regime is in effect in other states, including Arkansas, Texas,December 2019 and Louisiana. Where the rule is or becomes enforceable, it could increase costs for expanding our facilities or constructing new facilities, including pipelines. In accordance with a Presidential directive, in June 2017, the EPA and the DepartmentArmy Corps of the Army published a proposal to repeal the 2015 rule. On February 14, 2019, the Administrator of the EPA and the Assistant Secretary of the Army for Civil worksEngineers have published a proposed rule containing an alternative revision of the definition of “Waters of the U.S.” that is intended to increase predictability and consistency and generally adopts a narrower definition than the 2015 rule. However, legal challenges continue and the ultimate resolution is uncertain at this time. To the extent a final rule expands the scope of the CWA’s jurisdiction, we could face increased operating costs or other impediments that could alter the way we conduct our business, which could in turn have a material adverse effect on our business, financial condition and results of operations.
In recent years, various legislative and regulatory measures to address climate change and greenhouse gas ("GHG") emissions (including carbon dioxide, methane and nitrous oxides) have been discussed or implemented. They include proposed and enacted federal regulation and state actions to develop statewide, regional or nationwide programs designed to control and reduce GHG emissions from fixed sources, such as our refineries, power plants and oil and gas production operations, as well as mobile transportation sources and fuels. EPA rules require us to report GHG emissions from our refinery operations and use of fuel products produced at our refineries on an annual basis. While the cost of compliance with the reporting rule is not material, data gathered under the rule may be used in the future to support additional regulation of GHG. Moreover, the EPA directly regulates GHG emissions from refineries and other major sources through the Prevention of Significant Deterioration (“PSD”) and Federal Operating Permit programs and may require Best Available Control Technology (“BACT”) for GHG emissions above a certain threshold if emissions of other pollutants would otherwise require PSD permitting.
The Pipeline and Hazardous Materials Safety Administration ("PHMSA") of the DOT regulates the design, construction, testing, operation, maintenance, reporting and emergency response of crude oil, petroleum product and other hazardous liquids pipelines and other facilities, including certain tank facilities used in the transportation of such liquids. These requirements are complex, subject to change and, in certain cases, can be costly to comply with. We believe our operations are in substantial compliance with these regulations, but we cannot be certain that substantial expenditures will not be required to remain in compliance. Moreover, certain of these rules are difficult to insure adequately, and we cannot assure that we will have adequate insurance to address costs and damages from any noncompliance.
The United States Pipeline Safety, Regulatory Certainty and Job Creation Act of 2011 (“Pipeline Safety Act”), finalized in January 2012, increased the maximum civil penalties for certain violations from $100,000 to $200,000 per violation per day and from a total cap of $1 million to $2 million. A number of the provisions of the Pipeline Safety Act have the potential to cause owners and operators of pipeline facilities to incur significant capital expenditures and/or operating costs. In January 2017, PHMSA finalized a new regulation that imposes additional responsibilities concerning the operation, maintenance, and inspection of hazardous liquid pipelines; the reporting of pipeline incidents; reference standards for in-line pipeline inspection and the direct assessment of stress corrosion cracking; and other requirements. Additional potential new regulations of pipelines have been proposed by PHMSA and we are monitoring these developments to the extent applicable to our operations. The DOT has issued guidelines with respect to securing regulated facilities such as our bulk terminals against terrorist attack. We have instituted security measures and procedures in accordance with such guidelines to enhance the protection of certain of our facilities. We cannot provide any assurance that these security measures would fully protect our facilities from an attack.
The Federal Motor Carrier Safety Administration of the DOT regulates safety standards and monitors drivers and equipment of commercial motor carrier fleets. Such standards include vehicle and maintenance inspection requirements, limitations on the number of hours drivers may
operate vehicles and financial responsibility requirements. We believe that the operations of our fleet of crude oil and finished products truck transports are substantially in compliance with these regulations and safety requirements.
We have experienced several crude oil releases from pipelines owned by our logistics segment, including, but not limited to, a release at Magnolia Station in March 2013 (the "Magnolia Release"), a release near Fouke, Arkansas in April 2015 and a release near Woodville, Texas in January 2016. The DOJ, on behalf of the EPA, and the State of Arkansas, on behalf of the Arkansas Department of Environmental Quality, have been pursuing an enforcement action against Delek Logistics with regard to potential violations of the CWA and certain state laws arising from the Magnolia Release since June 2015. On July 13, 2018, the DOJ and the State of Arkansas filedNovember 8, 2019, a civil action against two of Delek Logistics’ wholly-owned subsidiaries, Delek Logistics Operating LLC and SALA Gathering Systems LLC,consent decree (the "Magnolia Consent Decree") was entered in the United States District Court for the Western District of Arkansas. On or around December 12, 2018,Arkansas to settle a civil action filed by the claimsDOJ and the State of Arkansas against the Partnership were resolved and an additional demand for a compliance audit attwo of Delek Logistics’ wholly-owned subsidiaries related to the Magnolia terminal was abandoned pursuantRelease. Under the Magnolia Consent Decree, final payments were made to paymentthe State of monetary penaltiesArkansas in the amount of $0.6 million and other relief. Asto the DOJ in the amount of December 31, 2018, we have accrued $2.2$1.7 million, which we recorded in accrued expensesamounts include interest.
On October 3, 2019, a release of diesel fuel involving one of our pipelines occurred near Sulphur Springs, Texas (the "Sulphur Springs Release"). Cleanup operations and other current liabilities in our condensed consolidated balance sheet, forsite maintenance and remediation on this release have been substantially completed and costs related to the Magnolia Release, which represents the full settlement amount for these proceedings. Based on current information available to us, we do not believe the total costs associated with these events, whether alone or in the aggregate, including any fines or penalties, will have a material adverse effect upon our business, financial condition or results of operations.
totaled $7.1 million as of December 31, 2019. Ground water wells for monitoring activities are expected to be installed in February 2020. We expect the monitoring period will last for at least a year. As of the date of this filing, we have not received notification that any legal action with respect to fines and penalties will be pursued by the regulatory agencies.
Working Capital
We fund our business operations through cash generated from our operating activities, borrowings under our debt facilities and potentialperiodic issuances of additional equity and debt securities. For additional information, see Item 7, Management's Discussion and Analysis of Financial Condition and Results of Operations, of this Annual Report on Form 10-K.
Employees
As of December 31, 2018,2019, we had 3,717approximately 3,814 employees, of whom 1,2611,299 were employed in our refining segment, 212197 were employed by Delek for the benefit of our logistics segment, 1,7601,707 were employed in our retail segment and 453587 were employed at our corporate office. AsApproximately 3,600 of December 31, 2018, 160 maintenance, production, operating employees, specific hourly safety employees, and regular storeroom hourly employees and 37 truck drivers at the Tyler refinery were represented by the United Steel, Paper and Forestry, Rubber, Manufacturing, Energy, Allied Industrial and Service Workers International Union and its Local 202. The Tyler maintenance, production, operating employees, specific hourly safety employees, and regular storeroom hourlyour employees are currently covered byemployed on a collective bargaining agreement that expires January 31, 2022. The Tyler truck drivers are currently covered by a collective bargaining agreement that expires May 1, 2021. Asfull-time basis. Approximately, 550 of December 31, 2018, 186 operations and maintenance hourly employees at the El Dorado refinery were represented by the International Union of Operating Engineers and its Local 381. Theseour employees are covered by a collective bargaining agreement which expires on August 1, 2021. As of December 31, 2018, 33 of our El Dorado based drivers for Lion Oil Company were represented by the United Steel, Paperagreements having various expiration dates between 2021 and Forestry, Rubber, Manufacturing, Energy, Allied Industrial and Service Workers International Union, American Federation of Labor and Congress of Industrial Organizations ("AFL-CIO") but are not currently covered by a collective bargaining agreement. As of December 31, 2018, seven of our Texas based drivers for Lion Oil Company were represented by the United Steel, Paper and Forestry, Rubber, Manufacturing, Energy, Allied Industrial and Service Workers International Union, AFL - CIO and are covered by a collective bargaining agreement that expires June 5, 2021. As of December 31, 2018, 4 of our El Dorado refinery warehouse technician hourly employees were represented by the International Union of Operating Engineers and its Local 381 and are covered by a collective bargaining agreement that expires January 11, 2022. As of December 31, 2018, approximately 143 employees who work at our Big Spring refinery are covered by a collective bargaining agreement that expires March 31, 2022. None of our employees in our logistics segment, retail segment or in our corporate office are represented by a union. We consider our relations with our employees to be satisfactory. See further discussion in Note 22 of our consolidated financial statements included in Item 8, Financial Statements and Supplementary Data, of this Annual Report on Form 10-K.
Corporate Headquarters
We lease our corporate headquarters at 7102 Commerce Way, Brentwood, Tennessee. The lease is for 54,000 square feet of office space. The lease term expires in May 2022.
Liens and Encumbrances
The majority of the assets described in this Form 10-K are pledged under and encumbered byunder certain of our debt facilities. See Note 11 of the consolidated financial statements included in Item 8, Financial Statements and Supplementary Data, of this Annual Report on Form 10-K for further information.
ITEM 1A. RISK FACTORS
We are subject to numerous known and unknown risks, many of which are presented below and elsewhere in this Annual Report on Form 10-K. You should carefully consider each of the following risks and all of the other information contained in this Annual Report on Form 10-K in evaluating us and our common stock. Any of the risk factors described below, or additional risks and uncertainties not presently known to us, or that we currently deem immaterial, could have a material adverse effect on our business, financial condition, cash flows and results of operations. The headings provided in this Item 1A are for convenience and reference purposes only and shall not limit or otherwise affect the extent or interpretation of the risk factors.
Risks Relating to Our Industries
A substantial or extended decline in refining margins would reduce our operating results and cash flows and could materially and adversely impact our future rate of growth and the carrying value of our assets.
Our earnings, cash flow and profitability from our refining operations are substantially determined by the difference between the market price of refined products and the market price of crude oil, which often move independently of each other and are referred to as the crack spread, refining margin or refined products margin. Refining margins historically have been volatile, and we believe they will continue to be volatile. Although we monitor our refinery operating margins and seek to optimize results by adjusting throughput volumes, throughput types and product slates, there are inherent limitations on our ability to offset the effects of adverse market conditions.
Many of the factors influencing a changechanges in crack spreads and refining margins are beyond our control. These factors include:
changes in global and local economic conditions;conditions, e.g., as a result of the recent outbreak of the novel coronavirus;
domestic and foreign supply and demand for crude oil and refined products;
the level of foreign and domestic production of crude oil and refined petroleum products;
increased regulation of feedstock production activities, such as hydraulic fracturing;
infrastructure limitations that restrict, or events that disrupt, the distribution of crude oil, other feedstocks and refined petroleum products;
excess or overbuilt infrastructure;
an increase or decrease of infrastructure limitations (or the perception that such an increase or decrease could occur) on the distribution of crude oil, other feedstocks or refined products;
investor speculation in commodities;
worldwide political conditions, particularly in significant oil producing regions such as the Middle East, Africa, the former Soviet Union and South America;
the ability or inability of the members of the Organization of Petroleum Exporting Countries to maintain oil price and production controls;
pricing and other actions taken by competitors that impact the market;
the level of crude oil, other feedstocks and refined petroleum products imported into and exported out of the United States;
excess capacity and utilization rates of refineries worldwide;
development and marketing of alternative and competing fuels, such as ethanol and biodiesel;
changes in fuel specifications required by environmental and other laws, particularly with respect to oxygenates and sulfur content;
local factors, including market conditions, adverse weather conditions and the level of operations of other refineries and pipelines in our markets;
volatility in the costs of natural gas and electricity used by our refineries;
accidents, interruptions in transportation, inclement weather or other events, including cyber attacks,cyber-attacks, that can cause unscheduled shutdowns or otherwise adversely affect our refineries or the supply and delivery of crude oil from third parties; and
United States government regulations.
Some of these factors can vary by region and may change quickly, adding to market volatility, while others may have longer-term effects. The long-term effects of these and other factors on prices for crude oil, refinery feedstocks and refined products could be substantial.
The crude oil we purchase, and the refined products we sell, are commodities whose prices are mainly determined by market forces beyond our control. While an increase or decrease in the price of crude oil will often result in a corresponding increase or decrease in the wholesale price of refined products, a change in the price of one commodity does not always result in a corresponding change in the other. A substantial or prolonged increase in crude oil prices without a corresponding increase in refined product prices, or a substantial or prolonged decrease in refined product prices without a corresponding decrease in crude oil prices, could also have a significant negative effect on our results of operations and cash flows. This is especially true for non-transportation refined products, such as asphalt, butane, coke, sulfur, propane and slurry, whose prices are less likely to correlate to fluctuations in the price of crude oil, all of which we produce at our refineries.
Also, the price for a significant portion of the crude oil processed at our refineries is based upon the WTI benchmark for such oil rather than the Brent benchmark. While the prices for WTI and Brent historically correlate to one another, elevated supply of WTI-priced crude oil in the Mid-Continent region has caused WTI prices to fall significantly below Brent prices at different points in time in recent years. During the years ended December 31, 20172018 and December 31, 2018,2019, this daily differential ranged from highs of $6.60$11.37 and $9.88,$10.99, respectively, to lows of $2.45$1.37 and $5.86,$3.53, respectively. Our ability to purchase and process favorably priced crude oilsoil has allowed us to achieve higher net income and cash flow in recent years; however, we cannot assure that these favorable conditions will continue. A substantial or prolonged narrowing in (or inversion to) the price
differential between the WTI and Brent benchmarks for any reason, including, without limitation, increased crude oil distribution capacity from the Permian Basin, crude oil exports from the United States or actual or perceived reductions in Mid-Continent crude oil inventories, could negatively impact our earnings and cash flows.flows, which could have a material adverse effect on our business, financial condition and results of operations. In addition, because the premium or discount we pay for a portion of the crude oil processed at our refineries is established based upon this differential during the month prior to the month in which the crude oil is processed, rapid decreases in the differential may negatively affect our results of operations and cash flows.
Additionally, governmental and regulatory actions, including continued resolutions by the Organization of the Petroleum Exporting Countries to restrict crude oil production levels and executive actions by the current U.S. presidential administration to advance certain energy infrastructure projects may continue to impact crude oil prices and crude oil differentials. Any increase in crude oil prices or unfavorable movements in crude oil differentials due to such actions or changing regulatory environment may negatively impact our ability to acquire crude oil at economical prices and could have a material adverse effect on our business, financial condition and results of operations.
We operate in a highly regulated industry and increased costs of compliance with, or liability for violation of, existing or future laws, regulations and other requirements could significantly increase our costs of doing business, thereby adversely affecting our profitability.
Our industry is subject to extensive laws, regulations, permits and other requirements including, but not limited to, those relating to the environment, fuel composition, safety, transportation, pipeline tariffs, employment, labor, immigration, minimum wages, overtime pay, health care benefits, working conditions, public accessibility, retail fuel pricing, the sale of alcohol and tobacco and other requirements. These permits, laws and regulations are enforced by federal agencies including the United States Environmental Protection Agency ("EPA"), United States Department of Transportation ("DOT"), Pipeline and Hazardous Materials Safety Administration ("PHMSA"),EPA, DOT, PHMSA, Federal Motor Carrier Safety Administration ("FMCSA"), Federal Railroad Administration ("FRA"), Occupational Health and Safety Administration ("OSHA"),OSHA, National Labor Relations Board ("NLRB"), Equal Employment Opportunity Commission ("EEOC"), Federal Trade Commission ("FTC") and the Federal Energy Regulatory Commission ("FERC"),FERC, and numerous other state and federal agencies. We anticipate that compliance with environmental, health and safety regulations could require us to spend significant amounts in capital costs during the next five years. These estimates do not include amounts related to capital investments that management has deemed to be strategic investments. These amounts could materially change as a result of governmental and regulatory actions.
Various permits, licenses, registrations and other authorizations are required under these laws for the operation of our refineries, biodiesel facilities, terminals, pipelines, retail locations and related operations, and these permits are subject to renewal and modification that may require operational changes involving significant costs. If key permits cannot be renewed or are revoked, the ability to continue operation of the affected facilities could be threatened.
Ongoing compliance with, or violation of, laws, regulations and other requirements could also have a material adverse effect on our business, financial condition and results of operations. We face potential exposure to future claims and lawsuits involving environmental matters, including, but not limited to, soil, groundwater and waterway contamination, air pollution, personal injury and property damage allegedly caused by substances we manufactured, handled, used, released or disposed. We are, and have been, the subject of various state, federal and private proceedings relating to environmental regulations, conditions and inquiries.
In addition, new legal requirements, new interpretations of existing legal requirements, increased legislative activity and governmental enforcement and other developments could require us to make additional unforeseen expenditures. Companies in the petroleum industry, such as us, are often the target of activist and regulatory activity regarding pricing, safety, environmental compliance, derivatives trading and other business practices, which could result in price controls, fines, increased taxes or other actions affecting the conduct of our business. The specific impact of laws and regulations or other actions may vary depending on a number of factors, including the age and location of operating facilities, marketing areas, crude oil and feedstock sources and production processes.
We generate wastes that may be subject to the Resource Conservation and Recovery Act ("RCRA")RCRA and comparable state and local requirements. The EPA and various state agencies have limited the approved methods of managing, transporting, recycling and disposal of hazardous and certain non-hazardous wastes. Our refineries are large quantity generators of hazardous waste and require hazardous waste permits issued by the EPA or state agencies. Additionally, certain of our other facilities, such as terminals and biodiesel plants, generate lesser quantities of hazardous wastes.
Under RCRA, the Comprehensive Environmental Response, Compensation, and Liability Act ("CERCLA") and other federal, state and local environmental laws, as the owner or operator of refineries, biodiesel plants, bulk terminals, pipelines, tank farms, rail cars, trucks and retail locations, we may be liable for the costs of removal or remediation of contamination at our existing or former locations, whether we knew of, or were responsible for, the presence of such contamination. We have incurred such liability in the past, and several of our current and former locations are the subject of ongoing remediation projects. The failure to timely report and properly remediate contamination may subject us to liability to third parties and may adversely affect our ability to sell or rent our property or to borrow money using our property as collateral. Additionally, persons who arrange for the disposal or treatment of hazardous substances also may be liable for the costs of removal or remediation of these substances at sites where they are located, regardless of whether the site is owned or operated by that person. We typically arrange for the treatment or disposal of hazardous
substances generated by our refining and other operations. Therefore, we may be liable for removal or remediation costs associated with releases of these substances at third party locations, as well as other related costs, including fines, penalties and damages resulting from injuries to persons, property and natural resources. Our El Dorado refinery is a minor potentially responsible party at a Superfund site, for which we expect our costs to be non-material. In the future, we may incur substantial expenditures for investigation or remediation of contamination that has not been discovered at our current or former locations or locations that we may acquire or at third party sites where hazardous substances from these locations have been treated or disposed.
Our operations are subject to certain requirements of the federal Clean Air Act (“CAA”),CAA, as well as related state and local laws and regulations governing air emissions. Certain CAA regulatory programs applicable to our refineries, terminals and other operations require capital expenditures
for the installation of air pollution control devices, operational procedures to minimize emissions and monitoring and reporting of emissions. In 2012, the EPA announced an industry-wide enforcement initiative directed at flaring operations and performance at refineries and petrochemical plants and finalized revisions to NSPS Subpart Ja that primarily affects flares and process heaters. We completed capital and other projects at our refineries related to flare compliance with NSPS Ja in 2015 and 2016.
Our Big Spring refinery has been negotiating an agreement with the EPA for over 10 years under EPA’s National Petroleum Refinery Initiative, regarding alleged historical violations of the CAA. A Consent Decree resolving these alleged historical violations for the Big Spring refineryconsent decree was lodged withentered in the United States District Court for the Northern District of Texas onin June 6, 2017. An Amendment to the Consent Decree was lodged on January 31, 2019. Upon entry2019 resolving alleged historical violations of the AmendmentCAA at our Big Spring refinery. In addition to the Consent Decree, expected in the springa civil penalty of 2019, the Consent Decree will require payment of a $0.5 million civil penalty andthat we paid in June 2019, we will be required to expend capital expenditures for pollution control equipment that may be significant over the next 10 years. According to the EPA, approximately 95% of the nation's refining capacity has entered into "global" settlements under the EPA National Refinery Initiative. Our El Dorado and Tyler refineries entered into similar global settlements in 2002 and 2009. A similar Consent Decreeconsent decree covering the Krotz Springs refinery entered into in 2005 by a previous owner was terminated by the court in October 2017.
In 2015, the EPA finalized reductions in the National Ambient Air Quality Standard (NAAQS)NAAQS for ozone, from 75 ppb to 70 ppb. Our Tyler refinery is located near areas that have been reclassified as being in non-attainment with the new standard. However, thisthe refinery area has not been classified as being in non-attainment with the new standard. If air quality near our facilities worsens in the future, it is possible that these area(s) could be reclassified as being in non-attainment for the new ozone standard which could require us to install additional air pollution control equipment for ozone forming emissions in the future. We do not believe such capital expenditures, or the changes in our operation, will result in a material adverse effect on our business, financial condition or results of operations.
In late 2015, the EPA finalized additional rules regulating refinery air emissions from a variety of sources (such as cokers, flares, tanks and other process units) through additional NSPS and National Emission Standards for Hazardous Air Pollutants and changing the way emissions from startup, shutdown and malfunction operations are regulated (the "Refinery Risk and Technology Review Rules" or “RTR”). The RTR rule also requires that we monitor property line benzene concentrations at our refineries, and report those concentrations quarterly to the EPA, which will make the results available to the public. Even though the concentrations are not expected to exceed regulatory or health basedhealth-based standards, the availability of such data may increase the likelihood of lawsuits against our refineries by the local public or organized public interest groups. Delek has obtained 1-year compliance extensions to certain provisions of the rule. Most of the capital cost needed to comply with these new rules has already been spent. We do not anticipate that any additional capital costs or future operating costs will be material, and do not believe compliance will affect our production capacities or have a material adverse effect upon our business, financial condition or results of operations.
In addition to our operations, many of the fuel products we manufacture are subject to requirements of the CAA, as well as related state and local laws and regulations. The EPA has the authority, under the CAA, to modify the formulation of the refined transportation fuel products we manufacture, in order to limit the emissions associated with their final use. In 2007, the EPA issued final Mobile Source Air Toxic II rules for gasoline formulation that required the reduction of annual average benzene content by July 1, 2012. We have purchased credits in the past to comply with these content requirements for two of our refineries. Although credits have been readily available, there can be no assurance that such credits will continue to be available for purchase at reasonable prices, or at all, and we could have to implement capital projects in the future to reduce benzene levels.
In March 2014, the EPA issued final Tier 3 gasoline rules that require a reduction in annual average gasoline sulfur content from 30 ppm to 10 ppm by January 1, 2017 for "large refineries" and retains the current maximum per-gallon sulfur content limit of 80 ppm. In April 2016, the EPA finalized a change to the Tier 3 standard, requiring small volume refineries that increase their annual average crude processing rate above 75,000 bpd to meet the Tier 3 sulfur limits 30 months from that “disqualifying” date. Under the final rules, all of our refineries are considered “small refineries” and are exempt until January 1, 2020. We anticipate that our refineries will meet these new limits when they become effective and that capital spending at our refineries to achieve compliance by the effective date were $12.0 million through 2018, and will be approximately $19.8 million in 2019. We do not anticipate that this rule change will affect our refineries.
Our operations are also subject to the Federal Clean Water Act (“CWA”),CWA, the Oil Pollution Act of 1990 (“OPA-90”)OPA-90 and comparable state and local requirements. The CWA, and similar laws, prohibit any discharge into surface waters, ground waters, injection wells and publicly-owned treatment works, except as allowed by pre-treatment permits and National Pollutant Discharge Elimination System (“NPDES”)NPDES permits issued by federal, state and local governmental agencies. The OPA-90 prohibits the discharge of oil into "Waters of the U.S." and requires that affected facilities have plans in place to respond to spills and other discharges. The CWA also regulates filling or discharges to wetlands and other "Waters of the U.S." In 2015, the EPA, in conjunction with the Army Corps of Engineers, issued a final rule regardingexpanding the definition of “Waters of the U.S.,” The rule, which expanded the regulatory reach of the existing clean water regulations. As a result of subsequentwas subject to litigation and judicial stays, and a final rule adopted on February 6, 2018, adding an applicability date to delay the effectiveness of the 2015 rule until February 6, 2020, the 2015 rule is currentlywas repealed in effect in certain states while the prior regulatory regime is in effect in other states, including Arkansas, Texas,December 2019 and Louisiana. Where the rule is or becomes enforceable, it could increase costs for expanding our facilities or constructing new facilities, including pipelines. In accordance with a Presidential directive, in June 2017, the EPA and the DepartmentArmy Corps of the Army published a proposal to repeal the 2015 rule. On February 14, 2019, the Administrator of the EPA and the Assistant Secretary of the Army for Civil WorksEngineers have published a proposed rule containing an alternative revision of the definition of “Waters of the U.S.” that is intended to increase the predictability and consistency and generally adopts a narrower definition than the 2015 rule. However, legal challenges continue and the ultimate resolution is uncertain at this time. To the extent a final rule expands the scope of the CWA’s jurisdiction, we could face increased operating costs
or other impediments that could alter the way we conduct our business, which could in turn have a material adverse effect on our business, financial condition and results of operations.
We are subject to regulation by the DOT and various state agencies in connection with our pipeline, trucking and rail transportation operations. These regulatory authorities exercise broad powers, governing activities such as the authorization to operate hazardous materials pipelines and engage in motor carrier operations. There are additional regulations specifically relating to the transportation industry, including integrity management of pipelines, testing and specification of equipment, product handling and labeling requirements and personnel qualifications. The transportation industry is subject to possible regulatory and legislative changes that may affect the economics of our business by requiring changes in operating practices or pipeline construction or by changing the demand for common or contract carrier services or the cost of providing trucking services. Possible changes include, among other things, increasingly stringent environmental regulations, increased frequency and stringency for testing and repairing pipelines, replacement of older pipelines, changes in the hours of service regulations that govern the amount of time a driver may drive in any specific period, on-board black box recorder devices or limits on vehicle weight and size and properties of the materials that can be shipped. Required changes to the specifications governing rail cars carrying crude oil will eliminate the most commonly used tank cars or require that such cars be upgraded. In January 2017, PHMSA announced they were considering limits on the volatility of crude oil that could be shipped by rail and other modes of transportation. These rules could limit the availability of tank cars to transport crude to our refineries and increase the cost of crude oil transported by rail or truck. In addition to the substantial remediation costs that could be caused by leaks or spills from our pipelines, regulators could prohibit our use of affected portions of the pipeline for extended periods, thereby interrupting the delivery of crude oil to, or the distribution of refined products from, our refineries.
In addition, the DOT has issued guidelines with respect to securing regulated facilities such as our bulk terminals against terrorist attack. We have instituted security measures and procedures in accordance with such guidelines to enhance the protection of certain of our facilities. We cannot provide any assurance that these security measures would fully protect our facilities from an attack.
Our operations are subject to various laws and regulations relating to occupational health and safety and process safety administered by OSHA, the EPA and various state equivalent agencies. We maintain safety, training, design standards, mechanical integrity and maintenance programs as part of our ongoing efforts to ensure compliance with applicable laws and regulations and to protect the safety of our workers and the public. More stringent laws or regulations or adverse changes in the interpretation of existing laws or regulations by government agencies could have an adverse effect on our financial position and the results of our operations and could require substantial expenditures for the installation and operation of systems and equipment.
Health and safety legislation and regulations change frequently. We cannot predict what additional health and safety legislation or regulations will be enacted or become effective in the future or how existing or future laws or regulations will be administered or interpreted with respect to our operations. Compliance with applicable health and safety laws and regulations has required, and continues to require, substantial expenditures. Future process safety rules could also mandate changes to the way we operate, the processes and chemicals we use and the materials from which our process units are constructed. Such regulations could have a significant negative effect on our operations and profitability. For example, in response to Executive Order 13650, Improving Chemical Facility Safety and Security, OSHA announced it intends to propose comprehensive changes to the process safety requirements, although they have not yet formally proposed any revisions. In January 2017, the EPA finalized changes to process safety requirements in its Risk Management Program rules that require evaluation of safer alternatives and technologies, expanded routine audits, independent third-party audits following certain process safety events and increased sharing of information with the public and emergency response organizations. In January 2017, OSHA announced changes to its National Emphasis Program, and specifically identified oil refineries as facilities for increased inspections. The changes also instruct inspectors to use data gathered from EPA Risk Management Plan inspections to identify refiners for additional Process Safety Management inspections.
Environmental regulations are becoming more stringent, and new environmental and safety laws and regulations are continuously being enacted or proposed. Compliance with any future legislation or regulation of our produced fuels, including renewable fuel or carbon content; GHG emissions; sulfur, benzene or other toxic content; vapor pressure; octane; or other fuel characteristics, may result in increased capital and operating costs and may have a material adverse effect on our business, financial conditions or results of operations and financial condition.operations. While it is impractical to predict the impact that potential regulatory and activist activity may have, such future activity may result in increased costs to operate and maintain our facilities, as well as increased capital outlays to improve our facilities. Such future activity could also adversely affect our ability to expand production, result in damaging publicity about us, or reduce demand for our products. Our need to incur costs associated with complying with any resulting new legal or regulatory requirements that are substantial and not adequately provided for, could have a material adverse effect on our business, financial condition and results of operations.
Our operating responsibility for bulk product terminals and refined product pipelines includes responsibility to ensure the quality and purity of the products loaded at our loading racks. If our quality control measures were to fail, we may have contaminated or off-specification products in pipelines and storage tanks or off-specification product could be sent to public gasoline stations. These types of incidents could result in product liability claims from our customers, as well as negative publicity. Product liability is a significant commercial risk. Substantial damage awards have been made in certain jurisdictions against manufacturers and resellers based upon claims for injuries caused by the use of or exposure to various products. There can be no assurance that product liability claims against us would not have a material adverse effect on our business or results of operations or our ability to maintain existing customers or retain new customers.
The Dodd-Frank Wall Street Reform and Consumer Protection Act (the "Dodd-Frank Act") is comprehensive financial reform legislation that, among other things, establishes comprehensive federal oversight and regulation of over-the-counter derivatives and many of the entities that participate
in that market. Although the Dodd-Frank Act was enacted on July 21, 2010, the Commodity Futures Trading Commission ("CFTC")
and the SEC, along with certain other regulators, must promulgate final rules and regulations to implement many of the Dodd-Frank Act's provisions relating to over-the-counter derivatives. While some of these rules have been finalized, others have not; and, as a result, the final form and timing of the implementation of the new regulatory regime affecting commodity derivatives remains uncertain.
The availability and cost of RINs could have ana material adverse effect on our financial condition and results of operations.
The RFS-2, issued by the EPA, requires refiners to add annually increasing amounts of “renewable fuels” to their petroleum products or to purchase credits, known as “RINs,” in lieu of such blending. Due to regulatory uncertainty and in part due to the nation’s fuel supply approaching the “blend wall” (the 10% ethanol limit prescribed by most automobile warranties), the price and availability of RINs has been volatile.
While we are able to obtain many of the RINs required for compliance by blending renewable fuels manufactured by third parties or by our own biodiesel plants, we must also purchase RINs on the open market. If we are unable to pass the costs of compliance with RFS-2 on to our customers, our profits will be adversely impacted. If we have to pay a significantly higher price for RINs, if sufficient RINs are unavailable for purchase or if we are otherwise unable to meet the RFS-2 mandates, our business, financial condition and results of operations could be materially and adversely affected.
The availability and cost of RINs and other required credits could have an adverse effect on our financial condition and results of operations.
Pursuant to the 2007 Energy Independence and Security Act, the EPA promulgated the RFS-2 regulations reflecting the increased volume of renewable fuels mandated to be blended into the nation's fuel supply. The regulations, in part, require refiners to add annually increasing amounts of “renewable fuels” to their petroleum products or purchase RINs in lieu of such blending. We currently purchase RINs for some fuel categories on the open market in order to comply with the quantity of renewable fuels we are required to blend under the RFS-2 regulations. Since the EPA first began mandating biofuels in excess of the “blend wall” (the 10% ethanol limit prescribed by most automobile warranties), the price of RINs has been extremely volatile. While we cannot predict the future prices of RINs, the costs to obtain the necessary number of RINs could be material. If we are unable to pass the costs of compliance with the RFS-2 regulations on to our customers, if sufficient RINs are unavailable for purchase, if we have to pay a significantly higher price for RINs or if we are otherwise unable to meet the RFS-2 mandates, our financial condition and results of operations could be adversely affected.
In the past, we have received small refinery exemptions under the RFS-2 program for certain of our refineries. However, there is no assurance that such an exemption will be obtained for any of our refineries in future years. For example, the EPA has recently indicated it plans to more closely align the agency’s criteria for granting small refinery exemptions with the recommendation of the Department of Energy, which could result in fewer such exemptions being granted. The failure to obtain such exemptions for certain of our refineries could result in the need to purchase more RINs than we currently have estimated and accrued for in our consolidated financial statements. The EPA recently promulgated new Renewable Fuel Standards regulations that could require the agency to increase the volume of renewable fuel or RINs that refiners are required to purchase if the agency anticipates it will grant small refinery exemptions. This could also increase the number of RINs we need to purchase. Additionally, recent decisions by the U.S. Court of Appeals for the 10th Circuit have vacated small refinery exemptions granted in past years for other refiners. These decisions have been remanded to the EPA for further proceedings, and it is not clear at this time what steps the EPA will take with respect to those vacated small refinery exemptions, or how the case will impact small refinery exemptions granted to other refineries or future small refinery exemptions.
In addition, the RFS-2 regulations are highly complex and evolving, requiring us to periodically update our compliance systems. The RFS-2 regulations require the EPA to determine and publish the applicable annual volume and percentage standards for each compliance year by November 30 for the forthcoming year, and such blending percentages could be higher or lower than amounts estimated and accrued for in our consolidated financial statements. The future cost of RINs is difficult to estimate until such time as the EPA finalizes the applicable standards for the forthcoming compliance year. Moreover, in addition to increased price volatility in the RINs market, there have been multiple instances of RINs fraud occurring in the marketplace over the past several years. The EPA has initiated several enforcement actions against refiners who purchase fraudulent RINs, resulting in substantial costs to the refiner. We cannot predict with certainty our exposure to increased RINs costs in the future, nor can we predict the extent by which costs associated with RFS-2 regulations will impact our future results of operations.
Increased supply of and demand for alternative transportation fuels, increased fuel economy standards and increased use of alternative means of transportation could lead to a decrease in transportation fuel prices and/or a reduction in demand for petroleum-based transportation fuels.
In addition, as regulatory initiatives have required an increase in the consumption of renewable transportation fuels, such as ethanol and biodiesel, consumer acceptance of electric, hybrid and other alternative vehicles is increasing. Increased use of renewable fuels and alternative vehicles may result in a decrease in demand for petroleum-based transportation fuels. Increased use of renewable fuels may also result in an increase in transportation fuel supply relative to decreased demand and a corresponding decrease in margins. A significant decrease in transportation fuel margins or demand for petroleum-based transportation fuels could have an adverse impact on our financial results. As described above, RFS-2 requires replacement of increasing amounts of petroleum-based transportation fuels with biofuels through 2022. RFS-2 and widespread use of E-15 or E-85 could cause decreased crude runs and materially affect our profitability, unless fuel demand rises at a comparable rate or other outlets are found for the displaced petroleum products.
On October 11, 2018, the White House announced the President has signed a memorandum directing the EPA to conduct a rulemaking that is intended to increase the utilization of E-15 during the summer months. In its regulatory agenda, the EPA projects publication of a proposed rule in February 2019 and a final rule in May 2019. Notwithstanding this timeline, the Office of Management and Budget's Office of Information and Regulatory Affairs has not yet announced that it has received a draft proposal for interagency review.
In 2012, the EPA and the National Highway Traffic Safety Administration finalized rules raising the required Corporate Average Fuel Economy and GHG standards for passenger vehicles beginning with 2017 model year vehicles and increasing to the equivalent of 54.5 mpg by 2025. These standards were reaffirmed by the EPA in January 2017, but that action was subsequently withdrawn on April 13, 2018. Additional increases in fuel efficiency standards for medium and heavy dutyheavy-duty vehicles were finalized in 2016. Such increases in fuel economy standards and potential electrification of the vehicle fleet, along with mandated increases in use of renewable fuels discussed above, could result in decreasing demand for petroleum fuels, which, in turn, could materially affect profitability at our refineries.
To meet higher fuel efficiency and GHG emission standards for passenger vehicles, automobile manufacturers are increasingly using technologies, such as turbocharging, direct injection and higher compression ratios that require high octane gasoline. Many auto manufacturers have expressed a desire that only a high-octane grade of gasoline be allowed in order to maximize fuel efficiency, rather than the three octane grades common now. Regulatory changes allowing only one high-octane grade, or significant increases in market demand for high-octane fuel, could result in a shift to high-octane ethanol blends containing 25% - 30% ethanol, the need for capital expenditures at our refineries to increase octane or reduced demand for petroleum fuels, which could materially affect profitability of our refineries.
Competition in the refining and logistics industry is intense, and an increase in competition in the markets in which we sell our products could adversely affect our earnings and profitability.
We compete with a broad range of companies in our refining and petroleum product marketing operations. Many of these competitors are integrated, multinational oil companies that are substantially larger than us. Because of their diversity, integration of operations, larger capitalization, larger and more complex refineries and greater resources, these companies may be better able to withstand volatile market conditions relating to crude oil and refined product pricing, to compete on the basis of price and to obtain crude oil in times of shortage.
We do not engage in petroleum exploration or production, and therefore do not produce any of our crude oil feedstocks. Certain of our competitors, however, obtain a portion of their feedstocks from company-owned production activities. Competitors that have their own crude oil production are at times able to offset losses from refining operations with profits from producing operations and may be better positioned to withstand periods of depressed refining margins or feedstock shortages. If we are unable to compete effectively with these competitors, there could be a material adverse effect on our business, financial condition and results of operations.
Our retail segment is subject to loss of market share or pressure to reduce prices in order to compete effectively with a changing group of competitors in a fragmented retail industry.
The markets in which we operate our retail fuel and convenience stores are highly competitive and characterized by ease of entry and constant change in the number and type of retailers offering the products and services found in our stores. We compete with other convenience store chains, gas stations, supermarkets, drug stores, discount stores, dollar stores, club stores, mass merchants, fast food operations, independent owner-operators and other retail outlets. In some of our markets, our competitors have been in existence longer and have greater financial, marketing and other resources than us. In addition, independent owner-operators can generally operate stores with lower overhead costs than ours. As a result, our competitors may be able to respond better to changes in the economy and new opportunities within the industry.
Several non-traditional retailers, such as supermarkets, club stores and mass merchants, have affected the convenience store industry by entering the retail fuel business and/or selling merchandise traditionally found in convenience stores. Many of these competitors are substantially larger than we are. Because of their diversity, integration of operations and greater resources, these companies may be better able to withstand volatile market conditions or levels of low or no profitability. In addition, these retailers may use promotional pricing or discounts, both at the pump and in the store, to encourage in-store merchandise sales. These activities by our competitors could adversely affect our profit margins. Additionally, our convenience stores could lose market share, relating to both gasoline and merchandise, to these and other retailers, which could adversely affect our business, results of operations and cash flows. Our convenience stores compete in large part based on their ability to offer convenience to customers. Consequently, changes in traffic patterns and the type, number and location of competing stores could result in the loss of customers and reduced sales and profitability at affected stores. These non-traditional gasoline and/or convenience merchandise retailers may obtain a significant share of the retail fuels market, may obtain a significant share of the convenience store merchandise market and their market share in each market is expected to grow.
We may seek to diversify and expand our retail fuel and convenience store operations, which may present operational and competitive challenges.
We may seek to grow by selectively operating stores in geographic areas other than those in which we currently operate, or in which we currently have a relatively small number of stores. This growth strategy would present numerous operational and competitive challenges to our senior management and employees and would place significant pressure on our operating systems. In addition, we cannot assure that consumers located in the regions in which we may expand our operations would be as receptive to our stores as consumers in our existing markets. The success of any such growth plans will depend in part upon our ability to:
select, and compete successfully in, new markets;
obtain suitable sites at acceptable costs;
realize an acceptable return on the capital invested in new facilities;
hire, train, and retain qualified personnel;
integrate new retail fuel and convenience stores into our existing distribution, inventory control, and information systems;
expand relationships with our suppliers or develop relationships with new suppliers; and
secure adequate financing, to the extent required.
We cannot assure that we will achieve our development goals, manage our growth effectively, or operate our existing and new retail fuel and convenience stores profitability. The failure to achieve any of the foregoing could have a material adverse effect on our business, financial condition and results of operations.
Decreases in commodity prices may lessen our borrowing capacities, increase collateral requirements for derivative instruments or cause a write-down of inventory.
The nature of our business requires us to maintain substantial quantities of crude oil, refined petroleum product and blendstock inventories. Because these inventories are commodities, we have no control over their changing market value. For example, reductions in the value of our inventories or accounts receivable as a result of lower commodity prices could result in a reduction in our borrowing base calculations and a reduction in the amount of financial resources available to meet the refineries' credit requirements. Further, if at any time our availability under certain of our revolving credit facilities falls below certain thresholds, we may be required to take steps to reduce our utilization under those credit facilities. In addition, changes in commodity prices may require us to utilize substantial amounts of cash to settle or cash collateralize some or all of our existing commodity hedges. Finally, because our inventory is valued at the lower of cost or market value, we would record a write-down of inventory and a non-cash charge to cost of sales if the market value of the inventory were to decline to an amount below our cost.
A terrorist attack on our assets, or threats of war or actual war, may hinder or prevent us from conducting our business.
Terrorist attacks (including cyber-attacks) in the United States, as well as events occurring in response to or in connection with them, including political instability in varioussignificant oil producing regions such as the Middle Eastern countries,East, Africa, the former Soviet Union and South America, may harm our business. Energy-related assets (which could include refineries, pipelines and terminals such as ours) may be at greater risk of future terrorist attacks than other possible targets in the United States.
A direct attack on our assets, or the assets of others used by us, could have a material adverse effect on our business, financial condition and results of operations. Uncertainty surrounding continued global hostilities or other sustained military campaigns, and the possibility that infrastructure facilities could be direct targets of, or indirect casualties of, an act of terror, may affect our operations in unpredictable ways, including disruptions of crude oil supplies and markets for refined products. In addition, any terrorist attack or continued political instability in significant oil producing regions such as the Middle East, Africa, the former Soviet Union and South America could have an adverse impact on energy prices, including prices for crude oil, other feedstocks and refined petroleum products, and an adverse impact on the margins from our
refining and petroleum product marketing operations. DisruptionThe long-term impacts of terrorist attacks and the threat of future terrorist on the energy transportation industry in general, and on us in particular, are unknown. Increased security measures taken by us as a precaution against possible terrorist attacks or vandalism could result in increased costs to our business. In addition, disruption or significant increases in energy prices could also result in government-imposed price controls. Any one of, or a combination of, these occurrences could have a material adverse effect on our business, financial condition and results of operations.
Legislative and regulatory measures to address climate change and GHG emissions could increase our operating costs or decrease demand for our refined products.
Various legislative and regulatory measures to address climate change and greenhouse gas ("GHG")GHG emissions (including carbon dioxide, methane and nitrous oxides) are in various phases of discussion or implementation and could affect our operations. They include proposed and recently enacted federal regulation and state actions to develop statewide, regional or nationwide programs designed to control and reduce GHG emissions from fixed sources, such as our refineries, coal-fired power plants and oil and gas production operations, as well as mobile transportation sources and fuels. Many states and regions have implemented, or are in the process of implementing, measures to reduce emissions of GHGs, primarily through cap and trade programs or low carbon fuel standards, but other than in California where we have limited operations, we do not currently operate in states that have their own GHG reduction programs.
In December 2009, the EPA published its findings that emissions of GHGs present a danger to public health and the environment because emissions of such gases are, according to the EPA, contributing to the warming of the Earth’s atmosphere and other climatic conditions. Based on these findings, the EPA adopted two sets of regulations that restrict emissions of GHGs under existing provisions of the federal CAA, including one that requires a reduction in emissions of GHGs from motor vehicles and another that regulates GHG emissions from certain large stationary sources under the Clean Air Act Prevention of Significant Deterioration (“PSD”)PSD and Title V permitting programs. Congress has also from time to time considered legislation to reduce emissions of GHGs. Efforts have been made, and continue to be made, in the international community toward the adoption of international treaties or protocols that would address global climate change issues. In April 2016, the United States became a signatory to the 2015 United Nations Conference on Climate Change, which led to the creation of the Paris Agreement. The Paris Agreement, which became effective by its terms on November 4, 2016, will require countries to review and "represent a progression" in their intended nationally determined contributions, which set GHG emission reduction
goals, every five years, beginning in 2020. On August 4, 2017, the United States formally communicated to the United Nations its intent to withdraw from participating in the Paris Agreement, which entails a four yearfour-year process. In response to the announced withdrawal plan, a number of state and local governments in the United States have expressed intentions to take GHG-related actions.
Although it is not possible to predict the requirements of any GHG legislation that may be enacted, any laws or regulations that have been or may be adopted to restrict or reduce GHG emissions will likely require us to incur increased operating and capital costs and/or increased taxes on GHG emissions and petroleum fuels, and any increase in the prices of refined products resulting from such increased costs, GHG cap and trade programs or taxes on GHGs, could result in reduced demand for our petroleum fuels. If we are unable to maintain sales of our refined products at a price that reflects such increased costs, there could be a material adverse effect on our business, financial condition and results of operations. GHG regulation, including taxes on the GHG content of fuels, could also impact the consumption of refined products, thereby affecting our refinery operations.
Increasing attention to environmental, social and governance matters may impact our business, financial results or stock price.
In recent years, increasing attention has been given to corporate activities related to environmental, social and governance (“ESG”) matters in public discourse and the investment community. A number of advocacy groups, both domestically and internationally, have campaigned for governmental and private action to promote change at public companies related to ESG matters, including through the investment and voting practices of investment advisers, public pension funds, universities and other members of the investing community. These activities include increasing attention and demands for action related to climate change, promoting the use of substitutes to fossil fuel products, and encouraging the divestment of companies in the fossil fuel industry. These activities could reduce demand for our products, reduce our profits, increase the potential for investigations and litigation, impair our brand and have negative impacts on our stock price and access to capital markets.
In addition, organizations that provide information to investors on corporate governance and related matters have developed ratings systems for evaluating companies on their approach to ESG matters. These ratings are used by some investors to inform their investment and voting decisions. Unfavorable ESG ratings may lead to increased negative investor sentiment toward us and our industry and to the diversion of investment to other industries, which could have a negative impact on our stock price and our access to and costs of capital.
Risks Relating to Our Business
We are particularly vulnerable to disruptions to our refining operations because our refining operations are concentrated in four facilities.
Because all of our refining operations are concentrated in the Tyler, El Dorado, Big Spring and Krotz Springs refineries, significant disruptions at one of these facilities could have a material adverse effect on our consolidated financial results. Refining segment contribution margin comprised approximately 84.2%79.4%, 88.3%84.2% and 78.1%88.3% of our consolidated contribution margin for the 2019, 2018 2017 and 20162017 fiscal years, respectively.
Our refineries consist of many processing units, a number of which have been in operation for many years. These processing units undergo periodic shutdowns, known as turnarounds, during which routine maintenance is performed to restore the operation of the equipment to its formera higher level of performance. Depending on which units are affected, all or a portion of a refinery's production may be halted or disrupted during a maintenance turnaround. We completed a maintenance turnaroundsturnaround at our El Dorado refinery in 2014 and our Tyler refinery in 2015. We will conduct a shortened turnaround that will allowallowed work to be completed on the majority of the process units at our El Dorado refinery in March 2019. In addition, we completed a maintenance turnaround at our Tyler refinery in 2015 and plan for a maintenance turnaround for our Big Spring refinery beginning January of 2020. We are also subject to unscheduled down time for unanticipated maintenance or repairs.
Refinery operations may also be disrupted by external factors, such as a suspension of feedstock deliveries, cyber attacks,cyber-attacks, or an interruption of electricity, natural gas, water treatment or other utilities. Other potentially disruptive factors include natural disasters, severe weather conditions, workplace or environmental accidents, interruptions of supply, work stoppages, losses of permits or authorizations or acts of terrorism.
Our operations are subject to business interruptions and casualty losses. Failure to manage risks associated with business interruptions could adversely impact our operations, financial condition, results of operations and cash flows.
Our refining and logistics operations are subject to significant hazards and risks inherent in transporting, storing and processing crude oil and intermediate and finished petroleum products. These hazards and risks include, but are not limited to, natural or weather-related disasters, fires, explosions, pipeline ruptures and spills, trucking accidents, train derailments, third-party interference, mechanical failure of equipment and other events beyond our control. The occurrence of any of these events could result in production and distribution difficulties and disruptions, personal injury or death, environmental pollution and other damage to our properties and the properties of others.
If any facility were to experience an interruption in operations, earnings from the facility could be materially adversely affected (to the extent not recoverable through insurance, if insured) because of lost production and repair costs. A significant interruption in one or more of our facilities could also lead to increased volatility in prices for feedstocks and refined products and could increase instability in the financial and insurance markets, making it more difficult for us to access capital and to obtain insurance coverage that we consider adequate.
Because of these inherent dangers, our refining and logistics operations are subject to various laws and regulations relating to occupational health and safety, process and operating safety, environmental protection and transportation safety. Continued efforts to comply with applicable laws and regulations related to health, safety and the environment, or a finding of non-compliance with current regulations, could result in additional capital expenditures or operating expenses, as well as fines and penalties.
In addition, our refineries, pipelines and terminals are located in populated areas and any release of hazardous material, or catastrophic event, could affect our employees and contractors, as well as persons and property outside our property. Our pipelines, trucks and rail cars carry flammable and toxic materials on public railways and roads and across populated and/or environmentally sensitive areas and waterways that could be severely impacted in the event of a release. An accident could result in significant personal injuries and/or cause a release that results in damage to occupied areas, as well as damage to natural resources. It could also affect deliveries of crude oil to our refineries, resulting in a curtailment of operations. The costs to remediate such an accidental release and address other potential liabilities, as well as the costs associated with any interruption of operations, could be substantial. Although we maintain significant insurance coverage for such events, it may not cover all potential losses or liabilities.
In the event that personal injuries or deaths result from such events, or there are natural resource damages, we would likely incur substantial legal costs and liabilities. The extent of these costs and liabilities could exceed the limits of our available insurance. As a result, any such event could have a material adverse effect on our business, financial condition, results of operations and cash flows.
The costs, scope, timelines and benefits of our refining projects may deviate significantly from our original plans and estimates.
We may experience unanticipated increases in the cost, scope and completion time for our improvement, maintenance and repair projects at our refineries. Refinery projects are generally initiated to increase the yields of higher-value products, increase our ability to process a variety of crude oils,oil, increase production capacity, meet new regulatory requirements or maintain the safe and reliable operations of our existing assets. Equipment that we require to complete these projects may be unavailable to us at expected costs or within expected time periods. Additionally, employee or contractor labor expense may exceed our expectations. Due to these or other factors beyond our control, we may be unable to complete these projects within anticipated cost parameters and timelines.
In addition, the benefits we realize from completed projects may take longer to achieve and/or be less than we anticipated. Large-scale capital projects are typically undertaken in anticipation of achieving an acceptable level of return on the capital to be employed in the project. We base these forecasted project economics on our best estimate of future market conditions that are not within our control. Most large-scale projects take many years to complete, and during this multi-year period, market and other business conditions can change from those we forecast. Our inability to complete, and/or realize the benefits of refinery projects in a cost-efficient and timely manner, could have a material adverse effect on our business, financial condition and results of operations.
We depend upon our logistics segment for a substantial portion of the crude oil supply and refined product distribution networks that serve our Tyler, Big Spring and El Dorado refineries.
Our logistics segment consists of Delek Logistics, a publicly-traded master limited partnership, and our consolidated financial statements include its consolidated financial results. As of December 31, 2018,2019, we owned a 61.4% limited partner interest in Delek Logistics, and a 94.6% interest in Logistics GP, which owns the entire 2.0% general partner interest in Delek Logistics. Delek Logistics operates a system of crude oil and refined product pipelines, distribution terminals and tankage in Arkansas, Louisiana, Tennessee and Texas. Delek Logistics generates revenues by charging tariffs for transporting crude oil and refined products through its pipelines, by leasing pipeline capacity to third parties, by charging fees for terminalling refined products and other hydrocarbons and storing and providing other services at its terminals.
Our Tyler, El Dorado and Big Spring refineries are substantially dependent upon Delek Logistics' assets and services under several long-term pipeline and terminal, tankage and throughput agreements expiring in 2024 through 2033. Delek Logistics is subject to its own operating and regulatory risks, including, but not limited to:
its reliance on significant customers, including us;
macroeconomic factors, such as commodity price volatility that could affect its customers' utilization of its assets;
its reliance on us for near-term growth;
sufficiency of cash flow for required distributions;
counterparty risks, such as creditworthiness and force majeure;
competition from third-party pipelines and terminals and other competitors in the transportation and marketing industries;
environmental regulations;
operational hazards and risks;
pipeline tariff regulations;
limitations on additional borrowings and other restrictions in its debt agreements; and
other financial, operational and legal risks.
The occurrence of any of these factors could directly or indirectly affect Delek Logistics' financial condition, results of operations and cash flows. Because Delek Logistics is our consolidated subsidiary, the occurrence of any of these risks could also affect our financial condition, results of
operations and cash flows. Additionally, if any of these risks affect Delek Logistics' viability, its ability to serve our supply and distribution needs may be jeopardized.
For additional information about Delek Logistics, see "Logistics Segment" under Item 1 & 2, Business and Properties, of this Annual Report on Form 10-K.
Interruptions or limitations in the supply and delivery of crude oil, or the supply and distribution of refined products, may negatively affect our refining operations and inhibit the growth of our refining operations.
We rely on Delek Logistics and third-party transportation systems for the delivery of crude oil to our refineries. For example, during the year ended December 31, 2018,2019, we relied upon the West Texas Gulf pipeline for the delivery of approximately 71.3%73.3% of the crude oil processed by our Tyler and El Dorado refineries. We could experience an interruption or reduction of supply and delivery, or an increased cost of receiving crude oil, if the ability of these systems to transport crude oil is disrupted because of accidents, adverse weather conditions, governmental regulation, terrorism, maintenance or failure of pipelines or other delivery systems, other third-party action or other events beyond our control. The unavailability for our use, for a prolonged period of time, of any system of delivery of crude oil could have a material adverse effect on our business, financial condition orand results of operations. Pipeline suspensions like these could require us to operate at reduced throughput rates.
Moreover, interruptions in delivery or limitations in delivery capacity may not allow our refining operations to draw sufficient crude oil to support current refinery production or increases in refining output. In order to maintain or materially increase refining output, existing crude delivery systems may require upgrades or supplementation, which may require substantial additional capital expenditures.
In addition, the El Dorado, Big Spring and Krotz Springs refineries distribute most of their light product production through a third-party pipeline system. An interruption to, or change in, the operation of the third-party pipeline system may result in a material restriction to our distribution channels. Because demand in the local markets is limited, a material restriction to each of the refinery's distribution channels may cause us to reduce production and may have a material adverse effect on our business, financial condition and results of operations.
We could experience an interruption or reduction of supply or delivery of refined products if our suppliers partially or completely ceased operations, temporarily or permanently. The ability of these refineries and our suppliers to supply refined products to us could be temporarily disrupted by anticipated events, such as scheduled upgrades or maintenance, as well as events beyond their control, such as unscheduled maintenance, fires, floods, storms, explosions, power outages, accidents, acts of terrorism or other catastrophic events, labor difficulties and work stoppages, governmental or private party litigation, or legislation or regulation that adversely impacts refinery operations. In addition, any reduction in capacity of other pipelines that connect with our suppliers' pipelines or our pipelines due to testing, line repair, reduced operating pressures, or other causes could result in reduced volumes of refined product supplied to our logistics segment's westWest Texas terminals. A reduction in the volume of refined products supplied to our West Texas terminals could adversely affect our sales and earnings.
We are subject to risks associated with significant investments in the Permian Basin.
We and our joint ventures have made and are continuing to make significant investments in infrastructure to gather crude oil from the Permian Basin in West Texas. Similar investments have been made and additional investments may be made in the future by us, our competitors or by new entrants to the markets we serve. The success of these and similar projects largely relies on the realization of anticipated market demand and growth in production in the Permian Basin. These projects typically require significant development periods, during which time demand for such infrastructure may change, production in the Permian Basin may decrease, or additional investments by competitors may be made. Lower production in the Permian Basin, or further investments by us or others in new pipelines, storage or dock capacity could result in capacity that exceeds demand, which could reduce the utilization of our gathering system and midstream assets and the related services or the prices we are able to charge for those services. There are several projects currently underway that are expected to increase pipeline capacity from the Permian Basin beyond current production. This excess capacity could decrease the differential between the Permian and end markets, resulting in a highly competitive environment for transportation services and reducing the rates for those services. When infrastructure investments in the markets we serve result in capacity that exceeds the demand in those markets, our facilities or investments could be underutilized, and rates could be unfavorably impacted, which could materially adversely affect our results of operations, financial position or cash flows, as well as our ability to pay cash distributions.
Our retail segment is dependent on fuel sales, which makes us susceptible to increases in the cost of gasoline and interruptions in fuel supply.
Our dependence on fuel sales makes us susceptible to increases in the cost of gasoline and diesel fuel, and fuel profit margins have a significant impact on our earnings. The volume of fuel sold by us, and our fuel profit margins, are affected by numerous factors beyond our control, including the supply and demand for fuel, volatility in the wholesale fuel market and the pricing policies of competitors in local markets. Although we can rapidly adjust our pump prices to reflect higher fuel costs, a material increase in the price of fuel could adversely affect demand. A material, sudden increase in the cost of fuel that causes our fuel sales to decline could have a material adverse effect on our business, financial condition and results of operations.
In addition, credit card interchange fees are typically calculated as a percentage of the transaction amount rather than a percentage of gallons sold. Higher refined product prices often result in negative consequences for our retail operations, such as higher credit card expenses,
lower retail fuel gross margin per gallon and reduced demand for gasoline and diesel. These conditions could result in fewer retail gallons sold and fewer retail merchandise transactions, which could have a material adverse effect on our business, financial condition and results of operations.
Our dependence on fuel sales also makes us susceptible to interruptions in fuel supply. Gasoline sales generate customer traffic to our retail fuel and convenience stores, and any decrease in gasoline sales, whether due to shortage or otherwise, could adversely affect our merchandise sales. A serious interruption in the supply of gasoline to our retail fuel and convenience stores could have a material adverse effect on our business, financial condition and results of operations.
General economic conditions may adversely affect our business, operating results and financial condition.
Economic slowdowns may have serious negative consequences for our business and operating results, because our performance is subject to domestic economic conditions and their impact on levels of consumer spending. Some of the factors affecting consumer spending include general economic conditions, unemployment, consumer debt, reductions in net worth based on declines in equity markets and residential real estate values, adverse developments in mortgage markets, taxation, energy prices, interest rates, consumer confidence and other macroeconomic factors. Political instability and global health crises, such as the recent outbreak of the novel coronavirus, can also impact the global economy and decrease worldwide demand for oil and refined products. During a period of economic weakness or uncertainty, current or potential customers may travel less, reduce or defer purchases, go out of business or have insufficient funds to buy or pay for our products and services. Moreover, a financial market crisis may have a material adverse impact on financial institutions and limit access to capital and credit. This could, among other things, make it more difficult for us to obtain (or increase our cost of obtaining) capital and financing for our operations. Our access to additional capital may not be available on terms acceptable to us or at all.
Also, because all of our operating refineries are located in the Gulf Coast Region, we primarily market our refined products in a relatively limited geographic area. As a result, we are more susceptible to regional economic conditions compared to our more geographically diversified competitors, and any unforeseen events or circumstances that affect the Gulf Coast Region could also materially and adversely affect our revenues and cash flows. The primary factors include, among other things, changes in the economy, weather conditions, demographics and population, increased supply of refined products from competitors and reductions in the supply of crude oil or other feedstocks. In the event of a shift in the supply/demand balance in the Gulf Coast Region due to changes in the local economy, an increase in aggregate refining capacity or other reasons, resulting in supply exceeding the demand in the region, our refineries may have to deliver refined products to more customers outside of the Gulf Coast Region and thus incur considerably higher transportation costs, resulting in lower refining margins, if any.
Additionally, general economic conditions in westWest Texas are highly dependent upon the price of crude oil. When crude oil prices exceed certain dollar per barrel thresholds, demand for people and equipment to support drilling and completion activities for the production of crude oil is robust, which supports overall economic health of the region. If crude oil prices fall below certain dollar per barrel thresholds, economic activity in the region may slow down, which could have a material adverse impact on the profitability of our business in westWest Texas.
The termination or expiration of our supply and offtake agreements could have a material adverse effect on our liquidity.
Our supply and offtake agreements with J. Aron & Company ("J. Aron") have expiration dates ranging from April 2020 to May 2021. Pursuant to the agreements, J. Aron purchases a substantial portion of the crude oil and refined products in our refineries' inventory at market prices. Upon any termination of the agreements, including at expiration or in connection with a force majeure or default, the parties are required to negotiate with third parties for the assignment to us of certain contracts, commitments and arrangements, including procurement contracts, commitments for the sale of product and pipeline, terminalling, storage and shipping arrangements. Additionally, effective as of the December 2018 and January 2019 amendments to the agreements, upon any termination, we will be required to repurchase or refinance the consigned crude oil and refined products from J. Aron at fixed prices for baseline volumes, and will be repaid or will pay for any inventory volumes over/short the baseline volumes based on current market prices at the date of termination.
If there is negative publicity concerning our brand names or the brand names of our suppliers, fuel and merchandise sales in our retail segment may suffer.
Negative publicity, regardless of whether the concerns are valid, concerning food, beverage, fuel or other product quality, food, beverage or other product safety or other health concerns, facilities, employee relations or other matters may materially and adversely affect demand for products offered at our stores and could result in a decrease in customer traffic to our stores. We offer food products in our stores that are marketed under our brand names and certain nationally recognized brands. These nationally recognized brands have significant operations at facilities owned and operated by third parties and negative publicity concerning these brands as a result of events that occur at facilities that we do not control could also adversely affect customer traffic to our stores. Additionally, we may be the subject of complaints or litigation arising from food or beverage-related illness or injury in general which could have a negative impact on our business. Health concerns, poor food, beverage, fuel or other product quality or operating issues stemming from one store or a limited number of stores can materially and adversely affect the operating results of some or all of our stores and harm our proprietary brands.
Wholesale cost increases, vendor pricing programs and tax increases applicable to tobacco products, as well as campaigns to discourage their use, could adversely impact our results of operations in our retail segment.
Increases in the retail price of tobacco products as a result of increased taxes or wholesale costs could materially impact our cigarette sales volume and/or revenues, merchandise gross profit and overall customer traffic. Cigarettes are subject to substantial and increasing excise taxes at both a state and federal level. In addition, national and local campaigns to discourage the use of tobacco products may have an adverse effect
on demand for these products. A reduction in cigarette sales volume and/or revenues, merchandise gross profit from tobacco products or overall customer demand for tobacco products could have a material adverse effect on the business, financial condition and results of operations of our retail segment.
MajorIn addition, major cigarette manufacturers currently offer substantial rebates to us; however, there can be no assurance that such rebate programs
will continue. We include these rebates as a component of our gross margin from sales of cigarettes. In the event these rebates are decreased or eliminated, or we fail to earn the rebates, our wholesale cigarette costs will increase. For example, certain major cigarette manufacturers have offered rebate programs that provide rebates only if we follow the manufacturer's retail pricing guidelines. If we do not receive the rebates, because we do not participate in the program or if the rebates we receive by participating in the program do not offset or surpass the revenue lost as a result of complying with the manufacturer's pricing guidelines, our cigarette gross margin will be adversely impacted. In general, we attempt to pass wholesale price increases on to our customers. However, competitive pressures in our markets may adversely impact our ability to do so. In addition, reduced retail display allowances on cigarettes offered by cigarette manufacturers negatively impact gross margins. These factors could materially impact our retail price of cigarettes, cigarette sales volume and/or revenues, merchandise gross profit and overall customer traffic, which could in turn have a material adverse effect on our business, financial condition and results of operations.
Our insurance policies do not cover all losses, costs or liabilities that we may experience, and insurance companies that currently insure companies in the energy industry may cease to do so or substantially increase premiums.
We carry property, business interruption, pollution, casualty and cyber insurance, but we do not maintain insurance coverage against all potential losses, costs or liabilities. We could suffer losses for uninsurable, or uninsured, risks or in amounts in excess of existing insurance coverage. In addition, we purchase insurance programs with large self-insured retentions and large deductibles. For example, we retain a short period of our business interruption losses. Therefore, a significant part, or all, of a business interruption loss or other types of loss could be retained by us. The occurrence of a loss that is retained by us, or not fully covered by insurance, could have a material adverse effect on our business, financial condition and results of operations.
The energy industry is highly capital intensive, and the entire or partial loss of individual facilities or multiple facilities can result in significant costs to both energy industry companies, such as us, and their insurance carriers. Historically, large energy industry claims have resulted in significant increases in the level of premium costs and deductible periods for participants in the energy industry. For example, hurricanes have caused significant damage to energy companies operating along the Gulf Coast, in addition to numerous oil and gas production facilities and pipelines in that region. Insurance companies that have historically participated in underwriting energy-related risks may discontinue that practice, may reduce the insurance capacity they are willing to offer or demand significantly higher premiums or deductible periods to cover these risks. If significant changes in the number, or financial solvency, of insurance underwriters foravailable to the energy industry occur, or if other adverse conditions over which we have no control prevail in the insurance market, we may be unable to obtain and maintain adequate insurance at reasonable cost.
In addition, we cannot assure that our insurers will renew our insurance coverage on acceptable terms, if at all, or that we will be able to arrange for adequate alternative coverage in the event of non-renewal. The unavailability of full insurance coverage to cover events in which we suffer significant losses could have a material adverse effect on our business, financial condition and results of operations.
We may not be able to successfully execute our strategy of growth through acquisitions.
A significant part of our growth strategy is to acquire assets, such as refineries, pipelines, terminals, and retail fuel and convenience stores that complement our existing assets and/or broaden our geographic presence. If attractive opportunities arise, we may also acquire assets in new lines of business that are complementary to our existing businesses. In the past we have acquired refineries, and we have developed our logistics segment through the acquisition of transportation and marketing assets. We expect to continue to acquire assets that complement our existing assets and/or broaden our geographic presence as a major element of our growth strategy. However, the occurrence of any of the following factors could adversely affect our growth strategy:
We may not be able to identify suitable acquisition candidates or acquire additional assets on favorable terms;
We usually compete with others to acquire assets, which competition may increase, and any level of competition could result in decreased availability or increased prices for acquisition candidates;
We may experience difficulty in anticipating the timing and availability of acquisition candidates;
We may not be able to obtain the necessary financing, on favorable terms or at all, to finance any of our potential acquisitions; and
As a public company, we are subject to reporting obligations, internal controls and other accounting requirements with respect to any business we acquire, which may prevent or negatively affect the valuation of some acquisitions we might otherwise deem favorable or increase our acquisition costs.
Acquisitions involve risks that could cause our actual growth or operating results to differ adversely compared with our expectations.
Due to our emphasis on growth through acquisitions, we are particularly susceptible to transactional risks that could cause our actual growth or operating results to differ adversely compared with our expectations. For example:
during the acquisition process, we may fail, or be unable, to discover some of the liabilities of companies or businesses that we acquire;
we may assume contracts or other obligations in connection with particular acquisitions on terms that are less favorable or desirable than the terms that we would expect to obtain if we negotiated the contracts or other obligations directly;
we may fail to successfully integrate or manage acquired assets;
acquired assets may not perform as we expect, or we may not be able to obtain the cost savings and financial improvements we anticipate;
acquisitions may require us to incur additional debt or issue additional equity;
acquired assets may suffer a diminishment in fair value as a result of which we may need to record a write-down or impairment;
we may fail to grow our existing systems, financial controls, information systems, management resources and human resources in a manner that effectively supports our growth;
to the extent that we acquire assets in new lines of business, we may become subject to additional regulatory requirements and additional risks that are characteristic or typical of these lines of business; and
to the extent that we acquire equity interests in entities that control assets (rather than acquiring the assets directly), we may become subject to liabilities that predate our ownership and control of the assets.
The occurrence of any of these factors could materially and adversely affect our business, financial condition or results of operations.
Our future results will suffer if we do not effectively manage our expanded operations.
The size and scope of operations of our business have increased .increased. In addition, we may continue to expand our size and operations through additional acquisitions or other strategic transactions. Our future success depends, in part, upon our ability to manage our expanded business, which may pose substantial challenges for management, including challenges related to the management and monitoring of new operations including, without limitation, integrating new operations with those of our existing business, managing the increased scope or geographic diversity of our expanded business, and associated increased costs and complexity. There can be no assurance that we will be successful, or that we will realize the expected economies of scale, synergies and other benefits anticipated from any additional acquisitions or strategic transactions.
We may incur significant costs and liabilities with respect to investigation and remediation of environmental conditions at our facilities.
Prior to our purchase of our refineries, pipelines, terminals and other facilities, the previous owners had been engaged for many years in the investigation and remediation of hydrocarbons and other materials which contaminated soil and groundwater. Upon purchase of the facilities, we became responsible and liable for certain costs associated with the continued investigation and remediation of known and unknown impacted areas at the facilities. In the future, it may be necessary to conduct further assessments and remediation efforts at impacted areas at our facilities and elsewhere. In addition, we have identified and self-reported certain other environmental matters subsequent to our purchase of our facilities.
Based upon environmental evaluations performed internally and by third parties, we recorded and periodically update environmental liabilities and accrued amounts we believe are sufficient to complete remediation. We expect investigational remediation at some properties to continue for the foreseeable future. The need to make future expenditures for these purposes that exceed the amounts we estimated and accrued for could have a material adverse effect on our business, financial condition and results of operations.
In addition, Alon indemnified certain parties, to which they sold assets, for costs and liabilities that may be incurred as a result of environmental conditions existing at the time of such sales. As a result of our purchase of Alon, if we are forced to incur costs or pay liabilities in connection with these indemnification obligations, such costs and payments could be significant.
In the future, we may incur substantial expenditures for investigation or remediation of contamination that has not been discovered at our current or former locations or locations that we may acquire, or at third party sites where hazardous substances from these locations have been treated or disposed. Our handling and storage of petroleum and hazardous substances may lead to additional contamination at our facilities or along our pipelines and at facilities to which we send or have sent wastes or by-products for treatment or disposal. In addition, new legal requirements, new interpretations of existing legal requirements, increased legislative activity and governmental enforcement and other developments could require us to make additional unforeseen expenditures. As a result, we may be subject to additional investigation and remediation costs, governmental penalties and third partythird-party suits alleging personal injury and property damage. Joint and several strict liability may be incurred in connection with releases of petroleum hydrocarbons, hazardous substances and/or wastes. Liabilities for future remediation costs are recorded when environmental assessments and/or remedial efforts are probable and the costs can be reasonably estimated as material. Other than for assessments, the timing and magnitude of these accruals generally are based on the completion of investigations or other studies or a commitment to a formal plan of action.
We could incur substantial costs or disruptions in our business if we cannot obtain or maintain necessary permits and authorizations or otherwise comply with health, safety, environmental and other laws and regulations.
Our operations require numerous permits and authorizations under various laws and regulations. These authorizations and permits are subject to revocation, renewal or modification, and can require operational changes to limit impacts or potential impacts on the environment and/or health and safety. A violation of authorization or permit conditions or other legal or regulatory requirements could result in substantial fines, criminal sanctions, permit revocations, injunctions and/or facility shutdowns. In addition, major modifications of our operations could require modifications to our existing permits or upgrades to our existing pollution control equipment. Any, or all, of these matters could have a negative effect on our business, results of operations and cash flows.
Our Tyler refinery currently primarily distributes refined petroleum products via truck or rail. We do not have the ability to distribute these products into markets outside our local market via pipeline.
In recent years, we have expanded our refined product distribution capabilities in northeast Texas with our acquisition of refined product terminals in Big Sandy and Mt. Pleasant, Texas and through the use of transloading facilities enabling the shipment of products by rail to distant markets, including Mexico. However, unlike most refineries, the Tyler refinery currently has limited ability to distribute refined products outside its local market in northeast Texas due to a lack of pipeline assets connecting the facility to other markets. This limited ability may limit the refinery’s ability to increase the production of petroleum products, attract new customers for its refined petroleum products or increase sales of products from the refinery. In addition, if demand for petroleum products diminishes in northeast Texas, the refinery may be required to reduce production levels and our financial results may be adversely affected.
An increase in competition, and/or reduction in demand in the markets in which we purchase feedstocks and sell our refined products, could increase our costs and/or lower prices and adversely affect our sales and profitability.
Certain of our refineries operate in localized or niche markets. If competitors commence operations within these niche markets, we could lose our niche market advantage, which could have a material adverse effect on our business, financial condition and results of operations. Additionally, where feedstocks are purchased in a localized market, disruptions in supply channels could significantly impact our ability to meet production demands in those facilities.
In addition, the maintenance, or replacement, of our existing customers depends on a number of factors outside of our control, including increased competition from other suppliers and demand for refined products in the markets we serve. The market for distribution of wholesale motor fuel is highly competitive and fragmented. Some of our competitors have significantly greater resources and name recognition than us. The loss of major customers, or a reduction in amounts purchased by major customers, could have ana material adverse effect on us to the extent that we are not able to correspondingly increase sales to other purchasers.
Compliance with and changes in tax laws could adversely affect our performance.
We are subject to extensive tax liabilities, including federal and state income taxes and transactional taxes, such as excise, sales/use, payroll, franchise, withholding and ad valorem taxes. New tax laws and regulations, and changes in existing tax laws and regulations, are continuously being enacted or proposed that could result in increased expenditures for tax liabilities in the future. Certain of these liabilities are subject to periodic audits by the respective taxing authority, which could increase or otherwise alter our tax liabilities. Subsequent changes to our tax liabilities as a result of these audits may also subject us to interest and penalties, and could have a material adverse effect on our business, financial condition and results of operations.
For example, the tax treatment of our logistics segment depends on its status as a partnership for federal income tax purposes. If a change in law, our failure to comply with existing law or other factors were to cause our logistics segment to be treated as a corporation for federal income tax purposes, it would become subject to entity-level taxation. As a result, our logistics segment would pay federal income tax on all of its taxable income at regular corporate income tax rates (subject to corporate alternative minimum tax for years ended prior to 2018), would likely pay additional state and local income taxes at varying rates, and distributions to unitholders, including us, would be generally treated as taxable dividends from a corporation. In such case, the logistics segment would likely experience a material reduction in its anticipated cash flow and after-tax return to its unitholders, and we would likely experience a substantial reduction in its value.
In addition, recent regulatory proposals in the United States could effectively limit, or even eliminate, use of the LIFO inventory method for financial purposes. Although the final outcome of these proposals cannot be ascertained at this time, the ultimate impact to us of the transition from LIFO to another inventory method could be material. We use the LIFO method with respect to our inventories at the Tyler refinery.
On December 22, 2017, tax legislation commonly known as the Tax Cuts and Jobs Act ("Tax Reform Act") was enacted. In the absence of guidance on various uncertainties and ambiguities in the application of certain provisions of the Tax Reform Act, we will use what we believe are reasonable interpretations and assumptions in applying the Tax Reform Act, but it is possible that the IRS could issue subsequent guidance or take positions on audit that differ from our prior interpretations and assumptions, which could adversely impact our cash tax liabilities, results of operations, and financial condition.
Adverse weather conditions or other unforeseen developments could damage our facilities, reduce customer traffic and impair our ability to produce and deliver refined petroleum products or receive supplies for our retail fuel and convenience stores.
The regions in which we operate are susceptible to severe storms, including hurricanes, thunderstorms, tornadoes, floods, extended periods of rain, ice storms and snow, all of which we have experienced in the past few years. Our facilities located in California and the related pipeline are located in areas with a history of earthquakes, some of which have been quite severe. In addition, for a variety of reasons, many members of the scientific community believe that climate changes are occurring that could have significant physical effects, such as increased frequency and severity of storms, droughts and floods and other climatic events. If any such effects were to occur, they could have an adverse effect on our assets and operations.
Inclement weather conditions, earthquakes or other unforeseen developments could damage our facilities, interrupt production, adversely impact consumer behavior, travel and retail fuel and convenience store traffic patterns or interrupt or impede our ability to operate our locations. If such conditions prevail near our refineries, they could interrupt or undermine our ability to produce and transport products from our refineries and receive and distribute products at our terminals. Regional occurrences, such as energy shortages or increases in energy prices, fires and other natural disasters, could also hurt our business. The occurrence of any of these developments could have a material adverse effect on our business, financial condition and results of operations.
Our operating results are seasonal and generally lower in the first and fourth quarters of the year for our refining and logistics segments and in the first quarter of the year for our retail segment. We depend on favorable weather conditions in the spring and summer months.
Demand for gasoline, convenience merchandise and asphalt products is generally higher during the summer months than during the winter months due to seasonal increases in motor vehicle traffic and road and home construction. Varying vapor pressure requirements between the summer and winter months also tighten summer gasoline supply. As a result, the operating results of our refining segment and logistics segment are generally lower for the first and fourth quarters of each year. Seasonal fluctuations in traffic also affect sales of motor fuels and merchandise in our retail fuel and convenience stores. As a result, the operating results of our retail segment are generally lower for the first quarter of the year.
Weather conditions in our operating area also have a significant effect on our operating results in our retail segment. Customers are more likely to purchase more gasoline and higher profit margin items such as fast foods, fountain drinks and other beverages during the spring and summer months. Unfavorable weather conditions during these months and a resulting lack of the expected seasonal upswings in traffic and sales could have a material adverse effect on our business, financial condition and results of operations.
A substantial portion of the workforce at our refineries is unionized, and we may face labor disruptions that would interfere with our operations.
As of December 31, 2018, 160 maintenance, production, operating2019, approximately 14.4% of our employees specific hourly safety employees, and regular storeroom hourly employees and 37 truck drivers at the Tyler refinery were represented by the United Steel, Paper and Forestry, Rubber, Manufacturing, Energy, Allied Industrial and Service Workers International Union and its Local 202. The Tyler maintenance, production, operating employees, specific hourly safety employees, and regular storeroom hourly employees are currently covered by a collective bargaining agreement that expires January 31, 2022. The Tyler truck drivers are currently covered by a collective bargaining agreement that expires May 1, 2021. As of December 31, 2018, 186 operations and maintenance hourly employees at the El Dorado refinery were represented by the International Union of Operating Engineers and its Local 381. These employees are covered by a collective bargaining agreement which expires on August 1, 2021. As of December 31, 2018, 33 of our El Dorado based drivers for Lion Oil Company were represented by the United Steel, Paper and Forestry, Rubber, Manufacturing, Energy, Allied Industrial and Service Workers International Union, American Federation of Labor and Congress of Industrial Organizations ("AFL-CIO"), but are not currentlyunions and/or covered by a collective bargaining agreement. As of December 31, 2018, 7None of our Texas based drivers for Lion Oil Company were employees in our logistics segment, retail segment or in our corporate office arerepresented by the United Steel, Paper and Forestry, Rubber, Manufacturing, Energy, Allied Industrial and Service Workers International Union, AFL - CIO and are covered by a collective bargaining agreement that expires June 5, 2021. As of December 31, 2018, 4 ofunion. We consider our El Dorado refinery warehouse technician hourlyrelations with our employees were represented byto be satisfactory. Although the International Union of Operating Engineers and its Local 381 and are covered by a collective bargaining agreement that expires January 11, 2022. As of December 31, 2018, approximately 143 employees who work at our Big Spring refinery are covered by a collective bargaining agreement that expires March 31, 2022. Although these collective bargaining agreements contain provisions to discourage strikes or work stoppages, we cannot assure that strikes or work stoppages will not occur. A strike or work stoppage could have a material adverse effect on our business, financial condition and results of operations.
We rely on information technology in our operations, and any material failure, inadequacy, interruption, cyber-attack or security failure of that technology could harm our business.
We rely on information technology across our operations, including the control of our refinery processes, monitoring the movement of petroleum through our pipelines and terminals, the point of sale processing at our retail sites and various other processes and transactions. We utilize information technology systems and controls throughout our operations to capture accounting, technical and regulatory data for subsequent archiving, analysis and reporting. Disruption, failure, or cyber security breaches affecting or targeting our computer and telecommunications, our infrastructure, or the infrastructure of our cloud-based IT service providers may materially impact our business and operations. An undetected failure of these systems, because of power loss, unsuccessful transition to upgraded or replacement systems, unauthorized access or other cyber breach or attack could result in disruption to our business operations, access to or disclosure or loss of data and/or proprietary information, personal injuries and environmental damage, which could have an adverse effect on our business, reputation, and effectiveness. We could also be subject to
resulting investigation and remediation costs as well as regulatory enforcement of private litigation and related costs, which could have ana material adverse impact on our cash flow and results of operations.
We rely on commercially available systems, software, tools and monitoring to provide security for processing, transmission and storage of confidential customer information, such as payment card and personal credit information.
In addition, the systems currently used for certain transmission and approval of payment card transactions, and the technology utilized in payment cards themselves, may put certain payment card data at risk. These standards for determining the required controls applicable to these systems are mandated by credit card issuers and administered by the Payment Card Industry Security Standards Counsel and not by us. The regulatory environment surrounding information security and privacy is increasingly demanding, with the frequent imposition of new and constantly changing requirements. We have taken the necessary steps to comply with the Payment Card Industry Data Security Standards (PCI-DSS) at all of our locations. However, compliance with these requirements may result in cost increases due to necessary systems changes and the development of new administrative processes.
In recent years, several retailers have experienced data breaches, resulting in the exposure of sensitive customer data, including payment card information. A breach could also originate from, or compromise, our customers' and vendors' or other third-party networks outside of our control. Any compromise or breach of our information and payment technology systems could cause interruptions in our operations, damage our reputation, reduce our customers' willingness to visit our sites and conduct business with them, or expose us to litigation from customers or sanctions for violations of the PCI-DSS. In addition, a compromise of our internal data network at any of our refining or terminal locations may have disruptive impacts similar to that of our retail operations. These disruptions could range from inconvenience in accessing business information to a disruption in our refining operations.
WeDespite our security measures, we experience attempts by external parties to penetrate and attack our networks and systems. Although such attempts to date have not, to our knowledge, resulted in any material breaches, disruptions, or loss of business-critical information, our systems and procedures for protecting against such attacks and mitigating such risks may prove to be insufficient in the future and such attacks could have an adverse impact on our business and operations, including damage to our reputation and competitiveness, remediation costs, litigation or regulatory actions. In addition, as technologies evolve, and these cyber security attackscyber-attacks become more sophisticated, we may incur significant costs to upgrade or enhance our security measures to protect against such attacks and we may face difficulties in fully anticipating or implementing adequate preventive measures or mitigating potential harm. We could also be liable under laws that protect the privacy of personal information, subject to
regulatory penalties, experience damage to our reputation or a loss of consumer confidence, or incur additional costs for remediation and modification or enhancement of our information systems to prevent future occurrences, all of which could adversely affect our reputation, business, operations or financial results.
If we lose any of our key personnel, our ability to manage our business and continue our growth could be negatively impacted.
Our future performance depends to a significant degree upon the continued contributions of our senior management team and key technical personnel. We do not currently maintain key person life insurance policies for any of our senior management team. The loss or unavailability to us of any member of our senior management team or a key technical employee could significantly harm us. We face competition for these professionals from our competitors, our customers and other companies operating in our industry. To the extent that the services of members of our senior management team and key technical personnel would be unavailable to us for any reason, we would be required to hire other personnel to manage and operate our company and to develop our products and technology. We cannot assure that we would be able to locate or employ such qualified personnel on acceptable terms or at all.
If we are, or become, a United States real property holding corporation, special tax rules may apply to a sale, exchange or other disposition of common stock, and non-U.S. holders may be less inclined to invest in our stock, as they may be subject to United States federal income tax in certain situations.
A non-U.S. holder of our common stock may be subject to United States federal income tax with respect to gain recognized on the sale, exchange or other disposition of our common stock if we are, or were, a "U.S. real property holding corporation" ("USRPHC") at any time during the shorter of the five-year period ending on the date of the sale or other disposition and the period such non-U.S. holder held our common stock (the shorter period referred to as the "lookback period"). In general, we would be a USRPHC if the fair market value of our "U.S. real property interests," as such term is defined for United States federal income tax purposes, equals or exceeds 50% of the sum of the fair market value of our worldwide real property interests and our other assets used or held for use in a trade or business. The test for determining USRPHC status is applied on certain specific determination dates and is dependent upon a number of factors, some of which are beyond our control (including, for example, fluctuations in the value of our assets). If we are or become a USRPHC, so long as our common stock is regularly traded on an established securities market such as the NYSE, only a non-U.S. holder who, actually or constructively, holds or held during the lookback period more than five percent of our common stock will be subject to United States federal income tax on the disposition of our common stock.
Loss of or reductions to tax incentives for biodiesel production may have a material adverse effect on earnings, profitability and cash flows relating to our renewable fuels facilities.
The biodiesel industry has historically been substantially aided by federal and state tax incentives. One tax incentive program that has been significant to our renewable fuels facilities is the federal blender's tax credit. The blender's tax credit provided(or biodiesel tax credit) provides a $1.00 refundable tax credit per gallon of pure biodiesel, or B100, to the first blender of biodiesel with petroleum-based diesel fuel. The blender's tax credit has expired on several occasions, only to be reinstated on a retroactive basis. Most recently,The blender's tax credit was re-enacted in December 2019 for the years 2020 through 2022 and was retroactively reinstated for 2018 and 2019. Previously, the blender's tax credit expired on December 31, 2016, but was retroactively reinstated during the first quarter of 2018 to extend through December 31, 2017. See Note 244 of the consolidated financial statements included in Item 8, Financial Statements and Supplementary Data, of this Annual Report on Form 10-K for further information regarding the extension of this tax credit.
It is uncertain what action, if any, Congress may take with respect to reinstating the blender's tax credit beyond 2022 or when such action might be effective. If Congress does not reinstate the credit for future years, it may result in a material adverse effect on the earnings, profitability and cash flows relating to our renewable fuels facilities.
Risks Related to Ownership of Our Common Stock
The price of our common stock may fluctuate significantly, and you could lose all or part of your investment.
The market price of our common stock may be influenced by many factors, some of which may be beyond our control, including:
our quarterly or annual earnings, or those of other companies in our industry;
inaccuracies in, and changes to, our previously published quarterly or annual earnings;
changes in accounting standards, policies, guidance, interpretations or principles;
economic conditions within our industry, as well as general economic and stock market conditions;
the failure of securities analysts to cover our common stock, or the cessation of such coverage;
changes in financial estimates by securities analysts and the frequency and accuracy of such reports;
future issuance or sales of our common stock;
announcements by us or our competitors of significant contracts or acquisitions;
sales of common stock by our senior officers or our affiliates; and
the other factors described in these "Risk Factors."
In recent years, the stock market in general, and the market for energy companies in particular, has experienced extreme price and volume fluctuations that have often been unrelated or disproportionate to the operating performance of those companies. This volatility has had a significant impact on the market price of securities issued by many companies, including companies in our industry. The trading price of Delek common stock and, prior to the Delek/Alon Merger, Old Delek common stock, has been volatile over the past three years. The changes often occur without any apparent regard to the operating performance of these companies, and these fluctuations could materially reduce our stock price.
Stockholder activism may negatively impact the price of our common stock.
Our stockholders may from time to time engage in proxy solicitations, advance stockholder proposals or otherwise attempt to effect changes or acquire control over us. Campaigns by stockholders to effect changes at publicly traded companies are sometimes led by investors seeking to increase short-term stockholder value through actions such as financial restructuring, increased debt, special dividends, stock repurchases or sales of assets or the entire company. Responding to proxy contests and other actions by activist stockholders can be costly and time-consuming, disrupting our operations and diverting the attention of our Board of Directors and senior management from the pursuit of business strategies. As a result, stockholder campaigns could adversely affect our results of operations, financial condition and cash flows.
Future sales of shares of our common stock could depress the price of our common stock, and could result in substantial dilution to our stockholders.
We may sell securities in the public or private equity markets, regardless of our need for capital, and even when conditions are not otherwise favorable. The market price of our common stock could decline as a result of the introduction of a large number of shares of our common stock into the market or the perception that these sales could occur. Sales of a large number of shares of our common stock, or the possibility that these sales may occur, also might make it more difficult for us to sell equity securities in the future at a time and at a price that we deem appropriate.
Our stockholders will suffer dilution if we issue currently unissued shares of our stock or sell our treasury holdings in the future. Our stockholders will also suffer dilution as stock, restricted stock units, stock options, stock appreciation rights, warrants or other equity awards, whether currently outstanding or subsequently granted, are exercised.
We depend upon our subsidiaries for cash to meet our obligations and pay any dividends.
We are a holding company. Our subsidiaries conduct substantially all of our operations and own substantially all of our assets. Consequently, our cash flow and our ability to meet our obligations or pay dividends to our stockholders depend upon the cash flow of our subsidiaries and the payment of funds by our subsidiaries to us in the form of dividends, distributions, tax sharing payments or otherwise. Our subsidiaries' ability to make any payments will depend on many factors, including their earnings, cash flows, the terms of any applicable credit facilities, tax considerations and legal restrictions.
We may be unable to pay future regular dividends in the anticipated amounts and frequency set forth herein.
We will only be able to pay regular dividends from our available cash on hand and funds received from our subsidiaries. Our ability to receive dividends and other cash payments from our subsidiaries may be restricted under the terms of any applicable credit facilities. For example, under the terms of their credit facilities, Delek Logistics and its subsidiaries are subject to certain customary covenants that limit their ability to, subject to certain exceptions as defined in their respective credit agreements, remit cash to, distribute assets to, or make investments in us as the parent company. Specifically, these covenants limit the payment, in the form of cash or other assets, of dividends or other cash payments to us. The declaration of future regular dividends on our common stock will be at the discretion of our Board of Directors and will depend upon many factors, including our results of operations, financial condition, earnings, capital requirements, restrictions in our debt agreements and legal requirements. Although we currently intend to pay regular quarterly cash dividends on our common stock, we cannot provide any assurances that any regular dividends will be paid in the anticipated amounts and frequency set forth herein, if at all.
Provisions of Delaware law and our organizational documents may discourage takeovers and business combinations that our stockholders may consider in their best interests, which could negatively affect our stock price.
Provisions of Delaware law, our Amended and Restated Certificate of Incorporation and our Amended and Restated Bylaws may have the effect of delaying or preventing a change in control of our company or deterring tender offers for our common stock that other stockholders may consider in their best interests. For example, our Amended and Restated Certificate of Incorporation provides that:
stockholder actions may only be taken at annual or special meetings of stockholders;
members of our Board of Directors can be removed with or without cause by a supermajority vote of stockholders;
the Court of Chancery of the State of Delaware is, with certain exceptions, the exclusive forum for certain legal actions;
our bylaws, as may be in effect from time to time, can be amended only by a supermajority vote of stockholders; and
certain provisions of our certificate of incorporation, as may be in effect from time to time, can be amended only by a supermajority vote of stockholders.
In addition, our Amended and Restated Certificate of Incorporation authorizes us to issue up to 10,000,000 shares of preferred stock in one or more different series, with terms to be fixed by our Board of Directors. Stockholder approval is not necessary to issue preferred stock in this manner. Issuance of these shares of preferred stock could have the effect of making it more difficult and more expensive for a person or group to acquire control of us and could effectively be used as an anti-takeover device. On the date of this report, no shares of our preferred stock are outstanding.
Finally, our Amended and Restated Bylaws provide for an advance notice procedure for stockholders to nominate director candidates for election or to bring business before an annual meeting of stockholders and require that special meetings of stockholders be called only by our chairman of the Board of Directors, president or secretary after written request of a majority of our Board of Directors. The advance notice provision requires disclosure of derivative positions, hedging transactions, short interests, rights to dividends and other similar positions of any stockholder proposing a director nomination, in order to promote full disclosure of such stockholder's economic interest in us.
The anti-takeover provisions of Delaware law and provisions in our organizational documents may prevent our stockholders from receiving the benefit from any premium to the market price of our common stock offered by a bidder in a takeover context. Even in the absence of a takeover attempt, the existence of these provisions may adversely affect the prevailing market price of our common stock if they are viewed as discouraging takeover attempts in the future.
Financial Instrument and Credit Profile Risks
Changes in our credit profile could affect our relationships with our suppliers, which could have a material adverse effect on our liquidity and our ability to operate our refineries at full capacity.
Changes in our credit profile could affect the way crude oil, feedstock and refined product suppliers view our ability to make payments. As a result, suppliers could shorten the payment terms of their invoices with us, or require us to provide significant collateral to them that we do not currently provide. Due to the large dollar amounts and volume of our crude oil and other petroleum product purchases, as well as the historical volatility of crude oil pricing, any imposition by our suppliers of more burdensome payment terms, or collateral requirements, may have a material adverse effect on our liquidity and our ability to make payments to our suppliers. This, in turn, could cause us to be unable to operate our refineries at desired capacities. A failure to operate our refineries at desired capacities could adversely affect our profitability and cash flows.
Our commodity and interest rate derivative activity may limit potential gains, increase potential losses, result in earnings volatility and involve other risks.
At times, we enter into commodity derivative contracts to manage our price exposure to our inventory positions, future purchases of crude oil, ethanol and other feedstocks, future sales of refined products, manage our RINs exposure or to secure margins on future production. At times we also enter into interest rate swap and cap agreements to manage our market exposure to changes in interest rates related to our floating rate borrowings. We expect to continue to enter into these types of transactions from time to time and have increased our use of commodity risk management activities in recent years.
While these transactions are intended to limit our exposure to the adverse effects of fluctuations in crude oil prices, refined products prices, RIN prices and interest rates, they may also limit our ability to benefit from favorable changes in market conditions, and may subject us to period-by-period earnings volatility in the instances where we do not seek hedge accounting for these transactions. Further, depending on the volume of commodity derivative activity as compared to our actual use of crude oil, production of refined products or total RINs exposure, our risk management activity may only partially limitslimit our exposure to market volatility. Also, in connection with such derivative transactions, we may be required to make cash payments or provide letters of credit to maintain margin accounts and to settle the contracts at their value upon termination. Finally, this activity exposes us to potential risk of counterparties to our derivative contracts failing to perform under the contracts. As a result, the effectiveness of our risk management policies could have a material adverse impact on our business, results of operations and cash flows. For additional information about the nature and volume of these transactions, see Item 7A, Quantitative and Qualitative Disclosures about Market Risk, of this Annual Report on Form 10-K.
Additionally, it continues to be a strategic and operational objective to manage supply risk related to crude oil that is used in refinery production, and to develop strategic sourcing relationships. For that purpose, we often enter into purchase and sale contracts with vendors and customers or take financial commodity positions for crude oil that may not be used immediately in production, but that may be used to manage the overall supply and availability of crude expected to ultimately be needed for production and/or to meet minimum requirements under strategic pipeline arrangements, and also to optimize and hedge availability risks associated with crude that we ultimately expect to use in production. Such transactions are inherently based on certain assumptions and judgments made about the current and possible future availability of crude. Therefore, when we take physical or financial positions for optimization purposes, our intent is generally to take offsetting positions in quantities and at prices that will advance these objectives while minimizing our positional and financial statement risk. However, because of the volatility of the market in terms of pricing and availability, it is possible that we may have material positions with timing differences or, more rarely, that we are unable to cover a position with an offsetting position as intended. Also, in connection with such transactions, we may be required to make cash payments or provide letters of credit to maintain margin accounts and to settle the contracts at their value upon termination. Finally, this activity exposes us to potential risk of counterparties to our derivative contracts failing to perform under the contracts.
As a result of the risks described above, the effectiveness of our risk management policies over these types of transactions and positions could have a material adverse impact on our business, results of operations and cash flows. For additional information about the nature and volume of these transactions, see Item 7A, Quantitative and Qualitative Disclosures about Market Risk, of this Annual Report on Form 10-K and in Note 12 of our consolidated financial statements included in Item 8, Financial Statements and Supplementary Data, of this Annual Report on Form 10-K.
We are exposed to certain counterparty risks which may adversely impact our results of operations.
We evaluate the creditworthiness of each of our various counterparties, but we may not always be able to fully anticipate or detect deterioration in a counterparty's creditworthiness and overall financial condition. The deterioration of creditworthiness or overall financial condition of a material counterparty (or counterparties) could expose us to an increased risk of nonpayment or other default under our contracts with them. If a material counterparty (or counterparties) defaults on their obligations to us, this could materially adversely affect our financial condition, results of operations or cash flows. For example, under the terms of the supply and offtake agreements with J. Aron, we grant J. Aron the exclusive right to store and withdraw crude and certain products in the tanks associated with the El Dorado, Big Spring and Krotz Springs refineries. These agreements also provide that the ownership of substantially all crude oil and certain other refined products in the tanks associated with these refineries will be retained by J. Aron, and that J. Aron will purchase substantially all of the specified refined products processed at these refineries. An adverse change in J. Aron's business, results of operations, liquidity or financial condition could adversely affect its ability to timely discharge its obligations to us, which could consequently have a material adverse effect on our business, results of operations or liquidity.
From time to time, our cash and credit needs may exceed our internally generated cash flow and available credit, and our business could be materially and adversely affected if we are not able to obtain the necessary cash or credit from financing sources.
We have significant short-term cash needs to satisfy working capital requirements, such as crude oil purchases which fluctuate with the pricing and sourcing of crude oil. We rely in part on our access to credit to purchase crude oil for our refineries. If the price of crude oil increases significantly, we may not have sufficient available credit, and may not be able to sufficiently increase such availability, under our existing credit facilities or other arrangements, to purchase enough crude oil to operate our refineries at desired capacities. Our failure to operate our refineries at desired capacities could have a material adverse effect on our business, financial condition and results of operations. We also have significant long-term needs for cash, including any capital expenditures for growth projects, sustaining maintenance, as well as projects necessary for regulatory compliance.
Depending on the conditions in the credit markets, it may become more difficult to obtain cash or credit from third-party sources. If we cannot generate cash flow or otherwise secure sufficient liquidity to support our short-term and long-term capital requirements, we may not be able to comply with regulatory deadlines or pursue our business strategies, in which case our operations may not perform as well as we currently expect.
Our debt levels may limit our flexibility in obtaining additional financing and in pursuing other business opportunities.
As of December 31, 2018,2019, we had total debt of $1,783.3$2,067.1 million, including current maturities of $32.0$36.4 million. In addition to our outstanding debt, as of December 31, 2018,2019, our letters of credit issued under our various credit facilities were $179.4$309.8 million. Our borrowing availability under our various credit facilities as of December 31, 20182019 was $913.9$921.8 million.
Our level of debt could have important consequences for us. For example, it could:
increase our vulnerability to general adverse economic and industry conditions;
require us to dedicate a substantial portion of our cash flow from operations to service our debt and lease obligations, thereby reducing the availability of our cash flow to fund working capital, capital expenditures and other general corporate purposes;
limit our flexibility in planning for, or reacting to, changes in our business and the industry in which we operate;
place us at a disadvantage relative to our competitors that have less indebtedness or better access to capital by, for example, limiting our ability to enter into new markets, upgrade our refiningfixed assets or pursue acquisitions or other business opportunities;
limit our ability to borrow additional funds in the future; and
increase interest costs for our borrowed funds and letters of credit.
In addition, a substantial portion of our debt has a variable rate of interest, which increases our exposure to interest rate fluctuations, to the extent we elect not to hedge such exposures.
If we are unable to meet our principal and interest obligations under our debt and lease agreements, we could be forced to restructure or refinance our obligations, seek additional equity financing or sell assets, which we may not be able to do on satisfactory terms or at all. Our default on any of those agreements could have a material adverse effect on our business, financial condition and results of operations. In addition, if new debt is added to our current debt levels, the related risks that we now face could intensify.
Our debt agreements contain operating and financial restrictions that might constrain our business and financing activities.
The operating and financial restrictions and covenants in our credit facilities and any future financing agreements could adversely affect our ability to finance future operations or capital needs or to engage in, expand or pursue our business activities. For example, to varying degrees our credit facilities restrict our ability to:
declare dividends and redeem or repurchase capital stock;
prepay, redeem or repurchase debt;
make loans and investments, issue guaranties and pledge assets;
incur additional indebtedness or amend our debt and other material agreements;
make capital expenditures;
engage in mergers, acquisitions and asset sales; and
enter into certain intercompany arrangements or make certain intercompany payments, which in some instances could restrict our ability to use the assets, cash flows or earnings of one operating segment to support another operating segment or Holdings.
Other restrictive covenants require that we meet certain financial covenants, including leverage coverage, fixed charge coverage and net worth tests, as described in the applicable credit agreements. In addition, the covenant requirements of our various credit agreements require us to make many subjective determinations pertaining to our compliance thereto and exercise good faith judgment in determining our compliance.
Our ability to comply with the covenants and restrictions contained in our debt instruments may be affected by events beyond our control, including prevailing economic, financial and industry conditions. If market or other economic conditions deteriorate, our ability to comply with these covenants and restrictions may be impaired. If we breach any of the restrictions or covenants in our debt agreements, a significant portion of our indebtedness may become immediately due and payable, and our lenders' commitments to make further loans to us may terminate. We might not have, or be able to obtain, sufficient funds to make these immediate payments. In addition, our obligations under our credit facilities are secured by substantially all of our assets. If we are unable to timely repay our obligations under our credit facilities, the lenders could seek to foreclose on the assets, or we may be required to contribute additional capital to certain of our subsidiaries. Any of these outcomes could have a material adverse effect on our business, financial condition and results of operations.
We may refinance a significant amount of indebtedness and otherwise require additional financing; we cannot guarantee that we will be able to obtain the necessary funds on favorable terms or at all.
We may elect to refinance certain of our indebtedness, even if not required to do so by the terms of such indebtedness. In addition, we may need, or want, to raise additional funds for our operations. We have been, and may continue to be, engaged in discussions with certain potential financing sources, which could provide a source of additional funds and liquidity for our operations. However, our ability to obtain such financing will depend on, among other factors, prevailing market conditions at the time of the proposed financing and other factors beyond our control. There is no assurance that we will be able to obtain additional financing on terms acceptable to us, or at all.
We recorded goodwill and other intangible assets that could become impaired and result in material non-cash charges to our results of operations in the future.
The Delek/Alon Merger has been accounted for as an acquisition, by us, of Alon in accordance with accounting principles generally accepted in the United States. Under the acquisition method of accounting, the assets and liabilities of Alon and its subsidiaries have been recorded, as of the completion of the Delek/Alon Merger, at their respective fair values. Under the acquisition method of accounting, the total purchase price has been allocated to Alon’s tangible assets and liabilities and identifiable intangible assets based on their estimated fair values as of the date of completion of the Delek/Alon Merger. The excess of the purchase price over those estimated fair values has been recorded as goodwill. To the extent the value of goodwill or intangibles becomes impaired, we may be required to incur material non-cash charges relating to such impairment. Our financial condition and operating results may be significantly impacted from both the impairment and the underlying trends in the business that triggered the impairment.
ITEM 1B. UNRESOLVED STAFF COMMENTS
None.
ITEM 3. LEGAL PROCEEDINGS
In the ordinary conduct of our business, we are from time to time subject to lawsuits, investigations and claims, including, environmental claims and employee-related matters.
Although we cannot predict with certainty the ultimate resolution of lawsuits, investigations and claims asserted against us, including civil penalties or other enforcement actions, we do not believe that any currently pending legal proceeding or proceedings to which we are a party will have a material adverse effect on our business, financial condition or results of operations.
We are reporting the following proceedings to comply with SEC regulations which require disclosure of proceedings arising under federal, state or local provisions regulating the discharge of materials into the environment or protecting the environment, if we reasonably believe that such proceedings may result in monetary sanctions of $0.1 million or more.
The DOJ, on behalf of the EPA, and the State of Arkansas, on behalf of the Arkansas Department of Environmental Quality, have been pursuing an enforcement action against Delek Logistics with regard to potential violations of the Clean Water Act and certain state laws arising from the Magnolia Release since June 2015. On July 13, 2018, the DOJ and the State of Arkansas filed a civil action against two of Delek Logistics’ wholly-owned subsidiaries, Delek Logistics Operating LLC and SALA Gathering Systems LLC, in the United States District Court for the Western District of Arkansas. On or around December 12, 2018, the claims against the Partnership were resolved and an additional demand for a compliance audit at the Magnolia terminal was abandoned pursuantArkansas related to payment of monetary penalties and other relief. As of December 31, 2018, we have accrued $2.2 million, for the Magnolia Release which represents the full settlement amount for these proceedings.
The Big Spring refinery has been negotiating an agreement with the EPA for over 10 years under the EPA’s National Petroleum Refinery Initiative regarding alleged historical violations of the federal Clean Air Act related to emissions and emissions control equipment. A Consent Decree resolving these alleged historical violations for the Big Spring refinery was lodged within 2013. In December 2018, Delek Logistics, the United States District Court forand the Northern Districtstate of Texas on June 6, 2017. An amendmentArkansas reached an agreement to settle the claims related to the Consent DecreeMagnolia Release abandoning the settlement payments totaling $2.2 million. On November 8, 2019, a consent decree was lodgedentered with the court and on January 31, 2019. Upon entry of the AmendmentNovember 18, 2019, final payments were made to the Consent Decree, expectedState of Arkansas in the springamount of 2019,$0.6 million and to the Consent Decree will require paymentDOJ in the amount of a $0.5$1.7 million, civil penalty and capital expenditures for pollution control equipment that may be significant over the next 10 years.which amounts include nominal interest.
ITEM 4. MINE SAFETY DISCLOSURES
Not applicable.
Market for Equity, Stockholder Matters, and Purchase of Equity Securities
PART II
ITEM 5. MARKET FOR REGISTRANT'S COMMON EQUITY, RELATED STOCKHOLDER MATTERS AND ISSUER PURCHASES OF EQUITY SECURITIES
Market Information
Our common stock is traded on the New York Stock Exchange under the symbol "DK."
Holders
As of February 22, 2019,21, 2020, there were approximately 2625 common stockholders of record. This number does not include beneficial owners of our common stock whose stock is held in nominee or "street name" accounts through brokers.
Purchases of Equity Securities by the Issuer and Affiliated Purchasers
During 2016,The following table sets forth information with respect to the purchase of shares of our common stock made during the three months ended December 31, 2019 by or on behalf of us or any “affiliated purchaser,” as defined by Rule 10b-18 of the Exchange Act:
|
| | | | | | | | | | | | | | |
| Period | | Total Number of Shares Purchased | | Average Price Paid per Share | | Total Number of Shares Purchased as Part of Publicly Announced Plans or Programs (1) | | Approximate Dollar Value of Shares that May Yet Be Purchased Under the Plans or Programs |
| October 1 - October 31, 2019 | | 60,810 |
| | $ | 36.54 |
| | 60,810 |
| | $ | 259,723,583 |
|
| November 1 - November 30, 2019 | | 229,093 |
| | 36.80 |
| | 229,093 |
| | 251,292,580 |
|
| December 1 - December 31, 2019 | | 573,555 |
| | 34.19 |
| | 573,555 |
| | 231,685,024 |
|
| Total | | 863,458 |
| | $ | 35.05 |
| | 863,458 |
| | N/A |
(1) On November 6, 2018, the Board of Directors authorized a sharethe repurchase program for up to $125.0of $500.0 million of Delek common stock. Under this program, approximately $6 million was repurchased during 2018. The repurchase program did not obligate the Company to acquire any particular amount of stock, and the unused portion of theThis authorization under the repurchase program expired on December 31, 2016.
In December 2016, our Board of Directors authorized a new share repurchase program for up to $150.0 million of Delek common stock.has no expiration. Any share repurchases under the repurchase program may be implemented through open market transactions or in privately negotiated transactions, in accordance with applicable securities laws. The timing, price, and size of repurchases will be made at the discretion of management and will depend on prevailing market prices, general economic and market conditions and other considerations. The repurchase program does not obligate us to acquire any particular amount of stock and does not expire. On February 26, 2018, the Board of Directors approved a new $150.0 million authorization to repurchase our common stock. In addition, on November 6, 2018, the Board of Directors authorized the repurchase of $500.0 million of Delek common stock. Both of these new authorizations in 2018 have no expiration and are in addition to any remaining amounts previously authorized. The following table sets forth information with respect to the purchase of shares of our common stock made during the three months ended December 31, 2018 by or on behalf of us or any “affiliated purchaser,” as defined by Rule 10b-18 of the Exchange Act:
|
| | | | | | | | | | | | | | |
| Period | | Total Number of Shares Purchased | | Average Price Paid per Share | | Total Number of Shares Purchased as Part of Publicly Announced Plans or Programs | | Approximate Dollar Value of Shares that May Yet Be Purchased Under the Plans or Programs |
| October 1 - October 31, 2018 | | 184,589 |
| | $ | 42.60 |
| | 184,589 |
| | $ | 59,722,234 |
|
| November 1 - November 30, 2018 | | — |
| | — |
| | — |
| | 559,722,234 |
|
| December 1 - December 31, 2018 | | 3,990,286 |
| | 37.59 |
| | 3,990,286 |
| | 409,722,408 |
|
| Total | | 4,174,875 |
| | $ | 37.81 |
| | 4,174,875 |
| | N/A |
In addition to purchases presented in the table above, we also received 2,692,771 shares from the exercise of call options on September 17, 2018 that were previously implemented to hedge Alon's 3.00% Convertible Notes due 2018, which shares offset the dilution from the issuance of shares of Delek common stock in connection with the settlement of the Convertible Notes. See Note 19 of the consolidated financial statements included in Item 8, Financial Statements and Supplementary Data, of this Annual Report on Form 10-K for further information.
Market for Equity, Stockholder Matters, and Purchase of Equity Securities
For comparative purposes, we have provided the three yearthree-year history of share repurchases in the following table:
| | | | | | | Repurchases on 2016 Authorization (excluding December 29, 2016 Authorization) | | Repurchases on December 29, 2016 Authorization | | Repurchases on February 2018 Authorization | | Repurchases on December 2018 Authorization | | | | Repurchases on December 29, 2016 Authorization | | Repurchases on February 2018 Authorization | | Repurchases on November 2018 Authorization |
| Period | | Share Repurchase Authorization | | Shares Repurchased | | Average Price Paid per Share | | Shares Repurchased | | Average Price Paid per Share | | Shares Repurchased | | Average Price Paid per Share | | Shares Repurchased | | Average Price Paid per Share | | Share Repurchase Authorization | | Shares Repurchased | | Average Price Paid per Share | | Shares Repurchased | | Average Price Paid per Share | | Shares Repurchased | | Average Price Paid per Share |
| Beginning Share Repurchases Authorized as of January 1, 2016 | | $ | — |
| | | | | | | | | |
|
| | | | | | | |
| Repurchases Authorized 2016 (excluding December 29, 2016 Authorization) | | 125,000,000 |
| | | | | | | | | | | | | | | | | |
| 2016 Repurchases | | (5,999,839 | ) | | 386,090 |
| | $ | 15.54 |
| | | | | |
|
| | | | | | | |
| Repurchases Expiration | | (119,000,161 | ) | | | | | | | | | | | | | | | | | |
| December 29, 2016 Repurchases Authorized | | 150,000,000 |
| | | | | | | | | | | | | | | | | |
| Share Repurchases Authorized as of December 31, 2016 | | 150,000,000 |
| | | | | | | | | | | | | | | | | | 150,000,000 |
| | | | | | | | | | | | |
| 2017 Repurchases | | (24,999,985 | ) | | | | | | 762,623 |
| | $ | 32.78 |
| | | | | | | | | | (24,999,985 | ) | | 762,623 |
| | $ | 32.78 |
| | | | | | | | |
| Share Repurchases Authorized as of December 31, 2017 | | 125,000,015 |
| | | | | | | | | | | | | | | | | | 125,000,015 |
| | | | | | | | | | | | |
| Repurchases Authorized February 2018 | | 150,000,000 |
| | | | | | | | | | | | | | | | | | 150,000,000 |
| | | | | | | | | | | | |
| Repurchases Authorized November 2018 | | 500,000,000 |
| | | | | | | | | | | | | | | | | | 500,000,000 |
| | | | | | | | | | | | |
| 2018 Repurchases | | (365,277,607 | ) | | | | | | 3,135,942 |
| | $ | 39.86 |
| | 3,449,260 |
| | $ | 43.49 |
| | 2,437,184 |
| | $ | 37.04 |
| | (365,277,607 | ) | | 3,135,942 |
| | $ | 39.86 |
| | 3,449,260 |
| | $ | 43.49 |
| | 2,437,184 |
| | $ | 37.04 |
|
| Share Repurchases Authorized as of December 31, 2018 | | $ | 409,722,408 |
| | | | | | | | | | | | | | | | | | 409,722,408 |
| | | | | | | | | | | | |
| 2019 Repurchases | | | (178,037,384 | ) | | | | | | | | | | 5,039,034 |
| | $ | 35.33 |
|
| Share Repurchases Authorized as of December 31, 2019 | | | $ | 231,685,024 |
| | | | | | | | | | | | |
Market for Equity, Stockholder Matters, and Purchase of Equity Securities
Performance Graph
The following Performance Graph and related information shall not be deemed "soliciting material" or to be "filed" with the SEC, nor shall such information be incorporated by reference into any future filing under the Securities Act of 1933 or Securities Exchange Act of 1934, each as amended, except to the extent that we specifically incorporate it by reference into such filing.
The following graph compares cumulative total returns for our stockholders to the Standard and Poor's 500 Stock Index and a market capitalization weighted peer group selected by management for the five-year period commencing December 31, 20132014 and ending December 31, 2018.2019. The graph assumes a $100 investment made on December 31, 2013.2014. Each of the three measures of cumulative total return assumes reinvestment of dividends. The 2018 peer group is comprised of CVR Energy, Inc. (NYSE: CVI), HollyFrontier Corporation (NYSE: HFC), Marathon Petroleum Corporation (NYSE: MPC), Phillips 66 (NYSE: PSX), and Valero Energy Corporation (NYSE: VLO). The Company's 20172019 peer group is comprised of CVR Energy, Inc. (NYSE: CVI), HollyFrontier Corporation (NYSE: HFC), Marathon Petroleum Corporation (NYSE: MPC), PBF Energy, Inc. (NYSE: PBF), Phillips 66 (NYSE: PSX), and Valero Energy Corporation (NYSE: VLO). The stock performance shown on the graph below is not necessarily indicative of future price performance.
ITEM 6. SELECTED FINANCIAL DATA
The following selected financial data should be read in conjunction with Item 7, Management's Discussion and Analysis of Financial Condition and Results of Operations, and Item 8, Financial Statements and Supplementary Data, of this Annual Report on Form 10-K.
|
| | | | | | | | | | | | | | | | | | | | |
| | | Year Ended December 31, |
| | | 2018(1)(2) | | 2017(3) | | 2016 | | 2015(4) | | 2014(4) |
| Statement of Operations Data: | | | | | | | |
| Net revenues | | $ | 10,233.1 |
| | $ | 7,267.1 |
| | $ | 4,197.9 |
| | $ | 4,782.0 |
| | $ | 7,019.2 |
|
| Income (loss) from continuing operations before income tax expense (benefit) | | 485.5 |
| | 299.3 |
| | (391.2 | ) | | 21.3 |
| | 326.9 |
|
| Income tax expense (benefit) | | 101.9 |
| | (29.2 | ) | | (171.5 | ) | | (15.8 | ) | | 101.6 |
|
| Income (loss) from continuing operations, net of tax |
| 383.6 |
| | 328.5 |
| | (219.7) |
| | 37.1 |
| | 225.3 |
|
| (Loss) income from discontinued operations, net of tax | | (8.7 | ) | | (5.9 | ) | | 86.3 |
| | 6.6 |
| | 0.7 |
|
| Net income (loss) | | 374.9 |
| | 322.6 |
| | (133.4 | ) | | 43.7 |
| | 226.0 |
|
| Net income attributed to non-controlling interests | | 34.8 |
| | 33.8 |
| | 20.3 |
| | 24.3 |
| | 27.4 |
|
| Net income (loss) attributable to Delek |
| $ | 340.1 |
| | $ | 288.8 |
|
| $ | (153.7 | ) |
| $ | 19.4 |
|
| $ | 198.6 |
|
| | | | | | | | | | | |
| Total basic income (loss) per share | | $ | 4.11 |
| | $ | 4.04 |
| | $ | (2.49 | ) | | $ | 0.32 |
| | $ | 3.38 |
|
| Total diluted income (loss) per share | | $ | 3.95 |
| | $ | 4.00 |
| | $ | (2.49 | ) | | $ | 0.32 |
| | $ | 3.34 |
|
| Dividends declared per common share outstanding | | $ | 0.96 |
| | $ | 0.60 |
| | $ | 0.60 |
| | $ | 0.60 |
| | $ | 1.00 |
|
|
| | | | | | | | | | | | | | | | | | | | |
| | | Year Ended December 31, |
| | | 2019 | | 2018(1)(2) | | 2017(3) | | 2016 | | 2015(4) |
| Statement of Operations Data: | | | | | | | |
| Net revenues | | $ | 9,298.2 |
| | $ | 10,233.1 |
| | $ | 7,267.1 |
| | $ | 4,197.9 |
| | $ | 4,782.0 |
|
| Income from continuing operations before income tax expense | | 402.7 |
| | 485.5 |
| | 299.3 |
| | (391.2 | ) | | 21.3 |
|
| Income tax expense (benefit) | | 71.7 |
| | 101.9 |
| | (29.2 | ) | | (171.5 | ) | | (15.8 | ) |
| Income from continuing operations, net of tax |
| 331.0 |
| | 383.6 |
| | 328.5 |
| | (219.7) |
| | 37.1 |
|
| Income (loss) from discontinued operations, net of tax | | 5.2 |
| | (8.7 | ) | | (5.9 | ) | | 86.3 |
| | 6.6 |
|
| Net income | | 336.2 |
| | 374.9 |
| | 322.6 |
| | (133.4 | ) | | 43.7 |
|
| Net income attributed to non-controlling interests | | 25.6 |
| | 34.8 |
| | 33.8 |
| | 20.3 |
| | 24.3 |
|
| Net income attributable to Delek |
| $ | 310.6 |
| | $ | 340.1 |
|
| $ | 288.8 |
|
| $ | (153.7 | ) |
| $ | 19.4 |
|
| | | | | | | | | | | |
| Total basic income per share | | $ | 4.10 |
| | $ | 4.11 |
| | $ | 4.04 |
| | $ | (2.49 | ) | | $ | 0.32 |
|
| Total diluted income per share | | $ | 4.06 |
| | $ | 3.95 |
| | $ | 4.00 |
| | $ | (2.49 | ) | | $ | 0.32 |
|
| Dividends declared per common share outstanding | | $ | 1.14 |
| | $ | 0.96 |
| | $ | 0.60 |
| | $ | 0.60 |
| | $ | 0.60 |
|
| | | | | December 31, | | December 31, |
| | | 2018(5) | | 2017(3) | | 2016 | | 2015(4) | | 2014(4) | | 2019 | | 2018(5) | | 2017(3) | | 2016 | | 2015(4) |
| Balance Sheet Data: | | | | (In millions) | | | | | | (In millions) | | |
| Cash and cash equivalents | | $ | 1,079.3 |
| | $ | 931.8 |
| | $ | 689.2 |
| | $ | 287.2 |
| | $ | 429.8 |
| | $ | 955.3 |
| | $ | 1,079.3 |
| | $ | 931.8 |
| | $ | 689.2 |
| | $ | 287.2 |
|
| Total current assets | | 2,420.3 |
| | 2,611.8 |
| | 1,396.9 |
| | 1,389.4 |
| | 1,656.0 |
| | 2,963.3 |
| | 2,420.3 |
| | 2,611.8 |
| | 1,396.9 |
| | 1,389.4 |
|
| Total assets | | 5,760.6 |
| | 5,935.2 |
| | 2,979.8 |
| | 3,316.8 |
| | 2,888.7 |
| | 7,016.3 |
| | 5,760.6 |
| | 5,935.2 |
| | 2,979.8 |
| | 3,316.8 |
|
| Total current liabilities | | 1,663.5 |
| | 2,671.7 |
| | 935.2 |
| | 996.0 |
| | 1,057.5 |
| | 2,355.9 |
| | 1,663.5 |
| | 2,671.7 |
| | 935.2 |
| | 996.0 |
|
| Total debt, including current maturities | | 1,783.3 |
| | 1,465.6 |
| | 832.9 |
| | 805.2 |
| | 464.8 |
| | 2,067.1 |
| | 1,783.3 |
| | 1,465.6 |
| | 832.9 |
| | 805.2 |
|
| Total stockholders' equity | | 1,808.1 |
| | 1,964.2 |
| | 1,182.5 |
| | 1,353.9 |
| | 1,198.4 |
| | 1,835.3 |
| | 1,808.1 |
| | 1,964.2 |
| | 1,182.5 |
| | 1,353.9 |
|
(1) Statement of operations data for the year ended December 31, 2018 reflects a $5.5 million adjustment to increase income tax expense related to the establishment of a valuation allowance on deferred tax assets and to decrease net income and net income attributable to Delek, and reducing basic and diluted income per share by $0.07 and $0.06, respectively, that were not reflected in the Earnings Release furnished as Exhibit 99.1 to the Form 8-K filed with the SEC on February 20, 2019 (the "Earnings Release"). Such adjustment has no impact on adjusted net income or adjusted net income per share (as defined in the Earnings Release). See further discussion in Notes 15 and 23 of our consolidated financial statements included in Item 8, Financial Statements and Supplementary Data, of this Annual Report on Form 10-K.
(2) Statement of operations data for the year ended December 31, 2018 includes a $60.7 adjustment to increase net revenues and cost of materials and other to record a correction of an intercompany elimination that was not reflected in the February 20, 2019 Earnings Release. Such amounts are not considered material to the financial statements and had no impact to operating income, segment contribution margin or net income.
(3) Statement of operations data for the year ended December 31, 2017 reflects six months of incremental results of operations resulting from the Delek/Alon Merger, which was effective July 1, 2017. Additionally, the balance sheet date as of December 31, 2017 reflects the assets and liabilities of Alon as a result of the Delek/Alon Merger.
(4) In August 2016, Delek entered into the Purchase Agreement to sell the Retail Entities, which consist of all of the retail segment and a portion of the corporate, other and eliminations segment, to COPEC. The operating results for the Retail Entities were reclassified to discontinued operations for 2016 2015 and 2014,2015, and the related assets and liabilities were reclassified as held for sale for the years ended December 31, 2016 2015 and 2014.2015.
(5) Balance sheet data for the year ended December 31, 2018 reflects a $20.0 million adjustment to decrease stockholders' equity ($14.5 million of which was an adjustment to retained earnings resulting from our correction of a cumulative adoption of an accounting policy) related to the establishment of a valuation allowance on deferred tax assets that was not reflected in the February 20, 2019 Earnings Release. See further discussion in Notes 2 andNote 15 of our consolidated financial statements included in Item 8, Financial Statements and Supplementary Data, of this Annual Report on Form 10-K.
Management's Discussion and Analysis
ITEM 7. MANAGEMENT’S DISCUSSION AND ANALYSIS OF FINANCIAL CONDITION AND RESULTS OF OPERATIONS
Forward-Looking Statements
This Annual Report on Form 10-K contains "forward-looking statements" within the meaning of Section 27A of the Securities Act of 1933, as amended, and Section 21E of the Securities Exchange Act of 1934, as amended (the "Exchange Act").amended. These forward-looking statements reflect our current estimates, expectations and projections about our future results, performance, prospects and opportunities. Forward-looking statements include, among other things, the information concerning our planned capital expenditures by segment for 2019,2020, possible future results of operations, business and growth strategies, financing plans, expectations that regulatory developments or other matters will or will not have a material adverse effect on our business or financial condition, our competitive position and the effects of competition, the projected growth of the industry in which we operate, and the benefits and synergies to be obtained from our completed and any future acquisitions, statements of management’s goals and objectives, and other similar expressions concerning matters that are not historical facts. Words such as "may," "will," "should," "could," "would," "predicts," "potential," "continue," "expects," "anticipates," "future," "intends," "plans," "believes," "estimates," "appears," "projects" and similar expressions, as well as statements in future tense, identify forward-looking statements.
Forward-looking statements should not be read as a guarantee of future performance or results, and will not necessarily be accurate indications of the times at, or by, which such performance or results will be achieved. Forward-looking information is based on information available at the time and/or management’s good faith belief with respect to future events, and is subject to risks and uncertainties that could cause actual performance or results to differ materially from those expressed in the statements. Important factors that, individually or in the aggregate, could cause such differences include, but are not limited to:
volatility in our refining margins or fuel gross profit as a result of changes in the prices of crude oil, other feedstocks and refined petroleum products;
reliability of our operating assets;
actions of our competitors and customers;
changes in, or the failure to comply with, the extensive government regulations applicable to our industry segments;
our ability to execute our strategy of growth through acquisitions and capital projects and changes in the expected value of and benefits derived therefrom, including any inability to successfully integrate acquisitions, realize expected synergies or achieve operational efficiency and effectiveness;
acquired assets may suffer a diminishment in fair value, which may require us to record a write-down or impairment;
reliability of our operating assets;
actions of our competitors and customers;
changes in, or the failure to comply with, the extensive government regulations applicable to our industry segments;
changes in interpretations, assumptions and expectations regarding the Tax Cuts and Jobs Act, including additional guidance that may be issued by federal and state taxing authorities;
diminution in value of long-lived assets may result in an impairment in the carrying value of the assets on our balance sheet and a resultant loss recognized in the statement of operations;
general economic and business conditions affecting the southern, southwestern and western United States, particularly levels of spending related to travel and tourism;
volatility under our derivative instruments;
deterioration of creditworthiness or overall financial condition of a material counterparty (or counterparties);
unanticipated increases in cost or scope of, or significant delays in the completion of, our capital improvement and periodic turnaround projects;
risks and uncertainties with respect to the quantities and costs of refined petroleum products supplied to our pipelines and/or held in our terminals;
operating hazards, natural disasters, casualty losses and other matters beyond our control;
increases in our debt levels or costs;
changes in our ability to continue to access the credit markets;
compliance, or failure to comply, with restrictive and financial covenants in our various debt agreements;
the inability of our subsidiaries to freely make dividends, loans or other cash distributions to us;
seasonality;
Management's Discussion and Analysis
acts of terrorism (including cyber-terrorism) aimed at either our facilities or other facilities that could impair our ability to produce or transport refined products or receive feedstocks;
disruption, failure, or cybersecurity breaches affecting or targeting our IT systems and controls, our infrastructure, or the infrastructure of our cloud-based IT service providers;
changes in the cost or availability of transportation for feedstocks and refined products; and
other factors discussed under Item 1A, Risk Factors and Item 7, Management’s Discussion and Analysis of Financial Condition and Results of Operations and in our other filings with the SEC.
In light of these risks, uncertainties and assumptions, our actual results of operations and execution of our business strategy could differ materially from those expressed in, or implied by, the forward-looking statements, and you should not place undue reliance upon them. In addition, past financial and/or operating performance is not necessarily a reliable indicator of future performance, and you should not use our historical performance to anticipate future results or period trends. We can give no assurances that any of the events anticipated by any forward-looking statements will occur or, if any of them do, what impact they will have on our results of operations and financial condition.
All forward-looking statements included in this report are based on information available to us on the date of this report. We undertake no obligation to revise or update any forward-looking statements as a result of new information, future events or otherwise.
Management's Discussion and Analysis
Executive Summary and Strategic Overview
We are an integrated downstream energy business focused on petroleum refining, the transportation, storage and wholesale distribution of crude oil, intermediate and refined products and convenience store retailing. Effective July 1, 2017, we acquired through the Delek/Alon the operations and net assets of Alon, as discussed in the 'Recent Strategic Developments' section of Item 1, Business, and as discussed in Note 3 of our consolidated financial statements included in Item 8, Financial Statements and Supplementary Data, of this Annual Report on Form 10-K. The Delek/Alon Merger continues to have a significant impact on our revenue and profitability as well as earnings per share, our net asset position, our purchasing position in the marketplace, our footprint in the refining industry, especially in the Gulf Coast Region/Permian Basin, and our ability to go to market and secure financing, and we continue to realize synergies from our combined operations.financing.
The refining segment processes crude oil and other purchased feedstocks for the manufacture of transportation motor fuels, including various grades of gasoline, diesel fuel, aviation fuel, asphalt and other petroleum-based products that are distributed through owned and third-party product terminals. It hadThe refining segment has a combined nameplate capacity of 302,000 barrels per day as of December 31, 2018.2019. Prior to the Delek/Alon Merger, the refining segment operated refineries inthe Tyler Texas (the "Tyler refinery")refinery and the El Dorado Arkansas (the "El Dorado refinery")refinery with a combined design crude throughput (nameplate) capacity of 155,000 barrels per day ("bpd"), including the 75,000 bpd Tyler refinery and the 80,000 bpd El Dorado refinery.. Effective with the Delek/Alon Merger, our refining segment now also includes a crude oil refinery located inthe Big Spring Texas (the "Big Spring refinery") with a nameplate capacity of 73,000 bpd, a crude oil refinery located inand the Krotz Springs Louisiana (the "Krotz Springs refinery") with a nameplate capacityrefinery. A high-level summary of 74,000 bpd. Our refining segment also included two biodiesel facilities we own and operate that are engagedthe refinery activities is presented below:
|
| | | | | | | | |
| | Tyler Refinery | El Dorado Refinery | Big Spring Refinery | Krotz Springs Refinery |
| Total Nameplate Capacity (barrels per day ("bpd")) | 75,000 |
| 80,000 |
| 73,000 |
| 74,000 |
|
| Primary Products | Gasoline, jet fuel, ultra-low-sulfur diesel, liquefied petroleum gases, propylene, petroleum coke and sulfur | Gasoline, ultra-low-sulfur diesel, liquefied petroleum gases, propylene, asphalt and sulfur | Gasoline, jet fuel, ultra-low-sulfur diesel, liquefied petroleum gases, propylene, aromatics and sulfur | Gasoline, jet fuel, high-sulfur diesel, light cycle oil, liquefied petroleum gases, propylene and ammonium thiosulfate |
| Relevant Crack Spread Benchmark | Gulf Coast 5-3-2 | Gulf Coast 5-3-2 (1) | Gulf Coast 3-2-1 (2) | Gulf Coast 2-1-1 (3) |
| Marketing and Distribution | The refining segment's petroleum-based products are marketed primarily in the south central, southwestern and western regions of the United States, and the refining segment also ships and sells gasoline into wholesale markets in the southern and eastern United States. Motor fuels are sold under the Alon or Delek brand through various terminals to supply Alon or Delek branded retail sites. In addition, we sell motor fuels through our wholesale distribution network on an unbranded basis. |
(1) While there is variability in the production of biodiesel fuels and related activities, located in Crossett, Arkansas and Cleburne, Texas.
Our profitability in the refining segment is substantially determined by the difference between the cost of the crude oil feedstocks we purchaseslate and the price ofproduct output at the refined products we sell, referred to as the "crack spread", "refining margin" or "refined product margin". The cost to acquire feedstocks and the price of the refined petroleum products we ultimately sell from our refineries depend on numerous factors beyond our control, including the supply of, and demand for, crude oil, gasoline and other refined petroleum products which, in turn, depend on, among other factors, changes in domestic and foreign economies, weather conditions such as hurricanes or tornadoes, local, domestic and foreign political affairs, global conflict, production levels, the availability of imports, the marketing of competitive fuels and government regulation. Other significant factors that influence our results in the refining segment include operating costs (particularly the cost of natural gas used for fuel and the cost of electricity), seasonal factors, refinery utilization rates and planned or unplanned maintenance activities or turnarounds. Moreover, while the fluctuations in the cost of crude oil are typically reflected in the prices of light refined products, such as gasoline and diesel fuel, the price of other residual products, such as asphalt, coke, carbon black oil and LPG are less likely to move in parallel with crude cost. This could cause additional pressure on our realized margin during periods of rising or falling crude oil prices. Additionally, our margins are impacted by the pricing differentials of the various types and sources of crude oil we use at our refineries and their relation to product pricing, such as the differentials between WTI Midland and WTI Cushing or WTI Midland and Brent crude oil.
With respect to measuring our refining margins at our refineries, we consider the following:
For our TylerEl Dorado refinery, we compare our per barrel refined product margin to the Gulf Coast 5-3-2 crack spread. The Gulf Coast 5-3-2 crack spread is used as a benchmark for measuring a refinery's product margins by measuringbecause we believe it to be the difference between the market price of light products and crude oil, and represents the approximate refined product margin resulting from processing one barrel of crude oil into three-fifths barrel of gasoline and two-fifths barrel of high-sulfur diesel.most closely aligned benchmark.
Management's Discussion and Analysis
For our Big Spring refinery, we compare our per barrel refined product margin to the Gulf Coast 3-2-1 crack spread. The Gulf Coast 3-2-1 crack spread is calculated assuming that one barrel of WTI Cushing crude oil are converted into two-thirds barrel of Gulf Coast conventional gasoline and one-third barrel of Gulf Coast ultra-low sulfur diesel. (2) Our Big Spring refinery is capable of processing substantial volumes of sour crude oil, which has historically cost less than intermediate, and/or substantial volumes of sweet crude oils,oil, and therefore the WTI Cushing/WTS price differential, taking into account differences in production yield, is an important measure for helping us make strategic, market-respondent production decisions.
For our Krotz Springs refinery, we compare our per barrel refined product margin to the Gulf Coast 2-1-1 high sulfur diesel crack spread, which is calculated assuming that one barrel of LLS crude oil is converted into one-half barrel of Gulf Coast conventional gasoline and one-half barrel of Gulf Coast high sulfur diesel. (3) The Krotz Springs refinery has the capability to process substantial volumes of light sweet crude oilsoil to produce a high percentage of refined light products.
Our refining segment also owns and operates three biodiesel facilities involved in the production of biodiesel fuels and related activities, located in Crossett, Arkansas, Cleburne, Texas, and New Albany, Mississippi.
| |
• |
The crude oil and product slate flexibility of the El Dorado refinery allows us to take advantage of changes in the crude oil and product markets; therefore, we anticipate that the quantities and varieties of crude oil processed and products manufactured at the El Dorado refinery by processing a variety of feedstocks into a number of refined product types will continue to vary. While there is variability in the crude slate and the product output at the El Dorado refinery, we compare our per barrel refined product margin to the Gulf Coast 5-3-2 crack spread because we believe it to be the most closely aligned benchmark.
Logistics Overview |
A widening of the WTI Cushing less WTI Midland spread will favorably influence the operating margin for our refineries. Alternatively, a narrowing of this differential will have an adverse effect on our operating margins. Global product prices are influenced by the price of Brent crude which is a global benchmark crude. Global product prices influence product prices in the U.S. As a result, our refineries are influenced by the spread between Brent crude and WTI Midland. The Brent less WTI Midland spread represents the differential between the average per barrel price of Brent crude oil and the average per barrel price of WTI Cushing crude oil. A widening of the spread between Brent and WTI Cushing will favorably influence our refineries' operating margins. Also, the Krotz Springs refinery is influenced by the spread between Brent crude and LLS. The Brent less LLS spread represents the differential between the average per barrel price of Brent crude oil and the average per barrel price of LLS crude oil. A discount in LLS relative to Brent will favorably influence the Krotz Springs refinery operating margin.
The cost to acquire the refined fuel products we sell to our wholesale customers in our logistics segment and at our convenience stores in our retail segment depends on numerous factors beyond our control, including the supply of, and demand for, crude oil, gasoline and other refined petroleum products which, in turn, depend on, among other factors, changes in domestic and foreign economies, weather conditions, domestic and foreign political affairs, production levels, the availability of imports, the marketing of competitive fuels and government regulation. Our retail merchandise sales are driven by convenience, customer service, competitive pricing and branding. Motor fuel margin is sales less the delivered cost of fuel and motor fuel taxes, measured on a cents per gallon basis. Our motor fuel margins are impacted by local supply, demand, weather, competitor pricing and product brand.
As part of our overall business strategy, we regularly evaluate opportunities to expand our portfolio of businesses and may at any time be discussing or negotiating a transaction that, if consummated, could have a material effect on our business, financial condition, liquidity or results of operations.
Logistics Overview
Our logistics segment gathers, transports and stores crude oil and markets, distributes, transports and stores refined products in select regions of the southeastern United States and westWest Texas for our refining segment and third parties. It is comprised of the consolidated balance sheet and results of operations of Delek Logistics Partners, LP ("Delek Logistics", NYSE:DKL), where we owned a 61.4% limited partner interest (at December 31, 2018)2019) in Delek Logistics and a 94.6% interest in the entity that owns the entire 2.0% general partner interest in Delek Logistics and all of the incentive distribution rights. Delek Logistics was formed by Delek in 2012 to own, operate, acquire and construct crude oil and refined products logistics and marketing assets. A substantial majority of Delek Logistics' assets are currently integral to our refining and marketing operations.
The logistics segment's pipelines and transportation business owns or leases capacity on approximately 400 miles of crude oil transportation pipelines, approximately 450 miles of refined product pipelines, an approximately 600-mile700-mile crude oil gathering system and associated crude oil storage tanks with an aggregate of approximately 9.69.9 million barrels of active shell capacity. Our logistics segment owns and operates nine light product terminals and markets light products using third-party terminals. Additionally, the logistics segment has strategic investments in pipeline joint ventures that provide access to pipeline capacity as well as the potential for earnings from joint venture operations.
Retail Overview
Management's Discussion and Analysis
Our retail segment at December 31, 2018, Delek's retail segment2019 includes the operations of 279252 owned and leased convenience store sites located primarily in centralCentral and westWest Texas and New Mexico which were acquired in connection with the Delek/Alon Merger. Our convenience stores typically offer various grades of gasoline and diesel under the DK or Alon brand name and food products, food service, tobacco products, non-alcoholic and alcoholic beverages, general merchandise as well as money orders to the public, primarily under the 7-Eleven and DK or Alon brand names pursuant to a license agreement with 7-Eleven, Inc. which gives us a perpetual license to use the 7-Eleven trademark, service name and trade name in west Texas and a majority of the counties in New Mexico in connection with our retail store operations. In November 2018, we terminated the license agreement with 7-Eleven, Inc. and the terms of such termination require the removal of all 7-Eleven branding on a store-by-store basis by the earlier of
Management's Discussion and Analysis
December 31, 2021 or the date upon which our last 7-Eleven store is de-identified or closed.2021. Merchandise sales at our convenience store sites will continue to be sold under the 7-Eleven brand name until 7-Eleven branding is removed pursuant to the termination.
As of December 31, 2019, we have removed the 7-Eleven brand name at 57 of our store locations. Substantially all of the motor fuel sold through our retail segment is supplied by our Big Spring refinery, which is transferred to the retail segment at prices substantially determined by reference to published commodity pricing information. In connection with our retail strategic initiatives, we closed or sold 30 under-performing or non-strategic store locations during 2019.
|
|
| Corporate and Other Overview |
Our corporate activities, results of certain immaterial operating segments (including our asphalt terminal operations effective with the Delek/Alon Merger), our non-controlling equity interest of approximately 47% of the outstanding shares in Alon (which was accounted for as an equity method investment) prior to the Delek/Alon Merger, results and assets of discontinued operations and intercompany eliminations are reported in the corporate, other and eliminations segment.in our segment disclosures. Additionally, our corporate activities include the majority of our commodity and other hedging activities.
Our 2018 Strategic Goals
The Company's overall strategy has been to take a disciplined approach that looks to balance returning cash to our shareholders and prudently investing in the business to support safe and reliable operations, while exploring opportunities for growth. Our goal has been to balance the different aspects of this program based on evaluations of each opportunity and how it matches our strategic goals for the company, while factoring in market conditions and expected cash generation.
|
|
| 2019 Strategic Goals and Developments |
The following is a summary of our most significant 20182019 strategic goals, and the actions we completed during 2019 in pursuit of those goals:
| |
| • | Maintain and continue to enhance our safe operations. As we invest in and grow our business, we remain focused on safe and compliant operations for the benefit of our employees, communities, customers and shareholders. |
| |
| • | Capitalize on the successful integration of the Alon transaction. During 2017 and 2018 Since the Delek/Alon Merger,we expended significant efforts to fully integrate the Alon organization. Now that the integration is complete, our goal is to continue to implement best practices to improve the performance of our larger organization which includes focusing on simplifying the organization structure and the balance sheet. We are continuing to realize synergies that are expected to have a positive effect on our combined operations. |
| |
| • | Build on a winning culture. During 2017 and 2018, weWe believe our team responded well to our larger scale, as steps were taken to integrate the two companies following the acquisition of Alon in July 2017. We are now a larger and more diverse company, but our focus is to foster a culture that has the ability to act quickly in a changing environment to take advantage of opportunities. In order to support this operation, we continue to be focused on expanding our team, developing systems and providing the resources to position the organization for success in the future. |
| |
| • | Enhance our position in the Permian Basin. Our 302,000 barrels per day of crude throughput capacity is primarily a WTI-linked crude oil slate that is weighted to supply from the Permian Basin through our access to approximately 200,000 barrels per day. In addition, we have complementary retail and logistics presence in the area. Our strategic focus will be to evaluate options to utilize our position to create additional growth across our businesses, while working toward reducing our susceptibility to volatility in the crude and refined product markets. |
| |
| • | Grow our logistics operations. The combination of our access to the Permian Basin and larger refining operation should allow us to continue to grow our logistics footprint. We will look for opportunities to capitalize on this position to increase our crude gathering operations, support the refining system and third partythird-party customers. This includes exploring opportunities for continued development through joint ventures and opportunities to acquire assets in markets that are complementary to our existing geographic footprint. |
| |
| • | Optimization of our refining system. We have doubled the size of our refining system since 2016. This gives us the opportunities to utilize the best practices from each location to improve reliability, efficiencies and yields in an effort to maximize performance. This should enhance our competitive position and free cash flow potential. |
Management's Discussion and Analysis
| |
| • | Use our financial flexibility and cash flow to create shareholder value. We are focused on managing the cash flow in our business to support our capital allocation program that includes: 1) returning cash to shareholders through dividends and share repurchases, 2) investing in our business and 3) growing through acquisitions - all of which combine to serve our central goal of increasing long-term value for our shareholders. |
In addition to the above, it continues to be a strategic and operational objective to manage price and supply risk related to crude oil that is used in refinery production, and to develop strategic sourcing relationships. For that purpose, from a pricing perspective, we enter into commodity derivative contracts to manage our price exposure to our inventory positions, future purchases of crude oil and ethanol, future sales of refined products or to fix margins on future production. We also enter into future commitments to purchase or sell RINs at fixed prices and quantities, which are used to manage the costs associated with our RINs obligations. Additionally, from a sourcing perspective, we often enter into purchase and sale contracts with vendors and customers or take financial commodity positions for crude oil that may not be used immediately in production, but that may be used to manage the overall supply and availability of crude expected to ultimately be needed for production and/or to meet minimum requirements under strategic pipeline arrangements, and also to optimize and hedge availability risks associated with crude that we ultimately expect to use in production. Such transactions are inherently based on certain assumptions and judgments made about the current and possible future availability of crude. Therefore, when we take physical or financial positions for optimization purposes, our intent is generally to take offsetting positions in quantities and at prices that will advance these objectives while minimizing our positional and financial statement risk. However, because
Management's Discussion and Analysis
of the volatility of the market in terms of pricing and availability, it is possible that we may have material positions with timing differences or, more rarely, that we are unable to cover a position with an offsetting position as intended. Such differences could have a material impact on the classification of resulting gains/losses, assets or liabilities, and could also significantly impact net earnings.
2018 Strategic Developments
We have executed on many initiatives during 2018 that have significantly advanced our progress toward the realization of our 2018 strategic goals. As part of a larger initiative to reduce our susceptibility to volatility in crack spreads, we continued to build on our Permian Basin platform in 2018. For example, Since December 31, 2017, we have focused efforts on developing a 200-mile gathering system in the Permian Basin connecting to our Big Spring, Texas terminal. This gathering system will provide Delek with access to crude directly from wellheads which will provide improvement in refining performance and cost structure while also providing a foundation for building a new midstream income source. As of December 31, 2018, approximately 50 miles of the gathering system were completed and operational. Additionally, in September 2018, Delek announced plans for a joint venture with Energy Transfer, Magellan, and MPLX to construct a 600-mile common carrier pipeline to transport crude oil from the Permian Basin to the Texas Gulf Coast region. We continue to work with our prospective partners to evaluate potential options for the development of the long-haul pipeline, including the possible combination of our project with another announced project. These developments position us to continue growing our midstream business and increase our fee-based income in that space, which will reduce our exposure to the volatility of the crude and refined product markets.
In our retail segment, we are actively implementing strategic initiatives to reduce our reliance on external brands and to optimize the performance of our portfolio of stores. We are rolling out our own branding initiatives which we will optimize in our current geographic areas as well as emerging markets. As a result of these efforts, we elected to terminate the 7-Eleven licensing agreement (as discussed above) with the current intention to re-brand with our own brand to capitalize on and build our brand recognition in the applicable regions. Additionally, we sold 15 under-performing or non-strategic store locations during the fourth quarter of 2018 and have plans to sell 28 additional stores during the first quarter of 2019. While the proceeds and resultant gains on sale of such related assets were not significant to our financial results as of and for the year ended December 31, 2018, removing these stores from our portfolio enables us to better focus our retail management and operational efforts on individual store performance, strategic optimization and growth opportunities which may include not only rebranding but possibly also expansion initiatives.
These significant developments were intentionally implemented to align with some of our most critical strategic initiatives for both 2018 and 2019 which include managing our risk and enhancing shareholder value by focusing on the following:
growing our business through new lines of business and investment in our existing businesses including capital improvements and new technology, and
identifying and managing operational and financial risks to improve operational decision-making and increase profitability.
In addition to the significant initiatives/developments described above, we entered into several other strategic transactions in order to improve our financial position or enhance shareholder value since December 31, 2017, some of the most significant of which are described below.
Transactions designed to maximize shareholder return
2018 and 2019 Share Repurchases
On January 23, 2018,During the year ended December 31, 2019, Delek repurchased 2.0 million5,039,034 shares of its common stock from Alon Israel in connection with Delek’s rights pursuant to a Stock Purchase Agreement dated April 14, 2015 by and between Delek and Alon Israel. Alon Israel delivered a right of first offer notice to Delek on January 16, 2018, informing Delek of Alon Israel’s intention to sell the 2.0 million shares, and Delek accepted such offer on January 17, 2018. The totalfor an aggregate purchase price was approximately $75.3of $178.1 million or $37.64 per share. In under the aggregate, pursuant to variousmost recent share repurchase programsplan which provided for repurchases up to $500.0 million and was approved by our Boardthe board on November 6, 2018. As of Directors, we have repurchased 9,022,386 shares for a total of approximately $365.3 million since December 31, 2017. As of February 22, 2019, there is approximately $409.7remained $231.7 million of authorization remainingavailable for repurchases under Delek's aggregate stockthe most recent repurchase program (based on repurchases that had settled as of February 22, 2019).plan. See further discussion in Note 5 of our consolidated financial statements included in Item 8, Financial Statements and Supplementary Data, of this Annual Report on Form 10-K.
February 2018 AcquisitionTransactions designed to maximize return on assets
Alkylation Project Completed
The alkylation unit at the Krotz Springs refinery was completed in April 2019 providing additional flexibility to the refinery. The total cost was approximately $138.0 million. This unit is expected to improve the refinery's ability to convert low value products into gasoline, enable the refinery to produce multiple summer gasoline grades and increase octane and allow the refinery to produce premium gasoline. Because of Non-controlling Interestthe conversion improvement at the refinery from this project, its returns are expected to be less dependent on the crack spread environment over time.
Investment in Alon PartnershipMidstream Ventures
On November 8, 2017,In July 2019, we acquired a 15% ownership interest in Wink to Webster Pipeline LLC ("WWP"). WWP intends to construct and operate a crude oil pipeline system from Wink, Texas to Webster, Texas along with certain pipelines from Webster, Texas to other destinations in the Gulf Coast area. It is expected to span approximately 650 miles at completion. Under the agreements governing the joint venture, we must contribute our percentage interest of the applicable construction costs (including certain costs previously incurred by WWP), and it is anticipated that our capital contributions will total approximately $340 million to $380 million over the course of construction (expected to be two to three years). During the year ended December 31, 2019, we made capital contributions totaling $126.7 million. Subsequent to December 31, 2019, we have made additional capital contributions totaling $18.9 million.
In May 2019, Delek and the Alon Partnership (as definedLogistics, acquired a 33% membership interest in Note 6 of our consolidated financial statements included in Item 8, Financial Statements and Supplementary Data, of this Annual Report on Form 10-K) entered into a definitive merger agreement under which Delek agreed to acquireRed River Pipeline Company LLC (the "Red River Pipeline Joint Venture" as previously defined) with Plains Pipeline, L.P. (“Plains”) for approximately $124.7 million, substantially all of which was financed under the outstanding limited partner units which Delek did not already own inLogistics Credit Facility, The Red River Pipeline Joint Venture subsequently proceeded with an all-equity transaction. This transaction was approved by all voting membersexpansion project to increase the capacity of the board of directors of the general partner of the Alon Partnership upon the recommendationpipeline from its conflicts committee150,000 barrels per day to 235,000 barrels per day for which we contributed an additional $3.5 million in May 2019. This investment was also made to advance our long-term strategic objectives to expand our midstream investments and by the board of directors of Delek. This transaction closed on February 7, 2018 (the "Merger Date"). Delek owned approximately 51.0 million limited partner units of the Alon Partnership, or approximately 81.6% of the outstanding units immediately prior to the Merger Date. Under terms of the merger agreement, the owners of the remaining outstanding units in the Alon Partnership that Delek did not currently own immediately prior to the Merger Date received a fixed exchange ratio of 0.49 shares of New Delek common stock for each limited partner unit of the Alon Partnership, resulting in the issuance of approximately 5.6 million shares of New Delek Common Stock to the public unitholders of the Alon Partnership. The limited partner interests of the Alon Partnership prior to this acquisition were represented as common units outstanding. Because the transaction represented a combination of ownership interests under common control, the transfer of equity from non-controlling interestnetwork/pipeline access.
Management's Discussion and Analysis
to owned interest was recorded at carrying value and no gain or loss was recognized in connection with the transaction. See further discussion in Note 67 of our consolidated financial statements included in Item 8, Financial Statements and Supplementary Data, of this Annual Report on Form 10-K.
Purchase of Biofuel Production Assets
Effective October 1, 2019, we acquired certain assets of JNS Biofuel, LLC, a biodiesel facility located in New Albany, Mississippi for a total purchase price of $8.0 million. The acquisitionassets acquired consisted primarily of the non-controlling interest in the Alon Partnership enabled us to refocus the efforts being expended for that separate master limited partnership on a more synergisticreal property and cohesive strategy where both the tactical operational and growth objectives of the Big Spring refinery (owned by the Alon Partnership) are fully integrated and aligned within our refining segment. Additionally, the elimination of the non-controlling public ownershipintegral equipment. This acquisition allows us to channel 100% of the Alon Partnership's operational, market and financial contributions to the benefit of Delek and its shareholders.
September 2018 Settlement of Convertible Debt and Related Call Options
On September 17, 2018, Delek settled its Convertible Notes (as defined in Note 11 of our consolidated financial statements included in Item 8, Financial Statements and Supplementary Data, of this Annual Report on Form 10-K)bring assets in-house for a combination of cash and shares of New Delek Common Stock. The maturity settlement in respect of the Convertible Notes consisted of (i) cash payments totaling approximately $152.5 million which included a cash payment for outstanding principal of $150.0 million, a cash payment for accrued interest of approximately $2.2 million, a cash payment for dividends of approximately $0.3 million and a nominal cash payment in lieu of fractional shares, and (ii) the issuance of approximately 2.7 million shares of New Delek Common Stock to holders of the Convertible Notes (the “Conversion Shares”). The issuance of the Conversion Shares was made in exchange for the Convertible Notes pursuant to an exemption from the registration requirements provided by Section 3(a)(9) of the Securities Act of 1933, as amended.
On September 17, 2018, we exercised the Call Options (as defined in Note 11 of our consolidated financial statements included in Item 8, Financial Statements and Supplementary Data, of this Annual Report on Form 10-K) in connection with the settlement of the Convertible Notes and received approximately 2.7 million shares of our common stock from the Call Option counterparties, a cash payment for dividends of approximately $0.3 million and a nominal cash payment in lieu of fractional shares. See further discussion in Note 5 of our consolidated financial statements included in Item 8, Financial Statements and Supplementary Data, of this Annual Report on Form 10-K.
The Convertible Notes as well as the Call Options were both assumed in connection with the Delek/Alon Merger. Under the Convertible Note indenture, we had the ability, at our option, to settle the Convertible Notes with cash, with stock, or with a combination of both. Under the combination option, only the accretive value of the conversion option (the portion that was "in-the-money") in excess of the principal amount of the Convertible Notes would be settled with shares. The Call Options were designed to hedge/offset the accretive value of the underlying conversion option only. After a careful review of our cash position and our objectives to minimize dilution by maximizing the effect of the Call Options, during 2018, we elected to settle the convertible debt for a combination of cash and stock. As a result, on a net basis,facility where we were ablepreviously the sole tolling customer, and utilize those assets to settle the Convertible Notes and the exercise of the Call Options with no net dilution toleverage across our common stock and therefore with no dilutive impact to our earnings per share.renewables activities.
November 2018 Warrant Unwind
In November 2018, Delek entered into Warrant Unwind Agreements (the "Unwind Agreement") with the holders of our outstanding common stock Warrants (as defined in Note 11 of our consolidated financial statements included in Item 8, Financial Statements and Supplementary Data, of this Annual Report on Form 10-K). Pursuant to the terms of the Unwind Agreements, we settled for cash all outstanding Warrants with the holders at various prices per Warrant as provided in the Unwind Agreements. The settlement amount was based on the volume-weighted average market price of our common stock taking into account an adjustment for the exercise price of the Warrants over a period of sixteen trading days beginning November 9, 2018 (the “Unwind Period”). Following the Unwind Period and upon the satisfaction of the payment obligation, the Warrants were canceled and the associated rights and obligations terminated. Based on the provisions of the Unwind Agreement, the amount paid to warrant holders in satisfaction of the payment obligation totaled approximately $36 million. See further discussion in Note 11 of our consolidated financial statements included in Item 8, Financial Statements and Supplementary Data, of this Annual Report on Form 10-K.
As was the case for the Convertible Notes and the Call Options, the existing common stock Warrants were also assumed in connection with the Delek/Alon Merger. The Warrant agreements provided for the issuance of a certain number of warrants exchangeable for shares of our common stock at a strike price that would have become exercisable beginning in December 2018, and that have been dilutive to our earnings per share calculation during the last three quarters of 2018. By entering into this Unwind Agreement, we were able to limit the upward accretive value of the instrument to its holders and eliminate its dilutive effect, causing an immediate and significant favorable impact on earnings per share.
Management's Discussion and Analysis
Transactions designed to maximize return on assets
2018 Disposal of California Discontinued Entities
On March 16, 2018, Delek sold to World Energy, LLC (i) all of Delek’s membership interests in AltAir (ii) certain refining assets and other related assets located in Paramount, California and (iii) certain associated tank farm and pipeline assets and other related assets located in California. Upon final settlement, Delek expects to receive net cash proceeds of approximately $85.2 million, subject to a post-closing working capital settlement, Delek’s portion of the expected biodiesel tax credit for 2017 and certain customary adjustments. The sale resulted in a loss on sale of discontinued operations totaling approximately $41.4 million during the year ended December 31, 2018. Of the total expected proceeds, $70.4 million was received in March 2018 ($14.9 million of which were included in net cash flows from investing activities in discontinued operations), with the remainder expected to be collected upon final settlement. In connection with the sale, the remaining assets and liabilities associated with the sold operations that were not included in the assets and liabilities acquired/assumed by the buyer were reclassified into assets and liabilities held and used (relating to continuing operations) and are presented as such in our December 31, 2018 balance sheet.
The transaction to dispose of certain assets and liabilities associated with our Long Beach, California refinery to Bridge Point Long Beach, LLC, closed July 17, 2018 resulting in initial cash proceeds of approximately $14.5 million, net of expenses.See further discussion in Note 8 of our consolidated financial statements included in Item 8, Financial Statements and Supplementary Data, of this Annual Report on Form 10-K.
The California Discontinued Entities were acquired as part of the Delek/Alon Merger and (as discussed in Note 8 of our consolidated financial statements included in Item 8, Financial Statements and Supplementary Data, of this Annual Report on Form 10-K) consisted primarily of non-operating refineries as well as a small renewables facility. As part of the acquisition, we evaluated the viability of the facilities and their potential for growth and profitability measured against their current operational cost and environmental risk exposure, and a strategic decision was made to divest of these assets. Intensive efforts were made to find suitable buyers with the objective of minimizing both our losses on the sale transactions as well as any on-going environmental exposures (See discussion of environmental exposures in Note 14 of our consolidated financial statements included in Item 8, Financial Statements and Supplementary Data, of this Annual Report on Form 10-K) and, as a result, we successfully closed on the divestitures of all of the California Discontinued Entities during 2018. We believe that the elimination of these Entities provides for the immediate elimination of the financial drain on our operating results while enabling us to divert resources that had previously been charged with managing these assets to more strategic efforts.
May 2018 Sale of Asphalt Assets
On May 21, 2018, we sold certain assets and operations of four asphalt terminals (included in Delek's corporate/other segment), as well as an equity method investment in an additional asphalt terminal, to an affiliate of Andeavor. This transaction includes asphalt terminal assets in Bakersfield, Mojave and Elk Grove, California and Phoenix, Arizona, as well as Delek’s 50% equity interest in the Paramount-Nevada Asphalt Company, LLC joint venture that operates an asphalt terminal located in Fernley, Nevada. The transaction resulted in net proceeds of approximately $110.8 million, inclusive of the $75.0 million base proceeds as well as certain preliminary working capital adjustments. The assets associated with the owned terminals met the definition of held for sale pursuant to Accounting Standards Codification ("ASC") 360, Property, Plant and Equipment ("ASC 360") as of February 1, 2018, but did not meet the definition of discontinued operations pursuant to ASC 205-20, Presentation of Financial Statements - Discontinued Operations ("ASC 205-20") as the sale of these asphalt assets does not represent a strategic shift that will have a major effect on the entity's operations and financial results. Accordingly, depreciation ceased as of February 1, 2018, and the associated assets to be sold were reclassified to assets held for sale as of that date and were written down to the estimated fair value less costs to sell, resulting in an impairment loss on assets held for sale of $27.5 million for the year ended December 31, 2018. In connection with the completion of the sale transaction, we recognized a gain of approximately $13.3 million in results of continuing operations on the accompanying consolidated income statement. See further discussion in Note 8 of our consolidated financial statements included in Item 8, Financial Statements and Supplementary Data, of this Annual Report on Form 10-K.
Like the California Discontinued Entities, the asphalt terminals (and related equity method investment) sold in the transaction describe above were originally acquired as part of the Delek/Alon Merger. We believe that these asphalt operations were not integral to our strategic business objectives, where maintaining focus on our core businesses and exploring growth in areas where there is opportunity to take advantage of new technology and advances in our industry as well as those opportunities with geographic customer or sourcing significance to our operations are paramount to achieving our long-term growth objectives. Therefore, we believe that divesting of these non-core operations only helps us to focus on implementing our most important strategies.
March 2018 Transaction with Delek Logistics
In March 2018, a subsidiary of Delek Logistics completed the acquisition from Delek of storage tanks and terminals that support our Big Spring refinery in the Big Spring Logistic Assets Acquisition (as defined in Note 6 of our consolidated financial statements included in Item 8, Financial Statements and Supplementary Data, of this Annual Report on Form 10-K). In addition, a new marketing agreement was entered into between subsidiary of Delek Logistics and Delek pursuant to which such subsidiary of Delek Logistics will provide marketing services for product sales from the Big Spring refinery. The cash paid for the transferred assets was $170.8 million and the cash paid for the marketing agreement was $144.2 million. The transactions were financed with borrowings under the DKL Credit Facility (as defined in Note 11 of the consolidated financial statements in Item 1, Financial Statements).
Management's Discussion and Analysis
We continue to be focused on utilizing our assets to their optimal utility in the framework of our business, and that means strategically aligning our logistics assets with our Delek Logistics business. Such alignment enhances, not only Delek Logistics' growth opportunities, but also our ability to best service the mutually beneficial commercial agreements between Delek Logistics and Delek. This drop-down of logistics assets to Delek Logistics specifically contributes to our ability to provide logistics services to our Big Spring refinery while growing our logistics infrastructure and potential for synergies.
March 2018 RINs Waivers
We consistently seek out regulatory and operational opportunities to minimize costs and thereby maximize the return on our refining assets. In March 2018, the El Dorado and Krotz Springs refineries both received approval from the EPA for a small refinery exemption from the requirements of the renewable fuel standard for the 2017 calendar year, which resulted in a reduction of our RINs Obligation (as defined in Note 13 to our accompanying condensed consolidated financial statements) and related cost of materials and other of approximately $59.3 million and $31.6 million for the El Dorado and Krotz Springs refineries, respectively, for the year ended December 31, 2018.
Transactions designed to minimize the cost of capital/manage financial risk exposures
March 30, 2018 Delek Revolver and Term Loan
On March 30, 2018, (the "Closing Date"), Delek entered into (i) a new term loan credit agreement with Wells Fargo Bank, National Association, as administrative agent (the "Term Administrative Agent"), Delek, as borrower, and the lenders from time to time party thereto, providing for a senior secured term loan facility in an amount of $700.0 million (the "Term Loan Credit Facility") and (ii) a second amended and restated credit agreement with Wells Fargo Bank, National Association, as administrative agent (the "Revolver Administrative Agent"), Delek, as borrower, certain subsidiaries of Delek, as guarantors, and the other lenders party thereto, providing for a senior secured asset-based revolving credit facility with commitments of $1.0 billion (the "Revolving Credit Facility" and, together with the "Term Loan Credit Facility," the "New Credit Facilities") - see Note 11 of the consolidated financial statements in Item 1, Financial Statements, for additional information. The Term Loan Credit Facility was drawn in full for $700.0 million on the Closing Date at an original issue discount of 0.50%. Proceeds under the Term Loan Credit Facility, as well as proceeds of approximately $300.0 million in borrowings under the Revolving Credit Facility on the Closing Date, were used to repay certain indebtedness of Delek and its subsidiaries (the “Refinancing”), as well as certain fees, costs and expenses in connection with the closing of the New Credit Facilities, with any remaining proceeds held in cash. Proceeds of future borrowings under the Revolving Credit Facility will be used for working capital and general corporate purposes of Delek and its subsidiaries. We recorded a loss on extinguishment of debt totaling approximately $9.1 million during the year ended December 31, 2018 in connection with the Refinancing. See further discussion in Note 11 of our consolidated financial statements included in Item 8, Financial Statements and Supplementary Data, of this Annual Report on Form 10-K.
The Refinancing consolidated many of our facilities providing not only a more simplified borrowing structure but also expanding our borrowing capacity with interest rates that reflect our strengthened financial position and broadened asset base. Additionally, our covenant requirements under the Refinancing arrangements are less complex and therefore better allow us to manage our covenant compliance risk.
2018 and 2019 Amendments to Supply and Offtake Agreements
Effective December 21, 2018,During January 2019, we amended our Big Spring refinery'sthe El Dorado refinery and the Krotz Springs refinery Supply and Offtake AgreementAgreements with J. Aron so that the repurchase of baseline volumes at the end of the applicable Supply and Offtake Agreement term (representing the "Baseline Step-Out Liability"Liabilities") will be based upon a fixed price instead of a market-indexed price.price and therefore subject to changes in fair value that reflect changes in interest rate risk rather than commodity price risk. The modified arrangement results in a Baseline Step-Out Liability that is no longer subject to commodity volatility, but for which its fair value is subject to interest rate risk. As a result, we recorded a gain on the change in fair value resulting from the modification of the instruments from commodities-based risk to interest rate risk in cost of materials and other totaling approximately $4.0 million in the fourthfirst quarter of 2018. As of December 31, 2018, the Baseline Step-Out Liability under the Big Spring refinery's Supply and Offtake Agreement represents the fixed notional amount outstanding under the Supply and Offtake Agreement of $52.0 million less the unamortized discount of $2.4 million for a fair value of $49.6 million related to 0.8 million barrels of baseline consigned inventory, and is reflected as a non-current obligation on our consolidated balance sheet as of December 31, 2018.2019. Such Baseline Step-Out Liabilities will continue to be recorded at fair value, where the fair value will reflect changes in interest rate risk rather than commodity price risk.
In September 2019, we amended the Supply and Offtake Agreements to increase the fixed Step-Out price on Baseline Volumes. As a result of the change in the contract terms, we received cash, net of estimated fees paid, totaling approximately $38.9 million. No gain or loss was recognized as a result of these September 2019 amendments.
See further discussion in Note 10 of our consolidated financial statements included in Item 8, Financial Statements and Supplementary Data, of this Annual Report on Form 10-K.
During January2019 Amendments to the Term Loan Credit Facility Agreement
On May 22, 2019 (the "First Incremental Effective Date"), we amended the Term Loan Credit Facility agreement pursuant to the terms of the First Incremental Amendment to Term Loan Credit Agreement (the "Incremental Amendment"). Pursuant to the Incremental Amendment, the Company borrowed $250.0 million in aggregate principal amount of incremental term loans (the “Incremental Term Loans”) at an original issue discount of 0.75%, increasing the aggregate principal amount of loans outstanding under the Term Loan Credit Facility on the First Incremental Effective Date to $943.0 million. Per the Incremental Amendment, the required scheduled quarterly principal payments under the Term Loan Credit Facility increased from $1.750 million to $2.375 million commencing with the quarterly principal payment due on June 28, 2019. There are no restrictions on the Company's use of the proceeds of the Incremental Term Loans, and the proceeds may be used to (i) to reduce utilizations under the Revolving Credit Facility, (ii) for general corporate purposes and (iii) to pay transaction fees and expenses associated with the Incremental Amendment.
On November 22, 2019 (the "Second Incremental Effective Date"), we amended the Term Loan Credit facility agreement pursuant to the terms of the Second Incremental Amendment to the Term Loan Credit Agreement (the "Second Incremental Amendment"). Pursuant to the Second Incremental Amendment, the Company borrowed $150.0 million in aggregate principal amount of incremental term loans (the "Incremental Loans') at an original issue discount of 1.21%, increasing the aggregate principal amount of loans outstanding under the Term Loan Credit Facility on the Second Incremental Effective Date to $1,088.3 million. Per the Second Incremental Amendment, the required scheduled quarterly principal payments under the Term Loan Credit Facility increased from $2.375 million to $2.750 million commencing with the quarterly principal payment due on December 31, 2019. The terms of the Incremental Term Loans are substantially identical to the terms applicable to the initial term loans under the Term Loan Credit Facility borrowed in March 2018. There are no restrictions on the Company's use of proceeds for the Incremental Loans.
On December 18, 2019, we also amended the El Dorado refinerySecond Amended and Restated Credit Agreement dated March 30, 2018, which increased the Krotz Springs refinery Supply and Offtake Agreements with J. Aron so thatcapacity to issue letters of credit under the repurchaseagreement from $300.0 million up to $400.0 million, including letters of baseline volumes at the endcredit denominated in Canadian dollars of the Supply and Offtake Agreement term (representing the Baseline Step-Out Liabilities) will be based upon a fixed price instead of a market-indexed price and therefore subjectup to changes in fair value that reflect changes in interest rate risk rather than commodity price risk. $10.0 million.
See further discussion in Note 2411 of our consolidated financial statements included in Item 8, Financial Statements and Supplementary Data, of this Annual Report on Form 10-K.
2019 New Term Loan Facility
On December 31, 2019, Delek entered into a term loan credit and guaranty agreement (the "Agreement") with Bank Hapoalim B.M. ("BHI") as the administrative agent. Pursuant to the Agreement, on December 31, 2019 Delek borrowed $40.0 million. The interest under the Agreement is equal to LIBOR plus a margin of 3.00%. The Agreement has a maturity of December 31, 2022 and requires quarterly loan amortization payments commencing March 31, 2020. Proceeds may be used for general purposes. The Agreement has an accordion feature that allows increasing the term loan to maximum size of $100.0 million, subject to receiving increased or new commitments from lenders and the satisfaction of certain other conditions. Any such additional borrowings must be completed before December 31, 2021. See further discussion in Note 11 of our consolidated financial statements included in Item 8, Financial Statements and Supplementary Data, of this Annual Report on Form 10-K.
Management's Discussion and Analysis
A Look to the Future: Our Strategic GoalsSeveral of our 2018 strategic goals continue to factor into our overall strategy. We still intend to focus on long-term shareholder returns; to have significant organic growth by identifying and capitalizing on margin improvement opportunities; to maintain financial flexibility to achieve the operational, capital and transactional objectives that are important to our sustainability and long-term growth; to continue to grow and develop complementary logistics systems; and to focus efforts on our Permian refining system, all of which contribute to thriving as an integrated and diversified refining, logistics and marketing company. |
|
| A Look to the Future: Our Strategic Goals |
During 2018,2019, Delek’s leadership team built a new framework to facilitate development of the Company’s strategies and initiatives. This framework starts with the Company’s overarching objectives for the next five years:years, and continues to lay the foundation for our annual strategic goals:
| |
| I. | Become nationally recognized for safety and wellness leadership, |
| |
| II. | Maximize return on assets through best-in-industry reliability and integrity, |
| |
| III. | Improve efficiency and execution through development of systems and processes, |
| |
| IV. | Identify and manage risks to improve decision making and increase profitability, and |
| |
| V. | Significantly increase overall earnings. |
These overarching objectives are supported by five strategic focuses,focus areas, which inform the priorities of each segment’s initiatives, as discussed below:
| |
| I. | Safety and wellness.In the refining environment, safety is always of paramount concern. But safety, and wellness, are also critical to maximizing productivity and optimizing the use of our team members' talents and capital assets, our two most valuable resources. For these reasons, safety and wellness have become an enterprise-wide, pervasive mantra in our culture that is already resulting in fewer injuries and less downtime. For 2019, our initiatives are centered around awareness and developing programs with our employees' input to guide and support all of the business units. We believe these cultural programs will drive continued reductions in work-related recordable injuries and move us toward becoming first in class with respect to safety and wellness. |
| |
| II. | Reliability and integrity.We are focused on improving refinery system availability through top-tiered maintenance and equipment monitoring, and minimizing environmental releases by exploring new technologies and methods for monitoring and correcting failures before they result in releases. But this objective reaches beyond our refining and logistics operations. We are also committed to improving the reliability and integrity of our internal information and organizational infrastructure, with a specific emphasis on information technology as well as other functions that support the operating business units. |
| |
| III. | Systems and processes.A primary focus to achieve not only an efficient model for sustainability but also to position us to absorb anticipated growth is to develop next generation processes and systems that are integrated, organized, and that are aligned with our operational and strategic objectives. |
| |
| IV. | Risk-based decision making.Making effective and insightful decisions in a rapidly changing environment is a hallmark of high-performing organizations that sustain through volatile times. We are working to develop mitigation plans for defined operational and business unit risks that will be anticipatory and preemptive. |
| |
| V. | Positioning for growth.We have a history of achieving growth, largely through acquisitions. Our view for the future includes continuing to identify acquisition targets that are strategic as well as accretive while also exploring the possibility of capital investment opportunities in new technology and alternative energy. |
We believe that these strategic objectives and areas of focus are representative of our desire to maximize the opportunities both within and external to the organization in a way that is innovative and forward-thinking, while incorporating some of the strategies that have been essential to our story so far and are part of who we are as a company. Accordingly, these focus areas continue to provide a foundation for our 2020 strategic initiatives, which are as follows:
Related to our strategic initiatives, we have developed the following 2020 strategic initiatives:
| |
| • | Maintain and continue to enhance our safe operations and commitment to responsible corporate citizenship. A central focus is to enhance the safety across our organization. It is a core value at Delek and we work day-to-day to ingrain this into our culture. The organization is focused on Environment/Health/Safety, Employee Engagement, Community Commitment and Ethics/Governance in an effort to have safe and compliant operations for the benefit of our employees, communities, customers and shareholders. |
| |
| • | Broaden our winning culture. As a growing organization, we want to develop a culture that can support its success. Our core values: Safety, Integrity, Maximize Value, Passion for Winning & Excellence, Growth Oriented and Commitment are guiding factors in the way we do business. We are investing in our people to expand our knowledge base through training, systems and processes with a goal to retain the ability to act quickly as we grow. |
| |
| • | Enhance our integrated platform. Our integrated platform allows to purchase a barrel of crude oil at the wellhead, transport crude oil to our refineries to produce finished products then transport it to our retail network or third parties. In 2019, projects such as the alkylation unit at Krotz Springs, turnaround at El Dorado, steps to improve our retail portfolio or investment in our logistics assets are all examples of the continuous effort to improve our existing platform. |
Management's Discussion and Analysis
| |
| • | Diversify our business model through growth in our midstream operations. We executed initiatives in 2019 to develop our midstream operations through construction of the Big Spring Gathering System, entering into joint ventures for the Red River and Wink to Webster pipelines. Our intention is to use our cash flow and strong balance sheet to diversify our earnings mix by increasing the size of our more stable midstream business. |
| |
| • | Maximize operational efficiencies. This extends to all aspects of the organization. From back office processes and systems to the operating assets in refining, logistics and retail. By safely maximizing our efficiencies, reliability and asset integrity, we should enhance our competitiveness and free cash flow generation potential. In a commodity based environment that changes quickly, we are consistently focused on executing on factors that are within our control. |
| |
| • | Create organizational scalability to support growth. A challenge of a growing company is that sometimes it comes in large steps, which can stretch an organization. We are focused on developing our systems and processes, improving efficiencies and retaining knowledge within the organization to create a structure that is scalable as we grow in the future. |
| |
| • | Use our financial flexibility and cash flow to create shareholder value. Delek is focused on managing the cash flow of our business to support a capital allocation program that includes: 1) returning cash to shareholders through dividends and share repurchases, 2) applying a disciplined approach to investing in our business and 3) growing through acquisitions- all of which combine to serve our overarching goal of increasing long-term value for our shareholders. |
Already, we have begun working towards the achievement of our 2020 strategic initiatives as evidenced by the significant 2020 transactions highlighted below:
2020 Investment in Project Financing Joint Venture
On February 21, 2020, we, through our wholly-owned direct subsidiary Delek Energy, entered into the W2W Holdings LLC Agreement with MPLX Operations LLC ("MPLX") (collectively, with its wholly-owned subsidiaries, the "WWP Project Financing Joint Venture" or the "WWP Project Financing JV"). The WWP Project Financing JV was created for the specific purpose of obtaining financing, through its wholly-owned subsidiary W2W Finance LLC, to fund our combined capital calls resulting from and occurring during the construction period of the pipeline system under the WWP Joint Venture, and to service that debt. In connection with the arrangement, both Delek Energy and MPLX contributed their respective 15% ownership interests to the WWP Project Financing JV as collateral for and in service of the related project financing. Accordingly, distributions received from WWP through the WWP Project Financing JV will first be applied in service of the related project financing debt, with excess distributions being made to the members of the WWP Project Financing JV as provided for in the W2W Holdings LLC Agreement. The obligations of the members under the W2W Holdings LLC Agreement are guaranteed by the parents of the members of the WWP Project Financing JV (i.e., for Delek Energy, the guarantee is from Delek US Holdings, Inc.). We believe that this financing mechanism provides not only for better pricing on the strength of our combined investments and member guarantees, but that it enhances our financial position by presenting our investment in the WWP Project Financing JV net of encumbrances that are specific to that investment.
See further discussion in Notes 7 and 25 of our consolidated financial statements included in Item 8, Financial Statements and Supplementary Data, of this Annual Report on Form 10-K.
2020 Amendments to Supply and Offtake Agreements
In January 2020, we amended our three Supply and Offtake Agreements to convert the Baseline Step-Out Liabilities back to a market-indexed price subject to commodity price risk with corresponding changes to underlying market-based indices and certain differentials. We believe that this will reduce the need for economic commodity hedges and provide operating results that more closely correlate to current crack spreads and differentials.
See further discussion in Notes 10 and 25 of our consolidated financial statements included in Item 8, Financial Statements and Supplementary Data, of this Annual Report on Form 10-K.
Management's Discussion and Analysis
Market Trends
Our results of operations are significantly affected by fluctuations in the prices of certain commodities, including, but not limited to, crude oil, gasoline, distillate fuel, biofuels and natural gas and electricity, among others. Historically, our profitability has been affected by commodity price volatility, specifically as it relates to the price of crude oil and refined products. We have significant sources of WTI Midland crude because of our gathering system, and so accordingly favorable pricing of WTI Midland crude compared to other WTI crude can favorably impact our cost of materials and other and therefore our margins compared to other refiners.
The table below reflects the quarterly high, low and average prices of WTI Midland crude oil for each of the quarterly periods over the past three years.
The table below reflects the quarterly high, low and average prices of WTI Cushing crude oil for each of the quarterly periods over the past three years. As shown in the historical graph, over the past three years WTI Midland crude prices have generally been favorable as compared to WTI Cushing, though that trend has reversed slightly in the fourth quarter 2019.
Management's Discussion and Analysis
Crack spreads are used as benchmarks for predicting and evaluating a refinery's product margins by measuring the difference between the market price of feedstocks and crude oil and refined products. Generally, crack spreads represent the approximate refining margin resulting from processing one barrel of crude oil into its outputs, generally gasoline and diesel fuel.
The table below reflects the quarterly high, low and average Gulf Coast 5-3-2, 3-2-1 and 2-1-1 crack spread (Tyler and El Dorado benchmark)spreads for each of the quarterly periods over the past three years.
The table below reflects As the quarterly high, low and average Gulf Coastchart illustrates, the 3-2-1 crack spread (Big Spring benchmark) forhas consistently outperformed the 5-3-2 and the 2-1-1 crack spreads over the past three years, where we have owned theyears. In such conditions, things being equal (i.e., near-capacity throughputs and no significant outages), our Big Spring refinery, only sincewhose benchmark is the Delek/Alon Merger.3-2-1 crack spread, should outperform our other refineries in terms of refining margin.
Management's Discussion and Analysis
The table below reflectsCrack spreads are impacted by the quarterly high, low and average Gulf Coast 2-1-1 crack spread (Krotz Springs benchmark) for the past three years, where we have owned the Krotz Springs refinery only since the Delek/Alon Merger.
The market price of refined products contributedas compared to the increaseprice of crude oil and therefore may narrow or widen based on different trends in those market prices, or lags in one commodity pricing change versus the other. For example, the average Gulf Coast 5-3-2 crack spread per barrel remained relatively steady at $13.78 in 2019 compared to $13.21 in 2018, from $13.01 in 2017, with thedespite Gulf Coast price of gasoline (CBOB) increasing 18.0%decreasing 10.7%, from an average of $1.55 per gallon in 2017 to $1.83 per gallon in 2018. The2018 to $1.63 per gallon in 2019, which indicates that decreases in feedstocks trended similarly. As a result, while, in such circumstances, total revenues for gasoline and corresponding cost of materials and other will be lower (assuming consistent volumes), refining margins would remain relatively flat year-over-year. Thus, while fluctuations in refined product prices will significantly impact our top line revenue (assuming consistent volumes), crack spread has greater direct impact on our margins.
Our refineries produce the following products:
|
| | | | |
| Tyler Refinery | El Dorado Refinery | Big Spring Refinery | Krotz Springs Refinery |
| Primary Products | Gasoline, jet fuel, ultra-low-sulfur diesel, liquefied petroleum gases, propylene, petroleum coke and sulfur | Gasoline, ultra-low-sulfur diesel, liquefied petroleum gases, propylene, asphalt and sulfur | Gasoline, jet fuel, ultra-low-sulfur diesel, liquefied petroleum gases, propylene, aromatics and sulfur | Gasoline, jet fuel, high-sulfur diesel, light cycle oil, liquefied petroleum gases, propylene and ammonium thiosulfate |
In addition to decreases in the price of CBOB gasoline, the Gulf Coast price of High Sulfur Diesel increased 30.8%decreased 8.3%, from an average of $1.47 per gallon in 2017 to $1.92 per gallon in 2018.2018 to $1.76 per gallon in 2019. The Gulf Coast price of Ultra Low Sulfur Diesel increased 26.3%decreased 8.0% from an average of $1.62 per gallon in 2017 to $2.05 per gallon in 2018.2018 to $1.88 per gallon in 2019. The charts below illustrate the quarterly high, low and average prices of Gulf Coast Gasoline, U.S. High Sulfur Diesel and U.S. Ultra Low Sulfur Diesel over the past three years.
Management's Discussion and Analysis
Management's Discussion and Analysis
|
|
| Crude Pricing Differentials |
As USU.S. crude oil production has increased, we have seen the discount for WTI Cushing widen compared to Brent.Brent widen. This generally leads to higher margins in our refineries as refined product prices are influenced by Brent crude prices and the majority of our crude supply is WTI-linked. The average discount for WTI Cushing compared to Brent increased to $6.49$7.13 during 20182019 from $3.95$6.70 during 2017.2018. We note similar historical trends when reviewing the average discount for LLS compared to WTI Cushing, where the average discount increased to $5.66 during 2019 from $4.99 during 2018 from $3.23 during 2017.2018. Additionally, our refineries continue to have relatively greater access to WTI Midland and WTI Midland-linked crude feedstocks compared to certain of our competitors. The average discount for WTI Midland compared to WTI Cushing increaseddecreased to $0.68 during 2019 from $7.36 during 2018 from $0.34 during 2017.2018. As these discounts shrink or, as in the case of the WTI Midland/WTI Cushing differential, become a premium, without taking into account changes in inventory, as they did at the end of 2019, our reliance on WTI-linked crude pricing, and specifically WTI Midland crude can negatively impact our results. Conversely, as these price discounts increase, so does our competitive advantage, created by our access to WTI-linked crude oil.oil pricing, and specifically WTI Midland crude sources through our gathering systems. The chart below illustrates the differentials of both Brent crude oil and WTI Midland crude oil as compared to WTI Cushing crude oil as well as WTI Cushing as compared to LLS over the past three years.
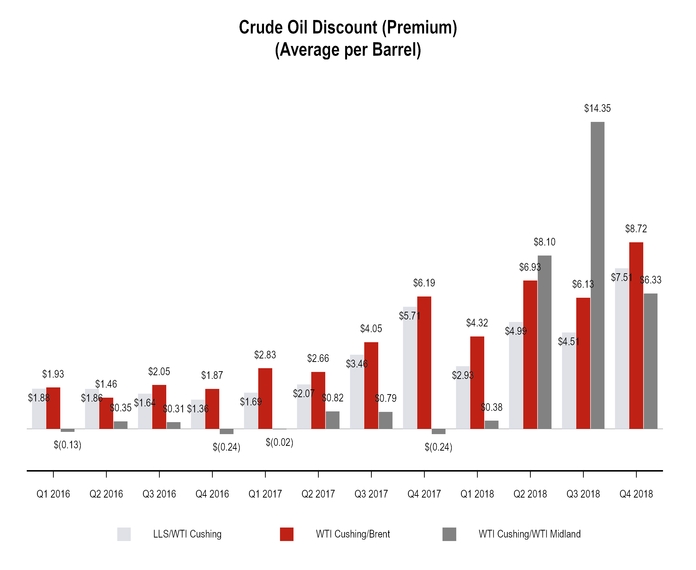
Management's Discussion and Analysis
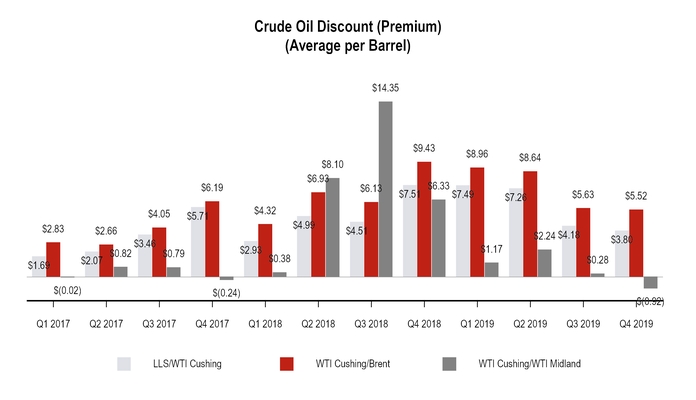
Environmental regulations continue to affect our margins in the form of volatility in the increasingcosts of RINs cost. On a consolidated basis, we work to balance our RINs obligations in order to minimize the effect of RINs on our results. While we generate RINs in both of our refining and logistics segments through our ethanol blending and biodiesel production, our refining segment needs to purchase additional RINs to satisfy its obligations. As a result, increases in the price of RINs generally adversely affect our results of operations. It is not possible at this time to predict with certainty what future volumes or costs may be, but given the increase in required volumes and the volatile price of RINs, the cost of purchasing sufficient RINs could have an adverse impact on our results of operations if we are unable to recover those costs in the price of our refined products. The chart below illustrates the volatile nature of the price for RINs over the past three years.
Management's Discussion and Analysis
Management's Discussion and Analysis
Summary Financial and Other Information
The following table provides summary financial data for Delek (in millions):
|
| | | | | | | | | | | | |
| Summary Statement of Operations Data | | Year Ended December 31, |
| | | 2018(1)(2) | | 2017(3) | | 2016 |
| Net revenues | | $ | 10,233.1 |
| | $ | 7,267.1 |
| | $ | 4,197.9 |
|
| Total operating costs and expenses | | 9,621.2 |
| | 7,086.8 |
| | 4,247.1 |
|
| Operating income (loss) | | 611.9 |
| | 180.3 |
| | (49.2 | ) |
| Total non-operating expenses (income), net | | 126.4 |
| | (119.0 | ) | | 342.0 |
|
| Income (loss) from continuing operations before income tax expense (benefit) | | 485.5 |
| | 299.3 |
| | (391.2 | ) |
| Income tax expense (benefit) | | 101.9 |
| | (29.2 | ) | | (171.5 | ) |
| Income (loss) from continuing operations, net of tax | | 383.6 |
| | 328.5 |
| | (219.7 | ) |
| (Loss) income from discontinued operations, net of tax | | (8.7 | ) | | (5.9 | ) | | 86.3 |
|
| Net income (loss) | | 374.9 |
| | 322.6 |
| | (133.4 | ) |
| Net income attributed to non-controlling interests | | 34.8 |
| | 33.8 |
| | 20.3 |
|
| Net income (loss) attributable to Delek | | $ | 340.1 |
| | $ | 288.8 |
| | $ | (153.7 | ) |
|
| | | | | | | | |
| Summary Statement of Operations Data | | Year Ended December 31, |
| | | 2019 | | 2018(1)(2) |
| Net revenues | | $ | 9,298.2 |
| | $ | 10,233.1 |
|
| Total operating costs and expenses | | 8,805.9 |
| | 9,621.2 |
|
| Operating income | | 492.3 |
| | 611.9 |
|
| Total non-operating expenses, net | | 89.6 |
| | 126.4 |
|
| Income from continuing operations before income tax expense | | 402.7 |
| | 485.5 |
|
| Income tax expense | | 71.7 |
| | 101.9 |
|
| Income from continuing operations, net of tax | | 331.0 |
| | 383.6 |
|
| Income (loss) from discontinued operations, net of tax | | 5.2 |
| | (8.7 | ) |
| Net income | | 336.2 |
| | 374.9 |
|
| Net income attributed to non-controlling interests | | 25.6 |
| | 34.8 |
|
| Net income attributable to Delek | | $ | 310.6 |
| | $ | 340.1 |
|
(1) Statement of operations data for the year ended December 31, 2018 reflects a $5.5 million adjustment to increase income tax expense related to the establishment of a valuation allowance on deferred tax assets and to decrease net income and net income attributable to Delek, and reducing basic and diluted income per share by $0.07 and $0.06, respectively, that were not reflected in the Earnings Release furnished as Exhibit 99.1 to the Form 8-K filed with the SEC on February 20, 2019 (the "Earnings Release").2019. Such adjustment hashad no impact on adjusted net income or adjusted net income per share (as defined in the Earnings Release). See further discussion in Notes 15 and 23 of our consolidated financial statements included in Item 8, Financial Statements and Supplementary Data, of this Annual Report on Form 10-K.
(2) Statement of operations data for the year ended December 31, 2018 includes a $60.7 million adjustment to increase net revenues and cost of materials and other to record a correction of an intercompany elimination that was not reflected in the February 20, 2019 Earnings Release. Such amounts are not considered material to the financial statements and had no impact to operating income, segment contribution margin or net income.
(3)Statement
We report operating results in three reportable segments:
Refining
Logistics
Retail
Decisions concerning the allocation of operations data forresources and assessment of operating performance are made based on this segmentation. Management measures the year ended December 31, 2017 reflects six monthsoperating performance of incremental resultseach of operations resulting fromits reportable segments based on the Delek/Alon Merger, which was effective July 1, 2017. Additionally, the balance sheet date as of December 31, 2017 reflects the assets and liabilities of Alon as a result of the Delek/Alon Merger.
segment contribution margin.
Management's Discussion and Analysis
Results of Operations
Consolidated Results of Operations — Comparison of the Year Ended December 31, 20182019 versus the Year Ended December 31, 2017 and the Year Ended December 31, 2017 versus the Year Ended December 31, 20162018
Net Income
2018 vs. 2017
Consolidated net income for the year ended December 31, 20182019 was $374.9$336.2 million compared to $322.6$374.9 million for the year ended December 31, 2017.2018. Consolidated net income attributable to Delek for the year ended December 31, 20182019 was $340.1$310.6 million, or $4.11$4.10 per basic share, compared to $288.8$340.1 million, or $4.04$4.11 per basic share, for the year ended December 31, 2017. Explanations for significant drivers impacting net income as compared to the comparable period of the prior year are discussed in the sections below.
2017 vs. 2016
Consolidated net income for the year ended December 31, 2017 was $322.6 million compared to a net loss of $133.4 million for the year ended December 31, 2016. Consolidated net income attributable to Delek for the year ended December 31, 2017 was $288.8 million, or $4.04 per basic share, compared to a net loss of $153.7 million, or $2.49 per basic share, for the year ended December 31, 2016.2018. Explanations for significant drivers impacting net income as compared to the comparable period of the prior year are discussed in the sections below.
Net Revenues
2018 vs. 2017
We generated net revenues of $10,233.1$9,298.2 million and $7,267.1$10,233.1 million during the years ended December 31, 2019 and 2018, and 2017, respectively, an increasea decrease of $2,966.0$934.9 million, or 40.8%9.1%. The increasedecrease in net revenues was primarily due to the following factors:
the addition of Alon financial results as a result of the Delek/Alon Merger, which contributed net incremental revenues of $2,710.9 millionin our refining segment, decreases in the year ended December 31, 2018, which included twelve months of Alon operating results, as compared to the year ended December 31, 2017, which included only six months; and
the effects of increases in the price of finished petroleum products at our refineries (including a 18.0% increase in average price of CBOBU.S. Gulf Coast gasoline of 10.7%, ULSD of 8.0%, and High-Sulfur diesel ("HSD") of 8.3%, partially offset by increase in sales volumes; and
in our logistics segment, decreases in the average volume sold and sales prices per gallon of gasoline and diesel sold in our West Texas marketing operations, where the average sales prices per gallon of gasoline and diesel sold decreased $0.14 per gallon and a 26.3% increase in average price of ULSD per gallon).
2017 vs. 2016
We generated net revenues of $7,267.1 million and $4,197.9 million during the years ended December 31, 2017 and 2016, respectively, an increase of $3,069.2 million, or 73.1%. The increase in net revenues was primarily due to the following factors:
the addition of Alon financial results as a result of the Delek/Alon Merger, which contributed net sales of $1,906.4 during the year ended December 31, 2017 (related to the six months since the date of the Delek/Alon Merger);
the effects of increases in the price of finished petroleum products at our refineries (including a 19.7% increase in average price of CBOB gasoline$0.22 per gallon, and a 22.8% increase in average price of ULSD per gallon); and
net increases in sales volumes in our refining and logistics segments during 2017.respectively.
Operating Costs and Expenses
Cost of Materials and Other
2018 vs. 2017
Cost of materials and other was $8,560.5$7,657.2 million for the year ended December 31, 2018,2019, compared to $6,327.6$8,560.5 million for 2017, an increase2018, a decrease of $2,232.9$903.3 million, or 35.3%10.6%. The increasenet decrease in cost of materials and other primarily related to the following factors:
the addition of Alon financial results as a result of the Delek/Alon Merger, which contributed net incremental cost of materials and other of $2,159.2 million during the year ended December 31, 2018 which included twelve months of Alon operating results, as compared to the year ended December 31, 2017, which included only six months of Alon operating results;
an increasedecrease in the cost of crude oil feedstocks at the refineries including an increasea decrease in the cost of WTI Cushing crude oil from an average of $50.78$65.20 per barrel to an average of $65.20,$56.99, and an increasea decrease in the cost of WTI Midland crude oil from an average of $50.44$57.84 per barrel to an average of $57.84;$56.31 per barrel;
a decrease in RIN expense where ethanol RIN prices averaged $0.17 per RIN compared to $0.31 per RIN in the prior year period;
a decrease in average volumes sold and
an increase in the cost of refined products in the logistics segment where the average cost per gallon of gasoline and diesel purchased increased $0.23decreased $0.15 per gallon and $0.45$0.19 per gallon, respectively.respectively;
an increase in hedging gains to $22.8 million recognized during 2019 compared to a loss of $0.8 million recognized during 2018; and
Management's Discussionthe reenactment of the BTC in December 2019 for the 2018 and Analysis
Such increasesdecreases were partially offset by:
a reduction in costprior period benefit of materials and other attributableapproximately $115.5 million related to a decrease in average RIN prices and RIN waivers received which resulted in an incremental net reduction of such costs as compared to the prior year.
2017 vs. 2016
Cost of materials and other was $6,327.6 million for the year ended December 31, 2017, compared to $3,812.9 million for 2016, an increase of $2,514.7 million, or 66.0%. The increase in cost of materials and other was primarily due to the following factors:
the addition of Alon financial results as a resultcombination of the Delek/Alon Merger, which contributed cost2017 RINs waivers and a biodiesel tax credit recognized during 2018, whereas 2018 RIN Waivers provided a benefit of materials and other of $1,531.90$20.7 million during the year ended December 31, 2017 (related to the six months since the date of the Delek/Alon Merger);
an increase in the cost of crude oil feedstocks at the refineries including an increase in the cost of WTI Cushing crude oil from an average of $43.33 per barrel to an average of $50.78, and an increase in the cost of WTI Midland crude oil from an average of $43.25 per barrel to an average of $50.44;
an increase in the cost of refined products in the logistics segment where the average cost per gallon of gasoline and diesel purchased increased $0.27 per gallon and $0.31 per gallon, respectively; and
an increase in sales volumes in our refining and logistics segments.
Such increases were partially offset by:
a reduction in cost of materials and other attributable to RIN waiver received which resulted in an incremental net reduction of such costs as compared to the prior year.2019.
Operating Expenses
2018 vs. 2017
Operating expenses (included in both cost of sales and other operating expenses) were $645.0$682.2 million for the year ended December 31, 20182019 compared to $429.0$645.0 million in 2017,2018, an increase of $216.0$37.2 million, or 50.3%5.8%. The increase in operating expenses was primarily driven by the following:
the addition of Alon financial results as a result of the Delek/Alon Merger, which contributed incremental operating expenses of $160.5 million during the year ended December 31, 2018, which included twelve months of Alon operating results, as compared to the year ended December 31, 2017, which included only six months of Alon operating results;
higher employee related expenses due to increased headcount, overtimecosts primarily across our refining and employee incentive costs;logistics segment;
higher operating costs at our refineries associated with various spills, maintenance, outages and increased utility expenses; and
higher operating costscontract services in our refining and logistics segment associated with increased volumes at our terminalssegments; and maintenance costs.
Such increases were partially offset by:
a $16.0 million reduction of operating expenses in 2018 attributed to recoveries received from the settlement of disputed indemnification matters related to environmental obligations and asset retirement obligations at the Bakersfield Refinery.refinery.
2017 vs. 2016Such increases were partially offset by:
Operatingreductions in maintenance expense and variable expenses (included in both cost of salesour refining segment; and other operating expenses) were $429.0 million for the year ended December 31, 2017 compared to $249.3 million
decrease in 2016, an increase of $179.7 million, or 72.1%. The increase inretail operating expenses is primarily driven by the following:
additiondue to reduction in number of Alon financial results as a result of the Delek/Alon Merger, which contributed operating expenses of $172.6 during the year ended December 31, 2017 (related to the six months since the date of the Delek/Alon Merger).
Insurance proceeds — business interruption
We recognized proceeds from business interruption insurance claims of $42.4 million for the year ended December 31, 2016, associated with a litigation settlement. We did not record any insurance proceeds for the years ended December 31, 2018 or 2017.stores.
Management's Discussion and Analysis
General and Administrative Expenses
2018 vs. 2017
General and administrative expenses were $247.6$274.7 million for the year ended December 31, 20182019 compared to $175.9$247.6 million in 2017,2018, an increase of $71.7$27.1 million, or 40.8%10.9%. The increase was primarily driven by the following factors:
the addition of Alon as a result of the Delek/Alon Merger, which contributed incremental general and administrative expenses of $31.8 million during the year ended December 31, 2018, which included twelve months of Alon operating results, as compared to the year ended December 31, 2017, which included only six months of Alon operating results;
an increase in employee related costs resulting from driven by higher equity-based compensation and increased headcount;
increases in incentive planlegal and audit costs associated with various acquisition, investment, litigation and the addition of employeesdispute matters;
increases in connection with the integration of the acquisition of Alon;property and other taxes;
increases in supplies expenses for subscriptions and office related costs; and
increases in information technology expenses related to system upgrades, security and licensing.
2017 vs. 2016
General and administrative expenses were $175.9 million for the year ended December 31, 2017 compared to $106.1 million in 2016, an increase of $69.8 million, or 65.8%. The overall increase was primarily driven by the following factors:
the addition of Alon as a result of the Delek/Alon Merger, which contributed general and administrative expenses of $37.4 during the year ended December 31, 2017 (related to the six months since the date of the Delek/Alon Merger), as well as additional absorbed overhead cost, integration costs and related transaction costs incurred during 2017; and
transaction costs related to the Delek/Alon Merger incurred by the Company totaled approximately $24.7 million, inclusive of $10.1 million of merger costs and $14.7 million of non-recurring costs associated with the transaction for the year ended December 31, 2017.various outside service costs.
Depreciation and Amortization
2018 vs. 2017
Depreciation and amortization (included in both cost of sales and other operating expenses) was $199.4$194.3 million and $153.3$199.4 million for the years ended December 31, 2019 and 2018, and 2017, respectively, an increasea decrease of $46.1$5.1 million, or 30.1%2.6%. The increase in depreciation expense
Other Operating Income, Net
Other operating income, net was primarily driven by the following:
the addition of Alon property, plant and equipment of $1,130.3$2.5 million and the addition of amortizable intangibles of $61.3 million as a result of the Delek/Alon Merger, combined with the addition of other capital expenditures and acquisitions (net of disposals) completed to date, where such additions contributed $45.3 million in incremental depreciation and amortization during the year ended December 31, 2018, which included twelve months of Alon operating results, as compared to the year ended December 31, 2017, which included only six months of Alon operating results.
2017 vs. 2016
Depreciation and amortization was $153.3 million and $116.4$31.3 million for the years ended December 31, 20172019 and 2016,2018, respectively, an increasea decrease of $36.9$28.8 million or 31.7%. The increase was primarily driven by the following:
addition of Alon property, plant and equipment of $1,130.5 million (at preliminary fair value) and amortizable intangibles of $53.6 million (at preliminary fair value) as a result of the Delek/Alon Merger, which contributed $34.4 million in additional depreciation and amortizationpartially due to lower net gains associated with our Canadian crude trading operations during 2017 (related2019 compared to the six months since the date of the Delek/Alon Merger).2018.
Other Operating (Income) Expense, Net
2018 vs. 2017
Other operating (income) expense, net was $(31.3) million and $1.0 million for the years ended December 31, 2018 and 2017, respectively, an increase of $(32.3) million. The increase was primarily driven by the following:
an increase of $20.1 million related to realized and unrealized gains on trading forward contract derivatives and net of gains of $7.7 million on related hedging derivatives in 2018; and
| |
• | a gain on asset disposal of $0.9 million partially driven by the sale of 14 retail stores.
|
Management's Discussion and Analysis
2017 vs. 2016
Other operating expense, net for the year ended December 31, 2017 and 2016 was $1.0 million and $4.8 million, respectively, primarily related to losses on asset disposals.
Non-Operating ExpensesInterest Expense
2018 vs. 2017
Interest expense was $125.9$131.1 million in the year ended December 31, 2018,2019, compared to $93.8$125.9 million for 2017,2018, an increase of $32.1$5.2 million, or 34.2%4.1%. The increase was primarily driven by the following:
an increase in net average borrowings outstanding (including the obligations under the supply and offtake agreements which have an associated interest charge) of approximately $594.0$321.6 million (calculated as a simple average of beginning borrowings/obligations and ending borrowings/obligations for the period) for the year ended December 31, 20182019 compared to the year ended December 31, 2017, where a significant driver of the increase in borrowings related to the assumption of debt/obligations in connection with the Delek/Alon Merger.
2017 vs. 2016
Interest expense was $93.8 million in the year ended December 31, 2017, compared to $54.4 million for 2016, an increase of $39.4 million, or 72.4%. The increase was primarily driven by the following:
addition of assumed debt totaling $568.0 million (at fair value) in connection with the Delek/Alon Merger; and
increases in the weighted average interest rate, including LIBOR interest rates, under our credit facilities2018.
Results from Equity Method Investments
2018 vs. 2017
We recognized income from equity method investments of $34.3 million for the year ended December 31, 2019, compared to $9.7 million for the year ended December 31, 2018, compared to $12.6 million for the year ended December 31, 2017, an increase of $2.9$24.6 million. This decreaseincrease was primarily driven by the following:
the absence of the equity method investmentan increase in Alon during the year ended December 31, 2018 whereas we recognized our proportionate share of the net income from our investmentasphalt joint venture from $3.4 million during 2018 to $15.2 million during 2019;
the addition of the Red River Pipeline Joint Venture in AlonMay 2019 which contributed income of $4.5 million, net of $1.3$8.4 million in amortization of the excess of our investment over our equity in the underlying net assets of Alon, for the year ended December 31, 2017;2019; and
the disposal of an equity method investment associated with the sale of asphalt terminals during the year ended December 31, 2018.
2017 vs. 2016
We recognized income from equity method investments of $12.6 millionincrease in the year ended December 31, 2017, compared to loss of $43.4 million for 2016. Changes in the results from equity method investments for 2017 and 2016 were primarily driven by the following:
the absence of an equity method investment in Alon during the last half of 2017, in which we recognized our proportionate share of the net income from our investment in Alon of $4.5other logistics joint ventures from $6.2 million net of $1.3during 2018 to $11.5 million in amortization of the excess of our investment over our equity in the underlying net assets of Alon, as compared to our proportionate share of the net loss from our investment in Alon of $39.6 million and $2.6 million in amortization of the excess of our investment over our equity in the underlying net assets of Alon for 2016; and
the recognition of our proportionate share of net income for equity method investments acquired in the Delek/Alon Merger.during 2019.
Other Non-Operating Expenses, Net
2018 vs. 2017
During the year ended December 31, 2018, we incurred certain infrequently occurring expenses/charges that were not incurred during the year ended December 31, 2017.2019. These included a $9.1 million loss on extinguishment of debt related to the Refinancing and an impairment loss on assets held for sale totaling approximately $27.5 million related to the asphalt assets held for sale. These charges were partially offset by a realized gain on the sale of certain asphalt assets totaling $13.3 million, including a gain on the sale of an asphalt equity method investment. See Notes 8 and 11 of the consolidated financial statements in Item 15, Exhibits and Financial Statement Schedules, for additional information.
Additionally, other expense (income), net was $(7.3) million and $(6.1) million in the years ended December 31, 2018 and 2017, respectively, an increase of $1.2 million. The increase was primarily driven by the following immaterial changes:
Management's Discussion and Analysis
the recognition of a gain related to settlement of disputed indemnification matters related to environmental obligations and asset retirement obligations at the Bakersfield Refinery; and
increase in other miscellaneous income, including decrease in reserves related to pending litigation and the relieving of certain retail deposits.
Such increases were partially offset by:
expense associated with the termination of our license agreement with 7-Eleven in 2018 .
2017 vs. 2016
Other expense (income), net was $(6.1) million and $0.4 million in the years ended December 31, 2017 and 2016, respectively, an increase of $6.5 million. The increase was primarily driven by the recognition of net periodic benefit cost, exclusive of service costs, associated with our defined benefit pension plans assumed in the Delek/Alon merger.
Income Taxes
2018 vs. 2017
The Tax Cuts and Jobs Act (the "Tax Reform Act") was enacted on December 22, 2017. The Tax Reform Act reduces the US federal corporate tax rate from 35% to 21%, provides for immediate deduction of qualified capital assets placed in service, requires companies to pay a one-time transition tax on earnings of certain foreign subsidiaries that were previously tax deferred and creates new taxes on certain foreign sourced earnings.At December 31, 2017, we made a reasonable estimate of the effects of the Tax Reform Act on our existing deferred tax balances, and recognized a provisional benefit amount of $166.9 million, which was included as a component of income tax expense from continuing operations. We remeasured certain deferred tax assets and liabilities based on the rates at which they are expected to reverse in the future, which is generally 21% for federal purposes. For the year ended December 31, 2018, we completed the analysis of the accounting for the tax effects of the enactment of the Act, resulting in our recording of an additional tax benefit of $0.6 million during 2018. These adjustments to the previously recorded provisional amounts include the effects on the existing deferred tax balances and executive compensation.
Income tax expense (benefit) was $101.9 million and $(29.2)decreased $30.2 million during the years ended December 31, 2019 compared to the same period for 2018, and 2017, respectively, an increase in expense of $131.1 million. The increase in expense was primarily driven by the following:
pre-tax income of $485.5$402.7 million compared to $299.3$485.5 million for the years ended December 31, 2019 and 2018, respectively;
Management's Discussion and 2017, respectively, and an increaseAnalysis
a decrease in our effective tax rate which was 21.0%17.8% compared to (9.8)%21.0% for the years ended December 31, 2019 and 2018, and 2017, respectively.
an increase to our effective tax rate to a more normalized level (in relation to statutory tax rates) where the 2017 tax rate was favorably and significantly impacted by the $166.9 million benefit attributablerespectively, primarily due to the impactfollowing:
| |
| ◦ | the 2019 recognition of the BTC receivable, the majority of which is non-taxable; and |
| |
| ◦ | discrete adjustments that were reported during 2018 for the following: |
| |
| ▪ | tax expense associated with the impairment of assets held for sale; and |
| |
| ▪ | changes in valuation allowance attributable to the book-tax basis differences from the Big Spring Logistic Asset Acquisition (See Note 6 of our consolidated financial statements included in Item 8, Financial Statements and Supplementary Data, of this Annual Report on Form 10-K). |
A detailed discussion of applying the Tax Reform Act to our existing net deferred tax liabilities in 2017.
2017 vs. 2016
Income tax benefit was $29.2 million and $171.5 million during the years ended December 31, 2017 and 2016, respectively, a decrease of $142.3 million, reflecting a decrease in our effective tax rate from 43.8% for 2016 to (9.8)% for 2017. The decrease in benefit was primarily driven by the following:
pre-tax income of $299.3 millionfiscal year 2018 compared to pre- tax lossyear-over-year changes from fiscal year 2017 can be found in Part II, Item 7, Management's Discussion and Analysis, "Results of $391.2 million for the years 2017Operations", of our 2018 Annual Report on Form 10-K, as amended and 2016, respectively, which resulted in income tax expense for 2017 as compared to benefit for 2016; andfiled on June 27, 2019.
Such increases were offset by:
a $166.9 million benefit attributable to the impact of applying the Tax Reform Act to our existing net deferred tax liabilities in 2017.
Management's Discussion and Analysis
We report operating results in three reportable segments: refining, logistics and retail. Decisions concerning the allocation of resources and assessment of operating performance are made based on this segmentation. Management measures the operating performance of each of its reportable segments based on the segment contribution margin.
The tables and charts below set forth certain information concerning our refining segment operations ($ in millions, except per barrel amounts):
| | | Refining Segment Margins | | Refining Segment Margins |
| | | Year Ended December 31, | | Year Ended December 31, |
| | | 2018 | | 2017 | | 2016 | | 2019 | | 2018 |
| Net revenues | | $ | 9,610.4 |
| | $ | 6,620.6 |
| | $ | 3,923.2 |
| | $ | 8,798.5 |
| | $ | 9,610.4 |
|
| Cost of materials and other | | 8,279.9 |
| | 5,852.2 |
| | 3,614.1 |
| | 7,544.5 |
| | 8,279.9 |
|
| Refining Margin | | 1,330.5 |
| | 768.4 |
| | 309.1 |
| | 1,254.0 |
| | 1,330.5 |
|
| Operating expenses (excluding depreciation and amortization) | | 465.4 |
| | 317.7 |
| | 212.4 |
| | 492.4 |
| | 465.4 |
|
| Insurance proceeds - business interruption | | — |
| | — |
| | (42.4 | ) | |
| Contribution margin | | $ | 865.1 |
| | $ | 450.7 |
| | $ | 139.1 |
| | $ | 761.6 |
| | $ | 865.1 |
|
| Contribution margin percentage | | 9.0 | % | | 6.8 | % | | 3.5 | % | | 8.7 | % | | 9.0 | % |
Factors Impacting Refining Profitability
Our profitability in the refining segment is substantially determined by the difference between the cost of the crude oil feedstocks we purchase and the price of the refined products we sell, referred to as the "crack spread", "refining margin" or "refined product margin". Refining margin is used as a metric to assess a refinery's product margins against market crack spread trends, where "crack spread" is a measure of the difference between market prices for crude oil and refined products and is a commonly used proxy within the industry to estimate or identify trends in refining margins.
The cost to acquire feedstocks and the price of the refined petroleum products we ultimately sell from our refineries depend on numerous factors beyond our control, including the supply of, and demand for, crude oil, gasoline and other refined petroleum products which, in turn, depend on, among other factors, changes in domestic and foreign economies, weather conditions such as hurricanes or tornadoes, local, domestic and foreign political affairs, global conflict, production levels, the availability of imports, the marketing of competitive fuels and government regulation. Other significant factors that influence our results in the refining segment include operating costs (particularly the cost of natural gas used for fuel and the cost of electricity), seasonal factors, refinery utilization rates and planned or unplanned maintenance activities or turnarounds. Moreover, while the fluctuations in the cost of crude oil are typically reflected in the prices of light refined products, such as gasoline and diesel fuel, the price of other residual products, such as asphalt, coke, carbon black oil and LPG are less likely to move in parallel with crude cost. This could cause additional pressure on our realized margin during periods of rising or falling crude oil prices.
Additionally, our margins are impacted by the pricing differentials of the various types and sources of crude oil we use at our refineries and their relation to product pricing. Our crude slate is predominantly comprised of WTI crude oil. Therefore, favorable differentials of WTI compared to other crude will favorably impact our operating results, and vice versa. Additionally, because of our gathering system presence in the Midland area and the significant source of crude specifically from that region into our network, a widening of the WTI Cushing less WTI Midland spread will favorably influence the operating margin for our refineries. Alternatively, a narrowing of this differential will have an adverse effect on our operating margins. Global product prices are influenced by the price of Brent crude which is a global benchmark crude. Global product prices influence product prices in the U.S. As a result, our refineries are influenced by the spread between Brent crude and WTI Midland. The Brent less WTI Midland spread represents the differential between the average per barrel price of Brent crude oil and the average per barrel price of WTI Midland crude oil. A widening of the spread between Brent and WTI Midland will favorably influence our refineries' operating margins. Also, the Krotz Springs refinery is influenced by the spread between Brent crude and LLS. The Brent less LLS spread represents the differential between the average per barrel price of Brent crude oil and the average per barrel price of LLS crude oil. A discount in LLS relative to Brent will favorably influence the Krotz Springs refinery operating margin.
The cost to acquire the refined fuel products we sell to our wholesale customers in our logistics segment and at our convenience stores in our retail segment depends on numerous factors beyond our control, including the supply of, and demand for, crude oil, gasoline and other refined petroleum products which, in turn, depend on, among other factors, changes in domestic and foreign economies, weather conditions, domestic and foreign political affairs, production levels, the availability of imports, the marketing of competitive fuels and government regulation. Our retail merchandise sales are driven by convenience, customer service, competitive pricing and branding. Motor fuel margin is sales less the delivered cost of fuel and motor fuel taxes, measured on a cents per gallon basis. Our motor fuel margins are impacted by local supply, demand, weather, competitor pricing and product brand.
As part of our overall business strategy, we regularly evaluate opportunities to expand our portfolio of businesses and may at any time be discussing or negotiating a transaction that, if consummated, could have a material effect on our business, financial condition, liquidity or results of operations.
Management's Discussion and Analysis
| | | Refinery Statistics | | Refinery Statistics |
| | | Year Ended December 31, | | Year Ended December 31, |
| | | 2018 | | 2017 | | 2016 | | 2019 | | 2018 |
| Tyler, TX Refinery | | | | | | | | | | |
| Days in period | | 365 |
| | 365 |
| | 366 |
| | 365 |
| | 365 |
|
Total sales volume - refined (average barrels per day) (1) | | 78,658 |
| | 76,041 |
| | 72,542 |
| |
Total sales volume - refined product (average barrels per day) (1) | | | 76,178 |
| | 78,658 |
|
| Products manufactured (average barrels per day): | | | | | | | | | | |
| Gasoline | | 42,138 |
| | 40,936 |
| | 38,618 |
| | 40,801 |
| | 42,138 |
|
| Diesel/Jet | | 30,035 |
| | 29,194 |
| | 28,031 |
| | 30,673 |
| | 30,035 |
|
| Petrochemicals, LPG, NGLs | | 2,564 |
| | 2,522 |
| | 2,551 |
| | 2,798 |
| | 2,564 |
|
| Other | | 1,665 |
| | 1,677 |
| | 1,548 |
| | 1,554 |
| | 1,665 |
|
| Total production | | 76,402 |
| | 74,329 |
| | 70,748 |
| | 75,826 |
| | 76,402 |
|
| Throughput (average barrels per day): | | | | | | | | | | |
| Crude Oil | | 70,041 |
| | 69,088 |
| | 67,357 |
| | 70,516 |
| | 70,041 |
|
| Other feedstocks | | 6,770 |
| | 6,729 |
| | 4,310 |
| | 5,873 |
| | 6,770 |
|
| Total throughput | | 76,811 |
| | 75,817 |
| | 71,667 |
| | 76,389 |
| | 76,811 |
|
| Per barrel of sales: | | | | | | | |
| Per barrel of refined product sales: | | | | | |
| Tyler refining margin | | $ | 11.88 |
| | $ | 9.10 |
| | $ | 7.56 |
| | $ | 14.09 |
| | $ | 11.88 |
|
| Direct operating expenses | | $ | 3.64 |
| | $ | 3.42 |
| | $ | 3.75 |
| |
| Operating expenses | | | $ | 3.91 |
| | $ | 3.64 |
|
| Crude Slate: (% based on amount received in period) | | | | | | | | | | |
| WTI crude oil | | 83.0 | % | | 81.1 | % | | 80.3 | % | | 89.0 | % | | 83.0 | % |
| East Texas crude oil | | 16.3 | % | | 17.8 | % | | 18.6 | % | | 11.0 | % | | 16.3 | % |
| Other | | 0.7 | % | | 1.1 | % | | 1.1 | % | | — | % | | 0.7 | % |
| | | | | | | | | | | |
| El Dorado, AR Refinery | | | | | | | | | | |
| Days in period | | 365 |
| | | | 366 |
| | 365 |
| | 365 |
|
Total sales volume - refined (average barrels per day) (2) | | 71,381 |
| | 80,277 |
| | 78,100 |
| |
Total sales volume - refined product (average barrels per day) (1) | | | 62,420 |
| | 71,381 |
|
| Products manufactured (average barrels per day): | | | | | | | | | | |
| Gasoline | | 33,718 |
| | 38,175 |
| | 40,751 |
| | 27,712 |
| | 33,718 |
|
| Diesel | | 24,609 |
| | 27,482 |
| | 27,085 |
| | 20,753 |
| | 24,609 |
|
| Petrochemicals, LPG, NGLs | | 1,228 |
| | 1,782 |
| | 1,042 |
| | 872 |
| | 1,228 |
|
| Asphalt | | 5,179 |
| | 6,507 |
| | 5,203 |
| | 5,533 |
| | 5,179 |
|
| Other | | 732 |
| | 985 |
| | 947 |
| | 735 |
| | 732 |
|
| Total production | | 65,466 |
| | 74,931 |
| | 75,028 |
| | 55,605 |
| | 65,466 |
|
| Throughput (average barrels per day): | | | | | | | | | | |
| Crude Oil | | 65,615 |
| | 73,577 |
| | 72,660 |
| | 54,420 |
| | 65,615 |
|
| Other feedstocks | | 1,313 |
| | 2,568 |
| | 3,742 |
| | 1,576 |
| | 1,313 |
|
| Total throughput | | 66,928 |
| | 76,145 |
| | 76,402 |
| | 55,996 |
| | 66,928 |
|
| Per barrel of sales: | | | | | | | |
| Per barrel of refined product sales: | | | | | |
| El Dorado refining margin | | $ | 8.64 |
| | $ | 7.76 |
| | $ | 3.09 |
| | $ | 7.38 |
| | $ | 8.64 |
|
| Direct operating expenses | | $ | 5.22 |
| | $ | 3.61 |
| | $ | 3.73 |
| |
| Operating expenses | | | $ | 5.73 |
| | $ | 5.22 |
|
| Crude Slate: (% based on amount received in period) | | | | | | | | | | |
| WTI crude oil | | 58.6 | % | | 60.8 | % | | 65.6 | % | | 49.9 | % | | 58.6 | % |
| Local Arkansas crude oil | | 21.2 | % | | 18.9 | % | | 21.1 | % | | 23.1 | % | | 21.2 | % |
| Other | | 20.2 | % | | 20.3 | % | | 13.3 | % | | 27.0 | % | | 20.2 | % |
Management's Discussion and Analysis
| | | Refinery Statistics (continued) | | Refinery Statistics (continued) |
| | | Year ended December 31, 2018 | | Period from July 1, 2017 through December 31, 2017 | | Year Ended December 31, 2019 | | Year Ended December 31, 2018 |
| Big Spring, TX Refinery (acquired on July 1, 2017) | | | | | |
| Big Spring, TX Refinery | | | | | |
| Days in period | | 365 |
| | 184 |
| | 365 |
| | 365 |
|
Total sales volume - refined (average barrels per day) (3) | | 74,721 |
| | 74,276 |
| |
Total sales volume - refined product (average barrels per day) (1) | | | 76,413 |
| | 74,721 |
|
| Products manufactured (average barrels per day): | | | | | | | | |
| Gasoline | | 36,596 |
| — |
| 37,266 |
| | 36,352 |
| | 36,596 |
|
| Diesel/Jet | | 26,660 |
| — |
| 27,027 |
| | 27,602 |
| | 26,660 |
|
| Petrochemicals, LPG, NGLs | | 3,646 |
| — |
| 3,738 |
| | 3,746 |
| | 3,646 |
|
| Asphalt | | 1,855 |
| — |
| 1,308 |
| | 1,870 |
| | 1,855 |
|
| Other | | 1,339 |
| — |
| 1,354 |
| | 1,327 |
| — |
| 1,339 |
|
| Total production | | 70,096 |
| — |
| 70,693 |
| | 70,897 |
| | 70,096 |
|
| Throughput (average barrels per day): | | | | | | | | |
| Crude oil | | 67,978 |
| — |
| 69,549 |
| | 72,039 |
| | 67,978 |
|
| Other feedstocks | | 1,533 |
| — |
| 1,253 |
| | (453 | ) | | 1,533 |
|
| Total throughput | | 69,511 |
| — |
| 70,802 |
| | 71,586 |
| | 69,511 |
|
| Per barrel of sales: | | | | | |
| Per barrel of refined product sales: | | | | | |
| Big Spring refining margin | | $ | 18.44 |
| | $ | 12.86 |
| | $ | 13.69 |
| | $ | 18.44 |
|
| Direct operating expenses | | $ | 4.20 |
| | $ | 4.04 |
| |
| Operating expenses | | | $ | 4.35 |
| | $ | 4.20 |
|
| Crude Slate: (% based on amount received in period) | | | | | | | | |
| WTI crude oil | | 73.8 | % | | 72.9 | % | | 75.5 | % | | 73.8 | % |
| WTS crude oil | | 26.2 | % | | 27.1 | % | | 24.5 | % | | 26.2 | % |
| | | | | | | | | |
| Krotz Springs, LA Refinery (acquired on July 1, 2017) | | | | | |
| Krotz Springs, LA Refinery | | | | | |
| Days in period | | 365 |
| | 184 |
| | 365 |
| | 365 |
|
Total sales volume - refined (average barrels per day) (4) | | 78,902 |
| | 70,923 |
| |
Total sales volume - refined product (average barrels per day) (1) | | | 70,511 |
| | 78,902 |
|
| Products manufactured (average barrels per day): | | | | | | | | |
| Gasoline | | 36,729 |
| — |
| 33,286 |
| | 35,026 |
| | 36,729 |
|
| Diesel/Jet | | 31,459 |
| — |
| 27,686 |
| | 28,049 |
| | 31,459 |
|
| Heavy Oils | | 1,216 |
| — |
| 1,024 |
| | 1,131 |
| | 1,216 |
|
| Petrochemicals, LPG, NGLs | | 7,224 |
| — |
| 7,018 |
| | 4,647 |
| | 7,224 |
|
| Other | | | 26 |
| | — |
|
| Total production | | 76,628 |
| — |
| 69,014 |
| | 68,879 |
| | 76,628 |
|
| Throughput (average barrels per day): | | | | | | | | |
| Crude Oil | | 73,171 |
| — |
| 67,407 |
| | 67,943 |
| | 73,171 |
|
| Other feedstocks | | 2,211 |
| — |
| 1,017 |
| | (366 | ) | | 2,211 |
|
| Total throughput | | 75,382 |
| — |
| 68,424 |
| | 67,577 |
| | 75,382 |
|
| Per barrel of sales: | | | | | | | | |
| Krotz Springs refining margin | | $ | 9.48 |
| | $ | 8.29 |
| | $ | 10.16 |
| | $ | 9.48 |
|
| Direct operating expenses | | $ | 3.84 |
| | $ | 3.80 |
| |
| Operating expenses | | | $ | 4.46 |
| | $ | 3.84 |
|
| Crude Slate: (% based on amount received in period) | | | | | | | | |
| WTI Crude | | 61.3 | % | | 52.9 | % | | 72.0 | % | | 61.3 | % |
| Gulf Coast Sweet Crude | | 38.7 | % | | 47.1 | % | | 28.0 | % | | 38.7 | % |
| | | | | | |
| |
(1) | Includes inter-refinery sales and sales to other segments which are eliminated in consolidation. See tables below. |
Management's Discussion and Analysis
Included in the refinery statistics above are the following inter-refinery and sales to other segments:
|
| | | | | | | | | | | | |
| Pricing statistics (average for the periods presented): | | Year Ended December 31, |
| | | 2018 | | 2017 | | 2016 |
| | | | | | | |
| | | | | | | |
| WTI — Cushing crude oil (per barrel) | | $ | 65.20 |
| | $ | 50.78 |
| | $ | 43.33 |
|
| WTI — Midland crude oil (per barrel) | | $ | 57.84 |
| | $ | 50.44 |
| | $ | 43.25 |
|
WTS -- Midland crude oil (per barrel) (5) | | $ | 57.43 |
| | $ | 49.81 |
| | $ | 42.49 |
|
LLS (per barrel) (5) | | $ | 70.19 |
| | $ | 54.01 |
| | $ | 45.02 |
|
| Brent crude oil (per barrel) | | $ | 71.69 |
| | $ | 54.73 |
| | $ | 45.18 |
|
| | | | | | | |
U.S. Gulf Coast 5-3-2 crack spread (per barrel) (5) | | $ | 13.21 |
| | $ | 13.01 |
| | $ | 9.19 |
|
U.S. Gulf Coast 3-2-1 crack spread (per barrel) (5) | | $ | 16.63 |
| | $ | 16.69 |
| | $ | 12.43 |
|
U.S. Gulf Coast 2-1-1 crack spread (per barrel) (5) | | $ | 9.58 |
| | $ | 10.94 |
| | $ | 8.47 |
|
| | | | | | | |
| U.S. Gulf Coast Unleaded Gasoline (per gallon) | | $ | 1.83 |
| | $ | 1.55 |
| | $ | 1.30 |
|
| Gulf Coast Ultra low sulfur diesel (per gallon) | | $ | 2.05 |
| | $ | 1.62 |
| | $ | 1.32 |
|
| U.S. Gulf Coast high sulfur diesel (per gallon) | | $ | 1.92 |
| | $ | 1.47 |
| | $ | 1.18 |
|
| Natural gas (per MMBTU) | | $ | 3.07 |
| | $ | 3.02 |
| | $ | 2.55 |
|
|
| | | | | |
| Inter-refinery Sales |
| | Year Ended December 31, |
| (in barrels per day) | 2019 | | 2018 |
| | | | |
| Tyler refined product sales to other Delek refineries | 894 |
| | 824 |
|
| El Dorado refined product sales to other Delek refineries | 5,039 |
| | 4,583 |
|
| Big Spring refined product sales to other Delek refineries | 990 |
| | 554 |
|
| Krotz Springs refined product sales to other Delek refineries | 9,734 |
| | 19,644 |
|
|
| | | | | | |
| Refinery Sales to Other Segments |
| | | Year Ended December 31, |
| (in barrels per day) | | 2019 | | 2018 |
| | | | | |
| Tyler refined product sales to other Delek segments | | 252 |
| | 986 |
|
| El Dorado refined product sales to other Delek segments | | 83 |
| | 562 |
|
| Big Spring refined product sales to other Delek segments | | 25,223 |
| | 25,661 |
|
| Krotz Springs refined product sales to other Delek segments | | 462 |
| | — |
|
|
| | | | | | | | |
| Pricing Statistics (average for the period presented) |
| | | Year Ended December 31, |
| | | 2019 | | 2018 |
| | | | | |
| | | | | |
| WTI — Cushing crude oil (per barrel) | | $ | 56.99 |
| | $ | 65.20 |
|
| WTI — Midland crude oil (per barrel) | | $ | 56.31 |
| | $ | 57.84 |
|
| WTS — Midland crude oil (per barrel) | | $ | 56.27 |
| | $ | 57.43 |
|
| LLS (per barrel) | | $ | 62.65 |
| | $ | 70.19 |
|
| Brent crude oil (per barrel) | | $ | 64.14 |
| | $ | 71.69 |
|
| | | | | |
U.S. Gulf Coast 5-3-2 crack spread (per barrel) (1) | | $ | 13.78 |
| | $ | 13.21 |
|
U.S. Gulf Coast 3-2-1 crack spread (per barrel) (1) | | $ | 16.71 |
| | $ | 16.63 |
|
U.S. Gulf Coast 2-1-1 crack spread (per barrel) (1) | | $ | 9.90 |
| | $ | 9.58 |
|
| | | | | |
| U.S. Gulf Coast Unleaded Gasoline (per gallon) | | $ | 1.63 |
| | $ | 1.83 |
|
| Gulf Coast Ultra low sulfur diesel (per gallon) | | $ | 1.88 |
| | $ | 2.05 |
|
| U.S. Gulf Coast high sulfur diesel (per gallon) | | $ | 1.76 |
| | $ | 1.92 |
|
| Natural gas (per MMBTU) | | $ | 2.53 |
| | $ | 3.07 |
|
| |
(1) | Total sales volume includes 986, 1,592 and 622 bpd sold to the logistics segment during the years ended December 31, 2018, 2017 and 2016, respectively. Total sales volume also includes sales of 193, 129 and 510 bpd of intermediate and finished products to the El Dorado refinery during the years ended December 31, 2018, 2017 and 2016, respectively. Total sales volume also includes 399 and 546 bpd of produced finished product sold to the Big Spring refinery for the years ended December 31, 2018 and 2017, respectively, and 232 bpd sold to the Krotz Springs refinery during the year ended December 31, 2018. Total sales volume excludes 4,444, 4,209 and 1,281 bpd of wholesale activity during the years ended December 31, 2018, 2017 and 2016, respectively.
|
| |
(2)
| Total sales volume includes 1,387, 514, and 102 bpd of produced finished product sold to the Tyler refinery during the years ended December 31, 2018, 2017 and 2016, respectively, and 27,048 bpd and 302 of produced finished product sold to the Krotz Springs and Big Spring refineries, respectively, for the year ended December 31, 2018. There were 140 bpd of produced finished product sold to the logistics segment and 17 bpd sold to the retail segment during the year ended December 31, 2018. In addition, 406 and 2,247 bpd of produced finished product was sold to Alon Asphalt Company during the years ended December 31, 2018 and 2017, respectively. Total sales volume excludes 47,422, 25,750 and 20,329 bpd of wholesale activity during the years ended December 31, 2018, 2017 and 2016, respectively. |
| |
(3)
| Total sales volume includes 13,967 and 15,190 bpd sold to the retail segment, 10,005 and 176 bpd sold to the logistics segment and 1,688 and 1,510 bpd sold to Alon Asphalt Company during the years ended December 31, 2018 and 2017, respectively. |
| |
(4)
| Sales volume includes 19,039 and 728 bpd sold to the El Dorado refinery and 606 and 60 bpd sold to the Tyler refinery during the years ended December 31, 2018 and 2017, respectively. |
| |
(5)
| For our Tyler and El Dorado refineries, we compare our per barrel refining product margin to the Gulf Coast 5-3-2 crack spread consisting of WTI Cushing crude, U.S. Gulf Coast CBOB and U.S,U.S. Gulf Coast Pipeline No. 2 heating oil (high sulfur diesel). For our Big Spring refinery, we compare our per barrel refined product margin to the Gulf Coast 3-2-1 crack spread consisting of WTI Cushing crude, Gulf Coast 87 Conventional gasoline and Gulf Coast ultra low sulfur diesel, and for our Krotz Springs refinery, we compare our per barrel refined product margin to the Gulf Coast 2-1-1 crack spread consisting of LLS crude oil, Gulf Coast 87 Conventional gasoline and U.S,U.S. Gulf Coast Pipeline No. 2 heating oil (high sulfur diesel). The Tyler refinery's crude oil input is primarily WTI Midland and east Texas, while the El Dorado refinery's crude input is primarily combination of WTI Midland, local Arkansas and other domestic inland crude oil. The Big Spring refinery’s crude oil input is primarily comprised of WTS and WTI Midland. The Krotz Springs refinery’s crude oil input is primarily comprised of LLS and WTI Midland. The Big Spring and Krotz Springs refineries were acquired July 1, 2017 as part of the Delek/Alon Merger, so Gulf Coast 3-2-1 and 2-1-1 crack spreads, LLS and WTS statistics are presented only for the period Delek owned these refineries. |
Management's Discussion and Analysis
Refining Segment Operational Comparison of the Year Ended December 31, 20182019 versus the Year Ended December 31, 2017 and the Year Ended December 31, 2017 versus the Year Ended December 31, 20162018
Net Revenues
2018 vs. 2017
Net revenues for the refining segment increased $2,989.8decreased $811.9 million, or 45.2%8.4%, in the year ended December 31, 20182019 compared to the year ended December 31, 2017.2018. The increasedecrease was primarily driven by the following:
the addition of the Big Spring and Krotz Springs refineries in connection with the Delek/Alon Mergerdecreases in the second half of 2017; and
increases in theaverage price of U.S. Gulf Coast gasoline of 10.7%, ULSD of 8.0%, and HSD where increasesof 8.3%; and
decreases in sales volume at he Tyler, Big Springof refined product totaling 9.0 million barrels due to decreases in sales volumes across all four refineries primarily resulting from unit outages and Krotz Springs refineries wereplanned downtime, offset by a decrease9.6 million barrel increase in purchased product sales volumes at the El Dorado refinery.across all four refineries primarily to compensate for production shortfalls.
2017 vs. 2016
Net revenues included sales to our retail segment of $379.6 million and $438.2 million, sales to our logistics segment of $278.3 million and $349.0 million and sales to our other segment of $44.7 million and $51.8 million for the refining segment increased $2,697.4 million, or 68.8% in the yearyears ended December 31, 2017 compared to the year ended December 31, 2016. The increase was primarily driven by the following:2019 and 2018, respectively. We eliminate this intercompany revenue in consolidation.
increase in net revenues included the addition of the Big Spring and Krotz Springs refineries in connection with the Delek/Alon Merger in the second half of 2017; and
increases in the price of U.S. Gulf Coast gasoline, ULSD and HSD.
Cost of Materials and Other
2018 vs. 2017
Cost of materials and other increased $2,427.7decreased $735.4 million, or 41.5%8.9%, in the year ended December 31, 20182019 compared to the year ended December 31, 2017.2018. This increasedecrease was primarily driven by the following:
the addition of the Big Spring and Krotz Springs refineriesa decrease in connection with the Delek/Alon Merger in the second half of 2017;refined product sales volume across all refineries;
an increasea decrease in the cost of WTI-WTI Cushing crude oil from an average of $50.78$65.20 per barrel for 20172018 to an average of $65.20$56.99 during 2018; and2019;
an increasea decrease in the cost of WTI - Midland crude oil, from an average of $50.44$57.84 per barrel for 20172018 to an average of $57.84$56.31 during 2019;
the net reversal benefit (expense) of $52.3 million related to inventory valuation reserves recognized during 2019 compared to $(51.3) million recognized during 2018; and
the reenactment of the BTC in December 2019 for the 2018 .and 2019 periods which resulted in a benefit of $78.0 million during 2019.
These decreases were partially offset by the following:
a prior period benefit of approximately $115.5 million related to a combination of the 2017 RIN Waivers and a biodiesel tax credit recognized during the year ended December 31, 2018, whereas 2018 RIN Waivers provided a benefit of $20.7 million the same period of 2019.
Management's Discussion and Analysis
These increases were partially offset by the following:
a reduction of our RINs Obligation and related cost of materials and other of approximately $59.3 million and $47.5 million for the year ended December 31, 2018 and 2017, respectively, related to the receipt of small refinery exemptions from the requirements of the renewable fuel standard at our El Dorado refinery for the 2018 and 2017 calendar years, respectively. In March 2018, the Krotz Springs refinery received such approval as well, which resulted in a reduction of our RINs Obligation and related cost of materials and other of approximately $31.6 million for the year ended December 31, 2018.
2017 vs. 2016
Cost of materials increased $2,238.1 million, or 61.9% in the year ended December 31, 2017 compared to the year ended December 31, 2016. This increase was primarily driven by the following:
the addition of the Big Spring and Krotz Springs refineries in connection with the Delek/Alon Merger in the second half of 2017;
an increase in the cost of WTI- Cushing crude oil from an average of $43.33 per barrel for 2016 to an average of $50.78 during 2017,; and
an increase in the cost of WTI - Midland crude oil, from an average of $43.25 per barrel for 2016 to an average of $50.44 during 2017.
These increases were partially offset by the following:
$47.5 million reduction in RINs expense associated with the RINs waiver received by the El Dorado refinery in the first quarter of 2017.
Service Agreements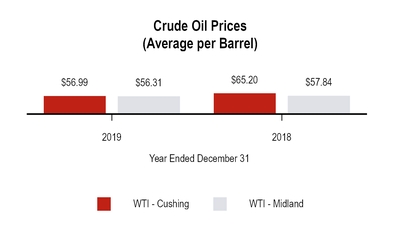
Our refining segment purchases finished product from our logistics segment and has multiple service agreements with our logistics segment which, among other things, require the refining segment to pay terminalling and storage fees based on the throughput volume of crude and finished product in the logistics segment pipelines and the volume of crude and finished product stored in the logistics segment storage tanks, subject to certain minimum volume commitments. These fees were $200.4 million, $129.6$218.0 million and $123.2$200.4 million during the years ended December 31, 2018, 20172019 and 2016,2018, respectively. We eliminate these intercompany fees in consolidation.
Refining Margin
2018 vs. 2017
Refining margin increaseddecreased by $562.1$76.5 million, or 73.2%5.7%, for the year ended December 31, 20182019 compared to the year ended December 31, 2017,2018, with a refining margin percentage of 13.8%14.3% as compared to 11.6%13.8% for the yearyears ended December 31, 20182019 and 2017,2018, respectively, primarily driven by the following:
the additiona narrowing of the Big Springdiscount between WTI Midland crude oil and Krotz Springs refineries in connection withBrent crude oil where, during the Delek/Alon Merger on July 1, 2017;year ended December 31, 2019, the WTI Midland crude oil differential to Brent crude oil was an average discount of $7.83 per barrel compared to $13.85 per barrel during the same period of 2018;
Management's Discussion and Analysis
wider discounts betweena narrowing of the average WTI Cushing crude oil and WTS crude oil to $0.72 during the year ended December 31, 2019, compared to Brent and$7.77 during the same period of 2018;
a narrowing of the discount between WTI Midland crude oil compared to WTI Cushing which impact refining margin at the Tyler and El Dorado Refineries where, during the year ended December 31, 2018, the average WTI Cushing crude oil differential to Brent crude oil was $6.49 per barrel compared to $3.95 during the year ended December 31, 2017, and2019, the average WTI Midland crude oil differential to WTI Cushing crude oil was $7.36$0.68 per barrel compared to $0.34$7.36 during the year ended December 31, 2017;2018; and
a 1.5%prior period benefit of approximately $115.5 million related to a combination of the 2017 RIN Waivers and a biodiesel tax credit recognized during the year ended 2018, whereas 2018 RIN Waivers provided a benefit of $20.7 million the same period of 2019.
These decreases were partially offset by the following:
a 4.3% improvement in the 5-3-2 crack spread (the primary measure for the Tyler refinery and El Dorado refinery);
a 0.5% improvement in the average Gulf Coast 5-3-23-2-1 crack spread; and
the cost of materials and other benefit attributable to the RIN waivers.
2017 vs. 2016
Refining margin increased by $459.3 million or 73.2%,spread (the primary measure for the year ended December 31, 2017 compared to the year ended December 31, 2016, with a refining margin percentage of 11.6% as compared to 7.9% for the year ended December 31, 2017 and 2016, respectively, primarily driven by the following:
the addition of the Big Spring and Krotz Springs refineries in connection with the Delek/Alon Merger on July 1, 2017;refinery);
a 41.6%3.3% improvement in the average Gulf Coast 5-3-22-1-1 crack spread; andspread (the primary measure for the Krotz Springs refinery);
the costnet reversal benefit (expense) of materials and other$52.3 million related to inventory valuation reserves recognized during 2019 compared to $(51.3) million recognized during 2018;
the $78.0 million benefit attributable to the BTC reenactment; and
the benefit attributable to the decrease in RIN waivers.prices.
Management's Discussion and Analysis
Operating Expenses
2018 vs. 2017
Operating expenses increased $147.7$27.0 million, or 46.5%5.8%, in the year ended December 31, 2018,2019, compared to year ended December 31, 2017.2018. The increase in operating expenses was primarily driven by the following:
additionan overall net increase of $18.1 million in outside services costs across the Tyler, Big Spring and Krotz Springs refineries primarily related to various unit outages and project studies;
an increase in connection withemployee related costs of $7.9 million across all four refineries;
a $16.0 million reduction of expenses in 2018 attributed to recoveries received from the Delek/Alon Mergersettlement of disputed indemnification matters related to environmental obligations and asset retirement obligations at the Bakersfield refinery;
an offsetting decrease of $10.4 million in the second half of 2017;variable expenses, primarily due to reduced production; and
additional costs associated with various spillsoffsetting reductions in repairs and maintenance expense at the El Dorado, refinery;
higher maintenanceKrotz Springs and other costs associated with outages at the refineries; and
higher employee costs due to overtime and incentive bonuses.
2017 vs. 2016
Operating expenses increased $105.3 million, or 49.6% in the year ended December 31, 2017, compared to the year ended December 31, 2016. The increase in operating expenses was primarily driven by the following:
addition of the Big Spring and Krotz Springs refineries in connection with the Delek/Alon Merger in the second half of 2017.
Contribution Margin
2018 vs. 2017
Contribution margin increased by $414.4 million, or a 2.8% improvement in contribution margin percentage, for the year ended December 31, 2018 compared to the year ended December 31, 2017, primarily driven by the following:
the addition of the Big Spring and Krotz Springs refineries in connection with the Delek/Alon Merger on July 1, 2017;
a 1.5% improvement in the average Gulf Coast 5-3-2 crack spread;
improvements in crude oil differentials as described above; and
the cost of materials and other benefit attributable to the RIN waivers.
2017 vs. 2016
Contribution margin increased by $374.8 million, or a 3.2% improvement in contribution margin percentage, for the year ended December 31, 2017, compared to the year ended December 31, 2016. The increase was primarily attributable to the following:
the addition of the Big Spring and Krotz Springs refineries in connection with the Delek/Alon Merger in the second half of 2017;
a 41.6% improvement in the average Gulf Coast 5-3-2 crack spread in 2017 as compared to 2016, which favorably impacted the period-over- period margins at all refineries; and
reduction in RINs expense, primarily associated with the $47.5 million reduction in RINs expense associated with the RINs waiver received by the El Dorado refinery in the first quarter of 2017.
These increases were partially offset by the following:
the recognition of the inventory fair value adjustment associated with purchase accounting as an increase in cost of materials and other during 2017 totaling $33.2 million, as the inventory acquired was sold; and
business interruption insurance proceeds of $42.4 million associated with a settlement of litigation received in the first quarter of 2016.
Management's Discussion and Analysis
Logistics Segment
The table below sets forth certain information concerning our logistics segment operations ($ in millions, except per barrel amounts):
|
| | | | | | | | | | | | |
| | | Year Ended December 31, |
| | | 2018 | | 2017 | | 2016 |
| Net revenues | | $ | 657.6 |
| | 538.1 |
| | $ | 448.1 |
|
| Cost of materials and other | | 429.1 |
| | 372.9 |
| | 302.2 |
|
| Operating expenses (excluding depreciation and amortization) | | 58.7 |
| | 43.3 |
| | 37.2 |
|
| Contribution margin | | $ | 169.8 |
| | $ | 121.9 |
| | $ | 108.7 |
|
| Operating Information: | | | | | | |
East Texas - Tyler Refinery sales volumes (average bpd) (1) | | 77,487 |
| | 73,655 |
| | 68,131 |
|
Big Spring wholesale marketing throughputs (average bpd) (2) | | 81,117 |
| | — |
| | — |
|
| West Texas wholesale marketing throughputs (average bpd) | | 13,323 |
| | 13,817 |
| | 13,257 |
|
| West Texas wholesale marketing margin per barrel | | $ | 5.57 |
| | $ | 4.03 |
| | $ | 1.43 |
|
Terminalling throughputs (average bpd) (3) | | 161,284 |
| | 124,488 |
| | 122,350 |
|
| Throughputs (average bpd): | | | | | | |
| Lion Pipeline System: | | | | | | |
| Crude pipelines (non-gathered) | | 51,992 |
| | 59,362 |
| | 56,555 |
|
| Refined products pipelines to Enterprise Systems | | 45,728 |
| | 51,927 |
| | 52,071 |
|
| SALA Gathering System | | 16,571 |
| | 15,871 | | 17,756 |
|
| East Texas Crude Logistics System | | 15,696 |
| | 15,780 | | 12,735 |
(1)Excludes jet fuel and petroleum coke.
(2) Throughputs for the year ended December 31, 2018 are for the 306 days we marketed certain finished products produced at or sold from the Big Spring Refinery following execution of the Big Spring Marketing Agreement, effective March 1, 2018, as defined in Note 6 to our accompanying condensed consolidated financial statements.
(3)Consists of terminalling throughputs at our Tyler, Big Spring, Big Sandy and Mount Pleasant, Texas, El Dorado and North Little Rock, Arkansas and Memphis and Nashville, Tennessee terminals. Throughputs for the year ended December 31, 2018 for the Big Spring terminal are for 306 days we operated the terminal following its acquisition effective March 1, 2018. Barrels per day are calculated for only the days we operated each terminal. Total throughput barrels for the year ended December 31, 2018 was 56.6 million barrels, which averaged 155,193 bpd per the period.
Management's Discussion and Analysis
Logistics Segment Operational Comparison of the Year Ended December 31, 2018 versus the Year Ended December 31, 2017 and the Year Ended December 31, 2017 versus the Year Ended December 31, 2016
Net Revenues
2018 vs. 2017
Net revenues increased by $119.5 million, or 22.2%, in the year ended December 31, 2018 compared to the year ended December 31, 2017 primarily driven by the following:
increases in the average sales prices per gallon of gasoline and diesel sold in our west Texas marketing operations. The average sales prices per gallon of gasoline and diesel sold increased $0.29 per gallon and $0.45 per gallon, respectively, amounting to an increase of $78.7 million of the $119.5 million increase in net revenues; and
net revenues generated under the agreements executed in connection with the Big Spring Logistics Assets Acquisition, which were effective March 1, 2018. Refer to Note 6 to our accompanying condensed consolidated financial statements for additional information about the agreements executed in connection with the Big Spring Logistic Assets Acquisition; and
increased net revenue related to the Paline Pipeline as a result of volume increases on the pipeline.
Net revenues included $33.0 million and $20.4 million of net service fees paid by our refining segment to our logistics segment during the year ended December 31, 2018 and 2017, respectively. These service fees are based on the number of gallons sold and a shared portion of the margin achieved in return for providing sales and customer support services, and includes fees earned under the marketing agreement entered into in connection with the Big Spring Logistic Assets Acquisition. Net revenues also included crude and refined product transportation, terminalling and storage fees paid by our refining segment to our logistics segment, which includes revenues earned under the commercial agreements entered into in connection with the Big Spring Logistic Assets Acquisition. These fees were $200.4 million and $129.6 million for the year ended December 31, 2018 and 2017, respectively. The logistics segment received management fees of $4.8 million during the year ended December 31, 2018, from the Corporate/Other segment for the management of a long-term capital project on behalf of the Company for the construction of a gathering system in the Permian Basin, as discussed further in Note 4 to our accompanying condensed consolidated financial statements. The logistics segment also sold $2.6 million and $5.6 million of RINs to the refining segment for the year ended December 31, 2018 and 2017, respectively. These intercompany sales and fees are eliminated in consolidation.
2017 vs. 2016
Net revenues increased $90.0 million, or 20.1% in the year ended December 31, 2017 compared to the year ended December 31, 2016. The increase was primarily driven by the following:
| |
• | increases in the average sales prices per gallon of gasoline and diesel sold in our west Texas marketing operations. The average sales prices increased $0.32 per gallon and $0.39 per gallon, respectively;
|
| |
• | a net increase of 8.0 million gallons in the volume of gasoline and diesel sold in west Texas during the year ended December 31, 2017 compared to gallons sold during the year ended December 31, 2016;
|
increased fees under our marketing agreement with Delek Holdings as a result of increased throughput due to higher demand following product supply disruptions associated with Hurricane Harvey, partially offset by a decline in fees on our Paline Pipeline System; and
| |
• | decreases in revenues on our Paline Pipeline System. During the year ended December 31, 2017, the Paline Pipeline System was FERC regulated pipeline with a tariff established for potential shippers, compared to the year ended December 31, 2016, when the pipeline capacity was under contract with two third parties for a monthly fee.
|
Net revenues included $20.4 million and $16.9 million of net service fees in our east Texas marketing business, paid by our refining segment during 2017 and 2016, respectively. These service fees are based on the number of gallons sold and a shared portion of the margin achieved in return for providing sales and customer support services. Net revenues also include crude, intermediate and refined product transportation, terminalling and storage fees paid by our refining segment. These fees were $129.6 million and $123.2 million in 2017 and 2016, respectively. The logistics segment also sold $5.6 million and $6.7 million of RINs, at market prices, to the refining segment during 2017 and 2016, respectively. These intercompany sales and fees are eliminated in consolidation.
Management's Discussion and Analysis
Cost of Materials and Other
2018 vs. 2017
Cost of materials and other for the logistics segment increased $56.2 million, or 15.1%, in the year ended December 31, 2018 compared to the year ended December 31, 2017. This increase was primarily driven by the following:
increases in the average cost per gallon of gasoline and diesel purchased in our west Texas marketing operations. The average cost per gallon of gasoline and diesel purchased increased $0.23 per gallon and $0.45 per gallon, respectively, which amounted to an increase of $72.6 million in cost of materials and other. The increase in the average cost per gallon of gasoline and diesel was partially offset by a decrease in volumes sold amounting to $13.5 million and hedging gains of $4.8 million.
2017 vs. 2016
Cost of materials and other increased by $70.7 million, or 23.4%, in the year ended December 31, 2017 compared to the year ended December 31, 2016. This increase was primarily driven by the following:
increases in the average cost per gallon of gasoline and diesel purchased in our west Texas marketing operations. The average cost per gallon of gasoline and diesel increased $0.27 per gallon and $0.31 per gallon, respectively; and
a net increase of 8.0 million gallons in the volume of gasoline and diesel purchased in west Texas during the year ended December 31, 2017 compared to gallons purchased during the year ended December 31, 2016.
Management's Discussion and Analysis
Operating Expenses
2018 vs. 2017
Operating expenses increased by $15.4 million, or 35.6%, in the year ended December 31, 2018 compared to the year ended December 31, 2017, primarily driven by the following:
higher operating costs associated with the logistics assets acquired in the Big Spring Logistic Assets Acquisition, including maintenance expenses, allocated employee costs, variable expenses such as utilities, and professional services fees incurred in connection with the transaction, which accounted for the majority of the increase in operating increases;
higher employee costs, primarily payroll expense, allocated to us as a result of increases in allocated employee headcount and employee incentive costs;
higher costs associated with operating certain of our terminals as a result of volume increases at such terminals; and
increases in outside services expenses related to maintenance projects on certain of our pipelines and tanks.
2017 vs. 2016
Operating expenses increased by $6.1 million, or 16.4% in the year ended December 31, 2017 compared to the year ended December 31, 2016 was primarily driven by the following:
increases in labor and utilities costs associated with certain of our pipelines as a result of increased usage;
higher maintenance costs associated with certain of our tanks at our tank farms; and
employee incentive costs incurred during the year ended December 31, 2017, with no comparable costs incurred during the year ended December 31, 2016.
These increases were partially offset by the following:
reduction in operating expenses for one of our terminal locations at which we incurred increased costs related to internal tank contamination during the year ended December 31, 2016 that were not incurred during the year ended December 31, 2017.
Management's Discussion and Analysis
Contribution Margin
2018 vs. 2017
Contribution margin increased by $47.9 million, or 39.3%, in the year ended December 31, 2018 compared to the year ended December 31, 2017, primarily driven by the following:
improved contribution margin in our west Texas operations as a result of continued increased drilling activity in the region and favorable market price movements; and
increases in revenue generated under the agreements executed in connection with the Big Spring Logistic Assets Acquisition as described above.
2017 vs. 2016
Contribution margin increased by $13.2 million, or 12.1% in the year ended December 31, 2017, compared to the year ended December 31, 2016, primarily driven by the following:
improved contribution margin in our west Texas operations as a result of increased drilling activity in the region, which has improved market conditions and increased demand;
improvements in our west Texas wholesale marketing margin per barrel as a result of a period of product supply disruptions associated with Hurricane Harvey; and
increased fees associated with the marketing agreement as described above.
These increases were partially offset by the following:
a decline in fees on our Paline Pipeline System as described above.
Management's Discussion and Analysis
Retail Segment
The Retail Segment was not reported for the year ended December 31, 2016 and for periods in 2017 prior to July 1, 2017 (the date of the Delek/Alon Merger), as our previous Retail Entities were discontinued, and the new Retail Segment was not acquired until July 1, 2017. The table below sets forth certain information concerning our retail segment operations ($ in millions):
|
| | | | | | | | |
| | | Year Ended December 31, |
| | | 2018 | | 2017 |
| Net revenues | | $ | 915.4 |
| | 426.7 |
|
| Cost of materials and other | | 755.8 |
| | 350.3 |
|
| Operating expenses (excluding depreciation and amortization) | | 100.7 |
| | 49.6 |
|
| Contribution margin | | $ | 58.9 |
| | $ | 26.8 |
|
| Operating Information: | | | | |
| Number of stores (end of period) | | 279 |
| | 302 |
|
| Average number of stores | | 295 |
| | 302 |
|
| Retail fuel sales | | $ | 571.6 |
| | $ | 251.8 |
|
| Retail fuel sales (thousands of gallons) | | 217,118 |
| | 107,599 |
|
| Average retail gallons per average number of stores (in thousands) | | 801 |
| | 367 |
|
| Average retail sales price per gallon sold | | $ | 2.63 |
| | $ | 2.34 |
|
Retail fuel margin ($ per gallon)(1) | | $ | 0.239 |
| | $ | 0.190 |
|
| Merchandise sales | | $ | 339.0 |
| | $ | 174.6 |
|
| Merchandise sales per average number of stores | | $ | 1.1 |
| | $ | 0.6 |
|
| Merchandise margin % | | 30.9 | % | | 30.7 | % |
| Operating expense/merchandise sales plus total gallons | | 11.1 | % | | 11.9 | % |
| |
(1)
| Retail fuel margin represents gross margin on fuel sales in the retail segment, and is calculated as retail fuel sales revenue less retail fuel cost of sales. The retail fuel margin per gallon calculation is derived by dividing retail fuel margin by the total retail fuel gallons sold for the period. |
Management's Discussion and Analysis
Retail Segment Operational Comparison of the Year Ended December 31, 2018 versus the Year Ended December 31, 2017
Net Revenues
2018 vs. 2017
Net revenues for the retail segment increased by $488.7 million, or 114.5% for the year ended December 31, 2018 compared to the year ended December 31, 2017, primarily driven by the following:
the addition of 302 convenience stores on July 1, 2017 in connection with the Delek/Alon Merger, where 2018 has twelve months of retail operating results and 2017 has only six months of retail operating results; and
improvements in average sales price of retail fuel per gallon to $2.63 during the year ended December 31, 2018 compared to $2.34 during the six months ended December 31, 2017.
Management's Discussion and Analysis
Cost of Materials and Other
2018 vs. 2017
Cost of materials and other for the retail segment increased by $405.5 million, or 115.8%, for the year ended December 31, 2018 compared to the year ended December 31, 2017, primarily driven by the following:
the addition of 302 convenience stores on July 1, 2017 in connection with the Delek/Alon Merger, where 2018 has twelve months of retail operating results and 2017 has only six months of retail operating results; and
increases in cost per gallon of fuel sold to $2.39 during the year ended December 31, 2018 compared to $2.15 during the six months ended December 31, 2017.
Operating Expenses
2018 vs. 2017
Operating expenses for the retail segment increased by $51.1 million, or 103.0% for the year ended December 31, 2018 compared to the year ended December 31, 2017, primarily driven by the following:
the addition of 302 convenience stores on July 1, 2017 in connection with the Delek/Alon Merger, where 2018 has twelve months of retail operating results and 2017 has only six months of retail operating results.
Contribution Margin
2018 vs. 2017
Contribution margin for the retail segment increaseddecreased by $32.1$103.5 million, or a 119.8% improvement0.3% decline in contribution margin percentage, for the year ended December 31, 20182019 compared to the year ended December 31, 2017,2018, primarily driven by the following:
a narrowing of the additiondiscount between WTI Cushing and WTS crude oil compared to the prior-year period;
a narrowing of 302 convenience stores on July 1, 2017the discount between WTI Midland and WTI Cushing compared to the prior-year period;
increase in connection with the Delek/Alon Merger, where 2018 has twelve months of retail operating results and 2017 has only six months of retail operating results;expenses across all refineries; and
improvementsa prior period benefit of approximately $115.5 million related to a combination of the 2017 RINs waivers and a biodiesel tax credit recognized during 2018, whereas 2018 RIN Waivers provided a benefit of $20.7 million the same period of 2019.
These decreases were partially offset by the following:
an overall improvement in crack spreads: a 3.3% improvement in the average sales priceGulf Coast 2-1-1 crack spread (the primary measure for the Krotz Springs refinery), a 4.3% improvement in the 5-3-2 crack spread (the primary measure for the Tyler and El Dorado refineries) and a 0.5% improvement in the average Gulf Coast 3-2-1 crack spread (the primary measure for the Big Spring refinery);
the net reversal benefit (expense) of retail fuel per gallon$52.3 million related to $2.63inventory valuation reserves recognized during the year ended December 31, 20182019 compared to $2.34$(51.3) million recognized during 2018;
the six months ended December 31, 2017, or an increase of 12.5%, where cost per gallon of fuel sold increased$78.0 million benefit attributable to $2.39 during BTC reenactment; and
the year ended December 31, 2018 comparedbenefit attributable to $2.15 during the six months ended December 31, 2017, an increase of 11.2%.decrease in RIN prices.
Management's Discussion and Analysis
The following chart compares the retailtable below sets forth certain information concerning our logistics segment operations ($ in millions, except per barrel amounts):
|
| | | | | | | | |
| Logistics Contribution Margin and Operating Information |
| | | Year Ended December 31, |
| | | 2019 | | 2018 |
| Net revenues | | $ | 584.0 |
| | 657.6 |
|
| Cost of materials and other | | 336.5 |
| | 429.1 |
|
| Operating expenses (excluding depreciation and amortization) | | 74.1 |
| | 58.7 |
|
| Contribution margin | | $ | 173.4 |
| | $ | 169.8 |
|
| Operating Information: | | | | |
East Texas - Tyler Refinery sales volumes (average bpd) (1) | | 74,206 |
| | 77,487 |
|
Big Spring wholesale marketing throughputs (average bpd) (2) | | 82,695 |
| | 81,117 |
|
| West Texas wholesale marketing throughputs (average bpd) | | 11,075 |
| | 13,323 |
|
| West Texas wholesale marketing margin per barrel | | $ | 4.44 |
| | $ | 5.57 |
|
Terminalling throughputs (average bpd) (3) | | 160,075 |
| | 161,284 |
|
| Throughputs (average bpd): | | | | |
| Lion Pipeline System: | | | | |
| Crude pipelines (non-gathered) | | 42,918 |
| | 51,992 |
|
| Refined products pipelines to Enterprise Systems | | 37,716 |
| | 45,728 |
|
| SALA Gathering System | | 21,869 |
| | 16,571 |
| East Texas Crude Logistics System | | 19,927 |
| | 15,696 |
(1)Excludes jet fuel margin resultsand petroleum coke.
(2) Throughputs for the year ended December 31, 2018 are for the 306 days we marketed certain finished products produced at or sold from the Big Spring refinery following execution of the Big Spring Marketing Agreement, effective March 1, 2018, as defined in Note 6 to six monthsour accompanying consolidated financial statements.
(3)Consists of terminalling throughputs at our Tyler, Big Spring, Big Sandy and Mount Pleasant, Texas, El Dorado and North Little Rock, Arkansas and Memphis and Nashville, Tennessee terminals. Throughputs for the year ended December 31, 2017:2018 for the Big Spring terminal are for 306 days we operated the terminal following its acquisition effective March 1, 2018. Barrels per day are calculated for only the days we operated each terminal. Total throughput barrels for the year ended December 31, 2018 was 56.6 million barrels, which averaged 155,193 bpd per the period.
Management's Discussion and Analysis
Logistics Segment Operational Comparison of the Year Ended December 31, 2019 versus the Year Ended December 31, 2018
Net Revenues
Net revenues decreased by $73.6 million, or 11.2%, in the year ended December 31, 2019 compared to the year ended December 31, 2018 primarily driven by the following:
decreases in the average volumes sold and in the average sales prices per gallon of gasoline and diesel in our West Texas marketing operations.
| |
| ◦ | the average volumes of gasoline and diesel sold in 2019 and 2018 decreased by 14.3 million gallons and 21.8 million gallons, respectively. |
| |
| ◦ | the average sales prices per gallon of gasoline and diesel sold in 2019 and 2018 decreased by $0.14 per gallon and $0.22 per gallon, respectively. |
Such decreases were partially offset by the following events:
increased revenues associated with the assets we acquired in the Big Spring Logistic Assets Acquisition, which we owned for the entirety of the year ended December 31, 2019 compared to ten months during the year ended December 31, 2018;
increased revenues associated with our Paline Pipeline as a result of increased rates and a change in the fee structure from the year ended December 31, 2018, during which the capacity of the Paline Pipeline was contracted to separate parties for a monthly fee, compared to the year ended December 31, 2019, during which the pipeline was subject to a FERC tariff;
increased revenues associated with the gathering assets as a result of increased throughput due to diversification of market locations during the year ended December 31, 2019 compared to the year ended December 31, 2018; and
increased revenues associated with our trucking assets.
Net revenues included sales to our refining segment of $254.9 million and $236.0 million for the years ended December 31, 2019 and 2018, respectively, and sales to our other segment of $6.1 million and $4.8 million for the years ended December 31, 2019 and 2018, respectively. We eliminate this intercompany revenue in consolidation.
Cost of Materials and Other
Cost of materials and other for the logistics segment decreased by $92.6 million, or 21.6%, in the year ended December 31, 2019 compared to the year ended December 31, 2018. This decrease was primarily driven by the following:
decreases in the average volumes sold and in average cost per gallon of gasoline and diesel sold in our West Texas marketing operations.
| |
| ◦ | the average volumes of gasoline and diesel sold in 2019 and 2018 decreased by 14.3 million gallons and 21.8 million gallons, respectively. |
| |
| ◦ | the average cost per gallon of gasoline and diesel sold in 2019 and 2018 decreased by $0.15 per gallon and $0.19 per gallon, respectively. |
Our logistics segment purchased product from our refining segment of $278.3 million and $349.0 million for the years ended December 31, 2019 and 2018, respectively. We eliminate these intercompany costs in consolidation.
Management's Discussion and Analysis
Operating Expenses
Operating expenses increased by $15.4 million, or 26.2%, in the year ended December 31, 2019 compared to the year ended December 31, 2018, primarily driven by the following:
costs in the amount of $7.1 million associated with the clean-up of a finished product release involving one of our pipelines that occurred in October 2019 near Sulphur Springs, Texas;
higher operating costs associated with allocated contract services pertaining to certain of our assets; and
higher employee costs allocated to us as a result of an increase in allocated employee headcount in various operational groups as Delek Logistics continues to experience growth.
These increases were partially offset by:
decreases in variable expenses such as utilities, maintenance and material costs.
Contribution Margin
Contribution margin increased by $3.6 million, or 2.1%, in the year ended December 31, 2019 compared to the year ended December 31, 2018, primarily driven by the following:
increases in revenue generated under the agreements executed in connection with the Big Spring Logistic Assets Acquisition; and
increase in revenue associated with the gathering assets.
Such increases were partially offset by the following:
higher operating expenses; and
decreases in the volumes combined with a $1.13 decrease in gross margin per barrel of gasoline and diesel sold in our West Texas marketing operations.
Management's Discussion and Analysis
The improvementtables below sets forth certain information concerning our retail segment operations (gross sales $ in millions):
|
| | | | | | | | |
| Retail Contribution Margin and Operating Information |
| | | Year Ended December 31, 2019 | | Year Ended December 31, 2018 |
| Net revenues | | $ | 838.0 |
| | 915.4 |
|
| Cost of materials and other | | 684.7 |
| | 755.8 |
|
| Operating expenses (excluding depreciation and amortization) | | 94.8 |
| | 100.7 |
|
| Contribution margin | | $ | 58.5 |
| | $ | 58.9 |
|
|
| | | | | | | | |
| Operating Information |
| | | Year Ended December 31, 2019 | | Year Ended December 31, 2018 |
| Number of stores (end of period) | | 252 |
| | 279 |
|
| Average number of stores | | 266 |
| | 295 |
|
| Retail fuel sales | | $ | 524.9 |
| | $ | 571.6 |
|
| Retail fuel sales (thousands of gallons) | | 214,094 |
| | 217,118 |
|
| Average retail gallons per average number of stores (in thousands) | | 827 |
| | 801 |
|
| Average retail sales price per gallon sold | | $ | 2.45 |
| | $ | 2.63 |
|
Retail fuel margin ($ per gallon)(1) | | $ | 0.276 |
| | $ | 0.239 |
|
| Merchandise sales | | $ | 313.1 |
| | $ | 339.0 |
|
| Merchandise sales per average number of stores | | $ | 1.2 |
| | $ | 1.1 |
|
| Merchandise margin % | | 30.8 | % | | 30.9 | % |
|
| | | |
Same-Store Comparison (2) |
| | Year Ended December 31, 2019 |
| | |
| Change in same-store retail fuel gallons sold | | 2.9 | % |
| Change in same-store merchandise sales | | (1.0 | )% |
| |
(1) | Retail fuel margin represents gross margin on fuel sales in the retail segment, and is calculated as retail fuel sales revenue less retail fuel cost of sales. The retail fuel margin per gallon calculation is derived by dividing retail fuel margin by the total retail fuel gallons sold for the period. |
| |
(2) | Same-store comparisons include year-over-year increases or decreases in specified metrics for stores that were in service at both the beginning of the year and the end of the most recent year used in the comparison. |
Management's Discussion and Analysis
Retail Segment Operational Comparison of the Year Ended December 31, 2019 versus the Year Ended December 31, 2018
Net Revenues
Net revenues for the retail segment decreased by $77.4 million, or 8.5%, for the year ended December 31, 2019 compared to the year ended December 31, 2018, primarily driven by the following:
total fuel sales were $524.9 million for the year ended December 31, 2019 compared to $571.6 million for 2018, attributable to the following:
| |
| ◦ | $22.8 million decrease related to reduction in number of stores period over period; |
| |
| ◦ | a $0.18 decrease in average price charged per gallon; and |
| |
| ◦ | a slight decrease in total retail fuel gallons sold of 214,094 thousand gallons during 2019 compared to 217,118 thousand gallons in 2018, attributable to a decrease in volumes associated with the reduction in average number of stores period over period offset by same-store sales growth in fuel volumes of 2.9%. |
merchandise sales were $313.1 million for the year ended December 31, 2019 compared to $339.0 million for 2018 primarily driven by the following:
| |
| ◦ | $23.0 million decrease related to reduction in number of stores period over period; and |
| |
| ◦ | a same-store sales decrease of 1.0%. |
Management's Discussion and Analysis
Cost of Materials and Other
Cost of materials and other for the retail segment decreased by $71.1 million, or 9.4%, for the year ended December 31, 2019 compared to the year ended December 31, 2018, primarily driven by the following:
$39.4 million decrease due to reduction in number of stores period over period; and
a decrease in average cost per gallon of $0.21 or 9.0% applied to fuel sales volumes that decreased slightly period over period.
Our retail segment purchased finished product from our refining segment of $379.6 million and $438.2 million for the years ended December 31, 2019 and 2018, respectively. We eliminate this intercompany cost in consolidation.
Operating Expenses
Operating expenses for the retail segment decreased by $5.9 million, or (5.9)%, for the year ended December 31, 2019 compared to the year ended December 31, 2018. This decrease is primarily attributable to a decrease in operating costs associated with the reduction in the number of stores.
Contribution Margin
Contribution margin for the retail segment decreased by $0.4 million, a 0.7% decline in contribution margin percentage, is also attributablefor the year ended December 31, 2019 compared to increased efficiencies and optimization of store operations during the period sinceyear ended December 31, 2018, primarily driven by a reduction in merchandise margin, partially offset by a $0.037 per gallon improvement in the stores were acquired.retail fuel margin.
Management's Discussion and Analysis
Liquidity and Capital Resources
Our primary sources of liquidity and capital resources are
cash generated from our operating activities, activities;
borrowings under our debt facilitiesfacilities; and
potential issuances of additional equity and debt securities.
At December 31, 2019 our total liquidity amounted to $1.9 billion comprised of $660.2 million in unused credit commitments under the Delek Revolving Credit Facility, $261.6 million in unused credit commitments under the DKL Credit Facility and $955.3 million in cash and cash equivalents. Historically, we have generated adequate cash from operations to fund ongoing working capital requirements, pay minimum quarterly cash distributions and operational capital expenditures and expect the same in the foreseeable future. Other funding sources including issuance of equity and debt securities have been utilized to meet our funding requirements and support our growth capital projects and acquisitions. In addition we have historically been able to source funding at terms that reflect market conditions, our financial position and our credit ratings. We continue to monitor market conditions, our financial position and our credit ratings and expect future funding sources to be at terms that are sustainable and profitable for the Company. However, there can be no assurances regarding the availability of any future debt or equity financings or whether such financings can be made available on terms that are acceptable to us.
We believe that cash generatedwe have sufficient financial resources from thesethe above sources will be sufficient to satisfy the anticipated cashmeet our funding requirements associated with our existing operations and capital expenditures for at leastin the next 12 months. See further discussion in Note 11 of our consolidated financial statements included in Item 8, Financial Statementsmonths, including working capital requirements, minimum quarterly cash distributions and Supplementary Data, of this Annual Report on Form 10-K regarding our available debt facilities.capital expenditures. At times, we may consider utilizing other financing agreements including entering into Joint Venture agreements.
Cash Flows
The following table sets forth a summary of our consolidated cash flows (in millions):
| | | Consolidated | | Consolidated |
| | | Year Ended December 31, | | Year Ended December 31, |
| | | 2018 | | 2017 | | 2016 | | 2019 | | 2018 |
| Cash Flow Data: | | | | | | | | | | |
| Operating activities | | $ | 560.3 |
| | $ | 319.7 |
| | $ | 248.0 |
| | $ | 575.2 |
| | $ | 560.3 |
|
| Investing activities | | (125.3 | ) | | 37.6 |
| | 200.7 |
| | (691.3 | ) | | (125.3 | ) |
| Financing activities | | (297.6 | ) | | (104.6 | ) | | (61.7 | ) | | (7.9 | ) | | (297.6 | ) |
| Net increase | | $ | 137.4 |
| | $ | 252.7 |
| | $ | 387.0 |
| |
| Net (decrease) increase | | | $ | (124.0 | ) | | $ | 137.4 |
|
Cash Flows from Operating Activities
YTD 2018 vs. YTD 2017
Net cash provided by operating activities was $560.3$575.2 million for the year ended December 31, 2018,2019, compared to $319.7$560.3 million for the comparable period of 2017. The increase in cash flows from operations was partially due to an increase in net income, which for the year ended December 31, 2018 was $374.9 million, compared to $322.6 million in the same period of 2017. A decrease in cash used to purchase inventory and other current assets and increase in cash received on accounts receivable also contributed to the increase in cash flows from operations. Additionally, in the year ended December 31, 2017, net income included a non-cash gain on remeasurement of equity method investment of $190.1 million for which there was no comparable activity in the current period. This increase was partially offset by increases in cash used to pay accounts payable and other current liabilities and obligation under the supply and offtake agreement with J. Aron. Additionally partially offsetting the increase, net income for the year ended December 31, 2018 included a non-cash benefit of deferred income taxes of $26.8 million compared to expense of $48.0 million in the prior year.
YTD 2017 vs. YTD 2016
2018. Net cash provided by operating activities for 2018 was $319.7net of cash used by discontinued operations of $30.1 million. Net cash provided by operating activities from continuing operations in 2018 was $590.4 million for the year ended December 31, 2017,resulting in a $15.2 million decrease when compared to $248.0net cash provided by operating activities from continuing operations for 2019. Cash receipts from customers and cash payments to suppliers and for salaries decreased resulting in a net $28.2 million decrease in cash from operating activities mainly due to a decline in the volume of refined product sold. Additionally, cash paid for 2016. Thedebt interest increased by $6.1 million. This decrease was partially offset by a $9.7 million decrease in cash paid for taxes and a $15.1 million increase in cash flows from operations was primarily due to an increase in net incomereceived for 2017 of $322.6 million, compared to net loss of $133.4 million in 2016 and a decrease in cash used to pay the obligation under the supply and offtake agreements with J. Aron of $113.0 million, partially offset by the non-cash gain on the remeasurement of the equity method investment in Alon of $190.1 million and increases in accounts receivable and inventory and other non-current assets. The net loss in 2016 included a non-cash impairment in our equity method investment in Alon USA of $245.3 million. Additionally, the disposed retail segment provided $13.3 million of cash flows from operations in 2016 that was not recurring in 2017.dividends.
Cash Flows from Investing Activities
YTD 2018 vs. YTD 2017
Net cash used in investing activities was $125.3$691.3 million for the year ended December 31, 2018,2019, compared to net cash provided of $37.6$125.3 million in the comparable period of 2017.2018. The decreaseincrease in cash flows provided byused in investing activities was primarily due to an increase in cash purchases of property, plant and equipment expenditures related to turnaround activities, which increased from $172.0 million in 2017, to $322.0 million in 2018, to $413.0 million in 2019, and a $11.2$267.2 million decreaseincrease in distributions received from equity method investments. Additionally, $200.5investment contributions in the current year, $124.7 million of which related to our obtaining a 33% membership interest in cash (excludingRed River in May 2019 and $126.7 million of which related to our obtaining a 15% interest in the cash acquired attributableWWP in July 2019. Also contributing to the California Discontinued Entities)this increase was acquired in 2017 with the Delek/Alon Merger. This decrease was partially offset by proceeds from sales of discontinued operations of $55.5 million and proceeds from the sale of asphalt assets and discontinued operations in 2018, for which we received proceeds of $110.8 million received in 2018.
Management's Discussion and Analysis
YTD 2017 vs. YTD 2016
Net cash provided by investing activities was $37.6$55.5 million, for the year ended December 31, 2017, compared to $200.7 million in 2016. This decrease in cash flows from investing activities was primarily due to an increase in cash purchases of property, plant and equipment, which increased from $46.3 million in 2016 to $172.0 million in 2017. Additionally, the disposed retail segment provided $288.9 million of cash flows from investing activities in 2016 that was not recurring in 2017, while the California Discontinued Entities provided $12.2 million of cash flows from investing activities in 2017 . This decrease was partially offset by the the cash acquired in the Delek/Alon Merger of $200.5 million (excluding the cash acquired attributable to the California Discontinued Entities) and a decrease in equity method contributions of $55.8 million.respectively.
Cash Flows from Financing Activities
YTD 2018 vs. YTD 2017
Net cash provided by financing activities was $297.6 million for the year ended December 31, 2018, compared to cash used of $104.6 million in the comparable 2017 period. We completed the Refinancing transaction as well as extinguished the Convertible Notes during the year ended December 31, 2018. The increase in net cash flows from financing activities was primarily attributable to proceeds from long-term revolvers of $2,124.6 million and proceeds from term debt of $690.6 million, offset by payments on long-term revolvers of $1,679.8 million, payment on term debt of $826.3 million, deferred financing costs paid of $13.8 million, repayment of product financing agreements of $72.4 million, repurchase of common stock of $365.3 million and increases in dividends paid to $80.1 million compared to $44.0 million in the comparable 2017 period.
YTD 2017 vs. YTD 2016
Net cash used in financing activities was $104.6$7.9 million for the year ended December 31, 2017,2019, compared to $61.7$297.6 million in the comparable 2018 period. Contributing to this decrease was a decrease in repurchase of common stock to $178.1 million for 2016. Thethe year ended December 31, 2019 compared to $365.3 million in the comparable 2018 period, a decrease in repayments of product financing arrangements to $22.2 million for the
Management's Discussion and Analysis
year ended December 31, 2019 compared to $72.4 million in the comparable 2018 period, an increase in term loan net proceeds of $399.7 million for the year ended December 31, 2019 compared to term loan net payments of $135.7 million in the comparable 2018 period, as well as proceeds from product financing arrangements of $40.8 million during the year ended December 31, 2019; there were no such proceeds in the comparable 2018 period. The decrease in net cash used inby financing activities was primarily attributablepartially offset by the decrease in net proceeds received during 2019 from long-term revolvers due to completion of the Refinancing transaction as well as the additional borrowings used to fund the Big Spring Logistic Assets Acquisition during the year ended December 31, 2018. We made net repayments under our revolving credit facilitiespayments on long-term revolvers of $117.7$118.3 million during 2019 compared to proceeds received of $444.8 million in 2017, compared to $41.1 million in 2016, an increase in repurchases of common stock of $19.0 million, an increase in distributions to non-controlling interest of $11.6 million, an increase in dividends paid of $6.5 million, and an increase in deferred financing costs paid of $4.4 million, offset by net borrowings under our term loans of $182.6 million during 2017 compared to net repayments of $14.7 million in 2016 and an increase in proceeds net of repayments associated with product financing agreements of $52.3 million. Additionally, the disposed retail segment used $17.5 million of cash flows from financing activities associated with debt repayments in 2016 that was not recurring in 2017.2018.
Cash Position and IndebtednessDebt Overview
As of December 31, 2018, our total cash and cash equivalents were $1,079.3 million and2019, we had total indebtedness of approximately $1,783.3 million. Total unused$2,067.1 million comprised of $1,069.5 million under the Term Loan Credit Facility, $588.4 million under the Delek Logistics Credit Facility, $244.7 million in Delek Logistics Notes, $30.0 million under the Revolving Credit Facility, $50.0 million under the Reliant Revolver, $45.0 million in Promissory Notes and the $39.5 million Hapoalim Term Loan. The increase of $283.8 million compared to the balance at December 31, 2018 resulted primarily from the additional borrowings under the Term Loan Credit Facility and the Delek Logistics Credit Facility in 2019.
On March 30, 2018, Delek entered into a term loan credit commitments or borrowing base availability,agreement with Wells Fargo Bank, National Association, as applicable, under our three separateadministrative agent, and certain subsidiaries of Delek as guarantors, providing for a senior secured term loan facility in an amount of $700.0 million (the "Term Loan Credit Facility") which was amended on May 22, 2019 to borrow $250.0 million in incremental term loans at an original issue discount of 0.75%, and again on November 12, 2019 to borrow an additional $150.0 million in incremental term loans at an original issue discount of 1.21%. In addition to the Term Loan Credit Facility, on March 30, 2018 we also entered into a second amended and restated credit agreement with Wells Fargo Bank, National Association, as administrative agent and certain subsidiaries of Delek as guarantors, providing for a senior secured asset-based revolving credit facilitiesfacility with commitments of $1.0 billion (the "Revolving Credit Facility" and, together with the Term Loan Credit Facility, the "New Credit Facilities").
On December 18, 2019, we amended the Revolving Credit Facility to increase the letter of credit sub-limit under the facility from $300.0 million to $400.0 million, including letters of credit denominated in Canadian dollars of up to $10.0 million.
The Revolving Credit Facility will mature and the commitments thereunder will terminate on March 30, 2023. The Term Loan Credit Facility matures on March 30, 2025 and requires scheduled quarterly principal payments on the last business day of the applicable quarter which, as of December 31, 2019, were $2.75 million. Additionally, the Term Loan Credit Facility requires prepayments by Delek with the net cash proceeds from certain debt incurrences, asset dispositions and insurance or condemnation events with respect to Delek’s assets, subject to certain exceptions, thresholds and reinvestment rights. The Term Loan Credit Facility also requires annual prepayments with a variable percentage of Delek’s excess cash flow, ranging from 50% to 0% depending on Delek’s consolidated fiscal year end secured net leverage ratio. Delek may also make voluntarily prepayments under the Term Loan Credit Facility at any time, subject to a prepayment premium of 1.0% in connection with certain customary repricing events that may occur within six months after the Second Incremental Effective Date, with no premium applied after six months.
The obligations of the borrowers under the New Credit Facilities are guaranteed by Delek and each of its direct and indirect, existing and future, wholly-owned domestic subsidiaries, subject to customary exceptions and limitations, and excluding Delek Logistics Partners, LP, Delek Logistics GP, LLC, and each subsidiary of the foregoing (collectively, the "MLP Subsidiaries"). Borrowings under the New Credit Facilities are also guaranteed by DK Canada Energy ULC, a British Columbia unlimited liability company and a wholly-owned restricted subsidiary of Delek.
The Revolving Credit Facility is secured by a first priority lien over substantially all of Delek’s and each guarantor's receivables, inventory, RINs, instruments, intercompany loan receivables, deposit and securities accounts and related books and records and certain other personal property, subject to certain customary exceptions (the "Revolving Priority Collateral"), and a second priority lien over substantially all of Delek's and each guarantor's other assets, including all of the equity interests of any subsidiary held by Delek or any guarantor (other than equity interests in certain MLP Subsidiaries) subject to certain customary exceptions, but excluding real property (such real property and equity interests, the "Term Priority Collateral").
The Term Loan Credit Facility is secured by a first priority lien on the Term Priority Collateral and a second priority lien on the Revolving Priority Collateral. Certain excluded assets are not included in the Term Priority Collateral and the Revolving Priority Collateral.
At December 31, 2019, the weighted average borrowing rate under the Revolving Credit Facility was approximately $913.9 million,5.0% and we hadwas comprised entirely of a base rate borrowing and the principal amount outstanding thereunder was $30.0 million. Additionally, there were letters of credit issued of approximately $179.4$309.8 million as of December 31, 2019 under the Revolving Credit Facility. Unused credit commitments under the Revolving Credit Facility, as of December 31, 2019, were approximately $660.2 million.
At December 31, 2019, the weighted average borrowing rate under the Term Loan Credit Facility was approximately 4.05% comprised entirely of a LIBOR borrowing and the principal amount outstanding thereunder was $1,085.5 million. As of December 31, 2019, the effective interest rate related to the Term Loan Credit Facility was 4.37%.
On December 31, 2019, Delek entered into a term loan credit and guaranty agreement with BHI as the administrative agent. Pursuant to the Agreement, Delek borrowed $40.0 million (the"BHI Term Loan"). The interest rate under the Agreement is equal to LIBOR plus a margin of 3.00%. The Agreement has a maturity of December 31, 2022 and requires quarterly loan amortization payments of $0.1 million, commencing March 31, 2020. Proceeds may be used for general corporate purposes. The Agreement has an accordion feature that allows increasing the term loan to maximum size of $100.0 million, subject to receiving increased or new commitments from lenders and the satisfaction of certain other conditions. Any such additional borrowings must be completed by December 31, 2021. At December 31, 2019, the weighted average borrowing rate under the term loan was approximately 4.80% comprised entirely of a LIBOR borrowing and the principal amount outstanding thereunder was $40.0 million. As of December 31, 2019, the effective interest rate related to the BHI Term Loan was 5.31%.
Management's Discussion and Analysis
In September 2018, Delek Logistics entered into a third amended and restated senior secured revolving credit agreement with Fifth Third as administrative agent (hereafter, the "Delek Logistics Credit Facility") with commitments of $850 million. The obligations under the Delek Logistics Credit Facility are secured by first priority liens on substantially all of the Delek Logistics' and its subsidiaries' tangible and intangible assets. Additionally, Delek Marketing & Supply, LLC ("Delek Marketing"), a subsidiary of Delek Holdings, continues to provide a limited guaranty of Delek Logistics' obligations under the Delek Logistics Credit Facility. Delek Marketing's guaranty is (i) limited to an amount equal to the principal amount, plus unpaid and accrued interest, of a promissory note made by Delek Holdings in favor of Delek Marketing (the "Holdings Note") and (ii) secured by Delek Marketing's pledge of the Holdings Note to the lenders under the Delek Logistics Credit Facility. As of December 31, 2019, the principal amount of the Holdings Note was $102.0 million.
The Delek Logistics Credit Facility has a maturity date of September 28, 2023 and allows borrowings in either U.S. dollars or Canadian dollars. Borrowings denominated in U.S. dollars bear interest at either the U.S. dollar prime rate, plus an applicable margin, or LIBOR, plus an applicable margin, at the election of the borrowers. Borrowings denominated in Canadian dollars bear interest at either a Canadian dollar prime rate, plus an applicable margin, or the Canadian Dealer Offered Rate, plus an applicable margin, at the election of the borrowers. At December 31, 2019, the weighted average interest rate for borrowings under the Delek Logistics Credit Facility was approximately 4.7%. Additionally, the Delek Logistics Credit Facility requires us to pay a leverage ratio dependent quarterly fee on the average unused revolving commitment. As of December 31, 2019, this fee was 0.50% per year.
On May 23, 2017, Delek Logistics and Delek Logistics Finance Corp., a Delaware corporation and a wholly owned subsidiary of Delek Logistics (“Finance Corp.” and together with Delek Logistics, the “Issuers”), issued $250.0 million in aggregate principal amount of 6.75% senior notes due 2025 (the “2025 Notes”) at a discount. The 2025 Notes are general unsecured senior obligations of the Issuers and rank equal in right of payment with all existing and future senior indebtedness of the Issuers, and senior in right of payment to any future subordinated indebtedness of the Issuers. Interest on the 2025 Notes is payable semi-annually in arrears on each May 15 and November 15.
At any time prior to May 15, 2020, the Issuers may redeem up to 35% of the aggregate principal amount of the 2025 Notes with the net cash proceeds of one or more equity offerings by Delek Logistics at a redemption price of 106.750% of the redeemed principal amount, plus accrued and unpaid interest, if any, subject to certain conditions and limitations. Prior to May 15, 2020, the Issuers may redeem all or part of the 2025 Notes, at a redemption price of the principal amount, plus accrued and unpaid interest, if any, plus a "make whole" premium, subject to certain conditions and limitations. In addition, beginning on May 15, 2020, the Issuers may, subject to certain conditions and limitations, redeem all or part of the 2025 Notes at a redemption price of 105.063% of the redeemed principal for the twelve-month period beginning on May 15, 2020, 103.375% for the twelve-month period beginning on May 15, 2021, 101.688% for the twelve-month period beginning on May 15, 2022 and 100% beginning on May 15, 2023 and thereafter, plus accrued and unpaid interest, if any. In the event of a change of control, accompanied or followed by a ratings downgrade within a certain period of time, subject to certain conditions and limitations, the Issuers will be obligated to make an offer for the purchase of the 2025 Notes from holders at a price equal to 101% of the principal amount thereof, plus accrued and unpaid interest.
Delek has an unsecured revolving credit agreement with Reliant Bank (the "Reliant Bank Revolver"). On December 16, 2019, we amended the Reliant Bank Revolver to extend the maturity date from June 28, 2020 to June 30, 2022, reduce the fixed interest rate from 4.75% to 4.50% per annum and increase the revolver commitment amount from $30.0 million to $50.0 million.
Delek has four notes payable (the "Promissory Notes") with various assignees of Alon Israel Oil Company, Ltd., the holder of a predecessor consolidated promissory note, which bear interest at a fixed rate of 5.50% per annum and which, collectively, require annual principal amortization payments of $25.0 million through 2020 followed by a final principal amortization payment of $20.0 million at maturity on January 4, 2021.
We believe we were in compliance with our covenants in all debt facilities as of December 31, 2018.
2019. See Note 11 to theour accompanying consolidated financial statements in Item 8, Financial Statements and Supplementary Data, of this Annual Report on Form 10-K for additional information abouta complete discussion of our credit facilities.third-party indebtedness.
Management's Discussion and Analysis
Capital Spending
A key component of our long-term strategy is our capital expenditure program. Our capital expenditures for the year ended December 31, 20182019 were $317.2$428.1 million, of which approximately $203.9$266.6 million was spent in our refining segment, $11.6$9.9 million in our logistics segment, $10.0$20.5 million in our retail segment and $91.7$131.1 million at the holding company level. The following table summarizes our actual capital expenditures for 20182019 and planned capital expenditures for 20192020 by operating segment and major category (in millions):
| | | | | Year Ended December 31, | | Year Ended December 31, |
| | | 2019 Forecast | | 2018 Actual | | 2020 Forecast | | 2019 Actual |
| Refining: | | | | | |
| Refining | | Refining |
| Sustaining maintenance, including turnaround activities | | $ | 112.3 |
| | $ | 88.7 |
| | $ | 141.2 |
| | $ | 168.3 |
|
| Regulatory | | 82.9 |
| | 38.0 |
| | 56.2 |
| | 62.3 |
|
| Discretionary projects | | 28.5 |
| | 77.2 |
| | 7.8 |
| | 36.0 |
|
| Refining segment total | | 223.7 |
| | 203.9 |
| | 205.2 |
| | 266.6 |
|
| Logistics: | | | | | |
| | | | | | |
| Logistics | | Logistics |
| Regulatory | | 8.1 |
| | 1.2 |
| | 7.6 |
| | 4.1 |
|
| Sustaining maintenance | | 8.8 |
| | 5.4 |
| | 9.8 |
| | 4.8 |
|
| Discretionary projects | | 0.6 |
| | 5.0 |
| | 5.3 |
| | 1.0 |
|
| Logistics segment total | | 17.5 |
| | 11.6 |
| | 22.7 |
| | 9.9 |
|
| Retail: | | | | | |
| | | | | | |
| Retail | | Retail |
| Regulatory | | — |
| | 0.2 |
| | — |
| | — |
|
| Sustaining maintenance | | 3.3 |
| | 4.0 |
| | 3.0 |
| | 3.5 |
|
| Discretionary projects | | 14.9 |
| | 5.8 |
| | 23.2 |
| | 17.0 |
|
| Retail segment total | | 18.2 |
| | 10.0 |
| | 26.2 |
| | 20.5 |
|
| | | | | | |
| Other | | | | | Other |
| Regulatory | | 2.2 |
| | 0.3 |
| | 0.7 |
| | 1.1 |
|
| Sustaining maintenance | | 3.4 |
| | 1.4 |
| | 13.6 |
| | 2.0 |
|
| Discretionary projects | | 85.1 |
| | 90.0 |
| |
Discretionary projects (1)(2) | | | 57.3 |
| | 128.0 |
|
| Other total | | 90.7 |
| | 91.7 |
| | 71.6 |
| | 131.1 |
|
| | | | | | |
| Total capital spending | | $ | 350.1 |
| | $ | 317.2 |
| | $ | 325.7 |
| | $ | 428.1 |
|
(1) Excludes a $65 million discretionary project to build a connector to the WWP pipeline, for which we have secured pre-approved committed financing from the WWP members.
(2) Excludes purchases of rights-of-way in the amount of $19.1 million in 2019.
The amount of our capital expenditure budget is subject to change due to unanticipated increases in the cost, scope and completion time for our capital projects and subject to the changes and uncertainties discussed under the 'Forward-Looking Statements' section of Item 7, Management Discussion and Analysis, of this Annual Report on Form 10-K. For further information, please refer to our discussion in Item 1A, Risk Factors, of this Annual Report on Form 10-K.
Management's Discussion and Analysis
Contractual Obligations and Commitments
Information regarding our known contractual obligations of the types described below as of December 31, 2018,2019, is set forth in the following table (in millions):
| | | | | Payments Due by Period | | Payments Due by Period |
| | | <1 Year | | 1-3 Years | | 3-5 Years | | >5 Years | | Total | | <1 Year | | 1-3 Years | | 3-5 Years | | >5 Years | | Total |
| Long term debt and notes payable obligations | | $ | 32.0 |
| | $ | 89.0 |
| | $ | 770.7 |
| | $ | 909.8 |
| | $ | 1,801.5 |
| | $ | 36.4 |
| | $ | 131.6 |
| | $ | 640.4 |
| | $ | 1,280.5 |
| | $ | 2,088.9 |
|
Interest(1) | | 97.3 |
| | 187.0 |
| | 163.4 |
| | 65.1 |
| | 512.8 |
| | 96.7 |
| | 186.8 |
| | 140.4 |
| | 18.7 |
| | 442.6 |
|
Operating lease commitments(2) | | 48.1 |
| | 81.6 |
| | 51.9 |
| | 77.9 |
| | 259.5 |
| | 50.2 |
| | 72.6 |
| | 42.5 |
| | 61.9 |
| | 227.2 |
|
Purchase commitments(3) | | 577.3 |
| | — |
| | — |
| | — |
| | 577.3 |
| | — |
| | — |
| | — |
| | — |
| | — |
|
Transportation agreements(4) | | 126.8 |
| | 195.3 |
| | 89.1 |
| | 126.9 |
| | 538.1 |
| | 109.3 |
| | 207.2 |
| | 129.8 |
| | 83.0 |
| | 529.3 |
|
| Total | | $ | 881.5 |
| | $ | 552.9 |
| | $ | 1,075.1 |
| | $ | 1,179.7 |
| | $ | 3,689.2 |
| | $ | 292.6 |
| | $ | 598.2 |
| | $ | 953.1 |
| | $ | 1,444.1 |
| | $ | 3,288.0 |
|
(1) Expected interest payments on debt outstanding at December 31, 2018.2019. Floating interest rate debt is calculated using December 31, 20182019 rates. For additional information, see Note 11 to the consolidated financial statements in Item 8, Financial Statements and Supplementary Data, of this Annual Report on Form 10-K.
(2) Amounts reflect future estimated lease payments under operating leases having remaining non-cancelable terms in excess of one year as of December 31, 2018.2019.
(3) We have supply agreements to secure certain quantities of crude oil, finished product and other resources used in production at both fixed and market prices. We have estimated future payments under the market basedmarket-based agreements using current market rates. Excludes purchase commitments in buy-sell transactions which have matching notional amounts with the same counterparty and are generally net settled.
(4) Balances consist of contractual obligations under agreements with third parties (not including Delek Logistics) for the transportation of crude oil to our refineries.
Off-Balance Sheet Arrangements
We have no material off-balance sheet arrangements through the date of this Annual Report on Form 10-K.
Management's Discussion and Analysis
Accounting Standards
Critical Accounting Policies and Estimates
The fundamental objective of financial reporting is to provide useful information that allows a reader to comprehend our business activities. We prepare our consolidated financial statements in conformity with GAAP, and in the process of applying these principles, we must make judgments, assumptions and estimates based on the best available information at the time. To aid a reader's understanding, management has identified our critical accounting policies. These policies are considered critical because they are both most important to the portrayal of our financial condition and results, and require our most difficult, subjective or complex judgments. Often they require judgments and estimation about matters which are inherently uncertain and involve measuring at a specific point in time, events which are continuous in nature. Actual results may differ based on the accuracy of the information utilized and subsequent events, some over which we may have little or no control.
LIFO Inventory
The Tyler refinery's inventory consists of crude oil, refined petroleum products and blendstocks which are stated at the lower of cost or market. Cost is determined under the last-in, first-out LIFO valuation method. The LIFO method requires management to make estimates on an interim basis of the anticipated year-end inventory quantities, which could differ from actual quantities.
We believe the accounting estimate related to the establishment of anticipated year-end LIFO inventory is a critical accounting estimate, because it requires management to make assumptions about future production rates in the Tyler refinery, the future buying patterns of our customers, as well as numerous other factors beyond our control, including the economic viability of the general economy, weather conditions, the availability of imports, the marketing of competitive fuels and government regulation. The impact of changes in actual performance versus these estimates could be material to the inventories reported on our quarterly balance sheets, and the impact on the results reported in our quarterly statements of income could be material. In selecting assumed inventory levels, we use historical trending of production and sales, recognition of current market indicators of future pricing and value and new regulatory requirements which might impact inventory levels. Management's assumptions require significant judgment because actual year-end inventory levels have fluctuated in the past and may continue to do so.
At each year-end, actual physical inventory levels are used to calculate both ending inventory balances and final cost of materials and other for the year.
Property, Plant and Equipment and Definite LifeOther Intangibles Impairment
Property, plant and equipment and definite lifeother intangibles are evaluated for impairment whenever indicators of impairment exist. Accounting standards require that if an impairment indicator is present, we must assess whether the carrying amount of the asset is unrecoverable by estimating the sum of the future cash flows expected to result from the asset, undiscounted and without interest charges. We derive the required undiscounted cash flow estimates from our historical experience and our internal business plans. We use quoted market prices when available and our internal cash flow estimates discounted at an appropriate interest rate to determine fair value, as appropriate. If the carrying amount is more than the recoverable amount, an impairment charge must be recognized based on the fair value of the asset. We recognized anOur assessment did not result in impairment charge of $2.7 million in 2016 related toduring the write-down of certain idle refining equipment in our refining segment to net realizable value. This impairment charge is included in other operating income in our consolidated statement of income for the period. There were no such impairment charges inyears ended December 31, 2019, 2018 andor 2017.
Goodwill and Potential Impairment
Goodwill in an acquisition represents the excess of the aggregate purchase price over the fair value of the identifiable net assets. Goodwill is reviewed at least annually for impairment, or more frequently if indicators of impairment exist, such as disruptions in our business, unexpected significant declines in operating results or a sustained market capitalization decline. Goodwill is evaluated for impairment by comparing the carrying amount of the reporting unit to its estimated fair value. Prior to the adoption of Accounting Standard Update ("ASU") 2017-04, Simplifying the Test for Goodwill Impairment, Ifif a reporting unit's carrying amount exceeds its fair value (Step 1), the impairment assessment leads to the testing of the implied fair value of the reporting unit's goodwill to its carrying amount (Step 2). If the implied fair value is less than the carrying amount, a goodwill impairment charge is recorded. Subsequent to adoption of ASU 2017-04 (which we adopted during the fourth quarter of 2018, as permitted by the ASU), Step 2 is no longer required, but rather any impairment is determined based on the results of Step 1.
In assessing the recoverability of goodwill, assumptions are made with respect to future business conditions and estimated expected future cash flows to determine the fair value of a reporting unit. We may consider inputs such as a market participant weighted average cost of capital ("WACC"), estimated growth rates for revenue, forecasted crack spreads, gross profit andmargin, capital expenditures, and long-term growth rate based on history and our best estimate of future forecasts, all of which are subject to significant judgment and estimates. We may also estimatecorroborate the fair values of the reporting units using a multiple of expected future cash flows, such as those used by third-party analysts. If these estimates and assumptions change in the future, due to factors such as a decline in general economic conditions, sustained decrease in the crack spreads, competitive pressures on sales and margins and other economic and industry factors beyond management's control, an impairment charge may be required. AThe most significant riskrisks to our future resultsvaluation and the potential future impairment of goodwill isare the WACC and the volatility of the crack spread, which is based on the crude oil and the refined product markets whichmarkets. The crack spread is often unpredictable and may negatively impact our results of operations in ways that cannot be anticipated and that are beyond management's control.
Management's Discussion and Analysis
Our annual assessment of goodwill did not result in impairment during the years ended December 31, 2019, 2018 2017 or 2016.2017. All reporting have fair values that are substantially in excess of its carrying values except for the Big Spring reporting unit. This reporting unit consists primarily of our Big Spring Refinery and has a $528.0 million goodwill balance, for which the calculated excess fair value represented 11.9% of carrying value. Its fair value is significantly driven by the WACC and the forecasted crack spreads. As described above, both of these assumptions are often unpredictable and are beyond management's control. We note an increase in more than 1% in the WACC may result in an impairment. Therefore, any sustained adverse changes to these assumptions may result in a material impairment charge for a portion or all of the goodwill balance. Details of remaining goodwill balances by segment are included in Note 18 to the consolidated financial statements in Item 8, Financial Statements and Supplementary Data, of this Annual Report on Form 10-K.
Environmental Liabilities
It is our policy to accrue environmental and clean-up related costs of a non-capital nature when it is both probable that a liability has been incurred and the amount can be reasonably estimated. Environmental liabilities represent the current estimated costs to investigate and remediate contamination at our properties.sites where we have environmental exposure. This estimate is based on internal and third-party assessments of the extent of the contamination, the selected remediation technologymethodology and review of applicable environmental regulations, typically considering estimated activities and costs for 15 years, and up to 30 years if a longer period is believed reasonably necessary. Such estimates may require judgment with respect to costs, time frame and extent of required remedial and clean-up activities. Accruals for estimated costs from environmental remediation obligations generally are recognized no later than completion of the remedial feasibility study and include, but are not limited to, costs to perform remedial actions and costs of machinery and equipment that are dedicated to the remedial actions and that do not have an alternative use. Such accruals are adjusted as further information develops or circumstances change. We discount environmental liabilities to their present value if payments are fixed andor reliably determinable. Expenditures for equipment necessary for environmental issues relating to ongoing operations are capitalized.
Changes in laws and regulations and actual remediation expenses compared to historical experience could significantly impact our results of operations and financial position. We believe the estimates selected, in each instance, represent our best estimate of future outcomes, but the actual outcomes could differ from the estimates selected.
Asset Retirement Obligations
Delek recognizes liabilities which represent the fair value of a legal obligation to perform asset retirement activities, including those that are conditional on a future event, when the amount can be reasonably estimated. If a reasonable estimate cannot be made at the time the liability is incurred, we record the liability when sufficient information is available to estimate the liability’s fair value.
In the refining segment, we have asset retirement obligations with respect to our refineries due to various legal obligations to clean and/or dispose of these assets at the time they are retired. However, the majority of these assets can be used for extended and indeterminate periods of time provided that they are properly maintained and/or upgraded. It is our practice and intent to continue to maintain these assets and make improvements based on technological advances. In the logistics segment, these obligations relate to the required cleanout of the pipeline and terminal tanks and removal of certain above-grade portions of the pipeline situated on right-of-way property. In the retail segment, we have asset retirement obligations related to the removal of underground storage tanks and the removal of brand signage at owned and leased retail sites which are legally required under the applicable leases. The asset retirement obligation for storage tank removal on leased retail sites is accreted over the expected life of the owned retail site or the average retail site lease term.
In order to determine fair value, management must make certain estimates and assumptions including, among other things, projected cash flows, a credit-adjusted risk-free rate and an assessment of market conditions that could significantly impact the estimated fair value of the asset retirement obligations. We believe the estimates selected, in each instance, represent our best estimate of future outcomes, but the actual outcomes could differ from the estimates selected.
New Accounting Pronouncements
See Note 2 to the consolidated financial statements in Item 8, Financial Statements and Supplementary Data, of this Annual Report on Form 10-K for a discussion of new accounting pronouncements applicable to us.
Management's Discussion and Analysis
Non-GAAP Measures
Our management uses certain “non-GAAP” operational measures to evaluate our operating segment performance and non-GAAP financial measures to evaluate past performance and prospects for the future to supplement our GAAP financial information presented in accordance with U.S. GAAP. These financial and operational non-GAAP measures are important factors in assessing our operating results and profitability and include:
Refining margin - calculated as the difference between net refining revenues and total cost of materials and other;
Refined product margin - calculated as the difference between net revenues attributable to refined products (produced and purchased) and related cost of materials and other (which is applicable to both the refining segment and the West Texas wholesale marketing activities within our logistics segment); and
Refining margin per barrels sold - calculated as refining margin divided by our average refining sales in barrels per day (excluding purchased barrels) multiplied by 1,000 and multiplied by the number of days in the period.
We believe these non-GAAP operational and financial measures are useful to investors, lenders, ratings agencies and analysts to assess our ongoing performance because, when reconciled to their most comparable GAAP financial measure, they provide improved comparability between periods through the exclusion of certain items that we believe are not indicative of our core operating performance and they may obscure our underlying results and trends.
Non-GAAP measures have important limitations as analytical tools, because they exclude some, but not all, items that affect net earnings and operating income. These measures should not be considered substitutes for their most directly comparable U.S. GAAP financial measures.
The following table provides a reconciliation of refining margin to the most directly comparable U.S. GAAP measure, gross margin:
Reconciliation of refining margin to gross margin
|
| | | | | | | | | | | | | |
| Refining Segment |
| | | | Year Ended December 31, |
| | | | 2019 | | 2018 | | 2017 |
| Net revenues | | | $ | 8,798.5 |
| | $ | 9,610.4 |
| | $ | 6,620.6 |
|
| Cost of sales | | | 8,171.2 |
| | 8,879.0 |
| | 6,279.1 |
|
| Gross margin | | | 627.3 |
| | 731.4 |
| | 341.5 |
|
| Add back (items included in cost of sales): | | | | | | | |
| Operating expenses (excluding depreciation and amortization) | | | 492.4 |
| | 465.4 |
| | 317.7 |
|
| Depreciation and amortization | | | 134.3 |
| | 133.7 |
| | 109.2 |
|
| Refining margin | | | $ | 1,254.0 |
| | $ | 1,330.5 |
| | $ | 768.4 |
|
Disclosures, Financial Statements,Management's Discussion and Changes in DisagreementsAnalysis
ITEM 7A. QUANTITATIVE AND QUALITATIVE DISCLOSURES ABOUT MARKET RISK
Changes in commodity prices (mainly crude oil and unleaded gasoline) and interest rates are our primary sources of market risk. When we make the decision to manage our market exposure, our objective is generally to avoid losses from adverse price changes, realizing we will not obtain the gains of beneficial price changes.
Commodity Price Risk
Impact of Changing Prices.Prices
Our revenues and cash flows, as well as estimates of future cash flows, are sensitive to changes in energy prices. Major shifts in the cost of crude oil, the prices of refined products and the cost of ethanol can generate large changes in the operating margin in each of our segments.
We maintain, at both company-owned and third-party facilities, inventories of crude oil, feedstocks and refined petroleum products, the values of which are subject to wide fluctuations in market prices driven by world economic conditions, regional and global inventory levels and seasonal conditions. At December 31, 20182019 and 2017,2018, we held approximately 3.7 million and 3.13.7 million barrels, respectively, of crude and product inventories associated with the Tyler refinery valued under the LIFO valuation method, with an average cost of $48.79$61.56 and $64.89$48.79 per barrel, respectively. At December 31, 20182019 and 2017,2018, the excess of replacement cost over the carrying value (LIFO) of refinery inventories was $1.5$14.9 million and $9.0$1.5 million, respectively. At December 31, 2019 and 2018, we held approximately 9.4 million and 8.5 million barrels, respectively, of crude and product inventories associated with the El Dorado, Big Spring and Krotz Springs refineries valued under the FIFO valuation method, with an average cost of $63.25 and $50.56 per barrel. At December 31, 2016, we held approximately 7.8 million barrels of crude and product inventories associated with the El Dorado refinery valued under the FIFO valuation method, with an average cost of $60.03 per barrel.barrel, respectively. Due to a lower crude oil and refined product pricing environment, experienced since the end of 2014, market prices have declined to a level below the average cost of our inventories. At December 31, 2018,2019, we recorded a pre-tax inventory valuation reserve of $54.0$1.7 million, $39.4$1.2 million of which related to LIFO inventory, which is subject to reversal in subsequent periods, not to exceed LIFO cost, should market prices recover. At December 31, 2017,2018, we recorded a pre-tax inventory valuation reserve of $2.4$54.0 million, of which $1.5$39.4 million related to LIFO inventory, which reversedis subject to reversal in the first quarter of 2018, as the inventories associated with the valuation adjustment at the end of 2017 were sold or used.subsequent periods, not to exceed LIFO cost, when those physical inventory quantities are sold. For the years ended December 31, 2019, 2018 2017 and 2016,2017, we recognized net inventory valuation (losses) gains of $37.6 million, $(52.5) million $14.0 million and $34.9$14.0 million, respectively, which were recorded as a component of cost of materials and other in the consolidated statements of income.
From time to time, we also may enter into forward purchase or sale derivative contracts for trading purposes (primarily in our Canadian business) and, as a result, may have trading commodity investmentsinvestment commodities on hand related to the purchased inventory. Such derivative contracts and related commodity investmentsinvestment commodities are recorded at fair value and subject to pricing risk each period with changes in fair value reflected in other operating income (expense) in the profit and loss section of our consolidated financial statements. For the yearyears ended December 31, 2019 and 2018, all of our forward contracts that were accounted for as derivative instruments consisted of contracts related to our Canadian trading activities. There were no forward contract transactions that were accounted for as derivatives for the years ended December 31, 2017 and 2016, and there were no forward contract derivative assets or liabilities outstanding as of December 31, 2017.
Price Risk Management Activities.Activities
At times, we enter into the following instruments/transactions in order to manage our market-indexed pricing risk: commodity derivative contracts which we use to manage our price exposure to our inventory positions, future purchases of crude oil and ethanol, future sales of refined products or to fix margins on future production; and future commitments to purchase or sell RINs at fixed prices and quantities, which are used to manage the costs associated with our RINs obligations and meet the definition of derivative instruments under ASC 815. In accordance with ASC 815, all of these commodity contracts and future purchase commitments are recorded at fair value, and any change in fair value between periods has historically been recorded in the profit and loss section of our consolidated financial statements. Occasionally, at inception, the Company will elect to designate the commodity derivative contracts as cash flow hedges under ASC 815. Gains or losses on commodity derivative contracts accounted for as cash flow hedges are recognized in other comprehensive income on the consolidated balance sheets and, ultimately, when the forecasted transactions are completed in net salesrevenues or cost of materials and other in the consolidated statements of income.
Disclosures, Financial Statements,
Management's Discussion and Changes in DisagreementsAnalysis
The following table sets forth information relating to our open commodity derivative contracts, excluding our trading derivative contracts (which are presented separately below), as of December 31, 20182019 ($ in millions).
| | | | | Total Outstanding | | Notional Contract Volume by Year of Maturity | | | | Total Outstanding | | Notional Contract Volume by Year of Maturity | | |
| Contract Description | | Fair Value | | Notional Contract Volume | | 2019 | | 2020 | | 2021 | | 2022 | | 2023 | | Fair Value | | Notional Contract Volume | | 2020 | | 2021 | | 2022 | | 2023 | | 2024 |
| Contracts not designated as hedging instruments: | | | | | | | | | | | | | | | | | | | | | | | | | | | | |
Crude oil price swaps - long(1) | | $ | (1.6 | ) | | 480,000 |
| | — |
| | 480,000 |
| | — |
| | — |
| | — |
| | $ | 7.4 |
| | 26,542,000 |
| | 21,222,000 |
| | 5,320,000 |
| | — |
| | — |
| | — |
|
Crude oil price swaps - short(1) | | 0.5 |
| | 480,000 |
| | — |
| | 480,000 |
| | — |
| | — |
| | — |
| | (19.3 | ) | | 26,471,000 |
| | 21,151,000 |
| | 5,320,000 |
| | — |
| | — |
| | — |
|
Inventory, refined product and crack spread swaps - long(1) | | (8.9 | ) | | 9,265,000 |
| | 6,225,000 |
| | 3,040,000 |
| | — |
| | — |
| | — |
| | 3.0 |
| | 13,484,000 |
| | 13,219,000 |
| | 265,000 |
| | — |
| | — |
| | — |
|
Inventory, refined product and crack spread swaps - short(1) | | 19.2 |
| | 10,207,000 |
| | 4,967,000 |
| | 5,000,000 |
| | 240,000 |
| | — |
| | — |
| | (20.7 | ) | | 16,907,000 |
| | 16,532,000 |
| | 375,000 |
| | — |
| | — |
| | — |
|
RIN commitment contracts - long(2) | | 0.3 |
| | 74,000,000 |
| | 74,000,000 |
| | — |
| | — |
| | — |
| | — |
| |
RIN commitment contracts - short(2) | | 6.5 |
| | 63,750,000 |
| | 63,750,000 |
| | — |
| | — |
| | — |
| | — |
| |
Natural gas swaps - long(2) | | | (2.7 | ) | | 26,347,500 |
| | 26,347,500 |
| | — |
| | — |
| | — |
| | |
Natural gas swaps - short(2) | | | 0.2 |
| | 13,702,500 |
| | 13,702,500 |
| | — |
| | — |
| | — |
| | |
RIN commitment contracts - long(3) | | | 1.9 |
| | 122,500,000 |
| | 122,500,000 |
| | 122,500,000 |
| | — |
| | — |
| | — |
|
RIN commitment contracts - short(3) | | | 9.0 |
| | 24,500,000 |
| | 24,500,000 |
| | 24,500,000 |
| | — |
| | — |
| | — |
|
| Total | | $ | 16.0 |
| | 158,182,000 |
| | 148,942,000 |
| | 9,000,000 |
| | 240,000 |
| | — |
| | — |
| | $ | (21.2 | ) | | 270,454,000 |
| | 259,174,000 |
| | 158,280,000 |
| | — |
| | — |
| | — |
|
| Contracts designated as cash flow hedging instruments: | | | | | | | | | | | | | | | | | | | | | | | | | | | | |
Inventory, refined product and crack spread swaps - long(1) | | 27.0 |
| | 15,811,000 |
| | 15,811,000 |
| | — |
| | — |
| | — |
| | — |
| | (2.1 | ) | | 300,000 |
| | 300,000 |
| | — |
| | — |
| | — |
| | — |
|
Inventory, refined product and crack spread swaps - short(1) | | 17.6 |
| | 650,000 |
| | 350,000 |
| | 300,000 |
| | — |
| | — |
| | — |
| | 3.6 |
| | 300,000 |
| | 300,000 |
| | — |
| | — |
| | — |
| | — |
|
| Total | | $ | 44.6 |
| | 16,461,000 |
| | 16,161,000 |
| | 300,000 |
| | — |
| | — |
| | — |
| | $ | 1.5 |
| | 600,000 |
| | 600,000 |
| | — |
| | — |
| | — |
| | — |
|
(1) Volume in barrelsbarrels.
(2) Volume in RINsMMBTU.
(3)Volume in RINs.
Interest Rate Risk
We have market exposure to changes in interest rates relating to our outstanding floating rate borrowings, which totaled approximately $1,451.5$1,743.9 million as of December 31, 2018.2019. The annualized impact of a hypothetical one percent change in interest rates on our floating rate debt outstanding as of December 31, 20182019 would be to change interest expense by approximately $14.5$17.4 million.
LIBOR Transition
LIBOR is a commonly used indicative measure of the average interest rate at which major global banks could borrow from one another. The United Kingdom’s Financial Conduct Authority, which regulates LIBOR, has publicly announced that it intends to discontinue the reporting of LIBOR rates after 2021. Certain of our agreements use LIBOR as a “benchmark” or “reference rate” for various terms. Some agreements contain an existing LIBOR alternative. Where there is not an alternative, we expect to replace the LIBOR benchmark with an alternative reference rate. While we do not expect the transition to an alternative rate to have a significant impact on our business or operations, it is possible that the move away from LIBOR could materially impact our borrowing costs on our variable rate indebtedness.
Disclosures, Financial Statements,
Management's Discussion and Changes in DisagreementsAnalysis
Commodity Derivatives Trading Activities
In the first half of 2018, we entered into active trading positions in a variety of commodity derivatives, which include forward physical contracts, swap contracts, and futures contracts. These contracts are classified as held for trading and are recognized at fair value with changes in fair value recognized in the income statement. Trading activities are undertaken by using a range of contract types in combination to create incremental gains by capitalizing on crude oil supply and pricing seasonality. These contracts had remaining durations of less than one year as of December 31, 2018.2019.
The following table sets forth information relating to commodity derivative contracts held for trading purposes as of December 31, 2018.2019.
| | | Contract Description | | Less than 1 year | | Less than 1 year |
| Over the counter forward sales contracts | | | | |
Notional contract volume (1) | | 1,454,109 |
| | 1,293,474 |
|
| Weighted-average market price (per barrel) | | $ | 28.87 |
| | $ | 34.31 |
|
| Contractual volume at fair value (in millions) | | $ | 42.0 |
| | $ | 44.4 |
|
| Over the counter forward purchase contracts | | | | |
Notional contract volume (1) | | 930,713 |
| | 1,186,591 |
|
| Weighted-average market price (per barrel) | | $ | 29.06 |
| | $ | 33.97 |
|
| Contractual volume at fair value (in millions) | | $ | 27.0 |
| | $ | 40.3 |
|
| |
(1) | Volume in barrelsbarrels. |
ITEM 8. FINANCIAL STATEMENTS AND SUPPLEMENTARY DATA
The information required by Item 8 is incorporated by reference to the section beginning on page F-1.
ITEM 9. CHANGES IN AND DISAGREEMENTS WITH ACCOUNTANTS ON ACCOUNTING AND FINANCIAL DISCLOSURE
None.
ITEM 9A. CONTROLS AND PROCEDURES
Disclosure Controls and Procedures
We maintain disclosure controls and procedures (as defined in RuleRules 13a-15(e) and 15d-15(e)) under the Securities Exchange Act of 1934, as amended ("Exchange Act") that are designed to provide reasonable assurance that the information that we are required to disclose in the reports we file or submit under the Exchange Act is recorded, processed, summarized and reported within the time periods specified in the SEC's rules and forms, and such information is accumulated and communicated to our management, including our Chief Executive Officer and Chief Financial Officer, as appropriate, to allow timely decisions regarding required disclosure. It should be noted that, because of inherent limitations, our disclosure controls and procedures, however well designed and operated, can provide only reasonable, and not absolute, assurance that the objectives of the disclosure controls and procedures are met.
As required by paragraph (b) of RulesRule 13a-15 and 15d-15 under the Exchange Act, we carried out an evaluation under the supervision and with the participation of our management, including our Chief Executive Officer and our Chief Financial Officer, have evaluatedof the effectiveness of the design and operation of our disclosure controls and procedures (as such term is defined in Rules 13a-15(e) and 15d-15(e) under the Exchange Act) as of the end of the period covered by this report. Based on such evaluation, our Chief Executive Officer and our Chief Financial Officer have concluded that our disclosure controls and procedures were effective as of the end of the period covered by this report, that our disclosure controls and procedures were effective at a reasonable assurance level to ensure that the information that we are required to disclose in the reports we file or submit under the Exchange Act is recorded, processed, summarized and reported within the time periods specified in SEC rules and forms, and such information is accumulated and communicated to our management, including our Chief Executive Officer and Chief Financial Officer, as appropriate, to allow timely decisions regarding required disclosure.report.
Management's Annual Report on Internal Control over Financial Reporting
Our management is responsible for establishing and maintaining adequate internal control over financial reporting. Our internal control over financial reporting is a process that is designed under the supervision of our Chief Executive Officer and Chief Financial Officer, and effected by our Board of Directors, management and other personnel, to provide reasonable assurance regarding the reliability of financial reporting and the preparation of financial statements for external purposes in accordance with GAAP. Our internal control over financial reporting includes those policies and procedures that:
Pertain to the maintenance of records that, in reasonable detail, accurately and fairly reflect the transactions and dispositions of our assets;
Controls and Procedures, and Other Information
| |
i. | Pertain to the maintenance of records that, in reasonable detail, accurately and fairly reflect the transactions and dispositions of our assets; |
| |
ii. | Provide reasonable assurance that transactions are recorded as necessary to permit preparation of financial statements in accordance with GAAP and that receipts and expenditures recorded by us are being made only in accordance with authorizations of our management and Board of Directors; and |
| |
iii. | Provide reasonable assurance regarding prevention or timely detection of unauthorized acquisition, use or disposition of our assets that could have a material effect on our financial statements. |
Provide reasonable assurance that transactions are recorded as necessary to permit preparation of financial statements in accordance with GAAP and that receipts and expenditures recorded by us are being made only in accordance with authorizations of our management and Board of Directors; and
Provide reasonable assurance regarding prevention or timely detection of unauthorized acquisition, use or disposition of our assets that could have a material effect on our financial statements.
Because of its inherent limitations, internal control over financial reporting may not prevent or detect misstatements. Also, projections of any evaluation of effectiveness to future periods are subject to the risk that controls may become inadequate because of changes in conditions, or that the degree of compliance with the policies and procedures may deteriorate.
Management has conducted its evaluation of the effectiveness of internal control over financial reporting as of December 31, 2018,2019, based on the framework in Internal Control - Integrated Framework (2013) issued by the Committee of Sponsoring Organizations of the Treadway Commission. Management's assessment included an evaluation of the design of our internal control over financial reporting and testing the operational effectiveness of our internal control over financial reporting. Management reviewed the results of the assessment with the Audit Committee of the Board of Directors. Based on its assessment and review with the Audit Committee, management concluded that, at December 31, 2018,2019, we maintained effective internal control over financial reporting.
Report of Independent Registered Public Accounting Firm
Our independent registered public accounting firm, Ernst & Young LLP, has audited the effectiveness of our internal control over financial reporting as of December 31, 2018,2019, as stated in their report, which is included in the section beginning on page F-1.
The information required by Item 8 is incorporated by reference to the section beginning on page F-1.
Changes in Internal Control over Financial Reporting
There has been no change in our internal control over financial reporting (as described in RuleRules 13a-15(f) and 15d-15(f) under the Exchange Act) during the quarter ended December 31, 20182019 that has materially affected, or is reasonably likely to materially affect, our internal control over financial reporting.
ITEM 9B. OTHER INFORMATION
Dividend Declaration
On February 19, 2019,24, 2020, Delek's Board of Directors voted to declare a quarterly cash dividend of $0.27$0.31 per share, payable on March 19, 2019,24, 2020, to stockholders of record on March 5, 2019.10, 2020.
Directors, Executive Officers, Corporate Governance and Security Ownership
PART III
ITEM 10. DIRECTORS, EXECUTIVE OFFICERS AND CORPORATE GOVERNANCE
Our Board Governance Guidelines, our charters for our Audit, Compensation, Nominating and Corporate Governance and Environmental, Health and Safety Committees and our Code of Business Conduct & Ethics covering all employees, including our principal executive officer, principal financial officer, principal accounting officer and controllers, are available on our website, www.DelekUS.com, under the "About Us - Corporate Governance" caption. A print copy of any of these documents will be mailed upon a written request made by a stockholder to the Secretary, Delek US Holdings, Inc. 7102 Commerce Way, Brentwood, Tennessee 37027. We intend to disclose any amendments to or waivers of the Code of Business Conduct & Ethics on behalf of our Chief Executive Officer, Chief Financial Officer and persons performing similar functions on our website, at www.DelekUS.com, under the "Investor Relations" caption, promptly following the date of any such amendment or waiver.
The information required by Item 401 of Regulation S-K regarding directors will be included under "Election of Directors" in the definitive Proxy Statement for our Annual Meeting of Stockholders to be held April 30, 2019May 5, 2020 (the "Definitive Proxy Statement"), and is incorporated herein by reference. The information required by Item 401 of Regulation S-K regarding executive officers will be included under "Corporate Governance" in the Definitive Proxy Statement and is incorporated herein by reference. The information required by Item 405 of Regulation S-K will be included under "Section 16(a) Beneficial Ownership Reporting Compliance" in the Definitive Proxy Statement and is incorporated herein by reference. The information required by Items 406, 407(c)(3), (d)(4), and (d)(5) of Regulation S-K will be included under "Corporate Governance" in the Definitive Proxy Statement and is incorporated herein by reference.
ITEM 11. EXECUTIVE COMPENSATION
The information required by Item 402 and paragraphs (e)(4) and (e)(5) of Item 407 of Regulation S-K will be included under "Executive Compensation" and "Corporate Governance" in the Definitive Proxy Statement and is incorporated herein by reference.
ITEM 12. SECURITY OWNERSHIP OF CERTAIN BENEFICIAL OWNERS AND MANAGEMENT AND RELATED STOCKHOLDER MATTERS
The information required by Item 201(d) and Item 403 of Regulation S-K will be included under "Equity Compensation Plan Information" and "Security Ownership of Certain Beneficial Owners and Management" in the Definitive Proxy Statement and is incorporated herein by reference.
ITEM 13. CERTAIN RELATIONSHIPS AND RELATED TRANSACTIONS AND DIRECTOR INDEPENDENCE
The information required by Item 404 of Regulation S-K will be included under "Certain Relationships and Related Transactions" in the Definitive Proxy Statement and is incorporated herein by reference.
The information required by Item 407(a) of Regulation S-K will be included under "Election of Directors" and "Corporate Governance" in the Definitive Proxy Statement and is incorporated herein by reference.
ITEM 14. PRINCIPAL ACCOUNTANT FEES AND SERVICES
The information required by this item will be included under “Independent Public Accountants” in the Definitive Proxy Statement and is incorporated herein by reference.
Financial Statements and Schedules
PART IV
ITEM 15. EXHIBITS AND FINANCIAL STATEMENT SCHEDULES
(a) Certain Documents Filed as Part of this Annual Report on Form 10-K:
| |
| 1. | Financial Statements. The accompanying Index to Financial Statements on page F-1 of this Annual Report on Form 10-K is provided in response to this item. |
| |
| 2. | List of Financial Statement Schedules. All schedules are omitted because the required information is either not present, not present in material amounts, included within the Consolidated Financial Statements or is not applicable. |
Financial Statements and Schedules
EXHIBIT INDEX
|
| | | | |
| Exhibit No. | | Description |
| 2.1 | | | | |
| 2.2 | | < | | |
| 2.3 | | < | | Agreement and Plan of Merger dated as of January 2, 2017, among Delek US Holdings, Inc., Delek Holdco, Inc., Dione Mergeco, Inc., Astro Mergeco, Inc. and Alon USA Energy, Inc. (incorporated by reference to Exhibit 2.1 to the Company's Form 8-K filed on January 3, 2017). |
| 2.4 | | | | First Amendment to Agreement and Plan of Merger dated as of February 27, 2017, among Delek US Holdings, Inc., Delek Holdco, Inc., Dion Mergeco, Inc., Astro Mergeco, Inc., and Alon USA Energy, Inc. (incorporated by reference to Exhibit 2.6 to the Company’s Form 10-K filed on February 28, 2017). |
| 2.5 | | | | Second Amendment to Agreement and Plan of Merger dated as of April 21, 2017, among Delek US Holdings, Inc., Delek Holdco, Inc., Dion Mergeco, Inc., Astro Mergeco, Inc., and Alon USA Energy, Inc. (incorporated by reference to Annex B-2 to the Company’s Proxy Statement/Prospectus filed pursuant to Rule 424(b)(3) on May 30, 2017). |
| 2.6 | | | | Agreement and Plan of Merger dated as of November 8, 2017, among Delek US Holdings, Inc., Sugarland Mergeco, LLC, Alon USA Partners, LP, and Alon USA Partners GP, LLC (incorporated by reference to Exhibit 2.1 to the Company’s Form 8-K filed on November 9, 2017). |
| 2.7 | | | | Asset Purchase Agreement, dated as of February 26, 2018, by and among DKL Big Spring, LLC, Delek US Holdings, Inc., Alon USA Partners, LP, Alon USA GP II, Alon USA Delaware, LLC, Alon USA Refining, LLC, and Alon USA, LP (incorporated by reference herein to Exhibit 2.1 to Delek US’the Company's Current Report on Form 8-K filed on March 2, 2018, File No. 001-38142).
|
| 3.1 | | | | |
| 3.2 | | | | |
| 4.1 | | | | Indenture, dated as of May 23, 2017, among Delek Logistics, LP, Delek Logistics Finance Corp., the Guarantors named therein and U.S. Bank, National Association, as trustee (incorporated by reference to Exhibit 4.1 to the Partnership's Form 8-K filed on May 24, 2017, SEC File No. 001-35721). |
| 4.2 | | | | |
| 4.3 | | # | | Registration Rights Agreement, dated asDescription of May 23, 2017, among Delek Logistics, LP, Delek Logistics Finance Corp., the Guarantors named therein and Merrill Lynch, Pierce, Fenner & Smith Incorporated, as representative of the initial purchasers (incorporated by reference to Exhibit 4.3 to the Partnership's Form 8-K filed on May 24, 2017, SEC File No. 001-35721).Common Stock |
| 10.1 | | * | | |
| 10.2(a) | | * | | |
| 10.2(b) | | * | | |
| 10.2(c) | | * | | |
| 10.2(d) | | * | | |
| 10.2(e) | | * | | |
| 10.2(f) | | * | | |
| 10.2(g) | | * | | |
| 10.3 | | | | |
| 10.4 | | | | |
Financial Statements and Schedules
|
| | | | |
| 10.5 | | | | Pipelines and Storage Facilities Agreement, dated November 7, 2012, by and among Lion Oil Company, Delek Logistics Partners, LP, SALA Gathering Systems, LLC, El Dorado Pipeline Company, LLC, Magnolia Pipeline Company, LLC and J. Aron & Company (incorporated by reference to Exhibit 10.5 to the Company's Form 8-K filed on November 14, 2012, SEC File No. 001-32868). |
10.610.6(a) | | ++ | | |
10.7(a)10.6(b) | | | | |
10.7(b)10.6(c) | | ~ | | Joinder and First Amendment to Second Amended and Restated CreditSupply and Offtake Agreement dated as of September 29, 2016, among Delek Refining, Ltd., as borrower, Delek Refining Inc.19, 2019, by and Delek U.S. Refining GP,between Lion Oil Company and J. Aron & Company LLC as guarantor, Wells Fargo Bank, National Association, as administrative agent, and a syndicate of lenders (incorporated by reference to Exhibit 10.110.5 to the Company'sCompany’s Quarterly Report on Form 8-K10-Q filed on October 3, 2016)November 8, 2019). |
10.7(c) | | | | Second Amendment to Amended and Restated Credit Agreement, dated May 17, 2017, among Delek Refining, Ltd., as borrower, and Delek Refining Inc. and Delek U.S. Refining GP, LLC, as guarantors, Wells Fargo Bank, National Association as administrative agent, and a syndicate of lenders (incorporated by reference to Exhibit 10.1 to the Company's Form 10-Q filed on August 7, 2017). |
10.8(a)10.7(a) | | * | | |
10.8(b)10.7(b) | | * | | |
10.9 | | | | |
10.10(a)10.8(a) | | | | Third Amended and Restated Omnibus Agreement, dated as of March 31, 2015, among Delek US Holdings, Inc., Lion Oil Company, Delek Logistics Operating, LLC, Delek Marketing & Supply, LP, Delek Refining, Ltd., Delek Logistics Partners, LP, Paline Pipeline Company, LLC, SALA Gathering Systems, LLC, Magnolia Pipeline Company, LLC, El Dorado Pipeline Company, LLC, Delek Crude Logistics, LLC, Delek Marketing-Big Sandy, LLC, DKL Transportation, LLC and Delek Logistics GP, LLC (incorporated by reference to Exhibit 10.1 to the Company's Form 10-Q filed on May 7, 2015). |
10.10(b)10.8(b) | | | | First Amendment to Third Amended and Restated Omnibus Agreement, dated as of August 3, 2015, by and among Delek US Holdings, Inc., Lion Oil Company, Delek Logistics Operating, LLC, Delek Marketing & Supply, LP, Delek Refining, Ltd., Delek Logistics Partners, LP, Paline Pipeline Company, LLC, SALA Gathering Systems, LLC, Magnolia Pipeline Company, LLC, El Dorado Pipeline Company, LLC, Delek Crude Logistics, LLC, Delek Marketing-Big Sandy, LLC, DKL Transportation, LLC and Delek Logistics GP, LLC (incorporated by reference to Exhibit 10.5 to the Company's Form 10-Q filed on August 5, 2015). |
10.11(a)10.9(a) | | | | |
10.11(b) | | | | First Amendment to Second Amended and Restated Financing Agreement, dated April 13, 2017, among Lion Oil Company, as borrower, certain subsidiaries of Lion Oil Company named therein as guarantors, the various institutions from time to time party to this Agreement, as Lenders, Fifth Third Bank, as Administrative Agent and Lead Collateral Agent, and Bank Hapoalim B.M., as Designated Account Collateral Agent (incorporated by reference to Exhibit 10.2 to the Company's Form 10-Q filed on August 7, 2017).
|
10.12(a) | | * | | |
10.12(b)10.9(b) | | * | | |
| 10.9(c) | | * | | |
10.12(c)10.9(d) | | * | | |
10.12(d)10.9(e) | | * | | |
10.12(e)10.9(f) | | * | | |
10.13(a)10.10(a) | | * | |
|
|
| | | | |
10.13(b)10.10(b) | | * | | |
10.13(c)10.10(c) | | * | | |
10.13(d)10.10(d) | | * | | |
10.13(e)10.10(e) | | * | | |
10.13(f)10.10(f) | | * | | |
Financial Statements and Schedules
|
| | | | |
| 10.10(g) | | * | | |
10.13(h)10.10(h) | | * | | |
10.14(a) | | * | | |
10.14(b) | | * | | |
10.14(c) | | * | | |
10.14(d) | | * | | |
10.15 | | | | |
10.16 | | | | |
10.17 | | | | |
10.18(a) | | | | Second Amended and Restated Credit Agreement dated as of March 14, 2014, among Southwest Convenience Stores, LLC, Skinny’s, LLC, as the Borrowers, Alon Brands, Inc., as a Guarantor, GTS Licensing Company, Inc., as a Guarantor, the lenders party thereto and Wells Fargo Bank, National Association, as Administrative Agent, Swingline Lender, LC Issuer, Syndication Agent and Sole Lead Arranger (incorporated by reference to Exhibit 10.1 to Alon USA Energy, Inc.’s Form 8-K filed on March 27, 2014, SEC File No. 001-32567). |
10.18(b) | | | | First Amendment to Second Amended and Restated Credit Agreement dated as of August 25, 2015, among Southwest Convenience Stores, LLC, Skinny’s, LLC, as the Borrowers, Alon Brands, Inc., as a Guarantor, GTS Licensing Company, Inc., as a Guarantor, the lenders party thereto and Wells Fargo Bank, National Association, as Administrative Agent, Swingline Lender, LC Issuer, Syndication Agent and Sole Lead Arranger (incorporated by reference to Exhibit 10.1 to Alon USA Energy, Inc.’s Form 8-K filed on August 31, 2015, SEC File No. 001-32567). |
10.19 | | | | Credit and Guaranty Agreement, dated as of November 26, 2012, among Alon USA Partners, LP, Alon USA Partners GP, LLC and certain subsidiaries of Alon USA Partners, LP, as Guarantors, the lenders party thereto and Credit Suisse AG, as Administrative Agent and Collateral Agent (incorporated by reference to Exhibit 10.1 to Alon USA Energy, Inc.’s Form 8-K, filed on November 30, 2012, SEC File No. 001-32567). |
10.20(a)10.11(a) | | ++ | | |
10.20(b)10.11(b) | | | | |
10.21(a)10.11(c) | | ~ | | |
| 10.11(d) | | ~ | | |
| 10.12(a) | | ++ | | |
|
| | | | |
10.21(b)10.12(b) | | ~+ | |
|
10.2210.12(c) | | ~ | | |
| 10.13 | | ++ | | |
10.23(a) | | | | Second Amended Revolving Credit Agreement dated as of May 23, 2013, by and among Alon USA Energy, Inc., Alon USA, LP, Israeli Discount Bank of New York, Bank Leumi USA and certain other guarantor companies and financial institutions from time to time named therein (incorporated by reference to Exhibit 10.1 to Alon USA Energy, Inc.’s Form 8-K filed on May 24, 2013, SEC File No. 001-32567). |
10.23(b) | | | | Second Amendment to Second Amended Revolving Credit Agreement and Partial Release, dated May 6, 2015, by and among Alon USA Energy, Inc., Alon USA, LP, Israel Discount Bank of New York, Bank Leumi USA and certain other guarantor companies and financial institutions from time to time named therein (incorporated by reference to Exhibit 10.4 to Alon USA Energy, Inc.’s Form 10-Q filed on May 8, 2015, SEC File No. 001-32567). |
10.24(a) | | | | |
10.24(b) | | | | |
10.2510.14 | | * | | |
10.26 | | * | | |
10.2710.15 | | * | | |
10.2810.16 | | * | | |
10.2910.17 | | * | | |
10.3010.18 | | * | | |
| 10.19 | | * | | |
| 10.20 | | | | Pipelines, Storage and Throughput Facilities Agreement (Big Spring Refinery Logistics Assets and Duncan Terminal), dated March 20, 2018 and effective as of March 1, 2018, by and among Alon USA, LP, DKL Big Spring, LLC, for the limited purposes specified therein, Delek US, and for the limited purposes specified therein, J. Aron & Company LLC (incorporated by reference to Exhibit 10.1 to Delek'sthe Company's Form 8-K filed on March 26, 2018).
|
10.3110.21 | | | | Big Spring Asphalt Services Agreement, dated March 20, 2018 and effective as of March 1, 2018, by and among Alon USA, LP, DKL Big Spring, LLC, for the limited purposes specified therein, Delek US, and for the limited purposes specified therein, J. Aron & Company LLC (incorporated by reference to Exhibit 10.2 to Delek'sthe Company's Form 8-K filed on March 26, 2018).
|
10.3210.22 | | | | Marketing Agreement, dated as of March 20, 2018 and effective as of March 1, 2018, by and among Alon USA, LP, DKL Big Spring, LLC, and for the limited purposes specified therein, Delek US (incorporated by reference to Exhibit 10.3 to Delek'sthe Company's Form 8-K filed on March 26, 2018). |
Financial Statements and Schedules
|
| | | | |
| 10.23 | | | | Amendment and Restatement of Schedules to Third Amended and Restated Omnibus Agreement, dated March 20, 2018 and effective as of March 1, 2018, by and among Delek US Energy, Inc. (f/k/a Delek US Holdings, Inc.), Delek Refining, Ltd., Lion Oil Company, Delek Logistics Partners, LP, Paline Pipeline Company, LLC, SALA Gathering Systems, LLC, Magnolia Pipeline Company, LLC, El Dorado Pipeline Company, LLC, Delek Crude Logistics, LLC, Delek Marketing-Big Sandy, LLC, Delek Marketing & Supply, LP, DKL Transportation, LLC, Delek Logistics Operating, LLC, Delek US Holdings, Inc. (f/k/a Delek Holdco, Inc.), Alon USA Partners, LP, Alon USA GP II, LLC, Alon USA Delaware, LLC,Alon USA Refining, LLC, Alon USA, LP, Alon Paramount Holdings, Inc., DKL Big Spring, LLC, and Delek Logistics GP, LLC (incorporated by reference to Exhibit 10.4 to Delek'sthe Company's Form 8-K filed on March 26, 2018).
|
10.3410.24(a) | | | | Term Loan Credit Agreement, dated as of March 30, 2018, by and among Delek US Holdings, Inc., as borrower, the lenders from time to time party thereto, Wells Fargo Bank, National Association, as administrative agent for each member of the Lender Group, Wells Fargo Securities, LLC, Barclays Bank PLC, SunTrust Robinson Humphrey, Inc., and Regions Capital Markets, a division of Regions Bank, each as a joint lead arranger and joint bookrunner, and The Bank of Tokyo-Mitsubishi, Ltd., Credit Suisse Securities (USA) LLC, PNC Capital Markets LLC and Fifth Third Bank, each as a co-manager (incorporated by reference to Exhibit 10.1 to Delek'sthe Company's Form 8-K filed on April 5, 2018). |
| 10.24(b) | | | |
|
10.3510.24(d) | | | | Second Incremental Amendment to Term Loan Credit Agreement, dated as of November 12, 2019, by and among Delek US Holdings, Inc., as borrower, the guarantors party thereto, the lenders party thereto, and Wells Fargo Bank, National Association, as administrative agent (incorporated by reference to Exhibit 10.1 to the Company's Form 8-K filed on November 15, 2019). |
| 10.24(c) | | | | |
| 10.24(d) | | | | Second Incremental Amendment to Term Loan Credit Agreement, dated as of November 12, 2019, by and among Delek US Holdings, Inc., as borrower, the guarantors party thereto, the lenders party thereto, and Wells Fargo Bank, National Association, as administrative agent (incorporated by reference to Exhibit 10.1 to the Company’s Form 8-K filed on November 15, 2019). |
| 10.25 | | | | Second Amended and Restated Credit Agreement, dated as of March 30, 2018, by and among Delek US Holdings, Inc., as borrower, the lenders from time to time party thereto, Wells Fargo Bank, National Association, as administrative agent for each member of the Lender Group and the Bank Product Providers, the Subsidiaries of Delek US Holdings, Inc. from time to time party thereto, as guarantors, Wells Fargo, Barclays Bank PLC, Regions Capital Markets, a division of Regions Bank, and SunTrust Robinson Humphrey, Inc., each as a joint lead arranger and joint book runner, Barclays Bank PLC, Regions Bank, and SunTrust Bank, each as a co-syndication agent, and Fifth Third Bank, The Bank of Tokyo-Mitsubishi UFJ, Ltd., PNC Bank, National Association, and Credit Suisse AG, Cayman Islands Branch, each as a co-documentation agent (incorporated by reference to Exhibit 10.2 to Delek'sthe Company's Form 8-K filed on April 5, 2018).
|
|
| | | | |
10.3610.26 | | | | First Amendment to theSecond Amended and Restated Credit Agreement, dated as of May 14, 2018, by and among Delek US Holdings, Inc. 2016 Long-Term Incentive Plan, effective May, as borrower, Wells Fargo Bank, National Association, as administrative agent for each member of the Lender Group and the Bank Product Providers and the lenders from time to time party thereto (incorporated by reference to Exhibit 10.1 to the Company’s Quarterly Report on Form 10-Q filed on November 8, 2019). |
| 10.27 | | | | Second Amendment to Second Amended and Restated Credit Agreement, dated as of July 13, 2018, by and among Delek US Holdings, Inc., as borrower, Wells Fargo Bank, National Association, as administrative agent for each member of the Lender Group and the Bank Product Providers and the lenders from time to time party thereto (incorporated by reference to Exhibit 10.2 to the Company's Registration StatementCompany’s Quarterly Report on Form S-810-Q filed on May 31, 2018)November 8, 2019).
|
10.3710.28 | | | | Executive EmploymentThird Amended and Restated Limited Liability Company Agreement effective May 21, 2018,of Wink to Webster Pipeline LLC, a Delaware limited liability company, dated as of July 30, 2019, by and betweenamong Delek US Energy, Inc., ExxonMobil Permian Logistics LLC, Plains Pipeline, L.P., MPLX W2W Pipeline Holdings, Inc.LLC, Centurion Permian Logistics, LLC, and Regina Bynote JonesRattler Midstream Operating LLC (incorporated by reference to Exhibit 10.1 to Delek's Fromthe Company's Form 8-K filed on May 25, 2018)August 5, 2019).
|
10.3810.29 | | * +# | | |
| 10.30 | | # | | |
| 10.31 | | # | | |
| 10.32 | | # | | |
| 21.1 | | +# | | |
| 23.1 | | +# | | |
| 31.1 | | # | | |
| 31.2 | | # | | |
| 32.1 | | ## | | |
Financial Statements and Schedules
|
| | | | |
| 32.2 | | ## | | |
| 101 | | | | The following materials from Delek US Holdings, Inc.’s Annual Report on Form 10-K for the annual period ended December 31, 2018,2019, formatted in XBRL (eXtensibleiXBRL (Inline eXtensible Business Reporting Language): (i) Consolidated Balance Sheets as of December 31, 20182019 and 2017,2018, (ii) Consolidated Statements of Income for the years ended December 31, 2019, 2018 2017 and 2016,2017, (iii) Consolidated Statements of Comprehensive Income for the years ended December 31, 2019, 2018 2017 and 2016,2017, (iv) Consolidated Statements of Changes in Stockholders’ Equity for the years ended December 31, 2019, 2018 2017 and 2016,2017, (v) Consolidated Statements of Cash Flows for the years ended December 31, 2019, 2018 2017 and 20162017 and (vi) Notes to Consolidated Financial Statements. |
| 104 | | | | Cover Page Interactive Data File formatted in iXBRL (Inline eXtensible Business Reporting Language) and contained in Exhibit 101. |
| |
| * | Management contract or compensatory plan or arrangement. |
| |
| < | Certain schedules have been omitted pursuant to Item 601(b)(2) of Regulation S-K. The Company agrees to supplementally furnish a copy of any of the omitted schedules to the United States Securities and Exchange Commission upon request. |
| |
| ++ | Confidential treatment has been requested and granted with respect to certain portions of this exhibit pursuant to Rule 24b-2 of the Securities Exchange Act of 1934, as amended. Omitted portions have been filed separately with the United States Securities and Exchange Commission. |
~ Confidential treatment has been requested with respect to certain portions of this exhibit pursuant to Rule 24b-2 of the Securities Exchange Act of 1934, as amended. Omitted portions have been filed separately with the United States Securities and Exchange Commission.
| |
+~ | Filed with the Company's Annual Report on Form 10-K for the year ended December 31, 2018 filed with the United States SecuritiesCertain confidential information contained in these exhibits has been omitted because it (i) is not material and Exchange Commission on March 1, 2019.(ii) would be competitively harmful if publicly disclosed. |
Financial Statements and Schedules
Delek US Holdings, Inc.
Consolidated Financial Statements
As of December 31, 20182019 and 20172018 and
For Each of the Three Years Ended December 31, 2019, 2018 2017 and 20162017
INDEX TO FINANCIAL STATEMENTS
|
| |
| |
| Audited Financial Statements: | |
| |
| |
| |
| |
| |
| |
Financial Statements and Schedules
Report of Independent Registered Public Accounting Firm
TheTo the Stockholders and the Board of Directors and Stockholders of
Delek US Holdings, Inc.
Opinion on the Financial Statements
We have audited the accompanying consolidated balance sheets of Delek US Holdings, Inc. (the Company) as of December 31, 20182019 and 2017,2018, and the related consolidated statements of income, comprehensive income, changes in stockholders' equity, and cash flows for each of the three years in the period ended December 31, 2018,2019, and the related notes (collectively referred to as the “financial“consolidated financial statements”). In our opinion, the consolidated financial statements referred to above present fairly, in all material respects, the consolidated financial position of the Company at December 31, 2019 and 2018, and 2017, and the consolidated results of its operations and its cash flows for each of the three years in the period ended December 31, 2018,2019, in conformity with U.S. generally accepted accounting principles.
We also have audited, in accordance with the standards of the Public Company Accounting Oversight Board (United States) (PCAOB), Delek US Holdings, Inc.’sthe Company’s internal control over financial reporting as of December 31, 2018,2019, based on criteria established in Internal Control-Integrated Framework issued by the Committee of Sponsoring Organizations of the Treadway Commission (2013 framework) and our report dated March 1, 2019February 27, 2020 expressed an unqualified opinion thereon.
Basis for Opinion
These financial statements are the responsibility of the Company's management. Our responsibility is to express an opinion on thesethe Company’s financial statements based on our audits. We are a public accounting firm registered with the PCAOB and are required to be independent with respect to the Company in accordance with the U.S. federal securities laws and the applicable rules and regulations of the Securities and Exchange Commission and the PCAOB.
We conducted our audits in accordance with the standards of the PCAOB. Those standards require that we plan and perform the audit to obtain reasonable assurance about whether the financial statements are free of material misstatement, whether due to error or fraud. Our audits included performing procedures to assess the risks of material misstatement of the financial statements, whether due to error or fraud, and performing procedures that respond to those risks. Such procedures included examining, on a test basis, evidence regarding the amounts and disclosures in the financial statements. Our audits also included evaluating the accounting principles used and significant estimates made by management, as well as evaluating the overall presentation of the financial statements. We believe that our audits provide a reasonable basis for our opinion.
Critical Audit Matters
The critical audit matters communicated below are matters arising from the current period audit of the financial statements that were communicated or required to be communicated to the audit committee and that: (1) relate to accounts or disclosures that are material to the financial statements and (2) involved our especially challenging, subjective or complex judgments. The communication of critical audit matters does not alter in any way our opinion on the consolidated financial statements, taken as a whole, and we are not, by communicating the critical audit matters below, providing separate opinions on the critical audit matters or on the accounts or disclosures to which they relate.
Financial Statements and Schedules
|
| | |
| | Goodwill Impairment Assessment |
| Description of the Matter | | At December 31, 2019, the Company’s goodwill was $855.7 million and represented approximately 12% of total assets, of which $801.3 million was associated with the refining segment. As discussed in Notes 2 and 18 of the consolidated financial statements, goodwill is tested for impairment at least annually at the reporting unit level, or more frequently if events or changes in circumstances indicate the goodwill might be impaired. The Company performs its annual goodwill impairment testing in the fourth quarter of each year.
Auditing management’s annual goodwill impairment test for the reporting units within the refining segment requires significant judgment, as the valuation includes subjective estimates and assumptions in estimating the fair value. In particular, the fair value estimates are sensitive to significant assumptions, such as forecasted gross margins and the weighted average cost of capital. |
| How We Addressed the Matter in Our Audit | | We obtained an understanding, evaluated the design, and tested the operating effectiveness of controls relating to the valuation of the Company’s goodwill. For example, we tested controls over management’s review of the discounted cash flow calculation, the prospective financial data, and the valuation assumptions.
To test the estimated fair value of the Company’s reporting units within the refining segment, our audit procedures included, among others, assessing the valuation methodology applied, performing recalculations, and testing the significant assumptions discussed above and the underlying data used by the Company. We compared the significant assumptions in the prospective financial data used by management to current industry and economic trends and historical performance. We performed sensitivity analyses of certain significant assumptions to evaluate the change in the fair value resulting from changes in the assumptions, as well as a hindsight analysis. In addition, we involved our valuation specialists to assist in evaluating the fair value methodology and testing the related assumptions that are most significant to the fair value estimates, as well as the market capitalization reconciliation. |
| | Environmental Liabilities |
| Description of the Matter | | As described in Notes 2 and 14 of the consolidated financial statements, the Company accrues environmental remediation costs when it is both probable that a liability has been incurred and the amount can be reasonably estimated. At December 31, 2019, the Company accrued a liability of $146.1 million, representing management’s best estimate of the expected costs related to environmental liabilities.
Auditing the Company’s environmental liabilities requires significant judgment due to the inherent complexity in estimating the likelihood, timing and amount of future costs. This required us to make highly subjective auditor judgments as estimates are based on management’s assessment of the extent of contamination, the selected remediation methodology and applicable environmental regulations. Such estimates require management to adjust its accruals as further information develops or circumstances change and includes significant judgment with respect to costs, time frame of remediation and monitoring activities, and extent of required remedial and clean-up activities. |
| How We Addressed the Matter in Our Audit | | We obtained an understanding, evaluated the design, and tested the operating effectiveness of controls over the Company’s environmental liability cost estimation and review process, including controls over management’s review of the significant assumptions relating to costs, time frame and extent of required remedial and clean-up activities.
To test the environmental liabilities, our audit procedures included, among others, evaluating the nature of contamination and the status of remediation including reviewing publicly available remediation data and through inquiries of the Company’s management. We utilized our environmental specialists to evaluate the reasonableness of management’s assessment of the extent of contamination, the selected remediation methodology and applicable environmental regulations. Our specialists also reviewed key assumptions used in the valuation of the environmental liabilities, including costs, time frame and extent of required remedial, clean-up and on-going monitoring activities in management’s analysis, including adjustments or lack thereof in the related cost estimates. |
/s/ Ernst & Young LLP
We have served as the Company’s auditor since 2002.
Nashville, Tennessee
March 1, 2019
Financial Statements and Schedules
Report of Independent Registered Public Accounting Firm
TheTo the Stockholders and the Board of Directors and Stockholders of
Delek US Holdings, Inc.
Opinion on Internal Control over Financial Reporting
We have audited Delek US Holdings, Inc.’s internal control over financial reporting as of December 31, 2018,2019, based on criteria established in Internal Control-Integrated Framework issued by the Committee of Sponsoring Organizations of the Treadway Commission (2013 framework) (the COSO criteria). In our opinion, Delek US Holdings, Inc. (the Company) maintained, in all material respects, effective internal control over financial reporting as of December 31, 2018,2019, based on the COSO criteria.
We also have audited, in accordance with the standards of the Public Company Accounting Oversight Board (United States) (PCAOB), the consolidated balance sheets of Delek US Holdings, Inc. as of December 31, 20182019 and 2017,2018, the related consolidated statements of income, comprehensive income, changes in stockholders' equity and cash flows for each of the three years in the period ended December 31, 2018,2019, and the related notes, of the Company, and our report dated March 1, 2019February 27, 2020 expressed an unqualified opinion thereon.
Basis for Opinion
The Company’s management is responsible for maintaining effective internal control over financial reporting and for its assessment of the effectiveness of internal control over financial reporting included in the accompanying Management’s Annual Report on Internal Control over Financial Reporting. Our responsibility is to express an opinion on the Company’s internal control over financial reporting based on our audit. We are a public accounting firm registered with the PCAOB and are required to be independent with respect to the Company in accordance with the U.S. federal securities laws and the applicable rules and regulations of the Securities and Exchange Commission and the PCAOB.
We conducted our audit in accordance with the standards of the PCAOB. Those standards require that we plan and perform the audit to obtain reasonable assurance about whether effective internal control over financial reporting was maintained in all material respects.
Our audit included obtaining an understanding of internal control over financial reporting, assessing the risk that a material weakness exists, testing and evaluating the design and operating effectiveness of internal control based on the assessed risk, and performing such other procedures as we considered necessary in the circumstances. We believe that our audit provides a reasonable basis for our opinion.
Definition and Limitations of Internal Control Over Financial Reporting
A company’s internal control over financial reporting is a process designed to provide reasonable assurance regarding the reliability of financial reporting and the preparation of financial statements for external purposes in accordance with generally accepted accounting principles. A company’s internal control over financial reporting includes those policies and procedures that (1) pertain to the maintenance of records that, in reasonable detail, accurately and fairly reflect the transactions and dispositions of the assets of the company; (2) provide reasonable assurance that transactions are recorded as necessary to permit preparation of financial statements in accordance with generally accepted accounting principles, and that receipts and expenditures of the company are being made only in accordance with authorizations of management and directors of the company; and (3) provide reasonable assurance regarding prevention or timely detection of unauthorized acquisition, use, or disposition of the company’s assets that could have a material effect on the financial statements.
Because of its inherent limitations, internal control over financial reporting may not prevent or detect misstatements. Also, projections of any evaluation of effectiveness to future periods are subject to the risk that controls may become inadequate because of changes in conditions, or that the degree of compliance with the policies or procedures may deteriorate.
/s/ Ernst & Young LLP
Nashville, Tennessee
March 1, 2019February 27, 2020
Financial Statements and Schedules
Delek US Holdings, Inc.
Consolidated Balance Sheets
(In millions, except share and per share data)
| | | | | December 31, | | December 31, |
| | | 2018 | | 2017 | | 2019 | | 2018 |
| ASSETS | | | | | | | | |
| Current assets: | | | | | | | | |
| Cash and cash equivalents | | $ | 1,079.3 |
| | $ | 931.8 |
| | $ | 955.3 |
| | $ | 1,079.3 |
|
| Accounts receivable, net | | 514.4 |
| | 579.6 |
| | 792.6 |
| | 514.4 |
|
| Accounts receivable from related parties | | — |
| | 2.1 |
| |
| Inventories, net of inventory valuation reserves | | 690.9 |
| | 808.4 |
| | 946.7 |
| | 677.9 |
|
| Assets held for sale | | — |
| | 160.0 |
| |
| Other current assets | | 135.7 |
| | 129.9 |
| | 268.7 |
| | 148.7 |
|
| Total current assets | | 2,420.3 |
| | 2,611.8 |
| | 2,963.3 |
| | 2,420.3 |
|
| Property, plant and equipment: | | | | | | | | |
| Property, plant and equipment | | 2,999.6 |
| | 2,772.5 |
| | 3,362.8 |
| | 2,999.6 |
|
| Less: accumulated depreciation | | (804.7 | ) | | (631.7 | ) | | (934.5 | ) | | (804.7 | ) |
| Property, plant and equipment, net | | 2,194.9 |
| | 2,140.8 |
| | 2,428.3 |
| | 2,194.9 |
|
| Operating lease right-of-use assets | | | 183.6 |
| | — |
|
| Goodwill | | 857.8 |
| | 816.6 |
| | 855.7 |
| | 857.8 |
|
| Other intangibles, net | | 104.4 |
| | 101.1 |
| | 110.3 |
| | 104.4 |
|
| Equity method investments | | 130.3 |
| | 138.1 |
| | 407.3 |
| | 130.3 |
|
| Other non-current assets | | 52.9 |
| | 126.8 |
| | 67.8 |
| | 52.9 |
|
| Total assets | | $ | 5,760.6 |
| | $ | 5,935.2 |
| | $ | 7,016.3 |
| | $ | 5,760.6 |
|
| LIABILITIES AND STOCKHOLDERS’ EQUITY | | | | | | | | |
| Current liabilities: | | | | | | | | |
| Accounts payable | | 1,009.7 |
| | $ | 973.4 |
| | $ | 1,599.7 |
| | $ | 1,011.2 |
|
| Accounts payable to related parties | | 1.5 |
| | 1.7 |
| |
| Current portion of long-term debt | | 32.0 |
| | 590.2 |
| | 36.4 |
| | 32.0 |
|
| Obligation under Supply and Offtake Agreements | | 312.6 |
| | 435.6 |
| | 332.5 |
| | 312.6 |
|
| Liabilities associated with assets held for sale | | — |
| | 105.9 |
| |
| Current portion of operating lease liabilities | | | 40.5 |
| | — |
|
| Accrued expenses and other current liabilities | | 307.7 |
| | 564.9 |
| | 346.8 |
| | 307.7 |
|
| Total current liabilities | | 1,663.5 |
| | 2,671.7 |
| | 2,355.9 |
| | 1,663.5 |
|
| Non-current liabilities: | | | | | | | | |
| Long-term debt, net of current portion | | 1,751.3 |
| | 875.4 |
| | 2,030.7 |
| | 1,751.3 |
|
| Obligation under Supply and Offtake Agreements | | 49.6 |
| | — |
| | 144.8 |
| | 49.6 |
|
| Environmental liabilities, net of current portion | | 139.5 |
| | 68.9 |
| | 137.9 |
| | 139.5 |
|
| Asset retirement obligations | | 75.5 |
| | 72.1 |
| | 68.6 |
| | 75.5 |
|
| Deferred tax liabilities | | 210.2 |
| | 199.9 |
| | 267.9 |
| | 210.2 |
|
| Operating lease liabilities, net of current portion | | | 144.3 |
| | — |
|
| Other non-current liabilities | | 62.9 |
| | 83.0 |
| | 30.9 |
| | 62.9 |
|
| Total non-current liabilities | | 2,289.0 |
| | 1,299.3 |
| | 2,825.1 |
| | 2,289.0 |
|
| Stockholders’ equity: | | | | | | | | |
| Preferred stock, $0.01 par value, 10,000,000 shares authorized, no shares issued and outstanding | | — |
| | — |
| | — |
| | — |
|
| Common stock, $0.01 par value, 110,000,000 shares authorized, 90,478,075 shares and 81,533,548 shares issued at December 31, 2018 and 2017, respectively | | 0.9 |
| | 0.8 |
| |
| Common stock, $0.01 par value, 110,000,000 shares authorized, 90,987,025 shares and 90,478,075 shares issued at December 31, 2019 and December 31, 2018, respectively | | | 0.9 |
| | 0.9 |
|
| Additional paid-in capital | | 1,135.4 |
| | 900.1 |
| | 1,151.9 |
| | 1,135.4 |
|
| Accumulated other comprehensive income | | 28.6 |
| | 6.9 |
| | 0.1 |
| | 28.6 |
|
| Treasury stock, 12,477,780 shares and 762,623 shares, at cost, as of December 31, 2018 and 2017, respectively | | (514.1 | ) | | (25.0 | ) | |
| Treasury stock, 17,516, 814 shares and 12,477,780 shares, at cost, as of December 31, 2019 and December 31, 2018, respectively | | | (692.2 | ) | | (514.1 | ) |
| Retained earnings | | 981.8 |
| | 767.8 |
| | 1,205.6 |
| | 981.8 |
|
| Non-controlling interests in subsidiaries | | 175.5 |
| | 313.6 |
| | 169.0 |
| | 175.5 |
|
| Total stockholders’ equity | | 1,808.1 |
| | 1,964.2 |
| | 1,835.3 |
| | 1,808.1 |
|
| Total liabilities and stockholders’ equity | | $ | 5,760.6 |
| | $ | 5,935.2 |
| | $ | 7,016.3 |
| | $ | 5,760.6 |
|
See accompanying notes to the consolidated financial statements
Financial Statements and Schedules
Delek US Holdings, Inc.
Consolidated Statements of Income
(In millions, except share and per share data)
| | | | | Year Ended December 31, | | Year Ended December 31, |
| | | 2018 | | 2017 | | 2016 | | 2019 | | 2018 | | 2017 |
| Net revenues | | $ | 10,233.1 |
| | $ | 7,267.1 |
| | $ | 4,197.9 |
| | $ | 9,298.2 |
| | $ | 10,233.1 |
| | $ | 7,267.1 |
|
| Cost of sales: | | | | | | | | | | | | |
| Cost of materials and other | | 8,560.5 |
| | 6,327.6 |
| | 3,812.9 |
| | 7,657.2 |
| | 8,560.5 |
| | 6,327.6 |
|
| Operating expenses (excluding depreciation and amortization presented below) | | 538.5 |
| | 375.7 |
| | 247.0 |
| | 580.2 |
| | 538.5 |
| | 375.7 |
|
| Depreciation and amortization | | 161.3 |
| | 132.1 |
| | 106.2 |
| | 170.7 |
| | 161.3 |
| | 132.1 |
|
| Total cost of sales | | 9,260.3 |
| | 6,835.4 |
| | 4,166.1 |
| | 8,408.1 |
| | 9,260.3 |
| | 6,835.4 |
|
| Insurance proceeds — business interruption | | — |
| | — |
| | (42.4 | ) | |
| Operating expenses related to retail and wholesale business (excluding depreciation and amortization presented below) | | 106.5 |
| | 53.3 |
| | 2.3 |
| | 102.0 |
| | 106.5 |
| | 53.3 |
|
| General and administrative expenses | | 247.6 |
| | 175.9 |
| | 106.1 |
| | 274.7 |
| | 247.6 |
| | 175.9 |
|
| Depreciation and amortization | | 38.1 |
| | 21.2 |
| | 10.2 |
| | 23.6 |
| | 38.1 |
| | 21.2 |
|
| Other operating (income) expense, net | | (31.3 | ) | | 1.0 |
| | 4.8 |
| | (2.5 | ) | | (31.3 | ) | | 1.0 |
|
| Total operating costs and expenses | | 9,621.2 |
| | 7,086.8 |
| | 4,247.1 |
| | 8,805.9 |
| | 9,621.2 |
| | 7,086.8 |
|
| Operating income (loss) | | 611.9 |
| | 180.3 |
| | (49.2 | ) | |
| Operating income | | | 492.3 |
| | 611.9 |
| | 180.3 |
|
| Interest expense | | 125.9 |
| | 93.8 |
| | 54.4 |
| | 131.1 |
| | 125.9 |
| | 93.8 |
|
| Interest income | | (5.8 | ) | | (4.0 | ) | | (1.5 | ) | | (11.3 | ) | | (5.8 | ) | | (4.0 | ) |
| (Income) loss from equity method investments | | (9.7 | ) | | (12.6 | ) | | 43.4 |
| |
| Loss on impairment of equity method investment | | — |
| | — |
| | 245.3 |
| |
| Income from equity method investments | | | (34.3 | ) | | (9.7 | ) | | (12.6 | ) |
| Gain on remeasurement of equity method investment | | — |
| | (190.1 | ) | | — |
| | — |
| | — |
| | (190.1 | ) |
| Gain on sale of business | | (13.3 | ) | | — |
| | — |
| | — |
| | (13.3 | ) | | — |
|
| Impairment loss on assets held for sale | | 27.5 |
| | — |
| | — |
| | — |
| | 27.5 |
| | — |
|
| Loss on extinguishment of debt | | 9.1 |
| | — |
| | — |
| | — |
| | 9.1 |
| | — |
|
| Other (income) expense, net | | (7.3 | ) | | (6.1 | ) | | 0.4 |
| |
| Other expense (income), net | | | 4.1 |
| | (7.3 | ) | | (6.1 | ) |
| Total non-operating expenses (income), net | | 126.4 |
| | (119.0 | ) | | 342.0 |
| | 89.6 |
| | 126.4 |
| | (119.0 | ) |
| Income (loss) from continuing operations before income tax expense (benefit) | | 485.5 |
| | 299.3 |
| | (391.2 | ) | |
| Income from continuing operations before income tax expense | | | 402.7 |
| | 485.5 |
| | 299.3 |
|
| Income tax expense (benefit) | | 101.9 |
| | (29.2 | ) | | (171.5 | ) | | 71.7 |
| | 101.9 |
| | (29.2 | ) |
| Income (loss) from continuing operations, net of tax | | 383.6 |
| | 328.5 |
| | (219.7 | ) | |
| Income from continuing operations, net of tax | | | 331.0 |
| | 383.6 |
| | 328.5 |
|
| Discontinued operations: | | | | | | | | | | | | |
| (Loss) income from discontinued operations, including gain (loss) on sale of discontinued operations | | (10.9 | ) | | (8.6 | ) | | 144.2 |
| |
| Income tax (benefit) expense | | (2.2 | ) | | (2.7 | ) | | 57.9 |
| |
| (Loss) income from discontinued operations, net of tax | | (8.7 | ) | | (5.9 | ) | | 86.3 |
| |
| Net income (loss) | | 374.9 |
| | 322.6 |
| | (133.4 | ) | |
| Income (loss) from discontinued operations, including gain (loss) on sale of discontinued operations | | | 6.6 |
| | (10.9 | ) | | (8.6 | ) |
| Income tax expense (benefit) | | | 1.4 |
| | (2.2 | ) | | (2.7 | ) |
| Income (loss) from discontinued operations, net of tax | | | 5.2 |
| | (8.7 | ) | | (5.9 | ) |
| Net income | | | 336.2 |
| | 374.9 |
| | 322.6 |
|
| Net income attributed to non-controlling interests | | 34.8 |
| | 33.8 |
| | 20.3 |
| | 25.6 |
| | 34.8 |
| | 33.8 |
|
| Net income (loss) attributable to Delek | | $ | 340.1 |
| | $ | 288.8 |
| | $ | (153.7 | ) | |
| Net income attributable to Delek | | | $ | 310.6 |
| | $ | 340.1 |
| | $ | 288.8 |
|
| Basic income (loss) per share: | | | | | | | | | | | | |
| Income (loss) from continuing operations | | $ | 4.31 |
| | $ | 4.12 |
| | $ | (3.88 | ) | |
| (Loss) income from discontinued operations | | (0.20 | ) | | (0.08 | ) | | 1.39 |
| |
| Total basic income (loss) per share | | $ | 4.11 |
| | $ | 4.04 |
| | $ | (2.49 | ) | |
| Diluted income per share: | | | | | | | |
| Income (loss) from continuing operations | | $ | 4.14 |
| | $ | 4.08 |
| | $ | (3.88 | ) | |
| (Loss) income from discontinued operations | | (0.19 | ) | | (0.08 | ) | | 1.39 |
| |
| Total diluted income (loss) per share | | $ | 3.95 |
| | $ | 4.00 |
| | $ | (2.49 | ) | |
| Income from continuing operations | | | $ | 4.03 |
| | $ | 4.31 |
| | $ | 4.12 |
|
| Income (loss) from discontinued operations | | | 0.07 |
| | (0.20 | ) | | (0.08 | ) |
| Total basic income per share | | | $ | 4.10 |
| | $ | 4.11 |
| | $ | 4.04 |
|
| Diluted income (loss) per share: | | | | | | | |
| Income from continuing operations | | | $ | 3.99 |
| | $ | 4.14 |
| | $ | 4.08 |
|
| Income (loss) from discontinued operations | | | 0.07 |
| | (0.19 | ) | | (0.08 | ) |
| Total diluted income per share | | | $ | 4.06 |
| | $ | 3.95 |
| | $ | 4.00 |
|
| Weighted average common shares outstanding: | | | | | | | | | | | | |
| Basic | | 82,797,110 |
| | 71,566,225 |
| | 61,921,787 |
| | 75,853,187 |
| | 82,797,110 |
| | 71,566,225 |
|
| Diluted | | 86,768,401 |
| | 72,303,083 |
| | 61,921,787 |
| | 76,574,091 |
| | 86,768,401 |
| | 72,303,083 |
|
| Dividends declared per common share outstanding | | $ | 0.96 |
| | $ | 0.60 |
| | $ | 0.60 |
| | $ | 1.14 |
| | $ | 0.96 |
| | $ | 0.60 |
|
See accompanying notes to the consolidated financial statements
Financial Statements and Schedules
Delek US Holdings, Inc.
Consolidated Statements of Comprehensive Income
(In millions)
|
| | | | | | | | | | | | |
| | | Year Ended December 31, |
| | | 2018 | | 2017 | | 2016 |
| Net income (loss) attributable to Delek | | $ | 340.1 |
| | $ | 288.8 |
| | $ | (153.7 | ) |
| Other comprehensive income (loss): | | | | | | |
| Commodity contracts designated as cash flow hedges: | | | | | | |
| Unrealized gains (losses), net of ineffectiveness losses (gains) of $0.9 million, $(0.5) million and $(3.1) million for the years ended December 31, 2018, 2017 and 2016, respectively | | 31.4 |
| | (2.0 | ) | | 8.4 |
|
| Realized losses reclassified to cost of materials and other | | 1.7 |
| | 38.6 |
| | 27.8 |
|
| Net gains related to commodity cash flow hedges | | 33.1 |
| | 36.6 |
| | 36.2 |
|
| Income tax expense | | (6.9 | ) | | (12.8 | ) | | (12.7 | ) |
| Net comprehensive income on commodity contracts designated as cash flow hedges | | 26.2 |
| | 23.8 |
| | 23.5 |
|
| | | | | | | |
| Interest rate contracts designated as cash flow hedges: | | | | | | |
| Unrealized (losses) gains | | (1.3 | ) | | 0.3 |
| | — |
|
| Realized losses reclassified to interest expense | | 0.7 |
| | 0.3 |
| | — |
|
| Net (losses) gains related to interest rate cash flow hedges | | (0.6 | ) | | 0.6 |
| | — |
|
| Income tax (expense) benefit | | 0.1 |
| | (0.2 | ) | | — |
|
| Net comprehensive (loss) income on interest rate contracts designated as cash flow hedges | | (0.5 | ) | | 0.4 |
| | — |
|
| | | | | | | |
| Foreign currency translation (loss) gain (net of taxes) | | (0.9 | ) | | 0.1 |
| | 0.2 |
|
| | | | | | | |
| Other comprehensive income from equity method investments, net of tax expense of $0.0 million and $2.2 million for the years ended December 31, 2018 and 2017, respectively | | — |
| | 4.1 |
| | 0.8 |
|
| | | | | | | |
| Postretirement benefit plans: | | | | | | |
| Unrealized gain (loss) arising during the year related to: | | | | | | |
| Net actuarial loss | | (6.5 | ) | | (0.8 | ) | | — |
|
| Curtailment and settlement gains | | 2.5 |
| | 6.3 |
| | — |
|
| (Gain) loss reclassified to earnings: | | | | | | |
| Recognized due to curtailment and settlement | | (2.5 | ) | | (6.1 | ) | | — |
|
| Amortization of net actuarial loss | | 0.5 |
| | — |
| | — |
|
| Loss related to postretirement benefit plans, net | | (6.0 | ) | | (0.6 | ) | | — |
|
| Income tax benefit | | 1.3 |
| | — |
| | — |
|
| Net comprehensive loss on postretirement benefit plans | | (4.7 | ) | | (0.6 | ) | | — |
|
| Total other comprehensive income | | 20.1 |
| | 27.8 |
| | 24.5 |
|
| Comprehensive income (loss) attributable to Delek | | $ | 360.2 |
| | $ | 316.6 |
| | $ | (129.2 | ) |
|
| | | | | | | | | | | | |
| | | Year Ended December 31, |
| | | 2019 | | 2018 | | 2017 |
| Net income | | $ | 336.2 |
| | $ | 374.9 |
| | $ | 322.6 |
|
| Other comprehensive income (loss): | | | | | | |
| Commodity contracts designated as cash flow hedges: | | | | | | |
| Net (losses) gains related to commodity cash flow hedges | | (43.4 | ) | | 33.1 |
| | 36.6 |
|
| Income tax (benefit) expense | | (9.5 | ) | | 6.9 |
| | 12.8 |
|
| Net comprehensive (loss) income on commodity contracts designated as cash flow hedges | | (33.9 | ) | | 26.2 |
| | 23.8 |
|
| (Loss) Gain on interest rate contracts designated as cash flow hedges, net of taxes | | — |
| | (0.5 | ) | | 0.4 |
|
| Foreign currency translation gain (loss), net of taxes | | 0.3 |
| | (0.9 | ) | | 0.1 |
|
| Other comprehensive income from equity method investments, net of tax expense of $0.0 million, $0.0 million and $2.2 million for the years ended December 31, 2019, 2018 and 2017, respectively | | — |
| | — |
| | 4.1 |
|
| Postretirement benefit plans: | | | | | | |
| Unrealized gain (loss) arising during the year related to: | | | | | | |
| Net actuarial gain (loss) | | 5.8 |
| | (6.5 | ) | | (0.8 | ) |
| Curtailment and settlement gains | | 2.7 |
| | 2.5 |
| | 6.3 |
|
| Reclassified to other expense (income), net: | | | | | | |
| Gain recognized due to curtailment and settlement | | (2.7 | ) | | (2.5 | ) | | (6.1 | ) |
| Amortization of net actuarial loss | | 0.7 |
| | 0.5 |
| | — |
|
| Gain (loss) related to postretirement benefit plans, net | | 6.5 |
| | (6.0 | ) | | (0.6 | ) |
| Income tax expense (benefit) | | 1.4 |
| | (1.3 | ) | | — |
|
| Net comprehensive gain (loss) on postretirement benefit plans | | 5.1 |
| | (4.7 | ) | | (0.6 | ) |
| Total other comprehensive (loss) income | | (28.5 | ) | | 20.1 |
| | 27.8 |
|
| Comprehensive income | | $ | 307.7 |
| | $ | 395.0 |
| | $ | 350.4 |
|
| Comprehensive income attributable to non-controlling interest | | 25.6 |
| | 34.8 |
| | 33.8 |
|
| Comprehensive Income attributable to Delek | | $ | 282.1 |
| | $ | 360.2 |
| | $ | 316.6 |
|
See accompanying notes to the consolidated financial statements
Financial Statements and Schedules
Delek US Holdings, Inc.
Consolidated Statements of Changes in Stockholders' Equity
(In millions, except share and per share data)
|
| | | | | | | | | | | | | | | | | | | | | | | | | | | | | | | | | | |
| | | Common Stock | | Additional Paid-in Capital | | Accumulated Other Comprehensive Income | | Retained Earnings | | Treasury Stock | | Non-Controlling Interest in Subsidiaries | | Total Stockholders' Equity |
| | | Shares | | Amount | | | | | Shares | | Amount | | |
| Balance at | December 31, 2015 | 66,946,721 |
| | $ | 0.7 |
| | $ | 639.2 |
| | $ | (45.3 | ) | | $ | 713.5 |
| | (4,809,701 | ) | | $ | (154.8 | ) | | $ | 200.6 |
| | $ | 1,353.9 |
|
| Net (loss) income | — |
| | — |
| | — |
| | — |
| | (153.7 | ) | | — |
| | — |
| | 20.3 |
| | (133.4 | ) |
| Other comprehensive income related to commodity contracts | — |
| | — |
| | — |
| | 23.5 |
| | — |
| | — |
| | — |
| | — |
| | 23.5 |
|
| Other comprehensive income from equity method investments |
| |
| |
| | 0.8 |
| | | | | | | | | | 0.8 |
|
| Foreign currency translation gain | — |
| | — |
| | — |
| | 0.2 |
| | — |
| | — |
| | — |
| | — |
| | 0.2 |
|
| Common stock dividends ($0.60 per share) | — |
| | — |
| | — |
| | — |
| | (37.5 | ) | | — |
| | — |
| | — |
| | (37.5 | ) |
| Equity-based compensation expense | — |
| | — |
| | 15.7 |
| | — |
| | — |
| | — |
| | — |
| | 0.7 |
| | 16.4 |
|
| Distribution to non-controlling interest | — |
| | — |
| | — |
| | — |
| | — |
| | — |
| | — |
| | (24.1 | ) | | (24.1 | ) |
| Repurchase of common stock | — |
| | — |
| | — |
| | — |
|
| — |
| | (386,090 | ) | | (6.0 | ) | | — |
| | (6.0 | ) |
| Repurchase of non-controlling interest | — |
| | — |
| | — |
| | — |
| | — |
| | — |
| | — |
| | (6.9 | ) | | (6.9 | ) |
| Income tax benefit from equity-based compensation expense | — |
| | — |
| | (2.9 | ) | | — |
| | — |
| | — |
| | — |
| | — |
| | (2.9 | ) |
| Taxes paid due to the net settlement of equity-based compensation | — |
| | — |
| | (1.5 | ) | | — |
| | — |
| | — |
| | — |
| | — |
| | (1.5 | ) |
| Exercise of equity-based awards | 203,631 |
| | — |
| | — |
| | — |
| | — |
| | — |
| | — |
| | — |
| | — |
|
| Balance at | December 31, 2016 | 67,150,352 |
| | $ | 0.7 |
| | $ | 650.5 |
| | $ | (20.8 | ) | | $ | 522.3 |
| | (5,195,791 | ) | | $ | (160.8 | ) | | $ | 190.6 |
| | $ | 1,182.5 |
|
Delek US Holdings, Inc.
Consolidated Statements of Changes in Stockholders' Equity (Continued)
(In millions, except share and per share data)
| | | | | Common Stock | | Additional Paid-in Capital | | Accumulated Other Comprehensive Income | | Retained Earnings | | Treasury Stock | | Non-Controlling Interest in Subsidiaries | | Total Stockholders' Equity | | Common Stock | | Additional Paid-in Capital | | Accumulated Other Comprehensive Income | | Retained Earnings | | Treasury Shares | | Non-Controlling Interest in Subsidiaries | | Total Stockholders' Equity |
| | | Shares | | Amount | | Shares | | Amount | | | Shares | | Amount | | Shares | | Amount | |
| Balance at | December 31, 2016 | 67,150,352 |
| | $ | 0.7 |
| | $ | 650.5 |
| | $ | (20.8 | ) | | $ | 522.3 |
| | (5,195,791 | ) | | $ | (160.8 | ) | | $ | 190.6 |
| | $ | 1,182.5 |
| December 31, 2016 | 67,150,352 |
| | $ | 0.7 |
| | $ | 650.5 |
| | $ | (20.8 | ) | | $ | 522.3 |
| | (5,195,791 | ) | | $ | (160.8 | ) | | $ | 190.6 |
| | $ | 1,182.5 |
|
| Net income | Net income | — |
| | — |
| | — |
| | — |
| | 288.8 |
| | — |
| | — |
| | 33.8 |
| | 322.6 |
| Net income | — |
| | — |
| | — |
| | — |
| | 288.8 |
| | — |
| | — |
| | 33.8 |
| | 322.6 |
|
| Other comprehensive income related to commodity contracts | Other comprehensive income related to commodity contracts | — |
| | — |
| | — |
| | 23.8 |
| | — |
| | — |
| | — |
| | — |
| | 23.8 |
| Other comprehensive income related to commodity contracts | — |
| | — |
| | — |
| | 23.8 |
| | — |
| | — |
| | — |
| | — |
| | 23.8 |
|
Other comprehensive income from equity method investments (1) | Other comprehensive income from equity method investments (1) | | | | | | | 4.1 |
| | — |
| | — |
| | — |
| | — |
| | 4.1 |
| Other comprehensive income from equity method investments (1) |
| |
| |
| | 4.1 |
| | | | | | | | | | 4.1 |
|
| Other comprehensive income related to postretirement benefit plans | Other comprehensive income related to postretirement benefit plans | — |
| | — |
| | — |
| | (0.6 | ) | | — |
| | — |
| | — |
| | — |
| | (0.6 | ) | Other comprehensive income related to postretirement benefit plans | — |
| | — |
| | — |
| | (0.6 | ) | | — |
| | — |
| | — |
| | — |
| | (0.6 | ) |
| Other comprehensive income related to interest rate contracts | Other comprehensive income related to interest rate contracts | — |
| | — |
| | — |
| | 0.4 |
| | — |
| | — |
| | — |
| | — |
| | 0.4 |
| Other comprehensive income related to interest rate contracts | — |
| | — |
| | — |
| | 0.4 |
| | — |
| | — |
| | — |
| | — |
| | 0.4 |
|
| Foreign currency translation gain | — |
| | — |
| | — |
| | 0.1 |
| | — |
| | — |
| | — |
| | — |
| | 0.1 |
| |
| Foreign currency translation gain, net | | Foreign currency translation gain, net | — |
| | — |
| | — |
| | 0.1 |
| | — |
| | — |
| | — |
| | — |
| | 0.1 |
|
| Common stock dividends ($0.60 per share) | Common stock dividends ($0.60 per share) | — |
| | — |
| | — |
| |
| | (44.0 | ) | | — |
| | — |
| | — |
| | (44.0 | ) | Common stock dividends ($0.60 per share) | — |
| | — |
| | — |
| | — |
| | (44.0 | ) | | — |
| | — |
| | — |
| | (44.0 | ) |
| Issuance of equity in connection with Delek/Alon Merger | Issuance of equity in connection with Delek/Alon Merger | 19,250,795 |
| | 0.1 |
| | 399.0 |
| | — |
| | — |
| | — |
| | — |
| | 131.6 |
| | 530.7 |
| Issuance of equity in connection with Delek/Alon Merger | 19,250,795 |
| | 0.1 |
| | 399.0 |
| | — |
| | — |
| | — |
| | — |
| | 131.6 |
| | 530.7 |
|
| Retirement of Treasury shares in connection with Delek/Alon Merger | Retirement of Treasury shares in connection with Delek/Alon Merger | (5,195,791 | ) | | — |
| | (160.8 | ) | | — |
| | — |
| | 5,195,791 |
| | 160.8 |
| | — |
| | — |
| Retirement of Treasury shares in connection with Delek/Alon Merger | (5,195,791 | ) | | — |
| | (160.8 | ) | | — |
| | — |
| | 5,195,791 |
| | 160.8 |
| | — |
| | — |
|
| Equity-based compensation expense | Equity-based compensation expense | — |
| | — |
| | 16.9 |
| | — |
| | — |
| | — |
| | — |
| | 0.6 |
| | 17.5 |
| Equity-based compensation expense | — |
| | — |
| | 16.9 |
| | — |
| | — |
| | — |
| | — |
| | 0.6 |
| | 17.5 |
|
| Distribution to non-controlling interest | Distribution to non-controlling interest | — |
| | — |
| | — |
| | — |
| | — |
| | — |
| | — |
| | (35.7 | ) | | (35.7 | ) | Distribution to non-controlling interest | — |
| | — |
| | — |
| | — |
| | — |
| | — |
| | — |
| | (35.7 | ) | | (35.7 | ) |
| Repurchase of common stock | Repurchase of common stock | — |
| | — |
| | — |
| | — |
| | — |
| | (762,623 | ) | | (25.0 | ) | | (7.3 | ) | | (32.3 | ) | Repurchase of common stock | — |
| | — |
| | — |
| | — |
|
| — |
| | (762,623 | ) | | (25.0 | ) | | (7.3 | ) | | (32.3 | ) |
| Issuance costs in connection with Delek/Alon Merger | Issuance costs in connection with Delek/Alon Merger | — |
| | — |
| | (0.2 | ) | | — |
| | — |
| | — |
| | — |
| | — |
| | (0.2 | ) | Issuance costs in connection with Delek/Alon Merger | — |
| | — |
| | (0.2 | ) | | — |
| | — |
| | — |
| | — |
| | — |
| | (0.2 | ) |
| Taxes paid due to the net settlement of equity-based compensation | Taxes paid due to the net settlement of equity-based compensation | — |
| | — |
| | (5.0 | ) | | — |
| | — |
| | — |
| | — |
| | — |
| | (5.0 | ) | Taxes paid due to the net settlement of equity-based compensation | — |
| | — |
| | (5.0 | ) | | — |
| | — |
| | — |
| | — |
| | — |
| | (5.0 | ) |
| Exercise of equity-based awards | Exercise of equity-based awards | 328,192 |
| | — |
| |
| | — |
| | — |
| | — |
| | — |
| | — |
| | — |
| Exercise of equity-based awards | 328,192 |
| | — |
| | — |
| | — |
| | — |
| | — |
| | — |
| | — |
| | — |
|
| Other | Other | — |
| | — |
| | (0.3 | ) | | (0.1 | ) | | 0.7 |
| | — |
| | — |
| | — |
| | 0.3 |
| Other | — |
| | — |
| | (0.3 | ) | | (0.1 | ) | | 0.7 |
| | — |
| | — |
| | — |
| | 0.3 |
|
| Balance at | December 31, 2017 | 81,533,548 |
| | $ | 0.8 |
| | $ | 900.1 |
| | $ | 6.9 |
| | $ | 767.8 |
| | (762,623 | ) | | $ | (25.0 | ) | | $ | 313.6 |
| | $ | 1,964.2 |
| December 31, 2017 | 81,533,548 |
| | $ | 0.8 |
| | $ | 900.1 |
| | $ | 6.9 |
| | $ | 767.8 |
| | (762,623 | ) | | $ | (25.0 | ) | | $ | 313.6 |
| | $ | 1,964.2 |
|
(1) Includes reversal of $4.1 million of accumulated other comprehensive loss related to the pre-Merger equity method investment in Alon.
Financial Statements and Schedules
Delek US Holdings, Inc.
Consolidated Statements of Changes in Stockholders' Equity (Continued)
(In millions, except share and per share data)
|
| | | | | | | | | | | | | | | | | | | | | | | | | | | | | | | | | | |
| | | Common Stock | | Additional Paid-in Capital | | Accumulated Other Comprehensive Income | | Retained Earnings | | Treasury Stock | | Non-Controlling Interest in Subsidiaries | | Total Stockholders' Equity |
| | | Shares | | Amount | | | | | Shares | | Amount | | |
| Balance at | December 31, 2017 | 81,533,548 |
| | $ | 0.8 |
| | $ | 900.1 |
| | $ | 6.9 |
| | $ | 767.8 |
| | (762,623 | ) | | $ | (25.0 | ) | | $ | 313.6 |
| | $ | 1,964.2 |
|
| Net income | — |
| | — |
| | — |
| | — |
| | 340.1 |
| | — |
| | — |
| | 34.8 |
| | 374.9 |
|
| Other comprehensive income related to commodity contracts | — |
| | — |
| | — |
| | 26.2 |
| | — |
| | — |
| | — |
| | — |
| | 26.2 |
|
| Other comprehensive loss related to postretirement benefit plans | — |
| | — |
| | — |
| | (4.7 | ) | | — |
| | — |
| | — |
| | — |
| | (4.7 | ) |
| Other comprehensive loss related to interest rate contracts | — |
| | — |
| | — |
| | (0.5 | ) | | — |
| | — |
| | — |
| | — |
| | (0.5 | ) |
| Foreign currency translation loss | — |
| | — |
| | — |
| | (0.9 | ) | | — |
| | — |
| | — |
| | — |
| | (0.9 | ) |
| Common stock dividends ($0.96 per share) | — |
| | — |
| | — |
| | — |
| | (80.1 | ) | | — |
| | — |
| | — |
| | (80.1 | ) |
| Distributions to non-controlling interests | — |
| | — |
| | — |
| | — |
| | — |
| | — |
| | — |
| | (27.7 | ) | | (27.7 | ) |
| Equity-based compensation expense | — |
| | — |
| | 20.9 |
| | — |
| | — |
| | — |
| | — |
| | 0.5 |
| | 21.4 |
|
| Issuance of stock for non-controlling interest repurchase, net of tax | 5,649,373 |
| | 0.1 |
| | 140.4 |
| | — |
| | — |
| | — |
| | — |
| | (127.0 | ) | | 13.5 |
|
| De-recognition of non-controlling interest | — |
| | — |
| | — |
| | — |
| | — |
| | — |
| | — |
| | (18.7 | ) | | (18.7 | ) |
| Reclassification for stranded tax effects resulting from the the Tax Reform Act (see Note 2) | — |
| | — |
| | — |
| | 1.6 |
| | (1.6 | ) | | — |
| | — |
| | — |
| | — |
|
Cumulative effect of adopting accounting principle regarding income tax effect of intra-equity transfers (see Note 2) (1) | — |
| | — |
| | — |
| | — |
| | (44.4 | ) | | — |
| | — |
| | — |
| | (44.4 | ) |
| Shares issued in connection with settlement of Convertible Notes | 2,692,218 |
| | — |
| | (0.3 | ) | | — |
| | — |
| | — |
| | — |
| | — |
| | (0.3 | ) |
| Shares received in connection with exercise of Call Options | — |
| | — |
| | 124.2 |
| | — |
| | — |
| | (2,692,771 | ) | | (123.9 | ) | | — |
| | 0.3 |
|
| Repurchase of common stock | — |
| | — |
| | — |
| | — |
| | — |
| | (9,022,386 | ) | | (365.3 | ) | | — |
| | (365.3 | ) |
| Warrant reclassification to liability award | — |
| | — |
| | (35.9 | ) | | — |
| | — |
| | — |
| | — |
| | — |
| | (35.9 | ) |
| Taxes due to the net settlement of equity-based compensation | — |
| | — |
| | (11.5 | ) | | — |
| | — |
| | — |
| | — |
| | — |
| | (11.5 | ) |
| Exercise of equity-based awards | 602,936 |
| | — |
| | — |
| | — |
| | — |
| | — |
| | — |
| | — |
| | — |
|
| Other | — |
| | — |
| | (2.5 | ) | | — |
| | — |
| | — |
| | 0.1 |
| | — |
| | (2.4 | ) |
| Balance at | December 31, 2018 | 90,478,075 |
| | $ | 0.9 |
| | $ | 1,135.4 |
| | $ | 28.6 |
| | $ | 981.8 |
| | (12,477,780 | ) | | $ | (514.1 | ) | | $ | 175.5 |
| | $ | 1,808.1 |
|
See accompanying notes to the consolidated financial statements |
| | | | | | | | | | | | | | | | | | | | | | | | | | | | | | | | | | |
| | | Common Stock | | Additional Paid-in Capital | | Accumulated Other Comprehensive Income | | Retained Earnings | | Treasury Stock | | Non-Controlling Interest in Subsidiaries | | Total Stockholders' Equity |
| | | Shares | | Amount | | | | | Shares | | Amount | | |
| Balance at | December 31, 2017 | 81,533,548 |
| | $ | 0.8 |
| | $ | 900.1 |
| | $ | 6.9 |
| | $ | 767.8 |
| | (762,623 | ) | | $ | (25.0 | ) | | $ | 313.6 |
| | $ | 1,964.2 |
|
| Net income | — |
| | — |
| | — |
| | — |
| | 340.1 |
| | — |
| | — |
| | 34.8 |
| | 374.9 |
|
| Other comprehensive income related to commodity contracts | — |
| | — |
| | — |
| | 26.2 |
| | — |
| | — |
| | — |
| | — |
| | 26.2 |
|
| Other comprehensive income related to postretirement benefit plans | — |
| | — |
| | — |
| | (4.7 | ) | | — |
| | — |
| | — |
| | — |
| | (4.7 | ) |
| Other comprehensive income related to interest rate contracts | — |
| | — |
| | — |
| | (0.5 | ) | | — |
| | — |
| | — |
| | — |
| | (0.5 | ) |
| Foreign currency translation loss, net | — |
| | — |
| | — |
| | (0.9 | ) | | — |
| | — |
| | — |
| | — |
| | (0.9 | ) |
| Common stock dividends ($0.96 per share) | — |
| | — |
| | — |
| |
| | (80.1 | ) | | — |
| | — |
| | — |
| | (80.1 | ) |
| Equity-based compensation expense | — |
| | — |
| | 20.9 |
| | — |
| | — |
| | — |
| | — |
| | 0.5 |
| | 21.4 |
|
| Distribution to non-controlling interest | — |
| | — |
| | — |
| | — |
| | — |
| | — |
| | — |
| | (27.7 | ) | | (27.7 | ) |
| Issuance of stock for non-controlling interest repurchase, net of tax | 5,649,373 |
| | 0.1 |
| | 140.4 |
| | — |
| | — |
| | — |
| | — |
| | (127.0 | ) | | 13.5 |
|
| De-recognition of non-controlling interest | — |
| | — |
| | — |
| | — |
| | — |
| | — |
| | — |
| | (18.7 | ) | | (18.7 | ) |
| Reclassification for stranded tax effects resulting from the Tax Reform Act | — |
| | — |
| | — |
| | 1.6 |
| | (1.6 | ) | | — |
| | — |
| | — |
| | — |
|
Cumulative effect of adopting accounting principle regarding income tax effect of intra-equity transfers (1) | — |
| | — |
| | — |
| | — |
| | (44.4 | ) | | — |
| | — |
| | — |
| | (44.4 | ) |
| Shares issued in connection with settlement of Convertible Notes | 2,692,218 |
| | — |
| | (0.3 | ) | | — |
| | — |
| | — |
| | — |
| | — |
| | (0.3 | ) |
| Shares received in connection with exercise of Call Options | — |
| | — |
| | 124.2 |
| | — |
| | — |
| | (2,692,771 | ) | | (123.9 | ) | | — |
| | 0.3 |
|
| Repurchase of common stock | — |
| | — |
| | — |
| | — |
| | — |
| | (9,022,386 | ) | | (365.3 | ) | | — |
| | (365.3 | ) |
| Warrant reclassification to liability award | — |
| | — |
| | (35.9 | ) | | — |
| | — |
| | — |
| | — |
| | — |
| | (35.9 | ) |
| Taxes paid due to the net settlement of equity-based compensation | — |
| | — |
| | (11.5 | ) | | — |
| | — |
| | — |
| | — |
| | — |
| | (11.5 | ) |
| Exercise of equity-based awards | 602,936 |
| | — |
| |
| | — |
| | — |
| | — |
| | — |
| | — |
| | — |
|
| Other | — |
| | — |
| | (2.5 | ) | | — |
| | — |
| | — |
| | 0.1 |
| | — |
| | (2.4 | ) |
| Balance at | December 31, 2018 | 90,478,075 |
| | $ | 0.9 |
| | $ | 1,135.4 |
| | $ | 28.6 |
| | $ | 981.8 |
| | (12,477,780 | ) | | $ | (514.1 | ) | | $ | 175.5 |
| | $ | 1,808.1 |
|
(1)1) This cumulative effect of adopting an accounting principle reflects a $14.5 million adjustment to decrease retained earnings related to the establishment of a valuation allowance on deferred tax assets recognized in connection with the adoption that was not previously reported in our March 31, 2018 Quarterly Report on Form 10-Q filed on May 10, 2018. This adjustment was not considered material to retained earnings or deferred tax liabilities.
Financial Statements and Schedules
Delek US Holdings, Inc.
Consolidated Statements of Changes in Stockholders' Equity (Continued)
(In millions, except share and per share data)
|
| | | | | | | | | | | | | | | | | | | | | | | | | | | | | | | | | | |
| | | Common Stock | | Additional Paid-in Capital | | Accumulated Other Comprehensive Income | | Retained Earnings | | Treasury Shares | | Non-Controlling Interest in Subsidiaries | | Total Stockholders' Equity |
| | | Shares | | Amount | | | | | Shares | | Amount | | |
| Balance at | December 31, 2018 | 90,478,075 |
| | $ | 0.9 |
| | $ | 1,135.4 |
| | $ | 28.6 |
| | $ | 981.8 |
| | (12,477,780 | ) | | $ | (514.1 | ) | | $ | 175.5 |
| | $ | 1,808.1 |
|
| Net income | — |
| | — |
| | — |
| | — |
| | 310.6 |
| | — |
| | — |
| | 25.6 |
| | 336.2 |
|
| Other comprehensive loss related to commodity contracts, net | — |
| | — |
| | — |
| | (33.9 | ) | | — |
| | — |
| | — |
| | — |
| | (33.9 | ) |
| Other comprehensive income related to postretirement benefit plans, net | — |
| | — |
| | — |
| | 5.1 |
| | — |
| | — |
| | — |
| | — |
| | 5.1 |
|
| Foreign currency translation gain, net | — |
| | — |
| | — |
| | 0.3 |
| | — |
| | — |
| | — |
| | — |
| | 0.3 |
|
| Common stock dividends ($1.14 per share) | — |
| | — |
| | — |
| | — |
| | (86.8 | ) | | — |
| | — |
| | — |
| | (86.8 | ) |
| Distributions to non-controlling interests | — |
| | — |
| | — |
| | — |
| | — |
| | — |
| | — |
| | (32.3 | ) | | (32.3 | ) |
| Equity-based compensation expense | — |
| | — |
| | 25.5 |
| | — |
| | — |
| | — |
| | — |
| | 0.3 |
| | 25.8 |
|
| Repurchase of common stock | — |
| | — |
| | — |
| | — |
| | — |
| | (5,039,034 | ) | | (178.1 | ) | | — |
| | (178.1 | ) |
| Taxes paid due to the net settlement of equity-based compensation | — |
| | — |
| | (9.2 | ) | | — |
| | — |
| | — |
| | — |
| | — |
| | (9.2 | ) |
| Exercise of equity-based awards | 508,950 |
| | — |
| | — |
| | — |
| | — |
| | — |
| | — |
| | — |
| | — |
|
| Other | — |
| | — |
| | 0.2 |
| | — |
| | — |
| | — |
| | — |
| | (0.1 | ) | | 0.1 |
|
| Balance at | December 31, 2019 | 90,987,025 |
| | $ | 0.9 |
| | $ | 1,151.9 |
| | $ | 0.1 |
| | $ | 1,205.6 |
| | (17,516,814 | ) | | $ | (692.2 | ) | | $ | 169.0 |
| | $ | 1,835.3 |
|
See accompanying notes to the consolidated financial statements
Financial Statements and Schedules
Delek US Holdings, Inc.
Consolidated Statements of Cash Flows
(In millions, except per share data )data) | | | | | Year Ended December 31, | | Year Ended December 31, |
| | | 2018 | | 2017 | | 2016 | | 2019 | | 2018 | | 2017 |
| Cash flows from operating activities: | |
| | | | | |
| | | | |
| Net income (loss) | | $ | 374.9 |
| | $ | 322.6 |
| | $ | (133.4 | ) | |
| Adjustments to reconcile net income (loss) to net cash provided by operating activities: | | | | | | | |
| Net income | | | $ | 336.2 |
| | $ | 374.9 |
| | $ | 322.6 |
|
| Adjustments to reconcile net income to net cash provided by operating activities: | | | | | | | |
| Depreciation and amortization | | 199.4 |
| | 153.3 |
| | 116.4 |
| | 194.3 |
| | 199.4 |
| | 153.3 |
|
| Amortization of above and below market leases, net | | (1.5 | ) | | — |
| | — |
| |
| Amortization of deferred financing costs and debt discount | | 8.6 |
| | 8.3 |
| | 4.4 |
| |
| Accretion of environmental liabilities and asset retirement obligations | | 3.3 |
| | 1.2 |
| | 0.3 |
| |
| Amortization of unfavorable contract liability | | (2.2 | ) | | (5.8 | ) | | (0.7 | ) | |
| Other amortization/accretion | | | 9.5 |
| | 8.2 |
| | 3.7 |
|
| Non-cash lease expense | | | 34.9 |
| | — |
| | — |
|
| Deferred income taxes | | (26.8 | ) | | (48.0 | ) | | (153.2 | ) | | 64.6 |
| | (26.8 | ) | | (48.0 | ) |
| (Income) loss from equity method investments | | (9.7 | ) | | (12.6 | ) | | 43.4 |
| |
| Income from equity method investments | | | (34.3 | ) | | (9.7 | ) | | (12.6 | ) |
| Dividends from equity method investments | | 8.8 |
| | 5.9 |
| | — |
| | 23.9 |
| | 8.8 |
| | 5.9 |
|
| (Gain) loss on disposal of assets | | (0.9 | ) | | 1.0 |
| | 4.8 |
| |
| Impairment of equity method investment | | — |
| | — |
| | 245.3 |
| |
| Loss (gain) on disposal of assets | | | 2.2 |
| | (0.9 | ) | | 1.0 |
|
| Gain on remeasurement of equity method investment | | — |
| | (190.1 | ) | | — |
| | — |
| | — |
| | (190.1 | ) |
| Loss on extinguishment of debt | | 9.1 |
| | — |
| | — |
| | — |
| | 9.1 |
| | — |
|
| Gain on sale of business | | (13.3 | ) | | — |
| | — |
| | — |
| | (13.3 | ) | | — |
|
| Impairment of assets held for sale | | 27.5 |
| | — |
| | — |
| | — |
| | 27.5 |
| | — |
|
| Equity-based compensation expense | | 21.4 |
| | 17.5 |
| | 16.4 |
| | 25.8 |
| | 21.4 |
| | 17.5 |
|
| Income tax benefit of equity-based compensation | | (2.2 | ) | | (1.4 | ) | | (1.2 | ) | | (2.5 | ) | | (2.2 | ) | | (1.4 | ) |
| Loss from discontinued operations | | 8.7 |
| | 5.9 |
| | (86.3 | ) | |
| (Income) loss from discontinued operations | | | (5.2 | ) | | 8.7 |
| | 5.9 |
|
| Changes in assets and liabilities, net of acquisitions: | | | | | | | | | | | | |
| Accounts receivable | | 112.7 |
| | (155.8 | ) | | (48.1 | ) | | (276.7 | ) | | 112.7 |
| | (155.8 | ) |
| Inventories and other current assets | | 138.7 |
| | (191.1 | ) | | (56.5 | ) | | (417.7 | ) | | 138.7 |
| | (191.1 | ) |
| Fair value of derivatives | | (52.6 | ) | | 39.2 |
| | 44.2 |
| | (12.5 | ) | | (52.6 | ) | | 39.2 |
|
| Accounts payable and other current liabilities | | (128.1 | ) | | 290.9 |
| | 223.8 |
| | 565.2 |
| | (128.1 | ) | | 290.9 |
|
| Obligation under Supply and Offtake Agreement | | (84.3 | ) | | 113.0 |
| | 12.8 |
| | 115.1 |
| | (84.3 | ) | | 113.0 |
|
| Non-current assets and liabilities, net | | (1.1 | ) | | (32.2 | ) | | 2.3 |
| | (47.6 | ) | | (1.1 | ) | | (32.2 | ) |
| Cash provided by operating activities - continuing operations | | 590.4 |
| | 321.8 |
| | 234.7 |
| | 575.2 |
| | 590.4 |
| | 321.8 |
|
| Cash (used in) provided by operating activities - discontinued operations | | (30.1 | ) | | (2.1 | ) | | 13.3 |
| |
| Cash used in operating activities - discontinued operations | | | — |
| | (30.1 | ) | | (2.1 | ) |
| Net cash provided by operating activities | | 560.3 |
| | 319.7 |
| | 248.0 |
| | 575.2 |
| | 560.3 |
| | 319.7 |
|
| Cash flows from investing activities: | | |
| | | | | | |
| | | | |
| Business combinations, net of cash acquired | | — |
| | 196.2 |
| | — |
| | — |
| | — |
| | 196.2 |
|
| Equity method investment contributions | | (0.2 | ) | | (5.8 | ) | | (61.6 | ) | | (267.4 | ) | | (0.2 | ) | | (5.8 | ) |
| Distributions from equity method investments |
| 1.2 |
| | 12.4 |
| | 20.2 |
|
| 0.8 |
| | 1.2 |
| | 12.4 |
|
| Purchases of property, plant and equipment | | (322.0 | ) | | (172.0 | ) | | (46.3 | ) | | (413.0 | ) | | (322.0 | ) | | (172.0 | ) |
| Asset acquisitions | | | (8.0 | ) | | — |
| | — |
|
| Purchase of intangible assets | | (1.7 | ) | | (5.5 | ) | | (0.7 | ) | | (19.9 | ) | | (1.7 | ) | | (5.5 | ) |
| Proceeds from sale of property, plant and equipment | | 11.1 |
| | 0.1 |
| | 0.2 |
| | 1.1 |
| | 11.1 |
| | 0.1 |
|
| Proceeds from sale of retail stores | | | 15.1 |
| | — |
| | — |
|
| Proceeds from sale of business | | 110.8 |
| | — |
| | — |
| | — |
| | 110.8 |
| | — |
|
| Proceeds from sales of discontinued operations | | 55.5 |
| | — |
| | — |
| | — |
| | 55.5 |
| | — |
|
| Cash (used in) provided by investing activities - continuing operations | | (145.3 | ) | | 25.4 |
| | (88.2 | ) | | (691.3 | ) | | (145.3 | ) | | 25.4 |
|
| Cash provided by investing activities - discontinued operations | | 20.0 |
| | 12.2 |
| | 288.9 |
| | — |
| | 20.0 |
| | 12.2 |
|
| Net cash (used in) provided by investing activities | | (125.3 | ) | | 37.6 |
| | 200.7 |
| | (691.3 | ) | | (125.3 | ) | | 37.6 |
|
Delek US Holdings, Inc.
Consolidated Statements of Cash Flows (Continued)
(In millions, except per share data )
| | | | | Year Ended December 31, | | Year Ended December 31, |
| | | 2018 | | 2017 | | 2016 | | 2019 | | 2018 | | 2017 |
| Cash flows from financing activities: | | |
| | | | | | |
| | | | |
| Proceeds from long-term revolvers | | 2,124.6 |
| | 1,122.1 |
| | 369.0 |
| | 1,435.4 |
| | 2,124.6 |
| | 1,122.1 |
|
| Payments on long-term revolvers | | (1,679.8 | ) | | (1,239.8 | ) | | (327.9 | ) | | (1,553.7 | ) | | (1,679.8 | ) | | (1,239.8 | ) |
| Proceeds from term debt | | 690.6 |
| | 286.2 |
| | 40.3 |
| | 434.0 |
| | 690.6 |
| | 286.2 |
|
| Payments on term debt | | (826.3 | ) | | (103.6 | ) | | (55.0 | ) | | (34.3 | ) | | (826.3 | ) | | (103.6 | ) |
| Proceeds from product financing agreements | | — |
| | 52.5 |
| | 56.5 |
| | 40.8 |
| | — |
| | 52.5 |
|
| Repayments of product financing agreements | | (72.4 | ) | | (98.7 | ) | | (50.4 | ) | | (22.2 | ) | | (72.4 | ) | | (98.7 | ) |
| Settlement of warrants unwind agreement | | (35.9 | ) | | — |
| | — |
| | — |
| | (35.9 | ) | | — |
|
| Taxes paid due to the net settlement of equity-based compensation | | (11.5 | ) | | (5.0 | ) | | (1.5 | ) | | (9.2 | ) | | (11.5 | ) | | (5.0 | ) |
| Income tax benefit of equity-based compensation | | — |
| | — |
| | 1.2 |
| |
| Repurchase of common stock | | (365.3 | ) | | (25.0 | ) | | (6.0 | ) | | (178.1 | ) | | (365.3 | ) | | (25.0 | ) |
| Repurchase of non-controlling interest | | — |
| | (7.3 | ) | | (6.9 | ) | | — |
| | — |
| | (7.3 | ) |
| Distribution to non-controlling interest | | (27.7 | ) | | (35.7 | ) | | (24.1 | ) | | (32.3 | ) | | (27.7 | ) | | (35.7 | ) |
| Dividends paid | | (80.1 | ) | | (44.0 | ) | | (37.5 | ) | | (86.8 | ) | | (80.1 | ) | | (44.0 | ) |
| Deferred financing costs paid | | (13.8 | ) | | (6.3 | ) | | (1.9 | ) | | (1.5 | ) | | (13.8 | ) | | (6.3 | ) |
| Cash used in financing activities - continuing operations | | (297.6 | ) | | (104.6 | ) | | (44.2 | ) | | (7.9 | ) | | (297.6 | ) | | (104.6 | ) |
| Cash used in financing activities - discontinued operations | | — |
| | — |
| | (17.5 | ) | | — |
| | — |
| | — |
|
| Net cash used in financing activities | | (297.6 | ) | | (104.6 | ) | | (61.7 | ) | | (7.9 | ) | | (297.6 | ) | | (104.6 | ) |
| Net increase in cash and cash equivalents | | 137.4 |
| | 252.7 |
| | 387.0 |
| |
| Net (decrease) increase in cash and cash equivalents | | | (124.0 | ) | | 137.4 |
| | 252.7 |
|
| Cash and cash equivalents at the beginning of the period | | 941.9 |
| | 689.2 |
| | 302.2 |
| | 1,079.3 |
| | 941.9 |
| | 689.2 |
|
| Cash and cash equivalents at the end of the period | | 1,079.3 |
| | 941.9 |
| | 689.2 |
| | 955.3 |
| | 1,079.3 |
| | 941.9 |
|
| Less cash and cash equivalents of discontinued operations at the end of the period | | — |
| | 10.1 |
| | — |
| | — |
| | — |
| | 10.1 |
|
| Cash and cash equivalents of continuing operations at the end of the period | | $ | 1,079.3 |
| | $ | 931.8 |
| | $ | 689.2 |
| | $ | 955.3 |
| | $ | 1,079.3 |
| | $ | 931.8 |
|
| | | | | | | | | | | | | |
| Supplemental disclosures of cash flow information: | | |
| | | | | | |
| | | | |
| Cash paid during the period for: | | |
| | | | | | |
| | | | |
| Interest, net of capitalized interest of $0.8 million, and $0.3 million and $0.2 million in 2018, 2017 and 2016, respectively | | $ | 120.1 |
| | $ | 82.1 |
| | $ | 51.9 |
| |
| Interest, net of capitalized interest of $1.5 million, $0.8 million and $0.3 million in the 2019, 2018 and 2017 periods, respectively | | | $ | 126.2 |
| | $ | 120.1 |
| | $ | 82.1 |
|
| Income taxes | | $ | 103.9 |
| | $ | 70.5 |
| | $ | 1.7 |
| | $ | 94.2 |
| | $ | 103.9 |
| | $ | 70.5 |
|
| Non-cash investing activities: | | | | | | | | | | | | |
| Common stock issued in connection with the buyout of Alon Partnership non-controlling interest | | $ | 127.0 |
| | $ | — |
| | $ | — |
| | $ | — |
| | $ | 127.0 |
| | $ | — |
|
| (Decrease) increase in accrued capital expenditures | | $ | (4.8 | ) | | $ | 9.4 |
| | $ | (3.7 | ) | |
| Increase (decrease) in accrued capital expenditures | | | $ | 15.1 |
| | $ | (4.8 | ) | | $ | 9.4 |
|
| Non-cash financing activities: | | | | | | | | | | | | |
| Non-cash lease liability arising from recognition of right of use assets upon adoption of ASU 2016-02 | | | $ | 206.0 |
| | $ | — |
| | $ | — |
|
| Non-cash lease liability arising from obtaining right of use assets during the period | | | $ | 15.9 |
| | $ | — |
| | $ | — |
|
| Common stock issued in connection with settlement of Convertible Notes | | $ | 123.9 |
| | $ | — |
| | $ | — |
| | $ | — |
| | $ | 123.9 |
| | $ | — |
|
| Treasury shares received in connection with exercise of Call Options | | $ | (123.9 | ) | | $ | — |
| | $ | — |
| | $ | — |
| | $ | (123.9 | ) | | $ | — |
|
| Common stock issued in connection with the Delek/Alon Merger | | $ | — |
| | $ | 509.0 |
| | $ | — |
| | $ | — |
| | $ | — |
| | $ | 509.0 |
|
| Equity instruments issued in connection with the Delek/Alon Merger | | $ | — |
| | $ | 21.7 |
| | $ | — |
| | $ | — |
| | $ | — |
| | $ | 21.7 |
|
See accompanying notes to the consolidated financial statements
Financial Statements and Schedules
Delek US Holdings, Inc.
Notes to Consolidated Financial Statements
1. General
Delek US Holdings, Inc. operates through its consolidated subsidiaries, which include Delek US Energy, Inc. ("Delek Energy") (and its subsidiaries) and Alon USA Energy, Inc. ("Alon") (and its subsidiaries).
Effective July 1, 2017 (the "Effective Time"), we acquired the outstanding common stock of Alon (previously listed under NYSE: ALJ) (the "Delek/Alon Merger", as further discussed in Note 3), resulting in a new post-combination consolidated registrant renamed as Delek US Holdings, Inc. (“New Delek”), with Alon and the previous Delek US Holdings, Inc. (“Old Delek”) surviving as wholly-owned subsidiaries. New Delek is the successor issuer to Old Delek and Alon pursuant to Rule 12g-3(c) under the Securities Exchange Act of 1934, as amended (the "Exchange Act"). In addition, as a result of the Delek/Alon Merger, the shares of common stock of Old Delek and Alon were delisted from the New York Stock Exchange ("NYSE") in July 2017, and their respective reporting obligations under the Exchange Act were terminated.
Unless otherwise indicated or the context requires otherwise, the disclosures and financial information included in this report for the periods prior to July 1, 2017 reflect that of Old Delek, and the disclosures and financial information included in this report for the periods beginning July 1, 2017 reflect that of New Delek. The terms "we," "our," "us," "Delek" and the "Company" are used in this report to refer to Old Delek and its consolidated subsidiaries for the periods prior to July 1, 2017, and New Delek and its consolidated subsidiaries for the periods on or after July 1, 2017, unless otherwise noted. New Delek's Common Stock is listed on the NYSE under the symbol "DK."
2. Accounting Policies
Basis of Presentation
Our consolidated financial statements include the accounts of Delek and its subsidiaries. All significant intercompany transactions and account balances have been eliminated in consolidation. We have evaluated subsequent events through the filing of this Form 10-K. Any material subsequent events that occurred during this time have been properly recognized or disclosed in our financial statements.
In August 2016, we entered into a definitive equity purchase agreement (the "Purchase Agreement") with Compañía de Petróleos de Chile COPEC S.A. and its subsidiary, Copec Inc., a Delaware corporation (collectively, "COPEC"). Under the terms of the Purchase Agreement, Delek agreed to sell, and COPEC agreed to purchase, 100% of the equity interests in Delek's wholly-owned subsidiaries MAPCO Express, Inc. ("MAPCO Express"), MAPCO Fleet, Inc., Delek Transportation, LLC, NTI Investments, LLC and GDK Bearpaw, LLC (collectively, the “Retail Entities”) for cash consideration of $535.0 million, subject to customary adjustments (the “ Retail Transaction”). The Retail Transaction closed in November 2016. As a result of the Purchase Agreement, we met the requirements under the provisions of Accounting Standards Codification ("ASC") 205-20, Presentation of Financial Statements - Discontinued Operations ("ASC 205-20")and ASC 360, Property, Plant and Equipment ("ASC 360"), to report the results of the Retail Entities as discontinued operations and to classify the Retail Entities as a group of assets held for sale. See Note 8 for further information regarding the Retail Entities.
During the third quarter 2017, we committed to a plan to sell certain assets associated with our Paramount and Long Beach, California refineries and Alon's California renewable fuels facility (collectively, the "California Discontinued Entities"), which were acquired as part of the Delek/Alon Merger. As a result of this decision and commitment to a plan, and because it was made within three months of the Delek/Alon Merger, we met the requirements under the provisions of Accounting Standards Codification ("ASC") 205-20, Presentation of Financial Statements - Discontinued Operations ("ASC 205-20 205-20")and ASC 360,Property, Plant and Equipment ("ASC 360") to report the results of the California Discontinued Entities as discontinued operations and to classify the California Discontinued Entities as a group of assets held for sale. On March 16, 2018, Delek sold to World Energy, LLC (i) all of Delek’s membership interests in AltAir Paramount, LLC (Alon's California renewable fuels facility), (ii) certain refining assets and other related assets located in Paramount, California and (iii) certain associated tank farm and pipeline assets and other related assets located in California. The transaction to dispose of certain assets and liabilities associated with our Long Beach, California refinery, to Bridge Point Long Beach, LLC, closed July 17, 2018. See Note 8 for further information regarding the California Discontinued Entities.
On February 12, 2018, Delek announced it had reached a definitive agreement to sell certain assets and operations of four4 asphalt terminals (included in Delek's corporate/other segment), as well as an equity method investment in an additional asphalt terminal, to an affiliate of Andeavor.Andeavor (prior to its acquisition by Marathon Petroleum). This transaction includesincluded asphalt terminal assets in Bakersfield, Mojave and Elk Grove, California and Phoenix, Arizona, as well as Delek’s 50% equity interest in the Paramount-Nevada Asphalt Company, LLC joint venture that operates an asphalt terminal located in Fernley, Nevada. On May 21, 2018, Delek completed the transaction and received net proceeds of approximately $110.8 million, inclusive of the $75.0 million base proceeds as well as certain preliminary working capital adjustments. These associated assets did not meet the definition of held for sale pursuant to ASC 360 as of December 31, 2017, and therefore were not reflected as held for sale nor as discontinued operations in the consolidated financial statements as of and for the year ended December 31, 2017. See Note 8 for further information regarding the disposal of these assets held for sale.
As of December 31, 2017, our consolidated financial statements included the consolidated financial statements of the following variable interest entities: Delek Logistics Partners, LP ("Delek Logistics"), Alon USA Partners, LP (the "Alon Partnership") and AltAir Paramount LLC ("AltAir"). On February 7, 2018, Delek acquired the non-controlling interest in the Alon Partnership; and on March 16, 2018, we sold the membership interests
in AltAir. Thus, Delek Logistics is Delek's only remaining variable interest entity as of December 31, 2019 and 2018. As the indirect owner of the general partner of Delek Logistics, we have the ability to direct the activities of this entity that most significantly impact economic performance. We are also considered to be the primary beneficiary for accounting purposes for this entity and are Delek Logistics' primary customer. As Delek Logistics does not derive an amount of gross margin material to us from third parties, there is limited risk to Delek associated with Delek Logistics' operations. However, in the event that Delek Logistics incurs a loss, our operating results will reflect such loss, net of intercompany eliminations, to the extent of our ownership interest in this entity.
The preparation of financial statements in conformity with U.S. generally accepted accounting principles ("GAAP") and in accordance with the rules and regulations of the Securities and Exchange Commission ("SEC") requires management to make estimates and assumptions that affect the
reported amounts of assets and liabilities and disclosure of contingent assets and liabilities at the date of the financial statements and the reported amounts of revenues and expenses during the reporting period. Actual results could differ from those estimates. In the opinion of management, all adjustments necessary for a fair presentation of the financial condition and the results of operations have been included. All significant intercompany transactions and account balances have been eliminated in consolidation. All adjustments are of a normal, recurring nature.
Reclassifications
Certain immaterial reclassifications have been made to prior period amounts have been reclassifiedpresentation in order to conform to the current year presentation. Additionally, certain changes to presentation of the prior period statements of income have been made in order to conform to the current period presentation, primarily relating to the addition of a subtotal entitled 'cost of sales' which includes all costs directly attributable to the generation of the related revenue, as defined by GAAP, and the retitling of what was previously referred to as 'cost of goods sold' to 'cost of materials and other'. In connection with this change in presentation, we have revised our related accounting policy for 'Cost of Materials and Other and Operating Expenses' presented below.
Segment Reporting
Delek is an integrated downstream energy business based in Brentwood, Tennessee, and has three primary lines of business: petroleum refining; the transportation, storage and wholesale distribution of crude oil, intermediate and refined products; and convenience store retailing. For the periods presented, we have aggregated our operating units into three3 reportable segments: refining, logisticsRefining, Logistics and retail.Retail.
OurOperations that are not specifically included in the reportable segments are included in Corporate, Other and Eliminations, which consists of the following:
our corporate activities, activities;
results of certain immaterial operating segments, (includingincluding our Canadian crude trading operations (as discussed in Note 12);
Alon's asphalt terminal operations effective withacquired as part of the Delek/Alon Merger), Merger and subsequently disposed in the second quarter of 2018 (see Note 8 for further discussion);
our non-controlling equity interest of approximately 47% of the outstanding shares in Alon (which was accounted for as an equity method investment) prior to the Delek/Alon Merger, Merger;
results and assets of discontinued operationsoperations; and
intercompany eliminations are reported in corporate, other and eliminations segment. eliminations.
Decisions concerning the allocation of resources and assessment of operating performance are made based on this segmentation. Management measures the operating performance of each of the reportable segments based on the segment contribution margin. Segment contribution margin is defined as net revenues less cost of materials and other and operating expenses, excluding depreciation and amortization. All inter-segment transactions have been eliminated in consolidation.
Prior to the Delek/Alon Merger, theThe refining segment operatedoperates high conversion, independent refineries located in Tyler, Texas (the "Tyler refinery") and, El Dorado, Arkansas (the "El Dorado refinery") and biodiesel facilities in Cleburne, Texas and Crossett, Arkansas. Effective with the Delek/Alon Merger, the refining segment now also includes the operations of high conversion, independent refineries in, Big Spring, Texas (the "Big Spring refinery"), Krotz Springs, Louisiana (the "Krotz Springs refinery") and a non-operating refinery located in Bakersfield, California (the "Bakersfield refinery"). The Bakersfield refinery has not processed crude oil since 2012 due toIn addition, the high costrefining segment owns and operates three biodiesel facilities involved in the production of crude oil relative to product yieldbiodiesel fuels and low asphalt demand.related activities, located in Crossett, Arkansas, Cleburne, Texas and New Albany, Mississippi (acquired in October 2019). The logistics segment owns and operates crude oil and refined products logistics and marketing assets. The retail segment markets gasoline, diesel and other refined petroleum products, and convenience merchandise through a network of company-operated retail fuel and convenience stores and includes the assets and results of operations of the retail business acquired in connection with the Delek/Alon Merger. The assets and results of operations related to the Retail Entities disposed in 2016 were classified as discontinued operations and therefore are excluded from our retail segment and included in our corporate, other and eliminations segment.
Segment reporting is more fully discussed in Note 4.
Cash and Cash Equivalents
Delek maintains cash and cash equivalents in accounts with large, U.S. or multi-national financial institutions. All highly liquid investments purchased with a term of three months or less are considered to be cash equivalents. As of December 31, 20182019 and 2017,2018, these cash equivalents consisted primarily of bank money market accounts and bank certificates of deposit, as well as overnight investments in U.S. Government or its agencies' obligations and bank repurchase obligations collateralized by U.S. Government or its agencies' obligations.
Accounts Receivable
Accounts receivable primarily consists of trade receivables generated in the ordinary course of business. Delek recorded an allowance for doubtful accounts related to trade receivables of $3.4$3.7 million and $4.4$3.4 million as of December 31, 20182019 and 2017,2018, respectively.
Credit is extended based on evaluation of the customer’s financial condition. We perform ongoing credit evaluations of our customers and require letters of credit, prepayments or other collateral or guarantees as management deems appropriate. Allowance for doubtful accounts is based on a combination of current saleshistorical experience and specific identification methods.
Credit risk is minimized as a result of the ongoing credit assessment of our customers and a lack of concentration in our customer base. Credit losses are charged to allowance for doubtful accounts when deemed uncollectible. Our allowance for doubtful accounts is reflected as a reduction of accounts receivable in the consolidated balance sheets.
No
NaN customer accounted for more than 10% of our consolidated accounts receivable balance as of both December 31, 2018 and 2017. No2019. NaN customer accounted for more than 10% of our consolidated accounts receivable balance as of December 31, 2018. NaN customer accounted for more than 10% of consolidated net sales for the years ended December 31, 2019, 2018 2017 or 2016.2017.
Inventory
Refinery crude oil, work-in-process, refined products, blendstocks and asphalt inventory for all of our operations, excluding the refinery located in Tyler Texas (the "Tyler refinery")refinery and merchandise inventory in our Retail segment, are stated at the lower of cost determined using the first-in, first-out (“FIFO”) basis or net realizable value. Cost of inventory at the Tyler refinery is determined using the last-in, first-out (“LIFO”) inventory valuation method and inventory is stated at the lower of LIFO cost or market. Retail merchandise inventory consists of cigarettes, beer, convenience merchandise and food service merchandise and is stated at estimated cost as determined by the retail inventory method. We are not subject to concentration risk with specific suppliers, since our crude oil and refined products inventory purchases are commodities that are readily available from a large selection of suppliers.
Commodity InvestmentsInvestment Commodities
Commodity investmentsInvestment commodities represent those commodities (generally crude oil) physically on hand as a result of trading activities with physical forward contracts where such crude will not be used (either directly in production or indirectly through inventory optimization) in the normal course of our refining business. Such investment storescommodities are maintained on a weighted average cost basis for determining realized gains and losses on physical purchases and sales under forward contracts, and ending balances are adjusted to fair value at each reporting date using published market prices of the commodity on the applicable exchange. The commodity investmentsinvestment commodities are included in other current assets on the accompanying consolidated balance sheets and changes in fair value are recorded in other operating income (expense) in the accompanying consolidated statements of income.
Property, Plant and Equipment
Assets acquired by Delek in conjunction with business acquisitions are recorded at estimated fair value at the acquisition date in accordance with the purchase method of accounting as prescribed in ASC 805, Business Combinations ("ASC 805"). Other acquisitions of property and equipment are carried at cost. Betterments, renewals and extraordinary repairs that extend the life of an asset are capitalized. Maintenance and repairs are charged to expense as incurred. Delek owns certain fixed assets on leased locations and depreciates these assets and asset improvements over the lesser of management's estimated useful lives of the assets or the remaining lease term.
Depreciation is computed using the straight-line method over management's estimated useful lives of the related assets, which are as follows:
|
| |
| | Years |
| Building and building improvements | 15-40 |
| Refinery machinery and equipment | 5-40 |
| Pipelines and terminals | 15-40 |
| Retail store equipment and site improvements | 7-40 |
| Refinery turnaround costs | 4-6 |
| Automobiles | 3-5 |
| Computer equipment and software | 3-10 |
| Furniture and fixtures | 5-15 |
| Asset retirement obligation assets | 15-50 |
Other Intangible Assets
Delek hasOther intangible assets associated with third-party fuel supply agreements, fuel trade name, liquor licenses, refinery permitsacquired in a business combination and below market leases resulting fromdetermined to the Delek/Alon Merger, in addition to a long-term supply contract, capacity contracts, line space history and rights of way. We amortize the definite-livedbe finite-lived are amortized over their respective estimated useful lives. The finite-lived intangible assets are amortized on straight-line bases over the estimated useful lives of five to 15 years. The amortization expense is included in depreciation and amortization on the accompanying consolidated statements of income.
Property, Plant and Equipment and Other Intangibles Impairment
Property, plant and equipment held and used and definite-lifeother intangibles are evaluated for impairment whenever indicators of impairment exist. In accordance with ASC 360 and ASC 350, Intangibles - Goodwill and Other("ASC 350"), Delek evaluates the realizability of these long-lived assets as events occur that might indicate potential impairment. In doing so, Delek assesses whether the carrying amount of the asset is recoverable by estimating the sum of the future cash flows expected to result from the asset, undiscounted and without interest charges. If the carrying amount is more than the recoverable amount, an impairment charge must be recognized based on the fair value of the asset. These impairment charges are included in other operating income in our consolidated statements of income. There were no0 impairment charges identified for the years ended December 31, 2019, 2018 2017 or 2016 .2017.
Equity Method Investments
For equity investments that are not required to be consolidated under the variable or voting interest model, we evaluate the level of influence we are able to exercise over an entity’s operations to determine whether to use the equity method of accounting. Our judgment regarding the level of influence over an equity method investment includes considering key factors such as our ownership interest, participation in policy-making and other significant decisions and material intercompany transactions. Equity investments for which we determine we have significant influence are accounted for as equity method investments. Amounts recognized for equity method investments are included in equity method investments in our consolidated balance sheets and adjusted for our share of the net earnings and losses of the investee and cash distributions, which are separately stated in our consolidated statements of income and our consolidated statements of cash flows. We evaluate our equity method investments presented for impairment whenever events or changes in circumstances indicate that the carrying amounts of such investments may be impaired. We recorded an impairment charge of $245.3 million on our investment in Alon based on the quoted market price of our ALJ Shares as of September 30, 2016, during the year ended December 31, 2016. This impairment is reflected in the loss on impairment of equity method investment in our consolidated statements of income for the year ended December 31, 2016. There were no0 impairment losses recorded on equity method investments for the yearyears ended December 31, 2019, 2018 or 2017. See Note 7 for further information on our equity method investments.
Variable Interest Entities
Our consolidated financial statements include the financial statements of our subsidiaries and variable interest entities ("VIE"), of which we are the primary beneficiary. We evaluate all legal entities in which we hold an ownership or other pecuniary interest to determine if the entity is a VIE. Variable interests can be contractual, ownership or other pecuniary interests in an entity that change with changes in the fair value of the VIE’s assets. If we are not the primary beneficiary, the general partner or another limited partner may consolidate the VIE, and we record the investment as an equity method investment.
Capitalized Interest
Delek capitalizes interest on capital projects associated with the refining and logistics segments. For the years ended December 31, 2019, 2018 2017 and 2016,2017, interest of $1.5 million, $0.8 million $0.3 million and $0.2$0.3 million, respectively, was capitalized relating to these projects.
Refinery Turnaround Costs
Refinery turnaround costs are incurred in connection with planned shutdowns and inspections of our refineries' major units to perform necessary repairs and replacements. Refinery turnaround costs are deferred when incurred, classified as property, plant and equipment and amortized on a straight-line basis over that period of time estimated to lapse until the next planned turnaround occurs. Refinery turnaround costs include, among other things, the cost to repair, restore, refurbish or replace refinery equipment such as vessels, tanks, reactors, piping, rotating equipment, instrumentation, electrical equipment, heat exchangers and fired heaters.
Goodwill and Potential Impairment
Goodwill in an acquisition represents the excess of the aggregate purchase price over the fair value of the identifiable net assets. Goodwill is reviewed at least annually during the fourth quarter for impairment, or more frequently if indicators of impairment exist, such as disruptions in our business, unexpected significant declines in operating results or a sustained market capitalization decline. Goodwill is evaluated for impairment by comparing the carrying amount of the reporting unit to its estimated fair value. Prior to the adoption ofThe Company adopted Accounting Standard Update ("ASU") 2017-04, Goodwill and Other (Topic 350); Simplifying the Test for Goodwill Impairment, Ifduring the fourth quarter of 2018. In accordance with this guidance, if a reporting unit's carrying amount exceeds its fair value, (Step 1), the impairment assessment leads to the testing of the implied fair value of the reporting unit's goodwill to its carrying amount (Step 2). If the implied fair value is less than the carrying amount, a goodwill impairment charge is recorded. Subsequent to adoption of ASU 2017-04 (which we adopted during the fourth quarter of 2018, as permitted by the ASU), Step 2 is no longer required, but rather any impairment is determined based on the results of Step 1.
In assessing the recoverability of goodwill, assumptions are made with respect to future business conditions and estimated expected future cash flows to determine the fair value of a reporting unit. We may consider inputs such as a market participant weighted average cost of capital, estimated growth rates for revenue, gross profitmargin and capital expenditures based on history and our best estimate of future forecasts, all of which are subject to significant judgment and estimates. We may also estimate the fair values of the reporting units using a multiple of expected future cash flows, such as those used by third-party analysts.market participants. If these estimates and assumptions change in the future, due to factors such as a decline in general economic conditions, competitive pressures on sales and margins and other economic and industry factors beyond management's control, an impairment charge may be required. A significant risk to our future results and the potential future impairment of goodwill is the volatility of the crude oil and the refined product markets which is often unpredictable and may negatively impact our results of operations in ways that cannot be anticipated and that are beyond management's control.
Our annual assessment of goodwill did not result in impairment during the years ended December 31, 2019, 2018 2017 or 2016.2017. Details of remaining goodwill balances by segment are included in Note 18 to the consolidated financial statements in Item 8, Financial Statements and Supplementary Data, of this Annual Report on Form 10-K.
Renewable Identification Numbers
The U.S. Environmental Protection Agency (“EPA”) requires certain refiners to blend biofuels into the fuel products they produce pursuant to the EPA’s Renewable Fuel Standard - 2 ("RFS-2"). Alternatively, credits, called Renewable Identification Numbers ("RINs"), which may be generated and/or purchased, can be used to satisfy this obligation instead of physically blending biofuels ("RINs Obligation"). All of our refineries are obligated parties to the RFS-2 (see Note 14 for further discussion of these requirements).RFS-2. To the extent that any of our refineries is unable to blend biofuels at the required rate, it must purchase RINs in the open market to satisfy its annual requirement. Our RINs Obligation is based on the amount of RINs we must purchase and the price of those RINs as
of the balance sheet date. The cost of RINs used each period is charged to cost of materials and other in the consolidated statements of income. We recognize a liability at the end of each reporting period in which we do not have sufficient RINs to cover the RINs Obligation. The liability is calculated by multiplying the RINs shortage (based on actual results) by the period end RIN spot price. From time to time, we may hold RINs generated or acquired in excess of our current obligations. We recognize an asset at the end of each reporting period in which we have generated or acquired RINs in excess of our RINs Obligation. The asset is calculated by multiplying the RINs surplus (based on actual results) by the period end RIN spot price. The value of RINs in excess of our RINs Obligation, if any, would be reflected in other current assets on the consolidated balance sheets. RINs generated in excess of our current RINs Obligation may be sold or held to offset future RINs Obligations. Any such sales of excess RINs are recorded in cost of materials and other on the consolidated statements of income. The assets and liabilities associated with our RINs Obligation are considered recurring fair value measurements. See Note 13 for further information.
From time to time, Delek enters into future commitments to purchase or sell RINs at fixed prices and quantities, which are used to manage the costs associated with our RINs Obligation. These future RIN commitment contracts meet the definition of derivative instruments under ASC 815, Derivatives and Hedging ("ASC 815"), and are measured at fair value based on quoted prices from an independent pricing service. Changes in the fair value of these future RIN commitment contracts are recorded in cost of materials and other on the consolidated statements of income. See Note 12 for further information.
Other Environmental Credits Obligations
From time to time, we may create, during the operation of our refining or other activities, or purchase on a market, other environmental credits (e.g., sulfur credits, benzene credits, etc.) for purposes of ultimately meeting expected environmental credit obligations. Such other environmental credits obligation surplus or deficit is based on the amount of these other emissions credits required for compliance as of the balance sheet date, net of amounts internally generated and purchased. The environmental credits obligation surplus or deficit is categorized is measured at fair value either directly through observable inputs or indirectly through market-corroborated inputs. See Note 13 for further information.
Derivatives
Delek records all derivative financial instruments, including any interest rate swap and cap agreements, fuel-related derivatives, over the counter ("OTC") future swaps, forward contracts and future RIN purchase and sales commitments that qualify as derivative instruments, at estimated fair value in accordance with the provisions of ASC 815. Changes in the fair value of the derivative instruments are recognized in operations, unless we elect to apply and qualify for the hedging treatment permitted under the provisions of ASC 815 allowing such changes to be classified as other comprehensive income for cash flow hedges. We validate the fair value of all derivative financial instruments on a periodic basis, utilizing exchange pricing and/or price index developers such as Platts, Argus or OPIS. On a regular basis, Delek enters into commodity contracts with counterparties for the purchase or sale of crude oil, blendstocks, and various finished products. These contracts usually qualify for the normal purchase / normal sale exemption under ASC 815 and, as such, are not measured at fair value.
Delek's policy under the guidance of ASC 815-10-45, Derivatives and Hedging - Other Presentation Matters ("ASC 815-10-45"), is to net the fair value amounts recognized for multiple derivative instruments executed with the same counterparty and offset these values against the cash collateral arising from these derivative positions.
Fair Value of Financial Instruments
The fair values of financial instruments are estimated based upon current market conditions and quoted market prices for the same or similar instruments. Management estimates that the carrying value approximates fair value for all of Delek's assets and liabilities that fall under the scope of ASC 825, Financial Instruments ("ASC 825").
Delek applies the provisions of ASC 820, Fair Value Measurements and Disclosure ("ASC 820"), which defines fair value, establishes a framework for its measurement and expands disclosures about fair value measurements. ASC 820 applies to our commodity and interest rateother derivatives that are measured at fair value on a recurring basis.basis, and to our environmental credit obligations that are accounted for under the fair value election. ASC 820 also applies to the measurement of our equity method investment, goodwill and long-lived tangible and intangible assets when determining whether or not an impairment exists, when circumstances require evaluation. See Note 7 for further information. This standard also requires that we assess the impact of nonperformance risk on our derivatives. Nonperformance risk is not considered material to our financial statements as of December 31, 20182019 and 2017.2018.
Delek also applies the provisions of ASC 825 as it pertains to the fair value option. This standard permits the election to carry financial instruments and certain other items similar to financial instruments at fair value on the balance sheet, with all changes in fair value reported in earnings. By electing the fair value option, we can achieve an accounting result similar to a fair value hedge without having to follow the complex hedge accounting rules. As of both December 31, 2018, and 2017, we elected to account for the market-indexed step-out liabilities associated with our applicable Master Supply and Offtake Agreements (the "Supply and Offtake Agreements" or the "J. Aron Agreements") with J. Aron & Company ("J. Aron") at fair value and recognize all changes in the fair value of the step-out liabilities in cost of materials and other in the accompanying statements of income. Additionally, at December 31, 20182019, we continue to apply our fair value election to our amended fixed-price step-out liabilities where changes in fair value relate to interest rate risk and therefore are recognized in interest expense in the accompanying statements of income. See Notes 10 and 13 for further discussion.
Self-Insurance Reserves
Delek has varying deductibles or self-insured retentions on our workers’ compensation, general liability, automobile liability insurance and medical claims for certain employees with coverage above the deductibles or self-insured retentions in amounts management considers adequate. We maintain an accrual for these costs based on claims filed and an estimate of claims incurred but not reported. Differences between actual settlements and recorded accruals are recorded in the period identified.
Environmental Expenditures
It is Delek's policy to accrue environmental and clean-up related costs of a non-capital nature when it is both probable that a liability has been incurred and the amount can be reasonably estimated. Environmental liabilities represent the current estimated costs to investigate and remediate contamination at our properties.sites where we have environmental exposure. This estimate is based on internal and third-party assessments of the extent of the contamination, the selected remediation technology and review of applicable environmental regulations, typically considering estimated activities and costs for 15 years, and up to 30 years if a longer period is believed reasonably necessary. Such estimates may require judgment with respect to costs, time frame and extent of required remedial and clean-up activities. Accruals for estimated costs from environmental remediation obligations generally are recognized no later than completion of the remedial feasibility study and include, but are not limited to, costs to perform remedial actions and costs of machinery and equipment that are dedicated to the remedial actions and that do not have an alternative use. Such accruals are adjusted as further information develops or circumstances change. We discount environmental liabilities to their present value if payments are fixed andor reliably determinable. Expenditures for equipment necessary for environmental issues relating to ongoing operations are capitalized. Provisions for environmental liabilities generally are recognized in operating expenses.
Changes in laws and regulations and actual remediation expenses compared to historical experience could significantly impact our results of operations and financial position. We believe the estimates selected, in each instance, represent our best estimate of future outcomes, but the actual outcomes could differ from the estimates selected.
Asset Retirement Obligations
Delek initially recognizes liabilities which represent the fair value of a legal obligation to perform asset retirement activities, including those that are conditional on a future event, when the amount can be reasonably estimated. If a reasonable estimate cannot be made at the time the liability is incurred, we record the liability when sufficient information is available to estimate the liability’s fair value.
In the refining segment, we have asset retirement obligations with respect to our refineries due to various legal obligations to clean and/or dispose of these assets at the time they are retired. However, the majority of these assets can be used for extended and indeterminate periods of time provided that they are properly maintained and/or upgraded. It is our practice and intent to continue to maintain these assets and make improvements based on technological advances. In the logistics segment, these obligations relate to the required cleanout of the pipeline and terminal tanks and removal of certain above-grade portions of the pipeline situated on right-of-way property. In the retail segment, we have asset retirement obligations related to the removal of underground storage tanks and the removal of brand signage at owned and leased retail sites which are legally required under the applicable leases. The asset retirement obligation for storage tank removal on leased retail sites is accreted over the expected life of the owned retail site or the average retail site lease term.
In order to determine fair value, management must make certain estimates and assumptions including, among other things, projected cash flows, a credit-adjusted risk-free rate and an assessment of market conditions that could significantly impact the estimated fair value of the asset retirement obligations. We believe the estimates selected, in each instance, represent our best estimate of future outcomes, but the actual outcomes could differ from the estimates selected.
Revenue Recognition
The Company recognizes revenue when it satisfies a performance obligation by transferring control over a product or by providing services to a customer. The adoption of ASC 606, Revenue from Contracts with Customers ("ASC 606"), beginning January 1, 2018, did not materially change our revenue recognition patterns, which are described below by reportable segment. The principles for recognizing revenue as codified in ASC 605, Revenue Recognition ("ASC 605"), were applied during the yearsyear ended December 31, 2017 and 2016.2017. No restatements to revenues or expenses were required to be made to our consolidated statements of income, as we applied the modified retrospective transition method in adopting ASC 606, as described below under "—New Accounting Pronouncements Adopted During 2018—ASU 2014-09, Revenue - Revenue from Contracts with Customers."606.
Refining
Revenues for products sold are recorded at the point of sale upon delivery of product, which is the point at which title to the product is transferred, the customer has accepted the product and the customer has significant risks and rewards of owning the product. We typically have a right to payment once control of the product is transferred to the customer. Transaction prices for these products are typically at market rates for the product at the time of delivery. Payment terms require customers to pay shortly after delivery and do not contain significant financing components.
Logistics
Revenues for products sold are generally recognized upon delivery of the product, which is when title and control of the product is transferred. Transaction prices for these products are typically at market rates for the product at the time of delivery. Service revenues are recognized as crude oil, intermediate and refined product are shipped through, delivered by or stored in our pipelines, trucks, terminals and storage facility assets, as
applicable. We do not recognize product revenues for these services as the product does not represent a promised good in the context of ASC
606. All service revenues are based on regulated tariff rates or contractual rates. Payment terms require customers to pay shortly after delivery and do not contain significant financing components.
Retail
Fuel and merchandise revenue is recognized at the point of sale, which is when control of the product is transferred to the customer. Payments from customers are received at the time sales occur in cash or by credit or debit card. We derive service revenues from the sale of lottery tickets, money orders, car washes and other ancillary product and service offerings. Service revenue and related costs are recorded at gross amounts or net amounts, as appropriate, in accordance with the principal versus agent provisions in ASC 606.
Refer to Note 4 for disclosure of our revenue disaggregated by segment, as well as a description of our reportable segment operations.
Cost of Materials and Other and Operating Expenses
For the refining segment, cost of materials and other includes (i) the following:
the direct cost of materials (such as crude oil and other refinery feedstocks, refined petroleum products and blendstocks, and ethanol feedstocks and products) that are a component of our products sold; (ii)
costs related to the delivery (such as shipping and handling costs) orof products sold; (iii)
costs related to our environmental credit obligations to comply with various governmental and regulatory programs (such as the cost of renewable identification numbersRINs as required by the EPA's Renewable Fuel Standard and emission credits under various cap-and-trade systems); and (iv)
gains and losses on our commodity derivative instruments.
Operating expenses for the refining segment include the costs to operate our refineries and biodiesel facilities, excluding depreciation and amortization. These costs primarily include employee-related expenses, energy and utility costs, catalysts and chemical costs, and repairs and maintenance expenses.
For the logistics segment, cost of materials and other includes (i) the following:
all costs of purchased refined products, additives and related transportation of such products, (ii) it also includes
costs associated with the operation of our trucking assets, which primarily include allocated employee costs and other costs related to fuel, truck leases and repairs and maintenance, (iii)
the cost of pipeline capacity leased from a third-party, and (iv)
gains and losses related to our commodity hedging activities.
Operating expenses for the logistics segment include the costs associated with the operation of owned terminals and pipelines and terminalling expenses at third-party locations, excluding depreciation and amortization. These costs primarily include outside services, allocated employee costs, repairs and maintenance costs and energy and utility costs. Operating expenses related to the wholesale business are excluded from cost of sales because they primarily relate to costs associated with selling the products through our wholesale business.
For the retail segment, cost of materials and other comprises the costs related to specific products sold at retail sites, primarily consisting of motor fuels and merchandise. Retail fuel cost of sales represents the cost of purchased fuel, including transportation costs. Merchandise cost of sales includes the delivered cost of merchandise purchases, net of merchandise rebates and commissions. Operating expenses related to the retail business include costs such as wages of employees, lease expense, utility expense and other costs of operating the stores, excluding depreciation and amortization, and are excluded from cost of sales because they primarily relate to costs associated with selling the products through our retail sites.
Depreciation and amortization is separately presented in our statement of income and disclosed by reportable segment in Note 4.
Interest Expense
Interest expense includes interest expense on debt, letters of credit, financing fees (including certain J. Aron fees associated with our Supply and Offtake Agreements), the amortization, net of accretion, of debt discounts or premium and amortization of deferred debt issuance costs, and interest rate swap settlements, but excludes capitalized interest. Original issuance discount and debt issuance costs are amortized ratably over the term of the related debt when it is not materially different from the effective interest method.
Sales, Use and Excise Taxes
Prior to the adoption of ASC 606, Delek's policy was to exclude sales, use and excise taxes from revenue when we are an agent of the taxing authority, in accordance with the applicable guidance in ASC 605, Revenue Recognition. Upon the adoption of ASC 606, we made the accounting policy election to exclude from revenue all taxes assessed by a governmental authority, including sales, use and excise taxes, that are both imposed on and concurrent with a specific revenue-producing transaction and collected from a customer.
Deferred Financing Costs
Deferred financing costs associated with our revolving credit facilities are included in other non-current assets in the accompanying consolidated balance sheets. Deferred financing costs associated with our term loan facilities are included as a reduction to the associated debt balance in the accompanying consolidated balance sheets. These costs represent expenses related to issuing our long-term debt and obtaining our lines of credit and are amortized ratably over the remaining term of the respective financing when it is not materially different from the effective interest method and included in interest expense in the accompanying consolidated statements of income. See Note 11 for further information.
Advertising Costs
Delek expenses advertising costs as the advertising space is utilized. Advertising expense for the years ended December 31, 2019, 2018 and 2017 and 2016 was $3.4 million, $4.1 million $1.3 million and $0.2$1.3 million, respectively.
Operating Leases
In accordance with ASC 842-20, Leases - Lessee ("ASC 842-20"), we classify leases with contractual terms longer than twelve months as either operating or finance. Finance leases are generally those leases that are highly specialized or allow us to substantially utilize or pay for the entire asset over its useful life. All other leases are classified as operating leases.
Delek leases land, buildings and various equipment under variousprimarily operating lease arrangements, most of which provide the option, after the initial lease term, to renew the leases. Some of these lease arrangements include fixed rentallease rate increases, while others include rentallease rate increases based upon such factors as changes, if any, in defined inflationary indices.
In accordance with ASC 840-20, Leases - Operating Leases ("ASC 840-20"), forFor all leases that include fixed rental rate increases, these are included in our fixed lease payments. Our leases may include variable payments, based on changes on price or other indices, that are expensed as incurred.
Delek calculates the total rentlease expense for the entire noncancelable lease period, considering renewals for all periods for which failureit is reasonably certain to renew the lease imposes economic penalty,be exercised, and records rentallease expense on a straight-line basis in the accompanying consolidated statements of income. Accordingly, a lease liability is recognized for these leases and is calculated to be the present value of the fixed lease payments, as defined by ASC 842-20, using a discount rate based on our incremental borrowing rate. A corresponding right-of-use asset is recognized based on the lease liability and adjusted for certain costs and prepayments. See Note 1424 for further information.
Income Taxes
Income taxes are accounted for under the provisions of ASC 740, Income Taxes ("ASC 740"). This statementstandard generally requires Delek to record deferred income taxes for the differences between the book and tax bases of its assets and liabilities, which are measured using enacted tax rates and laws that will be in effect when the differences are expected to reverse. Deferred income tax expense or benefit represents the net change during the year in our deferred income tax assets and liabilities, exclusive of the amounts held in other comprehensive income.
ASC 740 also prescribes a comprehensive model for how companies should recognize, measure, present and disclose in their financial statements uncertain tax positions taken or expected to be taken on a tax return and prescribes the minimum recognition threshold a tax position is required to meet before being recognized in the financial statements. Finally, ASC 740 requires an annual tabular roll-forward of unrecognized tax benefits.
The Tax Cuts and Jobs Act (the "Tax Reform Act") was enacted on December 22, 2017. The Tax Reform Act reduces the USU.S. federal corporate tax rate from 35% to 21%, provides for immediate deduction of qualified capital assets placed in service, requires companies to pay a one-time transition tax on earnings of certain foreign subsidiaries that were previously tax deferred and creates new taxes on certain foreign sourced earnings. At December 31,In the fourth quarter of fiscal 2018 we have finalized our accounting analysis based on the guidance, interpretations, and data available. Adjustments made in the fourth quarter of fiscal 2018 upon finalization of our accounting analysis were not material to our Consolidated Financial Statements.consolidated financial statements. See Note 15 for further discussion.
Equity-Based Compensation
ASC 718, Compensation - Stock Compensation ("ASC 718"), requires the cost of all share-based payments to employees, including grants of employee stock options, to be recognized in the income statement and establishes fair value as the measurement objective in accounting for share-based payment arrangements. ASC 718 requires the use of a valuation model to calculate the fair value of stock-based awards on the date of grant. Delek uses the Black-Scholes-Merton option-pricing model to determine the fair value of stock option and stock appreciation right (SAR) awards.
Restricted stock units ("RSUs") are valued based on the fair market value of the underlying stock on the date of grant. Performance-based RSUs ("PRSUs") include a market condition based on the Company's total shareholder return over the performance period and are valued using a Monte-Carlo simulation model. We record compensation expense for these awards based on the grant date fair value of the award, recognized ratably over the measurement period. Vested RSUs and PRSUs are not issued until the minimum statutory withholding requirements have been remitted to us for payment to the taxing authority. As a result, the actual number of shares accounted for as issued may be less than the number of RSUs vested, due to any withholding amounts which have not been remitted.
We generally recognize compensation expense related to stock-based awards with graded or cliff vesting on a straight-line basis over the vesting period. It is our practice to issue new shares when share-based awards are exercised. Our equity-based compensation expense includes estimates
for forfeitures and volatility based on our historical experience. If actual forfeitures differ from our estimates, we adjust equity-based compensation expense accordingly.
Postretirement Benefits
In connection with the Delek/Alon Merger, we assumed defined benefit pension and postretirement medical plans for certain former Alon employees. We recognize the underfunded status of our defined benefit pension and postretirement medical plans as a liability. Changes in the funded status of our defined benefit pension and postretirement medical plans are recognized in other comprehensive income in the period when the changes occur. The funded status represents the difference between the projected benefit obligation and the fair value of the plan assets. The projected benefit obligation is the present value of benefits earned to date by plan participants, including the effect of assumed future salary increases. Plan assets are measured at fair value. We use December 31 of each year, or more frequently as necessary, as the measurement date for plan assets and obligations for all of our defined benefit pension and postretirement medical plans. We straight-line amortize prior service costs and actuarial gains and losses over the average future service of members expected to receive benefits and use a 10% corridor in regards to the actuarial gains and losses. See Note 22 for more information regarding our postretirement benefits.
The service cost component of net periodic benefit is included as part of general and administrative expenses in the accompanying consolidated statements of income. The other components of net periodic benefit are included as part of other non-operating expense (income), net in the accompanying consolidated statements of income.
New Accounting Pronouncements Adopted During 20182019
ASU 2018-02, Comprehensive Income - Reclassification of Certain Tax Effects from Accumulated Other Comprehensive Income2016-02, Leases
In February 2018,2016, the FASBFinancial Accounting Standards Board (the "FASB") issued guidance that allowsrequires the recognition of a reclassification from accumulated other comprehensive income ("AOCI") to retained earnings for stranded tax effects resulting fromlease liability and a right-of-use asset, initially measured at the Tax Reform Act, which was signed into law on December 22, 2017. Consequently, the amendments eliminate the stranded tax effects related to items in accumulated other comprehensive income resulting from the Tax Reform Act. The new guidance may be applied retrospectively to each period in which the effectpresent value of the Tax Reform Act is recognized, orlease payments, in the periodstatement of adoption.financial condition for all leases with terms longer than one year. The guidance was subsequently amended to consider the impact of practical expedients and provide additional clarifications. This guidance is effective for fiscal years beginning after December 15, 2018, including interim periods within those fiscal years. Early adoption is permitted.We adopted the new lease standard on January 1, 2019. We elected the package of practical expedients which, among other things, allows us to early adopt thiscarry forward the historical lease classification. For substantially all classes of underlying assets, we have elected the practical expedient not to separate lease and non-lease components, which allows us to combine the components if certain criteria are met. For certain leases of logistic assets, we account for the service component separately. Further, we elected the optional transition method, which allows us to recognize a cumulative-effect adjustment to the opening balance sheet of retained earnings at the date of adoption and to not recast our comparative periods. We have not elected the hindsight practical expedient, which would have allowed us to use hindsight in determining the reasonably certain lease term. The adoption of the lease accounting guidance effectivehad no impact on January 1, 2018. As2019 retained earnings and resulted in the recognition of a result of adopting this guidance, we reclassified $1.6$206.0 million from AOCI to retained earnings.lease liability and a corresponding right-of-use asset on our consolidated balance sheet. The adoption did not have a material impact on our consolidated income statement. See Note 1524 for further discussion.information.
ASU 2017-09, Stock Compensation2017-12, Derivatives and Hedging - Scope of ModificationTargeted Improvements to Accounting for Hedging Activities
In MayAugust 2017, the FASB issued guidance that clarifies when changes to better align financial reporting for hedging activities with the terms or conditionseconomic objectives of a share-based payment award must be accountedthose activities for as modifications.both financial (e.g., interest rate) and commodity risks. The modification accounting guidance applies ifwas intended to create more transparency in the value, vesting conditions or classificationpresentation of financial results, both on the face of the award changes.financial statements and in the footnotes, and simplify the application of hedge accounting guidance. This guidance is effective for fiscal years beginning after December 15, 2017,2018, and interim periods within those fiscal years. ThisCompanies are required to apply the guidance should be applied prospectively to an awardon a modified on or afterretrospective transition method in which the adoption date.cumulative effect of the change is recognized within equity in the consolidated balance sheet as of the date of adoption. We adopted this guidance on January 1, 20182019 and the adoption did not have a material impact on our business, financial condition or results of operations.
ASU 2017-07, Compensation - Improving the Presentation of Net Periodic Pension Cost and Net Postretirement Benefit Cost
In March 2017, the FASB issued guidance that will require that an employer disaggregate the service cost component from the other components of net benefit cost with respect to defined benefit postretirement employee benefit plans. Service cost is required to be reported in the same line item or items as other compensation costs arising from services rendered by the pertinent employees during the period. The other components of net periodic benefit cost are required to be reported outside the subtotal See Note 12 for operating income. Additionally, only the service cost component of net benefit costs are eligible for capitalization. The guidance became effective January 1, 2018. We adopted this guidance on January 1, 2018, which retrospectively impacted the presentation of our third and fourth quarter 2017 statements of income as a result of the pension and postretirement obligations assumed in the Delek/Alon Merger. As further discussed in Note 22, only the service cost component of net periodic benefit costs are included as part of general and administrative expenses in the accompanying consolidated statements of income. The other components of net periodic benefit costs are included as part of other non-operating expenses (income), net. As a practical expedient, we used the amounts disclosed regarding our pension and other postretirement benefit plans for the prior comparative periods as the estimation basis for applying the retrospective presentation requirements. The following table details the impact of the retrospective adoption of this standard for the year ended December 31, 2017:information.
|
| | | | | | | | | | | | |
| | | December 31, 2017 |
| (in millions) | | As Reported | | Adjustment | | As Adjusted |
| General and administrative expenses | | $ | 169.8 |
| | $ | 6.1 |
| | $ | 175.9 |
|
| Other income, net | | $ | — |
| | $ | (6.1 | ) | | $ | (6.1 | ) |
ASU 2017-05, Other Income - Clarifying the Scope of Asset Derecognition Guidance and Accounting for Partial Sales of Nonfinancial Assets
In February 2017, the FASB issued guidance clarifying the scope of asset derecognition guidance and accounting for partial sales of nonfinancial assets. The amendments in this guidance should be applied using either i) a modified retrospective basis through a cumulative-effect adjustment directly to retained earnings as of the beginning of the period of adoption or ii) a retrospective basis to each period presented in the financial statements. This guidance is effective for annual reporting periods beginning after December 15, 2017, including interim reporting periods within
that reporting period. We adopted this guidance on January 1, 2018, and the adoption did not have a material impact on our business, financial condition or results of operations.
ASU 2017-04, Intangible - Simplifying the Test for Goodwill Impairment
In January 2017, the FASB issued guidance concerning the goodwill impairment test that eliminates Step 2, which required a comparison of the implied fair value of goodwill of the reporting unit with the carrying amount of that goodwill for that reporting unit. It also eliminates the requirements for any reporting unit with a zero or negative carrying amount to perform a qualitative assessment and, if it fails that qualitative assessment, to perform Step 2 of the goodwill impairment test. An entity still has the option to perform the qualitative assessment for a reporting unit to determine if the quantitative impairment test is necessary. This guidance is effective for annual or any interim goodwill impairment tests in fiscal years beginning after December 15, 2019. Early adoption is permitted for interim or annual goodwill impairment tests performed on testing dates after January 1, 2017. As permitted under ASU 2017-04, we adopted this guidance in the fourth quarter of 2018 in connection with our 2018 goodwill impairment tests. The adoption did not have a material impact on our business, financial condition or results of operations.
ASU 2016-16, Income Taxes - Intra-Entity Transfers of Assets Other Than Inventory
In October 2016, the FASB issued guidance that requires an entity to recognize the income tax consequences of an intra-entity transfer of an asset other than inventory when the transfer occurs. This guidance is effective for fiscal years beginning after December 15, 2017, and interim periods within those fiscal years. We adopted this guidance on January 1, 2018. As a result of adopting this guidance, we decreased retained earnings by $44.4 million for the cumulative effect as of January 1, 2018.
ASU 2016-15, Statement of Cash Flow - Classification of Certain Cash Receipts and Cash Payments
In August 2016, the FASB issued guidance that clarifies eight cash flow classification issues pertaining to cash receipts and cash payments. This guidance is effective for fiscal years beginning after December 15, 2017, and interim periods within those fiscal years. We adopted this guidance on January 1, 2018 and the adoption did not have a material impact on our business, financial condition or results of operations, except for reclassifications of certain distributions received from equity method investees, due to Delek making an accounting policy election to classify distributions received from equity method investees using the cumulative earnings approach. Under this approach, distributions received are considered returns on investment and classified as cash inflows from operating activities, unless the investor’s cumulative distributions received less distributions received in prior periods that were determined to be returns of investment exceed cumulative equity in earnings (as adjusted for amortization of basis differences) recognized by the investor. When such an excess occurs, the current-period distribution up to this excess should be considered a return of investment and classified as cash inflows from investing activities. This resulted in a reclassification of $12.4 million and $20.2 million of distributions received for the years ended December 31, 2017 and 2016, respectively, from the line item entitled dividends from equity method investments in net cash provided by (used in) operating activities to the line item entitled distributions from equity method investments in net cash provided by (used in) investing activities in the consolidated statements of cash flows.
ASU 2016-07, Investment - Simplifying the Transition to the Equity Method of Accounting
In January 2016, the FASB issued guidance that affects the accounting for equity investments, financial liabilities accounted for under the fair value option and the presentation and disclosure requirements for financial instruments. Under the new guidance, all equity investments in unconsolidated entities (other than those accounted for using the equity method of accounting) will generally be measured at fair value through earnings. There will no longer be an available-for-sale classification for equity securities with readily determinable fair values. For financial liabilities when the fair value option has been elected, changes in fair value due to instrument-specific credit risk will be recognized separately in other comprehensive income. It will require public business entities to use the exit price notion when measuring the fair value of financial instruments for disclosure purposes and separate presentation of financial assets and financial liabilities by measurement category and form of financial asset, and will eliminate the requirement for public business entities to disclose the method and significant assumptions used to estimate the fair value that is required to be disclosed for financial instruments measured at amortized cost. The new guidance is effective for annual reporting periods beginning after December 15, 2017, including interim reporting periods within that reporting period. We adopted this guidance on January 1, 2018 and the adoption did not have a material impact on our business, financial condition or results of operations.
ASU 2014-09, Revenue - Revenue from Contracts with Customers
In May 2014, the FASB issued guidance as codified in ASC 606 to clarify the principles for recognizing revenue. The core principle of the new guidance is that an entity should recognize revenue to depict the transfer of promised goods or services to customers in an amount that reflects the consideration to which the entity expects to be entitled in exchange for those goods or services. The guidance also requires improved interim and annual disclosures that enable the users of financial statements to better understand the nature, amount, timing, and uncertainty of revenues and cash flows arising from contracts with customers. The new guidance is effective for annual reporting periods beginning after December 15, 2017, including interim reporting periods within that reporting period, and can be adopted retrospectively. We adopted this guidance on January 1, 2018, using the modified retrospective transition method applied to contracts which were not completed as of January 1, 2018, and the adoption did not have a material impact on our business, financial condition or results of operations.
Accounting Pronouncements Not Yet Adopted
ASU 2019-12, Simplifying the Accounting for Income Taxes
In December 2019, the FASB issued guidance which is intended to simplify various aspects related to accounting for income taxes, eliminate certain exceptions within ASC 740 and clarify certain aspects of the current guidance to promote consistency among reporting entities. The pronouncement is effective for fiscal years, and for interim periods within those fiscal years, beginning after December 15, 2020, with early adoption permitted. We expect to adopt this guidance on the effective date and are currently evaluating the impact that adopting this new guidance will have on our business, financial condition and results of operations.
ASU 2018-15, Intangible - Customer’s Accounting for Implementation Costs Incurred in a Cloud Computing Arrangement That Is a Service Contract
In August 2018, the Financial Accounting Standards Board (the "FASB")FASB issued guidance related to customers’ accounting for implementation costs incurred in a cloud computing arrangement that is considered a service contract. This pronouncement aligns the requirements for capitalizing implementation costs in such arrangements with the requirements for capitalizing implementation costs incurred to develop or obtain internal-use software. This pronouncement is effective for fiscal years, and for interim periods within those fiscal years, beginning after December 15, 2019. Early adoption is permitted, including adoption in any interim period for which financial statements have not been issued. Entities can choose to adopt the new guidance prospectively or
retrospectively. We expect to adopt this guidance prospectively on or before the effective date and are currently evaluating the impact thatdo not expect adopting this new guidance will have a material impact on our business, financial condition andor results of operations.
ASU 2018-14, Compensation - Changes to the Disclosure Requirements for Defined Benefit Plans
In August 2018, the FASB issued guidance related to disclosure requirements for defined benefit plans. The pronouncement eliminates, modifies and adds disclosure requirements for defined benefit plans. The pronouncement is effective for fiscal years ending after December 15, 2020, and early adoption is permitted. We expect to adopt this guidance on or before the effective date and do not expect adopting this new guidance will have a material impact on our business, financial condition or results of operations.
ASU 2018-13, Fair Value Measurement - Changes to the Disclosure Requirements for Fair Value Measurement
In August 2018, the FASB issued guidance related to disclosure requirements for fair value measurements. The pronouncement eliminates, modifies and adds disclosure requirements for fair value measurements. The pronouncement is effective for fiscal years, and for interim periods within those fiscal years, beginning after December 15, 2019, with early adoption permitted. We expect to adopt this guidance on or before the effective date and do not expect adopting this new guidance will have a material impact on our business, financial condition or results of operations.
ASU 2017-12, Derivatives and Hedging - Targeted Improvements to Accounting for Hedging Activities
In August 2017, the FASB issued guidance to better align financial reporting for hedging activities with the economic objectives of those activities for both financial (e.g., interest rate) and commodity risks. The guidance was intended to create more transparency in the presentation of financial results, both on the face of the financial statements and in the footnotes, and simplify the application of hedge accounting guidance. This guidance is effective for fiscal years beginning after December 15, 2018, and interim periods within those fiscal years. Companies are required to apply the guidance on a modified retrospective transition method in which the cumulative effect of the change will be recognized within equitydisclosures included in the consolidated balance sheet as of the date of adoption. Early adoption is permitted, including in an interim period. If a company early adopts in an interim period, any adjustments should be reflected as of the beginning of the fiscal year that includes the interim period. We expect to adopt this guidance on or before the effective date and are currently evaluating the impact that adopting this new guidance will have on our business, financial condition and results of operations.statements.
ASU 2016-13, Financial Instruments - Measurement of Credit Losses on Financial Instruments
In June 2016, the FASB issued guidance requiring the measurement of all expected credit losses for financial assets held at the reporting date based on historical experience, current conditions, and reasonable and supportable forecasts. Financial institutions and other organizationsOrganizations will now use forward-looking information to better inform their credit loss estimates. This guidance is effective for interim and annual periods beginning after December 15, 2019. We expectEntities are required to adopt this guidance on or before the effective date and are currently evaluating the impact that adopting thisusing a modified retrospective approach, subject to certain limited exceptions. The new guidance will have on our business, financial condition and results of operations.
ASU 2016-02, Leases
In February 2016, the FASB issued guidance that requires the recognition of a lease liability and a right-of-use asset, initially measured at the present value of the lease payments, in the statement of financial condition for all leases with terms longer than one year. The guidance was subsequently amended to consider the impact of practical expedients and provide additional clarifications. This guidance isbe effective for fiscal yearsDelek beginning after December 15, 2018, including interim periods within those fiscal years. Early adoptionwith the first quarter of 2020 and is permitted. We plannot expected to adopt the new lease standard on January 1, 2019. We plan to elect the package of practical expedients which, among other things, allows us to carry forward the historical lease classification. We plan to also elect the practical expedient not to separate lease and non-lease components, which allows us to combine the components if certain criteria are met. Further, we plan to elect the optional transition method, which allows us to recognize a cumulative-effect adjustment to the opening balance sheet of retained earnings at the date of adoption and to not recast our comparative periods. We do not plan to elect the hindsight practical expedients, which would have allowed us to use hindsight in determining the reasonably certain lease term. We anticipate that adoption of the guidance will not have a material impact on ourthe Company's consolidated balance sheet or on our consolidated income statement, with the most significant impact consisting of the recognition of the lease liability and a right-of-use asset on our consolidated balance sheet.financial statements.
3. Acquisitions
Alon
Effective July 1, 2017, we acquired the outstanding common stock of Alon (the(as previously defined the "Delek/Alon Merger"). Prior to the Delek/Alon Merger, Old Delek owned a non-controlling equity interest of approximately 47% of the outstanding shares of Alon, which was accounted for under the equity method of accounting (See Note 7). Alon was a refiner and marketer of petroleum products, operating primarily in the south central, southwestern and western regions of the United States.
Subject to the terms and conditions of the Delek/Alon Merger Agreement (the "Merger Agreement"), at the Effective Time, each issued and outstanding share of Alon Common Stock, other than shares owned by Old Delek and its subsidiaries or held in the treasury of Alon, was converted into the right to receive 0.504 of a share of New Delek Common Stock, or, in the case of fractional shares of New Delek Common Stock, cash (without interest) in an amount equal to the product of (i) such fractional part of a share of New Delek Common Stock multiplied by (ii) $25.96 per share, which was the volume weighted average price of the Old Delek Common Stock, par value $0.01 per share as reported on the NYSE Composite Transactions Reporting System for the twenty consecutive NYSE full trading days ending on June 30, 2017. Each outstanding share of restricted Alon Common Stock was assumed by New Delek and converted into restricted stock denominated in shares of New Delek Common Stock, using the conversion rate applicable to the Delek/Alon Merger. Committed but unissued share-based awards were exchanged and converted into rights to receive share-based awards indexed to New Delek Common Stock.
In addition, subject to the terms and conditions of the Merger Agreement, each share of Old Delek Common Stock or fraction thereof issued and outstanding immediately prior to the Effective Time (other than Old Delek Common Stock held in the treasury of Old Delek, which was retired in connection with the Delek/Alon Merger) was converted at the Effective Time into the right to receive one1 validly issued, fully paid and non‑assessable share of New Delek Common Stock or such fraction thereof equal to the fractional share of New Delek Common Stock. All existing Old Delek stock options, restricted stock awards and stock appreciation rights were converted into equivalent rights with respect to New Delek Common Stock.
In connection with the Delek/Alon Merger, Alon, New Delek and U.S. Bank National Association, as trustee (the “Trustee”), entered into a First Supplemental Indenture (the “Supplemental Indenture”), effective as of July 1, 2017, supplementing the Indenture, dated as of September 16, 2013 (the “Original Indenture”; the Original Indenture, as amended by the Supplemental Indenture, is referred to as the "Indenture"), pursuant to which Alon issued its 3.00%3.0% Convertible Senior Notes due 2018 (the “Convertible Notes”), which were convertible into shares of Alon’s Common Stock, par value $0.01 per share or cash or a combination of cash and Alon Common Stock, all as provided in the Indenture. The Supplemental Indenture provided that, as of the Effective Time, the right to convert each $1,000 principal amount of the Convertible Notes based on a number of shares of Alon Common Stock equal to the Conversion Rate (as defined in the Indenture) in effect immediately prior to the Delek/Alon Merger was changed into a right to convert each $1,000 principal amount of Convertible Notes into or based on a number of shares of New Delek Common Stock (at the exchange rate of 0.504), par value $0.01 per share, equal to the Conversion Rate in effect immediately prior to the Delek/Alon Merger. In addition, the Supplemental Indenture provided that, as of the Effective Time, New Delek fully and unconditionally guaranteed, on a senior basis, Alon’s obligations under the Convertible Notes. See Note 11 for further discussion.
InAdditionally, in connection with the Indenture,Convertible Notes, Alon also entered into equity instruments, including Purchased Optionscall options (the "Call Options") and Warrants,warrants (the "Warrants"), designed, in combination, to hedge a portion of the risk associated with the potential exercise of the conversion feature
of the Convertible Notes and to minimizemitigate the dilutive effect of such potential conversion. These equity instruments, in addition to the conversion feature, represent equity instruments originally indexed to Alon Common Stock that were exchanged for instruments with terms designed to preserve the original economic intent of such instruments and indexed to New Delek Common Stock in connection with the Delek/Alon Merger. See Note 11 for further discussion.
In connection with the Delek/Alon Merger, Delek acquired 100% of the general partner and 81.6% of the limited partner interests in the Alon Partnership, which owns a crude oil refinery in Big Spring, Texas with a crude oil throughput capacity of 73,000 barrels per day ("bpd") and an integrated wholesale marketing business. Delek acquired the non-controlling interest in the Alon Partnership on February 7, 2018. In addition, as a result of the Delek/Alon Merger, Delek acquired a crude oil refinery in Krotz Springs, Louisiana with a crude oil throughput capacity of 74,000 bpd. In connection with the Delek/Alon Merger, Delek also acquired crude oil refineries in California, which have not processed crude oil since 2012. On March 16, 2018, Delek sold to World Energy, LLC the Paramount, California refinery and the California renewables facility (AltAir). The transaction to dispose of certain assets and liabilities associated with the Long Beach, California refinery, to Bridge Point Long Beach, LLC, closed July 17, 2018. Alon was a marketer of asphalt, which it distributed through asphalt terminals located predominantly in the southwestern and western United States. Alon also owned crude oil refineries in California, which have not processed crude oil since 2012. Alon is a marketer of asphalt, which it distributes through asphalt terminals located predominantly in the southwestern and western United States. On May 21, 2018, Delek sold four4 asphalt terminals (included in Delek's corporate/other segment) and its 50% interest in an asphalt joint venture to an affiliate of Andeavor. See further discussion in Note 2 and Note 8. Finally, in connection with the Delek/Alon Merger, Delek acquired Alon's retail business where Alon was the largest 7-Eleven licensee in the United States and operating approximately 300 convenience stores which market motor fuels in centralCentral and westWest Texas and New Mexico.
Transaction costs incurred by the Company in connection with theThe Delek/Alon Merger totaled approximately $6.6 million, $24.7 million and $3.0 million for the years ended December 31, 2018, December 31, 2017 and December 31, 2016, respectively. Such costs were included in general and administrative expenses in the accompanying consolidated statements of income.
The Merger was accounted for using the acquisition method of accounting, which requires, among other things, that assets acquired and liabilities assumed be recognized on the balance sheet at their fair value as of the acquisition date. Transaction costs incurred by the Company in connection with the Delek/Alon Merger totaled approximately $6.6 million and $24.7 million for the years ended December 31, 2018 and 2017, respectively. Such costs were included in general and administrative expenses in the accompanying consolidated statements of income.
Determination of Purchase Price
The componentspurchase consideration comprised of the consideration transferred were as follows (dollars in millions, except per share amounts):
|
| | | | | | |
| Delek common stock issued | 19,250,795 |
| |
| Ending price per share of Delek Common Stock immediately before the Effective Time | $ | 26.44 |
| |
| Total value of common stock consideration | | $ | 509.0 |
|
Additional consideration (1) | | 21.7 |
|
Fair value of Delek's pre-existing equity method investment in Alon (2) | | 449.0 |
|
| | | $ | 979.7 |
|
(1) Additional consideration includes the fair value of certain19,250,795 Delek common stock units valued at $509 million and equity instruments originally indexed to Alon stock that were exchanged for instruments indexed to New Delek's stock as well as the fair value ofand certain share-based payments that were required to be exchanged for awards indexed to New Delek's stock in connection with the Delek/Alon Merger.
(2) fair valued at $21.7 million. The fair value of Delek's pre-existing equity method investment in Alon was valued at $449 million on acquisition date based on the quoted market price of shares of Alon.
Final Purchase Price Allocation
The final allocation of Based on these components the aggregatetotal purchase price was $979.7 million, which was allocated as of December 31, 2018 (which was finalized as of June 30, 2018) is summarized as follows (in millions), and is inclusive of the California Discontinued Entities discussed in Note 8:follows:
| | | Cash | | $ | 215.3 |
| | $ | 215.3 |
|
| Receivables | | 176.8 |
| | 176.8 |
|
| Inventories | | 266.3 |
| | 266.3 |
|
| Prepaids and other current assets | | 38.7 |
| | 38.7 |
|
Property, plant and equipment (1) | | 1,130.3 |
| | 1,130.3 |
|
| Equity method investments | | 31.0 |
| | 31.0 |
|
Acquired intangible assets (2) | | 86.7 |
| | 86.7 |
|
Goodwill (3) | | 870.7 |
| | 870.7 |
|
| Other non-current assets | | 37.0 |
| | 37.0 |
|
| Accounts payable | | (263.4 | ) | | (263.4 | ) |
| Obligation under Supply & Offtake Agreements | | (208.9 | ) | | (208.9 | ) |
| Current portion of environmental liabilities | | (7.9 | ) | |
| Other current liabilities | | (308.6 | ) | | (308.6 | ) |
| Environmental liabilities and asset retirement obligations, net of current portion | | (226.7 | ) | |
| Environmental liabilities and asset retirement obligations | | | (234.6 | ) |
| Deferred income taxes | | (194.0 | ) | | (194.0 | ) |
| Debt | | (568.0 | ) | | (568.0 | ) |
Other non-current liabilities (4) | | (95.6 | ) | | (95.6 | ) |
| Fair value of net assets acquired | | $ | 979.7 |
| | $ | 979.7 |
|
(1) This fair value of property, plant and equipment is based on a valuation using a combination of the income, cost and market approaches. The useful lives are based upon guidelines for similar equipment, chronological ageyears since installation and consideration of costs spent on upgrades, repairs, turnarounds and rebuilds.
(2) The acquired intangible assets amount includesincluded certain identified intangibles, the following identified intangibles:most significant of which were as follows:
Third-party fuel supply agreement intangible that is subject to amortization with a fair value of $49.0 million, which is being amortized over a 10-year useful life. We recognized amortization expense for the year ended December 31, 2018 of $4.9 million. The estimated annual amortization is $4.9 million for the four succeeding fiscal years.life;
Fuel trade name intangible valued at $4.0 million, which will be amortized over 5 years. We recognized amortization expense for the year ended December 31, 2018 of $0.8 million. The estimated annual amortization is $0.8 million for the three succeeding fiscal years, with $0.4 million in the fourth succeeding year.
License agreements intangible valued at $2.6 million, which is being amortized over 8.7 years. We recognized amortization expense for the year ended December 31, 2018 of $0.1 million, as this intangible was sold in the first quarter of 2018.5 years;
Rights-of-way intangible valued at $9.5 million, which has an indefinite life.life;
Liquor license intangible valued at $8.5 million, which has an indefinite life.
Colonial Pipeline shipping rights intangible valued at $1.7 million, which has an indefinite life.
Refinery permits valued at $3.1 million, which have an indefinite life.life; and
Below-market lease intangibles valued at $8.3 million, which is being amortized over the remaining lease term.
(3) Goodwill generated as a result of the Delek/Alon Merger consists of the value of expected synergies from combining operations, the acquisition of an existing integrated refining, marketing and retail business located in areas with access to cost–advantaged feedstocks with an assembled workforce that cannot be duplicated at the same costs by a new entrant, and the strategic advantages of having a larger market presence. The total amount of goodwill that is expected to be deductible for tax purposes is $15.5 million. Goodwill has beenwas allocated to reportable segments based on various relevant factors. The updated allocation of goodwill to reportable segments in connection with the purchase price allocation isfactors as follows: Refining - $801.3 million and Retail - $44.3 million. The remainder relates to the asphalt operations, which was included in the corporate, other and eliminations segment, and which was subsequently written off as part of the impairment on assets held for sale during the first quarter of 2018.
(4) The assumed other non-current liabilities include liabilities related to above-market leases fair valued at $15.8 million, which is being amortized over the remaining lease term.
Pro Forma Financial Information
The following unaudited pro forma financial information presents the condensed combined results of operations of Delek and Alon for the yearsyear ended December 31, 2017, and 2016, as if the Delek/Alon Merger had occurred on January 1, 2016, and reflects the final purchase price allocation. The unaudited pro forma financial information is not intended to represent or be indicative of the consolidated results of operations that would have been reported had the Delek/Alon merger been completed as of January 1, 2016, and should not be taken as indicative of New Delek's future consolidated results of operations. In addition, the unaudited pro forma condensed combined results of operations do not reflect any cost savings or associated costs to achieve such savings from operating efficiencies, synergies, debt refinancing or other restructuring that may result from the Delek/Alon Merger. The pro forma financial information also does not reflect certain non-recurring adjustments that have been, or are expected to be, recorded in connection with the Delek/Alon Merger, including any accrual for integration costs or transaction costs or additional transactions costs related to the Delek/Alon Merger, nor any retrospective adjustments related to the conforming of Alon's accounting policies to Delek's accounting policies, as such adjustments are impracticable to determine, and such adjustments are not expected to be indicative of on-going operations of the combined company. Finally, the pro forma presentation of net revenues and net income is inclusive of the revenue and net income (loss) attributable to the California Discontinued Entities (which are generally not material as the majority of the California Discontinued Entities were non-operating during the pro forma period). Pro forma adjustments are tax-effected at the Company's estimated statutory tax rates.
| | | | Year Ended | | | |
| | December 31, | Year Ended December 31, |
| (in millions, except per share data) | 2017 (1) (2) | | 2016 (1) (2) | 2017 (1) (2) |
| | (unaudited) | (unaudited) |
| Net revenues | $ | 9,477.8 |
| | $ | 8,100.9 |
| $ | 9,477.8 |
|
| Net income attributable to Delek | 223.6 |
| | 16.3 |
| 223.6 |
|
| Earnings per share: | | | | |
| Basic | $ | 2.75 |
| | $ | 0.20 |
| $ | 2.75 |
|
| Diluted | $ | 2.73 |
| | $ | 0.20 |
| $ | 2.73 |
|
(1) The pro forma information for the yearsyear ended December 31, 2017 and 2016 has been updated to reflect the final purchase price allocation in the table above.
| |
(2) | The unaudited pro forma statements of operations reflect the following adjustments: |
| |
| • | To eliminate transactions between Delek and Alon for purchases and sales of refined products, reducing revenue and the associated cost of materials and other. Such pro forma eliminations resulted in a decrease to combined pro forma revenues by $59.0 million and $10.4 million million for the yearsyear ended December 31, 2017 and 2016, respectively.2017. |
To eliminate the non-recurring transaction costs incurred during the historical periods. Such adjustments to general and administrative expense have been estimated to result in an increase to pro forma pre-tax income attributable to Delek totaling $32.2 million and $13.7 million million for the yearsyear ended December 31, 2017 and 2016.2017.
To retrospectively reflect depreciation of property, plant and equipment and amortization of intangibles based on the fair value of the assets as of the acquisition date, as if that fair value had been reflected beginning January 1, 2016, and to retrospectively eliminate the amortization of any previously recorded intangibles. Such adjustments to depreciation and amortization have been estimated to result in an increase to pro forma pre-tax income attributable to Delek totaling $34.7 million and $70.8 million million for the yearsyear ended December 31, 2017 and 2016, respectively.2017.
To retrospectively reflect the accretion of asset retirement obligations and certain environmental liabilities. Such adjustments to general and administrative expense have been estimated to result in a decrease to pro forma pre-tax income attributable to Delek totaling $0.8 million and $1.6 million million for the years ended December 31, 2017 and 2016, respectively.2017.
To retrospectively reflect adjustments to interest expense, including the impact of discounts or premiums created by the difference in fair value and outstanding amounts as of the acquisition date (collectively, the “new effective yield”), by applying the new effective yield to historical outstanding amounts in the pro forma period and reversing previously recognized interest expense. Such net adjustments to interest expense have been estimated to result in an increase to pro forma pre-tax income attributable to Delek totaling $9.4 million and $20.7 million million for the yearsyear ended December 31, 2017 and 2016, respectively.2017.
To eliminate Delek’s equity income previously recorded on its equity method investment in Alon, prior to the Delek/Alon Merger. Such pro forma elimination resulted in an (increase)a decrease to pro forma pre-tax income totaling $3.2 million and $(42.2) million million for the years ended December 31, 2017 and 2016, respectively.
To eliminate the impairment charge on the equity method investment in Alon totaling $245.3 million recognized in the year ended December 31, 2016, and to2017.
To eliminate the gain on remeasurement of the equity method investment in Alon totaling $190.1 million recognized during the year ended December 31, 2017.
To record the tax effect on pro forma adjustments and additional tax benefit associated with dividends received from Alon at a combined U.S. (federal and state) income tax statutory blended rate of approximately 37% for the year ended December 31, 2017, and approximately 35% for the year ended December 31, 2016.
To adjust the weighted average number of shares outstanding based on 0.504 of a share of Delek common stock for each share of Alon common stock
outstanding as of July 1, 2017, as if they were outstanding for the entire year ended December 31, 2017, reflecting the elimination of Alon historical weighted average shares outstanding and the addition of the estimated New Delek incremental shares issued.
As of June 30, 2017, the carrying value of Delek's equity method investment in Alon was $252.6 million. During the year ended December 31, 2017, we recognized a gain of $196.4 million as a result of remeasuring the 47% equity method investment in Alon at its fair value as of the Effective Time of the Delek/Alon Merger, in accordance with ASC 805, net of a $6.3 million loss to record the reversal of accumulated other comprehensive income. This net gain of $190.1 million was recognized in the line item entitled Gaingain on remeasurement of equity method investment in Alon in the consolidated statements of income. The acquisition-date fair value of the pre-existing non-controlling interest in Alon was $449.0 million and is included in the measurement of the consideration transferred.
Delek began consolidating Alon's results of operations on July 1, 2017. Alon operations contributed $4,428.3 million, $4,649.8 million and $1,950.0 million to net revenues and $328.1 million, $394.9 million, and $90.1 million to pre-tax income for the yearyears ended December 31, 2019, 2018 and 2017, respectively, inclusive of the contribution of the California Discontinued Entities. Alon operations contributed $1,950.0 million to net revenues and and $90.1 million to pre-tax income for the year ended December 31, 2017, inclusive of the contribution of the California Discontinued Entities.
Updates to the Preliminary Purchase Price Allocation
During the year ended December 31, 2018, we continued our procedures to determine the fair value of assets acquired and liabilities assumed in the Delek/Alon Merger, as anticipated and disclosed in our 2017 Annual Report on Form 10-K (all of which were completed by June 30, 2018, within the permitted measurement period). As a result, the following changes were made to the preliminary purchase price allocation disclosed in our 2017 Annual Report on Form 10-K:
|
| | | | |
| Subsequent increases (decreases) to initial allocation of fair value of net assets acquired: | | |
Receivables (1) | | $ | 10.7 |
|
| Inventories | | (0.5 | ) |
Prepaids and other current assets (2) | | 9.7 |
|
| Property, plant and equipment | | (0.2 | ) |
Acquired intangible assets (3) | | 7.7 |
|
Accounts payable (4) | | 6.0 |
|
Obligation under Supply & Offtake Agreements (5) | | 10.9 |
|
| Current portion of environmental liabilities | | 0.4 |
|
Other current liabilities (6) | | 22.3 |
|
Environmental liabilities and asset retirement obligations, net of current portion (7) | | 65.3 |
|
Deferred income taxes (8) | | (8.4 | ) |
Other non-current liabilities (9) | | (2.8 | ) |
| Resulting increase to goodwill | | $ | 66.3 |
|
(1) Change primarily relates to the recognition of a receivable associated with a third-party indemnification agreement for asset retirement obligations for one of the acquired refineries that was previously under review, and finalization of an accrued receivable estimate.
(2) Change primarily relates to a reclassification of RINs assets from other current liabilities to other current assets.
(3) Change is primarily due to the addition of an intangible asset for certain below-market leases that had previously been identified but for which the evaluation and determination of fair value was not complete at December 31, 2017.
(4) Change is primarily due to the elimination of amounts in accounts payable in the retail segment that were determined not to have value combined with reclassifications of amounts to accounts receivable.
(5) Change relates to true-up of certain accounts related to one of the acquired supply and offtake agreements for contractual terms that were previously under review.
(6) Change is primarily due to an increase related to the reclassification of RINs assets from other current liabilities to other current assets and an increase related to the accrual of certain executive bonuses that were required under existing Alon employment agreements and related to service provided prior to the Delek/Alon Merger, net of adjustments to current income taxes payable to true up income taxes related to the acquired net assets.
(7) Change is to record the long-term portion of additional asset retirement obligations and environmental liabilities identified and/or to update preliminary estimates based on additional information.
(8) Change is related to adjustments to net deferred tax liabilities based on the updated purchase price allocation and revisions of preliminary tax estimates.
(9) Change is related to the reversal of an accrual established in the purchase price allocation related to a pre-acquisition legal contingency that was resolved during the first quarter 2018 in our favor.
During the year ended December 31, 2018, certain immaterial catch-up adjustments were recorded related to accretion of environmental liabilities and amortization of leasehold intangibles identified and valued during the final months of the measurement period.
Pipeline Assets
During the year ended December 31, 2017, Delek made two pipeline asset acquisitions, for a total purchase price of $13.0 million. Such acquisitions were accounted for as asset acquisitions, and therefore the cost of the acquisition has been allocated to the cost of the assets acquired on a relative fair value basis.
The following table summarizes the allocation of the relative fair value assigned to the asset groups for the acquisitions (in millions):
|
| | | | |
| Land | | $ | 0.2 |
|
| Property, plant and equipment | | 6.4 |
|
Intangible assets (1) | | 6.4 |
|
| Total | | $ | 13.0 |
|
(1) Intangible assets acquired represent rights-of-way assets with indefinite useful lives. Rights-of-way assets are not subject to amortization.
4. Segment Data
We aggregate our operating segments into three3 reportable segments: refining, logisticsRefining, Logistics and retail.Retail. Operations that are not specifically included in the reportable segments are included in Corporate, Other and Eliminations, which consists of the following:
Ourour corporate activities, activities;
results of certain immaterial operating segments, including our Canadian crude trading operations (as discussed in Note 12) , ;
Alon's asphalt terminal operations effective with the Delek/Alon Merger (see Note 8 for further discussion);
our equity method investment in Alon prior to the Delek/Alon Merger as well as (as discussed in Note 6);
our discontinued Paramount and Long Beach, California refinery and California renewable fuels facility operations (acquired as part of the Delek/Alon Merger - seeMerger) (see Note 8 for further discussion); and the discontinued Retail Entities operations (for 2016), and
intercompany eliminations are reported in the corporate, other and eliminations segment. In November 2016, Delek sold the Retail Entities to COPEC, as further discussed in Note 8. On March 16, 2018, Delek sold to World Energy, LLC (i) all of Delek’s membership interests in the California renewable fuels facility, (ii) certain refining assets and other related assets located in Paramount, California and (iii) certain associated tank farm and pipeline assets and other related assets located in California. On May 21, 2018, Delek sold certain assets and operations of four asphalt terminals (included in Delek's corporate/other segment), as well as an equity method investment in an additional asphalt terminal, to an affiliate of Andeavor. The transaction to dispose of certain assets and liabilities associated with our Long Beach, California refinery, to Bridge Point Long Beach, LLC, closed July 17, 2018.eliminations.
Decisions concerning the allocation of resources and assessment of operating performance are made based on this segmentation. Management measures the operating performance of each of the reportable segments based on the segment contribution margin. Segment contribution margin is defined as net revenues less cost of materials and other and operating expenses, excluding depreciation and amortization. Operations which are not specifically included in the reportable segments are included in the corporate and other category, which primarily consists of net revenues, operating costs and expenses, depreciation and amortization expense and interest income and expense associated with our discontinued operations and with our corporate headquarters.
Refining Segment
The refining segment processes crude oil and other purchased feedstocks for the manufacture of transportation motor fuels, including various grades of gasoline, diesel fuel and aviation fuel, asphalt and other petroleum-based products that are distributed through owned and third-party product terminals. The refining segment has a combined nameplate capacity of 302,000 barrels per day ("bpd") as of December 31, 2019, including the following:
75,000 bpd Tyler, Texas refinery (the "Tyler refinery");
80,000 bpd El Dorado, Arkansas refinery (the "El Dorado refinery");
73,000 bpd Big Spring, Texas refinery (the "Big Spring refinery");
74,000 bpd Krotz Springs, Louisiana refinery (the "Krotz Springs refinery"); and
a non-operating refinery located in Bakersfield, California.
Prior to the Delek/Alon Merger, the refining segment had a combined nameplate capacity of 155,000 bpd, including the 75,000 bpd Tyler refinery and the 80,000 bpd El Dorado refinery. TheAs of December 31, 2019, the refining segment also owns and operates twothree biodiesel facilities involved in the production of biodiesel fuels and related activities, located in Crossett, Arkansas, Cleburne, Texas and Cleburne, Texas. Effective withNew Albany, Mississippi (acquired in October 2019). The biodiesel industry has historically been substantially aided by federal and state tax incentives. One tax incentive program that has been significant to our renewable fuels facilities is the Delek/Alon Merger, our refining segment now also includesfederal blender's tax credit (also known as the operationsbiodiesel tax credit or "BTC"). The BTC provides a $1.00 refundable tax credit per gallon of the Big Spring refinery with a nameplate capacity of 73,000 bpd, the Krotz Springs refinery, with a nameplate capacity of 74,000 bpd and the Bakersfield refinery, which has not processed crude oil since 2012 duepure biodiesel to the high costfirst blender of crude oil relativebiodiesel with petroleum-based diesel fuel. The blender's tax credit was re-enacted in December 2019 for the years 2020 through 2022 and was retroactively reinstated for 2018 and 2019. Previously, the blender's tax credit expired on December 31, 2016, but was retroactively reinstated during the first quarter of 2018 to product yield and low asphalt demand. Alon'sextend through December 31, 2017.
The refining segment's petroleum-based products are marketed primarily in the south central, southwestern and western regions of the United States and also ships and sells gasoline into wholesale markets in the southern and eastern United States. Motor fuels are sold under the Alon or Delek brand through various terminals to supply Alon or Delek branded retail sites, including our retail segment convenience stores.sites. In addition, Alon sells motor fuels through its wholesale distribution network on an unbranded basis.
Our refining segment has services agreements with our logistics segment, which, among other things, requires the refining segment to pay service fees based on the number of gallons sold and a sharing of a portion of the margin achieved in return for providing marketing, sales and customer services at the Tyler refinery, and effective March 1, 2018, at the Big Spring refinery (see Note 6 for further discussion regarding the new marketing agreement). These intercompany transaction fees in regards to the Tyler refinery were $21.8 million, $20.4 million and $16.9 million
during the years ended December 31, 2018, 2017 and 2016, respectively. The intercompany transaction fees in regards to the Big Spring refinery for the year ended December 31, 2018 were $11.2 million. Additionally, the refining segment pays crude transportation, terminalling and storage fees to the logistics segment for the utilization of pipeline, terminal and storage assets, including effective March 1, 2018, those related to the Big Spring Logistic Assets Acquisition discussed further in Note 6. These fees were $200.4 million, $129.6 million and $123.2 million during the years ended December 31, 2018, 2017 and 2016, respectively. The logistics segment also sold $2.6 million, $5.6 million and $6.7 million of RINs to the refining segment during the years ended December 31, 2018, 2017 and 2016, respectively. The refining segment recorded sales revenues from the retail segment of $438.2 million and $186.8 million during the years ended December 31, 2018 and 2017, respectively, and recorded sales revenues from the Retail Entities, the operations of which are included in discontinued operations, in the amount of $292.1 million during the year ended December 31, 2016. The refining segment includes sales revenue from our logistics segment of $349.0 million, $57.5 million and $26.0 million during the years ended December 31, 2018, 2017 and 2016, respectively. The refining segment also includes sales revenue of $51.8 million and $11.8 million from sales of asphalt to our other segment during the years ended December 31, 2018 and 2017.Logistics Segment
Our logistics segment owns and operates crude oil and refined products logistics and marketing assets. The logistics segment generates revenue by charging fees for gathering, transporting and storing crude oil and for marketing, distributing, transporting and storing intermediate and refined products in select regions of the southeastern United States and westWest Texas for our refining segment and third parties, and sales of wholesale products in the westWest Texas market. The logistics segment is currently managing a long-term capital project on behalf of the Company for the construction of a gathering system in the Permian Basin and a long-haul crude oil pipeline that will originate in Midland, Texas and terminate near Houston, Texas. The logistics segment received management fees of $4.8 million during the year ended December 31, 2018, from the Corporate/Other segment for the management of this project.The logistics segment incurs costs in connection with the construction of the assets and is subsequently reimbursed by the Corporate/Other segment.
Retail Segment
Effective with the Delek/Alon Merger July 1, 2017 (see Note 3), Delek's retail segment includes the operations of Alon's owned and leased convenience store sites located primarily in central and westWest Texas and New Mexico. These convenience stores typically offer various grades of gasoline and diesel under the Alon or Delek brand name and food products, food service, tobacco products, non-alcoholic and alcoholic beverages, general merchandise as well as money orders to the public, primarily under the 7-Eleven and Alon brand names. Substantially all of the motor fuel sold through our retail segment is supplied by our Big Spring refinery, which is transferred to the retail segment at prices substantially determined by reference to published commodity pricing information. We operated 279252 and 302279 stores as of December 31, 20182019 and 2017,2018, respectively.
In November 2018, we terminated the license agreement with 7-Eleven, Inc. and the terms of such termination require the removal of all 7-Eleven
branding on a store-by-store basis by the earlier of December 31, 2021 or the date upon which our last 7-Eleven store is de-identified or closed. Merchandise sales at our convenience store sites will continue to be sold under the 7-Eleven brand name until 7-Eleven branding is removed at such convenience stores pursuant to the termination. In connection with certain strategic initiatives, we closed or sold 30 under-performing or non-strategic store locations for the year ended December 31, 2019 for total proceeds of $15.1 million.
Significant Inter-segment Transactions
All inter-segment transactions have been eliminated in consolidation.consolidation and consists primarily of the following:
refining segment refined product sales to the retail segment to be sold through the store locations;
refining segment sales of asphalt and refined product to entities included in corporate, other and eliminations;
logistics segment service fee revenue under service agreements with the refining segment based on the number of gallons sold and to share a portion of the margin achieved in return for providing marketing, sales and customer services;
logistics segment sales of wholesale finished product to our refining segment; and
logistics segment crude transportation, terminalling and storage fee revenue from our refining segment for the utilization of pipeline, terminal and storage assets.
Business Segment Operating Performance
The following is a summary of business segment operating performance as measured by contribution margin for the periodyear ended indicated (in millions):
| | | | | As of and For the Year Ended December 31, 2018 | | Year Ended December 31, 2019 |
| (In millions) | | Refining | | Retail | | Logistics | | Corporate,
Other and Eliminations | | Consolidated | | Refining (1) | | Logistics | | Retail | | Corporate,
Other and Eliminations | | Consolidated |
| Net revenues (excluding intercompany fees and sales) | | $ | 8,771.4 |
| | $ | 915.4 |
| | $ | 416.8 |
| | $ | 129.5 |
| | $ | 10,233.1 |
| | $ | 8,095.9 |
| | $ | 323.0 |
| | $ | 838.0 |
| | $ | 41.3 |
| | $ | 9,298.2 |
|
| Intercompany fees and sales | | 839.0 |
| | — |
| | 240.8 |
| | (1,079.8 | ) | | — |
| |
| Inter-segment fees and sales | | | 702.6 |
| | 261.0 |
| | — |
| | (963.6 | ) | | — |
|
| Operating costs and expenses: | | | | | | | | | | | | | | | | | | | | |
| Cost of materials and other | | 8,279.9 |
| | 755.8 |
| | 429.1 |
| | (904.3 | ) | | 8,560.5 |
| | 7,544.5 |
| | 336.5 |
| | 684.7 |
| | (908.5 | ) | | 7,657.2 |
|
| Operating expenses (excluding depreciation and amortization presented below) | | 465.4 |
| | 100.7 |
| | 58.7 |
| | 20.2 |
| | 645.0 |
| | 492.4 |
| | 74.1 |
| | 94.8 |
| | 20.9 |
| | 682.2 |
|
| Segment contribution margin | | $ | 865.1 |
| | $ | 58.9 |
| | $ | 169.8 |
| | $ | (66.2 | ) | | 1,027.6 |
| | $ | 761.6 |
| | $ | 173.4 |
| | $ | 58.5 |
| | $ | (34.7 | ) | | 958.8 |
|
| Depreciation and amortization | | 133.7 |
| | 24.6 |
| | 26.0 |
| | 15.1 |
| | 199.4 |
| | 134.3 |
| | 26.7 |
| | 11.2 |
| | 22.1 |
| | 194.3 |
|
| General and administrative expenses | | | | | | | | | | 247.6 |
| | | | | | | | | | 274.7 |
|
| Other operating income, net | | | | | | | | | | (31.3 | ) | | | | | | | | | | (2.5 | ) |
| Operating income | | | | | | | | | | $ | 611.9 |
| | | | | | | | | | $ | 492.3 |
|
| Total assets | | $ | 5,430.1 |
| | $ | 310.6 |
| | $ | 624.6 |
| | $ | (604.7 | ) | | $ | 5,760.6 |
| |
Capital spending (excluding business combinations)(1) | | $ | 203.9 |
| | $ | 10.0 |
| | $ | 11.6 |
| | $ | 91.7 |
| | $ | 317.2 |
| |
| Capital spending (excluding business combinations) | | | $ | 266.6 |
| | $ | 9.9 |
| | $ | 20.5 |
| | $ | 131.1 |
| | $ | 428.1 |
|
|
| | | | | | | | | | | | | | | | | | | | |
| | | Year Ended December 31, 2018 |
| (In millions) | | Refining (1) | | Logistics | | Retail | | Corporate,
Other and Eliminations | | Consolidated |
| Net revenues (excluding intercompany fees and sales) | | $ | 8,771.4 |
| | $ | 416.8 |
| | $ | 915.4 |
| | $ | 129.5 |
| | $ | 10,233.1 |
|
| Inter-segment fees and sales | | 839.0 |
| | 240.8 |
| | — |
| | (1,079.8 | ) | | — |
|
| Operating costs and expenses: | | | | | | | | | | |
| Cost of materials and other | | 8,279.9 |
| | 429.1 |
| | 755.8 |
| | (904.3 | ) | | 8,560.5 |
|
| Operating expenses (excluding depreciation and amortization presented below) | | 465.4 |
| | 58.7 |
| | 100.7 |
| | 20.2 |
| | 645.0 |
|
| Segment contribution margin | | $ | 865.1 |
| | $ | 169.8 |
| | $ | 58.9 |
| | $ | (66.2 | ) | | 1,027.6 |
|
| Depreciation and amortization | | 133.7 |
| | 26.0 |
| | 24.6 |
| | 15.1 |
| | 199.4 |
|
| General and administrative expenses | | |
| | | | | | | | 247.6 |
|
| Other operating expense, net | | | | | | | | | | (31.3 | ) |
| Operating income | | | | | | | | | | $ | 611.9 |
|
| Capital spending (excluding business combinations) | | $ | 203.9 |
| | $ | 11.6 |
| | $ | 10.0 |
| | $ | 91.7 |
| | $ | 317.2 |
|
|
| | | | | | | | | | | | | | | | | | | | |
| | | Year Ended December 31, 2017 |
| (In millions) | | Refining | | Logistics | | Retail | | Corporate,
Other and Eliminations | | Consolidated |
| Net revenues (excluding intercompany fees and sales) | | $ | 6,364.5 |
| | $ | 382.3 |
| | $ | 426.7 |
| | $ | 93.6 |
| | $ | 7,267.1 |
|
| Inter-segment fees and sales | | 256.1 |
| | 155.8 |
| | — |
| | (411.9 | ) | | — |
|
| Operating costs and expenses: | | | | | | | | | | |
| Cost of materials and other | | 5,852.2 |
| | 372.9 |
| | 350.3 |
| | (247.8 | ) | | 6,327.6 |
|
| Operating expenses (excluding depreciation and amortization presented below) | | 317.7 |
| | 43.3 |
| | 49.6 |
| | 18.4 |
| | 429.0 |
|
| Segment contribution margin | | $ | 450.7 |
| | $ | 121.9 |
| | $ | 26.8 |
| | $ | (88.9 | ) | | 510.5 |
|
| Depreciation and amortization | | 109.2 |
| | 21.9 |
| | 7.0 |
| | 15.2 |
| | 153.3 |
|
| General and administrative expenses | | | | | | | | | | 175.9 |
|
| Other operating expense, net | | | | | | | | | | 1.0 |
|
| Operating income | | | | | | | | | | $ | 180.3 |
|
| Capital spending (excluding business combinations) | | $ | 128.2 |
| | $ | 18.4 |
| | $ | 11.7 |
| | $ | 19.2 |
| | $ | 177.5 |
|
| |
(1) | Refining segment contribution margin for the year ended December 31, 2019 includes $77.6 million of BTC that was re-enacted in 2019, $36.0 million of which related to 2018 renewable blending activities. Refining segment contribution margin for the year ended December 31, 2018 includes $24.9 million of BTC that was enacted in 2018 all of which related to 2017 renewable blending activities. |
Other Segment Information
Total assets by segment were as follows as of: |
| | | | | | | | | | | | | | | | | | | | |
| | | As of and For the Year Ended December 31, 2017 |
| (In millions) | | Refining | | Retail | | Logistics | | Corporate,
Other and Eliminations | | Consolidated |
| Net revenues (excluding intercompany fees and sales) | | $ | 6,364.5 |
| | $ | 426.7 |
| | $ | 382.3 |
| | $ | 93.6 |
| | $ | 7,267.1 |
|
| Intercompany fees and sales | | 256.1 |
| | — |
| | 155.8 |
| | (411.9 | ) | | — |
|
| Operating costs and expenses: | | | | | | | | | | |
| Cost of materials and other | | 5,852.2 |
| | 350.3 |
| | 372.9 |
| | (247.8 | ) | | 6,327.6 |
|
| Operating expenses (excluding depreciation and amortization presented below) | | 317.7 |
| | 49.6 |
| | 43.3 |
| | 18.4 |
| | 429.0 |
|
| Segment contribution margin | | $ | 450.7 |
| | $ | 26.8 |
| | $ | 121.9 |
| | $ | (88.9 | ) | | 510.5 |
|
| Depreciation and amortization | | 109.2 |
| | 7.0 |
| | 21.9 |
| | 15.2 |
| | 153.3 |
|
| General and administrative expenses | | |
| | | | | | | | 175.9 |
|
| Other operating expense, net | | | | | | | | | | 1.0 |
|
| Operating income | | | | | | | | | | $ | 180.3 |
|
Total assets (2) | | $ | 4,846.5 |
| | $ | 331.4 |
| | $ | 443.5 |
| | $ | 313.8 |
| | $ | 5,935.2 |
|
Capital spending (excluding business combinations)(3) | | $ | 128.2 |
| | $ | 11.7 |
| | $ | 18.4 |
| | $ | 19.2 |
| | $ | 177.5 |
|
|
| | | | | | | | | | | | | | | | | | | | |
| | | December 31, 2019 |
| | | Refining | | Logistics | | Retail | | Corporate,
Other and Eliminations | | Consolidated |
| Total assets | | $ | 6,549.4 |
| | $ | 744.4 |
| | $ | 344.9 |
| | $ | (622.4 | ) | | $ | 7,016.3 |
|
| Less: | | | | | | | | | | |
| Inter-segment notes receivable | | (1,586.8 | ) | | — |
| | — |
| | 1,586.8 |
| | — |
|
| Inter-segment right of use lease assets | | (441.3 | ) | | — |
| | — |
| | 441.3 |
| | — |
|
| Total assets, excluding inter-segment notes receivable and right of use assets | | $ | 4,521.3 |
| | $ | 744.4 |
| | $ | 344.9 |
| | $ | 1,405.7 |
| | $ | 7,016.3 |
|
|
| | | | | | | | | | | | | | | | |
| | | As of and For the Year Ended December 31, 2016 |
| (In millions) | | Refining | | Logistics | | Corporate,
Other and Eliminations | | Consolidated |
| Net revenues (excluding intercompany fees and sales) | | $ | 3,605.1 |
| | $ | 301.3 |
| | $ | (0.6 | ) | | $ | 3,905.8 |
|
Intercompany fees and sales (4) | | 318.1 |
| | 146.8 |
| | (172.8 | ) | | 292.1 |
|
| Operating costs and expenses: | | | | | | | | |
| Cost of materials and other | | 3,614.1 |
| | 302.2 |
| | (103.4 | ) | | 3,812.9 |
|
| Operating expenses (excluding depreciation and amortization presented below) | | 212.4 |
| | 37.2 |
| | (0.3 | ) | | 249.3 |
|
| Insurance proceeds - business interruption | | (42.4 | ) | | — |
| | — |
| | (42.4 | ) |
| Segment contribution margin | | $ | 139.1 |
| | $ | 108.7 |
| | $ | (69.7 | ) | | 178.1 |
|
| Depreciation and amortization | | 88.2 |
| | 20.8 |
| | 7.4 |
| | 116.4 |
|
| General and administrative expenses | | | | | | | | 106.1 |
|
| Other operating expense, net | | | | | | | | 4.8 |
|
| Operating loss | | | | | | | | $ | (49.2 | ) |
Capital spending (excluding business combinations) (3) | | $ | 27.9 |
| | $ | 11.8 |
| | $ | 6.6 |
| | $ | 46.3 |
|
|
| | | | | | | | | | | | | | | | | | | | |
| | | December 31, 2018 |
| | | Refining | | Logistics | | Retail | | Corporate,
Other and Eliminations | | Consolidated |
| Total assets | | $ | 5,430.1 |
| | $ | 624.6 |
| | $ | 310.6 |
| | $ | (604.7 | ) | | $ | 5,760.6 |
|
| Less: | | | | | | | | | | |
| Inter-segment notes receivable | | (1,003.3 | ) | | — |
| | — |
| | 1,003.3 |
| | — |
|
| Inter-segment right of use lease assets | | — |
| | — |
| | — |
| | — |
| | — |
|
| Total assets, excluding inter-segment notes receivable and right of use assets | | $ | 4,426.8 |
| | $ | 624.6 |
| | $ | 310.6 |
| | $ | 398.6 |
| | $ | 5,760.6 |
|
(1) Capital spending excludes transaction costs capitalized in the amount of $0.4 million during the year ended December 31, 2018, that relate to the Big Spring Logistic Assets Acquisition.
(2) Assets held for sale of $160.0 million are included in the corporate, other and eliminations segment as of December 31, 2017.
(3) Capital spending excludes capital spending associated with the California Discontinued Entities of $2.6 million during the year ended December 31, 2017. Capital spending excludes capital spending associated with the Retail Entities of $14.4 million during the year ended December 31, 2017 .
(4) Intercompany fees and sales for the refining segment include revenues from the Retail Entities of $292.1 million during the year ended December 31, 2016, the operations of which are reported in discontinued operations.
5. Earnings (Loss) Per Share and Stock Repurchase Program
Earnings (Loss) Per Share
Basic earnings per share (or "EPS") is computed by dividing net income (loss) by the weighted average common shares outstanding. Diluted earnings per share is computed by dividing net income (loss), as adjusted for changes to income that would result from the assumed settlement of the dilutive equity instruments included in diluted weighted average common shares outstanding, by the diluted weighted average common shares outstanding. For all years presented, we have outstanding various equity-based compensation awards that are considered in our diluted EPS calculation when(when to do so would not be anti-dilutive,anti-dilutive), and is inclusive of awards disclosed in Note 21 to these consolidated financial statements. For those instruments that are indexed to our common stock, they are generally dilutive when the market price of the underlying indexed share of common stock is in excess of the exercise price. Additionally, in connection with the Delek/Alon Merger (disclosed in Note 3), we assumed certain equity instruments, including conversion options (associated with Convertible Debt)Notes) and Warrants, that may bewere dilutive for thein certain periods in which they were outstanding (see discussion of these instruments in Note 11). The Convertible DebtNotes conversion options were dilutive during the period they were outstanding when the incremental EPS calculated by dividing the increase in income associated with the elimination of interest expense on the convertible debt, net of tax, by the number of shares that would be issued upon conversion using the treasury stock method (which is applicable because of the cash settlement feature associated with the underlying principal) is dilutive to the overall diluted EPS calculation. The Warrants were generally dilutive during the periods they were outstanding when the market price of the underlying indexed share of common stock was in excess of the exercise price. All such instruments that may otherwise be dilutive may not be dilutive when there is net loss for the period. We also assumed Call Options in connection with the Delek/Alon Merger which were not reflected in the diluted weighted average common shares outstanding because to do so would have been antidilutive. On September 17, 2018, Delek settled the Convertible Notes for a combination of cash and shares of New Delek Common Stock (See Note 11) and in November 2018, Delek entered into Warrant Unwind Agreements (the "Unwind Agreements" - See Note 11) with the holders of our outstanding common stock warrants; therefore, these instruments were only potentially dilutive for EPS for the years ended December 31, 2018 and 2017.
The following table sets forth the computation of basic and diluted earnings per share.
| | | | | Year Ended December 31, | | Year Ended December 31, |
| | | 2018 | | 2017 | | 2016 | | 2019 | | 2018 | | 2017 |
| Numerator: | | | | | | | | | | | | |
| Numerator for EPS - continuing operations | | | | | | | | | | | | |
| Income (loss) from continuing operations | | $ | 383.6 |
| | $ | 328.5 |
| | $ | (219.7 | ) | |
| Income from continuing operations | | | $ | 331.0 |
| | $ | 383.6 |
| | $ | 328.5 |
|
| Less: Income from continuing operations attributed to non-controlling interest | | 26.7 |
| | 33.8 |
| | 20.3 |
| | 25.6 |
| | 26.7 |
| | 33.8 |
|
| Income (loss) from continuing operations attributable to Delek (numerator for basic EPS - continuing operations attributable to Delek) | | 356.9 |
| | 294.7 |
| | (240.0 | ) | |
| Income from continuing operations attributable to Delek (numerator for basic EPS - continuing operations attributable to Delek) | | | 305.4 |
| | 356.9 |
| | 294.7 |
|
| Interest on convertible debt, net of tax | | 2.6 |
| | — |
| | — |
| | — |
| | 2.6 |
| | — |
|
| Numerator for diluted EPS - continuing operations attributable to Delek | | $ | 359.5 |
| | $ | 294.7 |
| | $ | (240.0 | ) | | $ | 305.4 |
| | $ | 359.5 |
| | $ | 294.7 |
|
| | | | | | | | | | | | | |
| Numerator for EPS - discontinued operations | | | | | | | | | | | | |
| Income (loss) from discontinued operations | | $ | (8.7 | ) | | $ | (5.9 | ) | | $ | 86.3 |
| |
| Income (loss) from discontinued operations, including gain (loss) on sale of discontinued operations | | | $ | 6.6 |
| | $ | (10.9 | ) | | $ | (8.6 | ) |
| Less: Income tax expense (benefit) | | | 1.4 |
| | (2.2 | ) | | (2.7 | ) |
| Income (loss) from discontinued operations, net of tax | | | 5.2 |
| | (8.7 | ) | | (5.9 | ) |
| Less: Income from discontinued operations attributed to non-controlling interest | | 8.1 |
| | — |
| | — |
| | — |
| | 8.1 |
| | — |
|
| Income (loss) from discontinued operations attributable to Delek | | $ | (16.8 | ) | | $ | (5.9 | ) | | $ | 86.3 |
| | $ | 5.2 |
| | $ | (16.8 | ) | | $ | (5.9 | ) |
| | | | | | | | | | | | | |
| Denominator: | | | | | | | | | | | | |
| Weighted average common shares outstanding (denominator for basic EPS) | | 82,797,110 |
| | 71,566,225 |
| | 61,921,787 |
| | 75,853,187 |
| | 82,797,110 |
| | 71,566,225 |
|
| Dilutive effect of convertible debt | | 1,525,846 |
| | — |
| | — |
| | — |
| | 1,525,846 |
| | — |
|
| Dilutive effect of warrants | | 967,352 |
| | — |
| | — |
| | — |
| | 967,352 |
| | — |
|
| Dilutive effect of stock-based awards | | 1,478,093 |
| | 736,858 |
| | — |
| | 720,904 |
| | 1,478,093 |
| | 736,858 |
|
| Weighted average common shares outstanding, assuming dilution | | 86,768,401 |
| | 72,303,083 |
| | 61,921,787 |
| | 76,574,091 |
| | 86,768,401 |
| | 72,303,083 |
|
| | | | | | | | | | | | | |
| EPS: | | | | | | | | | | | | |
| Basic income (loss) per share: | | | | | | | | | | | | |
| Income (loss) from continuing operations | | $ | 4.31 |
| | $ | 4.12 |
| | $ | (3.88 | ) | | $ | 4.03 |
| | $ | 4.31 |
| | $ | 4.12 |
|
| (Loss) income from discontinued operations | | $ | (0.20 | ) | | (0.08 | ) | | 1.39 |
| | 0.07 |
| | (0.20 | ) | | (0.08 | ) |
| Total basic income (loss) per share | | $ | 4.11 |
| | $ | 4.04 |
| | $ | (2.49 | ) | | $ | 4.10 |
| | $ | 4.11 |
| | $ | 4.04 |
|
| Diluted income (loss) per share: | | | | | | | | | | | | |
| Income (loss) from continuing operations | | $ | 4.14 |
| | $ | 4.08 |
| | $ | (3.88 | ) | | $ | 3.99 |
| | $ | 4.14 |
| | $ | 4.08 |
|
| (Loss) income from discontinued operations | | $ | (0.19 | ) | | (0.08 | ) | | 1.39 |
| | 0.07 |
| | (0.19 | ) | | (0.08 | ) |
| Total diluted income (loss) per share | | $ | 3.95 |
| | $ | 4.00 |
| | $ | (2.49 | ) | | $ | 4.06 |
| | $ | 3.95 |
| | $ | 4.00 |
|
| | | | | | | | | | | | | |
| The following equity instruments were excluded from the diluted weighted average common shares outstanding because their effect would be anti-dilutive: | | | | | | | | | | | | |
| | | | | | | | | | | | | |
| Antidilutive stock-based compensation (because average share price is less than exercise price) | | 1,462,112 |
| |
|
| | 2,297,127 |
| | 1,932,179 |
| | 1,462,112 |
| | 4,080,723 |
|
| Antidilutive due to loss | | — |
| |
| | 276,094 |
| | — |
| | — |
| | — |
|
| Total antidilutive stock-based compensation | | 1,462,112 |
| | — |
| | 2,573,221 |
| | 1,932,179 |
| | 1,462,112 |
| | 4,080,723 |
|
| | | | | | | | | | | | | |
| Antidilutive convertible debt instruments (because average share price is less than exercise price) | | — |
| | 2,811,652 |
| | — |
| | — |
| | — |
| | 2,811,652 |
|
| Total antidilutive convertible debt instruments | | — |
| | 2,811,652 |
| | — |
| | — |
| | — |
| | 2,811,652 |
|
| | | | | | | | | | | | | |
| Antidilutive warrants (because average share price is less than exercise price) | | — |
| | 2,806,291 |
| | — |
| | — |
| | — |
| | 2,806,291 |
|
| Total antidilutive warrants | | — |
| | 2,806,291 |
| | — |
| | — |
| | — |
| | 2,806,291 |
|
Stock Repurchase Program
In December 2016, our Board of Directors authorized a share repurchase program for up to $150.0 million of Delek common stock. Any share repurchases under the repurchase program may be implemented through open market transactions or in privately negotiated transactions, in accordance with applicable securities laws. The timing, price and size of repurchases will be made at the discretion of management and will depend on prevailing market prices, general economic and market conditions and other considerations. The repurchase program does not obligate us to acquire any particular amount of stock and does not expire. We repurchased 762,623 shares, for a total of $25.0 million, pursuant to this repurchase program in December 2017.
On February 26, 2018, the Board of Directors approved a new $150.0 million authorization to repurchase Delek common stock. This amount has no expiration date and is in addition to any remaining amounts previously authorized. On November 6, 2018, the Board of Directors authorized the repurchase of an additional $500.0 million of Delek common stock. During the year ended December 31, 2018, we repurchased 9,022,386 shares of our common stock for a total of $365.3 million. The purchases included the 2.0 million shares of our common stock purchased from Alon Israel in connection with Delek’s rights pursuant to a Stock Purchase Agreement dated April 14, 2015, by and between Delek and Alon Israel. Alon Israel delivered a right of first offer notice to Delek on January 16, 2018, informing Delek of Alon Israel’s intention to sell the 2.0 million shares, and Delek accepted such offer on January 17, 2018. The total purchase price for the 2.0 million shares was approximately $75.3 million, or $37.64 per share.
During the year ended December 31, 2019, we repurchased 5,039,034 common shares for $178.1 million. As of December 31, 2018,2019, there was approximately $409.7$231.7 million of authorization remaining under Delek's aggregate stock repurchase program (based on repurchases that had settled as of December 31, 2018)2019).
6. Delek Logistics and the Alon Partnership
Delek Logistics
Delek Logistics is a publicly traded limited partnership that was formed by Delek in 2012 to own, operate, acquire and construct crude oil and refined products logistics and marketing assets. A substantial majority of Delek Logistics' assets are integral to Delek’s refining and marketing operations. As of December 31, 2018,2019, we owned a 61.4% limited partner interest in Delek Logistics, consisting of 15,294,046 common units, and a 94.6% interest in Delek Logistics GP, LLC which owns the entire 2.0% general partner interest, consisting of 498,038498,482 general partner units, in Delek Logistics and all of the incentive distribution rights.
The limited partner interests in Delek Logistics not owned by us are reflected in net income attributable to non-controlling interest in the accompanying consolidated statements of income and in non-controlling interest in subsidiaries in the accompanying consolidated balance sheets.
In March 2018, aDelek Logistics, through its wholly-owned subsidiary of Delek LogisticsDKL Big Spring, LLC, completed the acquisition from a subsidiary of Delek ( the(the Alon Partnership) of storage tanks and terminals that support our Big Spring, Texas refinery (the "Big Spring Logistic Assets Acquisition"), which included the execution of related commercial agreements. In addition, a new marketing agreement was entered into between the subsidiary of Delek Logistics and the Alon Partnership pursuant to which the subsidiary of Delek Logistics will provideprovides marketing services for product sales from Big Spring.Spring refinery. The cash paid for the transferred assets was $170.8 million, and the cash paid for the marketing agreement was $144.2 million. The transactions were financed with borrowings under the DKL Credit2014 Facility (as defined in Note 11 11). Additionally, the transaction resulted in the creation of a deferred tax asset related to the tax-book basis difference in the sold assets totaling $98.8 million, against which we have recorded a valuation allowance totaling $5.5 million for the portion of the deferred tax asset that relates to basis difference attributable to the non-controlling interest and therefore may not be realizable. Prior periods have not been recast in our Segment Data Note 4, as these assets did not constitute a business in accordance with the Accounting Standard Update, "ClarifyingASU 2017-01, Clarifying the Definition of a Business"Business ("ASU 2017-01"), and were accounted for as acquisitions of assets between entities under common control.
We have agreements with Delek Logistics that, among other things, establish fees for certain administrative and operational services provided by us and our subsidiaries to Delek Logistics, provide certain indemnification obligations and establish terms for fee-based commercial logistics and marketing services provided by Delek Logistics and its subsidiaries to us, including new agreements related to the Big Spring Logistic Assets Acquisition. The revenues and expenses associated with these agreements are eliminated in consolidation.
Delek Logistics is a variable interest entity, as defined under GAAP, and is consolidated into our consolidated financial statements, representing our logistics segment. With the exceptionThe assets of Delek Logistics can only be used to settle its own obligations and its creditors have no recourse to our assets. Exclusive of intercompany balances and the marketing agreement intangible asset between Delek Logistics and Delek which are eliminated in consolidation, the Delek Logistics consolidated balance sheets as of December 31, 2018 and 2017, as presented below, are included in the consolidated balance sheets of Delek.
The Delek Logistics consolidated balance sheets are presented below (in millions).:
| | | | | December 31, | | December 31, |
| | | 2018 | | 2017 | | 2019 | | 2018 |
| ASSETS | | | | | | | | |
| Cash and cash equivalents | | $ | 4.5 |
| | $ | 4.7 |
| | $ | 5.5 |
| | $ | 4.5 |
|
| Accounts receivable | | 21.6 |
| | 23.0 |
| | 13.2 |
| | 21.6 |
|
| Accounts receivable from related parties | | — |
| | 1.1 |
| |
| Inventory | | 5.5 |
| | 20.9 |
| | 12.6 |
| | 5.5 |
|
| Other current assets | | 1.0 |
| | 0.7 |
| | 2.3 |
| | 1.0 |
|
| Property, plant and equipment, net | | 312.6 |
| | 255.1 |
| | 295.0 |
| | 312.6 |
|
| Equity method investments | | 104.8 |
| | 106.5 |
| | 247.0 |
| | 104.8 |
|
| Operating lease right-of-use assets | | | 3.7 |
| | — |
|
| Goodwill | | 12.2 |
| | 12.2 |
| | 12.2 |
| | 12.2 |
|
| Intangible assets, net | | 154.0 |
| | 15.9 |
| | 131.0 |
| | 138.2 |
|
| Other non-current assets | | 8.4 |
| | 3.4 |
| | 21.9 |
| | 24.2 |
|
| Total assets | | $ | 624.6 |
| | $ | 443.5 |
| | $ | 744.4 |
| | $ | 624.6 |
|
| LIABILITIES AND DEFICIT | | | | | | | | |
| Accounts payable | | $ | 14.2 |
| | $ | 19.1 |
| | $ | 12.5 |
| | $ | 14.2 |
|
| Accounts payable to related parties | | 7.8 |
| | — |
| | 8.9 |
| | 7.8 |
|
| Current portion of operating lease liabilities | | | 1.4 |
| | — |
|
| Accrued expenses and other current liabilities | | 14.5 |
| | 12.6 |
| | 12.2 |
| | 14.5 |
|
| Long-term debt | | 700.4 |
| | 422.6 |
| | 833.1 |
| | 700.4 |
|
| Asset retirement obligations | | 5.2 |
| | 4.1 |
| | 5.6 |
| | 5.2 |
|
| Operating lease liabilities, net of current portion | | | 2.3 |
| | — |
|
| Deferred tax liabilities | | | 0.2 |
| | — |
|
| Other non-current liabilities | | 17.3 |
| | 14.3 |
| | 19.3 |
| | 17.3 |
|
| Deficit | | (134.8 | ) | | (29.2 | ) | | (151.1 | ) | | (134.8 | ) |
| Total liabilities and deficit | | $ | 624.6 |
| | $ | 443.5 |
| | $ | 744.4 |
| | $ | 624.6 |
|
Alon Partnership
TheAs part of the Delek/Alon Merger, we acquired the Alon Partnership which owns the assets and conducts the operations of the Big Spring refinery and the associated integrated wholesale marketing operations. On November 8, 2017, Delek and the Alon Partnership entered into a definitive merger agreement under which Delek agreed to acquire all of the outstanding limited partner units which Delek did not already own in an all-equity transaction (the "Alon Partnership Merger"). This transaction closed on February 7, 2018 (the "Merger Date"). Delek owned approximately 51.0 million limited partner units of the Alon Partnership, or approximately 81.6% of the outstanding units, immediately prior to the Merger Date. Under terms of the merger agreement, the owners of the remaining outstanding units in the Alon Partnership that Delek did not own immediately prior to the Merger Date received a fixed exchange ratio of 0.49 shares of New Delek common stock for each limited partner unit of the Alon Partnership, resulting in the issuance of approximately 5.6 million shares of New Delek common stock to the public unitholders of the Alon Partnership. Because the transaction represented a combination of ownership interests under common control, the transfer of equity from non-controlling interest to owned interest (additional paid-in capital) was recorded at carrying value and no gain or loss was recognized in connection with the transaction. Additionally, book-tax basis difference was created as a result of the transaction that resulted in a deferred tax asset of approximately $13.5 million, net of a valuation allowance on certain state income tax components, that also increased additional paid-in capital. Transaction costs incurred by the Company in connection with the Alon Partnership Merger totaled approximately $3.0 million for the year ended December 31, 2018. Such costs were included in general and administrative expenses in the accompanying consolidated statements of income.
The limited partner interests of the Alon Partnership prior to this acquisition were represented as common units outstanding. As of December 31, 2017, the 11.5 million common units held by the public represented approximately 18.4% of the Alon Partnership’s common units outstanding. Alon USA Partners GP, LLC (the “Alon General Partner”), our wholly-owned subsidiary, owns 100% of the general partner interest in the Alon Partnership, which is a non-economic interest.
The limited partner interests in the Alon Partnership not owned by us are reflected in net income attributable to non-controlling interest in the accompanying consolidated statements of income for the year ended December 31, 2017 and in non-controlling interest in subsidiaries in the accompanying consolidated balance sheet as of December 31, 2017.
Prior to the Alon Partnership Merger, we had agreements with the Alon Partnership, under which the Alon Partnership agreed to reimburse us for certain administrative and operational services provided by us and our subsidiaries to the Alon Partnership, indemnify us with respect to certain matters and establish terms for the supply of products by the Alon Partnership to us.
Prior to the Merger Date, the Alon Partnership was a variable interest entity, as defined under GAAP, and was consolidated into our consolidated financial statements as part of the refining segment. We have elected to push down purchase accounting to the Alon Partnership, which resulted in the push-down of the preliminary fair value of equity as purchase price consideration based on the market value of the Alon Partnership units as of the Merger Date, and the fair valuing of assets and liabilities as of the Merger Date. Such push-down purchase accounting also resulted in a determination of the fair value of our non-controlling interest in the Alon Partnership, which was estimated to be $120.6 million. With the exception of intercompany balances, which are eliminated in consolidation, the Alon Partnership condensed consolidated balance sheet asAs of December 31, 2017, as presented below, is included in the consolidated balance sheet of Delek (unaudited, in millions).
|
| | | | |
| | | December 31,
2017 |
| | |
| ASSETS | | |
| Cash and cash equivalents | | $ | 252.8 |
|
| Accounts receivable | | 96.7 |
|
| Accounts receivable from related parties | | 640.0 |
|
| Inventories | | 133.2 |
|
| Prepaid expenses and other current assets | | 5.9 |
|
| Property, plant and equipment, net | | 413.3 |
|
| Goodwill | | 576.6 |
|
| Other non-current assets | | 59.2 |
|
| Total assets | | $ | 2,177.7 |
|
| LIABILITIES AND EQUITY | | |
| Accounts payable | | $ | 44.5 |
|
| Accounts payable to related parties | | 794.2 |
|
| Accrued expenses and other current liabilities | | 161.9 |
|
| Current portion of long-term debt | | 337.4 |
|
Obligation under Supply and Offtake Agreement
| | 120.1 |
|
| Deferred income tax liability | | 1.3 |
|
| Other non-current liabilities | | 34.5 |
|
| Equity | | 683.8 |
|
| Total liabilities and equity | | $ | 2,177.7 |
|
Transaction costs incurred by the Company in connection with the Alon Partnership Merger totaled approximately $3.0 million for the year ended December 31, 2018. Such costs were included in general2019 and administrative expenses in the accompanying condensed consolidated statements of income.
As of December 31, 2018, the Alon Partnership is included in Delek's condensed consolidated balance sheet as a wholly-owned subsidiary.
7. Equity Method Investments
Wink to Webster Pipeline LLC ("WWP")
On July 30, 2019, we, through our wholly-owned direct subsidiary Delek US Energy, Inc. (“Delek Energy”), entered into a limited liability company agreement (the “LLCA”) and related agreements with multiple joint venture members of Wink to Webster Pipeline LLC (“WWP”). Pursuant to the LLCA, Delek Energy acquired a 15% ownership interest in WWP ("WWP Joint Venture"). WWP intends to construct and operate a crude oil pipeline system from Wink, Texas to Webster, Texas along with certain pipelines from Webster, Texas to other destinations in the Gulf Coast area. Pursuant to the LLCA, Delek Energy will be required to contribute its percentage interest of the applicable construction costs (including certain costs previously incurred by WWP) and it is anticipated that Delek Energy’s capital contributions will total approximately $340 million to $380 million over the course of construction (expected to be two to three years). During the year ended December 31, 2019, we made capital contributions totaling $126.7 million. Subsequent to December 31, 2019, we made additional capital contributions totaling $18.9 million based on capital calls received.
As of December 31, 2019, Delek's investment balance in WWP totaled $125.3 million, and our portion of net losses was $1.4 million for the year ended December 31, 2019. This investment is accounted for using the equity method and is included as part of total assets in corporate, other and eliminations in our segment disclosure.
Subsequent to December 31, 2019, on February 21, 2020, we, through our wholly-owned direct subsidiary Delek Energy, entered into the W2W Holdings LLC Agreement with MPLX Operations LLC ("MPLX") (collectively, with its wholly-owned subsidiaries, the "WWP Project Financing Joint Venture" or the "WWP Project Financing JV"). The WWP Project Financing JV was created for the specific purpose of obtaining financing, through its wholly-owned subsidiary, W2W Finance LLC, to fund our combined capital calls resulting from and occurring during the construction period of the pipeline system under the WWP Joint Venture, and to service that debt. In connection with the arrangement, both Delek Energy and MPLX contributed their respective 15% ownership interests to the WWP Project Financing JV as collateral for and in service of the related project financing. Accordingly, distributions received from WWP through the WWP Project Financing JV will first be applied in service of the related project financing debt, with excess distributions being made to the members of the WWP Project Financing JV as provided for in the W2W Holdings LLC Agreement. The obligations of the members under the W2W Holdings LLC Agreement are guaranteed by the parents of the members of the WWP Project Financing JV (i.e., for Delek Energy, the guarantee is from Delek US Holdings, Inc.).
Red River Pipeline Company LLC ("Red River")
In May 2019, Delek Logistics, through its wholly owned indirect subsidiary DKL Pipeline, LLC (“DKL Pipeline”), entered into a Contribution and Subscription Agreement (the “Contribution Agreement”) with Plains Pipeline, L.P. (“Plains”) and Red River Pipeline Company LLC (“Red River”). Pursuant to the Contribution Agreement, DKL Pipeline contributed $124.7 million, substantially all of which was financed under the Delek Logistics Credit Facility (as defined in Note 11), to Red River in exchange for a 33% membership interest in Red River and DKL Pipeline’s admission as a member of Red River ("Red River Pipeline Joint Venture"). Red River owns a 16-inch crude oil pipeline running from Cushing, Oklahoma to Longview, Texas, with an expansion project planned to increase the pipeline capacity, which is expected to be completed during the first half of 2020. Delek Logistics contributed an additional $3.5 million related to such expansion project in May 2019. As of December 31, 2019, Delek's investment balance in Red River totaled $131.0 million, and we recognized income on the investment totaling $8.4 million for the year ended December 31, 2019. This investment is accounted for using the equity method and is included as part of total assets in our logistics segment.
Other Investments
On May 14, 2015, Delek acquired from Alon Israel Oil Company, Ltd. ("Alon Israel") approximately 33.7 million shares of common stock (the "ALJ Shares") of Alon pursuant to the terms of a stock purchase agreement with Alon Israel dated April 14, 2015 (the "Alon Acquisition"). The ALJ Shares represented an equity interest in Alon of approximately 48% at the time of acquisition.
As of December 31, 2016, our investment balance in Alon was $259.0 million (our Our equity method investment in Alon prior to the Delek/Alon Merger was reported in the corporate, other and eliminations segment) and the excess of our initial investment over our net equity in the underlying net assets of Alon was approximately $11.9 million. This excess was included in equity method investments in our consolidated balance sheet and a portion had been attributed to property, plant and equipment and definite lived intangible assets. These portions of the excess were amortized as a reduction to earnings from equity method investments on a straight-line basis over the lives of the related assets. The earnings from this equity method investment reflected in our consolidated statements of income include our share of net earnings or losses directly attributable to this equity method investment, and amortization of the excess of our investment balance over the underlying net assets of Alon prior to the Delek/Alon Merger. We evaluated our investment in Alon as of September 30, 2016, and determined that the decline in the market value of the ALJ Shares was other than temporary and, therefore, it was necessary to record an impairment charge of $245.3 million on our investment based on the quoted market price of our ALJ Shares, which is a Level 1 fair value measurement. Our decision that the decline in market value of the ALJ shares was other than temporary was primarily based on the following factors: the duration of the period in which the fair market value had been below our investment balance and the decreased possibility of a recovery in the near term as a result of Alon's year-end financial performance, as well as expectations of Alon's future operating performance. This impairment is reflected in the loss on impairment of equity method investment in our consolidated statements of income for the year ended December 31, 2016.
Effective July 1, 2017, Alon became a wholly-owned subsidiary of New Delek in connection with the Delek/Alon Merger. In connection with the acquisition, we recognized a gain of $196.4 as a result of remeasuring the 47% equity method investment in Alon at its fair value as of the Effective Time of the Delek/Alon Merger, in accordance with ASC 805, net of a $6.3 million loss to record the reversal of accumulated other comprehensive income. This net gain of $190.1 million was recognized in the line item entitled Gaingain on remeasurement of equity method investment in Alon in the consolidated statements of income. The acquisition-date fair value of the pre-existing non-controlling interest in Alon was $449.0 million and is included in the measurement of the consideration transferred. See Note 3 for further discussion.
Below are the summarized financial information of the results of operations of Alon (in millions) for the previous periods when Alon was accounted for as an equity method investment:
| | | Income Statement Information | | For the period January 1, 2017 to June 30, 2017 | | Year Ended December 31, 2016 | | For the period January 1, 2017 to June 30, 2017 |
| Net revenues | | $ | 2,269.7 |
| | $ | 3,913.4 |
| | $ | 2,269.7 |
|
| Gross profit | | 351.2 |
| | 536.6 |
| | 351.2 |
|
| Pre-tax income (loss) | | 20.0 |
| | (126.6 | ) | |
| Net income (loss) | | 15.0 |
| | (79.8 | ) | |
| Net income (loss) attributable to Alon | | 9.5 |
| | (82.8 | ) | |
| Pre-tax income | | | 20.0 |
|
| Net income | | | 15.0 |
|
| Net income attributable to Alon | | | 9.5 |
|
In addition to Red River, Delek Logistics has two2 other joint ventures that own and operate logistics assets, and which serve third parties and subsidiaries of Delek. One of the joint venture projects was completed and began operations in September 2016. The other was completed and began operations in January 2017. As of December 31, 20182019 and 2017,2018, Delek Logistics' investment balance in these joint ventures was $104.8$116.0 million and $106.5$104.8 million, respectively, and are accounted for using the equity method.
In July 2017, Delek Renewables, LLC invested in a joint venture with an unrelated third party that was formed to plan, develop, construct, own, operate and maintain a terminal consisting of an ethanol unit train facility with an ethanol tank in North Little Rock, Arkansas. This investment was financed through cash from operations. As of December 31, 2018 and 2017, Delek Renewables, LLC's investment balance in this joint venture was $2.4 million and $2.2 million respectively, and was accounted for using the equity method. The investment in this joint venture is reflected in the refining segment.
Effective with the Delek/Alon Merger, we acquired a 50% interest in two2 joint ventures that own asphalt terminals located in Fernley, Nevada, and Brownwood, Texas. On May 21, 2018, Delek sold its 50% interest in the asphalt terminal located in Fernley, Nevada. See Note 8 for further discussion. As of December 31, 2019 and 2018, Delek's investment balance in the Brownwood, Texas joint venture was $30.7 million and $23.1 million, and as of December 31, 2017, Delek'srespectively. This investment balance in both joint ventures was $29.4 million. These investments areis accounted for using the equity method and areis included as part of total assets in the corporate, other and eliminations segment.in our segment disclosure.
8. Discontinued Operations and Assets Held for Sale
Asphalt Terminals Held for Sale
On February 12, 2018, Delek announced it had reached a definitive agreement to sell certain assets and operations of four4 asphalt terminals (included in Delek's corporate/corporate, other segment)and eliminations in our segment disclosure), as well as an equity method investment in an additional asphalt terminal, to an affiliate of Andeavor. This transaction includesincluded asphalt terminal assets in Bakersfield, Mojave and Elk Grove, California and Phoenix, Arizona, as well as Delek’s 50% equity interest in the Paramount-Nevada Asphalt Company, LLC joint venture that operatesoperated an asphalt terminal located in Fernley, Nevada. On May 21, 2018, Delek completed the transaction and received net proceeds of approximately $110.8 million, inclusive of the $75.0 million base proceeds as well as certain preliminary working capital adjustments. The assets associated with the owned terminals met the definition of held for sale pursuant to ASC 360 as of February 1, 2018, but did not meet the definition of discontinued operations pursuant to ASC 205-20, as the sale of these asphalt assets doesdid not represent a strategic shift that willwould have a major effect on the entity's operations and financial results. Accordingly, depreciation ceased as of February 1, 2018, and the assets to be sold were reclassified to assets held for sale as of that date and were written down to the estimated fair value less costs to sell, resulting in an impairment loss on assets held for sale of $27.5 million for the year ended December 31, 2018. All goodwill associated with the asphalt operations sold was written off in connection with the impairment charge discussed above. In connection with the completion of the sale transaction, we recognized a gain of approximately $13.3 million, resulting primarily from the recognition of certain additional proceeds at closing associated with the asphalt terminals which were not previously determinable or probable and the recognition of the gain on the sale of the joint venture which was not previously recognized as held for sale (as it did not meet the criteria). Such gain on sale of the asphalt assets is reflected in results of continuing operations on the accompanying consolidated income statement.
These associated assets did not meet the definition of held for sale pursuant to ASC 360 as of December 31, 2017, and therefore were not reflected as held for sale as of December 31, 2017 nor as discontinued operations in the consolidated financial statementsstatement for the yearsyear ended December 31, 2018 and 2017.2018.
California Discontinued Entities
During the third quarter 2017, we committed to a plan to sell certain assets associated with our Paramount and Long Beach, California refineries (both non-operating refineries) and our California renewable fuels facility (AltAir), which were acquired as part of the Delek/Alon Merger. As a result of this decision and commitment to a plan, and because it was made within three months of the Delek/Alon Merger, we met the requirements under ASC 205-20 and ASC 360 to report the results of the California Discontinued Entities as discontinued operations and to classify the California Discontinued Entities as a group of assets held for sale as of July 1, 2017. The property, plant and equipment of the California Discontinued Entities were recorded at fair value as part of the Delek/Alon Merger, and we have not recorded any depreciation of these assets since the Delek/Alon Merger.
Sale of Paramount Refinery Assets and Altair
On March 16, 2018, Delek sold to World Energy, LLC ("World Energy") (i) all of Delek’s membership interests in AltAirthe California renewable fuels facility ("AltAir") (ii) certain refining assets and other related assets located in Paramount, California and (iii) certain associated tank farm and pipeline assets and other related assets located in California. Upon final settlement (excluding contingent components), Delek expects to receive net cashThe sale involved initial proceeds of approximately $85.2 million, which includesdue at closing, a post-closingsubsequent working capital
settlement Delek’s portion of the expected biodiesel tax creditas well as contingent proceeds for 2017 and certain customary adjustments. The sale resulted in a loss on sale of discontinued operations totaling approximately $41.4 million for the year ended December 31, 2018. Of the total expected proceeds, $70.4 million was received in 2018 ($14.9 million of which were included in net cash flows from investing activities in discontinued operations). Additionally, Delek will be entitled to itsDelek's pro rata portion of any tax creditsBTC relating to AltAir activities in 2018 earned through the sale date ifin connection with the re-enactment of the 2018 biodiesel tax credit is re-enacted. ABTC that occurred in December 2019, and other final adjustments on retained contingent liabilities. In August 2019, we reached an agreement with World Energy to offset amounts payable by Delek under our seller obligations for the Ten-Tex Litigation matter (defined and further discussed in Note 14) against the working capital settlement receivable for such additional contingent proceeds will be recorded whenreferenced above, and to convert the criteria for recognition are met, which is predicated upon reenactmentnet receivable to a promissory note in the amount of $12.3 million (the "World Energy Note Receivable" or the tax credit and determination of the amounts earned by AltAir. "Note Receivable").
In connection with the sale, including the initial proceeds and the subsequent resolution of contingencies, we recorded the following:
|
| | | | | | | | | | | | |
| | Recognized in 2019 | | Recognized in 2018 | | | Total Transaction |
| (in millions) | Amount | | Amount | Location | | Amount |
| Initial cash proceeds received in March 2018: | | | | | | |
| Continuing operations | $ | — |
| | 55.5 |
| Cash flows from investing activities - continuing operations | | $ | 55.5 |
|
| Discontinued operations | — |
| | 14.9 |
| Cash flows from investing activities - discontinued operations | | 14.9 |
|
| Total cash proceeds | $ | — |
| | $ | 70.4 |
| | | $ | 70.4 |
|
| Add (less) non-cash balance sheet adjustments: | | | | | | |
| Receivable for working capital settlement | (14.8 | ) | | 14.8 |
| Balance sheet - Other current assets (other receivables) | | — |
|
Note Receivable for working capital settlement, net of actual litigation settlement (1) | 12.3 |
| | — |
| Balance sheet - Other current and non-current assets (notes receivable) | | 12.3 |
|
| Relief of existing liability for contingent litigation (net of immaterial rounding) | 4.9 |
| | — |
| Balance sheet - Other current liabilities | | 4.9 |
|
| Net Contingent Proceeds Receivable related to re-enactment of 2018 BTC | 5.7 |
| | — |
| Balance sheet - Other current assets (other receivables) and other current liabilities (other accrued liabilities) | | 5.7 |
|
| Additional proceeds | 8.1 |
| | 14.8 |
| | | 22.9 |
|
| Total expected proceeds | $ | 8.1 |
| | $ | 85.2 |
| | | $ | 93.3 |
|
| | | | | | | |
| Pre-tax loss (gain) on sale: | | | | | | |
| Initial loss on sale recognized in March 2018 | $ | — |
| | $ | 41.4 |
| Loss on sale of discontinued operations | | 41.4 |
|
| Subsequent reduction of contingent litigation accrual related to July 2019 settlement | (2.4 | ) | | — |
| Gain on sale of discontinued operations | | (2.4 | ) |
| Subsequent accrual for contingent proceeds due upon re-enactment of the 2018 BTC | (5.7 | ) | | — |
| Gain on sale of discontinued operations | | (5.7 | ) |
| Total (gain) loss on sale before taxes | $ | (8.1 | ) | | $ | 41.4 |
| | | $ | 33.3 |
|
(1) The World Energy Note Receivable bears interest at a fixed rate of 6.0% per annum payable monthly, and requires monthly principal payments totaling approximately $0.5 million beginning in January 2020. The Note Receivable matures on December 31, 2021, subject to acceleration clauses if certain events occur. In the event that the BTC is re-enacted for 2018 and/or 2019 resulting in proceeds to World Energy for Altair's qualifying credits, the Note Receivable also provides for the pre-payment of the lesser of the remaining assets and liabilities associated withoutstanding balance (and all accrued interest) or the sold operations that were not includedamount of the BTC proceeds received will be payable to Delek within 15 days of such receipt. Because the BTC was re-enacted for those periods in December 2019, this acceleration provision will be applicable when the assets and liabilities acquired/assumedBTC proceeds are received by the buyer were reclassified into assets and liabilities held and used (relatingWorld Energy, which is expected to continuing operations) and are presented as suchoccur in our December 31, 2018 balance sheet.2020.
Sale of Long Beach Refinery Net Assets
The transaction to dispose of certain assets and liabilities associated with our Long Beach, California refinery to Bridge Point Long Beach, LLC closed July 17, 2018 resulting in initial cash proceeds of approximately $14.5 million, net of expenses, and resulting in a gain on sale of discontinued operations of approximately $1.4 million forduring the year endedthird quarter of 2018. We retained certain asset retirement obligations in connection with the disposition of the Long Beach refinery related to work that was required subsequent to the sale. As of December 31, 2018.2019, the work has been completed and the remaining unused asset retirement obligations were written off resulting in additional gain on sale of discontinued operations of $1.9 million.
The carrying amount of the major classes of assets and liabilities of the California Discontinued Entities included in assets held for sale and liabilities associated with assets held for sale are as follows (in millions):
|
| | | | | |
| | | | December 31, 2017 |
| Assets held for sale: | | | |
| Cash and cash equivalents | | | $ | 10.1 |
|
| Accounts receivable | | | 7.9 |
|
| Inventory | | | 1.9 |
|
| Other current assets | | | 1.3 |
|
| Property, plant & equipment, net | | | 130.0 |
|
| Other intangibles, net | | | 6.6 |
|
| Other non-current assets | | | 2.2 |
|
| Assets held for sale | | | $ | 160.0 |
|
| Liabilities associated with assets held for sale: | | | |
| Accrued expenses and other current liabilities | | | $ | 9.5 |
|
| Deferred tax liabilities | | | 63.9 |
|
| Other non-current liabilities | | | 32.5 |
|
| Liabilities associated with assets held for sale | | | $ | 105.9 |
|
Once the operating assetsOperating Results of the California Discontinued Entities met the criteria to be classified as assets held for sale, the operations associated with these properties qualified for reporting as discontinued operations. Accordingly, theOperations
The operating results, net of tax, from discontinued operations associated with the California Discontinued Entities are presented separately in Delek’s consolidated statements of income and the notes to the consolidated financial statements have been adjusted to exclude the discontinued operations. Classification as discontinued operations requires retrospective reclassification of the associated assets, liabilities and results of operations for all periods presented, beginning (in this case) as of the date of acquisition, which was July 1, 2017. Components of amounts reflected in income from discontinued operations are as follows (in millions):
| | | | | Year Ended | Year Ended |
| | | December 31, 2018 | | December 31, 2017 | | December 31, 2019 | | December 31, 2018 | | December 31, 2017 |
| Net revenues | | $ | 32.5 |
| | $ | 82.4 |
| | $ | — |
| | $ | 32.5 |
| | $ | 82.4 |
|
| Cost of sales: | | | | | | | | | | |
| Cost of materials and other | | 3.8 |
| | (68.7 | ) | | — |
| | 3.8 |
| | (68.7 | ) |
| Operating expenses (excluding depreciation and amortization) | | (9.4 | ) | | (14.4 | ) | | — |
| | (9.4 | ) | | (14.4 | ) |
| Total cost of sales | | (5.6 | ) | | (83.1 | ) | | — |
| | (5.6 | ) | | (83.1 | ) |
| General and administrative expenses | | (1.1 | ) | | (6.0 | ) | | — |
| | (1.1 | ) | | (6.0 | ) |
| Other operating income, net | | 0.3 |
| | (0.2 | ) | | — |
| | 0.3 |
| | (0.2 | ) |
| Interest expense | | — |
| | (1.7 | ) | | — |
| | — |
| | (1.7 | ) |
| Interest income | | 3.0 |
| | — |
| | — |
| | 3.0 |
| | — |
|
| Other expense, net | | — |
| | — |
| | — |
| | — |
| | — |
|
| Loss on sale of California Discontinued Entities | | (40.0 | ) | | — |
| |
| Loss from discontinued operations before taxes | | (10.9 | ) | | (8.6 | ) | |
| Income tax benefit | | (2.2 | ) | | (2.7 | ) | |
| Loss from discontinued operations, net of tax | | $ | (8.7 | ) | | $ | (5.9 | ) | |
Gain (loss) on sale of California Discontinued Entities (1) | | | 6.6 |
| | (40.0 | ) | | — |
|
| Income (loss) from discontinued operations before taxes | | | 6.6 |
| | (10.9 | ) | | (8.6 | ) |
| Income tax expense (benefit) | | | 1.4 |
| | (2.2 | ) | | (2.7 | ) |
Income (loss) from discontinued operations, net of tax (2) | | | $ | 5.2 |
| | $ | (8.7 | ) | | $ | (5.9 | ) |
| |
(1) | See detail of subsequent adjustments to Gain (loss) on sale of discontinued operations in the table below. |
| |
(2) | Included in loss from discontinued operations is net income attributable to non-controlling interest totaling $(8.1) million related to AltAir for the year ended December 31, 2018. |
Subsequent Adjustments to Gain (Loss) on Sale of Discontinued OperationsThe net assetsSubsequent to the disposition of the California Discontinued Entities, include a non-controlling interest totaling $10.5 million aswe recognized certain adjustments that were attributable to operations of December 31, 2017the California Discontinued Entities for periods prior to disposition, including (but not necessarily limited to): litigations, claims or assessments related to AltAir. The income (loss) attributablematters/events that occurred prior to disposition; indemnification of certain liabilities that related to the non-controlling interest included $8.1 millionCalifornia Discontinued Entities and $(0.6) million relatedarose prior to AltAir for the years ended December 31, 2018disposition; and 2017.
Retail Entities
In August 2016, Delek entered intoresolution of other contingencies including contingent proceeds. The following table provides a Purchase Agreement to sell the Retail Entities to COPEC. As a resultdetail of the Purchase Agreement, we metsubsequent adjustments to the requirements of ASC 205-20 and ASC 360 to report the results of the Retail Entities as discontinued operations and to classify the Retail Entities as a group of assets held for sale. The fair value assessment of the Retail Entities as of August 27, 2016 did not result in an impairment. We ceased depreciation of these assets as of August 27, 2016. The Retail Transaction closed in November 2016, and we received net cash consideration of $378.9 million, net of debt repayments and transaction costs, and retained approximately $62.8 million of net liabilities from the Retail Entities. The Retail Transaction resulted in a gain (loss) on sale of discontinued operations, as well as the Retail Entities, before income tax, of $134.1 million in 2016.remaining identified contingent liabilities:
|
| | | | | | | |
| | Year Ended |
| (in millions) | December 31, 2019 | | December 31, 2018 |
| Subsequent adjustments to gain (loss) on sale of discontinued operations (pre-tax): | | | |
Reduction of AltAir-related contingent litigation accrual related to July 2019 settlement (1) | $ | 2.4 |
| | $ | — |
|
| Accrual for AltAir-related contingent proceeds due upon re-enactment of the 2018 BTC | 5.7 |
| | — |
|
| Reduction of Paramount-related accrual for California emissions credits requirements | (3.4 | ) | | — |
|
| Write-off related to retained Long Beach asset retirement obligations and environmental liabilities | 1.9 |
| | — |
|
| Total adjustments to gain (loss) on sale of discontinued operations (pre-tax) | $ | 6.6 |
| | $ | — |
|
| | | | |
| | As of |
| (in millions) | December 31, 2019 | | December 31, 2018 |
| Remaining identified contingent liabilities (recorded in other current liabilities): | | | |
AltAir-related Ten-Tex Litigation Accrual (1) | $ | — |
| | $ | 5.0 |
|
| Paramount-related accrual for California emissions credits requirements | $ | 3.4 |
| | $ | — |
|
| |
(1) | Relates to the "Ten-Tex Litigation" further discussed in Note 14. |
Under the terms of the Purchase Agreement, Lion Oil and MAPCO Express entered into a supply agreement at the closing of the Retail Transaction pursuant to which Lion Oil would supply fuel to retail locations owned by MAPCO Express for a period of 18 months following the closing of the Retail Transaction (the "Fuel Supply Agreement"). We recorded net revenues of $148.5 million, $410.5 million and $54.3 million and net cash inflows of $166.2 million, $411.5 million and $43.5 million for the years ended December 31, 2018, 2017 and
2016, respectively, associated with the Fuel Supply Agreement.
Once the Retail Entities were identified as assets held for sale, the operations associated with these properties qualified for reporting as discontinued operations. Accordingly, the operating results, net of tax, from discontinued operations are presented separately in Delek’s consolidated statements of income and the notes to the consolidated financial statements have been adjusted to exclude the discontinued operations. Components of amounts reflected in income from discontinued operations are as follows (in millions):
|
| | | | |
| | | Year Ended |
| | | December 31, 2016 |
| Net revenues | | $ | 1,216.3 |
|
| Cost of materials and other | | (1,041.2 | ) |
| Operating expenses | | (116.4 | ) |
| General and administrative expenses | | (21.8 | ) |
| Depreciation and amortization | | (20.4 | ) |
| Interest expense | | (6.4 | ) |
| Gain on sale of Retail Entities | | 134.1 |
|
| Income from discontinued operations before taxes | | 144.2 |
|
| Income tax expense | | 57.9 |
|
| Income from discontinued operations, net of tax | | $ | 86.3 |
|
9. Inventory
Crude oil, work in process, refined products, blendstocks and asphalt inventory for all of our operations, excluding the Tyler refinery and merchandise inventory in our retail segment, are stated at the lower of cost determined using the FIFO basis or net realizable value. Cost of all inventory at the Tyler refinery is determined using the LIFO inventory valuation method and inventory is stated at the lower of LIFO cost or market. Retail merchandise inventory consists of cigarettes, beer, convenience merchandise and food service merchandise and is stated at estimated cost as determined by the retail inventory method.
Carrying value of inventories consisted of the following (in millions):
| | | | | December 31,
2018 | | December 31,
2017 | | December 31, 2019 | | December 31, 2018 |
| Refinery raw materials and supplies | | $ | 289.0 |
| | $ | 308.0 |
| | $ | 400.4 |
| | $ | 289.0 |
|
| Refinery work in process | | 58.9 |
| | 79.2 |
| | 109.1 |
| | 58.9 |
|
| Refinery finished goods | | 304.1 |
| | 366.4 |
| | 397.5 |
| | 291.1 |
|
| Retail fuel | | 8.0 |
| | 8.3 |
| | 7.3 |
| | 8.0 |
|
| Retail merchandise | | 25.4 |
| | 25.6 |
| | 19.8 |
| | 25.4 |
|
| Logistics refined products | | 5.5 |
| | 20.9 |
| | 12.6 |
| | 5.5 |
|
| Total inventories | | $ | 690.9 |
| | $ | 808.4 |
| | $ | 946.7 |
| | $ | 677.9 |
|
At December 31, 2019, we recorded a pre-tax inventory valuation reserve of $1.7 million, $1.2 million of which related to LIFO inventory, due to a market price decline below our cost of certain inventory products. At December 31, 2018, we recorded a pre-tax inventory valuation reserve of $54.0 million, $39.4 million of which related to LIFO inventory, due to a market price decline below our average cost of certain inventory products, which is subject to reversal in subsequent periods, not to exceed LIFO cost, should market prices recover. At December 31, 2017, we recorded a pre-tax inventory valuation reserve of $2.4 million, $1.5 million of which related to LIFO inventory, which reversed in the first quarter of 2018.2019 due to the sale of inventory quantities that gave rise to the December 31, 2018 reserve. For the years ended December 31, 2019, 2018 2017 and 2016,2017, we recognized a net LIFO inventory valuation (losses) gains related to the pre-tax valuation of $(37.9) million, $14.5 million and $33.8 million, respectively, which were recorded as a component ofreduction (increase) in cost of materials and other in the accompanying consolidated statements of income.income related to the change in pre-tax inventory valuation of $52.3 million, $(51.3) million and $14.0 million, respectively.
At December 31, 20182019 and 2017,2018, the excess of replacement cost over the carrying value (LIFO) of the Tyler refinery inventories was $14.9 million and $1.5 million, and $9.0 million, respectively.
Permanent Liquidations
We incurred a permanent reduction in a LIFO layer resulting in liquidation gain (loss) gain in our refinery inventory of $9.2 million, $(7.5) million $0.9 million and $(2.2)$0.9 million during the years ended December 31, 2019, 2018 2017 and 2016,2017, respectively. These liquidation (losses) gains were recognized as a component of cost of materials and other in the accompanying consolidated statements of income.
10. Crude Oil Supply and Inventory Purchase Agreements
Delek has Master Supply and Offtake Agreements (the "Supply and Offtake Agreements") with J. Aron & Company ("J. Aron").
in connection with its El Dorado, refinery operations
ThroughoutBig Spring and Krotz Spring refineries (collectively, the term"Supply and Offtake Agreements"). Pursuant to the Supply and Offtake Agreements, (i) J. Aron agrees to sell to us, and we agree to buy from J. Aron, at market prices, crude oil for processing at these refineries and (ii) we agree to sell, and J. Aron agrees to buy, at market prices, certain refined products produced at these refineries. The Supply and Offtake Agreements also provide for the lease to J. Aron of crude oil and refined product storage facilities, and the identification of prospective purchasers of refined products on J. Aron’s behalf. At the inception of the Supply and Offtake Agreement that supportsAgreements, we transferred title to a certain number of barrels of crude and other inventories to J. Aron (the "Step-In"), and the operations of our refinery located in El Dorado, Arkansas (the "El Dorado Supply and Offtake Agreement"), which was amended on February 27, 2017 to change, among other things,Agreements require the repurchase of remaining inventory (including certain terms related to pricing and an extension"Baseline Volumes") at the termination of the maturity date to April 30, 2020, Lion Oil Company ("Lion Oil"those Agreements (the "Step-Out") (as the primary legal entity associated with the El Dorado refinery for purposes of this Agreement) and J. Aron will identify mutually acceptable contracts for the purchase of crude oil from third parties and J. Aron will supply up to 100,000 bpd of crude oil to the El Dorado refinery. Crude oil supplied to the El Dorado refinery by J. Aron will be purchased daily at an estimated average monthly market price by Lion Oil. J. Aron will also purchase all refined products from the El Dorado refinery at an estimated daily market price, as they are produced. These daily purchases and sales are trued-up on a monthly basis in order to reflect actual average monthly prices. We have recorded a receivable related to this monthly settlement of $7.8 million and $0.3 million as of December 31, 2018 and 2017, respectively. Also pursuant to the El Dorado. The Supply and Offtake Agreement and other related agreements, Lion Oil will endeavor to arrange potential sales by either Lion Oil or J. Aron to third parties of the products produced at the El Dorado refinery or purchased from third parties. In instances where Lion Oil is the seller to such third parties, J. Aron will first transfer title to the applicable products to Lion Oil.
This arrangement isAgreements are accounted for as a product financing arrangementarrangements under the fair value election provided by ASC 815 and ASC 825. Delek incurred fees payable
Barrels subject to J. Aron under the Supply and Offtake Agreements are as follows:
|
| | | | | | | | | |
| (in millions) | | El Dorado | | Big Spring | | Krotz Springs |
| Baseline Volumes pursuant to the respective Supply and Offtake Agreements | | 2.0 |
| | 0.8 |
| | 1.3 |
|
Barrels of inventory consigned under the respective Supply and Offtake Agreements as of December 31, 2019 (1) | | 3.5 |
| | 2.0 |
| | 1.7 |
|
Barrels of inventory consigned under the respective Supply and Offtake Agreements as of December 31, 2018 (1) | | 2.8 |
| | 1.7 |
| | 1.8 |
|
| |
(1) | Includes Baseline Volumes plus/minus over/short quantities. |
The El Dorado Supply and Offtake Agreement has a maturity date of $10.7 million, $9.7 millionApril 30, 2020. The Big Spring and $9.7 million during the years ended December 31, 2018, 2017 and 2016, respectively. These amounts are included as a component of interest expense in the condensed consolidated statements of income. Upon any termination of the El DoradoKrotz Springs Supply and Offtake Agreement, includingAgreements expire in connection with a force majeure event, the parties are requiredMay 2021, except that J. Aron or Delek may elect to early terminate in May 2020 on prior notice, as defined in those Agreements. The Big Spring and Krotz Springs Supply and Offtake Agreements were amended in November 2019 to require such notice in February 2020, and again in January and February 2020 to ultimately require such notice in March 2020. The Supply and Offtake Agreements have certain termination provisions, which may include requirements to negotiate with third parties for the assignment to us of certain contracts, commitments and arrangements, including procurement contracts, commitments for the sale of product, and pipeline, terminalling, storage and shipping arrangements.Based upon terms in effect as of December 31, 2018, upon the expiration of the El Dorado Supply and Offtake Agreement on April 30, 2020, or upon any earlier termination, Delek would be required to repurchase the consigned crude oil and refined products from J. Aron at then prevailing market prices. At December 31, 2018 and 2017, Delek had 2.8 million barrels and 3.0 million barrels, respectively, of inventory consigned from J. Aron under the El Dorado Supply and Offtake Agreement, and we have recorded liabilities associated with this consigned inventory of $152.6 million and $181.9 million, respectively, in the consolidated balance sheets, measured using the fair value election pursuant to ASC 825. We also maintained letters of credit with respect to the El Dorado Supply and Offtake Agreement totaling $120.0 and $95.0, as of December 31, 2018 and 2017, respectively. See Note 24 for discussion of the January 2019 amendment to the El Dorado Supply and Offtake Agreement and its expected impact on the consolidated financial statements.
Alon refinery operations
Effective with the Delek/Alon Merger, we assumed Alon's existing Supply and Offtake Agreements and other associated agreements with J. Aron, to support the operations of our Big Spring, Krotz Springs and California refineries (as further defined in Note 4) and certain of our asphalt terminals (together, the “Alon Supply and Offtake Agreements”). Pursuant to the Alon Supply and Offtake Agreements, (i) J. Aron agreed to sell to us, and we agreed to buy from J. Aron, at market prices, crude oil for processing at these refineries and (ii) we agreed to sell, and J. Aron agreed to buy, at market prices, certain refined products produced at these refineries. The Alon Supply and Offtake Agreements also provide for the sale, at market prices, of our crude oil and certain refined product inventories to J. Aron, the lease to J. Aron of crude oil and refined product storage facilities and the identification of prospective purchasers of refined products on J. Aron’s behalf.
The Supply and Offtake Agreements were amended in December 2018 for the Big Spring and Krotz Springs refineries have initial terms that expire in May 2021. The Supply and Offtake AgreementJanuary 2019 for the California refineries which had an initial expiration date in May 2019, contained early termination provisions, and we elected to terminate the Supply and Offtake Agreement at the California refineries effective on May 31, 2018. J. Aron may elect to terminate the Supply and Offtake Agreements for the Big SpringEl Dorado and Krotz Springs refineries prior to the expiration of the initial term beginning in May 2019 and upon each anniversary thereafter, on six months' prior notice. We may elect to terminate the agreements at the Big Spring and Krotz Springs refineries in May 2020 on six months prior notice.
These daily purchases and sales are trued-up on a monthly basis in order to reflect actual average monthly prices. We have recorded a net payable related to this monthly settlement of $1.0 million and $4.4 million as of December 31, 2018 and 2017, respectively.
These arrangements are accounted for as product financing arrangements. Delek incurred fees payable to J. Aron of $13.8 million and $7.1 million during the year ended December 31, 2018 and 2017, respectively. These amounts are included as a component of interest expense in the consolidated statements of income. Upon any termination of the Alon Supply and Offtake Agreements, including in connection with a force majeure event, the parties are required to negotiate with third parties for the assignment to us of certain contracts, commitments and arrangements, including procurement contracts, commitments for the sale of product, and pipeline, terminalling, storage and shipping arrangements.
Effective December 21, 2018, we amended our Big Spring refinery's Supply and Offtake Agreement with J. Aron so that the repurchase of baseline volumesBaseline Volumes at the end of the Supply and Offtake Agreement term (representing the "Baseline Step-Out Liability" or, collectively, the "Baseline Step-Out Liabilities") will be based upon a fixed price instead of a market-indexed price. The modified arrangement results in aPrior to those amendments, the Baseline Step-Out LiabilityLiabilities were based on market-indexed pricing. The amendments resulted in Baseline Step-Out Liabilities that isare no longer subject to commodity price volatility, but for which its fair value is now subject to interest rate risk. As a result, we recorded a gaingains on the change in fair value resulting from
the modification of the instruments from commodities-based risk to interest rate risk in cost of materials and other totaling approximatelyin the periods in which the amendments occurred, including $7.6 million of which were recognized in the first quarter of 2019 and $4.0 million in the fourth quarter of 2018. As of December 31, 2018, theSubsequent to these amendments, such Baseline Step-Out Liability under the Big Spring refinery's Supply and Offtake Agreement represents the fixed notional amount outstanding under the Supply and Offtake Agreement of $52.0 million less the unamortized discount of $2.4 million for a fair value of $49.6 million related to 0.8 million barrels of baseline consigned inventory, and is reflected as a non-current obligation due May 2020 on our consolidated balance sheet as of December 31, 2018. Such Baseline Step-Out Liability will continueLiabilities continued to be recorded at fair value, where the fair value will reflectreflected changes in interest rate risk rather than commodity price risk.
Underrisk under the terms of the amendmentfair value election provided by ASC 815 and ASC 825. Prior to the Big Spring refineryamendments, the Obligations under the Supply and Offtake Agreement,Agreements were all classified as current based on the market-indexed nature of the liabilities. Subsequent to the amendments, the Baseline Step-Out Liabilities are reflected as non-current liabilities on our consolidated balance sheet to the extent that they are not contractually due within twelve months. Monthly activity resulting in over and short and excess target quantities willvolumes continue to be refunded/financed on a monthly basis based on that month's activity, based onvalued using market-indexed pricing. This arrangement is treated like short-term financing (where J. Aron may finance our overages or we may finance the shortages based on activity each month),pricing, and therefore may be a receivable or payable at period end. As of December 31, 2018, this short-term arrangement resultedare included in a payable totaling $46.9 millionrelated to 0.9 million barrels of consigned inventory representing quantities over or short baseline volumes and excess target quantities, and is reflected at fair value as a currentobligation liabilities (or receivables) on our consolidated balance sheet. Net balances payable (receivable) under the Supply and Offtake Agreements were as follows as of the balance sheet dates:
|
| | | | | | | | | | | | | | | | |
| (in millions) | | El Dorado | | Big Spring | | Krotz Springs | | Total |
| Balances as of December 31, 2019: | | | | | | | | |
| Baseline Step-Out Liability | | $ | 125.5 |
| | $ | 57.2 |
| | $ | 87.6 |
| | $ | 270.3 |
|
| Revolving over/short product financing liability | | 93.0 |
| | 73.5 |
| | 40.5 |
| | 207.0 |
|
| Total Obligations Under Supply and Offtake Agreements | | 218.5 |
| | 130.7 |
| | 128.1 |
| | 477.3 |
|
| Less: Current portion | | 218.5 |
| | 73.5 |
| | 40.5 |
| | 332.5 |
|
| Obligations Under Supply and Offtake Agreements - Noncurrent portion | | $ | — |
| | $ | 57.2 |
| | $ | 87.6 |
| | $ | 144.8 |
|
| Other receivable for monthly activity true-up (included in current receivables) | | $ | (16.4 | ) | | $ | (3.1 | ) | | $ | (3.5 | ) | | $ | (23.0 | ) |
|
| | | | | | | | | | | | | | | | |
| (in millions) | | El Dorado | | Big Spring | | Krotz Springs | | Total |
| Balances as of December 31, 2018: | | | | | | | | |
| Baseline Step-Out Liability | | $ | — |
| | $ | 49.6 |
| | $ | — |
| | $ | 49.6 |
|
| Revolving over/short product financing liability | | — |
| | 46.9 |
| | — |
| | 46.9 |
|
| Revolving Step-Out Liability (prior to January 2019 amendments) | | 152.6 |
| | — |
| | 113.1 |
| | 265.7 |
|
| Total Obligations Under Supply and Offtake Agreements | | 152.6 |
| | 96.5 |
| | 113.1 |
| | 362.2 |
|
| Less: Current portion | | 152.6 |
| | 46.9 |
| | 113.1 |
| | 312.6 |
|
| Obligations Under Supply and Offtake Agreements - Noncurrent portion | | $ | — |
| | $ | 49.6 |
| | $ | — |
| | $ | 49.6 |
|
| Other (receivable) payable for monthly activity true-up (included in current payables (receivables)) | | $ | (7.8 | ) | | $ | (0.4 | ) | | $ | 1.4 |
| | $ | (6.8 | ) |
Based upon
In September 2019, we amended the Supply and Offtake Agreements to increase the fixed Step-Out price on Baseline Volumes. As a result of the change in the contractual terms, we received cash, net of estimated fees paid, totaling approximately $38.9 million. No gain or loss was recognized as a result of these September 2019 amendments. Subsequent to December 31, 2019, in effect asJanuary 2020, we amended our three Supply and Offtake Agreements to convert the Baseline Step-Out Liabilities back to a market-indexed price subject to commodity price risk with corresponding changes to underlying market-based indices and certain differentials.
As of December 31, 2018, upon2019, the expirationeffective interest rates related to the Supply and Offtake Agreements, as amended, were as follows:
|
| | | | | | | | | |
| | | El Dorado | | Big Spring | | Krotz Springs |
| Effective interest rate as of December 31, 2019 | | 8.4 | % | | 9.3 | % | | 7.8 | % |
The Supply and Offtake Agreements require payments of fees which are factored into the interest rate yield under the fair value accounting model. Recurring cash fees paid during the periods presented were as follows:
|
| | | | | | | | | | | | | | | | |
| (in millions) | | El Dorado | | Big Spring | | Krotz Springs | | Total |
| Recurring cash fees paid during the year ended December 31, 2019 | | $ | 11.6 |
| | $ | 6.2 |
| | $ | 10.3 |
| | $ | 28.1 |
|
| Recurring cash fees paid during the year ended December 31, 2018 | | $ | 10.7 |
| | $ | 7.1 |
| | $ | 6.7 |
| | $ | 24.5 |
|
| Recurring cash fees paid during the year ended December 31, 2017 | | $ | 9.7 |
| | $ | 4.1 |
| | $ | 3.0 |
| | $ | 16.8 |
|
Interest expense recognized under the Supply and Offtake Agreements includes the yield attributable to recurring cash fees, one-time cash fees (e.g., in connection with amendments), as well as other changes in fair value, which may increase or decrease interest expense. Total interest expense incurred during the periods presented was as follows:
|
| | | | | | | | | | | | | | | | |
| (in millions) | | El Dorado | | Big Spring | | Krotz Springs | | Total |
| Interest expense for the year ended December 31, 2019 | | $ | 15.4 |
| | $ | 5.5 |
| | $ | 12.1 |
| | $ | 33.0 |
|
| Interest expense for the year ended December 31, 2018 | | $ | 10.7 |
| | $ | 7.1 |
| | $ | 6.7 |
| | $ | 24.5 |
|
| Interest expense for the year ended December 31, 2017 | | $ | 9.7 |
| | $ | 4.1 |
| | $ | 3.0 |
| | $ | 16.8 |
|
Reflected in interest expense are gains totaling $9.3 million for the year ended December 31, 2019, related to the changes in fair value in the Baseline Step-Out Liabilities component of Obligations Under Supply and Offtake Agreements.
We maintained letters of credit under the Supply and Offtake Agreements as follows:
|
| | | | | | | | |
| (in millions) | | El Dorado | | Big Spring and Krotz Springs |
| Letters of credit outstanding as of December 31, 2019 | | $ | 180.0 |
| | $ | 44.0 |
|
| Letters of credit outstanding as of December 31, 2018 | | $ | 120.0 |
| | $ | 24.0 |
|
In connection with the Krotz Springs Supply and Offtake Agreement, or upon any earlier termination, Delek would be requiredprior to repurchase the consigned crude oil and refined products from J. Aron at then prevailing market prices. At December 31, 2018, Delek had 1.8 million barrels of inventory consigned from J. Aron under the Krotz Springs refinery's Supply and Offtake Agreement, inclusive of both the baseline volumes and over, short and excess target quantities, andSeptember 30, 2019, we have recorded a current liability associated with this consigned inventory of $113.1 million in the consolidated balance sheets, measured using the fair value election pursuant to ASC 825. See Note 24 for discussion of the January 2019 amendment to the Krotz Springs Supply and Offtake Agreement and its expected impact on the consolidated financial statements.
At December 31, 2017, Delek had 3.5 million barrels of inventory consigned from J. Aron under the Alon Supply and Offtake Agreements, and we recorded a current liability associated with this consigned inventory of $253.7 million in the consolidated balance sheets, measured using the fair value election pursuant to ASC 825. We maintained letters of credit totaling $24.0 and $10.0, as of December 31, 2018 and 2017, respectively with respect to the Alon Supply and Offtake Agreements.
In connection with the Alon Supply and Offtake Agreement for our Krotz Springs refinery, we have granted a security interest to J. Aron in certain assets (including all of its accounts receivable and inventory) to secure itsour obligations to J. Aron. Pursuant to an amendment to the security agreement effective September 30, 2019, no cash, deposit accounts or accounts receivable constitute collateral.
11. Long-Term Obligations and Notes Payable
Outstanding borrowings, net of unamortized debt discounts and certain deferred financing costs, under Delek’s existing debt instruments are as follows (in millions):
|
| | | | | | | | |
| | | December 31,
2018 | | December 31,
2017 |
| Revolving Credit Facility | | $ | 300.0 |
| | $ | — |
|
Term Loan Credit Facility (1) | | 682.9 |
| | — |
|
| Delek Logistics Credit Facility | | 456.7 |
| | 179.9 |
|
Delek Logistics Notes (2) | | 243.7 |
| | 242.7 |
|
Wells Term Loan (3) | | — |
| | 40.5 |
|
| Wells Revolving Loan | | — |
| | 45.0 |
|
| Reliant Bank Revolver | | 30.0 |
| | 17.0 |
|
| Promissory Notes | | 70.0 |
| | 95.1 |
|
Lion Term Loan (4) | | — |
| | 203.4 |
|
| Alon Partnership Credit Facility | | — |
| | 100.0 |
|
| Alon Partnership Term Loan | | — |
| | 237.5 |
|
Convertible Notes (5) | | — |
| | 146.0 |
|
Alon Term Loan Credit Facilities (6) | | — |
| | 72.4 |
|
Alon Retail Credit Facilities (7) | | — |
| | 86.1 |
|
| | | 1,783.3 |
| | 1,465.6 |
|
| Less: Current portion of long-term debt and notes payable | | 32.0 |
| | 590.2 |
|
| | | $ | 1,751.3 |
| | $ | 875.4 |
|
|
| | | | | | | | |
| | | December 31, 2019 | | December 31, 2018 |
| Revolving Credit Facility | | $ | 30.0 |
| | $ | 300.0 |
|
Term Loan Credit Facility (1) | | 1,069.5 |
| | 682.9 |
|
Hapoalim Term Loan (2) | | 39.5 |
| | — |
|
| Delek Logistics Credit Facility | | 588.4 |
| | 456.7 |
|
Delek Logistics Notes (3) | | 244.7 |
| | 243.7 |
|
| Reliant Bank Revolver | | 50.0 |
| | 30.0 |
|
| Promissory Notes | | 45.0 |
| | 70.0 |
|
| | | 2,067.1 |
| | 1,783.3 |
|
| Less: Current portion of long-term debt and notes payable | | 36.4 |
| | 32.0 |
|
| | | $ | 2,030.7 |
| | $ | 1,751.3 |
|
| |
(1) | The Term Loan Credit Facility is netNet of deferred financing costs of $3.5 million and $3.5 million, respectively, and debt discount of $12.5 million and $8.4 million, respectively, at December 31, 2019 and December 31, 2018. |
| |
(2) | The Delek Logistics Notes are netNet of deferred financing costs of $4.8$0.3 million and $5.6 million, respectively, and debt discount of $1.5$0.2 million and $1.7 million, respectively, at December 31, 2018 and December 31, 2017.
2019. |
| |
(3) | The Wells Term Loan was extinguished on March 30, 2018, as further discussed below, and was netNet of deferred financing costs of a nominal amount$4.0 million and debt discount $0.3$4.8 million, at December 31, 2017. |
| |
(4)
| The Lion Term Loan Facility was extinguished on March 30, 2018, as further discussed below, and was net of deferred financing costs of $2.1 millionrespectively, and debt discount of $0.8$1.3 million and $1.5 million, respectively, at December 31, 2017. |
| |
(5)
| The Convertible Notes were extinguished on September 17, 2018, as further discussed below,2019 and were net of debt discount of $4.0 million at December 31, 2017. |
| |
2018.(6) | The Alon Term Loan Credit Facilities were extinguished on March 30, 2018, as further discussed below, and were net of debt discount of $0.6 million at December 31, 2017. |
| |
(7)
| The Alon Retail Credit Facilities were extinguished on March 30, 2018, as further discussed below, and were net of debt discount of $2.4 million at December 31, 2017. |
Delek Revolver and Term Loan
On March 30, 2018 (the "Closing Date"), Delek entered into (i) a new term loan credit agreement with Wells Fargo Bank, National Association, as administrative agent (the "Term Administrative Agent"), Delek, as borrower, certain subsidiaries of Delek, as guarantors, and the lenders from time to time party thereto, providing for a senior secured term loan facility in an amount of $700.0 million (the "Term Loan Credit Facility") and (ii) a second amended and restated credit agreement with Wells Fargo Bank, National Association, as administrative agent (the "Revolver Administrative Agent"), Delek, as borrower, certain subsidiaries of Delek, as guarantors, and the other lenders party thereto, providing for a senior
secured asset-based revolving credit facility with commitments of $1.0 billion (the "Revolving Credit Facility" and, together with the "TermTerm Loan Credit Facility," the "New Credit Facilities").
The Revolving Credit Facility permits borrowings in Canadian dollars of up to $50.0 million. ThePrior to the December 2019 amendment, the Revolving Credit Facility also permitspermitted the issuance of letters of credit of up to $300.0 million, including letters of credit denominated in Canadian dollars of up to $10.0 million. On December 18, 2019, we amended the Second Amended and Restated Credit Agreement dated March 30, 2018, which increased the capacity to issue letters of credit under the agreement from $300.0 million up to $400.0 million. Delek may designate restricted subsidiaries as additional borrowers under the Revolving Credit Facility.
The Term Loan Credit Facility was drawn in full for $700.0 million on the Closing Date at an original issue discount of 0.50%. Proceeds under the Term Loan Credit Facility, as well as proceeds of approximately $300.0 million in borrowings under the Revolving Credit Facility on the Closing Date, were used to repay certain indebtedness of Delek and its subsidiaries (the “Refinancing”), as well as certain fees, costs and expenses in connection with the closing of the New Credit Facilities with any remaining proceeds held in cash. Proceeds of future borrowings under the Revolving Credit Facility will be used for working capital and general corporate purposes of Delek and its subsidiaries.
We In connection with the Refinancing, we recorded a loss on extinguishment of debt totaling approximately $9.1 million during 2018.
On May 22, 2019 (the "First Incremental Effective Date"), we amended the year ended December 31, 2018Term Loan Credit Facility agreement pursuant to the terms of the First Incremental Amendment to Term Loan Credit Agreement (the "Incremental Amendment"). Pursuant to the Incremental Amendment, the Company borrowed $250.0 million in connectionaggregate principal amount of incremental term loans (the “Incremental Term Loans”) at an original issue discount of 0.75%, increasing the aggregate principal amount of loans outstanding under the Term Loan Credit Facility on the First Incremental Effective Date to $943.0 million.
On November 12, 2019 (the "Second Incremental Effective Date"), we amended the Term Loan Credit facility agreement pursuant to the terms of the Second Incremental Amendment to the Term Loan Credit Agreement (the "Second Incremental Amendment") and borrowed $150.0 million in aggregate principal amount of incremental term loans (the "Incremental Loans") at an original issue discount of 1.21%, increasing the aggregate principal amount of loans outstanding under the Term Loan Credit Facility on the Second Incremental Effective Date to $1,088.3 million. The terms of the Incremental Term Loans and Incremental Loans are substantially identical to the terms applicable to the initial term loans under the Term Loan Credit Facility borrowed in March 2018. There are no restrictions on the Company's use of the proceeds of the Incremental Term Loans and Incremental Term Loans. The proceeds for the Incremental Term Loans may be used for (i) reducing utilizations under the Revolving Credit Facility, (ii) general corporate purposes and (iii) paying transaction fees and expenses associated with the Refinancing.Incremental Amendment. The proceeds for the Incremental Loans may be used for (i) for general corporate purposes (including growth capital expenditures) and (ii) to pay fees and expenses associated with the Second Incremental Amendment.
Interest and Unused Line Fees
The interest rates applicable to borrowings under the Term Loan Credit Facility and the Revolving Credit Facility are based on a fluctuating rate of interest measured by reference to either, at Delek’s option, (i) a base rate, plus an applicable margin, or (ii) a reserve-adjusted London Interbank Offered Rate ("LIBOR"), plus an applicable margin (or, in the case of Revolving Credit Facility borrowings denominated in Canadian dollars, the Canadian dollar bankers' acceptances rate ("CDOR")). The initial applicable margin for all Term Loan Credit Facility borrowings was 1.50% per annum with respect to base rate borrowings and 2.50% per annum with respect to LIBOR borrowings.
On October 26, 2018, Delek entered into an amendment to the Term Loan Credit Facility (the “First Amendment”) to reduce the margin on borrowings under the Term Loan Credit Facility and incorporate certain other changes. The First Amendment prospectively decreasesdecreased the applicable margins for borrowings under (i) Base Rate Loans from 1.50% to 1.25% and (ii) LIBOR Rate Loans from 2.50% to 2.25%, as such terms are defined in the Term Loan Credit Facility. The decreases to the applicable margins became effective upon execution of the First Amendment.
The initial applicable margin for Revolving Credit Facility borrowings was 0.25% per annum with respect to base rate borrowings and 1.25% per annum with respect to LIBOR and CDOR borrowings, and the applicable margin for such borrowings after September 30, 2018 is based on Delek’s excess availability as determined by reference to a borrowing base, ranging from 0.25% to 0.75% per annum with respect to base rate borrowings and from 1.25% per annum to 1.75% per annum with respect to LIBOR and CDOR borrowings.
In addition, the Revolving Credit Facility will requirerequires Delek to pay an unused line fee on the average amount of unused commitments thereunder in each quarter, which fee will be at a rate of 0.25% or 0.375% per annum, depending on average commitment usage for such quarter. As of December 31, 2018,2019, the unused line fee was set at 0.375% per annum.
Maturity and Repayments
The Revolving Credit Facility will mature and the commitments thereunder will terminate on March 30, 2023. The Term Loan Credit Facility matures on March 30, 2025 and requires scheduled quarterly principal payments on the last business day of the applicable quarter. Pursuant to the Incremental Amendment, quarterly payments increased from $1.75 million to $2.38 million. Pursuant to the Second Incremental Amendment, the quarterly payments increased to $2.75 million commencing with the balance of the principal due on March 30, 2025.December 31, 2019. Additionally, the Term Loan Credit Facility requires prepayments by Delek with the net cash proceeds from certain debt incurrences, asset dispositions and insurance or condemnation events with respect to Delek’s assets, subject to certain exceptions, thresholds and reinvestment rights. The Term Loan Credit Facility also requires annual prepayments with a variable percentage of Delek’s excess cash flow, ranging from 50% to 0% depending on Delek’s
consolidated fiscal year end secured net leverage ratio from time to time.ratio. Delek may also make voluntarily prepayments under the Term Loan Credit Facility at any time, subject to a prepayment
premium of 1.0% in connection with certain customary repricing events that may occur within six months after the ClosingSecond Incremental Effective Date, as well as after the First Amendment effective date, with no premium applied after six months.
Guarantee and Security
The obligations of the borrowers under the New Credit Facilities are guaranteed by Delek and each of its direct and indirect, existing and future, wholly-owned domestic subsidiaries, subject to customary exceptions and limitations, and excluding Delek Logistics Partners, LP, Delek Logistics GP, LLC, and each subsidiary of the foregoing (collectively, the "MLP Subsidiaries"). Borrowings under the New Credit Facilities are also guaranteed by DK Canada Energy ULC, a British Columbia unlimited liability company and a wholly-owned restricted subsidiary of Delek.
The Revolving Credit Facility is secured by a first priority lien over substantially all of Delek’s and each guarantor's receivables, inventory, renewable identification numbers,RINs, instruments, intercompany loan receivables, deposit and securities accounts and related books and records and certain other personal property, subject to certain customary exceptions (the "Revolving Priority Collateral"), and a second priority lien over substantially all of Delek's and each guarantor's other assets, including all of the equity interests of any subsidiary held by the Delek or any guarantor (other than equity interests in certain MLP Subsidiaries) subject to certain customary exceptions, but excluding real property (such real property and equity interests, the "Term Priority Collateral").
The Term Loan Credit Facility is secured by a first priority lien on the Term Priority Collateral and a second priority lien on the Revolving Priority Collateral, all in accordance with an intercreditor agreement between the Term Administrative Agent and the Revolver Administrative Agent and acknowledged by Delek and the subsidiary guarantors. Certain excluded assets are not included in the Term Priority Collateral and the Revolving Priority Collateral.
Additional Information
At December 31, 2018,2019, the weighted average borrowing rate under the Revolving Credit Facility was approximately 5.8%5.0% and was comprised entirely of a base rate borrowing and the principal amount outstanding thereunder was $300.0$30.0 million. Additionally, there were letters of credit issued of approximately $179.4$309.8 million as of December 31, 20182019 under the Revolving Credit Facility. Unused credit commitments under the Revolving Credit Facility, as of December 31, 2018,2019, were approximately $520.6$660.2 million.
At December 31, 2018,2019, the weighted average borrowing rate under the Term Loan Credit Facility was approximately 4.77%4.05% comprised entirely of a LIBOR borrowing and the principal amount outstanding thereunder was $1,085.5 million. As of December 31, 2019, the effective interest rate related to the Term Loan Credit Facility was 4.37%.
Delek Hapoalim Term Loan
On December 31, 2019, Delek entered into a term loan credit and guaranty agreement (the "Agreement") with Bank Hapoalim B.M. ("BHI") as the administrative agent. Pursuant to the Agreement, on December 31, 2019, Delek borrowed $40.0 million (the "BHI Term Loan"). The interest rate under the Agreement is equal to LIBOR plus a margin of 3.00%. The Agreement has a current maturity of December 31, 2022 and requires quarterly loan amortization payments of $0.1 million, commencing March 31, 2020. Proceeds may be used for general purposes. The Agreement has an accordion feature that allows increasing the term loan to maximum size of $100.0 million, subject to receiving increased or new commitments from lenders and the satisfaction of certain other conditions precedent. Any such additional borrowings must be completed by December 31, 2021.
At December 31, 2019, the weighted average borrowing rate under the term loan was approximately $694.84.80% comprised entirely of a LIBOR borrowing and the principal amount outstanding thereunder was $40.0 million. As of December 31, 2019 , the effective interest rate related to the BHI Term Loan was 5.31%.
Delek Logistics Credit Facility
At December 31, 2017,Prior to its amendment and restatement on September 28, 2018, Delek Logistics had a $700.0 million senior secured revolving credit agreement with Fifth Third Bank ("Fifth Third"), as administrative agent, and a syndicate of lenders (the "2014 Facility") with a $100.0 million accordion feature, bearing interest at (i) either athe U.S. dollar prime dollar rate, or a LIBOR Rate for borrowings denominated in U.S. Dollars, or (ii) either a Canadian dollar prime rate, LIBOR, or a CDOR rate, for borrowings denominated in Canadian dollars (in each case plus applicable margins, at the election of the borrowers and as a function of draw down currency). The 2014 Facility had a maturity date of December 30, 2019. Outstanding borrowings at December 31, 2017 were $179.9 million. The obligations under the 2014 Facility were secured by a first priority lien on substantially all of Delek Logistics' tangible and intangible assets. Additionally, a subsidiary of Delek provided a limited guaranty of Delek Logistics' obligations under the 2014 Facility.
currency. On September 28, 2018, Delek Logistics and all of its subsidiaries entered into a third amended and restated senior secured revolving credit agreement which amended and restated the 2014 Facility (hereafter, the "Delek Logistics Credit Facility") with Fifth Third as administrative agent and a syndicate of lenders. The Deleklenders (hereafter, the "Delek Logistics Credit Facility contains a dual currency borrowing tranche that permits draw downs in U.S. or Canadian dollars.Facility"). Under the terms of the Delek Logistics Credit Facility, among other things, the lender commitments were increased from $700.0 million to $850.0 million. The Delek Logistics Credit Facility also contains an accordion feature whereby the PartnershipDelek Logistics can increase the size of the credit facility to an aggregate of $1.0 billion, subject to receiving increased or new commitments from lenders and the satisfaction of certain other conditions precedent.
The obligations under the Delek Logistics Credit Facility remain secured by first priority liens on substantially all of Delek Logistics' tangible and intangible assets. Additionally, a subsidiary of Delek providescontinues to provide a limited guaranty of Delek Logistics' obligations under the Delek Logistics Credit Facility. The guaranty is (i) limited to an amount equal to the principal amount, plus unpaid and accrued interest, of a promissory note made by Delek in favor of the subsidiary guarantor (the "Holdings Note") and (ii) secured by the subsidiary guarantor's pledge of the Holdings Note to the Delek Logistics Credit Facility lenders. As of both December 31, 20182019 and 2017,2018, the principal amount of the Holdings Note was $102.0 million.
The Delek Logistics Credit Facility has a maturity date of September 28, 2023. Borrowings under the Delek Logistics Credit Facility bear interest at either a U.S. dollar prime rate, Canadian dollar prime rate, LIBOR, or a CDOR rate, in each case plus applicable margins, at the election of the borrowers and as a function of draw down currency. The applicable margin, in each case, and the fee payable for the unused revolving commitments vary based upon Delek Logistics' most recent total leverage ratio calculation delivered to the lenders, as called for and defined under the terms of the Delek Logistics Credit Facility. At December 31, 2018,2019, the weighted average borrowing rate was approximately 5.4%4.7%. Additionally, the Delek Logistics Credit Facility requires Delek Logistics to pay a leverage ratio dependent quarterly fee on the average unused revolving commitment. As of December 31, 2018,2019, this fee was 0.50% per year.
As of December 31, 2018,2019, Delek Logistics had $456.7$588.4 million of outstanding borrowings under the Delek Logistics Credit Facility, as well as nowith 0 letters of credit issued.in place. Unused credit commitments available under the Delek Logistics Credit Facility, as of December 31, 2018,2019, were $393.3$261.6 million.
Delek Logistics Notes
On May 23, 2017, Delek Logistics and Delek Logistics Finance Corp. (collectively, the “Issuers”) issued $250.0 million in aggregate principal amount of 6.75% senior notes due 2025 (the “Delek Logistics Notes”) at a discount. The Delek Logistics Notes are general unsecured senior obligations of the Issuers. The Delek Logistics Notes are unconditionally guaranteed jointly and severally on a senior unsecured basis by Delek Logistics' existing subsidiaries (other than Delek Logistics Finance Corp., the "Guarantors") and will be unconditionally guaranteed on the same basis by certain of Delek Logistics' future subsidiaries. The Delek Logistics Notes rank equal in right of payment with all existing and future senior indebtedness of the Issuers, and senior in right of payment to any future subordinated indebtedness of the Issuers. Interest on the Delek Logistics Notes is payable semi-annually in arrears on each May 15 and November 15, commencing November 15, 2017.
At any time prior to May 15, 2020, the Issuers may redeem up to 35% of the aggregate principal amount of the Delek Logistics Notes with the net cash proceeds of one or more equity offerings by Delek Logistics at a redemption price of 106.750% of the redeemed principal amount, plus accrued and unpaid interest, if any, subject to certain conditions and limitations. Prior to May 15, 2020, the Issuers may also redeem all or part of the Delek Logistics Notes at a redemption price of the principal amount plus accrued and unpaid interest, if any, plus a "make whole" premium, subject to certain conditions and limitations. In addition, beginning on May 15, 2020, the Issuers may, subject to certain conditions and limitations, redeem all or part of the Delek Logistics Notes, at a redemption price of 105.063% of the redeemed principal for the twelve-month period beginning on May 15, 2020, 103.375% for the twelve-month period beginning on May 15, 2021, 101.688% for the twelve-month period beginning on May 15, 2022, and 100.00% beginning on May 15, 2023 and thereafter, plus accrued and unpaid interest, if any.
In the event of a change of control, accompanied or followed by a ratings downgrade within a certain period of time, subject to certain conditions and limitations, the Issuers will be obligated to make an offer for the purchase of the Delek Logistics Notes from holders at a price equal to 101.00% of the principal amount thereof, plus accrued and unpaid interest.
In connection with the issuance of the Delek Logistics Notes, the Issuers and the Guarantors entered into a registration rights agreement, whereby the Issuers and the Guarantors were required to exchange the Delek Logistics Notes for new notes with terms substantially identical in all material respects with the Delek Logistics Notes except the new notes do not contain terms with respect to transfer restrictions. On April 25, 2018, Delek Logistics made an offer to exchange the Delek Logistics Notes and the related guarantees that were validly tendered and not validly withdrawn for an equal principal amount of exchange notes that are freely tradeable, as required under the terms of the original indenture (the “Exchange Offer”). The Exchange Offer expired on May 23, 2018 (the "Expiration Date"). The terms of the exchange notes that were issued as a result of the Exchange Offer (also referred to as the "2025 Notes") are substantially identical to the terms of the original Delek Logistics Notes.
As of December 31, 2018,2019, we had $250.0 million in outstanding principal amount under the Delek Logistics Notes. As of December 31, 2019, the effective interest rate to the Delek Logistics Notes was 7.43%.
Alon Convertible Senior Notes (share values in dollars)
In connection with the Delek/Alon Merger, Alon, New Delek and U.S. Bank National Association, as trustee (the “Trustee”),the Trustee, entered into a Firstthe Supplemental Indenture, (the “Supplemental Indenture”), effective as of July 1, 2017, supplementing the Indenture, dated as of September 16, 2013 (the “Original Indenture”; the Original Indenture, as amended by the Supplemental Indenture, is referred to as the "Indenture"), pursuant to which Alon issued its 3.00%3.0% Convertible Senior Notes due 2018 (the “ Convertible(as previously defined, the “Convertible Notes”) in the aggregate principal amount of $150.0 million, which were convertible into shares of Alon’s Common Stock, par value $0.01 per share or cash or a combination of cash and Alon Common Stock, at Alon's election, all as provided in the Indenture. The Supplemental Indenture provides that, as of the Effective Time, the right to convert each $1,000 principal amount of the Convertible Notes based on a number of shares of Alon Common Stock equal to the Conversion Rate (as defined in the Indenture) in effect immediately prior to the Delek/Alon Merger was changed into a right to convert each $1,000 principal amount of Convertible Notes into or based on a number of shares of New Delek Common Stock (at the exchange rate of 0.504), par value $0.01 per share, equal to the Conversion Rate in effect immediately prior to the Merger. In addition, the Supplemental Indenture provided that, as of the Effective Time, New Delek fully and unconditionally guaranteed, on a senior basis, Alon’s obligations under the Convertible Notes.
Interest on the Convertible Notes was payable in arrears in March and September of each year. The Convertible Notes were not redeemable at our option prior to maturity. Under the terms of the Convertible Notes, the holders of the Convertible Notes could not require us to repurchase all or part of the notes except for instances of a fundamental change, as defined in the indenture.Indenture.
The holders of the Convertible Notes could convert their notes at any time after June 15, 2018 into a settlement amount determined in accordance with the terms of the Indenture. The Convertible Notes could be converted into shares of New Delek Common Stock, into cash, or into a combination of cash and shares of New Delek Common Stock, at our election. In May 2018, we made the election and notified holders of our intention to satisfy the principal amount outstanding with cash and the incremental value of the conversion options with shares at maturity.
The conversion rate of the Convertible Notes was subject to adjustment upon the occurrence of certain events, including cash dividend adjustments. On September 17, 2018, Delek settled the Convertible Notes for a combination of cash and shares of New Delek Common Stock. The maturity settlement in respect of the Convertible Notes consisted of (i) cash payments totaling approximately $152.5 million which included a cash payment for outstanding principal of $150.0 million, a cash payment for accrued interest of approximately $2.2 million, a cash payment for dividends of approximately $0.3 million and a nominal cash payment in lieu of fractional shares, and (ii) the issuance of approximately 2.7 million shares of New Delek Common Stock to holders of the Convertible Notes (the “Conversion Shares”). The issuance of the Conversion Shares was made in exchange for the Convertible Notes pursuant to an exemption from the registration requirements provided by Section 3(a)(9) of the Securities Act of 1933, as amended.
Prior to the conversion, the conversion feature met the definition for recognition as a bifurcated equity instrument. As of December 31, 2017, the conversion feature equity instrument totaling $26.6 million was included in additional paid-in capital on the accompanying consolidated balance sheets.
Convertible Note Hedge Transactions
In connection with the Convertible Notes offering, Alon entered into convertible note hedge transactions with respect to Alon Common Stock (the(as previously defined, the “Call Options”) with the initial purchasers of the Convertible Notes (the “Hedge Counterparties”). In connection with the Delek/Alon Merger, Alon, Delek and the Hedge Counterparties entered into amended and restated Call Options permitting us to purchase up to approximately 5.7 million shares of New Delek Common Stock, subject to customary anti-dilution adjustments, that underlie the Convertible Notes sold in the offering.
The Call Options were intended to reduce the potential dilution with respect to our common stock upon conversion of the Convertible Notes, or upon settlement of the incremental value of the conversion options associated with the Convertible Notes in shares, as well as offset any potential cash payments we would be required to make in excess of the principal amount upon any conversion of the notes. As of December 31, 2017, the Call Options totaling $23.3 million were included as a reduction of additional paid-in capital on the consolidated balance sheets. The Call Options were separate transactions and were not part of the terms of the Convertible Notes and were excluded from classification as a derivative as the amount could be settled in our stock. Holders of the Convertible Notes did not have any rights with respect to the Call Options.
On September 17, 2018, we exercised the Call Options in connection with the settlement of the Convertible Notes and received approximately 2.7 million shares of our common stock from the Call Option counterparties, a cash payment for dividends of approximately $0.3 million and a nominal cash payment in lieu of fractional shares. On a net basis, the settlement of the Convertible Notes and the exercise of the Call Options resulted in no net dilution to our common stock. Prior to their exercise, the Call Options totaling $23.3 million were included as a reduction of additional paid-in capital on the consolidated balance sheets.
Warrant Transactions
In connection with the Convertible Notes offering, Alon also entered into warrant transactions (the “Warrants”) whereby warrants to acquire Alon common stock were sold to the Hedge Counterparties. In connection with the Delek/Alon Merger, Alon, Delek and the Hedge Counterparties entered into amended and restated Warrants which allow the Hedge Counterparties to purchase up to approximately 5.7 million shares of New Delek Common Stock, subject to customary anti-dilution adjustments. The Warrants are separate transactions and are not part of the terms of the Convertible Notes and are excluded from classification as a derivative as the amount could be settled in our stock. Holders of the Convertible Notes did not have any rights with respect to the Warrants.
As of December 31, 2017, the Warrants had an adjusted strike price of approximately $35 per share of New Delek Common Stock. The Warrants required settlement on a net-share basis and expired in April 2019. As of December 31, 2017, Warrants totaling $14.3 million were included in additional paid-in capital on the accompanying consolidated balance sheets. In November 2018, Delek entered into Warrant Unwind Agreements (the "Unwind Agreements") with the holders of our outstanding common stock Warrants. Pursuant to the terms of the Unwind Agreements, we settled for cash all outstanding Warrants with the holders at various prices per Warrant as provided in the Unwind Agreements. The settlement amount was based on the volume-weighted average market price of our common stock taking into account an adjustment for the exercise price of the Warrants over a period of sixteen trading days beginning November 9, 2018 (the “Unwind Period”). Following the Unwind Period and upon the satisfaction of the payment obligation, the Warrants were canceled and the associated rights and obligations terminated. Based on the provisions of the Unwind Agreements, the amount paid to warrant holders in satisfaction of the payment obligation totaled approximately $36 million.
Reliant Bank Revolver
Delek has an unsecured revolving credit agreement with Reliant Bank (the "Reliant Bank Revolver"), which was. On December 16, 2019, we amended on June 20, 2018 which extendedthe Reliant Bank Revolver to extend the maturity by two years todate from June 28, 2020 reducedto June 30, 2022, reduce the fixed interest rate from 5.25%4.75% to 4.75%4.50% per annum and increasedincrease the maximum borrowingrevolver commitment amount for loans from $17.0$30.0 million to $30.0$50.0 million. There were no other significant changes to the agreement.The Reliant Bank Revolverrevolving credit agreement requires us to pay a quarterly fee of 0.50% per year on the average availableunused revolving commitment. As of December 31, 2018,2019, we had $30.0$50.0 million outstanding under this facility and no0 unused credit commitments under the Reliant Bank Revolver.
Promissory Notes
Delek hadhas four notes payable (the "Promissory Notes") with various assignees of Alon Israel Oil Company, Ltd., the holder of a $50.0 millionpredecessor consolidated promissory note, with Ergon, Inc. that required Delek to make annual amortization payments of $10.0 million each, commencing April 29, 2013, and with interest computed at a fixed rate equal to 4% per annum. The Ergon Note matured on April 29, 2017 and was paid in full.
On May 14, 2015, in connection with the Company’s closing of the Alon Acquisition, the Company issued the Alon Israel Note in the amount of $145.0 million, which was payable to Alon Israel. The Alon Israel Note bearsbear interest at a fixed rate of 5.50% per annum and which, collectively, requires five annual principal amortization payments of $25.0 million beginning in January 2016through 2020 followed by a final principal amortization payment of $20.0 million at maturity on January 4, 2021. In October 2015, we prepaid the first annual principal amortization payment in the amount of $25.0 million, along with all interest due on the prepaid amount. On December 22, 2015, Alon Israel assigned the remaining $120.0 million of principal and all accrued interest due under the Alon Israel Note to assignees under four new notes in substantially the same form and on the same terms as the Alon Israel Note (collectively, the "Alon Successor Notes"). The $120.0 million total principal of the four Alon Successor Notes collectively require the same principal amortization payments and schedule as under the Alon Israel Note, with payments due under each Alon Successor Note commensurate to such note's pro rata share of $120.0 million in assigned principal. As of December 31, 2018,2019, a total principal amount of $70.0$45.0 million was outstanding under the Alon SuccessorPromissory Notes.
Restrictive Covenants
Under the terms of our Revolving Credit Facility, Term Loan Credit Facility, Delek Logistics Credit Facility, Delek Logistics Notes, and Reliant Bank Revolver and BHI Agreement, we are required to comply with certain usual and customary financial and non-financial covenants. The terms and conditions of the Revolving Credit Facility include periodic compliance with a springing minimum fixed charge coverage ratio financial covenant if excess availability under the revolver borrowing base is below certain thresholds, as defined in the credit agreement. The Term Loan Credit Facility does not have any financial maintenance covenants. We believe we were in compliance with all covenant requirements under each of our credit facilities as of December 31, 2018.2019.
Certain of our debt facilities contain limitations on the incurrence of additional indebtedness, making of investments, creation of liens, dispositions and acquisitions of assets, and making of restricted payments and transactions with affiliates. Specifically, these covenants may limit the payment, in the form of cash or other assets, of dividends or other distributions, or the repurchase of shares with respect to the equity of our subsidiaries. Additionally, certain of our debt facilities limit our ability to make investments, including extensions of loans or advances to, or acquisitions of equity interests in, or guarantees of obligations of, any other entities.
Restricted Net Assets
Some of Delek's subsidiaries have restrictions in their respective credit facilities limiting their use of assets, as has been discussed above. As of December 31, 2018,2019, we had no0 subsidiaries with restricted net assets which would prohibit earnings from being transferred to the parent company for its use.
Future Maturities
Principal maturities of Delek's existing third-party debt instruments for the next five years and thereafter are as follows as of December 31, 20182019 (in millions):
| | | | | 2019 | | 2020 | | 2021 | | 2022 | | 2023 | | Thereafter | | Total | | 2020 | | 2021 | | 2022 | | 2023 | | 2024 | | Thereafter | | Total |
| Revolving Credit Facility | | $ | — |
| | $ | — |
| | $ | — |
| | $ | — |
| | $ | 300.0 |
| | $ | — |
| | $ | 300.0 |
| | $ | — |
| | $ | — |
| | $ | — |
| | $ | 30.0 |
| | $ | — |
| | $ | — |
| | $ | 30.0 |
|
| Term Loan Credit Facility | | 7.0 |
| | 7.0 |
| | 7.0 |
| | 7.0 |
| | 7.0 |
| | 659.8 |
| | 694.8 |
| | 11.0 |
| | 11.0 |
| | 11.0 |
| | 11.0 |
| | 11.0 |
| | 1,030.5 |
| | 1,085.5 |
|
| Hapoalim Term Loan | | | 0.4 |
| | 0.4 |
| | 39.2 |
| | — |
| | — |
| | — |
| | 40.0 |
|
| Delek Logistics Credit Facility | | — |
| | — |
| | — |
| | — |
| | 456.7 |
| | — |
| | 456.7 |
| | — |
| | — |
| | — |
| | 588.4 |
| | — |
| | — |
| | 588.4 |
|
| Delek Logistics Notes | | — |
| | — |
| | — |
| | — |
| | — |
| | 250.0 |
| | 250.0 |
| | — |
| | — |
| | — |
| | — |
| | — |
| | 250.0 |
| | 250.0 |
|
| Reliant Bank Revolver | | — |
| | 30.0 |
| | — |
| | — |
| | — |
| | — |
| | 30.0 |
| | — |
| | — |
| | 50.0 |
| | — |
| | — |
| | — |
| | 50.0 |
|
| Promissory Notes | | 25.0 |
| | 25.0 |
| | 20.0 |
| | — |
| | — |
| | — |
| | 70.0 |
| | 25.0 |
| | 20.0 |
| | — |
| | — |
| | — |
| | — |
| | 45.0 |
|
| Total | | $ | 32.0 |
| | $ | 62.0 |
| | $ | 27.0 |
| | $ | 7.0 |
| | $ | 763.7 |
| | $ | 909.8 |
| | $ | 1,801.5 |
| | $ | 36.4 |
| | $ | 31.4 |
| | $ | 100.2 |
| | $ | 629.4 |
| | $ | 11.0 |
| | $ | 1,280.5 |
| | $ | 2,088.9 |
|
Obligations Extinguished in Connection with the 2018 Refinancing
During the first quarter 2018, Delek had outstanding various credit facilities/debt instruments as follows, all of which were extinguished in connection with the March 2018 Refinancing:
Wells ABL
Our subsidiary, Delek Refining, Ltd., had an asset-based loan credit facility with Wells Fargo Bank, National Association, as administrative agent, and a syndicate of lenders, which was previously amended and restated on September 29, 2016 and on May 17,2017 (the "Wells ABL"). This facility was amended and restated on March 30, 2018 in connection with the Refinancing. The Wells ABL consisted of (i) a $450.0 million revolving loan (the "Wells Revolving Loan"), which included a $45.0 million swing line loan sub-limit and a $200.0 million letter of credit sub-limit, (ii) a $70.0$70 million term loan (the "Wells Term Loan"), and (iii) an accordion feature that permitted an increase in the size of the revolving credit facility to an aggregate of $725.0 million, subject to additional lender commitments and the satisfaction of certain other conditions precedent. The Wells Revolving Loan was to mature on September 29, 2021 and the Wells Term Loan was to mature on September 29, 2019. The Wells Term Loan was subject to repayment in level principal installments of approximately $5.8 million per quarter, with the final installment due on September 29, 2019. The obligations under the Wells ABL were secured by (i) substantially all the assets of Refining and its subsidiaries, with certain limitations, (ii) guaranties provided by the general partner of Delek Refining, Ltd., as well as by the parent of Delek Refining, Ltd., Delek Refining, Inc. (iii) a limited guarantee provided jointly and severally by Old and New Delek in an amount up to $15.0 million in the aggregate and (iv) a limited guarantee provided by Lion Oil in an amount equal to the sum of the face amount of all letters of credit issued on behalf of Lion Oil under the Wells ABL and any loans made by Refining or its subsidiaries to Lion Oil. Under the facility, revolving loans and letters of credit were provided subject to availability requirements, which were determined pursuant to a borrowing base calculation as defined in the credit agreement. The borrowing base, as calculated, was primarily supported by cash, certain accounts receivable and certain inventory.. Borrowings under the Wells Revolving Loan and Wells Term Loan bore interest based on separate predetermined pricing grids that allowed us to choose between base rate loans or LIBOR rate loans. Additionally, the Wells ABL required us to pay a quarterly unused credit commitment fee. This facility was amended and restated on March 30, 2018 in connection with the Refinancing and replaced by the New Credit Facilities, as previously defined.
Lion Term Loan
Our subsidiary, Lion Oil, had a term loan credit facility with Fifth Third Bank, as administrative agent, and a syndicate of lenders, which as amended and restated hadwith a total loan size of $275.0 million (the "Lion Term Loan"). This facilityFor the period(s) it was extinguished in connection with the Refinancing on March 30, 2018. The Lion Term Loan required Lion Oil to make quarterly principal amortization payments of approximately $6.9 million each, commencing on September 30, 2015, with a final balloon payment due at maturity on May 14, 2020. The Lion Term Loan was secured by, among other things, (i) certain assets of Lion Oil and its subsidiaries, (ii) all shares in Lion Oil, (iii) any subordinated and common units of Delek Logistics held by Lion Oil, and (iv) the ALJ Shares. Additionally, the Lion Term Loan was guaranteed by Old and New Delek and the subsidiaries of Lion Oil. Interestoutstanding, interest on the unpaid balance of the Lion Term Loan was computed at a rate per annum equal to LIBOR or a base rate, at our election, plus the applicable margins, subject in each case to an all-in interest rate floor of 5.5%5.50% per annum.
Alon Partnership Facilities
Revolving Credit Facility
Alon USA, LP, a wholly-owned subsidiary of the Alon Partnership, had a $240.0 million asset-based revolving credit facility with Israel Discount Bank of New York, as administrative agent (the “Alon Partnership Credit Facility”) that was to mature on May 26, 2018. This facility was extinguished in connection with the Refinancing on March 30, 2018. The Alon Partnership Credit Facility could be used both for borrowings and the issuance of letters of credit subject to a limit of the lesser of the facility amount or the borrowing base amount under the facility.. Borrowings under the Alon Partnership Credit Facility bore interest at LIBOR or base rate, at our election, plus the applicable margins. The Alon Partnership Credit Facility was secured by a first priority lien on the Alon Partnership’s cash, accounts receivables, inventories and related assets and a second priority lien on the Alon Partnership’s fixed assets and other specified property. Additionally, the Alon Partnership Credit Facility required the payment of a quarterly fee on the average unused revolving commitment.
Partnership Term Loan Credit Facility
The Alon Partnership had a $250.0 million term loan with Credit Suisse AG, as administrative agent (the “Alon Partnership Term Loan”). This term loan was extinguished in connection with the Refinancing on March 30, 2018. The Alon Partnership Term Loan required principal payments of $2.5 million per annum paid in equal quarterly installments until maturity in November 2018, at which time a balloon payment was to be due for any remaining principal outstanding. The Alon Partnership Term Loan bore interest at a rate per annum equal to LIBOR (subject to a floor of 1.25%) or a base rate plus the applicable margins. The Alon Partnership Term Loan was guaranteed by Alon USA Partners GP, LLC, Alon Assets, Inc. and certain subsidiaries of the Alon Partnership, and was secured by a first priority lien on all of the Alon Partnership’s fixed assets and other specified property, as well as on the general partner interest in the Alon Partnership held by the Alon General Partner, and a second priority lien on the Alon Partnership’s cash, accounts receivables, inventories and related assets.
Alon Term Loan Credit Facilities
Alon Energy Term Loan
On March 27, 2014, Alon issuedhad a promissory note to Bank Hapoalim B.M. in an original principal amount of $25.0 million (“Alon Energy Term Loan”), that was to mature in March 2019, but was refinanced by Delek on December 29, 2017 with the proceeds of a new promissory note to Bank Hapoalim in an originalthe principal amount of $38.0 million ("New Alon Energy Term Loan"), maturing on December 29, 2022. The New Alon Energy Term Loan was extinguished in connection with the Refinancing on March 30, 2018. The New Alon Energy Term Loan required quarterly principal amortization payments of approximately $1.4 million each, commencing on March 30, 2018, and incurred interest at an annual rate equal to LIBOR plus an applicable margin. Additionally, Delek guaranteed all obligations under the New Alon Energy Term Loan.
Alon Asphalt Term Loan
Alon had a term loan owingowed to Export Development Canada secured by liens on certain of our asphalt terminals (“Alon Asphalt Term Loan”) in an original principal amount of $35.0 million. This loan was prepaid on March 29, 2018 in connection with the Refinancing on March 30, 2018. The Alon Asphalt Term Loan was guaranteed by Delek and certain subsidiaries of Alon and was also secured by pledges of equity of certain subsidiaries of Alon. The Alon Asphalt Term Loan required quarterly principal amortization payments of $3.9 million, commencing December 2018 until maturity in December 2020. The Alon Asphalt Term Loan bore interest at a rate equal to LIBOR plus an applicable margin.
Alon Energy Letter of Credit Facility
Alon had a Letter of Credit Facility with Israel Discount Bank of New York (the “Alon Energy Letter of Credit Facility”) that was used for the issuance of standby letters of credit. The facility was amended on November 30, 2017, to, among other things, extend the maturity date of the facility to February 28, 2018 and to reduce the maximum commitment under the facility from $60.0 million to $45.0 million effective December 31, 2017, and was again amended on February 27, 2018 to extend the maturity date to March 29, 2018. As collateral for the Alon Energy Letter of Credit Facility, we were required to pledge sufficient Alon Partnership common units with an initial collateral value of at least $100.0 million. Alon Assets, Inc. (“Alon Assets”) was a guarantor under the Alon Energy Letter of Credit Facility. Additionally, the Alon Energy Letter of Credit Facility required the payment of a quarterly fee on the average unused commitment.
Alon Retail Credit Agreement
Alon wholly-owned subsidiaries Southwest Convenience Stores, LLC and Skinny’s LLC, (collectively, “Alon Retail”), had a credit agreement (“Alon Retail Credit Agreement”), that was to mature in March 2019, with Wells Fargo Bank, National Association, as administrative agent. This credit agreement was extinguished in connection with the Refinancing on March 30, 2018. The Alon Retail Credit Agreement included a term loan in an original principal amount of $110.0 million and a $10.0 million revolving credit facility. The Alon Retail Credit Agreement also included an accordion feature that provided for incremental term loans up to $30.0 million. In August 2015, Alon borrowed $11.0 million using the accordion feature and amended the Alon Retail Credit Agreement to restore the available accordion back to $30.0 million. Borrowings under the Alon Retail Credit Agreement bore interest at LIBOR or base rate, at our election, plus an applicable margin, determined quarterly based upon Alon Retail’s leverage ratio.
Total Amounts Outstanding and Repaid
Principal payments on the term loan borrowings were made in quarterly installments based on a 15-year amortization schedule. Obligations under the Alon Retail Credit Agreement were secured by a first priority lien on substantially all of the assets of Alon Retailamounts outstanding and its subsidiaries. The Alon Retail Credit Agreement required us to pay a leverage ratio dependent quarterly fee on the average unused revolving commitment.
Interest-Rate Derivative Instruments
Effective with the Delek/Alon Merger, we assumed Alon's interest rate swap agreements set to mature in March 2019 that effectively fixed the variable LIBOR interest component of the term loans within the Alon Retail Credit Agreement. These interest rate swap agreements were terminatedrepaid in connection with the March 2018 Refinancing with respect to these credit facilities/debt instruments were as follows:
|
| | | | |
| (in millions) | | Amount Outstanding/Repaid at March 30, 2018 |
| Wells ABL | | $ | 40.8 |
|
| Lion Term Loan | | 206.3 |
|
| Alon Partnership Facilities | | 236.9 |
|
| Alon Term Loan Credit Facilities | | 38.0 |
|
| Alon Retail Credit Agreement | | 86.4 |
|
| Total | | $ | 608.4 |
|
Additionally, on March 30, 2018. These interest rate swaps were accounted for as cash flow hedges. See Note Note 16 for further information regarding29, 2018, in anticipation of the interest rate swap agreements.March 2018 Refinancing, we also repaid $35.0 million of principal on the Alon Asphalt Term Loan.
12. Derivative Instruments
We use the majority of our derivatives to reduce normal operating and market risks with the primary objective of reducing the impact of market price volatility on our results of operations. As such, our use of derivative contracts is aimed at:
limiting the exposure to price fluctuations of commodity inventory above or below target levels at each of our segments;
managing our exposure to commodity price risk associated with the purchase or sale of crude oil, feedstocks and finished grade fuel products at each of our segments;
managing the cost of our RINs Obligation using future commitments to purchase or sell RINs at fixed prices and quantities; and
limiting the exposure to interest rate fluctuations on our floating rate borrowings.
We primarily utilize commodity swaps, futures, forward contracts and options contracts, generally with maturity dates of three years or less, and from time to time interest rate swap agreements to achieve these objectives. Futures contracts are standardized agreements, traded on a futures exchange, to buy or sell the commodity at a predetermined price at a specified future date. Options provide the right, but not the obligation to buy or sell the commodity at a specified price in the future. Commodity swap and futures contracts require cash settlement for the commodity based on the difference between a fixed or floating price and the market price on the settlement date, and options require payment of an upfront premium. Because these derivatives are entered into to achieve objectives specifically related to our inventory and production risks, such gains and losses (to the extent not designated as accounting hedges and recognized on an unrealized basis in other comprehensive income) are recognized in cost of materials and other.
During the first quarter of 2018, we utilized Interest rate swap agreements economicallyto hedge floating rate debt by exchanging interest rate cash flows, based on a notional amount from a floating rate to a fixed rate. Effective with the Delek/Alon Merger, we acquired fourhad 4 interest rate swap agreements (that had maturities in March 2019) which effectively fixed the variable LIBOR interest component of the term loans within the Alon Retail Credit Agreement. The aggregate notional amount under these agreements were to cover approximately 77% of the outstanding principal of these term loans throughout the duration of the interest rate swaps. These interest rate swap agreements were terminated due to the extinguishment of the Alon Retail Credit
Agreement in connection with the Refinancing on March 30, 2018, resulting in a reclassification of unrealized loss of $0.6 million from accumulated other comprehensive income to interest expense on the condensed consolidated statement of income for the year ended December 31, 2018 - see Note 11 for further information.
Forward contracts are agreements to buy or sell a commodity at a predetermined price at a specified future date, and for our transactions, generally require physical delivery. Forward contracts where the underlying commodity will be used or sold in the normal course of business qualify as normal purchases and normal sales pursuant to ASC 815 and are not accounted for as derivative instruments. Rather, such forward contracts are accounted for under other applicable GAAP. Forward contracts entered into for trading purposes that do not meet the normal purchases, normal sales exception are accounted for as derivative instruments.instruments at fair value with changes in fair value recognized in earnings in the period of change. For the yearyears ended December 31, 2019 and 2018, all of our forward contracts that were accounted for as derivative instruments primarily consisted of contracts related to our Canadian crude trading operations. Since Canadian crude trading activity is not related to managing supply or pricing risk of the actual inventory that will be used in production, such unrealized and realized gains and losses are recognized in other operating income, (expense), net rather than cost of materials and other on the accompanying condensed consolidated statements of income. There were no forward contract transactions that were accounted for as derivatives for the yearsyear ended December 31, 2017 and 2016, and there were no forward contract derivative assets or liabilities outstanding as of December 31, 2017.
Futures, swaps or other commodity related derivative instruments that are utilized to specifically hedgeprovide economic hedges on our Canadian forward contract or investment positions are recognized in other operating income, (expense), net because that is where the related underlying transactions are reflected.
At this time, we do not believe there is any material credit risk with respect to the counterparties to any of our derivative contracts.
From time to time, we also enter into future commitments to purchase or sell RINs at fixed prices and quantities, which are used to manage the costs associated with our RINs Obligation. These future RIN commitment contracts meet the definition of derivative instruments under ASC 815, and are recorded at estimated fair value in accordance with the provisions of ASC 815. Changes in the fair value of these future RIN commitment contracts are recorded in cost of materials and other on the consolidated statements of income.
At this time, we do not believe there is any material credit risk with respect to the counterparties to any of our derivative contracts.
In accordance with ASC 815, certain of our commodity swap contracts and our interest rate agreements have been designated as cash flow hedges and the effective portion of the change in fair value between the execution date and the end of period (or early termination date in regards to the four4 Alon Retailretail interest rate swaps discussed above) has been recorded in other comprehensive income. The effective portion of the fair value of these contracts is recognized in income in the same financial statement line item as hedged transaction at the time the positions are closed and the hedged transactions are recognized in income. In regards to our interest rate swap agreements, the losses in accumulated other comprehensive income were reclassified into earnings as a result of the discontinuance of cash flow hedges since the originally forecasted Alon Retail Credit Agreement interest payments willdid not occur by the end of the originally specified time period due to the Refinancing on March 30, 2018, as discussed above.
The following table presents the fair value of our derivative instruments as of December 31, 20182019 and 2017.2018. The fair value amounts below are presented on a gross basis and do not reflect the netting of asset and liability positions permitted under our master netting arrangements, including cash collateral on deposit with our counterparties. We have elected to offset the recognized fair value amounts for multiple derivative instruments executed with the same counterparty in our financial statements. As a result, the asset and liability amounts below differ from the amounts presented in our consolidated balance sheets. See Note 13 for further information regarding the fair value of derivative instruments as presented below (in millions):
|
| | | | | | | | | | | | | | | | | |
| | | | December 31, 2019 | | December 31, 2018 |
| Derivative Type | Balance Sheet Location | | Assets | | Liabilities | | Assets | | Liabilities |
| Derivatives not designated as hedging instruments: | | | | | | | | |
Commodity derivatives(1) | Other current assets | | $ | 188.9 |
| | $ | (202.1 | ) | | $ | 158.3 |
| | $ | (142.4 | ) |
Commodity derivatives(1) | Other current liabilities | | 24.4 |
| | (34.0 | ) | | — |
| | (8.4 | ) |
Commodity derivatives(1) | Other long-term assets | | — |
| | — |
| | 2.1 |
| | (2.4 | ) |
Commodity derivatives(1) | Other long-term liabilities | | 23.4 |
| | (24.8 | ) | | 93.0 |
| | (94.0 | ) |
RIN commitment contracts(2) | Other current assets | | 0.6 |
| | — |
| | 2.0 |
| | — |
|
RIN commitment contracts(2) | Other current liabilities | | — |
| | (1.9 | ) | | — |
| | (6.7 | ) |
| Derivatives designated as hedging instruments: | | | | | | | | |
Commodity derivatives(1) | Other current assets | | 3.4 |
| | (2.0 | ) | | 200.3 |
| | (157.0 | ) |
Commodity derivatives(1) | Other current liabilities | | — |
| | — |
| | — |
| | — |
|
Commodity derivatives(1) | Other long-term assets | | 0.2 |
| | (0.1 | ) | | 6.1 |
| | (4.8 | ) |
| Interest rate derivatives | Other long-term liabilities | | — |
| | — |
| | — |
| | — |
|
| Total gross fair value of derivatives | | 240.9 |
| | (264.9 | ) | | 461.8 |
| | (415.7 | ) |
Less: Counterparty netting and cash collateral(3) | | 210.7 |
| | (249.5 | ) | | 399.9 |
| | (399.5 | ) |
| Total net fair value of derivatives | | $ | 30.2 |
| | $ | (15.4 | ) | | $ | 61.9 |
| | $ | (16.2 | ) |
|
| | | | | | | | | | | | | | | | | |
| | | | December 31, 2018 | | December 31, 2017 |
| Derivative Type | Balance Sheet Location | | Assets | | Liabilities | | Assets | | Liabilities |
| Derivatives not designated as hedging instruments: | | | | | | | | |
Commodity derivatives(1) | Other current assets | | $ | 158.3 |
| | $ | (142.4 | ) | | $ | 164.6 |
| | $ | (162.0 | ) |
Commodity derivatives(1) | Other current liabilities | | — |
| | (8.4 | ) | | 13.4 |
| | (28.3 | ) |
Commodity derivatives(1) | Other long-term assets | | 2.1 |
| | (2.4 | ) | | — |
| | — |
|
Commodity derivatives(1) | Other long-term liabilities | | 93.0 |
| | (94.0 | ) | | — |
| | — |
|
RIN commitment contracts(2) | Other current assets | | 2.0 |
| | — |
| | 1.4 |
| | — |
|
RIN commitment contracts(2) | Other current liabilities | | — |
| | (6.7 | ) | | — |
| | (24.0 | ) |
| Derivatives designated as hedging instruments: | | | | | | | | |
Commodity derivatives(1) | Other current assets | | 200.3 |
| | (157.0 | ) | | — |
| | — |
|
Commodity derivatives(1) | Other current liabilities | | — |
| | — |
| | — |
| | (13.6 | ) |
Commodity derivatives(1) | Other long-term assets | | 6.1 |
| | (4.8 | ) | | — |
| | — |
|
| Interest rate derivatives | Other long-term liabilities | | — |
| | — |
| | — |
| | (0.9 | ) |
| Total gross fair value of derivatives | | 461.8 |
| | (415.7 | ) | | 179.4 |
| | (228.8 | ) |
Less: Counterparty netting and cash collateral(3) | | 399.9 |
| | (399.5 | ) | | 163.5 |
| | (173.6 | ) |
| Total net fair value of derivatives | | $ | 61.9 |
| | $ | (16.2 | ) | | $ | 15.9 |
| | $ | (55.2 | ) |
| |
(1) | As of December 31, 20182019 and 2017,2018, we had open derivative positions representing 39,277,82286,484,065 and 35,978,00039,277,822 barrels, respectively, of crude oil and refined petroleum products. Of these open positions, contracts representing 16,461,000600,000 and 575,00016,461,000 barrels were designated as cash flow hedging instruments as of December 31, 2019 and 2018, and 2017, respectively. Additionally, as of December 31, 2019, we had open derivative positions representing 40,050,000 One Million British Thermal Units, ("MMBTU") of natural gas products. |
| |
(2) | As of December 31, 20182019 and 2017,2018, we had open RIN commitment contracts representing 137,750,000147,000,000 and 163,361,320137,750,000 RINs, respectively. |
| |
(3) | As of December 31, 2019 and 2018, and 2017, $(0.4)$38.8 million and $10.0$(0.4) million, respectively, of cash collateral (obligation) collateral held by counterparties has been netted with the derivatives with each counterparty. |
Total lossesgains (losses) on our commodityhedging derivatives and RIN commitment contracts recorded in cost of materials and other on the consolidated statements of income are as follows (in millions):
|
| | | | | | | | | | | | |
| | | Year Ended December 31, |
| | | 2018 | | 2017 | | 2016 |
Gains (losses) on commodity derivatives not designated as hedging instruments recognized in cost of materials and other (1) | | $ | 0.9 |
| | $ | (33.1 | ) | | $ | (21.7 | ) |
Gains on commodity derivatives not designated as hedging instruments recognized in other operating income (expenses), net (1) (2) | | 7.7 |
| | — |
| | — |
|
| Realized losses reclassified out of OCI on commodity derivatives designated as cash flow hedging instruments | | (1.7 | ) | | (38.6 | ) | | (27.8 | ) |
| Gains recognized on commodity derivatives due to cash flow hedging ineffectiveness | | 0.9 |
| | 0.5 |
| | 3.1 |
|
| Total income (losses) | | $ | 7.8 |
| | $ | (71.2 | ) | | $ | (46.4 | ) |
|
| | | | | | | | | | | | |
| | | Year Ended December 31, |
| | | 2019 | | 2018 | | 2017 |
Gains (losses) on commodity derivatives not designated as hedging instruments recognized in cost of materials and other (1) | | $ | 18.0 |
| | $ | 0.9 |
| | $ | (33.1 | ) |
Gains (losses) on commodity derivatives not designated as hedging instruments recognized in other operating income (expenses), net (1) (2) | | — |
| | 7.7 |
| | — |
|
| Realized gains (losses) reclassified out of accumulated other comprehensive income and into cost of materials and other on commodity derivatives designated as cash flow hedging instruments | | 4.8 |
| | (1.7 | ) | | (38.6 | ) |
| Gains recognized in cost of materials and other due to cash flow hedging ineffectiveness on commodity derivatives designated as hedging instruments | | — |
| | 0.9 |
| | 0.5 |
|
| Total gains (losses) | | $ | 22.8 |
| | $ | 7.8 |
| | $ | (71.2 | ) |
| |
(1) | Gains (losses) on commodity derivatives that are economic hedges but not designated as hedging instruments include unrealized gains (losses) of $32.1$(41.0) million, $(13.0)32.1 million and $(34.2)$(13.0) million for the years ended December 31, 2019, 2018 2017 and 2016,2017, respectively. Of these amounts, approximately $8.1$(6.8) million and $4.6$8.1 million for the years ended December 31, 20182019 and 2017,2018, respectively, represent unrealized (losses) gains where the instrument has matured but where it has not cash settled as of period end, excluding the reversal of prior period settlement differences. Derivative instruments that have matured but not cash settled at the balance sheet date continue to be reflected in derivative assets or liabilities on our balance sheet. |
| |
(2) | See separate table below for disclosures about "trading derivatives." |
The effect of cash flow hedge accounting on the consolidated statements of income is as follows (in millions):
|
| | | | |
| | | Year Ended December 31, |
| | | 2019 |
| Gain (loss) on cash flow hedging relationships recognized in cost of materials and other: | | |
| Commodity contracts: | | |
| Hedged items | | $ | (4.8 | ) |
| Derivative designated as hedging instruments | | 4.8 |
|
| Total | | $ | — |
|
For cash flow hedges, no0 component of the derivative instruments’ gains or losses was excluded from the assessment of hedge effectiveness for the years ended December 31, 2018, 2017 and 2016. As of December 31,2019, 2018 and 2017, cumulative gains of $35.4 million (related to Midland to Cushing crude price differentials at our refineries) and $7.6 million (related to future purchases of crude oil), respectively, on cash flow hedges, net of tax, remained in accumulated other comprehensive income.2017. Losses of $3.8 million, $1.5 million $25.1 million and $18.1$25.1 million, net of tax, on settled commodity contracts were reclassified into cost of materials and other in the consolidated statements of income during the years ended December 31,
2019, 2018 2017 and 2016,2017, respectively. We estimate that $43.6$1.4 million of deferred gains related to commodity cash flow hedges will be reclassified into cost of materials and other over the next 12 months as a result of hedged transactions that are forecasted to occur.
As of December 31, 2017 gains of $0.6 million, net of tax, related to the interest rate cash flow hedges, remained in accumulated other comprehensive income. Related to Alon's interest rate swap cash flow hedges for the year ended December 31, 2018, we recognized $0.7 million in interest expense on the consolidated statements of income in regards to normal settlements and for early termination settlements reclassified from accumulated other comprehensive income into income as a result of the discontinuation of cash flow hedge accounting. There was no cash flow hedge ineffectiveness for the year ended December 31, 2018 in regards to Alon's interest rate swap cash flow hedges. For the years ended December 31, 2018, 2017 and 2016, there were no amounts reclassified from accumulated other comprehensive income into income as a result of the discontinuation of cash flow hedge accounting.
Total gains on our trading forward contract derivatives (none of which were designated as hedging instruments) recorded in other operating income (expense),(income) expense, net on the condensed consolidated statements of income are as follows (in millions):
| | | | | | | Year Ended December 31, |
| | | Year Ended December 31, 2018 | | 2019 | | 2018 |
| Realized gains | | $ | 23.1 |
| | $ | 5.1 |
| | $ | 23.1 |
|
| Unrealized losses | | (3.0 | ) | |
| Unrealized gains (losses) | | | 3.6 |
| | (3.0 | ) |
| Total | | $ | 20.1 |
| | $ | 8.7 |
| | $ | 20.1 |
|
13. Fair Value Measurements
Our assets and liabilities that are measured at fair value include commodity derivatives, investment commodities, environmental credits obligations and Supply and Offtake Agreements. ASC 820 requires disclosures that we categorize assets and liabilities measured at fair value into one of three different levels depending on the observability of the inputs employed in the measurement. Level 1 inputs are quoted prices in active markets for identical assets or liabilities. Level 2 inputs are observable inputs other than quoted prices included within Level 1 for the asset or liability, either directly or indirectly through market-corroborated inputs. Level 3 inputs are unobservable inputs for the asset or liability reflecting our assumptions about pricing by market participants.
CommodityOur commodity derivative contracts, which consist of commodity swaps, exchange-traded futures, options and physical commodity forward purchase and sale contracts (that do not qualify as normal purchases or normal sales)sales exception under ASC 815), and interest rate swaps are generally valued using industry-standard models that consider various assumptions, including quoted forward prices, spot prices, interest rates, time value, volatility factors and contractual prices for the underlying instruments, as well as other relevant economic measures. The degree to which these inputs are observable in the forward markets determines the classification as Level 2 or 3. Our contracts are valued based on exchange pricing and/or price index developers such as Platts or Argus and are, therefore, classified as Level 2. Commodity investments
Investment commodities, which represent those commodities (generally crude oil) physically on hand as a result of trading activities with physical forward contracts, are valued using published market prices of the commodity on the applicable exchange and are, therefore, classified as Level 1.
Our RINs Obligation surplus or deficit is based on the amount of RINs we must purchase, net of amounts internally generated and purchased and the price of those RINs as of the balance sheet date. The RINs Obligation surplus or deficit is categorized as Level 2, and is measured at fair value based on quoted prices from an independent pricing service.
In both March 1, 2018 and March 1, 2017, the El Dorado refinery received approval from the EPA for a small refinery exemption from the requirements of the renewable fuel standard for the 2017 and 2016 calendar years, respectively which resulted in a reduction of our RINs Obligation and related cost of material other of approximately $59.3 million and $47.5 million for the year ended December 31, 2018 and 2017, respectively. In March 2018, the Krotz Springs refinery received such approval as well, which resulted in a reduction of our RINs Obligation and related cost of materials and other of approximately $31.6 million for the year ended December 31, 2018.
Our RIN commitment contracts are future commitments to purchase or sell RINs at fixed prices and quantities, which are used to manage the costs associated with our RINs Obligation. These RIN commitment contracts are categorized as Level 2, and are measured at fair value based on quoted prices from an independent pricing service. Changes in
Our environmental credits obligation surplus or deficit is based on the amount of RINs or other emissions credits we must purchase, net of amounts internally generated and purchased and the price of those RINs or other emissions credits as of the balance sheet date by refinery/obligor. The environmental credits obligation surplus or deficit is categorized as Level 2, and is measured at fair value either directly through observable inputs or indirectly through market-corroborated inputs.
The environmental credits obligation is impacted by government regulation requiring such credits, and the obligation, and likewise the value of these future the underlying credits, may be impacted by exemptions granted by the regulatory agencies. During the third quarter of 2019, the Tyler, El Dorado and Krotz Springs refineries received approval from the EPA for a small refinery exemption from the requirements of the renewable fuel standard ("RIN commitment contracts are recordedWaivers") for the 2018 calendar year, which resulted in a reduction of our RINs Obligation and related cost of materials and other inof approximately $20.7 million for the consolidated statements of income.
With respect to the J. Aron Agreements in effect as ofyear ended December 31, 2019. During the first quarter 2019, the Tyler and Big Spring refineries received RIN Waivers for the 2017 calendar year, which had an immaterial impact on our results of operations, while the 2017 RIN Waivers for the El Dorado and Krotz Springs refineries received in March 2018 resulted in a reduction of our RINs Obligation and related cost of materials and other of approximately $90.9 million for the year ended December 31, 2018. In March 2017, the El Dorado refinery received a RIN Waiver for the 2016 calendar year which resulted in a reduction of our RINs Obligation and related cost of material other of approximately $47.5 million for the year ended December 31, 2017.
As of and for the years ended December 31, 2019 and 2018, we elected to account for our related supply and offtake obligationsJ. Aron step-out liability at fair value in accordance with ASC 825, as it pertains to the fair value option.This standard permits the election As of December 31, 2018, our J. Aron step-out liability related to carry financial instruments and certain other items similar to financial instruments at fair value on the balance sheet, with all changes in fair value reported in earnings. For those periods for the El Dorado and Krotz SpringsSpring Supply and Offtake Agreements and at December 31, 2017 for our Big Spring Agreement, our corresponding J. Aron supply and offtake obligations arewas categorized as Level 2, and are measured at fair value using market prices for the consigned crude oil and refined products we arewere required to repurchase from J. Aron at the end of the term of the Supply and Offtake Agreements. These obligations are presented inAgreement. With respect to the current portion of the Obligation underamended Supply and Offtake Agreements, onsuch amendments being effective December 2018 for our consolidated balance sheets. Gains (losses) related to the change in fair value are recorded as a component of cost of materials and other in the consolidated statements of income. At December 31, 2018 with respect to the Big Spring Agreement and January 2019 for our El Dorado and Krotz Springs Agreements and as all subsequently amended on September 19, 2019, we apply fair value measurement as follows: (1) we determine fair value
for our amended fixed-price step-out liability based on changes in fair value related to interest rate risk where such obligation is categorized as Level 2 and is presented in the long-term portion of the Obligation under Supply and Offtake Agreements on our consolidated balance sheets, and where gains (losses) related to changes in fair value are recorded as a component of interest expense in the consolidated statements of income;2; and (2) we determine fair value of the short-term commodity-indexed financing facility based on the market prices for the consigned crude oil and refined products collateralizing the financing/funding where such obligation is categorized as Level 2 and is presented in the current portion of the Obligation under Supply and Offtake Agreements on our consolidated balance sheets, and where gains (losses) related to the change in fair value are recorded as a component of cost of materials and other in the consolidated statements of income.2.
Commodity investments represent those commodities (generally crude oil) physically on hand as a result of trading activities with physical forward contracts. Such investment stores are maintained on a weighted average cost basis for determining realized gains and losses on physical sales under forward contracts, and ending balances are adjusted to fair value at each reporting date. The unrealized loss on the commodity investments for the year ended December 31, 2018 totaled $2.0 million.
The fair value hierarchy for our financial assets and liabilities accounted for at fair value on a recurring basis at December 31, 2018 and 2017, was as follows (in millions):
| | | | | As of December 31, 2018 | | As of December 31, 2019 |
| | | Level 1 | | Level 2 | | Level 3 | | Total | | Level 1 | | Level 2 | | Level 3 | | Total |
| Assets | | | | | | | | | | | | | | | | |
| Commodity derivatives | | $ | — |
| | $ | 459.8 |
| | $ | — |
| | $ | 459.8 |
| | $ | — |
| | $ | 240.3 |
| | $ | — |
| | $ | 240.3 |
|
| Commodity investments | | 15.8 |
| | — |
| | — |
| | 15.8 |
| |
| Investment commodities | | | 12.1 |
| | — |
| | — |
| | 12.1 |
|
| RIN commitment contracts | | — |
| | 2.0 |
| | — |
| | 2.0 |
| | — |
| | 0.6 |
| | — |
| | 0.6 |
|
| Environmental Credits Obligation surplus | | | — |
| | 16.8 |
| | — |
| | 16.8 |
|
| Total assets | | 15.8 |
| | 461.8 |
| | — |
| | 477.6 |
| | 12.1 |
| | 257.7 |
| | — |
| | 269.8 |
|
| Liabilities | | | | | | | | | | | | | | | | |
| Commodity derivatives | | — |
| | (409.0 | ) | | — |
| | (409.0 | ) | | — |
| | (263.0 | ) | | — |
| | (263.0 | ) |
| RIN commitment contracts | | — |
| | (6.7 | ) | | — |
| | (6.7 | ) | | — |
| | (1.9 | ) | | — |
| | (1.9 | ) |
| RINs obligation deficit | | — |
| | (11.8 | ) | | — |
| | (11.8 | ) | |
| Environmental credits obligation deficit | | | — |
| | (18.5 | ) | | — |
| | (18.5 | ) |
| J. Aron supply and offtake obligations | | — |
| | (362.2 | ) | | — |
| | (362.2 | ) | | — |
| | (477.3 | ) | | — |
| | (477.3 | ) |
| Total liabilities | | — |
| | (789.7 | ) | | — |
| | (789.7 | ) | | — |
| | (760.7 | ) | | — |
| | (760.7 | ) |
| Net liabilities | | $ | 15.8 |
| | $ | (327.9 | ) | | $ | — |
| | $ | (312.1 | ) | | $ | 12.1 |
| | $ | (503.0 | ) | | $ | — |
| | $ | (490.9 | ) |
| | | | | As of December 31, 2017 | | As of December 31, 2018 |
| | | Level 1 | | Level 2 | | Level 3 | | Total | | Level 1 | | Level 2 | | Level 3 | | Total |
| Assets | | | | | | | | | | | | | | | | |
| Commodity derivatives | | $ | — |
| | $ | 178.0 |
| | $ | — |
| | $ | 178.0 |
| | $ | — |
| | $ | 459.8 |
| | $ | — |
| | $ | 459.8 |
|
| Investment commodities | | | 15.8 |
| | — |
| | — |
| | 15.8 |
|
| RIN commitment contracts | | — |
| | 1.4 |
| | — |
| | 1.4 |
| | — |
| | 2.0 |
| | — |
| | 2.0 |
|
| RINs Obligation surplus | | — |
| | 1.1 |
| | — |
| | 1.1 |
| |
| Environmental credits obligation surplus | | | — |
| | — |
| | — |
| | — |
|
| Total assets | | — |
| | 180.5 |
| | — |
| | 180.5 |
| | 15.8 |
| | 461.8 |
| | — |
| | 477.6 |
|
| Liabilities | | | | | | | | | | | | | | | | |
| Commodity derivatives | | — |
| | (203.9 | ) | | — |
| | (203.9 | ) | | — |
| | (409.0 | ) | | — |
| | (409.0 | ) |
| Interest rate derivatives | | — |
| | (0.9 | ) | | — |
| | (0.9 | ) | |
| RIN commitment contracts | | — |
| | (24.0 | ) | | — |
| | (24.0 | ) | | — |
| | (6.7 | ) | | — |
| | (6.7 | ) |
| RINs obligation deficit | | — |
| | (130.8 | ) | | — |
| | (130.8 | ) | |
| Environmental credits obligation deficit | | | — |
| | (11.8 | ) | | — |
| | (11.8 | ) |
| J. Aron supply and offtake obligations | | — |
| | (435.6 | ) | | — |
| | (435.6 | ) | | — |
| | (362.2 | ) | | — |
| | (362.2 | ) |
| Total liabilities | | — |
| | (795.2 | ) | | — |
| | (795.2 | ) | | — |
| | (789.7 | ) | | — |
| | (789.7 | ) |
| Net liabilities | | $ | — |
| | $ | (614.7 | ) | | $ | — |
| | $ | (614.7 | ) | | $ | 15.8 |
| | $ | (327.9 | ) | | $ | — |
| | $ | (312.1 | ) |
The derivative values above are based on analysis of each contract as the fundamental unit of account as required by ASC 820. In the table above, derivative assets and liabilities with the same counterparty are not netted where the legal right of offset exists. This differs from the presentation
in the financial statements which reflects our policy, wherein we have elected to offset the fair value amounts recognized for multiple derivative instruments executed with the same counterparty and where the legal right of offset exists. As of December 31, 2019 and 2018, and 2017, $(0.4)$38.8 million and $10.0$(0.4) million, respectively, of cash collateral (obligation) collateral was held by counterparty brokerage firms and has been netted with the net derivative positions with each counterparty. See Note 12 for further information regarding derivative instruments.
14. Commitments and Contingencies
Litigation
In the ordinary conduct of our business, we are from time to time subject to lawsuits, investigations and claims, including environmental claims and employee-related matters. Although we cannot predict with certainty the ultimate resolution of lawsuits, investigations and claims asserted against us, including civil penalties or other enforcement actions, we do not believe that any currently pending legal proceeding or proceedings to which we are a party will have a material adverse effect on our financial statements. Certain environmental matters that have or may result in penalties or assessments are discussed below in the "Environmental,"Environmental, Health and Safety" section of Note 14.this note.
One of our Alon subsidiaries was party tothe defendant in a lawsuit alleging breach of contract pertaininglegal action related to an asphalt supply agreement. Duringeasement dispute arising from a purchase of property that occurred in October 2013, prior to the Delek/Alon Merger. In June 2019, the court found in favor of the plaintiffs and assessed damages against such subsidiary totaling $6.7 million, which is included as of December 31, 2019 in accrued expenses and other current liabilities on the accompanying consolidated balance sheet, and which reflects a $5.7 million increase in the accrual recorded during the year ended December 31, 2017,2019. Additionally, we have incurred $1.2 million of related legal expenses during the year ended December 31, 2019 and has been recorded in general and administrative expenses in the accompanying consolidated statements of income.
As of December 31, 2019 and 2018, AltAir (one of the California Discontinued Entities) was the party to a lawsuit whereby the plaintiff alleged breach of contract relating to a supply agreement during the period prior to the Delek/Alon Merger. We recorded a contingent liability associated with this matter (the "Ten-Tex Litigation") totaling $5.0 million as part of the purchase price allocation, which was finalized in June 2018. In July 2019, we reached a settlement onwith the plaintiff, whereby we were obligated for $2.3 million of the judgment against AltAir plus expected legal fees of approximately $0.2 million. Related to this matterobligation, we reduced our litigation accrual by $2.4 million during the year ended December 31, 2019, which was includedrecorded in accrueddiscontinued operations. In August 2019, we reached an agreement with World Energy to offset amounts payable by Delek under our seller obligations for the Ten-Tex Litigation matter against the working capital settlement receivable, and to convert the net receivable into the World Energy Note Receivable. As a result, this obligation is no longer reflected in our liabilities in purchase accountingon the consolidated balance sheet as part of the fair valueDecember 31, 2019. See Note 8 for further discussion of the liabilities assumed in the Delek/Alon Merger.these matters.
Self-insurance
Delek records a self-insurance accrual for workers’ compensation claims up to a $1.0$4.0 million deductible on a per accident basis, general liability claims up to $4.0 million on a per occurrence basis, and medical claims for eligible full-time employees up to $0.3 million per covered individual per calendar year .year. We also record a self-insurance accrual for auto liability up to a $1.0$4.0 million deductible on a per accident basis for claims incurred in recent periods, and up to a $4.0 million deductible for remaining claims from certain prior periods.basis.
We have umbrella liability insurance available to each of our segments in an amount determined reasonable by management.
Environmental Health and Safety
We are subject to extensive federal, state and local environmental and safety laws and regulations enforced by various agencies, including the EPA, the United States Department of Transportation and the Occupational Safety and Health Administration, as well as numerous state, regional and local environmental, safety and pipeline agencies. These laws and regulations govern the discharge of materials into the environment, waste management practices, pollution prevention measures and the composition of the fuels we produce, as well as the safe operation of our plants and pipelines and the safety of our workers and the public. Numerous permits or other authorizations are required under these laws and regulations for the operation of our refineries, renewable fuels facilities, terminals, pipelines, underground storage tanks, trucks, rail cars and related operations, and may be subject to revocation, modification and renewal.
These laws and permits raise potential exposure to future claims and lawsuits involving environmental and safety matters which could include soil and water contamination, air pollution, personal injury and property damage allegedly caused by substances which we manufactured, handled, used, released or disposed of, transported, or that relate to pre-existing conditions for which we have assumed responsibility. We believe that our current operations are in substantial compliance with existing environmental and safety requirements. However, there have been and will continue to be ongoing discussions about environmental and safety matters between us and federal and state authorities, including notices of violations, citations and other enforcement actions, some of which have resulted or may result in changes to operating procedures and in capital expenditures. While it is often difficult to quantify future environmental or safety related expenditures, we anticipate that continuing capital investments and changes in operating procedures will be required for the foreseeable future to comply with existing and new requirements, as well as evolving interpretations and more strict enforcement of existing laws and regulations.
On November 5, 2018, Alon and certain of its subsidiaries including Alon Bakersfield Property, Inc. (collectively, "ABPI") entered into a Settlement and Release Agreement (the "Settlement Agreement") with Equilon Enterprises, LLC, doing business as Shell Oil Products, US ("Shell"), a former owner of our non-operating refinery located in Bakersfield California (the "Bakersfield Refinery")refinery which was acquired by Delek in connection with the Delek/Alon Merger. The Settlement Agreement resolved certain disputed indemnification matters related to environmental obligations and asset retirement obligations at the Bakersfield Refinery.refinery. As a result of this Settlement Agreement, Shell paid ABPI a lump sum payment of $34.0 million and conveyed to ABPI ownership of a non-operating terminal located on the site of the Bakersfield Refineryrefinery (deemed to have little or no value) and the parties will terminate a nominal lease agreement related to such terminal. Of this total lump sum settlement payment, $14.0 million was previously recognized as an indemnification receivable in the purchase price allocation associated with the Delek/Alon Merger as of July 1, 2017, because such amounts represented indemnification that
was deemed by the Company to be probable of realization based on existing indemnification agreements in place on the date of the acquisition and that related to identified asset retirement obligations that were also recognized in the purchase price allocation. Of the remaining settlement amount received, $16.0 million is attributable to additional recoveries of remediation costs and is included as a reduction of operating expenses, and $4.0 million is considered additional consideration for concessions made under the Settlement Agreement and is included as other income in the accompanying consolidated statements of income for the year ended December 31, 2018.
The Big Spring refinery has been negotiatingnegotiated an agreement with the EPA for over 10 years under the EPA’s National Petroleum Refinery Initiative regarding alleged historical violations of the federal Clean Air Act related to emissions and emissions control equipment. A Consent Decreeconsent decree resolving these alleged historical violations for the Big Spring refinery was lodged with the United States District Court for the Northern District of Texas on June 6, 2017, and we expect that Consent Decree to become final in early 2019 when amendments to the Consent Decree are lodged.2017. An amendment to the Consent Decreesuch consent decree was agreed upon by the Delek and the EPA/DOJDepartment of Justice ("DOJ") in late 2018 and was executed by Delek. However,That amended consent decree was lodged during the amendment to the Consent Decreefirst quarter of 2019, and was not executedentered by the EPA/DOJ and lodged due to the government shutdown. Once the amendment is lodged and entered, the Consent Decreewill require paymentCourt on June 5, 2019. The civil penalty of a $0.5 million civil penalty andwas paid on June 18, 2019. Per amended consent decree, the Company will be required to expend capital expenditures for pollution control equipment that may be significant over the next 10 years.
The Big Spring refinery had been in discussions with the EPA since March 2016 to resolve alleged violations regarding six batches of gasoline produced in 2012-2013 that exceeded the applicable Reid Vapor Pressure standard. The issue, which was previously accrued in the Delek/Alon Merger purchase price allocation, was resolved in January 2018, resulting in payment of a penalty of approximately $0.4 million.
The USA's Paramount Petroleum subsidiary had been in discussions with the State of California since December 2016 regarding alleged violations of the state's Low Carbon Fuel Standard ("LCFS") program related to reporting of fuel transactions. The issue, which was previously accrued in the Delek/Alon Merger purchase price allocation, was resolved in March 2018, resulting in payment of a penalty of approximately $0.3 million.
As of December 31, 2018,2019, we have recorded an environmental liability of approximately $143.3$146.1 million, primarily related to the estimated probable costs of remediating or otherwise addressing certain environmental issues of a non-capital nature at our refineries, as well as terminals, some of which we no longer own. This liability includes estimated costs for ongoing investigation and remediation efforts, which were already being performed by the former operators of the refineries and terminals prior to our acquisition of those facilities, for known contamination of soil and groundwater, as well as estimated costs for additional issues which have been identified subsequent to the acquisitions. Approximately $3.8$8.2 million of the total liability is expected to be expended over the next 12 months, with most of the balance expended by 2032, although some costs may extend up to 30 years. In the future, we could be required to extend the expected remediation period or undertake additional investigations of our refineries, pipelines and terminal facilities, which could result in the recognition of additional remediation liabilities.
Environmental liabilities with payments that are fixed or reliably determinable have been discounted to present value at various rates depending on their expected payment stream. In regards to the environmental liabilities assumed in the Delek/Alon acquisition, the discount rates vary from 2.31%1.51% to 2.84%. See Note 3 for further information regarding the environmental liabilities assumed in the Delek/Alon Merger. In regards to the environmental liability associated with the Tyler refinery, a discount rate of 2.78% has been used.
The table below summarizessummaries our environmental liability accruals (in millions):
| | | | | December 31, | | December 31, |
| | | 2018 | | 2017 | | 2019 | | 2018 |
| Discounted environmental liabilities | | $ | 58.7 |
| | $ | 33.7 |
| | $ | 59.5 |
| | $ | 58.7 |
|
| Undiscounted environmental liabilities | | 84.6 |
| | 42.4 |
| | 86.6 |
| | 84.6 |
|
| Total accrued environmental liabilities | | $ | 143.3 |
| | $ | 76.1 |
| | $ | 146.1 |
| | $ | 143.3 |
|
As of December 31, 2018,2019, the estimated future payments of environmental obligations for which discounts have been applied are as follows (in millions):
| | | 2019 | | $ | 2.9 |
| |
| 2020 | | 3.1 |
| | $ | 4.0 |
|
| 2021 | | 3.2 |
| | 3.0 |
|
| 2022 | | 3.7 |
| | 3.0 |
|
| 2023 | | 2.8 |
| | 4.0 |
|
| 2024 | | | 2.6 |
|
| Thereafter | | 61.7 |
| | 63.1 |
|
| Discounted environmental liabilities, gross | | 77.4 |
| | 79.7 |
|
| Less: Discount applied | | 18.7 |
| | 20.2 |
|
| Discounted environmental liabilities | | $ | 58.7 |
| | $ | 59.5 |
|
Crude Oil and Other Releases
We have experienced several crude oil and other releases from pipelines owned byinvolving our logistics segment,assets, including butfive releases that occurred in 2019 and six releases that occurred in 2018. Cleanup operations and site maintenance and remediation efforts on these and other releases are at various stages of completion. The majority of remediation efforts for these releases have been substantially completed, or have received regulatory closure. Boom maintenance and confirmatory sampling has been completed on the releases that occurred in 2019, with the exception of one release, which is currently in boom maintenance. We received regulatory closure in December of 2019 for the release sites that have not limited to:yet received it, with closure on a few remaining sites expected to occur in 2020.
Magnolia StationMany of the releases have occurred on the SALA gathering system. During the year ended December 31, 2019, we decommissioned certain sections of the SALA gathering system in March 2013 (the "Magnolia Release");an effort to improve the safety and integrity of the system. The decommissioning of these sections was completed in August 2019 and the project did not have a material effect on the financial statements.
On October 3, 2019, a pipeline segment eastrelease of El Dorado, Arkansas in February 2018;
a gathering line release neardiesel fuel involving one of our storage facilities located southpipelines occurred near Sulphur Springs, Texas (the "Sulphur Springs Release"). Cleanup operations and site maintenance and remediation on this release have been substantially completed where such costs incurred totaled $7.1 million during the year ended December 31, 2019. Ground water wells for monitoring activities are expected to be installed in the first quarter of El Dorado, Arkansas2020. We expect the monitoring period to last for at least a year. We have not received notification that any legal action with respect to fines and penalties will be pursued by the regulatory agencies.
Expenses incurred for the remediation of these crude oil and other releases are included in February 2018;
a gathering line release located on property owned by Clean Harbors, Inc.operating expenses in El Dorado, Arkansas in March 2018;
two gathering line releases near Smackover, Arkansas occurring in November 2018 and December 2018; and
a gathering line release near Norphlet, Arkansas in December 2018.our consolidated statements of income.
The United States Department of Justice (the "DOJ"),DOJ, on behalf of the EPA, and the State of Arkansas, on behalf of the Arkansas Department of Environmental Quality, have been pursuing an enforcement action against Delek Logistics with regard to potential violations of the Clean Water Act and certain state laws arising from the release of crude oil from a pumping facility at its Magnolia ReleaseStation near the El Dorado Refinery (the "Magnolia Release") since June 2015. On July 13, 2018, the DOJ and the State of Arkansas filed a civil action against two of Delek Logistics’ wholly-owned subsidiaries, Delek Logistics Operating LLC and SALA Gathering Systems LLC, in the United States District Court for the Western District of Arkansas. On or around
In December 12, 2018, Delek Logistics, the United States and the State of Arkansas reached an agreement to settle the claims related to the Magnolia Release for $2.2 million and the claims against the PartnershipDelek Logistics were resolved and an additional demand for a compliance audit at the Magnolia terminal was abandoned pursuant toin exchange for payment of monetary penalties and other relief. AsIn July 2019, Delek Logistics signed and submitted to the DOJ, a consent decree (the "Magnolia Consent Decree") to settle the release, and on August 30, 2019, the Magnolia Consent Decree was lodged with the Court. On November 8, 2019, the Magnolia Consent Decree was entered and on November 20, 2019, final payments were made to the State of December 31, 2018, we have accrued $2.2Arkansas in the amount of $0.6 million and to the DOJ in the amount of $1.7 million, which we recorded in accrued expenses and other current liabilities in our condensed consolidated balance sheet, which represents the full settlement amount for these proceedings. We believe this amount is adequate to cover our expected obligations related to these proceedings and that these proceedings will not have a material adverse effect upon Delek's business, financial condition or result of operations.includes interest.
Asset Retirement Obligations
The reconciliation of the beginning and ending carrying amounts of asset retirement obligations is as follows (in millions):
| | | | | December 31, | | December 31, |
| | | 2018 | | 2017 | | 2019 | | 2018 |
| Beginning balance | | $ | 72.1 |
| | $ | 5.2 |
| | $ | 75.5 |
| | $ | 72.1 |
|
Liabilities identified (1) | | (1.2 | ) | | 66.2 |
| | — |
| | (1.2 | ) |
| Liabilities settled | | (2.2 | ) | | — |
| | (8.6 | ) | | (2.2 | ) |
| Accretion expense | | 1.9 |
| | 0.7 |
| | 1.7 |
| | 1.9 |
|
| Reclassification from discontinued operations | | 4.9 |
| | — |
| | — |
| | 4.9 |
|
| Ending balance | | $ | 75.5 |
| | $ | 72.1 |
| | $ | 68.6 |
| | $ | 75.5 |
|
(1)All asset retirement obligations were assumed in the Delek/Alon Merger.
Business Interruption Insurance Proceeds
In January 2016, Delek US received an insurance settlement in the amount of $49.0 million related to losses stemming from the rupture of an unaffiliated third-party pipeline in 2012 that supplied crude to the El Dorado refinery. Of the total settlement, $42.4 million was recognized as business interruption proceeds in our 2016 consolidated statement of income.
Letters of Credit
As of December 31, 2018,2019, we had in place letters of credit totaling approximately $179.4$309.8 million with various financial institutions securing obligations primarily with respect to our commodity purchases for the refining segment and certain of our insurance programs. There were no0 amounts drawn by beneficiaries of these letters of credit at December 31, 2018.2019.
Operating Leases
Delek leases buildings, equipment and corporate office space under agreements expiring at various dates through 2035 after considering available renewal options. Many of these leases contain renewal options and require Delek to pay executory costs (such as property taxes, maintenance and insurance). Lease expense for all operating leases for the years ended December 31, 2018, 2017 and 2016 totaled $46.2 million, $40.9 million, and $31.1 million, respectively.
The following is an estimate of our future minimum lease payments for operating leases having remaining noncancelable terms in excess of one year as of December 31, 2018 (in millions):
|
| | | | |
| 2019 | | $ | 48.1 |
|
| 2020 | | 42.1 |
|
| 2021 | | 39.5 |
|
| 2022 | | 28.5 |
|
| 2023 | | 23.4 |
|
| Thereafter | | 77.9 |
|
| Total future minimum rentals | | $ | 259.5 |
|
15. Income Taxes
Deferred income taxes reflect the net tax effects of temporary differences between the carrying amounts of assets and liabilities for financial reporting purposes and the amounts used for income tax purposes.
On December 22, 2017, the U.S. government enacted the Tax Reform Act, which makesmade broad and complex changes to the U.S. tax code, including a permanent reduction in the U.S. federal corporate tax rate from 35% to 21% (“Rate Reduction”). The Tax Reform Act also puts into place new tax laws that will apply prospectively, which include, but are not limited to, modifying the rules governing the deductibility of certain executive compensation; extending and modifying the additional first-year depreciation deduction to accelerate expensing of certain qualified property; creating a limitation on deductible interest expense; and changing rules related to uses and limitations of net operating loss carryforwards. At December 31, 2018, we finalized our accounting analysis based on the guidance, interpretations, and data available. Adjustments made in the fourth quarter 2018 upon finalization of our accounting analysis were not material to our consolidated financial statements. We continue to monitor IRS guidance including final regulations, revenue rulings, revenue procedures, and applicable notices.
We applied the guidance in Staff Accounting Bulletin 118 (“SAB 118”), when accounting for the effects of the Tax Reform Act. At December 31,In 2017, we made a reasonable estimate of the effects on our existing deferred tax balances, and recognized a provisional benefit amount of $166.9 million, which was included as a component of income tax expense from continuing operations. We remeasured certain deferred tax assets and liabilities based on the rates at which they are expected to reverse in the future, which is generally 21% for federal purposes. For the year ended December 31, 2018, we completed the analysis of the accounting for the tax effects of the Tax Reform Act, resulting in our recording of an additional tax benefit of $0.6 million during 2018. These adjustments to the previously recorded provisional amounts include the tax effects on the remeasurement of the existing net deferred tax liabilities.balances and executive compensation. We also had a reclassification of $1.6 million from accumulated other comprehensive income to retained earnings for stranded tax effects as of December 31, 2018 resulting from the Tax Reform Act. See Note 2 for further information.
On January 1, 2018, we adopted ASU 2016-16 as discussed in Note 1.2016-16. As a result of the adoption, we decreased prepaid income taxes by $59.4 million, increased income taxes payable by $3.0 million, increased deferred tax assets by $18.0 million (net of a valuation allowance of $17.2 million), and decreased retained earnings by $44.4 million for the cumulative effect related to new guidance that requires recognizing the income tax consequences of an intra-entity transfer of an asset other than inventory when the transfer occurs - see Note 2 for further information.
Significant components of Delek's deferred tax assets (liabilities) reported in the accompanying consolidated financial statements as of December 31, 20182019 and 20172018 were as follows (in millions):
| | | | December 31, | December 31, |
| | 2018 | | 2017 | 2019 | | 2018 |
| Non-Current Deferred Taxes: | | | | | | |
| Property, plant and equipment, and intangibles | $ | (275.6 | ) | | $ | (180.9 | ) | $ | (306.3 | ) | | $ | (275.6 | ) |
| Right-of-use asset | | (40.7 | ) | | — |
|
| Derivatives and hedging | | — |
| | (12.5 | ) |
| Partnership and equity investments | 22.2 |
| | (83.7 | ) | (15.5 | ) | | — |
|
| Deferred revenues | (5.5 | ) | | (6.5 | ) | (5.3 | ) | | (5.5 | ) |
| Total deferred tax liabilities | | (367.8 | ) | | (293.6 | ) |
| Derivatives and hedging | (12.5 | ) | | 4.8 |
| 4.3 |
| | — |
|
| Compensation and employee benefits | 15.5 |
| | 15.9 |
| 14.5 |
| | 15.5 |
|
| Net operating loss carryforwards | 39.9 |
| | 26.5 |
| 52.4 |
| | 39.9 |
|
| Partnership and equity investments | | — |
| | 22.2 |
|
| Lease obligation | | 40.7 |
| | — |
|
| Reserves and accruals | 63.0 |
| | 40.8 |
| 48.3 |
| | 57.5 |
|
| Inventories | 1.3 |
| | 4.4 |
| |
| Other | | 5.5 |
| | 6.8 |
|
| Total deferred tax assets | | 165.7 |
| | 141.9 |
|
| Valuation allowance | (58.5 | ) | | (21.2 | ) | (65.8 | ) | | (58.5 | ) |
| Total net deferred tax liabilities | $ | (210.2 | ) | | $ | (199.9 | ) | $ | (267.9 | ) | | $ | (210.2 | ) |
The difference between the actual income tax expense and the tax expense computed by applying the statutory federal income tax rate to income from continuing operations was attributable to the following (in millions):
| | | | Year Ended December 31, | Year Ended December 31, |
| | 2018 | | 2017 | | 2016 | 2019 | | 2018 | | 2017 |
| Provision (benefit) for federal income taxes at statutory rate | $ | 102.0 |
| | $ | 104.7 |
| | $ | (137.0 | ) | |
| State income tax expense (benefit), net of federal tax provision | 5.5 |
| | 4.9 |
| | (10.2 | ) | |
| Income tax (benefit) expense attributable to non-controlling interest | (7.3 | ) | | (12.0 | ) | | (7.1 | ) | |
| Provision for federal income taxes at statutory rate | | $ | 84.6 |
| | $ | 102.0 |
| | $ | 104.7 |
|
| State income tax expense, net of federal tax provision | | 6.3 |
| | 3.4 |
| | 9.0 |
|
| Income tax benefit attributable to non-controlling interest | | (5.4 | ) | | (7.3 | ) | | (12.0 | ) |
Tax credits and incentives | (8.3 | ) | | (1.6 | ) | | (9.7 | ) | (23.2 | ) | | (8.3 | ) | | (1.6 | ) |
| Partnership basis differences not expected to be realized | 5.5 |
| | — |
| | — |
| |
| Dividends received deduction | — |
| | (2.8 | ) | | (5.7 | ) | |
| Executive compensation limitation | 1.7 |
| | 1.5 |
| | 0.3 |
| 2.0 |
| | 1.7 |
| | 1.5 |
|
| Stock compensation | (2.2 | ) | | — |
| | — |
| (2.5 | ) | | (2.2 | ) | | (1.1 | ) |
| Changes in valuation allowance | | 7.3 |
| | 7.7 |
| | (4.1 | ) |
| Amortization - prepaid taxes | — |
| | (2.4 | ) | | (3.5 | ) | — |
| | — |
| | — |
|
| Reversal of deferred taxes related to equity method investment in Alon | — |
| | 45.3 |
| | — |
| — |
| | — |
| | 45.3 |
|
| Impact of Tax Reform Act | (0.6 | ) | | (166.9 | ) | | — |
| — |
| | (0.6 | ) | | (166.9 | ) |
| Goodwill write-down | 5.3 |
| | — |
| | — |
| — |
| | 5.3 |
| | — |
|
| Other items | 0.3 |
| | 0.1 |
| | 1.4 |
| 2.6 |
| | 0.2 |
| | (4.0 | ) |
| Income tax expense (benefit) | $ | 101.9 |
| | $ | (29.2 | ) | | $ | (171.5 | ) | $ | 71.7 |
| | $ | 101.9 |
| | $ | (29.2 | ) |
| |
(1) | Tax credits and incentives include work opportunity and research and development credits, as well as incentives for the Company’s biodiesel blending operations. |
Tax credits and incentives include work opportunity, research and development, E-85 and blocked pump tax credits, as well as incentives for the Company’s biodiesel blending operations.
Income tax expense (benefit) from continuing operations was as follows (in millions):
| | | | Year Ended December 31, | Year Ended December 31, |
| | 2018 | | 2017 | | 2016 | 2019 | | 2018 | | 2017 |
| Current | $ | 128.7 |
| | $ | 18.8 |
| | $ | (18.3 | ) | $ | 7.1 |
| | $ | 128.7 |
| | $ | 18.8 |
|
| Deferred | (26.8 | ) | | (48.0 | ) | | (153.2 | ) | 64.6 |
| | (26.8 | ) | | (48.0 | ) |
| | $ | 101.9 |
| | $ | (29.2 | ) | | $ | (171.5 | ) | $ | 71.7 |
| | $ | 101.9 |
| | $ | (29.2 | ) |
We carry valuation allowances against certain state deferred tax assets and net operating losses that may not be recoverable with future taxable income. We also carry valuation allowances related to basis differences that may not be recoverable. During the years ended December 31, 20182019 and 2017,2018, we recorded increases to the valuation allowance related to continuing operations of $7.3 million and $37.3 million ($17.2 million of which was charged to retained earnings as a result of the cumulative effect of the adoption of accounting guidance, discussed above) and $13.9 million,ASU 2016-16), respectively.
In assessing the realizability of deferred tax assets, management considers whether it is more likely than not that some portion or all of the deferred tax assets will be realized. The ultimate realization of deferred tax assets is dependent upon the generation of future taxable income during the periods in which those temporary differences become deductible. Management considers the scheduled reversal of deferred tax liabilities, projected future taxable income, and tax planning strategies in making this assessment. Based upon the level of historical taxable income and projections for future taxable income over the periods for which the deferred tax assets are deductible, management believes it is more likely than not Delek will realize the benefits of these deductible differences, net of the existing valuation allowance. The amount of the deferred tax assets considered realizable, however, could be reduced in the near term if estimates of future taxable income during the carryforward period are reduced. Subsequently recognized tax benefit or expense relating to the valuation allowance for deferred tax assets will be reported as an income tax benefit or expense in the consolidated statement of income.
State net operating loss and credit carryforwards at December 31, 20182019 totaled $668.4$912.5 million and $3.5$2.4 million, respectively, a portion of which are subject to a valuation allowance. State net operating losses will begin expiring in 2019 through 2038. Stateand tax credit carryforwards will begin expiring in 2020.
Delek files a consolidated U.S. federal income tax return, as well as income tax returns in various state jurisdictions. Delek is no longer subject to U.S. federal income tax examinations by tax authorities for years through 2013. The Internal Revenue Service has examined Delek's income2011. Delek is under Joint Committee of Taxation review for tax returnsyears 2012 through the tax year ended 2013. However, pre-acquisition2017. Pre-acquisition tax returns for Alon USA Energy & Subsidiaries ("Alon") are open toclosed for U.S. federal income tax examinations beginning withfor the tax year ended December 31, 2013.2012. Alon's federal income tax returns for tax years 2014 through 2016 are currently under examination. The CompanyAlon is currently under Joint Committee of Taxation review for tax year 2017. Delek is currently under audit in the state of Texasvarious states for thetax years ended December 31, 20132014 through December 31, 2014.2017. No material adjustments have been identified at this time.
ASC 740 provides a recognition threshold and guidance for measurement of income tax positions taken or expected to be taken on a tax return. ASC 740 requires the elimination of the income tax benefits associated with any income tax position where it is not "more likely than not" that the position would be sustained upon examination by the taxing authorities.
Increases and decreases to the beginning balance of unrecognized tax benefits, which includes interest and penalties, during the years ended December 31, 2019, 2018, 2017, and 20162017 were as follows:
| | | | 2018 | | 2017 | | 2016 | 2019 | | 2018 | | 2017 |
| Balance at the beginning of the year | $ | 6.1 |
| | $ | 1.7 |
| | $ | 0.2 |
| $ | 19.2 |
| | $ | 6.1 |
| | $ | 1.7 |
|
| Additions based on tax positions related to current year | 11.2 |
| | 0.4 |
| | 1.5 |
| 0.4 |
| | 11.2 |
| | 0.4 |
|
| Additions for tax positions related to prior years and acquisitions | 3.4 |
| | 4.2 |
| | — |
| 6.4 |
| | 3.4 |
| | 4.2 |
|
| Reductions for tax positions related to prior years | (0.9 | ) | | (0.2 | ) | | — |
| (13.0 | ) | | (0.9 | ) | | (0.2 | ) |
| Settlements with taxing authorities | (0.6 | ) | | — |
| | — |
| (0.9 | ) | | (0.6 | ) | | — |
|
| Balance at the end of the year | $ | 19.2 |
| | $ | 6.1 |
| | $ | 1.7 |
| $ | 12.1 |
| | $ | 19.2 |
| | $ | 6.1 |
|
The amount of the unrecognized benefit above, that if recognized would change the effective tax rate, is $7.4 million and $4.6 million as of both December 31, 20182019 and 2017, respectively.
Delek recognizes accrued interest and penalties related to unrecognized tax benefits as an adjustment to the current provision for income taxes. We recognized interest (income) expense of $(1.1) million, $2.9 million, and $0.5 million of interest was recognized related to unrecognized tax benefits during the years ended December 31, 2019 , 2018 and 2017, respectively and a nominal amount of2017. The total recognized liability for interest was recognized during the year ended$2.4 million and $3.5 million as of December 31, 2016.2019 and 2018, respectively.
Uncertain tax positions have been examined by Delek for any material changes in the next 12 months, and noneno material changes are expected.
16. Related Party Transactions
Transaction with Caddo Pipeline, LLC ("CP LLC")
For the years ended December 31, 2018 and 2017, respectively, our refining segment paid pipeline throughput fees of $1.3 million and $1.6 million to CP LLC. There was no revenue and/or activity for the year ended December 31, 2016 as the Caddo Pipeline construction was completed at the end of December 2016. Delek Logistics owns 50% of CP LLC, and Plains All American Pipeline, LLC, a third-party, owns the other 50%.
Transactions with Rangeland RIO Pipeline, LLC ("Andeavor Logistics")
During 2018, Rangeland RIO Pipeline, LLC was acquired by Andeavor and became Andeavor Logistics RIO Pipeline LLC ("Andeavor Logistics"). For the years ended December 31, 2018, 2017 and 2016, respectively, our refining segment paid pipeline throughput fees of $17.9 million, $13.8 million and $3.1 million to Andeavor Logistics. As of December 31, 2018 and 2017, respectively, we carried a $1.5 million and $1.2 million payable balance to Andeavor Logistics, which is reflected in accounts payable to related party on our consolidated balance sheets. Delek Logistics owns 33% of Andeavor Logistics, and Rangeland Energy II, LLC, a third-party, owns 67%.
Transactions with Wright Asphalt Products Company, LLC ("Wright Asphalt")
For the year ended December 31, 2018 and the period from the Delek/Alon Merger date of July 1, 2017 through December 31, 2017, respectively, our refining segment paid throughput fees of $0.2 million and $1.8 million to Wright Asphalt. In addition, for the years ended December 31, 2018 and 2017, respectively, our other segment had related party revenues of $32.1 million and $40.9 million from Wright Asphalt related to asphalt sales and had purchases from Wright Asphalt of $1.3 million and $9.1 million. As of December 31, 2018, there was no payable balance to Wright Asphalt. As of December 31, 2017, we carried a $0.5 million payable balance to Wright Asphalt, which is reflected in accounts payable to related party on our consolidated balance sheets. Alon owns 50% of Wright Asphalt, and TTRD, Ltd., a third-party, owns the other 50%.
Transactions with Paramount Nevada Asphalt Company, LLC ("PNAC")
For the period from the Delek/Alon Merger date of July 1, 2017 through May 21, 2018 we hadOur related party transactions consist primarily of transactions with PNAC. Alon owned 50% of PNAC, and Granite Construction Inc., a third-party, owned the other 50%our equity method investees (See Note 7). On May 21, 2018, Delek sold its 50% interest in the PNAC - see note Note 8 for further information. For the years ended December 31, 2018 and 2017, respectively, our other segment had related party revenues of $1.6 million and $9.6 million from PNAC related to asphalt sales and had purchases from PNAC of $3.6 million and $6.0 million. As of December 31, 2017 we carried a $2.1 million receivable balance from PNAC, which is reflected in accounts receivable from related party on our consolidated balance sheets.
Transactions with North Little Rock Energy Logistics, LLC ("NLR")our related parties were as follows for the periods presented:
For the year ended December 31, 2018, our refining segment paid pipeline throughput fees of $0.7 million to NLR. As of December 31, 2018 we carried a $0.3 million payable balance to NLR, which is reflected in accounts payable to related party on our consolidated balance sheets. There was no activity related to NLR in 2017. Delek Logistics own 50% of NLR, and Green Plains Partners, LP, a third-party, owns the other 50%.Transactions with Alon |
| | | | | | | | | | | |
| | Year Ended December 31, |
| (in millions) | 2019 | | 2018 | | 2017 |
Revenues (1) | $ | 86.0 |
| | $ | 33.7 |
| | $ | 50.5 |
|
Cost of materials and other (2) | $ | 44.9 |
| | $ | 21.4 |
| | $ | 26.3 |
|
| |
(1) | Consists primarily of asphalt sales which are recorded in corporate, other and eliminations segment. |
| |
(2) | Consists primarily of pipeline throughput fees paid by the refining segment and asphalt purchases. |
For the period from January 1, 2017 through June 30, 2017 and the year ended December 31, 2016, respectively, our refining and logistics segments sold, $44.7 million and $7.5 million of refined products to and purchased $14.3 million and $2.9 million of refined products from Alon. Effective July 1, 2017, Alon became a wholly-owned subsidiary of New Delek in connection with the Delek/Alon Merger.
17. Property, Plant and Equipment
Property, plant and equipment, at cost, consist of the following (in millions):
| | | | | December 31, | | December 31, |
| | | 2018 | | 2017 | | 2019 | | 2018 |
| Land | | $ | 66.2 |
| | $ | 54.0 |
| | $ | 59.5 |
| | $ | 66.2 |
|
| Building and building improvements | | 108.7 |
| | 67.9 |
| | 108.5 |
| | 108.7 |
|
| Refinery machinery and equipment | | 1,801.8 |
| | 1,823.4 |
| | 2,019.4 |
| | 1,801.8 |
|
| Pipelines and terminals | | 412.2 |
| | 314.3 |
| | 427.3 |
| | 412.2 |
|
| Retail store equipment and site improvements | | 37.8 |
| | 75.5 |
| | 56.3 |
| | 37.8 |
|
| Refinery turnaround costs | | 166.9 |
| | 124.8 |
| | 179.9 |
| | 166.9 |
|
| Other equipment | | 124.9 |
| | 108.2 |
| | 142.7 |
| | 124.9 |
|
| Construction in progress | | 281.1 |
| | 204.4 |
| | 369.2 |
| | 281.1 |
|
| | | $ | 2,999.6 |
| | 2,772.5 |
| | $ | 3,362.8 |
| | $ | 2,999.6 |
|
| Less: accumulated depreciation | | (804.7 | ) | | (631.7 | ) | | (934.5 | ) | | (804.7 | ) |
| | | $ | 2,194.9 |
| | $ | 2,140.8 |
| | $ | 2,428.3 |
| | $ | 2,194.9 |
|
Property, plant and equipment, accumulated depreciation and depreciation expense by reporting segment are as follows (in millions):
| | | | | As of and For the Year Ended December 31, 2018 | | As of and For the Year Ended December 31, 2019 |
| | | Refining | | Logistics | | Retail | | Corporate,
Other and Eliminations | | Consolidated | | Refining | | Logistics | | Retail | | Corporate,
Other and Eliminations | | Consolidated |
| Property, plant and equipment | | $ | 2,230.6 |
| | $ | 452.7 |
| | $ | 146.5 |
| | $ | 169.8 |
| | $ | 2,999.6 |
| | $ | 2,444.4 |
| | $ | 461.3 |
| | $ | 156.4 |
| | $ | 300.7 |
| | $ | 3,362.8 |
|
| Less: Accumulated depreciation | | (584.2 | ) | | (140.2 | ) | | (29.3 | ) | | (51.0 | ) | | (804.7 | ) | | (658.6 | ) | | (166.3 | ) | | (36.6 | ) | | (73.0 | ) | | (934.5 | ) |
| Property, plant and equipment, net | | $ | 1,646.4 |
| | $ | 312.5 |
| | $ | 117.2 |
| | $ | 118.8 |
| | $ | 2,194.9 |
| | $ | 1,785.8 |
| | $ | 295.0 |
| | $ | 119.8 |
| | $ | 227.7 |
| | $ | 2,428.3 |
|
| Depreciation expense | | $ | 124.2 |
| | $ | 25.9 |
| | $ | 23.8 |
| | $ | 15.1 |
| | $ | 189.0 |
| | $ | 128.7 |
| | $ | 26.7 |
| | $ | 10.4 |
| | $ | 22.1 |
| | $ | 187.9 |
|
| | | | | As of and For the Year Ended December 31, 2017 | | As of and For the Year Ended December 31, 2018 |
| | | Refining | | Logistics | | Retail | | Corporate,
Other and Eliminations | | Consolidated | | Refining | | Logistics | | Retail | | Corporate,
Other and Eliminations | | Consolidated |
| Property, plant and equipment | | $ | 2,112.2 |
| | $ | 367.2 |
| | $ | 141.9 |
| | $ | 151.2 |
| | $ | 2,772.5 |
| | $ | 2,230.6 |
| | $ | 452.7 |
| | $ | 146.5 |
| | $ | 169.8 |
| | $ | 2,999.6 |
|
| Less: Accumulated depreciation | | (474.8 | ) | | (112.1 | ) | | (6.7 | ) | | (38.1 | ) | | (631.7 | ) | | (584.2 | ) | | (140.2 | ) | | (29.3 | ) | | (51.0 | ) | | (804.7 | ) |
| Property, plant and equipment, net | | $ | 1,637.4 |
| | $ | 255.1 |
| | $ | 135.2 |
| | $ | 113.1 |
| | $ | 2,140.8 |
| | $ | 1,646.4 |
| | $ | 312.5 |
| | $ | 117.2 |
| | $ | 118.8 |
| | $ | 2,194.9 |
|
| Depreciation expense | | $ | 106.8 |
| | $ | 20.9 |
| | $ | 6.6 |
| | $ | 15.2 |
| | $ | 149.5 |
| | $ | 124.2 |
| | $ | 25.9 |
| | $ | 23.8 |
| | $ | 15.1 |
| | $ | 189.0 |
|
18. Goodwill
Goodwill represents the excess of the aggregate purchase price over the fair value of the identifiable net assets acquired and is not amortized.
Delek performs an annual assessment of whether goodwill retains its value. This assessment is done more frequently if indicators of potential impairment exist. We performed our annual goodwill impairment review in the fourth quarter of 2019, 2018 2017 and 2016.2017. This review was performed at the reporting unit level, which is at or one level below our reportable segment. We performed a discounted cash flows test to estimate the value of each of our reporting units using a market participant weighted average cost of capital, estimated growth rates for revenue, forecasted crack spreads, gross profit andmargin, capital expenditures, and long-term growth rate based on history and our best estimate of future forecasts. We also estimatedcorroborate the fair values of the reporting units using a multiple of expected future cash flows, such as those used by third-party analysts. With respect to the goodwill associated with the reporting units within the logisticlogistics segment, we performed a qualitative assessment in 2019 and 2018. For the years ended December 31, 2019, 2018 2017 and 2016,2017, the annual impairment review resulted in the determination that no0 impairment of goodwill had occurred, and we had no0 accumulated goodwill impairment losses as of December 31, 2018.2019.
A summary of our goodwill by segment is as follows (in millions):
| | | | | Refining | Logistics | Retail | Corporate, Other and Eliminations | Total | | Refining | Logistics | Retail | Corporate, Other and Eliminations | Total |
| Balance, | December 31, 2015 | | $ | — |
| $ | 12.2 |
| $ | — |
| $ | — |
| $ | 12.2 |
| December 31, 2016 | | $ | — |
| $ | 12.2 |
| $ | — |
| $ | — |
| $ | 12.2 |
|
| Acquisitions | Acquisitions | | — |
| — |
| — |
| — |
| — |
| Acquisitions | | 750.9 |
| — |
| 30.8 |
| 22.7 |
| 804.4 |
|
| Balance, | December 31, 2016 | | — |
| 12.2 |
| — |
| — |
| 12.2 |
| December 31, 2017 | | 750.9 |
| 12.2 |
| 30.8 |
| 22.7 |
| 816.6 |
|
| Acquisitions | | 750.9 |
| — |
| 30.8 |
| 22.7 |
| 804.4 |
| |
| Balance, | December 31, 2017 | | 750.9 |
| 12.2 |
| 30.8 |
| 22.7 |
| 816.6 |
| |
| Finalization of purchase price allocation for 2017 Delek/Alon Merger | Finalization of purchase price allocation for 2017 Delek/Alon Merger | | 50.4 |
| — |
| 13.5 |
| 2.4 |
| 66.3 |
| Finalization of purchase price allocation for 2017 Delek/Alon Merger | | 50.4 |
| — |
| 13.5 |
| 2.4 |
| 66.3 |
|
Write-down resulting from asset held for sale impairment (1) | Write-down resulting from asset held for sale impairment (1) | | — |
| — |
| — |
| (25.1 | ) | (25.1 | ) | Write-down resulting from asset held for sale impairment (1) | | — |
| — |
| — |
| (25.1 | ) | (25.1 | ) |
| Balance, | December 31, 2018 | | $ | 801.3 |
| $ | 12.2 |
| $ | 44.3 |
| $ | — |
| $ | 857.8 |
| December 31, 2018 | | 801.3 |
| 12.2 |
| 44.3 |
| — |
| 857.8 |
|
| Write-off of goodwill associated with retail stores sold | | Write-off of goodwill associated with retail stores sold | | — |
| — |
| (2.1 | ) | — |
| (2.1 | ) |
| Balance, | | December 31, 2019 | | $ | 801.3 |
| $ | 12.2 |
| $ | 42.2 |
| $ | — |
| $ | 855.7 |
|
| |
(1) | This impairmentwrite-down of goodwill resulted from the write-downimpairment of assets held for sale associated with the asphalt business to net realizable value, as discussed in Note 8. |
Goodwill associated with the Delek/Alon Merger has been updated to reflect the final purchase price allocation in the table above for acquisitions during the year ended December 31, 2017. There was no goodwill allocated to the California Discontinued Entities as of December 31, 2018.2019.
19. Other Intangible Assets
A summary of our identifiable intangible assets are as follows (in millions):
| | | As of December 31, 2018 | | Useful Life | | Gross | | Accumulated Amortization | | Net | |
| As of December 31, 2019 | | As of December 31, 2019 | | Useful Life | | Gross | | Accumulated Amortization | | Net |
| Intangible Assets subject to amortization: | Intangible Assets subject to amortization: | | | | | | | | | Intangible Assets subject to amortization: | | | | | | | | |
| Supply contract | | 11.5 years | | $ | 12.2 |
| | $ | (12.2 | ) | | $ | — |
| |
| Third-party fuel supply agreement | Third-party fuel supply agreement | | 10 years | | 49.0 |
| | (7.4 | ) | | 41.6 |
| Third-party fuel supply agreement | | 10 years | | $ | 49.0 |
| | $ | (12.3 | ) | | $ | 36.7 |
|
| Capacity contract | | 8 years | | 9.3 |
| | (9.3 | ) | | — |
| |
| Fuel trade name | Fuel trade name | | 5 years | | 4.0 |
| | (1.2 | ) | | 2.8 |
| Fuel trade name | | 5 years | | 4.0 |
| | (2.0 | ) | | 2.0 |
|
| Below market leases | | 13 - 15 years | | 8.3 |
| | (0.3 | ) | | 8.0 |
| |
| Intangible assets not subject to amortization: | Intangible assets not subject to amortization: | | | | | | | | | Intangible assets not subject to amortization: | | | | | | | | |
| Rights-of-way | Rights-of-way | | Indefinite | | 30.0 |
| | | | 30.0 |
| Rights-of-way | | Indefinite | | 48.9 |
| | | | 48.9 |
|
| Line space history | Line space history | | Indefinite | | 11.3 |
| | | | 11.3 |
| Line space history | | Indefinite | | 12.0 |
| | | | 12.0 |
|
| Liquor licenses | Liquor licenses | | Indefinite | | 8.5 |
| | | | 8.5 |
| Liquor licenses | | Indefinite | | 8.5 |
| | | | 8.5 |
|
| Refinery permits | Refinery permits | | Indefinite | | 2.2 |
| | | | 2.2 |
| Refinery permits | | Indefinite | | 2.2 |
| | | | 2.2 |
|
| Total | Total | | | | $ | 134.8 |
| | $ | (30.4 | ) | | $ | 104.4 |
| Total | | | | $ | 124.6 |
| | $ | (14.3 | ) | | $ | 110.3 |
|
| | | As of December 31, 2017 | | Useful Life | | Gross | | Accumulated Amortization | | Net | |
| As of December 31, 2018 | | As of December 31, 2018 | | Useful Life | | Gross | | Accumulated Amortization | | Net |
| Intangible Assets subject to amortization: | Intangible Assets subject to amortization: | | | | | | | Intangible Assets subject to amortization: | | | | | | |
| Supply contract | | 11.5 years | | $ | 12.2 |
| | $ | (12.2 | ) | | $ | — |
| |
| Third-party fuel supply agreement | Third-party fuel supply agreement | | 10 years | | 49.0 |
| | (2.4 | ) | | 46.6 |
| Third-party fuel supply agreement | | 10 years | | 49.0 |
| | (7.4 | ) | | 41.6 |
|
| Capacity contract | | 8 years | | 9.3 |
| | (9.2 | ) | | 0.1 |
| |
| Fuel trade name | Fuel trade name | | 5 years | | 4.0 |
| | (0.4 | ) | | 3.6 |
| Fuel trade name | | 5 years | | 4.0 |
| | (1.2 | ) | | 2.8 |
|
| Below market leases | Below market leases | | 13 - 15 years | | 0.6 |
| | (0.1 | ) | | 0.5 |
| Below market leases | | 13 - 15 years | | 8.3 |
| | (0.3 | ) | | 8.0 |
|
| Intangible assets not subject to amortization: | Intangible assets not subject to amortization: | | | | | | | Intangible assets not subject to amortization: | | | | | | |
| Rights-of-way | Rights-of-way | | Indefinite | | 30.1 |
| | | | 30.1 |
| Rights-of-way | | Indefinite | | 30.0 |
| | | | 30.0 |
|
| Line space history | Line space history | | Indefinite | | 9.6 |
| | | | 9.6 |
| Line space history | | Indefinite | | 11.3 |
| | | | 11.3 |
|
| Liquor licenses | Liquor licenses | | Indefinite | | 8.5 |
| | | | 8.5 |
| Liquor licenses | | Indefinite | | 8.5 |
| | | | 8.5 |
|
| Refinery permits | Refinery permits | | Indefinite | | 2.1 |
| | | | 2.1 |
| Refinery permits | | Indefinite | | 2.2 |
| | | | 2.2 |
|
| Total | Total | | $ | 125.4 |
| | $ | (24.3 | ) | | $ | 101.1 |
| Total | | $ | 113.3 |
| | $ | (8.9 | ) | | $ | 104.4 |
|
Amortization of intangible assets was $5.7 million, $6.1 million, $3.8 million, and $1.3$3.8 million during the years ended December 31, 2019, 2018 2017 and 2016,2017, respectively, and is included in depreciation and amortization on the accompanying consolidated statements of income, with the exception of an immaterial amount related to below market leases.
Amortization expense for the next five years is estimated to be as follows:follows (in millions):
| | | 2019 | | $ | 5.9 |
| |
| 2020 | | 5.9 |
| | $ | 5.7 |
|
| 2021 | | 5.9 |
| | $ | 5.7 |
|
| 2022 | | 5.5 |
| | $ | 5.3 |
|
| 2023 | | 5.1 |
| | $ | 4.9 |
|
| 2024 | | | $ | 4.9 |
|
20. Other Assets and Liabilities
The detail of other current assets is as follows (in millions):
| | | Other Current Assets | December 31,
2018 | | December 31,
2017 | December 31, 2019 | | December 31, 2018 |
| Biodiesel tax credit (see Note 4) | | $ | 97.5 |
| | $ | — |
|
| Income and other tax receivables | | 61.9 |
| | 24.3 |
|
| Short-term derivative assets (see Note 12) | | 30.2 |
| | 61.9 |
|
| Prepaid expenses | $ | 15.8 |
| | $ | 17.6 |
| 21.9 |
| | 15.8 |
|
| Short-term derivative assets (see Note 12) | 61.9 |
| | 15.9 |
| |
| Income and other tax receivables | 24.3 |
| | 74.9 |
| |
| RINs Obligation surplus (see Note 13) | — |
| | 1.1 |
| |
| Commodity investments | 15.6 |
| | — |
| |
| Environmental Credits Obligation surplus (see Note 13) | | 16.8 |
| | 10.3 |
|
| RINs assets | | 14.5 |
| | 13.0 |
|
| Investment commodities | | 12.1 |
| | 15.6 |
|
| Note receivable - current portion (see Note 8) | | 6.2 |
| | — |
|
| Other | 18.1 |
| | 20.4 |
| 7.6 |
| | 7.8 |
|
| Total | $ | 135.7 |
| | $ | 129.9 |
| $ | 268.7 |
| | $ | 148.7 |
|
The detail of other non-current assets is as follows (in millions):
| | | Other Non-Current Assets | December 31,
2018 | | December 31,
2017 | December 31, 2019 | | December 31, 2018 |
| Prepaid tax asset | $ | — |
| | $ | 56.2 |
| |
| Supply and Offtake receivable | | $ | 32.7 |
| | $ | 32.7 |
|
| Other equity Investments | | 8.9 |
| | — |
|
| Deferred financing costs | 10.6 |
| | 5.9 |
| 8.5 |
| | 10.6 |
|
| Long-term income tax receivables | — |
| | 2.1 |
| |
| Supply and Offtake receivable | 32.7 |
| | 46.3 |
| |
| Note receivable - non-current portion (see Note 8) | | 6.2 |
| | — |
|
| Long-term derivative assets (see Note 12) | 1.0 |
| | — |
| 0.1 |
| | 1.0 |
|
| Other | 8.6 |
| | 16.3 |
| 11.4 |
| | 8.6 |
|
| Total | $ | 52.9 |
| | $ | 126.8 |
| $ | 67.8 |
| | $ | 52.9 |
|
The detail of accrued expenses and other current liabilities is as follows (in millions):
| | | Accrued Expenses and Other Current Liabilities | December 31,
2018 | | December 31,
2017 | December 31, 2019 | | December 31, 2018 |
| Income and other taxes payable | $ | 126.0 |
| | $ | 154.1 |
| $ | 119.6 |
| | $ | 126.0 |
|
| Crude purchase liabilities | | 72.1 |
| | 42.3 |
|
| Employee costs | | 47.6 |
| | 46.5 |
|
| Product financing agreements | | 21.1 |
| | — |
|
| Environmental Credits Obligation deficit (see Note 13) | | 18.5 |
| | 11.8 |
|
| Short-term derivative liabilities (see Note 12) | 16.2 |
| | 54.4 |
| 14.1 |
| | 16.2 |
|
| Interest payable | 10.2 |
| | 13.0 |
| 8.8 |
| | 10.2 |
|
| Employee costs | 46.5 |
| | 46.6 |
| |
| Environmental liabilities (see Note 14) | 3.8 |
| | 7.2 |
| 8.2 |
| | 3.8 |
|
| Product financing agreements | — |
| | 72.3 |
| |
| RINs Obligation deficit (see Note 13) | 11.8 |
| | 130.8 |
| |
| Tank inspection liabilities | | 5.6 |
| | 7.0 |
|
| Accrued utilities | 10.6 |
| | 9.4 |
| 4.4 |
| | 10.6 |
|
| Tank inspection liabilities | 7.0 |
| | 10.7 |
| |
| Crude liabilities | 42.3 |
| | 34.5 |
| |
| Other | 33.3 |
| | 31.9 |
| 26.8 |
| | 33.3 |
|
| Total | $ | 307.7 |
| | $ | 564.9 |
| $ | 346.8 |
| | $ | 307.7 |
|
The detail of other non-current liabilities is as follows (in millions):
| | | Other Non-Current Liabilities | December 31,
2018 | | December 31,
2017 | December 31, 2019 | | December 31, 2018 |
Pension and other postemployment benefit liabilities, net
(see Note 22) | $ | 17.6 |
| | 37.0 |
| |
| Tank inspection liabilities | | $ | 9.9 |
| | $ | 9.9 |
|
| Liability for unrecognized tax benefits | | 12.1 |
| | 19.2 |
|
| Pension and other postemployment benefit liabilities, net | | 5.3 |
| | 17.6 |
|
| Long-term derivative liabilities (see Note 12) | 1.0 |
| | 0.9 |
| 1.4 |
| | 1.0 |
|
| Liability for unrecognized tax benefits | 19.2 |
| | 6.1 |
| |
| Above-market leases | 9.2 |
| | 11.2 |
| — |
| | 9.2 |
|
| Tank inspection liabilities | 9.9 |
| | 11.7 |
| |
| Other | 6.0 |
| | 16.1 |
| 2.2 |
| | 6.0 |
|
| Total | $ | 62.9 |
| | $ | 83.0 |
| $ | 30.9 |
| | $ | 62.9 |
|
21. Equity-Based Compensation
Delek US Holdings, Inc. 2006 Long-Term Incentive Plan
The Delek US Holdings, Inc. 2006 Long-Term Incentive Plan, as amended (the "2006 Plan"), allowed Delek to grant stock options, SARs,stock appreciation rights ("SARs"), restricted stock, RSUs,restricted common stock units ("RSUs"), performance awards ("PRSUs"), and other stock-based awards of up to 5,053,392 shares of Delek's common stock to certain directors, officers, employees, consultants and other individuals who performed services for Delek or its affiliates. Stock options and SARs granted under the 2006 Plan were generally granted at market price or higher. The vesting of all outstanding awards was subject to continued service to Delek or its affiliates except that vesting of awards granted to certain executive employees could, under certain circumstances, accelerate upon termination of their employment and the vesting of all outstanding awards could accelerate upon the occurrence of an Exchange Transaction (as defined in the 2006 Plan). In the second quarter of 2010, Delek's Board of Directors and its Incentive Plan Committee began using stock-settled SARs, rather than stock options, as the primary form of appreciation award under the 2006 Plan. The 2006 Plan expired in April 2016.
Delek US Holdings, Inc. 2016 Long-Term Incentive Plan
On May 5, 2016, our stockholders approved our 2016 Long-Term Incentive Plan (the “2016 Plan”). The 2016 Plan succeeds to succeed our 2006 Plan, which expired in April 2016.Plan. The 2016 Plan allows Delek to grant stock options, SARs, restricted stock, RSUs, performance awards and other stock-based awards of up to 4,400,000 shares of Delek's common stock to certain directors, officers, employees, consultants and other individuals who perform services for Delek or its affiliates. On May 18, 2018, the Company's stockholders approved an amendment to the 2016 plan that increased the number of Common Stock available under this plan by 4,500,000 shares to 8,900,000 shares. Stock options and SARs issued under the 2016 Plan are granted at prices equal to (or greater than) the fair market value of Delek's common stock on the grant date and are generally subject to a vesting period of one year or more. No awards will be made under the 2016 Plan after May 5, 2026.
Alon USA Energy, Inc. 2005 Long-Term Incentive Plan
In connection with the Delek/Alon Merger, Delek assumed the Alon USA Energy, Inc. Second Amended and Restated 2005 Incentive Compensation Plan (“the Alon 2005 Plan” and, collectively with the 2006 Plan and the 2016 Plan, the "Incentive Plans") as a component of its overall executive incentive compensation program. The Alon 2005 Plan permits the granting of awards to Alon's officers and key employees in the form of options to purchase common stock, stock appreciation rights,SARs, restricted shares of common stock, restricted common stock units,RSUs, performance shares, performance units and senior executive plan bonuses. Effective with the Delek/Alon Merger, all contractually unvested share-based awards were converted into share-based awards denominated in New Delek Common Stock. Committed but unissued share-based awards were exchanged and converted into rights to receive share-based awards indexed to New Delek Common Stock.
Option and SAR Assumptions
The table below provides the assumptions used in estimating the fair values of our outstanding stock options and SARs under the Incentive Plans. For all awards granted, we calculated volatility using historical volatility and implied volatility of a peer group of public companies using weekly stock prices.
| | | | | 2018 Grants | | 2017 Grants | | 2016 Grants | | 2019 Grants | | 2018 Grants | | 2017 Grants |
| | | (Graded Vesting) | | (Graded Vesting) | | (Graded Vesting) | | (Graded Vesting) | | (Graded Vesting) | | (Graded Vesting) |
| | | 4 years | | 4 years | | 4 years | | 4 years | | 4 years | | 4 years |
| Expected volatility | | 47.52%-49.42% | | 47.49%-49.18% | | 51.31%-54.12% | | 48.16%-48.94% | | 47.52%-49.42% | | 47.49%-49.18% |
| Dividend yield | | 2.00%-2.33% | | 2.41%-3.72% | | 1.84%-3.72% | | 2.03%-2.60% | | 2.00%-2.33% | | 2.41%-3.72% |
| Expected term | | 4.38-4.62 years | | 4.37-4.82 years | | 4.75-4.87 years | | 4.57- 4.62 years | | 4.38-4.62 years | | 4.37-4.82 years |
| Risk free rate | | 1.56%-2.92% | | 0.60%-2.58% | | 0.18%-2.47% | | 1.57%-2.41% | | 1.56%-2.92% | | 0.60%-2.58% |
| Fair value per share | | $ | 15.00 |
| | $ | 8.08 |
| | $ | 5.67 |
| | $ | 11.46 |
| | $ | 15.00 |
| | $ | 8.08 |
|
Stock Option and SAR Activity
The following table summarizes the stock option and SAR activity under the Incentive Plans for the years ended December 31, 2019, 2018 2017 and 2016:2017:
| | | | | Number of Options | | Weighted-Average Strike Price | | Weighted-Average Contractual Term (in years) | | Average Intrinsic Value
(in millions) | | Number of Options | | Weighted-Average Strike Price | | Weighted-Average Contractual Term (in years) | | Average Intrinsic Value
(in millions) |
| Options outstanding, December 31, 2015 | 3,032,143 |
| | $ | 28.60 |
| | | |
| Granted | | 347,800 |
| | $ | 16.26 |
| | | |
| Exercised | | (68,510 | ) | | $ | 14.69 |
| | | |
| Forfeited | | (743,050 | ) | | $ | 31.17 |
| | | |
| Options and SARs outstanding, December 31, 2016 | Options and SARs outstanding, December 31, 2016 | 2,568,383 |
| | $ | 26.56 |
| | | Options and SARs outstanding, December 31, 2016 | 2,568,383 |
| | $ | 26.56 |
| | |
| Granted | | 2,460,500 |
| | $ | 25.95 |
| | | | 2,460,500 |
| | $ | 25.95 |
| | |
| Exercised | | (303,049 | ) | | $ | 17.04 |
| | | | (303,049 | ) | | $ | 17.04 |
| | |
| Forfeited | | (534,827 | ) | | $ | 28.00 |
| | | | (534,827 | ) | | $ | 28.00 |
| | |
| Options and SARs outstanding, December 31, 2017 | Options and SARs outstanding, December 31, 2017 | 4,191,007 |
| | $ | 26.71 |
| | | Options and SARs outstanding, December 31, 2017 | 4,191,007 |
| | $ | 26.71 |
| | |
| Granted | | 1,497,400 |
| | $ | 43.49 |
| | | | 1,497,400 |
| | $ | 43.49 |
| | |
| Exercised | | (1,286,527 | ) | | $ | 30.55 |
| | | | (1,286,527 | ) | | $ | 30.55 |
| | |
| Forfeited | | (827,775 | ) | | $ | 29.01 |
| | | | (827,775 | ) | | $ | 29.01 |
| | |
| Options and SARs outstanding, December 31, 2018 | Options and SARs outstanding, December 31, 2018 | 3,574,105 |
| | $ | 32.67 |
| | 8.4 | | $ | 42.7 |
| Options and SARs outstanding, December 31, 2018 | 3,574,105 |
| | $ | 32.67 |
| | |
| Vested options and SARs exercisable, December 31, 2018 | 768,955 |
| | $ | 26.40 |
| | 6.7 | | $ | 4.7 |
| |
| Granted | | | 593,500 |
| | $ | 34.96 |
| | |
| Exercised | | | (466,569 | ) | | $ | 29.61 |
| | |
| Forfeited | | | (494,826 | ) | | $ | 33.47 |
| | |
| Options and SARs outstanding, December 31, 2019 | | Options and SARs outstanding, December 31, 2019 | 3,206,210 |
| | $ | 34.21 |
| | 7.9 | | $ | 15.1 |
|
| Vested options and SARs exercisable, December 31, 2019 | | Vested options and SARs exercisable, December 31, 2019 | 1,094,860 |
| | $ | 32.06 |
| | 7.0 | | $ | 1.6 |
|
Restricted Stock Units
The Incentive Plans provide for the award of RSUs and PRSUs to certain employees and non-employee directors. RSUs granted to employees vest ratably over three to five years from the date of grant, and RSUs granted to non-employee directors vest quarterly over the year following the date of grant. The grant date fair value of RSUs is determined based on the closing price of Delek's common stock on the grant date. PRSUs initially granted to employees will typically vest in two tranches, the first of which vests on December 31 of the year following the grant date and the second on the subsequent December 31. PRSUs subsequently granted to employees will typically vest at the end of a three calendar year performance period. The number of PRSUs that will ultimately vest is based on the Company's total shareholder return over the performance period. The grant date fair value of PRSUs is determined using a Monte-Carlo simulation model. We record compensation expense for these awards based on the grant date fair value of the award, recognized ratably over the measurement period.
Performance-Based Restricted Stock Unit Assumptions
The table below provides the assumptions used in estimating the fair values of our outstanding PRSUs under the Plan. For all awards granted, we calculated volatility using historical volatility and implied volatility of a peer group of public companies using weekly stock prices.
| | | | 2018 Grants | | 2017 Grants | | 2016 Grants | 2019 Grants | | 2018 Grants | | 2017 Grants |
| Expected volatility | 36.11%-44.66% |
| | 44.03%-46.54% |
| | 41.77 | % | 39.67%-39.98% |
| | 36.11%-44.66% |
| | 44.03%-46.54% |
|
| Expected term | 2.06-2.81 |
| | 2.06-3.06 |
| | 2.81 |
| 2.06-2.81 |
| | 2.06-2.81 |
| | 2.06-3.06 |
|
| Risk free rate | 2.40%-2.73% |
| | 1.43%-1.93% |
| | 1.08 | % | 1.64%-2.42% |
| | 2.40%-2.73% |
| | 1.43%-1.93% |
|
| Fair value per share | $ | 57.93 |
| | $ | 37.80 |
| | $ | 14.31 |
| $ | 41.19 |
| | $ | 57.93 |
| | $ | 37.80 |
|
The following table summarizes the RSU and PRSU activity under the Incentive Plans for the years ended December 31, 2019, 2018 2017 and 2016:2017:
| | | | | Number of RSUs | | Weighted-Average Grant Date Price | | Number of RSUs | | Weighted-Average Grant Date Price |
| Balance | December 31, 2015 | 384,567 |
| | $ | 33.6 |
| |
| Granted | | 858,296 |
| | $ | 12.94 |
| |
| Vested | | (246,657 | ) | | $ | 21.17 |
| |
| Forfeited | | (114,393 | ) | | $ | 17.23 |
| |
| Balance | December 31, 2016 | 881,813 |
| | $ | 19.08 |
| December 31, 2016 | 881,813 |
| | $ | 19.08 |
|
| Granted | | 614,035 |
| | $ | 31.56 |
| | 614,035 |
| | $ | 31.56 |
|
| Vested | | (351,713 | ) | | $ | 21.95 |
| | (351,713 | ) | | $ | 21.95 |
|
| Forfeited | | (78,676 | ) | | $ | 13.44 |
| | (78,676 | ) | | $ | 13.44 |
|
| Performance Not Achieved | | (5,789 | ) | | $ | 38.03 |
| | (5,789 | ) | | $ | 38.03 |
|
| Balance | December 31, 2017 | 1,059,670 |
| | $ | 25.68 |
| December 31, 2017 | 1,059,670 |
| | $ | 25.68 |
|
| Granted | | 440,896 |
| | $ | 53.10 |
| | 440,896 |
| | $ | 53.10 |
|
| Vested | | (341,774 | ) | | $ | 25.62 |
| | (341,774 | ) | | $ | 25.62 |
|
| Forfeited | | (154,780 | ) | | $ | 36.96 |
| | (154,780 | ) | | $ | 36.96 |
|
| Balance | December 31, 2018 | 1,004,012 |
| | $ | 36.00 |
| December 31, 2018 | 1,004,012 |
| | $ | 36.00 |
|
| Granted | | | 701,875 |
| | $ | 36.30 |
|
| Vested | | | (604,971 | ) | | $ | 24.88 |
|
| Forfeited | | | (133,243 | ) | | $ | 39.19 |
|
| Performance Achieved | | | 145,169 |
| | $ | 16.55 |
|
| Balance | | December 31, 2019 | 1,112,842 |
| | $ | 39.31 |
|
Compensation Expense Related to Equity-based Awards Granted Under the Incentive Plans
Compensation expense for Delek equity-based awards amounted to $25.2 million, $20.9 million ($16.5 million, net of taxes),and $15.9 million ($10.3 million, net of taxes) and $14.6 million ($9.5 million, net of taxes) for the years ended December 31, 2019, 2018 2017 and 2016,2017, respectively. These amounts excluding amounts related to discontinued operations of $1.1 million for December 31, 2016, are included in general and administrative expenses in the accompanying consolidated statements of income. We recognized income tax benefits for equity-based awards of $2.5 million, $2.2 million and $1.4 million for the years ended December 31, 2019, 2018 and 2017, respectively, versus income tax expense for equity-based awards of $2.9 million for the year ended December 31, 2016.respectively.
As of December 31, 2018,2019, there was $48.4$45.4 million of total unrecognized compensation cost related to non-vested share-based compensation arrangements, which is expected to be recognized over a weighted-average period of 2.42.1 years.
The aggregate intrinsic value, which represents the difference between the underlying stock's market price and the award's exercise price, of the share-based awards exercised or vested during the years ended December 31, 2019, 2018 and 2017 and 2016 was $27.0 million, $39.4 million $12.2 million and $4.8$12.2 million, respectively. During the years December 31, 2019, 2018 2017 and 2016,2017, respectively, we issued 580,455, 332,156 and 203,631net shares of common stock of 508,950, 580,455
and 332,156 as a result of exercised or vested equity-based awards. These amounts are net of 564,090, 1,027,398 306,659 and 111,536306,659 shares, respectively, withheld to satisfy employee tax obligations related to the exercises and vestings for the years ended December 31, 2019, 2018 2017 and 2016.2017. Delek paid approximately $9.2 million, $11.5 million $5.0 million and $1.5$5 million of taxes in connection with the settlement of these awards both for the years ended December 31, 2019, 2018 2017 and 2016.2017. We issue new shares of common stock upon exercise or vesting of share-based awards.
Delek Logistics GP, LLC 2012 Long-Term Incentive Plan
Delek Logistics GP maintains a unit-based compensation plan for officers, directors and employees of Logistics GP or its affiliates and certain consultants, affiliates of Logistics GP or other individuals who perform services for Delek Logistics. The Delek Logistics GP, LLC 2012 Long-Term Incentive Plan ("Logistics LTIP") permits the grant of unit options, restricted units, phantom units, unit appreciation rights, distribution equivalent rights, other unit-based awards, and unit awards. The Logistics LTIP limits the number of units that may be delivered pursuant to vested awards to 612,207 common units, subject to proportionate adjustment in the event of unit splits and similar events. Awards granted under the Logistics LTIP will be settled with Delek Logistics units. Compensation expense for awards granted under the Logistics LTIP was $0.6 million, $0.5 million, ($0.4 million, net of taxes), $1.7 million ($1.1 million, net of taxes) and $1.7 million ($1.1 million, net of taxes) for the years ended December 31, 2019, 2018 2017 and 2016,2017, respectively. These amounts are included in general and administrative expenses in the accompanying consolidated statements of income. As of December 31, 2018,2019, there was $0.3$0.2 million of total unrecognized compensation cost related to non-vested Logistics LTIP awards, which is expected to be recognized over a weighted-average period of 0.4 years.
22. Employees
Workforce
As of December 31, 2018,2019, operations, maintenance and warehouse hourly employees along with truck drivers at the Tyler refinery were represented by the United Steel, Paper and Forestry, Rubber, Manufacturing, Energy, Allied Industrial and Service Workers International Union and its Local 202. Of thesethe Tyler labor employees, 63.0%52.6% of operations, maintenance and warehouse hourly employees are currently covered by a collective bargaining agreement that expires January 31, 2022. In addition of these employees, 84.1%2022 while 10.9% of Tyler truck drivers are currently covered by a collective bargaining agreement that expires May 1, 2021. As of December 31, 2018,2019, operations and maintenance hourly employees at the El Dorado refinery were represented by the International Union of Operating Engineers and its Local 381. Of thesethe El Dorado employees, 61.2%37.9% are covered by a collective bargaining agreement which expires on August 1, 2021. As of December 31, 2018,2019, our El Dorado and Texas based truck drivers for Lion Oil Company were represented by the United Steel, Paper and Forestry, Rubber, Manufacturing, Energy, Allied Industrial and Service Workers International Union, AFL - CIO while our El Dorado refinery warehouse hourly employees were represented by the International Union of Operating Engineers and its Local 381; none are currently covered by a collective bargaining agreement. As of December 31, 2018,2019, approximately 70.1%63.7% of employees who work at our Big Spring refinery are covered by a collective bargaining agreement that expires March 31, 2022. None of our employees in our logistics segment, retail segment or in our corporate office are represented by a union. We consider our relations with our employees to be satisfactory.
Postretirement Benefits
Pension Plans
Effective with the Delek/Alon Merger on July 1, 2017 (see Note 3), we had four defined benefit pension plans covering substantially all of Alon's employees, excluding employees of the retail segment. The benefits are based on years of service and the employee’s final average monthly compensation. Our funding policy is to contribute annually no less than the minimum required nor more than the maximum amount that can be deducted for federal income tax purposes. Contributions are intended to provide not only for benefits attributed to service to date but also for those benefits expected to be earned in the future. The plans were frozen for non-union employees effective September 30, 2017.
During the year ended December 31, 2018,, we completely settled the supplemental retirement income plan of the retail segment, and we had a partial settlement of Alon's executive non-qualified restoration plan. In addition, weplan, froze Alon's qualified pension plan for union employees effective July 31, 2018, and entered into an agreement with the International Union of Operating Engineers (the "Union") to extend the Union agreement to March 31, 2022, and to freeze Alon's qualified pension plan for union employees effective July 31, 2018.2022. As part of the extended Union agreement, the Company agreed to compensate each pension-eligible employee in the Union for the loss of the pension benefit over the remaining union contract period in four annual installments where paymentsbeginning July 2018. Payments are contingent upon continued employment at each annual payment date. The payments, the first of which was made in July 2018,date and are expected to total approximately $6.9 million in the aggregate without considering forfeitures (which cannot yet be estimated). The related expense (estimated without considering forfeitures) has been or will be recognized over the remaining union contract period as follows (estimated without considering forfeitures): approximately $0.8 million for the year ended December 31, 2018;period. Estimated remaining expense is approximately $2.0 million during each of the years 2019, 2020 and 2021, and approximately $0.1 million in 2022.
On October 1, 2018, we spun off a portion of the Alon's qualified pension plan into a new plan - The Alon USA Pension Plan for CollectiveCollectively Bargained Employees. This new plan consistconsists of Union employees. The assets were allocated as required under IRC Section 414. The remaining accumulated other comprehensive income at that date was split between the two plans based on their respective portions of Projected Benefit Obligation. The Alon USA Pension Plan for Collectively Bargained Employees was terminated. The plan's obligation was settled and paid out from the plan's asset on December 20, 2019.
Financial information related to our pension plans is presented below:
| | | | | | | Year Ended December 31, |
| | 2018 | | 2017 | 2019 | | 2018 |
| Change in projected benefit obligation: | | | | | | |
| Benefit obligation at beginning of the period (July 1, 2017 business combination) | $ | 146.9 |
| | $ | 145.2 |
| |
| Benefit obligation at beginning of year | | $ | 131.0 |
| | $ | 146.9 |
|
| Service cost | 0.4 |
| | 1.2 |
| — |
| | 0.4 |
|
| Interest cost | 5.2 |
| | 2.7 |
| 5.4 |
| | 5.2 |
|
| Actuarial (gain) loss | (9.9 | ) | | 6.5 |
| |
| Actuarial loss (gain) | | 13.6 |
| | (9.9 | ) |
| Benefits paid | (9.1 | ) | | (2.4 | ) | (5.3 | ) | | (9.1 | ) |
| Other (effect of curtailment/settlement) | (2.5 | ) | | (6.3 | ) | (13.2 | ) | | (2.5 | ) |
| Projected benefit obligations at end of year | $ | 131.0 |
| | $ | 146.9 |
| $ | 131.5 |
| | $ | 131.0 |
|
| Change in plan assets: | | | | | | |
| Fair value of plan assets at beginning of the period (July 1, 2017 business combination) | $ | 108.8 |
| | $ | 96.1 |
| |
| Actual (loss) gain on plan assets | (8.2 | ) | | 9.8 |
| |
| Fair value of plan assets at beginning of year | | $ | 115.7 |
| | $ | 108.8 |
|
| Actual gain (loss) on plan assets | | 29.5 |
| | (8.2 | ) |
| Employer contribution | 24.2 |
| | 5.3 |
| 1.4 |
| | 24.2 |
|
| Benefits paid | (9.1 | ) | | (2.4 | ) | (5.3 | ) | | (9.1 | ) |
| Other (effect of curtailment/settlement) | | (13.2 | ) | | — |
|
| Fair value of plan assets at end of year | $ | 115.7 |
| | $ | 108.8 |
| $ | 128.1 |
| | $ | 115.7 |
|
| Reconciliation of funded status: | | | | | | |
| Fair value of plan assets at end of year | $ | 115.7 |
| | $ | 108.8 |
| $ | 128.1 |
| | $ | 115.7 |
|
| Less projected benefit obligations at end of year | 131.0 |
| | 146.9 |
| 131.5 |
| | 131.0 |
|
| Under-funded status at end of year | $ | (15.3 | ) | | $ | (38.1 | ) | $ | (3.4 | ) | | $ | (15.3 | ) |
The pre-tax amounts related to the defined benefit plans recognized as pension benefit liability in the consolidated balance sheets as of December 31, 20182019 was $15.3$3.4 million.
The pre-tax amounts in accumulated other comprehensive loss that have not yet been recognized as components of net periodic benefit cost were as follows:
| | | | December 31, | December 31, |
| | 2018 | | 2017 | 2019 | | 2018 |
| Net actuarial loss | $ | 5.5 |
| | $ | 0.8 |
| $ | (0.1 | ) | | $ | 5.5 |
|
| Prior service credit | — |
| | — |
| — |
| | — |
|
| Projected benefit obligations at end of year | $ | 5.5 |
| | $ | 0.8 |
| $ | (0.1 | ) | | $ | 5.5 |
|
The accumulated benefit obligation for each of our pension plans was in excess of the fair value of plan assets. The projected benefit obligation, accumulated benefit obligation and fair value of plan assets for the pension plans were as follows:
| | | | December 31, | December 31, |
| | 2018 | | 2017 | 2019 | | 2018 |
| Projected benefit obligation | $ | 131.0 |
| | $ | 146.9 |
| $ | 131.5 |
| | $ | 131.0 |
|
| Accumulated benefit obligation | $ | 131.0 |
| | 143.8 |
| $ | 131.6 |
| | 131.0 |
|
| Fair value of plan assets | $ | 115.7 |
| | 108.8 |
| $ | 128.1 |
| | 115.7 |
|
The weighted-average assumptions used to determine benefit obligations were as follows:
| | | | December 31, | December 31, |
| | 2018 | | 2017 | 2019 | | 2018 |
| Discount rate | 4.15 | % | | 3.60 | % | 3.20 | % | | 4.15 | % |
| Rate of compensation increase | N/A |
| | 3.00 | % | N/A |
| | N/A |
|
The discount rate used reflects the expected future cash flow based on our funding valuation assumptions and participant data as of the beginning of the plan period. The expected future cash flow is discounted by the Principal Pension Discount Yield Curve for the fiscal year end because it has been specifically designed to help pension funds comply with statutory funding guidelines.
The weighted-average assumptions used to determine net periodic benefit costs were as follows:
| | | | Year Ended December 31, | Year Ended December 31, |
| | 2018 | | 2017 | 2019 | | 2018 | | 2017 |
| Discount rate | 3.60 | % | | 3.80 | % | 4.15 | % | | 3.60 | % | | 3.80 | % |
| Expected long-term rate of return on plan assets | 7.33 | % | | 7.45 | % | 7.00 | % | | 7.33 | % | | 7.45 | % |
| Rate of compensation increase | 3.00 | % | | 3.00 | % | — | % | | 3.00 | % | | 3.00 | % |
The expected long-term rate of return is based on the portfolio as a whole and not on the sum of the returns on individual asset categories.
The components of net periodic benefit cost related to our benefit plans consisted of the following:
| | | | | Year Ended December 31, | | Year Ended December 31, |
| Components of net periodic benefit cost: | | 2018 | | 2017 | |
| Components of net periodic benefit: | | | 2019 | | 2018 | | 2017 |
| Service cost | | $ | 0.4 |
| | $ | 1.2 |
| | $ | — |
| | $ | 0.4 |
| | $ | 1.2 |
|
| Interest cost | | 5.2 |
| | 2.7 |
| | 5.4 |
| | 5.2 |
| | 2.7 |
|
| Expected return on plan assets | | (8.0 | ) | | (2.7 | ) | | (7.5 | ) | | (8.0 | ) | | (2.7 | ) |
| Recognition of gain due to settlement | | (0.1 | ) | | — |
| | — |
| | (0.1 | ) | | — |
|
| Recognition of gain due to curtailment | | (2.4 | ) | | (6.1 | ) | | (2.7 | ) | | (2.4 | ) | | (6.1 | ) |
| Net periodic benefit cost | | $ | (4.9 | ) | | $ | (4.9 | ) | |
| Net periodic benefit | | | $ | (4.8 | ) | | $ | (4.9 | ) | | $ | (4.9 | ) |
The service cost component of net periodic benefit costs areis included as part of general and administrative expenses in the accompanying statements of income. The other components of net periodic benefit costs are included as part of other non-operating expense (income), net.
The weighted-average asset allocation of our pension benefits plan assets were as follows:
| | | | Year Ended December 31, | Year Ended December 31, |
| | 2018 | | 2017 | 2019 | | 2018 |
| Asset Category: | | | | | | |
| Equity securities | 66.4 | % | | 78.5 | % | 40.0 | % | | 66.4 | % |
| Debt securities | 26.8 | % | | 13.0 | % | 60.0 | % | | 26.8 | % |
| Real estate investment trust | 6.8 | % | | 8.5 | % | — | % | | 6.8 | % |
| Total | 100.0 | % | | 100.0 | % | 100.0 | % | | 100.0 | % |
The fair value of our pension assets by category were as follows:
| | | | Quoted Prices in Active Markets For Identical Assets or Liabilities (Level 1) | | Significant Other Observable Inputs (Level 2) | | Significant Unobservable Inputs (Level 3) | | Consolidated Total | Quoted Prices in Active Markets For Identical Assets or Liabilities (Level 1) | | Significant Other Observable Inputs (Level 2) | | Significant Unobservable Inputs (Level 3) | | Consolidated Total |
| Year Ended December 31, 2019 | | | | | | | | |
| Equity securities: | | | | | | | | |
| U.S. companies | | $ | — |
| | $ | 38.5 |
| | $ | — |
| | $ | 38.5 |
|
| International companies | | — |
| | 12.8 |
| | — |
| | 12.8 |
|
| Debt securities: | | | | | | | | |
| Preferred securities | | — |
| | — |
| | — |
| | — |
|
| Bond securities | | — |
| | 76.8 |
| | — |
| | 76.8 |
|
| Real estate securities | | — |
| | — |
| | — |
| | — |
|
| Total | | $ | — |
| | $ | 128.1 |
| | $ | — |
| | $ | 128.1 |
|
| Year Ended December 31, 2018 | | | | | | | | | | | | | | |
| Equity securities: | | | | | | | | | | | | | | |
| U.S. companies | $ | — |
| | $ | 62.8 |
| | $ | — |
| | $ | 62.8 |
| $ | — |
| | $ | 62.8 |
| | $ | — |
| | $ | 62.8 |
|
| International companies | — |
| | 14.0 |
| | — |
| | 14.0 |
| — |
| | 14.0 |
| | — |
| | 14.0 |
|
| Debt securities: | | | | | | | | | | | | | | |
| Preferred securities | — |
| | 4.4 |
| | — |
| | 4.4 |
| — |
| | 4.4 |
| | — |
| | 4.4 |
|
| Bond securities | — |
| | 26.6 |
| | — |
| | 26.6 |
| — |
| | 26.6 |
| | — |
| | 26.6 |
|
| Real estate securities | — |
| | 7.9 |
| | — |
| | 7.9 |
| — |
| | 7.9 |
| | — |
| | 7.9 |
|
| Total | $ | — |
| | $ | 115.7 |
| | $ | — |
| | $ | 115.7 |
| $ | — |
| | $ | 115.7 |
| | $ | — |
| | $ | 115.7 |
|
| Year Ended December 31, 2017 | | | | | | | | |
| Equity securities: | | | | | | | | |
| U.S. companies | $ | 67.1 |
| | $ | — |
| | $ | — |
| | $ | 67.1 |
| |
| International companies | 18.3 |
| | — |
| | — |
| | 18.3 |
| |
| Debt securities: | | | | | | | | |
| Preferred securities | 4.6 |
| | — |
| | — |
| | 4.6 |
| |
| Bond securities | — |
| | 9.5 |
| | — |
| | 9.5 |
| |
| Real estate securities | 9.3 |
| | — |
| | — |
| | 9.3 |
| |
| Total | $ | 99.3 |
| | $ | 9.5 |
| | $ | — |
| | $ | 108.8 |
| |
The investment policies and strategies for the assets of our pension benefits is to, over a five-year period, provide returns in excess of the benchmark. The portfolio is expected to earn long-term returns from capital appreciation and a stable stream of current income. This approach recognizes that assets are exposed to price risk and the market value of the plans’ assets may fluctuate from year to year. Risk tolerance is determined based on our specific risk management policies. In line with the investment return objective and risk parameters, the plans’ mix of assets includes a diversified portfolio of equity, fixed-income and real estate investments. Equity investments include domestic and international stocks of various sizes of capitalization. The asset allocation of the plan is reviewed on at least an annual basis.
We contributed $24.2$1.4 million to the pension plans for the year ended December 31, 2018,2019, and expect to contribute $5.8 million to the pension plans in 2019.2020. There were no0 employee contributions to the plans.
The benefits expected to be paid in each year 2019–20232020–2024 are $5.8 million, $6.0$6.1 million, $6.3$6.6 million, $6.7$6.5 million, and $6.7$6.8 million, respectively. The aggregate benefits expected to be paid in the five years from 2024–20282025–2029 are $37.1$34.8 million. The expected benefits are based on the same assumptions used to measure our benefit obligation at December 31, 20182019 and include estimated future employee service.
401(k) Plans
For the years ended December 31, 2019, 2018 2017 and 2016,2017, we sponsored a voluntary 401(k) Employee Retirement Savings Plans for eligible employees. Employees must be at least 21 years of age and have 45 days of service to be eligible to participate in the plan. Employee contributions are matched on a fully-vested basis by us up to a maximum of 8% of eligible compensation. Eligibility for the Company matching contribution begins on the first of the month following one year of employment. For the years ended December 31, 2019, 2018 2017 and 2016,2017, the 401(k) plans expense recognized was $9.6 million, $9.6 million, and $6.5 million, and $3.8 million, respectively.
Postretirement Medical Plan
In addition to providing pension benefits, Alon has an unfunded postretirement medical plan covering certain health care and life insurance benefits for certain employees of Alon that retired prior to January 2, 2017, who met eligibility requirements in the plan documents. This plan is closed to new participants. The health care benefits in excess of certain limits are insured. The accrued benefit liability related to this plan reflected in the consolidated balance sheet was $3.3$2.6 million and $3.9$3.3 million at December 31, 20182019 and 2017,2018, respectively.
23. Selected Quarterly Financial Data (Unaudited)
Quarterly financial information for the years ended December 31, 20182019 and 20172018 is summarized below. The sum of the quarterly results may differ from the annual results presented on our consolidated income statement due to rounding. The quarterly financial information summarized below has been prepared by Delek's management and is unaudited (in millions, except per share data).
|
| | | | | | | | | | | | | | | | |
| | | For the Three Month Periods Ended |
| | | March 31, 2018(1) | | June 30, 2018(2) | | September 30, 2018 (2) | | December 31, 2018 |
| Net revenues | | $ | 2,353.2 |
| | $ | 2,636.9 |
| | $ | 2,768.9 |
| | $ | 2,474.1 |
|
| Operating income | | $ | 38.8 |
| | $ | 135.1 |
| | $ | 255.2 |
| | $ | 182.8 |
|
| Net income (loss) from continuing operations | | $ | (17.3 | ) | | $ | 87.5 |
| | $ | 185.8 |
| | $ | 127.6 |
|
| Net income (loss) attributable to Delek | | $ | (40.4 | ) | | $ | 79.1 |
| | $ | 179.8 |
| | $ | 121.6 |
|
| Basic income (loss) per share from continuing operations | | $ | (0.29 | ) | | $ | 0.95 |
| | $ | 2.15 |
| | $ | 1.50 |
|
| Diluted income (loss) per share from continuing operations | | $ | (0.29 | ) | | $ | 0.90 |
| | $ | 2.02 |
| | $ | 1.48 |
|
|
| | | | | | | | | | | | | | | | |
| | | For the Three Month Periods Ended |
| | | March 31, 2019 | | June 30, 2019 | | September 30, 2019 | | December 31, 2019(1) |
| Net revenues | | $ | 2,199.9 |
| | $ | 2,480.3 |
| | $ | 2,334.3 |
| | $ | 2,283.7 |
|
| Operating income | | $ | 222.4 |
| | $ | 134.3 |
| | $ | 87.4 |
| | $ | 48.2 |
|
| Net income from continuing operations | | $ | 154.4 |
| | $ | 84.6 |
| | $ | 60.0 |
| | $ | 32.0 |
|
| Net income | | $ | 154.4 |
| | $ | 83.8 |
| | $ | 60.0 |
| | $ | 38.0 |
|
| Net income attributable to Delek | | $ | 149.3 |
| | $ | 77.3 |
| | $ | 51.3 |
| | $ | 32.7 |
|
| Basic income per share from continuing operations | | $ | 1.92 |
| | $ | 1.02 |
| | $ | 0.68 |
| | $ | 0.36 |
|
| Diluted income per share from continuing operations | | $ | 1.90 |
| | $ | 1.01 |
| | $ | 0.68 |
| | $ | 0.36 |
|
|
| | | | | | | | | | | | | | | | |
| | | For the Three Month Periods Ended |
| | | March 31, 2018(2) | | June 30, 2018 | | September 30, 2018 | | December 31, 2018(3) |
| Net revenues | | $ | 2,353.2 |
| | $ | 2,636.9 |
| | $ | 2,768.9 |
| | $ | 2,474.1 |
|
| Operating income | | $ | 38.8 |
| | $ | 135.1 |
| | $ | 255.2 |
| | $ | 182.8 |
|
| Net (loss) income from continuing operations | | $ | (17.3 | ) | | $ | 87.5 |
| | $ | 185.8 |
| | $ | 127.6 |
|
| Net (loss) income | | $ | (25.5 | ) | | $ | 86.7 |
| | $ | 186.3 |
| | $ | 127.4 |
|
| Net (loss) income attributable to Delek | | $ | (40.4 | ) | | $ | 79.1 |
| | $ | 179.8 |
| | $ | 121.6 |
|
| Basic (loss) income per share from continuing operations | | $ | (0.29 | ) | | $ | 0.95 |
| | $ | 2.15 |
| | $ | 1.50 |
|
| Diluted (loss) income per share from continuing operations | | $ | (0.29 | ) | | $ | 0.90 |
| | $ | 2.02 |
| | $ | 1.48 |
|
The tables above include the following infrequently occurring items:
| |
(1) | Net lossincome from continuing operations and net loss attributable to Delek for the quarter ended MarchDecember 31, 2019 includes the benefit of retroactive biodiesel tax credits related to 2019 and 2018 reflect a correction to record additional deferred tax expenseblending activities totaling $5.5$77.6 million. Of this amount, $31.1 million related to the recognitionfirst three quarters of a valuation allowance on deferred tax assets previously recognized in connection with the Big Spring Logistic Assets Acquisition (see Note 6) not previously reported in our March 31,2019 blending activities and $36.0 million related to 2018 Quarterly Report on Form 10-Q filed on May 10, 2018. Such amount was not considered material to the financial statements or the trend of earnings for that period.blending activities. |
| |
(2) | Net revenuesloss from continuing operations for the quarter ended September 30,March 31, 2018 reflects a correctionincludes the benefit of an intercompany elimination which resulted in an increase in net revenues and cost of materials and other of $273.7 million not previously reflected on the unaudited consolidated financial statements in our September 30, 2018 Quarterly Report on Form 10-Q filed on November 9, 2018, and net revenuesretroactive biodiesel tax credits related to 2017 blending activities totaling $24.9 million. |
| |
(3) | Net income from continuing operations for the quarter ended June 30,December 31, 2018 reflectsincludes an environmental indemnification settlement totaling $20.0 million, where $16.0 million is attributable to additional recoveries of remediation costs incurred by the Company and is included as a similar correction resultingreduction of operating expenses, and $4.0 million is considered additional consideration for concessions made under the Settlement Agreement and is included as other income in an increase in net revenues and costthe accompanying consolidated statements of materials and other of $73.4 million not previously reflected onincome for the unaudited consolidated financial statements in our June 30, 2018 Quarterly Report on Form 10-Q filed on August 9,year ended December 31, 2018. Such amounts are not considered material to the financial statements and had no impact to operating income or segment contribution margin for those periods. |
The table above includes the following infrequently occurring item in the fourth quarter of 2018:
Net income from continuing operations for the quarter ended December 31, 2018 includes an environmental indemnification settlement totaling $20.0 million, where $16.0 million is attributable to additional recoveries of remediation costs incurred by the Company and is included as a reduction of operating expenses, and $4.0 million is considered additional consideration for concessions made under the Settlement Agreement and is included as other income in the accompanying consolidated statements of income for the year ended December 31, 2018.
|
| | | | | | | | | | | | | | | | |
| | | For the Three Month Periods Ended |
| | | March 31, 2017 | | June 30, 2017 | | September 30, 2017 | | December 31, 2017 |
| Net revenues | | $ | 1,182.2 |
| | $ | 1,230.7 |
| | $ | 2,370.6 |
| | $ | 2,483.7 |
|
| Operating income (loss) | | $ | 29.8 |
| | $ | (46.5 | ) | | $ | 90.8 |
| | $ | 112.5 |
|
| Net income (loss) from continuing operations | | $ | 15.3 |
| | $ | (32.2 | ) | | $ | 118.5 |
| | $ | 226.9 |
|
| Net income (loss) attributable to Delek | | $ | 11.2 |
| | $ | (37.9 | ) | | $ | 104.4 |
| | $ | 211.1 |
|
| Basic income (loss) per share from continuing operations | | $ | 0.18 |
| | $ | (0.61 | ) | | $ | 1.30 |
| | $ | 2.62 |
|
| Diluted income (loss) per share from continuing operations | | $ | 0.18 |
| | $ | (0.61 | ) | | $ | 1.29 |
| | $ | 2.58 |
|
The table above includes the following infrequently occurring items:
Net income from continuing operations for the quarter ended September 30, 2017 includes gain on remeasurement of the Alon equity method investment, before tax, of $190.1 million (see Note 3) and the income tax effect of the write-off of deferred taxes in connection with the Delek/Alon Merger of $46.9 million;
Net income attributable to Delek for the quarter ended December 31, 2017 includes the income tax effect of the Tax Reform Act of $166.9 million.
Results subsequent to the Delek/Alon Merger (see Note 3) include 100% of Alon's various income statement items for the applicable quarters, whereas results for the three months ended June 30, 2017 and prior include Delek's proportionate share of its equity method investment in Alon in (Income) loss from equity method investments in our consolidated statements of income (see Note 7).
The quarterly earnings per share calculations for the three months ended December 31, 20182019 and 20172018 are presented below:
| | | | | Three Months Ended December 31, | | Three Months Ended December 31, |
| | | 2018 | | 2017 | | 2019 | | 2018 |
| Numerator: | | | | | | | | |
| Numerator for EPS - continuing operations | | | | | | | | |
| Income (loss) from continuing operations | | $ | 127.6 |
| | $ | 226.9 |
| |
| Income from continuing operations | | | $ | 32.0 |
| | $ | 127.6 |
|
| Less: Income from continuing operations attributed to non-controlling interest | | 5.8 |
| | 14.0 |
| | 5.3 |
| | 5.8 |
|
| Income (loss) from continuing operations attributable to Delek (numerator for basic EPS - continuing operations attributable to Delek) | | 121.8 |
| | 212.9 |
| |
| Income from continuing operations attributable to Delek (numerator for basic EPS - continuing operations attributable to Delek) | | | 26.7 |
| | 121.8 |
|
| Interest on convertible debt, net of tax | | — |
| | 0.7 |
| | — |
| | — |
|
| Numerator for diluted EPS - continuing operations attributable to Delek | | $ | 121.8 |
| | $ | 213.6 |
| | $ | 26.7 |
| | $ | 121.8 |
|
| | | | | | | | | |
| Numerator for EPS - discontinued operations | | | | | | | | |
| Income (loss) from discontinued operations | | $ | (0.2 | ) | | $ | (1.8 | ) | | $ | 6.0 |
| | $ | (0.2 | ) |
| | | | | | | | | |
| Denominator: | | | | | | | | |
| Weighted average common shares outstanding (denominator for basic EPS) | | 81,321,240 |
| | 81,338,755 |
| | 74,042,343 |
| | 81,321,240 |
|
| Dilutive effect of convertible debt | | — |
| | 526,464 |
| |
| Dilutive effect of warrants | | 260,838 |
| | — |
| | — |
| | 260,838 |
|
| Dilutive effect of stock-based awards | | 946,261 |
| | 779,841 |
| | 658,583 |
| | 946,261 |
|
| Weighted average common shares outstanding, assuming dilution | | 82,528,339 |
| | 82,645,060 |
| | 74,700,926 |
| | 82,528,339 |
|
| | | | | | | | | |
| EPS: | | | | | | | | |
| Basic income (loss) per share: | | | | | |
| Income (loss) from continuing operations | | $ | 1.50 |
| | $ | 2.62 |
| |
| (Loss) income from discontinued operations | | — |
| | (0.02 | ) | |
| Basic income per share: | | | | | |
| Income from continuing operations | | | $ | 0.36 |
| | $ | 1.50 |
|
| Income from discontinued operations | | | 0.08 |
| | — |
|
| Total basic income (loss) per share | | $ | 1.50 |
| | $ | 2.60 |
| | $ | 0.44 |
| | $ | 1.50 |
|
| Diluted income (loss) per share: | | | | | |
| Income (loss) from continuing operations | | $ | 1.48 |
| | $ | 2.58 |
| |
| (Loss) income from discontinued operations | | — |
| | (0.02 | ) | |
| Diluted income per share: | | | | | |
| Income from continuing operations | | | $ | 0.36 |
| | $ | 1.48 |
|
| Income from discontinued operations | | | 0.08 |
| | — |
|
| Total diluted income (loss) per share | | $ | 1.48 |
| | $ | 2.56 |
| | $ | 0.44 |
| | $ | 1.48 |
|
| The following equity instruments were excluded from the diluted weighted average common shares outstanding because their effect would be anti-dilutive: | | | | | | | | |
| | | | | | | | | |
| Antidilutive stock-based compensation | | 1,749,569 |
| | 3,660,354 |
| |
| Antidilutive due to loss | | — |
| | — |
| |
| Total antidilutive stock-based compensation | | 1,749,569 |
| | 3,660,354 |
| | 1,925,207 |
| | 1,749,569 |
|
| | | | | | |
| Antidilutive convertible debt instruments | | — |
| | 5,623,304 |
| |
| Antidilutive warrants | | — |
| | 5,612,581 |
| |
24. Leases
We lease certain retail stores, land, building and various equipment from others. Leases with an initial term of 12 months or less are not recorded on the balance sheet; we recognize lease expense for these leases on a straight-line basis over the lease term. Most leases include one or more options to renew, with renewal terms that can extend the lease term from one to 15 years or more. The exercise of existing lease renewal options is at our sole discretion. Certain leases also include options to purchase the leased property. The depreciable life of assets and leasehold improvements are limited by the expected lease term, unless there is a transfer of title or purchase option reasonably certain of exercise.
Some of our lease agreements include a rate based on equipment usage and others include a rate with fixed increases or inflationary indices based increase. Our lease agreements do not contain any material residual value guarantees or material restrictive covenants. We rent or sublease certain real estate and equipment to third parties. Our sublease portfolio consists primarily of operating leases within our retail stores and crude storage equipment.
As of December 31, 2019, $28.5 million of our net property, plant, and equipment balance is subject to an operating lease. This agreement does not include options for the lessee to purchase our leasing equipment, nor does it include any material residual value guarantees or material restrictive covenants. The agreement includes a one year renewal option and certain variable payment based on usage.
The following table presents additional information related to our operating leases in accordance ASC 842, Leases ("ASC 842"):
|
| | | | |
| (in millions) | | Year Ended December 31, |
| | | 2019 |
| Lease Cost | | |
| Operating lease costs | | $ | 49.5 |
|
Short-term lease costs (1) | | 17.4 |
|
| Sublease income | | (6.4 | ) |
| Net lease costs | | $ | 60.5 |
|
| | | |
| Other Information | | |
| Cash paid for amounts included in the measurement of lease liabilities: | | |
| Operating cash flows from operating leases | | $ | (49.5 | ) |
| Leased assets obtained in exchange for new operating lease liabilities | | $ | 15.9 |
|
| | | |
| Weighted-average remaining lease term (years) operating leases | | 6.7 |
|
Weighted-average discount rate operating leases (2) | | 6.0 | % |
(1)Includes an immaterial amount of variable lease cost.
(2) Our discount rate is primarily based on our incremental borrowing rate in accordance with ASC 842.
The following is an estimate of the maturity of our lease liabilities for operating leases having remaining noncancelable terms in excess of one year as of December 31, 2019 (in millions) under the new lease guidance ASC 842: |
| | | | |
| Maturity of Lease Liabilities | | Total |
| 2020 | | $ | 50.2 |
|
| 2021 | | 43.3 |
|
| 2022 | | 29.3 |
|
| 2023 | | 25.7 |
|
| 2024 | | 16.8 |
|
| Thereafter | | 61.9 |
|
| Total future lease payments | | 227.2 |
|
| Less: Interest | | 42.4 |
|
| Present Value of Lease Liabilities | | $ | 184.8 |
|
24.25. Subsequent Events
Dividend Declaration
On February 19, 2019,24, 2020, Delek's Board of Directors voted to declare a quarterly cash dividend of $0.27$0.31 per share, payable on March 19, 2019,24, 2020, to stockholders of record on March 5, 2019. Our previous quarterly cash dividend amount10, 2020.
Investment in Project Financing Joint Venture
On February 21, 2020, we, through our wholly-owned direct subsidiary Delek Energy, entered into the W2W Holdings LLC Agreement with MPLX to form the WWP Project Financing JV (inclusive of its wholly-owned subsidiaries). The WWP Project Financing JV was $0.26 per share.created for the specific purpose of obtaining financing, through its wholly-owned subsidiary, W2W Finance LLC, to fund our combined capital calls resulting from and occurring during the construction period of the pipeline system under the WWP Joint Venture, and to service that debt. See Note 7 for further discussion.
20192020 Amendments to Supply and Offtake Agreements
DuringIn January 2019,2020, we amended the El Dorado refinery and the Krotz Springs refineryour three Supply and Offtake Agreements with J. Aron so that the repurchase of baseline volumes at the end of the Supply and Offtake Agreement term (representingto convert the Baseline Step-Out Liabilities) will be based upon a fixed price instead ofLiabilities back to a market-indexed price. Such Baseline Step-Out Liabilities will continueprice subject to be recorded at fair value, where the fair value will reflect changes in interest rate risk rather than commodity price risk. As a result, we expectrisk with corresponding changes to record a gain on the change in fair value resulting from the modification of the instruments from commodities-based risk to interest rate risk in cost of materialsunderlying market-based indices and other totaling approximately $7.6 million in the first quarter of 2019. Subsequent accounting will result in the presentation of a long-term liabilitycertain differentials. See Note 10 for the fair value of the fixed obligation on baseline volumes and current asset/liability fair value presentation of monthly short-term financing/funding activities, similar to the accounting for the amended Big Spring refinery Supply and Offtake Agreement described in Note 10.further discussion.
Financial Statements and Schedules
ITEM 16. FORM 10-K SUMMARY
None.
SIGNATURES
Pursuant to the requirements of Section 13 or 15(d) of the Securities Exchange Act of 1934, the registrant has duly caused this report to be signed on its behalf by the undersigned, thereunto duly authorized.
Delek US Holdings, Inc.
By: /s/ Assaf Ginzburg
Assaf Ginzburg
Executive Vice President and Chief Financial Officer
Dated: June 26, 2019February 27, 2020
Pursuant to the requirements of the Securities Exchange Act of 1934, this report has been signed below by or on behalf of the following persons on behalf of the registrant and in the capacities indicated on February 27, 2020:
/s/ Ezra Uzi Yemin
Ezra Uzi Yemin
Director (Chairman), President and Chief Executive Officer
(Principal Executive Officer)
/s/ Assaf Ginzburg
Assaf Ginzburg
Executive Vice President and Chief Financial Officer
(Principal Financial and Accounting Officer)
/s/ William J. Finnerty
William J. Finnerty
Director
/s/ Richard J. Marcogliese
Richard J. Marcogliese
Director
/s/ Gary M. Sullivan, Jr.
Gary M. Sullivan, Jr.
Director
/s/ Vicky Sutil
Vicky Sutil
Director
/s/ David Wiessman
David Wiessman
Director
/s/ Shlomo Zohar
Shlomo Zohar
Director