UNITED STATES
SECURITIES AND EXCHANGE COMMISSION
Washington, D.C. 20549
FORM 10-Q
☒QUARTERLY REPORT PURSUANT TO SECTION 13 OR 15(d) OF THE SECURITIES EXCHANGE ACT OF 1934
For the quarterly period ended June 30, 2019March 31, 2020
or
☐TRANSITION REPORT PURSUANT TO SECTION 13 OR 15(d) OF THE SECURITIES EXCHANGE ACT OF 1934
For the transition period from to
Commission file number 001-16383
CHENIERE ENERGY, INC.
(Exact name of registrant as specified in its charter)
|
| | | |
| Delaware | 95-4352386 |
| (State or other jurisdiction of incorporation or organization) | (I.R.S. Employer Identification No.) |
| | | |
700 Milam Street | , | Suite 1900 | |
Houston | , | Texas | 77002 |
(Address of principal executive offices) | (Zip |
700 Milam Street, Suite 1900
Houston, Texas77002
(Address of principal executive offices) (Zip Code)
(713) 375-5000
(Registrant’s telephone number, including area code)
Securities registered pursuant to Section 12(b) of the Act:
|
| | |
| Title of each class | Trading Symbol | Name of each exchange on which registered |
| Common Stock, $ 0.003 par value | LNG | NYSE American |
Indicate by check mark whether the registrant (1) has filed all reports required to be filed by Section 13 or 15(d) of the Securities Exchange Act of 1934 during the preceding 12 months (or for such shorter period that the registrant was required to file such reports), and (2) has been subject to such filing requirements for the past 90 days. Yes ☒ No ☐
Indicate by check mark whether the registrant has submitted electronically every Interactive Data File required to be submitted pursuant to Rule 405 of Regulation S-T (§232.405 of this chapter) during the preceding 12 months (or for such shorter period that the registrant was required to submit such files). Yes ☒ No ☐
Indicate by check mark whether the registrant is a large accelerated filer, an accelerated filer, a non-accelerated filer, a smaller reporting company, or an emerging growth company. See the definitions of “large accelerated filer,” “accelerated filer,” “smaller reporting company” and “emerging growth company” in Rule 12b-2 of the Exchange Act.
|
| | | | | |
| | Large accelerated filer | ☒ | | Accelerated filer | ☐ |
| | Non-accelerated filer | ☐ | | Smaller reporting company | ☐ |
| | | | | Emerging growth company | ☐ |
If an emerging growth company, indicate by check mark if the registrant has elected not to use the extended transition period for complying with any new or revised financial accounting standards provided pursuant to Section 13(a) of the Exchange Act. ☐
Indicate by check mark whether the registrant is a shell company (as defined in Rule 12b-2 of the Exchange Act). Yes ☐ No ☒
As of August 2, 2019,April 24, 2020, the issuer had 256,779,983252,107,558 shares of Common Stock outstanding.
CHENIERE ENERGY, INC.
TABLE OF CONTENTS
DEFINITIONS
As used in this quarterly report, the terms listed below have the following meanings:
Common Industry and Other Terms
|
| | |
| Bcf | | billion cubic feet |
| Bcf/d | | billion cubic feet per day |
| Bcf/yr | | billion cubic feet per year |
| Bcfe | | billion cubic feet equivalent |
| DOE | | U.S. Department of Energy |
| EPC | | engineering, procurement and construction |
| FERC | | Federal Energy Regulatory Commission |
| FTA countries | | countries with which the United States has a free trade agreement providing for national treatment for trade in natural gas |
| GAAP | | generally accepted accounting principles in the United States |
| Henry Hub | | the final settlement price (in USD per MMBtu) for the New York Mercantile Exchange’s Henry Hub natural gas futures contract for the month in which a relevant cargo’s delivery window is scheduled to begin |
| LIBOR | | London Interbank Offered Rate |
| LNG | | liquefied natural gas, a product of natural gas that, through a refrigeration process, has been cooled to a liquid state, which occupies a volume that is approximately 1/600th of its gaseous state |
| MMBtu | | million British thermal units, an energy unit |
| mtpa | | million tonnes per annum |
| non-FTA countries | | countries with which the United States does not have a free trade agreement providing for national treatment for trade in natural gas and with which trade is permitted |
| SEC | | U.S. Securities and Exchange Commission |
| SPA | | LNG sale and purchase agreement |
| TBtu | | trillion British thermal units, an energy unit |
| Train | | an industrial facility comprised of a series of refrigerant compressor loops used to cool natural gas into LNG |
| TUA | | terminal use agreement |
Abbreviated Legal Entity Structure
The following diagram depicts our abbreviated legal entity structure as of June 30, 2019,March 31, 2020, including our ownership of certain subsidiaries, and the references to these entities used in this quarterly report:
Unless the context requires otherwise, references to “Cheniere,” the “Company,” “we,” “us” and “our” refer to Cheniere Energy, Inc. and its consolidated subsidiaries, including our publicly traded subsidiary, Cheniere Partners.
Unless the context requires otherwise, references to the “CCH Group” refer to CCH HoldCo II, CCH HoldCo I, CCH, CCL and CCP, collectively.
| |
| PART I. | FINANCIAL INFORMATION |
| |
| ITEM 1. | CONSOLIDATED FINANCIAL STATEMENTS |
CHENIERE ENERGY, INC. AND SUBSIDIARIES
CONSOLIDATED BALANCE SHEETS (1)
(in millions, except share data)
| | | | June 30, | | December 31, | March 31, | | December 31, |
| | 2019 | | 2018 | 2020 | | 2019 |
| ASSETS | (unaudited) | | | (unaudited) | | |
| Current assets | | | | | | |
| Cash and cash equivalents | $ | 2,279 |
| | $ | 981 |
| $ | 2,399 |
| | $ | 2,474 |
|
| Restricted cash | 1,161 |
| | 2,175 |
| 430 |
| | 520 |
|
| Accounts and other receivables | 433 |
| | 585 |
| 468 |
| | 491 |
|
| Inventory | 290 |
| | 316 |
| 239 |
| | 312 |
|
| Derivative assets | 127 |
| | 63 |
| 322 |
| | 323 |
|
| Other current assets | 135 |
| | 114 |
| 79 |
| | 92 |
|
| Total current assets | 4,425 |
| | 4,234 |
| 3,937 |
| | 4,212 |
|
| | | | | | | |
| Property, plant and equipment, net | 29,073 |
| | 27,245 |
| 29,802 |
| | 29,673 |
|
| Operating lease assets, net | 502 |
| | — |
| 350 |
| | 439 |
|
| Debt issuance costs, net | 55 |
| | 72 |
| |
| Non-current derivative assets | 103 |
| | 54 |
| 705 |
| | 174 |
|
| Goodwill | 77 |
| | 77 |
| 77 |
| | 77 |
|
| Deferred tax assets | | 400 |
| | 529 |
|
| Other non-current assets, net | 337 |
| | 305 |
| 476 |
| | 388 |
|
| Total assets | $ | 34,572 |
| | $ | 31,987 |
| $ | 35,747 |
| | $ | 35,492 |
|
| | | | | | | |
| LIABILITIES AND STOCKHOLDERS’ EQUITY | |
| | |
| | | |
| Current liabilities | |
| | |
| |
| | |
|
| Accounts payable | $ | 120 |
| | $ | 58 |
| $ | 29 |
| | $ | 66 |
|
| Accrued liabilities | 1,572 |
| | 1,169 |
| 922 |
| | 1,281 |
|
| Current debt | — |
| | 239 |
| 2,137 |
| | — |
|
| Deferred revenue | 136 |
| | 139 |
| 94 |
| | 161 |
|
| Current operating lease liabilities | 292 |
| | — |
| 178 |
| | 236 |
|
| Derivative liabilities | 84 |
| | 128 |
| 244 |
| | 117 |
|
| Other current liabilities | 3 |
| | 9 |
| 53 |
| | 13 |
|
| Total current liabilities | 2,207 |
| | 1,742 |
| 3,657 |
| | 1,874 |
|
| | | | | | | |
| Long-term debt, net | 29,944 |
| | 28,179 |
| 28,940 |
| | 30,774 |
|
| Non-current operating lease liabilities | 202 |
| | — |
| 164 |
| | 189 |
|
| Non-current finance lease liabilities | 58 |
| | 57 |
| 58 |
| | 58 |
|
| Non-current derivative liabilities | 94 |
| | 22 |
| 186 |
| | 151 |
|
| Other non-current liabilities | 44 |
| | 58 |
| 23 |
| | 11 |
|
| | | | | | | |
| Commitments and contingencies (see Note 16) |
|
| |
|
| |
| Commitments and contingencies (see Note 17) | |
|
| |
|
|
| | | | | | | |
| Stockholders’ equity | |
| | |
| |
| | |
|
| Preferred stock, $0.0001 par value, 5.0 million shares authorized, none issued | — |
| | — |
| — |
| | — |
|
| Common stock, $0.003 par value | | | |
| |
| Authorized: 480.0 million shares at June 30, 2019 and December 31, 2018 | | | | |
| Issued: 270.5 million shares at June 30, 2019 and 269.8 million shares at December 31, 2018 |
|
| |
|
| |
| Outstanding: 257.5 million shares at June 30, 2019 and 257.0 million shares at December 31, 2018 | 1 |
| | 1 |
| |
| Treasury stock: 13.0 million shares and 12.8 million shares at June 30, 2019 and December 31, 2018, respectively, at cost | (423 | ) | | (406 | ) | |
| Common stock, $0.003 par value, 480.0 million shares authorized | | | | |
| Issued: 272.8 million shares at March 31, 2020 and 270.7 million shares at December 31, 2019 | |
|
| |
|
|
| Outstanding: 252.1 million shares at March 31, 2020 and 253.6 million shares at December 31, 2019 | | 1 |
| | 1 |
|
| Treasury stock: 20.7 million shares and 17.1 million shares at March 31, 2020 and December 31, 2019, respectively, at cost | | (868 | ) | | (674 | ) |
| Additional paid-in-capital | 4,097 |
| | 4,035 |
| 4,196 |
| | 4,167 |
|
| Accumulated deficit | (4,129 | ) | | (4,156 | ) | (3,133 | ) | | (3,508 | ) |
| Total stockholders’ deficit | (454 | ) | | (526 | ) | |
| Total stockholders’ equity (deficit) | | 196 |
| | (14 | ) |
| Non-controlling interest | 2,477 |
| | 2,455 |
| 2,523 |
| | 2,449 |
|
| Total equity | 2,023 |
| | 1,929 |
| 2,719 |
| | 2,435 |
|
| Total liabilities and equity | $ | 34,572 |
| | $ | 31,987 |
| |
| Total liabilities and stockholders’ equity | | $ | 35,747 |
| | $ | 35,492 |
|
| |
| (1) | Amounts presented include balances held by our consolidated variable interest entity (“VIE”), Cheniere Partners, as further discussed in Note 8— Non-controlling Interest and Variable Interest Entity. As of March 31, 2020, total assets and liabilities of Cheniere Partners, which are included in our Consolidated Balance Sheets, were $19.0 billion and $18.4 billion, respectively, including $1.7 billion of cash and cash equivalents and $0.1 billion of restricted cash. |
The accompanying notes are an integral part of these consolidated financial statements.
3
CHENIERE ENERGY, INC. AND SUBSIDIARIES
CONSOLIDATED STATEMENTS OF OPERATIONS
(in millions, except per share data)
(unaudited)
| | | | Three Months Ended June 30, | | Six Months Ended June 30, | Three Months Ended March 31, |
| | 2019 | | 2018 | | 2019 | | 2018 | 2020 | | 2019 |
| Revenues | | | | | | | | | | |
| LNG revenues | $ | 2,173 |
| | $ | 1,442 |
| | $ | 4,316 |
| | $ | 3,608 |
| $ | 2,568 |
| | $ | 2,143 |
|
| Regasification revenues | 67 |
| | 65 |
| | 133 |
| | 130 |
| 67 |
| | 66 |
|
| Other revenues | 52 |
| | 36 |
| | 104 |
| | 47 |
| 74 |
| | 52 |
|
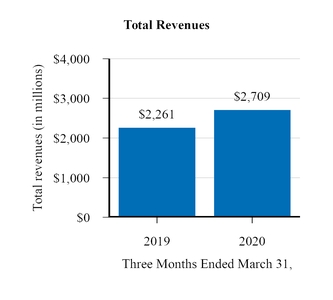
| Total revenues | 2,292 |
| | 1,543 |
| | 4,553 |
| | 3,785 |
| 2,709 |
| | 2,261 |
|
| | | | | | | | | | | |
| Operating costs and expenses | | | | | | | | | | |
| Cost of sales (excluding depreciation and amortization expense shown separately below) | 1,277 |
| | 873 |
| | 2,491 |
| | 2,051 |
| |
| Cost of sales (excluding items shown separately below) | | 724 |
| | 1,214 |
|
| Operating and maintenance expense | 295 |
| | 147 |
| | 516 |
| | 287 |
| 316 |
| | 221 |
|
| Development expense | 3 |
| | 3 |
| | 4 |
| | 4 |
| 4 |
| | 1 |
|
| Selling, general and administrative expense | 77 |
| | 73 |
| | 150 |
| | 140 |
| 81 |
| | 73 |
|
| Depreciation and amortization expense | 204 |
| | 111 |
| | 348 |
| | 220 |
| 233 |
| | 144 |
|
| Impairment expense and loss on disposal of assets | 4 |
| | — |
| | 6 |
| | — |
| 5 |
| | 2 |
|
| Total operating costs and expenses | 1,860 |
| | 1,207 |
| | 3,515 |
| | 2,702 |
| 1,363 |
| | 1,655 |
|
| | | | | | | | | | | |
| Income from operations | 432 |
| | 336 |
| | 1,038 |
| | 1,083 |
| 1,346 |
| | 606 |
|
| | | | | | | | | | | |
| Other income (expense) | | | | | | | | | | |
| Interest expense, net of capitalized interest | (372 | ) | | (216 | ) | | (619 | ) | | (432 | ) | (412 | ) | | (247 | ) |
| Loss on modification or extinguishment of debt | — |
| | (15 | ) | | — |
| | (15 | ) | (1 | ) | | — |
|
| Derivative gain (loss), net | (74 | ) | | 32 |
| | (109 | ) | | 109 |
| |
| Other income | 16 |
| | 10 |
| | 32 |
| | 17 |
| |
| Interest rate derivative loss, net | | (208 | ) | | (35 | ) |
| Other income, net | | 9 |
| | 16 |
|
| Total other expense | (430 | ) | | (189 | ) | | (696 | ) | | (321 | ) | (612 | ) | | (266 | ) |
| | | | | | | | | | | |
| Income before income taxes and non-controlling interest | 2 |
|
| 147 |
|
| 342 |
|
| 762 |
| 734 |
|
| 340 |
|
| Income tax benefit (provision) | — |
|
| 3 |
|
| (3 | ) |
| (12 | ) | |
| Income tax provision | | (131 | ) |
| (3 | ) |
| Net income | 2 |
|
| 150 |
|
| 339 |
|
| 750 |
| 603 |
|
| 337 |
|
| Less: net income attributable to non-controlling interest | 116 |
|
| 168 |
|
| 312 |
|
| 411 |
| 228 |
|
| 196 |
|
| Net income (loss) attributable to common stockholders | $ | (114 | ) |
| $ | (18 | ) |
| $ | 27 |
|
| $ | 339 |
| |
| Net income attributable to common stockholders | | $ | 375 |
|
| $ | 141 |
|
| | Net income (loss) per share attributable to common stockholders—basic (1) | $ | (0.44 | ) |
| $ | (0.07 | ) |
| $ | 0.11 |
|
| $ | 1.42 |
| |
| Net income (loss) per share attributable to common stockholders—diluted (1) | $ | (0.44 | ) | | $ | (0.07 | ) | | $ | 0.11 |
| | $ | 1.40 |
| |
| Net income per share attributable to common stockholders—basic (1) | | $ | 1.48 |
|
| $ | 0.55 |
|
| Net income per share attributable to common stockholders—diluted (1) | | $ | 1.43 |
| | $ | 0.54 |
|
| |
|
|
|
|
|
|
|
|
|
|
|
|
|
|
|
|
| Weighted average number of common shares outstanding—basic | 257.4 |
| | 242.8 |
| | 257.3 |
| | 239.2 |
| 253.0 |
| | 257.1 |
|
| Weighted average number of common shares outstanding—diluted | 257.4 |
| | 242.8 |
| | 258.6 |
| | 241.7 |
| 299.6 |
| | 258.5 |
|
(1) | |
| (1) | Earnings per share in the table may not recalculate exactly due to rounding because it is calculated based on whole numbers, not the rounded numbers presented. |
The accompanying notes are an integral part of these consolidated financial statements.
4
CHENIERE ENERGY, INC. AND SUBSIDIARIES
CONSOLIDATED STATEMENTS OF STOCKHOLDERS’ EQUITY
(in millions)
(unaudited)
|
| | | | | | | | | | | | | | | | | | | | | | | | | | | | | |
| Three and Six Months Ended June 30, 2019 | | | | | | | | | | | | | | | |
| | Total Stockholders’ Equity | | | |
| | Common Stock | | Treasury Stock | | Additional Paid-in Capital | | Accumulated Deficit | | Non-controlling Interest | | Total Equity |
| | Shares | | Par Value Amount | | Shares | | Amount | | | | |
| Balance at December 31, 2018 | 257.0 |
|
| $ | 1 |
|
| 12.8 |
|
| $ | (406 | ) |
| $ | 4,035 |
|
| $ | (4,156 | ) |
| $ | 2,455 |
|
| $ | 1,929 |
|
| Vesting of restricted stock units | 0.6 |
| | — |
| | — |
| | — |
| | — |
| | — |
| | — |
| | — |
|
| Share-based compensation | — |
| | — |
| | — |
| | — |
| | 28 |
| | — |
| | — |
| | 28 |
|
| Shares withheld from employees related to share-based compensation, at cost | (0.2 | ) | | — |
| | 0.2 |
| | (12 | ) | | — |
| | — |
| | — |
| | (12 | ) |
| Net income attributable to non-controlling interest | — |
| | — |
| | — |
| | — |
| | — |
| | — |
| | 196 |
| | 196 |
|
| Distributions and dividends to non-controlling interest | — |
| | — |
| | — |
| | — |
| | — |
| | — |
| | (144 | ) | | (144 | ) |
| Net income | — |
| | — |
| | — |
| | — |
| | — |
| | 141 |
| | — |
| | 141 |
|
| Balance at March 31, 2019 | 257.4 |
| | 1 |
| | 13.0 |
| | (418 | ) | | 4,063 |
| | (4,015 | ) | | 2,507 |
| | 2,138 |
|
| Vesting of restricted stock units | 0.1 |
| | — |
| | — |
| | — |
| | — |
| | — |
| | — |
| | — |
|
| Share-based compensation | — |
| | — |
| | — |
| | — |
| | 33 |
| | — |
| | — |
| | 33 |
|
| Shares withheld from employees related to share-based compensation, at cost | — |
| | — |
| | — |
| | (2 | ) | | — |
| | — |
| | — |
| | (2 | ) |
| Shares repurchased, at cost | — |
| | — |
| | — |
| | (3 | ) | | — |
| | — |
| | — |
| | (3 | ) |
| Net income attributable to non-controlling interest | — |
| | — |
| | — |
| | — |
| | — |
| | — |
| | 116 |
| | 116 |
|
| Equity portion of convertible notes, net | — |
| | — |
| | — |
| | — |
| | 1 |
| | — |
| | — |
| | 1 |
|
| Distributions and dividends to non-controlling interest | — |
| | — |
| | — |
| | — |
| | — |
| | — |
| | (146 | ) | | (146 | ) |
| Net loss | — |
| | — |
| | — |
| | — |
| | — |
| | (114 | ) | | — |
| | (114 | ) |
| Balance at June 30, 2019 | 257.5 |
| | $ | 1 |
| | 13.0 |
| | $ | (423 | ) | | $ | 4,097 |
| | $ | (4,129 | ) | | $ | 2,477 |
| | $ | 2,023 |
|
|
| | | | | | | | | | | | | | | | | | | | | | | | | | | | | |
| Three Months Ended March 31, 2020 | | | | | | | | | | | | | | | |
| | Total Stockholders’ Equity | | | |
| | Common Stock | | Treasury Stock | | Additional Paid-in Capital | | Accumulated Deficit | | Non-controlling Interest | | Total Equity |
| | Shares | | Par Value Amount | | Shares | | Amount | | | | |
| Balance at December 31, 2019 | 253.6 |
|
| $ | 1 |
|
| 17.1 |
|
| $ | (674 | ) |
| $ | 4,167 |
|
| $ | (3,508 | ) |
| $ | 2,449 |
|
| $ | 2,435 |
|
| Vesting of restricted stock units and performance stock units | 2.1 |
| | — |
| | — |
| | — |
| | — |
| | — |
| | — |
| | — |
|
| Share-based compensation | — |
| | — |
| | — |
| | — |
| | 29 |
| | — |
| | — |
| | 29 |
|
| Issued shares withheld from employees related to share-based compensation, at cost | (0.7 | ) | | — |
| | 0.7 |
| | (39 | ) | | — |
| | — |
| | — |
| | (39 | ) |
| Shares repurchased, at cost | (2.9 | ) | | — |
| | 2.9 |
| | (155 | ) | | — |
| | — |
| | — |
| | (155 | ) |
| Net income attributable to non-controlling interest | — |
| | — |
| | — |
| | — |
| | — |
| | — |
| | 228 |
| | 228 |
|
| Distributions and dividends to non-controlling interest | — |
| | — |
| | — |
| | — |
| | — |
| | — |
| | (154 | ) | | (154 | ) |
| Net income | — |
| | — |
| | — |
| | — |
| | — |
| | 375 |
| | — |
| | 375 |
|
| Balance at March 31, 2020 | 252.1 |
| | $ | 1 |
| | 20.7 |
| | $ | (868 | ) | | $ | 4,196 |
| | $ | (3,133 | ) | | $ | 2,523 |
| | $ | 2,719 |
|
|
| | | | | | | | | | | | | | | | | | | | | | | | | | | | | |
| Three Months Ended March 31, 2019 | | | | | | | | | | | | | | | |
| | Total Stockholders’ Equity | | | |
| | Common Stock | | Treasury Stock | | Additional Paid-in Capital | | Accumulated Deficit | | Non-controlling Interest | | Total
Equity |
| | Shares | | Par Value Amount | | Shares | | Amount | | | | |
| Balance at December 31, 2018 | 257.0 |
| | $ | 1 |
| | 12.8 |
| | $ | (406 | ) | | $ | 4,035 |
| | $ | (4,156 | ) | | $ | 2,455 |
| | $ | 1,929 |
|
| Vesting of restricted stock units | 0.6 |
| | — |
| | — |
| | — |
| | — |
| | — |
| | — |
| | — |
|
| Share-based compensation | — |
| | — |
| | — |
| | — |
| | 28 |
| | — |
| | — |
| | 28 |
|
| Issued shares withheld from employees related to share-based compensation, at cost | (0.2 | ) | | — |
| | 0.2 |
| | (12 | ) | | — |
| | — |
| | — |
| | (12 | ) |
| Net income attributable to non-controlling interest | — |
| | — |
| | — |
| | — |
| | — |
| | — |
| | 196 |
| | 196 |
|
| Distributions and dividends to non-controlling interest | — |
| | — |
| | — |
| | — |
| | — |
| | — |
| | (144 | ) | | (144 | ) |
| Net income | — |
| | — |
| | — |
| | — |
| | — |
| | 141 |
| | — |
| | 141 |
|
| Balance at March 31, 2019 | 257.4 |
| | $ | 1 |
| | 13.0 |
| | $ | (418 | ) | | $ | 4,063 |
| | $ | (4,015 | ) | | $ | 2,507 |
| | $ | 2,138 |
|
The accompanying notes are an integral part of these consolidated financial statements.
5
CHENIERE ENERGY, INC. AND SUBSIDIARIES
CONSOLIDATED STATEMENTS OF STOCKHOLDERS’ EQUITY—CONTINUED
(in millions)
(unaudited)
|
| | | | | | | | | | | | | | | | | | | | | | | | | | | | | |
| Three and Six Months Ended June 30, 2018 | | | | | | | | | | | | | | | |
| | Total Stockholders’ Equity | | | |
| | Common Stock | | Treasury Stock | | Additional Paid-in Capital | | Accumulated Deficit | | Non-controlling Interest | | Total
Equity |
| | Shares | | Par Value Amount | | Shares | | Amount | | | | |
| Balance at December 31, 2017 | 237.6 |
| | $ | 1 |
| | 12.5 |
| | $ | (386 | ) | | $ | 3,248 |
| | $ | (4,627 | ) | | $ | 3,004 |
| | $ | 1,240 |
|
| Vesting of restricted stock units | 0.3 |
| | — |
| | — |
| | — |
| | — |
| | — |
| | — |
| | — |
|
| Share-based compensation | — |
| | — |
| | — |
| | — |
| | 16 |
| | — |
| | — |
| | 16 |
|
| Shares withheld from employees related to share-based compensation, at cost | — |
| | — |
| | 0.1 |
| | (6 | ) | | — |
| | — |
| | — |
| | (6 | ) |
| Net income attributable to non-controlling interest | — |
| | — |
| | — |
| | — |
| | — |
| | — |
| | 243 |
| | 243 |
|
| Distributions and dividends to non-controlling interest | — |
| | — |
| | — |
| | — |
| | — |
| | — |
| | (143 | ) | | (143 | ) |
| Net income | — |
| | — |
| | — |
| | — |
| | — |
| | 357 |
| | — |
| | 357 |
|
| Balance at March 31, 2018 | 237.9 |
| | 1 |
| | 12.6 |
| | (392 | ) | | 3,264 |
| | (4,270 | ) | | 3,104 |
| | 1,707 |
|
| Issuance of stock to acquire additional interest in Cheniere Holdings | 10.3 |
| | — |
| | — |
| | — |
| | 376 |
| | — |
| | (376 | ) | | — |
|
| Share-based compensation | — |
| | — |
| | — |
| | — |
| | 23 |
| | — |
| | — |
| | 23 |
|
| Shares withheld from employees related to share-based compensation, at cost | (0.1 | ) | | — |
| | — |
| | (2 | ) | | — |
| | — |
| | — |
| | (2 | ) |
| Net income attributable to non-controlling interest | — |
| | — |
| | — |
| | — |
| | — |
| | — |
| | 168 |
| | 168 |
|
| Equity portion of convertible notes, net | — |
| | — |
| | — |
| | — |
| | 1 |
| | — |
| | — |
| | 1 |
|
| Distributions and dividends to non-controlling interest | — |
| | — |
| | — |
| | — |
| | — |
| | — |
| | (145 | ) | | (145 | ) |
| Net loss | — |
| | — |
| | — |
| | — |
| | — |
| | (18 | ) | | — |
| | (18 | ) |
| Balance at June 30, 2018 | 248.1 |
| | $ | 1 |
| | 12.6 |
| | $ | (394 | ) | | $ | 3,664 |
| | $ | (4,288 | ) | | $ | 2,751 |
| | $ | 1,734 |
|
The accompanying notes are an integral part of these consolidated financial statements.
6
CHENIERE ENERGY, INC. AND SUBSIDIARIES
CONSOLIDATED STATEMENTS OF CASH FLOWS
(in millions)
(unaudited)
| | | | Six Months Ended June 30, | Three Months Ended March 31, |
| | 2019 | | 2018 | 2020 | | 2019 |
| Cash flows from operating activities | | | | | | |
| Net income | $ | 339 |
| | $ | 750 |
| $ | 603 |
| | $ | 337 |
|
| Adjustments to reconcile net income to net cash provided by operating activities: | | | | | | |
| Depreciation and amortization expense | 348 |
| | 220 |
| 233 |
| | 144 |
|
| Share-based compensation expense | 61 |
| | 58 |
| 29 |
| | 28 |
|
| Non-cash interest expense | 93 |
| | 30 |
| 17 |
| | 33 |
|
| Amortization of debt issuance costs, deferred commitment fees, premium and discount | 44 |
| | 35 |
| |
| Amortization of operating lease assets | 158 |
| | — |
| |
| Amortization of debt issuance costs, premium and discount | | 32 |
| | 18 |
|
| Non-cash operating lease costs | | 96 |
| | 79 |
|
| Loss on modification or extinguishment of debt | — |
| | 15 |
| 1 |
| | — |
|
| Total losses (gains) on derivatives, net | (147 | ) | | 4 |
| |
| Net cash provided by (used for) settlement of derivative instruments | 62 |
| | (8 | ) | |
| Total gains on derivatives, net | | (459 | ) | | (122 | ) |
| Net cash provided by settlement of derivative instruments | | 91 |
| | 16 |
|
| Impairment expense and loss on disposal of assets | 6 |
| | — |
| 5 |
| | 2 |
|
| Other | 2 |
| | (5 | ) | |
| Impairment or loss on equity method investments | | 1 |
| | — |
|
| Deferred taxes | | 129 |
| | — |
|
| Changes in operating assets and liabilities: | | | | | | |
| Accounts and other receivables | 59 |
| | 80 |
| 23 |
| | 99 |
|
| Inventory | 33 |
| | 10 |
| 74 |
| | 44 |
|
| Other current assets | (46 | ) | | (61 | ) | 13 |
| | (15 | ) |
| Accounts payable and accrued liabilities | (80 | ) | | (132 | ) | (176 | ) | | (146 | ) |
| Deferred revenue | (2 | ) | | (13 | ) | (67 | ) | | (31 | ) |
| Operating lease liabilities | (163 | ) | | — |
| (90 | ) | | (85 | ) |
| Finance lease liabilities | | — |
| | 1 |
|
| Other, net | (7 | ) | | (1 | ) | 19 |
| | 10 |
|
| Net cash provided by operating activities | 760 |
| | 982 |
| 574 |
| | 412 |
|
| | | | | | | |
| Cash flows from investing activities | | | | | | |
| Property, plant and equipment, net | (1,508 | ) | | (1,508 | ) | (556 | ) | | (625 | ) |
| Investment in equity method investment | (34 | ) | | — |
| (90 | ) | | (24 | ) |
| Other | — |
| | 16 |
| (8 | ) | | (2 | ) |
| Net cash used in investing activities | (1,542 | ) | | (1,492 | ) | (654 | ) | | (651 | ) |
| | | | | | | |
| Cash flows from financing activities | | | | | | |
| Proceeds from issuances of debt | 2,021 |
| | 1,799 |
| 596 |
| | 692 |
|
| Repayments of debt | (630 | ) | | (281 | ) | (300 | ) | | (441 | ) |
| Debt issuance and deferred financing costs | (20 | ) | | (46 | ) | |
| Debt extinguishment costs | — |
| | (8 | ) | |
| Debt issuance and other financing costs | | (33 | ) | | — |
|
| Distributions and dividends to non-controlling interest | (290 | ) | | (288 | ) | (154 | ) | | (144 | ) |
| Payments related to tax withholdings for share-based compensation | (14 | ) | | (8 | ) | (39 | ) | | (12 | ) |
| Repurchase of common stock | (3 | ) | | — |
| (155 | ) | | — |
|
| Other | 2 |
| | — |
| — |
| | (1 | ) |
| Net cash provided by financing activities | 1,066 |
| | 1,168 |
| |
| Net cash provided by (used in) financing activities | | (85 | ) | | 94 |
|
| | | | | | | |
| Net increase in cash, cash equivalents and restricted cash | 284 |
| | 658 |
| |
| Net decrease in cash, cash equivalents and restricted cash | | (165 | ) | | (145 | ) |
| Cash, cash equivalents and restricted cash—beginning of period | 3,156 |
| | 2,613 |
| 2,994 |
| | 3,156 |
|
| Cash, cash equivalents and restricted cash—end of period | $ | 3,440 |
| | $ | 3,271 |
| $ | 2,829 |
| | $ | 3,011 |
|
Balances per Consolidated Balance Sheet:
| | | | | March 31, |
| | June 30, 2019 | 2020 |
| Cash and cash equivalents | $ | 2,279 |
| $ | 2,399 |
|
| Restricted cash | 1,161 |
| 430 |
|
| Total cash, cash equivalents and restricted cash | $ | 3,440 |
| $ | 2,829 |
|
The accompanying notes are an integral part of these consolidated financial statements.
76
CHENIERE ENERGY, INC. AND SUBSIDIARIES
NOTES TO CONSOLIDATED FINANCIAL STATEMENTS
(unaudited)
NOTE 1—NATURE OF OPERATIONS AND BASIS OF PRESENTATION
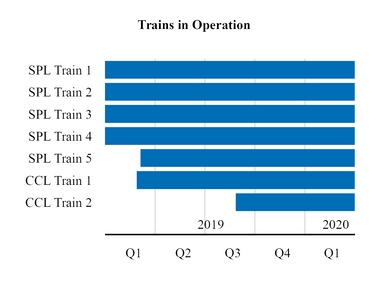
We ownare operating and operate twoconstructing 2 natural gas liquefaction and export facilities at Sabine Pass and Corpus Christi. The Sabine Pass LNG terminal is located in Cameron Parish, Louisiana, on the Sabine-Neches Waterway less than four miles from the Gulf Coast. Cheniere Partners, through its subsidiary SPL, is in various stages of constructing andcurrently operating six5 natural gas liquefaction facilitiesTrains and is constructing 1 additional Train for a total production capacity of approximately 30 mtpa of LNG (the “SPL Project”) at the Sabine Pass LNG terminal adjacent to the existing regasification facilities through a wholly owned subsidiary, SPL. Trains 1 through 5 are operational and Train 6 is under construction.terminal. The Sabine Pass LNG terminal has operational regasification facilities owned by Cheniere Partners’ wholly owned subsidiary, SPLNG, that include pre-existing infrastructure of 5 LNG storage tanks, 2 marine berths and vaporizers. Cheniere Partners also owns a 94-mile pipeline that interconnects the Sabine Pass LNG terminal with a number of large interstate pipelines owned by Cheniere Partners’ wholly owned(the “Creole Trail Pipeline”) through its subsidiary, CTPL. As of March 31, 2020, we owned 100% of the general partner interest and 48.6% of the limited partner interest in Cheniere Partners.
The Corpus Christi LNG terminal is located near Corpus Christi, Texas and is operated and constructed by our wholly owned subsidiary, CCL. We are currently operating 2 Trains and are constructing 1 additional Train for a total production capacity of approximately 15 mtpa of LNG. We also operate a 23-mile natural gas supply pipeline that interconnects the Corpus Christi LNG terminal with several interstate and intrastate natural gas pipelines (the “Corpus Christi Pipeline” and together with the liquefaction facilities,Trains, the “CCL Project”) through our wholly owned subsidiary, CCP. The CCL Project, is being developed in stages with the first phase being three Trains (“Phase 1”). The first stage includes Trains 1 and 2, twoonce fully constructed, will contain 3 LNG storage tanks one completeand 2 marine berth and a second partial berth and all of the CCL Project’s necessary infrastructure facilities (“Stage 1”). The second stage includes Train 3, one LNG storage tank and the completion of the second partial berth (“Stage 2”). Train 1 is operational, Train 2 is undergoing commissioning and Train 3 is under construction.berths.
Additionally, separate from the CCH Group, we are developing an expansion of the Corpus Christi LNG terminal adjacent to the CCL Project (“Corpus Christi Stage 3”) and filed an application with FERC in June 2018through our subsidiary CCL Stage III, for sevenup to 7 midscale Trains with an expected aggregate nominaltotal production capacity of approximately 9.510 mtpa of LNG. We received approval from FERC in November 2019 to site, construct and one LNG storage tank.operate the expansion project.
We remain focused on expansionoperational excellence and customer satisfaction. Increasing demand of LNG has allowed us to expand our existing sites by leveraging existing infrastructure.liquefaction infrastructure in a financially disciplined manner. We continue to considerhold significant land positions at both the Sabine Pass LNG terminal and the Corpus Christi LNG terminal which provide opportunity for further liquefaction capacity expansion. The development of these sites or other projects, including infrastructure projects in support of natural gas supply and LNG demand, which,will require, among other things, will require acceptable commercial and financing arrangements before we make a final investment decision (“FID”).
Basis of Presentation
The accompanying unaudited Consolidated Financial Statements of Cheniere have been prepared in accordance with GAAP for interim financial information and with Rule 10-01 of Regulation S-X. Accordingly, they do not include all of the information and footnotes required by GAAP for complete financial statements and should be read in conjunction with the Consolidated Financial Statements and accompanying notes included in our annual report on Form 10-K for the year ended December 31, 20182019.. In our opinion, all adjustments, consisting only of normal recurring adjustments necessary for a fair presentation, have been included.
Results of operations for the three and six months ended June 30, 2019March 31, 2020 are not necessarily indicative of the results of operations that will be realized for the year ending December 31, 2019.2020.
Recent Accounting Standards
We adopted ASU 2016-02,In March 2020, the Financial Accounting Standards Board (“FASB”) issued Accounting Standards Update (“ASU”) 2020-04, LeasesReference Rate Reform (Topic 842)848): Facilitation of the Effects of Reference Rate Reform on Financial Reporting,. This guidance primarily provides temporary optional expedients which simplify the accounting for contract modifications to existing debt agreements expected to arise from the market transition from LIBOR to alternative reference rates. The optional expedients were available to be used upon issuance of this guidance but we have not yet applied the guidance because we have not yet modified any of our existing contracts for reference rate reform. Once we apply an optional expedient to a modified contract and adopt this standard, the guidance will be applied to all subsequent amendments thereto (“ASC 842”) on January 1, 2019 usingapplicable contract modifications until December 31, 2022, at which time the optional transition approach to apply the standard at the beginning of the first quarter of 2019 withexpedients are no retrospective adjustments to prior periods. The adoption of the standard resulted in the recognition of right-of-use assets and lease liabilities for operating leases of approximately $550 million on our Consolidated Balance Sheets, with no material impact on our Consolidated Statements of Operations or Consolidated Statements of Cash Flows. We have elected the practical expedients to (1) carryforward prior conclusions related to lease identification and classification for existing leases, (2) combine lease and non-lease components of an arrangement for all classes of leased assets, (3) omit short-term leases with a term of 12 months or less from recognition on the balance sheet and (4) carryforward our existing accounting for land easements not previously accounted for as leases. See Note 11—Leases for additional information on our leases following the adoption of this standard.longer available.
CHENIERE ENERGY, INC. AND SUBSIDIARIES
NOTES TO CONSOLIDATED FINANCIAL STATEMENTS—CONTINUED
(unaudited)
NOTE 2—RESTRICTED CASH
Restricted cash consists of funds that are contractually andor legally restricted as to usage or withdrawal and have been presented separately from cash and cash equivalents on our Consolidated Balance Sheets. As of June 30, 2019March 31, 2020 and December 31, 2018,2019, restricted cash consisted of the following (in millions):
| | | | | June 30, | | December 31, | | March 31, | | December 31, |
| | | 2019 | | 2018 | | 2020 | | 2019 |
| Current restricted cash | | | | | | | | |
| SPL Project | | $ | 596 |
| | $ | 756 |
| | $ | 109 |
| | $ | 181 |
|
| Cheniere Partners and cash held by guarantor subsidiaries | | — |
| | 785 |
| |
| CCL Project | | 279 |
| | 289 |
| | 94 |
| | 80 |
|
| Cash held by our subsidiaries restricted to Cheniere | | 286 |
| | 345 |
| | 227 |
| | 259 |
|
| Total current restricted cash | | $ | 1,161 |
| | $ | 2,175 |
| | $ | 430 |
| | $ | 520 |
|
Pursuant to the accounts agreements entered into with the collateral trustees for the benefit of SPL’s debt holders and CCH’s debt holders, SPL and CCH are required to deposit all cash received into reserve accounts controlled by the collateral trustees. The usage or withdrawal of such cash is restricted to the payment of liabilities related to the SPL Project and the CCL Project (collectively, the “Liquefaction Projects”) and other restricted payments.
In May 2019, Cheniere Partners entered into the $1.5 billion credit facilities (the “2019 CQP Credit Facilities”), which replaced the previous $2.8 billion credit facilities (the “2016 CQP Credit Facilities”). The cash held by Cheniere Partners and its guarantor subsidiaries was restricted in use under the terms of the 2016 CQP Credit Facilities and the related depositary agreement governing the extension of credit to Cheniere Partners, but is no longer restricted under the 2019 CQP Credit Facilities.
NOTE 3—ACCOUNTS AND OTHER RECEIVABLES
As of June 30, 2019March 31, 2020 and December 31, 2018,2019, accounts and other receivables consisted of the following (in millions):
| | | | | June 30, | | December 31, | | March 31, | | December 31, |
| | | 2019 | | 2018 | | 2020 | | 2019 |
| Trade receivables | | | | | | | | |
| SPL and CCL | | $ | 257 |
| | $ | 330 |
| | $ | 304 |
| | $ | 328 |
|
| Cheniere Marketing | | 145 |
| | 205 |
| | 88 |
| | 113 |
|
| Other accounts receivable | | 31 |
| | 50 |
| | 76 |
| | 50 |
|
| Total accounts and other receivables | | $ | 433 |
| | $ | 585 |
| | $ | 468 |
| | $ | 491 |
|
NOTE 4—INVENTORY
As of June 30, 2019March 31, 2020 and December 31, 2018,2019, inventory consisted of the following (in millions):
| | | | | June 30, | | December 31, | | March 31, | | December 31, |
| | | 2019 | | 2018 | | 2020 | | 2019 |
| Natural gas | | $ | 19 |
| | $ | 30 |
| | $ | 13 |
| | $ | 16 |
|
| LNG | | 38 |
| | 24 |
| | 35 |
| | 67 |
|
| LNG in-transit | | 104 |
| | 173 |
| | 48 |
| | 93 |
|
| Materials and other | | 129 |
| | 89 |
| | 143 |
| | 136 |
|
| Total inventory | | $ | 290 |
| | $ | 316 |
| | $ | 239 |
| | $ | 312 |
|
CHENIERE ENERGY, INC. AND SUBSIDIARIES
NOTES TO CONSOLIDATED FINANCIAL STATEMENTS—CONTINUED
(unaudited)
NOTE 5—PROPERTY, PLANT AND EQUIPMENT
As of June 30, 2019March 31, 2020 and December 31, 2018,2019, property, plant and equipment, net consisted of the following (in millions):
| | | | | June 30, | | December 31, | | March 31, | | December 31, |
| | | 2019 | | 2018 | | 2020 | | 2019 |
| LNG terminal costs | | | | | | | | |
| LNG terminal and interconnecting pipeline facilities | | $ | 23,650 |
| | $ | 13,386 |
| | $ | 27,330 |
| | $ | 27,305 |
|
| LNG site and related costs | | 319 |
| | 86 |
| | 322 |
| | 322 |
|
| LNG terminal construction-in-process | | 6,529 |
| | 14,864 |
| | 4,233 |
| | 3,903 |
|
| Accumulated depreciation | | (1,625 | ) | | (1,299 | ) | | (2,272 | ) | | (2,049 | ) |
| Total LNG terminal costs, net | | 28,873 |
| | 27,037 |
| | 29,613 |
| | 29,481 |
|
| Fixed assets and other | | |
| | |
| | |
| | |
|
| Computer and office equipment | | 22 |
| | 17 |
| | 23 |
| | 23 |
|
| Furniture and fixtures | | 22 |
| | 22 |
| | 22 |
| | 22 |
|
| Computer software | | 104 |
| | 100 |
| | 112 |
| | 110 |
|
| Leasehold improvements | | 42 |
| | 41 |
| | 43 |
| | 42 |
|
| Land | | 59 |
| | 59 |
| | 59 |
| | 59 |
|
| Other | | 20 |
| | 21 |
| | 24 |
| | 21 |
|
| Accumulated depreciation | | (127 | ) | | (111 | ) | | (149 | ) | | (141 | ) |
| Total fixed assets and other, net | | 142 |
| | 149 |
| | 134 |
| | 136 |
|
| Assets under finance lease | | | | | | | | |
| Tug vessels | | 60 |
| | 60 |
| | 60 |
| | 60 |
|
| Accumulated depreciation | | (2 | ) | | (1 | ) | | (5 | ) | | (4 | ) |
| Total assets under finance lease, net | | 58 |
| | 59 |
| | 55 |
| | 56 |
|
| Property, plant and equipment, net | | $ | 29,073 |
| | $ | 27,245 |
| | $ | 29,802 |
| | $ | 29,673 |
|
Depreciation expense was $203$232 million and $111$143 million during the three months ended June 30,March 31, 2020 and 2019, and 2018, respectively, and $346 million and $219 million during the six months ended June 30, 2019 and 2018, respectively.
We realizerealized offsets to LNG terminal costs for salesof $202 million during the three months ended March 31, 2019 that were related to the sale of commissioning cargoes thatbecause these amounts were earned or loaded prior to the start of commercial operations of the respective TrainTrains of the Liquefaction Projects, during the testing phase for its construction. We realized offsets to LNG terminal costs of $202 million during the six months ended June 30, 2019 for sales of commissioning cargoes from the Liquefaction Projects. We did not0t realize any offsets to LNG terminal costs during the three months ended June 30, 2019 and the three and six months ended June 30, 2018.March 31, 2020.
NOTE 6—DERIVATIVE INSTRUMENTS
We have entered into the following derivative instruments that are reported at fair value:
interest rate swaps (“CCH Interest Rate Derivatives”) to hedge the exposure to volatility in a portion of the floating-rate interest payments underon CCH’s amended and restated credit facilities (“CCH Interest Rate Derivatives”facility (the “CCH Credit Facility”) and to hedge against changes in interest rates that could impact anticipated future issuance of debt by CCH, which is anticipated by the end of 2020 (“CCH Interest Rate Forward Start Derivatives” and, collectively with the CCH Interest Rate Derivatives, the “Interest Rate Derivatives”);
commodity derivatives consisting of natural gas supply contracts for the commissioning and operation of the SPL Project, CCL ProjectLiquefaction Projects and potential future development of Corpus Christi Stage 3 (“Physical Liquefaction Supply Derivatives”) and associated economic hedges (collectively, the “Liquefaction Supply Derivatives”);
financial derivatives to hedge the exposure to the commodity markets in which we have contractual arrangements to purchase or sell physical LNG (“LNG Trading Derivatives”); and
foreign currency exchange (“FX”) contracts to hedge exposure to currency risk associated with both LNG Trading Derivatives and operations in countries outside of the United States (“FX Derivatives”).
We recognize our derivative instruments as either assets or liabilities and measure those instruments at fair value. None of our derivative instruments are designated as cash flow or fair value hedging instruments, and changes in fair value are recorded within our Consolidated Statements of Operations to the extent not utilized for the commissioning process.
CHENIERE ENERGY, INC. AND SUBSIDIARIES
NOTES TO CONSOLIDATED FINANCIAL STATEMENTS—CONTINUED
(unaudited)
The following table shows the fair value of our derivative instruments that are required to be measured at fair value on a recurring basis as of June 30, 2019March 31, 2020 and December 31, 2018,2019, which are classified as derivative assets, non-current derivative assets, derivative liabilities or non-current derivative liabilities in our Consolidated Balance Sheets (in millions):
| | | | Fair Value Measurements as of | Fair Value Measurements as of |
| | June 30, 2019 | | December 31, 2018 | March 31, 2020 | | December 31, 2019 |
| | Quoted Prices in Active Markets
(Level 1) | | Significant Other Observable Inputs
(Level 2) | | Significant Unobservable Inputs
(Level 3) | | Total | | Quoted Prices in Active Markets
(Level 1) | | Significant Other Observable Inputs
(Level 2) | | Significant Unobservable Inputs
(Level 3) | | Total | Quoted Prices in Active Markets
(Level 1) | | Significant Other Observable Inputs
(Level 2) | | Significant Unobservable Inputs
(Level 3) | | Total | | Quoted Prices in Active Markets
(Level 1) | | Significant Other Observable Inputs
(Level 2) | | Significant Unobservable Inputs
(Level 3) | | Total |
| CCH Interest Rate Derivatives asset (liability) | $ | — |
| | $ | (88 | ) | | $ | — |
| | $ | (88 | ) | | $ | — |
| | $ | 18 |
| | $ | — |
| | $ | 18 |
| |
| CCH Interest Rate Derivatives liability | | $ | — |
| | $ | (197 | ) | | $ | — |
| | $ | (197 | ) | | $ | — |
| | $ | (81 | ) | | $ | — |
| | $ | (81 | ) |
| CCH Interest Rate Forward Start Derivatives liability | — |
| | (7 | ) | | — |
| | (7 | ) | | — |
| | — |
| | — |
| | — |
| — |
| | (92 | ) | | — |
| | (92 | ) | | — |
| | (8 | ) | | — |
| | (8 | ) |
| Liquefaction Supply Derivatives asset (liability) | — |
| | 1 |
| | 89 |
| | 90 |
| | 6 |
| | (19 | ) | | (29 | ) | | (42 | ) | |
| Liquefaction Supply Derivatives asset | | 1 |
| | 3 |
| | 674 |
| | 678 |
| | 5 |
| | 6 |
| | 138 |
| | 149 |
|
| LNG Trading Derivatives asset (liability) | (4 | ) | | 51 |
| | — |
| | 47 |
| | 1 |
| | (25 | ) | | — |
| | (24 | ) | (3 | ) | | 188 |
| | — |
| | 185 |
| | — |
| | 165 |
| | — |
| | 165 |
|
| FX Derivatives asset | — |
| | 10 |
| | — |
| | 10 |
| | — |
| | 15 |
| | — |
| | 15 |
| — |
| | 23 |
| | — |
| | 23 |
| | — |
| | 4 |
| | — |
| | 4 |
|
We value our CCH Interest Rate Derivatives and CCH Interest Rate Forward Start Derivatives using an income-based approach utilizing observable inputs to the valuation model including interest rate curves, risk adjusted discount rates, credit spreads and other relevant data. We value our LNG Trading Derivatives and our Liquefaction Supply Derivatives using a market or option-based approach incorporating present value techniques, as needed, using observable commodity price curves, when available, and other relevant data. We value our FX Derivatives with a market approach using observable FX rates and other relevant data.
The fair value of our Physical Liquefaction Supply Derivatives is predominantly driven by observable and unobservable market commodity prices and, as applicable to our natural gas supply contracts, our assessment of the associated conditions precedent,events deriving fair value, including evaluating whether the respective market is available as pipeline infrastructure is developed. The fair value of our Physical Liquefaction Supply Derivatives incorporates risk premiums related to the satisfaction of conditions precedent, such as completion and placement into service of relevant pipeline infrastructure to accommodate marketable physical gas flow. As of June 30, 2019March 31, 2020 and December 31, 2018,2019, some of our Physical Liquefaction Supply Derivatives existed within markets for which the pipeline infrastructure was under development to accommodate marketable physical gas flow.
We include a portion of our Physical Liquefaction Supply Derivatives as Level 3 within the valuation hierarchy as the fair value is developed through the use of internal models which incorporate significant unobservable inputs. In instances where observable data is unavailable, consideration is given to the assumptions that market participants would use in valuing the asset or liability. This includes assumptions about market risks, such as future prices of energy units for unobservable periods, liquidity, volatility and contract duration. In determining and recording fair value, we do not use third party sources that derive price based on proprietary models or market surveys.
The Level 3 fair value measurements of natural gas positions within our Physical Liquefaction Supply Derivatives could be materially impacted by a significant change in certain natural gas and international LNG prices. The following table includes quantitative information for the unobservable inputs for our Level 3 Physical Liquefaction Supply Derivatives as of June 30, 2019:March 31, 2020:
|
| | | | | | | | |
| | | Net Fair Value Asset (Liability) (in millions) | | Valuation Approach | | Significant Unobservable Input | | Range of Significant Unobservable Inputs Range/ Weighted Average (1) |
| Physical Liquefaction Supply Derivatives | | $89674 | | Market approach incorporating present value techniques | | Henry Hub Basis Spreadbasis spread | | $(0.700)(0.619) - $0.056$0.054 / (0.027) |
| | | | | Option pricing model | | International LNG pricing spread, relative to Henry Hub (1)(2) | | 128%48% - 176%154% / 117% |
(1) Unobservable inputs were weighted by the relative fair value of the instruments.
(2) Spread contemplates U.S. dollar-denominated pricing.
CHENIERE ENERGY, INC. AND SUBSIDIARIES
NOTES TO CONSOLIDATED FINANCIAL STATEMENTS—CONTINUED
(unaudited)
Increases or decreases in basis or pricing spreads, in isolation, would decrease or increase, respectively, the fair value of our Physical Liquefaction Supply Derivatives.
The following table shows the changes in the fair value of our Level 3 Physical Liquefaction Supply Derivatives during the three and six months ended June 30,March 31, 2020 and 2019 and 2018 (in millions):
| | | | | Three Months Ended June 30, | | Six Months Ended June 30, | | Three Months Ended March 31, |
| | | 2019 | | 2018 | | 2019 | | 2018 | | 2020 | | 2019 |
| Balance, beginning of period | | $ | 31 |
| | $ | 10 |
| | $ | (29 | ) | | $ | 43 |
| | $ | 138 |
| | $ | (29 | ) |
| Realized and mark-to-market gains (losses): | | | | | | | | | |
| Realized and mark-to-market gains: | | | | | |
| Included in cost of sales | | 7 |
| | (1 | ) | | 23 |
| | (12 | ) | | 534 |
| | 12 |
|
| Purchases and settlements: | | | | | | | | | | | | |
| Purchases | | 50 |
| | 6 |
| | 50 |
| | 6 |
| | 1 |
| | 1 |
|
| Settlements | | 1 |
| | (4 | ) | | 45 |
| | (25 | ) | | — |
| | 47 |
|
| Transfers out of Level 3 (1) | | — |
| | 1 |
| | — |
| | — |
| | 1 |
| | — |
|
| Balance, end of period | | $ | 89 |
| | $ | 12 |
| | $ | 89 |
| | $ | 12 |
| | $ | 674 |
| | $ | 31 |
|
| Change in unrealized gains (losses) relating to instruments still held at end of period | | $ | 7 |
| | $ | (1 | ) | | $ | 23 |
| | $ | (12 | ) | |
| Change in unrealized gains relating to instruments still held at end of period | | | $ | 534 |
| | $ | 12 |
|
(1) Transferred to Level 2 as a result of observable market for the underlying natural gas purchase agreements.
Derivative assets and liabilities arising from our derivative contracts with the same counterparty are reported on a net basis, as all counterparty derivative contracts provide for the unconditional right of set-off in the event of default. The use of derivative instruments exposes us to counterparty credit risk, or the risk that a counterparty will be unable to meet its commitments in instances when our derivative instruments are in an asset position. Additionally, counterparties are at risk that we will be unable to meet our commitments in instances where our derivative instruments are in a liability position. We incorporate both our own nonperformance risk and the respective counterparty’s nonperformance risk in fair value measurements. In adjusting the fair value of our derivative contracts for the effect of nonperformance risk, we have considered the impact of netting and any applicable credit enhancements, such as collateral postings, set-off rights and guarantees.
Interest Rate Derivatives
During the six months ended June 30, 2019, there were no changes to the terms of the CCH Interest Rate Derivatives entered into by CCH to protect against volatility of future cash flows and hedge a portion of the variable interest payments on its credit facility (the “CCH Credit Facility”).
In June 2019, we entered into the CCH Interest Rate Forward Start Derivatives to hedge against changes in interest rates that could impact anticipated future issuance of debt by CCH, which is anticipated by the end of 2020.
Cheniere Partners previously had interest rate swaps (“CQP Interest Rate Derivatives” and, collectively with the CCH Interest Rate Derivatives and the CCH Interest Rate Forward Start Derivatives, the “Interest Rate Derivatives”) to hedge a portion of the variable interest payments on its credit facilities, which were terminated in October 2018.
As of June 30, 2019,March 31, 2020, we had the following Interest Rate Derivatives outstanding:
|
| | | | | | | | | | | | |
| | | Initial Notional AmountAmounts | | Maximum Notional Amount | | | | | | |
| | March 31, 2020 | | December 31, 2019 | | Effective Date | | Maturity Date | | Weighted Average Fixed Interest Rate Paid | | Variable Interest Rate Received |
| CCH Interest Rate Derivatives | | $29 million4.7 billion | | $4.74.5 billion | | May 20, 2015 | | May 31, 2022 | | 2.30% | | One-month LIBOR |
| CCH Interest Rate Forward Start Derivatives | | $1.0 billion750 million | | $1.0 billion750 million | | JuneSeptember 30, 2020
| | September 30,December 31, 2030
| | 2.11%2.06% | | Three-month LIBOR |
CHENIERE ENERGY, INC. AND SUBSIDIARIES
NOTES TO CONSOLIDATED FINANCIAL STATEMENTS—CONTINUED
(unaudited)
The following table shows the fair value and location of the Interest Rate Derivatives on our Consolidated Balance Sheets (in millions):
| | | | June 30, 2019 | | December 31, 2018 | March 31, 2020 | | December 31, 2019 |
| | CCH Interest Rate Derivatives | | CCH Interest Rate Forward Start Derivatives | | Total | | CCH Interest Rate Derivatives | | CCH Interest Rate Forward Start Derivatives | | Total | CCH Interest Rate Derivatives | | CCH Interest Rate Forward Start Derivatives | | Total | | CCH Interest Rate Derivatives | | CCH Interest Rate Forward Start Derivatives | | Total |
| Consolidated Balance Sheet Location | | | | | | | | | | | | | | | | | | | | | | |
| Derivative assets | $ | — |
| | $ | — |
| | $ | — |
| | $ | 10 |
| | $ | — |
| | $ | 10 |
| |
| Non-current derivative assets | — |
| | — |
| | — |
| | 8 |
| | — |
| | 8 |
| |
| Total derivative assets | — |
|
| — |
|
| — |
|
| 18 |
|
| — |
|
| 18 |
| |
| | | | | |
|
| | | | | |
|
| |
| Derivative liabilities | (21 | ) | | — |
| | (21 | ) | | — |
| | — |
| | — |
| $ | (92 | ) | | $ | (92 | ) | | $ | (184 | ) | | $ | (32 | ) | | $ | (8 | ) | | $ | (40 | ) |
| Non-current derivative liabilities | (67 | ) | | (7 | ) | | (74 | ) | | — |
| | — |
| | — |
| (105 | ) | | — |
| | (105 | ) | | (49 | ) | | — |
| | (49 | ) |
| Total derivative liabilities | (88 | ) |
| (7 | ) |
| (95 | ) |
| — |
|
| — |
|
| — |
| $ | (197 | ) |
| $ | (92 | ) |
| $ | (289 | ) |
| $ | (81 | ) |
| $ | (8 | ) |
| $ | (89 | ) |
| | | | | |
|
| | | | | |
|
| |
| Derivative asset (liability), net | $ | (88 | ) |
| $ | (7 | ) |
| $ | (95 | ) |
| $ | 18 |
|
| $ | — |
|
| $ | 18 |
| |
CHENIERE ENERGY, INC. AND SUBSIDIARIES
NOTES TO CONSOLIDATED FINANCIAL STATEMENTS—CONTINUED
(unaudited)
The following table shows the changes in the fair value and settlements of our Interest Rate Derivatives recorded in interest rate derivative gain (loss),loss, net on our Consolidated Statements of Operations during the three and six months ended June 30,March 31, 2020 and 2019 and 2018 (in millions):
|
| | | | | | | | | | | | | | | | |
| | | Three Months Ended June 30, | | Six Months Ended June 30, |
| | | 2019 | | 2018 | | 2019 | | 2018 |
| CCH Interest Rate Derivatives gain (loss) | | $ | (67 | ) | | $ | 29 |
| | $ | (102 | ) | | $ | 98 |
|
| CCH Interest Rate Forward Start Derivatives loss | | (7 | ) | | — |
| | (7 | ) | | — |
|
| CQP Interest Rate Derivatives gain | | — |
| | 3 |
| | — |
| | 11 |
|
|
| | | | | | | | |
| | | Three Months Ended March 31, |
| | | 2020 | | 2019 |
| CCH Interest Rate Derivatives loss | | $ | (123 | ) | | $ | (35 | ) |
| CCH Interest Rate Forward Start Derivatives loss | | (85 | ) | | — |
|
Commodity Derivatives
SPL, CCL and CCL Stage III have entered into physical natural gas supply contracts and associated economic hedges to purchase natural gas for the commissioning and operation of the SPL Project, the CCL ProjectLiquefaction Projects and potential future development of Corpus Christi Stage 3, respectively, which are primarily indexed to the natural gas market and international LNG indices. The remaining terms of the index-based physical natural gas supply contracts range up to approximately 15 years, some of which commence upon the satisfaction of certain conditions precedent.events or states of affairs.
We have entered into, and may from time to time enter into, financial LNG Trading Derivatives in the form of swaps, forwards, options or futures to economically hedge exposure to the commodity markets in which we have contractual arrangements to purchase or sell physical LNG. We have entered into LNG Trading Derivatives to secure a fixed price position to minimize future cash flow variability associated with LNG purchase and sale transactions.
CHENIERE ENERGY, INC. AND SUBSIDIARIES
NOTES TO CONSOLIDATED FINANCIAL STATEMENTS—CONTINUED
(unaudited)
The following table shows the fair value and location of our Liquefaction Supply Derivatives and LNG Trading Derivatives (collectively, “Commodity Derivatives”) on our Consolidated Balance Sheets (in millions, except notional amount):
| | | | June 30, 2019 | | December 31, 2018 | March 31, 2020 | | December 31, 2019 |
| | Liquefaction Supply Derivatives (1) | | LNG Trading Derivatives (2) | | Total | | Liquefaction Supply Derivatives (1) | | LNG Trading Derivatives (2) | | Total | Liquefaction Supply Derivatives (1) | | LNG Trading Derivatives (2) | | Total | | Liquefaction Supply Derivatives (1) | | LNG Trading Derivatives (2) | | Total |
| Consolidated Balance Sheet Location | | | | | | | | | | | | | | | | | | | | | | |
| Derivative assets | $ | 24 |
| | $ | 92 |
| | $ | 116 |
| | $ | 13 |
| | $ | 24 |
| | $ | 37 |
| $ | 113 |
| | $ | 190 |
| | $ | 303 |
| | $ | 93 |
| | $ | 225 |
| | $ | 318 |
|
| Non-current derivative assets | 94 |
| | 9 |
| | 103 |
| | 46 |
| | — |
| | 46 |
| 665 |
| | 35 |
| | 700 |
| | 174 |
| | — |
| | 174 |
|
| Total derivative assets | 118 |
| | 101 |
| | 219 |
| | 59 |
| | 24 |
| | 83 |
| 778 |
| | 225 |
| | 1,003 |
| | 267 |
| | 225 |
| | 492 |
|
| | | | | | | | | | | | | | | | | | | | | | | |
| Derivative liabilities | (13 | ) | | (50 | ) | | (63 | ) | | (79 | ) | | (48 | ) | | (127 | ) | (19 | ) | | (40 | ) | | (59 | ) | | (16 | ) | | (60 | ) | | (76 | ) |
| Non-current derivative liabilities | (15 | ) | | (4 | ) | | (19 | ) | | (22 | ) | | — |
| | (22 | ) | (81 | ) | | — |
| | (81 | ) | | (102 | ) | | — |
| | (102 | ) |
| Total derivative liabilities | (28 | ) | | (54 | ) | | (82 | ) | | (101 | ) | | (48 | ) | | (149 | ) | (100 | ) | | (40 | ) | | (140 | ) | | (118 | ) | | (60 | ) | | (178 | ) |
| | | | | | | | | | | | | | | | | | | | | | | |
| Derivative asset (liability), net | $ | 90 |
| | $ | 47 |
| | $ | 137 |
| | $ | (42 | ) | | $ | (24 | ) | | $ | (66 | ) | |
| Derivative asset, net | | $ | 678 |
| | $ | 185 |
| | $ | 863 |
| | $ | 149 |
| | $ | 165 |
| | $ | 314 |
|
| | | | | | | | | | | | | | | | | | | | | | | |
| Notional amount, net (in TBtu) (3) | 6,781 |
| | 50 |
| | | | 5,832 |
| | 12 |
| | | 10,988 |
| | 22 |
| | | | 9,177 |
| | 4 |
| | |
| |
| (1) | Does not include collateral callsposted with counterparties by us of $6$11 million and $5$7 million for such contracts, which are included in other current assets in our Consolidated Balance Sheets as of June 30, 2019March 31, 2020 and December 31, 2018,2019, respectively. Includes derivative assets of $2 million and $2 million and non-current assets of $1$4 million and $3 million as of June 30, 2019March 31, 2020 and December 31, 2018,2019, respectively, and non-current assets of $2 million as of both March 31, 2020 and December 31, 2019 for a natural gas supply contractcontracts that SPL and CCL hashave with a related party.parties. |
| |
| (2) | Does not include collateral posted with counterparties by us of $15$11 million and $9$5 million deposited for such contracts, which are included in other current assets in our Consolidated Balance Sheets as of June 30, 2019March 31, 2020 and December 31, 2018,2019, respectively. |
| |
| (3) | SPL had secured up to approximately 3,437Includes 198 TBtu and 3,464120 TBtu as of June 30, 2019March 31, 2020 and December 31, 2018, respectively. CCL had secured up to approximately 2,787 TBtu and 2,801 TBtu of natural gas feedstock through2019, respectively, for natural gas supply contracts as of June 30, 2019that SPL and December 31, 2018, respectively, of which 57 TBtu and 55 TBtu, respectively, were for a natural gas supply contract CCL hashave with a related party. Corpus Christi Stage 3 had secured up to approximately 754 TBtu of natural gas feedstock through natural gas supply contracts as of June 30, 2019.parties. |
CHENIERE ENERGY, INC. AND SUBSIDIARIES
NOTES TO CONSOLIDATED FINANCIAL STATEMENTS—CONTINUED
(unaudited)
The following table shows the changes in the fair value, settlements and location of our Commodity Derivatives recorded on our Consolidated Statements of Operations during the three and six months ended June 30,March 31, 2020 and 2019 and 2018 (in millions):
| | | | Consolidated Statements of Operations Location (1) | | Three Months Ended June 30, | | Six Months Ended June 30, | Consolidated Statements of Operations Location (1) | | Three Months Ended March 31, |
| | | 2019 | | 2018 | | 2019 | | 2018 | | 2020 | | 2019 |
| LNG Trading Derivatives gain (loss) | LNG revenues | | $ | 94 |
| | $ | (76 | ) | | $ | 158 |
| | $ | (70 | ) | |
| LNG Trading Derivatives gain | | LNG revenues | | $ | 140 |
| | $ | 64 |
|
| LNG Trading Derivatives loss | Cost of sales | | (51 | ) | | — |
| | (51 | ) | | — |
| Cost of sales | | (34 | ) | | — |
|
| Liquefaction Supply Derivatives gain (loss) (2) | LNG revenues | | (1 | ) | | — |
| | 1 |
| | — |
| LNG revenues | | (1 | ) | | 2 |
|
| Liquefaction Supply Derivatives gain (loss) (2)(3) | Cost of sales | | 57 |
| | (3 | ) | | 139 |
| | (53 | ) | |
| Liquefaction Supply Derivatives gain (2)(3) | | Cost of sales | | 537 |
| | 82 |
|
| |
| (1) | Fair value fluctuations associated with commodity derivative activities are classified and presented consistently with the item economically hedged and the nature and intent of the derivative instrument. |
| |
| (2) | Does not include the realized value associated with derivative instruments that settle through physical delivery. |
| |
| (3) | Includes $24CCL recorded $23 million and $36$10 million that CCL recorded in cost of sales under a natural gas supply contract with a related party during the three and six months ended June 30,March 31, 2020 and 2019, respectively, including $1 million of Liquefaction Supply Derivatives gain and $2 million of Liquefaction Supply Derivatives loss, respectively. Of this amount, $4As of March 31, 2020 and December 31, 2019, $7 million wasand $3 million, respectively, were included in accrued liabilities as of June 30, 2019. CCL did not have any transactions during the three and six months ended June 30, 2018 underrelated to this contract. |
CHENIERE ENERGY, INC. AND SUBSIDIARIES
NOTES TO CONSOLIDATED FINANCIAL STATEMENTS—CONTINUED
(unaudited)
FX Derivatives
Cheniere Marketing has entered into FX Derivatives to protect against the volatility in future cash flows attributable to changes in international currency exchange rates. The FX Derivatives economically hedge the foreign currency exposure arising from cash flows expended for both physical and financial LNG transactions.
The following table shows the fair value and location of our FX Derivatives on our Consolidated Balance Sheets (in millions):
| | | | | Fair Value Measurements as of | | Fair Value Measurements as of |
| | Consolidated Balance Sheet Location | | June 30, 2019 | | December 31, 2018 | Consolidated Balance Sheet Location | | March 31, 2020 | | December 31, 2019 |
| FX Derivatives | Derivative assets | | $ | 11 |
| | $ | 16 |
| Derivative assets | | $ | 19 |
| | $ | 5 |
|
| FX Derivatives | Derivative liabilities | | — |
| | (1 | ) | Non-current derivative assets | | 5 |
| | — |
|
| FX Derivatives | Non-current derivative liabilities | | (1 | ) | | — |
| Derivative liabilities | | (1 | ) | | (1 | ) |
The total notional amount of our FX Derivatives was $942$496 million and $379$827 million as of June 30, 2019March 31, 2020 and December 31, 2018,2019, respectively.
The following table shows the changes in the fair value, settlements and location of our FX Derivatives recorded on our Consolidated Statements of Operations during the three and six months ended June 30,March 31, 2020 and 2019 and 2018 (in millions):
|
| | | | | | | | | | | | | | | | | |
| | | | Three Months Ended June 30, | | Six Months Ended June 30, |
| | Consolidated Statements of Operations Location | | 2019 | | 2018 | | 2019 | | 2018 |
| FX Derivatives gain | LNG revenues | | $ | — |
| | $ | 12 |
| | $ | 9 |
| | $ | 10 |
|
|
| | | | | | | | | |
| | | | Three Months Ended March 31, |
| | Consolidated Statements of Operations Location | | 2020 | | 2019 |
| FX Derivatives gain | LNG revenues | | $ | 25 |
| | $ | 9 |
|
CHENIERE ENERGY, INC. AND SUBSIDIARIES
NOTES TO CONSOLIDATED FINANCIAL STATEMENTS—CONTINUED
(unaudited)
Consolidated Balance Sheet Presentation
Our derivative instruments are presented on a net basis on our Consolidated Balance Sheets as described above. The following table shows the fair value of our derivatives outstanding on a gross and net basis (in millions):
| | | | | Gross Amounts Recognized | | Gross Amounts Offset in the Consolidated Balance Sheets | | Net Amounts Presented in the Consolidated Balance Sheets | | Gross Amounts Recognized | | Gross Amounts Offset in the Consolidated Balance Sheets | | Net Amounts Presented in the Consolidated Balance Sheets |
| Offsetting Derivative Assets (Liabilities) | | |
| As of June 30, 2019 | | | | | | | |
| As of March 31, 2020 | | | | | | | |
| CCH Interest Rate Derivatives | | $ | (88 | ) | | $ | — |
| | $ | (88 | ) | | $ | (197 | ) | | $ | — |
| | $ | (197 | ) |
| CCH Interest Rate Forward Start Derivatives | | (7 | ) | | — |
| | (7 | ) | | (92 | ) | | — |
| | (92 | ) |
| Liquefaction Supply Derivatives | | 121 |
| | (3 | ) | | 118 |
| | 796 |
| | (18 | ) | | 778 |
|
| Liquefaction Supply Derivatives | | (35 | ) | | 7 |
| | (28 | ) | | (104 | ) | | 4 |
| | (100 | ) |
| LNG Trading Derivatives | | 109 |
| | (8 | ) | | 101 |
| | 225 |
| | — |
| | 225 |
|
| LNG Trading Derivatives | | (62 | ) | | 8 |
| | (54 | ) | | (47 | ) | | 7 |
| | (40 | ) |
| FX Derivatives | | 21 |
| | (10 | ) | | 11 |
| | 27 |
| | (3 | ) | | 24 |
|
| FX Derivatives | | (11 | ) | | 10 |
| | (1 | ) | | (1 | ) | | — |
| | (1 | ) |
| As of December 31, 2018 | | | | | |
|
| |
| As of December 31, 2019 | | | | | | |
|
|
| CCH Interest Rate Derivatives | | $ | 19 |
| | $ | (1 | ) | | $ | 18 |
| | $ | (81 | ) | | $ | — |
| | $ | (81 | ) |
| CCH Interest Rate Forward Start Derivatives | | | (8 | ) | | — |
| | (8 | ) |
| Liquefaction Supply Derivatives | | 95 |
| | (36 | ) | | 59 |
| | 281 |
| | (14 | ) | | 267 |
|
| Liquefaction Supply Derivatives | | (121 | ) | | 20 |
| | (101 | ) | | (126 | ) | | 8 |
| | (118 | ) |
| LNG Trading Derivatives | | 112 |
| | (88 | ) | | 24 |
| | 229 |
| | (4 | ) | | 225 |
|
| LNG Trading Derivatives | | (92 | ) | | 44 |
| | (48 | ) | | (60 | ) | | — |
| | (60 | ) |
| FX Derivatives | | 30 |
| | (14 | ) | | 16 |
| | 9 |
| | (4 | ) | | 5 |
|
| FX Derivatives | | (2 | ) | | 1 |
| | (1 | ) | | (6 | ) | | 5 |
| | (1 | ) |
CHENIERE ENERGY, INC. AND SUBSIDIARIES
NOTES TO CONSOLIDATED FINANCIAL STATEMENTS—CONTINUED
(unaudited)
NOTE 7—OTHER NON-CURRENT ASSETS
As of June 30, 2019March 31, 2020 and December 31, 2018,2019, other non-current assets, net consisted of the following (in millions):
| | | | | June 30, | | December 31, | | March 31, | | December 31, |
| | | 2019 | | 2018 | | 2020 | | 2019 |
| Advances made to municipalities for water system enhancements | | $ | 89 |
| | $ | 90 |
| | $ | 86 |
| | $ | 87 |
|
| Advances and other asset conveyances to third parties to support LNG terminals | | 55 |
| | 54 |
| | 60 |
| | 55 |
|
| Advances made under EPC and non-EPC contracts | | | 7 |
| | 29 |
|
| Equity method investments | | | 197 |
| | 108 |
|
| Debt issuance costs and debt discount, net | | | 48 |
| | 45 |
|
| Tax-related payments and receivables | | 21 |
| | 21 |
| | 20 |
| | 20 |
|
| Equity method investments | | 124 |
| | 94 |
| |
| Advances made under EPC and non-EPC contracts | | 11 |
| | 14 |
| |
| Other | | 37 |
| | 32 |
| | 58 |
| | 44 |
|
| Total other non-current assets, net | | $ | 337 |
| | $ | 305 |
| | $ | 476 |
| | $ | 388 |
|
Equity Method Investments
Our equity method investments consist of interests in privately-held companies. In 2017, we acquired an equity interest in Midship Holdings, LLC (“Midship Holdings”), which manages the business and affairs of Midship Pipeline Company, LLC (“Midship Pipeline”). Midship Pipeline is currently constructing an approximately 200-mile natural gas pipeline project (the “Midship Project”) that connects production in the Anadarko Basin to Gulf Coast markets. Construction of the Midship Project commenced in the first quarter of 2019.
Subsequent to Midship Project obtaining its financing in the form of credit facilities, in conjunction with existing equity, Midship Holdings is able to finance its current activities without additional subordinated financial support. As a result of the total equity investment at risk being sufficient to finance its activities, Midship Holdings is no longer a variable interest entity. We continue to report Midship Holdings, which we account for as an equity method
investment dueinvestment. See Note 8—Other Non-Current Assets of our Notes to Consolidated Financial Statements in our ability to exercise significant influence overannual report on Form 10-K for the operating and financial policies of Midship Holdings through our non-controlling voting rights on its board of managers. year ended December 31, 2019 for further information.
Our investment in Midship Holdings, net of impairment losses, was $117$195 million and $85$105 million at June 30, 2019March 31, 2020 and December 31, 2018,2019, respectively.
Cheniere LNG O&M Services, LLC (“O&M Services”), our wholly owned subsidiary provides the development, construction, operation and maintenance services associated with the Midship Project pursuant to agreements in which O&M Services receives an agreed upon fee and reimbursement of costs incurred. O&M Services recorded $3 million in each of the three months ended June 30, 2019 and 2018 and $7 million and $4 million in the sixthree months ended June 30,March 31, 2020 and 2019, and 2018, respectively, of other revenues and $2 million and $4$3 million of accounts
CHENIERE ENERGY, INC. AND SUBSIDIARIES
NOTES TO CONSOLIDATED FINANCIAL STATEMENTS—CONTINUED
(unaudited)
receivable as of June 30, 2019March 31, 2020 and December 31, 2018,2019, respectively, for services provided to Midship Pipeline under these agreements. CCL has entered into a transportation precedent agreement and a negotiated rate agreement with Midship Pipeline to secure firm pipeline transportation capacity for a period of 10 years following commencement of the Midship Project. In May 2018,March 2020, CCH and CCL issuedentered into a letter of credit toguaranty agreement whereby CCH absolutely and irrevocably guarantees CCL’s obligation under the transportation precedent agreement with Midship Pipeline for drawings up to an aggregate maximum amount of $16 million. Midship Pipeline had not made any drawings on this letter of credit as of June 30, 2019.Pipeline.
NOTE 8—NON-CONTROLLING INTEREST AND VARIABLE INTEREST ENTITY
We own a 48.6% limited partner interest in Cheniere Partners in the form of 104.5 million common units and 135.4 million subordinated units, with the remaining non-controlling interest held by Blackstone CQP Holdco LP (“Blackstone CQP Holdco”) and the public. We also own 100% of the general partner interest and the incentive distribution rights in Cheniere Partners. Cheniere Partners is accounted for as a consolidated variable interest entity. See Note 10—9—Non-Controlling Interest and Variable Interest EntitiesEntity of our Notes to Consolidated Financial Statements in our annual report on Form 10-K for the year ended December 31, 20182019 for further information. The following table presents the summarized assets and liabilities (in millions) of Cheniere Partners, our consolidated VIE, which are included in our Consolidated Balance Sheets. The assets in the table below may only be used to settle obligations of Cheniere Partners. In addition, there is no recourse to us for the consolidated VIE’s liabilities. The assets and liabilities in the table below include third-party assets and liabilities of Cheniere Partners only and exclude intercompany balances that eliminate in consolidation.
|
| | | | | | | | |
| | | March 31, | | December 31, |
| | | 2020 | | 2019 |
| ASSETS | | | | |
| Current assets | | | | |
| Cash and cash equivalents | | $ | 1,734 |
| | $ | 1,781 |
|
| Restricted cash | | 109 |
| | 181 |
|
| Accounts and other receivables | | 259 |
| | 297 |
|
| Other current assets | | 160 |
| | 184 |
|
| Total current assets | | 2,262 |
| | 2,443 |
|
| | | | | |
| Property, plant and equipment, net | | 16,476 |
| | 16,368 |
|
| Other non-current assets, net | | 309 |
| | 309 |
|
| Total assets | | $ | 19,047 |
| | $ | 19,120 |
|
| | | | | |
| LIABILITIES | | | | |
| Current liabilities | | | | |
| Accrued liabilities | | $ | 569 |
| | $ | 709 |
|
| Current debt | | 1,996 |
| | — |
|
| Other current liabilities | | 120 |
| | 210 |
|
| Total current liabilities | | 2,685 |
| | 919 |
|
| | | | | |
| Long-term debt, net | | 15,591 |
| | 17,579 |
|
| Other non-current liabilities | | 88 |
| | 104 |
|
| Total liabilities | | $ | 18,364 |
| | $ | 18,602 |
|
CHENIERE ENERGY, INC. AND SUBSIDIARIES
NOTES TO CONSOLIDATED FINANCIAL STATEMENTS—CONTINUED
(unaudited)
NOTE 9—ACCRUED LIABILITIES
As of June 30, 2019March 31, 2020 and December 31, 2018,2019, accrued liabilities consisted of the following (in millions):
| | | | | June 30, | | December 31, | | March 31, | | December 31, |
| | | 2019 | | 2018 | | 2020 | | 2019 |
| Interest costs and related debt fees | | $ | 405 |
| | $ | 233 |
| | $ | 380 |
| | $ | 293 |
|
| Accrued natural gas purchases | | 402 |
| | 610 |
| | 318 |
| | 460 |
|
| LNG terminals and related pipeline costs | | 630 |
| | 125 |
| | 120 |
| | 327 |
|
| Compensation and benefits | | 58 |
| | 117 |
| | 42 |
| | 115 |
|
| Accrued LNG inventory | | 3 |
| | 14 |
| | 14 |
| | 6 |
|
| Other accrued liabilities | | 74 |
| | 70 |
| | 48 |
| | 80 |
|
| Total accrued liabilities | | $ | 1,572 |
| | $ | 1,169 |
| | $ | 922 |
| | $ | 1,281 |
|
CHENIERE ENERGY, INC. AND SUBSIDIARIES
NOTES TO CONSOLIDATED FINANCIAL STATEMENTS—CONTINUED
(unaudited)
NOTE 10—DEBT
As of June 30, 2019March 31, 2020 and December 31, 2018,2019, our debt consisted of the following (in millions):
| | | | | June 30, | | December 31, | | March 31, | | December 31, |
| | | 2019 | | 2018 | | 2020 | | 2019 |
| Long-term debt: | | | | | | | | |
| SPL | | | |
|
| | | | |
| 5.625% Senior Secured Notes due 2021 (“2021 SPL Senior Notes”) | | $ | 2,000 |
| | $ | 2,000 |
| | $ | — |
| | $ | 2,000 |
|
| 6.25% Senior Secured Notes due 2022 (“2022 SPL Senior Notes”) | | 1,000 |
| | 1,000 |
| | 1,000 |
| | 1,000 |
|
| 5.625% Senior Secured Notes due 2023 (“2023 SPL Senior Notes”) | | 1,500 |
| | 1,500 |
| | 1,500 |
| | 1,500 |
|
| 5.75% Senior Secured Notes due 2024 (“2024 SPL Senior Notes”) | | 2,000 |
| | 2,000 |
| | 2,000 |
| | 2,000 |
|
| 5.625% Senior Secured Notes due 2025 (“2025 SPL Senior Notes”) | | 2,000 |
| | 2,000 |
| | 2,000 |
| | 2,000 |
|
| 5.875% Senior Secured Notes due 2026 (“2026 SPL Senior Notes”) | | 1,500 |
| | 1,500 |
| | 1,500 |
| | 1,500 |
|
| 5.00% Senior Secured Notes due 2027 (“2027 SPL Senior Notes”) | | 1,500 |
| | 1,500 |
| | 1,500 |
| | 1,500 |
|
| 4.200% Senior Secured Notes due 2028 (“2028 SPL Senior Notes”) | | 1,350 |
| | 1,350 |
| | 1,350 |
| | 1,350 |
|
| 5.00% Senior Secured Notes due 2037 (“2037 SPL Senior Notes”) | | 800 |
| | 800 |
| | 800 |
| | 800 |
|
$1.2 billion SPL Working Capital Facility executed in 2020 (“2020 SPL Working Capital Facility”)
| | | — |
| | — |
|
| Cheniere Partners | | | | | | | | |
| 5.250% Senior Notes due 2025 (“2025 CQP Senior Notes”) | | 1,500 |
| | 1,500 |
| | 1,500 |
| | 1,500 |
|
| 5.625% Senior Notes due 2026 (“2026 CQP Senior Notes”) | | 1,100 |
| | 1,100 |
| | 1,100 |
| | 1,100 |
|
| 2016 CQP Credit Facilities | | — |
| | — |
| |
| 2019 CQP Credit Facilities | | 649 |
| | — |
| |
| 4.500% Senior Notes due 2029 (“2029 CQP Senior Notes”) | | | 1,500 |
| | 1,500 |
|
| CQP Credit Facilities executed in 2019 (“2019 CQP Credit Facilities”) | | | — |
| | — |
|
| CCH | | | | | | | | |
| 7.000% Senior Secured Notes due 2024 (“2024 CCH Senior Notes”) | | 1,250 |
| | 1,250 |
| | 1,250 |
| | 1,250 |
|
| 5.875% Senior Secured Notes due 2025 (“2025 CCH Senior Notes”) | | 1,500 |
| | 1,500 |
| | 1,500 |
| | 1,500 |
|
| 5.125% Senior Secured Notes due 2027 (“2027 CCH Senior Notes”) | | 1,500 |
| | 1,500 |
| | 1,500 |
| | 1,500 |
|
| 4.80% Senior Secured Notes due 2039 (“4.80% CCH Senior Notes”) | | | 727 |
| | 727 |
|
| 3.925% Senior Secured Notes due 2039 (“3.925% CCH Senior Notes”) | | | 475 |
| | 475 |
|
| 3.700% Senior Secured Notes due 2029 (“2029 CCH Senior Notes”) | | | 1,500 |
| | 1,500 |
|
| CCH Credit Facility | | 6,138 |
| | 5,156 |
| | 3,283 |
| | 3,283 |
|
| CCH HoldCo II | | | | | | | | |
| 11.0% Convertible Senior Secured Notes due 2025 (“2025 CCH HoldCo II Convertible Senior Notes”) | | 1,536 |
| | 1,455 |
| | 1,278 |
| | 1,578 |
|
| Cheniere | | | | | | | | |
| 4.875% Convertible Unsecured Notes due 2021 (“2021 Cheniere Convertible Unsecured Notes”) | | 1,248 |
| | 1,218 |
| | 1,278 |
| | 1,278 |
|
| 4.25% Convertible Senior Notes due 2045 (“2045 Cheniere Convertible Senior Notes”) | | 625 |
| | 625 |
| | 625 |
| | 625 |
|
| $1.25 billion Cheniere Revolving Credit Facility (“Cheniere Revolving Credit Facility”) | | — |
| | — |
| | 455 |
| | — |
|
| Unamortized premium, discount and debt issuance costs, net | | (752 | ) | | (775 | ) | | (681 | ) | | (692 | ) |
| Total long-term debt, net | | 29,944 |
| | 28,179 |
| | 28,940 |
|
| 30,774 |
|
| | | | | | | | | |
| Current debt: | | | | | | | | |
| $1.2 billion SPL Working Capital Facility (“SPL Working Capital Facility”) | | — |
| | — |
| |
| 2021 SPL Senior Notes | | | 2,000 |
| | — |
|
| $1.2 billion SPL Working Capital Facility executed in 2015 (“2015 SPL Working Capital Facility”) | | | — |
| | — |
|
| $1.2 billion CCH Working Capital Facility (“CCH Working Capital Facility”) | | — |
| | 168 |
| | 141 |
| | — |
|
| Cheniere Marketing trade finance facilities | | — |
| | 71 |
| | — |
| | — |
|
| Unamortized premium, discount and debt issuance costs, net | | | (4 | ) | | — |
|
| Total current debt | | — |
| | 239 |
| | 2,137 |
|
| — |
|
| | | | | | | | | |
| Total debt, net | | $ | 29,944 |
| | $ | 28,418 |
| | $ | 31,077 |
|
| $ | 30,774 |
|
2019 Debt Issuances and Terminations
2016 CQP Credit Facilities
In May 2019, the remaining commitments under the 2016 CQP Credit Facilities were terminated. There were no write-offs of debt issuance costs associated with the termination of the 2016 CQP Credit Facilities.
CHENIERE ENERGY, INC. AND SUBSIDIARIES
NOTES TO CONSOLIDATED FINANCIAL STATEMENTS—CONTINUED
(unaudited)
2019 CQP Credit Facilities2020 Material Debt Activities
2020 SPL Working Capital Facility
In May 2019, Cheniere PartnersMarch 2020, SPL entered into the $1.52020 SPL Working Capital Facility with aggregate commitments of $1.2 billion, 2019 CQP Credit Facilities, which consist of a $750 million term loan (“CQP Term Facility”) and a $750 million revolving credit facility (“CQP Revolving Facility”). Borrowings underreplaced the 2019 CQP Credit Facilities will2015 SPL Working Capital Facility. The 2020 SPL Working Capital Facility is intended to be used for loans to fund the developmentSPL (“SPL Revolving Loans”), swing line loans to SPL (“SPL Swing Line Loans”) and construction of Train 6 of the SPL Project and subject to a sublimit, for general corporate purposes. The CQP Revolving Facility is also available for the issuance of letters of credit.
Loans under the 2019 CQP Credit Facilities will2020 SPL Working Capital Facility accrue interest at a variable rate per annum equal to LIBOR or the base rate (equal to the highest of the senior facility agent’s published prime rate, the federal funds effective rate, as published by the Federal Reserve Bank of New York, plus 0.50%, and the adjusted one-monthone month LIBOR plus 1.0%0.50%), plus the applicable margin. Under the CQP Term Facility, theThe applicable margin for LIBOR loans under the 2020 SPL Working Capital Facility is 1.50%1.125% to 1.750% per annum (depending on the then-current rating of SPL), and the applicable margin for base rate loans under the 2020 SPL Working Capital Facility is 0.50%0.125% to 0.750% per annum in each case with a 0.25% step-up beginning on May 29, 2022. Under the CQP Revolving Facility, the applicable margin for LIBOR loans is 1.25% to 2.125% per annum, and the applicable margin for base rate loans is 0.25% to 1.125% per annum, in each case depending(depending on the then-current rating of Cheniere Partners.SPL). Interest on LIBOR loans is due and payable at the end of each applicable LIBOR period, (and at the end of every three-month period within the LIBOR period, if any), and interest on base rate loans is due and payable at the end of each calendarfiscal quarter.
Cheniere Partners incurred $20 million of discounts and debt issuance costs in conjunction with the entry into the 2019 CQP Credit Facilities. Cheniere PartnersSPL pays a commitment fee equal to an annual rate of 30%0.1% to 0.3% (depending on the then-current rating of SPL), which accrues on the margin for LIBOR loans multiplied by the average daily amount of the undrawntotal commitment payable quarterly in arrears.less the sum of (1) the outstanding principal amount of SPL Revolving Loans, (2) letters of credit issued and (3) the outstanding principal amount of SPL Swing Line Loans. If draws are made upon a letter of credit issued under the 2020 SPL Working Capital Facility and SPL does not elect for such draw to be deemed an SPL LC Loan (an “SPL LC Draw”), SPL is required to pay the full amount of the SPL LC Draw on or prior to noon eastern time on the business day of the SPL LC Draw. An SPL LC Draw accrues interest at the base rate plus the applicable margin. As of March 31, 2020, 0 SPL LC Draws had been made upon any letters of credit issued under the 2020 SPL Working Capital Facility.
The 2019 CQP Credit Facilities mature2020 SPL Working Capital Facility matures on May 29, 2024. The principal of any loans under the 2019 CQP Credit Facilities must be repaid in quarterly installments commencing on May 29, 2023 based on an amortization schedule. Any outstanding balanceMarch 19, 2025, but may be repaid, in whole or in part, at any time without premium or penalty, exceptextended with consent of the lenders. The 2020 SPL Working Capital Facility provides for interest hedging and interest rate breakage costs. mandatory prepayments under customary circumstances.
The 2019 CQP Credit Facilities contain2020 SPL Working Capital Facility contains customary conditions precedent for extensions of credit, as well as customary affirmative and negative covenants,covenants. SPL is restricted from making certain distributions under agreements governing its indebtedness generally until, among other requirements, satisfaction of a 12-month forward-looking and limit Cheniere Partners’ ability to make restricted payments, including distributions, to once per fiscal quarter and one true-up per fiscal quarter as long as certain conditionsbackward-looking 1.25:1.00 debt service reserve ratio test. The obligations of SPL under the 2020 SPL Working Capital Facility are satisfied.
The 2019 CQP Credit Facilities are unconditionally guaranteedsecured by each subsidiarysubstantially all of Cheniere Partners other thanthe assets of SPL Sabine Pass LNG-LP, LLC and certain subsidiaries of Cheniere Partners owning other development projects, as well as certain other specified subsidiaries and membersa pledge of all of the foregoing entities.membership interests in SPL and certain future subsidiaries of SPL on a pari passu basis by a first priority lien with the SPL Senior Notes.
2025 CCH HoldCo II Convertible Senior Notes
In February 2020, the amended and restated note purchase agreement for the 2025 CCH HoldCo II Convertible Senior Notes was amended to allow CCH HoldCo II the option to redeem all or a portion of the outstanding notes with cash at a price of $1,080 per $1,000 principal amount, at the time of any CCH HoldCo II- or noteholder-initiated conversion through September 2, 2020. In March 2020, CCH HoldCo II redeemed an aggregate outstanding principal amount of $300 million with cash. CCH HoldCo II retains the ability to convert the 2025 CCH HoldCo II Convertible Senior Notes into our common stock at a conversion price equal to the lower of (1) a 10% discount to the average of the daily volume-weighted average price (“VWAP”) of our common stock for the 90 trading day period prior to the date on which notice of conversion is provided and (2) a 10% discount to the closing price of our common stock on the trading day preceding the date on which notice of conversion is provided. The noteholders retain the ability to request conversion into our common stock at a conversion price equal to the average of the daily VWAP of our common stock for the 90 trading day period preceding the date on which notice of requested conversion is provided. Conversions remain subject to various limitations and conditions.
CHENIERE ENERGY, INC. AND SUBSIDIARIES
NOTES TO CONSOLIDATED FINANCIAL STATEMENTS—CONTINUED
(unaudited)
Credit Facilities
Below is a summary of our credit facilities outstanding as of June 30, 2019March 31, 2020 (in millions):
| | | | | SPL Working Capital Facility (1) | | 2019 CQP Credit Facilities | | CCH Credit Facility | | CCH Working Capital Facility | | Cheniere Revolving Credit Facility | | 2020 SPL Working Capital Facility | | 2019 CQP Credit Facilities | | CCH Credit Facility | | CCH Working Capital Facility | | Cheniere Revolving Credit Facility |
| Original facility size | | $ | 1,200 |
| | $ | 1,500 |
| | $ | 8,404 |
| | $ | 350 |
| | $ | 750 |
| | $ | 1,200 |
| | $ | 1,500 |
| | $ | 8,404 |
| | $ | 350 |
| | $ | 750 |
|
| Incremental commitments | | — |
| | — |
| | 1,566 |
| | 850 |
| | 500 |
| | — |
| | — |
| | 1,566 |
| | 850 |
| | 500 |
|
| Less: | | | | | | | | | | | | | | | | | | | | |
| Outstanding balance | | — |
| | 649 |
| | 6,138 |
| | — |
| | — |
| | — |
| | — |
| | 3,283 |
| | 141 |
| | 455 |
|
| Commitments prepaid or terminated | | — |
| | — |
| | 3,832 |
| | — |
| | — |
| | — |
| | 750 |
| | 6,687 |
| | — |
| | — |
|
| Letters of credit issued | | 415 |
| | — |
| | — |
| | 338 |
| | — |
| | 414 |
| | — |
| | — |
| | 399 |
| | 365 |
|
| Available commitment | | $ | 785 |
|
| $ | 851 |
| | $ | — |
|
| $ | 862 |
|
| $ | 1,250 |
| | $ | 786 |
|
| $ | 750 |
|
| $ | — |
|
| $ | 660 |
| | $ | 430 |
|
| | | | | | | | | | | | | | | | | | | | | |
| Interest rate on outstanding balance | | LIBOR plus 1.75% or base rate plus 0.75% | | (2) | | LIBOR plus 1.75% or base rate plus 0.75% | | LIBOR plus 1.25% - 1.75% or base rate plus 0.25% - 0.75% | | LIBOR plus 1.75% - 2.50% or base rate plus 0.75% - 1.50% | |
| Interest rate on available balance | | | LIBOR plus 1.125% - 1.750% or base rate plus 0.125% - 0.750% | | LIBOR plus 1.25% - 2.125% or base rate plus 0.25% - 1.125% | | LIBOR plus 1.75% or base rate plus 0.75% | | LIBOR plus 1.25% - 1.75% or base rate plus 0.25% - 0.75% | | LIBOR plus 1.75% - 2.50% or base rate plus 0.75% - 1.50% |
| Weighted average interest rate of outstanding balance | | n/a | | 3.92% | | 4.15% | | n/a | | n/a | | n/a | | n/a | | 2.74% | | 2.77% | | 2.70% |
| Maturity date | | December 31, 2020 | | May 29, 2024 | | June 30, 2024 | | June 29, 2023 | | December 23, 2022 | | March 19, 2025 | | May 29, 2024 | | June 30, 2024 | | June 29, 2023 | | December 13, 2022 |
| |
(1) | The SPL Working Capital Facility was amended in May 2019 in connection with commercialization and financing of Train 6 of the SPL Project. All terms of the SPL Working Capital Facility substantially remained unchanged. |
CHENIERE ENERGY, INC. AND SUBSIDIARIES
NOTES TO CONSOLIDATED FINANCIAL STATEMENTS—CONTINUED
(unaudited)
| |
(2) | LIBOR plus 1.50% or base rate plus 0.50%, with a 0.25% step-up beginning on May 29, 2022 for the CQP Term Facility. LIBOR plus 1.25% to 2.125% or base rate plus 0.25% to 1.125%, depending on the then-current rating of Cheniere Partners for the CQP Revolving Facility. |
Convertible Notes
Below is a summary of our convertible notes outstanding as of June 30, 2019March 31, 2020 (in millions):
| | | | | 2021 Cheniere Convertible Unsecured Notes | | 2025 CCH HoldCo II Convertible Senior Notes | | 2045 Cheniere Convertible Senior Notes | | 2021 Cheniere Convertible Unsecured Notes | | 2025 CCH HoldCo II Convertible Senior Notes | | 2045 Cheniere Convertible Senior Notes |
| Aggregate original principal | | $ | 1,000 |
| | $ | 1,000 |
| | $ | 625 |
| | $ | 1,000 |
| | $ | 1,000 |
| | $ | 625 |
|
| Add: interest paid-in-kind | | | 278 |
| | 578 |
| | — |
|
| Less: aggregate principal redeemed | | | — |
| | (300 | ) | | — |
|
| Aggregate remaining principal | | | $ | 1,278 |
| | $ | 1,278 |
| | $ | 625 |
|
| | | | | | | | |
| Debt component, net of discount and debt issuance costs | | $ | 1,172 |
| | $ | 1,519 |
| | $ | 311 |
| | $ | 1,230 |
| | $ | 1,250 |
| | $ | 315 |
|
| Equity component | | $ | 210 |
| | $ | — |
| | $ | 194 |
| | $ | 211 |
| | $ | — |
| | $ | 194 |
|
| Interest payment method | | Paid-in-kind |
| | Paid-in-kind (1) |
| | Cash |
| | Paid-in-kind |
| | Paid-in-kind / cash (1) |
| | Cash |
|
| Conversion by us (2) | | — |
| | (3) |
| | (4) |
| | — |
| | (3) |
| | (4) |
|
| Conversion by holders (2) | | (5) |
| | (6) |
| | (7) |
| | (5) |
| | (3) |
| | (6) |
|
| Conversion basis | | Cash and/or stock |
| | Stock |
| | Cash and/or stock |
| | Cash and/or stock |
| | Cash and/or stock |
| | Cash and/or stock |
|
| Conversion value in excess of principal | | $ | — |
| | $ | — |
| | $ | — |
| | $ | — |
| | n/a |
| | $ | — |
|
| Maturity date | | May 28, 2021 |
| | May 13, 2025 |
| | March 15, 2045 |
| | May 28, 2021 |
| | May 13, 2025 |
| | March 15, 2045 |
|
| Contractual interest rate | | 4.875 | % | | 11.0 | % | | 4.25 | % | | 4.875 | % | | 11.0 | % | | 4.25 | % |
| Effective interest rate (8) | | 8.4 | % | | 11.9 | % | | 9.4 | % | |
| Remaining debt discount and debt issuance costs amortization period (9) | | 1.9 years |
| | 1.3 years |
| | 25.7 years |
| |
| Effective interest rate (7) | | | 8.2 | % | | 12.2 | % | | 9.4 | % |
| Remaining debt discount and debt issuance costs amortization period (8) | | | 1.2 years |
| | 0.5 years |
| | 25.0 years |
|
| |
| (1) | Prior to the substantial completion of Train 2 of the CCL Project in August 2019, interest will bewas paid entirely in kind. Following this date,substantial completion, the interest generally must behas been paid in cash; however, a portion of the interest may, in the future, be paid in kind under certain specified circumstances. |
| |
| (2) | Conversion is subject to various limitations and conditions. |
| |
| (3) | Convertible into cash or stock at our option on or after the later of March 1, 2020 until September 2, 2020, and the substantial completion of Traininto stock upon conversion notice by us or note holders after September 2, of the CCL Project,2020, provided that our market capitalization is not less than $10.0 billion (“Eligible Conversion Date”). The conversion price for stock is the lower of (1) a 10% discount to the average of the daily volume-weighted average price (“VWAP”)VWAP of our common stock for the 90 trading day period prior to the date notice is provided, and (2) a 10% discount to the closing price of our common stock on the trading day preceding the date notice is provided. |
CHENIERE ENERGY, INC. AND SUBSIDIARIES
NOTES TO CONSOLIDATED FINANCIAL STATEMENTS—CONTINUED
(unaudited)
10% discount to the closing price of our common stock on the trading day preceding the date notice is provided. The conversion price for cash is $1,080 per $1,000 principal amount of the notes. In March 2020, we delivered our first notice to convert notes in an aggregate outstanding principal amount of $300 million into cash.
| |
| (4) | Redeemable at any time after March 15, 2020 at a redemption price payable in cash equal to the accreted amount of the 2045 Cheniere Convertible Senior Notes to be redeemed, plus accrued and unpaid interest, if any, to such redemption date. |
| |
| (5) | Initially convertible at $93.64 (subject to adjustment upon the occurrence of certain specified events), provided that the closing price of our common stock is greater than or equal to the conversion price on the conversion date. |
| |
| (6) | Convertible on or after the six-month anniversary of the Eligible Conversion Date, provided that our total market capitalization is not less than $10.0 billion, at a price equal to the average of the daily VWAP of our common stock for the 90 trading day period prior to the date on which notice of conversion is provided. |
| |
(7) | Prior to December 15, 2044, convertible only under certain circumstances as specified in the indenture; thereafter, holders may convert their notes regardless of these circumstances. The conversion rate will initially equal 7.2265 shares of our common stock per $1,000 principal amount of the 2045 Cheniere Convertible Senior Notes, which corresponds to an initial conversion price of approximately $138.38 per share of our common stock (subject to adjustment upon the occurrence of certain specified events). |
| |
(8)(7) | Rate to accrete the discounted carrying value of the convertible notes to the face value over the remaining amortization period. |
CHENIERE ENERGY, INC. AND SUBSIDIARIES
NOTES TO CONSOLIDATED FINANCIAL STATEMENTS—CONTINUED
(unaudited)
| |
(9)(8) | We amortize any debt discount and debt issuance costs using the effective interest over the period through contractual maturity except for the 2025 CCH HoldCo II Convertible Senior Notes, which are amortized through the date they are first convertible by holders into our common stock. |
Restrictive Debt Covenants
As of June 30, 2019,March 31, 2020, each of our issuers was in compliance with all covenants related to their respective debt agreements.
Interest Expense
Total interest expense, including interest expense related to our convertible notes, consisted of the following (in millions):
| | | | | Three Months Ended June 30, | | Six Months Ended June 30, | | Three Months Ended March 31, |
| | | 2019 | | 2018 | | 2019 | | 2018 | | 2020 | | 2019 |
| Interest cost on convertible notes: | | | | | | | | | | | | |
| Interest per contractual rate | | $ | 64 |
| | $ | 58 |
| | $ | 126 |
| | $ | 116 |
| | $ | 63 |
| | $ | 62 |
|
| Amortization of debt discount | | 9 |
| | 8 |
| | 19 |
| | 16 |
| | 14 |
| | 10 |
|
| Amortization of debt issuance costs | | 3 |
| | 2 |
| | 6 |
| | 4 |
| | 3 |
| | 3 |
|
| Total interest cost related to convertible notes | | 76 |
| | 68 |
| | 151 |
| | 136 |
|
| 80 |
|
| 75 |
|
| Interest cost on debt and finance leases excluding convertible notes | | 382 |
| | 344 |
| | 755 |
|
| 680 |
| | 391 |
|
| 373 |
|
| Total interest cost | | 458 |
| | 412 |
| | 906 |
| | 816 |
| | 471 |
| | 448 |
|
| Capitalized interest | | (86 | ) | | (196 | ) | | (287 | ) | | (384 | ) | | (59 | ) | | (201 | ) |
| Total interest expense, net | | $ | 372 |
|
| $ | 216 |
| | $ | 619 |
| | $ | 432 |
|
| $ | 412 |
| | $ | 247 |
|
CHENIERE ENERGY, INC. AND SUBSIDIARIES
NOTES TO CONSOLIDATED FINANCIAL STATEMENTS—CONTINUED
(unaudited)
Fair Value Disclosures
The following table shows the carrying amount which is net of unamortized premium, discount and debt issuance costs, and estimated fair value of our debt (in millions):
| | | | | June 30, 2019 | | December 31, 2018 | | March 31, 2020 | | December 31, 2019 |
| | | Carrying
Amount | | Estimated
Fair Value | | Carrying
Amount | | Estimated
Fair Value | | Carrying
Amount | | Estimated
Fair Value | | Carrying
Amount | | Estimated
Fair Value |
| Senior notes (1) | | $ | 19,483 |
| | $ | 21,499 |
| | $ | 19,466 |
| | $ | 19,901 |
| | $ | 22,700 |
| | $ | 20,805 |
| | $ | 22,700 |
| | $ | 24,650 |
|
| 2037 SPL Senior Notes (2) | | 791 |
| | 912 |
| | 791 |
| | 817 |
| | 800 |
| | 709 |
| | 800 |
| | 934 |
|
| 4.80% CCH Senior Notes (2) | | | 727 |
| | 594 |
| | 727 |
| | 830 |
|
| 3.925% CCH Senior Notes (2) | | | 475 |
| | 350 |
| | 475 |
| | 495 |
|
| Credit facilities (3) | | 6,668 |
| | 6,668 |
| | 5,294 |
| | 5,294 |
| | 3,879 |
| | 3,879 |
| | 3,283 |
| | 3,283 |
|
| 2021 Cheniere Convertible Unsecured Notes (2) | | 1,172 |
| | 1,302 |
| | 1,126 |
| | 1,236 |
| | 1,278 |
| | 1,248 |
| | 1,278 |
| | 1,312 |
|
| 2025 CCH HoldCo II Convertible Senior Notes (2) | | 1,519 |
| | 1,771 |
| | 1,432 |
| | 1,612 |
| | 1,278 |
| | 1,406 |
| | 1,578 |
| | 1,807 |
|
| 2045 Cheniere Convertible Senior Notes (4) | | 311 |
| | 489 |
| | 310 |
| | 431 |
| | 625 |
| | 281 |
| | 625 |
| | 498 |
|
| |
| (1) | Includes 2021the SPL Senior Notes 2022except the 2037 SPL Senior Notes, 2023 SPL Senior Notes, 2024 SPL Senior Notes, 2025 SPL Senior Notes, 2026 SPL Senior Notes, 2027 SPL Senior Notes, 2028 SPL Senior Notes, 2025the CQP Senior Notes 2026 CQP Senior Notes, 2024 CCH Senior Notes, 2025 CCH Senior Notes and 2027the 144A CCH Senior Notes. The Level 2 estimated fair value was based on quotes obtained from broker-dealers or market makers of these senior notes and other similar instruments. |
| |
| (2) | The Level 3 estimated fair value was calculated based on inputs that are observable in the market or that could be derived from, or corroborated with, observable market data, including our stock price and interest rates based on debt issued by parties with comparable credit ratings to us and inputs that are not observable in the market. |
| |
| (3) | Includes 2015 SPL Working Capital Facility, 2016 CQP Credit Facilities,2020 SPL Working Capital Facility, 2019 CQP Credit Facilities, CCH Credit Facility, CCH Working Capital Facility, Cheniere Revolving Credit Facility and Cheniere Marketing trade finance facilities. The Level 3 estimated fair value approximates the principal amount because the interest rates are variable and reflective of market rates and the debt may be repaid, in full or in part, at any time without penalty. |
| |
| (4) | The Level 1 estimated fair value was based on unadjusted quoted prices in active markets for identical liabilities that we had the ability to access at the measurement date. |
CHENIERE ENERGY, INC. AND SUBSIDIARIES
NOTES TO CONSOLIDATED FINANCIAL STATEMENTS—CONTINUED
(unaudited)
NOTE 11—LEASES
Our leased assets consist primarily of (1) LNG vessel time charters (“vessel charters”), (2) tug vessels, (3) office space and facilities and (4) land sites, all of which are classified as operating leases except for our tug vessels at the Corpus Christi LNG terminal, which are classified as finance leases.
ASC 842 requires a lessee to recognize leases on its balance sheet by recording a lease liability representing the obligation to make future lease payments and a right-of-use asset representing the right to use the underlying asset for the lease term. As our leases generally do not provide an implicit rate, in order to calculate the lease liability, we discounted our expected future lease payments using our relevant subsidiary’s incremental borrowing rate at the later of January 1, 2019 or the commencement date of the lease. The incremental borrowing rate is an estimate of the rate of interest that a given subsidiary would have to pay to borrow on a collateralized basis over a similar term to that of the lease term.
Many of our leases contain renewal options exercisable at our sole discretion. Options to renew a lease are included in the lease term and recognized as part of the right-of-use asset and lease liability only to the extent they are reasonably certain to be exercised, such as when necessary to satisfy obligations that existed at the execution of the lease or when the non-renewal would otherwise result in an economic penalty.
We have elected the practical expedient to omit leases with an initial term of 12 months or less (“short-term lease”) from recognition on the balance sheet. We recognize short-term lease payments on a straight-line basis over the lease term and variable payments under short-term leases in the period in which the obligation is incurred.
Certain of our leases contain non-lease components which are not separated from the lease components when calculating the right-of-use asset and lease liability per our use of the practical expedient to combine both components of an arrangement for all classes of leased assets.
Certain of our leases also contain variable payments, such as inflation, that are not included when calculating the right-of-use asset and lease liability unless the payments are in-substance fixed.
We recognize lease expense for operating leases on a straight-line basis over the lease term. We recognize lease expense for finance leases as the sum of the amortization of the right-of-use assets on a straight-line basis and the interest on lease liabilities using the effective interest method over the lease term.
The following table shows the classification and location of our right-of-use assets and lease liabilities on our Consolidated Balance Sheets (in millions):
| | | | Consolidated Balance Sheet Location | | June 30, 2019 | Consolidated Balance Sheet Location | | March 31, 2020 | | December 31, 2019 |
| Right-of-use assets—Operating | Operating lease assets, net | | $ | 502 |
| Operating lease assets, net | | $ | 350 |
| | $ | 439 |
|
| Right-of-use assets—Financing | Property, plant and equipment, net | | 58 |
| Property, plant and equipment, net | | 55 |
| | 56 |
|
| Total right-of-use assets | | $ | 560 |
| | $ | 405 |
| | $ | 495 |
|
| | | | | | | |
| Current operating lease liabilities | Current operating lease liabilities | | $ | 292 |
| Current operating lease liabilities | | $ | 178 |
| | $ | 236 |
|
| Current finance lease liabilities | Other current liabilities | | 1 |
| Other current liabilities | | 1 |
| | 1 |
|
| Non-current operating lease liabilities | Non-current operating lease liabilities | | 202 |
| Non-current operating lease liabilities | | 164 |
| | 189 |
|
| Non-current finance lease liabilities | Non-current finance lease liabilities | | 58 |
| Non-current finance lease liabilities | | 58 |
| | 58 |
|
| Total lease liabilities | | $ | 553 |
| | $ | 401 |
| | $ | 484 |
|
CHENIERE ENERGY, INC. AND SUBSIDIARIES
NOTES TO CONSOLIDATED FINANCIAL STATEMENTS—CONTINUED
(unaudited)
The following table shows the classification and location of our lease cost on our Consolidated Statements of Operations (in millions):
| | | | | | | | Consolidated Statement of Operations Location | | Three Months Ended March 31, |
| | Consolidated Statement of Operations Location | | Three Months Ended June 30, 2019 | | Six Months Ended June 30, 2019 | | 2020 | | 2019 |
| Operating lease cost (1) | Operating costs and expenses (2) | | $ | 140 |
| | $ | 277 |
| Operating costs and expenses (2) | | $ | 141 |
| | $ | 137 |
|
| Finance lease cost: | | | | | |
|
| | |
| Amortization of right-of-use assets | Depreciation and amortization expense | | 1 |
| | 2 |
| Depreciation and amortization expense | | 1 |
| | 1 |
|
| Interest on lease liabilities | Interest expense, net of capitalized interest | | 3 |
| | 5 |
| Interest expense, net of capitalized interest | | 2 |
| | 2 |
|
| Total lease cost | | $ | 144 |
| | $ | 284 |
| | $ | 144 |
| | $ | 140 |
|
| |
| (1) | Includes $46$35 million and $93$47 million of short-term lease costs during the three months ended March 31, 2020 and $8 million2019, respectively, and $13$5 million of variable lease costs incurredpaid to the lessor during each of the three and six months ended June 30, 2019, respectively.March 31, 2020 and 2019. |
| |
| (2) | Presented in cost of sales, operating and maintenance expense or selling, general and administrative expense consistent with the nature of the asset under lease. |
Future annual minimum lease payments for operating and finance leases as of June 30, 2019March 31, 2020 are as follows (in millions):
| | | Years Ending December 31, | Operating Leases (1) | | Finance Leases | Operating Leases (1) | | Finance Leases |
| 2019 | $ | 192 |
| | $ | 5 |
| |
| 2020 | 167 |
| | 10 |
| $ | 158 |
| | $ | 8 |
|
| 2021 | 39 |
| | 10 |
| 58 |
| | 10 |
|
| 2022 | 19 |
| | 10 |
| 23 |
| | 10 |
|
| 2023 | 19 |
| | 10 |
| 22 |
| | 10 |
|
| 2024 | | 22 |
| | 10 |
|
| Thereafter | 166 |
| | 146 |
| 166 |
| | 136 |
|
| Total lease payments | 602 |
| | 191 |
| 449 |
| | 184 |
|
| Less: Interest | (108 | ) | | (132 | ) | (107 | ) | | (125 | ) |
| Present value of lease liabilities | $ | 494 |
| | $ | 59 |
| $ | 342 |
| | $ | 59 |
|
| |
| (1) | Does not include $1.6$2.0 billion of legally binding minimum lease payments primarily for vessel charters which were executed as of June 30, 2019March 31, 2020 but will commence in future period primarily between 2020 and 2021in the next two years and have fixed minimum lease terms of up to seven years. |
Future annual minimum lease payments for operating and capital leases as of December 31, 2018, prepared in accordance with accounting standards prior to the adoption of ASC 842, were as follows (in millions):
|
| | | | | | | |
| Years Ending December 31, | Operating Leases (1) | | Capital Leases (2) |
| 2019 (3) | $ | 380 |
| | $ | 5 |
|
| 2020 | 184 |
| | 5 |
|
| 2021 | 238 |
| | 5 |
|
| 2022 | 264 |
| | 5 |
|
| 2023 | 264 |
| | 5 |
|
| Thereafter | 999 |
| | 73 |
|
| Total lease payments | 2,329 |
| | 98 |
|
| Less: Interest | — |
| | (39 | ) |
| Present value of lease liabilities | $ | 2,329 |
| | $ | 59 |
|
| |
(1) | Includes certain lease option renewals that are reasonably assured and payments for certain non-lease components. Also includes $79 million in payments for short-term leases and $1.6 billion in payments for LNG vessel charters which were previously executed but will commence primarily between 2020 and 2021.
|
| |
(2) | Does not include payments for non-lease components of $98 million. |
| |
(3) | Does not include $43 million in aggregate payments we will receive from our LNG vessel subcharters. |
CHENIERE ENERGY, INC. AND SUBSIDIARIES
NOTES TO CONSOLIDATED FINANCIAL STATEMENTS—CONTINUED
(unaudited)
The following table shows the weighted-average remaining lease term (in years) and the weighted-average discount rate for our operating leases and finance leases:
|
| | | | | | | |
| | March 31, 2020 | | December 31, 2019 |
| | Operating Leases | | Finance Leases | | Operating Leases | | Finance Leases |
| Weighted-average remaining lease term (in years) | 9.8 | | 18.4 | | 8.4 | | 18.7 |
| Weighted-average discount rate (1) | 5.0% | | 16.2% | | 5.2% | | 16.2% |
|
| | | |
| | June 30, 2019 |
| | Operating Leases | | Finance Leases |
| Weighted-average remaining lease term (in years) | 7.2 | | 19.3 |
| Weighted-average discount rate (1) | 5.4% | | 16.2% |
| |
| (1) | The finance leases commenced prior to the adoption of ASC 842.the current leasing standard under GAAP. In accordance with previous accounting guidance, the implied rate is based on the fair value of the underlying assets. |
The following table includes other quantitative information for our operating and finance leases (in millions):
| | | | | | Three Months Ended March 31, |
| | Six Months Ended June 30, 2019 | 2020 | | 2019 |
| Cash paid for amounts included in the measurement of lease liabilities: | | | | |
| Operating cash flows from operating leases | $ | 174 |
| $ | 94 |
| | $ | 90 |
|
| Operating cash flows from finance leases | 5 |
| 2 |
| | 2 |
|
| Financing cash flows from finance leases | — |
| — |
| | — |
|
| Right-of-use assets obtained in exchange for new operating lease liabilities | 106 |
| 8 |
| | 64 |
|
CHENIERE ENERGY, INC. AND SUBSIDIARIES
NOTES TO CONSOLIDATED FINANCIAL STATEMENTS—CONTINUED
(unaudited)
LNG Vessel Subcharters
From time to time, we sublease certain LNG vessels under charter to third parties while retaining our existing obligation to the original lessor. We have elected the practical expedient for lessors to combine lease and non-lease components and since the lease component is the predominant component of each arrangement, these subleases are accounted for as operating leases. The subleases have lease terms of up to one year and many contain short-term renewal options exercisable at the discretion of the third party. As of June 30,March 31, 2020 and December 31, 2019, we had $13$3 million and $9 million in future minimum sublease payments to be received from LNG vessel subcharters, respectively, which will be recognized entirely within 2019. We recognize fixed sublease income on a straight-line basis over the lease term of the sublease while variable sublease income is recognized when earned.2020. We recognized $31$52 million and $68$37 million of sublease income, including $5$15 million and $10$5 million of variable lease payments, during the three and six months ended June 30,March 31, 2020 and 2019, respectively, in other revenues on our Consolidated Statements of Operations.
NOTE 12—REVENUES FROM CONTRACTS WITH CUSTOMERS
The following table represents a disaggregation of revenue earned from contracts with customers during the three and six months ended June 30,March 31, 2020 and 2019 and 2018 (in millions):
| | | | | Three Months Ended June 30, | | Six Months Ended June 30, | | Three Months Ended March 31, |
| | | 2019 | | 2018 | | 2019 | | 2018 | | 2020 | | 2019 |
LNG revenues | | $ | 2,080 |
| | $ | 1,516 |
| | $ | 4,147 |
| | $ | 3,668 |
| | $ | 2,404 |
| | $ | 2,068 |
|
| Regasification revenues | | 67 |
| | 65 |
| | 133 |
| | 130 |
| | 67 |
| | 66 |
|
| Other revenues | | 21 |
| | 13 |
| | 36 |
| | 23 |
| | 22 |
| | 15 |
|
| Total revenues from customers | | 2,168 |
| | 1,594 |
| | 4,316 |
| | 3,821 |
| | 2,493 |
| | 2,149 |
|
| Net derivative gains (losses) (1) | | 93 |
| | (64 | ) | | 169 |
| | (60 | ) | |
| Other revenues (2) | | 31 |
| | 13 |
| | 68 |
| | 24 |
| |
| Net derivative gains (2) | | | 164 |
| | 75 |
|
| Other (3) | | | 52 |
| | 37 |
|
| Total revenues | | $ | 2,292 |
| | $ | 1,543 |
| | $ | 4,553 |
| | $ | 3,785 |
| | $ | 2,709 |
| | $ | 2,261 |
|
| |
| (1) | LNG revenues include revenues for LNG cargoes in which our customers exercised their contractual right to not take delivery but remained obligated to pay fixed fees irrespective of such election. Revenue associated with canceled LNG cargoes is generally recognized upon notice of customer cancellation because our customers have no contractual right to take delivery of canceled LNG cargoes in future periods and our performance obligations with respect to such canceled LNG cargoes have been satisfied. |
| |
(2)(3) | Includes revenues from LNG vessel subcharters. See Note 11—Leases for additional information about our subleases. |
CHENIERE ENERGY, INC. AND SUBSIDIARIES
NOTES TO CONSOLIDATED FINANCIAL STATEMENTS—CONTINUED
(unaudited)
Contract Assets and Liabilities
The following table shows our contract assets, which we classifyare classified as other non-current assets, net on our Consolidated Balance Sheets (in millions):
|
| | | | | | | | |
| | | June 30, | | December 31, |
| | | 2019 | | 2018 |
| Contract assets | | $ | 8 |
| | $ | — |
|
|
| | | | | | | | |
| | | March 31, | | December 31, |
| | | 2020 | | 2019 |
| Contract assets | | $ | 34 |
| | $ | 18 |
|
Contract assets represent our right to consideration for transferring goods or services to the customer under the terms of a sales contract when the associated consideration is not yet due. Changes in contract assets during the sixthree months ended June 30, 2019March 31, 2020 were primarily attributable to revenue recognized due to the delivery of LNG under certain SPAs for which the associated consideration was not yet due.
The following table reflects the changes in our contract liabilities, which we classify as deferred revenue on our Consolidated Balance Sheets (in millions):
| | | | | Six Months Ended June 30, 2019 | | Three Months Ended March 31, 2020 |
| Deferred revenues, beginning of period | | $ | 139 |
| | $ | 161 |
|
| Cash received but not yet recognized | | 136 |
| | 94 |
|
| Revenue recognized from prior period deferral | | (139 | ) | | (161 | ) |
| Deferred revenues, end of period | | $ | 136 |
| | $ | 94 |
|
CHENIERE ENERGY, INC. AND SUBSIDIARIES
NOTES TO CONSOLIDATED FINANCIAL STATEMENTS—CONTINUED
(unaudited)
Transaction Price Allocated to Future Performance Obligations
Because many of our sales contracts have long-term durations, we are contractually entitled to significant future consideration which we have not yet recognized as revenue. The following table discloses the aggregate amount of the transaction price that is allocated to performance obligations that have not yet been satisfied as of June 30, 2019March 31, 2020 and December 31, 2018:2019:
| | | | | June 30, 2019 | | December 31, 2018 | | March 31, 2020 | | December 31, 2019 |
| | | Unsatisfied Transaction Price (in billions) | | Weighted Average Recognition Timing (years) (1) | | Unsatisfied Transaction Price (in billions) | | Weighted Average Recognition Timing (years) (1) | | Unsatisfied Transaction Price (in billions) | | Weighted Average Recognition Timing (years) (1) | | Unsatisfied Transaction Price (in billions) | | Weighted Average Recognition Timing (years) (1) |
| LNG revenues | | $ | 108.4 |
| | 11 | | $ | 106.6 |
| | 11 | | $ | 105.4 |
| | 11 | | $ | 106.4 |
| | 11 |
| Regasification revenues | | 2.5 |
| | 5 | | 2.6 |
| | 6 | | 2.3 |
| | 5 | | 2.4 |
| | 5 |
| Total revenues | | $ | 110.9 |
| |
| | $ | 109.2 |
| | | $ | 107.7 |
| |
| | $ | 108.8 |
| |
(1) The weighted average recognition timing represents an estimate of the number of years during which we shall have recognized half of the unsatisfied transaction price.
| |
(1) | The weighted average recognition timing represents an estimate of the number of years during which we shall have recognized half of the unsatisfied transaction price. |
We have elected the following exemptions which omit certain potential future sources of revenue from the table above:
| |
| (1) | We omit from the table above all performance obligations that are part of a contract that has an original expected duration of one year or less. |
| |
| (2) | The table above excludes substantially all variable consideration under our SPAs and TUAs. We omit from the table above all variable consideration that is allocated entirely to a wholly unsatisfied performance obligation or to a wholly unsatisfied promise to transfer a distinct good or service that forms part of a single performance obligation when that performance obligation qualifies as a series. The table above excludes substantially all variable consideration under our SPAs and TUAs. The amount of revenue from variable fees that is not included in the transaction price will vary based on the future prices of Henry Hub throughout the contract terms, to the extent customers elect to take delivery of their LNG, and adjustments to the consumer price index. Certain of our contracts contain additional variable consideration based on the outcome of contingent events and the movement of various indexes. We have not included such variable consideration in the transaction price to the extent the consideration is considered constrained due to the uncertainty of ultimate pricing and receipt. Approximately 52%42% and 55%58% of our LNG revenues from contracts with a duration of over one year during the three months ended June 30,March 31, 2020 and 2019, respectively, were related to variable consideration received from customers. During each of the three months ended March 31, 2020 and 2018, respectively, and2019, approximately 55%3% of our LNGregasification revenues were related to variable consideration received from contracts with a duration of over one year duringcustomers. |
CHENIERE ENERGY, INC. AND SUBSIDIARIES
NOTES TO CONSOLIDATED FINANCIAL STATEMENTS—CONTINUED
(unaudited)
each of the six months ended June 30, 2019 and 2018, were related to variable consideration received from customers. During each of the three and six months ended June 30, 2019 and 2018, approximately 3% of our regasification revenues were related to variable consideration received from customers.
We have entered into contracts to sell LNG that are conditioned upon one or both of the parties achieving certain milestones such as reaching FID on a certain liquefaction Train, obtaining financing or achieving substantial completion of a Train and any related facilities. These contracts are considered completed contracts for revenue recognition purposes and are included in the transaction price above when the conditions are considered probable of being met.
NOTE 13—INCOME TAXES
We recorded an income tax benefitprovision of zero$131 million and $3 million during the three months ended June 30,March 31, 2020 and 2019, and 2018, respectively, and an income tax provision of $3 million and $12 million during the six months ended June 30, 2019 and 2018, respectively. Changes in the income tax recorded between comparative periods are primarily attributable to changes in the income earned and tax transfer pricing applied to our U.K. integrated marketing function.
The effective tax rates duringrate for the three and six months ended June 30, 2019 and 2018 wereMarch 31, 2020 was 17.8%, which is lower than the 21% federal statutory rate duringprimarily due to income allocated to non-controlling interest that is not taxable to Cheniere, partially offset by a one-time discrete event related to an internal tax restructuring. The discrete item resulted in expense of $38 million for the three months ended March 31, 2020. The effective tax rate for the three months ended March 31, 2019 and 2018 interim periodswas 0.9%, which is lower than the 21% federal statutory rate primarily as a result ofdue to maintaining a valuation allowance against our federal and state net deferred tax assets. Due to historical losses and other available evidence related to our ability to generate taxable income, we continue to maintain a valuation allowance against our federal and state net deferred tax assets at June 30, 2019.
NOTE 14—SHARE-BASED COMPENSATION
We have granted restricted stock shares, restricted stock units, performance stock units and phantom units to employees and non-employee directors under the 2011 Incentive Plan, as amended (the “2011 Plan”) and the 2015 Employee Inducement Incentive Plan.
CHENIERE ENERGY, INC. AND SUBSIDIARIES
NOTES TO CONSOLIDATED FINANCIAL STATEMENTS—CONTINUED
(unaudited)
For the sixthree months ended June 30, 2019,March 31, 2020, we granted 1.31.2 million restricted stock units and 0.20.3 million performance stock units at target performance under the 2011 Plan to certain employees. Additionally, 0.2 million incremental shares of our common stock were issued based on performance results from previously-granted performance stock unit awards. Restricted stock units are stock awards that vest over a service period of three years and entitle the holder to receive shares of our common stock upon vesting, subject to restrictions on transfer and to a risk of forfeiture if the recipient terminates employment with us prior to the lapse of the restrictions. Performance stock units provide for cliff vesting after a period of three years with payouts based on metrics dependent upon market and performance achieved over the period from January 1, 20192020 through December 31, 20212022 compared to pre-established performance targets. The settlement amounts of the awards are based on market and performance metrics which include cumulative distributable cash flow per share, and in certain circumstances, absolute total shareholder return (“TSR”ATSR”) of our common stock. Where applicable, the compensation for performance stock units is based on fair value assigned to the market metric of TSRATSR using a Monte Carlo model upon grant, which remains constant through the vesting period, and a performance metric, which will vary due to changing estimates regarding the expected achievement of the performance metric of cumulative distributable cash flow per share. The number of shares that may be earned at the end of the vesting period ranges from 25%0% up to 300% of the target award amount if the threshold performance is met.amount. Both restricted stock units and performance stock units will be settled in Cheniere common stock (on a one-for-one basis) and are classified as equity awards.
Total share-based compensation consisted of the following (in millions):
| | | | | Three Months Ended June 30, | | Six Months Ended June 30, | | Three Months Ended March 31, |
| | | 2019 | | 2018 | | 2019 | | 2018 | | 2020 | | 2019 |
| Share-based compensation costs, pre-tax: | | | | | | | | | | | | |
| Equity awards | | $ | 32 |
| | $ | 22 |
| | $ | 61 |
| | $ | 39 |
| | $ | 30 |
| | $ | 29 |
|
| Liability awards | | 2 |
| | 15 |
| | 5 |
| | 32 |
| | — |
| | 3 |
|
| Total share-based compensation | | 34 |
|
| 37 |
|
| 66 |
|
| 71 |
|
| 30 |
| | 32 |
|
| Capitalized share-based compensation | | (1 | ) | | (7 | ) | | (5 | ) | | (13 | ) | | (1 | ) | | (4 | ) |
| Total share-based compensation expense | | $ | 33 |
|
| $ | 30 |
|
| $ | 61 |
|
| $ | 58 |
|
| $ | 29 |
| | $ | 28 |
|
| Tax benefit associated with share-based compensation expense | | $ | — |
| | $ | — |
| | $ | 1 |
| | $ | 2 |
| | $ | 18 |
| | $ | 1 |
|
CHENIERE ENERGY, INC. AND SUBSIDIARIES
NOTES TO CONSOLIDATED FINANCIAL STATEMENTS—CONTINUED
(unaudited)
NOTE 15—NET INCOME (LOSS) PER SHARE ATTRIBUTABLE TO COMMON STOCKHOLDERS
Basic net income (loss) per share attributable to common stockholders (“EPS”) excludes dilution and is computed by dividing net income (loss) attributable to common stockholders by the weighted average number of common shares outstanding during the period. Diluted EPS reflects potential dilution and is computed by dividing net income (loss) attributable to common stockholders by the weighted average number of common shares outstanding during the period increased by the number of additional common shares that would have been outstanding if the potential common shares had been issued. The dilutive effect of unvested stock is calculated using the treasury-stock method and the dilutive effect of convertible securities is calculated using the if-converted method.
The following table reconciles basic and diluted weighted average common shares outstanding for the three and six months ended June 30,March 31, 2020 and 2019 and 2018 (in millions, except per share data):
| | | | | Three Months Ended June 30, | | Six Months Ended June 30, | | Three Months Ended March 31, |
| | | 2019 | | 2018 | | 2019 | | 2018 | | 2020 | | 2019 |
| Weighted average common shares outstanding: | | | | | | | | | | | | |
| Basic | | 257.4 |
| | 242.8 |
| | 257.3 |
| | 239.2 |
| | 253.0 |
| | 257.1 |
|
| Dilutive unvested stock | | — |
| | — |
| | 1.3 |
| | 2.5 |
| | 1.1 |
| | 1.4 |
|
| Dilutive convertible securities | | | 45.5 |
| | — |
|
| Diluted | | 257.4 |
| | 242.8 |
| | 258.6 |
| | 241.7 |
| | 299.6 |
| | 258.5 |
|
| | | | | | | | | | | | | |
| Basic net income (loss) per share attributable to common stockholders | | $ | (0.44 | ) | | $ | (0.07 | ) | | $ | 0.11 |
| | $ | 1.42 |
| |
| Diluted net income (loss) per share attributable to common stockholders | | $ | (0.44 | ) | | $ | (0.07 | ) | | $ | 0.11 |
| | $ | 1.40 |
| |
| Basic net income per share attributable to common stockholders | | | $ | 1.48 |
| | $ | 0.55 |
|
| Diluted net income per share attributable to common stockholders | | | $ | 1.43 |
| | $ | 0.54 |
|
CHENIERE ENERGY, INC. AND SUBSIDIARIES
NOTES TO CONSOLIDATED FINANCIAL STATEMENTS—CONTINUED
(unaudited)
Potentially dilutive securities that were not included in the diluted net income (loss) per share computations because their effects would have been anti-dilutive were as follows (in millions):
| | | | | Three Months Ended June 30, | | Six Months Ended June 30, | | Three Months Ended March 31, |
| | | 2019 | | 2018 | | 2019 | | 2018 | | 2020 | | 2019 |
| Unvested stock (1) | | 3.8 |
| | 5.2 |
| | 3.8 |
| | 2.6 |
| | 2.1 |
| | 2.4 |
|
| Convertible notes (2) | | 17.8 |
| | 17.2 |
| | 17.8 |
| | 17.2 |
| | — |
| | 17.7 |
|
| Total potentially dilutive common shares | | 21.6 |
| | 22.4 |
| | 21.6 |
| | 19.8 |
| | 2.1 |
| | 20.1 |
|
| |
| (1) | Does not include 0.7 million shares and 0.6 million shares for each of the three and six months ended June 30,March 31, 2020 and 2019, and 0.4 million shares for each of the three and six months ended June 30, 2018respectively, of unvested stock because the performance conditions had not yet been satisfied as of June 30, 2019 and 2018, respectively.the respective dates. |
| |
| (2) | Includes number of shares in aggregate issuable upon conversion of the 2021 Cheniere Convertible Unsecured Notes and the 2045 Cheniere Convertible Senior Notes. There were no shares included in the computation of diluted net income (loss) per shareNotes for all periods presented and additionally the 2025 CCH HoldCo II Convertible Senior Notes because substantive non-market-based contingencies underlyingfor the eligible conversion date have not been met asthree months ended March 31, 2020, following the substantial completion of June 30,Train 2 of the CCL Project in August 2019. |
NOTE 16—SHARE REPURCHASE PROGRAM
On June 3, 2019, we announced that our Board authorized a 3-year, $1.0 billion share repurchase program. During the three months ended March 31, 2020, we repurchased an aggregate of 2.9 million shares of our common stock for $155 million, for a weighted average price per share of $53.88.
As of March 31, 2020, we had up to $596 million of the share repurchase program available. Under the share repurchase program, repurchases can be made from time to time using a variety of methods, which may include open market purchases, privately negotiated transactions or otherwise, all in accordance with the rules of the SEC and other applicable legal requirements. The timing and amount of any shares of our common stock that are repurchased under the share repurchase program will be determined by our management based on market conditions and other factors. The share repurchase program does not obligate us to acquire any particular amount of common stock, and may be modified, suspended or discontinued at any time or from time to time at our discretion.
NOTE 17—COMMITMENTS AND CONTINGENCIES
We have various contractual obligations which are recorded as liabilities in our Consolidated Financial Statements. Other items, such as certain purchase commitments and other executed contracts which do not meet the definition of a liability as of June 30, 2019,March 31, 2020, are not recognized as liabilities but require disclosures in our Consolidated Financial Statements.
Environmental and Regulatory Matters
Our LNG terminals and pipelines are subject to extensive regulation under federal, state and local statutes, rules, regulations and laws. These laws require that we engage in consultations with appropriate federal and state agencies and that we obtain and maintain applicable permits and other authorizations. Failure to comply with such laws could result in legal proceedings, which may include substantial penalties. We believe that, based on currently known information, compliance with these laws and regulations will not have a material adverse effect on our results of operations, financial condition or cash flows.
Legal Proceedings
We are, and may in the future be, involved as a party to various legal proceedings, which are incidental to the ordinary course of business. We regularly analyze current information and, as necessary, provide accruals for probable liabilities on the eventual disposition of these matters. While the results of these litigation matters and claims cannot be predicted with certainty, we believe the reasonably possible losses from such matters, individually and in the aggregate, are not material. Additionally, we believe the probable final outcome of such matters will not have a material adverse effect on our consolidated results of operations, financial position or cash flows.
CHENIERE ENERGY, INC. AND SUBSIDIARIES
NOTES TO CONSOLIDATED FINANCIAL STATEMENTS—CONTINUED
(unaudited)
Parallax Litigation
In 2015, our wholly owned subsidiary, Cheniere LNG Terminals, LLC (“CLNGT”), entered into discussions with Parallax Enterprises, LLC (“Parallax Enterprises”) regarding the potential joint development of two liquefaction plants in Louisiana (the “Potential Liquefaction Transactions”). While the parties negotiated regarding the Potential Liquefaction Transactions, CLNGT loaned Parallax Enterprises approximately $46 million, as reflected in a secured note dated April 23, 2015, as amended on June 30, 2015, September 30, 2015 and November 4, 2015 (the “Secured Note”). The Secured Note was secured by all assets of Parallax Enterprises and its subsidiary entities. On June 30, 2015, Parallax Enterprises’ parent entity, Parallax Energy LLC (“Parallax Energy”), executed a Pledge and Guarantee Agreement further securing repayment of the Secured Note by providing a parent guaranty and a pledge of all of the equity of Parallax Enterprises in satisfaction of the Secured Note (the “Pledge Agreement”). CLNGT and Parallax Enterprises never executed a definitive agreement to pursue the Potential Liquefaction Transactions. The Secured Note matured on December 11, 2015, and Parallax Enterprises failed to make payment. On February 3, 2016, CLNGT filed an action against Parallax Energy, Parallax Enterprises and certain of Parallax Enterprises’ subsidiary entities, styled Cause No. 4:16-cv-00286, Cheniere LNG Terminals, LLC v. Parallax Energy LLC, et al., in the United States District Court for the Southern District of Texas (the “Texas Federal Suit”). CLNGT asserted claims in the Texas Federal Suit for (1) recovery of all amounts due under the Secured Note and (2) declaratory relief establishing that CLNGT is entitled to enforce its rights under the Secured Note and Pledge Agreement in accordance with each instrument’s terms and that CLNGT has no obligations of any sort to Parallax Enterprises concerning the Potential Liquefaction Transactions. On March 11, 2016, Parallax Enterprises and the other defendants in the Texas Federal Suit moved to dismiss the suit for lack of subject matter jurisdiction. On August 2, 2016, the court denied the defendants’ motion to dismiss without prejudice and permitted the parties to pursue jurisdictional discovery.
On March 11, 2016, Parallax Enterprises filed a suit against us and CLNGT styled Civil Action No. 62-810, Parallax Enterprises LLP v. Cheniere Energy, Inc. and Cheniere LNG Terminals, LLC, in the 25th Judicial District Court of Plaquemines Parish, Louisiana (the “Louisiana Suit”), wherein Parallax Enterprises asserted claims for breach of contract, fraudulent inducement, negligent misrepresentation, detrimental reliance, unjust enrichment and violation of the Louisiana Unfair Trade Practices Act. Parallax Enterprises predicated its claims in the Louisiana Suit on an allegation that we and CLNGT breached a purported agreement to jointly develop the Potential Liquefaction Transactions. Parallax Enterprises sought $400 million in alleged economic damages and rescission of the Secured Note. On April 15, 2016, we and CLNGT removed the Louisiana Suit to the United States District Court for the Eastern District of Louisiana, which subsequently transferred the Louisiana Suit to the United States District Court for the Southern District of Texas, where it was assigned Civil Action No. 4:16-cv-01628 and transferred to the same judge presiding over the Texas Federal Suit for coordinated handling. On August 22, 2016, Parallax Enterprises voluntarily dismissed all claims asserted against CLNGT and us in the Louisiana Suit without prejudice to refiling.
On July 27, 2017, the Parallax entities named as defendants in the Texas Federal Suit reurged their motion to dismiss and simultaneously filed counterclaims against CLNGT and third party claims against us for breach of contract, breach of fiduciary duty, promissory estoppel, quantum meruit and fraudulent inducement of the Secured Note and Pledge Agreement, based on substantially the same factual allegations Parallax Enterprises made in the Louisiana Suit. These Parallax entities also simultaneously filed an action styled Cause No. 2017-49685, Parallax Enterprises, LLC, et al. v. Cheniere Energy, Inc., et al., in the 61st District Court of Harris County, Texas (the “Texas State Suit”), which asserts substantially the same claims these entities asserted in the Texas Federal Suit. On July 31, 2017, CLNGT withdrew its opposition to the dismissal of the Texas Federal Suit without prejudice on jurisdictional grounds and the federal court subsequently dismissed the Texas Federal Suit without prejudice. We and CLNGT simultaneously filed an answer and counterclaims in the Texas State Suit, asserting the same claims CLNGT had previously asserted in the Texas Federal Suit. Additionally, CLNGT filed third party claims against Parallax principals Martin Houston, Christopher Bowen Daniels, Howard Candelet and Mark Evans, as well as Tellurian Investments, Inc., Driftwood LNG, LLC, Driftwood LNG Pipeline LLC and Tellurian Services LLC, formerly known as Parallax Services LLC, including claims for tortious interference with CLNGT’s collateral rights under the Secured Note and Pledge Agreement, fraudulent transfer, conspiracy/aiding and abetting. Discovery in the Texas State Suit is ongoing. Trial is currently set for February 2020.
On February 15, 2019, we filed an action with CLNGT against Charif Souki, our former Chairman of the Board and Chief Executive Officer, styled, Cause No. 2019-11529, Cheniere Energy, Inc. and Cheniere LNG Terminals, LLC v. Charif Souki, in the 55th District Court of Harris County, Texas, which asserts claims of breach of fiduciary duties, fraudulent transfer, tortious interference with CLNGT’s collateral rights under the Secured Note and Pledge Agreement and conspiracy/aiding and abetting. On April 29, 2019, the court consolidated the Souki matter with the earlier filed pending case against Parallax, Tellurian and the individual defendants in the Texas State Suit.
CHENIERE ENERGY, INC. AND SUBSIDIARIES
NOTES TO CONSOLIDATED FINANCIAL STATEMENTS—CONTINUED
(unaudited)
We do not expect that the resolution of any of the foregoing litigation will have a material adverse impact on our financial results.
NOTE 17—18—CUSTOMER CONCENTRATION
The following table shows customers with revenues of 10% or greater of total revenues from external customers and customers with accounts receivable balances of 10% or greater of total accounts receivable from external customers:
| | | | | Percentage of Total Revenues from External Customers | | Percentage of Accounts Receivable from External Customers | Percentage of Total Revenues from External Customers | | Percentage of Accounts Receivable from External Customers |
| | | Three Months Ended June 30, | | Six Months Ended June 30, | | June 30, | | December 31, | Three Months Ended March 31, | | March 31, | | December 31, |
| | | 2019 | | 2018 | | 2019 | | 2018 | | 2019 | | 2018 | 2020 | | 2019 | | 2020 | | 2019 |
| Customer A | | 17% | | 21% | | 18% | | 19% | | 11% | | 21% | 16% | | 20% | | 12% | | 13% |
| Customer B | | 11% | | 17% | | 11% | | 14% | | 15% | | 14% | * | | 12% | | * | | * |
| Customer C | | 11% | | 18% | | 12% | | 22% | | 15% | | 18% | * | | 12% | | 15% | | 13% |
| Customer D | | 12% | | 16% | | 13% | | 11% | | 14% | | * | * | | 14% | | * | | * |
| Customer E | | * | | * | | * | | * | | 13% | | * | |
| Customer F | | * | | * | | * | | * | | * | | 10% | |
* Less than 10%
NOTE 18—19—SUPPLEMENTAL CASH FLOW INFORMATION
The following table provides supplemental disclosure of cash flow information (in millions):
| | | | | Six Months Ended June 30, | | Three Months Ended March 31, |
| | | 2019 | | 2018 | | 2020 | | 2019 |
| Cash paid during the period for interest on debt and finance leases, net of amounts capitalized | | $ | 271 |
| | $ | 282 |
| |
| Cash paid during the period for interest on debt, net of amounts capitalized | | | $ | 295 |
| | $ | 108 |
|
| Cash paid for income taxes | | 20 |
| | 4 |
| | 1 |
| | 20 |
|
The balance in property, plant and equipment, net funded with accounts payable and accrued liabilities was $958$255 million and $935$509 million as of June 30,March 31, 2020 and 2019, and 2018, respectively.
See Note 11—Leases for our supplemental cash flow information related to our leases.
| |
| ITEM 2. | MANAGEMENT’S DISCUSSION AND ANALYSIS OF FINANCIAL CONDITION AND RESULTS OF OPERATIONS |
Information Regarding Forward-Looking Statements
This quarterly report contains certain statements that are, or may be deemed to be, “forward-looking statements” within the meaning of Section 27A of the Securities Act of 1933, as amended (the “Securities Act”), and Section 21E of the Securities Exchange Act of 1934, as amended (the “Exchange Act”). All statements, other than statements of historical or present facts or conditions, included herein or incorporated herein by reference are “forward-looking statements.” Included among “forward-looking statements” are, among other things:
statements that we expect to commence or complete construction of our proposed LNG terminals, liquefaction facilities, pipeline facilities or other projects, or any expansions or portions thereof, by certain dates, or at all;
statements regarding future levels of domestic and international natural gas production, supply or consumption or future levels of LNG imports into or exports from North America and other countries worldwide or purchases of natural gas, regardless of the source of such information, or the transportation or other infrastructure or demand for and prices related to natural gas, LNG or other hydrocarbon products;
statements regarding any financing transactions or arrangements, or our ability to enter into such transactions;
statements regarding the amount and timing of share repurchases;
statements relating to the construction of our Trains and pipelines, including statements concerning the engagement of any EPC contractor or other contractor and the anticipated terms and provisions of any agreement with any EPC or other contractor, and anticipated costs related thereto;
statements regarding any SPA or other agreement to be entered into or performed substantially in the future, including any revenues anticipated to be received and the anticipated timing thereof, and statements regarding the amounts of total LNG regasification, natural gas liquefaction or storage capacities that are, or may become, subject to contracts;
statements regarding counterparties to our commercial contracts, construction contracts, and other contracts;
statements regarding our planned development and construction of additional Trains andor pipelines, including the financing of such Trains or pipelines;
statements that our Trains, when completed, will have certain characteristics, including amounts of liquefaction capacities;
statements regarding our business strategy, our strengths, our business and operation plans or any other plans, forecasts, projections, or objectives, including anticipated revenues, capital expenditures, maintenance and operating costs and cash flows, any or all of which are subject to change;
statements regarding legislative, governmental, regulatory, administrative or other public body actions, approvals, requirements, permits, applications, filings, investigations, proceedings or decisions;
statements regarding our anticipated LNG and natural gas marketing activities;
statements regarding the outbreak of volumes expected to be made available toCOVID-19 and its impact on our integrated marketing function;business and operating results, including any customers not taking delivery of LNG cargoes, the ongoing credit worthiness of our contractual counterparties, any disruptions in our operations or construction of our Trains and the health and safety of our employees, and on our customers, the global economy and the demand for LNG; and
| |
| • | any other statements that relate to non-historical or future information. |
All of these types of statements, other than statements of historical or present facts or conditions, are forward-looking statements. In some cases, forward-looking statements can be identified by terminology such as “may,” “will,” “could,” “should,” “achieve,” “anticipate,” “believe,” “contemplate,” “continue,” “estimate,” “expect,” “intend,” “plan,” “potential,” “predict,” “project,” “pursue,” “target,” the negative of such terms or other comparable terminology. The forward-looking statements contained in this quarterly report are largely based on our expectations, which reflect estimates and assumptions made by our management. These estimates and assumptions reflect our best judgment based on currently known market conditions and other factors. Although we believe that such estimates are reasonable, they are inherently uncertain and involve a number of risks and uncertainties beyond our control. In addition, assumptions may prove to be inaccurate. We caution that the forward-looking
statements contained in this quarterly report are not guarantees of future performance and that such statements may not be realized or the forward-looking statements or events may not occur. Actual results may differ materially from those anticipated or implied in forward-looking statements as a result of a variety of factors described in this quarterly report and in the other reports and other information that we file with the SEC, including those discussed under “Risk Factors” in our annual report on Form 10-K for the year ended December 31, 20182019. All forward-looking statements attributable to us or persons acting on our behalf are expressly qualified in their entirety by these risk factors. These forward-looking statements speak only as of the date made, and other than
as required by law, we undertake no obligation to update or revise any forward-looking statement or provide reasons why actual results may differ, whether as a result of new information, future events or otherwise.
Introduction
The following discussion and analysis presents management’s view of our business, financial condition and overall performance and should be read in conjunction with our Consolidated Financial Statements and the accompanying notes. This information is intended to provide investors with an understanding of our past performance, current financial condition and outlook for the future. Our discussion and analysis includes the following subjects:
Overview of Business
Overview of Significant Events
Impact of COVID-19 and Market Environment
Liquidity and Capital Resources
Results of Operations
Off-Balance Sheet Arrangements
Summary of Critical Accounting Estimates
Recent Accounting Standards
Overview of Business
Cheniere, a Delaware corporation, is a Houston-based energy infrastructure company primarily engaged in LNG-related businesses. Our vision is toWe provide clean, secure and affordable LNG to integrated energy companies, utilities and energy trading companies around the world. We aspire to the world, while responsiblyconduct our business in a safe and responsible manner, delivering a reliable, competitive and integrated source of LNG in a safe and rewarding work environment.to our customers. We own and operate the Sabine Pass LNG terminal in Louisiana, one of the largest LNG production facilities in the world, through our ownership interest in and management agreements with Cheniere Partners, which is a publicly traded limited partnership that we created in 2007. As of June 30, 2019,March 31, 2020, we owned 100% of the general partner interest and 48.6% of the limited partner interest in Cheniere Partners. We also own and operate the Corpus Christi LNG terminal in Texas, which is wholly owned by us. The liquefaction of natural gas into LNG allows it to be shipped economically from the United States where natural gas is abundant and inexpensive to produce to our international customers in areas where natural gas demand and infrastructure exist.
The Sabine Pass LNG terminal is located in Cameron Parish, Louisiana, on the Sabine-Neches Waterway less than four miles from the Gulf Coast. Cheniere Partners, through its subsidiary SPL, is in various stages of constructing andcurrently operating sixfive natural gas liquefaction facilitiesTrains and is constructing one additional Train for a total production capacity of approximately 30 mtpa of LNG (the “SPL Project”) at the Sabine Pass LNG terminal adjacent to the existing regasification facilities through a wholly owned subsidiary, SPL. Trains 1 through 5 are operational and Train 6 is under construction. Each Train is expected to have a nominal production capacity, which is prior to adjusting for planned maintenance, production reliability, potential overdesign and debottlenecking opportunities, of approximately 4.5 mtpa of LNG per Train.terminal. The Sabine Pass LNG terminal has operational regasification facilities owned by Cheniere Partners’ wholly owned subsidiary, SPLNG, that include pre-existing infrastructure of five LNG storage tanks with aggregate capacity of approximately 16.917 Bcfe, two marine berths that can each accommodate vessels with nominal capacity of up to 266,000 cubic meters and vaporizers with regasification capacity of approximately 4.04 Bcf/d. Cheniere Partners also owns a 94-mile pipeline through its subsidiary, CTPL, that interconnects the Sabine Pass LNG terminal with a number of large interstate pipelines through a wholly owned subsidiary, CTPL.pipelines.
We also own and operate a second natural gas liquefaction and export facility at the Corpus Christi LNG terminal near Corpus Christi, Texas, and operateare currently operating two Trains and are constructing one additional Train for a total production capacity of approximately 15 mtpa of LNG. Additionally, we are operating a 23-mile natural gas supply pipeline that interconnects the Corpus Christi LNG terminal with several interstate and intrastate natural gas pipelines (the “Corpus Christi Pipeline” and together with the liquefaction facilities,Trains, the “CCL Project”) through our wholly owned subsidiaries CCL and CCP, respectively. The CCL Project, is being developed in stages with the first phase being three Trains (“Phase 1”),once fully constructed, will contain three LNG storage tanks with aggregate capacity of approximately 10.110 Bcfe and two marine berths that can each accommodate vessels with nominal capacity of up to 266,000 cubic meters. The first stage (“Stage 1”) includes Trains 1 and 2, two LNG storage tanks, one complete marine berth and a second partial berth and all of the CCL Project’s necessary infrastructure facilities. The second stage (“Stage 2”) includes Train 3, one LNG storage tank and the completion of the second partial berth. Train 1 is operational, Train 2 is undergoing commissioning and Train 3 is under construction. Each Train is expected to have a nominal production capacity, which is prior to adjusting for planned maintenance, production reliability, potential overdesign and debottlenecking opportunities, of approximately 4.5 mtpa of LNG per Train.
We have contracted approximately 85% of the expected aggregate nominaltotal production capacity from the SPL Project and the CCL Project (collectively, the “Liquefaction Projects”) on a long-termterm basis. This includes volumes contracted under SPAs in which the customers are required to pay a fixed fee with respect to the contracted volumes irrespective of their election to cancel or suspend deliveries of LNG cargoes, as well as volumes contracted under integrated production marketing (“IPM”) gas supply agreements.
Additionally, separate from the CCH Group, we are developing an expansion of the Corpus Christi LNG terminal adjacent to the CCL Project (“Corpus Christi Stage 3”) and filed an application with FERC in June 2018through our subsidiary CCL Stage III for up to seven midscale Trains with an expected aggregate nominaltotal production capacity of approximately 9.510 mtpa of LNG. We received approval from FERC in November 2019 to site, construct and one LNG storage tank.
We have made an equity investment in Midship Holdings, LLC (“Midship Holdings”), which managesoperate the business and affairs of Midship Pipeline Company, LLC (“Midship Pipeline”). Midship Pipeline is constructing a pipeline (the “Midship Project”) with expected capacity of up to 1.44 million Dekatherms per day that will connect new gas production in the Anadarko Basin to Gulf Coast markets, including markets serving the Liquefaction Projects. Construction of the Midship Project commenced in the first quarter of 2019.expansion project.
We remain focused on expansionoperational excellence and customer satisfaction. Increasing demand of LNG has allowed us to expand our existing sites by leveraging existing infrastructure.liquefaction infrastructure in a financially disciplined manner. We continue to considerhold significant land positions at both the Sabine Pass LNG terminal and the Corpus Christi LNG terminal which provide opportunity for further liquefaction capacity expansion. The development of these sites or other projects, including infrastructure projects in support of natural gas supply and LNG demand, which,will require, among other things, will require acceptable commercial and financing arrangements before we can make a final investment decision (“FID”).
Overview of Significant Events
Our significant accomplishmentsevents since January 1, 20192020 and through the filing date of this Form 10-Q include the following:
Strategic
In June 2019, our board of directors (the “Board”) appointed Michele A. Evans to serve as a member of the Board. Ms. Evans was also appointed to the Audit Committee and the Governance and Nominating Committee of the Board.
In May 2019, our wholly owned subsidiary CCL Stage III entered into an integrated production marketing transaction with Apache Corporation to purchase 140,000 MMBtu per day of natural gas, for a term of approximately 15 years, at a price based on international LNG indices, net of a fixed liquefaction fee and certain costs incurred by Cheniere.
In May 2019, the board of directors of the general partner of Cheniere Partners made a positive FID with respect to Train 6 of the SPL Project and issued a full notice to proceed with construction to Bechtel Oil, Gas and Chemicals, Inc. (“Bechtel”) in June 2019.
In March 2019, we received a positive Environmental Assessment from the FERC relating to Corpus Christi Stage 3 and anticipate receiving all remaining necessary regulatory approvals for the project by the end of 2019.
In February 2019,April 2020, Midship Pipeline Company, LLC, in which we holdhave an indirect equity interest, issued full notice to proceed to constructinvestment, placed into service the Midship natural gas pipeline and related compression and interconnect facilities following receipt of final Notice to Proceed from the FERC and obtaining financing to construct the Midship Project.facilities.
Operational
As of July 31, 2019, over 750April 27, 2020, more than 1,100 cumulative LNG cargoes totaling over 75 million tonnes of LNG have been produced, loaded and exported from the Liquefaction Projects.
Financial
In June 2019, first LNG production from Train 2March 2020, SPL entered into a $1.2 billion Working Capital Revolving Credit and Letter of Credit Reimbursement Agreement (the “2020 SPL Working Capital Facility”), which refinanced its previous working capital facility, reduced the CCL Project occurred,interest rate and extended the first commissioning cargo from Train 2 was exported.maturity date to March 2025.
In February 20192020, the amended and March 2019, CCL and SPL achieved substantial completion of Train 1 of the CCL Project and Train 5 of the SPL Project, respectively, and commenced operating activities.
Financial
In June 2019, we announced a capital allocation framework which prioritizes investments in the growth of our liquefaction platform, improvement of consolidated leverage metrics, and a return of excess capital to shareholders under a three-year, $1.0 billion share repurchase program.
In June 2019, the date of first commercial delivery was reached under the 20-year SPAs with Endesa S.A. and PT Pertamina (Persero) relating to Train 1 of the CCL Project.
In June 2019, CCH and its subsidiaries, as guarantors, entered into arestated note purchase agreement (“CCH Note Purchase Agreement”) with Allianz Global Investors GmbH to issue an aggregate principal amount of $727 million of 4.80%for the 11.0% Convertible Senior Secured Notes due 20392025 (the “2039“2025 CCH HoldCo II Convertible Senior Notes”), with closing and funding of was amended to allow CCH HoldCo II the 2039 CCH Senior Notes conditional in part on the 2039 CCH Senior Notes receiving at least two investment grade ratings within 18 months of the date of the CCH Note Purchase Agreement.
In May 2019, Cheniere Partners entered into five-year, $1.5 billion credit facilities (the “2019 CQP Credit Facilities”), which consist of a $750 million delayed draw term loan (“CQP Term Facility”) and a $750 million revolving credit facility (“CQP Revolving Facility”),option to fundredeem all or a portion of the development and constructionoutstanding notes with cash at a price of Train 6, a third LNG berth and supporting infrastructure$1,080 per $1,000 principal amount, at the SPL Project.time of any CCH HoldCo II- or noteholder-initiated conversion through September 2, 2020. In March 2020, CCH HoldCo II redeemed an aggregate outstanding principal amount of $300 million with cash.
Impact of COVID-19 and Market Environment
The business environment in which we operate has been impacted by the recent downturn in the energy market as well as the outbreak of COVID-19 and its progression into a pandemic in March 2020. As a result of these developments, our growth estimates for LNG in 2020 have moderated from previous expectations. Annual LNG demand grew by 13% in 2019 to approximately 360 mtpa. In a report published in the month of April 2020, IHS Markit projected LNG demand in 2020 to reach 363 mtpa, down from a pre-COVID-19 estimate of approximately 377 mtpa. This implies a year-over-year rate of growth of approximately 0.8% in 2020 compared to the implied 4.7% pre-COVID-19 year-over-year growth estimate. While worldwide demand increased by approximately 10% during the three months ended March 31, 2020 compared to the comparable period of 2019, we expect to potentially see year-over-year declines in some future quarters as reduced economic activity affects LNG demand and high storage inventory levels reduce the need for imports. The robust LNG supply additions over the past several years, along with warmer winters and now strict virus containment measures, have exerted downward pressure on global gas prices. As an example, the Dutch Title Transfer Facility (“TTF”), a virtual trading point for natural gas in the Netherlands, averaged $3.35 during the quarter ended March 31, 2020, 51% lower than the comparable period of 2019, while the Japan Korean Marker (“JKM”), an LNG benchmark price assessment for spot physical cargoes delivered ex-ship into certain key markets in Asia, averaged $4.82 during the three months ended March 31, 2020, 43% lower than the comparable period of 2019. As a result of the weaker LNG market environment,
as well as customer-specific variables, we have recently experienced an increase in the number of LNG cargoes for which our customers have notified us they will not take delivery. While this may impact our expected LNG production, we do not expect it to have a material impact on our forecasted financial results for 2020, due to the highly contracted nature of our business and the fact that customers continue to be obligated to pay fixed fees for cargoes in relation to which they have exercised their contractual right to cancel. Revenue associated with canceled LNG cargoes is generally recognized upon notice of customer cancellation. During the three months ended March 31, 2020, we recognized revenue of approximately $53 million associated with canceled LNG cargoes.
In addition, in response to the COVID-19 pandemic, we have modified certain business and workforce practices to protect the safety and welfare of our employees who continue to work at our facilities and offices worldwide, as well as implemented certain mitigation efforts to ensure business continuity. In March 2019,2020, we began consulting with a medical advisor, and implemented social distancing through revised shift schedules, work from home policies and designated remote work locations where appropriate, restricted non-essential business travel and began requiring self-screening for employees and contractors. In April 2020, we began utilizing temporary on-site housing for our workforce at our facilities, implemented temperature testing, incorporated medical and social workers to support employees, enforced prior self-isolation and screening for on-site housing and implemented marine operations with zero contact during loading activities. These measures have resulted in increased costs, which we expect to continue until the daterisks associated with the COVID-19 pandemic diminish. As of first commercial delivery was reached under the 20-year SPA with BG Gulf Coast LNG, LLC relating to Train 4April 28, 2020, we have incurred approximately $30 million of the SPL Project.such costs.
Liquidity and Capital Resources
Although results are consolidated for financial reporting, Cheniere, Cheniere Partners, SPL and the CCH Group operate with independent capital structures. Our capital requirements include capital and investment expenditures, repayment of long-term debt and repurchase of our shares. We expect the cash needs for at least the next twelve months will be met for each of these independent capital structures as follows:
SPL through project debt and borrowings, operating cash flows and equity contributions from Cheniere Partners;
Cheniere Partners through operating cash flows from SPLNG, SPL and CTPL and debt or equity offerings;
CCH Group through operating cash flows from CCL and CCP, project debt and borrowings and equity contributions from Cheniere; and
Cheniere through project financing, existing unrestricted cash, debt and equity offerings by us or our subsidiaries, operating cash flows, borrowings, services fees from our subsidiaries and distributions from our investment in Cheniere Partners.
The following table provides a summary of our liquidity position at June 30, 2019March 31, 2020 and December 31, 20182019 (in millions):
| | | | June 30, | | December 31, | March 31, | | December 31, |
| | 2019 | | 2018 | 2020 | | 2019 |
Cash and cash equivalents | $ | 2,279 |
| | $ | 981 |
| $ | 2,399 |
| | $ | 2,474 |
|
| Restricted cash designated for the following purposes: | | | | | | |
| SPL Project | 596 |
| | 756 |
| 109 |
| | 181 |
|
| Cheniere Partners and cash held by guarantor subsidiaries | — |
| | 785 |
| |
| CCL Project | 279 |
| | 289 |
| 94 |
| | 80 |
|
| Other | 286 |
| | 345 |
| 227 |
| | 259 |
|
| Available commitments under the following credit facilities: | | | | | | |
| $1.2 billion SPL Working Capital Facility (“SPL Working Capital Facility”) | 785 |
| | 775 |
| |
| $1.5 billion 2019 CQP Credit Facilities | 851 |
| | — |
| |
| $2.8 billion Cheniere Partners’ Credit Facilities (“2016 CQP Credit Facilities”) | — |
| | 115 |
| |
| Amended and restated CCH Credit Facility (“CCH Credit Facility”) | — |
| | 982 |
| |
| $1.2 billion Amended and Restated SPL Working Capital Facility (“2015 SPL Working Capital Facility”) | | — |
| | 786 |
|
2020 SPL Working Capital Facility
| | 786 |
| | — |
|
| CQP Credit Facilities executed in 2019 (“2019 CQP Credit Facilities”) | | 750 |
| | 750 |
|
| $1.2 billion CCH Working Capital Facility (“CCH Working Capital Facility”) | 862 |
| | 716 |
| 660 |
| | 729 |
|
| $1.25 billion Cheniere Revolving Credit Facility (“Cheniere Revolving Credit Facility”) | 1,250 |
| | 1,250 |
| 430 |
| | 665 |
|
| |
| (1) | Amounts presented include balances held by our consolidated variable interest entity (“VIE”), Cheniere Partners as discussed in Note 8—Non-controlling Interest and Variable Interest Entity of our Notes to Consolidated Financial Statements. As of March 31, 2020 and December 31, 2019, assets of Cheniere Partners, which are included in our Consolidated Balance Sheets, included $1.7 billion and $1.8 billion, respectively, of cash and cash equivalents. |
For additional information regarding our debt agreements, see Note 10—Debt of our Notes to Consolidated Financial Statements in this quarterly report and Note 12—11—Debt of our Notes to Consolidated Financial Statements in our annual report on Form 10-K for the year ended December 31, 2018.2019.
Cheniere
Convertible Notes
In November 2014, we issued an aggregate principal amount of $1.0 billion of Convertible Unsecured Notes due 2021 (the “2021 Cheniere Convertible Unsecured Notes”). The 2021 Cheniere Convertible Unsecured Notes are convertible at the option of the holder into our common stock at the then applicable conversion rate, provided that the closing price of our common stock is greater than or equal to the conversion price on the date of conversion. In March 2015, we issued $625 million aggregate
principal amount of 4.25% Convertible Senior Notes due 2045 (the “2045 Cheniere Convertible Senior Notes”). We have the right, at our option, at any time after March 15, 2020, to redeem all or any part of the 2045 Cheniere Convertible Senior Notes at a redemption price equal to the accreted amount of the 2045 Cheniere Convertible Senior Notes to be redeemed, plus accrued and unpaid interest, if any, to such redemption date. We have the option to satisfy the conversion obligation for the 2021 Cheniere Convertible Unsecured Notes and the 2045 Cheniere Convertible Senior Notes with cash, common stock or a combination thereof.
Cheniere Revolving Credit Facility
In December 2018, we amended and restated the Cheniere Revolving Credit Facility to increase total commitments under the Cheniere Revolving Credit Facility from $750 million to $1.25 billion. The Cheniere Revolving Credit Facility is intended to fund, through loans and letters of credit, equity capital contributions to CCH HoldCo II and its subsidiaries for the development of the CCL Project and, provided that certain conditions are met, for general corporate purposes.
The Cheniere Revolving Credit Facility matures on December 13, 2022 and contains representations, warranties and affirmative and negative covenants customary for companies like us with lenders of the type participating in the Cheniere Revolving Credit Facility that limit our ability to make restricted payments, including distributions, unless certain conditions are satisfied, as well as limitations on indebtedness, guarantees, hedging, liens, investments and affiliate transactions. Under the Cheniere Revolving Credit Facility, we are required to ensure that the sum of our unrestricted cash and the amount of undrawn commitments under the Cheniere Revolving Credit Facility is at least equal to the lesser of (1) 20% of the commitments under the Cheniere Revolving Credit Facility and (2) $200 million (the “Liquidity Covenant”).
From and after the time at which certain specified conditions are met (the “Trigger Point”), we will have increased flexibility under the Cheniere Revolving Credit Facility to, among other things, (1) make restricted payments and (2) raise incremental commitments. The Trigger Point will occur once (1) completion has occurred for each of Train 1 of the CCL Project (as defined in the CCH Indenture) and Train 5 of the SPL Project (as defined in SPL’s common terms agreement), which has occurred in February 2019 and March 2019, respectively; (2) the aggregate principal amount of outstanding loans plus drawn and unreimbursed letters of credit under the Cheniere Revolving Credit Facility is less than or equal to 10% of aggregate commitments under the Cheniere Revolving Credit Facility and (3) we elect on a go-forward basis to be governed by a non-consolidated leverage ratio covenant not to exceed 5.75:1.00 (the “Springing Leverage Covenant”), which following such election will apply at any time that the aggregate principal amount of outstanding loans plus drawn and unreimbursed letters of credit under the Cheniere Revolving Credit Facility is greater than 30% of aggregate commitments under the Cheniere Revolving Credit Facility. Following the Trigger Point, at any time that the Springing Leverage Covenant is in effect, the Liquidity Covenant will not apply.
The Cheniere Revolving Credit Facility is secured by a first priority security interest (subject to permitted liens and other customary exceptions) in substantially all of our assets, including our interests in our direct subsidiaries (excluding CCH HoldCo II and certain other subsidiaries).
Cash Receipts from Subsidiaries
Our ownership interest in the Sabine Pass LNG terminal is held through Cheniere Partners. As of June 30, 2019, we owned a 48.6% limited partner interest in Cheniere Partners in the form of 104.5 million common units and 135.4 million subordinated units. We also own 100% of the general partner interest and the incentive distribution rights in Cheniere Partners. We are eligible to receive quarterly equity distributions from Cheniere Partners related to our ownership interests and our incentive distribution rights.
We also receive fees for providing management services to some of our subsidiaries. We received $36 million and $38 million in total service fees from these subsidiaries during each of the six months ended June 30, 2019 and 2018, respectively.
Share Repurchase Authorization
On June 3, 2019, we announced that our Board authorized a 3-year, $1.0 billion share repurchase program. During the three months ended June 30, 2019, we repurchased an aggregate of 44,600 shares of our common stock for $3 million, for a weighted average price per share of $68.30. As of June 30, 2019, we had $997 million of the share repurchase authorization available. Under the share repurchase program, repurchases can be made from time to time using a variety of methods, which may include open market purchases, privately negotiated transactions or otherwise, all in accordance with the rules of the SEC and other
applicable legal requirements. The timing and amount of any shares of our common stock that are repurchased under the share repurchase program will be determined by our management based on market conditions and other factors.
Cheniere Partners
CQP Senior Notes
The $1.5 billion of 5.250% Senior Notes due 2025 (the “2025 CQP Senior Notes”) and $1.1 billion of 5.625% Senior Notes due 2026 (the “2026 CQP Senior Notes”) (collectively, the “CQP Senior Notes”) are jointly and severally guaranteed by each of Cheniere Partners’ subsidiaries other than SPL (the “CQP Guarantors”) and, subject to certain conditions governing its guarantee, Sabine Pass LP. The CQP Senior Notes are governed by the same base indenture (the “CQP Base Indenture”). The 2025 CQP Senior Notes are further governed by the First Supplemental Indenture (together with the CQP Base Indenture, the “2025 CQP Notes Indenture”) and the 2026 CQP Senior Notes are further governed by the Second Supplemental Indenture (together with the CQP Base Indenture, the “2026 CQP Notes Indenture”). The 2025 CQP Notes Indenture and the 2026 CQP Notes Indenture contain customary terms and events of default and certain covenants that, among other things, limit the ability of Cheniere Partners and the CQP Guarantors to incur liens and sell assets, enter into transactions with affiliates, enter into sale-leaseback transactions and consolidate, merge or sell, lease or otherwise dispose of all or substantially all of the applicable entity’s properties or assets.
At any time prior to October 1, 2020 for the 2025 CQP Senior Notes and October 1, 2021 for the 2026 CQP Senior Notes, Cheniere Partners may redeem all or a part of the applicable CQP Senior Notes at a redemption price equal to 100% of the aggregate principal amount of the CQP Senior Notes redeemed, plus the “applicable premium” set forth in the respective indentures governing the CQP Senior Notes, plus accrued and unpaid interest, if any, to the date of redemption. In addition, at any time prior to October 1, 2020 for the 2025 CQP Senior Notes and October 1, 2021 for the 2026 CQP Senior Notes, Cheniere Partners may redeem up to 35% of the aggregate principal amount of the CQP Senior Notes with an amount of cash not greater than the net cash proceeds from certain equity offerings at a redemption price equal to 105.250% of the aggregate principal amount of the 2025 CQP Senior Notes and 105.625% of the aggregate principal amount of the 2026 CQP Senior Notes redeemed, plus accrued and unpaid interest, if any, to the date of redemption. Cheniere Partners also may at any time on or after October 1, 2020 through the maturity date of October 1, 2025 for the 2025 CQP Senior Notes and October 1, 2021 through the maturity date of October 1, 2026 for the 2026 CQP Senior Notes, redeem the CQP Senior Notes, in whole or in part, at the redemption prices set forth in the respective indentures governing the CQP Senior Notes.
The CQP Senior Notes are Cheniere Partners’ senior obligations, ranking equally in right of payment with Cheniere Partners’ other existing and future unsubordinated debt and senior to any of its future subordinated debt. After applying the proceeds from the 2026 CQP Senior Notes, the CQP Senior Notes became unsecured. In the event that the aggregate amount of Cheniere Partners’ secured indebtedness and the secured indebtedness of the CQP Guarantors (other than the CQP Senior Notes or any other series of notes issued under the CQP Base Indenture) outstanding at any one time exceeds the greater of (1) $1.5 billion and (2) 10% of net tangible assets, the CQP Senior Notes will be secured to the same extent as such obligations under the 2019 CQP Credit Facilities. The obligations under the 2019 CQP Credit Facilities are secured on a first-priority basis (subject to permitted encumbrances) with liens on substantially all the existing and future tangible and intangible assets and rights of Cheniere Partners and the CQP Guarantors and equity interests in the CQP Guarantors (except, in each case, for certain excluded properties set forth in the 2019 CQP Credit Facilities). The liens securing the CQP Senior Notes, if applicable, will be shared equally and ratably (subject to permitted liens) with the holders of other senior secured obligations, which include the 2019 CQP Credit Facilities obligations and any future additional senior secured debt obligations.
2016 CQP Credit Facilities
In May 2019, the remaining commitments under the 2016 CQP Credit Facilities were terminated.
2019 CQP Credit Facilities
In May 2019, Cheniere Partners entered into the 2019 CQP Credit Facilities, which consist of a $750 million term loan (“CQP Term Facility”) and a $750 million revolving credit facility (“CQP Revolving Facility”). Borrowings under the 2019 CQP Credit Facilities will be used to fund the development and construction of Train 6 of the SPL Project and subject to a sublimit, for general corporate purposes. The CQP Revolving Facility is also available for the issuance of letters of credit.
Loans under the 2019 CQP Credit Facilities will accrue interest at a variable rate per annum equal to LIBOR or the base rate (equal to the highest of the prime rate, the federal funds effective rate, as published by the Federal Reserve Bank of New York, plus 0.50%, and the adjusted one-month LIBOR plus 1.0%), plus the applicable margin. Under the CQP Term Facility, the applicable margin for LIBOR loans is 1.50% per annum, and the applicable margin for base rate loans is 0.50% per annum, in each case with a 0.25% step-up beginning on May 29, 2022. Under the CQP Revolving Facility, the applicable margin for LIBOR loans is 1.25% to 2.125% per annum, and the applicable margin for base rate loans is 0.25% to 1.125% per annum, in each case depending on the then-current rating of Cheniere Partners. Interest on LIBOR loans is due and payable at the end of each applicable LIBOR period (and at the end of every three month period within the LIBOR period, if any), and interest on base rate loans is due and payable at the end of each calendar quarter.
Cheniere Partners pays a commitment fee equal to an annual rate of 30% of the margin for LIBOR loans multiplied by the average daily amount of the undrawn commitment, payable quarterly in arrears.
The 2019 CQP Credit Facilities mature on May 29, 2024. The principal of any loans under the 2019 CQP Credit Facilities must be repaid in quarterly installments commencing on May 29, 2023 based on an amortization schedule. Any outstanding balance may be repaid, in whole or in part, at any time without premium or penalty, except for interest hedging and interest rate breakage costs. The 2019 CQP Credit Facilities contain conditions precedent for extensions of credit, as well as customary affirmative and negative covenants, and limit Cheniere Partners’ ability to make restricted payments, including distributions, to once per fiscal quarter and one true-up per fiscal quarter as long as certain conditions are satisfied.
The 2019 CQP Credit Facilities are unconditionally guaranteed by each subsidiary of Cheniere Partners other than SPL, Sabine Pass LNG-LP, LLC and certain subsidiaries of Cheniere Partners owning other development projects, as well as certain other specified subsidiaries and members of the foregoing entities.
Sabine Pass LNG Terminal
Liquefaction Facilities
WeThe SPL Project is one of the largest LNG production facilities in the world. Through Cheniere Partners, we are in various stages of constructingcurrently operating five Trains and operatingtwo marine berths at the SPL Project at the Sabine Pass LNG terminal adjacent to the existing regasification facilities.and are constructing one additional Train. We have received authorization from the FERC to site, construct and operate Trains 1 through 6.6, as well as for the construction of a third marine berth. We have achieved substantial completion of the first five Trains 1, 2, 3, 4 and 5 of the SPL Project and commenced commercial operating activities for each Train at various times starting in May 2016, September 2016, March 2017, October 2017 and March 2019, respectively.2016. The following table summarizes the project completion and construction status of Train 6 of the SPL Project as of June 30, 2019:March 31, 2020:
|
| | | |
| | | SPL Train 6 |
| Overall project completion percentage | | 32.4%53.9% |
| Completion percentage of: | |
|
| Engineering | | 74.1%93.8% |
| Procurement | | 48.2%78.4% |
| Subcontract work | | 30.7%39.5% |
| Construction | | 2.1%15.0% |
| Date of expected substantial completion | | 1H 2023 |
The following orders have been issued by the DOE authorizing the export of domestically produced LNG by vessel from the Sabine Pass LNG terminal:
Trains 1 through 4—FTA countries for a 30-year term, which commenced onin May 15, 2016, and non-FTA countries for a 20-year term, which commenced onin June 3, 2016, in an amount up to a combined total of the equivalent of 16 mtpa (approximately 803 Bcf/yr of natural gas).
Trains 1 through 4—FTA countries for a 25-year term and non-FTA countries for a 20-year term, both of which commenced in December 2018, in an amount up to a combined total of the equivalent of approximately 203 Bcf/yr of natural gas (approximately 4 mtpa).
Trains 5 and 6—FTA countries and non-FTA countries for a 20-year term, which partially commenced in June 2019 and the remainder commenced in September 2019, in an amount up to a combined total of 503.3 Bcf/yr of natural gas (approximately 10 mtpa).
In each case, the terms of these authorizations beginbegan on the earlier of the date of first export thereunder or the date specified in the particular order, which ranges from five to 10 years from the date the order was issued.order. In addition, SPL received an order
providing for a three-year makeup period with respect to each of the non-FTA orders for LNG volumes SPL was authorized but unable to export during any portion of the initial 20-year export period of such order.
In January 2018, theThe DOE issued ordersan order authorizing SPL to export domestically produced LNG by vessel from the Sabine Pass LNG terminal to FTA countries and non-FTA countries over a two-year period commencing January 2018,2020, in an aggregate amount up to the equivalent of 600 Bcf of natural gas (however, exports under this order, when combined with exports under the orders above, may not exceed 1,509 Bcf/yr).
An application was filed in September 2019 seeking authorization to make additional exports from the SPL Project to FTA countries for a 25-year term and to non-FTA countries for a 20-year term in an amount up to the equivalent of approximately 153 Bcf/yr of natural gas, for a total SPL Project export capacity of approximately 1,662 Bcf/yr. The terms of the authorizations are requested to commence on the date of first commercial export from the SPL Project of the volumes contemplated in the application. In April 2020, the DOE issued an order authorizing SPL to export to FTA countries related to this application, but has not yet issued an order authorizing SPL to export to non-FTA countries for the corresponding LNG volume. A corresponding application for authorization to increase the total LNG production capacity of the SPL Project from the currently authorized level to approximately 1,662 Bcf/yr was also submitted to the FERC and is currently pending.
Customers
SPL has entered into fixed price long-term SPAs generally with terms of at least 20 years (plus extension rights) with eight third parties for Trains 1 through 6 of the SPL Project, including an agreement anticipated to be assigned from Cheniere Marketing.Project. Under these SPAs, the customers will purchase LNG from SPL on a free on board (“FOB”) basis for a price consisting of a fixed fee per MMBtu of LNG (a portion of which is subject to annual adjustment for inflation) plus a variable fee per MMBtu of LNG generally equal to approximately 115% of Henry Hub. In certain circumstances, theThe customers may elect to cancel or suspend deliveries of LNG cargoes, with advance notice as governed by each respective SPA, in which case the customers would still be required to pay the fixed fee with respect to the contracted volumes that are not delivered as a result of such cancellation or suspension. We refer to the fee component that is applicable regardless of a cancellation or suspension of LNG cargo deliveries under the SPAs as the fixed fee component of the price under SPL’s SPAs. We refer to the fee component that is applicable only in connection with LNG cargo deliveries as the variable fee component of the price under SPL’s SPAs. The variable fees under SPL’s SPAs were generally sized at the time of entry into each SPA with the intent to cover the costs of gas purchases and transportation related to, and operating and maintenance costsliquefaction fuel to produce the LNG to be sold under each such SPA. The SPAs and contracted volumes to be made available under the SPAs are not tied to a specific Train; however, the term of each SPA generally commences upon the date of first commercial delivery of a specified Train.
In aggregate, the annual fixed fee portion to be paid by the third-party SPA customers is approximately $2.3$2.9 billion for Trains 1 through 4 and increasing5. After giving effect to $2.9an SPA that Cheniere has committed to provide to SPL by the end of 2020, the annual fixed fee portion to be paid by the third-party SPA customers would increase to at least $3.3 billion, which is expected to occur upon the date of first commercial delivery of Train 5,6.
In addition, Cheniere Marketing has agreements with the applicable fixed fees starting from the dateSPL to purchase, at Cheniere Marketing’s option, any LNG produced by SPL in excess of first commercial delivery from the applicable Train, as specified in each SPA.that required for other customers. See Marketing section for additional information regarding agreements entered into by Cheniere Marketing.
Natural Gas Transportation, Storage and Supply
To ensure SPL is able to transport adequate natural gas feedstock to the Sabine Pass LNG terminal, it has entered into transportation precedent and other agreements to secure firm pipeline transportation capacity with CTPL and third-party pipeline companies. SPL has entered into firm storage services agreements with third parties to assist in managing variability in natural gas needs for the SPL Project. SPL has also entered into enabling agreements and long-term natural gas supply contracts with third parties in order to secure natural gas feedstock for the SPL Project. As of June 30, 2019,March 31, 2020, SPL had secured up to approximately 3,4375,300 TBtu of natural gas feedstock through long-term and short-term natural gas supply contracts.
Construction
SPL entered into lump sum turnkey contracts with Bechtel Oil, Gas and Chemicals, Inc. (“Bechtel”) for the engineering, procurement and construction of Trains 1 through 6 of the SPL Project, under which Bechtel charges a lump sum for all work performed and generally bears project cost, riskschedule and performance risks unless certain specified events occur, in which case Bechtel may cause SPL to enter into a change order, or SPL agrees with Bechtel to a change order.
The total contract price of the EPC contract for Train 6 of the SPL Project is approximately $2.5 billion, including estimated costs for an optional third marine berth.
Regasification Facilities
The Sabine Pass LNG terminal has operational regasification capacity of approximately 4.04 Bcf/d and aggregate LNG storage capacity of approximately 16.917 Bcfe. Approximately 2.02 Bcf/d of the regasification capacity at the Sabine Pass LNG terminal has been reserved under two long-term third-party TUAs, under which SPLNG’s customers are required to pay fixed monthly fees, whether or not they use the LNG terminal. Each of Total Gas & Power North America, Inc. (“Total”) and Chevron U.S.A. Inc. (“Chevron”) has reserved approximately 1.01 Bcf/d of regasification capacity and is obligated to make monthly capacity payments to SPLNG aggregating approximately $125 million annually, prior to inflation adjustments, for 20 years that commenced
in 2009. Total S.A. has guaranteed Total’s obligations under its TUA up to $2.5 billion, subject to certain exceptions, and Chevron Corporation has guaranteed Chevron’s obligations under its TUA up to 80% of the fees payable by Chevron.
The remaining approximately 2.02 Bcf/d of capacity has been reserved under a TUA by SPL. SPL is obligated to make monthly capacity payments to SPLNG aggregating approximately $250 million annually, prior to inflation adjustments, continuing until at least May 2036. SPL entered into a partial TUA assignment agreement with Total, whereby upon substantial completion of Train 5 of the SPL Project, SPL gained access to substantially all of Total’s capacity and other services provided under Total’s TUA with SPLNG. This agreement provides SPL with additional berthing and storage capacity at the Sabine Pass LNG terminal that may be used to provide increased flexibility in managing LNG cargo loading and unloading activity, permit SPL to more flexibly manage its LNG storage capacity and accommodate the development of Train 6. Notwithstanding any arrangements between Total and SPL, payments required to be made by Total to SPLNG will continue to be made by Total to SPLNG in accordance with its TUA. During the three months ended June 30,March 31, 2020 and 2019, and 2018, SPL recorded $32 million and $7.5 million, respectively, and during the six months ended June 30, 2019 and 2018, SPL recorded $40 million and $15 million, respectively, as operating and maintenance expense under this partial TUA assignment agreement.
Under each of these TUAs, SPLNG is entitled to retain 2% of the LNG delivered to the Sabine Pass LNG terminal.
Capital Resources
We currently expect that SPL’s capital resources requirements with respect to the SPL Project will be financed through project debt and borrowings, cash flows under the SPAs and equity contributions from Cheniere Partners. We believe that with the net proceeds of borrowings, available commitments under the 2020 SPL Working Capital Facility, 2019 CQP Credit Facilities, and cash flows from operations and equity contributions from Cheniere Partners, weSPL will have adequate financial resources available to meet ourits currently anticipated capital, operating and debt service requirements with respect to Trains 1 through 6 of the SPL Project. SPL began generating cash flows from operations from the SPL Project in May 2016, when Train 1 achieved substantial completion and initiated operating activities. Trains 2, 3, 4 and 5 subsequently achieved substantial completion in September 2016, March 2017, October 2017 and March 2019, respectively. We realized offsets to LNG terminal costs of $74 million in the six months ended June 30, 2019, respectively, that were related to the sale of commissioning cargoes because these amounts were earned or loaded prior to the start of commercial operations of Train 5 of the SPL Project during the testing phase for its construction. We did not realize any offsets to LNG terminal costs in the three months ended June 30, 2019 and the three and six months ended June 30, 2018. Additionally, SPLNG generates cash flows from the TUAs, as discussed above.
The following table provides a summary of our capital resources from borrowings and available commitments for the Sabine Pass LNG Terminal, excluding equity contributions to our subsidiaries and cash flows from operations (as described in Sources and Uses of Cash), at June 30, 2019March 31, 2020 and December 31, 20182019 (in millions):
| | | | | June 30, | | December 31, | | March 31, | | December 31, |
| | | 2019 | | 2018 | | 2020 | | 2019 |
| Senior notes (1) | | $ | 16,250 |
| | $ | 16,250 |
| | $ | 17,750 |
| | $ | 17,750 |
|
| Credit facilities outstanding balance (2) | | 649 |
| | — |
| | — |
| | — |
|
| Letters of credit issued (3) | | 415 |
| | 425 |
| | 414 |
| | 414 |
|
| Available commitments under credit facilities (3) | | 1,636 |
| | 775 |
| | 1,536 |
| | 1,536 |
|
| Total capital resources from borrowings and available commitments (4) | | $ | 18,950 |
| | $ | 17,450 |
| | $ | 19,700 |
| | $ | 19,700 |
|
| |
| (1) | Includes SPL’s 5.625% Senior Secured Notes due 2021, 6.25% Senior Secured Notes due 2022, 5.625% Senior Secured Notes due 2023, 5.75% Senior Secured Notes due 2024, 5.625% Senior Secured Notes due 2025, 5.875% Senior Secured Notes due 2026 (the “2026 SPL Senior Notes”), 5.00% Senior Secured Notes due 2027 (the “2027 SPL Senior Notes”), 4.200% Senior Secured Notes due 2028 (the “2028 SPL Senior Notes”) and 5.00% Senior Secured Notes due 2037 (the “2037 SPL Senior Notes”) (collectively, the “SPL Senior Notes”) and Cheniere Partners’, as well as CQP’s $1.5 billion of 5.250% Senior Notes due 2025 (the “2025 CQP Senior Notes”), $1.1 billion of 5.625% Senior Notes anddue 2026 (the “2026 CQP Senior Notes.Notes”) and the 4.500% Senior Notes due 2029 (the “2029 CQP Senior Notes”) (collectively, the “CQP Senior Notes”). |
| |
| (2) | Includes outstanding balances under the 2015 SPL Working Capital Facility, 2020 SPL Working Capital Facility and 2019 CQP Credit Facilities, inclusive of any portion of the 2020 SPL Working Capital Facility and 2019 CQP Credit Facilities that may be used for general corporate purposes. |
| |
| (3) | Consists of 2015 SPL Working Capital Facility, 2020 SPL Working Capital Facility and 2019 CQP Credit Facilities. Balance at December 31, 2018 did not include the letters of credit issued or available commitments under the terminated 2016 CQP Credit Facilities, which were not specifically for the Sabine Pass LNG Terminal. |
| |
| (4) | Does not include equity contributions that may be available from Cheniere’s additional borrowings from the 2021 Cheniere Convertible Unsecured Notes and the 2045 Cheniere Convertible Senior Notes,under its convertible notes, which may be used for the Sabine Pass LNG Terminal. |
For additional information regarding our debt agreements related to the Sabine Pass LNG Terminal, see Note 10—Debt of our Notes to Consolidated Financial Statements in this quarterly report and Note 12—11—Debt of our Notes to Consolidated Financial Statements in our annual report on Form 10-K for the year ended December 31, 2018.2019.
SPL Senior Notes
The SPL Senior Notes are secured on a pari passu first-priority basis by a security interest in all of the membership interests in SPL and substantially all of SPL’s assets.
At any time prior to three months before the respective dates of maturity for each series of the SPL Senior Notes (except for the 2026 SPL Senior Notes, 2027 SPL Senior Notes, 2028 SPL Senior Notes and 2037 SPL Senior Notes, in which case the time period is six months before the respective dates of maturity), SPL may redeem all or part of such series of the SPL Senior Notes at a redemption price equal to the “make-whole” price (except for the 2037 SPL Senior Notes, in which case the redemption price is equal to the “optional redemption” price) set forth in the respective indentures governing the SPL Senior Notes, plus accrued and unpaid interest, if any, to the date of redemption. SPL may also, at any time within three months of the respective maturity dates for each series of the SPL Senior Notes (except for the 2026 SPL Senior Notes, 2027 SPL Senior Notes, 2028 SPL Senior Notes and 2037 SPL Senior Notes, in which case the time period is within six months of the respective dates of maturity), redeem all or part of such series of the SPL Senior Notes at a redemption price equal to 100% of the principal amount of such series of the SPL Senior Notes to be redeemed, plus accrued and unpaid interest, if any, to the date of redemption.
Both the indenture governing the 2037 SPL Senior Notes (the “2037 SPL Senior Notes Indenture”) and the common indenture governing the remainder of the SPL Senior Notes (the “SPL Indenture”) include restrictive covenants. SPL may incur additional indebtedness in the future, including by issuing additional notes, and such indebtedness could be at higher interest rates and have different maturity dates and more restrictive covenants than the current outstanding indebtedness of SPL, including the SPL Senior Notes and the 2020 SPL Working Capital Facility. Under the 2037 SPL Senior Notes Indenture and the SPL Indenture, SPL may not make any distributions until, among other requirements, deposits are made into debt service reserve accounts as required and a debt service coverage ratio test of 1.25:1.00 is satisfied. Semi-annual principal payments for the 2037 SPL Senior Notes are due on March 15 and September 15 of each year beginning September 15, 2025.
2025 and are fully amortizing according to a fixed sculpted amortization schedule.
2015 SPL Working Capital Facility
In SeptemberMarch 2020, SPL terminated the remaining commitments under the 2015 SPL Working Capital Facility. As of December 31, 2019, SPL had $786 million of available commitments, $414 million aggregate amount of issued letters of credit and no outstanding borrowings under the 2015 SPL Working Capital Facility.
2020 SPL Working Capital Facility
In March 2020, SPL entered into the 2020 SPL Working Capital Facility with aggregate commitments of $1.2 billion, which replaced the 2015 SPL Working Capital Facility. The 2020 SPL Working Capital Facility is intended to be used for loans to SPL, (“swing line loans to SPL Working Capital Loans”),and the issuance of letters of credit on behalf of SPL, as well as for swing line loans to SPL (“SPL Swing Line Loans”), primarily for certain working capital requirements(1) the refinancing of the 2015 SPL Working Capital Facility, (2) fees and expenses related to developingthe 2020 SPL Working Capital Facility, (3) SPL’s gas purchase obligations and placing into operation the(4) SPL Project.and certain of its future subsidiaries’ general corporate purposes. SPL may, from time to time, request increases in the commitments under the 2020 SPL Working Capital Facility of up to $760 million and, upon the completion of the debt financing of Train 6 of the SPL Project, request an incremental increase in commitments of up to an additional $390$800 million. As of June 30, 2019 and DecemberMarch 31, 2018,2020, SPL had $785 million and $775$786 million of available commitments, and $415 million and $425$414 million aggregate amount of issued letters of credit and no outstanding borrowings under the 2020 SPL Working Capital Facility, respectively. SPL did not have any amounts outstanding under the SPL Working Capital Facility as of both June 30, 2019 and December 31, 2018.
The 2020 SPL Working Capital Facility matures on DecemberMarch 19, 2025, but may be extended with consent of the lenders. The 2020 SPL Working Capital Facility provides for mandatory prepayments under customary circumstances.
The 2020 SPL Working Capital Facility contains customary conditions precedent for extensions of credit, as well as customary affirmative and negative covenants. SPL is restricted from making certain distributions under agreements governing its indebtedness generally until, among other requirements, satisfaction of a 12-month forward-looking and backward-looking 1.25:1.00 debt service reserve ratio test. The obligations of SPL under the 2020 SPL Working Capital Facility are secured by substantially all of the assets of SPL as well as a pledge of all of the membership interests in SPL and certain future subsidiaries of SPL on a pari passu basis by a first priority lien with the SPL Senior Notes.
Cheniere Partners
CQP Senior Notes
The CQP Senior Notes are jointly and severally guaranteed by each of Cheniere Partners’ subsidiaries other than SPL and, subject to certain conditions governing its guarantee, Sabine Pass LP (the “CQP Guarantors”). The CQP Senior Notes are governed by the same base indenture (the “CQP Base Indenture”). The 2025 CQP Senior Notes are further governed by the First Supplemental Indenture, the 2026 CQP Senior Notes are further governed by the Second Supplemental Indenture and the 2029 CQP Senior Notes are further governed by the Third Supplemental Indenture. The indentures governing the CQP Senior Notes contain customary terms and events of default and certain covenants that, among other things, limit the ability of Cheniere Partners and the CQP Guarantors to incur liens and sell assets, enter into transactions with affiliates, enter into sale-leaseback transactions and consolidate, merge or sell, lease or otherwise dispose of all or substantially all of the applicable entity’s properties or assets.
At any time prior to October 1, 2020 for the 2025 CQP Senior Notes, October 1, 2021 for the 2026 CQP Senior Notes and October 1, 2024 for the 2029 CQP Senior Notes, Cheniere Partners may redeem all or a part of the applicable CQP Senior Notes at a redemption price equal to 100% of the aggregate principal amount of the CQP Senior Notes redeemed, plus the “applicable premium” set forth in the respective indentures governing the CQP Senior Notes, plus accrued and unpaid interest, if any, to the date of redemption. In addition, at any time prior to October 1, 2020 for the 2025 CQP Senior Notes, October 1, 2021 for the 2026 CQP Senior Notes and October 1, 2024 for the 2029 CQP Senior Notes, Cheniere Partners may redeem up to 35% of the aggregate principal amount of the CQP Senior Notes with an amount of cash not greater than the net cash proceeds from certain equity offerings at a redemption price equal to 105.250% of the aggregate principal amount of the 2025 CQP Senior Notes, 105.625% of the aggregate principal amount of the 2026 CQP Senior Notes and 104.5% of the aggregate principal amount of the 2029 CQP Senior Notes redeemed, plus accrued and unpaid interest, if any, to the date of redemption. Cheniere Partners also may at any time on or after October 1, 2020 through the maturity date of October 1, 2025 for the 2025 CQP Senior Notes, October 1, 2021 through the maturity date of October 1, 2026 for the 2026 CQP Senior Notes and October 1, 2024 through the maturity date of October 1, 2029 for the 2029 CQP Senior Notes, redeem the CQP Senior Notes, in whole or in part, at the redemption prices set forth in the respective indentures governing the CQP Senior Notes.
The CQP Senior Notes are Cheniere Partners’ senior obligations, ranking equally in right of payment with Cheniere Partners’ other existing and future unsubordinated debt and senior to any of its future subordinated debt. In the event that the aggregate amount of Cheniere Partners’ secured indebtedness and the secured indebtedness of the CQP Guarantors (other than the CQP Senior Notes or any other series of notes issued under the CQP Base Indenture) outstanding at any one time exceeds the greater of (1) $1.5 billion and (2) 10% of net tangible assets, the CQP Senior Notes will be secured to the same extent as such obligations under the 2019 CQP Credit Facilities. The obligations under the 2019 CQP Credit Facilities are secured on a first-priority basis (subject to permitted encumbrances) with liens on substantially all the existing and future tangible and intangible assets and rights of Cheniere Partners and the CQP Guarantors and equity interests in the CQP Guarantors (except, in each case, for certain excluded properties set forth in the 2019 CQP Credit Facilities). The liens securing the CQP Senior Notes, if applicable, will be shared equally and ratably (subject to permitted liens) with the holders of other senior secured obligations, which include the 2019 CQP Credit Facilities obligations and any future additional senior secured debt obligations.
2019 CQP Credit Facilities
In May 2019, Cheniere Partners entered into the 2019 CQP Credit Facilities, which consisted of the $750 million term loan (“CQP Term Facility”), which was prepaid and terminated upon issuance of the 2029 CQP Senior Notes in September 2019, and the $750 million revolving credit facility (“CQP Revolving Facility”). Borrowings under the 2019 CQP Credit Facilities will be used to fund the development and construction of Train 6 of the SPL Project and for general corporate purposes, subject to a sublimit, and the 2019 CQP Credit Facilities are also available for the issuance of letters of credit. As of both March 31, 2020 and December 31, 2019, CQP had $750 million of available commitments and no letters of credit issued or loans outstanding under the 2019 CQP Credit Facilities.
The 2019 CQP Credit Facilities mature on May 29, 2024. Any outstanding balance may be repaid, in whole or in part, at any time without premium or penalty, upon three business days’ notice. Loans deemed made in connection with a draw upon a letter of credit have a term of up to one year. SPL Swing Line Loans terminate upon the earliest of (1) the maturity date or earlier termination of the SPL Working Capital Facility, (2) the date 15 days after such SPL Swing Line Loan is made and (3) the first borrowing dateexcept for a SPL Working Capital Loan or SPL Swing Line Loan occurring at least three business days following the date the SPL Swing Line Loan is made. SPL is required to reduce the aggregate outstanding principal amount of all SPL Working Capital Loans to zero for a period of five consecutive business days at least once each year.
interest rate breakage costs. The SPL Working Capital Facility contains2019 CQP Credit Facilities contain conditions precedent for extensions of credit, as well as customary affirmative and negative covenants. covenants, and limit Cheniere Partners’ ability to make restricted payments, including distributions, to once per fiscal quarter and one true-up per fiscal quarter as long as certain conditions are satisfied.
The obligations of SPL under the SPL Working Capital Facility2019 CQP Credit Facilities are unconditionally guaranteed and secured by a first priority lien (subject to permitted encumbrances) on substantially all of Cheniere Partners’ and the CQP Guarantors’ existing and future tangible and intangible assets of SPL as well as all of the membershipand rights and equity interests in SPL on a pari passu basis with the SPL Senior Notes.CQP Guarantors (except, in each case, for certain excluded properties set forth in the 2019 CQP Credit Facilities).
Corpus Christi LNG Terminal
Liquefaction Facilities
We are in various stages of constructingcurrently operating two Trains and operatingone marine berth at the CCL Project at the Corpus Christi LNG terminal.and are constructing one additional Train and marine berth. We have received authorization from the FERC to site, construct and operate StagesTrains 1 through 3 of the CCL Project. We completed construction of Trains 1 and 2 of the CCL Project. We achieved substantial completion of Train 1 of the CCL Project and commenced commercial operating activities in February 2019.2019 and August 2019, respectively. The following table summarizes the overall project completion and construction status of Train 3 of the CCL Project, including the related infrastructure, as of June 30, 2019:March 31, 2020:
|
| | | | | |
| | CCL Stage 1 | | CCL Stage 2 |
| Overall project completion percentage | 99.5% | | 62.4% |
| Completion percentage of: | | | | |
| Engineering | 100% | | 94.3% |
| Procurement | 100% | | 92.5% |
| Subcontract work | 96.4% | | 12.2% |
| Construction | 99.2% | | 29.2% |
| Expected date of substantial completion | Train 2 | 3Q 2019 | | Train 3 | 2H 2021 |
|
| | | |
| | CCL Train 3 |
| Overall project completion percentage | | 83.7% |
| Completion percentage of: | | |
| Engineering | | 99.2% |
| Procurement | | 99.6% |
| Subcontract work | | 69.5% |
| Construction | | 63.0% |
| Expected date of substantial completion | | 1H 2021 |
Separate from the CCH Group, we are also developing Corpus Christi Stage 3 through our subsidiary CCL Stage III, adjacent to the CCL Project. We filed an application with thereceived approval from FERC in June 2018 forNovember 2019 to site, construct and operate seven midscale Trains with an expected aggregate nominaltotal production capacity of approximately 9.510 mtpa and one LNG storage tank.of LNG.
The following orders have been issued by the DOE authorizing the export of domestically produced LNG by vessel from the Corpus Christi LNG terminal:
CCL Project—FTA countries for a 25-year term and to non-FTA countries for a 20-year term, both of which commenced in June 2019, up to a combined total of the equivalent of 767 Bcf/yr (approximately 15 mtpa) of natural gas.
Corpus Christi Stage 3—FTA countries for a 25-year term and to non-FTA countries for a 20-year term in an amount equivalent to 514582.14 Bcf/yr (approximately 1011 mtpa) of natural gas (the “Stage 3 FTA”). The application for authorization to export that same 514 Bcf/yr of domestically produced LNG by vessel to non-FTA countries is currently pending before the DOE (the “Stage 3 Non-FTA”).gas.
In each case, the terms of these authorizations begin on the earlier of the date of first export thereunder or the date specified in the particular order, which ranges from seven to 10 years from the date the order was issued.
In June 2018, we requested that DOE vacateAn application was filed in September 2019 to authorize additional exports from the Stage 3 FTA and permit us to withdraw the pending Stage 3 Non-FTA. These requests were made due to certain changes to Corpus Christi Stage 3.
In conjunction with the submission in June 2018 of our FERC application for Corpus Christi Stage 3, we submitted a new application for long-term multi-contract authorization to export up to a combined total of 582.14 Bcf/yr (approximately 11.45 mtpa) of natural gasCCL Project to FTA countries for a 25-year term and to non-FTA countries for a 20-year term.term in an amount up to the equivalent of approximately 108 Bcf/yr of natural gas, for a total CCL Project export of 875.16 Bcf/yr. The termterms of each authorization is expectedthe authorizations are requested to begincommence on the earlier of the date of first commercial export of LNG produced by Corpus Christi Stage 3 or the date which is seven years from the issuanceCCL Project of such authorizations.the volumes contemplated in the application. The application is currently pending before DOE.
Customers
CCL has entered into fixed price long-term SPAs generally with terms of 20 years (plus extension rights) with nine third parties for Trains 1 through 3 of the CCL Project. Under these SPAs, the customers will purchase LNG from CCL on a FOB basis for a price consisting of a fixed fee per MMBtu of LNG (a portion of which is subject to annual adjustment for inflation) plus a variable fee per MMBtu of LNG equal to approximately 115% of Henry Hub. In certain circumstances, theThe customers may elect to cancel or suspend deliveries of LNG cargoes, with advance notice as governed by each respective SPA, in which case the customers would still be required to pay the fixed fee with respect to the contracted volumes that are not delivered as a result of such cancellation or suspension. We refer to the fee component that is applicable regardless of a cancellation or suspension of LNG cargo deliveries under the SPAs as the fixed fee component of the price under our SPAs. We refer to the fee component that is applicable only in connection with LNG cargo deliveries as the variable fee component of the price under our SPAs.SPAs. The variable fee under CCL’s
SPAs entered into in connection with the development of the CCL Project was sized at the time of entry into each SPA with the intent to cover the costs of gas purchases and transportation related to, and operating and maintenance costsliquefaction fuel to produce the LNG to be sold under each such SPA. The SPAs and contracted
volumes to be made available under the SPAs are not tied to a specific Train; however, the term of each SPA generally commences upon the date of first commercial delivery for the applicable Train, as specified in each SPA.
In aggregate, the minimum fixed fee portion to be paid by the third-party SPA customers is approximately $550 million for Train 1, increasing to approximately $1.4 billion upon the date of first commercial delivery for Train 2 and further increasing to approximately $1.8 billion following the substantial completion of Train 3 of the CCL Project.
In addition, Cheniere Marketing has entered into SPAsagreements with CCL to purchasepurchase: (1) 15 TBtu per annum of LNG andwith an approximate term of 23 years, (2) any LNG produced by CCL in excess of that required for other customers at Cheniere Marketing’s option.option and (3) 0.85 mtpa of LNG with a term of up to seven years associated with the IPM gas supply agreement between CCL and EOG. See Marketing section for additional information regarding agreements entered into by Cheniere Marketing.
Natural Gas Transportation, Storage and Supply
To ensure CCL is able to transport adequate natural gas feedstock to the Corpus Christi LNG terminal, it has entered into transportation precedent agreements to secure firm pipeline transportation capacity with CCP and certain third-party pipeline companies. CCL has entered into a firm storage services agreement with a third party to assist in managing variability in natural gas needs for the CCL Project. CCL has also entered into enabling agreements and long-term natural gas supply contracts with third parties, and will continue to enter into such agreements, in order to secure natural gas feedstock for the CCL Project. As of June 30, 2019,March 31, 2020, CCL had secured up to approximately 2,7873,182 TBtu of natural gas feedstock through long-term natural gas supply contracts with remaining terms that range up to 10 years, a portion of which is subject to the achievement of certain project milestones and other conditions precedent.
CCL Stage III has also entered into long-term natural gas supply contracts with third parties, and anticipates continuing to enter into such agreements, in order to secure natural gas feedstock for Corpus Christi Stage 3. As of March 31, 2020, CCL Stage III had secured up to approximately 2,361 TBtu of natural gas feedstock through long-term natural gas supply contracts with remaining terms that range up to approximately 15 years, which is subject to the achievement of certain project milestones and other conditions precedent.
A portion of the natural gas feedstock transactions for CCL and CCL Stage III are IPM transactions, in which the natural gas producers are paid based on a global gas market price less a fixed liquefaction fee and certain costs incurred by us.
Construction
CCL entered into separate lump sum turnkey contracts with Bechtel for the engineering, procurement and construction of StagesTrains 1 and 2through 3 of the CCL Project under which Bechtel charges a lump sum for all work performed and generally bears project cost, riskschedule and performance risks unless certain specified events occur, in which case Bechtel may cause CCL to enter into a change order, or CCL agrees with Bechtel to a change order.
The total contract pricesprice of the EPC contract for Stage 1 and the EPC contract for Stage 2,Train 3, which do not include the Corpus Christi Pipeline, areis currently under construction, is approximately $7.8 billion and $2.4 billion, respectively, reflecting amounts incurred under change orders through June 30, 2019. Total expected capital costsMarch 31, 2020. As of March 31, 2020, we have incurred $2.1 billion under this contract.
Final Investment Decision for Trains 1 throughCorpus Christi Stage 3 are estimated to be between $11.0 billion and $12.0 billion before financing costs and between $15.0 billion and $16.0 billion after financing costs including, in each case, estimated owner’s costs and contingencies.
FID for Corpus Christi Stage 3 will be subject to, among other things, entering into an EPC contract, obtaining additional commercial support for the project and securing the necessary financing arrangements.
Pipeline Facilities
In December 2014,November 2019, the FERC issued a certificate of public convenience and necessity under Section 7(c) of the Natural Gas Act of 1938, as amended, authorizingauthorized CCP to construct and operate the pipeline for Corpus Christi Pipeline.Stage 3. The Corpus Christi Pipeline ispipeline will be designed to transport 2.251.5 Bcf/d of natural gas feedstock required by the CCL ProjectCorpus Christi Stage 3 from the existing regional natural gas pipeline grid. The construction of the Corpus Christi Pipeline was completed in the second quarter of 2018.
Capital Resources
The CCH Group expects to finance the construction costs of the CCL Project from one or more of the following: project financing, operating cash flows from CCL and CCP, project debt and equity contributions from Cheniere. We realized offsets to LNG terminal costs of $128 million in the six months ended June 30, 2019 that were related to the sale of commissioning cargoes because these amounts were earned or loaded prior to the start of commercial operations of Train 1 during the testing phase for its construction. We did not realize any offsets to LNG terminal costs in the three months ended June 30, 2019. The following table provides a summary of the capital resources of the CCH Group from borrowings and available commitments for the CCL Project, excluding equity contributions from Cheniere, at June 30, 2019March 31, 2020 and December 31, 20182019 (in millions):
| | | | | June 30, | | December 31, | | March 31, | | December 31, |
| | | 2019 | | 2018 | | 2020 | | 2019 |
| Senior notes (1) | | $ | 4,250 |
| | $ | 4,250 |
| | $ | 6,952 |
| | $ | 6,952 |
|
| 11.0% Convertible Senior Secured Notes due 2025 (2) | | 1,000 |
| | 1,000 |
| | 700 |
| | 1,000 |
|
| Credit facilities outstanding balance (3) | | 6,138 |
| | 5,324 |
| | 3,424 |
| | 3,283 |
|
| Letters of credit issued (3) | | 338 |
| | 316 |
| | 399 |
| | 471 |
|
| Available commitments under credit facilities (3) | | 862 |
| | 1,698 |
| | 660 |
| | 729 |
|
| Total capital resources from borrowings and available commitments (4) | | $ | 12,588 |
| | $ | 12,588 |
| | $ | 12,135 |
| | $ | 12,435 |
|
| |
| (1) | Includes CCH’s 7.000% Senior Secured Notes due 2024 (the “2024 CCH Senior Notes”), 5.875% Senior Secured Notes due 2025 (the “2025 CCH Senior Notes”) and, 5.125% Senior Secured Notes due 2027 (the “2027 CCH Senior Notes”), 3.700% Senior Secured Notes due 2029 (the "2029 CCH Senior Notes"), 4.80% Senior Secured Notes due 2039 (the “4.80% CCH Senior Notes”) and 3.925% Senior Secured Notes due 2039 (the "3.925% CCH Senior Notes") (collectively, the “CCH Senior Notes”). |
| |
| (2) | Aggregate original principal amount before debt discount and debt issuance costs.costs and interest paid-in-kind. |
| |
| (3) | Includes CCH’s amended and restated credit facility (“CCH Credit FacilityFacility”) and CCH Working Capital Facility. |
| |
| (4) | Does not include equity contributions that may be available from Cheniere’s additional borrowings fromunder the 4.875% Convertible Unsecured Notes due 2021 (the “2021 Cheniere Convertible Unsecured Notes”), 4.25% Convertible Senior Notes due 2045 (the “2045 Cheniere Convertible Senior NotesNotes”) and Cheniere Revolving Credit Facility, which may be used for the CCL Project. |
For additional information regarding our debt agreements related to the CCL Project, see Note 10—Debt of our Notes to Consolidated Financial Statements in this quarterly report and Note 12—Debt of our Notes to Consolidated Financial Statements in our annual report on Form 10-K for the year ended December 31, 2018.
2025 CCH HoldCo II Convertible Senior Notes
In May 2015, CCH HoldCo II issued $1.0 billion aggregate principal amount of 11.0% Convertible Senior Secured Notes duethe 2025 (the “2025 CCH HoldCo II Convertible Senior Notes”)Notes on a private placement basis. The 2025 CCH HoldCo II Convertible Senior Notes are convertible at the option of CCH HoldCo II or the holders on or after March 1, 2020 and September 1, 2020, respectively, provided the total market capitalization of Cheniere at that varioustime is not less than $10.0 billion and certain other conditions are met.satisfied. CCH HoldCo II is restricted from making distributions to Cheniere under agreements governing its indebtedness generally until, among other requirements, Trains 1 and 2 of the CCL Project are in commercial operation and a historical debt service coverage ratio and a projected fixed debt service coverage ratio of 1.20:1.00 are achieved. The 2025 CCH HoldCo II Convertible Senior Notes are secured by a pledge by us of 100% of the equity interests in CCH HoldCo II, and a pledge by CCH HoldCo II of 100% of the equity interests in CCH HoldCo I. In addition, the 2025 CCH HoldCo II Convertible Senior Notes are secured by a security interest in the account into which all distributions from CCH HoldCo I to CCH HoldCo II must be deposited.
In May 2018, the amended and restated note purchase agreement under which the 2025 CCH HoldCo II Convertible Senior Notes were issued was subsequently amended in connection with commercialization and financing of Train 3 of the CCL Project and to provide the note holders with certain prepayment rights related thereto consistent with those under the CCH Credit Facility. All terms of the 2025 CCH HoldCo II Convertible Senior Notes substantially remained unchanged.
In February 2020, the amended and restated note purchase agreement for the 2025 CCH HoldCo II Convertible Senior Notes was amended to allow CCH HoldCo II the option to redeem all or a portion of the outstanding notes with cash at a price of $1,080 per $1,000 principal amount, at the time of any CCH HoldCo II- or noteholder-initiated conversion through September 2, 2020. In March 2020, CCH HoldCo II redeemed an aggregate outstanding principal amount of $300 million with cash. CCH HoldCo II retains the ability to convert the 2025 CCH HoldCo II Convertible Senior Notes into our common stock at a conversion price equal to the lower of (1) a 10% discount to the average of the daily volume-weighted average price (“VWAP”) of our common stock for the 90 trading day period prior to the date on which notice of conversion is provided and (2) a 10% discount to the closing price of our common stock on the trading day preceding the date on which notice of conversion is provided. The noteholders retain the ability to request conversion into our common stock at a conversion price equal to the average of the daily VWAP of
our common stock for the 90 trading day period preceding the date on which notice of requested conversion is provided. Conversions remain subject to various limitations and conditions.
CCH Senior Notes
The CCH Senior Notes are jointly and severally guaranteed by CCH’s subsidiaries, CCL, CCP and Corpus Christi Pipeline GP, LLC (the(each a “CCH Guarantor” and collectively, the “CCH Guarantors”). The indentureindentures governing the CCH Senior Notes (the “CCH Indenture”) containscontain customary terms and events of default and certain covenants that, among other things, limit CCH’s ability and the ability of CCH’s restricted subsidiaries to: incur additional indebtedness or issue preferred stock; make certain investments or pay dividends or distributions on membership interests or subordinated indebtedness or purchase, redeem or retire membership interests; sell or transfer assets, including membership or partnership interests of CCH’s restricted subsidiaries; restrict dividends or other payments by restricted subsidiaries to CCH or any of CCH’s restricted subsidiaries; incur liens; enter into transactions with affiliates; dissolve, liquidate, consolidate, merge, sell or lease all or substantially all of the properties or assets of CCH and its restricted subsidiaries taken as a
whole; or permit any CCH Guarantor to dissolve, liquidate, consolidate, merge, sell or lease all or substantially all of its properties and assets. The covenants included in the respective indentures that govern the CCH Senior Notes are subject to a number of important limitations and exceptions.
The CCH Senior Notes are CCH’s senior secured obligations, ranking senior in right of payment to any and all of CCH’s future indebtedness that is subordinated to the CCH Senior Notes and equal in right of payment with CCH’s other existing and future indebtedness that is senior and secured by the same collateral securing the CCH Senior Notes. The CCH Senior Notes are secured by a first-priority security interest in substantially all of CCH’s and the CCH Guarantors’ assets.
At any time prior to six months before the respective dates of maturity for each series of the CCH Senior Notes, CCH may redeem all or part of such series of the CCH Senior Notes at a redemption price equal to the “make-whole” price set forth in the CCH Indenture,appropriate indenture, plus accrued and unpaid interest, if any, to the date of redemption. CCH also may atAt any time within six months of the respective dates of maturity for each series of the CCH Senior Notes, CCH may redeem all or part of such series of the CCH Senior Notes, in whole or in part, at a redemption price equal to 100% of the principal amount of the CCH Senior Notes to be redeemed, plus accrued and unpaid interest, if any, to the date of redemption.
CCH Credit Facility
In May 2018, CCH amended and restated the CCH Credit Facility to increase total commitments under the CCH Credit Facility from $4.6 billion to $6.1 billion. The obligations of CCH under the CCH Credit Facility are secured by a first priority lien on substantially all of the assets of CCH and its subsidiaries and by a pledge by CCH HoldCo I of its limited liability company interests in CCH. As of June 30, 2019both March 31, 2020 and December 31, 2018,2019, CCH had zero and $1.0 billion ofno available commitments and $6.1 billion and $5.2$3.3 billion of loans outstanding under the CCH Credit Facility, respectively.Facility.
The CCH Credit Facility matures on June 30, 2024, with principal payments due quarterly commencing on the earlier of (1) the first quarterly payment date occurring more than three calendar months following the completion of the CCL Project as defined in the common terms agreement and (2) a set date determined by reference to the date under which a certain LNG buyer linked to the last Train of the CCL Project to become operational is entitled to terminate its SPA for failure to achieve the date of first commercial delivery for that agreement. Scheduled repayments will be based upon a 19-year tailored amortization, commencing the first full quarter after the completion of Trains 1 through 3 and designed to achieve a minimum projected fixed debt service coverage ratio of 1.50:1.
Under the CCH Credit Facility, CCH is required to hedge not less than 65% of the variable interest rate exposure of its senior secured debt. CCH is restricted from making certain distributions under agreements governing its indebtedness generally until, among other requirements, the completion of the construction of Trains 1 through 3 of the CCL Project, funding of a debt service reserve account equal to six months of debt service and achieving a historical debt service coverage ratio and fixed projected debt service coverage ratio of at least 1.25:1.00.
CCH Working Capital Facility
In June 2018, CCH amended and restated the CCH Working Capital Facility to increase total commitments under the CCH Working Capital Facility from $350 million to $1.2 billion. The CCH Working Capital Facility is intended to be used for loans to CCH (“CCH Working Capital Loans”) and the issuance of letters of credit on behalf of CCH for certain working capital
requirements related to developing and placing into operationsoperating the CCL Project and for related business purposes. Loans under the CCH Working Capital Facility are guaranteed by the CCH Guarantors. CCH may, from time to time, request increases in the commitments under the CCH Working Capital Facility of up to the maximum allowed for working capital under the Common Terms Agreement that was entered into concurrently with the CCH Credit Facility. As of June 30, 2019March 31, 2020 and December 31, 2018,2019, CCH had $862$660 million and $716$729 million of available commitments, $338$399 million and $316$471 million aggregate amount of issued letters of credit and zero$141 million and $168 millionzero of loans outstanding under the CCH Working Capital Facility, respectively.
The CCH Working Capital Facility matures on June 29, 2023, and CCH may prepay the CCH Working Capital Loans and loans made in connection with a draw upon any letter of credit (“CCH LC Loans”) at any time without premium or penalty upon three business days’ notice and may re-borrow at any time. CCH LC Loans have a term of up to one year. CCH is required to reduce the aggregate outstanding principal amount of all CCH Working Capital Loans to zero for a period of five consecutive business days at least once each year.
The CCH Working Capital Facility contains conditions precedent for extensions of credit, as well as customary affirmative and negative covenants. The obligations of CCH under the CCH Working Capital Facility are secured by substantially all of the assets of CCH and the CCH Guarantors as well as all of the membership interests in CCH and each of the CCH Guarantors on a pari passu basis with the CCH Senior Notes and the CCH Credit Facility.
Cheniere
CCH Note Purchase Agreement
Convertible Notes
In June 2019, CCH entered into the CCH Note Purchase Agreement with Allianz Global Investors GmbH to issueNovember 2014, we issued an aggregate principal amount of $727 million$1.0 billion of the 2039 CCH2021 Cheniere Convertible Unsecured Notes. The 2021 Cheniere Convertible Unsecured Notes are convertible at the option of the holder into our common stock at the then applicable conversion rate, provided that the closing price of our common stock is greater than or equal to the conversion price on the date of conversion. In March 2015, we issued $625 million aggregate principal amount of unsecured 2045 Cheniere Convertible Senior Notes. We have the right, at our option, at any time after March 15, 2020, to redeem all or any part of the 2045 Cheniere Convertible Senior Notes which will be jointly and severally guaranteed byat a redemption price equal to the CCH Guarantors. The conditions to closing and issuanceaccreted amount of the 2039 CCH2045 Cheniere Convertible Senior Notes includeto be redeemed, plus accrued and unpaid interest, if any, to such redemption date. We have the receipt of at least two investment grade ratings for the 2039 CCH Senior Notes, in addition to other customary conditions to closing. Pursuant to the CCH Note Purchase Agreement, CCH has up to 12 months, subject to a six-month extension at CCH’s option to satisfy the conditions to closingconversion obligation for the 2021 Cheniere Convertible Unsecured Notes and issuance. The net proceeds from the 2039 CCH2045 Cheniere Convertible Senior Notes will be used by CCHwith cash, common stock or a combination thereof.
Cheniere Revolving Credit Facility
In December 2018, we amended and restated the Cheniere Revolving Credit Facility to repay a portion of its outstanding termincrease total commitments under the Cheniere Revolving Credit Facility from $750 million to $1.25 billion. The Cheniere Revolving Credit Facility is intended to fund, through loans and pay fees, costsletters of credit, equity capital contributions to CCH HoldCo II and expenses incurredits subsidiaries for the development of the CCL Project and, provided that certain conditions are met, for general corporate purposes. As of March 31, 2020 and December 31, 2019, we had $430 million and $665 million of available commitments, $365 million and $585 million aggregate amount of issued letters of credit and $455 million and zero of loans outstanding under the Cheniere Revolving Credit Facility, respectively.
The Cheniere Revolving Credit Facility matures on December 13, 2022 and contains representations, warranties and affirmative and negative covenants customary for companies like us with lenders of the type participating in connection with the repaymentCheniere Revolving Credit Facility that limit our ability to make restricted payments, including distributions, unless certain conditions are satisfied, as well as limitations on indebtedness, guarantees, hedging, liens, investments and affiliate transactions. Under the Cheniere Revolving Credit Facility, we are required to ensure that the sum of such outstanding term loans and/orour unrestricted cash and the transactions contemplatedamount of undrawn commitments under the Cheniere Revolving Credit Facility is at least equal to the lesser of (1) 20% of the commitments under the Cheniere Revolving Credit Facility and (2) $200 million (the “Liquidity Covenant”).
From and after the time at which certain specified conditions are met (the “Trigger Point”), we will have increased flexibility under the Cheniere Revolving Credit Facility to, among other things, (1) make restricted payments and (2) raise incremental commitments. The Trigger Point will occur once (1) completion has occurred for each of Train 1 of the CCL Project (as defined in the CCH Note Purchase Agreement.Indenture) and Train 5 of the SPL Project (as defined in SPL’s common terms agreement), which has occurred in February 2019 and March 2019, respectively; (2) the aggregate principal amount of outstanding loans plus drawn and unreimbursed letters of credit under the Cheniere Revolving Credit Facility is less than or equal to 10% of aggregate commitments under the
Cheniere Revolving Credit Facility and (3) we elect on a go-forward basis to be governed by a non-consolidated leverage ratio covenant not to exceed 5.75:1.00 (the “Springing Leverage Covenant”), which following such election will apply at any time that the aggregate principal amount of outstanding loans plus drawn and unreimbursed letters of credit under the Cheniere Revolving Credit Facility is greater than 30% of aggregate commitments under the Cheniere Revolving Credit Facility. Following the Trigger Point, at any time that the Springing Leverage Covenant is in effect, the Liquidity Covenant will not apply.
Restrictive Debt CovenantsThe Cheniere Revolving Credit Facility is secured by a first priority security interest (subject to permitted liens and other customary exceptions) in substantially all of our assets, including our interests in our direct subsidiaries (excluding CCH HoldCo II and certain other subsidiaries).
Cash Receipts from Subsidiaries
Our ownership interest in the Sabine Pass LNG terminal is held through Cheniere Partners. As of June 30, 2019, eachMarch 31, 2020, we owned a 48.6% limited partner interest in Cheniere Partners in the form of 104.5 million common units and 135.4 million subordinated units. We also own 100% of the general partner interest and the incentive distribution rights in Cheniere Partners. We are eligible to receive quarterly equity distributions from Cheniere Partners related to our ownership interests and our incentive distribution rights.
We also receive fees for providing management services to some of our issuers wassubsidiaries. We received $25 million and $20 million in compliancetotal service fees from these subsidiaries during the three months ended March 31, 2020 and 2019, respectively.
Share Repurchase Program
On June 3, 2019, we announced that our Board authorized a 3-year, $1.0 billion share repurchase program. During the three months ended March 31, 2020, we repurchased an aggregate of 2.9 million shares of our common stock for $155 million, for a weighted average price per share of $53.88. As of March 31, 2020, we had up to $596 million of the share repurchase program available. Under the share repurchase program, repurchases can be made from time to time using a variety of methods, which may include open market purchases, privately negotiated transactions or otherwise, all in accordance with all covenants relatedthe rules of the SEC and other applicable legal requirements. The timing and amount of any shares of our common stock that are repurchased under the share repurchase program will be determined by our management based on market conditions and other factors. The share repurchase program does not obligate us to their respective debt agreements.acquire any particular amount of common stock, and may be modified, suspended or discontinued at any time or from time to time at our discretion.
Marketing
We market and sell LNG produced by the Liquefaction Projects that is not required for other customers through our integrated marketing function. We are developinghave, and continue to develop, a portfolio of long-, medium- and short-term SPAs to transport and unload commercial LNG cargoes to locations worldwide, which isworldwide. These volumes are expected to be primarily sourced by LNG produced by the Liquefaction Projects but supplemented by volumevolumes procured from other locations worldwide, as needed. As of June 30, 2019,March 31, 2020, we have sold or have options to sell approximately 5,0664,856 TBtu of LNG to be delivered to customers between 20192020 and 2045, excluding volumevolumes for an agreement anticipated toagreements that may be assigned to SPL in the future. The cargoes have been sold either on a free on board (“FOB”)FOB basis (delivered to the customer at the Sabine Pass LNG terminal or the Corpus Christi LNG terminal)terminal, as applicable) or a delivered at terminal (“DAT”) basis (delivered to the customer at their LNG receiving terminal). We have chartered LNG vessels to be utilized infor cargoes sold on a DAT transactions.basis. In addition, we have entered into a long-term agreement to sell LNG cargoes on a DAT basis that is conditioned upon the buyer achieving certain milestones.
Cheniere Marketing entered into uncommitted trade finance facilities with available commitments of $420 million as of June 30, 2019,March 31, 2020, primarily to be used for the purchase and sale of LNG for ultimate resale in the course of its operations. The finance facilities are intended to be used for advances, guarantees or the issuance of letters of credit or standby letters of credit on behalf of Cheniere Marketing. As of June 30, 2019March 31, 2020 and December 31, 2018,2019, Cheniere Marketing had $10$4 million and $31$41 million, respectively, in standby letters of credit and guarantees outstanding under the finance facilities. As of June 30, 2019March 31, 2020 and December 31, 2018,2019, Cheniere Marketing had zero and $71 million, respectively, in loans outstanding under the finance facilities. As of March 31, 2020, there were no loans outstanding under the finance facilities. Cheniere Marketing pays interest or fees on utilized commitments.
Corporate and Other Activities
We are required to maintain corporate and general and administrative functions to serve our business activities described above. We are also in various stagesThe development of developingour sites or other projects, including infrastructure projects in support of natural gas supply and LNG demand, which,will require, among other things, will require acceptable commercial and financing arrangements before we make an FID.
We have made an equity investment in Midship Holdings, LLC (“Midship Holdings”), which manages the business and affairs of Midship Pipeline. Midship Pipeline which is constructing a pipelinethe Midship Project with expected capacity of up to 1.44 million Dekatherms per day that will connect new gas production in the Anadarko Basin to Gulf Coast markets, including markets serving the Liquefaction Projects. Construction of the Midship Project commenced in the first quarter of 2019 and the Midship Project was placed in service in April 2020.
Restrictive Debt Covenants
As of March 31, 2020, each of our issuers was in compliance with all covenants related to their respective debt agreements.
LIBOR
The use of LIBOR is expected to be phased out by the end of 2021. It is currently unclear whether LIBOR will be utilized beyond that date or whether it will be replaced by a particular rate. We intend to continue to work with our lenders to pursue any amendments to our debt agreements that are currently subject to LIBOR and will continue to monitor, assess and plan for the phase out of LIBOR.
Sources and Uses of Cash
The following table summarizes the sources and uses of our cash, cash equivalents and restricted cash for the sixthree months ended June 30,March 31, 2020 and 2019 and 2018 (in millions). The table presents capital expenditures on a cash basis; therefore, these amounts differ from the amounts of capital expenditures, including accruals, which are referred to elsewhere in this report. Additional discussion of these items follows the table.
| | | | Six Months Ended June 30, | Three Months Ended March 31, |
| | 2019 | | 2018 | 2020 | | 2019 |
| Operating cash flows | $ | 760 |
| | $ | 982 |
| $ | 574 |
| | $ | 412 |
|
| Investing cash flows | (1,542 | ) | | (1,492 | ) | (654 | ) | | (651 | ) |
| Financing cash flows | 1,066 |
| | 1,168 |
| (85 | ) | | 94 |
|
| | | | | | | |
| Net increase in cash, cash equivalents and restricted cash | 284 |
|
| 658 |
| |
| Net decrease in cash, cash equivalents and restricted cash | | (165 | ) |
| (145 | ) |
| Cash, cash equivalents and restricted cash—beginning of period | 3,156 |
| | 2,613 |
| 2,994 |
| | 3,156 |
|
| Cash, cash equivalents and restricted cash—end of period | $ | 3,440 |
| | $ | 3,271 |
| $ | 2,829 |
| | $ | 3,011 |
|
Operating Cash Flows
Our operating cash net inflows during the sixthree months ended June 30,March 31, 2020 and 2019 and 2018 were $760$574 million and $982$412 million, respectively. The $222$162 million decreaseincrease in operating cash inflows in 20192020 compared to 20182019 was primarily related to increased operating costs and expenses, which were partially offset by increased cash receipts from the sale of LNG cargoes, as a result of the additional Trains that were operating at the Liquefaction Projects in 2019. In addition to Trains 1 through 4 of the SPL Project that were operational during both the six months ended June 30, 2019 and 2018, Train 5 of the SPL Project and Train 1 of the CCL Project were operational for approximately four months during the six months ended June 30, 2019.
Investing Cash Flows
Investing cash net outflows during the sixthree months ended June 30,March 31, 2020 and 2019 and 2018 were $1,542$654 million and $1,492$651 million, respectively, and were primarily used to fund the construction costs for the Liquefaction Projects. These costs are capitalized as construction-in-process until achievement of substantial completion. Additionally, we invested $34$90 million and $24 million in Midship Holdings, our equity method investment, during the sixthree months ended June 30, 2019.March 31, 2020 and 2019, respectively.
Financing Cash Flows
Financing cash net inflowsoutflows during the sixthree months ended June 30, 2019March 31, 2020 were $1,066$85 million, primarily as a result of:
$982455 million of borrowings under the CCHCheniere Revolving Credit Facility;
$649141 million of borrowings under the 2019 CQP Credit Facilities;
$390 million of borrowings and $558 million in repayments under the CCH Working Capital Facility;
$290300 million principal amount of the 2025 CCH HoldCo II Convertible Senior Notes converted into cash;
$154 million of distributions to non-controlling interest by Cheniere Partners;
$72155 million paid to repurchase approximately 3 million shares of net repayments related to our Cheniere Marketing trade financing facilities;
$20 million of debt issuance costs primarily related to up-front fees paid uponcommon stock under the closing of the 2019 CQP Credit Facilities;share repurchase program; and
$1439 million paid for tax withholdings for share-based compensation.
Financing cash net inflows during the sixthree months ended June 30, 2018March 31, 2019 were $1.2 billion,$94 million, primarily as a result of:
$1.7 billion491 million of borrowings and $281 million in repayments under the CCH Credit Facility;
$14201 million of borrowings and $369 million in repayments under the CCH Working Capital Facility;
$12372 million of net borrowingsrepayments related to our Cheniere Marketing trade financing facilities;
$46144 million of debt issuance costs related to up-front fees paid for the amendment and restatement of the CCH Credit Facility and the CCH Working Capital Facility;
$8 million in debt extinguishment costs;
$288 million of distributions and dividends to non-controlling interest by Cheniere Partners and Cheniere Holdings;Partners; and
$812 million paid for tax withholdings for share-based compensation.
Results of Operations
The following charts summarize the number of Trains that were in operation during the year ended December 31, 2019 and the three months ended March 31, 2020 and total revenues and total LNG volumes loaded from our Liquefaction Projects (including both operational and commissioning volumes) during the three months ended March 31, 2020 and 2019:
The following table summarizes the volumes of operational and commissioning LNG cargoes that were loaded from the Liquefaction Projects, which were recognized on our Consolidated Financial Statements during the three and six months ended June 30, 2019:March 31, 2020:
|
| | | | | | | | | | | |
| | Three Months Ended June 30, 2019 | | Six Months Ended June 30, 2019 |
| (in TBtu) | Operational | | Commissioning | | Operational | | Commissioning |
| Volumes loaded during the current period | 361 |
| | 3 |
| | 645 |
| | 28 |
|
| Volumes loaded during the prior period but recognized during the current period | 27 |
| | — |
| | 25 |
| | 3 |
|
| Less: volumes loaded during the current period and in transit at the end of the period | (36 | ) | | (3 | ) | | (36 | ) | | (3 | ) |
| Total volumes recognized in the current period | 352 |
| | — |
| | 634 |
| | 28 |
|
Our consolidated net loss attributable to common stockholders was $114 million, or $0.44 per share (basic and diluted), in the three months ended June 30, 2019, compared to net loss attributable to common stockholders of $18 million, or $0.07 per share (basic and diluted), in the three months ended June 30, 2018. This $96 million increase in net loss attributable to common stockholders in 2019 was primarily attributable to decreased margins per MMBtu due to decreased pricing on LNG, increased interest expense, net of amounts capitalized, increased operating and maintenance expense, increased derivative loss, net, and increased depreciation and amortization expense, which were partially offset by decreased net income attributable to non-controlling interest. |
| | | | | |
| Three Months Ended March 31, 2020 |
| (in TBtu) | Operational | | Commissioning |
| Volumes loaded during the current period | 455 |
| | — |
|
| Volumes loaded during the prior period but recognized during the current period | 33 |
| | — |
|
| Less: volumes loaded during the current period and in transit at the end of the period | (29 | ) | | — |
|
| Total volumes recognized in the current period | 459 |
| | — |
|
Our consolidated net income attributable to common stockholders was $27$375 million, or $0.11$1.48 per share (basicshare—basic and diluted),$1.43 per share—diluted, in the sixthree months ended June 30, 2019,March 31, 2020, compared to net income attributable to common stockholders of $339
$141 million, or $1.42$0.55 per share—basic and $1.40$0.54 per share—diluted, in the sixthree months ended June 30, 2018.March 31, 2019. This $312$234 million decreaseincrease in net income attributable to common stockholders in 20192020 was primarily attributable to decreasedincreased gross margins per MMBtu due to increased volume of LNG sold partially offset by decreased pricing on LNG and from increased operating and maintenance expense, increasedderivative gains on commodity derivatives, which were partially offset by increases in (1) interest rate derivative loss, net, increased(2) interest expense, net of amounts capitalized, (3) income tax provision, (4) operating and increasedmaintenance expense and (5) depreciation and amortization expense, which were partially offset by decreased net income attributable to non-controlling interest.expense.
We enter into derivative instruments to manage our exposure to (1) changing interest rates, (2) commodity-related marketing and price risks and (3) foreign exchange volatility. Derivative instruments are reported at fair value on our Consolidated Financial Statements. In some cases, the underlying transactions economically hedged receive accrual accounting treatment, whereby revenues and expenses are recognized only upon delivery, receipt or realization of the underlying transaction. Because the recognition of derivative instruments at fair value has the effect of recognizing gains or losses relating to future period exposure, use of derivative instruments may increase the volatility of our results of operations based on changes in market pricing, counterparty credit risk and other relevant factors.
Revenues
| | | | Three Months Ended June 30, | | Six Months Ended June 30, | Three Months Ended March 31, |
| (in millions) | 2019 | | 2018 | | Change | | 2019 | | 2018 | | Change | 2020 | | 2019 | | Change |
| LNG revenues | $ | 2,173 |
| | $ | 1,442 |
| | $ | 731 |
| | $ | 4,316 |
| | $ | 3,608 |
| | $ | 708 |
| $ | 2,568 |
| | $ | 2,143 |
| | $ | 425 |
|
| Regasification revenues | 67 |
| | 65 |
| | 2 |
| | 133 |
| | 130 |
| | 3 |
| 67 |
| | 66 |
| | 1 |
|
| Other revenues | 52 |
| | 36 |
| | 16 |
| | 104 |
| | 47 |
| | 57 |
| 74 |
| | 52 |
| | 22 |
|
| Total revenues | $ | 2,292 |
|
| $ | 1,543 |
|
| $ | 749 |
|
| $ | 4,553 |
|
| $ | 3,785 |
|
| $ | 768 |
| $ | 2,709 |
|
| $ | 2,261 |
|
| $ | 448 |
|
We begin recognizing LNG revenues from the Liquefaction Projects following the substantial completion and the commencement of operating activities of the respective Trains. In addition toIncreased Trains 1 through 4 ofin operation over the SPL Project that were operational during both the six months ended June 30, 2019 and 2018, Train 5 of the SPL Project and Train 1 of the CCL Project
were operational for approximately four months during the six months ended June 30, 2019. Thecomparable period resulted in additional revenue from the increased volume of LNG sold. The increase in revenue attributable to LNG volume sold following the achievement of substantial completion of these Trains induring the three and six months ended June 30, 2019March 31, 2020 from the comparable periodsperiod in 20182019 was partially offset by decreased LNG revenues per MMBtu, which was primarily affected by sales made at currentdecreased pricing on LNG and to a lesser degree, market prices realized for volumes sold by our integrated marketing function. Additionally, the increase in other revenues was primarily due to an increase in sub-chartering income. LNG revenues during the three months ended March 31, 2020 also included $53 million in revenues attributable to LNG cargoes contractually canceled by our customers, for which revenue is generally recognized upon notice of customer cancellation. We expect our LNG revenues to increase in the future upon Train 3 of the CCL Project and Train 6 of the SPL Project and Trains 2 and 3 of the CCL Project becoming operational.
Prior to substantial completion of a Train, amounts received from the sale of commissioning cargoes from that Train are offset against LNG terminal construction-in-process, because these amounts are earned or loaded during the testing phase for the construction of that Train. WeDuring the three months ended March 31, 2019, we realized offsets to LNG terminal costs of $202 million corresponding to 28 TBtu, of LNG in the six months ended June 30, 2019respectively, that were related to the sale of commissioning cargoes from the Liquefaction Projects. We did not realize any offsets to LNG terminal costs induring the three months ended June 30, 2019 and the three and six months ended June 30, 2018.March 31, 2020.
Also included in LNG revenues are gains and losses from derivative instruments which include the realized value associated with a portion of derivative instruments that settle through physical delivery and the sale of unutilized natural gas procured for the liquefaction process. DuringWe recognized revenues of $265 million and $134 million during the three months ended June 30,March 31, 2020 and 2019, respectively, related to derivative instruments and 2018, we realized $183 million of gains and $34 million of losses, respectively,other revenues from these transactions and other revenues. During the six months ended June 30, 2019 and 2018, we realized $317 million and $8 million, respectively, of gains from these transactions and other revenues.transactions.
The following table presents the components of LNG revenues and the corresponding LNG volumes sold.sold:
| | | | Three Months Ended June 30, | | Six Months Ended June 30, | Three Months Ended March 31, |
| | 2019 | | 2018 | | 2019 | | 2018 | 2020 | | 2019 |
LNG revenues (in millions): | | | | | | | | | | |
| LNG from the Liquefaction Projects sold under third party long-term agreements (1) | $ | 1,393 |
| | $ | 1,118 |
| | $ | 2,910 |
| | $ | 2,111 |
| $ | 1,907 |
| | $ | 1,517 |
|
| LNG from the Liquefaction Projects sold by our integrated marketing function under short-term agreements | 566 |
| | 282 |
| | 905 |
| | 1,303 |
| 325 |
| | 339 |
|
| LNG procured from third parties | 31 |
| | 76 |
| | 184 |
| | 186 |
| 71 |
| | 153 |
|
| Other revenues and derivative gains (losses) | 183 |
| | (34 | ) | | 317 |
| | 8 |
| |
| Other revenues and derivative gains | | 265 |
| | 134 |
|
| Total LNG revenues | $ | 2,173 |
| | $ | 1,442 |
| | $ | 4,316 |
| | $ | 3,608 |
| $ | 2,568 |
| | $ | 2,143 |
|
| | | | | | | | | | | |
Volumes sold as LNG revenues (in TBtu): | | | | | | | | |
Volumes delivered as LNG revenues (in TBtu): | | | | |
| LNG from the Liquefaction Projects sold under third party long-term agreements (1) | 241 |
| | 189 |
| | 477 |
| | 354 |
| 366 |
| | 236 |
|
| LNG from the Liquefaction Projects sold by our integrated marketing function under short-term agreements | 111 |
| | 41 |
| | 157 |
| | 149 |
| 93 |
| | 46 |
|
| LNG procured from third parties | 5 |
| | 10 |
| | 23 |
| | 21 |
| 14 |
| | 18 |
|
| Total volumes sold as LNG revenues | 357 |
| | 240 |
| | 657 |
| | 524 |
| |
| Total volumes delivered as LNG revenues | | 473 |
| | 300 |
|
(1) Long-term agreements include agreements with tenure of 12 months or more.
| |
| (1) | Long-term agreements include agreements with a tenure of 12 months or more. LNG revenues include revenues with no corresponding volumes attributable to LNG cargoes contractually canceled by our customers, with revenue generally recognized upon notice of customer cancellation. |
Operating costs and expenses
| | | | Three Months Ended June 30, | | Six Months Ended June 30, | Three Months Ended March 31, |
| (in millions) | 2019 | | 2018 | | Change | | 2019 | | 2018 | | Change | 2020 | | 2019 | | Change |
| Cost of sales | $ | 1,277 |
| | $ | 873 |
| | $ | 404 |
| | $ | 2,491 |
| | $ | 2,051 |
| | $ | 440 |
| $ | 724 |
| | $ | 1,214 |
| | $ | (490 | ) |
| Operating and maintenance expense | 295 |
| | 147 |
| | 148 |
| | 516 |
| | 287 |
| | 229 |
| 316 |
| | 221 |
| | 95 |
|
| Development expense | 3 |
| | 3 |
| | — |
| | 4 |
| | 4 |
| | — |
| 4 |
| | 1 |
| | 3 |
|
| Selling, general and administrative expense | 77 |
| | 73 |
| | 4 |
| | 150 |
| | 140 |
| | 10 |
| 81 |
| | 73 |
| | 8 |
|
| Depreciation and amortization expense | 204 |
| | 111 |
| | 93 |
| | 348 |
| | 220 |
| | 128 |
| 233 |
| | 144 |
| | 89 |
|
| Impairment expense and loss on disposal of assets | 4 |
| | — |
| | 4 |
| | 6 |
| | — |
| | 6 |
| 5 |
| | 2 |
| | 3 |
|
| Total operating costs and expenses | $ | 1,860 |
| | $ | 1,207 |
| | $ | 653 |
| | $ | 3,515 |
| | $ | 2,702 |
| | $ | 813 |
| $ | 1,363 |
| | $ | 1,655 |
| | $ | (292 | ) |
Our total operating costs and expenses increaseddecreased during the three and six months ended June 30, 2019March 31, 2020 from the three and six months ended June 30, 2018,March 31, 2019, primarily as a result of the increase indecreased cost of sales from increased derivative gains and lower pricing of natural gas feedstock, partially offset by increased operating and maintenance expense from additional operating Trains between each of the periods and increased third-party servicedepreciation and maintenance costs from additional maintenance and related activities at the SPL Project.amortization expense.
Cost of sales includes costs incurred directly for the production and delivery of LNG from the Liquefaction Projects, to the extent those costs are not utilized for the commissioning process. Cost of sales increaseddecreased during the three and six months ended June 30, 2019March 31, 2020 from the three and six months ended June 30, 2018March 31, 2019 primarily due to increased volumes of natural gas feedstock for our LNG sales as a result of substantial completion of Train 5 of the SPL Project and Train 1 of the CCL Project, partially offset by decreased pricing of natural gas feedstock, and increased vessel charter costs. Partially offsetting the increase in cost of natural gas feedstock wasderivative gains from an increase in fair value of the derivatives associated with economic hedges to secure natural gas feedstock for the Liquefaction Projects, primarily due to a favorable shift in the long-term forward prices.prices relative to our hedged position. Additionally, cost of natural gas feedstock decreased between the periods due to decreased pricing, which was partially offset by increased volume. Partially offsetting these decreases was an increase in vessel charter costs. Cost of sales also includes port and canal fees, variable transportation and storage costs costs associated with a portion of derivative instruments that settle through physical delivery and the sale of natural gas procured for the liquefaction process and other costs to convert natural gas into LNG.
Operating and maintenance expense primarily includes costs associated with operating and maintaining the Liquefaction Projects. The increase in operating and maintenance expense during the three and six months ended June 30, 2019March 31, 2020 from the comparable 2019 period was primarily as a result of the increase in operating Trains. The increase during the three and six months ended June 30, 2018March 31, 2020 from the comparable period in 2019 was primarily related to: (1) increased natural gas transportation and storage capacity demand charges from operating Train 5 of the SPL Project and TrainTrains 1 and 2 of the CCL Project following the respective substantial completions, (2) increased cost of maintenanceTUA reservation charges due to Total under the partial TUA assignment agreement and related activities at the SPL Project, (3) increased payroll and benefit costs from increased headcount to operate Train 5 of the SPL Project and TrainTrains 1 and 2 of the CCL Project and (4) increased TUA reservation charges paid to Total from payments under the partial TUA assignment agreement. Operating and maintenance expense also includes insurance and regulatory costs and other operating costs.Project.
Depreciation and amortization expense increased during the three and six months ended June 30, 2019March 31, 2020 from the three and six months ended June 30, 2018March 31, 2019 as a result of commencing operationsan increased number of Train 5 of the SPL Project and Train 1 of the CCL Project in March 2019 and February 2019, respectively, and completing construction of the Corpus Christi Pipeline in the second quarter of 2018,operational Trains, as the related assets began depreciating upon reaching substantial completion.
We expect our operating costs and expenses to generally increase in the future upon Train 3 of the CCL Project and Train 6 of the SPL Project and Trains 2 and 3 of the CCL Project achieving substantial completion, although we expect certain costs will not proportionally increase with the number of operational Trains as cost efficiencies will be realized.
Other expense (income)
| | | | Three Months Ended June 30, | | Six Months Ended June 30, | Three Months Ended March 31, |
| (in millions) | 2019 | | 2018 | | Change | | 2019 | | 2018 | | Change | 2020 | | 2019 | | Change |
| Interest expense, net of capitalized interest | $ | 372 |
| | $ | 216 |
| | $ | 156 |
| | $ | 619 |
| | $ | 432 |
| | $ | 187 |
| $ | 412 |
| | $ | 247 |
| | $ | 165 |
|
| Loss on modification or extinguishment of debt | — |
| | 15 |
| | (15 | ) | | — |
| | 15 |
| | (15 | ) | 1 |
| | — |
| | 1 |
|
| Derivative loss (gain), net | 74 |
| | (32 | ) | | 106 |
| | 109 |
| | (109 | ) | | 218 |
| |
| Other income | (16 | ) | | (10 | ) | | (6 | ) | | (32 | ) | | (17 | ) | | (15 | ) | |
| Interest rate derivative loss, net | | 208 |
| | 35 |
| | 173 |
|
| Other income, net | | (9 | ) | | (16 | ) | | 7 |
|
| Total other expense | $ | 430 |
| | $ | 189 |
| | $ | 241 |
| | $ | 696 |
| | $ | 321 |
| | $ | 375 |
| $ | 612 |
| | $ | 266 |
| | $ | 346 |
|
Interest expense, net of capitalized interest, increased during the three and six months ended June 30, 2019 compared toMarch 31, 2020 from the three and six months ended June 30, 2018,March 31, 2019 as a result of increased outstanding debt (before unamortized premium, discount and debt issuance costs, net) from $27.6 billion as of June 30, 2018 to $30.7 billion as of June 30, 2019, primarily due to increased borrowings under the CCH Credit Facility, as well as a decrease in the portion of total interest costs that could be capitalizedis eligible for capitalization as additional Trains of the Liquefaction Projects completed construction between the periods. ForDuring the three months ended June 30,March 31, 2020 and 2019, and 2018, we incurred $458$471 million and $412$448 million of total interest cost, respectively, of which we capitalized $86$59 million and $196$201 million, respectively, which was primarily related to interest costs incurred to construct the constructionremaining assets of the Liquefaction Projects. For the six months ended June 30, 2019 and 2018, we incurred $906 million and $816 million of total interest cost, respectively, of which we capitalized $287 million and $384 million, respectively, which was primarily related to the construction of the Liquefaction Projects.
Loss on modification or extinguishment of debt during the three and six months ended June 30, 2019 decreased from the comparable periods in 2018. Loss on modification or extinguishment of debt recognized in 2018 was attributable to $15 million
of debt modification and extinguishment costs relating to the incurrence of third-party fees and write-off of unamortized debt issuance costs as a result of the amendment and restatement of the CCH Credit Facility.
Derivative loss, net increased during the three and six months ended June 30, 2019March 31, 2020 compared to the three and six months ended June 30, 2018,March 31, 2019, primarily due to an unfavorable shift in the long-term forward LIBOR curve between the periods.
Other income, increasednet decreased during the three and six months ended June 30, 2019 asMarch 31, 2020 compared to the three and six months ended June 30, 2018,March 31, 2019, primarily due to an increasea decrease in interest income earned on our cash and cash equivalents.equivalents and restricted cash.
Income tax benefit (provision)provision
| | | | Three Months Ended June 30, | | Six Months Ended June 30, | Three Months Ended March 31, |
| (in millions) | 2019 | | 2018 | | Change | | 2019 | | 2018 | | Change | 2020 | | 2019 | | Change |
| Income before income taxes and non-controlling interest | $ | 2 |
| | $ | 147 |
| | (145 | ) | | $ | 342 |
| | $ | 762 |
| | $ | (420 | ) | $ | 734 |
| | $ | 340 |
| | $ | 394 |
|
| Income tax benefit (provision) | — |
| | 3 |
| | (3 | ) | | (3 | ) | | (12 | ) | | 9 |
| |
| | | | | | | | | | | | | |
| Income tax provision | | (131 | ) | | (3 | ) | | (128 | ) |
| Effective tax rate | — | % | | 2.0 | % | | | | 0.9 | % | | 1.6 | % | | | 17.8 | % | | 0.9 | % | | |
IncomeThe effective tax benefit decreased $3 million duringrate for the three months ended June 30, 2019 and income tax provision decreased $9 million during the six months ended June 30, 2019, respectively, from the comparable periods in 2018 primarily attributable to changes in the income earned and tax transfer pricing applied to our U.K. integrated marketing function. The effective tax rates during each of the three and six months ended June 30, 2019 and 2018 wereMarch 31, 2020 is lower than the 21% federal statutory rate primarily asdue to income allocated to non-controlling interest that is not taxable to Cheniere, partially offset by a resultone-time discrete event related to an internal tax restructuring. The discrete item resulted in expense of $38 million for the three months ended March 31, 2020. The effective tax rate for the three months ended March 31, 2019 is lower than the 21% federal statutory rate primarily due to maintaining a valuation allowance against our federal and state net deferred tax assets. Given our current
On March 27, 2020, the Coronavirus Aid, Relief and anticipated future earnings, we believe that thereEconomic (CARES) Act (“the CARES Act”) was signed into law which provides numerous tax changes in response to the COVID-19 pandemic. The most significant provision expected to impact us is a reasonable possibility that within approximately 6the modification to 18 months, sufficient positive evidence may become availablethe business interest expense limitation. The CARES Act increases the adjusted taxable income limitation from 30% to 50% for business interest deductions in 2019 and 2020 and will allow us to conclude that a significant portion of the valuation allowance will no longer be needed. The release of the valuation allowance would resultdeduct additional business interest expense in the recognition of certain deferred tax assets and an income tax benefit in the period the release is recorded. However, the precise timing and amount of the valuation allowance release are subject to change on the basis of the level of profitability that we are able to achieve.2020.
Net income attributable to non-controlling interest
| | | | Three Months Ended June 30, | | Six Months Ended June 30, | Three Months Ended March 31, |
| (in millions) | 2019 | | 2018 | | Change | | 2019 | | 2018 | | Change | 2020 | | 2019 | | Change |
| Net income attributable to non-controlling interest | $ | 116 |
| | $ | 168 |
| | $ | (52 | ) | | $ | 312 |
| | $ | 411 |
| | $ | (99 | ) | $ | 228 |
| | $ | 196 |
| | $ | 32 |
|
Net income attributable to non-controlling interest decreased during the three and six months ended June 30, 2019 from the three and six months ended June 30, 2018 due to the decrease of non-controlling interest as a result of our merger with Cheniere Holdings in September 2018, in which all publicly-held shares of Cheniere Holdings were canceled and the non-controlling interest in Cheniere Holdings was reduced to zero. Net income attributable to non-controlling interest also decreasedincreased during the three months ended June 30, 2019March 31, 2020 from the three months ended June 30, 2018March 31, 2019 primarily due to the decreasean increase in consolidated net income recognized by Cheniere Partners in which the non-controlling interests are held.Partners. The consolidated net income recognized by Cheniere Partners decreasedincreased from $281$385 million in the three months ended June 30, 2018March 31, 2019 to $232$435 million in the three months ended June 30, 2019March 31, 2020 primarily due an increaseincreased gross margins due to higher volumes of LNG, partially offset by increases in (1) interest expense, net of capitalized interest, as a result of the decrease in the portion of total interest costs that could be capitalized as an additional Train of the SPL Project completed construction between the periods.(2) depreciation and amortization expense and (3) operating and maintenance expense.
Off-Balance Sheet Arrangements
As of June 30, 2019,March 31, 2020, we had no transactions that met the definition of off-balance sheet arrangements that may have a current or future material effect on our consolidated financial position or operating results.
Summary of Critical Accounting Estimates
The preparation of our Consolidated Financial Statements in conformity with GAAP requires management to make certain estimates and assumptions that affect the amounts reported in the Consolidated Financial Statements and the accompanying notes. There have been no significant changes to our critical accounting estimates from those disclosed in our annual report on Form 10-K for the year ended December 31, 20182019.
Recent Accounting Standards
ITEM 3. QUANTITATIVE AND QUALITATIVE DISCLOSURES ABOUT MARKET RISK
Cash Investments
We have cash investments that we manage based on internal investment guidelines that emphasize liquidity and preservation of capital. Such cash investments are stated at historical cost, which approximates fair market value on our Consolidated Balance Sheets.
Marketing and Trading Commodity Price Risk
We have entered into commodity derivatives consisting of natural gas supply contracts for the commissioning and operation of the SPL Project, the CCL Project and potential future development of Corpus Christi Stage 3 (“Liquefaction Supply Derivatives”). We have also entered into financial derivatives to hedge the exposure to the commodity markets in which we have contractual arrangements to purchase or sell physical LNG (“LNG Trading Derivatives”). In order to test the sensitivity of the fair value of the Liquefaction Supply Derivatives and the LNG Trading Derivatives to changes in underlying commodity prices, management modeled a 10% change in the commodity price for natural gas for each delivery location and a 10% change in the commodity price for LNG, respectively, as follows (in millions):
| | | | June 30, 2019 | | December 31, 2018 | March 31, 2020 | | December 31, 2019 |
| | Fair Value | | Change in Fair Value | | Fair Value | | Change in Fair Value | Fair Value | | Change in Fair Value | | Fair Value | | Change in Fair Value |
| Liquefaction Supply Derivatives | $ | 90 |
| | $ | 127 |
| | $ | (42 | ) | | $ | 6 |
| $ | 678 |
| | $ | 180 |
| | $ | 149 |
| | $ | 179 |
|
| LNG Trading Derivatives | 47 |
| | 39 |
| | (24 | ) | | 9 |
| 185 |
| | 2 |
| | 165 |
| | 22 |
|
Interest Rate Risk
We are exposed to interest rate risk primarily when we incur debt related to project financing. Interest rate risk is managed in part by replacing outstanding floating-rate debt with fixed-rate debt with varying maturities. CCH has entered into interest rate swaps to hedge the exposure to volatility in a portion of the floating-rate interest payments under the CCH Credit Facility (“CCH Interest Rate Derivatives”) and to hedge against changes in interest rates that could impact anticipated future issuance of debt by CCH (“CCH Interest Rate Forward Start Derivatives”). In order to test the sensitivity of the fair value of the CCH Interest Rate Derivatives to changes in interest rates, management modeled a 10% change in the forward one-month LIBOR curve across the remaining terms of the CCH Interest Rate Derivatives and CCH Interest Rate Forward Start Derivatives as follows (in millions):
| | | | June 30, 2019 | | December 31, 2018 | March 31, 2020 | | December 31, 2019 |
| | Fair Value | | Change in Fair Value | | Fair Value | | Change in Fair Value | Fair Value | | Change in Fair Value | | Fair Value | | Change in Fair Value |
| CCH Interest Rate Derivatives | $ | (88 | ) | | $ | 25 |
| | $ | 18 |
| | $ | 37 |
| $ | (197 | ) | | $ | 4 |
| | $ | (81 | ) | | $ | 19 |
|
| CCH Interest Rate Forward Start Derivatives | (7 | ) | | 20 |
| | — |
| | — |
| (92 | ) | | 9 |
| | (8 | ) | | 15 |
|
Foreign Currency Exchange Risk
We have entered into foreign currency exchange (“FX”) contracts to hedge exposure to currency risk associated with operations in countries outside of the United States (“FX Derivatives”). In order to test the sensitivity of the fair value of the FX Derivatives to changes in FX rates, management modeled a 10% change in FX rate between the U.S. dollar and the applicable foreign currencies as follows (in millions):
|
| | | | | | | | | | | | | | | |
| | June 30, 2019 | | December 31, 2018 |
| | Fair Value | | Change in Fair Value | | Fair Value | | Change in Fair Value |
| FX Derivatives | $ | 10 |
| | $ | 1 |
| | $ | 15 |
| | $ | 1 |
|
|
| | | | | | | | | | | | | | | |
| | March 31, 2020 | | December 31, 2019 |
| | Fair Value | | Change in Fair Value | | Fair Value | | Change in Fair Value |
| FX Derivatives | $ | 23 |
| | $ | 2 |
| | $ | 4 |
| | $ | — |
|
| |
| ITEM 4. | CONTROLS AND PROCEDURES |
We maintain a set of disclosure controls and procedures that are designed to ensure that information required to be disclosed by us in the reports filed by us under the Exchange Act, is recorded, processed, summarized and reported within the time periods specified in the SEC’s rules and forms. As of the end of the period covered by this report, we evaluated, under the supervision and with the participation of our management, including our Chief Executive Officer and our Chief Financial Officer, the effectiveness of our disclosure controls and procedures pursuant to Rule 13a-15 of the Exchange Act. Based on that evaluation, our Chief Executive Officer and our Chief Financial Officer concluded that our disclosure controls and procedures are effective.
During the most recent fiscal quarter, there have been no changes in our internal control over financial reporting that have materially affected, or are reasonably likely to materially affect, our internal control over financial reporting.
PART II. OTHER INFORMATION
ITEM 1. LEGAL PROCEEDINGS
We may in the future be involved as a party to various legal proceedings, which are incidental to the ordinary course of business. We regularly analyze current information and, as necessary, provide accruals for probable liabilities on the eventual disposition of these matters. Other than discussed below, thereThere have been no material changes to the legal proceedings disclosed in our annual report on Form 10-K for the year ended December 31, 20182019.
In February 2018, the Pipeline and Hazardous Materials Safety Administration (“PHMSA”) issued a Corrective Action Order (the “CAO”) to SPL in connection with a minor LNG leak from one tank and minor vapor release from a second tank at the Sabine Pass LNG terminal. These two tanks have been taken out of operational service while we conduct analysis, repair and remediation. On April 20, 2018, SPL and PHMSA executed a Consent Agreement and Order (the “Consent Order”) that replaces and supersedes the CAO. On July 9, 2019, PHMSA and FERC issued a joint letter setting out operating conditions required to be met prior to SPL returning the tanks to service. We continue to coordinate with PHMSA and FERC to address the matters relating to the February 2018 leak, including repair approach and related analysis. We do not expect that the Consent Order and related analysis, repair and remediation will have a material adverse impact on our financial results or operations.
The outbreak of COVID-19 and volatility in the energy markets may materially and adversely affect our business, financial condition, operating results, cash flow, liquidity and prospects.
The outbreak of COVID-19 and its development into a pandemic in March 2020 have resulted in significant disruption globally. Actions taken by various governmental authorities, individuals and companies around the world to prevent the spread of COVID-19 have restricted travel, business operations, and the overall level of individual movement and in-person interaction across the globe. Additionally, recent disputes over production levels between members of the Organization of Petroleum Exporting Countries and other oil producing countries has resulted in increased volatility in oil and natural gas prices.
The extent, duration and magnitude of the COVID-19 pandemic’s effects will depend on future developments, all of which are highly uncertain and difficult to predict, including the impact of the pandemic on global and regional economies, travel, and economic activity, as well as actions taken by governments, business and individuals in response to the pandemic or any future resurgence. These developments include the impact of the COVID-19 pandemic on unemployment rates, the demand for oil and natural gas, levels of consumer confidence and the post-pandemic pace of recovery.
Many uncertainties remain with respect to the COVID-19 pandemic, and we continue to monitor the rapidly evolving situation. The COVID-19 pandemic alone or coupled with continued volatility in the energy markets may materially and adversely affect our business, financial condition, operating results, cash flow, liquidity and prospects or have the effect of heightening many of the other risks described herein and in our annual report on Form 10-K for the year ended December 31, 2019. The extent to which our business, contracts, financial condition, operating results, cash flow, liquidity and prospects are affected by the COVID-19 outbreak or volatility in the energy markets will depend on various factors beyond our control and are highly uncertain, including the duration and scope of the outbreak, decreased demand for LNG and the resulting economic effects of the outbreak of COVID-19.
Our ability to generate cash is substantially dependent upon the performance by customers under long-term contracts that we have entered into, and we could be materially and adversely affected if any significant customer fails to perform its contractual obligations for any reason.
Our future results and liquidity are substantially dependent upon performance by our customers to make payments under long-term contracts. As of March 31, 2020, SPL had SPAs with eight third-party customers, CCL had SPAs with nine third-party customers and our integrated marketing function had a limited number of SPAs with third-party customers. In addition, SPLNG had TUAs with two third-party customers. We are dependent on each customer’s continued willingness and ability to perform its obligations under its SPA or TUA. We are exposed to the credit risk of any guarantor of these customers’ obligations under their respective agreements in the event that we must seek recourse under a guaranty. As a result of the disruptions caused by the COVID-19 pandemic and the volatility in the energy markets, we believe we are exposed to heightened credit and performance risk of our customers. Additionally, some customers have indicated to us that COVID-19 has begun to impact their operations and/or may impact their operations in the future. Some of our SPA customers’ primary countries of business have experienced a significant number of COVID-19 cases and/or have been subject to government imposed lockdown or quarantine measures. Although we believe that impacts of the COVID-19 pandemic on LNG regasification facilities, downstream markets and broader energy demand do not constitute valid force majeure claims under our FOB LNG SPAs, if any significant customer fails to perform its obligations under its SPA or TUA, our business, contracts, financial condition, operating results, cash flow, liquidity and prospects
could be materially and adversely affected, even if we were ultimately successful in seeking damages from that customer or its guarantor for a breach of the agreement.
Cost overruns and delays in the completion of one or more Trains, as well as difficulties in obtaining sufficient financing to pay for such costs and delays, could have a material adverse effect on our business, contracts, financial condition, operating results, cash flow, liquidity and prospects.
The actual construction costs of the Trains may be significantly higher than our current estimates as a result of many factors, including change orders under existing or future EPC contracts resulting from the occurrence of certain specified events that may give our EPC contractor the right to cause us to enter into change orders or resulting from changes with which we otherwise agree. We have already experienced increased costs due to change orders. As construction progresses, we may decide or be forced to submit change orders to our contractor that could result in longer construction periods, higher construction costs or both, including change orders to comply with existing or future environmental or other regulations.
The outbreak of COVID-19 and the resulting actions taken by governmental and regulatory authorities to prevent the spread of COVID-19 may cause a slow-down in the construction of one or more Trains. Our EPC contractor has advised us of voluntary proactive measures it is taking to protect employees and to mitigate risks associated with COVID-19, however, it has not indicated that there will be any changes to the project cost or schedule and is still performing its obligations under its EPC contracts. While the construction of Trains is continuing, if there was a major outbreak of COVID-19 at any construction site or the implementation of restrictions by the government that prevented construction for an extended period, we could experience significant delays in the construction of one or more Trains.
Delays in the construction of one or more Trains beyond the estimated development periods, as well as change orders to our existing EPC contracts or any future EPC contract related to additional Trains, could increase the cost of completion beyond the amounts that we estimate, which could require us to obtain additional sources of financing to fund our operations until the applicable liquefaction project is fully constructed (which could cause further delays). Our ability to obtain financing that may be needed to provide additional funding to cover increased costs will depend, in part, on factors beyond our control. Accordingly, we may not be able to obtain financing on terms that are acceptable to us, or at all. Even if we are able to obtain financing, we may have to accept terms that are disadvantageous to us or that may have a material adverse effect on our current or future business, contracts, financial condition, operating results, cash flow, liquidity and prospects.
Outbreaks of infectious diseases, such as the outbreak of COVID-19, at one or more of our facilities could adversely affect our operations.
Federal, state and local governments have enacted various measures to try to contain the outbreak of COVID-19, such as travel bans and restrictions, quarantines, shelter-in-place orders and business shutdowns. Our facilities at the Sabine Pass LNG terminal and Corpus Christi LNG terminal are critical infrastructure and have continued to operate during the outbreak, which means that we must keep our employees who operate our facilities safe and minimize unnecessary risk of exposure to the virus. In response, we have taken extra precautionary measures to protect the continued safety and welfare of our employees who continue to work at our facilities and have modified certain business and workforce practices, such as implementing work from home policies where appropriate. The measures taken to prevent an outbreak at our facilities have resulted in increased costs. If a large number of our employees in those critical facilities were to contract COVID-19 at the same time, our operations could be adversely affected.
| |
| ITEM 2. | UNREGISTERED SALES OF EQUITY SECURITIES AND USE OF PROCEEDS |
Purchase of Equity Securities by the Issuer and Affiliated Purchasers
The following table summarizes stock repurchases for the three months ended June 30, 2019:March 31, 2020: |
| | | | | | | | |
| Period | | Total Number of Shares Purchased (1) | | Average Price Paid Per Share (2) | | Total Number of Shares Purchased as a Part of Publicly Announced Plans | | Approximate Dollar Value of Shares That May Yet Be Purchased Under the Plans (3) |
| April 1 - 30, 2019 | | 425 | | $64.70 | | — | | — |
| May 1 - 31, 2019 | | 13,973 | | $67.87 | | — | | — |
| June 1 - 30, 2019 | | 45,266 | | $68.24 | | 44,600 | | $996,954,020 |
|
| | | | | | | | |
| Period | | Total Number of Shares Purchased (1) | | Average Price Paid Per Share (2) | | Total Number of Shares Purchased as a Part of Publicly Announced Plans | | Approximate Dollar Value of Shares That May Yet Be Purchased Under the Plans (3) |
| January 1 - 31, 2020 | | 689,407 | | $60.91 | | 681,100 | | $709,400,285 |
| February 1 - 29, 2020 | | 961,734 | | $55.97 | | 225,892 | | $695,992,139 |
| March 1 - 31, 2020 | | 1,968,384 | | $50.80 | | 1,968,384 | | $595,952,809 |
| Total | | 3,619,525 | | $54.11 | | 2,875,376 | | |
| |
| (1) | Includes issued shares surrendered to us by participants in our share-based compensation plans for payment of applicable tax withholdings on the vesting of share-based compensation awards. Associated shares surrendered by participants are repurchased pursuant to settleterms of the participants’ personal tax liabilities that resulted fromplan and award agreements and not as part of the lapsing of restrictions on shares awarded to the participants under these plans.publicly announced share repurchase plan. |
| |
| (2) | The price paid per share was based on the closingaverage trading price of our common stock on the dates on which we repurchased the shares. |
| |
| (3) | On June 3, 2019, we announced that our Board authorized a 3-year, $1 billion share repurchase program. For additional information, see Note 16—Share Repurchase Program. |
|
| | |
| Exhibit No. | | Description |
10.110.1* | | Omnibus Amendment 4 to Amended and Restated Note Purchase Agreement, Amendment to Registration Rights Agreement and Administrative Agent and Technical Agent Resignation and Appointment Agreement, dated as of February 18, 2020, by and among CCH HoldCo II, as Issuer, EIG Management Company, LLC, as resigning administrative agent and as technical agent, The Bank of New York Mellon, as collateral agent and as Successor Agent and the note holders identified therein |
| 10.2 | | Amendment 5 to Amended and Restated Note Purchase Agreement, dated as of February 24, 2020, by and among CCH HoldCo II, as Issuer, the Company, EIG Management Company, LLC, as technical agent, The Bank of New York Mellon, as administrative agent and collateral agent and the note holders identified therein (Incorporated by reference to Exhibit 10.1 to the Company’s Current Report on Form 8-K (SEC File No. 001-16383), filed on February 25, 2020) |
| 10.3 | | Working Capital Revolving Credit and GuarantyLetter of Credit Reimbursement Agreement, dated May 29, 2019, among Cheniere Partners,SPL, as Borrower,borrower, certain subsidiaries of Cheniere Partners,SPL, The Bank of Nova Scotia, as Subsidiary Guarantors,Senior Facility Agent, Société Générale, as the Common Security Trustee, the issuing banks and lenders from time to time party thereto Natixis, Société Générale, The Bank of Nova Scotia, Wells Fargo Bank, as Issuing Banks, MUFG Bank, LTD as Administrative Agent and Sole Coordinating Lead Arranger, and certain arrangers and other participants (Incorporated by reference to Exhibit 10.1 to Cheniere Partners’SPL’s Current Report on Form 8-K (SEC File No. 001-33366)333-192373), filed on June 3, 2019)March 23, 2020) |
10.2*10.4 | | Third Amended and Restated Senior Working Capital Revolving Credit and Letter of Credit ReimbursementCommon Terms Agreement, dated September 4, 2015, as amended by (a) Third Omnibus Amendment, dated as of May 23, 2018; (b) Fourth Omnibus Amendment, dated as of September 17, 2018; and (c) Fifth Omnibus Amendment, Consent and Waiver, dated as of May 29, 2019, among SPL, as Borrower, The Bank of Nova Scotia, as Senior Issuing Bankborrower, the Secured Debt Holder Group Representatives party thereto, the Secured Hedge Representatives party thereto, the Secured Gas Hedge Representatives party thereto and Senior Facility Agent, ABN Amro Capital USA LLC, HSBC Bank USA, National Association and ING Capital LLC, as Senior Issuing Banks, Société Générale, as Swing Line Lender andthe Common Security Trustee and the senior lenders party thereto from timeIntercreditor Agent (Incorporated by reference to timeExhibit 10.2 to SPL’s Current Report on Form 8-K (SEC File No. 333-192373), filed on March 23, 2020) |
10.3*10.5 | | |
| 10.6* | | Change ordersorder to the Fixed Price SeparatedLump Sum Turnkey Agreement for the Engineering, Procurement and Construction of the Corpus ChristiSabine Pass LNG Stage 14 Liquefaction Facility, dated as of December 6, 2013,November 7, 2018, by and between CCLSPL and Bechtel Oil Gas and Chemicals, Inc.: (i) the Change Order CO-00051 Fencing Scope Modifications,CO-00013 Cost to Comply with SPL FTZ (FTZ entries, bonded transports and receipts for AG Pipe Spools Only), dated April 19, 2019 andFebruary 10, 2020, (ii) the Change Order CO-00052 West Jetty ManualCO-00014 Permanent Access Road to Third Berth, dated February 10, 2020, (iii) the Change Order CO-00015 Modifications to Schedule Bonus Language, dated February 10, 2020, (iv) the Change Order CO-00016 LNG Berth 3 LNTP No 3, dated January 31, 2020 and (v) the Change Order CO-00017 Construction Doc Fender Guards and LP Fuel Gas Sampler,Overpressure Interlock, dated April 19, 2019 (Portions of this exhibit have been omitted.)March 18, 2020 |
10.4*10.7* | | Change orders to the Amended and Restated Fixed Price Separated Turnkey Agreement for the Engineering, Procurement and Construction of the Corpus Christi Stage 2 Liquefaction Facility, dated as of December 12, 2017, between CCL and Bechtel Oil, Gas and Chemicals, Inc.: (i) the Change Order CO-000013 Section 232 Steel and Aluminum TariffsCO-00024 East Jetty Cooldown Line & Anti-dumping (ADA) and Countervailing Duties (CVD),Simultaneous Ship Loading, dated May 2, 2019,January 6, 2020, (ii) the Change Order CO-00014CO-00025 East Jetty Manual Gas Sampler, dated January 7, 2020, (iii) the Change Order CO-00026 Study for Adding Valve Actuator for E-W Jetty Flow Segregation, dated January 8, 2020, (iv) the Change Order CO-00027 Tank B Jump-over Tie-In InterfaceIsolation of Proposed Fourth In-Tank LNG Pump - Long Lead Items, dated May 2, 2019 and (iii)January 8, 2020, (v) the Change Order CO-00015 Section 232 SteelCO-00028 Tank B Rundown Line (Part I), dated January 31, 2020, (vi) the Change Order CO-00029 9% Nickel and Aluminum Tariffs & Anti-dumping (ADA)Cryogenic Rebar Provisional Sum Closeout, dated February 18, 2020 and Countervailing Duties (CVD) Q1_2019,(vii) the Change Order CO-00030 Additional Valve for Isolation in CCL Stage 2 to CCL Stage 3 from Tank B, dated June 4, 2019February 18, 2020 (Portions of this exhibit have been omitted.) |
10.5* | | |
10.6* | | |
| 31.1* | | |
| 31.2* | | |
| 32.1** | | |
| 32.2** | | |
| 101.INS* | | XBRL Instance Document - the instance document does not appear in the Interactive Data File because its XBRL tags are embedded within the Inline XBRL document. |
| 101.SCH* | | Inline XBRL Taxonomy Extension Schema Document |
| 101.CAL* | | Inline XBRL Taxonomy Extension Calculation Linkbase Document |
| 101.DEF* | | Inline XBRL Taxonomy Extension Definition Linkbase Document |
| 101.LAB* | | Inline XBRL Taxonomy Extension Labels Linkbase Document |
| 101.PRE* | | Inline XBRL Taxonomy Extension Presentation Linkbase Document |
| 104* | | Cover Page Interactive Data File (formatted as Inline XBRL and contained in Exhibit 101) |
|
| |
| * | Filed herewith. |
| ** | Furnished herewith. |
Pursuant to the requirements of the Securities Exchange Act of 1934, the registrant has duly caused this report to be signed on its behalf by the undersigned, thereunto duly authorized.
|
| | | |
| | | CHENIERE ENERGY, INC. |
| | | | |
| Date: | August 7, 2019April 29, 2020 | By: | /s/ Michael J. Wortley |
| | | | Michael J. Wortley |
| | | | Executive Vice President and Chief Financial Officer |
| | | | (on behalf of the registrant and
as principal financial officer) |
| | | | |
| Date: | August 7, 2019April 29, 2020 | By: | /s/ Leonard E. Travis |
| | | | Leonard E. Travis |
| | | | Senior Vice President and Chief Accounting Officer |
| | | | (on behalf of the registrant and
as principal accounting officer) |