Note 10.9. Short-term Financing
The Company has a $3.5$3.75 billion, 364-day credit agreement that matures in June 20182022 with a one year term-out option. The Company also has a $2.25$2.75 billion five-yearfive year credit facility that matures in June 20222024 that also contains an accordion feature under which the aggregate commitment can be increased by $500 million, subject to the availability of additional commitments. In addition, the Company has a five-year $3.75five year $3.2 billion credit facility maturing in June 20212026 that also contains an accordion feature under which the aggregate commitment can be increased by $500 million, subject to the availability of additional commitments. The interest rate applicable to committed borrowings is tied to LIBOR, the effective federal funds rate, or the prime rate, depending on the notification provided by the Company to the syndicated financial institutions prior to borrowing. The Company is also required to pay facility fees on the credit agreements. The primary uses of the credit facilities are to provide liquidity to the commercial paper program and funding for general corporate purposes, if necessary. The Company had no borrowings through December 31, 20172021 under the credit agreements.
The Company's U.S. short-term funding requirements related to client funds are sometimes obtained on an unsecured basis through the issuance of commercial paper, rather than liquidating previously-collected client funds that have already been invested in available-for-sale securities. This commercial paper program provides for the issuance of up to $9.5$9.7 billion in aggregate maturity value. The Company’s commercial paper program is rated A-1+ by Standard & Poor’s, Prime-1 (“P-1”) by Moody’s and Prime-1F1+ by Moody’s.Fitch. These ratings denote the highest quality commercial paper securities. Maturities of commercial paper can range from overnight to up to 364 days. At December 31, 20172021 and June 30, 2017,2021, the Company had no commercial paper borrowing outstanding. For the three months ended December 31, 2017 and 2016, the Company had average daily borrowings of $3.5 billion and $4.2 billion, respectively, at weighted average interest rates of 1.2% and 0.5%, respectively. For the six months ended December 31, 2017 and 2016, the Company had average daily borrowings of $3.7 billion and $4.2 billion, respectively, at weighted average interest rates of 1.2% and 0.5%, respectively. The weighted average maturityDetails of the Company’sborrowings under the commercial paper during the three and six months ended December 31, 2017 was approximately two days.program are as follows:
| Three Months Ended | Six Months Ended | ||||||||||||||||||||||
| December 31, | December 31, | ||||||||||||||||||||||
| 2021 | 2020 | 2021 | 2020 | ||||||||||||||||||||
| Average daily borrowings (in billions) | $ | 1.9 | $ | 1.8 | $ | 1.9 | $ | 2.1 | |||||||||||||||
| Weighted average interest rates | 0.1 | % | 0.1 | % | 0.1 | % | 0.1 | % | |||||||||||||||
| Weighted average maturity (approximately in days) | 1 day | 1 day | 1 day | 1 day | |||||||||||||||||||
The Company’s U.S., Canadian and CanadianUnited Kingdom short-term funding requirements related to client funds obligations are sometimes obtained on a secured basis through the use of reverse repurchase agreements, which are collateralized principally by government and government agency securities, rather than liquidating previously-collected client funds that have already been invested in available-for-sale securities. These agreements generally have terms ranging from overnight to up to five business days. At December 31, 2017 and2021 there were no outstanding obligations related to reverse repurchase agreements. At June 30, 2017, there were no2021, the Company had $23.5 million of outstanding obligations related to the reverse repurchase agreements. ForDetails of the three months ended December 31, 2017 and 2016, the Company had average outstanding balances under reverse repurchase agreements of $537.0 million and $267.6 million, respectively, at weighted average interest rates of 1.2% and 0.5%, respectively. For the six months ended December 31, 2017 and 2016, the Company had average outstanding balances under reverse repurchase agreements of $531.6 million and $313.4 million, respectively, at weighted average interest rates of 1.1% and 0.5%, respectively.are as follows:
| Three Months Ended | Six Months Ended | ||||||||||||||||||||||
| December 31, | December 31, | ||||||||||||||||||||||
| 2021 | 2020 | 2021 | 2020 | ||||||||||||||||||||
| Average outstanding balances | $ | 228.4 | $ | 83.2 | $ | 211.7 | $ | 117.8 | |||||||||||||||
| Weighted average interest rates | 0.2 | % | 0.3 | % | 0.2 | % | 0.3 | % | |||||||||||||||
Note 11. Long-term10. Debt
The Company hasissued three series of fixed-rate notes with 5-yearstaggered maturities of 7 and 10-year maturities for an aggregate principal amount of $2.010-years totaling $3.0 billion (collectively the “Notes”). The Notes are senior unsecured obligations, and interest is payable in arrears, semi-annually.
16
The principal amounts and associated effective interest rates of the Notes and other debt as of December 31, 20172021 and June 30, 2017,2021, are as follows:
| Debt instrument | Effective Interest Rate | December 31, 2021 | June 30, 2021 | |||||||||||||||||
| Fixed-rate 3.375% notes due September 15, 2025 | 3.47% | $ | 1,000.0 | $ | 1,000.0 | |||||||||||||||
| Fixed-rate 1.250% notes due September 1, 2030 | 1.83% | 1,000.0 | 1,000.0 | |||||||||||||||||
| Fixed-rate 1.700% notes due May 15, 2028 | 1.85% | 1,000.0 | 1,000.0 | |||||||||||||||||
| Other | 6.4 | 6.9 | ||||||||||||||||||
| 3,006.4 | 3,006.9 | |||||||||||||||||||
| Less: current portion (a) | (1.1) | (1.2) | ||||||||||||||||||
| Less: unamortized discount and debt issuance costs | (19.2) | (20.7) | ||||||||||||||||||
| Total long-term debt | $ | 2,986.1 | $ | 2,985.0 | ||||||||||||||||
| Debt instrument | Effective Interest Rate | December 31, 2017 | June 30, 2017 | |||||||
| Fixed-rate 2.250% notes due September 15, 2020 | 2.37% | $ | 1,000.0 | $ | 1,000.0 | |||||
| Fixed-rate 3.375% notes due September 15, 2025 | 3.47% | 1,000.0 | 1,000.0 | |||||||
| Other | 14.0 | 20.3 | ||||||||
| 2,014.0 | 2,020.3 | |||||||||
| Less: current portion | (2.5 | ) | (7.8 | ) | ||||||
| Less: unamortized discount and debt issuance costs | (9.1 | ) | (10.1 | ) | ||||||
| Total long-term debt | $ | 2,002.4 | $ | 2,002.4 | ||||||
(a) - Current portion of long-term debt as of December 31, 2021 is included within Accrued expenses and other current liabilities on the Consolidated Balance Sheets.
The effective interest rates for the Notes include the interest on the Notes and amortization of the discount and debt issuance costs.
As of December 31, 2017,2021, the fair value of the Notes, based on Level 2 inputs, was $2,034.7$3,012.2 million. For a description of the fair value hierarchy and the Company's fair value methodologies, including the use of an independent third-party pricing service, see Note 1 "Summary“Summary of Significant Accounting Policies"Policies” in the Company's Annual Report on Form 10-K for fiscal 2017.2021.
Note 12.11. Employee Benefit Plans
A. Stock-based Compensation PlansPlans. Stock-based compensation consists of the following:
The Company's share-based compensation consists of stock options, time-based restricted stock, time-based restricted stock units, performance-based restricted stock, and performance-based restricted stock units. The Company also offers an employee stock purchase plan for eligible employees.
The Company currently utilizes treasury stock to satisfy stock option exercises, issuances under the Company's employee stock purchase plan, and restricted stock awards. From time to time, the Company may repurchase shares of its common stock under its authorized share repurchase programs.program. The Company repurchased 1.42.0 million and 4.61.6 million shares in the three months ended December 31, 20172021 and 2016,2020, respectively, and repurchased 3.64.6 million and 8.63.2 million shares in the six months ended December 31, 20172021 and 2016,2020, respectively. The Company considers several factors in determining when to execute share repurchases, including, among other things, actual and potential acquisition activity, cash balances and cash flows, issuances due to employee benefit plan activity, and market conditions.
The following table represents pre-tax stock-based compensation expense for the three and six months ended December 31, 20172021 and 2016,2020, respectively:
| Three Months Ended | Six Months Ended | ||||||||||||||||||||||
| December 31, | December 31, | ||||||||||||||||||||||
| 2021 | 2020 | 2021 | 2020 | ||||||||||||||||||||
| Operating expenses | $ | 5.2 | $ | 4.8 | $ | 9.9 | $ | 8.4 | |||||||||||||||
| Selling, general and administrative expenses | 42.7 | 35.6 | 74.1 | 60.9 | |||||||||||||||||||
| System development and programming costs | 7.7 | 6.7 | 13.9 | 11.6 | |||||||||||||||||||
| Total stock-based compensation expense | $ | 55.6 | $ | 47.1 | $ | 97.9 | $ | 80.9 | |||||||||||||||
17
| Three Months Ended | Six Months Ended | ||||||||||||||
| December 31, | December 31, | ||||||||||||||
| 2017 | 2016 | 2017 | 2016 | ||||||||||||
| Operating expenses | $ | 5.4 | $ | 6.3 | $ | 10.6 | $ | 11.8 | |||||||
| Selling, general and administrative expenses | 27.5 | 24.3 | 56.1 | 45.9 | |||||||||||
| System development and programming costs | 5.8 | 5.2 | 11.0 | 9.2 | |||||||||||
| Total stock-based compensation expense | $ | 38.7 | $ | 35.8 | $ | 77.7 | $ | 66.9 | |||||||
B. Pension Plans
The components of net pension expenseincome were as follows:
| Three Months Ended | Six Months Ended | ||||||||||||||||||||||||||||||||||
| December 31, | December 31, | ||||||||||||||||||||||||||||||||||
| 2021 | 2020 | 2021 | 2020 | ||||||||||||||||||||||||||||||||
| Service cost – benefits earned during the period | $ | 1.4 | $ | 1.2 | $ | 2.8 | $ | 2.4 | |||||||||||||||||||||||||||
| Interest cost on projected benefits | 13.1 | 12.8 | 26.2 | 25.5 | |||||||||||||||||||||||||||||||
| Expected return on plan assets | (32.0) | (30.4) | (64.0) | (60.7) | |||||||||||||||||||||||||||||||
| Net amortization and deferral | 1.7 | 2.5 | 3.4 | 5.0 | |||||||||||||||||||||||||||||||
| Settlement charges and special termination benefits | — | 2.9 | — | 5.8 | |||||||||||||||||||||||||||||||
| Net pension (income)/expense | $ | (15.8) | $ | (11.0) | $ | (31.6) | $ | (22.0) | |||||||||||||||||||||||||||
| Three Months Ended | Six Months Ended | |||||||||||||||
| December 31, | December 31, | |||||||||||||||
| 2017 | 2016 | 2017 | 2016 | |||||||||||||
| Service cost – benefits earned during the period | $ | 18.6 | $ | 20.2 | $ | 37.3 | $ | 40.4 | ||||||||
| Interest cost on projected benefits | 16.3 | 14.9 | 32.6 | 30.0 | ||||||||||||
| Expected return on plan assets | (34.3 | ) | (33.9 | ) | (68.6 | ) | (67.9 | ) | ||||||||
| Net amortization and deferral | 2.1 | 4.8 | 4.2 | 9.6 | ||||||||||||
| Net pension expense | $ | 2.7 | $ | 6.0 | $ | 5.5 | $ | 12.1 | ||||||||
Note 13.12. Income Taxes
The effective tax rate for the three months ended December 31, 20172021 and 20162020 was 17.4%23.7% and 35.0%22.2%, respectively, andrespectively. The increase in the effective tax rate is primarily due to benefits from a foreign tax election in the three months ended December 31, 2020, partially offset by a favorable earnings mix in the three months ended December 31, 2021.
The effective tax rate for the six months ended December 31, 20172021 and 20162020 was 22.0%23.0% and 33.1%21.8%, respectively. The decreasesincrease in the effective tax rates arerate is primarily due to the Tax Cutscombined benefits from adjustments to prior year tax liabilities and Jobs Act (the “Act”) enacted on December 22, 2017 and the impact of sale of the CHSA and COBRA businessesa foreign tax election in the three months ended December 31, 2016.
Note 14.13. Commitments and Contingencies
In July 2016, Uniloc USA, Inc.May 2020, 2 potential class action complaints were filed against ADP, TotalSource and Uniloc Luxembourg, S.A. (“Uniloc”) filed a lawsuit against the Companyrelated defendants in the United StatesU.S. District Court, for the Eastern District of Texas (the "Court"New Jersey. The complaints assert violations of the Employee Retirement Income Security Act of 1974 (“ERISA”) alleging that Company productsin connection with the ADP TotalSource Retirement Savings Plan’s fiduciary administrative and services infringe four patents. Uniloc alleged infringement of its patents concerning centralized management of application programs on a network, distribution of application programs to a target station on a network, management of configurable application programs on a network,investment decision-making. The complaints seek statutory and license use management on a network. The complaint soughtother unspecified monetary damages, costs,injunctive relief and injunctive relief. On September 28, 2017,attorney’s fees. These claims are still in their earliest stages and the Court granted ADP’s motionCompany is unable to dismiss the complaint on the grounds that all asserted claimsestimate any reasonably possible loss, or range of the four patents are invalid and dismissed the caseloss, with prejudice.
respect to these matters. The Company has acquired a licenseintends to the four patents and a release for any potential past infringement liability. Despite the Company being licensed and released, Uniloc appealed the Court's invalidity determination to the U.S. Court of Appeals for the Federal Circuit. The Company has moved to dismiss Uniloc's appeal on the ground that the license and release have removed any justiciable dispute between the parties concerning the patents; the Company's motion is pending. Even though the Company's motion is pending, as a result of the license and release the Company does not believe the result of Uniloc’s appeal will have a material adverse impact on the Company.vigorously defend against these lawsuits.
The Company is subject to various claims, litigation, and regulatory compliance matters in the normal course of business. When a loss is considered probable and reasonably estimable, the Company records a liability in the amount of its best estimate for the ultimate loss. Management currently believes that the resolution of these claims, litigation and regulatory compliance matters against us, individually or in the aggregate, will not have a material adverse impact on our consolidated results of operations, financial condition or cash flows. These matters are subject to inherent uncertainties and management's view of these matters may change in the future.
It is not the Company’s business practice to enter into off-balance sheet arrangements. In the normal course of business, the Company may enter into contracts in which it makes representations and warranties that relate to the performance of the Company’s services and products. The Company does not expect any material losses related to such representations and warranties.
18
Note 14. Stockholders' Equity
Changes in stockholders' equity by component are as follows:
| Three Months Ended | |||||||||||||||||||||||||||||||||||
| December 31, 2021 | |||||||||||||||||||||||||||||||||||
| Common Stock | Capital in Excess of Par Value | Retained Earnings | Treasury Stock | AOCI | Total | ||||||||||||||||||||||||||||||
| Balance at September 30, 2021 | $ | 63.9 | $ | 1,579.1 | $ | 19,754.8 | $ | (15,924.2) | $ | (122.9) | $ | 5,350.7 | |||||||||||||||||||||||
| Net earnings | — | — | 694.4 | — | — | 694.4 | |||||||||||||||||||||||||||||
| Other comprehensive income | — | — | — | — | (205.5) | (205.5) | |||||||||||||||||||||||||||||
| Stock-based compensation expense | — | 47.6 | — | — | — | 47.6 | |||||||||||||||||||||||||||||
| Issuances relating to stock compensation plans | — | 38.0 | — | 20.4 | — | 58.4 | |||||||||||||||||||||||||||||
| Treasury stock acquired (2.0 million shares repurchased) | — | — | — | (458.6) | — | (458.6) | |||||||||||||||||||||||||||||
| Dividends declared ($1.04 per share) | — | — | (437.4) | — | — | (437.4) | |||||||||||||||||||||||||||||
| Balance at December 31, 2021 | $ | 63.9 | $ | 1,664.7 | $ | 20,011.8 | $ | (16,362.4) | $ | (328.4) | $ | 5,049.6 | |||||||||||||||||||||||
| Three Months Ended | |||||||||||||||||||||||||||||||||||
| December 31, 2020 | |||||||||||||||||||||||||||||||||||
| Common Stock | Capital in Excess of Par Value | Retained Earnings | Treasury Stock | AOCI | Total | ||||||||||||||||||||||||||||||
| Balance at September 30, 2020 | $ | 63.9 | $ | 1,348.4 | $ | 18,644.7 | $ | (14,264.0) | $ | 15.9 | $ | 5,808.9 | |||||||||||||||||||||||
| Net earnings | — | — | 647.5 | — | — | 647.5 | |||||||||||||||||||||||||||||
| Other comprehensive income | — | — | — | — | 24.4 | 24.4 | |||||||||||||||||||||||||||||
| Stock-based compensation expense | — | 40.6 | — | — | — | 40.6 | |||||||||||||||||||||||||||||
| Issuances relating to stock compensation plans | — | 18.6 | — | 17.7 | — | 36.3 | |||||||||||||||||||||||||||||
| Treasury stock acquired (1.6 million shares repurchased) | — | — | — | (259.1) | — | (259.1) | |||||||||||||||||||||||||||||
| Dividends declared ($0.93 per share) | — | — | (398.6) | — | — | (398.6) | |||||||||||||||||||||||||||||
| Balance at December 31, 2020 | $ | 63.9 | $ | 1,407.6 | $ | 18,893.6 | $ | (14,505.4) | $ | 40.3 | $ | 5,900.0 | |||||||||||||||||||||||
19
| Six Months Ended | |||||||||||||||||||||||||||||||||||
| December 31, 2021 | |||||||||||||||||||||||||||||||||||
| Common Stock | Capital in Excess of Par Value | Retained Earnings | Treasury Stock | AOCI | Total | ||||||||||||||||||||||||||||||
| Balance at June 30, 2021 | $ | 63.9 | $ | 1,531.3 | $ | 19,451.1 | $ | (15,386.8) | $ | 10.6 | $ | 5,670.1 | |||||||||||||||||||||||
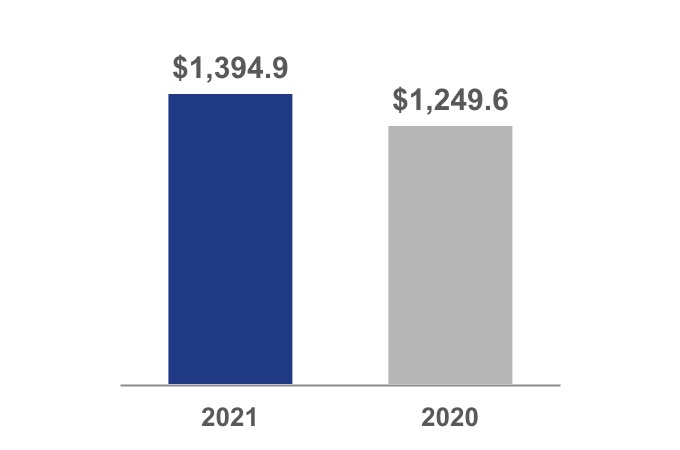
| Net earnings | — | — | 1,394.9 | — | — | 1,394.9 | |||||||||||||||||||||||||||||
| Other comprehensive income | — | — | — | — | (339.0) | (339.0) | |||||||||||||||||||||||||||||
| Stock-based compensation expense | — | 87.0 | — | — | — | 87.0 | |||||||||||||||||||||||||||||
| Issuances relating to stock compensation plans | — | 46.4 | — | 80.4 | — | 126.8 | |||||||||||||||||||||||||||||
| Treasury stock acquired (4.6 million shares repurchased) | — | — | (1,056.0) | — | (1,056.0) | ||||||||||||||||||||||||||||||
| Dividends declared ($1.97 per share) | — | — | (834.2) | — | — | (834.2) | |||||||||||||||||||||||||||||
| Balance at December 31, 2021 | $ | 63.9 | $ | 1,664.7 | $ | 20,011.8 | $ | (16,362.4) | $ | (328.4) | $ | 5,049.6 | |||||||||||||||||||||||
| Six Months Ended | |||||||||||||||||||||||||||||||||||
| December 31, 2020 | |||||||||||||||||||||||||||||||||||
| Common Stock | Capital in Excess of Par Value | Retained Earnings | Treasury Stock | AOCI | Total | ||||||||||||||||||||||||||||||
| Balance at June 30, 2020 | $ | 63.9 | $ | 1,333.8 | $ | 18,436.3 | $ | (14,067.0) | $ | (14.8) | $ | 5,752.2 | |||||||||||||||||||||||
| Net earnings | — | — | 1,249.6 | — | — | 1,249.6 | |||||||||||||||||||||||||||||
| Other comprehensive income | — | — | — | — | 55.1 | 55.1 | |||||||||||||||||||||||||||||
| Stock-based compensation expense | — | 75.7 | — | — | — | 75.7 | |||||||||||||||||||||||||||||
| Issuances relating to stock compensation plans | — | (1.9) | — | 83.0 | — | 81.1 | |||||||||||||||||||||||||||||
| Treasury stock acquired (3.2 million shares repurchased) | — | — | — | (521.4) | — | (521.4) | |||||||||||||||||||||||||||||
| Dividends declared ($1.84 per share) | — | — | (792.3) | — | — | (792.3) | |||||||||||||||||||||||||||||
| Balance at December 31, 2020 | $ | 63.9 | $ | 1,407.6 | $ | 18,893.6 | $ | (14,505.4) | $ | 40.3 | $ | 5,900.0 | |||||||||||||||||||||||
20
Note 15. Reclassifications out of Accumulated Other Comprehensive Income ("AOCI"(“AOCI”)
Changes in AOCI by component are as follows:
| Three Months Ended | |||||||||||||||||||||||||||||||||||
| December 31, 2021 | |||||||||||||||||||||||||||||||||||
| Currency Translation Adjustment | Net Gains/Losses on Available-for-sale Securities | Cash Flow Hedging Activities | Pension Liability | Accumulated Other Comprehensive (Loss) /Income | |||||||||||||||||||||||||||||||
| Balance at September 30, 2021 | $ | (261.9) | $ | 289.8 | $ | (29.1) | $ | (121.7) | $ | (122.9) | |||||||||||||||||||||||||
| Other comprehensive (loss)/income before reclassification adjustments | (16.4) | (247.6) | — | — | (264.0) | ||||||||||||||||||||||||||||||
| Tax effect | — | 56.4 | — | — | 56.4 | ||||||||||||||||||||||||||||||
| Reclassification adjustments to net earnings | — | (0.4) | (A) | 1.1 | (C) | 1.9 | (B) | 2.6 | |||||||||||||||||||||||||||
| Tax effect | — | 0.1 | (0.3) | (0.3) | (0.5) | ||||||||||||||||||||||||||||||
| Balance at December 31, 2021 | $ | (278.3) | $ | 98.3 | $ | (28.3) | $ | (120.1) | $ | (328.4) | |||||||||||||||||||||||||
| Three Months Ended | |||||||||||||||||||||||||||||||||||
| December 31, 2020 | |||||||||||||||||||||||||||||||||||
| Currency Translation Adjustment | Net Gains/Losses on Available-for-sale Securities | Cash Flow Hedging Activities | Pension Liability | Accumulated Other Comprehensive (Loss) /Income | |||||||||||||||||||||||||||||||
| Balance at September 30, 2020 | $ | (271.8) | $ | 661.1 | $ | (32.2) | $ | (341.2) | $ | 15.9 | |||||||||||||||||||||||||
| Other comprehensive (loss)/income before reclassification adjustments | 61.9 | (44.1) | — | — | 17.8 | ||||||||||||||||||||||||||||||
| Tax effect | — | 10.0 | — | — | 10.0 | ||||||||||||||||||||||||||||||
| Reclassification adjustments to net earnings | — | (7.7) | (A) | 1.1 | (C) | 2.5 | (B) | (4.1) | |||||||||||||||||||||||||||
| Tax effect | — | 1.7 | (0.4) | (0.6) | 0.7 | ||||||||||||||||||||||||||||||
| Balance at December 31, 2020 | $ | (209.9) | $ | 621.0 | $ | (31.5) | $ | (339.3) | $ | 40.3 | |||||||||||||||||||||||||
| Six Months Ended | |||||||||||||||||||||||||||||||||||
| December 31, 2021 | |||||||||||||||||||||||||||||||||||
| Currency Translation Adjustment | Net Gains/Losses on Available-for-sale Securities | Cash Flow Hedging Activities | Pension Liability | Accumulated Other Comprehensive (Loss) /Income | |||||||||||||||||||||||||||||||
| Balance at June 30, 2021 | $ | (226.8) | $ | 390.9 | $ | (29.9) | $ | (123.6) | $ | 10.6 | |||||||||||||||||||||||||
| Other comprehensive (loss)/income before reclassification adjustments | (51.5) | (377.9) | — | — | (429.4) | ||||||||||||||||||||||||||||||
| Tax effect | — | 85.7 | — | — | 85.7 | ||||||||||||||||||||||||||||||
| Reclassification adjustments to net earnings | — | (0.5) | (A) | 2.2 | (C) | 4.0 | (B) | 5.7 | |||||||||||||||||||||||||||
| Tax effect | — | 0.1 | (0.6) | (0.5) | (1.0) | ||||||||||||||||||||||||||||||
| Balance at December 31, 2021 | $ | (278.3) | $ | 98.3 | $ | (28.3) | $ | (120.1) | $ | (328.4) | |||||||||||||||||||||||||
21
| Three Months Ended | |||||||||||||||
| December 31, 2017 | |||||||||||||||
| Currency Translation Adjustment | Net Gains/Losses on Available-for-sale Securities | Pension Liability | Accumulated Other Comprehensive Loss | ||||||||||||
| Balance at September 30, 2017 | $ | (188.3 | ) | $ | 59.0 | $ | (215.3 | ) | $ | (344.6 | ) | ||||
| Other comprehensive income/(loss) before reclassification adjustments | 4.1 | (147.3 | ) | — | (143.2 | ) | |||||||||
| Tax effect | — | 53.1 | — | 53.1 | |||||||||||
| Reclassification adjustments to net earnings | — | 1.0 | (A) | 2.3 | (B) | 3.3 | |||||||||
| Tax effect | — | (0.4 | ) | (0.8 | ) | (1.2 | ) | ||||||||
| Balance at December 31, 2017 | $ | (184.2 | ) | $ | (34.6 | ) | $ | (213.8 | ) | $ | (432.6 | ) | |||
| Six Months Ended | |||||||||||||||||||||||||||||
| December 31, 2020 | |||||||||||||||||||||||||||||
| Currency Translation Adjustment | Net Gains/Losses on Available-for-sale Securities | Cash Flow Hedging Activities | Pension Liability | Accumulated Other Comprehensive (Loss) /Income | |||||||||||||||||||||||||
| Balance at June 30, 2020 | $ | (322.2) | $ | 680.4 | $ | (30.3) | $ | (342.7) | $ | (14.8) | |||||||||||||||||||
| Other comprehensive (loss)/income before reclassification adjustments | 112.3 | (68.7) | (3.3) | — | 40.3 | ||||||||||||||||||||||||
| Tax effect | — | 15.5 | 0.8 | — | 16.3 | ||||||||||||||||||||||||
| Reclassification adjustments to net earnings | — | (8.0) | (A) | 1.7 | (C) | 5.0 | (B) | (1.3) | |||||||||||||||||||||
| Tax effect | — | 1.8 | (0.4) | (1.6) | (0.2) | ||||||||||||||||||||||||
| Balance at December 31, 2020 | $ | (209.9) | $ | 621.0 | $ | (31.5) | $ | (339.3) | $ | 40.3 | |||||||||||||||||||
| Three Months Ended | |||||||||||||||
| December 31, 2016 | |||||||||||||||
| Currency Translation Adjustment | Net Gains/Losses on Available-for-sale Securities | Pension Liability | Accumulated Other Comprehensive Loss | ||||||||||||
| Balance at September 30, 2016 | $ | (243.0 | ) | $ | 288.5 | $ | (291.9 | ) | $ | (246.4 | ) | ||||
| Other comprehensive loss before reclassification adjustments | (55.0 | ) | (413.3 | ) | — | (468.3 | ) | ||||||||
| Tax effect | — | 145.4 | — | 145.4 | |||||||||||
| Reclassification adjustments to net earnings | — | (1.3 | ) | (A) | 5.1 | (B) | 3.8 | ||||||||
| Tax effect | — | 0.6 | (1.8 | ) | (1.2 | ) | |||||||||
| Balance at December 31, 2016 | $ | (298.0 | ) | $ | 19.9 | $ | (288.6 | ) | $ | (566.7 | ) | ||||
| Six Months Ended | |||||||||||||||
| December 31, 2017 | |||||||||||||||
| Currency Translation Adjustment | Net Gains/Losses on Available-for-sale Securities | Pension Liability | Accumulated Other Comprehensive Loss | ||||||||||||
| Balance at June 30, 2017 | $ | (230.8 | ) | $ | 68.3 | $ | (216.7 | ) | $ | (379.2 | ) | ||||
| Other comprehensive income/(loss) before reclassification adjustments | 46.6 | (160.2 | ) | — | (113.6 | ) | |||||||||
| Tax effect | — | 56.6 | — | 56.6 | |||||||||||
| Reclassification adjustments to net earnings | — | 1.1 | (A) | 4.6 | (B) | 5.7 | |||||||||
| Tax effect | — | (0.4 | ) | (1.7 | ) | (2.1 | ) | ||||||||
| Balance at December 31, 2017 | $ | (184.2 | ) | $ | (34.6 | ) | $ | (213.8 | ) | $ | (432.6 | ) | |||
| Six Months Ended | |||||||||||||||
| December 31, 2016 | |||||||||||||||
| Currency Translation Adjustment | Net Gains/Losses on Available-for-sale Securities | Pension Liability | Accumulated Other Comprehensive Loss | ||||||||||||
| Balance at June 30, 2016 | $ | (253.8 | ) | $ | 333.8 | $ | (295.1 | ) | $ | (215.1 | ) | ||||
| Other comprehensive loss before reclassification adjustments | (44.2 | ) | (484.7 | ) | — | (528.9 | ) | ||||||||
| Tax effect | — | 171.6 | — | 171.6 | |||||||||||
| Reclassification adjustments to net earnings | — | (1.4 | ) | (A) | 10.2 | (B) | 8.8 | ||||||||
| Tax effect | — | 0.6 | (3.7 | ) | (3.1 | ) | |||||||||
| Balance at December 31, 2016 | $ | (298.0 | ) | $ | 19.9 | $ | (288.6 | ) | $ | (566.7 | ) | ||||
(A) Reclassification adjustments out of AOCI are included within Other income,(income)/expense, net, on the Statements of Consolidated Earnings.
(B) Reclassification adjustments out of AOCI are included in net pension (income)/expense (see Note 12)11).
(C) Reclassification adjustments out of AOCI are included in Interest expense on the Statements of Consolidated Earnings (see Note 10).
Note 16. Interim Financial Data by Segment
Based upon similar economic and operational characteristics, the Company’s strategic business units have been aggregated into the following two2 reportable segments: Employer Services and PEO Services. The primary components of the “Other” segment are non-recurring gains and losses, miscellaneous processing services, the elimination of intercompany transactions, interest expense, the results of operations of ADP Indemnity (a wholly-owned captive insurance company that provides workers’ compensation and employee’s liability deductible reimbursement insurance protection for PEO Services’ worksite employees), and certain corporate overhead charges and expenses that have not been allocated to the reportable segments. Changessegments, including corporate functions, costs related to our transformation office, severance costs, non-recurring gains and losses, the allocation methodology for certain allocations have been adjusted in both the current periodelimination of intercompany transactions, and the prior period in the table below and did not materially affect reportable segment results.
interest expense. Certain revenues and expenses are charged to the reportable segments at a standard rate for management reasons. Other costs are recorded based on management responsibility. There is a reconciling item for the difference between actual interest income earned on invested funds held for clients and interest credited to Employer Services and PEO Services at a standard rate of 4.5%. This allocation is made for management reasons so that the reportable segments' results are presented on a consistent basis without the impact of fluctuations in interest rates. This reconciling adjustment to the reportable segments' revenues and earnings before income taxes is eliminated in consolidation.
Segment Results:
| Revenues | |||||||||||||||||||||||
| Three Months Ended | Six Months Ended | ||||||||||||||||||||||
| December 31, | December 31, | ||||||||||||||||||||||
| 2021 | 2020 | 2021 | 2020 | ||||||||||||||||||||
| Employer Services | $ | 2,671.3 | $ | 2,510.6 | $ | 5,242.8 | $ | 4,887.4 | |||||||||||||||
| PEO Services | 1,358.8 | 1,186.1 | 2,622.9 | 2,282.0 | |||||||||||||||||||
| Other | (4.7) | (1.0) | (8.0) | (2.9) | |||||||||||||||||||
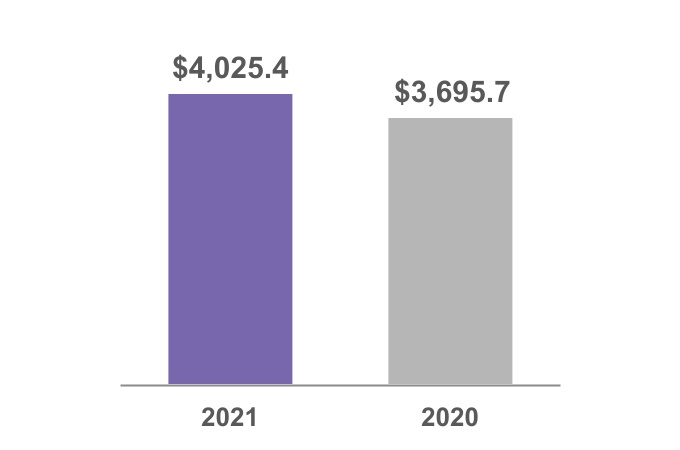
| $ | 4,025.4 | $ | 3,695.7 | $ | 7,857.7 | $ | 7,166.5 | ||||||||||||||||
22
| Revenues | |||||||||||||||
| Three Months Ended | Six Months Ended | ||||||||||||||
| December 31, | December 31, | ||||||||||||||
| 2017 | 2016 | 2017 | 2016 | ||||||||||||
| Employer Services | $ | 2,437.6 | $ | 2,309.3 | $ | 4,754.0 | $ | 4,570.6 | |||||||
| PEO Services | 945.3 | 822.9 | 1,848.8 | 1,617.6 | |||||||||||
| Other | (1.9 | ) | (2.3 | ) | (3.9 | ) | (6.0 | ) | |||||||
| Reconciling item: | |||||||||||||||
| Client fund interest | (145.6 | ) | (142.6 | ) | (284.7 | ) | (278.0 | ) | |||||||
| $ | 3,235.4 | $ | 2,987.3 | $ | 6,314.2 | $ | 5,904.2 | ||||||||
| Earnings before Income Taxes | |||||||||||||||||||||||
| Three Months Ended | Six Months Ended | ||||||||||||||||||||||
| December 31, | December 31, | ||||||||||||||||||||||
| 2021 | 2020 | 2021 | 2020 | ||||||||||||||||||||
| Employer Services | $ | 817.3 | $ | 758.6 | $ | 1,601.3 | $ | 1,447.8 | |||||||||||||||
| PEO Services | 212.7 | 187.4 | 405.7 | 346.8 | |||||||||||||||||||
| Other | (119.9) | (113.4) | (196.1) | (196.8) | |||||||||||||||||||
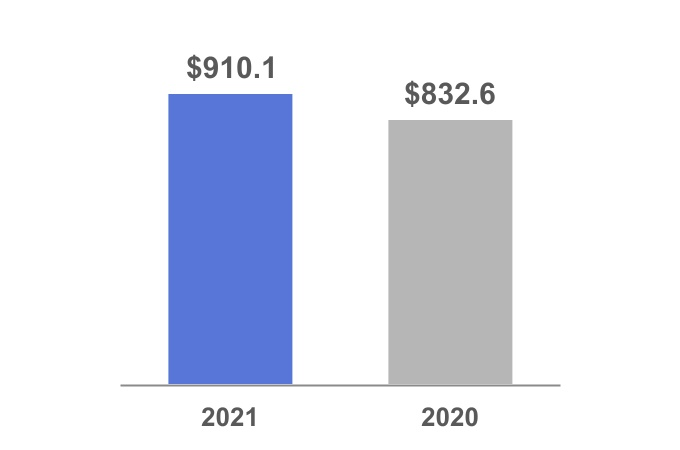
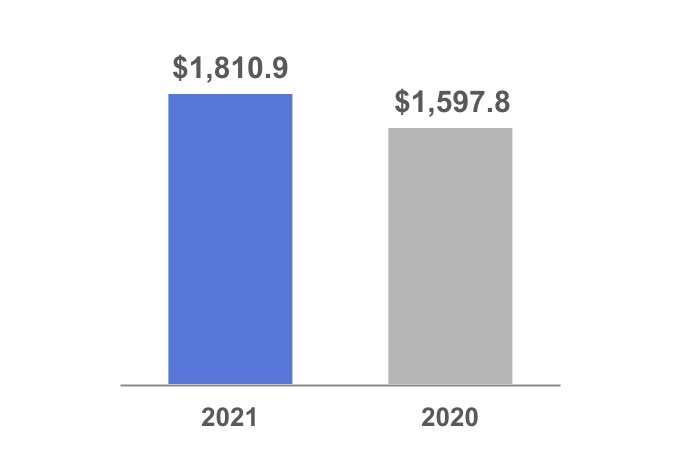
| $ | 910.1 | $ | 832.6 | $ | 1,810.9 | $ | 1,597.8 | ||||||||||||||||
23
| Earnings before Income Taxes | |||||||||||||||
| Three Months Ended | Six Months Ended | ||||||||||||||
| December 31, | December 31, | ||||||||||||||
| 2017 | 2016 | 2017 | 2016 | ||||||||||||
| Employer Services | $ | 706.4 | $ | 681.1 | $ | 1,353.0 | $ | 1,337.1 | |||||||
| PEO Services | 128.2 | 114.5 | 245.0 | 221.6 | |||||||||||
| Other | (123.3 | ) | 133.2 | (199.4 | ) | 34.1 | |||||||||
| Reconciling item: | |||||||||||||||
| Client fund interest | (145.6 | ) | (142.6 | ) | (284.7 | ) | (278.0 | ) | |||||||
| $ | 565.7 | $ | 786.2 | $ | 1,113.9 | $ | 1,314.8 | ||||||||
Item 2. Management's Discussion and Analysis of Financial Condition and Results of Operations
(Tabular dollars are presented in millions, except per share amounts)
FORWARD-LOOKING STATEMENTS
This document and other written or oral statements made from time to time by Automatic Data Processing, Inc. and, its subsidiaries ("ADP"and variable interest entity (“ADP” or "the Company"the “Company”) may contain “forward-looking statements” within the meaning of the Private Securities Litigation Reform Act of 1995. Statements that are not historical in nature and which may be identified by the use of words like “expects,” “assumes,” “projects,” “anticipates,” “estimates,” “we believe,” “could” and other words of similar meaning, are forward-looking statements. These statements are based on management’s expectations and assumptions and depend upon or refer to future events or conditions and are subject to risks and uncertainties that may cause actual results to differ materially from those expressed. Factors that could cause actual results to differ materially from those contemplated by the forward-looking statements or that could contribute to such difference include: ADP's success in obtaining and retaining clients, and selling additional services to clients; the pricing of products and services; the success of our new solutions; compliance with existing or new legislation or regulations; changes in, or interpretations of, existing legislation or regulations; overall market, political and economic conditions, including interest rate and foreign currency trends; competitive conditions; our ability to maintain our current credit ratings and the impact on our funding costs and profitability; security or privacycyber breaches, fraudulent acts, and system interruptions and failures; employment and wage levels; changes in technology; availability of skilled technical associates; and the impact of new acquisitions and divestitures.divestitures; the adequacy, effectiveness and success of our business transformation initiatives; and the impact of any uncertainties related to major natural disasters or catastrophic events, including the coronavirus ("COVID-19") pandemic. ADP disclaims any obligation to update any forward-looking statements, whether as a result of new information, future events, or otherwise, except as required by law. These risks and uncertainties, along with the risk factors discussed under “Item 1A. - Risk Factors” in our Annual Report on Form 10‑K10-K for the fiscal year ended June 30, 2017 ("2021 (“fiscal 2017"2021”), and in other written or oral statements made from time to time by ADP, should be considered in evaluating any forward-looking statements contained herein.
24
Highlights from the six months ended December 31, 20172021 include:
| 10% | 80 basis points | 13% | ||||||||||||
| Revenue Growth | Earnings Before Income Taxes Margin Expansion | Diluted EPS Growth | ||||||||||||
| 10% | 80 basis points | 13% | ||||||||||||
| Organic Constant Currency Revenue Growth | Adjusted EBIT Margin Expansion | Adjusted Diluted EPS Growth | ||||||||||||
| 7% | Employer Services Pays Per Control | 15% | PEO Services Average Worksite Employee Growth | ||||||||||||||
| $1.8B | Cash Returned via Shareholder Friendly Actions $0.8B Dividends | $1.0B Share Repurchases | ||||||||||||||||
We are a leading global provider of cloud-based Human Capital Management (“HCM”) technology solutions to employers around the world. The global COVID-19 pandemic has had a significant impact on the global business environment and on our clients and we continue to advance and offer our HCM services, including the processing of payroll and tax obligations, to our clients during this time. ADP's efforts have also been focused on providing information and tools throughout the pandemic to help clients understand and navigate the governmental relief that has been adopted globally. In addition, we continue to add features to our Return to Workplace solution that assists our clients in bringing their employees back to work safely through a comprehensive set of tools designed to streamline the entire process.
In the second quarter, we achieved new product milestones as we continue to invest in our portfolio. We made further progress towards the development of a new, unified user experience, and we introduced this modernization to our RUN Powered by ADP ® and Next Gen HCM client bases in the U.S. and to our iHCM client base in Europe. We reached a milestone of processing one million pay slips for a single client, on a single day, for the first time in our history. At the other end of the spectrum, we continued to see growth in our new Roll™ by ADP mobile application, which serves the micro segment. Innovation is inherent in ADP’s business, and we have a growing, agile research and development organization committed to delivering solutions in the market that redefine what HCM solutions can do for employers.
For the six months ended December 31, 2021, we delivered solid revenue growth of 10%. Our pays per control metric, which represents the number of employees on ADP clients' payrolls in the United States when measured on a same-store-sales basis for a subset of clients ranging from small to large businesses, grew 7% for the six months ended December 31, 2017
We have a strong business model, generating significant cash flows with low capital intensity, and offer a suite of products that provide critical support to our clients’ HCM functions. We generate sufficient free cash flow to satisfy our cash dividend and our modest debt obligations, which enables us to absorb the impact of downturns and remain steadfast in our reinvestments, our longer term strategy, and our commitments to shareholder friendly actions. We are committed to building upon our past successes by investing in our business through enhancements in research and development and by driving meaningful transformation in the business asway we continue to build momentum going into the second half of fiscal year ending June 30, 2018 ("fiscal 2018")operate. Our financial condition remains solid at December 31, 2021 and we are confident thatremain well positioned to support our associates and our clients.
25
RESULTS AND ANALYSIS OF CONSOLIDATED OPERATIONS
Total Revenues
For the three and six months ended December 31, respectively:
| Total Revenues | Total Revenues | ||||
| 9% YoY Growth | 10% YoY Growth | ||||
| 9% YoY Growth, Organic Constant Currency | 10% YoY Growth, Organic Constant Currency | ||||

Revenues for the three and six months ended December 31, 2021 increased due to strong client retention, new business started from New Business Bookings, an increase in zero-margin benefits pass-throughs, and an increase in our pays per control. Refer to “Analysis of Reportable Segments” for additional discussion of the changes in revenue for each of our reportable segments, Employer Services and Professional Employer Organization (“PEO”) Services.
Total revenues for the three months ended December 31, 2021 include interest on funds held for clients of $106.0 million, as compared to $105.4 million for the three months ended December 31, 2020. The increase in the interest earned on funds held for clients resulted from an increase in our average client funds balances of 28.4% to $32.2 billion for the three months ended December 31, 2021, partially offset by the decrease in our average interest rate earned to 1.3% for the three months ended December 31, 2021, as compared to 1.7% for the three months ended December 31, 2020.
Total revenues for the six months ended December 31, 2021 include interest on funds held for clients of $207.1 million, as compared to $211.9 million for the six months ended December 31, 2020. The decrease in the interest earned on funds held for clients resulted from the decrease in our average interest rate earned to 1.4% for the six months ended December 31, 2021, as compared to 1.8% for the six months ended December 31, 2020, partially offset by an increase in our average client funds balances of 25.5% to $29.6 billion for the six months ended December 31, 2021.
26
Total Expenses
| Three Months Ended | Six Months Ended | ||||||||||||||||||||||||||||||||||||||||||||||
| December 31, | December 31, | ||||||||||||||||||||||||||||||||||||||||||||||
| 2021 | 2020 | % Change | 2021 | 2020 | % Change | ||||||||||||||||||||||||||||||||||||||||||
| Costs of revenues: | |||||||||||||||||||||||||||||||||||||||||||||||
| Operating expenses | $ | 2,040.7 | $ | 1,847.8 | 10 | % | $ | 3,971.5 | $ | 3,610.0 | 10 | % | |||||||||||||||||||||||||||||||||||
| Systems development and programming costs | 199.7 | 174.5 | 14 | % | 388.5 | 343.2 | 13 | % | |||||||||||||||||||||||||||||||||||||||
| Depreciation and amortization | 100.8 | 100.1 | 1 | % | 203.8 | 203.6 | — | % | |||||||||||||||||||||||||||||||||||||||
| Total costs of revenues | 2,341.2 | 2,122.4 | 10 | % | 4,563.8 | 4,156.8 | 10 | % | |||||||||||||||||||||||||||||||||||||||
| Selling, general and administrative expenses | 782.3 | 755.8 | 4 | % | 1,501.5 | 1,436.9 | 4 | % | |||||||||||||||||||||||||||||||||||||||
| Interest expense | 18.4 | 13.9 | 32 | % | 36.9 | 29.0 | 27 | % | |||||||||||||||||||||||||||||||||||||||
| Total expenses | $ | 3,141.9 | $ | 2,892.1 | 9 | % | $ | 6,102.2 | $ | 5,622.7 | 9 | % | |||||||||||||||||||||||||||||||||||
For the three and six months ended December 31, 2021, operating expenses increased due to an increase in our PEO Services zero-margin benefits pass-through costs to $863.9 million from $765.9 million for the three months ended December 31, 2021 and 2020, respectively, and to $1,703.4 million from $1,507.0 million for the six months ended December 31, 2021 and 2020, respectively. Additionally, operating expenses increased due to increased costs to service our client base in support of our growing revenue.
Systems development and programming costs increased for the three and six months ended December 31, 2021 due to increased investments and costs to develop, support, and maintain our new and existing products.
Selling, general and administrative expenses increased for the three months ended December 31, 2021 due to increased selling expenses as a result of investments in our sales forceorganization, increased marketing expenses, increased amortization of costs to obtain a contract under ASC 606, and products will drive resultsincreased travel expenses.
Selling, general and administrative expenses increased for the six months ended December 31, 2021 due to increased selling expenses as a result of investments in line with our expectations.sales organization, increased marketing expenses, increased amortization of costs to obtain a contract under ASC 606, and increased travel expenses.
Other (Income)/Expense, net
| Three Months Ended | Six Months Ended | ||||||||||||||||||||||||||||||||||
| December 31, | December 31, | ||||||||||||||||||||||||||||||||||
| 2021 | 2020 | $ Change | 2021 | 2020 | $ Change | ||||||||||||||||||||||||||||||
| Interest income on corporate funds | $ | (8.5) | $ | (10.4) | $ | (1.9) | $ | (18.2) | $ | (24.3) | $ | (6.1) | |||||||||||||||||||||||
| Realized (gains)/losses on available-for-sale securities, net | (0.4) | (7.7) | (7.3) | (0.5) | (8.0) | (7.5) | |||||||||||||||||||||||||||||
| Impairment of assets | — | 2.2 | 2.2 | — | 5.0 | 5.0 | |||||||||||||||||||||||||||||
| Gain on sale of assets | — | (1.6) | (1.6) | (1.3) | (1.8) | (0.5) | |||||||||||||||||||||||||||||
| Non-service components of pension income, net | (17.7) | (11.5) | 6.2 | (35.4) | (24.9) | 10.5 | |||||||||||||||||||||||||||||
| Other (income)/expense, net | $ | (26.6) | $ | (29.0) | $ | (2.4) | $ | (55.4) | $ | (54.0) | $ | 1.4 | |||||||||||||||||||||||
See Note 11 for further details on non-service components of pension (income)/expense, net.
27
Earnings Before Income Taxes
For the three months ended December 31:
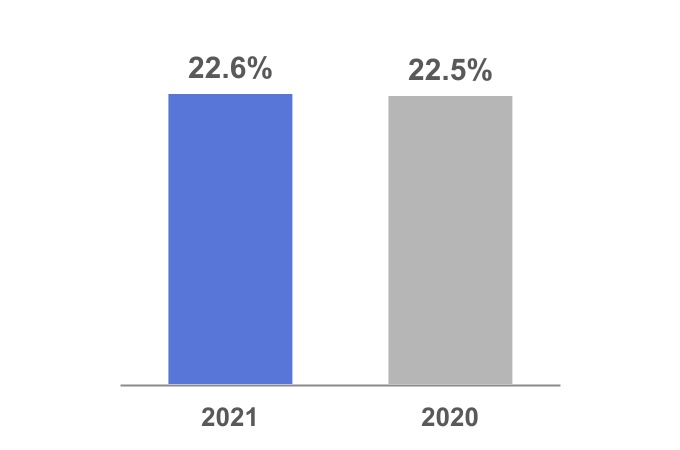
| Earnings Before Income Taxes | Margin | ||||
| 9% YoY Growth | 10 bps YoY Increase | ||||
For the six months ended December 31:
| Earnings Before Income Taxes | Margin | ||||
| 13% YoY Growth | 80 bps YoY Increase | ||||

Earnings before income taxes increased for the three and six months ended December 31, 2021, respectively, due to the components discussed above.
Margin increased for the three and six months ended December 31, 2021 due to increases in revenues, discussed above, partially offset by increased costs to service our client base in support of our growing revenue, retention improved 70 basis points acrossand incremental pressure from growth in our businesseszero-margin benefits pass-throughs.
28
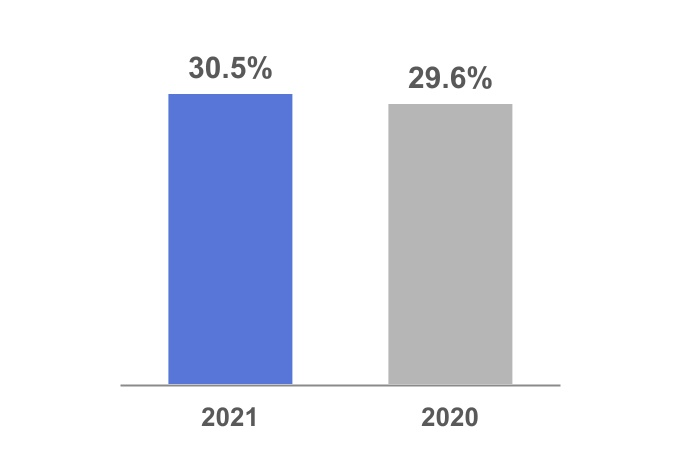
Adjusted Earnings before certain Interest and Taxes ("Adjusted EBIT")
For the three months ended December 31:
| Adjusted EBIT | Adjusted EBIT Margin | ||||
| 10% YoY Growth | 20 bps YoY Increase | ||||

For the six months ended December 31:
| Adjusted EBIT | Adjusted EBIT Margin | ||||
| 13% YoY Growth | 80 bps YoY Increase | ||||
Adjusted EBIT and Adjusted EBIT margin exclude interest income and interest expense that are not related to our client funds extended investment strategy, gain on sale of assets, net charges related to our broad-based transformation initiatives and the impact of the net severance charges, as applicable, in the respective periods.
29
Provision for Income Taxes
The effective tax rate for the three months ended December 31, 2021 and 2020 was 23.7% and 22.2%, respectively. The increase in the effective tax rate is primarily due to benefits from a foreign tax election in the three months ended December 31, 2020, partially offset by a favorable earnings mix in the three months ended December 31, 2021.
The effective tax rate for the six months ended December 31, 2021 and 2020 was 23.0% and 21.8%, respectively. The increase in the effective tax rate is primarily due to combined benefits from adjustments to prior year tax liabilities and a foreign tax election in the six months ended December 31, 2020, partially offset by an increase in the excess tax benefits on stock-based compensation and a favorable earnings mix in the six months ended December 31, 2021.
Adjusted Provision for Income Taxes
The adjusted effective tax rate for the three months ended December 31, 2021 and 2020 was 23.7% and 22.2%, respectively. The adjusted effective tax rate for the six months ended December 31, 2021 and 2020 was 23.0% and 21.8%, respectively. The drivers of the adjusted effective tax rate are the same as the drivers of the effective tax rate discussed above.
Net Earnings and Diluted EPS
For the three months ended December 31:
| Net Earnings | Diluted EPS | ||||
| 7% YoY Growth | 9% YoY Growth | ||||
30
For the six months ended December 31:
| Net Earnings | Diluted EPS | ||||
| 12% YoY Growth | 13% YoY Growth | ||||
For the three and six months ended December 31, 2021, net earnings reflect the changes described above in our earnings before income taxes and our effective tax rate.
For the three months ended December 31, 2021, diluted EPS increased as a result of the impact of fewer shares outstanding resulting from the repurchase of approximately 2.0 million shares during the three months ended December 31, 2021 and 1.6 million shares during the three months ended December 31, 2020, partially offset by the issuances of shares under our employee benefit plans.
For the six months ended December 31, 2021, diluted EPS increased as a result of the impact of fewer shares outstanding resulting from the repurchase of approximately 4.6 million shares during the six months ended December 31, 2017. This improvement was driven by the upgrades of our clients from legacy platforms to our new cloud-based solutions, our focus on improving the client experience,2021 and the loss of a large client within our former Consumer Health Spending Account ("CHSA") business3.2 million shares during the six months ended December 31, 2016. This focus is translating well as we are seeing2020, partially offset by the issuances of shares under our employee benefit plans.
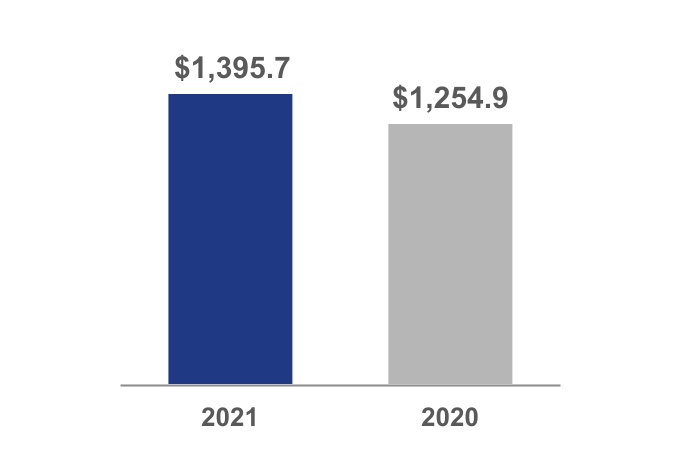
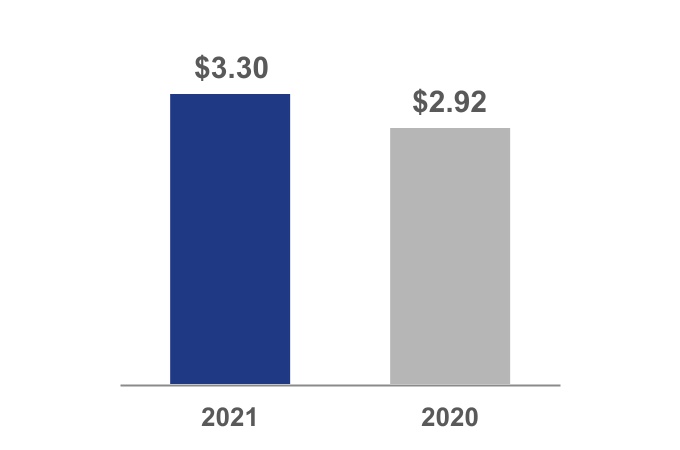
Adjusted Net Earnings and Adjusted Diluted EPS
For the three months ended December 31:
| Adjusted Net Earnings | Adjusted Diluted EPS | ||||
| 7% YoY Growth | 9% YoY Growth | ||||

31
For the six months ended December 31:
| Adjusted Net Earnings | Adjusted Diluted EPS | ||||
| 11% YoY Growth | 13% YoY Growth | ||||
For the three and six months ended December 31, 2021, adjusted net earnings and adjusted diluted EPS reflect the changes in components described above.
ANALYSIS OF REPORTABLE SEGMENTS
| Revenues | |||||||||||||||||||||||||||||||||||||||||||||||
| Three Months Ended | % Change | Six Months Ended | |||||||||||||||||||||||||||||||||||||||||||||
| December 31, | December 31, | % Change | |||||||||||||||||||||||||||||||||||||||||||||
| 2021 | 2020 | As Reported | Organic constant currency | 2021 | 2020 | As Reported | Organic constant currency | ||||||||||||||||||||||||||||||||||||||||
| Employer Services | $ | 2,671.3 | $ | 2,510.6 | 6 | % | 7 | % | $ | 5,242.8 | $ | 4,887.4 | 7 | % | 7 | % | |||||||||||||||||||||||||||||||
| PEO Services | 1,358.8 | 1,186.1 | 15 | % | 15 | % | 2,622.9 | 2,282.0 | 15 | % | 15 | % | |||||||||||||||||||||||||||||||||||
| Other | (4.7) | (1.0) | n/m | n/m | (8.0) | (2.9) | n/m | n/m | |||||||||||||||||||||||||||||||||||||||
| $ | 4,025.4 | $ | 3,695.7 | 9 | % | 9 | % | $ | 7,857.7 | $ | 7,166.5 | 10 | % | 10 | % | ||||||||||||||||||||||||||||||||
| Earnings before Income Taxes | |||||||||||||||||||||||||||||||||||||||||||||||
| Three Months Ended | % Change | Six Months Ended | % Change | ||||||||||||||||||||||||||||||||||||||||||||
| December 31, | December 31, | ||||||||||||||||||||||||||||||||||||||||||||||
| 2021 | 2020 | As Reported | 2021 | 2020 | As Reported | ||||||||||||||||||||||||||||||||||||||||||
| Employer Services | $ | 817.3 | $ | 758.6 | 8 | % | $ | 1,601.3 | $ | 1,447.8 | 11 | % | |||||||||||||||||||||||||||||||||||
| PEO Services | 212.7 | 187.4 | 14 | % | 405.7 | 346.8 | 17 | % | |||||||||||||||||||||||||||||||||||||||
| Other | (119.9) | (113.4) | n/m | (196.1) | (196.8) | n/m | |||||||||||||||||||||||||||||||||||||||||
| $ | 910.1 | $ | 832.6 | 9 | % | $ | 1,810.9 | $ | 1,597.8 | 13 | % | ||||||||||||||||||||||||||||||||||||
n/m - not meaningful
32
Employer Services
Revenues
Revenues increased for the three months ended December 31, 2021 due to strong retention onand new business started from New Business Bookings, and an increase in our strategic platforms.pays per control of 6%.
Earnings before Income Taxes
Employer Services' earnings before income taxes increased for the number of employees on our clients' payrolls as measured on a same-store-sales basis utilizing a representative subset of payrolls ranging from small to large businesses that are reflective of a broad range of U.S. geographic regions.
33
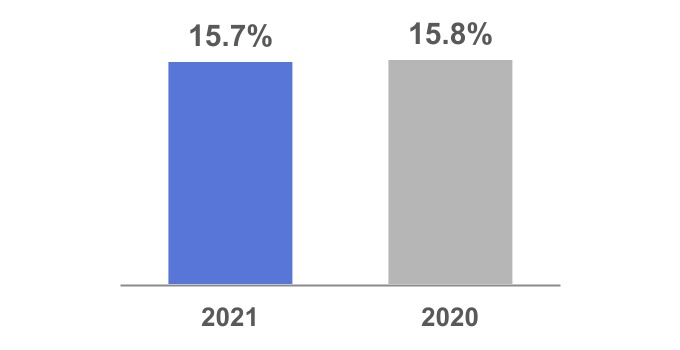
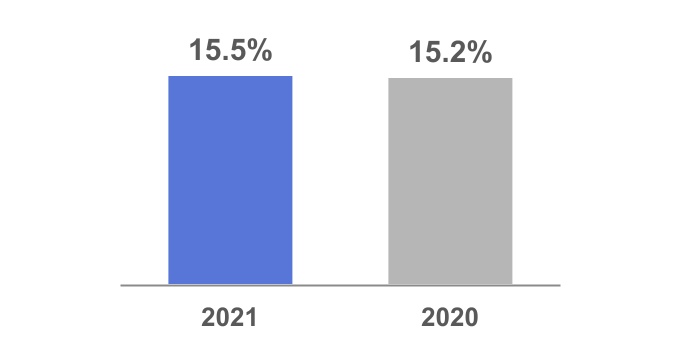
For the three and six months ended December 31, respectively:
| ES Margin | ES Margin | ||||
| 40 bps YoY Increase | 90 bps YoY Increase | ||||

Employer Services' margin increased for the three and six months ended December 31, 2021 due to increases in revenues, discussed above, partially offset by increased costs to service our client base in support of our growing revenue and investments and costs to develop, support, and maintain our products.
PEO Services
Revenues
| PEO Revenues | |||||||||||||||||||||||||||||||||||||||||||||||
| Three Months Ended | Change | Six Months Ended | Change | ||||||||||||||||||||||||||||||||||||||||||||
| December 31, | December 31, | ||||||||||||||||||||||||||||||||||||||||||||||
| 2021 | 2020 | $ | % | 2021 | 2020 | $ | % | ||||||||||||||||||||||||||||||||||||||||
| PEO Services' revenues | $ | 1,358.8 | $ | 1,186.1 | $ | 172.7 | 15 | % | $ | 2,622.9 | $ | 2,282.0 | $ | 340.9 | 15 | % | |||||||||||||||||||||||||||||||
| Less: PEO zero-margin benefits pass-throughs | 863.9 | 765.9 | 98.0 | 13 | % | 1,703.4 | 1,507.0 | 196.4 | 13 | % | |||||||||||||||||||||||||||||||||||||
| PEO Services' revenues excluding zero-margin benefits pass-throughs | $ | 494.9 | $ | 420.2 | $ | 74.7 | 18 | % | $ | 919.5 | $ | 775.0 | $ | 144.5 | 19 | % | |||||||||||||||||||||||||||||||
PEO Services' revenue increased 15% and for the three and six months ended December 31, 2021, respectively, due to an increase in zero-margin benefits pass-throughs, and increases in average worksite employees of 16% and 15% for three and six months ended December 31, 2021, respectively, as compared to the three and six months ended December 31, 2020.
Earnings before Income Taxes
PEO Services' earnings before income taxes increased 14% and 17% for the three and six months ended December 31, 2021, respectively, due to increased revenues discussed above, partially offset by the increases in zero-margin benefits pass-through costs of $98.0 million and $196.4 million for the three and six months ended December 31, 2021, respectively.
34
For the three and six months ended December 31, respectively:
| PEO Margin | PEO Margin | ||||
| 10 bps YoY Decrease | 30 bps YoY Increase | ||||
PEO Services' margin decreased for the three months ended December 31, 2021 due to increases in zero-margin pass through costs, partially offset by an increase in revenues, discussed above.
PEO Services' margin increased for the six months ended December 31, 2021 due to an increase in revenues, discussed above, partially offset by increases in zero-margin pass through costs.
ADP Indemnity provides workers’ compensation and employer’s liability deductible reimbursement insurance protection for PEO Services’ worksite employees up to $1 million per occurrence. PEO Services has secured a workers’ compensation and employer’s liability insurance policy that caps the exposure for each claim at $1 million per occurrence and has also secured aggregate stop loss insurance that caps aggregate losses at a certain level in fiscal years 2012 and prior from an admitted and licensed insurance company of AIG. We utilize historical loss experience and actuarial judgment to determine the estimated claim liability, and changes in estimated ultimate incurred losses are included in the PEO segment.
Additionally, starting in fiscal year 2013, ADP Indemnity paid premiums to enter into reinsurance arrangements with cashACE American Insurance Company, a wholly-owned subsidiary of Chubb Limited (“Chubb”), to cover substantially all losses incurred by the Company up to the $1 million per occurrence related to the workers' compensation and cash equivalents and marketable securitiesemployer's liability deductible reimbursement insurance protection for PEO Services' worksite employees. Each of these reinsurance arrangements limits our overall exposure incurred up to a certain limit. The Company believes the likelihood of ultimate losses exceeding this limit is remote.ADP Indemnity recorded a pre-tax benefit of approximately $1.8 billion. We will benefit from$3.7 million and $14.6 million for the Tax Cutsthree and Jobs Act (the "Act") signedsix months ended December 31, 2021, as compared to approximately $4.8 million and $15.2 million for the three and six months ended December 31, 2020, which were primarily a result of changes in our estimated actuarial losses. In July 2021, ADP Indemnity paid a premium of $260 million to enter into law in late December 2017 which offers us additional flexibilitya reinsurance arrangement with Chubb Limited to cover substantially all losses incurred by ADP Indemnity for the fiscal 2022 policy year on terms substantially similar to the fiscal 2021 reinsurance policy.
Other
The primary components of “Other” are certain corporate overhead charges and greater accessexpenses that have not been allocated to cash world-wide. Our estimated fiscal 2018 adjusted effective tax rate is 26.9% and we anticipate a future adjusted effective tax rate, excluding one time items, of 25% to 26% beyond fiscal 2018. With this increased operating cash flow and greater accessthe reportable segments, including corporate functions, costs related to our cash worldwide, we will continue our disciplined approach to capital allocation decisions, including assessing reinvestments intotransformation office, severance costs, non-recurring gains and losses, the business, potential acquisitions, and/or returning cash to shareholders through dividendselimination of intercompany transactions, and sharebacks, among other potential uses.interest expense.
35
| Three Months Ended | Six Months Ended | ||||||||||||||||||||||||||
| December 31, | % Change | December 31, | % Change | ||||||||||||||||||||||||
| 2017 | 2016 | As Reported | Constant Dollar Basis (Note 1) | 2017 | 2016 | As Reported | Constant Dollar Basis (Note 1) | ||||||||||||||||||||
| Total revenues | $ | 3,235.4 | $ | 2,987.3 | 8 | % | 7 | % | $ | 6,314.2 | $ | 5,904.2 | 7 | % | 6 | % | |||||||||||
| Costs of revenues: | |||||||||||||||||||||||||||
| Operating expenses | 1,719.3 | 1,560.4 | 10 | % | 9 | % | 3,366.0 | 3,091.9 | 9 | % | 8 | % | |||||||||||||||
| Systems development and programming costs | 158.1 | 152.5 | 4 | % | 2 | % | 315.1 | 307.4 | 3 | % | 1 | % | |||||||||||||||
| Depreciation and amortization | 69.3 | 54.9 | 26 | % | 25 | % | 131.9 | 112.2 | 18 | % | 17 | % | |||||||||||||||
| Total costs of revenues | 1,946.7 | 1,767.8 | 10 | % | 9 | % | 3,813.0 | 3,511.5 | 9 | % | 8 | % | |||||||||||||||
| Selling, general and administrative costs | 717.2 | 640.8 | 12 | % | 11 | % | 1,379.6 | 1,288.6 | 7 | % | 7 | % | |||||||||||||||
| Interest expense | 27.5 | 20.5 | n/m | n/m | 55.5 | 40.4 | n/m | n/m | |||||||||||||||||||
| Total expenses | 2,691.4 | 2,429.1 | 11 | % | 10 | % | 5,248.1 | 4,840.5 | 8 | % | 8 | % | |||||||||||||||
| Other income, net | (21.7 | ) | (228.0 | ) | n/m | n/m | (47.8 | ) | (251.1 | ) | n/m | n/m | |||||||||||||||
| Earnings before income taxes | $ | 565.7 | $ | 786.2 | (28 | )% | (29 | )% | $ | 1,113.9 | $ | 1,314.8 | (15 | )% | (16 | )% | |||||||||||
| Margin | 17.5 | % | 26.3 | % | 17.6 | % | 22.3 | % | |||||||||||||||||||
| Provision for income taxes | $ | 98.2 | $ | 275.3 | (64 | )% | (65 | )% | $ | 244.9 | $ | 435.2 | (44 | )% | (44 | )% | |||||||||||
| Effective tax rate | 17.4 | % | 35.0 | % | 22.0 | % | 33.1 | % | |||||||||||||||||||
| Net earnings | $ | 467.5 | $ | 510.9 | (8 | )% | (9 | )% | $ | 869.0 | $ | 879.6 | (1 | )% | (2 | )% | |||||||||||
| Diluted earnings per share | $ | 1.05 | $ | 1.13 | (7 | )% | (7 | )% | $ | 1.96 | $ | 1.94 | 1 | % | — | % | |||||||||||
In addition to our U.S. GAAP results, we use the adjusted results and other non-GAAP metrics set forth in the table below to evaluate our operating performance in the absence of certain items and for planning and forecasting of future periods:
| Adjusted Financial Measure | U.S. GAAP Measures | |||||||
| Adjusted EBIT | Net earnings | |||||||
| Adjusted provision for income taxes | Provision for income taxes | |||||||
| Adjusted net earnings | Net earnings | |||||||
| Adjusted diluted earnings per share | Diluted earnings per share | |||||||
| Adjusted effective tax rate | Effective tax rate | |||||||
| Organic constant currency | Revenues | |||||||
We believe that the exclusion of the identified items helps us reflect the fundamentals of our underlying business model and analyze results against our expectations and against prior period, and to plan for future periods by focusing on our underlying operations. We believe that the adjusted results provide relevant and useful information for investors because it allows investors to view performance in a manner similar to the method used by management and improves their ability to understand and assess our operating performance. The nature of these exclusions areis for specific items that are not fundamental to our underlying business operations. Since these adjusted financial measures and other non-GAAP metrics are not measures of performance calculated in accordance with U.S. GAAP, they should not be considered in isolation from, as a substitute for, or superior to their corresponding U.S. GAAP measures, and they may not be comparable to similarly titled measures at other companies.
36
| Three Months Ended | Six Months Ended | |||||||||||||||||||||||||||
| December 31, | % Change | December 31, | % Change | |||||||||||||||||||||||||
| 2017 | 2016 | As Reported | Constant Dollar Basis (h) | 2017 | 2016 | As Reported | Constant Dollar Basis (h) | |||||||||||||||||||||
| Net earnings | $ | 467.5 | $ | 510.9 | (8 | )% | (9 | )% | $ | 869.0 | $ | 879.6 | (1 | )% | (2 | )% | ||||||||||||
| Adjustments: | ||||||||||||||||||||||||||||
| Provision for income taxes | 98.2 | 275.3 | 244.9 | 435.2 | ||||||||||||||||||||||||
| All other interest expense (a) | 15.0 | 14.9 | 30.0 | 29.9 | ||||||||||||||||||||||||
| All other interest income (a) | (4.4 | ) | (4.4 | ) | (10.7 | ) | (9.2 | ) | ||||||||||||||||||||
| Gain on sale of business | — | (205.4 | ) | — | (205.4 | ) | ||||||||||||||||||||||
| Service Alignment Initiative (b) | 3.3 | 1.2 | — | 41.1 | ||||||||||||||||||||||||
| Proxy contest matters (f) | 22.9 | — | 33.3 | — | ||||||||||||||||||||||||
| Adjusted EBIT | $ | 602.5 | $ | 592.5 | 2 | % | 1 | % | $ | 1,166.5 | $ | 1,171.2 | — | % | (1 | )% | ||||||||||||
| Adjusted EBIT Margin | 18.6 | % | 19.8 | % | 18.5 | % | 19.8 | % | ||||||||||||||||||||
| Provision for income taxes | $ | 98.2 | $ | 275.3 | (64 | )% | (65 | )% | $ | 244.9 | $ | 435.2 | (44 | )% | (44 | )% | ||||||||||||
| Adjustments: | ||||||||||||||||||||||||||||
| Gain on sale of business (c) | — | (84.0 | ) | — | (84.0 | ) | ||||||||||||||||||||||
| Service Alignment Initiative (d) | 1.3 | 0.4 | — | 15.5 | ||||||||||||||||||||||||
| Proxy contest matters (f) | 6.3 | — | 10.3 | — | ||||||||||||||||||||||||
| Tax Cuts and Jobs Act (g) | 45.7 | — | 45.7 | — | ||||||||||||||||||||||||
| Adjusted provision for income taxes | $ | 151.5 | $ | 191.7 | (21 | )% | (22 | )% | $ | 300.9 | $ | 366.7 | (18 | )% | (19 | )% | ||||||||||||
| Adjusted effective tax rate (e) | 25.6 | % | 32.9 | % | 26.2 | % | 31.9 | % | ||||||||||||||||||||
| Net earnings | $ | 467.5 | $ | 510.9 | (8 | )% | (9 | )% | $ | 869.0 | $ | 879.6 | (1 | )% | (2 | )% | ||||||||||||
| Adjustments: | ||||||||||||||||||||||||||||
| Gain on sale of business | — | (205.4 | ) | — | (205.4 | ) | ||||||||||||||||||||||
| Provision for income taxes on gain on sale of business (c) | — | 84.0 | — | 84.0 | ||||||||||||||||||||||||
| Service Alignment Initiative (b) | 3.3 | 1.2 | — | 41.1 | ||||||||||||||||||||||||
| Income tax benefit for Service Alignment Initiative (d) | (1.3 | ) | (0.4 | ) | — | (15.5 | ) | |||||||||||||||||||||
| Proxy contest matters (f) | 22.9 | — | 33.3 | — | ||||||||||||||||||||||||
| Income tax benefit for proxy contest matters (f) | (6.3 | ) | — | (10.3 | ) | — | ||||||||||||||||||||||
| Income tax benefit from Tax Cuts and Jobs Act (g) | (45.7 | ) | — | (45.7 | ) | — | ||||||||||||||||||||||
| Adjusted net earnings | $ | 440.4 | $ | 390.3 | 13 | % | 12 | % | $ | 846.3 | $ | 783.8 | 8 | % | 7 | % | ||||||||||||
| Diluted EPS | $ | 1.05 | $ | 1.13 | (7 | )% | (7 | )% | $ | 1.96 | $ | 1.94 | 1 | % | — | % | ||||||||||||
| Adjustments: | ||||||||||||||||||||||||||||
| Gain on sale of business (c) | — | (0.27 | ) | — | (0.27 | ) | ||||||||||||||||||||||
| Service Alignment Initiative (b) | — | — | — | 0.06 | ||||||||||||||||||||||||
| Proxy contest matters (f) | 0.04 | — | 0.05 | — | ||||||||||||||||||||||||
| Tax Cuts and Jobs Act (g) | (0.10 | ) | — | (0.10 | ) | — | ||||||||||||||||||||||
| Adjusted diluted EPS | $ | 0.99 | $ | 0.87 | 14 | % | 13 | % | $ | 1.90 | $ | 1.73 | 10 | % | 9 | % | ||||||||||||
| Three Months Ended | % Change | Six Months Ended | % Change | |||||||||||||||||||||||||||||||||||||||||||||||
| December 31, | December 31, | |||||||||||||||||||||||||||||||||||||||||||||||||
| 2021 | 2020 | As Reported | 2021 | 2020 | As Reported | |||||||||||||||||||||||||||||||||||||||||||||
| Net earnings | $ | 694.4 | $ | 647.5 | 7 | % | $ | 1,394.9 | $ | 1,249.6 | 12 | % | ||||||||||||||||||||||||||||||||||||||
| Adjustments: | ||||||||||||||||||||||||||||||||||||||||||||||||||
| Provision for income taxes | 215.7 | 185.1 | 416.0 | 348.2 | ||||||||||||||||||||||||||||||||||||||||||||||
| All other interest expense (a) | 17.8 | 13.2 | 35.6 | 27.3 | ||||||||||||||||||||||||||||||||||||||||||||||
| All other interest income (a) | (1.1) | (1.5) | (2.4) | (3.3) | ||||||||||||||||||||||||||||||||||||||||||||||
| Transformation initiatives (b) | 3.0 | 3.3 | 0.9 | 4.1 | ||||||||||||||||||||||||||||||||||||||||||||||
| Excess capacity severance charges | — | 0.5 | — | 2.9 | ||||||||||||||||||||||||||||||||||||||||||||||
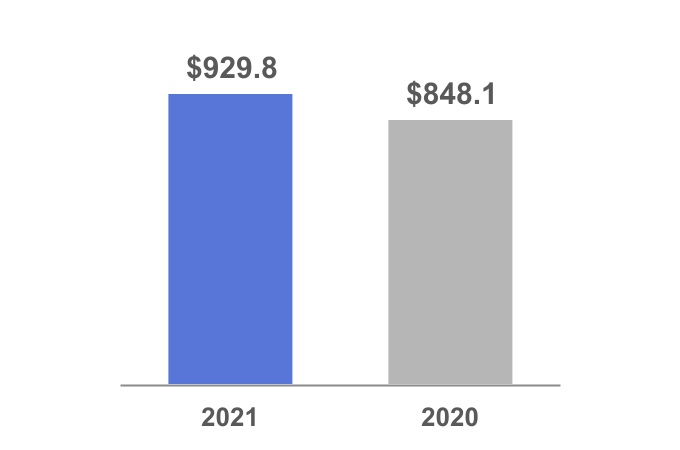
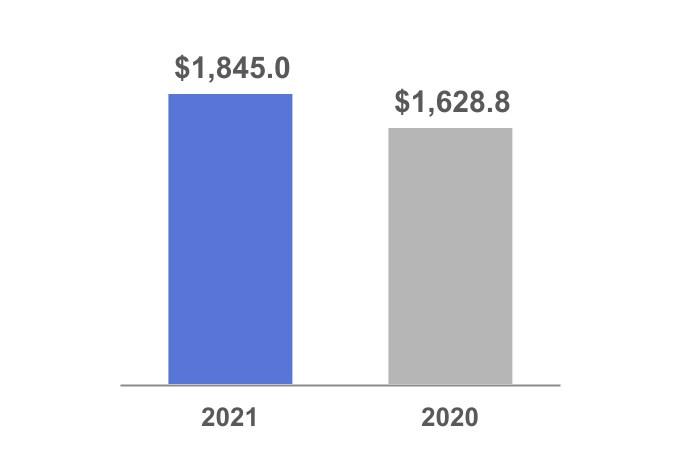
| Adjusted EBIT | $ | 929.8 | $ | 848.1 | 10 | % | $ | 1,845.0 | $ | 1,628.8 | 13 | % | ||||||||||||||||||||||||||||||||||||||
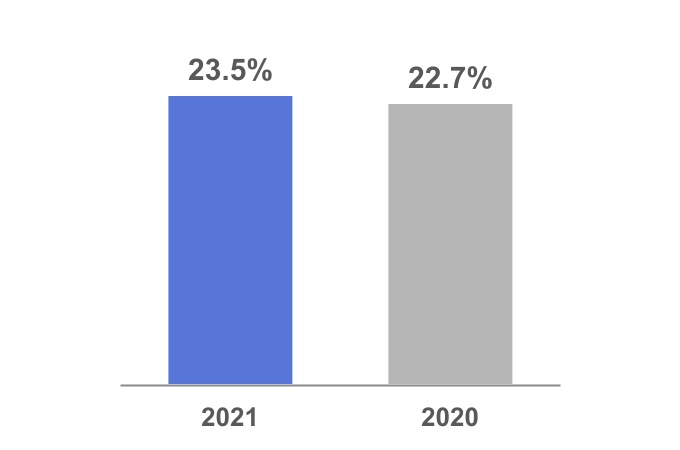
| Adjusted EBIT Margin | 23.1 | % | 22.9 | % | 23.5 | % | 22.7 | % | ||||||||||||||||||||||||||||||||||||||||||
| Provision for income taxes | $ | 215.7 | $ | 185.1 | 17 | % | $ | 416.0 | $ | 348.2 | 19 | % | ||||||||||||||||||||||||||||||||||||||
| Adjustments: | ||||||||||||||||||||||||||||||||||||||||||||||||||
| Transformation initiatives (c) | 0.7 | 0.8 | 0.1 | 1.0 | ||||||||||||||||||||||||||||||||||||||||||||||
| Excess capacity severance charges (c) | — | 0.1 | — | 0.7 | ||||||||||||||||||||||||||||||||||||||||||||||
| Adjusted provision for income taxes | $ | 216.4 | $ | 186.0 | 16 | % | $ | 416.1 | $ | 349.9 | 19 | % | ||||||||||||||||||||||||||||||||||||||
| Adjusted effective tax rate (d) | 23.7 | % | 22.2 | % | 23.0 | % | 21.8 | % | ||||||||||||||||||||||||||||||||||||||||||
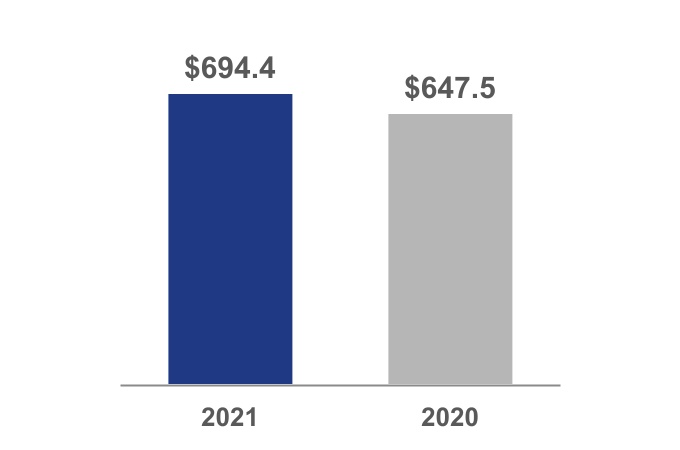
| Net earnings | $ | 694.4 | $ | 647.5 | 7 | % | $ | 1,394.9 | $ | 1,249.6 | 12 | % | ||||||||||||||||||||||||||||||||||||||
| Adjustments: | ||||||||||||||||||||||||||||||||||||||||||||||||||
| Transformation initiatives (b) | 3.0 | 3.3 | 0.9 | 4.1 | ||||||||||||||||||||||||||||||||||||||||||||||
| Income tax provision/(benefit) for transformation initiatives (c) | (0.7) | (0.8) | (0.1) | (1.0) | ||||||||||||||||||||||||||||||||||||||||||||||
| Excess capacity severance charges | — | 0.5 | — | 2.9 | ||||||||||||||||||||||||||||||||||||||||||||||
| Income tax benefit for excess capacity severance charges (c) | — | (0.1) | — | (0.7) | ||||||||||||||||||||||||||||||||||||||||||||||
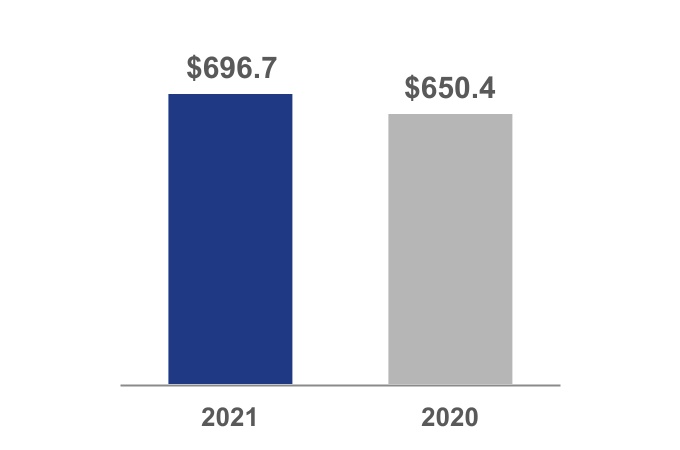
| Adjusted net earnings | $ | 696.7 | $ | 650.4 | 7 | % | $ | 1,395.7 | $ | 1,254.9 | 11 | % | ||||||||||||||||||||||||||||||||||||||
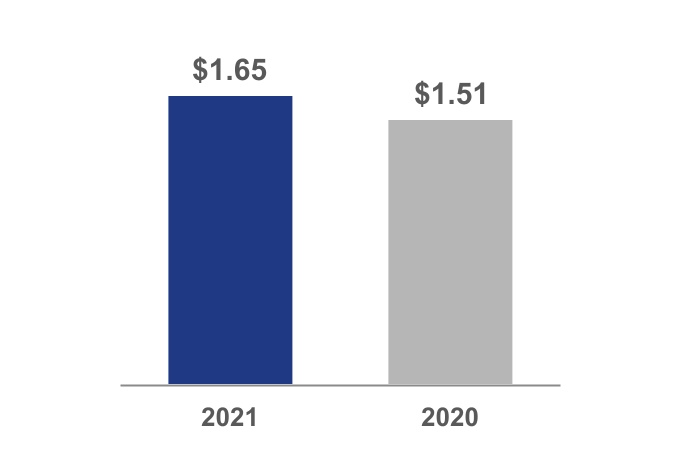
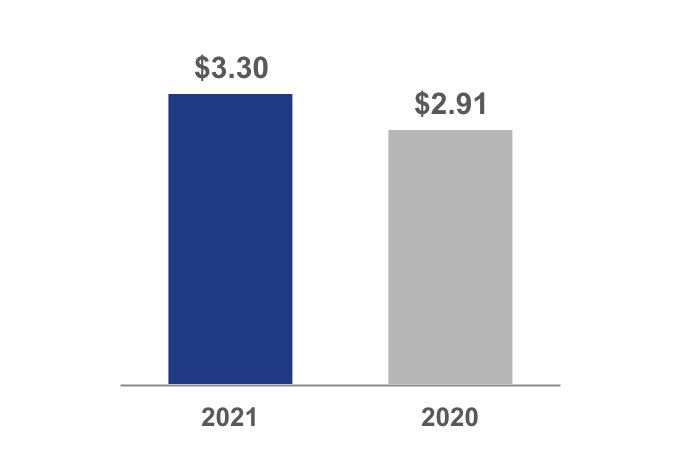
| Diluted EPS | $ | 1.65 | $ | 1.51 | 9 | % | $ | 3.30 | $ | 2.91 | 13 | % | ||||||||||||||||||||||||||||||||||||||
| Adjustments: | ||||||||||||||||||||||||||||||||||||||||||||||||||
| Transformation initiatives (b) (c) | 0.01 | 0.01 | — | 0.01 | ||||||||||||||||||||||||||||||||||||||||||||||
| Excess capacity severance charges (c) | — | — | — | 0.01 | ||||||||||||||||||||||||||||||||||||||||||||||
| Adjusted diluted EPS | $ | 1.65 | $ | 1.52 | 9 | % | $ | 3.30 | $ | 2.92 | 13 | % | ||||||||||||||||||||||||||||||||||||||
(a) We continue to include the interest income earned on investments associated with our client funds extended investment strategy and interest expense on borrowings related to our client funds extended investment strategy as we believe these amounts to be fundamental to the underlying operations of our business model. The adjustments in the table above represent the interest income and interest expense that isare not related to our client funds extended investment strategy and are labeled as "All“All other interest expense"expense” and "All“All other interest income."”
(b) The majority of chargesIn the three months ended December 31, 2021, transformation initiatives include consulting costs relating to our Service Alignment Initiative representcompany wide transformation initiatives. In the six months ended December 31, 2021, the charges include consulting costs relating our company wide transformation initiatives offset by gain on sale of assets and net reversals relating to severance. Unlike other severance charges. Severance charges have been taken in the past andwhich are not included as an adjustment to get to adjusted results. Unlike severance charges in prior periods,results, these specific charges relate to actions taken as part of our broad-based, company-wide Service Alignment Initiative.transformation initiative.
(c) The taxes on the gain on sale of the business were calculated based on the annualized marginal rate in effect during the quarter of the adjustment. Theincome tax amount was adjusted for a book vs. tax basis difference for the period ended December 31, 2016 due to the derecognition of goodwill upon the sale of the business.
37
and dispositions is calculated by excluding the non-operational charges related to proxy contest matters was calculated based oncurrent year revenues of acquisitions until the annualized marginal rate in effect during the quarterone-year anniversary of the adjustment.
| Three Months Ended | Six Months Ended | |||||||||||||||||||||||||
| December 31, | December 31, | |||||||||||||||||||||||||
| 2021 | 2021 | |||||||||||||||||||||||||
| Consolidated revenue growth as reported | 9 | % | 10 | % | ||||||||||||||||||||||
| Adjustments: | ||||||||||||||||||||||||||
| Impact of acquisitions | — | % | — | % | ||||||||||||||||||||||
| Impact of foreign currency | — | % | — | % | ||||||||||||||||||||||
| Consolidated revenue growth, organic constant currency | 9 | % | 10 | % | ||||||||||||||||||||||
| Employer Services revenue growth as reported | 6 | % | 7 | % | ||||||||||||||||||||||
| Adjustments: | ||||||||||||||||||||||||||
| Impact of acquisitions | — | % | — | % | ||||||||||||||||||||||
| Impact of foreign currency | 1 | % | — | % | ||||||||||||||||||||||
| Employer Services revenue growth, organic constant currency | 7 | % | 7 | % | ||||||||||||||||||||||
| Three Months Ended | Six Months Ended | ||||||||||||||||||||||
| December 31, | December 31, | ||||||||||||||||||||||
| 2017 | 2016 | $ Change | 2017 | 2016 | $ Change | ||||||||||||||||||
| Interest income on corporate funds | $ | (22.7 | ) | $ | (21.3 | ) | $ | 1.4 | $ | (48.5 | ) | $ | (44.3 | ) | $ | 4.2 | |||||||
| Realized gains on available-for-sale securities | (0.2 | ) | (2.0 | ) | (1.8 | ) | (0.5 | ) | (2.5 | ) | (2.0 | ) | |||||||||||
| Realized losses on available-for-sale securities | 1.2 | 0.7 | (0.5 | ) | 1.6 | 1.1 | (0.5 | ) | |||||||||||||||
| Gain on sale of assets | — | — | — | (0.4 | ) | — | 0.4 | ||||||||||||||||
| Gain on sale of business (see Note 4 of the Consolidated Financial Statements) | — | (205.4 | ) | (205.4 | ) | — | (205.4 | ) | (205.4 | ) | |||||||||||||
| Other income, net | $ | (21.7 | ) | $ | (228.0 | ) | $ | (206.3 | ) | $ | (47.8 | ) | $ | (251.1 | ) | $ | (203.3 | ) | |||||
| Revenues | |||||||||||||||||||||||||||
| Three Months Ended | Six Months Ended | ||||||||||||||||||||||||||
| December 31, | % Change | December 31, | % Change | ||||||||||||||||||||||||
| 2017 | 2016 | As Reported | Constant Dollar Basis | 2017 | 2016 | As Reported | Constant Dollar Basis | ||||||||||||||||||||
| Employer Services | $ | 2,437.6 | $ | 2,309.3 | 6 | % | 4 | % | $ | 4,754.0 | $ | 4,570.6 | 4 | % | 3 | % | |||||||||||
| PEO Services | 945.3 | 822.9 | 15 | % | 15 | % | 1,848.8 | 1,617.6 | 14 | % | 14 | % | |||||||||||||||
| Other | (1.9 | ) | (2.3 | ) | n/m | n/m | (3.9 | ) | (6.0 | ) | n/m | n/m | |||||||||||||||
| Reconciling item: | |||||||||||||||||||||||||||
| Client fund interest | (145.6 | ) | (142.6 | ) | n/m | n/m | (284.7 | ) | (278.0 | ) | n/m | n/m | |||||||||||||||
| $ | 3,235.4 | $ | 2,987.3 | 8 | % | 7 | % | $ | 6,314.2 | $ | 5,904.2 | 7 | % | 6 | % | ||||||||||||
| Earnings before Income Taxes | |||||||||||||||||||||||||||
| Three Months Ended | Six Months Ended | ||||||||||||||||||||||||||
| December 31, | % Change | December 31, | % Change | ||||||||||||||||||||||||
| 2017 | 2016 | As Reported | Constant Dollar Basis | 2017 | 2016 | As Reported | Constant Dollar Basis | ||||||||||||||||||||
| Employer Services | $ | 706.4 | $ | 681.1 | 4 | % | 3 | % | $ | 1,353.0 | $ | 1,337.1 | 1 | % | 1 | % | |||||||||||
| PEO Services | 128.2 | 114.5 | 12 | % | 12 | % | 245.0 | 221.6 | 11 | % | 11 | % | |||||||||||||||
| Other | (123.3 | ) | 133.2 | n/m | n/m | (199.4 | ) | 34.1 | n/m | n/m | |||||||||||||||||
| Reconciling item: | |||||||||||||||||||||||||||
| Client fund interest | (145.6 | ) | (142.6 | ) | n/m | n/m | (284.7 | ) | (278.0 | ) | n/m | n/m | |||||||||||||||
| $ | 565.7 | $ | 786.2 | (28 | )% | (29 | )% | $ | 1,113.9 | $ | 1,314.8 | (15 | )% | (16 | )% | ||||||||||||
FINANCIAL CONDITION, LIQUIDITY AND CAPITAL RESOURCESRESOURCES
As of December 31, 2021, cash and cash equivalents were $1.7 billion, which were primarily invested in time deposits and money market funds.
For corporate liquidity, we expect existing cash, cash equivalents, short-term marketable securities, long-term marketable securities, and cash flow from operations together with our $9.5 $9.7 billion of committedcommitted credit facilities and our ability to access both long-term and short-term debt financing from the capital markets will be adequate to meet our operating, investing, and financing activities such as our regular quarterly dividends, share repurchases, and capital expenditures. Additionally, we will benefit fromexpenditures for the Act signed into law in lateforeseeable future. Our financial condition remains solid at December 2017 which offers us additional flexibility and greater access to cash world-wide. Our estimated fiscal 2018 adjusted effective tax rate is 26.9%31, 2021 and we anticipate a future adjusted effective tax rate, excluding one time items, of 25% to 26% beyond fiscal 2018. With this increased operating cash flow and greater access to our cash worldwide, we will continue our disciplined approach to capital allocation decisions, including assessing reinvestments into the business, potential acquisitions, and/or returning capital to shareholders through dividends and sharebacks, among other potential uses.have sufficient liquidity.
For client funds liquidity, we have the ability to borrow through our financing arrangements under our U.S. short-term commercial paper program and our U.S., Canadian and CanadianUnited Kingdom short-term reverse repurchase agreements, together with our $9.5$9.7 billion of committed credit facilities and our ability to use corporate liquidity when necessary to meet short-term funding requirements related to client funds obligations. Please see "Quantitative“Quantitative and Qualitative Disclosures about Market Risk"Risk” for a further discussion of the risks, ofincluding with respect to the COVID-19 pandemic, related to our client funds extended investment strategy. See Note 109 of our Consolidated Financial Statements for a description of our short-term financing including commercial paper.
Operating, Investing and Financing Cash Flows
Our cash flows from operating, investing, and financing activities, as reflected in the Statements of Consolidated Cash Flows for the six months ended December 31, 20172021 and 2016,2020, respectively, are summarized as follows:
| Six Months Ended | ||||||||||||||||||||
| December 31, | ||||||||||||||||||||
| 2021 | 2020 | $ Change | ||||||||||||||||||
| Cash provided by / (used in): | ||||||||||||||||||||
| Operating activities | $ | 1,215.6 | $ | 1,188.3 | $ | 27.3 | ||||||||||||||
| Investing activities | (3,468.4) | (949.6) | (2,518.8) | |||||||||||||||||
| Financing activities | 9,664.7 | 8,751.5 | 913.2 | |||||||||||||||||
| Effect of exchange rate changes on cash, cash equivalents, restricted cash, and restricted cash equivalents | (20.9) | 84.7 | (105.6) | |||||||||||||||||
| Net change in cash, cash equivalents, restricted cash, and restricted cash equivalents | $ | 7,391.0 | $ | 9,074.9 | $ | (1,683.9) | ||||||||||||||
38
| Six Months Ended | ||||||||||||
| December 31, | ||||||||||||
| 2017 | 2016 *As Adjusted | $ Change | ||||||||||
| Cash provided by (used in): | ||||||||||||
| Operating activities | $ | 675.1 | $ | 841.1 | $ | (166.0 | ) | |||||
| Investing activities | (1,326.3 | ) | (493.8 | ) | (832.5 | ) | ||||||
| Financing activities | 6,280.3 | (4,029.3 | ) | 10,309.6 | ||||||||
| Effect of exchange rate changes on cash, cash equivalents, restricted cash, and restricted cash equivalents | 49.1 | (55.1 | ) | 104.2 | ||||||||
Net change in cash, cash equivalents, restricted cash, and restricted cash equivalents | $ | 5,678.2 | $ | (3,737.1 | ) | $ | 9,415.3 | |||||
Net cash flows provided by operating activities for the six months ended December 31, 2017 and December 31, 2016 include cash payments for reinsurance agreements of $235.0 million and $221.0 million, respectively, which represent the policy premium for the entire fiscal year. The decrease in operating cash provided is primarilyincreased due to angrowth in our underlying business (net income adjusted for non-cash adjustments), offset by a net unfavorable change in the components of working capitaloperating assets and liabilities which includes an increase in incentive compensation payments as compared to the six months ended December 31, 2016. These unfavorable changes were due to the timing of payments from our clients and to our vendors, associates, and taxing authorities in the ordinary course of business.2020.
Net cash flows from investing activities changed due to the timing of proceeds fromand purchases of corporate and client funds marketable securities of $106.7$2,504.1 million, and higher payments made related to acquisitions purchases of intangibles and capital expenditures during the six months ended December 31, 2017a business, offset by proceeds from the sale of the CHSAproperty, plant, and COBRA businesses of $234.0 millionequipment in the six months ended December 31, 2016.2021.
Net cash flows from financing activities changed due to a net increase in the cash flow from client fundfunds obligations of $10.0 billion,$1,379.4 million, which is due to the timing of impounds from our clients and payments to our clients' employees.employees and other payees, and settlement of cash flow hedges in the six months ended December 31, 2020. These were partially offset by an increase in repurchases of common stock in the six months ended December 31, 2021.
We purchased 3.6approximately 4.6 million shares of our common stock at an average price per shareshare of $108.70 during$213.79 during the six months ended December 31, 20172021, as compared to purchases of 8.63.2 million shares at an average price per share of $90.44$149.39 during the six months ended December 31, 2016.2020. From time to time, the Company may repurchase shares of its common stock under its authorized share repurchase programs.program. The Company considers several factors in determining when to execute share repurchases, including, among other things, actual and potential acquisition activity, cash balances and cash flows, issuances due to employee benefit plan activity, and market conditions.
Capital Resources and Client Funds Obligations
Our U.S. short-term funding requirements related to client funds are sometimes obtained on an unsecured basis through the issuance of commercial paper, rather than liquidating previously-collected client funds that have already been invested in available-for-sale securities. This commercial paper program provides for the issuance of up to $9.5$9.7 billion in aggregate maturity value. Our commercial paper program is rated A-1+ by StandardStandard & Poor’s, and Prime-1 ("P-1"(“P-1”) by Moody’s.Moody’s and F1+ by Fitch. These ratings denote the highest quality commercial paper securities. Maturities of commercial paper can range from overnight to up to 364 days. For the three months ended December 31, 2017 and 2016, our average daily borrowings were $3.5 billion and $4.2 billion, respectively, at weighted average interest rates of 1.2% and 0.5%, respectively. For the six months ended December 31, 2017 and 2016, our average daily borrowings were $3.7 billion and $4.2 billion, respectively, at weighted average interest rates of 1.2% and 0.5%, respectively. The weighted average maturity of our commercial paper during the six months ended December 31, 2017 was approximately two days. At December 31, 20172021 and June 30, 2017, we2021, the Company had no outstanding obligations under our short-term commercial paper program.borrowing outstanding. Details of the borrowings under the commercial paper program are as follows:
| Three Months Ended | Six Months Ended | ||||||||||||||||||||||
| December 31, | December 31, | ||||||||||||||||||||||
| 2021 | 2020 | 2021 | 2020 | ||||||||||||||||||||
| Average daily borrowings (in billions) | $ | 1.9 | $ | 1.8 | $ | 1.9 | $ | 2.1 | |||||||||||||||
| Weighted average interest rates | 0.1 | % | 0.1 | % | 0.1 | % | 0.1 | % | |||||||||||||||
| Weighted average maturity (approximately in days) | 1 day | 1 day | 1 day | 1 day | |||||||||||||||||||
Our U.S., Canadian, and CanadianUnited Kingdom short-term funding requirements related to client funds obligations are sometimes obtained on a secured basis through the use of reverse repurchase agreements, which are collateralized principally by government and government agency securities, rather than liquidating previously-collected client funds that have already been invested in available-for-sale securities. These agreements generally have terms ranging from overnight to up to five business days. We have successfully borrowed through the use of reverse repurchase agreements on an as-needed basis to meet short-term funding requirements related to client funds obligations.obligations. At December 31, 2017 and2021 there were no outstanding obligations related to reverse repurchase agreements. At June 30, 2017, there were no2021, the Company had $23.5 million of outstanding obligations related to the reverse repurchase agreements. ForDetails of the three months ended December 31, 2017 and 2016, we had average outstanding balances under reverse repurchase agreements of $537.0 million and $267.6 million, respectively, at weighted average interest rates of 1.2% and 0.5%, respectively. For the six months ended December 31, 2017 and 2016, we had average outstanding balances under reverse repurchase agreements of $531.6 million and $313.4 million, respectively, at weighted average interest rates of 1.1% and 0.5%, respectively. See Note 8 of our Consolidated Financial Statements for client fund investments usedare as collateral for reverse repurchase agreements.follows:
| Three Months Ended | Six Months Ended | ||||||||||||||||||||||
| December 31, | December 31, | ||||||||||||||||||||||
| 2021 | 2020 | 2021 | 2020 | ||||||||||||||||||||
| Average outstanding balances | $ | 228.4 | $ | 83.2 | $ | 211.7 | $ | 117.8 | |||||||||||||||
| Weighted average interest rates | 0.2 | % | 0.3 | % | 0.2 | % | 0.3 | % | |||||||||||||||
39
We vary the maturities of our committed credit facilities to limit the refinancing risk of any one facility. We have a $3.5$3.75 billion, 364-day credit agreement that matures in June 20182022 with a one year term-out option. In addition, we have a five-year $2.25$2.75 billion credit facility and a five-year $3.75$3.2 billion credit facility maturing in June 20222024 and June 2021,2026, respectively, each with an accordion feature under which the aggregate commitment can be increased by $500.0$500 million, subject to the availability of additional commitments. The primary uses of the credit facilities are to provide liquidity to the commercial paper program and funding for general corporate purposes, if necessary. We had no borrowings through December 31, 20172021 under the credit facilities. We believe that we currently meet all conditions set forth in the revolving credit agreements to borrow thereunder and we are not aware of any conditions that would prevent us from borrowing part or all of the $9.5$9.7 billion available to us under the revolving credit agreements. See Note 109 of our Consolidated Financial Statements for a description of our short-term financing including credit facilities.
Our investment portfolio does not contain any asset-backed securities with underlying collateral of sub-prime mortgages, alternative-A mortgages, sub-prime auto loans or sub-prime home equity loans, collateralized debt obligations, collateralized loan obligations, credit default swaps, derivatives, auction rate securities, structured investment vehicles or non-investment
grade fixed-income securities. We own AAA ratedAAA-rated senior tranches of primarily fixed rate auto loan, credit card, auto loan, equipment lease, and rate reduction receivables, secured predominantly by prime collateral. All collateral on asset-backed securities is performinghas performed as expected.expected through December 31, 2021. In addition, we own seniorU.S. government securities which primarily include debt directly issued by Federal Home LoanFarm Credit Banks and Federal Farm CreditHome Loan Banks. We do own mortgage-backed securities, which represent an undivided beneficial ownership interest in a group or pool of one or more residential mortgages. These securities are collateralized by the cash flows of 15-year and 30-year residential mortgages and are guaranteed primarily by Federal National Mortgage Association as to the timely payment of principal and interest. Our client funds investment strategy is structured to allow us to average our way through an interest rate cycle by laddering the maturities of our investments out to five years (in the case of the extended portfolio) and out to ten years (in the case of the long portfolio). This investment strategy is supported by our short-term financing arrangements necessary to satisfy short-term funding requirements relating to client funds obligations. See Note 86 of our Consolidated Financial Statements for a description of our corporate investments and funds held for clients.
Capital expenditures for the six months ended December 31, 20172021 were $104.9$74.1 million, as compared to $123.5$79.7 million for the six months ended December 31, 2016. Capital2020. We expect capital expenditures forin fiscal 2018 are expected2022 to be aboutbetween $200 million and $225 million, as compared to $249.1$178.3 million in fiscal 2017.2021.
40
QUANTITATIVE AND QUALITATIVE DISCLOSURES ABOUT MARKET RISK
Our overall investment portfolio is comprised of corporate investments (cash and cash equivalents, short-term marketable securities, and long-term marketable securities) and client funds assets (funds that have been collected from clients but have not yet been remitted to the applicable tax authorities or client employees).
Our corporate investments are invested in cash and cash equivalents and highly liquid, investment-grade marketable securities. These assets are available for our regular quarterly dividends, share repurchases, of common stock for treasurycapital expenditures and/or acquisitions, as well as other corporate operating purposes. All of our short-term and long-term fixed-income securities are classified as available-for-sale securities.
Our client funds assets are invested with safety of principal, liquidity, and diversification as the primary objectives. Consistent with those objectives, we also seek to maximize interest income and to minimize the volatility of interest income. Client funds assets are invested in highly liquid, investment-grade marketable securities, with a maximum maturity of 10 years at the time of purchase, and money market securities and other cash equivalents.
We utilize a strategy by which we extend the maturities of our investment portfolio for funds held for clients and employ short-term financing arrangements to satisfy our short-term funding requirements related to client funds obligations. Our client funds investment strategy is structured to allow us to average our way through an interest rate cycle by laddering the maturities of our investments out to five years (in the case of the extended portfolio) and out to ten years (in the case of the long portfolio). As part of our client funds investment strategy, we use the daily collection of funds from our clients to satisfy other unrelated client funds obligations, rather than liquidating previously-collected client funds that have already been invested in available-for-sale securities. In circumstances where we experience a reduction in employment levels due to a slowdown in the economy, we may make tactical decisions to sell certain securities or not reinvest maturing securities in order to reduce the size of the funds held for clients to correspond to client funds obligations. We minimize the risk of not having funds collected from a client available at the time such client’s obligation becomes due by impounding, in virtually all instances, the client’s funds in advance of the timing of payment of such client’s obligation. As a result of this practice, we have consistently maintained the required level of client funds assets to satisfy all of our obligations.
There are inherent risks and uncertainties involving our investment strategy relating to our client funds assets. Such risks include liquidity risk, including the risk associated with our ability to liquidate, if necessary, our available-for-sale securities in a timely manner in order to satisfy our client funds obligations. However, our investments are made with the safety of principal, liquidity, and diversification as the primary goals to minimize the risk of not having sufficient funds to satisfy all of our client funds obligations. We also believe we have significantly reduced the risk of not having sufficient funds to satisfy our client funds obligations by consistently maintaining access to other sources of liquidity, including our corporate cash balances, available borrowings under our $9.5$9.7 billion commercial paper program (rated A-1+ by Standard and Poor’s, and P-1 by Moody’s, and F1+ by Fitch, the highest possible short-term credit ratings), and our ability to engage in reverse repurchase agreement transactions and available borrowings under our $9.5$9.7 billion committed credit facilities. The reduced availability of financing during periods of economic turmoil, including the COVID-19 pandemic, even to borrowers with the highest credit ratings, may limit our ability to access short-term debt markets to meet the liquidity needs of our business. In addition to liquidity risk, our investments are subject to interest rate risk and credit risk, as discussed below.
We have established credit quality, maturity, and exposure limits for our investments. The minimum allowed credit rating at time of purchase for corporate,Corporate, Canadian government agency and Canadian provincial bonds is BBB, for asset-backed
securities is AAA, and for municipal bonds is A. The maximum maturity at time of purchase for BBB ratedBBB-rated securities is 5 years, for single A rated securities is 710 years, and for AA ratedAA-rated and AAA ratedAAA-rated securities is 10 years. Time deposits and commercial paper must be rated A-1 and/or P-1. Money market funds must be rated AAA/Aaa-mf.
41
Details regarding our overall investment portfolio are as follows:
| Three Months Ended | Six Months Ended | ||||||||||||||||||||||
| December 31, | December 31, | ||||||||||||||||||||||
| 2021 | 2020 | 2021 | 2020 | ||||||||||||||||||||
| Average investment balances at cost: | |||||||||||||||||||||||
| Corporate investments | $ | 3,777.6 | $ | 3,504.5 | $ | 4,037.2 | $ | 3,869.5 | |||||||||||||||
| Funds held for clients | 32,245.5 | 25,109.5 | 29,550.1 | 23,540.2 | |||||||||||||||||||
| Total | $ | 36,023.1 | $ | 28,614.0 | $ | 33,587.3 | $ | 27,409.7 | |||||||||||||||
| Average interest rates earned exclusive of realized (gains)/losses on: | |||||||||||||||||||||||
| Corporate investments | 0.9 | % | 1.2 | % | 0.9 | % | 1.3 | % | |||||||||||||||
| Funds held for clients | 1.3 | % | 1.7 | % | 1.4 | % | 1.8 | % | |||||||||||||||
| Total | 1.3 | % | 1.6 | % | 1.3 | % | 1.7 | % | |||||||||||||||
| Net realized (gains)/losses on available-for-sale securities | $ | (0.4) | $ | (7.7) | $ | (0.5) | $ | (8.0) | |||||||||||||||
| Three Months Ended | Six Months Ended | ||||||||||||||
| December 31, | December 31, | ||||||||||||||
| 2017 | 2016 | 2017 | 2016 | ||||||||||||
| Average investment balances at cost: | |||||||||||||||
| Corporate investments | $ | 5,602.4 | $ | 7,033.4 | $ | 6,110.5 | $ | 7,184.0 | |||||||
| Funds held for clients | 22,460.7 | 20,905.9 | 21,836.8 | 20,476.0 | |||||||||||
| Total | $ | 28,063.1 | $ | 27,939.3 | $ | 27,947.3 | $ | 27,660.0 | |||||||
Average interest rates earned exclusive of realized (gains)/losses on: | |||||||||||||||
| Corporate investments | 1.6 | % | 1.2 | % | 1.6 | % | 1.2 | % | |||||||
| Funds held for clients | 1.9 | % | 1.8 | % | 1.9 | % | 1.8 | % | |||||||
| Total | 1.8 | % | 1.6 | % | 1.8 | % | 1.6 | % | |||||||
| Realized gains on available-for-sale securities | $ | (0.2 | ) | $ | (2.0 | ) | $ | (0.5 | ) | $ | (2.5 | ) | |||
| Realized losses on available-for-sale securities | 1.2 | 0.7 | 1.6 | 1.1 | |||||||||||
| Net realized losses/(gains) on available-for-sale securities | $ | 1.0 | $ | (1.3 | ) | $ | 1.1 | $ | (1.4 | ) | |||||
| December 31, 2021 | June 30, 2021 | ||||||||||
| Net unrealized pre-tax gains on available-for-sale securities | $ | 123.8 | $ | 502.2 | |||||||
| Total available-for-sale securities at fair value | $ | 27,120.9 | $ | 24,371.7 | |||||||
| December 31, 2017 | June 30, 2017 | ||||||
| Net unrealized pre-tax (losses)/gains on available-for-sale securities | $ | (56.7 | ) | $ | 102.5 | ||
| Total available-for-sale securities at fair value | $ | 22,375.5 | $ | 21,901.1 | |||
We are exposed to interest rate risk in relation to securities that mature, as the proceeds from maturing securities are reinvested. Factors that influence the earnings impact of interest rate changes include, among others, the amount of invested funds and the overall portfolio mix between short-term and long-term investments. This mix varies during the fiscal year and is impacted by daily interest rate changes. The annualizedannualized interest ratesrate earned on our entire portfolio increasedportfolio decreased from 1.6%1.7% for the six months ended December 31, 20162020 to 1.8%1.3% for the six months ended December 31, 2017. 2021. A hypothetical change in both short-term interest rates (e.g., overnight interest rates or the federal funds rate) and intermediate-term interestinterest rates of 25 basis points applied to the estimated average investment balances and any related short-term borrowings would result in approximately a $7$23 million impact to earnings before income taxes over the ensuing twelve-month period ending December 31, 2018.2022. A hypothetical change in only short-term interest rates of 25 basis points applied to the estimated average short-term investment balances and any related short-term borrowings would result in approximately a $2$9 million impact to earnings before income taxes over the ensuing twelve-month period ending December 31, 2018.2022.
We are exposed to credit risk in connection with our available-for-sale securities through the possible inability of the borrowers to meet the terms of the securities. We limit credit risk by investing in investment-grade securities, primarily AAAAAA-rated and AAAA- rated securities, as rated by Moody’s, Standard & Poor’s, DBRS for Canadian dollar denominated securities, and Fitch for asset-backed and commercial mortgage backedcommercial-mortgage-backed securities. Approximately 80% of our available-for-sale securities held a AAA or AA rating at December 31, 2017. In addition, we limit amounts that can be invested in any security other than U.S. government and government agency, Canadian government, and United Kingdom government securities.
We operate and transact business in various foreign jurisdictions and are therefore exposed to market risk from changes in foreign currency exchange rates that could impact our consolidated results of operations, financial position, or cash flows. We manage our exposure to these market risks through our regular operating and financing activities and, when deemed appropriate, through the use of derivative financial instruments. We may use derivative financial instruments as risk
management tools and not for trading purposes.
42
CRITICAL ACCOUNTING POLICIES
Our Consolidated Financial Statements and accompanying notes have been prepared in accordance with accounting principles generally accepted in the United States of America (“U.S. GAAP”). The preparation of these financial statements requires management to make estimates, judgments, and assumptions that affect reported amounts of assets, liabilities, revenues, expenses, and other comprehensive income. We had no derivative financial instruments outstanding at December 31, 2017continually evaluate the accounting policies and estimates used to prepare the Consolidated Financial Statements. The estimates are based on historical experience and assumptions believed to be reasonable under current facts and circumstances. Actual amounts and results could differ from these estimates made by management. In addition, as the duration and severity of the COVID-19 pandemic are uncertain, certain of our estimates could require further judgment or June 30, 2017.modification and therefore carry a higher degree of variability and volatility. As events continue to evolve, our estimates may change materially in future periods. Refer to Note 2 of our Consolidated Financial Statements for changes to our accounting policies effective for the fiscal 2022.
NEW ACCOUNTING PRONOUNCEMENTS
See Note 2,, New Accounting Pronouncements, of Notes to the Consolidated Financial Statements for a discussion of recent accounting pronouncements.
Item 3. Quantitative and Qualitative Disclosures About Market Risk
The information called for by this item is provided under the caption "Quantitative“Quantitative and Qualitative Disclosures about Market Risk"Risk” under Item 2 – Management's Discussion and Analysis of Financial Condition and Results of Operations.
Item 4. Controls and Procedures
The Company carried out an evaluation, under the supervision and with the participation of the Company's management, including its Chief Executive Officer and Chief Financial Officer, of the effectiveness of the Company's disclosure controls and procedures, as defined in Rules 13a-15(e) and 15d-15(e) of the Securities Exchange Act of 1934 (the "evaluation"“evaluation”). Disclosure controls and procedures include, without limitation, controls and procedures designed to ensure that information required to be disclosed by the Company in the reports that it files or submits under the Securities Exchange Act of 1934 is accumulated and communicated to the Company's management, including its Chief Executive Officer and Chief Financial Officer, or persons performing similar functions, as appropriate to allow timely decisions regarding required disclosure. Based on the evaluation, the Company's Chief Executive Officer and Chief Financial Officer have concluded that the Company's disclosure controls and procedures were effective as of December 31, 20172021 in ensuring that (i) information required to be disclosed by the Company in reports that it files or submits under the Securities Exchange Act of 1934 is accumulated and communicated to the Company's management, including its Chief Executive Officer and Chief Financial Officer, to allow timely decisions regarding required disclosure and (ii) such information is recorded, processed, summarized and reported within the time periods specified in the Securities and Exchange Commission's rules and forms.
There was no change in the Company's internal control over financial reporting that occurred during the three months ended December 31, 20172021 that has materially affected, or is reasonably likely to materially affect, the Company's internal control over financial reporting.
PART II. OTHER INFORMATION
Except as noted below, all other items are either inapplicable or would result in negative responses and, therefore, have been omitted.
Item 1. Legal Proceedings
In the normal course of business, the Company is subject to various claims and litigation. While the outcome of any litigation is inherently unpredictable, the Company believes it has valid defenses with respect to the legal matters pending against it and the Company believes that the ultimate resolution of these matters will not have a material adverse impact on its financial condition, results of operations, or cash flows.
With respect to the disclosure of administrative or judicial proceedings arising under any Federal, State, or local provisions regulating the discharge of materials into the environment or that are primarily for the purpose of protecting the environment, the Company has determined that the following threshold is reasonably designed to result in disclosure of any such proceeding that is material to its business or financial condition: any proceeding when the potential monetary sanctions exceed $1 million.
Item 1A. Risk Factors
There have been no material changes in our risk factors disclosed in Part 1, Item 1A, of our Annual Report on Form 10-K for the fiscal year ended June 30, 2017.
2021.
Item 2. Unregistered Sales of Equity Securities and Use of Proceeds.
Issuer Purchases of Equity Securities
| Total Number of Shares Purchased (1) | Average Price Paid per Share | Total Number of Shares Purchased as Part of the Publicly Announced Common Stock Repurchase Plan (2) | Maximum Approximate Dollar Value of Shares that may yet be Purchased under the Common Stock Repurchase Plan (2) | |||||||||||||||||||||||
| Period | ||||||||||||||||||||||||||
| October 1 to 31, 2021 | 807,011 | $ | 210.67 | 807,011 | $ | 2,375,063,115 | ||||||||||||||||||||
| November 1 to 30, 2021 | 631,095 | $ | 230.56 | 628,923 | $ | 2,230,057,833 | ||||||||||||||||||||
| December 1 to 31, 2021 | 601,651 | $ | 235.26 | 601,397 | $ | 2,088,578,302 | ||||||||||||||||||||
| Total | 2,039,757 | 2,037,331 | ||||||||||||||||||||||||
Total Number of Shares Purchased (1) | Average Price Paid per Share | Total Number of Shares Purchased as Part of the Publicly Announced Common Stock Repurchase Plan (2) | Maximum Number of Shares that may yet be Purchased under the Common Stock Repurchase Plan (2) | ||||||||||
| Period | |||||||||||||
| October 1 to 31, 2017 | 552,197 | $ | 113.85 | 540,293 | 22,162,980 | ||||||||
| November 1 to 30, 2017 | 563,653 | $ | 111.81 | 563,549 | 21,599,431 | ||||||||
| December 1 to 31, 2017 | 264,706 | $ | 116.04 | 259,427 | 21,340,004 | ||||||||
| Total | 1,380,556 | 1,363,269 | |||||||||||
(1) During the three months ended December 31, 2017,2021, pursuant to the terms of the Company'sour restricted stock program, the Company purchased 17,2872,426 shares at the then marketthen-market value of the shares in connection with the vesting of restricted shares of employees under such program to satisfy certain tax withholding requirements throughfor employees upon the deliveryvesting of shares to the Company instead of cash.their restricted shares.
(2) The Company announcedreceived the Board of Directors' approval to repurchase the shares of our common stock included in the table above as follows:
| Date of Approval | |||||
There is no expiration date for the common stock repurchase plan.authorization.
44
Item 6. Exhibits
| Exhibit Number | Exhibit | ||||
| Compensation letter for John Ayala, dated December 2021. | |||||
Certification by Carlos A. Rodriguez pursuant to Rule 13a-14(a) of the Securities Exchange Act of 1934 | |||||
Certification by | |||||
Certification by Carlos A. Rodriguez pursuant to 18 U.S.C. Section 1350, as adopted pursuant to Section 906 of the Sarbanes-Oxley Act of 2002 | |||||
Certification by | |||||
| 101.INS | |||||
| 101.SCH | Inline XBRL Taxonomy Extension Schema | ||||
| 101.CAL | Inline XBRL Taxonomy Extension Calculation Linkbase | ||||
| 101.LAB | Inline XBRL Taxonomy Label Linkbase | ||||
| 101.PRE | Inline XBRL Taxonomy Extension Presentation Linkbase | ||||
| 101.DEF | Inline XBRL | ||||
| 104 | Cover Page Interactive Data File - the cover page interactive data file does not appear in the Interactive Data File because its XBRL tags are embedded within the Inline XBRL document | ||||
45
SIGNATURES
Pursuant to the requirements of the Securities Exchange Act of 1934, the registrant has duly caused this report to be signed on its behalf by the undersigned thereunto duly authorized.
AUTOMATIC DATA PROCESSING, INC. (Registrant) | ||||||||
| Date: | /s/ | |||||||
Chief Financial Officer (Title) | ||||||||
46