UNITED STATES
SECURITIES AND EXCHANGE COMMISSION
Washington, D.C. 20549
______________
FORM 10-Q
______________
| | | | | | | | | | | | | | |
| ☒ | QUARTERLY REPORT PURSUANT TO SECTION 13 OR 15(d) OF THE SECURITIES EXCHANGE ACT OF 1934 | | | |
For the Quarterly Period Ended MarchDecember 31, 2020
OR
| | | | | | | | | | | | | | |
| ☐ | TRANSITION REPORT PURSUANT TO SECTION 13 OR 15(d) OF THE SECURITIES EXCHANGE ACT OF 1934 | | | |
For the Transition Period From to
Commission File Number 1-5397
__________________________
AUTOMATIC DATA PROCESSING, INC.
(Exact name of registrant as specified in its charter)
__________________________
| | | | | | | | |
| Delaware | | 22-1467904 |
| (State or other jurisdiction of incorporation or organization) | | (IRS Employer Identification No.) |
| One ADP Boulevard | | |
| Roseland, | NJ | 07068 |
| (Address of principal executive offices) | | (Zip Code) |
| | |
| | |
| | |
| | |
| | |
Registrant's telephone number, including area code: (973)(973) 974-5000
__________________________
| | | | | | | | |
| Securities registered pursuant to Section 12(b) of the Act: | | |
| Title of each class | Trading Symbol(s) | Name of each exchange on which registered |
Common Stock, $0.10 Par Value
(voting) | ADP | NASDAQ Global Select Market |
Indicate by check mark whether the registrant: (1) has filed all reports required to be filed by Section 13 or 15(d) of the Securities Exchange Act of 1934 during the preceding 12 months (or for such shorter period that the registrant was required to file such reports), and (2) has been subject to such filing requirements for the past 90 days. Yes ý No o
Indicate by check mark whether the registrant has submitted electronically every Interactive Data File required to be submitted pursuant to Rule 405 of Regulation S-T (§232.405 of this chapter) during the preceding 12 months (or for such shorter period that the registrant was required to submit such files). Yes ý No o
Indicate by check mark whether the registrant is a large accelerated filer, an accelerated filer, a non-accelerated filer, a smaller reporting company, or an emerging growth company. See the definitions of “large accelerated filer,” “accelerated filer,” “smaller reporting company,” and "emerging growth company" in Rule 12b-2 of the Exchange Act.
| | | | | | | | | | | |
| Large Accelerated Filer | ☒ | Accelerated filer | ☐ |
| Non-accelerated filer | ☐ | Smaller reporting company | ☐ |
| | Emerging growth company | ☐ |
If an emerging growth company, indicate by check mark if the registrant has elected not to use the extended transition period for complying with any new or revised financial accounting standards provided pursuant to Section 13(a) of the Exchange Act. o
| | | | | | | | | | | | | | |
| Indicate by check mark whether the registrant is a shell company (as defined in Rule 12b-2 of the Exchange Act). | Yes | ☐ | No | ☒ |
The number of shares outstanding of the registrant’s common stock as of April 28, 2020January 27, 2021 was 429,774,376.427,940,220.
Table of Contents
| | | | | | | | |
| | |
| | | Page |
| | |
| | | |
| Item 1. | | |
| | | |
| | | |
| | | |
| | |
| | |
| | | |
| | | |
| | | |
| | | |
| | | |
| | | |
| Item 2. | | |
| | | |
| Item 3. | | |
| | | |
| Item 4. | | |
| | | |
| | |
| | | |
| Item 1. | | |
| | | |
| Item 1A. | | |
| | | |
| Item 2. | | |
| | |
| | |
| | |
| Item 6. | | |
| | |
| | |
Part I. FINANCIAL INFORMATION
Item 1. Financial Statements
Automatic Data Processing, Inc. and Subsidiaries
Statements of Consolidated Earnings
(In millions, except per share amounts)
(Unaudited)
| | | Three Months Ended | | | Nine Months Ended | | | Three Months Ended | | Six Months Ended |
| | March 31, | | | March 31, | | | December 31, | | December 31, |
| | 2020 | | 2019 | | 2020 | | 2019 | | 2020 | | 2019 | | 2020 | | 2019 |
| | | | | | | | | | 2020 | | 2019 |
| REVENUES: | REVENUES: | | | | | | | | REVENUES: | | | | | | | |
Revenues, other than interest on funds held
for clients and PEO revenues | Revenues, other than interest on funds held
for clients and PEO revenues | $ | 2,652.1 | | | $ | 2,546.9 | | | $ | 7,356.7 | | | $ | 7,084.7 | | Revenues, other than interest on funds held
for clients and PEO revenues | $ | 2,405.2 | | | $ | 2,398.4 | | | $ | 4,674.9 | | | $ | 4,704.7 | |
| Interest on funds held for clients | Interest on funds held for clients | 158.9 | | | 167.4 | | | 430.4 | | | 415.0 | | Interest on funds held for clients | 105.4 | | | 137.7 | | | 211.9 | | | 271.5 | |
| PEO revenues (A) | PEO revenues (A) | 1,236.8 | | | 1,113.9 | | | 3,425.9 | | | 3,131.2 | | PEO revenues (A) | 1,185.1 | | | 1,133.4 | | | 2,279.7 | | | 2,189.0 | |
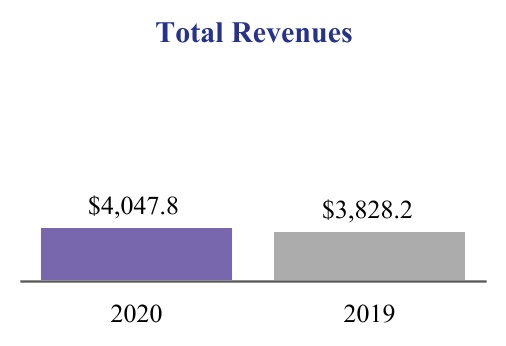
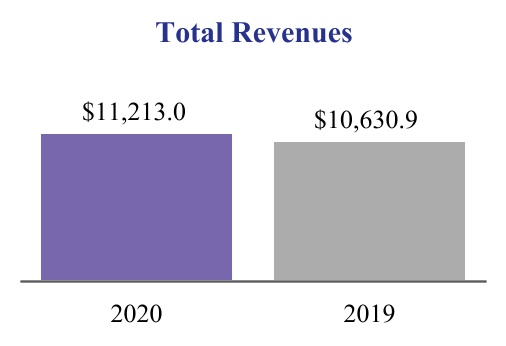
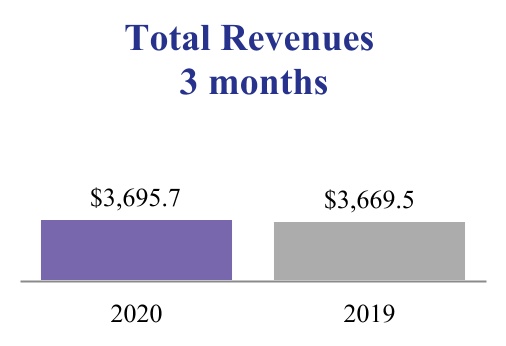
| TOTAL REVENUES | TOTAL REVENUES | 4,047.8 | | | 3,828.2 | | | 11,213.0 | | | 10,630.9 | | TOTAL REVENUES | 3,695.7 | | | 3,669.5 | | | 7,166.5 | | | 7,165.2 | |
| | EXPENSES: | EXPENSES: | | | | | | | | EXPENSES: | | | | | | | |
| Costs of revenues: | Costs of revenues: | | | | | | | | Costs of revenues: | | | | | | | |
| Operating expenses | Operating expenses | 1,974.1 | | | 1,855.3 | | | 5,597.8 | | | 5,324.8 | | Operating expenses | 1,847.8 | | | 1,836.0 | | | 3,610.0 | | | 3,623.6 | |
| Systems development and programming costs | Systems development and programming costs | 172.1 | | | 160.1 | | | 509.0 | | | 474.2 | | Systems development and programming costs | 174.5 | | | 168.7 | | | 343.2 | | | 336.9 | |
| Depreciation and amortization | Depreciation and amortization | 92.9 | | | 77.2 | | | 271.2 | | | 221.5 | | Depreciation and amortization | 100.1 | | | 89.4 | | | 203.6 | | | 178.3 | |
| TOTAL COSTS OF REVENUES | TOTAL COSTS OF REVENUES | 2,239.1 | | | 2,092.6 | | | 6,378.0 | | | 6,020.5 | | TOTAL COSTS OF REVENUES | 2,122.4 | | | 2,094.1 | | | 4,156.8 | | | 4,138.8 | |
| | Selling, general, and administrative expenses | Selling, general, and administrative expenses | 756.6 | | | 750.4 | | | 2,237.4 | | | 2,209.4 | | Selling, general, and administrative expenses | 755.8 | | | 754.3 | | | 1,436.9 | | | 1,480.9 | |
| Interest expense | Interest expense | 20.0 | | | 21.7 | | | 91.5 | | | 96.2 | | Interest expense | 13.9 | | | 31.6 | | | 29.0 | | | 71.5 | |
| TOTAL EXPENSES | TOTAL EXPENSES | 3,015.7 | | | 2,864.7 | | | 8,706.9 | | | 8,326.1 | | TOTAL EXPENSES | 2,892.1 | | | 2,880.0 | | | 5,622.7 | | | 5,691.2 | |
| | Other income, net | (44.6) | | | (21.0) | | | (145.2) | | | (67.5) | | |
| Other (income)/expense, net | | Other (income)/expense, net | (29.0) | | | (46.0) | | | (54.0) | | | (100.6) | |
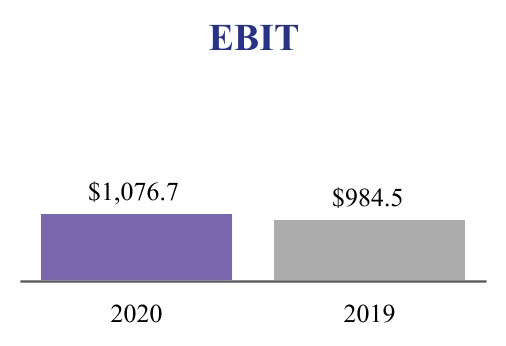
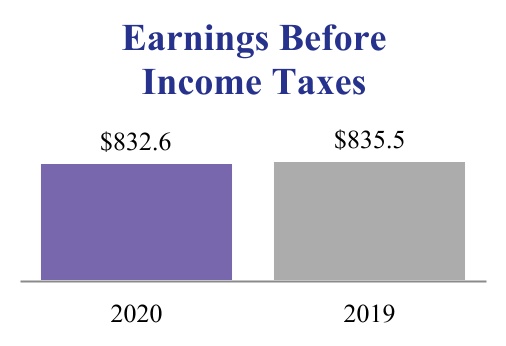
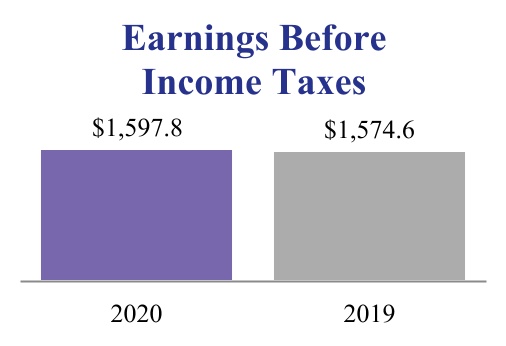
| | EARNINGS BEFORE INCOME TAXES | EARNINGS BEFORE INCOME TAXES | 1,076.7 | | | 984.5 | | | 2,651.3 | | | 2,372.3 | | EARNINGS BEFORE INCOME TAXES | 832.6 | | | 835.5 | | | 1,597.8 | | | 1,574.6 | |
| | Provision for income taxes | Provision for income taxes | 255.8 | | | 230.8 | | | 596.4 | | | 554.9 | | Provision for income taxes | 185.1 | | | 183.9 | | | 348.2 | | | 340.6 | |
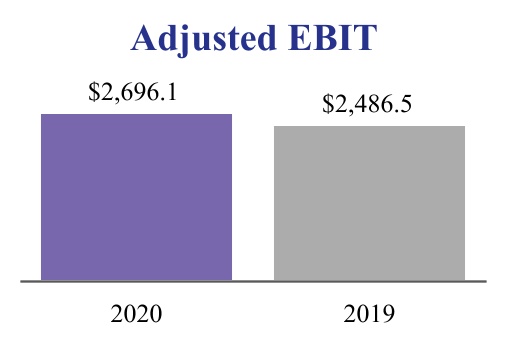
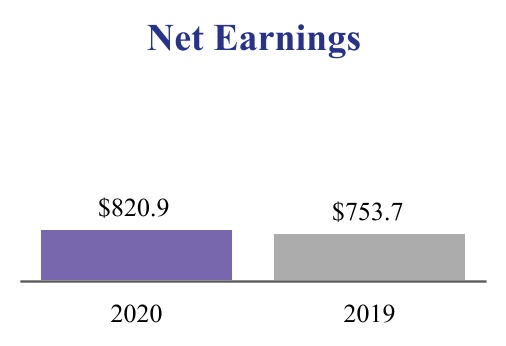
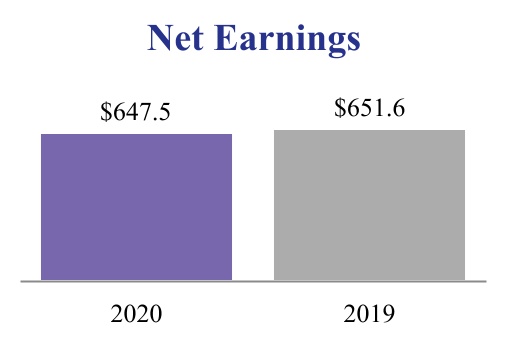
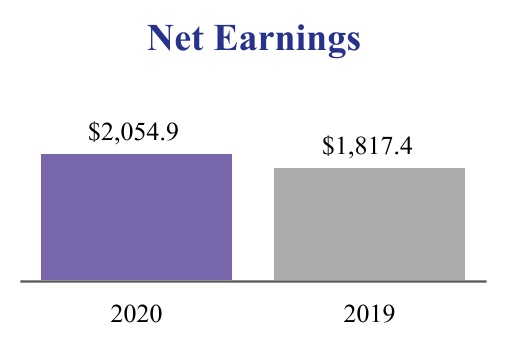
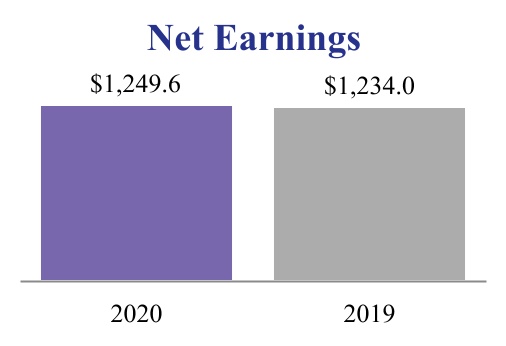
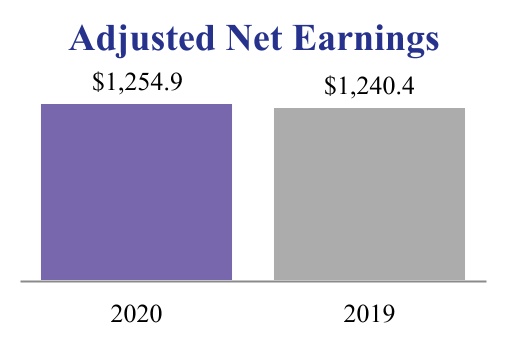
| | | NET EARNINGS | NET EARNINGS | $ | 820.9 | | | $ | 753.7 | | | $ | 2,054.9 | | | $ | 1,817.4 | | NET EARNINGS | $ | 647.5 | | | $ | 651.6 | | | $ | 1,249.6 | | | $ | 1,234.0 | |
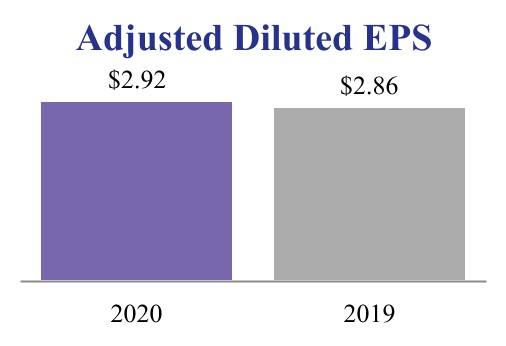
| | | BASIC EARNINGS PER SHARE | BASIC EARNINGS PER SHARE | $ | 1.91 | | | $ | 1.74 | | | $ | 4.76 | | | $ | 4.17 | | BASIC EARNINGS PER SHARE | $ | 1.51 | | | $ | 1.51 | | | $ | 2.92 | | | $ | 2.86 | |
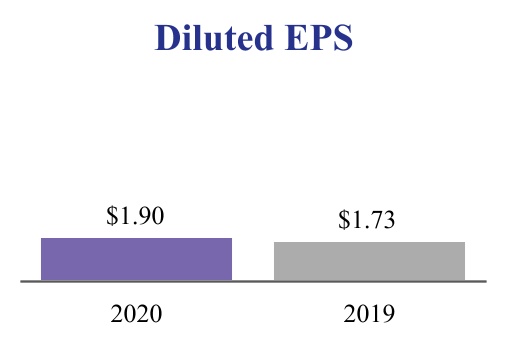
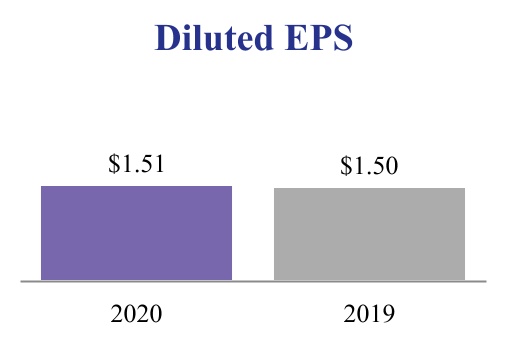
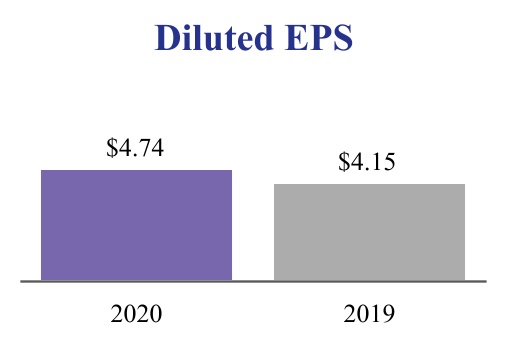
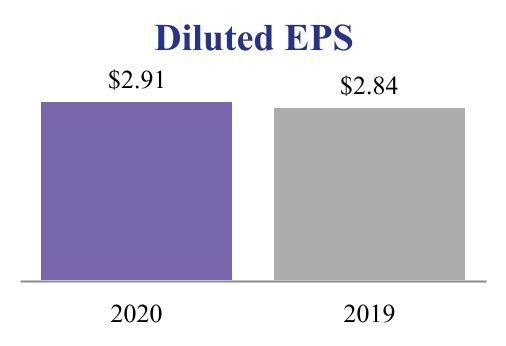
| | | DILUTED EARNINGS PER SHARE | DILUTED EARNINGS PER SHARE | $ | 1.90 | | | $ | 1.73 | | | $ | 4.74 | | | $ | 4.15 | | DILUTED EARNINGS PER SHARE | $ | 1.51 | | | $ | 1.50 | | | $ | 2.91 | | | $ | 2.84 | |
| | Basic weighted average shares outstanding | Basic weighted average shares outstanding | 430.0 | | | 434.1 | | | 431.4 | | | 435.5 | | Basic weighted average shares outstanding | 427.4 | | | 431.5 | | | 428.0 | | | 432.1 | |
| Diluted weighted average shares outstanding | Diluted weighted average shares outstanding | 431.8 | | | 436.6 | | | 433.5 | | | 438.1 | | Diluted weighted average shares outstanding | 429.0 | | | 433.3 | | | 429.5 | | | 434.3 | |
|
(A) Professional Employer Organization (“PEO”) revenues are net of direct pass-through costs, primarily consisting of payroll wages and payroll taxes of $12,643.6$13,349.1 million and $10,798.3$12,371.6 million for the three months ended MarchDecember 31, 2020 and 2019, respectively, and $35,525.8$24,364.9 million and $32,178.8$22,882.2 million for the ninesix months ended MarchDecember 31, 2020 and 2019, respectively.
See notes to the Consolidated Financial Statements.
Automatic Data Processing, Inc. and Subsidiaries
Statements of Consolidated Comprehensive Income
(In millions)
(Unaudited)
| | | | | | | | | | | | | | | | | | | | | | | |
| Three Months Ended | | | | Nine Months Ended | | |
| March 31, | | | | March 31, | | |
| 2020 | | 2019 | | 2020 | | 2019 |
| | | | | | | |
| Net earnings | $ | 820.9 | | | $ | 753.7 | | | $ | 2,054.9 | | | $ | 1,817.4 | |
| | | | | | | |
| Other comprehensive income/(loss): | | | | | | | |
| Currency translation adjustments | (68.4) | | | (2.3) | | | (83.0) | | | (49.9) | |
| | | | | | | |
| Unrealized net gains/(losses) on available-for-sale securities | 139.3 | | | 259.0 | | | 199.9 | | | 377.0 | |
| Tax effect | (32.2) | | | (58.0) | | | (45.4) | | | (84.8) | |
| Reclassification of net (gain)/losses on available-for-sale securities to net earnings | (2.5) | | | (0.1) | | | (11.9) | | | 1.4 | |
| Tax effect | 0.6 | | | — | | | 2.6 | | | (0.2) | |
| | | | | | | |
| Unrealized loss on cash flow hedging activities | (38.2) | | | — | | | (37.4) | | | — | |
| Tax effect | 9.5 | | | — | | | 9.2 | | | — | |
| | | | | | | |
| | | | | | | |
| | | | | | | |
| | | | | | | |
| | | | | | | |
| Reclassification of pension liability adjustment to net earnings | (15.0) | | | 6.1 | | | (14.8) | | | 32.5 | |
| Tax effect | 3.7 | | | (1.6) | | | 3.7 | | | (8.1) | |
| | | | | | | |
| | | | | | | |
| | | | | | | |
| | | | | | | |
| Other comprehensive income/(loss), net of tax | (3.2) | | | 203.1 | | | 22.9 | | | 267.9 | |
| Comprehensive income | $ | 817.7 | | | $ | 956.8 | | | $ | 2,077.8 | | | $ | 2,085.3 | |
| | | | | | | | | | | | | | | | | | | | | | | |
| Three Months Ended | | Six Months Ended |
| December 31, | | December 31, |
| 2020 | | 2019 | | 2020 | | 2019 |
| | | |
| Net earnings | $ | 647.5 | | | $ | 651.6 | | | $ | 1,249.6 | | | $ | 1,234.0 | |
| | | | | | | |
| Other comprehensive income/(loss): | | | | | | | |
| Currency translation adjustments | 61.9 | | | 34.3 | | | 112.3 | | | (14.6) | |
| | | | | | | |
| Unrealized net (losses)/gains on available-for-sale securities | (44.1) | | | (35.5) | | | (68.7) | | | 60.6 | |
| Tax effect | 10.0 | | | 7.5 | | | 15.5 | | | (13.3) | |
| Reclassification of net (gains)/losses on available-for-sale securities to net earnings | (7.7) | | | (7.1) | | | (8.0) | | | (9.4) | |
| Tax effect | 1.7 | | | 1.6 | | | 1.8 | | | 2.1 | |
| | | | | | | |
| Unrealized (losses)/gains on cash flow hedging activities | 0 | | | 0.7 | | | (3.3) | | | 0.7 | |
| Tax effect | 0 | | | (0.2) | | | 0.8 | | | (0.2) | |
| Amortization of unrealized losses on cash flow hedging activities | 1.1 | | | 0 | | | 1.7 | | | 0 | |
| Tax effect | (0.4) | | | 0 | | | (0.4) | | | 0 | |
| | | | | | | |
| | | | | | | |
| | | | | | | |
| Reclassification of pension liability adjustment to net earnings | 2.5 | | | 1.9 | | | 5.0 | | | 0.2 | |
| Tax effect | (0.6) | | | (0.5) | | | (1.6) | | | 0 | |
| | | | | | | |
| | | | | | | |
| | | | | | | |
| | | | | | | |
| Other comprehensive income, net of tax | 24.4 | | | 2.7 | | | 55.1 | | | 26.1 | |
| Comprehensive income | $ | 671.9 | | | $ | 654.3 | | | $ | 1,304.7 | | | $ | 1,260.1 | |
See notes to the Consolidated Financial Statements.
Automatic Data Processing, Inc. and Subsidiaries
Consolidated Balance Sheets
(In millions, except per share amounts)
(Unaudited)
| | | March 31, | | June 30, | | December 31, | | June 30, |
| | 2020 | | 2019 | | 2020 | | 2020 |
| Assets | Assets | | | | | Assets | | | | |
| Current assets: | Current assets: | | | | | Current assets: | | | | |
| Cash and cash equivalents | Cash and cash equivalents | | $ | 1,705.0 | | | $ | 1,949.2 | | Cash and cash equivalents | | $ | 1,602.2 | | | $ | 1,908.5 | |
| Short-term marketable securities | | 3.2 | | | 10.5 | | |
| Accounts receivable, net of allowance for doubtful accounts of $84.8 and $54.9, respectively | | 2,620.6 | | | 2,439.3 | | |
| | Accounts receivable, net of allowance for doubtful accounts of $86.3 and $92.5, respectively | | Accounts receivable, net of allowance for doubtful accounts of $86.3 and $92.5, respectively | | 2,509.8 | | | 2,441.3 | |
| Other current assets | Other current assets | | 545.5 | | | 509.1 | | Other current assets | | 684.1 | | | 506.2 | |
| | Total current assets before funds held for clients | Total current assets before funds held for clients | | 4,874.3 | | | 4,908.1 | | Total current assets before funds held for clients | | 4,796.1 | | | 4,856.0 | |
| Funds held for clients | Funds held for clients | | 30,834.4 | | | 29,434.2 | | Funds held for clients | | 36,866.2 | | | 26,708.1 | |
| Total current assets | Total current assets | | 35,708.7 | | | 34,342.3 | | Total current assets | | 41,662.3 | | | 31,564.1 | |
| | Long-term receivables, net of allowance for doubtful accounts of $0.6 and $0.4, respectively | | 21.6 | | | 23.8 | | |
| Long-term receivables, net of allowance for doubtful accounts of $0.6 and $0.5, respectively | | Long-term receivables, net of allowance for doubtful accounts of $0.6 and $0.5, respectively | | 15.3 | | | 18.6 | |
| Property, plant and equipment, net | Property, plant and equipment, net | | 743.1 | | | 764.2 | | Property, plant and equipment, net | | 692.7 | | | 703.9 | |
| Operating lease right-of-use asset | Operating lease right-of-use asset | | 521.1 | | | — | | Operating lease right-of-use asset | | 501.1 | | | 493.7 | |
| Deferred contract costs | Deferred contract costs | | 2,403.0 | | | 2,428.5 | | Deferred contract costs | | 2,417.2 | | | 2,401.6 | |
| Other assets | Other assets | | 579.9 | | | 934.4 | | Other assets | | 483.5 | | | 458.4 | |
| Goodwill | Goodwill | | 2,299.3 | | | 2,323.0 | | Goodwill | | 2,346.6 | | | 2,309.4 | |
| Intangible assets, net | Intangible assets, net | | 1,106.7 | | | 1,071.5 | | Intangible assets, net | | 1,207.2 | | | 1,215.8 | |
| Total assets | Total assets | | $ | 43,383.4 | | | $ | 41,887.7 | | Total assets | | $ | 49,325.9 | | | $ | 39,165.5 | |
| Liabilities and Stockholders' Equity | Liabilities and Stockholders' Equity | | | | | Liabilities and Stockholders' Equity | | | | |
| Current liabilities: | Current liabilities: | | | | | Current liabilities: | | | | |
| Accounts payable | Accounts payable | | $ | 115.5 | | | $ | 125.5 | | Accounts payable | | $ | 113.9 | | | $ | 102.0 | |
| Accrued expenses and other current liabilities | Accrued expenses and other current liabilities | | 1,978.7 | | | 1,759.0 | | Accrued expenses and other current liabilities | | 1,778.1 | | | 1,980.7 | |
| Accrued payroll and payroll-related expenses | Accrued payroll and payroll-related expenses | | 564.0 | | | 721.1 | | Accrued payroll and payroll-related expenses | | 587.4 | | | 557.0 | |
| Dividends payable | Dividends payable | | 387.9 | | | 340.1 | | Dividends payable | | 394.4 | | | 387.3 | |
| Short-term deferred revenues | Short-term deferred revenues | | 215.8 | | | 220.7 | | Short-term deferred revenues | | 207.7 | | | 212.5 | |
| Obligations under reverse repurchase agreements (A) | Obligations under reverse repurchase agreements (A) | | — | | | 262.0 | | Obligations under reverse repurchase agreements (A) | | 0 | | | 13.6 | |
| | Short-term debt | Short-term debt | | 1,001.8 | | | — | | Short-term debt | | 0 | | | 1,001.8 | |
| Income taxes payable | Income taxes payable | | 50.1 | | | 54.8 | | Income taxes payable | | 28.9 | | | 40.1 | |
| | Total current liabilities before client funds obligations | Total current liabilities before client funds obligations | | 4,313.8 | | | 3,483.2 | | Total current liabilities before client funds obligations | | 3,110.4 | | | 4,295.0 | |
| Client funds obligations | Client funds obligations | | 30,359.0 | | | 29,144.5 | | Client funds obligations | | 36,066.1 | | | 25,831.6 | |
| Total current liabilities | Total current liabilities | | 34,672.8 | | | 32,627.7 | | Total current liabilities | | 39,176.5 | | | 30,126.6 | |
| Long-term debt | Long-term debt | | 1,002.8 | | | 2,002.2 | | Long-term debt | | 1,994.1 | | | 1,002.8 | |
| Operating lease liabilities | Operating lease liabilities | | 361.2 | | | — | | Operating lease liabilities | | 357.4 | | | 344.4 | |
| Other liabilities | Other liabilities | | 745.6 | | | 798.7 | | Other liabilities | | 812.5 | | | 837.0 | |
| Deferred income taxes | Deferred income taxes | | 732.2 | | | 659.9 | | Deferred income taxes | | 711.5 | | | 731.9 | |
| Long-term deferred revenues | Long-term deferred revenues | | 378.1 | | | 399.3 | | Long-term deferred revenues | | 373.9 | | | 370.6 | |
| Total liabilities | Total liabilities | | 37,892.7 | | | 36,487.8 | | Total liabilities | | 43,425.9 | | | 33,413.3 | |
| | Commitments and contingencies (Note 13) | Commitments and contingencies (Note 13) | | Commitments and contingencies (Note 13) | | 0 | | 0 |
| | Stockholders' equity: | Stockholders' equity: | | | | | Stockholders' equity: | | | | |
| Preferred stock, $1.00 par value: authorized, 0.3 shares; issued, 0ne | | — | | | — | | |
Common stock, $0.10 par value: authorized, 1,000.0 shares; issued, 638.7 shares at March 31, 2020 and June 30, 2019; outstanding, 429.8 and 434.2 shares at March 31, 2020 and June 30, 2019, respectively | | 63.9 | | | 63.9 | | |
Preferred stock, $1.00 par value: authorized, 0.3 shares; issued, 0ne | | Preferred stock, $1.00 par value: authorized, 0.3 shares; issued, 0ne | | 0 | | | 0 | |
Common stock, $0.10 par value: authorized, 1,000.0 shares; issued, 638.7 shares at December 31, 2020 and June 30, 2020; outstanding, 428.1 and 429.9 shares at December 31, 2020 and June 30, 2020, respectively | | Common stock, $0.10 par value: authorized, 1,000.0 shares; issued, 638.7 shares at December 31, 2020 and June 30, 2020; outstanding, 428.1 and 429.9 shares at December 31, 2020 and June 30, 2020, respectively | | 63.9 | | | 63.9 | |
| Capital in excess of par value | Capital in excess of par value | | 1,315.1 | | | 1,183.2 | | Capital in excess of par value | | 1,407.6 | | | 1,333.8 | |
| Retained earnings | Retained earnings | | 18,416.5 | | | 17,500.6 | | Retained earnings | | 18,893.6 | | | 18,436.3 | |
| Treasury stock - at cost: 208.9 and 204.5 shares at March 31, 2020 and June 30, 2019, respectively | | (14,070.4) | | | (13,090.5) | | |
| Accumulated other comprehensive loss | | (234.4) | | | (257.3) | | |
| Treasury stock - at cost: 210.6 and 208.9 shares at December 31, 2020 and June 30, 2020, respectively | | Treasury stock - at cost: 210.6 and 208.9 shares at December 31, 2020 and June 30, 2020, respectively | | (14,505.4) | | | (14,067.0) | |
| Accumulated other comprehensive income (loss) | | Accumulated other comprehensive income (loss) | | 40.3 | | | (14.8) | |
| Total stockholders’ equity | Total stockholders’ equity | | 5,490.7 | | | 5,399.9 | | Total stockholders’ equity | | 5,900.0 | | | 5,752.2 | |
| Total liabilities and stockholders’ equity | Total liabilities and stockholders’ equity | | $ | 43,383.4 | | | $ | 41,887.7 | | Total liabilities and stockholders’ equity | | $ | 49,325.9 | | | $ | 39,165.5 | |
(A)(A) As of June 30, 2019, $261.42020, $13.6 million of long-term marketable securities and $0.6 million of cash and cash equivalents have been pledged as collateral under the Company's reverse repurchase agreements. Refer toagreements (see Note 9.9).
See notes to the Consolidated Financial Statements.
Automatic Data Processing, Inc. and Subsidiaries
Statements of Consolidated Cash Flows
(In millions)
(Unaudited)
| | | | | | | | | | | | | | | |
| | Nine Months Ended | | | |
| | March 31, | | | |
| | 2020 | | 2019 | |
| | | | | |
| Cash Flows from Operating Activities: | | | | | | |
| Net earnings | | | $ | 2,054.9 | | | $ | 1,817.4 | | |
| Adjustments to reconcile net earnings to cash flows provided by operating activities: | | | | | | |
| Depreciation and amortization | | | 355.5 | | | 299.6 | | |
| Amortization of deferred contract costs | | | 687.4 | | | 655.2 | | |
| | | | | |
| Deferred income taxes | | | 57.7 | | | 4.1 | | |
| Stock-based compensation expense | | | 106.7 | | | 122.2 | | |
| | | | | |
| Net pension expense | | | (14.6) | | | 41.0 | | |
| | | | | |
| Net amortization of premiums and accretion of discounts on available-for-sale securities | | | 40.7 | | | 38.9 | | |
| Impairment of intangible assets | | | — | | | 12.1 | | |
| Gain on sale of assets | | | (2.1) | | | (4.1) | | |
| | | | | |
| Other | | | 44.9 | | | 25.3 | | |
| Changes in operating assets and liabilities, net of effects from acquisitions: | | | | | | |
| Increase in accounts receivable | | | (281.6) | | | (526.7) | | |
| Increase in other assets | | | (762.3) | | | (748.9) | | |
| (Decrease) / increase in accounts payable | | | (3.6) | | | 25.4 | | |
| (Decrease) / increase in accrued expenses and other liabilities | | | (34.0) | | | 194.5 | | |
| | | | | |
| | | | | |
| Net cash flows provided by operating activities | | | 2,249.6 | | | 1,956.0 | | |
| | | | | |
| Cash Flows from Investing Activities: | | | | | | |
| Purchases of corporate and client funds marketable securities | | | (3,894.6) | | | (2,725.8) | | |
| Proceeds from the sales and maturities of corporate and client funds marketable securities | | | 4,749.9 | | | 2,090.6 | | |
| | | | | |
| Capital expenditures | | | (139.3) | | | (120.3) | | |
| Additions to intangibles | | | (261.0) | | | (329.9) | | |
| Acquisitions of businesses, net of cash acquired | | | — | | | (120.4) | | |
| Proceeds from the sale of property, plant, and equipment and other assets | | | 23.6 | | | 7.9 | | |
| | | | | |
| | | | | |
| | | | | |
| | | | | |
| | | | | |
| Net cash flows provided by / (used in) investing activities | | | 478.6 | | | (1,197.9) | | |
| | | | | |
| Cash Flows from Financing Activities: | | | | | | |
| Net increase in client funds obligations | | | 1,351.5 | | | 8,612.0 | | |
| | | | | |
| Payments of debt | | | (1.6) | | | (1.6) | | |
| Repurchases of common stock | | | (1,006.3) | | | (760.6) | | |
| Net proceeds from stock purchase plan and stock-based compensation plans | | | 33.3 | | | 50.5 | | |
| | | | | |
| Dividends paid | | | (1,078.9) | | | (949.6) | | |
| Net payments of reverse repurchase agreements | | | (262.0) | | | — | | |
| | | | | |
| | | | | |
| Other | | | — | | | (5.3) | | |
| | | | | |
| Net cash flows (used in) / provided by financing activities | | | (964.0) | | | 6,945.4 | | |
| | | | | |
| Effect of exchange rate changes on cash, cash equivalents, restricted cash, and restricted cash equivalents | | | (41.4) | | | (34.1) | | |
| | | | | |
| Net change in cash, cash equivalents, restricted cash, and restricted cash equivalents | | | 1,722.8 | | | 7,669.4 | | |
| | | | | |
| Cash, cash equivalents, restricted cash, and restricted cash equivalents, beginning of period | | | 6,796.2 | | | 6,542.1 | | |
| Cash, cash equivalents, restricted cash, and restricted cash equivalents, end of period | | | $ | 8,519.0 | | | $ | 14,211.5 | | |
| | | | | |
| | | | | |
| | | | | |
| Reconciliation of cash, cash equivalents, restricted cash, and restricted cash equivalents to the Consolidated Balance Sheets | | | | | | |
| Cash and cash equivalents | | | $ | 1,705.0 | | | $ | 1,826.2 | | |
| Restricted cash and restricted cash equivalents included in funds held for clients (A) | | | 6,814.0 | | | 12,385.3 | | |
| Total cash, cash equivalents, restricted cash, and restricted cash equivalents | | | $ | 8,519.0 | | | $ | 14,211.5 | | |
| | | | | |
| Supplemental disclosures of cash flow information: | | | | | | |
| Cash paid for interest | | | $ | 103.8 | | | $ | 108.6 | | |
| Cash paid for income taxes, net of income tax refunds | | | $ | 520.2 | | | $ | 437.7 | | |
| | | | | |
| | | | | |
| | | | | |
| | | | | | | | | | | | | | | |
| | Six Months Ended | |
| | December 31, | |
| | 2020 | | 2019 | |
| | | |
| Cash Flows from Operating Activities: | | | | | |
| Net earnings | | $ | 1,249.6 | | | $ | 1,234.0 | | |
| Adjustments to reconcile net earnings to cash flows provided by operating activities: | | | | | |
| Depreciation and amortization | | 257.8 | | | 234.9 | | |
| Amortization of deferred contract costs | | 464.9 | | | 456.0 | | |
| | | | | |
| Deferred income taxes | | 1.3 | | | 44.1 | | |
| Stock-based compensation expense | | 80.9 | | | 73.3 | | |
| | | | | |
| Net pension income | | (22.0) | | | (0.4) | | |
| | | | | |
| Net amortization of premiums and accretion of discounts on available-for-sale securities | | 28.7 | | | 26.3 | | |
| Impairment of assets | | 5.0 | | | 0 | | |
| Gain on sale of assets | | (1.8) | | | (2.1) | | |
| | | | | |
| Other | | 2.4 | | | 6.5 | | |
| Changes in operating assets and liabilities: | | | | | |
| Increase in accounts receivable | | (86.5) | | | (198.8) | | |
| Increase in other assets | | (643.3) | | | (605.4) | | |
| Increase in accounts payable | | 10.2 | | | 12.3 | | |
| Decrease in accrued expenses and other liabilities | | (158.9) | | | (149.8) | | |
| | | | | |
| | | | | |
| Net cash flows provided by operating activities | | 1,188.3 | | | 1,130.9 | | |
| | | | | |
| Cash Flows from Investing Activities: | | | | | |
| Purchases of corporate and client funds marketable securities | | (3,554.8) | | | (2,875.3) | | |
| Proceeds from the sales and maturities of corporate and client funds marketable securities | | 2,832.5 | | | 2,995.2 | | |
| | | | | |
| Capital expenditures | | (81.0) | | | (100.7) | | |
| Additions to intangibles | | (148.1) | | | (167.7) | | |
| | | | | |
| Proceeds from sale of property, plant, and equipment and other assets | | 1.8 | | | 23.6 | | |
| | | | | |
| | | | | |
| | | | | |
| | | | | |
| | | | | |
| Net cash flows used in investing activities | | (949.6) | | | (124.9) | | |
| | | | | |
| Cash Flows from Financing Activities: | | | | | |
| Net increase in client funds obligations | | 10,036.4 | | | 7,093.7 | | |
| | | | | |
| Payments of debt | | (1,001.1) | | | (1.1) | | |
| Proceeds from the issuance of debt | | 991.1 | | | 0 | | |
| Settlement of cash flow hedges | | (43.6) | | | 0 | | |
| Repurchases of common stock | | (475.1) | | | (615.1) | | |
| Net proceeds from stock purchase plan and stock-based compensation plans | | 39.1 | | | (4.4) | | |
| | | | | |
| Dividends paid | | (781.7) | | | (686.0) | | |
| Net payments related to reverse repurchase agreements | | (13.6) | | | (262.0) | | |
| | | | | |
| | | | | |
| | | | | |
| | | | | |
| Net cash flows provided by financing activities | | 8,751.5 | | | 5,525.1 | | |
| | | | | |
| Effect of exchange rate changes on cash, cash equivalents, restricted cash, and restricted cash equivalents | | 84.7 | | | (12.2) | | |
| | | | | |
| Net change in cash, cash equivalents, restricted cash, and restricted cash equivalents | | 9,074.9 | | | 6,518.9 | | |
| | | | | |
| Cash, cash equivalents, restricted cash, and restricted cash equivalents, beginning of period | | 7,053.6 | | | 6,796.2 | | |
| Cash, cash equivalents, restricted cash, and restricted cash equivalents, end of period | | $ | 16,128.5 | | | $ | 13,315.1 | | |
| | | | | |
| | | | | |
| | | | | |
| Reconciliation of cash, cash equivalents, restricted cash, and restricted cash equivalents to the Consolidated Balance Sheets | | | | | |
| Cash and cash equivalents | | $ | 1,602.2 | | | $ | 1,500.4 | | |
| Restricted cash and restricted cash equivalents included in funds held for clients (A) | | 14,526.3 | | | 11,814.7 | | |
| Total cash, cash equivalents, restricted cash, and restricted cash equivalents | | $ | 16,128.5 | | | $ | 13,315.1 | | |
| | | | | |
| Supplemental disclosures of cash flow information: | | | | | |
| Cash paid for interest | | $ | 28.1 | | | $ | 70.6 | | |
| Cash paid for income taxes, net of income tax refunds | | $ | 362.7 | | | $ | 350.4 | | |
| | | | | |
| | | | | |
| | | | | |
(A) See Note 6 for a reconciliation of restricted cash and restricted cash equivalents in funds held for clients on the Consolidated Balance Sheets.
See notes to the Consolidated Financial Statements.
Automatic Data Processing, Inc. and Subsidiaries
Notes to the Consolidated Financial Statements
(Tabular dollars in millions, except per share amounts or where otherwise stated)
(Unaudited)
Note 1. Basis of Presentation
The accompanying Consolidated Financial Statements and footnotes thereto of Automatic Data Processing, Inc., its subsidiaries and variable interest entity (“ADP” or the “Company”) have been prepared in accordance with accounting principles generally accepted in the United States of America (“U.S. GAAP”). The Consolidated Financial Statements and footnotes thereto are unaudited. In the opinion of the Company’s management, the Consolidated Financial Statements reflect all adjustments, which are of a normal recurring nature, that are necessary for a fair presentation of the Company’s interim financial results.
The Company has a grantor trust, which holds the majority of the funds provided by its clients pending remittance to employees of those clients, tax authorities, and other payees. The Company is the sole beneficial owner of the trust. The trust meets the criteria in Accounting Standards Codification (“ASC”) 810, “Consolidation” to be characterized as a variable interest entity (“VIE”). The Company has determined that it has a controlling financial interest in the trust because it has both (1) the power to direct the activities that most significantly impact the economic performance of the trust (including the power to make all investment decisions for the trust) and (2) the right to receive benefits that could potentially be significant to the trust (in the form of investment returns) and, therefore, consolidates the trust. Further information on these funds and the Company’s obligations to remit to its clients’ employees, tax authorities, and other payees is provided in Note 6, “Corporate Investments and Funds Held for Clients.”
The preparation of financial statements in conformity with U.S. GAAP requires management to make estimates and assumptions that affect the assets, liabilities, revenue, expenses, and accumulated other comprehensive income that are reported in the Consolidated Financial Statements and footnotes thereto. Actual results may differ from those estimates. Interim financial results are not necessarily indicative of financial results for a full year. The information included in this Quarterly Report on Form 10-Q should be read in conjunction with the Company’s Annual Report on Form 10-K for the fiscal year ended June 30, 20192020 (“fiscal 2019”2020”).
Revision of Previously Reported Financial Information
The Company has historically classified certain fees collectedCertain amounts from worksite employers for certain benefits within PEO revenues, and the associated costs of these benefits have historically been classified within operating expenses as PEO zero-margin benefits pass-through costs in the Company's Statements of Consolidated Earnings. During the quarter ended September 30, 2019, management determined that the Company does not retain risk and is acting as the agent, rather than as the primary obligor, for a portion of the fees collected for worksite employee benefits and the worksite employer is primarily responsible for fulfilling certain aspects of the service and has discretion in establishing price. Accordingly, the accompanying Statements of Consolidated Earnings for the three and nine months ended March 31, 2019prior year's financial statements have been revisedreclassified in order to correctconform to the amounts previously reported on a gross basis to a net basis by reducing PEO revenues and operating expenses for associated costs of an equal amount, as follows:current year's
| | | | | | | | | | | | | | | | | |
| Three Months Ended | | | | |
| March 31, 2019 | | | | |
| As reported | | Revision | | As revised |
| | | | | |
| | | | | |
| PEO revenues | | $ | 1,133.1 | | | (19.2) | | | $ | 1,113.9 | |
| TOTAL REVENUES | | 3,847.4 | | | (19.2) | | | 3,828.2 | |
| Operating expenses | | 1,874.5 | | | (19.2) | | | 1,855.3 | |
| | | | | |
| | | | | |
| | | | | |
| | | | | |
| Total Expenses | | 2,883.9 | | | (19.2) | | | 2,864.7 | |
| | | | | |
| EARNINGS BEFORE INCOME TAXES | | 984.5 | | | — | | | 984.5 | |
| Provision for income taxes | | 230.8 | | | — | | | 230.8 | |
| NET EARNINGS | | $ | 753.7 | | | — | | | $ | 753.7 | |
| | | | | |
| | | | | |
| | | | | |
| | | | | |
| | | | | | | | | | | | | | | | | |
| Nine Months Ended | | | | |
| March 31, 2019 | | | | |
| As reported | | Revision | | As revised |
| | | | | |
| | | | | |
| PEO revenues | | $ | 3,176.8 | | | (45.6) | | | $ | 3,131.2 | |
| TOTAL REVENUES | | 10,676.5 | | | (45.6) | | | 10,630.9 | |
| Operating expenses | | 5,370.4 | | | (45.6) | | | 5,324.8 | |
| | | | | |
| | | | | |
| | | | | |
| | | | | |
| Total Expenses | | 8,371.7 | | | (45.6) | | | 8,326.1 | |
| | | | | |
| EARNINGS BEFORE INCOME TAXES | | 2,372.3 | | | — | | | 2,372.3 | |
| Provision for income taxes | | 554.9 | | | — | | | 554.9 | |
| NET EARNINGS | | $ | 1,817.4 | | | — | | | $ | 1,817.4 | |
The correction of these previously reported amounts had no impact on the Company's earnings before income taxes, net earnings, consolidated financial condition or cash flows. In addition, corresponding revisions have been made elsewhere in the Company's consolidated footnote disclosures, where applicable, including its Interim Financial Data by Segment disclosure.presentation.
Note 2. New Accounting Pronouncements
Recently Adopted Accounting Pronouncements
Effective July 1, 2019,2020, the Company adopted accounting standard update (“ASU”) 2016-02, “Leases (ASC 842)2018-13, “Fair Value Measurement.” underThe update modifies the optional transition method. As a result, the Company recordeddisclosure requirements on the Consolidated Balance Sheets total operating lease right-of-use (“ROU”) assets of $573.3 million and total operating lease liabilities of $522.6 million, as of the adoption date.fair value measurements. The adoption of ASU 2018-13 modified the disclosures in Note 6 but did not have an impact on our Statementsthe Company's consolidated results of Consolidated Earningsoperations, financial condition, or Statementscash flows.
Effective July 1, 2020, the Company adopted ASU 2016-13, “Financial Instruments - Credit Losses (Topic 326): Measurement of Consolidated Cash Flows. ReferCredit Losses on Financial Instruments.” This update introduces the current expected credit loss (“CECL”) model, which requires an entity to Note 7measure credit losses based on expected losses rather than incurred losses for further details.
Recently Issued Accounting Pronouncements
The following table summarizes recent ASU's issued by the Financial Accounting Standards Board (“FASB”) which have been assessed:assessed and are applicable to the Company:
| | | | | | | | | | | |
| Standard | Description | Effective Date | Effect on Financial Statements or Other Significant Matters |
| | | |
ASU 2020-04 Reference Rate Reform
(Topic 848): Facilitation of the Effects of Reference Rate Reform on Financial Reporting | This update provides optional guidance for a limited period of time to ease the potential burden in accounting for (or recognizing the effects of) reference rate (LIBOR) reform on financial reporting. | March 12, 2020
(Fiscal 2020) through
December 31, 2022
(Fiscal 2023) | The Company is assessing the effects of the Reference Rate Reform. The Company has not yet determined the impact of this ASU on its consolidated results of operations, financial condition, or cash flows. |
| | | |
| ASU 2018-14 Compensation-Retirement Benefits-Defined Benefit Plans | This update modifies the disclosure requirements for employers that sponsor defined benefit pension or other post-retirement plans by removing and adding certain disclosures for these plans. The eliminated disclosures include (a) the amounts in accumulated other comprehensive income expected to be recognized in net periodic benefit costs over the next fiscal year, and (b) the effects of a one percentage point change in assumed health care cost trend rates on the net periodic benefit costs and the benefit obligation for post-retirement health care benefits. Additional disclosures include descriptions of significant gains and losses affecting the benefit obligation for the period. The amendments in ASU 2018-14 would need to be applied on a retrospective basis. | July 1, 2021
(Fiscal 2022) | The adoption of this guidance will modify disclosures but will not have an impact on the Company's consolidated results of operations, financial condition, or cash flows.
|
ASU 2018-13 Fair Value Measurement | This update modifies the disclosure requirements on fair value measurements. Certain disclosures in ASU 2018-13 would need to be applied on a retrospective basis and others on a prospective basis. | July 1, 2020
(Fiscal 2021) | The adoption of this guidance will modify disclosures but will not have an impact on the Company's consolidated results of operations, financial condition, or cash flows.
|
ASU 2016-13 Financial Instruments - Credit Losses (Topic 326): Measurement of Credit Losses on Financial Instruments | This update introduces the current expected credit loss (CECL) model, which will require an entity to measure credit losses for certain financial instruments and financial assets, including trade receivables. Under this update, on initial recognition and at each reporting period, an entity will be required to recognize an allowance that reflects the entity’s current estimate of credit losses expected to be incurred over the life of the financial instrument. In addition, this update modifies the impairment model for available-for-sale debt securities and provides for a simplified accounting model for purchased financial assets with credit deterioration since their origination. In November 2019, the FASB issued Accounting Standard Update 2019-11 Codification Improvements to Topic 326, Financial-Credit Losses which provides clarification and eliminates inconsistencies to amendments included in Update 2016-13. | July 1, 2020
(Fiscal 2021) | The Company is evaluating the impact of this ASU on its consolidated results of operations, financial condition, or cash flows.
|
| | | |
| | | |
| | | |
|
|
| | | |
Note 3. Revenue
Based upon similar operational and economic characteristics, the Company’s revenues are disaggregated by its three strategic pillars: Human Capital Management (“HCM”), HR Outsourcing (“HRO”), and Global (“Global”) Solutions, with separate disaggregation for PEO zero-margin benefits pass-through revenues and client fundfunds interest revenues. The Company believes these revenue categories depict how the nature, amount, timing, and uncertainty of its revenue and cash flows are affected by economic factors.
HCM provides a suite of product offerings that assist employers of all types and sizes in all stages of the employment cycle, from recruitment to retirement. Global is generally consistent with the types of services provided within HCM but represents geographies outside of the United States and includes our multinational offerings. HCM and Global revenues are primarily attributable to fees for providing solutions for payroll, benefits, talent, retirement services and HR processing and fees charged to implement the Company's solutions for clients.
HRO provides a comprehensive human resources outsourcing solution, including offering benefits, providing workers’ compensation insurance, and administering state unemployment insurance, among other human resources functions. This revenue is primarily driven by the PEO. Amounts collected from PEO worksite employers include payroll, fees for benefits, and an administrative fee that also includes payroll taxes, fees for workers’ compensation and state unemployment taxes. The payroll and payroll taxes collected from the worksite employers are presented in revenue net, as the Company does not retain risk and acts as an agent with respect to this aspect of the PEO arrangement. With respect to the payroll and payroll taxes, the worksite employer is primarily responsible for providing the service and has discretion in establishing wages. The fees collected from the worksite employers for benefits (i.e., PEO benefits pass-throughs), workers’ compensation and state unemployment taxes are presented in revenues and the associated costs of benefits, workers’ compensation and state unemployment taxes are included in operating expenses, as the Company acts as a principal with respect to this aspect of the arrangement. With respect to these fees, the Company is primarily responsible for fulfilling the service and has discretion in establishing price. The Company has further disaggregated HRO to separate out its PEO zero-margin benefits pass-through revenues.
The Company recognizes client fund interest revenues on collected but not yet remitted funds held for clients in revenues as earned, as the collection, holding and remittance of these funds are critical components of providing these services.
The following tables provide details of revenue by our strategic pillars, with disaggregation for PEO zero-margin benefits pass-throughs and client fund interest, and include a reconciliation to the Company’s reportable segments:
| | | | Three Months Ended | | | Nine Months Ended | | | Three Months Ended | | Six Months Ended |
| | March 31, | | | March 31, | | | December 31, | | December 31, |
| Types of Revenues | Types of Revenues | 2020 | | 2019 | | 2020 | | 2019 | Types of Revenues | 2020 | | 2019 | | 2020 | | 2019 |
| HCM | HCM | $ | 1,858.3 | | | $ | 1,771.4 | | | $ | 5,074.8 | | | $ | 4,886.1 | | HCM | $ | 1,624.8 | | | $ | 1,647.9 | | | $ | 3,155.4 | | | $ | 3,216.5 | |
| HRO, excluding PEO zero-margin benefits pass-throughs | HRO, excluding PEO zero-margin benefits pass-throughs | 742.4 | | | 678.7 | | | 1,983.6 | | | 1,855.4 | | HRO, excluding PEO zero-margin benefits pass-throughs | 668.7 | | | 650.1 | | | 1,251.1 | | | 1,241.2 | |
| PEO zero-margin benefits pass-throughs | PEO zero-margin benefits pass-throughs | 747.9 | | | 665.3 | | | 2,169.4 | | | 1,965.5 | | PEO zero-margin benefits pass-throughs | 765.9 | | | 722.4 | | | 1,507.0 | | | 1,421.5 | |
| Global | Global | 540.3 | | | 545.4 | | | 1,554.8 | | | 1,508.9 | | Global | 530.9 | | | 511.4 | | | 1,041.1 | | | 1,014.5 | |
| Interest on funds held for clients | Interest on funds held for clients | 158.9 | | | 167.4 | | | 430.4 | | | 415.0 | | Interest on funds held for clients | 105.4 | | | 137.7 | | | 211.9 | | | 271.5 | |
| Total Revenues | Total Revenues | $ | 4,047.8 | | | $ | 3,828.2 | | | $ | 11,213.0 | | | $ | 10,630.9 | | Total Revenues | $ | 3,695.7 | | | $ | 3,669.5 | | | $ | 7,166.5 | | | $ | 7,165.2 | |
Reconciliation of disaggregated revenue to our reportable segments for the three months ended March 31, 2020:
| | | | | | | | | | | | | | | | | | | | | | | |
| Types of Revenues | Employer Services | | PEO | | Other | | Total |
| HCM | $ | 1,859.8 | | | $ | — | | | $ | (1.5) | | | $ | 1,858.3 | |
| HRO, excluding PEO zero-margin benefits pass-throughs | 254.1 | | | 489.0 | | | (0.7) | | | 742.4 | |
| PEO zero-margin benefits pass-throughs | — | | | 747.9 | | | — | | | 747.9 | |
| Global | 540.3 | | | — | | | — | | | 540.3 | |
| Interest on funds held for clients | 157.5 | | | 1.4 | | | — | | | 158.9 | |
| Total Segment Revenues | $ | 2,811.7 | | | $ | 1,238.3 | | | $ | (2.2) | | | $ | 4,047.8 | |
Reconciliation of disaggregated revenue to our reportable segments for the three months ended MarchDecember 31, 2019:2020:
| | | | | | | | | | | | | | | | | | | | | | | |
| Types of Revenues | Employer Services | | PEO | | Other | | Total |
| HCM | $ | 1,774.7 | | | $ | — | | | $ | (3.3) | | | $ | 1,771.4 | |
| HRO, excluding PEO zero-margin benefits pass-throughs | 233.2 | | | 448.6 | | | (3.1) | | | 678.7 | |
| PEO zero-margin benefits pass-throughs | — | | | 665.3 | | | — | | | 665.3 | |
| Global | 545.4 | | | — | | | — | | | 545.4 | |
| Interest on funds held for clients | 165.8 | | | 1.6 | | | — | | | 167.4 | |
| Total Segment Revenues | $ | 2,719.1 | | | $ | 1,115.5 | | | $ | (6.4) | | | $ | 3,828.2 | |
| | | | | | | | | | | | | | | | | | | | | | | |
| Types of Revenues | Employer Services | | PEO | | Other | | Total |
| HCM | $ | 1,625.2 | | | $ | 0 | | | $ | (0.4) | | | $ | 1,624.8 | |
| HRO, excluding PEO zero-margin benefits pass-throughs | 250.1 | | | 419.2 | | | (0.6) | | | 668.7 | |
| PEO zero-margin benefits pass-throughs | 0 | | | 765.9 | | | 0 | | | 765.9 | |
| Global | 530.9 | | | 0 | | | 0 | | | 530.9 | |
| Interest on funds held for clients | 104.4 | | | 1.0 | | | 0 | | | 105.4 | |
| Total Segment Revenues | $ | 2,510.6 | | | $ | 1,186.1 | | | $ | (1.0) | | | $ | 3,695.7 | |
Reconciliation of disaggregated revenue to our reportable segments for the ninethree months ended MarchDecember 31, 2020:2019:
| | Types of Revenues | Types of Revenues | Employer Services | | PEO | | Other | | Total | Types of Revenues | Employer Services | | PEO | | Other | | Total |
| HCM | HCM | $ | 5,079.6 | | | $ | — | | | $ | (4.8) | | | $ | 5,074.8 | | HCM | $ | 1,649.8 | | | $ | 0 | | | $ | (1.9) | | | $ | 1,647.9 | |
| HRO, excluding PEO zero-margin benefits pass-throughs | HRO, excluding PEO zero-margin benefits pass-throughs | 729.7 | | | 1,256.5 | | | (2.6) | | | 1,983.6 | | HRO, excluding PEO zero-margin benefits pass-throughs | 239.9 | | | 411.0 | | | (0.8) | | | 650.1 | |
| PEO zero-margin benefits pass-throughs | PEO zero-margin benefits pass-throughs | — | | | 2,169.4 | | | — | | | 2,169.4 | | PEO zero-margin benefits pass-throughs | 0 | | | 722.4 | | | 0 | | | 722.4 | |
| Global | Global | 1,554.8 | | | — | | | — | | | 1,554.8 | | Global | 511.4 | | | 0 | | | 0 | | | 511.4 | |
| Interest on funds held for clients | Interest on funds held for clients | 426.5 | | | 3.9 | | | — | | | 430.4 | | Interest on funds held for clients | 136.4 | | | 1.3 | | | 0 | | | 137.7 | |
| Total Segment Revenues | Total Segment Revenues | $ | 7,790.6 | | | $ | 3,429.8 | | | $ | (7.4) | | | $ | 11,213.0 | | Total Segment Revenues | $ | 2,537.5 | | | $ | 1,134.7 | | | $ | (2.7) | | | $ | 3,669.5 | |
Reconciliation of disaggregated revenue to our reportable segments for the ninesix months ended MarchDecember 31, 2020:
| | | | | | | | | | | | | | | | | | | | | | | |
| Types of Revenues | Employer Services | | PEO | | Other | | Total |
| HCM | $ | 3,157.4 | | | $ | 0 | | | $ | (2.0) | | | $ | 3,155.4 | |
| HRO, excluding PEO zero-margin benefits pass-throughs | 479.3 | | | 772.7 | | | (0.9) | | | 1,251.1 | |
| PEO zero-margin benefits pass-throughs | 0 | | | 1,507.0 | | | 0 | | | 1,507.0 | |
| Global | 1,041.1 | | | 0 | | | 0 | | | 1,041.1 | |
| Interest on funds held for clients | 209.6 | | | 2.3 | | | 0 | | | 211.9 | |
| Total Segment Revenues | $ | 4,887.4 | | | $ | 2,282.0 | | | $ | (2.9) | | | $ | 7,166.5 | |
Reconciliation of disaggregated revenue to our reportable segments for the six months ended December 31, 2019:
| | Types of Revenues | Types of Revenues | Employer Services | | PEO | | Other | | Total | Types of Revenues | Employer Services | | PEO | | Other | | Total |
| HCM | HCM | $ | 4,891.1 | | | $ | — | | | $ | (5.0) | | | $ | 4,886.1 | | HCM | $ | 3,219.8 | | | $ | 0 | | | $ | (3.3) | | | $ | 3,216.5 | |
| HRO, excluding PEO zero-margin benefits pass-throughs | HRO, excluding PEO zero-margin benefits pass-throughs | 696.6 | | | 1,165.7 | | | (6.9) | | | 1,855.4 | | HRO, excluding PEO zero-margin benefits pass-throughs | 475.6 | | | 767.5 | | | (1.9) | | | 1,241.2 | |
| PEO zero-margin benefits pass-throughs | PEO zero-margin benefits pass-throughs | — | | | 1,965.5 | | | — | | | 1,965.5 | | PEO zero-margin benefits pass-throughs | 0 | | | 1,421.5 | | | 0 | | | 1,421.5 | |
| Global | Global | 1,508.9 | | | — | | | — | | | 1,508.9 | | Global | 1,014.5 | | | 0 | | | 0 | | | 1,014.5 | |
| Interest on funds held for clients | Interest on funds held for clients | 411.1 | | | 3.9 | | | — | | | 415.0 | | Interest on funds held for clients | 269.0 | | | 2.5 | | | 0 | | | 271.5 | |
| Total Segment Revenues | Total Segment Revenues | $ | 7,507.7 | | | $ | 3,135.1 | | | $ | (11.9) | | | $ | 10,630.9 | | Total Segment Revenues | $ | 4,978.9 | | | $ | 2,191.5 | | | $ | (5.2) | | | $ | 7,165.2 | |
Contract Balances
The timing of revenue recognition for HCM, HRO and Global Solutions is consistent with the invoicing of clients, as invoicing occurs in the period the services are provided. Therefore, the Company does not recognize a contract asset or liability resulting from the timing of revenue recognition and invoicing.
Changes in deferred revenue related to set up fees for the ninesix months ended MarchDecember 31, 2020 were as follows:
| | | | | |
| Contract Liability | |
Contract liability, July 1, 20192020 | $ | 563.4522.7 | |
| Recognition of revenue included in beginning of year contract liability | (129.7)(85.8) | |
| Contract liability, net of revenue recognized on contracts during the period | 107.664.1 | |
| Currency translation adjustments | (6.7)20.6 | |
Contract liability, MarchDecember 31, 2020 | $ | 534.6521.6 | |
Note 4. Earnings per Share (“EPS”)
| | | Basic | | Effect of Employee Stock Option Shares | | Effect of
Employee
Restricted
Stock
Shares | | Diluted | | Basic | | Effect of Employee Stock Option Shares | | Effect of
Employee
Restricted
Stock
Shares | | Diluted |
| Three Months Ended March 31, 2020 | | | | | | | | | |
| Three Months Ended December 31, 2020 | | Three Months Ended December 31, 2020 | | | | | | | | |
| Net earnings | Net earnings | | $ | 820.9 | | | | | | | $ | 820.9 | | Net earnings | | $ | 647.5 | | | | | | | $ | 647.5 | |
| Weighted average shares (in millions) | Weighted average shares (in millions) | | 430.0 | | | 0.9 | | | 0.9 | | | 431.8 | | Weighted average shares (in millions) | | 427.4 | | | 0.7 | | | 0.9 | | | 429.0 | |
| EPS | EPS | | $ | 1.91 | | | | | | | $ | 1.90 | | EPS | | $ | 1.51 | | | | | | | $ | 1.51 | |
| Three Months Ended March 31, 2019 | | | | | | | | | |
| Three Months Ended December 31, 2019 | | Three Months Ended December 31, 2019 | | | | | | | | |
| Net earnings | Net earnings | | $ | 753.7 | | | | | | | $ | 753.7 | | Net earnings | | $ | 651.6 | | | | | | | $ | 651.6 | |
| Weighted average shares (in millions) | Weighted average shares (in millions) | | 434.1 | | | 1.2 | | | 1.3 | | | 436.6 | | Weighted average shares (in millions) | | 431.5 | | | 1.1 | | | 0.7 | | | 433.3 | |
| EPS | EPS | | $ | 1.74 | | | | | | | | | $ | 1.73 | | EPS | | $ | 1.51 | | | | | | | $ | 1.50 | |
| | Nine Months Ended March 31, 2020 | | |
| Six Months Ended December 31, 2020 | | Six Months Ended December 31, 2020 | |
| Net earnings | Net earnings | | $ | 2,054.9 | | | | | | | $ | 2,054.9 | | Net earnings | | $ | 1,249.6 | | | | | | | $ | 1,249.6 | |
| Weighted average shares (in millions) | Weighted average shares (in millions) | | 431.4 | | | 1.1 | | | 1.0 | | | 433.5 | | Weighted average shares (in millions) | | 428.0 | | | 0.7 | | | 0.8 | | | 429.5 | |
| EPS | EPS | | $ | 4.76 | | | | | | | $ | 4.74 | | EPS | | $ | 2.92 | | | | | | | $ | 2.91 | |
| Nine Months Ended March 31, 2019 | | | | | | | | | |
| Six Months Ended December 31, 2019 | | Six Months Ended December 31, 2019 | | | | | | | | |
| Net earnings | Net earnings | | $ | 1,817.4 | | | | | | | $ | 1,817.4 | | Net earnings | | $ | 1,234.0 | | | | | | | $ | 1,234.0 | |
| Weighted average shares (in millions) | Weighted average shares (in millions) | | 435.5 | | | 1.3 | | | 1.3 | | | 438.1 | | Weighted average shares (in millions) | | 432.1 | | | 1.1 | | | 1.1 | | | 434.3 | |
| EPS | EPS | | $ | 4.17 | | | | | | | | | $ | 4.15 | | EPS | | $ | 2.86 | | | | | | | $ | 2.84 | |
Options to purchase 1.31.2 million and 0.81.3 million shares of common stock for the three months ended MarchDecember 31, 2020 and 2019, respectively, and 1.11.8 million and 0.61.0 million shares of common stock for the ninesix months ended MarchDecember 31, 2020 and 2019, respectively, were excluded from the calculation of diluted earnings per share because their inclusion would have been anti-dilutive.
Note 5. Other Income,(Income)/Expense, Net
| | | | | | | | | | | | | | | | | | | | | | | |
| Three Months Ended | | | | Nine Months Ended | | |
| March 31, | | | | March 31, | | |
| 2020 | | 2019 | | 2020 | | 2019 |
| Interest income on corporate funds | $ | (12.1) | | | $ | (15.0) | | | $ | (70.1) | | | $ | (71.6) | |
| Realized gains on available-for-sale securities | (2.9) | | | (0.6) | | | (13.0) | | | (1.2) | |
| Realized losses on available-for-sale securities | 0.4 | | | 0.5 | | | 1.1 | | | 2.6 | |
| | | | | | | |
| Impairment of intangible assets | — | | | — | | | — | | | 12.1 | |
| Gain on sale of assets | — | | | — | | | (1.9) | | | (4.1) | |
| Gain on sale of investment | — | | | — | | | (0.2) | | | — | |
| | | | | | | |
| | | | | | | |
| Non-service components of pension expense, net (see Note 11) | (30.0) | | | (5.9) | | | (61.1) | | | (5.3) | |
| Other income, net | $ | (44.6) | | | $ | (21.0) | | | $ | (145.2) | | | $ | (67.5) | |
| | | | | | | | | | | | | | | | | | | | | | | |
| Three Months Ended | | Six Months Ended |
| December 31, | | December 31, |
| 2020 | | 2019 | | 2020 | | 2019 |
| Interest income on corporate funds | $ | (10.4) | | | $ | (25.7) | | | $ | (24.3) | | | $ | (58.0) | |
| | | | | | | |
| | | | | | | |
| Realized (gains) / losses on available-for-sale securities, net | (7.7) | | | (7.1) | | | (8.0) | | | (9.4) | |
| | | | | | | |
| Impairment of assets | 2.2 | | | 0 | | | 5.0 | | | 0 | |
| Gain on sale of assets | (1.6) | | | (0.2) | | | (1.8) | | | (2.1) | |
| | | | | | | |
| | | | | | | |
| | | | | | | |
| Non-service components of pension income, net (see Note 11) | (11.5) | | | (13.0) | | | (24.9) | | | (31.1) | |
| Other (income)/expense, net | $ | (29.0) | | | $ | (46.0) | | | $ | (54.0) | | | $ | (100.6) | |
In fiscal 2019,Other (income)/expense, net, decreased for the Company wrote down $12.1 millionthree and six months ended December 31, 2020 primarily as a result of internally developed software which was determined to have no future usea decrease in interest income on corporate funds due to redundant software identified as part of an acquisition. In addition, the Company recognized a gain of $4.1 million for the sale of assets in relation to the Service Alignment Initiative.
Note 6. Corporate Investments and Funds Held for Clients
Corporate investments and funds held for clients at MarchDecember 31, 2020 and June 30, 20192020 were as follows:
| | | | March 31, 2020 | | | December 31, 2020 |
| | Amortized
Cost | | Gross
Unrealized
Gains | | Gross
Unrealized
Losses | | | Fair Market Value (A) | | Amortized
Cost | | Gross
Unrealized
Gains | | Gross
Unrealized
Losses | | | Fair Market Value (A) |
| Type of issue: | Type of issue: | | | | | | | | | Type of issue: | | | | | | | | |
| Money market securities, cash and other cash equivalents | Money market securities, cash and other cash equivalents | $ | 8,519.0 | | | $ | — | | | $ | — | | | | $ | 8,519.0 | | Money market securities, cash and other cash equivalents | $ | 16,128.5 | | | $ | — | | | $ | — | | | | $ | 16,128.5 | |
| Available-for-sale securities: | Available-for-sale securities: | | | | Available-for-sale securities: | | | |
| Corporate bonds | Corporate bonds | 10,802.4 | | | 226.4 | | | (33.0) | | | | 10,995.8 | | Corporate bonds | 10,266.6 | | | 439.7 | | | (0.9) | | | | 10,705.4 | |
| Asset-backed securities | Asset-backed securities | 4,056.7 | | | 27.4 | | | (42.1) | | | | 4,042.0 | | Asset-backed securities | 2,741.5 | | | 87.3 | | | 0 | | | | 2,828.8 | |
| U.S. Treasury securities | U.S. Treasury securities | 3,585.9 | | | 129.4 | | | — | | | | 3,715.3 | | U.S. Treasury securities | 3,609.3 | | | 93.8 | | | (0.1) | | | | 3,703.0 | |
| U.S. government agency securities | U.S. government agency securities | 1,491.4 | | | 61.0 | | | — | | | | 1,552.4 | | U.S. government agency securities | 1,403.4 | | | 30.4 | | | (0.9) | | | | 1,432.9 | |
| Canadian government obligations and Canadian government agency obligations | Canadian government obligations and Canadian government agency obligations | 1,007.0 | | | 16.2 | | | (0.3) | | | | 1,022.9 | | Canadian government obligations and Canadian government agency obligations | 1,084.9 | | | 21.8 | | | (0.1) | | | | 1,106.6 | |
| Commercial mortgage-backed securities | | Commercial mortgage-backed securities | 805.8 | | | 54.6 | | | 0 | | | | 860.4 | |
| Canadian provincial bonds | Canadian provincial bonds | 731.4 | | | 24.4 | | | — | | | | 755.8 | | Canadian provincial bonds | 713.9 | | | 34.5 | | | (0.1) | | | | 748.3 | |
| Municipal bonds | 581.4 | | | 17.0 | | | (0.5) | | | | 597.9 | | |
| Other securities | Other securities | 1,291.9 | | | 50.7 | | | (1.1) | | | | 1,341.5 | | Other securities | 925.0 | | | 40.2 | | | (0.1) | | | | 965.1 | |
| | Total available-for-sale securities | Total available-for-sale securities | 23,548.1 | | | 552.5 | | | (77.0) | | | | 24,023.6 | | Total available-for-sale securities | 21,550.4 | | | 802.3 | | | (2.2) | | | | 22,350.5 | |
| | Total corporate investments and funds held for clients | Total corporate investments and funds held for clients | $ | 32,067.1 | | | $ | 552.5 | | | $ | (77.0) | | | | $ | 32,542.6 | | Total corporate investments and funds held for clients | $ | 37,678.9 | | | $ | 802.3 | | | $ | (2.2) | | | | $ | 38,479.0 | |
(A) Included within available-for-sale securities are corporate investments with fair values of $3.2$10.6 million and funds held for clients with fair values of $24,020.4 million.$22,339.9 million. All available-for-sale securities were included in Level 2 of the fair value hierarchy.
| | | | June 30, 2019 | | | June 30, 2020 |
| | Amortized
Cost | | Gross
Unrealized
Gains | | Gross
Unrealized
Losses | | Fair Market Value (B) | | Amortized
Cost | | Gross
Unrealized
Gains | | Gross
Unrealized
Losses | | Fair Market Value (B) |
| Type of issue: | Type of issue: | | | | | | | | Type of issue: | | | | | | | |
| Money market securities, cash and other cash equivalents | Money market securities, cash and other cash equivalents | $ | 6,796.2 | | | $ | — | | | $ | — | | | $ | 6,796.2 | | Money market securities, cash and other cash equivalents | $ | 7,053.6 | | | $ | — | | | $ | — | | | $ | 7,053.6 | |
| Available-for-sale securities: | Available-for-sale securities: | | | Available-for-sale securities: | | |
| Corporate bonds | Corporate bonds | 10,691.8 | | | 182.8 | | | (6.7) | | | 10,867.9 | | Corporate bonds | 9,188.7 | | | 473.4 | | | 0 | | | 9,662.1 | |
| Asset-backed securities | Asset-backed securities | 4,658.3 | | | 37.8 | | | (5.4) | | | 4,690.7 | | Asset-backed securities | 3,274.6 | | | 96.0 | | | (0.5) | | | 3,370.1 | |
| U.S. Treasury securities | U.S. Treasury securities | 2,933.0 | | | 23.8 | | | (8.0) | | | 2,948.8 | | U.S. Treasury securities | 3,580.6 | | | 120.8 | | | 0 | | | 3,701.4 | |
| U.S. government agency securities | U.S. government agency securities | 2,612.0 | | | 17.7 | | | (5.8) | | | 2,623.9 | | U.S. government agency securities | 1,128.2 | | | 35.6 | | | 0 | | | 1,163.8 | |
| Canadian government obligations and Canadian government agency obligations | Canadian government obligations and Canadian government agency obligations | 1,164.1 | | | 7.0 | | | (6.0) | | | 1,165.1 | | Canadian government obligations and Canadian government agency obligations | 1,018.7 | | | 23.1 | | | 0 | | | 1,041.8 | |
| Commercial mortgage-backed securities | | Commercial mortgage-backed securities | 814.3 | | | 53.9 | | | 0 | | | 868.2 | |
| Canadian provincial bonds | Canadian provincial bonds | 800.2 | | | 14.5 | | | (0.5) | | | 814.2 | | Canadian provincial bonds | 676.6 | | | 33.6 | | | 0 | | | 710.2 | |
| Municipal bonds | 596.1 | | | 16.4 | | | (0.1) | | | 612.4 | | |
| Other securities | Other securities | 1,116.1 | | | 20.6 | | | (0.6) | | | 1,136.1 | | Other securities | 1,018.1 | | | 41.1 | | | (0.2) | | | 1,059.0 | |
| | Total available-for-sale securities | Total available-for-sale securities | 24,571.6 | | | 320.6 | | | (33.1) | | | 24,859.1 | | Total available-for-sale securities | 20,699.8 | | | 877.5 | | | (0.7) | | | 21,576.6 | |
| | Total corporate investments and funds held for clients | Total corporate investments and funds held for clients | $ | 31,367.8 | | | $ | 320.6 | | | $ | (33.1) | | | $ | 31,655.3 | | Total corporate investments and funds held for clients | $ | 27,753.4 | | | $ | 877.5 | | | $ | (0.7) | | | $ | 28,630.2 | |
(B) Included within available-for-sale securities are corporate investments with fair values of $271.9$13.6 million and funds held for clients with fair values of $24,587.2$21,563.0 million. All available-for-sale securities were included in Level 2 of the fair value hierarchy.
For a description of the fair value hierarchy and the Company's fair value methodologies, including the use of an independent third-party pricing service, see Note 1 “Summary of Significant Accounting Policies” in the Company's Annual Report on Form 10-K for fiscal 2019.2020. The Company did not transfer any assets between Levels during the nine months ended March 31, 2020 or fiscal 2019. In addition, the Company concurred with and did not adjust the prices obtained from the independent pricing service. The Company had 0 available-for-sale securities included in Level 1 or Level 3 at MarchDecember 31, 2020.
The unrealized losses and fair values of available-for-sale securities that have been in an unrealized loss position for a period of less than and greater than 12 months as of MarchDecember 31, 2020, are as follows:
| | | March 31, 2020 | | | December 31, 2020 |
| | Securities in Unrealized Loss Position Less Than 12 Months | | | Securities in Unrealized Loss Position Greater Than 12 Months | | | Total | | | Securities in Unrealized Loss Position Less Than 12 Months | | Securities in Unrealized Loss Position Greater Than 12 Months | | Total |
| | Gross
Unrealized
Losses | | Fair Market
Value | | Gross
Unrealized
Losses | | Fair Market
Value | | Gross
Unrealized
Losses | | Fair
Market Value | | Gross
Unrealized
Losses | | Fair Market
Value | | Gross
Unrealized
Losses | | Fair Market
Value | | Gross
Unrealized
Losses | | Fair
Market Value |
| Corporate bonds | Corporate bonds | $ | (32.9) | | | $ | 2,811.0 | | | $ | (0.1) | | | $ | 12.0 | | | $ | (33.0) | | | $ | 2,823.0 | | Corporate bonds | $ | (0.9) | | | $ | 379.3 | | | $ | 0 | | | $ | 0 | | | $ | (0.9) | | | $ | 379.3 | |
| Asset-backed securities | Asset-backed securities | (41.2) | | | 1,954.6 | | | (0.9) | | | 281.6 | | | (42.1) | | | 2,236.2 | | Asset-backed securities | 0 | | | 3.2 | | | 0 | | | 0 | | | 0 | | | 3.2 | |
| U.S. Treasury securities | U.S. Treasury securities | — | | | 2.5 | | | — | | | — | | | — | | | 2.5 | | U.S. Treasury securities | (0.1) | | | 14.1 | | | 0 | | | 0 | | | (0.1) | | | 14.1 | |
| U.S. government agency securities | U.S. government agency securities | — | | | — | | | — | | | — | | | — | | | — | | U.S. government agency securities | (0.9) | | | 348.6 | | | 0 | | | 0 | | | (0.9) | | | 348.6 | |
| Canadian government obligations and Canadian government agency obligations | Canadian government obligations and Canadian government agency obligations | (0.3) | | | 24.6 | | | — | | | — | | | (0.3) | | | 24.6 | | Canadian government obligations and Canadian government agency obligations | (0.1) | | | 68.1 | | | 0 | | | 0 | | | (0.1) | | | 68.1 | |
| Commercial mortgage-backed securities | | Commercial mortgage-backed securities | 0 | | | 0 | | | 0 | | | 1.4 | | | 0 | | | 1.4 | |
| Canadian provincial bonds | Canadian provincial bonds | — | | | 7.7 | | | — | | | — | | | — | | | 7.7 | | Canadian provincial bonds | (0.1) | | | 45.7 | | | 0 | | | 0 | | | (0.1) | | | 45.7 | |
| Municipal bonds | (0.5) | | | 44.1 | | | — | | | — | | | (0.5) | | | 44.1 | | |
| Other securities | Other securities | (1.1) | | | 89.1 | | | — | | | 3.2 | | | (1.1) | | | 92.3 | | Other securities | (0.1) | | | 28.2 | | | 0 | | | 0 | | | (0.1) | | | 28.2 | |
| | | $ | (76.0) | | | $ | 4,933.6 | | | $ | (1.0) | | | $ | 296.8 | | | $ | (77.0) | | | $ | 5,230.4 | | | $ | (2.2) | | | $ | 887.2 | | | $ | 0 | | | $ | 1.4 | | | $ | (2.2) | | | $ | 888.6 | |
The unrealized losses and fair values of available-for-sale securities that have been in an unrealized loss position for a period of less than and greater than 12 months as of June 30, 2019,2020, are as follows:
| | | June 30, 2019 | | | June 30, 2020 |
| | Securities in Unrealized Loss Position Less Than 12 Months | | | Securities in Unrealized Loss Position Greater Than 12 Months | | | Total | | | Securities in Unrealized Loss Position Less Than 12 Months | | Securities in Unrealized Loss Position Greater Than 12 Months | | Total |
| | Gross
Unrealized
Losses | | Fair Market
Value | | Gross
Unrealized
Losses | | Fair Market
Value | | Gross
Unrealized
Losses | | Fair
Market Value | | Gross
Unrealized
Losses | | Fair Market
Value | | Gross
Unrealized
Losses | | Fair Market
Value | | Gross
Unrealized
Losses | | Fair
Market Value |
| Corporate bonds | Corporate bonds | $ | (0.6) | | | $ | 151.9 | | | $ | (6.1) | | | $ | 2,055.6 | | | $ | (6.7) | | | $ | 2,207.5 | | Corporate bonds | $ | 0 | | | $ | 0 | | | $ | 0 | | | $ | 0 | | | $ | 0 | | | $ | 0 | |
| Asset-backed securities | Asset-backed securities | (0.2) | | | 171.9 | | | (5.2) | | | 2,083.5 | | | (5.4) | | | 2,255.4 | | Asset-backed securities | (0.5) | | | 43.9 | | | 0 | | | 0 | | | (0.5) | | | 43.9 | |
| U.S. Treasury securities | U.S. Treasury securities | — | | | 1.8 | | | (8.0) | | | 1,159.4 | | | (8.0) | | | 1,161.2 | | U.S. Treasury securities | 0 | | | 2.0 | | | 0 | | | 0 | | | 0 | | | 2.0 | |
| U.S. government agency securities | U.S. government agency securities | — | | | — | | | (5.8) | | | 1,671.4 | | | (5.8) | | | 1,671.4 | | U.S. government agency securities | 0 | | | 0 | | | 0 | | | 0 | | | 0 | | | 0 | |
| Canadian government obligations and Canadian government agency obligations | Canadian government obligations and Canadian government agency obligations | (6.0) | | | 662.7 | | | — | | | 1.1 | | | (6.0) | | | 663.8 | | Canadian government obligations and Canadian government agency obligations | 0 | | | 0 | | | 0 | | | 0 | | | 0 | | | 0 | |
| Commercial mortgage-backed securities | | Commercial mortgage-backed securities | 0 | | | 0 | | | 0 | | | 1.5 | | | 0 | | | 1.5 | |
| Canadian provincial bonds | Canadian provincial bonds | (0.3) | | | 81.5 | | | (0.2) | | | 50.1 | | | (0.5) | | | 131.6 | | Canadian provincial bonds | 0 | | | 0 | | | 0 | | | 0 | | | 0 | | | 0 | |
| Municipal bonds | — | | | 1.5 | | | (0.1) | | | 23.3 | | | (0.1) | | | 24.8 | | |
| Other securities | Other securities | (0.1) | | | 36.4 | | | (0.5) | | | 148.1 | | | (0.6) | | | 184.5 | | Other securities | (0.2) | | | 17.1 | | | 0 | | | 0 | | | (0.2) | | | 17.1 | |
| | | $ | (7.2) | | | $ | 1,107.7 | | | $ | (25.9) | | | $ | 7,192.5 | | | $ | (33.1) | | | $ | 8,300.2 | | | $ | (0.7) | | | $ | 63.0 | | | $ | 0 | | | $ | 1.5 | | | $ | (0.7) | | | $ | 64.5 | |
At MarchDecember 31, 2020, Corporate bonds include investment-grade debt securities with a wide variety of issuers, industries, and sectors, primarily carry credit ratings of A and above, and have maturities rangingranging from April 2020January 2021 through MarchOctober 2030.
At MarchDecember 31, 2020, asset-backed securities include AAA-rated senior tranches of securities with predominantly prime collateral of fixed-rate auto loan, credit card, equipment lease, and rate reduction receivables with fair values of $2,045.2$1,478.7 million,, $1,483.6 $965.8 million,, $391.5 $302.8 million,, and $121.0$80.8 million,, respectively. These securities are collateralized by the cash flows of the
underlying pools of receivables. The primary risk associated with these securities is the collection risk of the underlying receivables. All collateral on such asset-backed securities has performed as expected through MarchDecember 31, 2020.
At MarchDecember 31, 2020, U.S. government agency securities primarily include debt directly issued by Federal Farm Credit Banks and Federal Home Loan Banks with fair values of $679.4 million$698.4 million and $648.5$584.7 million,, respectively. U.S. government agency securities represent senior, unsecured, non-callable debt that primarily carry ratings of Aaa by Moody's, and AA+ by Standard & Poor's, with maturities ranging from April 2020January 2021 through December 2029.November 2030.
At MarchDecember 31, 2020, other securities and their fair value primarily include U.S.U.S government agency commercial mortgage-backed securities of $859.0$860.4 million include those issued by Federal Home Loan Mortgage Corporation and Federal National Mortgage Association,Association.
At December 31, 2020, other securities primarily include municipal bonds, diversified with a variety of issuers, with credit ratings of A and above with fair values of $560.7 million and AA-rated United Kingdom Gilt securities of $190.2 million, and AAA-rated and AA-rated supranational bonds of $91.7$208.3 million.
Classification of corporate investments on the Consolidated Balance Sheets is as follows:
| | | March 31, | | June 30, | | December 31, | | June 30, |
| | 2020 | | 2019 | | 2020 | | 2020 |
| Corporate investments: | Corporate investments: | | | | | Corporate investments: | | | | |
| Cash and cash equivalents | Cash and cash equivalents | | $ | 1,705.0 | | | $ | 1,949.2 | | Cash and cash equivalents | | $ | 1,602.2 | | | $ | 1,908.5 | |
Short-term marketable securities | Short-term marketable securities | | 3.2 | | | 10.5 | | Short-term marketable securities | | 10.6 | | | 0 | |
Long-term marketable securities (a)(b) | Long-term marketable securities (a)(b) | | — | | | 261.4 | | Long-term marketable securities (a)(b) | | 0 | | | 13.6 | |
| Total corporate investments | Total corporate investments | | $ | 1,708.2 | | | $ | 2,221.1 | | Total corporate investments | | $ | 1,612.8 | | | $ | 1,922.1 | |
(a) - Short-term marketable securities are included within Other current assets on the Consolidated Balance Sheets.
(b) - Long-term marketable securities are included within Other assets on the Consolidated Balance Sheets.
Funds held for clients represent assets that, based upon the Company's intent, are restricted for use solely for the purposes of satisfying the obligations to remit funds relating to the Company’s payroll and payroll tax filing services, which are classified as client funds obligations on our Consolidated Balance Sheets.
Funds held for clients have been invested in the following categories:
| | | March 31, | | June 30, | | December 31, | | June 30, |
| | 2020 | | 2019 | | 2020 | | 2020 |
| Funds held for clients: | Funds held for clients: | | | | | Funds held for clients: | | | | |
| Restricted cash and cash equivalents held to satisfy client funds obligations | Restricted cash and cash equivalents held to satisfy client funds obligations | | $ | 6,814.0 | | | $ | 4,847.0 | | Restricted cash and cash equivalents held to satisfy client funds obligations | | $ | 14,526.3 | | | $ | 5,145.1 | |
| Restricted short-term marketable securities held to satisfy client funds obligations | Restricted short-term marketable securities held to satisfy client funds obligations | | 5,799.0 | | | 5,013.9 | | Restricted short-term marketable securities held to satisfy client funds obligations | | 4,768.3 | | | 5,541.2 | |
| Restricted long-term marketable securities held to satisfy client funds obligations | Restricted long-term marketable securities held to satisfy client funds obligations | | 18,221.4 | | | 19,573.3 | | Restricted long-term marketable securities held to satisfy client funds obligations | | 17,571.6 | | | 16,021.8 | |
| Total funds held for clients | Total funds held for clients | | $ | 30,834.4 | | | $ | 29,434.2 | | Total funds held for clients | | $ | 36,866.2 | | | $ | 26,708.1 | |
Client funds obligations represent the Company's contractual obligations to remit funds to satisfy clients' payroll, tax, and other payee payment obligations and are recorded on the Consolidated Balance Sheets at the time that the Company impounds funds from clients. The client funds obligations represent liabilities that will be repaid within one year of the balance sheet date. The Company has reported client funds obligations as a current liability on the Consolidated Balance SheetsSheets totaling $30,359.0$36,066.1 million and $29,144.5$25,831.6 million at MarchDecember 31, 2020 and June 30, 2019,2020, respectively. The Company hashas classified funds held for clients as a current asset since these funds are held solely for the purpose of satisfying the client funds obligations. Of the Company’s funds held for clients at MarchDecember 31, 2020 and June 30, 2019, $27,689.82020, $33,706.4 million and $26,648.0and $23,740.0 million, respectively, are held in the grantor trust. The liabilities held within the trust are intercompany liabilities to other Company subsidiaries and are eliminated in consolidation.
The Company has reported the cash flows related to the purchases of corporate and client funds marketable securities and related to the proceeds from the sales and maturities of corporate and client funds marketable securities on a gross basis in the investing section of the Statements of Consolidated Cash Flows. The Company has reported the cash and cash equivalents related to client funds investments with original maturities of ninety days or less, within the beginning and ending balances of cash, cash equivalents, restricted cash, and restricted cash equivalents. These amounts have been reconciled to the Consolidated Balance Sheets on the Statements of Consolidated Cash Flows. The Company has reported the cash flows related to the cash
received from and paid on behalf of clients on a net basis within net increase / (decrease) in client funds obligations in the financing activities section of the Statements of Consolidated Cash Flows.
Approximately 77% of the available-for-sale securities held a AAA-rating or AA-rating at MarchDecember 31, 2020, as rated by Moody's, Standard & Poor's, DBRS for Canadian dollar-denominated securities, and Fitch for asset-backed and commercial mortgage-backed securities. All available-for-sale securities were rated as investment grade at MarchDecember 31, 2020.
Expected maturities of available-for-sale securities at MarchDecember 31, 2020 are as follows:
| | | | | |
| One year or less | $ | 5,802.24,778.9 | |
| One year to two years | 4,387.04,561.0 | |
| Two years to three years | 4,904.93,524.7 | |
| Three years to four years | 3,369.32,670.6 | |
| After four years | 5,560.26,815.3 | |
| Total available-for-sale securities | $ | 24,023.622,350.5 | |
Note 7. Leases
During the first quarter of the fiscal year ending June 30, 2020 ("fiscal 2020"), the Company adopted ASC 842 using the optional transition method under which financial results reported in periods prior were not adjusted and continue to be reported in accordance with historic accounting under ASC 840 - Leases.
The Company elected the following practical expedients permitted under the lease standard:
•The Company did not reassess prior conclusions about lease identification, lease classification or initial direct costs, and did not use hindsight for leases existing at adoption date.
•The Company did not record leases with an initial term of 12 months or less on the consolidated balance sheet but continues to expense them on a straight-line basis over the lease term.
•The Company elected to combine lease and non-lease components for our facilities leases only. Non-lease components consist primarily of maintenance services.
The Company records leases on the consolidated balance sheets as operating lease ROUright-of-use (“ROU”) assets, records the current portion of operating lease liabilities within accrued expenses and other current liabilities and, separately, records long-term operating lease liabilities.
The Company has entered into operating lease agreements for facilities and equipment. The Company's leases have remaining lease terms of up to approximately eleven years. Operating lease ROU assets and operating lease liabilities are recognized at the lease commencement date based on the present value of the lease payments over the lease term. The lease liabilities are measured by discounting future lease payments at the Company’s collateralized incremental borrowing rate for financing instruments of a similar term, unless the implicit rate is readily determinable. ROU assets also include adjustments related to prepaid or deferred lease payments and lease incentives. As of March 31, 2020, total operating lease ROU assets were $521.1 million, current and long-term operating lease liabilities were approximately $98.2 million and $361.2 million, respectively. The difference between total ROU assets and total lease liabilities are primarily attributable to pre-payments of our obligations and the recognition of various lease incentives.
The Company has entered into operating lease agreements for facilities and equipment. The Company's leases have remaining lease terms of up to approximately eleven years.
The components of operating lease expense were as follows:
| | | Three Months Ended | | Nine Months Ended | | Three Months Ended | | Six Months Ended |
| | March 31, | | March 31, | | December 31, | | December 31, |
| | 2020 | | 2020 | | 2020 | | 2019 | | 2020 | | 2019 |
| Operating lease cost | Operating lease cost | $ | 34.8 | | | $ | 121.3 | | Operating lease cost | $ | 40.0 | | | $ | 42.3 | | | $ | 79.1 | | | $ | 86.5 | |
| Short-term lease cost | Short-term lease cost | 1.6 | | | 5.6 | | Short-term lease cost | 0.3 | | | 1.2 | | | 0.7 | | | 3.9 | |
| Variable lease cost | Variable lease cost | 2.9 | | | 4.9 | | Variable lease cost | 2.2 | | | 0.7 | | | 4.3 | | | 2.0 | |
| Total operating lease cost | Total operating lease cost | $ | 39.3 | | | $ | 131.8 | | Total operating lease cost | $ | 42.5 | | | $ | 44.2 | | | $ | 84.1 | | | $ | 92.4 | |
|
The following table provides supplemental cash flow information related to the Company's leases:
| | | | | | | | | | | |
| Six Months Ended |
| December 31, |
| 2020 | | 2019 |
| Cash paid for operating lease liabilities | $ | 77.0 | | | $ | 75.8 | |
| Operating lease ROU assets obtained in exchange for new operating lease liabilities | $ | 72.0 | | | $ | 17.4 | |
| | | |
| | | |
InformationOther information related to our operating lease ROU assets and operating lease liabilities wasis as follows:
| | | | | |
| Nine Months Ended |
| March 31, |
| 2020 |
Cash paid for operating lease liabilities | $ | 186.9 | |
Operating lease ROU assets obtained in exchange for new operating lease liabilities | $ | 142.9 | |
Weighted-average remaining lease term (in years) | 6 |
Weighted-average discount rate | | 2.3 | % |
| | | | | | | | | | | |
| December 31, | | June 30, |
| 2020 | | 2020 |
| Weighted-average remaining lease term (in years) | 6 | | 6 |
| Weighted-average discount rate | 2.1 | % | | 2.3 | % |
| Current operating lease liability | $ | 97.4 | | | $ | 95.5 | |
As of MarchDecember 31, 2020, maturities of operating lease liabilities are as follows:
| | | | | |
Three months ending June 30, 2020 | $ | 28.2 | |
TwelveSix months ending June 30, 2021 | 103.9 $ | 52.9 | |
| Twelve months ending June 30, 2022 | 89.0100.5 | |
| Twelve months ending June 30, 2023 | 76.587.8 | |
| Twelve months ending June 30, 2024 | 56.465.0 | |
| Twelve months ending June 30, 2025 | 48.5 | |
| Thereafter | 139.6130.0 | |
| Total undiscounted lease obligations | 493.6484.7 | |
| Less: Imputed interest | (34.2)(29.9) | |
| Net lease obligations | $ | 459.4454.8 | |
Note 8. Goodwill and Intangible Assets, net
Changes in goodwill for the ninesix months ended MarchDecember 31, 2020 are as follows:
| | | Employer
Services | | PEO
Services | | | Total | | Employer
Services | | PEO
Services | | | Total |
| Balance at June 30, 2019 | $ | 2,318.2 | | | $ | 4.8 | | | | $ | 2,323.0 | | |
| Balance at June 30, 2020 | | Balance at June 30, 2020 | $ | 2,304.6 | | | $ | 4.8 | | | | $ | 2,309.4 | |
| Additions and other adjustments | Additions and other adjustments | (2.5) | | | — | | | | (2.5) | | Additions and other adjustments | 0 | | | 0 | | | | 0 | |
| Currency translation adjustments | Currency translation adjustments | (21.2) | | | — | | | | (21.2) | | Currency translation adjustments | 37.2 | | | 0 | | | | 37.2 | |
| | Balance at March 31, 2020 | $ | 2,294.5 | | | $ | 4.8 | | | | $ | 2,299.3 | | |
| Balance at December 31, 2020 | | Balance at December 31, 2020 | $ | 2,341.8 | | | $ | 4.8 | | | | $ | 2,346.6 | |
Components of intangible assets, net, are as follows:
| | | March 31, | | June 30, | | December 31, | | June 30, |
| | 2020 | | 2019 | | 2020 | | 2020 |
| Intangible assets: | Intangible assets: | | | | | Intangible assets: | | | | |
| Software and software licenses | Software and software licenses | | $ | 2,673.9 | | | $ | 2,519.3 | | Software and software licenses | | $ | 2,831.3 | | | $ | 2,719.1 | |
| Customer contracts and lists | Customer contracts and lists | | 901.9 | | | 860.7 | | Customer contracts and lists | | 1,038.9 | | | 1,021.2 | |
| Other intangibles | Other intangibles | | 239.1 | | | 237.9 | | Other intangibles | | 239.2 | | | 239.2 | |
| | | | 3,814.9 | | | 3,617.9 | | | | 4,109.4 | | | 3,979.5 | |
| Less accumulated amortization: | Less accumulated amortization: | | | | | Less accumulated amortization: | | | | |
| Software and software licenses | Software and software licenses | | (1,880.0) | | | (1,762.3) | | Software and software licenses | | (1,995.6) | | | (1,912.0) | |
| Customer contracts and lists | Customer contracts and lists | | (606.6) | | | (566.4) | | Customer contracts and lists | | (680.8) | | | (628.3) | |
| Other intangibles | Other intangibles | | (221.6) | | | (217.7) | | Other intangibles | | (225.8) | | | (223.4) | |
| | | | (2,708.2) | | | (2,546.4) | | | | (2,902.2) | | | (2,763.7) | |
| Intangible assets, net | Intangible assets, net | | $ | 1,106.7 | | | $ | 1,071.5 | | Intangible assets, net | | $ | 1,207.2 | | | $ | 1,215.8 | |
Other intangibles consist primarily of purchased rights, trademarks and trade names (acquired directly or through acquisitions). All intangible assets have finite lives and, as such, are subject to amortization. The weighted average remaining useful life of the intangible assets is 6 years (6 years for software and software licenses, 5 years for customer contracts and lists, and 43 years for other intangibles). Amortization of intangible assets was $71.9$80.8 million and $57.1$69.7 million for the three months
ended MarchDecember 31, 2020 and 2019, respectively, and $211.0$165.0 million and $166.0$139.1 million for the ninesix months ended MarchDecember 31, 2020 and 2019, respectively.
Estimated future amortization expenses of the Company's existing intangible assets are as follows:
| | | | | |
| | Amount |
Three months ending June 30, 2020 | $ | 77.2 | |
TwelveSix months ending June 30, 2021 | $ | 257.2157.0 | |
| Twelve months ending June 30, 2022 | $ | 206.4270.2 | |
| Twelve months ending June 30, 2023 | $ | 167.7224.9 | |
| Twelve months ending June 30, 2024 | $ | 129.3176.7 | |
| Twelve months ending June 30, 2025 | $ | 79.1122.8 | |
| Twelve months ending June 30, 2026 | $ | 72.6 | |
Note 9. Short-term Financing
The Company has a $3.8$3.2 billion, 364-day credit agreement that matures in June 20202021 with a one year term-out option. The Company also has a $2.75 billion five year credit facility that matures in June 2024 that contains an accordion feature under which the aggregate commitment can be increased by $500 million, subject to the availability of additional commitments. In addition, the Company has a five year $3.75 billion credit facility maturing in June 2023 that also contains an accordion feature under which the aggregate commitment can be increased by $500 million, subject to the availability of additional commitments. The interest rate applicable to committed borrowings is tied to LIBOR, the effective federal funds rate, or the prime rate, depending on the notification provided by the Company to the syndicated financial institutions prior to borrowing. The Company is also required to pay facility fees on the credit agreements. The primary uses of the credit facilities are to provide liquidity to the commercial paper program and funding for general corporate purposes, if necessary. The Company had 0 borrowings through MarchDecember 31, 2020 under the credit agreements.
The Company's U.S. short-term funding requirements related to client funds are sometimes obtained on an unsecured basis through the issuance of commercial paper, rather than liquidating previously-collected client funds that have already been invested in available-for-sale securities. This commercial paper program provides for the issuance of up to $10.3$9.7 billion in aggregate maturity value. The Company’s commercial paper program is rated A-1+ by Standard & Poor’s, and Prime-1 (“P-1”) by Moody’s.Moody’s and F1+ by Fitch. These ratings denote the highest quality commercial paper securities. Maturities of commercial paper can range from overnight to up to 364 days. At MarchDecember 31, 2020 and June 30, 2019,2020, the Company had no0 commercial paper borrowing outstanding. Details of the borrowings under the commercial paper program are as follows:
| | | Three Months Ended | | | Nine Months Ended | | | Three Months Ended | | Six Months Ended |
| | March 31, | | | March 31, | | | December 31, | | December 31, |
| | 2020 | | 2019 | | 2020 | | 2019 | | 2020 | | 2019 | | 2020 | | 2019 |
| Average daily borrowings (in billions) | Average daily borrowings (in billions) | $ | 1.2 | | | $ | 1.1 | | | $ | 2.9 | | | $ | 2.9 | | Average daily borrowings (in billions) | $ | 1.8 | | | $ | 3.5 | | | $ | 2.1 | | | $ | 3.7 | |
| Weighted average interest rates | Weighted average interest rates | 1.5 | % | | 2.4 | % | | 1.9 | % | | 2.2 | % | Weighted average interest rates | 0.1 | % | | 1.7 | % | | 0.1 | % | | 2.0 | % |
| Weighted average maturity (approximately in days) | Weighted average maturity (approximately in days) | 1 day | | 1 day | | 2 days | | 2 days | Weighted average maturity (approximately in days) | 1 day | | 2 days | | 1 day | | 2 days |
The Company’s U.S., Canadian and United Kingdom short-term funding requirements related to client funds obligations are sometimes obtained on a secured basis through the use of reverse repurchase agreements, which are collateralized principally by government and government agency securities, rather than liquidating previously-collected client funds that have already been invested in available-for-sale securities. These agreements generally have terms ranging from overnight to up to five business days. At MarchDecember 31, 2020, there were no0 outstanding obligations related to reverse repurchase agreements. At June 30, 2019,2020, the Company had $262.0$13.6 million of outstanding obligations related to the reverse repurchase agreements, which were fully paid in early July 2019.agreements. Details of the reverse repurchase agreements are as follows:
| | | Three Months Ended | | | Nine Months Ended | | | Three Months Ended | | Six Months Ended |
| | March 31, | | | March 31, | | | December 31, | | December 31, |
| | 2020 | | 2019 | | 2020 | | 2019 | | 2020 | | 2019 | | 2020 | | 2019 |
| Average outstanding balances | Average outstanding balances | $ | 123.2 | | | $ | 93.1 | | | $ | 295.9 | | | $ | 306.1 | | Average outstanding balances | $ | 83.2 | | | $ | 335.9 | | | $ | 117.8 | | | $ | 381.2 | |
| Weighted average interest rates | Weighted average interest rates | 1.6 | % | | 1.8 | % | | 1.8 | % | | 1.8 | % | Weighted average interest rates | 0.3 | % | | 1.7 | % | | 0.3 | % | | 1.8 | % |
Note 10. Debt
The Company has two series of fixed-rate notes with 5-year and 10-year, staggered maturities for an aggregate principal amount of $2.0 billion (collectively the “Notes”). The Notes are senior unsecured obligations, and interest is payable in arrears, semi-annually.
During the three months ended September 30, 2020, the Company issued $1.0 billion of senior notes due in 2030 bearing a fixed interest rate of 1.25%. The Company also redeemed $1.0 billion of senior notes bearing a fixed interest rate of 2.25%. In connection with the senior notes issuance, the Company also terminated several derivative contracts in place to hedge exposure in changes in benchmark interest rates for the senior notes issued with an aggregate notional amount totaling $1.0 billion (of which $400.0 million were entered into during fiscal year 2020 and $600.0 million were entered into on the day of issuance). Since these derivative contracts were classified as cash flow hedges, the unamortized loss of $43.6 million was deferred in accumulated other comprehensive income and will be amortized to earnings over the life of the Notes as the interest payments are made.
The principal amounts and associated effective interest rates of the Notes and other debt as of MarchDecember 31, 2020 and June 30, 2019,2020, are as follows:
| | Debt instrument | Debt instrument | | Effective Interest Rate | | March 31, 2020 | | June 30, 2019 | Debt instrument | | Effective Interest Rate | | December 31, 2020 | | June 30, 2020 |
| Fixed-rate 2.250% notes due September 15, 2020 | Fixed-rate 2.250% notes due September 15, 2020 | | 2.37% | | $ | 1,000.0 | | | $ | 1,000.0 | | Fixed-rate 2.250% notes due September 15, 2020 | | 2.37% | | $ | — | | | $ | 1,000.0 | |
| Fixed-rate 3.375% notes due September 15, 2025 | Fixed-rate 3.375% notes due September 15, 2025 | | 3.47% | | 1,000.0 | | | 1,000.0 | | Fixed-rate 3.375% notes due September 15, 2025 | | 3.47% | | 1,000.0 | | | 1,000.0 | |
| Fixed-rate 1.250% notes due September 1, 2030 | | Fixed-rate 1.250% notes due September 1, 2030 | | 1.83% | | 1,000.0 | | | 0 | |
| Other | Other | | 8.7 | | | 10.9 | | Other | | 7.6 | | | 8.4 | |
| | 2,008.7 | | | 2,010.9 | | | 2,007.6 | | | 2,008.4 | |
| Less: current portion | | (1,001.8) | | | (2.5) | | |
| Less: current portion (a) | | Less: current portion (a) | | (1.4) | | | (1,001.8) | |
| Less: unamortized discount and debt issuance costs | Less: unamortized discount and debt issuance costs | | (4.1) | | | (6.2) | | Less: unamortized discount and debt issuance costs | | (12.1) | | | (3.8) | |
| Total long-term debt | Total long-term debt | | $ | 1,002.8 | | | $ | 2,002.2 | | Total long-term debt | | $ | 1,994.1 | | | $ | 1,002.8 | |
(a) - Current portion of long-term debt as of December 31, 2020 is included within Accrued expenses and other current liabilities on the Consolidated Balance Sheets.
The effective interest rates for the Notes include the interest on the Notes and amortization of the discount and debt issuance costs.
As of MarchDecember 31, 2020, the fair value of the Notes, based on Level 2 inputs, was $2,070.0$2,120.6 million. For a description of the fair value hierarchy and the Company's fair value methodologies, including the use of an independent third-party pricing service, see Note 1 “Summary of Significant Accounting Policies” in the Company's Annual Report on Form 10-K for fiscal 2019.
In anticipation of the refinancing of our fixed-rate 2.25% notes due September 15, 2020, from December 3, 2019 through March 4, 2020, the Company entered into a series of treasury rate lock transactions, with an aggregate notional amount totaling $400.0 million, to hedge its exposure to changes in interest rates through the completion of the refinancing. The derivative contracts entered into during fiscal 2020 have been designated as cash-flow hedges and will be terminated upon completion of the refinancing. Changes in the derivative’s fair value are recorded each period in other comprehensive income with a corresponding current asset or liability and, upon settlement, the aggregate amount in accumulated other comprehensive income will be amortized into net income over the term of the future debt instrument. Refer to Note 15 for the impact to accumulated other comprehensive income. There are no cash flows associated with the derivative until settlement occurs with the counter-parties. The treasury rate lock derivatives are classified as Level 2 in the fair value hierarchy as their value is determined using observable inputs such as forward treasury rates.2020.
Note 11. Employee Benefit Plans
A. Stock-based Compensation Plans. Stock-based compensation consists of the following:
The Company's share-based compensation consists of stock options, time-based restricted stock, time-based restricted stock
units, performance-based restricted stock, and performance-based restricted stock units. The Company also offers an employee
stock purchase plan for eligible employees.
The Company currently utilizes treasury stock to satisfy stock option exercises, issuances under the Company's employee stock purchase plan, and restricted stock awards. From time to time, the Company may repurchase shares of its common stock under its authorized share repurchase program. During the second quarter of fiscal 2020, the Board of Directors authorized the repurchase of $5 billion of our common stock, replacing in its entirety the previous 2015 authorization to purchase up to 25 million shares of our common stock. The Company repurchased 2.51.6 million and 1.61.8 million shares in the three months ended March 31, 2020 and 2019, respectively. The Company repurchased 6.2 million and 5.4 million shares in the nine months ended MarchDecember 31, 2020 and 2019, respectively, of which $536.6and repurchased 3.2 million and 3.7 million shares in the ninesix months ended MarchDecember 31, 2020 were repurchased under the Novemberand 2019, authorization.respectively. The Company considers several factors in determining when to execute share repurchases, including, among other things, actual and potential acquisition activity, cash balances and cash flows, issuances due to employee benefit plan activity, and market conditions.
The following table represents pre-tax stock-based compensation expense for the three and ninesix months ended MarchDecember 31, 2020 and 2019, respectively:
| | | Three Months Ended | | | Nine Months Ended | | | Three Months Ended | | Six Months Ended |
| | March 31, | | | March 31, | | | December 31, | | December 31, |
| | 2020 | | 2019 | | 2020 | | 2019 | | 2020 | | 2019 | | 2020 | | 2019 |
| Operating expenses | Operating expenses | $ | 3.0 | | | $ | 4.1 | | | $ | 10.5 | | | $ | 12.9 | | Operating expenses | $ | 4.8 | | | $ | 3.4 | | | $ | 8.4 | | | $ | 7.4 | |
| Selling, general and administrative expenses | Selling, general and administrative expenses | 26.1 | | | 36.1 | | | 82.3 | | | 94.6 | | Selling, general and administrative expenses | 35.6 | | | 28.0 | | | 60.9 | | | 56.3 | |
| System development and programming costs | System development and programming costs | 4.3 | | | 5.0 | | | 13.9 | | | 14.7 | | System development and programming costs | 6.7 | | | 4.8 | | | 11.6 | | | 9.6 | |
| Total stock-based compensation expense | Total stock-based compensation expense | $ | 33.4 | | | $ | 45.2 | | | $ | 106.7 | | | $ | 122.2 | | Total stock-based compensation expense | $ | 47.1 | | | $ | 36.2 | | | $ | 80.9 | | | $ | 73.3 | |
|
The methods and assumptions used in the determination of the fair value of stock-based awards are consistent with those
described in the Company's Annual Report on Form 10-K for fiscal 2019.2020. See the Company's Annual Report on Form 10-K for fiscal 20192020 for a detailed description of the Company's stock-based compensation awards and employee stock purchase plan, including information related to vesting terms, service and performance conditions, payout percentages, and process for estimating the fair value of stock options granted.
B. Pension Plans
The components of net pension expenseincome were as follows:
| | | | | | | | | | | | | | | | | | | | | | | | | | | |
| Three Months Ended | | | | | | | | Nine Months Ended | | |
| March 31, | | | | | | | | March 31, | | |
| | 2020 | | 2019 | | | | | | 2020 | | 2019 |
| Service cost – benefits earned during the period | $ | 14.9 | | | $ | 14.9 | | | | | | | $ | 44.8 | | | $ | 44.9 | |
| Interest cost on projected benefits | 15.5 | | | 19.7 | | | | | | | 46.3 | | | 59.0 | |
| Expected return on plan assets | (29.5) | | | (32.9) | | | | | | | (88.4) | | | (98.9) | |
| Net amortization and deferral | 1.9 | | | — | | | | | | | 4.8 | | | 0.1 | |
| Settlement charges, special termination benefits and plan curtailment | (17.0) | | | 7.8 | | | | | | | (22.1) | | | 35.9 | |
| Net pension expense | $ | (14.2) | | | $ | 9.5 | | | | | | | $ | (14.6) | | | $ | 41.0 | |
The US pension plan, which is currently closed to new entrants, will be frozen effective July 1, 2020. Benefits under the plan will continue to accrue through June 30, 2020, and as of July 1, 2020 and onward, participants will retain their accrued benefits and will not accrue any future benefits due to service rendered or pay increases. As a result of the freeze, the Company recognized $17.0 million of prior service credits during the three months ended March 31, 2020 within Other Income, net, which were previously recognized within accumulated other comprehensive income (see Note 15).
In fiscal 2018, the Company offered a Voluntary Early Retirement Program (“VERP”) to certain eligible U.S.-based associates aged 55 or above with at least 10 years of service. During the three and nine months ended March 31, 2019, the Company recorded $7.8 million and $35.9 million, respectively, of non-cash settlement charges and special termination benefits. | | | | | | | | | | | | | | | | | | | | | | | | | | | |
| Three Months Ended | | | | Six Months Ended |
| December 31, | | | | December 31, |
| | 2020 | | 2019 | | | | | | 2020 | | 2019 |
| Service cost – benefits earned during the period | $ | 1.2 | | | $ | 14.9 | | | | | | | $ | 2.4 | | | $ | 29.9 | |
| Interest cost on projected benefits | 12.8 | | | 15.4 | | | | | | | 25.5 | | | 30.9 | |
| Expected return on plan assets | (30.4) | | | (29.5) | | | | | | | (60.7) | | | (59.0) | |
| Net amortization and deferral | 2.5 | | | 1.5 | | | | | | | 5.0 | | | 2.9 | |
| Settlement charges and special termination benefits | 2.9 | | | 0 | | | | | | | 5.8 | | | (5.1) | |
| Net pension (income)/expense | $ | (11.0) | | | $ | 2.3 | | | | | | | $ | (22.0) | | | $ | (0.4) | |
Note 12. Income Taxes
The effective tax rate for the three months ended MarchDecember 31, 2020 and 2019 was 23.8%22.2% and 23.4%22.0%, respectively. The increase in the effective tax rate is primarily due to tax creditsthe benefit from a valuation allowance release related to research and development activitiesforeign tax credit carryforwards in the three months ended MarchDecember 31, 2019, andpartially offset by the benefits from a foreign withholding taxes on future distributions and an increase in reserves for uncertain tax positionselection in the three months ended March 31, 2020, partially offset by the benefits of a foreign tax law change and a reduction in the operating tax rate due to the mix between domestic and foreign earnings in the three months ended MarchDecember 31, 2020.
The effective tax rate for the ninesix months ended MarchDecember 31, 2020 and 2019 was 22.5%21.8% and 23.4%21.6%, respectively. The decreaseincrease in the effective tax rate is primarily due to the release ofbenefit from a valuation allowance release related to foreign tax creditcredits carryforwards a reduction in the operatingsix months ended December 31, 2019 and a decrease in the excess tax rate duebenefit on stock-based compensation partially offset by favorable adjustments to the mix between domestic and foreign earningsprior year tax liabilities and the benefit ofbenefits from a foreign tax law change partially offset by foreign withholding taxes on future distributions.election in the six months ended December 31, 2020.
Note 13. Commitments and Contingencies
In June 2018, a potential class action complaint was filed against ADPthe Company in the Circuit Court of Cook County, Illinois. The complaint assertsIllinois asserting that ADP violated the Illinois Biometric Privacy Act was negligent and unjustly enriched itself in connection with its collection, use and storage of biometric data of employees of its clients who are residents of Illinois in connection with certain services provided by ADP to clients in Illinois. The complaint seeks statutory and other unspecified monetary damages, injunctive relief and attorney’s fees. In addition, similar potential class action complaints have been filed in Illinois state courts against ADP and/or certain of its clients with respect to the collection, use and storage of biometric data of the employees of these clients. AllIn June 2020, the Company reached a settlement of theseall outstanding claims against it for $25.0 million, subject to the court's final approval. The Company does not expect that any of the remaining cases against its clients will result in any material liabilities to the Company.
In May 2020, 2 potential class action complaints were filed against ADP, TotalSource and related defendants in the U.S. District Court, District of New Jersey. The complaints assert violations of the Employee Retirement Income Security Act of
1974 (“ERISA”) in connection with the ADP TotalSource Retirement Savings Plan’s fiduciary administrative and investment decision-making. The complaints seek statutory and other unspecified monetary damages, injunctive relief and attorney’s fees. These claims are still in their earliest stages and the Company is unable to estimate any reasonably possible loss, or range of loss, with respect to these matters. The Company intends to vigorously defend against these lawsuits.
The Company is subject to various claims, litigation, and regulatory compliance matters in the normal course of business. When a loss is considered probable and reasonably estimable, the Company records a liability in the amount of its best estimate for the ultimate loss. Management currently believes that the resolution of these claims, litigation and regulatory compliance matters against us, individually or in the aggregate, will not have a material adverse impact on our consolidated results of operations, financial condition or cash flows. These matters are subject to inherent uncertainties and management's view of these matters may change in the future.
It is not the Company’s business practice to enter into off-balance sheet arrangements. In the normal course of business, the Company may enter into contracts in which it makes representations and warranties that relate to the performance of the Company’s services and products. The Company does not expect any material losses related to such representations and warranties.
Note 14. Stockholders' Equity
Changes in stockholders' equity by component are as follows:
| | | | | | | | | | | | | | | | | | | | | | | | | | | | | | | | | | | |
| Three Months Ended | | | | | | | | | | |
| March 31, 2020 | | | | | | | | | | |
| Common Stock | | Capital in Excess of Par Value | | Retained Earnings | | Treasury Stock | | AOCI | | Total |
| Balance at December 31, 2019 | $ | 63.9 | | | $ | 1,253.7 | | | $ | 17,987.6 | | | $ | (13,709.6) | | | $ | (231.2) | | | $ | 5,364.4 | |
| Net earnings | — | | | — | | | 820.9 | | | — | | | — | | | 820.9 | |
| Other comprehensive income | — | | | — | | | — | | | — | | | (3.2) | | | (3.2) | |
| Stock-based compensation expense | — | | | 30.8 | | | — | | | — | | | — | | | 30.8 | |
| Issuances relating to stock compensation plans | — | | | 30.6 | | | — | | | 23.0 | | | — | | | 53.6 | |
| Treasury stock acquired (2.5 shares repurchased) | — | | | — | | | — | | | (383.8) | | | — | | | (383.8) | |
| Dividends declared ($0.91 per share) | — | | | — | | | (392.0) | | | — | | | — | | | (392.0) | |
| | | | | | | | | | | |
| Balance at March 31, 2020 | $ | 63.9 | | | $ | 1,315.1 | | | $ | 18,416.5 | | | $ | (14,070.4) | | | $ | (234.4) | | | $ | 5,490.7 | |
| | | | | | | | | | | | | | | | | | | | | | | | | | | | | | | | | | | |
| Three Months Ended |
| December 31, 2020 |
| Common Stock | | Capital in Excess of Par Value | | Retained Earnings | | Treasury Stock | | AOCI | | Total |
| Balance at September 30, 2020 | $ | 63.9 | | | $ | 1,348.4 | | | $ | 18,644.7 | | | $ | (14,264.0) | | | $ | 15.9 | | | $ | 5,808.9 | |
| Net earnings | — | | | — | | | 647.5 | | | — | | | — | | | 647.5 | |
| Other comprehensive income | — | | | — | | | — | | | — | | | 24.4 | | | 24.4 | |
| Stock-based compensation expense | — | | | 40.6 | | | — | | | — | | | — | | | 40.6 | |
| Issuances relating to stock compensation plans | — | | | 18.6 | | | — | | | 17.7 | | | — | | | 36.3 | |
| Treasury stock acquired (1.6 million shares repurchased) | — | | | — | | | — | | | (259.1) | | | — | | | (259.1) | |
| Dividends declared ($0.93 per share) | — | | | — | | | (398.6) | | | — | | | — | | | (398.6) | |
| | | | | | | | | | | |
| Balance at December 31, 2020 | $ | 63.9 | | | $ | 1,407.6 | | | $ | 18,893.6 | | | $ | (14,505.4) | | | $ | 40.3 | | | $ | 5,900.0 | |
| | | | | | | | | | | | | | | | | | | | | | | | | | | | | | | | | | | |
| Three Months Ended | | | | | | | | | | |
| March 31, 2019 | | | | | | | | | | |
| Common Stock | | Capital in Excess of Par Value | | Retained Earnings | | Treasury Stock | | AOCI | | Total |
| Balance at December 31, 2018 | $ | 63.9 | | | $ | 1,076.1 | | | $ | 16,959.1 | | | $ | (12,720.2) | | | $ | (615.0) | | | $ | 4,763.9 | |
| Net earnings | — | | | — | | | 753.7 | | | — | | | — | | | 753.7 | |
| Other comprehensive income | — | | | — | | | — | | | — | | | 203.1 | | | 203.1 | |
| Stock-based compensation expense | — | | | 35.8 | | | — | | | — | | | — | | | 35.8 | |
| Issuances relating to stock compensation plans | — | | | 28.3 | | | — | | | 33.6 | | | — | | | 61.9 | |
| Treasury stock acquired (1.6 shares repurchased) | — | | | — | | | — | | | (228.0) | | | — | | | (228.0) | |
| Dividends declared ($0.79 per share) | — | | | — | | | (344.2) | | | — | | | — | | | (344.2) | |
| | | | | | | | | | | |
| Balance at March 31, 2019 | $ | 63.9 | | | $ | 1,140.2 | | | $ | 17,368.6 | | | $ | (12,914.6) | | | $ | (411.9) | | | $ | 5,246.2 | |
| | | | | | | | | | | | | | | | | | | | | | | | | | | | | | | | | | | |
| Nine Months Ended | | | | | | | | | | |
| March 31, 2020 | | | | | | | | | | |
| Common Stock | | Capital in Excess of Par Value | | Retained Earnings | | Treasury Stock | | AOCI | | Total |
| Balance at June 30, 2019 | $ | 63.9 | | | $ | 1,183.2 | | | $ | 17,500.6 | | | $ | (13,090.5) | | | $ | (257.3) | | | $ | 5,399.9 | |
| Net earnings | — | | | — | | | 2,054.9 | | | — | | | — | | | 2,054.9 | |
| Other comprehensive income | — | | | — | | | — | | | — | | | 22.9 | | | 22.9 | |
| Stock-based compensation expense | — | | | 98.1 | | | — | | | — | | | — | | | 98.1 | |
| Issuances relating to stock compensation plans | — | | | 33.8 | | | — | | | 107.9 | | | — | | | 141.7 | |
| Treasury stock acquired (6.2 shares repurchased) | — | | | — | | | — | | | (1,087.8) | | | — | | | (1,087.8) | |
| Dividends declared ($2.61 per share) | — | | | — | | | (1,132.1) | | | — | | | — | | | (1,132.1) | |
| Other | — | | | — | | | (6.9) | | | — | | | — | | | (6.9) | |
| Balance at March 31, 2020 | $ | 63.9 | | | $ | 1,315.1 | | | $ | 18,416.5 | | | $ | (14,070.4) | | | $ | (234.4) | | | $ | 5,490.7 | |
| | | Nine Months Ended | | | Three Months Ended |
| | March 31, 2019 | | | December 31, 2019 |
| | Common Stock | | Capital in Excess of Par Value | | Retained Earnings | | Treasury Stock | | AOCI | | Total | | Common Stock | | Capital in Excess of Par Value | | Retained Earnings | | Treasury Stock | | AOCI | | Total |
| Balance at June 30, 2018 | $ | 63.9 | | | $ | 1,014.8 | | | $ | 16,546.6 | | | $ | (12,209.6) | | | $ | (679.8) | | | $ | 4,735.9 | | |
| Balance at September 30, 2019 | | Balance at September 30, 2019 | $ | 63.9 | | | $ | 1,213.7 | | | $ | 17,729.6 | | | $ | (13,412.6) | | | $ | (233.9) | | | $ | 5,360.7 | |
| Net earnings | Net earnings | — | | | — | | | 1,817.4 | | | — | | | — | | | 1,817.4 | | Net earnings | — | | | — | | | 651.6 | | | — | | | — | | | 651.6 | |
| Other comprehensive income | Other comprehensive income | — | | | — | | | — | | | — | | | 267.9 | | | 267.9 | | Other comprehensive income | — | | | — | | | — | | | — | | | 2.7 | | | 2.7 | |
| Stock-based compensation expense | Stock-based compensation expense | — | | | 105.4 | | | — | | | — | | | — | | | 105.4 | | Stock-based compensation expense | — | | | 31.3 | | | — | | | — | | | — | | | 31.3 | |
| Issuances relating to stock compensation plans | Issuances relating to stock compensation plans | — | | | 20.0 | | | — | | | 117.1 | | | — | | | 137.1 | | Issuances relating to stock compensation plans | — | | | 8.7 | | | — | | | 14.5 | | | — | | | 23.2 | |
| Treasury stock acquired (5.4 shares repurchased) | — | | | — | | | — | | | (822.1) | | | — | | | (822.1) | | |
| Dividends declared ($2.27 per share) | — | | | — | | | (995.4) | | | — | | | — | | | (995.4) | | |
| Treasury stock acquired (1.8 million shares repurchased) | | Treasury stock acquired (1.8 million shares repurchased) | — | | | — | | | — | | | (311.5) | | | — | | | (311.5) | |
| Dividends declared ($0.91 per share) | | Dividends declared ($0.91 per share) | — | | | — | | | (393.6) | | | — | | | — | | | (393.6) | |
| | Balance at March 31, 2019 | $ | 63.9 | | | $ | 1,140.2 | | | $ | 17,368.6 | | | $ | (12,914.6) | | | $ | (411.9) | | | $ | 5,246.2 | | |
| Balance at December 31, 2019 | | Balance at December 31, 2019 | $ | 63.9 | | | $ | 1,253.7 | | | $ | 17,987.6 | | | $ | (13,709.6) | | | $ | (231.2) | | | $ | 5,364.4 | |
| | | | | | | | | | | | | | | | | | | | | | | | | | | | | | | | | | | |
| Six Months Ended |
| December 31, 2020 |
| Common Stock | | Capital in Excess of Par Value | | Retained Earnings | | Treasury Stock | | AOCI | | Total |
| Balance at June 30, 2020 | $ | 63.9 | | | $ | 1,333.8 | | | $ | 18,436.3 | | | $ | (14,067.0) | | | $ | (14.8) | | | $ | 5,752.2 | |
| Net earnings | — | | | — | | | 1,249.6 | | | — | | | — | | | 1,249.6 | |
| Other comprehensive income | — | | | — | | | — | | | — | | | 55.1 | | | 55.1 | |
| Stock-based compensation expense | — | | | 75.7 | | | — | | | — | | | — | | | 75.7 | |
| Issuances relating to stock compensation plans | — | | | (1.9) | | | — | | | 83.0 | | | — | | | 81.1 | |
| Treasury stock acquired (3.2 million shares repurchased) | — | | | — | | | — | | | (521.4) | | | — | | | (521.4) | |
| Dividends declared ($1.84 per share) | — | | | — | | | (792.3) | | | — | | | — | | | (792.3) | |
| | | | | | | | | | | |
| Balance at December 31, 2020 | $ | 63.9 | | | $ | 1,407.6 | | | $ | 18,893.6 | | | $ | (14,505.4) | | | $ | 40.3 | | | $ | 5,900.0 | |
| | | | | | | | | | | | | | | | | | | | | | | | | | | | | | | | | | | |
| Six Months Ended |
| December 31, 2019 |
| Common Stock | | Capital in Excess of Par Value | | Retained Earnings | | Treasury Stock | | AOCI | | Total |
| Balance at June 30, 2019 | $ | 63.9 | | | $ | 1,183.2 | | | $ | 17,500.6 | | | $ | (13,090.5) | | | $ | (257.3) | | | $ | 5,399.9 | |
| Net earnings | — | | | — | | | 1,234.0 | | | — | | | — | | | 1,234.0 | |
| Other comprehensive income | — | | | — | | | — | | | — | | | 26.1 | | | 26.1 | |
| Stock-based compensation expense | — | | | 67.3 | | | — | | | — | | | — | | | 67.3 | |
| Issuances relating to stock compensation plans | — | | | 3.2 | | | — | | | 84.9 | | | — | | | 88.1 | |
| Treasury stock acquired (3.7 million shares repurchased) | — | | | — | | | — | | | (704.0) | | | — | | | (704.0) | |
| Dividends declared ($1.70 per share) | — | | | — | | | (740.2) | | | — | | | — | | | (740.2) | |
| Other | — | | | — | | | (6.8) | | | — | | | — | | | (6.8) | |
| Balance at December 31, 2019 | $ | 63.9 | | | $ | 1,253.7 | | | $ | 17,987.6 | | | $ | (13,709.6) | | | $ | (231.2) | | | $ | 5,364.4 | |
Note 15. Reclassifications out of Accumulated Other Comprehensive Income (“AOCI”)
Changes in AOCI by component are as follows:
| | | Three Months Ended | | | Three Months Ended |
| | March 31, 2020 | | | December 31, 2020 |
| | Currency Translation Adjustment | | Net Gains/Losses on Available-for-sale Securities | | Cash Flow Hedging Activities | | Pension Liability | | | Accumulated Other Comprehensive Loss | | Currency Translation Adjustment | | Net Gains/Losses on Available-for-sale Securities | | Cash Flow Hedging Activities | | Pension Liability | | | Accumulated Other Comprehensive (Loss) /Income |
| Balance at December 31, 2019 | $ | (283.8) | | | $ | 264.6 | | | $ | 0.5 | | | $ | (212.5) | | | | $ | (231.2) | | |
| Balance at September 30, 2020 | | Balance at September 30, 2020 | $ | (271.8) | | | $ | 661.1 | | | $ | (32.2) | | | $ | (341.2) | | | | $ | 15.9 | |
| Other comprehensive (loss)/income before reclassification adjustments | Other comprehensive (loss)/income before reclassification adjustments | (68.4) | | | 139.3 | | | (38.2) | | | — | | | | 32.7 | | Other comprehensive (loss)/income before reclassification adjustments | 61.9 | | | (44.1) | | | 0 | | | 0 | | | | 17.8 | |
| Tax effect | Tax effect | — | | | (32.2) | | | 9.5 | | | — | | | | (22.7) | | Tax effect | 0 | | | 10.0 | | | 0 | | | 0 | | | | 10.0 | |
Reclassification adjustments to
net earnings | Reclassification adjustments to
net earnings | — | | | (2.5) | | (A) | — | | | (15.0) | | (B) | | (17.5) | | Reclassification adjustments to net earnings | 0 | | | (7.7) | | (A) | 1.1 | | (C) | 2.5 | | (B) | | (4.1) | |
| Tax effect | Tax effect | — | | | 0.6 | | | — | | | 3.7 | | | | 4.3 | | Tax effect | 0 | | | 1.7 | | | (0.4) | | | (0.6) | | | | 0.7 | |
| | Balance at March 31, 2020 | $ | (352.2) | | | $ | 369.8 | | | $ | (28.2) | | | $ | (223.8) | | | | $ | (234.4) | | |
| Balance at December 31, 2020 | | Balance at December 31, 2020 | $ | (209.9) | | | $ | 621.0 | | | $ | (31.5) | | | $ | (339.3) | | | | $ | 40.3 | |
| | | Three Months Ended | | | Three Months Ended |
| | March 31, 2019 | | | December 31, 2019 |
| | Currency Translation Adjustment | | Net Gains/Losses on Available-for-sale Securities | | Pension Liability | | Accumulated Other Comprehensive Loss | | Currency Translation Adjustment | | Net Gains/Losses on Available-for-sale Securities | | Cash Flow Hedging Activities | | Pension Liability | | Accumulated Other Comprehensive (Loss) /Income |
| Balance at December 31, 2018 | $ | (274.6) | | | $ | (181.5) | | | $ | (158.9) | | | $ | (615.0) | | |
| Balance at September 30, 2019 | | Balance at September 30, 2019 | $ | (318.1) | | | $ | 298.1 | | | $ | 0 | | | $ | (213.9) | | | $ | (233.9) | |
| Other comprehensive (loss)/income before reclassification adjustments | Other comprehensive (loss)/income before reclassification adjustments | (2.3) | | | 259.0 | | | — | | | 256.7 | | Other comprehensive (loss)/income before reclassification adjustments | 34.3 | | | (35.5) | | | 0.7 | | | 0 | | | (0.5) | |
| Tax effect | Tax effect | — | | | (58.0) | | | — | | | (58.0) | | Tax effect | 0 | | | 7.5 | | | (0.2) | | | 0 | | | 7.3 | |
| Reclassification adjustments to net earnings | Reclassification adjustments to net earnings | — | | | (0.1) | | (A) | 6.1 | | (B) | 6.0 | | Reclassification adjustments to net earnings | 0 | | | (7.1) | | (A) | 0 | | | 1.9 | | (B) | (5.2) | |
| Tax effect | Tax effect | — | | | — | | | (1.6) | | | (1.6) | | Tax effect | 0 | | | 1.6 | | | 0 | | | (0.5) | | | 1.1 | |
| | Balance at March 31, 2019 | $ | (276.9) | | | $ | 19.4 | | | $ | (154.4) | | | $ | (411.9) | | |
| Balance at December 31, 2019 | | Balance at December 31, 2019 | $ | (283.8) | | | $ | 264.6 | | | $ | 0.5 | | | $ | (212.5) | | | $ | (231.2) | |
| | | | | | | | | | | | | | | | | | | | | | | | | | | | | | | |
| Six Months Ended |
| December 31, 2020 |
| Currency Translation Adjustment | | Net Gains/Losses on Available-for-sale Securities | | Cash Flow Hedging Activities | | Pension Liability | | | | Accumulated Other Comprehensive (Loss) /Income |
| Balance at June 30, 2020 | $ | (322.2) | | | $ | 680.4 | | | $ | (30.3) | | | $ | (342.7) | | | | | $ | (14.8) | |
| Other comprehensive (loss)/income before reclassification adjustments | 112.3 | | | (68.7) | | | (3.3) | | | 0 | | | | | 40.3 | |
| Tax effect | 0 | | | 15.5 | | | 0.8 | | | 0 | | | | | 16.3 | |
| Reclassification adjustments to net earnings | 0 | | | (8.0) | | (A) | 1.7 | | (C) | 5.0 | | (B) | | | (1.3) | |
| Tax effect | 0 | | | 1.8 | | | (0.4) | | | (1.6) | | | | | (0.2) | |
| | | | | | | | | | | |
| Balance at December 31, 2020 | $ | (209.9) | | | $ | 621.0 | | | $ | (31.5) | | | $ | (339.3) | | | | | $ | 40.3 | |
| | | | | | | | | | | | | | | | | | | | | | | | | | | | | | | |
| Nine Months Ended | | | | | | | | | | |
| March 31, 2020 | | | | | | | | | | |
| Currency Translation Adjustment | | Net Gains/Losses on Available-for-sale Securities | | Cash Flow Hedging Activities | | Pension Liability | | | | Accumulated Other Comprehensive Loss |
| Balance at June 30, 2019 | $ | (269.2) | | | $ | 224.6 | | | $ | — | | | $ | (212.7) | | | | | $ | (257.3) | |
| Other comprehensive (loss)/income before reclassification adjustments | (83.0) | | | 199.9 | | | (37.4) | | | — | | | | | 79.5 | |
| Tax effect | — | | | (45.4) | | | 9.2 | | | — | | | | | (36.2) | |
| Reclassification adjustments to net earnings | — | | | (11.9) | | (A) | — | | | (14.8) | | (B) | | | (26.7) | |
| Tax effect | — | | | 2.6 | | | — | | | 3.7 | | | | | 6.3 | |
| | | | | | | | | | | |
| Balance at March 31, 2020 | $ | (352.2) | | | $ | 369.8 | | | $ | (28.2) | | | $ | (223.8) | | | | | $ | (234.4) | |
| | | Nine Months Ended | | | Six Months Ended |
| | March 31, 2019 | | | December 31, 2019 |
| | Currency Translation Adjustment | | Net Gains/Losses on Available-for-sale Securities | | Pension Liability | | Accumulated Other Comprehensive Loss | | Currency Translation Adjustment | | Net Gains/Losses on Available-for-sale Securities | | Cash Flow Hedging Activities | | Pension Liability | | Accumulated Other Comprehensive (Loss) /Income |
| Balance at June 30, 2018 | $ | (227.0) | | | $ | (274.0) | | | $ | (178.8) | | | $ | (679.8) | | |
| Balance at June 30, 2019 | | Balance at June 30, 2019 | $ | (269.2) | | | $ | 224.6 | | | $ | 0 | | | $ | (212.7) | | | $ | (257.3) | |
| Other comprehensive (loss)/income before reclassification adjustments | Other comprehensive (loss)/income before reclassification adjustments | (49.9) | | | 377.0 | | | — | | | 327.1 | | Other comprehensive (loss)/income before reclassification adjustments | (14.6) | | | 60.6 | | | 0.7 | | | 0 | | | 46.7 | |
| Tax effect | Tax effect | — | | | (84.8) | | | — | | | (84.8) | | Tax effect | 0 | | | (13.3) | | | (0.2) | | | 0 | | | (13.5) | |
| Reclassification adjustments to net earnings | Reclassification adjustments to net earnings | — | | | 1.4 | | (A) | 32.5 | | (B) | 33.9 | | Reclassification adjustments to net earnings | 0 | | | (9.4) | | (A) | 0 | | | 0.2 | | (B) | (9.2) | |
| Tax effect | Tax effect | — | | | (0.2) | | | (8.1) | | | (8.3) | | Tax effect | 0 | | | 2.1 | | | 0 | | | 0 | | | 2.1 | |
| | Balance at March 31, 2019 | $ | (276.9) | | | $ | 19.4 | | | $ | (154.4) | | | $ | (411.9) | | |
| Balance at December 31, 2019 | | Balance at December 31, 2019 | $ | (283.8) | | | $ | 264.6 | | | $ | 0.5 | | | $ | (212.5) | | | $ | (231.2) | |
(A) Reclassification adjustments out of AOCI are included within Other income,(income)/expense, net, on the Statements of Consolidated Earnings.
(B) Reclassification adjustments out of AOCI are included in net pension (income)/expense (see Note 11). The three and nine months ended March 31, 2020, include $17.0 million of prior service credits which were recognized as a component of net pension expense as a result of the US pension plan freeze.
(C) Reclassification adjustments out of AOCI are included in Interest expense on the Statements of Consolidated Earnings (see Note 10).
Note 16. Interim Financial Data by Segment
Based upon similar economic and operational characteristics, the Company’s strategic business units have been aggregated into the following 2 reportable segments: Employer Services and PEO Services. The primary components of the “Other” segment are certain corporate overhead charges and expenses that have not been allocated to the reportable segments, including corporate functions, costs related to our transformation office, severance costs, non-recurring gains and losses, the elimination of intercompany transactions, and interest expense. Certain revenues and expenses are charged to the reportable segments at a standard rate for management reasons. Other costs are recorded based on management responsibility. Beginning in the first quarter of fiscal 2020, theThe Company made changes to the allocation methodology for certain corporate allocations, in both the current period and the prior period in the table below, which did not materially affect reportable segment results. In addition, the segment results in the table below reflect the impact of the revision to PEO revenues for comparability. Refer to Note 1 to our Consolidated Financial Statements for more information on this revision.
Segment Results:
| | | | | | | | | | | | | | | | | | | | | | | |
| | Revenues |
| Three Months Ended | | Six Months Ended |
| December 31, | | December 31, |
| | 2020 | | 2019 | | 2020 | | 2019 |
| Employer Services | $ | 2,510.6 | | | $ | 2,537.5 | | | $ | 4,887.4 | | | $ | 4,978.9 | |
| PEO Services | 1,186.1 | | | 1,134.7 | | | 2,282.0 | | | 2,191.5 | |
| Other | (1.0) | | | (2.7) | | | (2.9) | | | (5.2) | |
| $ | 3,695.7 | | | $ | 3,669.5 | | | $ | 7,166.5 | | | $ | 7,165.2 | |
| | | | | | | | | | | | | | | | | | | | | | | |
| | Earnings before Income Taxes |
| | Three Months Ended | | Six Months Ended |
| December 31, | | December 31, |
| | 2020 | | 2019 | | 2020 | | 2019 |
| Employer Services | $ | 758.6 | | | $ | 766.3 | | | $ | 1,447.8 | | | $ | 1,445.7 | |
| PEO Services | 187.4 | | | 168.0 | | | 346.8 | | | 317.3 | |
| Other | (113.4) | | | (98.8) | | | (196.8) | | | (188.4) | |
| $ | 832.6 | | | $ | 835.5 | | | $ | 1,597.8 | | | $ | 1,574.6 | |
Segment Results:
| | | | | | | | | | | | | | | | | | | | | | | |
| | Revenues | | | | | | |
| Three Months Ended | | | | Nine Months Ended | | |
| March 31, | | | | March 31, | | |
| | 2020 | | 2019 | | 2020 | | 2019 |
| Employer Services | $ | 2,811.7 | | | $ | 2,719.1 | | | $ | 7,790.6 | | | $ | 7,507.7 | |
| PEO Services | 1,238.3 | | | 1,115.5 | | | 3,429.8 | | | 3,135.1 | |
| Other | (2.2) | | | (6.4) | | | (7.4) | | | (11.9) | |
| $ | 4,047.8 | | | $ | 3,828.2 | | | $ | 11,213.0 | | | $ | 10,630.9 | |
| | | | | | | | | | | | | | | | | | | | | | | |
| | Earnings before Income Taxes | | | | | | |
| | Three Months Ended | | | | Nine Months Ended | | |
| March 31, | | | | March 31, | | |
| | 2020 | | 2019 | | 2020 | | 2019 |
| Employer Services | $ | 1,025.0 | | | $ | 963.1 | | | $ | 2,473.4 | | | $ | 2,335.9 | |
| PEO Services | 172.6 | | | 154.7 | | | 488.1 | | | 455.7 | |
| Other | (120.9) | | | (133.3) | | | (310.2) | | | (419.3) | |
| $ | 1,076.7 | | | $ | 984.5 | | | $ | 2,651.3 | | | $ | 2,372.3 | |
Note 17. Subsequent Events
In April 2020, the Company made a decision to sell certain available-for-sale securities in the funds held for clients as the Company anticipates client fund obligations will decline due to reduction in employment levels from a slowdown in the economy as a result of the coronavirus ("COVID-19") pandemic. To maintain the size of the funds held for clients in line with client fund obligations, the Company will reduce its holdings of available-for-sale securities in the funds held for clients. As of May 1, 2020, the Company sold approximately $1.3 billion of its available-for-sale securities, resulting in a net realized gain of $0.7 million.
The Company continues to evaluate the impact of COVID-19 on its operations and financial condition through the filing of this Form 10-Q and has determined there are no required updates to our disclosures.
Item 2. Management's Discussion and Analysis of Financial Condition and Results of Operations
(Tabular dollars are presented in millions, except per share amounts)
FORWARD-LOOKING STATEMENTS
This document and other written or oral statements made from time to time by Automatic Data Processing, Inc. and, its subsidiaries and variable interest entity (“ADP” or “the Company”the “Company”) may contain “forward-looking statements” within the meaning of the Private Securities Litigation Reform Act of 1995. Statements that are not historical in nature and which may be identified by the use of words like “expects,” “assumes,” “projects,” “anticipates,” “estimates,” “we believe,” “could” and other words of similar meaning, are forward-looking statements. These statements are based on management’s expectations and assumptions and depend upon or refer to future events or conditions and are subject to risks and uncertainties that may cause actual results to differ materially from those expressed. Factors that could cause actual results to differ materially from those contemplated by the forward-looking statements or that could contribute to such difference include: ADP's success in obtaining and retaining clients, and selling additional services to clients; the pricing of products and services; the success of our new solutions; compliance with existing or new legislation or regulations; changes in, or interpretations of, existing legislation or regulations; overall market, political and economic conditions, including interest rate and foreign currency trends; competitive conditions; our ability to maintain our current credit ratings and the impact on our funding costs and profitability; security or cyber breaches, fraudulent acts, and system interruptions and failures; employment and wage levels; changes in technology; availability of skilled technical associates; the impact of new acquisitions and divestitures; the adequacy, effectiveness and success of our business transformation initiatives; and the impact of and uncertainties related to major natural disasters or catastrophic events, including the coronavirus ("COVID-19") pandemic. ADP disclaims any obligation to update any forward-looking statements, whether as a result of new information, future events, or otherwise, except as required by law. These risks and uncertainties, along with the risk factors discussed under “Item 1A. - Risk Factors” in our Annual Report on Form 10-K for the fiscal year ended June 30, 20192020 (“fiscal 2019”2020”) and within this Form 10-Q,, and in other written or oral statements made from time to time by ADP, should be considered in evaluating any forward-looking statements contained herein.
NON-GAAP FINANCIAL MEASURES
In addition to our U.S. GAAP results, we use adjusted results and other non-GAAP metrics to evaluate our operating performance in the absence of certain items and for planning and forecasting of future periods. Adjusted EBIT, adjusted EBIT margin, adjusted net earnings, adjusted diluted earnings per share, adjusted effective tax rate and organic constant currency are all non-GAAP financial measures. Please refer to the accompanying financial tables in the “Non-GAAP Financial Measures” section for a discussion of why ADP believes these measures are important and for a reconciliation of non-GAAP financial measures to their comparable GAAP financial measures.
EXECUTIVE OVERVIEW
In MarchHighlights from the six months ended December 31, 2020 the World Health Organization declared the outbreak of COVID-19 as a pandemic. As the situation has developed over the past few months, our priority has been and continues to be the safety of our associates as well as the needs of our clients. As a result, we implemented our Business Continuity Plan and took steps to shift over 98% of our workforce to work from home or off-site locations to ensure uninterrupted service to our clients across our solutions. In addition, on March 22, 2020, we announced for our employees, excluding corporate officers, a one-time global associate assistance payment of $1,000 (or equivalent, based on the average wage parity in each country) in response to COVID-19, totaling $50.4 million, which was not contemplated in our outlook issued on January 29, 2020. This one-time global associate assistance payment was made pursuant to the Stafford Disaster Relief and Emergency Assistance Act, and is tax-free to associates in the United States and tax-deductible to ADP. We are also deeply embedded in our local communities and continue to support COVID-19 relief efforts through financial donations and donations of medical supplies for hospital workers globally.include:
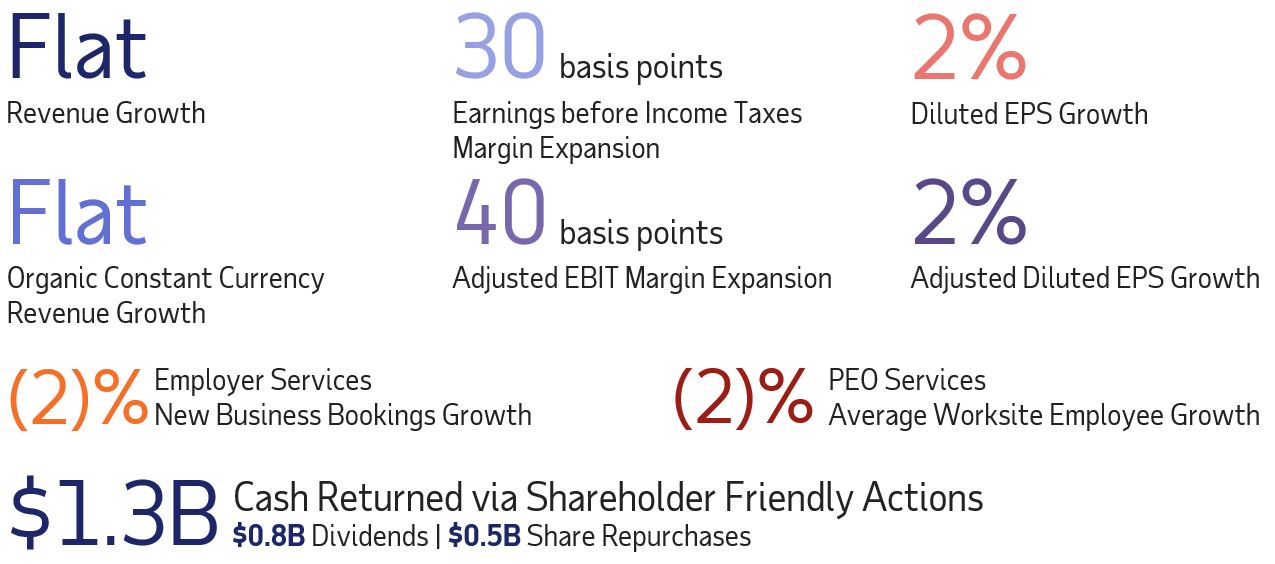
AsWe are a leading global provider of cloud-based Human Capital Management (“HCM”) technology solutions to employers around the world, weworld. The global COVID-19 pandemic has had a significant impact on the global business environment and on our clients, but our priority has been and continues to be the safety of our associates and the needs of our clients. We have continued to processprovide HCM services, including the processing of payroll and tax obligations, and provide other HCM services to our clients despite the unexpected challenges that our clients and their employees around the world are facing.during this time. ADP's efforts have also been focused on providing information and tools to help clients understand and navigate the governmental relief that has been adopted globally. For example,In addition, we released a Return to Workplace solution that assists our clients in bringing their employees back to work safely through a comprehensive set of tools designed to streamline the federal governmententire process.
We are executing well considering the on-going headwinds related to COVID-19 and our momentum continued to build this quarter as economic activity continued to trend positively. Our pays per control metric, which represents the number of employees on ADP clients' payrolls in the United States enacted the Families First Coronavirus Response Act ("FFCRA") and the Coronavirus Aid, Relief, and Economic Security ("CARES") Act. ADP has been working non-stop to provide support for all employers on the relief available under both laws. This includes an Employer Preparedness Toolkit that helps explain the federal and state government relief, as well as a website dedicated to providing critical information about the Small Business Administration Paycheck Protection Program ("PPP"). Additionally, ADP has prepared reports and added
custom paycodes globally to help clients comply with regulatory changes and stimulus plans. Further, ADP call volumes increased significantly beginning in March with clients seeking assistancewhen measured on a varietysame-store-sales basis for a subset of matters. Asclients ranging from small to large businesses, showed a decline of 7% in the global economy continues to evolve for our clients, whether due to legislative changes or other factors, ADP is committed to supporting our clients to help them navigate these challenges.
The significant impactsix months ended December 31, 2020; however, we've seen an improvement sequentially with a decline of 6% in the COVID-19 pandemic is having on our clients and the broader economy is in turn having an effect on our reported metrics, and in a much more abrupt fashion asthree months ended December 31, 2020 compared to previous macroeconomic slowdowns.a decline of 9% in the three months ended September 30, 2020. For Employer Services New Business Bookings, iswe are down 9% and 1%2% for the three and ninesix months ended MarchDecember 31, 2020, respectively, asnearly matching the prior fiscal year's first half performance despite the very difficult environment. For the six months ended December 31, 2020, the PEO average number of Worksite Employees decreased 2%. Despite the decline for the six months ended December 31, 2020, we saw bookings decline significantly and rapidly in mid-March duehave seen some improvements compared to the global social distancing guidelines coupled with the delayed decision making of our clients and prospects.first quarter. The PEO average number of Worksite Employees increased 7%decreased 2% for the three and nine months ended MarchDecember 31, 2020, respectively; however, we are expecting slower growthcompared to a decrease of 3% in the fourth quarter duethree months ended September 30, 2020. Further, even with the operating challenges brought about by the pandemic, we continue to layoffsmove forward with our digital and furloughs at our clientsprocurement transformation initiatives, which helped us deliver profit growth and an anticipated increase in out-of-business losses. Our pays per control metric, which represents growth of the employee base for a large portion of our client base, showed a decline in March resulting in deceleration of growth to 1.9% and 2.2%margin expansion for the three and ninesix months ended MarchDecember 31, 2020, respectively. We expect further deterioration in our pays per control in the fourth quarter. In addition, though we had continued strong retention as of March 31, 2020, we are expecting deterioration in retention in the fourth quarter due to an increase in out-of-business losses. These trends are anticipated to have an adverse impact on our future financial results. See Risk Factors identified in Part II, Item 1A "Risk Factors" in this Form 10-Q, for further discussion of the possible impact of the COVID-19 pandemic on our business.2020.
Highlights from the nine months ended March 31, 2020 include:
| | | | | | | | | | | | | | | | | |
| Employer Services New Business Bookings | | | PEO Average Number of Worksite Employees | | |
| â | 1% | | | á | 7% | | to 579,000 | |
| | | | | |
| | | | | | | | | | | | | | | | | | | | |
Revenues | | | | Revenues | | |
á | 5% to | | $11.2 billion | | | á | 6% organic constant currency | | |
| | | | | | |
| | | | | | | | | | | | | | | | | | | | |
| EBIT Margin | | | | Adjusted EBIT Margin | | |
| á | 130 basis points to | | 23.6% | | | á | 70 basis points to | | 24.0% | |
| | | | | | |
| | | | | | | | | | | | | | | | | | | | |
| Diluted earnings per share ("EPS") | | | | Adjusted diluted EPS | | |
| á | 14% to | | $4.74 | | | á | 11% to | | $4.77 | |
| | | | | | |
| Our shareholder friendly actions continued as we returned approximately: | | | | | | |
| $1,080 million | | | | | $1,010 million | | | |
| via dividends | | | | via share repurchases | | |
| | | | | | |
While the challenges presented by COVID-19 may affect the timing of our execution of parts of our strategy, we remain on a transformation journey, and our initiatives are yielding efficiencies and are focused on changing how we work. We continued to deliver balanced revenue and profit growth during the nine months ended March 31, 2020. We will continue to monitor macro trends based on externaldrive innovation by anticipating our clients' evolving needs and internal available dataalways designing for people as the world of work changes. We lead the HCM industry by driving growth through our strategic, cloud-based HCM solutions and are usingdeveloping innovations like our next gen platforms. We further enable these indicatorssolutions by supplementing them with organic, differentiated investments such as the ADP Marketplace and ADP Datacloud, and through our compliance expertise. The recognition we have received in the market for our next gen payroll platform and in winning the 2020 HR Executive 'Top HR Product' award reflect our commitment to drive real-time decisions as we remain committed toinnovation and strong execution by our long-term strategy.associates.
We have a strong business model, a highly cash generative business with low capital intensity, and sellwe offer a suite of products that provide critical HCM support to our clients’ HR and management functions.clients. We generate sufficient free cash flow to satisfy our cash dividend and our modest debt obligations, and our cash dividend which enables us to absorb the impact of downturns and keepremain steadfast in our reinvestments,product investments, our longer term strategy, and our commitments to shareholder friendly actions. We are committed to building upon our past successes by investing in our business through enhancements in research and development and by driving meaningful
meaningful transformation in the way we operate. operational transformation. Our financial condition remains solid at March December 31, 2020, and we remain well positioned to support our associates and our clients.clients.
RESULTS AND ANALYSIS OF CONSOLIDATED OPERATIONS
Total Revenues
For the three months and ninesix months ended March December 31, respectively:
| | | | | | | | | | | | | | | | | |
| Growth: | á | 6% | | | á | 5% | |
| Organic constant currency: | á | 6% | | | á | 6% | |
| | | | | | | | | | | | | | | | | |
| Growth: | á | 1% | | Flat |
| Organic constant currency: | | Flat | | Flat |
Revenues for the three and nine months ended MarchDecember 31, 2020 increased increased due to strong retention, new business started from New Business Bookings, an increase in zero-margin benefits pass-throughs and one percentage point of favorability from foreign currency. The increase in revenues was partially offset by one percentage point of unfavorability from our interest earned on funds held for clients discussed below and a decrease in our pays per control.
Revenues for the six months ended December 31, 2020 were flat due to strong retention, new business started from New Business Bookings and continued strong retention, partiallyan increase in zero-margin benefits pass-throughs, offset by business losses. For the nine months ended March 31, 2020, our revenue growth includes about one percentage point of unfavorability from foreign currency partially offset by benefits from acquisitions. our interest earned on funds held for clients discussed below and a decrease in our pays per control. Refer to “Analysis of Reportable Segments” for additional discussion of the increaseschanges in revenue for both of our reportable segments, Employer Services and Professional Employer Organization (“PEO”) Services.Services, respectively.
Total revenues for the three months ended MarchDecember 31, 2020 include consolidated interest on funds held for clients of $105.4 million, a $158.9 million, ass compared to $167.4$137.7 million for the three months ended MarchDecember 31, 2019. The decrease in the consolidated interest earned on funds held for clients resulted from athe decrease in theour average interest rate earned to 2.0%1.7% for the three months ended MarchDecember 31, 2020, as compared to 2.2% for the three months ended March 31, 2019. The decrease is partially offset by an increase in our average client funds balance of 4.3% to $31.3 billion for the three months ended March 31, 2020, as compared to the three months ended MarchDecember 31, 2019.
Total revenues for the ninesix months ended March December 31, 2020 include consolidated interest on funds held for clients of $430.4$211.9 million, as compared to $415.0$271.5 million for the ninesix months ended MarchDecember 31, 2019. The increase decrease in the consolidated interest earned on funds held for clients resulted from an increasethe decrease in our average interest rate earned to 1.8% for the six months ended December 31, 2020, as compared to 2.2% for the six months ended December 31, 2019 coupled with a decrease in our average client funds balancebalances of 5.7%3.4% to $26.7$23.5 billion forfor the ninesix months ended MarchDecember 31, 2020, as compared to the ninesix months ended MarchDecember 31, 2019.
Total Expenses
| | | | | | | | | | | | | | | | | | | | | | | | | | | | | | | | | | | | | | | |
| Three Months Ended | | | | | | | | Nine Months Ended | | | | | | |
| March 31, | | | | | | | | March 31, | | | | | | |
| | 2020 | | 2019 | | %
Change | | | | 2020 | | 2019 | | %
Change | | |
| | | | | | | | | | | | | | | |
| Costs of revenues: | | | | | | | | | | | | | | | |
| Operating expenses | $ | 1,974.1 | | | $ | 1,855.3 | | | 6 | % | | | | $ | 5,597.8 | | | $ | 5,324.8 | | | 5 | % | | |
| Systems development and programming costs | 172.1 | | | 160.1 | | | 7 | % | | | | 509.0 | | | 474.2 | | | 7 | % | | |
| Depreciation and amortization | 92.9 | | | 77.2 | | | 20 | % | | | | 271.2 | | | 221.5 | | | 22 | % | | |
| Total costs of revenues | 2,239.1 | | | 2,092.6 | | | 7 | % | | | | 6,378.0 | | | 6,020.5 | | | 6 | % | | |
| Selling, general and administrative expenses | 756.6 | | | 750.4 | | | 1 | % | | | | 2,237.4 | | | 2,209.4 | | | 1 | % | | |
| Interest expense | 20.0 | | | 21.7 | | | n/m | | | | | 91.5 | | | 96.2 | | | n/m | | | |
| Total expenses | $ | 3,015.7 | | | $ | 2,864.7 | | | 5 | % | | | | $ | 8,706.9 | | | $ | 8,326.1 | | | 5 | % | | |
n/m - not meaningful | | | | | | | | | | | | | | | | | | | | | | | | | | | | | | | | | | | | | | | | | |
| Three Months Ended | | | | | | Six Months Ended | | | | |
| December 31, | | | | | December 31, | | | |
| | 2020 | | 2019 | | %
Change | | | | 2020 | | 2019 | | %
Change | | |
| | | | | | | |
| Costs of revenues: | | | | | | | | | | | | | | | |
| Operating expenses | $ | 1,847.8 | | | $ | 1,836.0 | | | 1 | % | | | | $ | 3,610.0 | | | $ | 3,623.6 | | | — | % | | |
| Systems development and programming costs | 174.5 | | | 168.7 | | | 3 | % | | | | 343.2 | | | 336.9 | | | 2 | % | | |
| Depreciation and amortization | 100.1 | | | 89.4 | | | 12 | % | | | | 203.6 | | | 178.3 | | | 14 | % | | |
| Total costs of revenues | 2,122.4 | | | 2,094.1 | | | 1 | % | | | | 4,156.8 | | | 4,138.8 | | | — | % | | |
| Selling, general and administrative expenses | 755.8 | | | 754.3 | | | — | % | | | | 1,436.9 | | | 1,480.9 | | | (3) | % | | |
| Interest expense | 13.9 | | | 31.6 | | | (56) | % | | | | 29.0 | | | 71.5 | | | (59) | % | | |
| Total expenses | $ | 2,892.1 | | | $ | 2,880.0 | | | — | % | | | | $ | 5,622.7 | | | $ | 5,691.2 | | | (1) | % | | |
For the three months ended MarchDecember 31, 2020, our totaloperating expenses increased due to thean increase in PEO Services zero-margin benefits pass-through costs a one-time global associate assistance payment in response to COVID-19 of $50.4$765.9 million ("associate assistance payment"), an increase in our allowance from $722.4 million for doubtful accounts of $26.0 millionas a result of an increase in estimated credit losses related to the impact of COVID-19 on our clients ("increase in our allowance for doubtful accounts"), an increase in sellingthree months ended December 31, 2020 and marketing expenses,2019, respectively, and an increase in amortization expense.incentive compensation costs due to decreases in the prior year. The increase wasincreases were partially offset by reduced incentive compensation costs a decrease in net charges related to our transformation initiatives, operating efficienciesfrom certain cost and headcount actions as a result of our continued successful execution onbroad-based transformation initiatives, including digital and procurement transformation initiatives (“broad-based transformation initiatives”), and excess capacity headcount actions. Additionally, increases were further offset by reduced travel expenses and decreased pension costs as a result of eliminated U.S. pension service costs with the impactJuly 1, 2020 cessation of foreign currency in tU.S. participants accruing any future service benefits (he three months ended March 31, 2020.“U.S. pension freeze”).
For the ninesix months ended MarchDecember 31, 2020, our totaloperating expenses increasedwere flat due to the increase in PEO Services zero-margin benefits pass-throughreduced costs selling and marketing expenses, an associate assistance payment, an increase in our allowance for doubtful accounts, and an increase in amortization expense. The increase was partially offset by reduced incentive compensation costs, a decrease in net charges related to our transformation initiatives, operating efficiencies as a result of our continued successful execution onbroad-based transformation initiatives, excess capacity headcount actions, reduced travel expenses, and decreased costs as a result of the impact of foreign currency U.S. pension freeze. These decreases were offset by an increase in the nine months ended March 31, 2020.
Operating expenses increased as our PEO Services zero-margin benefits pass-through costs increased to $747.9$1,507.0 million and $2,169.4 million from $665.3 million and $1,965.5from $1,421.5 million for the three and ninesix months ended MarchDecember 31, 2020 and 2019, respectively. Additionally, operating expenses increased due torespectively, and an associate assistance payment. The increase was partially offset by reducedin incentive compensation costs and impact of foreign currency in the three and nine months ended March 31, 2020.costs.
Systems development and programming costs increased for the three and ninesix months ended MarchDecember 31, 2020 due to increased investments and costs to develop, support, and maintain our products, partially offset by capitalization of costs related to our strategic projects, including our next gen platforms. Depreciation and amortization expense increased relateddue to the amortization of our acquisitions of intangibles and internally developed software and acquisitions of intangibles.software.
Selling, general and administrative expenses increasedwere flat for the three months ended MarchDecember 31, 2020 due to an increase in incentive compensation costs and investments in our allowance for doubtful accounts, increasedsales organization, offset by decreased selling expenses as a result of investments incapitalization of costs to obtain a contract under ASC 606, reduced travel expenses, reduced costs as a result of our sales forcebroad-based transformation initiatives, and an associate assistance payment. This increase was partially offset by reduced incentive compensation costs.excess capacity headcount actions for non-sales associates.
Selling, general and administrative expenses increaseddecreased for the ninesix months ended MarchDecember 31, 2020 due to increaseddecreased selling and marketing expenses as a result of investments in our sales force and our brand, an increase in our allowance for doubtful accounts and an associate assistance payment. The increase was partially offset by capitalization of costs to obtain a contract under ASC 606, reduced incentive compensationtravel expenses, reduced costsbroad-based efficiencies as a result of our broad-based transformation initiatives and excess capacity headcount actions for non-sales associates, and reduced facilities costs. The decrease was partially offset by an increase in incentive compensation costs.
Interest expense decreased for the three and six months ended December 31, 2020 due to a decrease in net charges relatedaverage interest rates for commercial paper borrowings to our transformation initiatives in0.1% and 0.1% for the nine three and six months ended MarchDecember 31, 2020.2020, respectively, as compared to 1.7% and 2.0% for the three and six months ended December 31, 2019, respectively. This was coupled with a decrease in average daily borrowings under our commercial paper program to $1.8 billion and $2.1 billion for the three and six months ended December 31, 2020, respectively, as compared to $3.5 billion and $3.7 billion for the three and six months ended December 31, 2019, respectively.
Other Income,(Income)/Expense, net
| | | | | | | | | | | | | | | | | | | | | | | | | | | | | | | | | | | |
| Three Months Ended | | | | | | Nine Months Ended | | | | |
| March 31, | | | | | | March 31, | | | | |
| 2020 | | 2019 | | $ Change | | 2020 | | 2019 | | $ Change |
| Interest income on corporate funds | $ | (12.1) | | | $ | (15.0) | | | $ | (2.9) | | | $ | (70.1) | | | $ | (71.6) | | | $ | (1.5) | |
| Realized gains on available-for-sale securities | (2.9) | | | (0.6) | | | 2.3 | | | (13.0) | | | (1.2) | | | 11.8 | |
| Realized losses on available-for-sale securities | 0.4 | | | 0.5 | | | 0.1 | | | 1.1 | | | 2.6 | | | 1.5 | |
| | | | | | | | | | | |
| Impairment of intangible assets | — | | | — | | | — | | | — | | | 12.1 | | | 12.1 | |
| Gain on sale of assets | — | | | — | | | — | | | (1.9) | | | (4.1) | | | (2.2) | |
| Gain on sale of investment | — | | | — | | | — | | | (0.2) | | | — | | | 0.2 | |
| Non-service components of pension expense, net | (30.0) | | | (5.9) | | | 24.1 | | | (61.1) | | | (5.3) | | | 55.8 | |
| Other income, net | $ | (44.6) | | | $ | (21.0) | | | $ | 23.6 | | | $ | (145.2) | | | $ | (67.5) | | | $ | 77.7 | |
| | | | | | | | | | | | | | | | | | | | | | | | | | | | | | | | | | | |
| Three Months Ended | | | | Six Months Ended | | |
| December 31, | | | | December 31, | | |
| 2020 | | 2019 | | $ Change | | 2020 | | 2019 | | $ Change |
| Interest income on corporate funds | $ | (10.4) | | | $ | (25.7) | | | $ | (15.3) | | | $ | (24.3) | | | $ | (58.0) | | | $ | (33.7) | |
| | | | | | | | | | | |
| | | | | | | | | | | |
| Realized (gains) / losses on available-for-sale securities, net | (7.7) | | | (7.1) | | | 0.6 | | | (8.0) | | | (9.4) | | | (1.4) | |
| | | | | | | | | | | |
| Impairment of assets | 2.2 | | | — | | | (2.2) | | | 5.0 | | | — | | | (5.0) | |
| Gain on sale of assets | (1.6) | | | (0.2) | | | 1.4 | | | (1.8) | | | (2.1) | | | (0.3) | |
| | | | | | | | | | | |
| Non-service components of pension income, net | (11.5) | | | (13.0) | | | (1.5) | | | (24.9) | | | (31.1) | | | (6.2) | |
| Other (income)/expense, net | $ | (29.0) | | | $ | (46.0) | | | $ | (17.0) | | | $ | (54.0) | | | $ | (100.6) | | | $ | (46.6) | |
Other income, net, increased $23.6(income)/expense, net, decreased $17.0 million and $77.7$46.6 million for the three and ninesix months ended MarchDecember 31, 2020 primarily as compared to the three and nine months ended March 31, 2019. The increase was primarilya result of a decrease in interest income on corporate funds due to the non-service components of pension expense, net during the three and nine months ended March 31, 2020. Additionally, in fiscal 2019, we wrote down $12.1 million of internally developed software which was determined to have no future use due to redundant software identified as part of an acquisition offset by the gain on sale of assets of $4.1 million in relation to the Service Alignment Initiative.lower interest rates earned.
Earnings beforeBefore Income Taxes (“EBIT”)
For the three months ended MarchDecember 31:
For the six months ended December 31:
| | | | | | | | | | | | | | |
| Growth: | á | 9% | 1% | á | 90bps 30bps |
| | | | |
Earnings before income taxes was flat for the three months ended December 31, 2020 and increased for the six months ended December 31, 2020 due to the components discussed above.
Margin decreased for the three months ended December 31, 2020 as a result of an increase in incentive compensation costs, incremental pressure from growth in our zero-margin benefits pass-throughs, and an increase in amortization expense, partially offset by reduced costs as a result of our broad-based transformation initiatives, and excess capacity headcount actions. In addition, the margin decrease was offset by decreased selling expenses, reduced travel expenses, decreased interest expense, and decreased pension costs as a result of the U.S. pension freeze.
Margin increased for the six months ended December 31, 2020 due to reduced costs as a result of our broad-based transformation initiatives and excess capacity headcount actions. In addition, our margin improvement was aided by decreased selling expenses, decreased interest expense, reduced travel expenses, decreased pension costs as a result of the U.S. pension freeze, and reduced facilities costs. These were partially offset by an increase in incentive compensation costs, incremental pressure from growth in our zero-margin benefits pass-throughs and an increase in amortization expense.
Adjusted Earnings before certain Interest and Taxes ("Adjusted EBIT")
For the three months ended December 31:
For the ninesix months ended MarchDecember 31:
Earnings before income taxes increased for the three and nine months ended March 31, 2020 due to the increases in revenues partially offset by increases in expenses discussed above.
Overall margin increased for the three and nine months ended March 31, 2020 as a result of our continued successful execution of our broad-based transformation initiatives as well as operating efficiencies. In addition, our margin improvement was aided by lower transformation initiative related charges of $11.7 million and $72.7 million for the three and nine months ended March 31, 2020, respectively, reduced incentive compensation costs and selling expenses which increased at a reduced rate. These were partially offset by incremental pressure from growth in our zero-margin benefits pass-throughs, an associate assistance payment, an increase in our allowance for doubtful accounts and amortization expense.
Adjusted EBIT
For the three months ended March 31:
For the nine months ended March 31:
Adjusted EBIT excludesand Adjusted EBIT margin exclude certain interest amounts, gain on sale of assets, net charges related to our broad-based transformation initiatives and the impact of the net severance charges as applicable in the respective periods for the three and nine months ended March 31, 2020 and 2019, reflecting a decrease in net chperiods.arges of $11.7 million and $72.7 million during the three and nine months ended March 31, 2020, respectively, as compared to the three and nine months ended March 31, 2019, respectively. For the three and nine months ended March 31, 2020, adjusted EBIT increased due to the increases in revenues offset by the increases in expenses discussed above. Our adjusted EBIT margin reflects changes described above in our EBIT margin.
Provision for Income Taxes
The effective tax rate for the three months ended MarchDecember 31, 2020 and 2019 was 23.8%22.2% and 23.4%22.0%, respectively. The
increase in the effective tax rate is primarily due to tax creditsthe benefit from a valuation allowance release related to research and development activitiesforeign tax credit carryforwards in the three months ended MarchDecember 31, 2019, andpartially offset by the benefits from a foreign withholding taxes on future distributions and an increase in reserves for uncertain tax positionselection in the three months ended March 31, 2020, partially offset by the benefits of a foreign tax law change and a reduction in the operating tax rate due to the mix between domestic and foreign earnings in the three months ended MarchDecember 31, 2020.
The effective tax rate for the ninesix months ended MarchDecember 31, 2020 and 2019 was 22.5%21.8% and 23.4%21.6%, respectively. The decreaseincrease in the effective tax rate is primarily due to the release ofbenefit from a valuation allowance release related to foreign tax creditcredits carryforwards in the six months ended December 31, 2019 and a decrease in the excess tax benefit on stock-based
reduction in the operatingcompensation, partially offset byfavorable adjustments to prior year tax rate due to the mix between domestic and foreign earningsliabilities and the benefit ofbenefits from a foreign tax law change partially offset by foreign withholding taxes on future distributions.election in the six months ended December 31, 2020.
Adjusted Provision for Income Taxes
The adjusted effective tax rate for the three months ended MarchDecember 31, 2020 and 2019 was 23.8%22.2% and 23.5%22.0%, respectively. The adjusted effective tax rate for the ninesix months ended MarchDecember 31, 2020 and 2019 was 22.5%21.8% and 23.5%21.6%, respectively. The drivers of the adjusted effective tax rate are the same as the drivers of the effective tax rate discussed above.
Net Earnings and Diluted EPS
For the three months ended MarchDecember 31:
For the ninesix months ended MarchDecember 31:
For the three and ninesix months ended MarchDecember 31, 2020, the net earnings reflect the changes described above in our earnings before income taxes and our effective tax rate.
For the three and nine months ended MarchDecember 31, 2020, diluted EPS increased as a result of fewer shares outstanding resulting from the repurchase of approximately 1.6 million shares during the three months ended December 31, 2020 and 1.8 million shares during the three months ended December 31, 2019, partially offset by the issuances of shares under our employee benefit plans and a decrease in net earnings.
For the six months ended December 31, 2020, diluted EPS increased as a result of an increase in net earnings and the impact of fewer shares outstanding resulting from the repurchase of approximaapproximattely 6.2ely 3.2 million sharesshares during the ninesix months ended MarchDecember 31, 2020 and 5.43.7 million shares forduring the ninesix months ended MarchDecember 31, 2019, partially offset by the issuances of shares under our employee benefit plans.
Adjusted Net Earnings and Adjusted Diluted EPS
For the three months ended MarchDecember 31:
For the ninesix months ended MarchDecember 31:
For the three and ninesix months ended MarchDecember 31, 2020, adjusted net earnings and adjusted diluted EPS reflect the changes in components described above in our adjusted EBIT and our adjusted effective tax rate.
For the three and nine months ended March 31, 2020, adjusted diluted EPS reflects the changes described above in our adjusted net earnings and shares outstanding.above.
ANALYSIS OF REPORTABLE SEGMENTS
| | | Revenues | | | Revenues |
| | Three Months Ended | | | % Change | | | Nine Months Ended | | | | Three Months Ended | | % Change | | Six Months Ended | |
| | March 31, | | | | | March 31, | | | % Change | | | December 31, | % Change | | December 31, | | % Change |
| | | 2020 | | 2019 | | As
Reported | | Organic constant currency | | 2020 | | 2019 | | As
Reported | | Organic constant currency | | 2020 | | 2019 | | As
Reported | | Organic constant currency | | 2020 | | 2019 | | As
Reported |
| Employer Services | Employer Services | $ | 2,811.7 | | | $ | 2,719.1 | | | 3 | % | | 4 | % | | $ | 7,790.6 | | | $ | 7,507.7 | | | 4 | % | | 4 | % | Employer Services | $ | 2,510.6 | | | $ | 2,537.5 | | | (1) | % | | (2) | % | | $ | 4,887.4 | | | $ | 4,978.9 | | | (2) | % | | (2) | % |
| PEO Services | PEO Services | 1,238.3 | | | 1,115.5 | | | 11 | % | | 11 | % | | 3,429.8 | | | 3,135.1 | | | 9 | % | | 9 | % | PEO Services | 1,186.1 | | | 1,134.7 | | | 5 | % | | 5 | % | | 2,282.0 | | | 2,191.5 | | | 4 | % | | 4 | % |
| Other | Other | (2.2) | | | (6.4) | | | n/m | | | n/m | | | (7.4) | | | (11.9) | | | n/m | | | n/m | | Other | (1.0) | | | (2.7) | | | n/m | | n/m | | (2.9) | | | (5.2) | | | n/m | | n/m |
| | | $ | 4,047.8 | | | $ | 3,828.2 | | | 6 | % | | 6 | % | | $ | 11,213.0 | | | $ | 10,630.9 | | | 5 | % | | 6 | % | | $ | 3,695.7 | | | $ | 3,669.5 | | | 1 | % | | — | % | | $ | 7,166.5 | | | $ | 7,165.2 | | | — | % | | — | % |
| | | Earnings before Income Taxes | | | Earnings before Income Taxes |
| | Three Months Ended | | | %
Change | | | Nine Months Ended | | | %
Change | | | Three Months Ended | | %
Change | | | Six Months Ended | | %
Change | |
| | March 31, | | | | | March 31, | | | | | December 31, | | %
Change | | | December 31, | | %
Change | |
| | | 2020 | | 2019 | | As Reported | | | 2020 | | 2019 | | As
Reported | | | 2020 | | 2019 | | As Reported | | | 2020 | | | As
Reported | |
| Employer Services | Employer Services | $ | 1,025.0 | | | $ | 963.1 | | | 6 | % | | | $ | 2,473.4 | | | $ | 2,335.9 | | | 6 | % | | Employer Services | $ | 758.6 | | | $ | 766.3 | | | (1) | % | | | $ | 1,447.8 | | | $ | 1,445.7 | | | — | % | |
| PEO Services | PEO Services | 172.6 | | | 154.7 | | | 12 | % | | | 488.1 | | | 455.7 | | | 7 | % | | PEO Services | 187.4 | | | 168.0 | | | 12 | % | | | 346.8 | | | 317.3 | | | 9 | % | |
| Other | Other | (120.9) | | | (133.3) | | | n/m | | | | (310.2) | | | (419.3) | | | n/m | | | Other | (113.4) | | | (98.8) | | | n/m | | | (196.8) | | | (188.4) | | | n/m | |
| | | $ | 1,076.7 | | | $ | 984.5 | | | 9 | % | | | $ | 2,651.3 | | | $ | 2,372.3 | | | 12 | % | | | $ | 832.6 | | | $ | 835.5 | | | — | % | | | $ | 1,597.8 | | | $ | 1,574.6 | | | 1 | % | |
n/m - not meaningful
Employer Services
Revenues
Revenues increasedRevenues decreased for the three months ended MarchDecember 31, 2020 due due to one percentage point of unfavorability from our interest earned on funds held for clients and decreases in our pays per control of 6%. These decreases were partially offset by strong retention, new business started from New Business Bookings and continued strong retention, partially offset by business losses and a decrease in interest earned on funds heldone percentage point of favorability from foreign currency.
Revenues decreased for clients. Our revenue growth includesthe six months ended December 31, 2020 due to one percentage point of unfavorability from foreign currency. Our revenues also increased due to an increase in the number of employees on our clients’ payrolls as our pays per control increased 1.9% for the three months ended March 31, 2020 as compared to the three months ended March 31, 2019. Our pays per control metric measures the number of employees on our clients' payrolls as measured on a same-store-sales basis utilizing a representative subset of payrolls ranging from small to large businesses that are reflective of a broad range of U.S. geographic regions.
Revenues increased for the nine months ended March 31, 2020 due to new business started from New Business Bookings and continued strong retention, partially offset by business losses. Our revenues also increased due to increased interest earned on funds held for clients as a result of growthand decreases in average client funds balances, and an increase in the number of employees on our clients’ payrolls as our pays per control inccreased 2.2% foontrol of 7%. These decreases were partially offset by strong retention and new business started from New Business Bookingr the nine months ended March 31, 2020, as compared to the nine months ended March 31, 2019.s.
Earnings before Income Taxes
Employer Services’Services' earnings before income taxes increaseddecreased for the three months ended MarchDecember 31, 2020 due to decreased revenues discussed above, partially offset by decreases in expenses. The decreases in expenses were due to reduced costs as a result of our broad-based transformation initiatives and excess capacity headcount actions. Additionally, decreases in expenses were due to a decrease in selling expenses and reduced travel expenses. These decreases in expenses were partially offset by an increase in incentive compensation costs and an increase in amortization expense.
Employer Services' earnings before income taxes was flat for the six months ended December 31, 2020 due to decreased revenues discussed above, offset by decreases in expenses. The decreases in expenses were due to reduced costs as a result of our broad-based transformation initiatives and excess capacity headcount actions. Additionally, decreases in expenses were due to a decrease in selling expenses and reduced facilities costs and reduced travel expenses. These decreases were partially offset by an increase incentive compensation costs and an increase in amortization expense.
For the three and six months ended December 31, respectively:
Employer Services' margin was flat for the three months ended December 31, 2020 due to reduced costs as a result of our broad-based transformation initiatives and excess capacity headcount actions, decreased selling expenses, and reduced travel expenses. These were offset by an increase in incentive compensation costs and an increase in amortization expense.
Employer Services' margin increased for the six months ended December 31, 2020 due to reduced costs as a result of our broad-based transformation initiatives and excess capacity headcount actions. In addition, our margin improvement was aided by decreased selling expenses, reduced facilities costs and reduced travel expenses. These were partially offset by an increase in incentive compensation costs and an increase in amortization expense.
PEO Services
Revenues
| | | | | | | | | | | | | | | | | | | | | | | | | | | | | | | | | | | | | | | | | | | | | | | |
| PEO Revenues |
| Three Months Ended | | Change | | Six Months Ended | | Change |
| December 31, | | | December 31, | |
| | 2020 | | 2019 | | $ | | % | | 2020 | | 2019 | | $ | | % |
| PEO Services' revenues | $ | 1,186.1 | | | $ | 1,134.7 | | | $ | 51.4 | | | 5 | % | | $ | 2,282.0 | | | $ | 2,191.5 | | | $ | 90.5 | | | 4 | % |
| Less: PEO zero-margin benefits pass-throughs | 765.9 | | | 722.4 | | | 43.5 | | | 6 | % | | 1,507.0 | | | 1,421.5 | | | 85.5 | | | 6 | % |
| PEO Services' revenues excluding zero-margin benefits pass-throughs | $ | 420.2 | | | $ | 412.3 | | | $ | 7.9 | | | 2 | % | | $ | 775.0 | | | $ | 770.0 | | | $ | 5.0 | | | 1 | % |
PEO Services' revenues increased 5% and 4% for the three and six months ended December 31, 2020, respectively, due to an increase in zero-margin benefits pass-throughs partially offset by a 2% decrease in the number of Average Worksite Employees for the three and six months ended December 31, 2020, respectively.
Earnings before Income Taxes
PEO Services' earnings before income taxes increased 12% and 9% for the three and six months ended December 31, 2020, respectively, due to increased revenues discussed above, offset by increased expenses due to an increase in our allowance for doubtful accounts, an increase in selling expenses as a result of investments in our sales force and amortization expense. These increases in expenses were partially offset by reduced incentive compensation costs, operating efficiencies as a result of our transformation initiatives and the impact from foreign currency.
Employer Services' earnings before income taxes increased for the nine months ended March 31, 2020 due to increased revenues discussed above, offset by increased expenses due tincreases in expenses. o an increase in selling and marketing expenses as a result of investments in our sales force and our brand, Than increase in our allowance for doubtful accounts and amortization expense. Thesee increases in expenses were related to increases in zero-margin benefits pass-through costs of $43.5 million and $85.5 million, respectively, described above, partially offset by reduced incentive compensation costs, operating efficiencies as a result ofdecreases in selling expenses. In addition, the increase in expenses for the six months ended December 31, 2020 was partially offset by changes in our transformation initiatives and the impact from foreign currency.estimated losses related to ADP Indemnity.
For the three and ninesix months ended MarchDecember 31, respectively:
| | | | | | | | | | | | | | |
| Growth: | á | 100bps | | á | | 60bps | 70bps |
EmployerPEO Services' overall margin increased for the three and nine months ended March 31, 2020 as a result of the continued successful execution of our broad-based transformation initiatives, as well as operating efficiencies, reduced incentive compensation costs and selling expenses which increased at a reduced rate. This increase was partially offset by due to an increase in our allowance for doubtful accounts and amortization expense.
PEO Services
Revenues
| | | | | | | | | | | | | | | | | | | | | | | | | | | | | | | | | | | | | | | | | | | | | | | |
| PEO Revenues | | | | | | | | | | | | | | |
| Three Months Ended | | | | Change | | | | Nine Months Ended | | | | Change | | |
| March 31, | | | | | | | | March 31, | | | | | | |
| | 2020 | | 2019 | | $ | | % | | 2020 | | 2019 | | $ | | % |
| PEO Services' revenues | $ | 1,238.3 | | | $ | 1,115.5 | | | $ | 122.8 | | | 11 | % | | $ | 3,429.8 | | | $ | 3,135.1 | | | $ | 294.7 | | | 9 | % |
| Less: PEO zero-margin benefits pass-throughs | 747.9 | | | 665.3 | | | 82.6 | | | 12 | % | | 2,169.4 | | | 1,965.5 | | | 203.9 | | | 10 | % |
| PEO Services' revenues excluding zero-margin benefits pass-throughs | $ | 490.4 | | | $ | 450.2 | | | $ | 40.2 | | | 9 | % | | $ | 1,260.4 | | | $ | 1,169.6 | | | $ | 90.8 | | | 8 | % |
PEO Services' revenues increased 11% and 9% for the three and nine months ended March 31, 2020, respectively, due to a 7%increase in the average number of Worksite Employees for the three and nine months ended March 31, 2020, respectively, driven by an increase in the number of new PEO Services clients and growth of our existing clients. PEO Services' revenue excluding zero-margin benefits pass-throughs increased 9% and 8% for the three and nine months ended March 31, 2020, respectively, and includes pressure from lower workers compensation and State Unemployment Insurance (“SUI”) costs and related pricing.
Earnings before Income Taxes
PEO Services' earnings before income taxes increased 12% for the three months ended March 31, 2020 due to the increased revenuesas discussed above offset by an increase in expenses. The increase in expenses was related to the increase in zero-margin benefits pass-through costs of $82.6 million described above as well as increased costs to service our client base.
PEO Services' earnings before income taxes increased 7% for the nine months ended March 31, 2020 due to the increased revenues discussed above offset by an increase in expenses. The increase in expenses was related to the increase in zero-margin benefits pass-through costs of $203.9 million described above, increased selling expenses andand a decrease of $2.8 million in pre-tax benefit related to ADP Indemnity in the nine months ended March 31, 2020, as compared to the nine months ended March 31, 2019.
For the three and nine months ended March 31, respectively:
PEO Services' overall margin increased due to operating and selling expense which increased at a reduced rateexpenses in the three months ended MarchDecember 31, 2020, as compared to the three months ended MarchDecember 31, 2019.
PEO Services' overall margin decreasedincreased due to increasedto an increase in revenues as discussed above, a decrease in selling expenses andand a decrease of $2.8 millionchange in pre-tax benefit fromour estimated losses related to ADP Indemnity in the ninesix months ended MarchDecember 31, 2020, as compared to the ninesix months ended MarchDecember 31, 2019.
ADP Indemnity provides workers'workers’ compensation and employer'semployer’s liability deductible reimbursement insurance protection for PEO Services' Worksite EmployeesServices’ worksite employees up to $1 million per occurrence. PEO Services has secured a workers’ compensation and employer’s liability insurance policy that has a $1 million per occurrence retention and, in fiscal years 2012 and prior, aggregate stop loss insurance that covers any aggregate losses within the $1 million retention that collectively exceed a certain level, from an admitted and licensed insurance company of AIG. The Company has obtained approximately $242 million of irrevocable standby letters of credit in favor of licensed insurance companies of AIG to secure TotalSource workers’ compensation obligations if ADP were to fail to reimburse AIG for workers’ compensation payments. The Company had no drawdowns during the nine months ended March 31, 2020 and March 31, 2019, respectively, under the letters of credit. We utilize historical loss experience and actuarial judgment to determine the estimated claim liability, and changes in estimated ultimate incurred losses are included in the PEO segment. ADP Indemnity recorded a pre-tax benefit of approximately $5.6 million and $13.6 million for the three and nine months ended March 31, 2020, compared to $6.0 million and $16.4 million for the three and nine months ended March 31, 2019. For theBeginning in fiscal yearsyear 2013, to 2019, ADP Indemnity paid premiums to enter into reinsurance arrangements with ACE American Insurance Company, a wholly-owned subsidiary of Chubb Limited, to cover substantially all losses incurred by ADP Indemnity during these policy years. Each of these reinsurance arrangements limits our overall exposure incurred up to a certain limit. We believe the likelihood of ultimate losses exceeding this limit is remote. Forremote. ADP Indemnity recorded a pre-tax benefit of approximately $4.8 million and $15.2 million for the ninethree and six months ended MarchDecember 31, 2020, respectively, compared to approximately $4.7 million and $8.1 million for the three and six months ended December 31, 2019, respectively, which were primarily a result of changes in our estimated actuarial losses. In July 2020, ADP Indemnity paid a premium of $215.0$240 million toto enter into a reinsurance arrangement with Chubb Limited to cover substantially all losses incurred by ADP Indemnity for the fiscal 20202021 policy year on terms substantially similar to the fiscal 20192020 reinsurance policy.
Other
The primary components of the “Other” segment are certain corporate overhead charges and expenses that have not been allocated to the reportable segments, including corporate functions, costs related to our transformation office, an associate assistance payment,severance costs, non-recurring gains and losses, the elimination of intercompany transactions, and other interest expense.
Non-GAAP Financial Measures
In addition to our U.S. GAAP results, we use the adjusted results and other non-GAAP metrics set forth in the table below to evaluate our operating performance in the absence of certain items and for planning and forecasting of future periods:
| | | | | | |
| Adjusted Financial Measure | U.S. GAAP Measures | |
| Adjusted EBIT | Net earnings | |
| Adjusted provision for income taxes | Provision for income taxes | |
| Adjusted net earnings | Net earnings | |
| | |
| Adjusted diluted earnings per share | Diluted earnings per share | |
| Adjusted effective tax rate | Effective tax rate | |
| | |
| Organic constant currency | Revenues | |
| | |
We believe that the exclusion of the identified items helps us reflect the fundamentals of our underlying business model and analyze results against our expectations and against prior period, and to plan for future periods by focusing on our underlying operations. We believe that the adjusted results provide relevant and useful information for investors because it allows investors to view performance in a manner similar to the method used by management and improves their ability to understand and assess our operating performance. The nature of these exclusions is for specific items that are not fundamental to our underlying business operations. Since these adjusted financial measures and other non-GAAP metrics are not measures of performance calculated in accordance with U.S. GAAP, they should not be considered in isolation from, as a substitute for, or superior to their corresponding U.S. GAAP measures, and they may not be comparable to similarly titled measures at other companies.
| | | Three Months Ended | | | % Change | | | Nine Months Ended | | | % Change | | | Three Months Ended | | % Change | | | Six Months Ended | | % Change | |
| | March 31, | | | | | | March 31, | | | | | December 31, | | % Change | | | December 31, | | % Change | |
| | 2020 | | 2019 | | As Reported | | | 2020 | | 2019 | | As Reported | | | 2020 | | 2019 | | As Reported | | | 2020 | | | As Reported | |
| | | | | | | | | | | | | | 2020 | | As Reported | | 2020 | | 2019 | | As Reported |
| Net earnings | Net earnings | | $ | 820.9 | | | $ | 753.7 | | | 9 | % | | | $ | 2,054.9 | | | $ | 1,817.4 | | | 13 | % | | Net earnings | | $ | 647.5 | | | $ | 651.6 | | | (1) | % | | | $ | 1,249.6 | | | 1 | % | |
| Adjustments: | Adjustments: | | | | | Adjustments: | | | | |
| Provision for income taxes | Provision for income taxes | | 255.8 | | | 230.8 | | | | 596.4 | | | 554.9 | | | | Provision for income taxes | | 185.1 | | | 183.9 | | | | 348.2 | | | 340.6 | | | |
| All other interest expense (a) | All other interest expense (a) | | 14.8 | | | 14.8 | | | | 44.3 | | | 44.8 | | | | All other interest expense (a) | | 13.2 | | | 14.7 | | | | 27.3 | | | 29.5 | | | |
| All other interest income (a) | All other interest income (a) | | (5.1) | | | (8.7) | | | | (18.9) | | | (22.9) | | | | All other interest income (a) | | (1.5) | | | (5.4) | | | | (3.3) | | | (13.8) | | | |
| | Gain on sale of assets | Gain on sale of assets | | — | | | — | | | | (0.2) | | | — | | | | Gain on sale of assets | | — | | | (0.2) | | | | — | | | (0.2) | | | |
| | Transformation initiatives (b) | Transformation initiatives (b) | | 11.1 | | | 22.8 | | | | 19.6 | | | 92.3 | | | | Transformation initiatives (b) | | 3.3 | | | 9.1 | | | | 4.1 | | | 8.6 | | | |
| Excess capacity severance charges (c) | | Excess capacity severance charges (c) | | 0.5 | | | — | | | | 2.9 | | | — | | | |
| | Adjusted EBIT | Adjusted EBIT | | $ | 1,097.5 | | | $ | 1,013.4 | | | 8 | % | | | $ | 2,696.1 | | | $ | 2,486.5 | | | 8 | % | | Adjusted EBIT | | $ | 848.1 | | | $ | 853.7 | | | (1) | % | | | $ | 1,628.8 | | | $ | 1,598.7 | | | 2 | % | |
| Adjusted EBIT Margin | Adjusted EBIT Margin | | 27.1 | % | | 26.5 | % | | | 24.0 | % | | 23.4 | % | | | Adjusted EBIT Margin | | 22.9 | % | | 23.3 | % | | | 22.7 | % | | 22.3 | % | | |
| | Provision for income taxes | Provision for income taxes | | $ | 255.8 | | | $ | 230.8 | | | 11 | % | | | $ | 596.4 | | | $ | 554.9 | | | 7 | % | | Provision for income taxes | | $ | 185.1 | | | $ | 183.9 | | | 1 | % | | | $ | 348.2 | | | $ | 340.6 | | | 2 | % | |
| Adjustments: | Adjustments: | | | | | Adjustments: | | | | |
| | Gain on sale of assets (c) | | — | | | — | | | | (0.1) | | | — | | | | |
| Transformation initiatives (c) | | 2.7 | | | 5.6 | | | | 4.8 | | | 22.8 | | | | |
| Gain on sale of assets (d) | | Gain on sale of assets (d) | | — | | | (0.1) | | | | — | | | (0.1) | | | |
| Transformation initiatives (d) | | Transformation initiatives (d) | | 0.8 | | | 2.3 | | | | 1.0 | | | 2.1 | | | |
| Excess capacity severance charges (d) | | Excess capacity severance charges (d) | | 0.1 | | | — | | | | 0.7 | | | — | | | |
| | Tax Cuts and Jobs Act (d) | | — | | | — | | | | — | | | 0.5 | | | | |
| | Adjusted provision for income taxes | Adjusted provision for income taxes | | $ | 258.5 | | | $ | 236.4 | | | 9 | % | | | $ | 601.1 | | | $ | 578.2 | | | 4 | % | | Adjusted provision for income taxes | | $ | 186.0 | | | $ | 186.1 | | | — | % | | | $ | 349.9 | | | $ | 342.6 | | | 2 | % | |
| Adjusted effective tax rate (e) | Adjusted effective tax rate (e) | | 23.8 | % | | 23.5 | % | | | 22.5 | % | | 23.5 | % | | | Adjusted effective tax rate (e) | | 22.2 | % | | 22.0 | % | | | 21.8 | % | | 21.6 | % | | |
| | Net earnings | Net earnings | | $ | 820.9 | | | $ | 753.7 | | | 9 | % | | | $ | 2,054.9 | | | $ | 1,817.4 | | | 13 | % | | Net earnings | | $ | 647.5 | | | $ | 651.6 | | | (1) | % | | | $ | 1,249.6 | | | $ | 1,234.0 | | | 1 | % | |
| Adjustments: | Adjustments: | | | | | Adjustments: | | | | |
| | Gain on sale of assets | Gain on sale of assets | | — | | | — | | | | (0.2) | | | — | | | | Gain on sale of assets | | — | | | (0.2) | | | | — | | | (0.2) | | | |
| Income tax provision on gain on sale of assets (c) | | — | | | — | | | | 0.1 | | | — | | | | |
| Income tax provision on gain on sale of assets (d) | | Income tax provision on gain on sale of assets (d) | | — | | | 0.1 | | | | — | | | 0.1 | | | |
| Transformation initiatives (b) | Transformation initiatives (b) | | 11.1 | | | 22.8 | | | | 19.6 | | | 92.3 | | | | Transformation initiatives (b) | | 3.3 | | | 9.1 | | | | 4.1 | | | 8.6 | | | |
| Income tax provision for transformation initiatives (c) | | (2.7) | | | (5.6) | | | | (4.8) | | | (22.8) | | | | |
| Income tax benefit for transformation initiatives (d) | | Income tax benefit for transformation initiatives (d) | | (0.8) | | | (2.3) | | | | (1.0) | | | (2.1) | | | |
| Excess capacity severance charges (c) | | Excess capacity severance charges (c) | | 0.5 | | | — | | | | 2.9 | | | — | | | |
| Income tax benefit for excess capacity severance charges (d) | | Income tax benefit for excess capacity severance charges (d) | | (0.1) | | | — | | | | (0.7) | | | — | | | |
| | Tax Cuts and Jobs Act (d) | | — | | | — | | | | — | | | (0.5) | | | | |
| | Adjusted net earnings | Adjusted net earnings | | $ | 829.3 | | | $ | 770.9 | | | 8 | % | | | $ | 2,069.6 | | | $ | 1,886.4 | | | 10 | % | | Adjusted net earnings | | $ | 650.4 | | | $ | 658.3 | | | (1) | % | | | $ | 1,254.9 | | | $ | 1,240.4 | | | 1 | % | |
| | Diluted EPS | Diluted EPS | | $ | 1.90 | | | $ | 1.73 | | | 10 | % | | | $ | 4.74 | | | $ | 4.15 | | | 14 | % | | Diluted EPS | | $ | 1.51 | | | $ | 1.50 | | | 1 | % | | | $ | 2.91 | | | $ | 2.84 | | | 2 | % | |
| Adjustments: | Adjustments: | | | | | Adjustments: | | | | |
| | Gain on sale of assets (c) | | — | | | — | | | | — | | | — | | | | |
| Transformation initiatives (b) (c) | | 0.02 | | | 0.04 | | | | 0.03 | | | 0.16 | | | | |
| Gain on sale of assets | | Gain on sale of assets | | — | | | — | | | | — | | | — | | | |
| Transformation initiatives (b) (d) | | Transformation initiatives (b) (d) | | 0.01 | | | 0.02 | | | | 0.01 | | | 0.01 | | | |
| Excess capacity severance charges (c) (d) | | Excess capacity severance charges (c) (d) | | — | | | — | | | | 0.01 | | | — | | | |
| | Tax Cuts and Jobs Act (d) | | — | | | — | | | | — | | | — | | | | |
| | Adjusted diluted EPS | Adjusted diluted EPS | | $ | 1.92 | | | $ | 1.77 | | | 8 | % | | | $ | 4.77 | | | $ | 4.31 | | | 11 | % | | Adjusted diluted EPS | | $ | 1.52 | | | $ | 1.52 | | | — | % | | | $ | 2.92 | | | $ | 2.86 | | | 2 | % | |
(a) We include the interest income earned on investments associated with our client funds extended investment strategy and interest expense on borrowings related to our client funds extended investment strategy as we believe these amounts to be fundamental to the underlying operations of our business model. The adjustments in the table above represent the interest income and interest expense that isare not related to our client funds extended investment strategy and are labeled as “All other interest expense” and “All other interest income.”
(b) TheIn the three months ended December 31, 2020, transformation initiatives include charges related to impairment charges of operating right-of-use assets and certain related fixed assets associated with the vacating of certain leased locations (“lease asset impairment”) and net charges related to severance, Voluntary Early Retirement Program (“VERP”) and other transformation initiatives. initiatives, including severance. In the six months ended December 31, 2020, transformation initiatives include charges related to impairment charges as a result of recognizing certain owned facilities at fair value given intent to sell and accordingly classified as held for sale and lease asset impairment charges partially offset by net reversals of charges related to other transformation initiatives, including severance. Unlike other
severance charges which are not included as an adjustment to get to adjusted results, these specific charges relate to actions taken as part of our broad-based, company-wide transformation initiative.
(c) Represents net severance cost related to excess capacity. Unlike certain other severance charges whichin prior periods that are not included as an adjustment to get to adjusted results, these specific charges relate to actions that are part of our broad-based, company-wide transformation initiative.initiatives to address excess capacity across our business and functions.
(c)(d) The income tax (benefit)/ provision (benefit) on transformation initiatives and gain on sale of assets was calculated based on the annualized marginal rate in effect during the quarter of the adjustment.
(d) There was no impact from the Tax Cuts and Jobs Act in the three and nine months ended March 31, 2020.
(e) The Adjusted effective tax rate is calculated as our Adjusted provision for income taxes divided by the sum of our Adjusted net earnings plus our Adjusted provision for income taxes.
The following table reconciles our reported growth rates to the non-GAAP measure of organic constant currency, which excludes the impact of acquisitions, the impact of dispositions, and the impact of foreign currency. The impact of acquisitions and dispositions is calculated by excluding the current year revenues of acquisitions until the one-year anniversary of the transaction and by excluding the prior year revenues of divestitures for the one-year period preceding the transaction. The impact of foreign currency is determined by calculating the current year result using foreign exchange rates consistent with the prior year. The PEO segment is not impacted by acquisitions, dispositions or foreign currency.
| | | Three Months Ended | | | Nine Months Ended | | | Three Months Ended | | | Six Months Ended | |
| | March 31, | | | March 31, | | | December 31, | | | December 31, | |
| | 2020 | | | 2020 | | | 2020 | | | 2020 | |
| Consolidated revenue growth as reported | Consolidated revenue growth as reported | 6 | % | | | 5 | % | | Consolidated revenue growth as reported | 1 | % | | | — | % | |
| Adjustments: | Adjustments: | | | | | Adjustments: | | | | |
| Impact of acquisitions | Impact of acquisitions | — | % | | | — | % | | Impact of acquisitions | — | % | | | — | % | |
| | Impact of foreign currency | Impact of foreign currency | — | % | | | — | % | | Impact of foreign currency | (1) | % | | | — | % | |
| Consolidated revenue growth, organic constant currency | Consolidated revenue growth, organic constant currency | 6 | % | | | 6 | % | | Consolidated revenue growth, organic constant currency | — | % | | | — | % | |
| | Employer Services revenue growth as reported | Employer Services revenue growth as reported | 3 | % | | | 4 | % | | Employer Services revenue growth as reported | (1) | % | | | (2) | % | |
| Adjustments: | Adjustments: | | | | | Adjustments: | | | | |
| Impact of acquisitions | Impact of acquisitions | — | % | | | — | % | | Impact of acquisitions | — | % | | | — | % | |
| | Impact of foreign currency | Impact of foreign currency | 1 | % | | | 1 | % | | Impact of foreign currency | -1 | % | | | — | % | |
| Employer Services revenue growth, organic constant currency | Employer Services revenue growth, organic constant currency | 4 | % | | | 4 | % | | Employer Services revenue growth, organic constant currency | (2) | % | | | (2) | % | |
FINANCIAL CONDITION, LIQUIDITY AND CAPITAL RESOURCESRESOURCES
As of MarchDecember 31, 2020, cash and cash equivalents were $1.7$1.6 billion, which were primarily invested in time deposits and money market funds.
For corporate liquidity, we expect existing cash, cash equivalents, short-term marketable securities, and cash flow from operations together with our $10.3 $9.7 billion of committedcommitted credit facilities and our ability to access both long-term and short-term debt financing from the capital markets will be adequate to meet our operating, investing, and financing activities such as our regular quarterly dividends, share repurchases, and capital expenditures for the foreseeable future. GivenOur financial condition remains solid at December 31, 2020 and we have sufficient liquidity as noted above; however, given the continuing uncertainty in the rapidly changing market and economic conditions related to the COVID-19 pandemic, we will continue to evaluate the nature and extent of the impact to our financial condition and liquidity.
For client funds liquidity, we have the ability to borrow through our financing arrangements under our U.S. short-term commercial paper program and our U.S., Canadian and United Kingdom short-term reverse repurchase agreements, together with our $10.3$9.7 billion of committed credit facilities and our ability to use corporate liquidity when necessary to meet short-term funding requirements related to client funds obligations. Please see “Quantitative and Qualitative Disclosures about Market Risk” for a further discussion of the risks, including with respect to the COVID-19 pandemic, related to our client funds extended investment strategy. See Note 9 of our Consolidated Financial Statements for a description of our short-term financing including commercial paper.
Operating, Investing and Financing Cash Flows
Our cash flows from operating, investing, and financing activities, as reflected in the Statements of Consolidated Cash Flows for the ninesix months ended MarchDecember 31, 2020 and 2019, respectively, are summarized as follows:
| | | Nine Months Ended | | | | Six Months Ended | |
| | March 31, | | | | December 31, | |
| | 2020 | | 2019 | | $ Change | | 2020 | | 2019 | | $ Change |
| Cash provided by / (used in): | Cash provided by / (used in): | | | | | | | Cash provided by / (used in): | | | | | | |
| Operating activities | Operating activities | | $ | 2,249.6 | | | $ | 1,956.0 | | | $ | 293.6 | | Operating activities | | $ | 1,188.3 | | | $ | 1,130.9 | | | $ | 57.4 | |
| Investing activities | Investing activities | | 478.6 | | | (1,197.9) | | | 1,676.5 | | Investing activities | | (949.6) | | | (124.9) | | | (824.7) | |
| Financing activities | Financing activities | | (964.0) | | | 6,945.4 | | | (7,909.4) | | Financing activities | | 8,751.5 | | | 5,525.1 | | | 3,226.4 | |
| Effect of exchange rate changes on cash, cash equivalents, restricted cash, and restricted cash equivalents | Effect of exchange rate changes on cash, cash equivalents, restricted cash, and restricted cash equivalents | | (41.4) | | | (34.1) | | | (7.3) | | Effect of exchange rate changes on cash, cash equivalents, restricted cash, and restricted cash equivalents | | 84.7 | | | (12.2) | | | 96.9 | |
| Net change in cash, cash equivalents, restricted cash, and restricted cash equivalents | Net change in cash, cash equivalents, restricted cash, and restricted cash equivalents | | $ | 1,722.8 | | | $ | 7,669.4 | | | $ | (5,946.6) | | Net change in cash, cash equivalents, restricted cash, and restricted cash equivalents | | $ | 9,074.9 | | | $ | 6,518.9 | | | $ | 2,556.0 | |
Net cash flows provided by operating activities for the nine months ended March 31, 2020 and March 31, 2019 include cash payments for reinsurance agreements of $215.0 million and $218.0 million, respectively, which represent the policy premium for the entire fiscal year. The increase in operating cash provided isincreased due to growth in our business supplemented by a growthnet favorable change in non-cash expenses within operating activities,the components of working capital as compared to the ninesix months ended MarchDecember 31, 2019.
Net cash flows from investing activities changed due to the timing of proceeds and purchases of corporate and client funds marketable securitiessecurities of $1,490.5$842.2 million, lowerlower payments made related to acquisitions of businessintangibles and intangibles partially offset by payments related to capital expenditures partially offset by lower proceeds from the sale of assets in the ninesix months ended MarchDecember 31, 2020.
Net cash flows from financing activities changed due to a net decreaseincrease in the cash flow from client fundfunds obligations of $7,260.5$2,942.7 million, whichwhich is due to the timing of impounds from our clients and payments to our clients' employees and other payees, proceeds from debt issuance, a net repayment of reverse repurchase agreements and less cash paid for share repurchases. These were partially offset by payments of debt, more cash returned to shareholders via dividends, and share repurchases and a repaymentsettlement of reverse repurchase agreements forcash flow hedges in the ninesix months ended MarchDecember 31, 2020.
We purchased 6.2approximately 3.2 million sharesshares of our common stock at an average price per share of $160.61$149.39 during the ninesix months ended MarchDecember 31, 2020, as compared to purchases of 5.43.7 million shares at an average price per share of $139.11$164.99 during the ninesix months ended MarchDecember 31, 2019. From time to time, the Company may repurchase shares of its common stock under its authorized share repurchase programs.program. The Company considers several factors in determining when to execute share repurchases, including, among other things, actual and potential acquisition activity, cash balances and cash flows, issuances due to employee benefit plan activity, and market conditions.
Capital Resources and Client Funds Obligations
We have $2.0 billion of senior unsecured notes with maturity dates in 20202025 and 2025.2030. We may from time to time revisit the long-term debt market to refinance existing debt, finance investments including acquisitions for our growth, and maintain the appropriate capital structure. However, there can be no assurance that volatility in the global capital and credit markets would not impair our ability to access these markets on terms acceptable to us, or at all. See Note 10 of our Consolidated Financial Statements for a description of our long-term financing.
Our U.S. short-term funding requirements related to client funds are sometimes obtained on an unsecured basis through the issuance of commercial paper, rather than liquidating previously-collected client funds that have already been invested in available-for-sale securities. This commercial paper program provides for the issuance of up to $10.3$9.7 billion in aggregate maturity value. Our commercial paper program is rated A-1+ by StandardStandard & Poor’s, and Prime-1 (“P-1”) by Moody’s.Moody’s and F1+ by Fitch. These ratings denote the highest quality commercial paper securities. Maturities of commercial paper can range from overnight to up to 364 days. At MarchDecember 31, 2020 and June 30, 2019,2020, the Company had no commercial paper borrowing outstanding. Details of the borrowings under the commercial paper program are as follows:
| | | Three Months Ended | | | Nine Months Ended | | | Three Months Ended | | Six Months Ended |
| | March 31, | | | March 31, | | | December 31, | | December 31, |
| | 2020 | | 2019 | | 2020 | | 2019 | | 2020 | | 2019 | | 2020 | | 2019 |
| Average daily borrowings (in billions) | Average daily borrowings (in billions) | $ | 1.2 | | | $ | 1.1 | | | $ | 2.9 | | | $ | 2.9 | | Average daily borrowings (in billions) | $ | 1.8 | | | $ | 3.5 | | | $ | 2.1 | | | $ | 3.7 | |
| Weighted average interest rates | Weighted average interest rates | 1.5 | % | | 2.4 | % | | 1.9 | % | | 2.2 | % | Weighted average interest rates | 0.1 | % | | 1.7 | % | | 0.1 | % | | 2.0 | % |
| Weighted average maturity (approximately in days) | Weighted average maturity (approximately in days) | 1 day | | 1 day | | 2 days | | 2 days | Weighted average maturity (approximately in days) | 1 day | | 2 days | | 1 day | | 2 days |
Our U.S., Canadian, and United Kingdom short-term funding requirements related to client funds obligations are sometimes obtained on a secured basis through the use of reverse repurchase agreements, which are collateralized principally by government and government agency securities, rather than liquidating previously-collected client funds that have already been invested in available-for-sale securities. These agreements generally have terms ranging from overnight to up to five business days. We have successfully borrowed through the use of reverse repurchase agreements on an as-needed basis to meet short-term funding requirements related to client funds obligations. At MarchDecember 31, 2020, there were no outstanding obligations related to reverse repurchase agreements. At June 30, 2019,2020, the Company had $262.0$13.6 million of outstanding obligations related to the reverse repurchase agreements, which were fully paid in early July 2019.agreements. Details of the reverse repurchase agreements are as follows:
| | | | | | | | | | | | | | | | | | | | | | | |
| Three Months Ended | | | | Nine Months Ended | | |
| March 31, | | | | March 31, | | |
| 2020 | | 2019 | | 2020 | | 2019 |
| Average outstanding balances | $ | 123.2 | | | $ | 93.1 | | | $ | 295.9 | | | $ | 306.1 | |
| Weighted average interest rates | 1.6 | % | | 1.8 | % | | 1.8 | % | | 1.8 | % |
| | | | | | | | | | | | | | | | | | | | | | | |
| Three Months Ended | | Six Months Ended |
| December 31, | | December 31, |
| 2020 | | 2019 | | 2020 | | 2019 |
| Average outstanding balances | $ | 83.2 | | | $ | 335.9 | | | $ | 117.8 | | | $ | 381.2 | |
| Weighted average interest rates | 0.3 | % | | 1.7 | % | | 0.3 | % | | 1.8 | % |
We vary the maturities of our committed credit facilities to limit the refinancing risk of any one facility. We have a $3.8$3.2 billion, 364-day credit agreement that matures in June 20202021 with a one year term-out option. In addition, we have a five-year $2.75 billion credit facility and a five-year $3.75 billion credit facility maturing in June 2024 and June 2023, respectively, each with an accordion feature under which the aggregate commitment can be increased by $500 million, subject to the availability of additional commitments. The primary uses of the credit facilities are to provide liquidity to the commercial paper program and funding for general corporate purposes, if necessary. We had no borrowings through MarchDecember 31, 2020 under the credit facilities. We believe that we currently meet all conditions set forth in the revolving credit agreements to borrow thereunder and we are not aware of any conditions that would prevent us from borrowing part or all of the $10.3$9.7 billion available to us under the revolving credit agreements. See Note 9 of our Consolidated Financial Statements for a description of our short-term financing including credit facilities.
Our investment portfolio does not contain any asset-backed securities with underlying collateral of sub-prime mortgages, alternative-A mortgages, sub-prime auto loans or sub-prime home equity loans, collateralized debt obligations, collateralized loan obligations, credit default swaps, derivatives, auction rate securities, structured investment vehicles or non-investment grade fixed-income securities. We own AAA-rated senior tranches of primarily fixed rate auto loan, credit card, equipment lease, and rate reduction receivables, secured predominantly by prime collateral.collateral. All collateral on asset-backed securities is performinghas performed as expected.expected through December 31, 2020. In addition, we own senior, unsecured, non-callable debt directly issued by Federal Farm Credit Banks and FederalFederal Home Loan Banks. Our client funds investment strategy is structured to allow us to average our way through an interest rate cycle by laddering the maturities of our investments out to five years (in the case of the extended portfolio) and out to ten years (in the case of the long portfolio). This investment strategy is supported by our short-term financing arrangements necessary to satisfy short-term funding requirements relating to client funds obligations. See Note 6 of our Consolidated Financial Statements for a description of our corporate investments and funds held for clients.
Capital expenditures for the ninesix months ended MarchDecember 31, 2020 were $$79.7 million133.5 million,, as compared to $116.8$94.1 million for the ninesix months ended MarchDecember 31, 2019. CapitalWe expect capital expenditures forin fiscal 2020 are expected2021 to be about $175between $150 million and $175 million, as compared to $163$168.3 million in fiscal 2019.2020.
QUANTITATIVE AND QUALITATIVE DISCLOSURES ABOUT MARKET RISK
Our overall investment portfolio is comprised of corporate investments (cash and cash equivalents, and short-term marketable securities) and client funds assets (funds that have been collected from clients but have not yet been remitted to the applicable tax authorities or client employees).
Our corporate investments are invested in cash and cash equivalents and highly liquid, investment-grade marketable securities. These assets are available for our regular quarterly dividends, share repurchases, capital expenditures and/or acquisitions, as well as other corporate operating purposes. All of our short-term fixed-income securities are classified as available-for-sale securities.
Our client funds assets are invested with safety of principal, liquidity, and diversification as the primary objectives. Consistent with those objectives, we also seek to maximize interest income and to minimize the volatility of interest income. Client funds assets are invested in highly liquid, investment-grade marketable securities, with a maximum maturity of 10 years at the time of purchase, and money market securities and other cash equivalents.
We utilize a strategy by which we extend the maturities of our investment portfolio for funds held for clients and employ short-term financing arrangements to satisfy our short-term funding requirements related to client funds obligations. Our client funds investment strategy is structured to allow us to average our way through an interest rate cycle by laddering the maturities of our investments out to five years (in the case of the extended portfolio) and out to ten years (in the case of the long portfolio). As part of our client funds investment strategy, we use the daily collection of funds from our clients to satisfy other unrelated client funds obligations, rather than liquidating previously-collected client funds that have already been invested in available-for-sale securities. In circumstances where we experience a reduction in employment levels due to a slowdown in the economy, we may make tactical decisions to sell certain securities in order to reduce the size of the funds held for clients to correspond to client fundfunds obligations. We minimize the risk of not having funds collected from a client available at the time such client’s obligation becomes due by impounding, in virtually all instances, the client’s funds in advance of the timing of payment of such client’s obligation. As a result of this practice, we have consistently maintained the required level of client funds assets to satisfy all of our obligations.
There are inherent risks and uncertainties involving our investment strategy relating to our client funds assets. Such risks include liquidity risk, including the risk associated with our ability to liquidate, if necessary, our available-for-sale securities in a timely manner in order to satisfy our client funds obligations. However, our investments are made with the safety of principal, liquidity, and diversification as the primary goals to minimize the risk of not having sufficient funds to satisfy all of our client funds obligations. We also believe we have significantly reduced the risk of not having sufficient funds to satisfy our client funds obligations by consistently maintaining access to other sources of liquidity, including our corporate cash balances, available borrowings under our $10.3$9.7 billion commercial paper program (rated A-1+ by Standard and Poor’s, and P-1 by Moody’s, and F1+ by Fitch, the highest possible short-term credit ratings), and our ability to engage in reverse repurchase agreement transactions and available borrowings under our $10.3$9.7 billion committed credit facilities. The reduced availability of financing during periods of economic turmoil, including the COVID-19 pandemic, even to borrowers with the highest credit ratings, may limit our ability to access short-term debt markets to meet the liquidity needs of our business. In addition to liquidity risk, our investments are subject to interest rate risk and credit risk, as discussed below.
We have established credit quality, maturity, and exposure limits for our investments. The minimum allowed credit rating at time of purchase for corporate, Canadian government agency and Canadian provincial bonds is BBB, for asset-backed securities is AAA, and for municipal bonds is A. The maximum maturity at time of purchase for BBB-rated securities is 5 years, for single A rated securities is 7 years, and for AA-rated and AAA-rated securities is 10 years. Time deposits and commercial paper must be rated A-1 and/or P-1. Money market funds must be rated AAA/Aaa-mf.
Details regarding our overall investment portfolio are as follows:
| | | Three Months Ended | | | Nine Months Ended | | | Three Months Ended | | Six Months Ended |
| | March 31, | | | March 31, | | | December 31, | | December 31, |
| | 2020 | | 2019 | | 2020 | | 2019 | | 2020 | | 2019 | | 2020 | | 2019 |
| Average investment balances at cost: | Average investment balances at cost: | | | | | | | | Average investment balances at cost: | | | | | | | |
| Corporate investments | Corporate investments | $ | 2,932.0 | | | $ | 2,799.6 | | | $ | 4,716.1 | | | $ | 4,782.6 | | Corporate investments | $ | 3,504.5 | | | $ | 5,142.0 | | | $ | 3,869.5 | | | $ | 5,598.5 | |
| Funds held for clients | Funds held for clients | 31,282.0 | | | 29,985.0 | | | 26,655.0 | | | 25,211.3 | | Funds held for clients | 25,109.5 | | | 25,051.7 | | | 23,540.2 | | | 24,366.6 | |
| Total | Total | $ | 34,214.0 | | | $ | 32,784.6 | | | $ | 31,371.1 | | | $ | 29,993.9 | | Total | $ | 28,614.0 | | | $ | 30,193.7 | | | $ | 27,409.7 | | | $ | 29,965.1 | |
| | | | | | | | | | | | | | | | |
Average interest rates earned exclusive of realized
(gains)/losses on: | Average interest rates earned exclusive of realized
(gains)/losses on: | | | | | | | | Average interest rates earned exclusive of realized
(gains)/losses on: | | | | | | | |
| Corporate investments | Corporate investments | 1.7 | % | | 2.1 | % | | 2.0 | % | | 2.0 | % | Corporate investments | 1.2 | % | | 2.0 | % | | 1.3 | % | | 2.1 | % |
| Funds held for clients | Funds held for clients | 2.0 | % | | 2.2 | % | | 2.2 | % | | 2.2 | % | Funds held for clients | 1.7 | % | | 2.2 | % | | 1.8 | % | | 2.2 | % |
| Total | Total | 2.0 | % | | 2.2 | % | | 2.1 | % | | 2.2 | % | Total | 1.6 | % | | 2.2 | % | | 1.7 | % | | 2.2 | % |
| | Realized gains on available-for-sale securities | $ | (2.9) | | | $ | (0.6) | | | $ | (13.0) | | | $ | (1.2) | | |
| Realized losses on available-for-sale securities | 0.4 | | | 0.5 | | | 1.1 | | | 2.6 | | |
| | Net realized (gains)/losses on available-for-sale securities | Net realized (gains)/losses on available-for-sale securities | $ | (2.5) | | | $ | (0.1) | | | $ | (11.9) | | | $ | 1.4 | | Net realized (gains)/losses on available-for-sale securities | $ | (7.7) | | | $ | (7.1) | | | $ | (8.0) | | | $ | (9.4) | |
| | | March 31, 2020 | | June 30, 2019 | | December 31, 2020 | | June 30, 2020 |
| Net unrealized pre-tax gains on available-for-sale securities | Net unrealized pre-tax gains on available-for-sale securities | $ | 475.5 | | | $ | 287.5 | | Net unrealized pre-tax gains on available-for-sale securities | $ | 800.1 | | | $ | 876.8 | |
| | Total available-for-sale securities at fair value | Total available-for-sale securities at fair value | $ | 24,023.6 | | | $ | 24,859.1 | | Total available-for-sale securities at fair value | $ | 22,350.5 | | | $ | 21,576.6 | |
Beginning in March 2020, we halted all new reinvestment of maturities in our client long and extended portfolio. In April 2020, the Company made a decision to sell certain available-for-sale securities in the funds held for clients as the Company anticipates client fund obligations will decline due to reduction in employment levels from a slowdown in the economy as a result of the COVID-19 pandemic. To maintain the size of the funds held for clients in line with client fund obligations, the Company will reduce its holdings of available-for-sale securities in the funds held for clients. As of May 1, 2020, the Company sold approximately $1.3 billion of its available-for-sale securities, resulting in a net realized gain of $0.7 million.
We are exposed to interest rate risk in relation to securities that mature, as the proceeds from maturing securities are reinvested. Factors that influence the earnings impact of interest rate changes include, among others, the amount of invested funds and the overall portfolio mix between short-term and long-term investments. This mix varies during the fiscal year and is impacted by daily interest rate changes. The annualized interest ratesrate earned on our entire portfolio decreased from 2.2% for the ninesix months ended MarchDecember 31, 2019 to 2.1% forto 1.7% for the ninesix months ended MarchDecember 31, 2020. A hypothetical change in both short-term interest rates (e.g., overnight interest rates or the federal funds rate) and intermediate-term interest rates of 25 basis points applied to the estimated average investment balances and any related short-term borrowings would result in approximately a $21 million impact to earnings before income taxes over the ensuing twelve-month period ending December 31, 2021. A hypothetical change in only short-term interest rates of 25 basis points applied to the estimated average short-term investment balances and any related short-term borrowings would result in approximately a $5$6 million impactimpact to earnings before income taxes over the ensuing twelve-month period ending MarchDecember 31, 2021.
We are exposed to credit risk in connection with our available-for-sale securities through the possible inability of the borrowers to meet the terms of the securities. We limit credit risk by investing in investment-grade securities, primarily AAA-rated and AA-ratedAA- rated securities, as rated by Moody’s, Standard & Poor’s, DBRS for Canadian dollar denominated securities, and Fitch for asset-backed and commercial mortgage backedcommercial-mortgage-backed securities. Approximately 77% of our our available-for-sale securities held a AAA-rating or AA-rating at MarchDecember 31, 2020. In addition, we limit amounts that can be invested in any security other than U.S. government and government agency, Canadian government, and United Kingdom government securities.
We operate and transact business in various foreign jurisdictions and are therefore exposed to market risk from changes in foreign currency exchange rates that could impact our consolidated results of operations, financial position, or cash flows. We manage our exposure to these market risks through our regular operating and financing activities and, when deemed appropriate, through the use of derivative financial instruments. We may use derivative financial instruments as risk management tools and not for trading purposes.
CRITICAL ACCOUNTING POLICIES
Our Consolidated Financial Statements and accompanying notes have been prepared in accordance with accounting principles generally accepted in the United States of America (“U.S. GAAP”). The preparation of these financial statements requires management to make estimates, judgments, and assumptions that affect reported amounts of assets, liabilities, revenues, expenses, and other comprehensive income. We continually evaluate the accounting policies and estimates used to prepare the Consolidated Financial Statements. The estimates are based on historical experience and assumptions believed to be reasonable under current facts and circumstances. Actual amounts and results could differ from these estimates made by management. In addition, as the duration and severity of the COVID-19 pandemic are uncertain, certain of our estimates could require further judgment or modification and therefore carry a higher degree of variability and volatility. As events continue to evolve, our estimates may change materially in future periods. Refer to Note 2 of our Consolidated Financial Statements for changes to our accounting policies effective for the fiscal 2020.2021.
NEW ACCOUNTING PRONOUNCEMENTS
See Note 2, New Accounting Pronouncements, of Notes to the Consolidated Financial Statements for a discussion of recent accounting pronouncements.
Item 3. Quantitative and Qualitative Disclosures About Market Risk
The information called for by this item is provided under the caption “Quantitative and Qualitative Disclosures about Market Risk” under Item 2 – Management's Discussion and Analysis of Financial Condition and Results of Operations.
Item 4. Controls and Procedures
The Company carried out an evaluation, under the supervision and with the participation of the Company's management, including its Chief Executive Officer and Chief Financial Officer, of the effectiveness of the Company's disclosure controls and procedures, as defined in Rules 13a-15(e) and 15d-15(e) of the Securities Exchange Act of 1934 (the “evaluation”). Disclosure controls and procedures include, without limitation, controls and procedures designed to ensure that information required to be disclosed by the Company in the reports that it files or submits under the Securities Exchange Act of 1934 is accumulated and communicated to the Company's management, including its Chief Executive Officer and Chief Financial Officer, or persons performing similar functions, as appropriate to allow timely decisions regarding required disclosure. Based on the evaluation, the Company's Chief Executive Officer and Chief Financial Officer have concluded that the Company's disclosure controls and procedures were effective as of MarchDecember 31, 2020 in ensuring that (i) information required to be disclosed by the Company in reports that it files or submits under the Securities Exchange Act of 1934 is accumulated and communicated to the Company's management, including its Chief Executive Officer and Chief Financial Officer, to allow timely decisions regarding required disclosure and (ii) such information is recorded, processed, summarized and reported within the time periods specified in the Securities and Exchange Commission's rules and forms.
There was no change in the Company's internal control over financial reporting that occurred during the three months ended MarchDecember 31, 2020 that has materially affected, or is reasonably likely to materially affect, the Company's internal control over financial reporting.
PART II. OTHER INFORMATION
Except as noted below, all other items are either inapplicable or would result in negative responses and, therefore, have been omitted.
Item 1. Legal Proceedings
In the normal course of business, the Company is subject to various claims and litigation. While the outcome of any litigation is inherently unpredictable, the Company believes it has valid defenses with respect to the legal matters pending against it and the Company believes that the ultimate resolution of these matters will not have a material adverse impact on its financial condition, results of operations, or cash flows.
With respect to the disclosure of administrative or judicial proceedings arising under any Federal, State, or local provisions regulating the discharge of materials into the environment or that are primarily for the purpose of protecting the environment, the Company has determined that the following threshold is reasonably designed to result in disclosure of any such proceeding that is material to its business or financial condition: any proceeding when the potential monetary sanctions exceed $1 million.
Item 1A. Risk Factors
The Company is supplementing theThere have been no material changes in our risk factors set out under "Item 1A. Risk Factors"disclosed in Part 1, Item 1A, of our Annual Report on Form 10-K for the fiscal year ended June 30, 2019, filed on August 9, 2019 (the "2019 Form 10-K"), with the additional risk factors set out below. The risk factors below should be read in conjunction with the other risk factors set out in the 2019 Form 10-K.
A major natural disaster or catastrophic event could have a materially adverse effect on our business, financial condition and results of operations, or have other adverse consequences
Our business, financial condition, results of operations, access to capital markets and borrowing costs may be adversely affected by a major natural disaster or catastrophic event, including civil unrest, geopolitical instability, war, terrorist attack, or pandemics or other public health emergencies such as the recent COVID-19 outbreak, and measures taken in response thereto.
The COVID-19 outbreak has created, and such other events may create, significant volatility and uncertainty and economic and financial market disruption. The extent of any such impact depends on developments which are highly uncertain and cannot be predicted, including the duration and scope of the event; the governmental and business actions taken in response thereto; actions taken by the Company in response thereto and the related costs; the impact on economic activity and employment levels; the effect on our clients, prospects, suppliers and partners; our ability to sell and provide our solutions and services, including due to travel restrictions, business and facility closures, and employee remote working arrangements; the ability of our clients or prospects to pay for our services and solutions; and how quickly and to what extent normal economic and operating conditions can resume. In addition, clients or prospects may delay decision making, demand pricing and other concessions, reduce the value or duration of their orders, delay planned work or seek to terminate existing agreements. Our business is also impacted by employment levels across our clients, as we have varied contracts throughout our business that blend base fees and per-employee fees. To date, the COVID-19 outbreak has had a significant impact on our clients and, as a result, our revenue and new business bookings have been and, we expect, will continue to be negatively impacted. Our bookings have also been adversely affected by the impact of the outbreak on the buying behavior of our clients and prospects, coupled with the inability of our sales force to engage with clients and prospects on an in-person basis and instead primarily leveraging virtual interactions.
Political and economic factors may adversely affect our business and financial results
Trade, monetary and fiscal policies, and political and economic conditions may substantially change, and credit markets may experience periods of constriction and volatility. When there is a slowdown in the economy, employment levels and interest rates may decrease with a corresponding impact on our businesses. Clients may react to worsening conditions by reducing their spending on HCM services or renegotiating their contracts with us, which may adversely affect our business and financial results.
We invest our funds held for clients in liquid, investment-grade marketable securities, money market securities, and other cash equivalents. Nevertheless, such investments are subject to general market, interest rate, credit and liquidity risks. These risks may be exacerbated, individually or together, during periods of unusual financial market volatility.
In addition, as part of our client funds investment strategy, we extend the maturities of our investment portfolio for client funds and utilize short-term financing arrangements to satisfy our short-term funding requirements related to client funds obligations. In order to satisfy these short-term funding requirements, we maintain access to various sources of liquidity, including borrowings under our commercial paper program and our committed credit facilities, our ability to execute reverse repurchase transactions and corporate cash balances. A reduction in the availability of any such financing during periods of disruption in the financial markets or otherwise may increase our borrowing costs and/or require us to sell available-for-sale securities in our funds held for clients to satisfy our short-term funding requirements. When there is a reduction in employment levels due to a slowdown in the economy, the Company may experience a decline in client fund obligations and may also sell available-for-sale securities in our funds held for clients in order to reduce the size of the funds held for clients to correspond to client fund obligations. A sale of such available-for-sale securities may result in the recognition of losses and reduce the interest income earned on funds held for clients, either or both of which may adversely impact our results of operations, financial condition and cash flow.
We are dependent upon various large banks to execute electronic payments and wire transfers as part of our client payroll, tax and other money movement services. While we have contingency plans in place for bank failures, a systemic shutdown of the banking industry would impede our ability to process funds on behalf of our payroll, tax and other money movement services clients and could have an adverse impact on our financial results and liquidity.
We derive a significant portion of our revenues and operating income outside of the United States and, as a result, we are exposed to market risk from changes in foreign currency exchange rates that could impact our results of operations, financial position and cash flows.
Any of the foregoing could cause, contribute to or heighten the risks and uncertainties enumerated in our 2019 Form 10-K and any subsequent Quarterly Report on Form 10-Q or Current Report on Form 8-K, and could materially adversely affect our business, financial condition, results of operations and/or access to capital markets and borrowing costs.2020.
Item 2. Unregistered Sales of Equity Securities and Use of Proceeds.
Issuer Purchases of Equity Securities
| | | | | | | | | | | | | | | | | | | | | | | | | | |
| | Total Number
of Shares Purchased (1) | | Average Price
Paid per Share | | Total Number of
Shares Purchased
as Part of the
Publicly
Announced
Common Stock Repurchase Plan (2) | | Maximum Approximate Dollar Value
of Shares that
may yet be
Purchased under
the Common Stock
Repurchase Plan (2) |
| Period | | | | | | | | |
| January 1 to 31, 2020 | | 522,355 | | | $ | 172.40 | | | 518,265 | | | $ | 4,755,253,122 | |
| | | | | | | | |
| February 1 to 29, 2020 | | 712,655 | | | $ | 174.13 | | | 712,127 | | | $ | 4,631,240,541 | |
| | | | | | | | |
| | | | | | | | |
| March 1 to 31, 2020 | | 1,252,439 | | | $ | 134.80 | | | 1,245,086 | | | $ | 4,463,426,975 | |
| Total | | 2,487,449 | | | | | 2,475,478 | | | |
| | | | | | | | | | | | | | | | | | | | | | | | | | |
| | Total Number
of Shares Purchased (1) | | Average Price
Paid per Share | | Total Number of
Shares Purchased
as Part of the
Publicly
Announced
Common Stock Repurchase Plan (2) | | Maximum Approximate Dollar Value
of Shares that
may yet be
Purchased under
the Common Stock
Repurchase Plan (2) |
| Period | | | | |
| October 1 to 31, 2020 | | 612,071 | | | $ | 146.77 | | | 609,713 | | | $ | 4,148,324,224 | |
| | | | | | | | |
| November 1 to 30, 2020 | | 470,964 | | | $ | 170.80 | | | 468,369 | | | $ | 4,068,334,335 | |
| | | | | | | | |
| | | | | | | | |
| December 1 to 31, 2020 | | 504,313 | | | $ | 174.84 | | | 503,385 | | | $ | 3,980,325,850 | |
| Total | | 1,587,348 | | | | | 1,581,467 | | | |
(1) During the three months ended MarchDecember 31, 2020, pursuant to the terms of the Company'sour restricted stock program, the Company purchased 11,9715,881 shares at the then marketthen-market value of the shares in connection with the vesting of restricted shares of employees under such program to satisfy certain tax withholding requirements throughfor employees upon the deliveryvesting of shares to the Company instead of cash.their restricted shares.
(2) The Company received the Board of Directors' approval to repurchase the shares of our common stock included in the table above as follows:
| | | | | |
| Date of Approval | |
| |
| November 2019 | $5 billion |
There is no expiration date for the common stock repurchase plan.authorization.
Item 6. Exhibits
| | | | | |
| Exhibit Number | Exhibit |
| Separation Agreement and Release, dated March 12, 2020, by and between Thomas J. Perrotti and Automatic Data Processing, Inc. - incorporated by reference to Exhibit 10.1 to the Company's Current Report on Form 8-K dated March 18, 2020 |
| |
| |
| |
| Certification by Carlos A. Rodriguez pursuant to Rule 13a-14(a) of the Securities Exchange Act of 1934
|
| Certification by Kathleen A. Winters pursuant to Rule 13a-14(a) of the Securities Exchange Act of 1934
|
| Certification by Carlos A. Rodriguez pursuant to 18 U.S.C. Section 1350, as adopted pursuant to Section 906 of the Sarbanes-Oxley Act of 2002
|
| Certification by Kathleen A. Winters pursuant to 18 U.S.C. Section 1350, as adopted pursuant to Section 906 of the Sarbanes-Oxley Act of 2002
|
| 101.INS | Instance Document - the instance document does not appear in the Interactive Data File because its XBRL tags are embedded within the Inline XBRL document
|
| 101.SCH | Inline XBRL Taxonomy Extension Schema
|
| 101.CAL | Inline XBRL Taxonomy Extension Calculation Linkbase
|
| 101.LAB | Inline XBRL Taxonomy Label Linkbase
|
| 101.PRE | Inline XBRL Taxonomy Extension Presentation Linkbase
|
| 101.DEF | Inline XBRL Taxonomy Extension Definition Document
|
| 104 | Cover Page Interactive Data File - the cover page interactive data file does not appear in the Interactive Data File because its XBRL tags are embedded within the Inline XBRL document |
SIGNATURES
Pursuant to the requirements of the Securities Exchange Act of 1934, the registrant has duly caused this report to be signed on its behalf by the undersigned thereunto duly authorized.
| | | | | | | | |
| | AUTOMATIC DATA PROCESSING, INC. (Registrant) |
| | |
| Date: | MayFebruary 1, 20202021 | /s/ Kathleen A. Winters Kathleen A. Winters |
| | |
| | Chief Financial Officer (Title) |