
Delaware | 37-0602744 | |||||||||||||
| (State or other jurisdiction of incorporation) | (IRS Employer I.D. No.) | |||||||||||||
| 5205 N. O'Connor Boulevard, | Suite 100, | Irving, | Texas | 75039 | ||||||||||
(Address of principal executive offices) | (Zip Code) | |||||||||||||
| Title of each class | Trading Symbol (s) | Name of each exchange on which registered | |||||||||
| Common Stock ($1.00 par value) | CAT | New York Stock Exchange | ¹ | ||||||||
| 8% Debentures due February 15, 2023 | CAT23 | New York Stock Exchange | |||||||||
| 5.3% Debentures due September 15, 2035 | CAT35 | New York Stock Exchange | |||||||||
| Large accelerated filer | Accelerated filer | ||||||||||
| Non-accelerated filer | |||||||||||
| Smaller reporting company | |||||||||||
| Emerging growth company | |||||||||||
| Item 3. | Defaults Upon Senior Securities | * | ||||||
| Item 4. | Mine Safety Disclosures | * | ||||||
| Item 5. | Other Information | * | ||||||
| Three Months Ended September 30 | Three Months Ended September 30 | |||||||||||||||||
| 2017 | 2016 | 2022 | 2021 | |||||||||||||||
| Sales and revenues: | Sales and revenues: | |||||||||||||||||
| Sales of Machinery, Energy & Transportation | $ | 10,713 | $ | 8,463 | Sales of Machinery, Energy & Transportation | $ | 14,278 | $ | 11,707 | |||||||||
| Revenues of Financial Products | 700 | 697 | Revenues of Financial Products | 716 | 690 | |||||||||||||
| Total sales and revenues | 11,413 | 9,160 | Total sales and revenues | 14,994 | 12,397 | |||||||||||||
| Operating costs: | Operating costs: | |||||||||||||||||
| Cost of goods sold | 7,633 | 6,527 | Cost of goods sold | 10,202 | 8,617 | |||||||||||||
| Selling, general and administrative expenses | 1,237 | 992 | Selling, general and administrative expenses | 1,401 | 1,340 | |||||||||||||
| Research and development expenses | 455 | 453 | Research and development expenses | 476 | 427 | |||||||||||||
| Interest expense of Financial Products | 163 | 147 | Interest expense of Financial Products | 151 | 111 | |||||||||||||
| Other operating (income) expenses | 348 | 560 | Other operating (income) expenses | 339 | 238 | |||||||||||||
| Total operating costs | 9,836 | 8,679 | Total operating costs | 12,569 | 10,733 | |||||||||||||
| Operating profit | 1,577 | 481 | Operating profit | 2,425 | 1,664 | |||||||||||||
| Interest expense excluding Financial Products | 118 | 126 | Interest expense excluding Financial Products | 109 | 114 | |||||||||||||
| Other income (expense) | 64 | 28 | Other income (expense) | 242 | 225 | |||||||||||||
| Consolidated profit before taxes | 1,523 | 383 | Consolidated profit before taxes | 2,558 | 1,775 | |||||||||||||
| Provision (benefit) for income taxes | 470 | 96 | Provision (benefit) for income taxes | 527 | 368 | |||||||||||||
| Profit of consolidated companies | 1,053 | 287 | Profit of consolidated companies | 2,031 | 1,407 | |||||||||||||
| Equity in profit (loss) of unconsolidated affiliated companies | 8 | (4 | ) | Equity in profit (loss) of unconsolidated affiliated companies | 9 | 21 | ||||||||||||
| Profit of consolidated and affiliated companies | 1,061 | 283 | Profit of consolidated and affiliated companies | 2,040 | 1,428 | |||||||||||||
| Less: Profit (loss) attributable to noncontrolling interests | 2 | — | Less: Profit (loss) attributable to noncontrolling interests | (1) | 2 | |||||||||||||
Profit 1 | $ | 1,059 | $ | 283 | Profit 1 | $ | 2,041 | $ | 1,426 | |||||||||
| Profit per common share | $ | 1.79 | $ | 0.48 | Profit per common share | $ | 3.89 | $ | 2.62 | |||||||||
Profit per common share – diluted 2 | $ | 1.77 | $ | 0.48 | Profit per common share – diluted 2 | $ | 3.87 | $ | 2.60 | |||||||||
| Weighted-average common shares outstanding (millions) | Weighted-average common shares outstanding (millions) | |||||||||||||||||
| – Basic | 592.9 | 584.7 | – Basic | 525.0 | 544.0 | |||||||||||||
– Diluted 2 | 600.1 | 589.6 | – Diluted 2 | 527.6 | 547.6 | |||||||||||||
| Cash dividends declared per common share | $ | — | $ | — | ||||||||||||||
| Three Months Ended September 30 | |||||||||||
| 2022 | 2021 | ||||||||||
| Profit of consolidated and affiliated companies | $ | 2,040 | $ | 1,428 | |||||||
| Other comprehensive income (loss), net of tax (Note 13): | |||||||||||
| Foreign currency translation: | (618) | (242) | |||||||||
| Pension and other postretirement benefits: | (1) | (8) | |||||||||
| Derivative financial instruments: | (191) | (31) | |||||||||
| Available-for-sale securities: | (44) | (5) | |||||||||
| Total other comprehensive income (loss), net of tax | (854) | (286) | |||||||||
| Comprehensive income | 1,186 | 1,142 | |||||||||
| Less: comprehensive income attributable to the noncontrolling interests | (1) | 2 | |||||||||
| Comprehensive income attributable to shareholders | $ | 1,187 | $ | 1,140 | |||||||
| Three Months Ended September 30 | |||||||
| 2017 | 2016 | ||||||
| Profit of consolidated and affiliated companies | $ | 1,061 | $ | 283 | |||
| Other comprehensive income (loss), net of tax: | |||||||
| Foreign currency translation, net of tax (provision)/benefit of: 2017 - $28; 2016 - $4 | 248 | 137 | |||||
| Pension and other postretirement benefits: | |||||||
| Current year prior service credit (cost), net of tax (provision)/benefit of: 2017 - $0; 2016 - $0 | — | 2 | |||||
| Amortization of prior service (credit) cost, net of tax (provision)/benefit of: 2017 - $2; 2016 - $5 | (4 | ) | (10 | ) | |||
| Derivative financial instruments: | |||||||
| Gains (losses) deferred, net of tax (provision)/benefit of: 2017 - $2; 2016 - $16 | (4 | ) | (28 | ) | |||
| (Gains) losses reclassified to earnings, net of tax (provision)/benefit of: 2017 - $(5); 2016 - $(2) | 11 | 6 | |||||
| Available-for-sale securities: | |||||||
| Gains (losses) deferred, net of tax (provision)/benefit of: 2017 - $(8); 2016 - $(1) | 11 | 5 | |||||
| (Gains) losses reclassified to earnings, net of tax (provision)/benefit of: 2017 - $12; 2016 - $3 | (24 | ) | (6 | ) | |||
| Total other comprehensive income (loss), net of tax | 238 | 106 | |||||
| Comprehensive income | 1,299 | 389 | |||||
| Less: comprehensive income attributable to the noncontrolling interests | (2 | ) | — | ||||
| Comprehensive income attributable to shareholders | $ | 1,297 | $ | 389 | |||
| Nine Months Ended September 30 | |||||||||||
| 2022 | 2021 | ||||||||||
| Sales and revenues: | |||||||||||
| Sales of Machinery, Energy & Transportation | $ | 40,703 | $ | 35,091 | |||||||
| Revenues of Financial Products | 2,127 | 2,082 | |||||||||
| Total sales and revenues | 42,830 | 37,173 | |||||||||
| Operating costs: | |||||||||||
| Cost of goods sold | 29,736 | 25,510 | |||||||||
| Selling, general and administrative expenses | 4,172 | 3,943 | |||||||||
| Research and development expenses | 1,413 | 1,247 | |||||||||
| Interest expense of Financial Products | 377 | 352 | |||||||||
| Other operating (income) expenses | 908 | 854 | |||||||||
| Total operating costs | 36,606 | 31,906 | |||||||||
| Operating profit | 6,224 | 5,267 | |||||||||
| Interest expense excluding Financial Products | 326 | 376 | |||||||||
| Other income (expense) | 755 | 751 | |||||||||
| Consolidated profit before taxes | 6,653 | 5,642 | |||||||||
| Provision (benefit) for income taxes | 1,423 | 1,313 | |||||||||
| Profit of consolidated companies | 5,230 | 4,329 | |||||||||
| Equity in profit (loss) of unconsolidated affiliated companies | 20 | 44 | |||||||||
| Profit of consolidated and affiliated companies | 5,250 | 4,373 | |||||||||
| Less: Profit (loss) attributable to noncontrolling interests | (1) | 4 | |||||||||
Profit 1 | $ | 5,251 | $ | 4,369 | |||||||
| Profit per common share | $ | 9.91 | $ | 8.00 | |||||||
Profit per common share – diluted 2 | $ | 9.85 | $ | 7.94 | |||||||
| Weighted-average common shares outstanding (millions) | |||||||||||
| – Basic | 530.1 | 545.8 | |||||||||
– Diluted 2 | 533.2 | 550.2 | |||||||||
| Nine Months Ended September 30 | |||||||
| 2017 | 2016 | ||||||
| Sales and revenues: | |||||||
| Sales of Machinery, Energy & Transportation | $ | 30,482 | $ | 26,888 | |||
| Revenues of Financial Products | 2,084 | 2,075 | |||||
| Total sales and revenues | 32,566 | 28,963 | |||||
| Operating costs: | |||||||
| Cost of goods sold | 22,160 | 20,768 | |||||
| Selling, general and administrative expenses | 3,571 | 3,203 | |||||
| Research and development expenses | 1,326 | 1,429 | |||||
| Interest expense of Financial Products | 484 | 447 | |||||
| Other operating (income) expenses | 1,780 | 1,356 | |||||
| Total operating costs | 29,321 | 27,203 | |||||
| Operating profit | 3,245 | 1,760 | |||||
| Interest expense excluding Financial Products | 362 | 385 | |||||
| Other income (expense) | 88 | 112 | |||||
| Consolidated profit before taxes | 2,971 | 1,487 | |||||
| Provision (benefit) for income taxes | 921 | 372 | |||||
| Profit of consolidated companies | 2,050 | 1,115 | |||||
| Equity in profit (loss) of unconsolidated affiliated companies | 8 | (7 | ) | ||||
| Profit of consolidated and affiliated companies | 2,058 | 1,108 | |||||
| Less: Profit (loss) attributable to noncontrolling interests | 5 | 4 | |||||
Profit 1 | $ | 2,053 | $ | 1,104 | |||
| Profit per common share | $ | 3.48 | $ | 1.89 | |||
Profit per common share – diluted 2 | $ | 3.44 | $ | 1.88 | |||
| Weighted-average common shares outstanding (millions) | |||||||
| – Basic | 590.3 | 583.8 | |||||
– Diluted 2 | 596.5 | 588.7 | |||||
| Cash dividends declared per common share | $ | 1.55 | $ | 1.54 | |||
| Nine Months Ended September 30 | |||||||||||
| 2022 | 2021 | ||||||||||
| Profit of consolidated and affiliated companies | $ | 5,250 | $ | 4,373 | |||||||
| Other comprehensive income (loss), net of tax (Note 13): | |||||||||||
| Foreign currency translation: | (1,392) | (490) | |||||||||
| Pension and other postretirement benefits: | (3) | (23) | |||||||||
| Derivative financial instruments: | (254) | (19) | |||||||||
| Available-for-sale securities: | (151) | (20) | |||||||||
| Total other comprehensive income (loss), net of tax | (1,800) | (552) | |||||||||
| Comprehensive income | 3,450 | 3,821 | |||||||||
| Less: comprehensive income attributable to the noncontrolling interests | (1) | 4 | |||||||||
| Comprehensive income attributable to shareholders | $ | 3,451 | $ | 3,817 | |||||||
| Nine Months Ended September 30 | |||||||
| 2017 | 2016 | ||||||
| Profit of consolidated and affiliated companies | $ | 2,058 | $ | 1,108 | |||
| Other comprehensive income (loss), net of tax: | |||||||
| Foreign currency translation, net of tax (provision)/benefit of: 2017 - $86; 2016 - $16 | 719 | 442 | |||||
| Pension and other postretirement benefits: | |||||||
| Current year prior service credit (cost), net of tax (provision)/benefit of: 2017 - $(4); 2016 - $(69) | 8 | 119 | |||||
| Amortization of prior service (credit) cost, net of tax (provision)/benefit of: 2017 - $6; 2016 - $16 | (12 | ) | (29 | ) | |||
| Derivative financial instruments: | |||||||
| Gains (losses) deferred, net of tax (provision)/benefit of: 2017 - $(3); 2016 - $21 | 6 | (37 | ) | ||||
| (Gains) losses reclassified to earnings, net of tax (provision)/benefit of: 2017 - $(41); 2016 - $(8) | 77 | 16 | |||||
| Available-for-sale securities: | |||||||
| Gains (losses) deferred, net of tax (provision)/benefit of: 2017 - $(17); 2016 - $(9) | 29 | 21 | |||||
| (Gains) losses reclassified to earnings, net of tax (provision)/benefit of: 2017 - $11; 2016 - $12 | (21 | ) | (24 | ) | |||
| Total other comprehensive income (loss), net of tax | 806 | 508 | |||||
| Comprehensive income | 2,864 | 1,616 | |||||
| Less: comprehensive income attributable to the noncontrolling interests | (5 | ) | (4 | ) | |||
| Comprehensive income attributable to shareholders | $ | 2,859 | $ | 1,612 | |||
| September 30, 2017 | December 31, 2016 | September 30, 2022 | December 31, 2021 | |||||||||||||||
| Assets | Assets | |||||||||||||||||
| Current assets: | Current assets: | |||||||||||||||||
| Cash and short-term investments | $ | 9,591 | $ | 7,168 | ||||||||||||||
| Cash and cash equivalents | Cash and cash equivalents | $ | 6,346 | $ | 9,254 | |||||||||||||
| Receivables – trade and other | 6,691 | 5,981 | Receivables – trade and other | 8,158 | 8,477 | |||||||||||||
| Receivables – finance | 8,984 | 8,522 | Receivables – finance | 8,918 | 8,898 | |||||||||||||
| Prepaid expenses and other current assets | 1,707 | 1,682 | Prepaid expenses and other current assets | 2,295 | 2,788 | |||||||||||||
| Inventories | 10,212 | 8,614 | Inventories | 16,860 | 14,038 | |||||||||||||
| Total current assets | 37,185 | 31,967 | Total current assets | 42,577 | 43,455 | |||||||||||||
| Property, plant and equipment – net | 14,187 | 15,322 | Property, plant and equipment – net | 11,643 | 12,090 | |||||||||||||
| Long-term receivables – trade and other | 969 | 1,029 | Long-term receivables – trade and other | 1,278 | 1,204 | |||||||||||||
| Long-term receivables – finance | 13,192 | 13,556 | Long-term receivables – finance | 11,859 | 12,707 | |||||||||||||
| Noncurrent deferred and refundable income taxes | 2,845 | 2,790 | Noncurrent deferred and refundable income taxes | 2,218 | 1,840 | |||||||||||||
| Intangible assets | 2,175 | 2,349 | Intangible assets | 806 | 1,042 | |||||||||||||
| Goodwill | 6,196 | 6,020 | Goodwill | 6,092 | 6,324 | |||||||||||||
| Other assets | 1,811 | 1,671 | Other assets | 4,434 | 4,131 | |||||||||||||
| Total assets | $ | 78,560 | $ | 74,704 | Total assets | $ | 80,907 | $ | 82,793 | |||||||||
| Liabilities | Liabilities | |||||||||||||||||
| Current liabilities: | Current liabilities: | |||||||||||||||||
| Short-term borrowings: | Short-term borrowings: | |||||||||||||||||
| Machinery, Energy & Transportation | $ | 11 | $ | 209 | Machinery, Energy & Transportation | $ | 3 | $ | 9 | |||||||||
| Financial Products | 5,459 | 7,094 | Financial Products | 4,199 | 5,395 | |||||||||||||
| Accounts payable | 6,113 | 4,614 | Accounts payable | 8,260 | 8,154 | |||||||||||||
| Accrued expenses | 3,114 | 3,003 | Accrued expenses | 4,013 | 3,757 | |||||||||||||
| Accrued wages, salaries and employee benefits | 2,333 | 1,296 | Accrued wages, salaries and employee benefits | 2,204 | 2,242 | |||||||||||||
| Customer advances | 1,510 | 1,167 | Customer advances | 1,831 | 1,087 | |||||||||||||
| Dividends payable | — | 452 | Dividends payable | — | 595 | |||||||||||||
| Other current liabilities | 1,744 | 1,635 | Other current liabilities | 2,878 | 2,256 | |||||||||||||
| Long-term debt due within one year: | Long-term debt due within one year: | |||||||||||||||||
| Machinery, Energy & Transportation | 5 | 507 | Machinery, Energy & Transportation | 120 | 45 | |||||||||||||
| Financial Products | 5,614 | 6,155 | Financial Products | 6,694 | 6,307 | |||||||||||||
| Total current liabilities | 25,903 | 26,132 | Total current liabilities | 30,202 | 29,847 | |||||||||||||
| Long-term debt due after one year: | Long-term debt due after one year: | |||||||||||||||||
| Machinery, Energy & Transportation | 8,820 | 8,436 | Machinery, Energy & Transportation | 9,479 | 9,746 | |||||||||||||
| Financial Products | 16,015 | 14,382 | Financial Products | 16,030 | 16,287 | |||||||||||||
| Liability for postemployment benefits | 8,973 | 9,357 | Liability for postemployment benefits | 5,038 | 5,592 | |||||||||||||
| Other liabilities | 3,152 | 3,184 | Other liabilities | 4,536 | 4,805 | |||||||||||||
| Total liabilities | 62,863 | 61,491 | Total liabilities | 65,285 | 66,277 | |||||||||||||
| Commitments and contingencies (Notes 10 and 13) | ||||||||||||||||||
| Commitments and contingencies (Notes 11 and 14) | Commitments and contingencies (Notes 11 and 14) | |||||||||||||||||
| Shareholders’ equity | Shareholders’ equity | |||||||||||||||||
| Common stock of $1.00 par value: | Common stock of $1.00 par value: | |||||||||||||||||
| Authorized shares: 2,000,000,000 Issued shares: (9/30/17 and 12/31/16 – 814,894,624) at paid-in amount | 5,460 | 5,277 | ||||||||||||||||
| Treasury stock (9/30/17 – 219,961,042 shares; 12/31/16 – 228,408,600 shares) at cost | (17,130 | ) | (17,478 | ) | ||||||||||||||
Authorized shares: 2,000,000,000 Issued shares: (9/30/22 and 12/31/21 – 814,894,624) at paid-in amount | Authorized shares: 2,000,000,000 Issued shares: (9/30/22 and 12/31/21 – 814,894,624) at paid-in amount | 6,523 | 6,398 | |||||||||||||||
| Treasury stock: (9/30/22 – 294,485,269 shares; 12/31/21 – 279,006,573 shares) at cost | Treasury stock: (9/30/22 – 294,485,269 shares; 12/31/21 – 279,006,573 shares) at cost | (30,883) | (27,643) | |||||||||||||||
| Profit employed in the business | 28,530 | 27,377 | Profit employed in the business | 43,304 | 39,282 | |||||||||||||
| Accumulated other comprehensive income (loss) | (1,233 | ) | (2,039 | ) | Accumulated other comprehensive income (loss) | (3,353) | (1,553) | |||||||||||
| Noncontrolling interests | 70 | 76 | Noncontrolling interests | 31 | 32 | |||||||||||||
| Total shareholders’ equity | 15,697 | 13,213 | Total shareholders’ equity | 15,622 | 16,516 | |||||||||||||
| Total liabilities and shareholders’ equity | $ | 78,560 | $ | 74,704 | Total liabilities and shareholders’ equity | $ | 80,907 | $ | 82,793 | |||||||||
| Common stock | Treasury stock | Profit employed in the business | Accumulated other comprehensive income (loss) | Noncontrolling interests | Total | |||||||||||||||||||||||||||||||||
| Three Months Ended September 30, 2021 | ||||||||||||||||||||||||||||||||||||||
| Balance at June 30, 2021 | $ | 6,293 | $ | (25,240) | $ | 36,934 | $ | (1,154) | $ | 47 | $ | 16,880 | ||||||||||||||||||||||||||
| Profit of consolidated and affiliated companies | — | — | 1,426 | — | 2 | 1,428 | ||||||||||||||||||||||||||||||||
| Foreign currency translation, net of tax | — | — | — | (242) | — | (242) | ||||||||||||||||||||||||||||||||
| Pension and other postretirement benefits, net of tax | — | — | — | (8) | — | (8) | ||||||||||||||||||||||||||||||||
| Derivative financial instruments, net of tax | — | — | — | (31) | — | (31) | ||||||||||||||||||||||||||||||||
| Available-for-sale securities, net of tax | — | — | — | (5) | — | (5) | ||||||||||||||||||||||||||||||||
| Change in ownership from noncontrolling interests | — | — | — | — | (16) | (16) | ||||||||||||||||||||||||||||||||
| Dividends declared | — | — | 1 | — | — | 1 | ||||||||||||||||||||||||||||||||
| Distribution to noncontrolling interests | — | — | — | — | (2) | (2) | ||||||||||||||||||||||||||||||||
| Common shares issued from treasury stock for stock-based compensation: 80,571 | (5) | 4 | — | — | — | (1) | ||||||||||||||||||||||||||||||||
| Stock-based compensation expense | 58 | — | — | — | — | 58 | ||||||||||||||||||||||||||||||||
Common shares repurchased: 6,610,438 1 | — | (1,371) | — | — | — | (1,371) | ||||||||||||||||||||||||||||||||
| Other | 6 | (1) | — | — | (1) | 4 | ||||||||||||||||||||||||||||||||
| Balance at September 30, 2021 | $ | 6,352 | $ | (26,608) | $ | 38,361 | $ | (1,440) | $ | 30 | $ | 16,695 | ||||||||||||||||||||||||||
| Three Months Ended September 30, 2022 | ||||||||||||||||||||||||||||||||||||||
| Balance at June 30, 2022 | $ | 6,464 | $ | (29,501) | $ | 41,263 | $ | (2,499) | $ | 32 | $ | 15,759 | ||||||||||||||||||||||||||
| Profit of consolidated and affiliated companies | — | — | 2,041 | — | (1) | 2,040 | ||||||||||||||||||||||||||||||||
| Foreign currency translation, net of tax | — | — | — | (618) | — | (618) | ||||||||||||||||||||||||||||||||
| Pension and other postretirement benefits, net of tax | — | — | — | (1) | — | (1) | ||||||||||||||||||||||||||||||||
| Derivative financial instruments, net of tax | — | — | — | (191) | — | (191) | ||||||||||||||||||||||||||||||||
| Available-for-sale securities, net of tax | — | — | — | (44) | — | (44) | ||||||||||||||||||||||||||||||||
| Common shares issued from treasury stock for stock-based compensation: 75,534 | (5) | 4 | — | — | — | (1) | ||||||||||||||||||||||||||||||||
| Stock-based compensation expense | 55 | — | — | — | — | 55 | ||||||||||||||||||||||||||||||||
Common shares repurchased: 7,575,322 1 | — | (1,385) | — | — | — | (1,385) | ||||||||||||||||||||||||||||||||
| Other | 9 | (1) | — | — | — | 8 | ||||||||||||||||||||||||||||||||
| Balance at September 30, 2022 | $ | 6,523 | $ | (30,883) | $ | 43,304 | $ | (3,353) | $ | 31 | $ | 15,622 | ||||||||||||||||||||||||||
Common stock | Treasury stock | Profit employed in the business | Accumulated other comprehensive income (loss) | Noncontrolling interests | Total | ||||||||||||||||||
| Nine Months Ended September 30, 2016 | |||||||||||||||||||||||
| Balance at December 31, 2015 | $ | 5,238 | $ | (17,640 | ) | $ | 29,246 | $ | (2,035 | ) | $ | 76 | $ | 14,885 | |||||||||
| Profit of consolidated and affiliated companies | — | — | 1,104 | — | 4 | 1,108 | |||||||||||||||||
| Foreign currency translation, net of tax | — | — | — | 442 | — | 442 | |||||||||||||||||
| Pension and other postretirement benefits, net of tax | — | — | — | 90 | — | 90 | |||||||||||||||||
| Derivative financial instruments, net of tax | — | — | — | (21 | ) | — | (21 | ) | |||||||||||||||
| Available-for-sale securities, net of tax | — | — | — | (3 | ) | — | (3 | ) | |||||||||||||||
| Dividends declared | — | — | (900 | ) | — | — | (900 | ) | |||||||||||||||
| Distribution to noncontrolling interests | — | — | — | — | (10 | ) | (10 | ) | |||||||||||||||
| Common shares issued from treasury stock for stock-based compensation: 2,750,695 | (150 | ) | 96 | — | — | — | (54 | ) | |||||||||||||||
| Stock-based compensation expense | 187 | — | — | — | — | 187 | |||||||||||||||||
| Net excess tax benefits from stock-based compensation | (18 | ) | — | — | — | — | (18 | ) | |||||||||||||||
| Other | 9 | — | — | — | — | 9 | |||||||||||||||||
| Balance at September 30, 2016 | $ | 5,266 | $ | (17,544 | ) | $ | 29,450 | $ | (1,527 | ) | $ | 70 | $ | 15,715 | |||||||||
| Nine Months Ended September 30, 2017 | |||||||||||||||||||||||
| Balance at December 31, 2016 | $ | 5,277 | $ | (17,478 | ) | $ | 27,377 | $ | (2,039 | ) | $ | 76 | $ | 13,213 | |||||||||
Adjustment to adopt stock-based compensation guidance1 | — | — | 15 | — | — | 15 | |||||||||||||||||
| Balance at January 1, 2017 | $ | 5,277 | $ | (17,478 | ) | $ | 27,392 | $ | (2,039 | ) | $ | 76 | $ | 13,228 | |||||||||
| Profit of consolidated and affiliated companies | — | — | 2,053 | — | 5 | 2,058 | |||||||||||||||||
| Foreign currency translation, net of tax | — | — | — | 719 | — | 719 | |||||||||||||||||
| Pension and other postretirement benefits, net of tax | — | — | — | (4 | ) | — | (4 | ) | |||||||||||||||
| Derivative financial instruments, net of tax | — | — | — | 83 | — | 83 | |||||||||||||||||
| Available-for-sale securities, net of tax | — | — | — | 8 | — | 8 | |||||||||||||||||
| Change in ownership from noncontrolling interests | 4 | — | — | — | (3 | ) | 1 | ||||||||||||||||
| Dividends declared | — | — | (915 | ) | — | — | (915 | ) | |||||||||||||||
| Distribution to noncontrolling interests | — | — | — | — | (8 | ) | (8 | ) | |||||||||||||||
| Common shares issued from treasury stock for stock-based compensation: 8,447,558 | 5 | 348 | — | — | — | 353 | |||||||||||||||||
| Stock-based compensation expense | 165 | — | — | — | — | 165 | |||||||||||||||||
| Other | 9 | — | — | — | — | 9 | |||||||||||||||||
| Balance at September 30, 2017 | $ | 5,460 | $ | (17,130 | ) | $ | 28,530 | $ | (1,233 | ) | $ | 70 | $ | 15,697 | |||||||||
1 See Note 2 for additional information. | |||||||||||||||||||||||
| Common stock | Treasury stock | Profit employed in the business | Accumulated other comprehensive income (loss) | Noncontrolling interests | Total | |||||||||||||||||||||||||||||||||
| Nine Months Ended September 30, 2021 | ||||||||||||||||||||||||||||||||||||||
| Balance at December 31, 2020 | $ | 6,230 | $ | (25,178) | $ | 35,167 | $ | (888) | $ | 47 | $ | 15,378 | ||||||||||||||||||||||||||
| Profit of consolidated and affiliated companies | — | — | 4,369 | — | 4 | 4,373 | ||||||||||||||||||||||||||||||||
| Foreign currency translation, net of tax | — | — | — | (490) | — | (490) | ||||||||||||||||||||||||||||||||
| Pension and other postretirement benefits, net of tax | — | — | — | (23) | — | (23) | ||||||||||||||||||||||||||||||||
| Derivative financial instruments, net of tax | — | — | — | (19) | — | (19) | ||||||||||||||||||||||||||||||||
| Available-for-sale securities, net of tax | — | — | — | (20) | — | (20) | ||||||||||||||||||||||||||||||||
| Change in ownership from noncontrolling interests | — | — | — | — | (16) | (16) | ||||||||||||||||||||||||||||||||
Dividends declared 1 | — | — | (1,175) | — | — | (1,175) | ||||||||||||||||||||||||||||||||
| Distribution to noncontrolling interests | — | — | — | — | (4) | (4) | ||||||||||||||||||||||||||||||||
| Common shares issued from treasury stock for stock-based compensation: 3,410,146 | (70) | 192 | — | — | — | 122 | ||||||||||||||||||||||||||||||||
| Stock-based compensation expense | 169 | — | — | — | — | 169 | ||||||||||||||||||||||||||||||||
Common shares repurchased: 7,772,393 2 | — | (1,622) | — | — | — | (1,622) | ||||||||||||||||||||||||||||||||
| Other | 23 | — | — | — | (1) | 22 | ||||||||||||||||||||||||||||||||
| Balance at September 30, 2021 | $ | 6,352 | $ | (26,608) | $ | 38,361 | $ | (1,440) | $ | 30 | $ | 16,695 | ||||||||||||||||||||||||||
| Nine Months Ended September 30, 2022 | ||||||||||||||||||||||||||||||||||||||
| Balance at December 31, 2021 | $ | 6,398 | $ | (27,643) | $ | 39,282 | $ | (1,553) | $ | 32 | $ | 16,516 | ||||||||||||||||||||||||||
| Profit of consolidated and affiliated companies | — | — | 5,251 | — | (1) | 5,250 | ||||||||||||||||||||||||||||||||
| Foreign currency translation, net of tax | — | — | — | (1,392) | — | (1,392) | ||||||||||||||||||||||||||||||||
| Pension and other postretirement benefits, net of tax | — | — | — | (3) | — | (3) | ||||||||||||||||||||||||||||||||
| Derivative financial instruments, net of tax | — | — | — | (254) | — | (254) | ||||||||||||||||||||||||||||||||
| Available-for-sale securities, net of tax | — | — | — | (151) | — | (151) | ||||||||||||||||||||||||||||||||
Dividends declared 1 | — | — | (1,229) | — | — | (1,229) | ||||||||||||||||||||||||||||||||
| Common shares issued from treasury stock for stock-based compensation: 1,529,753 | (67) | 69 | — | — | — | 2 | ||||||||||||||||||||||||||||||||
| Stock-based compensation expense | 162 | — | — | — | — | 162 | ||||||||||||||||||||||||||||||||
Common shares repurchased: 17,007,819 2 | — | (3,309) | — | — | — | (3,309) | ||||||||||||||||||||||||||||||||
| Other | 30 | — | — | — | — | 30 | ||||||||||||||||||||||||||||||||
| Balance at September 30, 2022 | $ | 6,523 | $ | (30,883) | $ | 43,304 | $ | (3,353) | $ | 31 | $ | 15,622 | ||||||||||||||||||||||||||
| Nine Months Ended September 30 | |||||||||||
| 2022 | 2021 | ||||||||||
| Cash flow from operating activities: | |||||||||||
| Profit of consolidated and affiliated companies | $ | 5,250 | $ | 4,373 | |||||||
| Adjustments for non-cash items: | |||||||||||
| Depreciation and amortization | 1,661 | 1,766 | |||||||||
| Provision (benefit) for deferred income taxes | (349) | (321) | |||||||||
| Other | 132 | 102 | |||||||||
| Changes in assets and liabilities, net of acquisitions and divestitures: | |||||||||||
| Receivables – trade and other | 365 | (326) | |||||||||
| Inventories | (3,088) | (2,195) | |||||||||
| Accounts payable | 786 | 1,232 | |||||||||
| Accrued expenses | 70 | 46 | |||||||||
| Accrued wages, salaries and employee benefits | 15 | 934 | |||||||||
| Customer advances | 751 | 39 | |||||||||
| Other assets – net | 57 | 138 | |||||||||
| Other liabilities – net | (623) | (2) | |||||||||
| Net cash provided by (used for) operating activities | 5,027 | 5,786 | |||||||||
| Cash flow from investing activities: | |||||||||||
| Capital expenditures – excluding equipment leased to others | (868) | (673) | |||||||||
| Expenditures for equipment leased to others | (1,023) | (1,014) | |||||||||
| Proceeds from disposals of leased assets and property, plant and equipment | 666 | 877 | |||||||||
| Additions to finance receivables | (9,914) | (9,603) | |||||||||
| Collections of finance receivables | 9,738 | 9,221 | |||||||||
| Proceeds from sale of finance receivables | 50 | 44 | |||||||||
| Investments and acquisitions (net of cash acquired) | (44) | (449) | |||||||||
| Proceeds from sale of businesses and investments (net of cash sold) | 1 | 23 | |||||||||
| Proceeds from sale of securities | 2,080 | 424 | |||||||||
| Investments in securities | (2,399) | (934) | |||||||||
| Other – net | 15 | (8) | |||||||||
| Net cash provided by (used for) investing activities | (1,698) | (2,092) | |||||||||
| Cash flow from financing activities: | |||||||||||
| Dividends paid | (1,820) | (1,733) | |||||||||
| Common stock issued, including treasury shares reissued | 2 | 122 | |||||||||
| Common shares repurchased | (3,309) | (1,622) | |||||||||
| Proceeds from debt issued (original maturities greater than three months): | |||||||||||
| Machinery, Energy & Transportation | — | 494 | |||||||||
| Financial Products | 5,570 | 6,437 | |||||||||
| Payments on debt (original maturities greater than three months): | |||||||||||
| Machinery, Energy & Transportation | (20) | (1,910) | |||||||||
| Financial Products | (5,269) | (6,710) | |||||||||
| Short-term borrowings – net (original maturities three months or less) | (1,311) | 1,324 | |||||||||
| Other – net | (1) | (4) | |||||||||
| Net cash provided by (used for) financing activities | (6,158) | (3,602) | |||||||||
| Effect of exchange rate changes on cash | (79) | (9) | |||||||||
| Increase (decrease) in cash, cash equivalents and restricted cash | (2,908) | 83 | |||||||||
| Cash, cash equivalents and restricted cash at beginning of period | 9,263 | 9,366 | |||||||||
| Cash, cash equivalents and restricted cash at end of period | $ | 6,355 | $ | 9,449 | |||||||
| Nine Months Ended September 30 | |||||||
| 2017 | 2016 | ||||||
| Cash flow from operating activities: | |||||||
| Profit of consolidated and affiliated companies | $ | 2,058 | $ | 1,108 | |||
| Adjustments for non-cash items: | |||||||
| Depreciation and amortization | 2,153 | 2,255 | |||||
| Other | 592 | 640 | |||||
| Changes in assets and liabilities, net of acquisitions and divestitures: | |||||||
| Receivables – trade and other | (455 | ) | 1,128 | ||||
| Inventories | (1,489 | ) | 331 | ||||
| Accounts payable | 1,371 | (163 | ) | ||||
| Accrued expenses | 121 | (153 | ) | ||||
| Accrued wages, salaries and employee benefits | 962 | (727 | ) | ||||
| Customer advances | 310 | (24 | ) | ||||
| Other assets – net | (137 | ) | (141 | ) | |||
| Other liabilities – net | (325 | ) | (279 | ) | |||
| Net cash provided by (used for) operating activities | 5,161 | 3,975 | |||||
| Cash flow from investing activities: | |||||||
| Capital expenditures – excluding equipment leased to others | (566 | ) | (807 | ) | |||
| Expenditures for equipment leased to others | (1,071 | ) | (1,393 | ) | |||
| Proceeds from disposals of leased assets and property, plant and equipment | 864 | 572 | |||||
| Additions to finance receivables | (8,246 | ) | (6,911 | ) | |||
| Collections of finance receivables | 8,532 | 6,968 | |||||
| Proceeds from sale of finance receivables | 98 | 55 | |||||
| Investments and acquisitions (net of cash acquired) | (47 | ) | (72 | ) | |||
| Proceeds from sale of businesses and investments (net of cash sold) | 93 | — | |||||
| Proceeds from sale of securities | 431 | 304 | |||||
| Investments in securities | (594 | ) | (339 | ) | |||
| Other – net | 38 | 5 | |||||
| Net cash provided by (used for) investing activities | (468 | ) | (1,618 | ) | |||
| Cash flow from financing activities: | |||||||
| Dividends paid | (1,367 | ) | (1,348 | ) | |||
| Distribution to noncontrolling interests | (7 | ) | (8 | ) | |||
| Common stock issued, including treasury shares reissued | 353 | (54 | ) | ||||
| Proceeds from debt issued (original maturities greater than three months): | |||||||
| Machinery, Energy & Transportation | 362 | 6 | |||||
| Financial Products | 6,972 | 4,424 | |||||
| Payments on debt (original maturities greater than three months): | |||||||
| Machinery, Energy & Transportation | (506 | ) | (525 | ) | |||
| Financial Products | (5,714 | ) | (5,077 | ) | |||
| Short-term borrowings – net (original maturities three months or less) | (2,403 | ) | (111 | ) | |||
| Net cash provided by (used for) financing activities | (2,310 | ) | (2,693 | ) | |||
| Effect of exchange rate changes on cash | 40 | (11 | ) | ||||
| Increase (decrease) in cash and short-term investments | 2,423 | (347 | ) | ||||
| Cash and short-term investments at beginning of period | 7,168 | 6,460 | |||||
| Cash and short-term investments at end of period | $ | 9,591 | $ | 6,113 | |||
| (Millions of dollars) | September 30, 2017 | December 31, 2016 | |||||||
| Receivables - trade and other | $ | 18 | $ | 55 | |||||
| Receivables - finance | 161 | 174 | |||||||
| Long-term receivables - finance | 218 | 246 | |||||||
| Investments in unconsolidated affiliated companies | 38 | 31 | |||||||
| Guarantees | 270 | 210 | |||||||
| Total | $ | 705 | $ | 716 | |||||
| ASU | Description | ||||
| 2020-06 | Debt with conversion and other options and derivatives and hedging | ||||
| 2021-05 | Lessor - Variable lease payments | ||||
| 2021-10 | Government assistance | ||||
| Nine Months Ended September 30, 2017 | Nine Months Ended September 30, 2016 | Nine Months Ended September 30, 2022 | Nine Months Ended September 30, 2021 | |||||||||||||||||||||||||||||||||||||||||||||||||||||
| Shares Granted | Weighted-Average Fair Value Per Share | Weighted-Average Grant Date Stock Price | Shares Granted | Weighted-Average Fair Value Per Share | Weighted-Average Grant Date Stock Price | Shares Granted | Weighted-Average Fair Value Per Share | Weighted-Average Grant Date Stock Price | Shares Granted | Weighted-Average Fair Value Per Share | Weighted-Average Grant Date Stock Price | |||||||||||||||||||||||||||||||||||||||||||||
| Stock options | 2,701,644 | $ | 25.01 | $ | 95.66 | 4,243,272 | $ | 20.64 | $ | 74.77 | Stock options | 1,029,202 | $ | 51.69 | $ | 196.70 | 1,084,821 | $ | 56.30 | $ | 219.76 | |||||||||||||||||||||||||||||||||||
| RSUs | 924,421 | $ | 90.11 | $ | 96.01 | 1,085,505 | $ | 68.04 | $ | 74.77 | RSUs | 484,025 | $ | 196.70 | $ | 196.70 | 448,311 | $ | 219.76 | $ | 219.76 | |||||||||||||||||||||||||||||||||||
| PRSUs | 437,385 | $ | 86.78 | $ | 95.66 | 614,347 | $ | 64.71 | $ | 74.77 | PRSUs | 258,900 | $ | 196.70 | $ | 196.70 | 266,894 | $ | 219.76 | $ | 219.76 | |||||||||||||||||||||||||||||||||||
| Grant Year | Grant Year | |||||||||||||
| 2017 | 2016 | 2022 | 2021 | |||||||||||
| Weighted-average dividend yield | 3.42% | 3.23% | Weighted-average dividend yield | 2.60% | 2.60% | |||||||||
| Weighted-average volatility | 29.2% | 31.1% | Weighted-average volatility | 31.7% | 32.9% | |||||||||
| Range of volatilities | 22.1-33.0% | 22.5-33.4% | Range of volatilities | 25.3% - 36.8% | 29.2% - 45.8% | |||||||||
| Range of risk-free interest rates | 0.81-2.35% | 0.62-1.73% | Range of risk-free interest rates | 1.03% - 2.00% | 0.06% - 1.41% | |||||||||
| Weighted-average expected lives | 8 years | 8 years | Weighted-average expected lives | 8 years | 8 years | |||||||||
(Millions of dollars) | Consolidated Statement of Financial | Asset (Liability) Fair Value | |||||||
| Position Location | September 30, 2017 | December 31, 2016 | |||||||
| Designated derivatives | |||||||||
| Foreign exchange contracts | |||||||||
| Machinery, Energy & Transportation | Receivables – trade and other | $ | 14 | $ | 13 | ||||
| Machinery, Energy & Transportation | Long-term receivables – trade and other | 3 | — | ||||||
| Machinery, Energy & Transportation | Accrued expenses | (8 | ) | (93 | ) | ||||
| Machinery, Energy & Transportation | Other liabilities | (5 | ) | (36 | ) | ||||
| Financial Products | Long-term receivables – trade and other | 8 | 29 | ||||||
| Financial Products | Accrued expenses | (41 | ) | (3 | ) | ||||
| Interest rate contracts | |||||||||
| Financial Products | Long-term receivables – trade and other | 3 | 4 | ||||||
| Financial Products | Accrued expenses | (1 | ) | (1 | ) | ||||
| $ | (27 | ) | $ | (87 | ) | ||||
| Undesignated derivatives | |||||||||
| Foreign exchange contracts | |||||||||
| Machinery, Energy & Transportation | Receivables – trade and other | $ | 11 | $ | — | ||||
| Machinery, Energy & Transportation | Accrued expenses | (2 | ) | (30 | ) | ||||
| Financial Products | Receivables – trade and other | 42 | 39 | ||||||
| Financial Products | Accrued expenses | (8 | ) | (4 | ) | ||||
| Commodity contracts | |||||||||
| Machinery, Energy & Transportation | Receivables – trade and other | 12 | 10 | ||||||
| $ | 55 | $ | 15 | ||||||
| (Millions of dollars) | Fair Value | ||||||||||||||||||||||
| September 30, 2022 | December 31, 2021 | ||||||||||||||||||||||
Assets1 | Liabilities2 | Assets1 | Liabilities2 | ||||||||||||||||||||
| Designated derivatives | |||||||||||||||||||||||
| Foreign exchange contracts | $ | 692 | $ | (394) | $ | 228 | $ | (64) | |||||||||||||||
| Interest rate contracts | 94 | (302) | 38 | (15) | |||||||||||||||||||
| Total | $ | 786 | $ | (696) | $ | 266 | $ | (79) | |||||||||||||||
| Undesignated derivatives | |||||||||||||||||||||||
| Foreign exchange contracts | $ | 118 | $ | (78) | $ | 46 | $ | (42) | |||||||||||||||
| Commodity contracts | 9 | (43) | 30 | (9) | |||||||||||||||||||
| Total | $ | 127 | $ | (121) | $ | 76 | $ | (51) | |||||||||||||||
1 Assets are classified on the Consolidated Statement of Financial Position as Receivables - trade and other or Long-term receivables - trade and other. | |||||||||||||||||||||||
2 Liabilities are classified on the Consolidated Statement of Financial Position as Accrued expenses or Other liabilities. | |||||||||||||||||||||||
| (Millions of dollars) | September 30, 2017 | December 31, 2016 | ||||||
| Machinery, Energy & Transportation | $ | 2,081 | $ | 2,530 | ||||
| Financial Products | $ | 3,560 | $ | 2,626 | ||||
| (Millions of dollars) | Three Months Ended September 30 | ||||||||||||||||||||||||||||||||||
| Fair Value / Undesignated Hedges | Cash Flow Hedges | ||||||||||||||||||||||||||||||||||
Gains (Losses) Recognized on the Consolidated Statement of Results of Operations1 | Gains (Losses) Recognized in AOCI | Gains (Losses) Reclassified from AOCI2 | |||||||||||||||||||||||||||||||||
| 2022 | 2021 | 2022 | 2021 | 2022 | 2021 | ||||||||||||||||||||||||||||||
| Foreign exchange contracts | $ | (2) | $ | 46 | $ | 18 | $ | 42 | $ | 289 | $ | 90 | |||||||||||||||||||||||
| Interest rate contracts | (5) | 5 | 26 | 3 | 7 | (5) | |||||||||||||||||||||||||||||
| Commodity contracts | (42) | (30) | — | — | — | — | |||||||||||||||||||||||||||||
| Total | $ | (49) | $ | 21 | $ | 44 | $ | 45 | $ | 296 | $ | 85 | |||||||||||||||||||||||
1 Foreign exchange contract and Commodity contract gains (losses) are included in Other income (expense). Interest rate contract gains (losses) are primarily included in Interest expense of Financial Products. | |||||||||||||||||||||||||||||||||||
2 Foreign exchange contract gains (losses) are primarily included in Other income (expense) in the Consolidated Statement of Results of Operations. Interest rate contract gains (losses) are primarily included in Interest expense of Financial Products in the Consolidated Statement of Results of Operations. | |||||||||||||||||||||||||||||||||||
| (Millions of dollars) | Nine Months Ended September 30 | ||||||||||||||||||||||||||||||||||
| Fair Value / Undesignated Hedges | Cash Flow Hedges | ||||||||||||||||||||||||||||||||||
Gains (Losses) Recognized on the Consolidated Statement of Results of Operations1 | Gains (Losses) Recognized in AOCI | Gains (Losses) Reclassified from AOCI2 | |||||||||||||||||||||||||||||||||
| 2022 | 2021 | 2022 | 2021 | 2022 | 2021 | ||||||||||||||||||||||||||||||
| Foreign exchange contracts | $ | (32) | $ | 77 | $ | 195 | $ | 130 | $ | 638 | $ | 187 | |||||||||||||||||||||||
| Interest rate contracts | 12 | 18 | 103 | 11 | (2) | (23) | |||||||||||||||||||||||||||||
| Commodity contract | 3 | 35 | — | — | — | — | |||||||||||||||||||||||||||||
| Total | $ | (17) | $ | 130 | $ | 298 | $ | 141 | $ | 636 | $ | 164 | |||||||||||||||||||||||
1 Foreign exchange contract and Commodity contract gains (losses) are included in Other income (expense). Interest rate contract gains (losses) are primarily included in Interest expense excluding Financial Products. | |||||||||||||||||||||||||||||||||||
2 Foreign exchange contract gains (losses) are primarily included in Other income (expense). Interest rate contract gains (losses) are primarily included in Interest expense excluding Financial Products. | |||||||||||||||||||||||||||||||||||
| Fair Value Hedges | ||||||||||||||||||
| Three Months Ended September 30, 2017 | Three Months Ended September 30, 2016 | |||||||||||||||||
(Millions of dollars) | Classification | Gains (Losses) on Derivatives | Gains (Losses) on Borrowings | Gains (Losses) on Derivatives | Gains (Losses) on Borrowings | |||||||||||||
| Interest rate contracts | ||||||||||||||||||
| Financial Products | Other income (expense) | $ | — | $ | — | $ | (11 | ) | $ | 11 | ||||||||
| $ | — | $ | — | $ | (11 | ) | $ | 11 | ||||||||||
| Nine Months Ended September 30, 2017 | Nine Months Ended September 30, 2016 | |||||||||||||||||
| Classification | Gains (Losses) on Derivatives | Gains (Losses) on Borrowings | Gains (Losses) on Derivatives | Gains (Losses) on Borrowings | ||||||||||||||
| Interest rate contracts | ||||||||||||||||||
| Financial Products | Other income (expense) | $ | (1 | ) | $ | 1 | $ | (11 | ) | $ | 10 | |||||||
| $ | (1 | ) | $ | 1 | $ | (11 | ) | $ | 10 | |||||||||
| (Millions of dollars) | Carrying Value of the Hedged Liabilities | Cumulative Amount of Fair Value Hedging Adjustment Included in the Carrying Value of the Hedged Liabilities | |||||||||||||||||||||
| September 30, 2022 | December 31, 2021 | September 30, 2022 | December 31, 2021 | ||||||||||||||||||||
| Long-term debt due within one year | $ | — | $ | 755 | $ | — | $ | 5 | |||||||||||||||
| Long-term debt due after one year | 3,796 | 1,304 | (227) | (2) | |||||||||||||||||||
| Total | $ | 3,796 | $ | 2,059 | $ | (227) | $ | 3 | |||||||||||||||
| Cash Flow Hedges | ||||||||||||||
| Three Months Ended September 30, 2017 | ||||||||||||||
| Recognized in Earnings | ||||||||||||||
(Millions of dollars) | Amount of Gains (Losses) Recognized in AOCI (Effective Portion) | Classification of Gains (Losses) | Amount of Gains (Losses) Reclassified from AOCI to Earnings | Recognized in Earnings (Ineffective Portion) | ||||||||||
| Foreign exchange contracts | ||||||||||||||
| Machinery, Energy & Transportation | $ | 16 | Other income (expense) | $ | 4 | $ | — | |||||||
| Financial Products | (21 | ) | Other income (expense) | (20 | ) | — | ||||||||
| Interest rate contracts | ||||||||||||||
| Machinery, Energy & Transportation | — | Interest expense excluding Financial Products | (2 | ) | — | |||||||||
| Financial Products | (1 | ) | Interest expense of Financial Products | 2 | — | |||||||||
| $ | (6 | ) | $ | (16 | ) | $ | — | |||||||
| Three Months Ended September 30, 2016 | ||||||||||||||
| Recognized in Earnings | ||||||||||||||
Amount of Gains (Losses) Recognized in AOCI (Effective Portion) | Classification of Gains (Losses) | Amount of Gains (Losses) Reclassified from AOCI to Earnings | Recognized in Earnings (Ineffective Portion) | |||||||||||
| Foreign exchange contracts | ||||||||||||||
| Machinery, Energy & Transportation | $ | (29 | ) | Other income (expense) | $ | 4 | $ | — | ||||||
| Financial Products | (17 | ) | Other income (expense) | (10 | ) | — | ||||||||
| Interest rate contracts | ||||||||||||||
| Machinery, Energy & Transportation | — | Interest expense excluding Financial Products | (2 | ) | — | |||||||||
| Financial Products | 2 | Interest expense of Financial Products | — | — | ||||||||||
| $ | (44 | ) | $ | (8 | ) | $ | — | |||||||
| Nine Months Ended September 30, 2017 | ||||||||||||||
| Recognized in Earnings | ||||||||||||||
Amount of Gains (Losses) Recognized in AOCI (Effective Portion) | Classification of Gains (Losses) | Amount of Gains (Losses) Reclassified from AOCI to Earnings | Recognized in Earnings (Ineffective Portion) | |||||||||||
| Foreign exchange contracts | ||||||||||||||
| Machinery, Energy & Transportation | $ | 72 | Other income (expense) | $ | (49 | ) | $ | — | ||||||
| Financial Products | (62 | ) | Other income (expense) | (69 | ) | — | ||||||||
| Interest rate contracts | ||||||||||||||
| Machinery, Energy & Transportation | — | Interest expense excluding Financial Products | (5 | ) | — | |||||||||
| Financial Products | (1 | ) | Interest expense of Financial Products | 5 | — | |||||||||
| $ | 9 | $ | (118 | ) | $ | — | ||||||||
| Nine Months Ended September 30, 2016 | ||||||||||||||
| Recognized in Earnings | ||||||||||||||
Amount of Gains (Losses) Recognized in AOCI (Effective Portion) | Classification of Gains (Losses) | Amount of Gains (Losses) Reclassified from AOCI to Earnings | Recognized in Earnings (Ineffective Portion) | |||||||||||
| Foreign exchange contracts | ||||||||||||||
| Machinery, Energy & Transportation | $ | (35 | ) | Other income (expense) | $ | — | $ | — | ||||||
| Financial Products | (23 | ) | Other income (expense) | (16 | ) | — | ||||||||
| Interest rate contracts | ||||||||||||||
| Machinery, Energy & Transportation | — | Interest expense excluding Financial Products | (5 | ) | — | |||||||||
| Financial Products | — | Interest expense of Financial Products | (3 | ) | — | |||||||||
| $ | (58 | ) | $ | (24 | ) | $ | — | |||||||
(Millions of dollars) | Classification of Gains (Losses) | Three Months Ended September 30, 2017 | Three Months Ended September 30, 2016 | ||||||
| Foreign exchange contracts | |||||||||
| Machinery, Energy & Transportation | Other income (expense) | $ | 15 | $ | 2 | ||||
| Financial Products | Other income (expense) | 11 | (5 | ) | |||||
| Commodity contracts | |||||||||
| Machinery, Energy & Transportation | Other income (expense) | 11 | 3 | ||||||
| $ | 37 | $ | — | ||||||
| Classification of Gains (Losses) | Nine Months Ended September 30, 2017 | Nine Months Ended September 30, 2016 | |||||||
| Foreign exchange contracts | |||||||||
| Machinery, Energy & Transportation | Other income (expense) | $ | 67 | $ | 24 | ||||
| Financial Products | Other income (expense) | 21 | (33 | ) | |||||
| Commodity contracts | |||||||||
| Machinery, Energy & Transportation | Other income (expense) | 12 | 9 | ||||||
| $ | 100 | $ | — | ||||||
| (Millions of dollars) | September 30, 2022 | December 31, 2021 | |||||||||||||||||||||
| Assets | Liabilities | Assets | Liabilities | ||||||||||||||||||||
| Gross Amounts Recognized | $ | 913 | $ | (817) | $ | 342 | $ | (130) | |||||||||||||||
| Financial Instruments Not Offset | (282) | 282 | (114) | 114 | |||||||||||||||||||
| Cash Collateral Received | — | — | — | — | |||||||||||||||||||
| Net Amount | $ | 631 | $ | (535) | $ | 228 | $ | (16) | |||||||||||||||
| September 30, 2017 | Gross Amounts Not Offset in the Statement of Financial Position | |||||||||||||||||||||||
| (Millions of dollars) | Gross Amount of Recognized Assets | Gross Amounts Offset in the Statement of Financial Position | Net Amount of Assets Presented in the Statement of Financial Position | Financial Instruments | Cash Collateral Received | Net Amount of Assets | ||||||||||||||||||
| Derivatives | ||||||||||||||||||||||||
| Machinery, Energy & Transportation | $ | 40 | $ | — | $ | 40 | $ | (14 | ) | $ | — | $ | 26 | |||||||||||
| Financial Products | 53 | — | 53 | (8 | ) | — | 45 | |||||||||||||||||
| Total | $ | 93 | $ | — | $ | 93 | $ | (22 | ) | $ | — | $ | 71 | |||||||||||
| September 30, 2017 | Gross Amounts Not Offset in the Statement of Financial Position | |||||||||||||||||||||||
| (Millions of dollars) | Gross Amount of Recognized Liabilities | Gross Amounts Offset in the Statement of Financial Position | Net Amount of Liabilities Presented in the Statement of Financial Position | Financial Instruments | Cash Collateral Pledged | Net Amount of Liabilities | ||||||||||||||||||
| Derivatives | ||||||||||||||||||||||||
| Machinery, Energy & Transportation | $ | (15 | ) | $ | — | $ | (15 | ) | $ | 14 | $ | — | $ | (1 | ) | |||||||||
| Financial Products | (50 | ) | — | (50 | ) | 8 | — | (42 | ) | |||||||||||||||
| Total | $ | (65 | ) | $ | — | $ | (65 | ) | $ | 22 | $ | — | $ | (43 | ) | |||||||||
| December 31, 2016 | Gross Amounts Not Offset in the Statement of Financial Position | |||||||||||||||||||||||
| (Millions of dollars) | Gross Amount of Recognized Assets | Gross Amounts Offset in the Statement of Financial Position | Net Amount of Assets Presented in the Statement of Financial Position | Financial Instruments | Cash Collateral Received | Net Amount of Assets | ||||||||||||||||||
| Derivatives | ||||||||||||||||||||||||
| Machinery, Energy & Transportation | $ | 23 | $ | — | $ | 23 | $ | (21 | ) | $ | — | $ | 2 | |||||||||||
| Financial Products | 72 | — | 72 | (7 | ) | — | 65 | |||||||||||||||||
| Total | $ | 95 | $ | — | $ | 95 | $ | (28 | ) | $ | — | $ | 67 | |||||||||||
| December 31, 2016 | Gross Amounts Not Offset in the Statement of Financial Position | |||||||||||||||||||||||
| (Millions of dollars) | Gross Amount of Recognized Liabilities | Gross Amounts Offset in the Statement of Financial Position | Net Amount of Liabilities Presented in the Statement of Financial Position | Financial Instruments | Cash Collateral Pledged | Net Amount of Liabilities | ||||||||||||||||||
| Derivatives | ||||||||||||||||||||||||
| Machinery, Energy & Transportation | $ | (159 | ) | $ | — | $ | (159 | ) | $ | 21 | $ | — | $ | (138 | ) | |||||||||
| Financial Products | (8 | ) | — | (8 | ) | 7 | — | (1 | ) | |||||||||||||||
| Total | $ | (167 | ) | $ | — | $ | (167 | ) | $ | 28 | $ | — | $ | (139 | ) | |||||||||
| (Millions of dollars) | September 30, 2017 | December 31, 2016 | |||||
| Raw materials | $ | 2,777 | $ | 2,102 | |||
| Work-in-process | 2,241 | 1,719 | |||||
| Finished goods | 4,990 | 4,576 | |||||
| Supplies | 204 | 217 | |||||
| Total inventories | $ | 10,212 | $ | 8,614 | |||
| (Millions of dollars) | September 30, 2022 | December 31, 2021 | |||||||||
| Raw materials | $ | 6,335 | $ | 5,528 | |||||||
| Work-in-process | 1,836 | 1,318 | |||||||||
| Finished goods | 8,387 | 6,907 | |||||||||
| Supplies | 302 | 285 | |||||||||
| Total inventories | $ | 16,860 | $ | 14,038 | |||||||
| (Millions of dollars) | September 30, 2017 | December 31, 2016 | |||||
| Investments in equity method companies | $ | 219 | $ | 192 | |||
| Plus: Investments in cost method companies | 33 | 57 | |||||
| Total investments in unconsolidated affiliated companies | $ | 252 | $ | 249 | |||
| September 30, 2022 | |||||||||||||||||||||||
| (Millions of dollars) | Weighted Amortizable Life (Years) | Gross Carrying Amount | Accumulated Amortization | Net | |||||||||||||||||||
| Customer relationships | 16 | $ | 2,183 | $ | (1,604) | $ | 579 | ||||||||||||||||
| Intellectual property | 12 | 1,470 | (1,287) | 183 | |||||||||||||||||||
| Other | 16 | 128 | (84) | 44 | |||||||||||||||||||
| Total finite-lived intangible assets | 14 | $ | 3,781 | $ | (2,975) | $ | 806 | ||||||||||||||||
| September 30, 2017 | |||||||||||||
| (Millions of dollars) | Weighted Amortizable Life (Years) | Gross Carrying Amount | Accumulated Amortization | Net | |||||||||
| Customer relationships | 15 | $ | 2,433 | $ | (1,077 | ) | $ | 1,356 | |||||
| Intellectual property | 11 | 1,529 | (812 | ) | 717 | ||||||||
| Other | 13 | 191 | (89 | ) | 102 | ||||||||
| Total finite-lived intangible assets | 14 | $ | 4,153 | $ | (1,978 | ) | $ | 2,175 | |||||
| December 31, 2021 | |||||||||||||||||||||||
| Weighted Amortizable Life (Years) | Gross Carrying Amount | Accumulated Amortization | Net | ||||||||||||||||||||
| Customer relationships | 15 | $ | 2,421 | $ | (1,709) | $ | 712 | ||||||||||||||||
| Intellectual property | 12 | 1,472 | (1,192) | 280 | |||||||||||||||||||
| Other | 14 | 156 | (106) | 50 | |||||||||||||||||||
| Total finite-lived intangible assets | 14 | $ | 4,049 | $ | (3,007) | $ | 1,042 | ||||||||||||||||
| December 31, 2016 | |||||||||||||
Weighted Amortizable Life (Years) | Gross Carrying Amount | Accumulated Amortization | Net | ||||||||||
| Customer relationships | 15 | $ | 2,378 | $ | (934 | ) | $ | 1,444 | |||||
| Intellectual property | 11 | 1,496 | (706 | ) | 790 | ||||||||
| Other | 14 | 192 | (77 | ) | 115 | ||||||||
| Total finite-lived intangible assets | 14 | $ | 4,066 | $ | (1,717 | ) | $ | 2,349 | |||||
| (Millions of dollars) | ||||||||||
| Remaining Three Months of 2017 | 2018 | 2019 | 2020 | 2021 | Thereafter | |||||
| $81 | $319 | $313 | $302 | $284 | $876 | |||||
| (Millions of dollars) | ||||||||||||||||||||||||||||||||
| Remaining Three Months of 2022 | 2023 | 2024 | 2025 | 2026 | Thereafter | |||||||||||||||||||||||||||
| $70 | $222 | $163 | $153 | $85 | $113 | |||||||||||||||||||||||||||
| (Millions of dollars) | December 31, 2021 | Acquisitions | Other Adjustments 1 | September 30, 2022 | ||||||||||||||||||||||||||||
| Construction Industries | ||||||||||||||||||||||||||||||||
| Goodwill | $ | 302 | $ | — | $ | (39) | $ | 263 | ||||||||||||||||||||||||
| Impairments | (22) | — | — | (22) | ||||||||||||||||||||||||||||
| Net goodwill | 280 | — | (39) | 241 | ||||||||||||||||||||||||||||
| Resource Industries | ||||||||||||||||||||||||||||||||
| Goodwill | 4,182 | — | (127) | 4,055 | ||||||||||||||||||||||||||||
| Impairments | (1,175) | — | — | (1,175) | ||||||||||||||||||||||||||||
| Net goodwill | 3,007 | — | (127) | 2,880 | ||||||||||||||||||||||||||||
| Energy & Transportation | ||||||||||||||||||||||||||||||||
| Goodwill | 2,985 | 25 | (81) | 2,929 | ||||||||||||||||||||||||||||
All Other 2 | ||||||||||||||||||||||||||||||||
| Goodwill | 52 | — | (10) | 42 | ||||||||||||||||||||||||||||
| Consolidated total | ||||||||||||||||||||||||||||||||
| Goodwill | 7,521 | 25 | (257) | 7,289 | ||||||||||||||||||||||||||||
| Impairments | (1,197) | — | — | (1,197) | ||||||||||||||||||||||||||||
| Net goodwill | $ | 6,324 | $ | 25 | $ | (257) | $ | 6,092 | ||||||||||||||||||||||||
| (Millions of dollars) | December 31, 2016 | Other Adjustments 1 | September 30, 2017 | |||||||||
| Construction Industries | ||||||||||||
| Goodwill | $ | 296 | $ | 10 | $ | 306 | ||||||
| Impairments | (22 | ) | — | (22 | ) | |||||||
| Net goodwill | 274 | 10 | 284 | |||||||||
| Resource Industries | ||||||||||||
| Goodwill | 4,110 | 111 | 4,221 | |||||||||
| Impairments | (1,175 | ) | — | (1,175 | ) | |||||||
| Net goodwill | 2,935 | 111 | 3,046 | |||||||||
| Energy & Transportation | ||||||||||||
| Goodwill | 2,756 | 54 | 2,810 | |||||||||
All Other 2 | ||||||||||||
| Goodwill | 55 | 1 | 56 | |||||||||
| Consolidated total | ||||||||||||
| Goodwill | 7,217 | 176 | 7,393 | |||||||||
| Impairments | (1,197 | ) | — | (1,197 | ) | |||||||
| Net goodwill | $ | 6,020 | $ | 176 | $ | 6,196 | ||||||
| September 30, 2017 | December 31, 2016 | |||||||||||||||||||||||||||||||||||||||||||||||||||||||||
| Available-for-sale debt securities | Available-for-sale debt securities | September 30, 2022 | December 31, 2021 | |||||||||||||||||||||||||||||||||||||||||||||||||||||||
| (Millions of dollars) | Cost Basis | Unrealized Pretax Net Gains (Losses) | Fair Value | Cost Basis | Unrealized Pretax Net Gains (Losses) | Fair Value | (Millions of dollars) | Cost Basis | Unrealized Pretax Net Gains (Losses) | Fair Value | Cost Basis | Unrealized Pretax Net Gains (Losses) | Fair Value | |||||||||||||||||||||||||||||||||||||||||||||
| Government debt | ||||||||||||||||||||||||||||||||||||||||||||||||||||||||||
| Government debt securities | Government debt securities | |||||||||||||||||||||||||||||||||||||||||||||||||||||||||
| U.S. treasury bonds | $ | 10 | $ | — | $ | 10 | $ | 9 | $ | — | $ | 9 | U.S. treasury bonds | $ | 10 | $ | — | $ | 10 | $ | 10 | $ | — | $ | 10 | |||||||||||||||||||||||||||||||||
| Other U.S. and non-U.S. government bonds | 48 | — | 48 | 60 | — | 60 | Other U.S. and non-U.S. government bonds | 51 | (2) | 49 | 61 | — | 61 | |||||||||||||||||||||||||||||||||||||||||||||
| Corporate bonds | ||||||||||||||||||||||||||||||||||||||||||||||||||||||||||
| Corporate bonds | 529 | 3 | 532 | 489 | 3 | 492 | ||||||||||||||||||||||||||||||||||||||||||||||||||||
| Corporate debt securities | Corporate debt securities | |||||||||||||||||||||||||||||||||||||||||||||||||||||||||
| Corporate bonds and other debt securities | Corporate bonds and other debt securities | 2,156 | (108) | 2,048 | 1,027 | 19 | 1,046 | |||||||||||||||||||||||||||||||||||||||||||||||||||
| Asset-backed securities | 76 | — | 76 | 90 | — | 90 | Asset-backed securities | 185 | (5) | 180 | 175 | 1 | 176 | |||||||||||||||||||||||||||||||||||||||||||||
| Mortgage-backed debt securities | Mortgage-backed debt securities | |||||||||||||||||||||||||||||||||||||||||||||||||||||||||
| U.S. governmental agency | 245 | (2 | ) | 243 | 225 | (2 | ) | 223 | U.S. governmental agency | 384 | (36) | 348 | 319 | 6 | 325 | |||||||||||||||||||||||||||||||||||||||||||
| Residential | 8 | — | 8 | 10 | — | 10 | Residential | 3 | — | 3 | 4 | — | 4 | |||||||||||||||||||||||||||||||||||||||||||||
| Commercial | 17 | — | 17 | 36 | — | 36 | Commercial | 139 | (10) | 129 | 98 | 1 | 99 | |||||||||||||||||||||||||||||||||||||||||||||
| Total available-for-sale debt securities | Total available-for-sale debt securities | $ | 2,928 | $ | (161) | $ | 2,767 | $ | 1,694 | $ | 27 | $ | 1,721 | |||||||||||||||||||||||||||||||||||||||||||||
| Equity securities | ||||||||||||||||||||||||||||||||||||||||||||||||||||||||||
| Large capitalization value | 313 | 36 | 349 | 280 | 32 | 312 | ||||||||||||||||||||||||||||||||||||||||||||||||||||
| Real estate investment trust (REIT) | 104 | 5 | 109 | 77 | 2 | 79 | ||||||||||||||||||||||||||||||||||||||||||||||||||||
| Smaller company growth | 43 | 22 | 65 | 41 | 15 | 56 | ||||||||||||||||||||||||||||||||||||||||||||||||||||
| Total | $ | 1,393 | $ | 64 | $ | 1,457 | $ | 1,317 | $ | 50 | $ | 1,367 | ||||||||||||||||||||||||||||||||||||||||||||||
| Available-for-sale investments in an unrealized loss position that are not other-than-temporarily impaired: | |||||||||||||||||||||||
| September 30, 2017 | |||||||||||||||||||||||
Less than 12 months 1 | 12 months or more 1 | Total | |||||||||||||||||||||
| (Millions of dollars) | Fair Value | Unrealized Losses | Fair Value | Unrealized Losses | Fair Value | Unrealized Losses | |||||||||||||||||
| Mortgage-backed debt securities | |||||||||||||||||||||||
| U.S. governmental agency | 102 | 1 | 89 | 2 | 191 | 3 | |||||||||||||||||
| Equity securities | |||||||||||||||||||||||
| Large capitalization value | 72 | 5 | 14 | 3 | 86 | 8 | |||||||||||||||||
| Small company growth | 9 | 1 | 2 | — | 11 | 1 | |||||||||||||||||
| Total | $ | 183 | $ | 7 | $ | 105 | $ | 5 | $ | 288 | $ | 12 | |||||||||||
| Available-for-sale debt securities in an unrealized loss position: | |||||||||||||||||||||||||||||||||||
| September 30, 2022 | |||||||||||||||||||||||||||||||||||
Less than 12 months 1 | 12 months or more 1 | Total | |||||||||||||||||||||||||||||||||
| (Millions of dollars) | Fair Value | Unrealized Losses | Fair Value | Unrealized Losses | Fair Value | Unrealized Losses | |||||||||||||||||||||||||||||
| Government debt securities | |||||||||||||||||||||||||||||||||||
| Other U.S. and non-U.S. government bonds | $ | 31 | $ | 1 | $ | 15 | $ | 1 | $ | 46 | $ | 2 | |||||||||||||||||||||||
| Corporate debt securities | |||||||||||||||||||||||||||||||||||
| Corporate bonds | 1,774 | 75 | 218 | 33 | 1,992 | 108 | |||||||||||||||||||||||||||||
| Asset-backed securities | 102 | 4 | 35 | 1 | 137 | 5 | |||||||||||||||||||||||||||||
| Mortgage-backed debt securities | |||||||||||||||||||||||||||||||||||
| U.S. governmental agency | 293 | 27 | 51 | 9 | 344 | 36 | |||||||||||||||||||||||||||||
| Commercial | 88 | 7 | 41 | 3 | 129 | 10 | |||||||||||||||||||||||||||||
| $ | 2,288 | $ | 114 | $ | 360 | $ | 47 | $ | 2,648 | $ | 161 | ||||||||||||||||||||||||
| December 31, 2016 | December 31, 2021 | |||||||||||||||||||||||||||||||||||||||||||||||||||||||||
Less than 12 months 1 | 12 months or more 1 | Total | Less than 12 months 1 | 12 months or more 1 | Total | |||||||||||||||||||||||||||||||||||||||||||||||||||||
| (Millions of dollars) | Fair Value | Unrealized Losses | Fair Value | Unrealized Losses | Fair Value | Unrealized Losses | (Millions of dollars) | Fair Value | Unrealized Losses | Fair Value | Unrealized Losses | Fair Value | Unrealized Losses | |||||||||||||||||||||||||||||||||||||||||||||
| Corporate debt securities | Corporate debt securities | |||||||||||||||||||||||||||||||||||||||||||||||||||||||||
| Corporate bonds | Corporate bonds | $ | 270 | $ | 4 | $ | 33 | $ | 1 | $ | 303 | $ | 5 | |||||||||||||||||||||||||||||||||||||||||||||
| Corporate bonds | $ | 131 | $ | 1 | $ | 13 | $ | — | $ | 144 | $ | 1 | ||||||||||||||||||||||||||||||||||||||||||||||
| Mortgage-backed debt securities | Mortgage-backed debt securities | |||||||||||||||||||||||||||||||||||||||||||||||||||||||||
| U.S. governmental agency | 167 | 2 | 11 | — | 178 | 2 | U.S. governmental agency | 89 | 1 | 22 | — | 111 | 1 | |||||||||||||||||||||||||||||||||||||||||||||
| Equity securities | ||||||||||||||||||||||||||||||||||||||||||||||||||||||||||
| Large capitalization value | 68 | 6 | 11 | 2 | 79 | 8 | ||||||||||||||||||||||||||||||||||||||||||||||||||||
| Smaller company growth | 10 | 1 | 3 | 1 | 13 | 2 | ||||||||||||||||||||||||||||||||||||||||||||||||||||
| Total | $ | 376 | $ | 10 | $ | 38 | $ | 3 | $ | 414 | $ | 13 | Total | $ | 359 | $ | 5 | $ | 55 | $ | 1 | $ | 414 | $ | 6 | |||||||||||||||||||||||||||||||||
1 Indicates the length of time that individual securities have been in a continuous unrealized loss position. | 1 Indicates the length of time that individual securities have been in a continuous unrealized loss position. | |||||||||||||||||||||||||||||||||||||||||||||||||||||||||
| September 30, 2022 | |||||||||||
| (Millions of dollars) | Cost Basis | Fair Value | |||||||||
| Due in one year or less | $ | 696 | $ | 687 | |||||||
| Due after one year through five years | 1,354 | 1,277 | |||||||||
| Due after five years through ten years | 282 | 256 | |||||||||
| Due after ten years | 70 | 67 | |||||||||
| U.S. governmental agency mortgage-backed securities | 384 | 348 | |||||||||
| Residential mortgage-backed securities | 3 | 3 | |||||||||
| Commercial mortgage-backed securities | 139 | 129 | |||||||||
| Total debt securities – available-for-sale | $ | 2,928 | $ | 2,767 | |||||||
| Sales of available-for-sale debt securities: | |||||||||||||||||||||||
| Three Months Ended September 30 | Nine Months Ended September 30 | ||||||||||||||||||||||
| (Millions of dollars) | 2022 | 2021 | 2022 | 2021 | |||||||||||||||||||
| Proceeds from the sale of available-for-sale securities | $ | 204 | $ | 97 | $ | 474 | $ | 322 | |||||||||||||||
| Gross gains from the sale of available-for-sale securities | — | 1 | 1 | 3 | |||||||||||||||||||
| Gross losses from the sale of available-for-sale securities | — | — | 1 | — | |||||||||||||||||||
| September 30, 2017 | |||||||
| (Millions of dollars) | Cost Basis | Fair Value | |||||
| Due in one year or less | $ | 169 | $ | 170 | |||
| Due after one year through five years | 415 | 417 | |||||
| Due after five years through ten years | 55 | 55 | |||||
| Due after ten years | 24 | 24 | |||||
| U.S. governmental agency mortgage-backed securities | 245 | 243 | |||||
| Residential mortgage-backed securities | 8 | 8 | |||||
| Commercial mortgage-backed securities | 17 | 17 | |||||
| Total debt securities – available-for-sale | $ | 933 | $ | 934 | |||
| Sales of Securities: | |||||||||||||||
| Three Months Ended September 30 | Nine Months Ended September 30 | ||||||||||||||
| (Millions of dollars) | 2017 | 2016 | 2017 | 2016 | |||||||||||
| Proceeds from the sale of available-for-sale securities | $ | 244 | $ | 109 | $ | 431 | $ | 304 | |||||||
| Gross gains from the sale of available-for-sale securities | $ | 38 | $ | 10 | $ | 40 | $ | 43 | |||||||
| Gross losses from the sale of available-for-sale securities | $ | 1 | $ | 1 | $ | 3 | $ | 3 | |||||||
U.S. Pension Benefits | Non-U.S. Pension Benefits | Other Postretirement Benefits | |||||||||||||||||||||||||||||||||
| September 30 | September 30 | September 30 | |||||||||||||||||||||||||||||||||
| (Millions of dollars) | 2022 | 2021 | 2022 | 2021 | 2022 | 2021 | |||||||||||||||||||||||||||||
| For the three months ended: | |||||||||||||||||||||||||||||||||||
| Components of net periodic benefit cost: | |||||||||||||||||||||||||||||||||||
| Service cost | $ | — | $ | — | $ | 15 | $ | 15 | $ | 24 | $ | 25 | |||||||||||||||||||||||
| Interest cost | 100 | 82 | 17 | 16 | 20 | 16 | |||||||||||||||||||||||||||||
| Expected return on plan assets | (167) | (180) | (33) | (33) | (3) | (1) | |||||||||||||||||||||||||||||
| Amortization of prior service cost (credit) | — | — | — | — | (1) | (11) | |||||||||||||||||||||||||||||
Net periodic benefit cost (benefit) 1 | $ | (67) | $ | (98) | $ | (1) | $ | (2) | $ | 40 | $ | 29 | |||||||||||||||||||||||
| For the nine months ended: | |||||||||||||||||||||||||||||||||||
| Components of net periodic benefit cost: | |||||||||||||||||||||||||||||||||||
| Service cost | $ | — | $ | — | $ | 40 | $ | 44 | $ | 74 | $ | 75 | |||||||||||||||||||||||
| Interest cost | 301 | 247 | 53 | 43 | 60 | 48 | |||||||||||||||||||||||||||||
| Expected return on plan assets | (502) | (538) | (100) | (98) | (9) | (4) | |||||||||||||||||||||||||||||
| Amortization of prior service cost (credit) | — | — | — | — | (4) | (31) | |||||||||||||||||||||||||||||
Net periodic benefit cost (benefit) 1 | $ | (201) | $ | (291) | $ | (7) | $ | (11) | $ | 121 | $ | 88 | |||||||||||||||||||||||
U.S. Pension Benefits | Non-U.S. Pension Benefits | Other Postretirement Benefits | |||||||||||||||||||||
(Millions of dollars) | September 30 | September 30 | September 30 | ||||||||||||||||||||
| 2017 | 2016 | 2017 | 2016 | 2017 | 2016 | ||||||||||||||||||
| For the three months ended: | |||||||||||||||||||||||
| Components of net periodic benefit cost: | |||||||||||||||||||||||
| Service cost | $ | 29 | $ | 30 | $ | 23 | $ | 22 | $ | 19 | $ | 20 | |||||||||||
| Interest cost | 131 | 129 | 23 | 30 | 33 | 33 | |||||||||||||||||
| Expected return on plan assets | (184 | ) | (190 | ) | (55 | ) | (59 | ) | (10 | ) | (11 | ) | |||||||||||
Amortization of prior service cost (credit) 1 | — | — | — | — | (6 | ) | (15 | ) | |||||||||||||||
| Net periodic benefit cost (benefit) | (24 | ) | (31 | ) | (9 | ) | (7 | ) | 36 | 27 | |||||||||||||
Curtailments and termination benefits 2 | — | — | — | 1 | — | — | |||||||||||||||||
| Total cost (benefit) included in operating profit | $ | (24 | ) | $ | (31 | ) | $ | (9 | ) | $ | (6 | ) | $ | 36 | $ | 27 | |||||||
| For the nine months ended: | |||||||||||||||||||||||
| Components of net periodic benefit cost: | |||||||||||||||||||||||
| Service cost | $ | 87 | $ | 89 | $ | 70 | $ | 68 | $ | 58 | $ | 61 | |||||||||||
| Interest cost | 393 | 388 | 73 | 90 | 98 | 98 | |||||||||||||||||
| Expected return on plan assets | (551 | ) | (568 | ) | (168 | ) | (176 | ) | (28 | ) | (33 | ) | |||||||||||
Amortization of prior service cost (credit) 1 | — | — | (1 | ) | — | (17 | ) | (45 | ) | ||||||||||||||
| Net periodic benefit cost (benefit) | (71 | ) | (91 | ) | (26 | ) | (18 | ) | 111 | 81 | |||||||||||||
Curtailments and termination benefits 2 | 9 | — | 20 | 1 | — | (2 | ) | ||||||||||||||||
| Total cost (benefit) included in operating profit | $ | (62 | ) | $ | (91 | ) | $ | (6 | ) | $ | (17 | ) | $ | 111 | $ | 79 | |||||||
| Weighted-average assumptions used to determine net cost: | |||||||||||||||||||||||
| Discount rate used to measure service cost | 4.2 | % | 4.5 | % | 2.3 | % | 2.9 | % | 3.9 | % | 4.4 | % | |||||||||||
| Discount rate used to measure interest cost | 3.3 | % | 3.4 | % | 2.3 | % | 2.8 | % | 3.3 | % | 3.3 | % | |||||||||||
| Expected rate of return on plan assets | 6.7 | % | 6.9 | % | 5.9 | % | 6.1 | % | 7.5 | % | 7.5 | % | |||||||||||
| Rate of compensation increase | 4.0 | % | 4.0 | % | 4.0 | % | 3.5 | % | 4.0 | % | 4.0 | % | |||||||||||
| Three Months Ended September 30 | Nine Months Ended September 30 | ||||||||||||||||||||||
| (Millions of dollars) | 2022 | 2021 | 2022 | 2021 | |||||||||||||||||||
| U.S. Plans | $ | 87 | $ | 81 | $ | 236 | $ | 321 | |||||||||||||||
| Non-U.S. Plans | 29 | 29 | 85 | 83 | |||||||||||||||||||
| $ | 116 | $ | 110 | $ | 321 | $ | 404 | ||||||||||||||||
| Three Months Ended September 30 | Nine Months Ended September 30 | ||||||||||||||
| (Millions of dollars) | 2017 | 2016 | 2017 | 2016 | |||||||||||
| U.S. Plans | $ | 97 | $ | 83 | $ | 267 | $ | 235 | |||||||
| Non-U.S. Plans | 19 | 16 | 54 | 51 | |||||||||||
| $ | 116 | $ | 99 | $ | 321 | $ | 286 | ||||||||
| Three Months Ended September 30 | Nine Months Ended September 30 | |||||||||||||||||||||||||
| (Millions of dollars) | 2022 | 2021 | 2022 | 2021 | ||||||||||||||||||||||
| Finance lease revenue | $ | 105 | $ | 120 | $ | 326 | $ | 369 | ||||||||||||||||||
| Operating lease revenue | 270 | 275 | 819 | 850 | ||||||||||||||||||||||
| Total | $ | 375 | $ | 395 | $ | 1,145 | $ | 1,219 | ||||||||||||||||||
| (Millions of dollars) | September 30, 2022 | December 31, 2021 | |||||||||
| Caterpillar dealer performance guarantees | $ | 137 | $ | 747 | |||||||
| Supplier consortium performance guarantee | 17 | 242 | |||||||||
| Other guarantees | 284 | 232 | |||||||||
| Total guarantees | $ | 438 | $ | 1,221 | |||||||
| (Millions of dollars) | September 30, 2017 | December 31, 2016 | |||||
| Caterpillar dealer performance guarantees | $ | 1,425 | $ | 1,384 | |||
| Customer loan guarantees | 51 | 51 | |||||
| Supplier consortium performance guarantee | 564 | 278 | |||||
| Third party logistics business lease guarantees | 73 | 87 | |||||
| Other guarantees | 100 | 56 | |||||
| Total guarantees | $ | 2,213 | $ | 1,856 | |||
| (Millions of dollars) | 2017 | |||
| Warranty liability, January 1 | $ | 1,258 | ||
| Reduction in liability (payments) | (637 | ) | ||
| Increase in liability (new warranties) | 749 | |||
| Warranty liability, September 30 | $ | 1,370 | ||
| (Millions of dollars) | 2016 | |||
| Warranty liability, January 1 | $ | 1,354 | ||
| Reduction in liability (payments) | (909 | ) | ||
| Increase in liability (new warranties) | 813 | |||
| Warranty liability, December 31 | $ | 1,258 | ||
| Computations of profit per share: | Three Months Ended September 30 | Nine Months Ended September 30 | |||||||||||||||
| (Dollars in millions except per share data) | 2017 | 2016 | 2017 | 2016 | |||||||||||||
Profit for the period (A) 1 | $ | 1,059 | $ | 283 | $ | 2,053 | $ | 1,104 | |||||||||
| Determination of shares (in millions): | |||||||||||||||||
| Weighted-average number of common shares outstanding (B) | 592.9 | 584.7 | 590.3 | 583.8 | |||||||||||||
| Shares issuable on exercise of stock awards, net of shares assumed to be purchased out of proceeds at average market price | 7.2 | 4.9 | 6.2 | 4.9 | |||||||||||||
Average common shares outstanding for fully diluted computation (C) 2 | 600.1 | 589.6 | 596.5 | 588.7 | |||||||||||||
| Profit per share of common stock: | |||||||||||||||||
| Assuming no dilution (A/B) | $ | 1.79 | $ | 0.48 | $ | 3.48 | $ | 1.89 | |||||||||
Assuming full dilution (A/C) 2 | $ | 1.77 | $ | 0.48 | $ | 3.44 | $ | 1.88 | |||||||||
| Shares outstanding as of September 30 (in millions) | 594.9 | 585.1 | |||||||||||||||
1 Profit attributable to common shareholders. | |||||||||||||||||
2 Diluted by assumed exercise of stock-based compensation awards using the treasury stock method. | |||||||||||||||||
| First Nine Months | |||||||||||
| (Millions of dollars) | 2022 | 2021 | |||||||||
| Warranty liability, beginning of period | $ | 1,689 | $ | 1,612 | |||||||
| Reduction in liability (payments) | (589) | (638) | |||||||||
| Increase in liability (new warranties) | 562 | 716 | |||||||||
| Warranty liability, end of period | $ | 1,662 | $ | 1,690 | |||||||
| Computations of profit per share: | Three Months Ended September 30 | Nine Months Ended September 30 | |||||||||||||||||||||||||||
| (Dollars in millions except per share data) | 2022 | 2021 | 2022 | 2021 | |||||||||||||||||||||||||
Profit for the period (A) 1 | $ | 2,041 | $ | 1,426 | $ | 5,251 | $ | 4,369 | |||||||||||||||||||||
| Determination of shares (in millions): | |||||||||||||||||||||||||||||
| Weighted-average number of common shares outstanding (B) | 525.0 | 544.0 | 530.1 | 545.8 | |||||||||||||||||||||||||
| Shares issuable on exercise of stock awards, net of shares assumed to be purchased out of proceeds at average market price | 2.6 | 3.6 | 3.1 | 4.4 | |||||||||||||||||||||||||
Average common shares outstanding for fully diluted computation (C) 2 | 527.6 | 547.6 | 533.2 | 550.2 | |||||||||||||||||||||||||
| Profit per share of common stock: | |||||||||||||||||||||||||||||
| Assuming no dilution (A/B) | $ | 3.89 | $ | 2.62 | $ | 9.91 | $ | 8.00 | |||||||||||||||||||||
Assuming full dilution (A/C) 2 | $ | 3.87 | $ | 2.60 | $ | 9.85 | $ | 7.94 | |||||||||||||||||||||
| Shares outstanding as of September 30 (in millions) | 520.4 | 540.9 | |||||||||||||||||||||||||||
1 Profit attributable to common shareholders. | |||||||||||||||||||||||||||||
2 Diluted by assumed exercise of stock-based compensation awards using the treasury stock method. | |||||||||||||||||||||||||||||
| (Millions of dollars) | Foreign currency translation | Pension and other postretirement benefits | Derivative financial instruments | Available-for-sale securities | Total | |||||||||||||||
| Three Months Ended September 30, 2017 | ||||||||||||||||||||
| Balance at June 30, 2017 | $ | (1,499 | ) | $ | 14 | $ | (39 | ) | $ | 53 | $ | (1,471 | ) | |||||||
| Other comprehensive income (loss) before reclassifications | 237 | — | (4 | ) | 11 | 244 | ||||||||||||||
| Amounts reclassified from accumulated other comprehensive (income) loss | 11 | (4 | ) | 11 | (24 | ) | (6 | ) | ||||||||||||
| Other comprehensive income (loss) | 248 | (4 | ) | 7 | (13 | ) | 238 | |||||||||||||
| Balance at September 30, 2017 | $ | (1,251 | ) | $ | 10 | $ | (32 | ) | $ | 40 | $ | (1,233 | ) | |||||||
| Three Months Ended September 30, 2016 | ||||||||||||||||||||
| Balance at June 30, 2016 | $ | (1,648 | ) | $ | 29 | $ | (49 | ) | $ | 35 | $ | (1,633 | ) | |||||||
| Other comprehensive income (loss) before reclassifications | 124 | 2 | (28 | ) | 5 | 103 | ||||||||||||||
| Amounts reclassified from accumulated other comprehensive (income) loss | 13 | (10 | ) | 6 | (6 | ) | 3 | |||||||||||||
| Other comprehensive income (loss) | 137 | (8 | ) | (22 | ) | (1 | ) | 106 | ||||||||||||
| Balance at September 30, 2016 | $ | (1,511 | ) | $ | 21 | $ | (71 | ) | $ | 34 | $ | (1,527 | ) | |||||||
| (Millions of dollars) | Foreign currency translation | Pension and other postretirement benefits | Derivative financial instruments | Available-for-sale securities | Total | |||||||||||||||
| Nine Months Ended September 30, 2017 | ||||||||||||||||||||
| Balance at December 31, 2016 | $ | (1,970 | ) | $ | 14 | $ | (115 | ) | $ | 32 | $ | (2,039 | ) | |||||||
| Other comprehensive income (loss) before reclassifications | 706 | 8 | 6 | 29 | 749 | |||||||||||||||
| Amounts reclassified from accumulated other comprehensive (income) loss | 13 | (12 | ) | 77 | (21 | ) | 57 | |||||||||||||
| Other comprehensive income (loss) | 719 | (4 | ) | 83 | 8 | 806 | ||||||||||||||
| Balance at September 30, 2017 | $ | (1,251 | ) | $ | 10 | $ | (32 | ) | $ | 40 | $ | (1,233 | ) | |||||||
| Nine Months Ended September 30, 2016 | ||||||||||||||||||||
| Balance at December 31, 2015 | $ | (1,953 | ) | $ | (69 | ) | $ | (50 | ) | $ | 37 | $ | (2,035 | ) | ||||||
| Other comprehensive income (loss) before reclassifications | 429 | 119 | (37 | ) | 21 | 532 | ||||||||||||||
| Amounts reclassified from accumulated other comprehensive (income) loss | 13 | (29 | ) | 16 | (24 | ) | (24 | ) | ||||||||||||
| Other comprehensive income (loss) | 442 | 90 | (21 | ) | (3 | ) | 508 | |||||||||||||
| Balance at September 30, 2016 | $ | (1,511 | ) | $ | 21 | $ | (71 | ) | $ | 34 | $ | (1,527 | ) | |||||||
| Three Months Ended September 30 | ||||||||||
| (Millions of dollars) | Classification of income (expense) | 2017 | 2016 | |||||||
| Foreign currency translation | ||||||||||
| Gain (loss) on foreign currency translation | Other income (expense) | $ | (11 | ) | $ | (13 | ) | |||
| Tax (provision) benefit | — | — | ||||||||
| Reclassifications net of tax | $ | (11 | ) | $ | (13 | ) | ||||
| Pension and other postretirement benefits: | ||||||||||
| Amortization of prior service credit (cost) | Note 9 1 | $ | 6 | $ | 15 | |||||
| Tax (provision) benefit | (2 | ) | (5 | ) | ||||||
| Reclassifications net of tax | $ | 4 | $ | 10 | ||||||
| Derivative financial instruments: | ||||||||||
| Foreign exchange contracts | Other income (expense) | $ | (16 | ) | $ | (6 | ) | |||
| Interest rate contracts | Interest expense excluding Financial Products | (2 | ) | (2 | ) | |||||
| Interest rate contracts | Interest expense of Financial Products | 2 | — | |||||||
| Reclassifications before tax | (16 | ) | (8 | ) | ||||||
| Tax (provision) benefit | 5 | 2 | ||||||||
| Reclassifications net of tax | $ | (11 | ) | $ | (6 | ) | ||||
| Available-for-sale securities: | ||||||||||
| Realized gain (loss) | Other income (expense) | $ | 36 | $ | 9 | |||||
| Tax (provision) benefit | (12 | ) | (3 | ) | ||||||
| Reclassifications net of tax | $ | 24 | $ | 6 | ||||||
| Total reclassifications from Accumulated other comprehensive income (loss) | $ | 6 | $ | (3 | ) | |||||
1Amounts are included in the calculation of net periodic benefit cost. See Note 9 for additional information. | ||||||||||
| Three Months Ended September 30 | Nine Months Ended September 30 | ||||||||||||||||||||||
| (Millions of dollars) | 2022 | 2021 | 2022 | 2021 | |||||||||||||||||||
| Foreign currency translation: | |||||||||||||||||||||||
| Beginning balance | $ | (2,282) | $ | (1,158) | $ | (1,508) | $ | (910) | |||||||||||||||
| Gains (losses) on foreign currency translation | (592) | (230) | (1,328) | (461) | |||||||||||||||||||
| Less: Tax provision /(benefit) | 26 | 12 | 64 | 29 | |||||||||||||||||||
| Net gains (losses) on foreign currency translation | (618) | (242) | (1,392) | (490) | |||||||||||||||||||
| (Gains) losses reclassified to earnings | — | — | — | — | |||||||||||||||||||
| Less: Tax provision /(benefit) | — | — | — | — | |||||||||||||||||||
| Net (gains) losses reclassified to earnings | — | — | — | — | |||||||||||||||||||
| Other comprehensive income (loss), net of tax | (618) | (242) | (1,392) | (490) | |||||||||||||||||||
| Ending balance | $ | (2,900) | $ | (1,400) | $ | (2,900) | $ | (1,400) | |||||||||||||||
| Pension and other postretirement benefits | |||||||||||||||||||||||
| Beginning balance | $ | (64) | $ | (47) | $ | (62) | $ | (32) | |||||||||||||||
| Current year prior service credit (cost) | — | — | — | — | |||||||||||||||||||
| Less: Tax provision /(benefit) | — | — | — | — | |||||||||||||||||||
| Net current year prior service credit (cost) | — | — | — | — | |||||||||||||||||||
| Amortization of prior service (credit) cost | (1) | (11) | (4) | (31) | |||||||||||||||||||
| Less: Tax provision /(benefit) | — | (3) | (1) | (8) | |||||||||||||||||||
| Net amortization of prior service (credit) cost | (1) | (8) | (3) | (23) | |||||||||||||||||||
| Other comprehensive income (loss), net of tax | (1) | (8) | (3) | (23) | |||||||||||||||||||
| Ending balance | $ | (65) | $ | (55) | $ | (65) | $ | (55) | |||||||||||||||
| Derivative financial instruments | |||||||||||||||||||||||
| Beginning balance | $ | (66) | $ | 12 | $ | (3) | $ | — | |||||||||||||||
| Gains (losses) deferred | 44 | 45 | 298 | 141 | |||||||||||||||||||
| Less: Tax provision /(benefit) | 35 | 3 | 71 | 22 | |||||||||||||||||||
| Net gains (losses) deferred | 9 | 42 | 227 | 119 | |||||||||||||||||||
| (Gains) losses reclassified to earnings | (296) | (85) | (636) | (164) | |||||||||||||||||||
| Less: Tax provision /(benefit) | (96) | (12) | (155) | (26) | |||||||||||||||||||
| Net (gains) losses reclassified to earnings | (200) | (73) | (481) | (138) | |||||||||||||||||||
| Other comprehensive income (loss), net of tax | (191) | (31) | (254) | (19) | |||||||||||||||||||
| Ending balance | $ | (257) | $ | (19) | $ | (257) | $ | (19) | |||||||||||||||
| Available-for-sale securities | |||||||||||||||||||||||
| Beginning balance | $ | (87) | $ | 39 | $ | 20 | $ | 54 | |||||||||||||||
| Gains (losses) deferred | (55) | (4) | (188) | (22) | |||||||||||||||||||
| Less: Tax provision /(benefit) | (11) | — | (37) | (4) | |||||||||||||||||||
| Net gains (losses) deferred | (44) | (4) | (151) | (18) | |||||||||||||||||||
| (Gains) losses reclassified to earnings | — | (1) | — | (3) | |||||||||||||||||||
| Less: Tax provision /(benefit) | — | — | — | (1) | |||||||||||||||||||
| Net (gains) losses reclassified to earnings | — | (1) | — | (2) | |||||||||||||||||||
| Other comprehensive income (loss), net of tax | (44) | (5) | (151) | (20) | |||||||||||||||||||
| Ending balance | $ | (131) | $ | 34 | $ | (131) | $ | 34 | |||||||||||||||
| Total AOCI Ending Balance at September 30 | $ | (3,353) | $ | (1,440) | $ | (3,353) | $ | (1,440) | |||||||||||||||
| Nine Months Ended September 30 | ||||||||||
| (Millions of dollars) | Classification of income (expense) | 2017 | 2016 | |||||||
| Foreign currency translation | ||||||||||
| Gain (loss) on foreign currency translation | Other income (expense) | $ | (13 | ) | $ | (13 | ) | |||
| Tax (provision) benefit | — | — | ||||||||
| Reclassifications net of tax | $ | (13 | ) | $ | (13 | ) | ||||
| Pension and other postretirement benefits: | ||||||||||
| Amortization of prior service credit (cost) | Note 9 1 | $ | 18 | $ | 45 | |||||
| Tax (provision) benefit | (6 | ) | (16 | ) | ||||||
| Reclassifications net of tax | $ | 12 | $ | 29 | ||||||
| Derivative financial instruments: | ||||||||||
| Foreign exchange contracts | Other income (expense) | $ | (118 | ) | $ | (16 | ) | |||
| Interest rate contracts | Interest expense excluding Financial Products | (5 | ) | (5 | ) | |||||
| Interest rate contracts | Interest expense of Financial Products | 5 | (3 | ) | ||||||
| Reclassifications before tax | (118 | ) | (24 | ) | ||||||
| Tax (provision) benefit | 41 | 8 | ||||||||
| Reclassifications net of tax | $ | (77 | ) | $ | (16 | ) | ||||
| Available-for-sale securities: | ||||||||||
| Realized gain (loss) | Other income (expense) | $ | 32 | $ | 36 | |||||
| Tax (provision) benefit | (11 | ) | (12 | ) | ||||||
| Reclassifications net of tax | $ | 21 | $ | 24 | ||||||
| Total reclassifications from Accumulated other comprehensive income (loss) | $ | (57 | ) | $ | 24 | |||||
1Amounts are included in the calculation of net periodic benefit cost. See Note 9 for additional information. | ||||||||||
| Sales and Revenues by Geographic Region | ||||||||||||||||||||||||||||||||||||||||||||
| (Millions of dollars) | North America | Latin America | EAME | Asia/ Pacific | External Sales and Revenues | Intersegment Sales and Revenues | Total Sales and Revenues | |||||||||||||||||||||||||||||||||||||
| Three Months Ended September 30, 2022 | ||||||||||||||||||||||||||||||||||||||||||||
| Construction Industries | $ | 3,106 | $ | 799 | $ | 1,247 | $ | 1,084 | $ | 6,236 | $ | 40 | $ | 6,276 | ||||||||||||||||||||||||||||||
| Resource Industries | 1,122 | 472 | 526 | 893 | 3,013 | 74 | 3,087 | |||||||||||||||||||||||||||||||||||||
| Energy & Transportation | 2,422 | 468 | 1,280 | 827 | 4,997 | 1,189 | 6,186 | |||||||||||||||||||||||||||||||||||||
| Financial Products Segment | 522 | 90 | 100 | 107 | 819 | 1 | — | 819 | ||||||||||||||||||||||||||||||||||||
| Total sales and revenues from reportable segments | 7,172 | 1,829 | 3,153 | 2,911 | 15,065 | 1,303 | 16,368 | |||||||||||||||||||||||||||||||||||||
| All Other operating segment | 16 | — | 4 | 15 | 35 | 68 | 103 | |||||||||||||||||||||||||||||||||||||
| Corporate Items and Eliminations | (53) | (20) | (12) | (21) | (106) | (1,371) | (1,477) | |||||||||||||||||||||||||||||||||||||
| Total Sales and Revenues | $ | 7,135 | $ | 1,809 | $ | 3,145 | $ | 2,905 | $ | 14,994 | $ | — | $ | 14,994 | ||||||||||||||||||||||||||||||
| Three Months Ended September 30, 2021 | ||||||||||||||||||||||||||||||||||||||||||||
| Construction Industries | $ | 2,417 | $ | 528 | $ | 1,240 | $ | 1,076 | $ | 5,261 | $ | (6) | $ | 5,255 | ||||||||||||||||||||||||||||||
| Resource Industries | 674 | 417 | 456 | 744 | 2,291 | 75 | 2,366 | |||||||||||||||||||||||||||||||||||||
| Energy & Transportation | 1,924 | 329 | 1,144 | 744 | 4,141 | 936 | 5,077 | |||||||||||||||||||||||||||||||||||||
| Financial Products Segment | 478 | 68 | 105 | 111 | 762 | 1 | — | 762 | ||||||||||||||||||||||||||||||||||||
| Total sales and revenues from reportable segments | 5,493 | 1,342 | 2,945 | 2,675 | 12,455 | 1,005 | 13,460 | |||||||||||||||||||||||||||||||||||||
| All Other operating segment | 18 | — | 3 | 14 | 35 | 84 | 119 | |||||||||||||||||||||||||||||||||||||
| Corporate Items and Eliminations | (56) | (13) | (9) | (15) | (93) | (1,089) | (1,182) | |||||||||||||||||||||||||||||||||||||
| Total Sales and Revenues | $ | 5,455 | $ | 1,329 | $ | 2,939 | $ | 2,674 | $ | 12,397 | $ | — | $ | 12,397 | ||||||||||||||||||||||||||||||
| Reportable Segments | |||||||||||||||||||||||||||
| Three Months Ended September 30 | |||||||||||||||||||||||||||
| (Millions of dollars) | |||||||||||||||||||||||||||
| 2017 | |||||||||||||||||||||||||||
External sales and revenues | Inter- segment sales and revenues | Total sales and revenues | Depreciation and amortization | Segment profit | Segment assets at September 30 | Capital expenditures | |||||||||||||||||||||
| Construction Industries | $ | 4,854 | $ | 32 | $ | 4,886 | $ | 99 | $ | 884 | $ | 4,739 | $ | 50 | |||||||||||||
| Resource Industries | 1,870 | 86 | 1,956 | 129 | 226 | 6,596 | 41 | ||||||||||||||||||||
| Energy & Transportation | 3,961 | 877 | 4,838 | 165 | 750 | 7,502 | 113 | ||||||||||||||||||||
| Machinery, Energy & Transportation | $ | 10,685 | $ | 995 | $ | 11,680 | $ | 393 | $ | 1,860 | $ | 18,837 | $ | 204 | |||||||||||||
| Financial Products Segment | 774 | — | 774 | 204 | 185 | 35,415 | 308 | ||||||||||||||||||||
| Total | $ | 11,459 | $ | 995 | $ | 12,454 | $ | 597 | $ | 2,045 | $ | 54,252 | $ | 512 | |||||||||||||
| 2016 | |||||||||||||||||||||||||||
External sales and revenues | Inter- segment sales and revenues | Total sales and revenues | Depreciation and amortization | Segment profit (loss) | Segment assets at December 31 | Capital expenditures | |||||||||||||||||||||
| Construction Industries | $ | 3,554 | $ | 27 | $ | 3,581 | $ | 117 | $ | 326 | $ | 5,367 | $ | 46 | |||||||||||||
| Resource Industries | 1,377 | 69 | 1,446 | 150 | (77 | ) | 7,135 | 68 | |||||||||||||||||||
| Energy & Transportation | 3,534 | 629 | 4,163 | 170 | 572 | 7,791 | 97 | ||||||||||||||||||||
| Machinery, Energy & Transportation | $ | 8,465 | $ | 725 | $ | 9,190 | $ | 437 | $ | 821 | $ | 20,293 | $ | 211 | |||||||||||||
| Financial Products Segment | 749 | — | 749 | 215 | 183 | 35,224 | 357 | ||||||||||||||||||||
| Total | $ | 9,214 | $ | 725 | $ | 9,939 | $ | 652 | $ | 1,004 | $ | 55,517 | $ | 568 | |||||||||||||
| Reportable Segments | |||||||||||||||||||||||||||
| Nine Months Ended September 30 | |||||||||||||||||||||||||||
| (Millions of dollars) | |||||||||||||||||||||||||||
| 2017 | |||||||||||||||||||||||||||
External sales and revenues | Inter- segment sales and revenues | Total sales and revenues | Depreciation and amortization | Segment profit | Segment assets at September 30 | Capital expenditures | |||||||||||||||||||||
| Construction Industries | $ | 13,875 | $ | 70 | $ | 13,945 | $ | 301 | $ | 2,420 | $ | 4,739 | $ | 107 | |||||||||||||
| Resource Industries | 5,299 | 254 | 5,553 | 386 | 481 | 6,596 | 93 | ||||||||||||||||||||
| Energy & Transportation | 11,258 | 2,484 | 13,742 | 485 | 2,002 | 7,502 | 320 | ||||||||||||||||||||
| Machinery, Energy & Transportation | $ | 30,432 | $ | 2,808 | $ | 33,240 | $ | 1,172 | $ | 4,903 | $ | 18,837 | $ | 520 | |||||||||||||
| Financial Products Segment | 2,310 | — | 2,310 | 616 | 559 | 35,415 | 1,018 | ||||||||||||||||||||
| Total | $ | 32,742 | $ | 2,808 | $ | 35,550 | $ | 1,788 | $ | 5,462 | $ | 54,252 | $ | 1,538 | |||||||||||||
| 2016 | |||||||||||||||||||||||||||
External sales and revenues | Inter- segment sales and revenues | Total sales and revenues | Depreciation and amortization | Segment profit (loss) | Segment assets at December 31 | Capital expenditures | |||||||||||||||||||||
| Construction Industries | $ | 12,023 | $ | 47 | $ | 12,070 | $ | 346 | $ | 1,316 | $ | 5,367 | $ | 114 | |||||||||||||
| Resource Industries | 4,283 | 197 | 4,480 | 458 | (336 | ) | 7,135 | 162 | |||||||||||||||||||
| Energy & Transportation | 10,562 | 1,919 | 12,481 | 505 | 1,584 | 7,791 | 340 | ||||||||||||||||||||
| Machinery, Energy & Transportation | $ | 26,868 | $ | 2,163 | $ | 29,031 | $ | 1,309 | $ | 2,564 | $ | 20,293 | $ | 616 | |||||||||||||
| Financial Products Segment | 2,251 | — | 2,251 | 633 | 553 | 35,224 | 1,266 | ||||||||||||||||||||
| Total | $ | 29,119 | $ | 2,163 | $ | 31,282 | $ | 1,942 | $ | 3,117 | $ | 55,517 | $ | 1,882 | |||||||||||||
| Reconciliation of Sales and revenues: | |||||||||||||||
| (Millions of dollars) | Machinery, Energy & Transportation | Financial Products | Consolidating Adjustments | Consolidated Total | |||||||||||
| Three Months Ended September 30, 2017 | |||||||||||||||
| Total external sales and revenues from reportable segments | $ | 10,685 | $ | 774 | $ | — | $ | 11,459 | |||||||
| All Other operating segments | 56 | — | — | 56 | |||||||||||
| Other | (28 | ) | 19 | (93 | ) | 1 | (102 | ) | |||||||
| Total sales and revenues | $ | 10,713 | $ | 793 | $ | (93 | ) | $ | 11,413 | ||||||
| Three Months Ended September 30, 2016 | |||||||||||||||
| Total external sales and revenues from reportable segments | $ | 8,465 | $ | 749 | $ | — | $ | 9,214 | |||||||
| All Other operating segments | 28 | — | — | 28 | |||||||||||
| Other | (30 | ) | 19 | (71 | ) | 1 | (82 | ) | |||||||
| Total sales and revenues | $ | 8,463 | $ | 768 | $ | (71 | ) | $ | 9,160 | ||||||
1 Elimination of Financial Products revenues from Machinery, Energy & Transportation. | |||||||||||||||
| Reconciliation of Sales and revenues: | |||||||||||||||
| (Millions of dollars) | Machinery, Energy & Transportation | Financial Products | Consolidating Adjustments | Consolidated Total | |||||||||||
| Nine Months Ended September 30, 2017 | |||||||||||||||
| Total external sales and revenues from reportable segments | $ | 30,432 | $ | 2,310 | $ | — | $ | 32,742 | |||||||
| All Other operating segments | 126 | — | — | 126 | |||||||||||
| Other | (76 | ) | 53 | (279 | ) | 1 | (302 | ) | |||||||
| Total sales and revenues | $ | 30,482 | $ | 2,363 | $ | (279 | ) | $ | 32,566 | ||||||
| Nine Months Ended September 30, 2016 | |||||||||||||||
| Total external sales and revenues from reportable segments | $ | 26,868 | $ | 2,251 | $ | — | $ | 29,119 | |||||||
| All Other operating segments | 107 | — | — | 107 | |||||||||||
| Other | (87 | ) | 54 | (230 | ) | 1 | (263 | ) | |||||||
| Total sales and revenues | $ | 26,888 | $ | 2,305 | $ | (230 | ) | $ | 28,963 | ||||||
1 Elimination of Financial Products revenues from Machinery, Energy & Transportation. | |||||||||||||||
| Reconciliation of Consolidated profit before taxes: | |||||||||||
| (Millions of dollars) | Machinery, Energy & Transportation | Financial Products | Consolidated Total | ||||||||
| Three Months Ended September 30, 2017 | |||||||||||
| Total profit from reportable segments | $ | 1,860 | $ | 185 | $ | 2,045 | |||||
| All Other operating segments | 6 | — | 6 | ||||||||
| Cost centers | 17 | — | 17 | ||||||||
| Corporate costs | (158 | ) | — | (158 | ) | ||||||
| Timing | (21 | ) | — | (21 | ) | ||||||
| Restructuring costs | (89 | ) | (1 | ) | (90 | ) | |||||
| Methodology differences: | |||||||||||
| Inventory/cost of sales | (4 | ) | — | (4 | ) | ||||||
| Postretirement benefit expense | 32 | — | 32 | ||||||||
| Stock-based compensation expense | (46 | ) | (2 | ) | (48 | ) | |||||
| Financing costs | (116 | ) | — | (116 | ) | ||||||
| Currency | (37 | ) | — | (37 | ) | ||||||
| Other income/expense methodology differences | (71 | ) | — | (71 | ) | ||||||
| Other methodology differences | (31 | ) | (1 | ) | (32 | ) | |||||
| Total consolidated profit before taxes | $ | 1,342 | $ | 181 | $ | 1,523 | |||||
| Three Months Ended September 30, 2016 | |||||||||||
| Total profit from reportable segments | $ | 821 | $ | 183 | $ | 1,004 | |||||
| All Other operating segments | (22 | ) | — | (22 | ) | ||||||
| Cost centers | 29 | — | 29 | ||||||||
| Corporate costs | (121 | ) | — | (121 | ) | ||||||
| Timing | 12 | — | 12 | ||||||||
| Restructuring costs | (323 | ) | (1 | ) | (324 | ) | |||||
| Methodology differences: | — | ||||||||||
| Inventory/cost of sales | 19 | — | 19 | ||||||||
| Postretirement benefit expense | 37 | — | 37 | ||||||||
| Stock-based compensation expense | (40 | ) | (1 | ) | (41 | ) | |||||
| Financing costs | (129 | ) | — | (129 | ) | ||||||
| Currency | (10 | ) | — | (10 | ) | ||||||
| Other income/expense methodology differences | (60 | ) | — | (60 | ) | ||||||
| Other methodology differences | (11 | ) | — | (11 | ) | ||||||
| Total consolidated profit before taxes | $ | 202 | $ | 181 | $ | 383 | |||||
| Reconciliation of Consolidated profit before taxes: | |||||||||||
| (Millions of dollars) | Machinery, Energy & Transportation | Financial Products | Consolidated Total | ||||||||
| Nine Months Ended September 30, 2017 | |||||||||||
| Total profit from reportable segments | $ | 4,903 | $ | 559 | $ | 5,462 | |||||
| All Other operating segments | (27 | ) | — | (27 | ) | ||||||
| Cost centers | 13 | — | 13 | ||||||||
| Corporate costs | (447 | ) | — | (447 | ) | ||||||
| Timing | (128 | ) | — | (128 | ) | ||||||
| Restructuring costs | (1,009 | ) | (2 | ) | (1,011 | ) | |||||
| Methodology differences: | |||||||||||
| Inventory/cost of sales | (80 | ) | — | (80 | ) | ||||||
| Postretirement benefit expense | 111 | — | 111 | ||||||||
| Stock-based compensation expense | (158 | ) | (7 | ) | (165 | ) | |||||
| Financing costs | (369 | ) | — | (369 | ) | ||||||
| Currency | (195 | ) | — | (195 | ) | ||||||
| Other income/expense methodology differences | (105 | ) | — | (105 | ) | ||||||
| Other methodology differences | (91 | ) | 3 | (88 | ) | ||||||
| Total consolidated profit before taxes | $ | 2,418 | $ | 553 | $ | 2,971 | |||||
| Nine Months Ended September 30, 2016 | |||||||||||
| Total profit from reportable segments | $ | 2,564 | $ | 553 | $ | 3,117 | |||||
| All Other operating segments | (43 | ) | — | (43 | ) | ||||||
| Cost centers | 68 | — | 68 | ||||||||
| Corporate costs | (429 | ) | — | (429 | ) | ||||||
| Timing | 53 | — | 53 | ||||||||
| Restructuring costs | (619 | ) | (5 | ) | (624 | ) | |||||
| Methodology differences: | |||||||||||
| Inventory/cost of sales | — | — | — | ||||||||
| Postretirement benefit expense | 148 | — | 148 | ||||||||
| Stock-based compensation expense | (180 | ) | (7 | ) | (187 | ) | |||||
| Financing costs | (396 | ) | — | (396 | ) | ||||||
| Currency | (22 | ) | — | (22 | ) | ||||||
| Other income/expense methodology differences | (170 | ) | — | (170 | ) | ||||||
| Other methodology differences | (34 | ) | 6 | (28 | ) | ||||||
| Total consolidated profit before taxes | $ | 940 | $ | 547 | $ | 1,487 | |||||
| Sales and Revenues by Geographic Region | ||||||||||||||||||||||||||||||||||||||||||||
| (Millions of dollars) | North America | Latin America | EAME | Asia/ Pacific | External Sales and Revenues | Intersegment Sales and Revenues | Total Sales and Revenues | |||||||||||||||||||||||||||||||||||||
| Nine Months Ended September 30, 2022 | ||||||||||||||||||||||||||||||||||||||||||||
| Construction Industries | $ | 8,832 | $ | 2,061 | $ | 3,726 | $ | 3,694 | $ | 18,313 | $ | 111 | $ | 18,424 | ||||||||||||||||||||||||||||||
| Resource Industries | 3,167 | 1,337 | 1,609 | 2,554 | 8,667 | 211 | 8,878 | |||||||||||||||||||||||||||||||||||||
| Energy & Transportation | 6,637 | 1,160 | 3,679 | 2,193 | 13,669 | 3,260 | 16,929 | |||||||||||||||||||||||||||||||||||||
| Financial Products Segment | 1,530 | 250 | 293 | 327 | 2,400 | 1 | — | 2,400 | ||||||||||||||||||||||||||||||||||||
| Total sales and revenues from reportable segments | 20,166 | 4,808 | 9,307 | 8,768 | 43,049 | 3,582 | 46,631 | |||||||||||||||||||||||||||||||||||||
| All Other operating segment | 52 | — | 14 | 46 | 112 | 227 | 339 | |||||||||||||||||||||||||||||||||||||
| Corporate Items and Eliminations | (175) | (59) | (33) | (64) | (331) | (3,809) | (4,140) | |||||||||||||||||||||||||||||||||||||
| Total Sales and Revenues | $ | 20,043 | $ | 4,749 | $ | 9,288 | $ | 8,750 | $ | 42,830 | $ | — | $ | 42,830 | ||||||||||||||||||||||||||||||
| Nine Months Ended September 30, 2021 | ||||||||||||||||||||||||||||||||||||||||||||
| Construction Industries | $ | 7,041 | $ | 1,350 | $ | 3,612 | $ | 4,302 | $ | 16,305 | $ | 65 | $ | 16,370 | ||||||||||||||||||||||||||||||
| Resource Industries | 2,130 | 1,309 | 1,455 | 1,965 | 6,859 | 232 | 7,091 | |||||||||||||||||||||||||||||||||||||
| Energy & Transportation | 5,698 | 835 | 3,433 | 1,953 | 11,919 | 2,640 | 14,559 | |||||||||||||||||||||||||||||||||||||
| Financial Products Segment | 1,442 | 195 | 301 | 359 | 2,297 | 1 | — | 2,297 | ||||||||||||||||||||||||||||||||||||
| Total sales and revenues from reportable segments | 16,311 | 3,689 | 8,801 | 8,579 | 37,380 | 2,937 | 40,317 | |||||||||||||||||||||||||||||||||||||
| All Other operating segment | 42 | 1 | 10 | 54 | 107 | 270 | 377 | |||||||||||||||||||||||||||||||||||||
| Corporate Items and Eliminations | (188) | (36) | (27) | (63) | (314) | (3,207) | (3,521) | |||||||||||||||||||||||||||||||||||||
| Total Sales and Revenues | $ | 16,165 | $ | 3,654 | $ | 8,784 | $ | 8,570 | $ | 37,173 | $ | — | $ | 37,173 | ||||||||||||||||||||||||||||||
| Energy & Transportation External Sales | ||||||||||||||||||||||||||
| Three Months Ended September 30 | Nine Months Ended September 30 | |||||||||||||||||||||||||
| (Millions of dollars) | 2022 | 2021 | 2022 | 2021 | ||||||||||||||||||||||
| Oil and gas | $ | 1,323 | $ | 1,088 | $ | 3,503 | $ | 3,140 | ||||||||||||||||||
| Power generation | 1,320 | 1,010 | 3,518 | 3,025 | ||||||||||||||||||||||
| Industrial | 1,158 | 948 | 3,295 | 2,660 | ||||||||||||||||||||||
| Transportation | 1,196 | 1,095 | 3,353 | 3,094 | ||||||||||||||||||||||
| Energy & Transportation External Sales | $ | 4,997 | $ | 4,141 | $ | 13,669 | $ | 11,919 | ||||||||||||||||||
| Reconciliation of Consolidated profit before taxes: | |||||||||||||||||||||||
| (Millions of dollars) | Three Months Ended September 30 | Nine Months Ended September 30 | |||||||||||||||||||||
| 2022 | 2021 | 2022 | 2021 | ||||||||||||||||||||
| Profit from reportable segments: | |||||||||||||||||||||||
| Construction Industries | $ | 1,209 | $ | 866 | $ | 3,255 | $ | 2,937 | |||||||||||||||
| Resource Industries | 506 | 280 | 1,222 | 941 | |||||||||||||||||||
| Energy & Transportation | 935 | 706 | 2,132 | 2,119 | |||||||||||||||||||
| Financial Products Segment | 220 | 173 | 675 | 660 | |||||||||||||||||||
| Total profit from reportable segments | 2,870 | 2,025 | 7,284 | 6,657 | |||||||||||||||||||
| Profit from All Other operating segment | 8 | 5 | 42 | (2) | |||||||||||||||||||
| Cost centers | (37) | 19 | 1 | 51 | |||||||||||||||||||
| Corporate costs | (168) | (189) | (670) | (576) | |||||||||||||||||||
| Timing | (84) | (40) | (129) | (230) | |||||||||||||||||||
| Restructuring costs | (49) | (35) | (90) | (124) | |||||||||||||||||||
| Methodology differences: | |||||||||||||||||||||||
| Inventory/cost of sales | 138 | 73 | 407 | 80 | |||||||||||||||||||
| Postretirement benefit expense | 82 | 116 | 293 | 270 | |||||||||||||||||||
| Stock-based compensation expense | (55) | (58) | (162) | (169) | |||||||||||||||||||
| Financing costs | (75) | (103) | (269) | (342) | |||||||||||||||||||
| Currency | 53 | 19 | 315 | 255 | |||||||||||||||||||
| Other income/expense methodology differences | (109) | (80) | (287) | (201) | |||||||||||||||||||
| Other methodology differences | (16) | 23 | (82) | (27) | |||||||||||||||||||
| Total consolidated profit before taxes | $ | 2,558 | $ | 1,775 | $ | 6,653 | $ | 5,642 | |||||||||||||||
| Reconciliation of Assets: | Reconciliation of Assets: | ||||||||||||||||||||||
| Reconciliation of Restructuring costs: | |||||||||||||||||||||||
| (Millions of dollars) | Segment profit (loss) | Restructuring costs | Segment profit (loss) with restructuring costs | (Millions of dollars) | September 30, 2022 | December 31, 2021 | |||||||||||||||||
| Three Months Ended September 30, 2017 | |||||||||||||||||||||||
| Assets from reportable segments: | Assets from reportable segments: | ||||||||||||||||||||||
| Construction Industries | $ | 884 | $ | (15 | ) | $ | 869 | Construction Industries | $ | 5,439 | $ | 4,547 | |||||||||||
| Resource Industries | 226 | (59 | ) | 167 | Resource Industries | 5,841 | 5,962 | ||||||||||||||||
| Energy & Transportation | 750 | (28 | ) | 722 | Energy & Transportation | 9,394 | 9,253 | ||||||||||||||||
| Financial Products Segment | 185 | — | 185 | Financial Products Segment | 33,982 | 34,860 | |||||||||||||||||
| All Other operating segments | 6 | (13 | ) | (7 | ) | ||||||||||||||||||
| Total | $ | 2,051 | $ | (115 | ) | $ | 1,936 | ||||||||||||||||
| Total assets from reportable segments | Total assets from reportable segments | 54,656 | 54,622 | ||||||||||||||||||||
| Assets from All Other operating segment | Assets from All Other operating segment | 1,729 | 1,678 | ||||||||||||||||||||
| Items not included in segment assets: | Items not included in segment assets: | ||||||||||||||||||||||
| Cash and cash equivalents | Cash and cash equivalents | 5,403 | 8,428 | ||||||||||||||||||||
| Deferred income taxes | Deferred income taxes | 2,112 | 1,735 | ||||||||||||||||||||
| Goodwill and intangible assets | Goodwill and intangible assets | 4,681 | 4,859 | ||||||||||||||||||||
| Property, plant and equipment – net and other assets | Property, plant and equipment – net and other assets | 3,714 | 4,056 | ||||||||||||||||||||
| Inventory methodology differences | Inventory methodology differences | (2,833) | (2,656) | ||||||||||||||||||||
| Liabilities included in segment assets | Liabilities included in segment assets | 11,973 | 10,777 | ||||||||||||||||||||
| Other | Other | (528) | (706) | ||||||||||||||||||||
| Total assets | Total assets | $ | 80,907 | $ | 82,793 | ||||||||||||||||||
| Three Months Ended September 30, 2016 | |||||||||||||||||||||||
| Construction Industries | $ | 326 | $ | (9 | ) | $ | 317 | ||||||||||||||||
| Resource Industries | (77 | ) | (254 | ) | (331 | ) | |||||||||||||||||
| Energy & Transportation | 572 | (39 | ) | 533 | |||||||||||||||||||
| Financial Products Segment | 183 | (1 | ) | 182 | |||||||||||||||||||
| All Other operating segments | (22 | ) | (15 | ) | (37 | ) | |||||||||||||||||
| Total | $ | 982 | $ | (318 | ) | $ | 664 | ||||||||||||||||
| Reconciliation of Depreciation and amortization: | |||||||||||||||||||||||
| (Millions of dollars) | |||||||||||||||||||||||
| Three Months Ended September 30 | Nine Months Ended September 30 | ||||||||||||||||||||||
| 2022 | 2021 | 2022 | 2021 | ||||||||||||||||||||
| Depreciation and amortization from reportable segments: | |||||||||||||||||||||||
| Construction Industries | $ | 57 | $ | 60 | $ | 172 | $ | 178 | |||||||||||||||
| Resource Industries | 92 | 101 | 275 | 301 | |||||||||||||||||||
| Energy & Transportation | 136 | 144 | 405 | 428 | |||||||||||||||||||
| Financial Products Segment | 183 | 195 | 556 | 582 | |||||||||||||||||||
| Total depreciation and amortization from reportable segments | 468 | 500 | 1,408 | 1,489 | |||||||||||||||||||
| Items not included in segment depreciation and amortization: | |||||||||||||||||||||||
| All Other operating segment | 56 | 59 | 172 | 181 | |||||||||||||||||||
| Cost centers | 20 | 24 | 63 | 74 | |||||||||||||||||||
| Other | 7 | 10 | 18 | 22 | |||||||||||||||||||
| Total depreciation and amortization | $ | 551 | $ | 593 | $ | 1,661 | $ | 1,766 | |||||||||||||||
| Reconciliation of Capital expenditures: | Reconciliation of Capital expenditures: | ||||||||||||||||||||||||||||||||||
| (Millions of dollars) | (Millions of dollars) | ||||||||||||||||||||||||||||||||||
| Three Months Ended September 30 | Nine Months Ended September 30 | ||||||||||||||||||||||||||||||||||
| 2022 | 2021 | 2022 | 2021 | ||||||||||||||||||||||||||||||||
| Reconciliation of Restructuring costs: | |||||||||||||||||||||||||||||||||||
| (Millions of dollars) | Segment profit (loss) | Restructuring costs | Segment profit (loss) with restructuring costs | ||||||||||||||||||||||||||||||||
| Nine Months Ended September 30, 2017 | |||||||||||||||||||||||||||||||||||
| Capital expenditures from reportable segments: | Capital expenditures from reportable segments: | ||||||||||||||||||||||||||||||||||
| Construction Industries | $ | 2,420 | $ | (709 | ) | $ | 1,711 | Construction Industries | $ | 74 | $ | 56 | $ | 149 | $ | 120 | |||||||||||||||||||
| Resource Industries | 481 | (229 | ) | 252 | Resource Industries | 65 | 44 | 129 | 101 | ||||||||||||||||||||||||||
| Energy & Transportation | 2,002 | (86 | ) | 1,916 | Energy & Transportation | 167 | 115 | 444 | 339 | ||||||||||||||||||||||||||
| Financial Products Segment | 559 | (2 | ) | 557 | Financial Products Segment | 295 | 311 | 870 | 900 | ||||||||||||||||||||||||||
| All Other operating segments | (27 | ) | (32 | ) | (59 | ) | |||||||||||||||||||||||||||||
| Total | $ | 5,435 | $ | (1,058 | ) | $ | 4,377 | ||||||||||||||||||||||||||||
| Total capital expenditures from reportable segments | Total capital expenditures from reportable segments | 601 | 526 | 1,592 | 1,460 | ||||||||||||||||||||||||||||||
| Items not included in segment capital expenditures: | Items not included in segment capital expenditures: | ||||||||||||||||||||||||||||||||||
| All Other operating segment | All Other operating segment | 54 | 59 | 116 | 106 | ||||||||||||||||||||||||||||||
| Cost centers | Cost centers | 16 | 15 | 41 | 34 | ||||||||||||||||||||||||||||||
| Timing | Timing | (35) | (13) | 173 | 96 | ||||||||||||||||||||||||||||||
| Other | Other | (19) | — | (31) | (9) | ||||||||||||||||||||||||||||||
| Total capital expenditures | Total capital expenditures | $ | 617 | $ | 587 | $ | 1,891 | $ | 1,687 | ||||||||||||||||||||||||||
| Nine Months Ended September 30, 2016 | |||||||||||||||||||||||||||||||||||
| Construction Industries | $ | 1,316 | $ | (34 | ) | $ | 1,282 | ||||||||||||||||||||||||||||
| Resource Industries | (336 | ) | (348 | ) | (684 | ) | |||||||||||||||||||||||||||||
| Energy & Transportation | 1,584 | (194 | ) | 1,390 | |||||||||||||||||||||||||||||||
| Financial Products Segment | 553 | (5 | ) | 548 | |||||||||||||||||||||||||||||||
| All Other operating segments | (43 | ) | (29 | ) | (72 | ) | |||||||||||||||||||||||||||||
| Total | $ | 3,074 | $ | (610 | ) | $ | 2,464 | ||||||||||||||||||||||||||||
| Reconciliation of Assets: | |||||||||||||||
| (Millions of dollars) | Machinery, Energy & Transportation | Financial Products | Consolidating Adjustments | Consolidated Total | |||||||||||
| September 30, 2017 | |||||||||||||||
| Total assets from reportable segments | $ | 18,837 | $ | 35,415 | $ | — | $ | 54,252 | |||||||
| All Other operating segments | 1,345 | — | — | 1,345 | |||||||||||
| Items not included in segment assets: | |||||||||||||||
| Cash and short-term investments | 8,736 | — | — | 8,736 | |||||||||||
| Intercompany receivables | 1,567 | — | (1,567 | ) | — | ||||||||||
| Investment in Financial Products | 4,435 | — | (4,435 | ) | — | ||||||||||
| Deferred income taxes | 3,595 | — | (855 | ) | 2,740 | ||||||||||
| Goodwill and intangible assets | 4,203 | — | — | 4,203 | |||||||||||
| Property, plant and equipment – net and other assets | 1,979 | — | — | 1,979 | |||||||||||
| Operating lease methodology difference | (189 | ) | — | — | (189 | ) | |||||||||
| Inventory methodology differences | (2,207 | ) | — | — | (2,207 | ) | |||||||||
| Intercompany loan included in Financial Products' assets | — | — | (1,000 | ) | (1,000 | ) | |||||||||
| Liabilities included in segment assets | 9,153 | — | — | 9,153 | |||||||||||
| Other | (378 | ) | (29 | ) | (45 | ) | (452 | ) | |||||||
| Total assets | $ | 51,076 | $ | 35,386 | $ | (7,902 | ) | $ | 78,560 | ||||||
| December 31, 2016 | |||||||||||||||
| Total assets from reportable segments | $ | 20,293 | $ | 35,224 | $ | — | $ | 55,517 | |||||||
| All Other operating segments | 1,381 | — | — | 1,381 | |||||||||||
| Items not included in segment assets: | |||||||||||||||
| Cash and short-term investments | 5,257 | — | — | 5,257 | |||||||||||
| Intercompany receivables | 1,713 | — | (1,713 | ) | — | ||||||||||
| Investment in Financial Products | 3,638 | — | (3,638 | ) | — | ||||||||||
| Deferred income taxes | 3,648 | — | (947 | ) | 2,701 | ||||||||||
| Goodwill and intangible assets | 3,883 | — | — | 3,883 | |||||||||||
| Property, plant and equipment – net and other assets | 1,645 | — | — | 1,645 | |||||||||||
| Operating lease methodology difference | (186 | ) | — | — | (186 | ) | |||||||||
| Inventory methodology differences | (2,373 | ) | — | — | (2,373 | ) | |||||||||
| Liabilities included in segment assets | 7,400 | — | — | 7,400 | |||||||||||
| Other | (436 | ) | (29 | ) | (56 | ) | (521 | ) | |||||||
| Total assets | $ | 45,863 | $ | 35,195 | $ | (6,354 | ) | $ | 74,704 | ||||||
| Reconciliations of Depreciation and amortization: | |||||||||||
| (Millions of dollars) | Machinery, Energy & Transportation | Financial Products | Consolidated Total | ||||||||
| Three Months Ended September 30, 2017 | |||||||||||
| Total depreciation and amortization from reportable segments | $ | 393 | $ | 204 | $ | 597 | |||||
| Items not included in segment depreciation and amortization: | |||||||||||
| All Other operating segments | 52 | — | 52 | ||||||||
| Cost centers | 36 | — | 36 | ||||||||
| Other | 28 | 10 | 38 | ||||||||
| Total depreciation and amortization | $ | 509 | $ | 214 | $ | 723 | |||||
| Three Months Ended September 30, 2016 | |||||||||||
| Total depreciation and amortization from reportable segments | $ | 437 | $ | 215 | $ | 652 | |||||
| Items not included in segment depreciation and amortization: | |||||||||||
| All Other operating segments | 53 | — | 53 | ||||||||
| Cost centers | 39 | — | 39 | ||||||||
| Other | 6 | 11 | 17 | ||||||||
| Total depreciation and amortization | $ | 535 | $ | 226 | $ | 761 | |||||
| Reconciliations of Depreciation and amortization: | |||||||||||
| (Millions of dollars) | Machinery, Energy & Transportation | Financial Products | Consolidated Total | ||||||||
| Nine Months Ended September 30, 2017 | |||||||||||
| Total depreciation and amortization from reportable segments | $ | 1,172 | $ | 616 | $ | 1,788 | |||||
| Items not included in segment depreciation and amortization: | |||||||||||
| All Other operating segments | 162 | — | 162 | ||||||||
| Cost centers | 106 | — | 106 | ||||||||
| Other | 67 | 30 | 97 | ||||||||
| Total depreciation and amortization | $ | 1,507 | $ | 646 | $ | 2,153 | |||||
| Nine Months Ended September 30, 2016 | |||||||||||
| Total depreciation and amortization from reportable segments | $ | 1,309 | $ | 633 | $ | 1,942 | |||||
| Items not included in segment depreciation and amortization: | |||||||||||
| All Other operating segments | 158 | — | 158 | ||||||||
| Cost centers | 117 | — | 117 | ||||||||
| Other | 7 | 31 | 38 | ||||||||
| Total depreciation and amortization | $ | 1,591 | $ | 664 | $ | 2,255 | |||||
| Reconciliations of Capital expenditures: | |||||||||||||||
| (Millions of dollars) | Machinery, Energy & Transportation | Financial Products | Consolidating Adjustments | Consolidated Total | |||||||||||
| Three Months Ended September 30, 2017 | |||||||||||||||
| Total capital expenditures from reportable segments | $ | 204 | $ | 308 | $ | — | $ | 512 | |||||||
| Items not included in segment capital expenditures: | |||||||||||||||
| All Other operating segments | 26 | — | — | 26 | |||||||||||
| Cost centers | 17 | — | — | 17 | |||||||||||
| Timing | (21 | ) | — | — | (21 | ) | |||||||||
| Other | (31 | ) | 19 | (9 | ) | (21 | ) | ||||||||
| Total capital expenditures | $ | 195 | $ | 327 | $ | (9 | ) | $ | 513 | ||||||
| Three Months Ended September 30, 2016 | |||||||||||||||
| Total capital expenditures from reportable segments | $ | 211 | $ | 357 | $ | — | $ | 568 | |||||||
| Items not included in segment capital expenditures: | |||||||||||||||
| All Other operating segments | 35 | — | — | 35 | |||||||||||
| Cost centers | 20 | — | — | 20 | |||||||||||
| Timing | 4 | — | — | 4 | |||||||||||
| Other | (30 | ) | 22 | (24 | ) | (32 | ) | ||||||||
| Total capital expenditures | $ | 240 | $ | 379 | $ | (24 | ) | $ | 595 | ||||||
| Reconciliations of Capital expenditures: | |||||||||||||||
| (Millions of dollars) | Machinery, Energy & Transportation | Financial Products | Consolidating Adjustments | Consolidated Total | |||||||||||
| Nine Months Ended September 30, 2017 | |||||||||||||||
| Total capital expenditures from reportable segments | $ | 520 | $ | 1,018 | $ | — | $ | 1,538 | |||||||
| Items not included in segment capital expenditures: | |||||||||||||||
| All Other operating segments | 71 | — | — | 71 | |||||||||||
| Cost centers | 40 | — | — | 40 | |||||||||||
| Timing | 58 | — | — | 58 | |||||||||||
| Other | (115 | ) | 62 | (17 | ) | (70 | ) | ||||||||
| Total capital expenditures | $ | 574 | $ | 1,080 | $ | (17 | ) | $ | 1,637 | ||||||
| Nine Months Ended September 30, 2016 | |||||||||||||||
| Total capital expenditures from reportable segments | $ | 616 | $ | 1,266 | $ | — | $ | 1,882 | |||||||
| Items not included in segment capital expenditures: | |||||||||||||||
| All Other operating segments | 102 | — | — | 102 | |||||||||||
| Cost centers | 48 | — | — | 48 | |||||||||||
| Timing | 221 | — | — | 221 | |||||||||||
| Other | (129 | ) | 117 | (41 | ) | (53 | ) | ||||||||
| Total capital expenditures | $ | 858 | $ | 1,383 | $ | (41 | ) | $ | 2,200 | ||||||
| (Millions of dollars) | Three Months Ended September 30, 2022 | Three Months Ended September 30, 2021 | |||||||||||||||||||||||||||||||||
| Customer | Dealer | Total | Customer | Dealer | Total | ||||||||||||||||||||||||||||||
| Beginning balance | $ | 290 | $ | 82 | $ | 372 | $ | 354 | $ | 44 | $ | 398 | |||||||||||||||||||||||
| Write-offs | (30) | — | (30) | (91) | — | (91) | |||||||||||||||||||||||||||||
| Recoveries | 17 | — | 17 | 15 | — | 15 | |||||||||||||||||||||||||||||
Provision for credit losses 1 | (2) | (17) | (19) | 17 | 38 | 55 | |||||||||||||||||||||||||||||
| Other | (5) | — | (5) | (3) | — | (3) | |||||||||||||||||||||||||||||
| Ending balance | $ | 270 | $ | 65 | $ | 335 | $ | 292 | $ | 82 | $ | 374 | |||||||||||||||||||||||
| Nine Months Ended September 30, 2022 | Nine Months Ended September 30, 2021 | ||||||||||||||||||||||||||||||||||
| Allowance for Credit Losses: | Customer | Dealer | Total | Customer | Dealer | Total | |||||||||||||||||||||||||||||
| Beginning balance | $ | 251 | $ | 82 | $ | 333 | $ | 431 | $ | 44 | $ | 475 | |||||||||||||||||||||||
| Write-offs | (68) | — | (68) | (193) | — | (193) | |||||||||||||||||||||||||||||
| Recoveries | 47 | — | 47 | 39 | — | 39 | |||||||||||||||||||||||||||||
Provision for credit losses 1 | 46 | (17) | 29 | 20 | 38 | 58 | |||||||||||||||||||||||||||||
| Other | (6) | — | (6) | (5) | — | (5) | |||||||||||||||||||||||||||||
| Ending balance | $ | 270 | $ | 65 | $ | 335 | $ | 292 | $ | 82 | $ | 374 | |||||||||||||||||||||||
| Finance Receivables | $ | 19,363 | $ | 1,737 | $ | 21,100 | $ | 19,967 | $ | 1,931 | $ | 21,898 | |||||||||||||||||||||||
1 Excludes provision for credit losses on unfunded commitments and other miscellaneous receivables. | |||||||||||||||||||||||||||||||||||
(Millions of dollars) | September 30, 2017 | ||||||||||
| Allowance for Credit Losses: | Customer | Dealer | Total | ||||||||
| Balance at beginning of year | $ | 331 | $ | 10 | $ | 341 | |||||
| Receivables written off | (119 | ) | — | (119 | ) | ||||||
| Recoveries on receivables previously written off | 31 | — | 31 | ||||||||
| Provision for credit losses | 80 | — | 80 | ||||||||
| Other | 8 | — | 8 | ||||||||
| Balance at end of period | $ | 331 | $ | 10 | $ | 341 | |||||
| Individually evaluated for impairment | $ | 100 | $ | — | $ | 100 | |||||
| Collectively evaluated for impairment | 231 | 10 | 241 | ||||||||
| Ending Balance | $ | 331 | $ | 10 | $ | 341 | |||||
| Recorded Investment in Finance Receivables: | |||||||||||
| Individually evaluated for impairment | $ | 869 | $ | — | $ | 869 | |||||
| Collectively evaluated for impairment | 18,086 | 3,533 | 21,619 | ||||||||
| Ending Balance | $ | 18,955 | $ | 3,533 | $ | 22,488 | |||||
(Millions of dollars) | December 31, 2016 | ||||||||||
| Allowance for Credit Losses: | Customer | Dealer | Total | ||||||||
| Balance at beginning of year | $ | 327 | $ | 9 | $ | 336 | |||||
| Receivables written off | (158 | ) | — | (158 | ) | ||||||
| Recoveries on receivables previously written off | 35 | — | 35 | ||||||||
| Provision for credit losses | 132 | 1 | 133 | ||||||||
| Other | (5 | ) | — | (5 | ) | ||||||
| Balance at end of year | $ | 331 | $ | 10 | $ | 341 | |||||
| Individually evaluated for impairment | $ | 85 | $ | — | $ | 85 | |||||
| Collectively evaluated for impairment | 246 | 10 | 256 | ||||||||
| Ending Balance | $ | 331 | $ | 10 | $ | 341 | |||||
| Recorded Investment in Finance Receivables: | |||||||||||
| Individually evaluated for impairment | $ | 786 | $ | — | $ | 786 | |||||
| Collectively evaluated for impairment | 18,236 | 3,375 | 21,611 | ||||||||
| Ending Balance | $ | 19,022 | $ | 3,375 | $ | 22,397 | |||||
| September 30, 2017 | |||||||||||||||||||||||||||
(Millions of dollars) | 31-60 Days Past Due | 61-90 Days Past Due | 91+ Days Past Due | Total Past Due | Current | Recorded Investment in Finance Receivables | 91+ Still Accruing | ||||||||||||||||||||
| Customer | |||||||||||||||||||||||||||
| North America | $ | 64 | $ | 17 | $ | 49 | $ | 130 | $ | 7,820 | $ | 7,950 | $ | 8 | |||||||||||||
| Europe | 27 | 9 | 56 | 92 | 2,642 | 2,734 | 4 | ||||||||||||||||||||
| Asia Pacific | 26 | 13 | 17 | 56 | 1,793 | 1,849 | 9 | ||||||||||||||||||||
| Mining | 8 | 4 | 52 | 64 | 1,682 | 1,746 | 1 | ||||||||||||||||||||
| Latin America | 53 | 28 | 180 | 261 | 1,657 | 1,918 | — | ||||||||||||||||||||
| Caterpillar Power Finance | 11 | 34 | 124 | 169 | 2,589 | 2,758 | 11 | ||||||||||||||||||||
| Dealer | |||||||||||||||||||||||||||
| North America | — | — | — | — | 2,129 | 2,129 | — | ||||||||||||||||||||
| Europe | — | — | — | — | 132 | 132 | — | ||||||||||||||||||||
| Asia Pacific | — | — | — | — | 555 | 555 | — | ||||||||||||||||||||
| Mining | — | — | — | — | 3 | 3 | — | ||||||||||||||||||||
| Latin America | 5 | — | 3 | 8 | 704 | 712 | — | ||||||||||||||||||||
| Caterpillar Power Finance | — | — | — | — | 2 | 2 | — | ||||||||||||||||||||
| Total | $ | 194 | $ | 105 | $ | 481 | $ | 780 | $ | 21,708 | $ | 22,488 | $ | 33 | |||||||||||||
| December 31, 2016 | |||||||||||||||||||||||||||
(Millions of dollars) | 31-60 Days Past Due | 61-90 Days Past Due | 91+ Days Past Due | Total Past Due | Current | Recorded Investment in Finance Receivables | 91+ Still Accruing | ||||||||||||||||||||
| Customer | |||||||||||||||||||||||||||
| North America | $ | 50 | $ | 16 | $ | 59 | $ | 125 | $ | 7,938 | $ | 8,063 | $ | 5 | |||||||||||||
| Europe | 16 | 12 | 39 | 67 | 2,388 | 2,455 | 6 | ||||||||||||||||||||
| Asia Pacific | 17 | 7 | 15 | 39 | 1,435 | 1,474 | 4 | ||||||||||||||||||||
| Mining | 3 | 2 | 63 | 68 | 1,756 | 1,824 | 2 | ||||||||||||||||||||
| Latin America | 40 | 33 | 214 | 287 | 1,808 | 2,095 | — | ||||||||||||||||||||
| Caterpillar Power Finance | 11 | 9 | 73 | 93 | 3,018 | 3,111 | 1 | ||||||||||||||||||||
| Dealer | |||||||||||||||||||||||||||
| North America | — | — | — | — | 1,916 | 1,916 | — | ||||||||||||||||||||
| Europe | — | — | — | — | 161 | 161 | — | ||||||||||||||||||||
| Asia Pacific | — | — | — | — | 541 | 541 | — | ||||||||||||||||||||
| Mining | — | — | — | — | 3 | 3 | — | ||||||||||||||||||||
| Latin America | — | — | — | — | 752 | 752 | — | ||||||||||||||||||||
| Caterpillar Power Finance | — | — | — | — | 2 | 2 | — | ||||||||||||||||||||
| Total | $ | 137 | $ | 79 | $ | 463 | $ | 679 | $ | 21,718 | $ | 22,397 | $ | 18 | |||||||||||||
| September 30, 2017 | December 31, 2016 | |||||||||||||||||||||||||||||||||||||||||||||||||||||||||||||||||||||||||||
| (Millions of dollars) | Recorded Investment | Unpaid Principal Balance | Related Allowance | Recorded Investment | Unpaid Principal Balance | Related Allowance | (Millions of dollars) | September 30, 2022 | ||||||||||||||||||||||||||||||||||||||||||||||||||||||||||||||||||||
| Impaired Finance Receivables With No Allowance Recorded | ||||||||||||||||||||||||||||||||||||||||||||||||||||||||||||||||||||||||||||
| 2022 | 2021 | 2020 | 2019 | 2018 | Prior | Revolving Finance Receivables | Total Finance Receivables | |||||||||||||||||||||||||||||||||||||||||||||||||||||||||||||||||||||
| North America | $ | 16 | $ | 21 | $ | — | $ | 10 | $ | 10 | $ | — | North America | |||||||||||||||||||||||||||||||||||||||||||||||||||||||||||||||
| Europe | 47 | 47 | — | 49 | 48 | — | ||||||||||||||||||||||||||||||||||||||||||||||||||||||||||||||||||||||
| Asia Pacific | 32 | 31 | — | 3 | 2 | — | ||||||||||||||||||||||||||||||||||||||||||||||||||||||||||||||||||||||
| Current | Current | $ | 3,151 | $ | 3,632 | $ | 1,765 | $ | 811 | $ | 289 | $ | 64 | $ | 233 | $ | 9,945 | |||||||||||||||||||||||||||||||||||||||||||||||||||||||||||
| 31-60 days past due | 31-60 days past due | 18 | 25 | 19 | 13 | 6 | 2 | 4 | 87 | |||||||||||||||||||||||||||||||||||||||||||||||||||||||||||||||||||
| 61-90 days past due | 61-90 days past due | 5 | 9 | 4 | 2 | 1 | 1 | 2 | 24 | |||||||||||||||||||||||||||||||||||||||||||||||||||||||||||||||||||
| 91+ days past due | 91+ days past due | 5 | 16 | 13 | 8 | 5 | 5 | 5 | 57 | |||||||||||||||||||||||||||||||||||||||||||||||||||||||||||||||||||
| EAME | EAME | |||||||||||||||||||||||||||||||||||||||||||||||||||||||||||||||||||||||||||
| Current | Current | 873 | 1,014 | 511 | 309 | 179 | 81 | — | 2,967 | |||||||||||||||||||||||||||||||||||||||||||||||||||||||||||||||||||
| 31-60 days past due | 31-60 days past due | 6 | 12 | 5 | 4 | — | — | — | 27 | |||||||||||||||||||||||||||||||||||||||||||||||||||||||||||||||||||
| 61-90 days past due | 61-90 days past due | 2 | 4 | 5 | 1 | 1 | — | — | 13 | |||||||||||||||||||||||||||||||||||||||||||||||||||||||||||||||||||
| 91+ days past due | 91+ days past due | 3 | 21 | 11 | 5 | 2 | 1 | — | 43 | |||||||||||||||||||||||||||||||||||||||||||||||||||||||||||||||||||
| Asia/Pacific | Asia/Pacific | |||||||||||||||||||||||||||||||||||||||||||||||||||||||||||||||||||||||||||
| Current | Current | 805 | 765 | 385 | 95 | 23 | 4 | — | 2,077 | |||||||||||||||||||||||||||||||||||||||||||||||||||||||||||||||||||
| 31-60 days past due | 31-60 days past due | 5 | 13 | 11 | 2 | 1 | — | — | 32 | |||||||||||||||||||||||||||||||||||||||||||||||||||||||||||||||||||
| 61-90 days past due | 61-90 days past due | 1 | 6 | 6 | 2 | — | — | — | 15 | |||||||||||||||||||||||||||||||||||||||||||||||||||||||||||||||||||
| 91+ days past due | 91+ days past due | 1 | 8 | 6 | 6 | 1 | — | — | 22 | |||||||||||||||||||||||||||||||||||||||||||||||||||||||||||||||||||
| Mining | 127 | 125 | — | 129 | 129 | — | Mining | |||||||||||||||||||||||||||||||||||||||||||||||||||||||||||||||||||||
| Current | Current | 568 | 625 | 240 | 203 | 117 | 112 | 79 | 1,944 | |||||||||||||||||||||||||||||||||||||||||||||||||||||||||||||||||||
| 31-60 days past due | 31-60 days past due | — | — | — | — | — | — | — | — | |||||||||||||||||||||||||||||||||||||||||||||||||||||||||||||||||||
| 61-90 days past due | 61-90 days past due | — | — | — | — | — | 3 | — | 3 | |||||||||||||||||||||||||||||||||||||||||||||||||||||||||||||||||||
| 91+ days past due | 91+ days past due | — | — | 1 | — | 3 | 1 | — | 5 | |||||||||||||||||||||||||||||||||||||||||||||||||||||||||||||||||||
| Latin America | 60 | 60 | — | 68 | 68 | — | Latin America | |||||||||||||||||||||||||||||||||||||||||||||||||||||||||||||||||||||
| Current | Current | 584 | 443 | 176 | 86 | 24 | 14 | — | 1,327 | |||||||||||||||||||||||||||||||||||||||||||||||||||||||||||||||||||
| 31-60 days past due | 31-60 days past due | 5 | 9 | 5 | 2 | 12 | — | — | 33 | |||||||||||||||||||||||||||||||||||||||||||||||||||||||||||||||||||
| 61-90 days past due | 61-90 days past due | 4 | 4 | 2 | 1 | — | — | — | 11 | |||||||||||||||||||||||||||||||||||||||||||||||||||||||||||||||||||
| 91+ days past due | 91+ days past due | — | 14 | 14 | 5 | 4 | 17 | — | 54 | |||||||||||||||||||||||||||||||||||||||||||||||||||||||||||||||||||
| Caterpillar Power Finance | 187 | 200 | — | 271 | 271 | — | Caterpillar Power Finance | |||||||||||||||||||||||||||||||||||||||||||||||||||||||||||||||||||||
| Total | $ | 469 | $ | 484 | $ | — | $ | 530 | $ | 528 | $ | — | ||||||||||||||||||||||||||||||||||||||||||||||||||||||||||||||||
| Current | Current | 40 | 91 | 145 | 75 | 30 | 170 | 118 | 669 | |||||||||||||||||||||||||||||||||||||||||||||||||||||||||||||||||||
| 31-60 days past due | 31-60 days past due | — | — | — | — | — | — | — | — | |||||||||||||||||||||||||||||||||||||||||||||||||||||||||||||||||||
| 61-90 days past due | 61-90 days past due | — | — | — | — | — | — | — | — | |||||||||||||||||||||||||||||||||||||||||||||||||||||||||||||||||||
| 91+ days past due | 91+ days past due | — | — | — | — | — | 8 | — | 8 | |||||||||||||||||||||||||||||||||||||||||||||||||||||||||||||||||||
| Impaired Finance Receivables With An Allowance Recorded | ||||||||||||||||||||||||||||||||||||||||||||||||||||||||||||||||||||||||||||
| North America | $ | 36 | $ | 35 | $ | 13 | $ | 61 | $ | 60 | $ | 22 | ||||||||||||||||||||||||||||||||||||||||||||||||||||||||||||||||
| Europe | 8 | 8 | 5 | 7 | 7 | 3 | ||||||||||||||||||||||||||||||||||||||||||||||||||||||||||||||||||||||
| Asia Pacific | 25 | 25 | 3 | 50 | 50 | 8 | ||||||||||||||||||||||||||||||||||||||||||||||||||||||||||||||||||||||
| Mining | — | — | — | — | — | — | ||||||||||||||||||||||||||||||||||||||||||||||||||||||||||||||||||||||
| Latin America | 92 | 104 | 35 | 93 | 104 | 34 | ||||||||||||||||||||||||||||||||||||||||||||||||||||||||||||||||||||||
| Caterpillar Power Finance | 239 | 241 | 44 | 45 | 44 | 18 | ||||||||||||||||||||||||||||||||||||||||||||||||||||||||||||||||||||||
| Total | $ | 400 | $ | 413 | $ | 100 | $ | 256 | $ | 265 | $ | 85 | ||||||||||||||||||||||||||||||||||||||||||||||||||||||||||||||||
| Total Impaired Finance Receivables | ||||||||||||||||||||||||||||||||||||||||||||||||||||||||||||||||||||||||||||
| North America | $ | 52 | $ | 56 | $ | 13 | $ | 71 | $ | 70 | $ | 22 | ||||||||||||||||||||||||||||||||||||||||||||||||||||||||||||||||
| Europe | 55 | 55 | 5 | 56 | 55 | 3 | ||||||||||||||||||||||||||||||||||||||||||||||||||||||||||||||||||||||
| Asia Pacific | 57 | 56 | 3 | 53 | 52 | 8 | ||||||||||||||||||||||||||||||||||||||||||||||||||||||||||||||||||||||
| Mining | 127 | 125 | — | 129 | 129 | — | ||||||||||||||||||||||||||||||||||||||||||||||||||||||||||||||||||||||
| Latin America | 152 | 164 | 35 | 161 | 172 | 34 | ||||||||||||||||||||||||||||||||||||||||||||||||||||||||||||||||||||||
| Caterpillar Power Finance | 426 | 441 | 44 | 316 | 315 | 18 | ||||||||||||||||||||||||||||||||||||||||||||||||||||||||||||||||||||||
| Total | $ | 869 | $ | 897 | $ | 100 | $ | 786 | $ | 793 | $ | 85 | ||||||||||||||||||||||||||||||||||||||||||||||||||||||||||||||||
| Totals by Aging Category | Totals by Aging Category | |||||||||||||||||||||||||||||||||||||||||||||||||||||||||||||||||||||||||||
| Current | Current | $ | 6,021 | $ | 6,570 | $ | 3,222 | $ | 1,579 | $ | 662 | $ | 445 | $ | 430 | $ | 18,929 | |||||||||||||||||||||||||||||||||||||||||||||||||||||||||||
| 31-60 days past due | 31-60 days past due | 34 | 59 | 40 | 21 | 19 | 2 | 4 | 179 | |||||||||||||||||||||||||||||||||||||||||||||||||||||||||||||||||||
| 61-90 days past due | 61-90 days past due | 12 | 23 | 17 | 6 | 2 | 4 | 2 | 66 | |||||||||||||||||||||||||||||||||||||||||||||||||||||||||||||||||||
| 91+ days past due | 91+ days past due | 9 | 59 | 45 | 24 | 15 | 32 | 5 | 189 | |||||||||||||||||||||||||||||||||||||||||||||||||||||||||||||||||||
| Total Customer | Total Customer | $ | 6,076 | $ | 6,711 | $ | 3,324 | $ | 1,630 | $ | 698 | $ | 483 | $ | 441 | $ | 19,363 | |||||||||||||||||||||||||||||||||||||||||||||||||||||||||||
| Three Months Ended September 30, 2017 | Three Months Ended September 30, 2016 | |||||||||||||||||||||||||||||||||||||||||||||||||||||||||||||||||||
| (Millions of dollars) | Average Recorded Investment | Interest Income Recognized | Average Recorded Investment | Interest Income Recognized | (Millions of dollars) | December 31, 2021 | ||||||||||||||||||||||||||||||||||||||||||||||||||||||||||||||
| Impaired Finance Receivables With No Allowance Recorded | ||||||||||||||||||||||||||||||||||||||||||||||||||||||||||||||||||||
| 2021 | 2020 | 2019 | 2018 | 2017 | Prior | Revolving Finance Receivables | Total Finance Receivables | |||||||||||||||||||||||||||||||||||||||||||||||||||||||||||||
| North America | $ | 14 | $ | 1 | $ | 24 | $ | — | North America | |||||||||||||||||||||||||||||||||||||||||||||||||||||||||||
| Europe | 47 | — | 49 | 1 | ||||||||||||||||||||||||||||||||||||||||||||||||||||||||||||||||
| Asia Pacific | 30 | 1 | 1 | — | ||||||||||||||||||||||||||||||||||||||||||||||||||||||||||||||||
| Current | Current | $ | 4,792 | $ | 2,596 | $ | 1,426 | $ | 630 | $ | 182 | $ | 32 | $ | 182 | $ | 9,840 | |||||||||||||||||||||||||||||||||||||||||||||||||||
| 31-60 days past due | 31-60 days past due | 27 | 32 | 20 | 12 | 4 | 1 | 5 | 101 | |||||||||||||||||||||||||||||||||||||||||||||||||||||||||||
| 61-90 days past due | 61-90 days past due | 7 | 8 | 5 | 3 | 1 | 1 | 5 | 30 | |||||||||||||||||||||||||||||||||||||||||||||||||||||||||||
| 91+ days past due | 91+ days past due | 9 | 17 | 12 | 13 | 5 | 4 | 5 | 65 | |||||||||||||||||||||||||||||||||||||||||||||||||||||||||||
| EAME | EAME | |||||||||||||||||||||||||||||||||||||||||||||||||||||||||||||||||||
| Current | Current | 1,499 | 836 | 577 | 352 | 140 | 26 | — | 3,430 | |||||||||||||||||||||||||||||||||||||||||||||||||||||||||||
| 31-60 days past due | 31-60 days past due | 5 | 4 | 3 | 1 | 1 | — | — | 14 | |||||||||||||||||||||||||||||||||||||||||||||||||||||||||||
| 61-90 days past due | 61-90 days past due | 3 | 3 | 3 | 1 | — | — | — | 10 | |||||||||||||||||||||||||||||||||||||||||||||||||||||||||||
| 91+ days past due | 91+ days past due | 3 | 11 | 2 | 2 | — | 2 | — | 20 | |||||||||||||||||||||||||||||||||||||||||||||||||||||||||||
| Asia/Pacific | Asia/Pacific | |||||||||||||||||||||||||||||||||||||||||||||||||||||||||||||||||||
| Current | Current | 1,271 | 803 | 307 | 71 | 16 | 2 | — | 2,470 | |||||||||||||||||||||||||||||||||||||||||||||||||||||||||||
| 31-60 days past due | 31-60 days past due | 10 | 14 | 10 | 2 | — | — | — | 36 | |||||||||||||||||||||||||||||||||||||||||||||||||||||||||||
| 61-90 days past due | 61-90 days past due | 3 | 7 | 4 | 1 | — | — | — | 15 | |||||||||||||||||||||||||||||||||||||||||||||||||||||||||||
| 91+ days past due | 91+ days past due | 2 | 10 | 10 | 3 | — | — | — | 25 | |||||||||||||||||||||||||||||||||||||||||||||||||||||||||||
| Mining | 128 | 1 | 90 | 2 | Mining | |||||||||||||||||||||||||||||||||||||||||||||||||||||||||||||||
| Current | Current | 851 | 347 | 307 | 193 | 36 | 161 | 36 | 1,931 | |||||||||||||||||||||||||||||||||||||||||||||||||||||||||||
| 31-60 days past due | 31-60 days past due | 6 | — | — | — | — | — | — | 6 | |||||||||||||||||||||||||||||||||||||||||||||||||||||||||||
| 61-90 days past due | 61-90 days past due | 1 | — | — | — | 4 | — | — | 5 | |||||||||||||||||||||||||||||||||||||||||||||||||||||||||||
| 91+ days past due | 91+ days past due | — | 1 | 8 | 9 | 3 | 1 | — | 22 | |||||||||||||||||||||||||||||||||||||||||||||||||||||||||||
| Latin America | 68 | 1 | 58 | — | Latin America | |||||||||||||||||||||||||||||||||||||||||||||||||||||||||||||||
| Current | Current | 617 | 299 | 160 | 70 | 17 | 18 | — | 1,181 | |||||||||||||||||||||||||||||||||||||||||||||||||||||||||||
| 31-60 days past due | 31-60 days past due | 4 | 7 | 3 | 3 | 1 | — | — | 18 | |||||||||||||||||||||||||||||||||||||||||||||||||||||||||||
| 61-90 days past due | 61-90 days past due | 3 | 3 | 1 | 1 | — | — | — | 8 | |||||||||||||||||||||||||||||||||||||||||||||||||||||||||||
| 91+ days past due | 91+ days past due | 4 | 9 | 9 | 7 | 7 | 14 | — | 50 | |||||||||||||||||||||||||||||||||||||||||||||||||||||||||||
| Caterpillar Power Finance | 171 | 1 | 282 | 3 | Caterpillar Power Finance | |||||||||||||||||||||||||||||||||||||||||||||||||||||||||||||||
| Total | $ | 458 | $ | 5 | $ | 504 | $ | 6 | ||||||||||||||||||||||||||||||||||||||||||||||||||||||||||||
| Current | Current | 117 | 145 | 97 | 70 | 180 | 104 | 101 | 814 | |||||||||||||||||||||||||||||||||||||||||||||||||||||||||||
| 31-60 days past due | 31-60 days past due | — | — | — | — | — | — | — | — | |||||||||||||||||||||||||||||||||||||||||||||||||||||||||||
| 61-90 days past due | 61-90 days past due | — | — | — | — | — | — | — | — | |||||||||||||||||||||||||||||||||||||||||||||||||||||||||||
| 91+ days past due | 91+ days past due | — | — | — | — | — | 44 | — | 44 | |||||||||||||||||||||||||||||||||||||||||||||||||||||||||||
| Impaired Finance Receivables With An Allowance Recorded | ||||||||||||||||||||||||||||||||||||||||||||||||||||||||||||||||||||
| North America | $ | 44 | $ | — | $ | 42 | $ | — | ||||||||||||||||||||||||||||||||||||||||||||||||||||||||||||
| Europe | 6 | — | 10 | — | ||||||||||||||||||||||||||||||||||||||||||||||||||||||||||||||||
| Asia Pacific | 28 | 1 | 35 | — | ||||||||||||||||||||||||||||||||||||||||||||||||||||||||||||||||
| Mining | — | — | 19 | — | ||||||||||||||||||||||||||||||||||||||||||||||||||||||||||||||||
| Latin America | 102 | 1 | 67 | 1 | ||||||||||||||||||||||||||||||||||||||||||||||||||||||||||||||||
| Caterpillar Power Finance | 251 | 3 | 43 | — | ||||||||||||||||||||||||||||||||||||||||||||||||||||||||||||||||
| Total | $ | 431 | $ | 5 | $ | 216 | $ | 1 | ||||||||||||||||||||||||||||||||||||||||||||||||||||||||||||
| Total Impaired Finance Receivables | ||||||||||||||||||||||||||||||||||||||||||||||||||||||||||||||||||||
| North America | $ | 58 | $ | 1 | $ | 66 | $ | — | ||||||||||||||||||||||||||||||||||||||||||||||||||||||||||||
| Europe | 53 | — | 59 | 1 | ||||||||||||||||||||||||||||||||||||||||||||||||||||||||||||||||
| Asia Pacific | 58 | 2 | 36 | — | ||||||||||||||||||||||||||||||||||||||||||||||||||||||||||||||||
| Mining | 128 | 1 | 109 | 2 | ||||||||||||||||||||||||||||||||||||||||||||||||||||||||||||||||
| Latin America | 170 | 2 | 125 | 1 | ||||||||||||||||||||||||||||||||||||||||||||||||||||||||||||||||
| Caterpillar Power Finance | 422 | 4 | 325 | 3 | ||||||||||||||||||||||||||||||||||||||||||||||||||||||||||||||||
| Total | $ | 889 | $ | 10 | $ | 720 | $ | 7 | ||||||||||||||||||||||||||||||||||||||||||||||||||||||||||||
| Totals by Aging Category | Totals by Aging Category | |||||||||||||||||||||||||||||||||||||||||||||||||||||||||||||||||||
| Current | Current | $ | 9,147 | $ | 5,026 | $ | 2,874 | $ | 1,386 | $ | 571 | $ | 343 | $ | 319 | $ | 19,666 | |||||||||||||||||||||||||||||||||||||||||||||||||||
| 31-60 days past due | 31-60 days past due | 52 | 57 | 36 | 18 | 6 | 1 | 5 | 175 | |||||||||||||||||||||||||||||||||||||||||||||||||||||||||||
| 61-90 days past due | 61-90 days past due | 17 | 21 | 13 | 6 | 5 | 1 | 5 | 68 | |||||||||||||||||||||||||||||||||||||||||||||||||||||||||||
| 91+ days past due | 91+ days past due | 18 | 48 | 41 | 34 | 15 | 65 | 5 | 226 | |||||||||||||||||||||||||||||||||||||||||||||||||||||||||||
| Total Customer | Total Customer | $ | 9,234 | $ | 5,152 | $ | 2,964 | $ | 1,444 | $ | 597 | $ | 410 | $ | 334 | $ | 20,135 | |||||||||||||||||||||||||||||||||||||||||||||||||||
| Nine Months Ended September 30, 2017 | Nine Months Ended September 30, 2016 | ||||||||||||||
| (Millions of dollars) | Average Recorded Investment | Interest Income Recognized | Average Recorded Investment | Interest Income Recognized | |||||||||||
| Impaired Finance Receivables With No Allowance Recorded | |||||||||||||||
| North America | $ | 12 | $ | 1 | $ | 19 | $ | 1 | |||||||
| Europe | 48 | 1 | 45 | 1 | |||||||||||
| Asia Pacific | 22 | 2 | 2 | — | |||||||||||
| Mining | 128 | 5 | 84 | 3 | |||||||||||
| Latin America | 69 | 2 | 39 | — | |||||||||||
| Caterpillar Power Finance | 233 | 7 | 269 | 8 | |||||||||||
| Total | $ | 512 | $ | 18 | $ | 458 | $ | 13 | |||||||
| Impaired Finance Receivables With An Allowance Recorded | |||||||||||||||
| North America | $ | 52 | $ | 1 | $ | 28 | $ | — | |||||||
| Europe | 6 | — | 11 | — | |||||||||||
| Asia Pacific | 35 | 2 | 34 | 2 | |||||||||||
| Mining | — | — | 15 | — | |||||||||||
| Latin America | 101 | 3 | 59 | 2 | |||||||||||
| Caterpillar Power Finance | 141 | 4 | 50 | 1 | |||||||||||
| Total | $ | 335 | $ | 10 | $ | 197 | $ | 5 | |||||||
| Total Impaired Finance Receivables | |||||||||||||||
| North America | $ | 64 | $ | 2 | $ | 47 | $ | 1 | |||||||
| Europe | 54 | 1 | 56 | 1 | |||||||||||
| Asia Pacific | 57 | 4 | 36 | 2 | |||||||||||
| Mining | 128 | 5 | 99 | 3 | |||||||||||
| Latin America | 170 | 5 | 98 | 2 | |||||||||||
| Caterpillar Power Finance | 374 | 11 | 319 | 9 | |||||||||||
| Total | $ | 847 | $ | 28 | $ | 655 | $ | 18 | |||||||
| September 30, 2022 | December 31, 2021 | ||||||||||||||||||||||||||||||||||||||||||||||||||||
| Amortized Cost | Amortized Cost | ||||||||||||||||||||||||||||||||||||||||||||||||||||
(Millions of dollars) | Non-accrual With an Allowance | Non-accrual Without an Allowance | 91+ Still Accruing | Non-accrual With an Allowance | Non-accrual Without an Allowance | 91+ Still Accruing | |||||||||||||||||||||||||||||||||||||||||||||||
| North America | $ | 54 | $ | 5 | $ | 10 | $ | 47 | $ | 9 | $ | 12 | |||||||||||||||||||||||||||||||||||||||||
| EAME | 42 | — | 4 | 18 | 1 | 2 | |||||||||||||||||||||||||||||||||||||||||||||||
| Asia/Pacific | 15 | — | 7 | 19 | — | 7 | |||||||||||||||||||||||||||||||||||||||||||||||
| Mining | 6 | 1 | — | 8 | 1 | 14 | |||||||||||||||||||||||||||||||||||||||||||||||
| Latin America | 57 | — | — | 52 | 4 | 1 | |||||||||||||||||||||||||||||||||||||||||||||||
| Caterpillar Power Finance | 9 | 11 | — | 40 | 11 | — | |||||||||||||||||||||||||||||||||||||||||||||||
| Total | $ | 183 | $ | 17 | $ | 21 | $ | 184 | $ | 26 | $ | 36 | |||||||||||||||||||||||||||||||||||||||||
(Millions of dollars) | September 30, 2017 | December 31, 2016 | |||||
| North America | $ | 48 | $ | 66 | |||
| Europe | 56 | 35 | |||||
| Asia Pacific | 11 | 12 | |||||
| Mining | 55 | 69 | |||||
| Latin America | 242 | 307 | |||||
| Caterpillar Power Finance | 277 | 90 | |||||
| Total | $ | 689 | $ | 579 | |||
| (Millions of dollars) | Three Months Ended September 30, 2022 | Three Months Ended September 30, 2021 | |||||||||||||||||||||
| Pre-TDR Amortized Cost | Post-TDR Amortized Cost | Pre-TDR Amortized Cost | Post-TDR Amortized Cost | ||||||||||||||||||||
| Customer | |||||||||||||||||||||||
| North America | $ | 3 | $ | 3 | $ | 1 | $ | 1 | |||||||||||||||
| EAME | — | — | 1 | 1 | |||||||||||||||||||
| Asia/Pacific | — | — | 4 | 4 | |||||||||||||||||||
| Mining | 15 | 15 | — | — | |||||||||||||||||||
| Latin America | — | — | 4 | 4 | |||||||||||||||||||
| Caterpillar Power Finance | 11 | 11 | 7 | 3 | |||||||||||||||||||
| Total | $ | 29 | $ | 29 | $ | 17 | $ | 13 | |||||||||||||||
| Nine Months Ended September 30, 2022 | Nine Months Ended September 30, 2021 | ||||||||||||||||||||||
| Pre-TDR Amortized Cost | Post-TDR Amortized Cost | Pre-TDR Amortized Cost | Post-TDR Amortized Cost | ||||||||||||||||||||
| North America | $ | 4 | $ | 4 | $ | 5 | $ | 5 | |||||||||||||||
| EAME | 1 | 1 | 1 | 1 | |||||||||||||||||||
| Asia/Pacific | — | — | 4 | 4 | |||||||||||||||||||
| Mining | 15 | 15 | 11 | 5 | |||||||||||||||||||
| Latin America | — | — | 10 | 10 | |||||||||||||||||||
| Caterpillar Power Finance | 20 | 19 | 23 | 19 | |||||||||||||||||||
Total | $ | 40 | $ | 39 | $ | 54 | $ | 44 | |||||||||||||||
| Three Months Ended September 30, 2017 | Three Months Ended September 30, 2016 | |||||||||||||||||||
(Millions of dollars) | Number of Contracts | Pre-TDR Recorded Investment | Post-TDR Recorded Investment | Number of Contracts | Pre-TDR Recorded Investment | Post-TDR Recorded Investment | ||||||||||||||
| North America | 11 | $ | 4 | $ | 5 | 2 | $ | — | $ | — | ||||||||||
| Europe | 1 | — | — | — | — | — | ||||||||||||||
| Asia Pacific | — | — | — | 4 | 1 | 1 | ||||||||||||||
| Mining | — | — | — | 1 | 33 | 30 | ||||||||||||||
Latin America1 | 3 | 21 | 22 | 341 | 105 | 74 | ||||||||||||||
| Caterpillar Power Finance | 5 | 51 | 44 | 4 | 13 | 13 | ||||||||||||||
| Total | 20 | $ | 76 | $ | 71 | 352 | $ | 152 | $ | 118 | ||||||||||
| Nine Months Ended September 30, 2017 | Nine Months Ended September 30, 2016 | |||||||||||||||||||
Number of Contracts | Pre-TDR Recorded Investment | Post-TDR Recorded Investment | Number of Contracts | Pre-TDR Recorded Investment | Post-TDR Recorded Investment | |||||||||||||||
| North America | 37 | $ | 13 | $ | 13 | 15 | $ | 16 | $ | 16 | ||||||||||
| Europe | 2 | — | — | 3 | 11 | 8 | ||||||||||||||
| Asia Pacific | 6 | 39 | 30 | 8 | 4 | 4 | ||||||||||||||
| Mining | 2 | 57 | 56 | 2 | 43 | 35 | ||||||||||||||
| Latin America | 17 | 26 | 27 | 431 | 117 | 87 | ||||||||||||||
Caterpillar Power Finance2 | 59 | 319 | 305 | 34 | 196 | 177 | ||||||||||||||
| Total | 123 | $ | 454 | $ | 431 | 493 | $ | 387 | $ | 327 | ||||||||||
| (Millions of dollars) | Three Months Ended September 30 | Nine Months Ended September 30 | |||||||||||||||||||||
| Customer | 2022 | 2021 | 2022 | 2021 | |||||||||||||||||||
| North America | $ | — | $ | — | $ | — | $ | 1 | |||||||||||||||
| Asia/Pacific | — | — | — | 6 | |||||||||||||||||||
| Mining | — | — | 5 | — | |||||||||||||||||||
| Latin America | — | — | — | 15 | |||||||||||||||||||
| Caterpillar Power Finance | — | — | — | 5 | |||||||||||||||||||
| Total | $ | — | $ | — | $ | 5 | $ | 27 | |||||||||||||||
| September 30, 2017 | |||||||||||||||
(Millions of dollars) | Level 1 | Level 2 | Level 3 | Total Assets / Liabilities, at Fair Value | |||||||||||
| Assets | |||||||||||||||
| Available-for-sale securities | |||||||||||||||
| Government debt | |||||||||||||||
| U.S. treasury bonds | $ | 10 | $ | — | $ | — | $ | 10 | |||||||
| Other U.S. and non-U.S. government bonds | — | 48 | — | 48 | |||||||||||
| Corporate bonds | |||||||||||||||
| Corporate bonds | — | 532 | — | 532 | |||||||||||
| Asset-backed securities | — | 76 | — | 76 | |||||||||||
| Mortgage-backed debt securities | |||||||||||||||
| U.S. governmental agency | — | 243 | — | 243 | |||||||||||
| Residential | — | 8 | — | 8 | |||||||||||
| Commercial | — | 17 | — | 17 | |||||||||||
| Equity securities | |||||||||||||||
| Large capitalization value | 349 | — | — | 349 | |||||||||||
| Smaller company growth | 65 | — | — | 65 | |||||||||||
| Total available-for-sale securities | 424 | 924 | — | 1,348 | |||||||||||
| REIT | — | — | 109 | 109 | |||||||||||
| Derivative financial instruments, net | — | 28 | — | 28 | |||||||||||
| Total Assets | $ | 424 | $ | 952 | $ | 109 | $ | 1,485 | |||||||
| December 31, 2016 | |||||||||||||||
(Millions of dollars) | Level 1 | Level 2 | Level 3 | Total Assets / Liabilities, at Fair Value | |||||||||||
| Assets | |||||||||||||||
| Available-for-sale securities | |||||||||||||||
| Government debt | |||||||||||||||
| U.S. treasury bonds | $ | 9 | $ | — | $ | — | $ | 9 | |||||||
| Other U.S. and non-U.S. government bonds | — | 60 | — | 60 | |||||||||||
| Corporate bonds | |||||||||||||||
| Corporate bonds | — | 492 | — | 492 | |||||||||||
| Asset-backed securities | — | 90 | — | 90 | |||||||||||
| Mortgage-backed debt securities | |||||||||||||||
| U.S. governmental agency | — | 223 | — | 223 | |||||||||||
| Residential | — | 10 | — | 10 | |||||||||||
| Commercial | — | 36 | — | 36 | |||||||||||
| Equity securities | |||||||||||||||
| Large capitalization value | 312 | — | — | 312 | |||||||||||
| Smaller company growth | 56 | — | — | 56 | |||||||||||
| Total available-for-sale securities | 377 | 911 | — | 1,288 | |||||||||||
| REIT | — | — | 79 | 79 | |||||||||||
| Total Assets | $ | 377 | $ | 911 | $ | 79 | $ | 1,367 | |||||||
| Liabilities | |||||||||||||||
| Derivative financial instruments, net | $ | — | $ | 72 | $ | — | $ | 72 | |||||||
| Total Liabilities | $ | — | $ | 72 | $ | — | $ | 72 | |||||||
| September 30, 2022 | |||||||||||||||||||||||||||||
(Millions of dollars) | Level 1 | Level 2 | Level 3 | Measured at NAV | Total Assets / Liabilities, at Fair Value | ||||||||||||||||||||||||
| Assets | |||||||||||||||||||||||||||||
| Debt securities | |||||||||||||||||||||||||||||
| Government debt securities | |||||||||||||||||||||||||||||
| U.S. treasury bonds | $ | 10 | $ | — | $ | — | $ | — | $ | 10 | |||||||||||||||||||
| Other U.S. and non-U.S. government bonds | — | 49 | — | — | 49 | ||||||||||||||||||||||||
| Corporate debt securities | |||||||||||||||||||||||||||||
| Corporate bonds and other debt securities | — | 1,998 | 50 | — | 2,048 | ||||||||||||||||||||||||
| Asset-backed securities | — | 180 | — | — | 180 | ||||||||||||||||||||||||
| Mortgage-backed debt securities | |||||||||||||||||||||||||||||
| U.S. governmental agency | — | 348 | — | — | 348 | ||||||||||||||||||||||||
| Residential | — | 3 | — | — | 3 | ||||||||||||||||||||||||
| Commercial | — | 129 | — | — | 129 | ||||||||||||||||||||||||
| Total debt securities | 10 | 2,707 | 50 | — | 2,767 | ||||||||||||||||||||||||
| Equity securities | |||||||||||||||||||||||||||||
| Large capitalization value | 183 | — | — | — | 183 | ||||||||||||||||||||||||
| Smaller company growth | 40 | — | — | — | 40 | ||||||||||||||||||||||||
| REIT | — | — | — | 208 | 208 | ||||||||||||||||||||||||
| Total equity securities | 223 | — | — | 208 | 431 | ||||||||||||||||||||||||
| Derivative financial instruments - assets | |||||||||||||||||||||||||||||
| Foreign currency contracts - net | — | 338 | — | — | 338 | ||||||||||||||||||||||||
| Total assets | $ | 233 | $ | 3,045 | $ | 50 | $ | 208 | $ | 3,536 | |||||||||||||||||||
| Liabilities | |||||||||||||||||||||||||||||
| Derivative financial instruments - liabilities | |||||||||||||||||||||||||||||
| Interest rate contracts - net | $ | — | $ | 208 | $ | — | $ | — | $ | 208 | |||||||||||||||||||
| Commodity contracts - net | — | 34 | — | — | 34 | ||||||||||||||||||||||||
| Total liabilities | $ | — | $ | 242 | $ | — | $ | — | $ | 242 | |||||||||||||||||||
| (Millions of dollars) | REIT | |||
| Balance at December 31, 2016 | $ | 79 | ||
| Purchases of securities | 27 | |||
| Sale of securities | — | |||
| Gains (losses) included in Accumulated other comprehensive income (loss) | 3 | |||
| Balance at September 30, 2017 | $ | 109 | ||
| December 31, 2021 | |||||||||||||||||||||||||||||
(Millions of dollars) | Level 1 | Level 2 | Level 3 | Measured at NAV | Total Assets / Liabilities, at Fair Value | ||||||||||||||||||||||||
| Assets | |||||||||||||||||||||||||||||
| Debt securities | |||||||||||||||||||||||||||||
| Government debt securities | |||||||||||||||||||||||||||||
| U.S. treasury bonds | $ | 10 | $ | — | $ | — | $ | — | $ | 10 | |||||||||||||||||||
| Other U.S. and non-U.S. government bonds | — | 61 | — | — | 61 | ||||||||||||||||||||||||
| Corporate debt securities | |||||||||||||||||||||||||||||
| Corporate bonds and other debt securities | — | 1,046 | — | — | 1,046 | ||||||||||||||||||||||||
| Asset-backed securities | — | 176 | — | — | 176 | ||||||||||||||||||||||||
| Mortgage-backed debt securities | |||||||||||||||||||||||||||||
| U.S. governmental agency | — | 325 | — | — | 325 | ||||||||||||||||||||||||
| Residential | — | 4 | — | — | 4 | ||||||||||||||||||||||||
| Commercial | — | 99 | — | — | 99 | ||||||||||||||||||||||||
| Total debt securities | 10 | 1,711 | — | — | 1,721 | ||||||||||||||||||||||||
| Equity securities | |||||||||||||||||||||||||||||
| Large capitalization value | 217 | — | — | — | 217 | ||||||||||||||||||||||||
| Smaller company growth | 98 | — | — | — | 98 | ||||||||||||||||||||||||
| REIT | — | — | — | 167 | 167 | ||||||||||||||||||||||||
| Total equity securities | 315 | — | — | 167 | 482 | ||||||||||||||||||||||||
| Derivative financial instruments - assets | |||||||||||||||||||||||||||||
| Foreign currency contracts - net | — | 168 | — | — | 168 | ||||||||||||||||||||||||
| Interest rate contracts - net | — | 23 | — | — | 23 | ||||||||||||||||||||||||
| Commodity contracts - net | — | 21 | — | — | 21 | ||||||||||||||||||||||||
| Total Assets | $ | 325 | $ | 1,923 | $ | — | $ | 167 | $ | 2,415 | |||||||||||||||||||
| September 30, 2022 | December 31, 2021 | |||||||||||||||||||||||||||||||||||||
| (Millions of dollars) | Carrying Amount | Fair Value | Carrying Amount | Fair Value | Fair Value Levels | Reference | ||||||||||||||||||||||||||||||||
| Assets | ||||||||||||||||||||||||||||||||||||||
Finance receivables – net (excluding finance leases 1 ) | $ | 13,931 | $ | 13,356 | $ | 13,837 | $ | 13,836 | 3 | Note 17 | ||||||||||||||||||||||||||||
Wholesale inventory receivables – net (excluding finance leases 1) | 768 | 724 | 773 | 753 | 3 | |||||||||||||||||||||||||||||||||
| Liabilities | ||||||||||||||||||||||||||||||||||||||
| Long-term debt (including amounts due within one year) | ||||||||||||||||||||||||||||||||||||||
| Machinery, Energy & Transportation | 9,599 | 9,072 | 9,791 | 12,420 | 2 | |||||||||||||||||||||||||||||||||
| Financial Products | 22,724 | 21,886 | 22,594 | 22,797 | 2 | |||||||||||||||||||||||||||||||||
| Fair Value of Financial Instruments | ||||||||||||||||||||
| September 30, 2017 | December 31, 2016 | |||||||||||||||||||
| (Millions of dollars) | Carrying Amount | Fair Value | Carrying Amount | Fair Value | Fair Value Levels | Reference | ||||||||||||||
| Assets | ||||||||||||||||||||
| Cash and short-term investments | $ | 9,591 | $ | 9,591 | $ | 7,168 | $ | 7,168 | 1 | |||||||||||
| Restricted cash and short-term investments | $ | 202 | $ | 202 | $ | 31 | $ | 31 | 1 | |||||||||||
| Investments in debt and equity securities | $ | 1,457 | $ | 1,457 | $ | 1,367 | $ | 1,367 | 1, 2 & 3 | Note 8 | ||||||||||
Finance receivables – net (excluding finance leases 1) | $ | 15,583 | $ | 15,604 | $ | 16,172 | $ | 16,056 | 3 | Note 16 | ||||||||||
Wholesale inventory receivables – net (excluding finance leases 1) | $ | 1,393 | $ | 1,362 | $ | 1,500 | $ | 1,464 | 3 | Note 16 | ||||||||||
| Foreign currency contracts – net | $ | 14 | $ | 14 | $ | — | $ | — | 2 | Note 4 | ||||||||||
| Interest rate contracts – net | $ | 2 | $ | 2 | $ | 3 | $ | 3 | 2 | Note 4 | ||||||||||
| Commodity contracts – net | $ | 12 | $ | 12 | $ | 10 | $ | 10 | 2 | Note 4 | ||||||||||
| Liabilities | ||||||||||||||||||||
| Short-term borrowings | $ | 5,470 | $ | 5,470 | $ | 7,303 | $ | 7,303 | 1 | |||||||||||
| Long-term debt (including amounts due within one year) | ||||||||||||||||||||
| Machinery, Energy & Transportation | $ | 8,825 | $ | 10,708 | $ | 8,943 | $ | 10,348 | 2 | |||||||||||
| Financial Products | $ | 21,629 | $ | 21,854 | $ | 20,537 | $ | 20,724 | 2 | |||||||||||
| Foreign currency contracts – net | $ | — | $ | — | $ | 85 | $ | 85 | 2 | Note 4 | ||||||||||
| Guarantees | $ | 8 | $ | 8 | $ | 8 | $ | 8 | 3 | Note 10 | ||||||||||
| Three Months Ended September 30 | Nine Months Ended September 30 | |||||||||||||||||||||||||
| (Millions of dollars) | 2022 | 2021 | 2022 | 2021 | ||||||||||||||||||||||
| Investment and interest income | $ | 52 | $ | 20 | $ | 98 | $ | 64 | ||||||||||||||||||
Foreign exchange gains (losses) 1 | 134 | 47 | 405 | 110 | ||||||||||||||||||||||
| License fee income | 37 | 31 | 106 | 88 | ||||||||||||||||||||||
| Net periodic pension and OPEB income (cost), excluding service cost | 67 | 111 | 201 | 333 | ||||||||||||||||||||||
| Gains (losses) on securities | — | 50 | (59) | 92 | ||||||||||||||||||||||
| Miscellaneous income (loss) | (48) | (34) | 4 | 64 | ||||||||||||||||||||||
| Total | $ | 242 | $ | 225 | $ | 755 | $ | 751 | ||||||||||||||||||
| (Millions of dollars) | Three Months Ended September 30 | Nine Months Ended September 30 | ||||||||||||||||||||||||
| 2022 | 2021 | 2022 | 2021 | |||||||||||||||||||||||
Employee separations 1 | $ | 39 | $ | 17 | $ | 62 | $ | 79 | ||||||||||||||||||
Contract terminations 1 | 1 | 1 | 1 | 1 | ||||||||||||||||||||||
Long-lived asset impairments 1 | (4) | 8 | 1 | 12 | ||||||||||||||||||||||
Other 2 | 13 | 9 | 26 | 32 | ||||||||||||||||||||||
| Total restructuring costs | $ | 49 | $ | 35 | $ | 90 | $ | 124 | ||||||||||||||||||
1 Recognized in Other operating (income) expenses. | ||||||||||||||||||||||||||
2 Represents costs related to our restructuring programs, primarily for accelerated depreciation, equipment relocation, inventory write-downs and project management, all of which are primarily included in Cost of goods sold. | ||||||||||||||||||||||||||
| (Millions of dollars) | Three Months Ended September 30 | |||||||
| 2017 | 2016 | |||||||
Employee separations 1 | $ | 8 | $ | 99 | ||||
Contract terminations 1 | 6 | 9 | ||||||
Long-lived asset impairments 1 | 31 | 158 | ||||||
Other 2 | 45 | 58 | ||||||
| Total restructuring costs | $ | 90 | $ | 324 | ||||
| Nine Months Ended September 30 | ||||||||
| 2017 | 2016 | |||||||
Employee separations 1 | $ | 514 | $ | 175 | ||||
Contract terminations 1 | 32 | 55 | ||||||
Long-lived asset impairments 1 | 306 | 254 | ||||||
Defined benefit plan curtailments and termination benefits 1 | 29 | — | ||||||
Other 2 | 130 | 140 | ||||||
| Total restructuring costs | $ | 1,011 | $ | 624 | ||||
1 Recognized in Other operating (income) expenses. | ||||||||
2 Represents costs related to our restructuring programs, primarily for accelerated depreciation, inventory write-downs, equipment relocation and | ||||||||
| project management costs and also LIFO inventory decrement benefits from inventory liquidations at closed facilities (all of which are | ||||||||
| primarily included in Cost of goods sold). | ||||||||
| (Millions of dollars) | Nine Months Ended September 30 | |||||||||||||
| 2022 | 2021 | |||||||||||||
| Liability balance, beginning of period | $ | 61 | $ | 164 | ||||||||||
| Increase in liability (separation charges) | 62 | 79 | ||||||||||||
| Reduction in liability (payments) | (63) | (159) | ||||||||||||
| Liability balance, end of period | $ | 60 | $ | 84 | ||||||||||
| (Millions of dollars) | ||||
| Liability balance at December 31, 2015 | $ | 483 | ||
| Increase in liability (separation charges) | 297 | |||
| Reduction in liability (payments) | (633 | ) | ||
| Liability balance at December 31, 2016 | $ | 147 | ||
| Increase in liability (separation charges) | 514 | |||
| Reduction in liability (payments) | (339 | ) | ||
| Liability balance at September 30, 2017 | $ | 322 | ||
| Three Months Ended September 30, 2022 | Three Months Ended September 30, 2021 | Nine Months Ended September 30, 2022 | Nine Months Ended September 30, 2021 | ||||||||||||||||||||||||||||||||
| (Dollars in millions except per share data) | Profit Before Taxes | Profit Per Share | Profit Before Taxes | Profit Per Share | Profit Before Taxes | Profit Per Share | Profit Before Taxes | Profit Per Share | |||||||||||||||||||||||||||
| Profit | $ | 2,558 | $ | 3.87 | $ | 1,775 | $ | 2.60 | $ | 6,653 | $ | 9.85 | $ | 5,642 | $ | 7.94 | |||||||||||||||||||
| Restructuring costs | 49 | 0.08 | 35 | 0.06 | 90 | 0.14 | 124 | 0.19 | |||||||||||||||||||||||||||
| Adjusted profit | $ | 2,607 | $ | 3.95 | $ | 1,810 | $ | 2.66 | $ | 6,743 | $ | 9.99 | $ | 5,766 | $ | 8.13 | |||||||||||||||||||
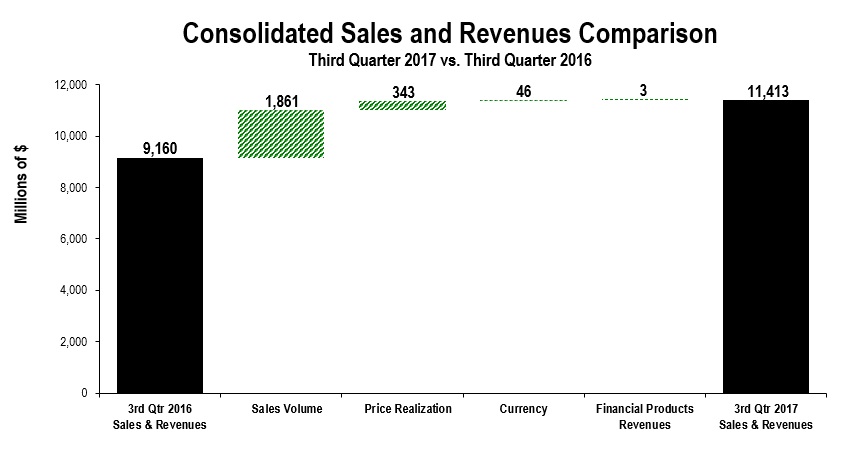
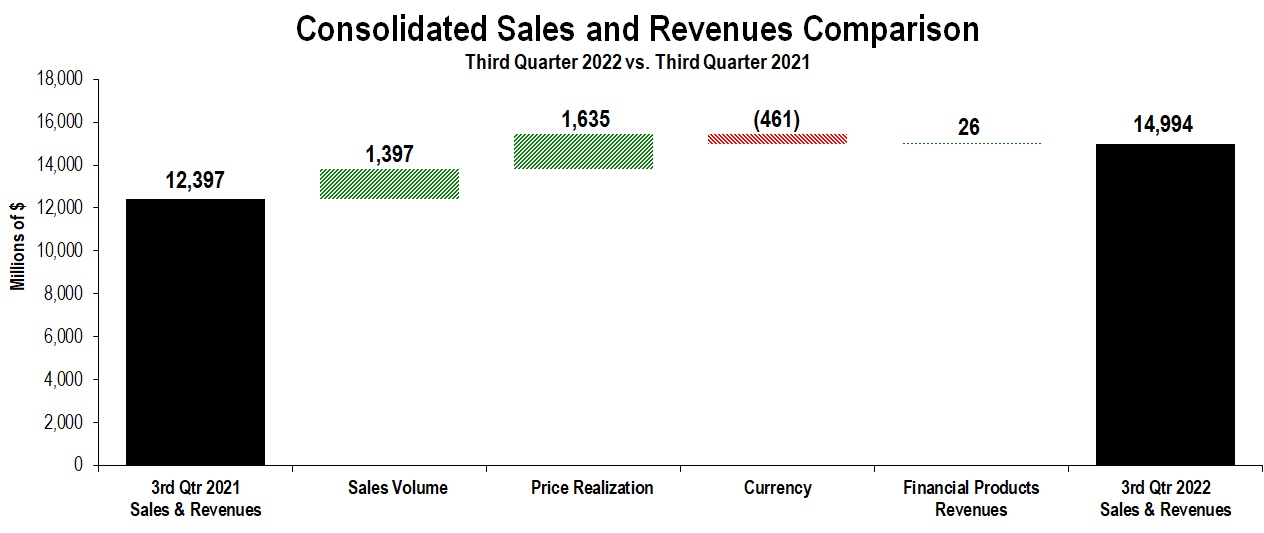
| Sales and Revenues by Segment | |||||||||||||||||||||||||||||||||||||||||||||||
| (Millions of dollars) | Third Quarter 2021 | Sales Volume | Price Realization | Currency | Inter-Segment / Other | Third Quarter 2022 | $ Change | % Change | |||||||||||||||||||||||||||||||||||||||
| Construction Industries | $ | 5,255 | $ | 423 | $ | 781 | $ | (229) | $ | 46 | $ | 6,276 | $ | 1,021 | 19 | % | |||||||||||||||||||||||||||||||
| Resource Industries | 2,366 | 338 | 443 | (59) | (1) | 3,087 | 721 | 30 | % | ||||||||||||||||||||||||||||||||||||||
| Energy & Transportation | 5,077 | 618 | 409 | (171) | 253 | 6,186 | 1,109 | 22 | % | ||||||||||||||||||||||||||||||||||||||
| All Other Segment | 119 | 2 | — | (2) | (16) | 103 | (16) | (13 | %) | ||||||||||||||||||||||||||||||||||||||
| Corporate Items and Eliminations | (1,110) | 16 | 2 | — | (282) | (1,374) | (264) | ||||||||||||||||||||||||||||||||||||||||
Machinery, Energy & Transportation Sales | 11,707 | 1,397 | 1,635 | (461) | — | 14,278 | 2,571 | 22 | % | ||||||||||||||||||||||||||||||||||||||
| Financial Products Segment | 762 | — | — | — | 57 | 819 | 57 | 7 | % | ||||||||||||||||||||||||||||||||||||||
| Corporate Items and Eliminations | (72) | — | — | — | (31) | (103) | (31) | ||||||||||||||||||||||||||||||||||||||||
Financial Products Revenues | 690 | — | — | — | 26 | 716 | 26 | 4 | % | ||||||||||||||||||||||||||||||||||||||
| Consolidated Sales and Revenues | $ | 12,397 | $ | 1,397 | $ | 1,635 | $ | (461) | $ | 26 | $ | 14,994 | $ | 2,597 | 21 | % | |||||||||||||||||||||||||||||||
| Sales and Revenues by Geographic Region | ||
| North America | Latin America | EAME | Asia/Pacific | External Sales and Revenues | Inter-Segment | Total Sales and Revenues | |||||||||||||||||||||||||||||||||||||||||||||||||||||||||||||||||||||||||||||
| (Millions of dollars) | $ | % Chg | $ | % Chg | $ | % Chg | $ | % Chg | $ | % Chg | $ | % Chg | $ | % Chg | |||||||||||||||||||||||||||||||||||||||||||||||||||||||||||||||||||||
| Third Quarter 2022 | |||||||||||||||||||||||||||||||||||||||||||||||||||||||||||||||||||||||||||||||||||
| Construction Industries | $ | 3,106 | 29 | % | $ | 799 | 51 | % | $ | 1,247 | 1 | % | $ | 1,084 | 1 | % | $ | 6,236 | 19 | % | $ | 40 | (767 | %) | $ | 6,276 | 19 | % | |||||||||||||||||||||||||||||||||||||||||||||||||||||||
| Resource Industries | 1,122 | 66 | % | 472 | 13 | % | 526 | 15 | % | 893 | 20 | % | 3,013 | 32 | % | 74 | (1 | %) | 3,087 | 30 | % | ||||||||||||||||||||||||||||||||||||||||||||||||||||||||||||||
| Energy & Transportation | 2,422 | 26 | % | 468 | 42 | % | 1,280 | 12 | % | 827 | 11 | % | 4,997 | 21 | % | 1,189 | 27 | % | 6,186 | 22 | % | ||||||||||||||||||||||||||||||||||||||||||||||||||||||||||||||
| All Other Segment | 16 | (11 | %) | — | — | % | 4 | 33 | % | 15 | 7 | % | 35 | — | % | 68 | (19 | %) | 103 | (13 | %) | ||||||||||||||||||||||||||||||||||||||||||||||||||||||||||||||
| Corporate Items and Eliminations | 1 | — | — | (4) | (3) | (1,371) | (1,374) | ||||||||||||||||||||||||||||||||||||||||||||||||||||||||||||||||||||||||||||
| Machinery, Energy & Transportation Sales | 6,667 | 33 | % | 1,739 | 36 | % | 3,057 | 8 | % | 2,815 | 9 | % | 14,278 | 22 | % | — | — | 14,278 | 22 | % | |||||||||||||||||||||||||||||||||||||||||||||||||||||||||||||||
| Financial Products Segment | 522 | 9 | % | 90 | 32 | % | 100 | (5 | %) | 107 | (4 | %) | 819 | 1 | 7 | % | — | — | 819 | 7 | % | ||||||||||||||||||||||||||||||||||||||||||||||||||||||||||||||
| Corporate Items and Eliminations | (54) | (20) | (12) | (17) | (103) | — | (103) | ||||||||||||||||||||||||||||||||||||||||||||||||||||||||||||||||||||||||||||
| Financial Products Revenues | 468 | 6 | % | 70 | 27 | % | 88 | (8 | %) | 90 | (8 | %) | 716 | 4 | % | — | — | 716 | 4 | % | |||||||||||||||||||||||||||||||||||||||||||||||||||||||||||||||
| Consolidated Sales and Revenues | $ | 7,135 | 31 | % | $ | 1,809 | 36 | % | $ | 3,145 | 7 | % | $ | 2,905 | 9 | % | $ | 14,994 | 21 | % | $ | — | — | $ | 14,994 | 21 | % | ||||||||||||||||||||||||||||||||||||||||||||||||||||||||
| Third Quarter 2021 | |||||||||||||||||||||||||||||||||||||||||||||||||||||||||||||||||||||||||||||||||||
| Construction Industries | $ | 2,417 | $ | 528 | $ | 1,240 | $ | 1,076 | $ | 5,261 | $ | (6) | $ | 5,255 | |||||||||||||||||||||||||||||||||||||||||||||||||||||||||||||||||||||
| Resource Industries | 674 | 417 | 456 | 744 | 2,291 | 75 | 2,366 | ||||||||||||||||||||||||||||||||||||||||||||||||||||||||||||||||||||||||||||
| Energy & Transportation | 1,924 | 329 | 1,144 | 744 | 4,141 | 936 | 5,077 | ||||||||||||||||||||||||||||||||||||||||||||||||||||||||||||||||||||||||||||
| All Other Segment | 18 | — | 3 | 14 | 35 | 84 | 119 | ||||||||||||||||||||||||||||||||||||||||||||||||||||||||||||||||||||||||||||
| Corporate Items and Eliminations | (19) | — | — | (2) | (21) | (1,089) | (1,110) | ||||||||||||||||||||||||||||||||||||||||||||||||||||||||||||||||||||||||||||
| Machinery, Energy & Transportation Sales | 5,014 | 1,274 | 2,843 | 2,576 | 11,707 | — | 11,707 | ||||||||||||||||||||||||||||||||||||||||||||||||||||||||||||||||||||||||||||
| Financial Products Segment | 478 | 68 | 105 | 111 | 762 | 1 | — | 762 | |||||||||||||||||||||||||||||||||||||||||||||||||||||||||||||||||||||||||||
| Corporate Items and Eliminations | (37) | (13) | (9) | (13) | (72) | — | (72) | ||||||||||||||||||||||||||||||||||||||||||||||||||||||||||||||||||||||||||||
| Financial Products Revenues | 441 | 55 | 96 | 98 | 690 | — | 690 | ||||||||||||||||||||||||||||||||||||||||||||||||||||||||||||||||||||||||||||
| Consolidated Sales and Revenues | $ | 5,455 | $ | 1,329 | $ | 2,939 | $ | 2,674 | $ | 12,397 | $ | — | $ | 12,397 | |||||||||||||||||||||||||||||||||||||||||||||||||||||||||||||||||||||
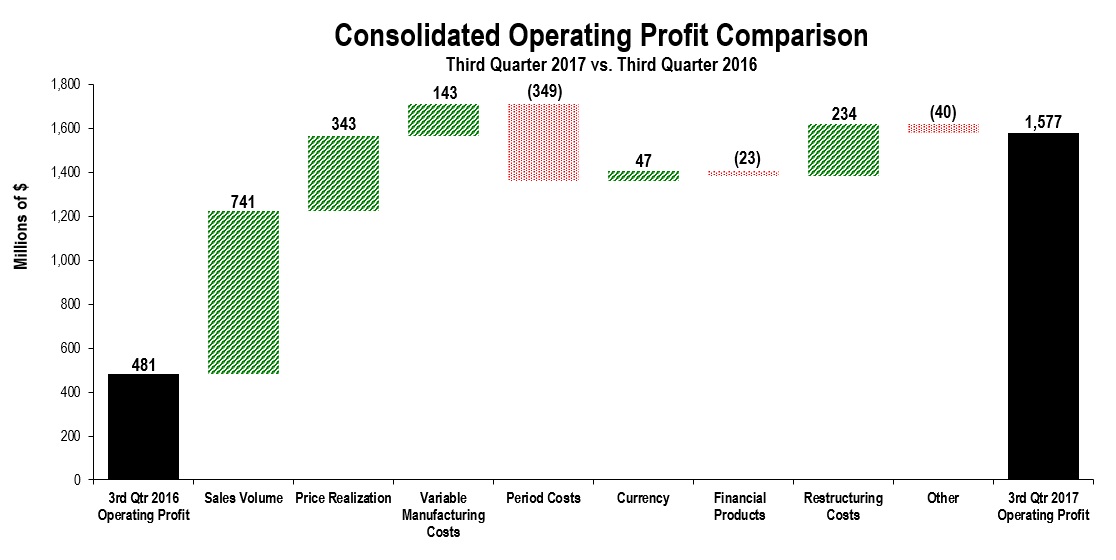
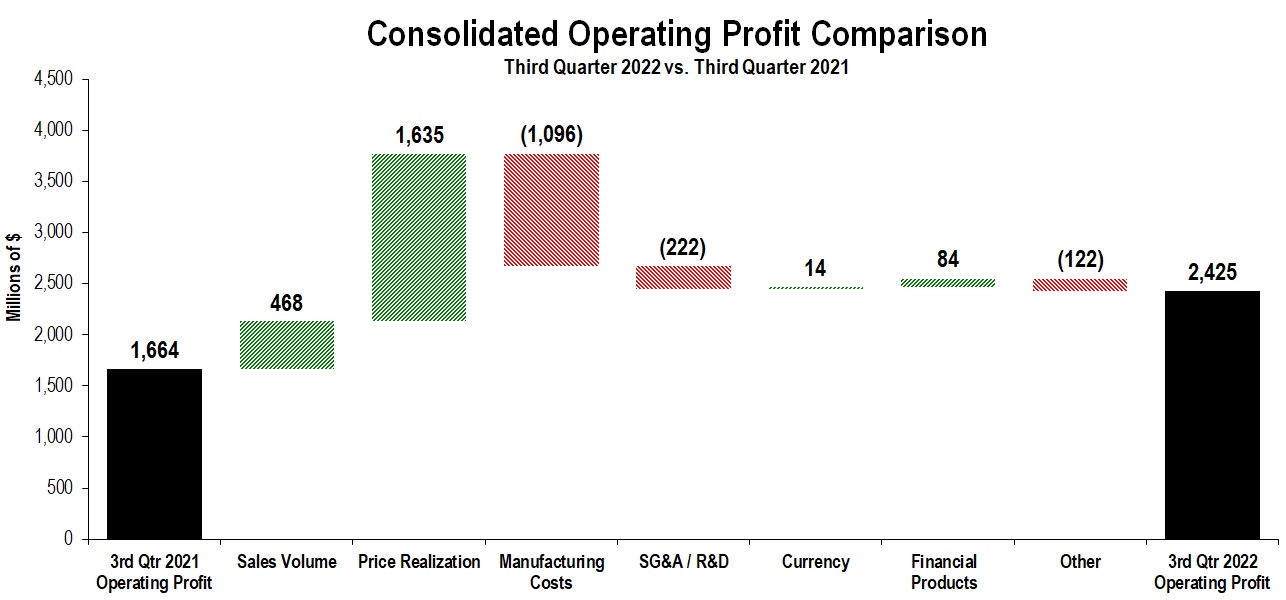
| Profit by Segment | |||||||||||||||||||||||
| (Millions of dollars) | Third Quarter 2022 | Third Quarter 2021 | $ Change | % Change | |||||||||||||||||||
| Construction Industries | $ | 1,209 | $ | 866 | $ | 343 | 40 | % | |||||||||||||||
| Resource Industries | 506 | 280 | 226 | 81 | % | ||||||||||||||||||
| Energy & Transportation | 935 | 706 | 229 | 32 | % | ||||||||||||||||||
| All Other Segment | 8 | 5 | 3 | 60 | % | ||||||||||||||||||
| Corporate Items and Eliminations | (373) | (286) | (87) | ||||||||||||||||||||
| Machinery, Energy & Transportation | 2,285 | 1,571 | 714 | 45 | % | ||||||||||||||||||
| Financial Products Segment | 220 | 173 | 47 | 27 | % | ||||||||||||||||||
| Corporate Items and Eliminations | 30 | (7) | 37 | ||||||||||||||||||||
| Financial Products | 250 | 166 | 84 | 51 | % | ||||||||||||||||||
| Consolidating Adjustments | (110) | (73) | (37) | ||||||||||||||||||||
| Consolidated Operating Profit | $ | 2,425 | $ | 1,664 | $ | 761 | 46 | % | |||||||||||||||
| Corporate Items and Eliminations included corporate-level expenses, timing differences (as some expenses are reported in segment profit on a cash basis), methodology differences between segment and consolidated external reporting (the company values segment inventories and cost of sales using a current cost methodology), certain restructuring costs and inter-segment eliminations. | |||||||||||||||||||||||
| (Millions of dollars) | Total | % Change | North America | % Change | Latin America | % Change | EAME | % Change | Asia/ Pacific | % Change | ||||||||||||||||||||||||
| Third Quarter 2017 | ||||||||||||||||||||||||||||||||||
Construction Industries 1 | $ | 4,854 | 37 | % | $ | 2,165 | 31 | % | $ | 390 | 36 | % | $ | 1,008 | 28 | % | $ | 1,291 | 57 | % | ||||||||||||||
Resource Industries 2 | 1,870 | 36 | % | 581 | 28 | % | 329 | 30 | % | 488 | 61 | % | 472 | 29 | % | |||||||||||||||||||
Energy & Transportation 3 | 3,961 | 12 | % | 1,928 | 22 | % | 300 | 7 | % | 1,166 | 7 | % | 567 | (2 | )% | |||||||||||||||||||
All Other Segments 4 | 56 | 100 | % | 30 | 400 | % | 1 | — | % | 13 | 160 | % | 12 | (29 | )% | |||||||||||||||||||
| Corporate Items and Eliminations | (28 | ) | — | (25 | ) | (1 | ) | (2 | ) | — | ||||||||||||||||||||||||
| Machinery, Energy & Transportation Sales | 10,713 | 27 | % | 4,679 | 27 | % | 1,019 | 24 | % | 2,673 | 22 | % | 2,342 | 31 | % | |||||||||||||||||||
| Financial Products Segment | 774 | 3 | % | 510 | 9 | % | 64 | (24 | )% | 110 | 9 | % | 90 | (8 | )% | |||||||||||||||||||
| Corporate Items and Eliminations | (74 | ) | (51 | ) | (5 | ) | (4 | ) | (14 | ) | ||||||||||||||||||||||||
| Financial Products Revenues | 700 | — | % | 459 | 5 | % | 59 | (20 | )% | 106 | 9 | % | 76 | (14 | )% | |||||||||||||||||||
| Consolidated Sales and Revenues | $ | 11,413 | 25 | % | $ | 5,138 | 25 | % | $ | 1,078 | 20 | % | $ | 2,779 | 22 | % | $ | 2,418 | 29 | % | ||||||||||||||
| Third Quarter 2016 | ||||||||||||||||||||||||||||||||||
Construction Industries 1 | $ | 3,554 | $ | 1,655 | $ | 287 | $ | 789 | $ | 823 | ||||||||||||||||||||||||
Resource Industries 2 | 1,377 | 454 | 254 | 303 | 366 | |||||||||||||||||||||||||||||
Energy & Transportation 3 | 3,534 | 1,583 | 280 | 1,094 | 577 | |||||||||||||||||||||||||||||
All Other Segments 4 | 28 | 6 | — | 5 | 17 | |||||||||||||||||||||||||||||
| Corporate Items and Eliminations | (30 | ) | (26 | ) | — | (3 | ) | (1 | ) | |||||||||||||||||||||||||
| Machinery, Energy & Transportation Sales | 8,463 | 3,672 | 821 | 2,188 | 1,782 | |||||||||||||||||||||||||||||
| Financial Products Segment | 749 | 466 | 84 | 101 | 98 | |||||||||||||||||||||||||||||
| Corporate Items and Eliminations | (52 | ) | (28 | ) | (10 | ) | (4 | ) | (10 | ) | ||||||||||||||||||||||||
| Financial Products Revenues | 697 | 438 | 74 | 97 | 88 | |||||||||||||||||||||||||||||
| Consolidated Sales and Revenues | $ | 9,160 | $ | 4,110 | $ | 895 | $ | 2,285 | $ | 1,870 | ||||||||||||||||||||||||
| Sales and Revenues by Segment | ||||||||||||||||||||||||||||||
| (Millions of dollars) | Third Quarter 2016 | Sales Volume | Price Realization | Currency | Other | Third Quarter 2017 | $ Change | % Change | ||||||||||||||||||||||
| Construction Industries | $ | 3,554 | $ | 1,002 | $ | 291 | $ | 7 | $ | — | $ | 4,854 | $ | 1,300 | 37 | % | ||||||||||||||
| Resource Industries | 1,377 | 410 | 73 | 10 | — | 1,870 | 493 | 36 | % | |||||||||||||||||||||
| Energy & Transportation | 3,534 | 419 | (21 | ) | 29 | — | 3,961 | 427 | 12 | % | ||||||||||||||||||||
| All Other Segments | 28 | 28 | — | — | — | 56 | 28 | 100 | % | |||||||||||||||||||||
| Corporate Items and Eliminations | (30 | ) | 2 | — | — | — | (28 | ) | 2 | |||||||||||||||||||||
| Machinery, Energy & Transportation Sales | 8,463 | 1,861 | 343 | 46 | — | 10,713 | 2,250 | 27 | % | |||||||||||||||||||||
| Financial Products Segment | 749 | — | — | — | 25 | 774 | 25 | 3 | % | |||||||||||||||||||||
| Corporate Items and Eliminations | (52 | ) | — | — | — | (22 | ) | (74 | ) | (22 | ) | |||||||||||||||||||
| Financial Products Revenues | 697 | — | — | — | 3 | 700 | 3 | — | % | |||||||||||||||||||||
| Consolidated Sales and Revenues | $ | 9,160 | $ | 1,861 | $ | 343 | $ | 46 | $ | 3 | $ | 11,413 | $ | 2,253 | 25 | % | ||||||||||||||
| Operating Profit / (Loss) by Segment | ||||||||||||||
| (Millions of dollars) | Third Quarter 2017 | Third Quarter 2016 | $ Change | % Change | ||||||||||
| Construction Industries | $ | 884 | $ | 326 | $ | 558 | 171 | % | ||||||
| Resource Industries | 226 | (77 | ) | 303 | n/a | |||||||||
| Energy & Transportation | 750 | 572 | 178 | 31 | % | |||||||||
| All Other Segments | 6 | (22 | ) | 28 | n/a | |||||||||
| Corporate Items and Eliminations | (359 | ) | (433 | ) | 74 | |||||||||
| Machinery, Energy & Transportation | 1,507 | 366 | 1,141 | 312 | % | |||||||||
| Financial Products Segment | 185 | 183 | 2 | 1 | % | |||||||||
| Corporate Items and Eliminations | (37 | ) | (12 | ) | (25 | ) | ||||||||
| Financial Products | 148 | 171 | (23 | ) | (13 | )% | ||||||||
| Consolidating Adjustments | (78 | ) | (56 | ) | (22 | ) | ||||||||
| Consolidated Operating Profit / (Loss) | $ | 1,577 | $ | 481 | $ | 1,096 | 228 | % | ||||||
| Sales by Application | ||||||||||||||||||||||||||
| (Millions of dollars) | Third Quarter 2022 | Third Quarter 2021 | $ Change | % Change | ||||||||||||||||||||||
| Oil and Gas | $ | 1,323 | $ | 1,088 | $ | 235 | 22 | % | ||||||||||||||||||
| Power Generation | 1,320 | 1,010 | 310 | 31 | % | |||||||||||||||||||||
| Industrial | 1,158 | 948 | 210 | 22 | % | |||||||||||||||||||||
| Transportation | 1,196 | 1,095 | 101 | 9 | % | |||||||||||||||||||||
| External Sales | 4,997 | 4,141 | 856 | 21 | % | |||||||||||||||||||||
| Inter-segment | 1,189 | 936 | 253 | 27 | % | |||||||||||||||||||||
| Total Sales | $ | 6,186 | $ | 5,077 | $ | 1,109 | 22 | % | ||||||||||||||||||
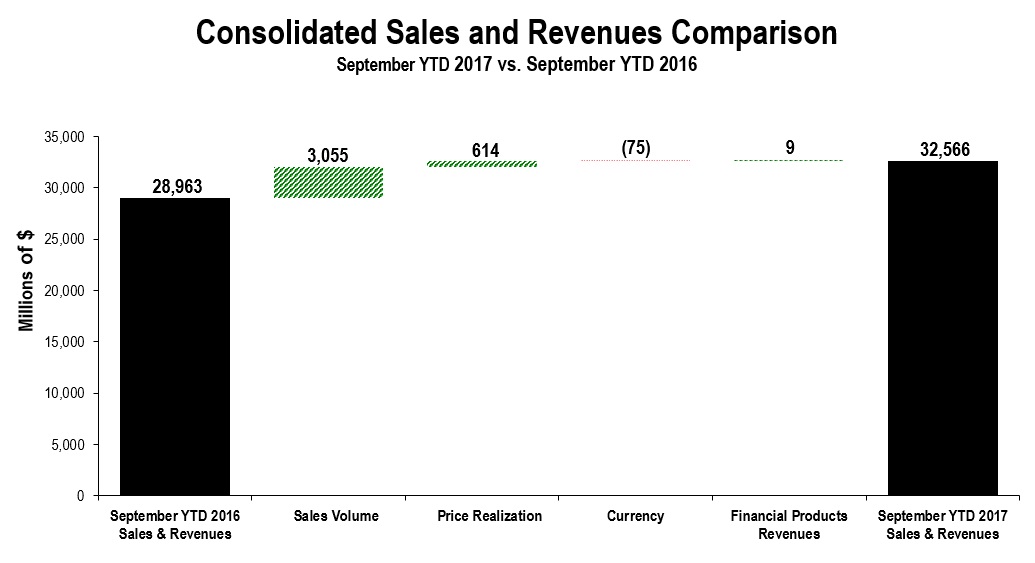

| Sales and Revenues by Segment | |||||||||||||||||||||||||||||||||||||||||||||||
| (Millions of dollars) | Nine Months Ended September 30, 2021 | Sales Volume | Price Realization | Currency | Inter-Segment / Other | Nine Months Ended September 30, 2022 | $ Change | % Change | |||||||||||||||||||||||||||||||||||||||
| Construction Industries | $ | 16,370 | $ | 723 | $ | 1,737 | $ | (452) | $ | 46 | $ | 18,424 | $ | 2,054 | 13 | % | |||||||||||||||||||||||||||||||
| Resource Industries | 7,091 | 1,005 | 929 | (126) | (21) | 8,878 | 1,787 | 25 | % | ||||||||||||||||||||||||||||||||||||||
| Energy & Transportation | 14,559 | 1,314 | 784 | (348) | 620 | 16,929 | 2,370 | 16 | % | ||||||||||||||||||||||||||||||||||||||
| All Other Segment | 377 | 8 | 1 | (4) | (43) | 339 | (38) | (10 | %) | ||||||||||||||||||||||||||||||||||||||
| Corporate Items and Eliminations | (3,306) | 48 | (7) | — | (602) | (3,867) | (561) | ||||||||||||||||||||||||||||||||||||||||
| Machinery, Energy & Transportation Sales | 35,091 | 3,098 | 3,444 | (930) | — | 40,703 | 5,612 | 16 | % | ||||||||||||||||||||||||||||||||||||||
| Financial Products Segment | 2,297 | — | — | — | 103 | 2,400 | 103 | 4 | % | ||||||||||||||||||||||||||||||||||||||
| Corporate Items and Eliminations | (215) | — | — | — | (58) | (273) | (58) | ||||||||||||||||||||||||||||||||||||||||
| Financial Products Revenues | 2,082 | — | — | — | 45 | 2,127 | 45 | 2 | % | ||||||||||||||||||||||||||||||||||||||
| Consolidated Sales and Revenues | $ | 37,173 | $ | 3,098 | $ | 3,444 | $ | (930) | $ | 45 | $ | 42,830 | $ | 5,657 | 15 | % | |||||||||||||||||||||||||||||||
| Sales and Revenues by Geographic Region | ||
| North America | Latin America | EAME | Asia/Pacific | External Sales and Revenues | Inter-Segment | Total Sales and Revenues | |||||||||||||||||||||||||||||||||||||||||||||||||||||||||||||||||||||||||||||
| (Millions of dollars) | $ | % Chg | $ | % Chg | $ | % Chg | $ | % Chg | $ | % Chg | $ | % Chg | $ | % Chg | |||||||||||||||||||||||||||||||||||||||||||||||||||||||||||||||||||||
| Nine Months Ended September 30, 2022 | |||||||||||||||||||||||||||||||||||||||||||||||||||||||||||||||||||||||||||||||||||
| Construction Industries | $ | 8,832 | 25 | % | $ | 2,061 | 53 | % | $ | 3,726 | 3 | % | $ | 3,694 | (14 | %) | $ | 18,313 | 12 | % | $ | 111 | 71 | % | $ | 18,424 | 13 | % | |||||||||||||||||||||||||||||||||||||||||||||||||||||||
| Resource Industries | 3,167 | 49 | % | 1,337 | 2 | % | 1,609 | 11 | % | 2,554 | 30 | % | 8,667 | 26 | % | 211 | (9 | %) | 8,878 | 25 | % | ||||||||||||||||||||||||||||||||||||||||||||||||||||||||||||||
| Energy & Transportation | 6,637 | 16 | % | 1,160 | 39 | % | 3,679 | 7 | % | 2,193 | 12 | % | 13,669 | 15 | % | 3,260 | 23 | % | 16,929 | 16 | % | ||||||||||||||||||||||||||||||||||||||||||||||||||||||||||||||
| All Other Segment | 52 | 24 | % | — | (100 | %) | 14 | 40 | % | 46 | (15 | %) | 112 | 5 | % | 227 | (16 | %) | 339 | (10 | %) | ||||||||||||||||||||||||||||||||||||||||||||||||||||||||||||||
| Corporate Items and Eliminations | (43) | (1) | (2) | (12) | (58) | (3,809) | (3,867) | ||||||||||||||||||||||||||||||||||||||||||||||||||||||||||||||||||||||||||||
| Machinery, Energy & Transportation Sales | 18,645 | 26 | % | 4,557 | 30 | % | 9,026 | 6 | % | 8,475 | 3 | % | 40,703 | 16 | % | — | — | % | 40,703 | 16 | % | ||||||||||||||||||||||||||||||||||||||||||||||||||||||||||||||
| Financial Products Segment | 1,530 | 6 | % | 250 | 28 | % | 293 | (3 | %) | 327 | (9 | %) | 2,400 | 1 | 4 | % | — | — | % | 2,400 | 4 | % | |||||||||||||||||||||||||||||||||||||||||||||||||||||||||||||
| Corporate Items and Eliminations | (132) | (58) | (31) | (52) | (273) | — | (273) | ||||||||||||||||||||||||||||||||||||||||||||||||||||||||||||||||||||||||||||
| Financial Products Revenues | 1,398 | 4 | % | 192 | 20 | % | 262 | (5 | %) | 275 | (10 | %) | 2,127 | 2 | % | — | — | % | 2,127 | 2 | % | ||||||||||||||||||||||||||||||||||||||||||||||||||||||||||||||
| Consolidated Sales and Revenues | $ | 20,043 | 24 | % | $ | 4,749 | 30 | % | $ | 9,288 | 6 | % | $ | 8,750 | 2 | % | $ | 42,830 | 15 | % | $ | — | — | % | $ | 42,830 | 15 | % | |||||||||||||||||||||||||||||||||||||||||||||||||||||||
| Nine Months Ended September 30, 2021 | |||||||||||||||||||||||||||||||||||||||||||||||||||||||||||||||||||||||||||||||||||
| Construction Industries | $ | 7,041 | $ | 1,350 | $ | 3,612 | $ | 4,302 | $ | 16,305 | $ | 65 | $ | 16,370 | |||||||||||||||||||||||||||||||||||||||||||||||||||||||||||||||||||||
| Resource Industries | 2,130 | 1,309 | 1,455 | 1,965 | 6,859 | 232 | 7,091 | ||||||||||||||||||||||||||||||||||||||||||||||||||||||||||||||||||||||||||||
| Energy & Transportation | 5,698 | 835 | 3,433 | 1,953 | 11,919 | 2,640 | 14,559 | ||||||||||||||||||||||||||||||||||||||||||||||||||||||||||||||||||||||||||||
| All Other Segment | 42 | 1 | 10 | 54 | 107 | 270 | 377 | ||||||||||||||||||||||||||||||||||||||||||||||||||||||||||||||||||||||||||||
| Corporate Items and Eliminations | (89) | (1) | (1) | (8) | (99) | (3,207) | (3,306) | ||||||||||||||||||||||||||||||||||||||||||||||||||||||||||||||||||||||||||||
| Machinery, Energy & Transportation Sales | 14,822 | 3,494 | 8,509 | 8,266 | 35,091 | — | 35,091 | ||||||||||||||||||||||||||||||||||||||||||||||||||||||||||||||||||||||||||||
| Financial Products Segment | 1,442 | 195 | 301 | 359 | 2,297 | 1 | — | 2,297 | |||||||||||||||||||||||||||||||||||||||||||||||||||||||||||||||||||||||||||
| Corporate Items and Eliminations | (99) | (35) | (26) | (55) | (215) | — | (215) | ||||||||||||||||||||||||||||||||||||||||||||||||||||||||||||||||||||||||||||
| Financial Products Revenues | 1,343 | 160 | 275 | 304 | 2,082 | — | 2,082 | ||||||||||||||||||||||||||||||||||||||||||||||||||||||||||||||||||||||||||||
| Consolidated Sales and Revenues | $ | 16,165 | $ | 3,654 | $ | 8,784 | $ | 8,570 | $ | 37,173 | $ | — | $ | 37,173 | |||||||||||||||||||||||||||||||||||||||||||||||||||||||||||||||||||||
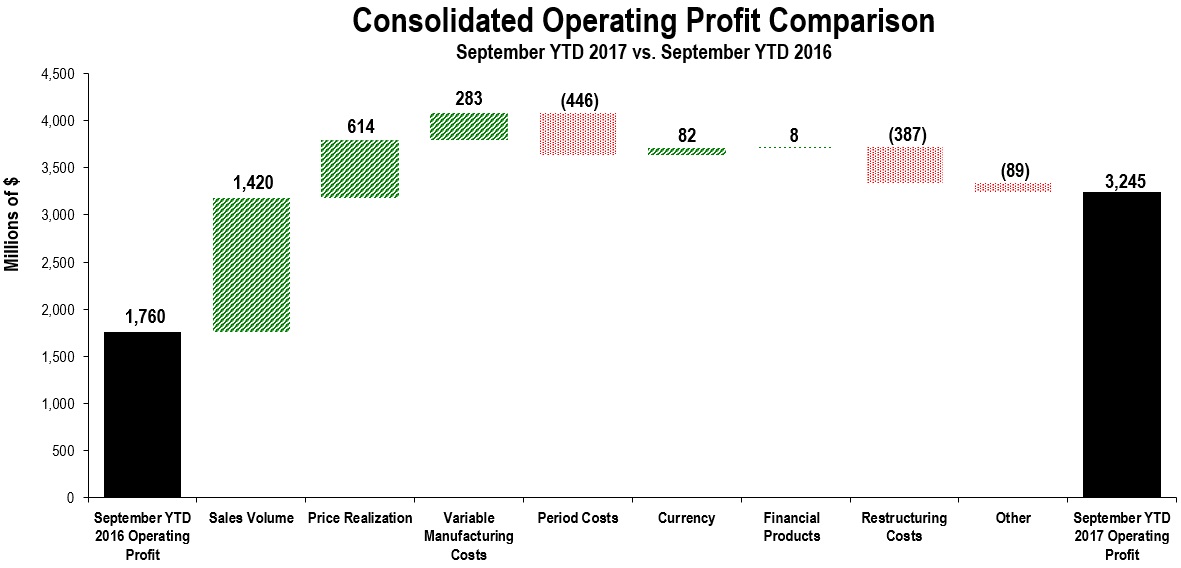
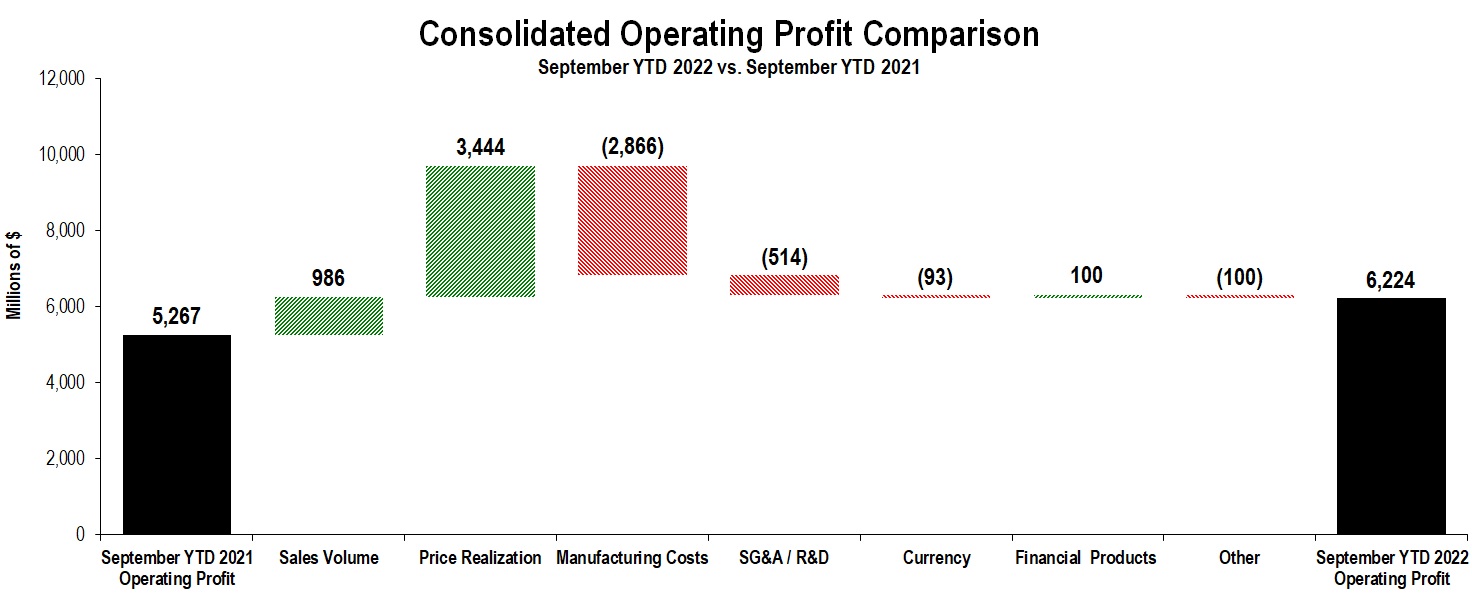
| Profit (Loss) by Segment | |||||||||||||||||||||||
| (Millions of dollars) | Nine Months Ended September 30, 2022 | Nine Months Ended September 30, 2021 | $ Change | % Change | |||||||||||||||||||
| Construction Industries | $ | 3,255 | $ | 2,937 | $ | 318 | 11 | % | |||||||||||||||
| Resource Industries | 1,222 | 941 | 281 | 30 | % | ||||||||||||||||||
| Energy & Transportation | 2,132 | 2,119 | 13 | 1 | % | ||||||||||||||||||
| All Other Segment | 42 | (2) | 44 | n/a | |||||||||||||||||||
| Corporate Items and Eliminations | (847) | (1,107) | 260 | ||||||||||||||||||||
| Machinery, Energy & Transportation | 5,804 | 4,888 | 916 | 19 | % | ||||||||||||||||||
| Financial Products Segment | 675 | 660 | 15 | 2 | % | ||||||||||||||||||
| Corporate Items and Eliminations | 30 | (55) | 85 | ||||||||||||||||||||
| Financial Products | 705 | 605 | 100 | 17 | % | ||||||||||||||||||
| Consolidating Adjustments | (285) | (226) | (59) | ||||||||||||||||||||
| Consolidated Operating Profit | $ | 6,224 | $ | 5,267 | $ | 957 | 18 | % | |||||||||||||||
| Corporate Items and Eliminations included corporate-level expenses, timing differences (as some expenses are reported in segment profit on a cash basis), methodology differences between segment and consolidated external reporting (the company values segment inventories and cost of sales using a current cost methodology), certain restructuring costs and inter-segment eliminations. | |||||||||||||||||||||||
| (Millions of dollars) | Total | % Change | North America | % Change | Latin America | % Change | EAME | % Change | Asia/ Pacific | % Change | ||||||||||||||||||||||||
| Nine Months Ended September 30, 2017 | ||||||||||||||||||||||||||||||||||
Construction Industries 1 | $ | 13,875 | 15 | % | $ | 6,396 | 7 | % | $ | 1,004 | 26 | % | $ | 2,784 | 5 | % | $ | 3,691 | 41 | % | ||||||||||||||
Resource Industries 2 | 5,299 | 24 | % | 1,791 | 12 | % | 897 | 15 | % | 1,300 | 47 | % | 1,311 | 28 | % | |||||||||||||||||||
Energy & Transportation 3 | 11,258 | 7 | % | 5,632 | 14 | % | 887 | 17 | % | 3,145 | — | % | 1,594 | (7 | )% | |||||||||||||||||||
All Other Segments 4 | 126 | 18 | % | 48 | 37 | % | 2 | (33 | )% | 40 | 74 | % | 36 | (22 | )% | |||||||||||||||||||
| Corporate Items and Eliminations | (76 | ) | (70 | ) | (1 | ) | (6 | ) | 1 | |||||||||||||||||||||||||
| Machinery, Energy & Transportation Sales | 30,482 | 13 | % | 13,797 | 11 | % | 2,789 | 19 | % | 7,263 | 9 | % | 6,633 | 23 | % | |||||||||||||||||||
| Financial Products Segment | 2,310 | 3 | % | 1,501 | 7 | % | 226 | (11 | )% | 311 | 3 | % | 272 | (9 | )% | |||||||||||||||||||
| Corporate Items and Eliminations | (226 | ) | (140 | ) | (34 | ) | (13 | ) | (39 | ) | ||||||||||||||||||||||||
| Financial Products Revenues | 2,084 | — | % | 1,361 | 5 | % | 192 | (12 | )% | 298 | 3 | % | 233 | (13 | )% | |||||||||||||||||||
| Consolidated Sales and Revenues | $ | 32,566 | 12 | % | $ | 15,158 | 10 | % | $ | 2,981 | 17 | % | $ | 7,561 | 8 | % | $ | 6,866 | 21 | % | ||||||||||||||
| Nine Months Ended September 30, 2016 | ||||||||||||||||||||||||||||||||||
Construction Industries 1 | $ | 12,023 | $ | 5,960 | $ | 795 | $ | 2,646 | $ | 2,622 | ||||||||||||||||||||||||
Resource Industries 2 | 4,283 | 1,597 | 780 | 882 | 1,024 | |||||||||||||||||||||||||||||
Energy & Transportation 3 | 10,562 | 4,958 | 757 | 3,138 | 1,709 | |||||||||||||||||||||||||||||
All Other Segments 4 | 107 | 35 | 3 | 23 | 46 | |||||||||||||||||||||||||||||
| Corporate Items and Eliminations | (87 | ) | (75 | ) | (1 | ) | (7 | ) | (4 | ) | ||||||||||||||||||||||||
| Machinery, Energy & Transportation Sales | 26,888 | 12,475 | 2,334 | 6,682 | 5,397 | |||||||||||||||||||||||||||||
| Financial Products Segment | 2,251 | 1,398 | 253 | 302 | 298 | |||||||||||||||||||||||||||||
| Corporate Items and Eliminations | (176 | ) | (96 | ) | (36 | ) | (13 | ) | (31 | ) | ||||||||||||||||||||||||
| Financial Products Revenues | 2,075 | 1,302 | 217 | 289 | 267 | |||||||||||||||||||||||||||||
| Consolidated Sales and Revenues | $ | 28,963 | $ | 13,777 | $ | 2,551 | $ | 6,971 | $ | 5,664 | ||||||||||||||||||||||||
| Sales and Revenues by Segment | ||||||||||||||||||||||||||||||
| (Millions of dollars) | Nine Months Ended September 30, 2016 | Sales Volume | Price Realization | Currency | Other | Nine Months Ended September 30, 2017 | $ Change | % Change | ||||||||||||||||||||||
| Construction Industries | $ | 12,023 | $ | 1,308 | $ | 605 | $ | (61 | ) | $ | — | $ | 13,875 | $ | 1,852 | 15 | % | |||||||||||||
| Resource Industries | 4,283 | 969 | 34 | 13 | — | 5,299 | 1,016 | 24 | % | |||||||||||||||||||||
| Energy & Transportation | 10,562 | 748 | (25 | ) | (27 | ) | — | 11,258 | 696 | 7 | % | |||||||||||||||||||
| All Other Segments | 107 | 19 | — | — | — | 126 | 19 | 18 | % | |||||||||||||||||||||
| Corporate Items and Eliminations | (87 | ) | 11 | — | — | — | (76 | ) | 11 | |||||||||||||||||||||
| Machinery, Energy & Transportation Sales | 26,888 | 3,055 | 614 | (75 | ) | — | 30,482 | 3,594 | 13 | % | ||||||||||||||||||||
| Financial Products Segment | 2,251 | — | — | — | 59 | 2,310 | 59 | 3 | % | |||||||||||||||||||||
| Corporate Items and Eliminations | (176 | ) | — | — | — | (50 | ) | (226 | ) | (50 | ) | |||||||||||||||||||
| Financial Products Revenues | 2,075 | — | — | — | 9 | 2,084 | 9 | — | % | |||||||||||||||||||||
| Consolidated Sales and Revenues | $ | 28,963 | $ | 3,055 | $ | 614 | $ | (75 | ) | $ | 9 | $ | 32,566 | $ | 3,603 | 12 | % | |||||||||||||
| Operating Profit / (Loss) by Segment | ||||||||||||||
| (Millions of dollars) | Nine Months Ended September 30, 2017 | Nine Months Ended September 30, 2016 | $ Change | % Change | ||||||||||
| Construction Industries | $ | 2,420 | $ | 1,316 | $ | 1,104 | 84 | % | ||||||
| Resource Industries | 481 | (336 | ) | 817 | n/a | |||||||||
| Energy & Transportation | 2,002 | 1,584 | 418 | 26 | % | |||||||||
| All Other Segments | (27 | ) | (43 | ) | 16 | (37 | )% | |||||||
| Corporate Items and Eliminations | (1,915 | ) | (1,087 | ) | (828 | ) | ||||||||
| Machinery, Energy & Transportation | 2,961 | 1,434 | 1,527 | 106 | % | |||||||||
| Financial Products Segment | 559 | 553 | 6 | 1 | % | |||||||||
| Corporate Items and Eliminations | (39 | ) | (44 | ) | 5 | |||||||||
| Financial Products | 520 | 509 | 11 | 2 | % | |||||||||
| Consolidating Adjustments | (236 | ) | (183 | ) | (53 | ) | ||||||||
| Consolidated Operating Profit / (Loss) | $ | 3,245 | $ | 1,760 | $ | 1,485 | 84 | % | ||||||
| Sales by Application | ||||||||||||||||||||||||||
| (Millions of dollars) | Nine Months Ended September 30, 2022 | Nine Months Ended September 30, 2021 | $ Change | % Change | ||||||||||||||||||||||
| Oil and Gas | $ | 3,503 | $ | 3,140 | $ | 363 | 12 | % | ||||||||||||||||||
| Power Generation | 3,518 | 3,025 | 493 | 16 | % | |||||||||||||||||||||
| Industrial | 3,295 | 2,660 | 635 | 24 | % | |||||||||||||||||||||
| Transportation | 3,353 | 3,094 | 259 | 8 | % | |||||||||||||||||||||
| External Sales | 13,669 | 11,919 | 1,750 | 15 | % | |||||||||||||||||||||
| Inter-Segment | 3,260 | 2,640 | 620 | 23 | % | |||||||||||||||||||||
| Total Sales | $ | 16,929 | $ | 14,559 | $ | 2,370 | 16 | % | ||||||||||||||||||
| (Millions of dollars) | Three Months Ended September 30 | ||||||||
| 2017 | 2016 | ||||||||
Employee separations 1 | $ | 8 | $ | 99 | |||||
Contract terminations 1 | 6 | 9 | |||||||
Long-lived asset impairments 1 | 31 | 158 | |||||||
Other 2 | 45 | 58 | |||||||
| Total restructuring costs | $ | 90 | $ | 324 | |||||
| Nine Months Ended September 30 | |||||||||
| 2017 | 2016 | ||||||||
Employee separations 1 | $ | 514 | $ | 175 | |||||
Contract terminations 1 | 32 | 55 | |||||||
Long-lived asset impairments 1 | 306 | 254 | |||||||
Defined benefit plan curtailments and termination benefits 1 | 29 | — | |||||||
Other 2 | 130 | 140 | |||||||
| Total restructuring costs | $ | 1,011 | $ | 624 | |||||
1 Recognized in Other operating (income) expenses. | |||||||||
2 Represents costs related to our restructuring programs, primarily for accelerated depreciation, inventory write-downs, equipment relocation and | |||||||||
project management costs and also LIFO inventory decrement benefits from inventory liquidations at closed facilities (all of which are | |||||||||
| primarily included in Cost of goods sold). | |||||||||
| (Millions of dollars) | ||||
| Liability balance at December 31, 2015 | $ | 483 | ||
| Increase in liability (separation charges) | 297 | |||
| Reduction in liability (payments) | (633 | ) | ||
| Liability balance at December 31, 2016 | $ | 147 | ||
| Increase in liability (separation charges) | 514 | |||
| Reduction in liability (payments) | (339 | ) | ||
| Liability balance at September 30, 2017 | $ | 322 | ||
2.Adjusted Profit Per Share – Profit per share excluding restructuring costs. 3.All Other Segment – Primarily includes activities such as: business strategy; product management and development; manufacturing and sourcing of filters and fluids, undercarriage, ground-engaging tools, fluid transfer products, precision seals, rubber sealing and connecting components primarily for Cat® products; parts distribution; integrated logistics solutions; distribution services responsible for dealer development and administration, including a wholly owned dealer in Japan; dealer portfolio management |
| September 30, 2017 | September 30, 2022 | |||||||||||||||||||||||||||
| (Millions of dollars) | Consolidated | Machinery, Energy & Transportation | Financial Products | (Millions of dollars) | Consolidated | Machinery, Energy & Transportation | Financial Products | |||||||||||||||||||||
| Credit lines available: | Credit lines available: | |||||||||||||||||||||||||||
| Global credit facilities | $ | 10,500 | $ | 2,750 | $ | 7,750 | Global credit facilities | $ | 10,500 | $ | 2,750 | $ | 7,750 | |||||||||||||||
| Other external | 4,597 | 11 | 4,586 | Other external | 3,352 | 172 | 3,180 | |||||||||||||||||||||
| Total credit lines available | 15,097 | 2,761 | 12,336 | Total credit lines available | 13,852 | 2,922 | 10,930 | |||||||||||||||||||||
| Less: Commercial paper outstanding | (4,227 | ) | — | (4,227 | ) | Less: Commercial paper outstanding | (3,723) | — | (3,723) | |||||||||||||||||||
| Less: Utilized credit | (1,567 | ) | (11 | ) | (1,556 | ) | Less: Utilized credit | (684) | (3) | (681) | ||||||||||||||||||
| Available credit | $ | 9,303 | $ | 2,750 | $ | 6,553 | Available credit | $ | 9,445 | $ | 2,919 | $ | 6,526 | |||||||||||||||
| (Dollars in millions except per share data) | Operating Profit | Operating Profit Margin | Profit Before Taxes | Provision (Benefit) for Income Taxes | Effective Tax Rate | Profit | Profit per Share | |||||||||||||||||||||||||||||||||||||
| Three Months Ended September 30, 2022 - U.S. GAAP | $ | 2,425 | 16.2 | % | $ | 2,558 | $ | 527 | 20.6 | % | $ | 2,041 | $ | 3.87 | ||||||||||||||||||||||||||||||
| Restructuring costs | 49 | 0.3 | % | 49 | 9 | 18.4 | % | 40 | $ | 0.08 | ||||||||||||||||||||||||||||||||||
| Three Months Ended September 30, 2022 - Adjusted | $ | 2,474 | 16.5 | % | $ | 2,607 | $ | 536 | 20.6 | % | $ | 2,081 | $ | 3.95 | ||||||||||||||||||||||||||||||
| Three Months Ended September 30, 2021 - U.S. GAAP | $ | 1,664 | 13.4 | % | $ | 1,775 | $ | 368 | 20.7 | % | $ | 1,426 | $ | 2.60 | ||||||||||||||||||||||||||||||
| Restructuring costs | 35 | 0.3 | % | 35 | 6 | 15.0 | % | 29 | $ | 0.06 | ||||||||||||||||||||||||||||||||||
| Three Months Ended September 30, 2021 - Adjusted | $ | 1,699 | 13.7 | % | $ | 1,810 | $ | 374 | 20.7 | % | $ | 1,455 | $ | 2.66 | ||||||||||||||||||||||||||||||
| Nine Months Ended September 30, 2022- U.S. GAAP | $ | 6,224 | 14.5 | % | $ | 6,653 | $ | 1,423 | 21.4 | % | $ | 5,251 | $ | 9.85 | ||||||||||||||||||||||||||||||
| Restructuring costs | 90 | 0.2 | % | 90 | 13 | 14.0 | % | 77 | $ | 0.14 | ||||||||||||||||||||||||||||||||||
| Nine Months Ended September 30, 2022 - Adjusted | $ | 6,314 | 14.7 | % | $ | 6,743 | $ | 1,436 | 21.3 | % | $ | 5,328 | $ | 9.99 | ||||||||||||||||||||||||||||||
| Nine Months Ended September 30, 2021 - U.S. GAAP | $ | 5,267 | 14.2 | % | $ | 5,642 | $ | 1,313 | 23.3 | % | $ | 4,369 | $ | 7.94 | ||||||||||||||||||||||||||||||
| Restructuring costs | 124 | 0.3 | % | 124 | 19 | 15.0 | % | 105 | $ | 0.19 | ||||||||||||||||||||||||||||||||||
| Nine Months Ended September 30, 2021 - Adjusted | $ | 5,391 | 14.5 | % | $ | 5,766 | $ | 1,332 | 23.1 | % | $ | 4,474 | $ | 8.13 | ||||||||||||||||||||||||||||||
| (Millions of dollars) | Nine Months Ended September 30 | |||||||||||||||||||
| 2022 | 2021 | |||||||||||||||||||
ME&T net cash provided by operating activities 1 | $ | 3,191 | $ | 4,899 | ||||||||||||||||
| ME&T capital expenditures | (880) | (693) | ||||||||||||||||||
| Cash payments related to settlements with the U.S. Internal Revenue Service | 467 | — | ||||||||||||||||||
| ME&T free cash flow | $ | 2,778 | $ | 4,206 | ||||||||||||||||
1 See reconciliation of ME&T net cash provided by operating activities to consolidated net cash provided by operating activities on pages 73 - 74. | ||||||||||||||||||||
| Three Months Ended September 30 | Nine Months Ended September 30 | |||||||||||||||
| 2017 | 2016 | 2017 | 2016 | |||||||||||||
| Profit per share - diluted | $ | 1.77 | $ | 0.48 | $ | 3.44 | $ | 1.88 | ||||||||
Per share restructuring costs 1 | 0.18 | 0.37 | 1.37 | 0.70 | ||||||||||||
Per share gain on sale of equity investment2 | $ | — | $ | — | $ | (0.09 | ) | $ | — | |||||||
| Adjusted profit per share | $ | 1.95 | $ | 0.85 | $ | 4.72 | $ | 2.58 | ||||||||
1 At estimated annual tax rate based on full-year outlook for per share restructuring costs at statutory tax rates. Three and nine months ended September 30, 2017 at estimated annual tax rate of 20 percent. Nine months ended September 30, 2017 also includes $15 million increase to prior year taxes related to non-U.S. restructuring costs recognized in the first quarter of 2017. Third-quarter 2017 includes an unfavorable interim adjustment of $0.06 per share and nine months ended September 30, 2017 includes a favorable interim adjustment of $0.01 per share resulting from the difference in the estimated annual tax rate for consolidated reporting of 32 percent and the estimated annual tax rate for profit per share excluding restructuring costs, gain on sale of equity investment and discrete items of 29 percent. | ||||||||||||||||
2 At U.S. statutory tax rate of 35 percent. | ||||||||||||||||
| Supplemental Consolidating Data | Supplemental Consolidating Data | ||||||||||||||||||||||||||||||||||||||||||
| Consolidated | Machinery, Energy & Transportation 1 | Financial Products | Consolidating Adjustments | Consolidated | Machinery, Energy & Transportation | Financial Products | Consolidating Adjustments | ||||||||||||||||||||||||||||||||||||
| Sales and revenues: | Sales and revenues: | ||||||||||||||||||||||||||||||||||||||||||
| Sales of Machinery, Energy & Transportation | $ | 10,713 | $ | 10,713 | $ | — | $ | — | Sales of Machinery, Energy & Transportation | $ | 14,278 | $ | 14,278 | $ | — | $ | — | ||||||||||||||||||||||||||
| Revenues of Financial Products | 700 | — | 793 | (93 | ) | 2 | Revenues of Financial Products | 716 | — | 852 | (136) | 1 | |||||||||||||||||||||||||||||||
| Total sales and revenues | 11,413 | 10,713 | 793 | (93 | ) | Total sales and revenues | 14,994 | 14,278 | 852 | (136) | |||||||||||||||||||||||||||||||||
| Operating costs: | Operating costs: | ||||||||||||||||||||||||||||||||||||||||||
| Cost of goods sold | 7,633 | 7,633 | — | — | Cost of goods sold | 10,202 | 10,203 | — | (1) | 2 | |||||||||||||||||||||||||||||||||
| Selling, general and administrative expenses | 1,237 | 1,067 | 173 | (3 | ) | 3 | Selling, general and administrative expenses | 1,401 | 1,271 | 136 | (6) | 2 | |||||||||||||||||||||||||||||||
| Research and development expenses | 455 | 455 | — | — | Research and development expenses | 476 | 476 | — | — | ||||||||||||||||||||||||||||||||||
| Interest expense of Financial Products | 163 | — | 169 | (6 | ) | 4 | Interest expense of Financial Products | 151 | — | 151 | — | ||||||||||||||||||||||||||||||||
| Other operating (income) expenses | 348 | 51 | 303 | (6 | ) | 3 | Other operating (income) expenses | 339 | 43 | 315 | (19) | 2 | |||||||||||||||||||||||||||||||
| Total operating costs | 9,836 | 9,206 | 645 | (15 | ) | Total operating costs | 12,569 | 11,993 | 602 | (26) | |||||||||||||||||||||||||||||||||
| Operating profit | 1,577 | 1,507 | 148 | (78 | ) | Operating profit | 2,425 | 2,285 | 250 | (110) | |||||||||||||||||||||||||||||||||
| Interest expense excluding Financial Products | 118 | 143 | — | (25 | ) | 4 | Interest expense excluding Financial Products | 109 | 110 | — | (1) | 3 | |||||||||||||||||||||||||||||||
| Other income (expense) | 64 | (22 | ) | 33 | 53 | 5 | Other income (expense) | 242 | 160 | (27) | 109 | 4 | |||||||||||||||||||||||||||||||
| Consolidated profit before taxes | 1,523 | 1,342 | 181 | — | Consolidated profit before taxes | 2,558 | 2,335 | 223 | — | ||||||||||||||||||||||||||||||||||
| Provision (benefit) for income taxes | 470 | 413 | 57 | — | Provision (benefit) for income taxes | 527 | 464 | 63 | — | ||||||||||||||||||||||||||||||||||
| Profit of consolidated companies | 1,053 | 929 | 124 | — | Profit of consolidated companies | 2,031 | 1,871 | 160 | — | ||||||||||||||||||||||||||||||||||
| Equity in profit (loss) of unconsolidated affiliated companies | 8 | 8 | — | — | Equity in profit (loss) of unconsolidated affiliated companies | 9 | 11 | — | (2) | 5 | |||||||||||||||||||||||||||||||||
| Equity in profit of Financial Products’ subsidiaries | — | 122 | — | (122 | ) | 6 | |||||||||||||||||||||||||||||||||||||
| Profit of consolidated and affiliated companies | 1,061 | 1,059 | 124 | (122 | ) | Profit of consolidated and affiliated companies | 2,040 | 1,882 | 160 | (2) | |||||||||||||||||||||||||||||||||
| Less: Profit (loss) attributable to noncontrolling interests | 2 | — | 2 | — | Less: Profit (loss) attributable to noncontrolling interests | (1) | (1) | 2 | (2) | 6 | |||||||||||||||||||||||||||||||||
Profit 7 | $ | 1,059 | $ | 1,059 | $ | 122 | $ | (122 | ) | Profit 7 | $ | 2,041 | $ | 1,883 | $ | 158 | $ | — | |||||||||||||||||||||||||
| Supplemental Consolidating Data | Supplemental Consolidating Data | ||||||||||||||||||||||||||||||||||||||||||
| Consolidated | Machinery, Energy & Transportation 1 | Financial Products | Consolidating Adjustments | Consolidated | Machinery, Energy & Transportation | Financial Products | Consolidating Adjustments | ||||||||||||||||||||||||||||||||||||
| Sales and revenues: | Sales and revenues: | ||||||||||||||||||||||||||||||||||||||||||
| Sales of Machinery, Energy & Transportation | $ | 30,482 | $ | 30,482 | $ | — | $ | — | Sales of Machinery, Energy & Transportation | $ | 40,703 | $ | 40,703 | $ | — | $ | — | ||||||||||||||||||||||||||
| Revenues of Financial Products | 2,084 | — | 2,363 | (279 | ) | 2 | Revenues of Financial Products | 2,127 | — | 2,493 | (366) | 1 | |||||||||||||||||||||||||||||||
| Total sales and revenues | 32,566 | 30,482 | 2,363 | (279 | ) | Total sales and revenues | 42,830 | 40,703 | 2,493 | (366) | |||||||||||||||||||||||||||||||||
| Operating costs: | Operating costs: | ||||||||||||||||||||||||||||||||||||||||||
| Cost of goods sold | 22,160 | 22,160 | — | — | Cost of goods sold | 29,736 | 29,741 | — | (5) | 2 | |||||||||||||||||||||||||||||||||
| Selling, general and administrative expenses | 3,571 | 3,145 | 438 | (12 | ) | 3 | Selling, general and administrative expenses | 4,172 | 3,714 | 475 | (17) | 2 | |||||||||||||||||||||||||||||||
| Research and development expenses | 1,326 | 1,326 | — | — | Research and development expenses | 1,413 | 1,413 | — | — | ||||||||||||||||||||||||||||||||||
| Interest expense of Financial Products | 484 | — | 499 | (15 | ) | 4 | Interest expense of Financial Products | 377 | — | 377 | — | ||||||||||||||||||||||||||||||||
| Other operating (income) expenses | 1,780 | 890 | 906 | (16 | ) | 3 | Other operating (income) expenses | 908 | 31 | 936 | (59) | 2 | |||||||||||||||||||||||||||||||
| Total operating costs | 29,321 | 27,521 | 1,843 | (43 | ) | Total operating costs | 36,606 | 34,899 | 1,788 | (81) | |||||||||||||||||||||||||||||||||
| Operating profit | 3,245 | 2,961 | 520 | (236 | ) | Operating profit | 6,224 | 5,804 | 705 | (285) | |||||||||||||||||||||||||||||||||
| Interest expense excluding Financial Products | 362 | 433 | — | (71 | ) | 4 | Interest expense excluding Financial Products | 326 | 327 | — | (1) | 3 | |||||||||||||||||||||||||||||||
| Other income (expense) | 88 | (110 | ) | 33 | 165 | 5 | Other income (expense) | 755 | 497 | (26) | 284 | 4 | |||||||||||||||||||||||||||||||
| Consolidated profit before taxes | 2,971 | 2,418 | 553 | — | Consolidated profit before taxes | 6,653 | 5,974 | 679 | — | ||||||||||||||||||||||||||||||||||
| Provision (benefit) for income taxes | 921 | 750 | 171 | — | Provision (benefit) for income taxes | 1,423 | 1,250 | 173 | — | ||||||||||||||||||||||||||||||||||
| Profit of consolidated companies | 2,050 | 1,668 | 382 | — | Profit of consolidated companies | 5,230 | 4,724 | 506 | — | ||||||||||||||||||||||||||||||||||
| Equity in profit (loss) of unconsolidated affiliated companies | 8 | 8 | — | — | Equity in profit (loss) of unconsolidated affiliated companies | 20 | 26 | — | (6) | 5 | |||||||||||||||||||||||||||||||||
| Equity in profit of Financial Products’ subsidiaries | — | 377 | — | (377 | ) | 6 | |||||||||||||||||||||||||||||||||||||
| Profit of consolidated and affiliated companies | 2,058 | 2,053 | 382 | (377 | ) | Profit of consolidated and affiliated companies | 5,250 | 4,750 | 506 | (6) | |||||||||||||||||||||||||||||||||
| Less: Profit (loss) attributable to noncontrolling interests | 5 | — | 5 | — | Less: Profit (loss) attributable to noncontrolling interests | (1) | (1) | 6 | (6) | 6 | |||||||||||||||||||||||||||||||||
Profit 7 | $ | 2,053 | $ | 2,053 | $ | 377 | $ | (377 | ) | Profit 7 | $ | 5,251 | $ | 4,751 | $ | 500 | $ | — | |||||||||||||||||||||||||
| Supplemental Consolidating Data | Supplemental Consolidating Data | ||||||||||||||||||||||||||||||||||||||||||
| Consolidated | Machinery, Energy & Transportation 1 | Financial Products | Consolidating Adjustments | Consolidated | Machinery, Energy & Transportation | Financial Products | Consolidating Adjustments | ||||||||||||||||||||||||||||||||||||
| Sales and revenues: | Sales and revenues: | ||||||||||||||||||||||||||||||||||||||||||
| Sales of Machinery, Energy & Transportation | $ | 8,463 | $ | 8,463 | $ | — | $ | — | Sales of Machinery, Energy & Transportation | $ | 11,707 | $ | 11,707 | $ | — | $ | — | ||||||||||||||||||||||||||
| Revenues of Financial Products | 697 | — | 768 | (71 | ) | 2 | Revenues of Financial Products | 690 | — | 787 | (97) | 1 | |||||||||||||||||||||||||||||||
| Total sales and revenues | 9,160 | 8,463 | 768 | (71 | ) | Total sales and revenues | 12,397 | 11,707 | 787 | (97) | |||||||||||||||||||||||||||||||||
| Operating costs: | Operating costs: | ||||||||||||||||||||||||||||||||||||||||||
| Cost of goods sold | 6,527 | 6,528 | — | (1 | ) | 3 | Cost of goods sold | 8,617 | 8,618 | — | (1) | 2 | |||||||||||||||||||||||||||||||
| Selling, general and administrative expenses | 992 | 858 | 138 | (4 | ) | 3 | Selling, general and administrative expenses | 1,340 | 1,147 | 200 | (7) | 2 | |||||||||||||||||||||||||||||||
| Research and development expenses | 453 | 453 | — | — | Research and development expenses | 427 | 427 | — | — | ||||||||||||||||||||||||||||||||||
| Interest expense of Financial Products | 147 | — | 151 | (4 | ) | 4 | Interest expense of Financial Products | 111 | — | 111 | — | ||||||||||||||||||||||||||||||||
| Other operating (income) expenses | 560 | 258 | 308 | (6 | ) | 3 | Other operating (income) expenses | 238 | (56) | 310 | (16) | 2 | |||||||||||||||||||||||||||||||
| Total operating costs | 8,679 | 8,097 | 597 | (15 | ) | Total operating costs | 10,733 | 10,136 | 621 | (24) | |||||||||||||||||||||||||||||||||
| Operating profit | 481 | 366 | 171 | (56 | ) | Operating profit | 1,664 | 1,571 | 166 | (73) | |||||||||||||||||||||||||||||||||
| Interest expense excluding Financial Products | 126 | 139 | — | (13 | ) | 4 | Interest expense excluding Financial Products | 114 | 114 | — | — | ||||||||||||||||||||||||||||||||
| Other income (expense) | 28 | (25 | ) | 10 | 43 | 5 | Other income (expense) | 225 | 143 | 9 | 73 | 3 | |||||||||||||||||||||||||||||||
| Consolidated profit before taxes | 383 | 202 | 181 | — | Consolidated profit before taxes | 1,775 | 1,600 | 175 | — | ||||||||||||||||||||||||||||||||||
| Provision (benefit) for income taxes | 96 | 36 | 60 | — | Provision (benefit) for income taxes | 368 | 331 | 37 | — | ||||||||||||||||||||||||||||||||||
| Profit of consolidated companies | 287 | 166 | 121 | — | Profit of consolidated companies | 1,407 | 1,269 | 138 | — | ||||||||||||||||||||||||||||||||||
| Equity in profit (loss) of unconsolidated affiliated companies | (4 | ) | (4 | ) | — | — | Equity in profit (loss) of unconsolidated affiliated companies | 21 | 23 | — | (2) | 4 | |||||||||||||||||||||||||||||||
| Equity in profit of Financial Products’ subsidiaries | — | 120 | — | (120 | ) | 6 | |||||||||||||||||||||||||||||||||||||
| Profit of consolidated and affiliated companies | 283 | 282 | 121 | (120 | ) | Profit of consolidated and affiliated companies | 1,428 | 1,292 | 138 | (2) | |||||||||||||||||||||||||||||||||
| Less: Profit (loss) attributable to noncontrolling interests | — | (1 | ) | 1 | — | Less: Profit (loss) attributable to noncontrolling interests | 2 | 1 | 3 | (2) | 5 | ||||||||||||||||||||||||||||||||
Profit 7 | $ | 283 | $ | 283 | $ | 120 | $ | (120 | ) | ||||||||||||||||||||||||||||||||||
Profit 6 | Profit 6 | $ | 1,426 | $ | 1,291 | $ | 135 | $ | — | ||||||||||||||||||||||||||||||||||
| Supplemental Consolidating Data | Supplemental Consolidating Data | ||||||||||||||||||||||||||||||||||||||||||
| Consolidated | Machinery, Energy & Transportation 1 | Financial Products | Consolidating Adjustments | Consolidated | Machinery, Energy & Transportation | Financial Products | Consolidating Adjustments | ||||||||||||||||||||||||||||||||||||
| Sales and revenues: | Sales and revenues: | ||||||||||||||||||||||||||||||||||||||||||
| Sales of Machinery, Energy & Transportation | $ | 26,888 | $ | 26,888 | $ | — | $ | — | Sales of Machinery, Energy & Transportation | $ | 35,091 | $ | 35,091 | $ | — | $ | — | ||||||||||||||||||||||||||
| Revenues of Financial Products | 2,075 | — | 2,305 | (230 | ) | 2 | Revenues of Financial Products | 2,082 | — | 2,371 | (289) | 1 | |||||||||||||||||||||||||||||||
| Total sales and revenues | 28,963 | 26,888 | 2,305 | (230 | ) | Total sales and revenues | 37,173 | 35,091 | 2,371 | (289) | |||||||||||||||||||||||||||||||||
| Operating costs: | Operating costs: | ||||||||||||||||||||||||||||||||||||||||||
| Cost of goods sold | 20,768 | 20,769 | — | (1 | ) | 3 | Cost of goods sold | 25,510 | 25,515 | — | (5) | 2 | |||||||||||||||||||||||||||||||
| Selling, general and administrative expenses | 3,203 | 2,794 | 424 | (15 | ) | 3 | Selling, general and administrative expenses | 3,943 | 3,471 | 483 | (11) | 2 | |||||||||||||||||||||||||||||||
| Research and development expenses | 1,429 | 1,429 | — | — | Research and development expenses | 1,247 | 1,247 | — | — | ||||||||||||||||||||||||||||||||||
| Interest expense of Financial Products | 447 | — | 458 | (11 | ) | 4 | Interest expense of Financial Products | 352 | — | 352 | — | ||||||||||||||||||||||||||||||||
| Other operating (income) expenses | 1,356 | 462 | 914 | (20 | ) | 3 | Other operating (income) expenses | 854 | (30) | 931 | (47) | 2 | |||||||||||||||||||||||||||||||
| Total operating costs | 27,203 | 25,454 | 1,796 | (47 | ) | Total operating costs | 31,906 | 30,203 | 1,766 | (63) | |||||||||||||||||||||||||||||||||
| Operating profit | 1,760 | 1,434 | 509 | (183 | ) | Operating profit | 5,267 | 4,888 | 605 | (226) | |||||||||||||||||||||||||||||||||
| Interest expense excluding Financial Products | 385 | 422 | — | (37 | ) | 4 | Interest expense excluding Financial Products | 376 | 376 | — | — | ||||||||||||||||||||||||||||||||
| Other income (expense) | 112 | (72 | ) | 38 | 146 | 5 | Other income (expense) | 751 | 819 | 56 | (124) | 3 | |||||||||||||||||||||||||||||||
| Consolidated profit before taxes | 1,487 | 940 | 547 | — | Consolidated profit before taxes | 5,642 | 5,331 | 661 | (350) | ||||||||||||||||||||||||||||||||||
| Provision (benefit) for income taxes | 372 | 198 | 174 | — | Provision (benefit) for income taxes | 1,313 | 1,158 | 155 | — | ||||||||||||||||||||||||||||||||||
| Profit of consolidated companies | 1,115 | 742 | 373 | — | Profit of consolidated companies | 4,329 | 4,173 | 506 | (350) | ||||||||||||||||||||||||||||||||||
| Equity in profit (loss) of unconsolidated affiliated companies | (7 | ) | (7 | ) | — | — | Equity in profit (loss) of unconsolidated affiliated companies | 44 | 52 | — | (8) | 4 | |||||||||||||||||||||||||||||||
| Equity in profit of Financial Products’ subsidiaries | — | 369 | — | (369 | ) | 6 | |||||||||||||||||||||||||||||||||||||
| Profit of consolidated and affiliated companies | 1,108 | 1,104 | 373 | (369 | ) | Profit of consolidated and affiliated companies | 4,373 | 4,225 | 506 | (358) | |||||||||||||||||||||||||||||||||
| Less: Profit (loss) attributable to noncontrolling interests | 4 | — | 4 | — | Less: Profit (loss) attributable to noncontrolling interests | 4 | 3 | 9 | (8) | 5 | |||||||||||||||||||||||||||||||||
Profit 7 | $ | 1,104 | $ | 1,104 | $ | 369 | $ | (369 | ) | ||||||||||||||||||||||||||||||||||
Profit 6 | Profit 6 | $ | 4,369 | $ | 4,222 | $ | 497 | $ | (350) | ||||||||||||||||||||||||||||||||||
| Supplemental Consolidating Data | Supplemental Consolidating Data | |||||||||||||||||||||||||||||||||||||||||
| Consolidated | Machinery, Energy & Transportation 1 | Financial Products | Consolidating Adjustments | Consolidated | Machinery, Energy & Transportation | Financial Products | Consolidating Adjustments | |||||||||||||||||||||||||||||||||||
| Assets | Assets | |||||||||||||||||||||||||||||||||||||||||
| Current assets: | Current assets: | |||||||||||||||||||||||||||||||||||||||||
| Cash and short-term investments | $ | 9,591 | $ | 8,736 | $ | 855 | $ | — | ||||||||||||||||||||||||||||||||||
| Cash and cash equivalents | Cash and cash equivalents | $ | 6,346 | $ | 5,403 | $ | 943 | $ | — | |||||||||||||||||||||||||||||||||
| Receivables – trade and other | 6,691 | 4,123 | 1,326 | 1,242 | 2,3 | Receivables – trade and other | 8,158 | 3,134 | 652 | 4,372 | 1,2 | |||||||||||||||||||||||||||||||
| Receivables – finance | 8,984 | — | 12,796 | (3,812 | ) | 3 | Receivables – finance | 8,918 | — | 13,446 | (4,528) | 2 | ||||||||||||||||||||||||||||||
| Prepaid expenses and other current assets | 1,707 | 940 | 779 | (12 | ) | 4 | Prepaid expenses and other current assets | 2,295 | 2,013 | 316 | (34) | 3 | ||||||||||||||||||||||||||||||
| Inventories | 10,212 | 10,212 | — | — | Inventories | 16,860 | 16,860 | — | — | |||||||||||||||||||||||||||||||||
| Total current assets | 37,185 | 24,011 | 15,756 | (2,582 | ) | Total current assets | 42,577 | 27,410 | 15,357 | (190) | ||||||||||||||||||||||||||||||||
| Property, plant and equipment – net | 14,187 | 9,851 | 4,336 | — | Property, plant and equipment – net | 11,643 | 7,810 | 3,833 | — | |||||||||||||||||||||||||||||||||
| Long-term receivables – trade and other | 969 | 208 | 153 | 608 | 2,3 | Long-term receivables – trade and other | 1,278 | 319 | 512 | 447 | 1,2 | |||||||||||||||||||||||||||||||
| Long-term receivables – finance | 13,192 | — | 13,830 | (638 | ) | 3 | Long-term receivables – finance | 11,859 | — | 12,338 | (479) | 2 | ||||||||||||||||||||||||||||||
| Investments in Financial Products subsidiaries | — | 4,435 | — | (4,435 | ) | 5 | ||||||||||||||||||||||||||||||||||||
| Noncurrent deferred and refundable income taxes | 2,845 | 3,595 | 105 | (855 | ) | 6 | Noncurrent deferred and refundable income taxes | 2,218 | 2,745 | 106 | (633) | 4 | ||||||||||||||||||||||||||||||
| Intangible assets | 2,175 | 2,170 | 5 | — | Intangible assets | 806 | 806 | — | — | |||||||||||||||||||||||||||||||||
| Goodwill | 6,196 | 6,179 | 17 | — | Goodwill | 6,092 | 6,092 | — | — | |||||||||||||||||||||||||||||||||
| Other assets | 1,811 | 627 | 1,184 | — | Other assets | 4,434 | 3,663 | 1,946 | (1,175) | 5 | ||||||||||||||||||||||||||||||||
| Total assets | $ | 78,560 | $ | 51,076 | $ | 35,386 | $ | (7,902 | ) | Total assets | $ | 80,907 | $ | 48,845 | $ | 34,092 | $ | (2,030) | ||||||||||||||||||||||||
| Liabilities | Liabilities | |||||||||||||||||||||||||||||||||||||||||
| Current liabilities: | Current liabilities: | |||||||||||||||||||||||||||||||||||||||||
| Short-term borrowings | $ | 5,470 | $ | 11 | $ | 5,459 | $ | — | Short-term borrowings | $ | 4,202 | $ | 3 | $ | 4,199 | $ | — | |||||||||||||||||||||||||
| Short-term borrowings with consolidated companies | — | 1,000 | 1,481 | (2,481 | ) | 7 | ||||||||||||||||||||||||||||||||||||
| Accounts payable | 6,113 | 6,009 | 193 | (89 | ) | 8 | Accounts payable | 8,260 | 8,149 | 267 | (156) | 6 | ||||||||||||||||||||||||||||||
| Accrued expenses | 3,114 | 2,808 | 306 | — | Accrued expenses | 4,013 | 3,622 | 391 | — | |||||||||||||||||||||||||||||||||
| Accrued wages, salaries and employee benefits | 2,333 | 2,286 | 47 | — | Accrued wages, salaries and employee benefits | 2,204 | 2,160 | 44 | — | |||||||||||||||||||||||||||||||||
| Customer advances | 1,510 | 1,510 | — | — | Customer advances | 1,831 | 1,831 | — | — | |||||||||||||||||||||||||||||||||
| Dividends payable | — | — | — | — | ||||||||||||||||||||||||||||||||||||||
| Other current liabilities | 1,744 | 1,240 | 516 | (12 | ) | 6,9 | Other current liabilities | 2,878 | 2,126 | 807 | (55) | 4,7 | ||||||||||||||||||||||||||||||
| Long-term debt due within one year | 5,619 | 5 | 5,614 | — | Long-term debt due within one year | 6,814 | 120 | 6,694 | — | |||||||||||||||||||||||||||||||||
| Total current liabilities | 25,903 | 14,869 | 13,616 | (2,582 | ) | Total current liabilities | 30,202 | 18,011 | 12,402 | (211) | ||||||||||||||||||||||||||||||||
| Long-term debt due after one year | 24,835 | 8,850 | 16,015 | (30 | ) | 7 | Long-term debt due after one year | 25,509 | 9,511 | 16,030 | (32) | 8 | ||||||||||||||||||||||||||||||
| Liability for postemployment benefits | 8,973 | 8,973 | — | — | Liability for postemployment benefits | 5,038 | 5,038 | — | — | |||||||||||||||||||||||||||||||||
| Other liabilities | 3,152 | 2,687 | 1,320 | (855 | ) | 6 | Other liabilities | 4,536 | 3,659 | 1,565 | (688) | 4 | ||||||||||||||||||||||||||||||
| Total liabilities | 62,863 | 35,379 | 30,951 | (3,467 | ) | Total liabilities | 65,285 | 36,219 | 29,997 | (931) | ||||||||||||||||||||||||||||||||
| Commitments and contingencies | Commitments and contingencies | |||||||||||||||||||||||||||||||||||||||||
| Shareholders’ equity | Shareholders’ equity | |||||||||||||||||||||||||||||||||||||||||
| Common stock | 5,460 | 5,460 | 918 | (918 | ) | 5 | Common stock | 6,523 | 6,523 | 905 | (905) | 9 | ||||||||||||||||||||||||||||||
| Treasury stock | (17,130 | ) | (17,130 | ) | — | — | Treasury stock | (30,883) | (30,883) | — | — | |||||||||||||||||||||||||||||||
| Profit employed in the business | 28,530 | 28,530 | 3,962 | (3,962 | ) | 5 | Profit employed in the business | 43,304 | 38,898 | 4,395 | 11 | 9 | ||||||||||||||||||||||||||||||
| Accumulated other comprehensive income (loss) | (1,233 | ) | (1,233 | ) | (581 | ) | 581 | 5 | Accumulated other comprehensive income (loss) | (3,353) | (1,946) | (1,407) | — | |||||||||||||||||||||||||||||
| Noncontrolling interests | 70 | 70 | 136 | (136 | ) | 5 | Noncontrolling interests | 31 | 34 | 202 | (205) | 9 | ||||||||||||||||||||||||||||||
| Total shareholders’ equity | 15,697 | 15,697 | 4,435 | (4,435 | ) | Total shareholders’ equity | 15,622 | 12,626 | 4,095 | (1,099) | ||||||||||||||||||||||||||||||||
| Total liabilities and shareholders’ equity | $ | 78,560 | $ | 51,076 | $ | 35,386 | $ | (7,902 | ) | Total liabilities and shareholders’ equity | $ | 80,907 | $ | 48,845 | $ | 34,092 | $ | (2,030) | ||||||||||||||||||||||||
| Supplemental Consolidating Data | Supplemental Consolidating Data | |||||||||||||||||||||||||||||||||||||||||
| Consolidated | Machinery, Energy & Transportation 1 | Financial Products | Consolidating Adjustments | Consolidated | Machinery, Energy & Transportation | Financial Products | Consolidating Adjustments | |||||||||||||||||||||||||||||||||||
| Assets | Assets | |||||||||||||||||||||||||||||||||||||||||
| Current assets: | Current assets: | |||||||||||||||||||||||||||||||||||||||||
| Cash and short-term investments | $ | 7,168 | $ | 5,257 | $ | 1,911 | $ | — | ||||||||||||||||||||||||||||||||||
| Cash and cash equivalents | Cash and cash equivalents | $ | 9,254 | $ | 8,428 | $ | 826 | $ | — | |||||||||||||||||||||||||||||||||
| Receivables – trade and other | 5,981 | 3,910 | 377 | 1,694 | 2,3 | Receivables – trade and other | 8,477 | 3,279 | 435 | 4,763 | 1,2 | |||||||||||||||||||||||||||||||
| Receivables – finance | 8,522 | — | 11,934 | (3,412 | ) | 3 | Receivables – finance | 8,898 | — | 13,828 | (4,930) | 2 | ||||||||||||||||||||||||||||||
| Prepaid expenses and other current assets | 1,682 | 764 | 926 | (8 | ) | 4 | Prepaid expenses and other current assets | 2,788 | 2,567 | 358 | (137) | 3 | ||||||||||||||||||||||||||||||
| Inventories | 8,614 | 8,614 | — | — | Inventories | 14,038 | 14,038 | — | — | |||||||||||||||||||||||||||||||||
| Total current assets | 31,967 | 18,545 | 15,148 | (1,726 | ) | Total current assets | 43,455 | 28,312 | 15,447 | (304) | ||||||||||||||||||||||||||||||||
| Property, plant and equipment – net | 15,322 | 10,899 | 4,423 | — | Property, plant and equipment – net | 12,090 | 8,172 | 3,918 | — | |||||||||||||||||||||||||||||||||
| Long-term receivables – trade and other | 1,029 | 177 | 138 | 714 | 2,3 | Long-term receivables – trade and other | 1,204 | 375 | 204 | 625 | 1,2 | |||||||||||||||||||||||||||||||
| Long-term receivables – finance | 13,556 | — | 14,300 | (744 | ) | 3 | Long-term receivables – finance | 12,707 | — | 13,358 | (651) | 2 | ||||||||||||||||||||||||||||||
| Investments in Financial Products subsidiaries | — | 3,638 | — | (3,638 | ) | 5 | ||||||||||||||||||||||||||||||||||||
| Noncurrent deferred and refundable income taxes | 2,790 | 3,648 | 89 | (947 | ) | 6 | Noncurrent deferred and refundable income taxes | 1,840 | 2,396 | 105 | (661) | 4 | ||||||||||||||||||||||||||||||
| Intangible assets | 2,349 | 2,344 | 5 | — | Intangible assets | 1,042 | 1,042 | — | — | |||||||||||||||||||||||||||||||||
| Goodwill | 6,020 | 6,003 | 17 | — | Goodwill | 6,324 | 6,324 | — | — | |||||||||||||||||||||||||||||||||
| Other assets | 1,671 | 609 | 1,075 | (13 | ) | 4 | Other assets | 4,131 | 3,388 | 1,952 | (1,209) | 5 | ||||||||||||||||||||||||||||||
| Total assets | $ | 74,704 | $ | 45,863 | $ | 35,195 | $ | (6,354 | ) | Total assets | $ | 82,793 | $ | 50,009 | $ | 34,984 | $ | (2,200) | ||||||||||||||||||||||||
| Liabilities | Liabilities | |||||||||||||||||||||||||||||||||||||||||
| Current liabilities: | Current liabilities: | |||||||||||||||||||||||||||||||||||||||||
| Short-term borrowings | $ | 7,303 | $ | 209 | $ | 7,094 | $ | — | Short-term borrowings | $ | 5,404 | $ | 9 | $ | 5,395 | $ | — | |||||||||||||||||||||||||
| Short-term borrowings with consolidated companies | — | — | 1,637 | (1,637 | ) | 7 | ||||||||||||||||||||||||||||||||||||
| Accounts payable | 4,614 | 4,506 | 189 | (81 | ) | 8 | Accounts payable | 8,154 | 8,079 | 242 | (167) | 6 | ||||||||||||||||||||||||||||||
| Accrued expenses | 3,003 | 2,744 | 259 | — | Accrued expenses | 3,757 | 3,385 | 372 | — | |||||||||||||||||||||||||||||||||
| Accrued wages, salaries and employee benefits | 1,296 | 1,268 | 28 | — | Accrued wages, salaries and employee benefits | 2,242 | 2,186 | 56 | — | |||||||||||||||||||||||||||||||||
| Customer advances | 1,167 | 1,167 | — | — | Customer advances | 1,087 | 1,086 | 1 | — | |||||||||||||||||||||||||||||||||
| Dividends payable | 452 | 452 | — | — | Dividends payable | 595 | 595 | — | — | |||||||||||||||||||||||||||||||||
| Other current liabilities | 1,635 | 1,245 | 399 | (9 | ) | 6,9 | Other current liabilities | 2,256 | 1,773 | 642 | (159) | 4,7 | ||||||||||||||||||||||||||||||
| Long-term debt due within one year | 6,662 | 507 | 6,155 | — | Long-term debt due within one year | 6,352 | 45 | 6,307 | — | |||||||||||||||||||||||||||||||||
| Total current liabilities | 26,132 | 12,098 | 15,761 | (1,727 | ) | Total current liabilities | 29,847 | 17,158 | 13,015 | (326) | ||||||||||||||||||||||||||||||||
| Long-term debt due after one year | 22,818 | 8,466 | 14,382 | (30 | ) | 7 | Long-term debt due after one year | 26,033 | 9,772 | 16,287 | (26) | 8 | ||||||||||||||||||||||||||||||
| Liability for postemployment benefits | 9,357 | 9,357 | — | — | Liability for postemployment benefits | 5,592 | 5,592 | — | — | |||||||||||||||||||||||||||||||||
| Other liabilities | 3,184 | 2,729 | 1,414 | (959 | ) | 6,9 | Other liabilities | 4,805 | 4,106 | 1,425 | (726) | 4 | ||||||||||||||||||||||||||||||
| Total liabilities | 61,491 | 32,650 | 31,557 | (2,716 | ) | Total liabilities | 66,277 | 36,628 | 30,727 | (1,078) | ||||||||||||||||||||||||||||||||
| Commitments and contingencies | Commitments and contingencies | |||||||||||||||||||||||||||||||||||||||||
| Shareholders’ equity | Shareholders’ equity | |||||||||||||||||||||||||||||||||||||||||
| Common stock | 5,277 | 5,277 | 918 | (918 | ) | 5 | Common stock | 6,398 | 6,398 | 919 | (919) | 9 | ||||||||||||||||||||||||||||||
| Treasury stock | (17,478 | ) | (17,478 | ) | — | — | Treasury stock | (27,643) | (27,643) | — | — | |||||||||||||||||||||||||||||||
| Profit employed in the business | 27,377 | 27,377 | 3,585 | (3,585 | ) | 5 | Profit employed in the business | 39,282 | 35,390 | 3,881 | 11 | 9 | ||||||||||||||||||||||||||||||
| Accumulated other comprehensive income (loss) | (2,039 | ) | (2,039 | ) | (990 | ) | 990 | 5 | Accumulated other comprehensive income (loss) | (1,553) | (799) | (754) | — | |||||||||||||||||||||||||||||
| Noncontrolling interests | 76 | 76 | 125 | (125 | ) | 5 | Noncontrolling interests | 32 | 35 | 211 | (214) | 9 | ||||||||||||||||||||||||||||||
| Total shareholders’ equity | 13,213 | 13,213 | 3,638 | (3,638 | ) | Total shareholders’ equity | 16,516 | 13,381 | 4,257 | (1,122) | ||||||||||||||||||||||||||||||||
| Total liabilities and shareholders’ equity | $ | 74,704 | $ | 45,863 | $ | 35,195 | $ | (6,354 | ) | Total liabilities and shareholders’ equity | $ | 82,793 | $ | 50,009 | $ | 34,984 | $ | (2,200) | ||||||||||||||||||||||||
| Supplemental Consolidating Data | Supplemental Consolidating Data | |||||||||||||||||||||||||||||||||||||||||
| Consolidated | Machinery, Energy & Transportation 1 | Financial Products | Consolidating Adjustments | Consolidated | Machinery, Energy & Transportation | Financial Products | Consolidating Adjustments | |||||||||||||||||||||||||||||||||||
| Cash flow from operating activities: | Cash flow from operating activities: | |||||||||||||||||||||||||||||||||||||||||
| Profit of consolidated and affiliated companies | $ | 2,058 | $ | 2,053 | $ | 382 | $ | (377 | ) | 2 | Profit of consolidated and affiliated companies | $ | 5,250 | $ | 4,750 | $ | 506 | $ | (6) | 1 | ||||||||||||||||||||||
| Adjustments for non-cash items: | Adjustments for non-cash items: | |||||||||||||||||||||||||||||||||||||||||
| Depreciation and amortization | 2,153 | 1,507 | 646 | — | Depreciation and amortization | 1,661 | 1,072 | 589 | — | |||||||||||||||||||||||||||||||||
| Undistributed profit of Financial Products | — | (377 | ) | — | 377 | 3 | ||||||||||||||||||||||||||||||||||||
| Provision (benefit) for deferred income taxes | Provision (benefit) for deferred income taxes | (349) | (294) | (55) | — | |||||||||||||||||||||||||||||||||||||
| Other | 592 | 524 | (111 | ) | 179 | 4 | Other | 132 | (83) | (123) | 338 | 2 | ||||||||||||||||||||||||||||||
| Changes in assets and liabilities, net of acquisitions and divestitures: | Changes in assets and liabilities, net of acquisitions and divestitures: | |||||||||||||||||||||||||||||||||||||||||
| Receivables - trade and other | (455 | ) | (324 | ) | 62 | (193 | ) | 4, 5 | ||||||||||||||||||||||||||||||||||
| Receivables – trade and other | Receivables – trade and other | 365 | 97 | 21 | 247 | 2,3 | ||||||||||||||||||||||||||||||||||||
| Inventories | (1,489 | ) | (1,487 | ) | — | (2 | ) | 4 | Inventories | (3,088) | (3,074) | — | (14) | 2 | ||||||||||||||||||||||||||||
| Accounts payable | 1,371 | 1,412 | (33 | ) | (8 | ) | 4 | Accounts payable | 786 | 701 | 74 | 11 | 2 | |||||||||||||||||||||||||||||
| Accrued expenses | 121 | 118 | 3 | — | Accrued expenses | 70 | 28 | 42 | — | |||||||||||||||||||||||||||||||||
| Accrued wages, salaries and employee benefits | 962 | 943 | 19 | — | Accrued wages, salaries and employee benefits | 15 | 27 | (12) | — | |||||||||||||||||||||||||||||||||
| Customer advances | 310 | 310 | — | — | Customer advances | 751 | 752 | (1) | — | |||||||||||||||||||||||||||||||||
| Other assets – net | (137 | ) | 18 | (54 | ) | (101 | ) | 4 | Other assets – net | 57 | 128 | (28) | (43) | 2 | ||||||||||||||||||||||||||||
| Other liabilities – net | (325 | ) | (533 | ) | 107 | 101 | 4 | Other liabilities – net | (623) | (913) | 239 | 51 | 2 | |||||||||||||||||||||||||||||
| Net cash provided by (used for) operating activities | 5,161 | 4,164 | 1,021 | (24 | ) | Net cash provided by (used for) operating activities | 5,027 | 3,191 | 1,252 | 584 | ||||||||||||||||||||||||||||||||
| Cash flow from investing activities: | Cash flow from investing activities: | |||||||||||||||||||||||||||||||||||||||||
| Capital expenditures - excluding equipment leased to others | (566 | ) | (561 | ) | (6 | ) | 1 | 4 | ||||||||||||||||||||||||||||||||||
| Capital expenditures – excluding equipment leased to others | Capital expenditures – excluding equipment leased to others | (868) | (860) | (10) | 2 | 2 | ||||||||||||||||||||||||||||||||||||
| Expenditures for equipment leased to others | (1,071 | ) | (13 | ) | (1,074 | ) | 16 | 4 | Expenditures for equipment leased to others | (1,023) | (20) | (1,024) | 21 | 2 | ||||||||||||||||||||||||||||
| Proceeds from disposals of leased assets and property, plant and equipment | 864 | 142 | 733 | (11 | ) | 4 | Proceeds from disposals of leased assets and property, plant and equipment | 666 | 63 | 612 | (9) | 2 | ||||||||||||||||||||||||||||||
| Additions to finance receivables | (8,246 | ) | — | (9,765 | ) | 1,519 | 5 | Additions to finance receivables | (9,914) | — | (10,584) | 670 | 3 | |||||||||||||||||||||||||||||
| Collections of finance receivables | 8,532 | — | 10,194 | (1,662 | ) | 5 | Collections of finance receivables | 9,738 | — | 10,328 | (590) | 3 | ||||||||||||||||||||||||||||||
| Net intercompany purchased receivables | — | — | (161 | ) | 161 | 5 | Net intercompany purchased receivables | — | — | 678 | (678) | 3 | ||||||||||||||||||||||||||||||
| Proceeds from sale of finance receivables | 98 | — | 98 | — | Proceeds from sale of finance receivables | 50 | — | 50 | — | |||||||||||||||||||||||||||||||||
| Net intercompany borrowings | — | 165 | (1,000 | ) | 835 | 6 | Net intercompany borrowings | — | — | 5 | (5) | 4 | ||||||||||||||||||||||||||||||
| Investments and acquisitions (net of cash acquired) | (47 | ) | (47 | ) | — | — | Investments and acquisitions (net of cash acquired) | (44) | (44) | — | — | |||||||||||||||||||||||||||||||
| Proceeds from sale of businesses and investments (net of cash sold) | 93 | 93 | — | — | Proceeds from sale of businesses and investments (net of cash sold) | 1 | 1 | — | — | |||||||||||||||||||||||||||||||||
| Proceeds from sale of securities | 431 | 36 | 395 | — | Proceeds from sale of securities | 2,080 | 1,820 | 260 | — | |||||||||||||||||||||||||||||||||
| Investments in securities | (594 | ) | (165 | ) | (429 | ) | — | Investments in securities | (2,399) | (1,925) | (474) | — | ||||||||||||||||||||||||||||||
| Other – net | 38 | 17 | 21 | — | Other – net | 15 | 84 | (69) | — | |||||||||||||||||||||||||||||||||
| Net cash provided by (used for) investing activities | (468 | ) | (333 | ) | (994 | ) | 859 | Net cash provided by (used for) investing activities | (1,698) | (881) | (228) | (589) | ||||||||||||||||||||||||||||||
| Cash flow from financing activities: | Cash flow from financing activities: | |||||||||||||||||||||||||||||||||||||||||
| Dividends paid | (1,367 | ) | (1,367 | ) | — | — | Dividends paid | (1,820) | (1,820) | — | — | |||||||||||||||||||||||||||||||
| Distribution to noncontrolling interests | (7 | ) | (7 | ) | — | — | ||||||||||||||||||||||||||||||||||||
| Common stock issued, including treasury shares reissued | 353 | 353 | — | — | Common stock issued, including treasury shares reissued | 2 | 2 | — | — | |||||||||||||||||||||||||||||||||
| Common shares repurchased | Common shares repurchased | (3,309) | (3,309) | — | — | |||||||||||||||||||||||||||||||||||||
| Net intercompany borrowings | — | 1,000 | (165 | ) | (835 | ) | 6 | Net intercompany borrowings | — | (5) | — | 5 | 4 | |||||||||||||||||||||||||||||
| Proceeds from debt issued (original maturities greater than three months) | 7,334 | 362 | 6,972 | — | Proceeds from debt issued (original maturities greater than three months) | 5,570 | — | 5,570 | — | |||||||||||||||||||||||||||||||||
| Payments on debt (original maturities greater than three months) | (6,220 | ) | (506 | ) | (5,714 | ) | — | Payments on debt (original maturities greater than three months) | (5,289) | (20) | (5,269) | — | ||||||||||||||||||||||||||||||
| Short-term borrowings – net (original maturities three months or less) | (2,403 | ) | (196 | ) | (2,207 | ) | — | Short-term borrowings – net (original maturities three months or less) | (1,311) | (138) | (1,173) | — | ||||||||||||||||||||||||||||||
| Other – net | Other – net | (1) | (1) | — | — | |||||||||||||||||||||||||||||||||||||
| Net cash provided by (used for) financing activities | (2,310 | ) | (361 | ) | (1,114 | ) | (835 | ) | Net cash provided by (used for) financing activities | (6,158) | (5,291) | (872) | 5 | |||||||||||||||||||||||||||||
| Effect of exchange rate changes on cash | 40 | 9 | 31 | — | Effect of exchange rate changes on cash | (79) | (42) | (37) | — | |||||||||||||||||||||||||||||||||
| Increase (decrease) in cash and short-term investments | 2,423 | 3,479 | (1,056 | ) | — | |||||||||||||||||||||||||||||||||||||
| Cash and short-term investments at beginning of period | 7,168 | 5,257 | 1,911 | — | ||||||||||||||||||||||||||||||||||||||
| Cash and short-term investments at end of period | $ | 9,591 | $ | 8,736 | $ | 855 | $ | — | ||||||||||||||||||||||||||||||||||
| Increase (decrease) in cash, cash equivalents and restricted cash | Increase (decrease) in cash, cash equivalents and restricted cash | (2,908) | (3,023) | 115 | — | |||||||||||||||||||||||||||||||||||||
| Cash, cash equivalents and restricted cash at beginning of period | Cash, cash equivalents and restricted cash at beginning of period | 9,263 | 8,433 | 830 | — | |||||||||||||||||||||||||||||||||||||
| Cash, cash equivalents and restricted cash at end of period | Cash, cash equivalents and restricted cash at end of period | $ | 6,355 | $ | 5,410 | $ | 945 | $ | — | |||||||||||||||||||||||||||||||||
| Supplemental Consolidating Data | ||||||||||||||||||||||||||
| Consolidated | Machinery, Energy & Transportation | Financial Products | Consolidating Adjustments | |||||||||||||||||||||||
| Cash flow from operating activities: | ||||||||||||||||||||||||||
| Profit of consolidated and affiliated companies | $ | 4,373 | $ | 4,225 | $ | 506 | $ | (358) | 1,5 | |||||||||||||||||
| Adjustments for non-cash items: | ||||||||||||||||||||||||||
| Depreciation and amortization | 1,766 | 1,162 | 604 | — | ||||||||||||||||||||||
| Provision (benefit) for deferred income taxes | (321) | (255) | (66) | — | ||||||||||||||||||||||
| Other | 102 | 104 | (135) | 133 | 2 | |||||||||||||||||||||
| Changes in assets and liabilities, net of acquisitions and divestitures: | ||||||||||||||||||||||||||
| Receivables – trade and other | (326) | (338) | 40 | (28) | 2,3 | |||||||||||||||||||||
| Inventories | (2,195) | (2,194) | — | (1) | 2 | |||||||||||||||||||||
| Accounts payable | 1,232 | 1,194 | 28 | 10 | 2 | |||||||||||||||||||||
| Accrued expenses | 46 | 117 | (71) | — | ||||||||||||||||||||||
| Accrued wages, salaries and employee benefits | 934 | 905 | 29 | — | ||||||||||||||||||||||
| Customer advances | 39 | 39 | — | — | ||||||||||||||||||||||
| Other assets – net | 138 | 133 | 24 | (19) | 2 | |||||||||||||||||||||
| Other liabilities – net | (2) | (193) | 144 | 47 | 2 | |||||||||||||||||||||
| Net cash provided by (used for) operating activities | 5,786 | 4,899 | 1,103 | (216) | ||||||||||||||||||||||
| Cash flow from investing activities: | ||||||||||||||||||||||||||
| Capital expenditures – excluding equipment leased to others | (673) | (670) | (11) | 8 | 2 | |||||||||||||||||||||
| Expenditures for equipment leased to others | (1,014) | (23) | (997) | 6 | 2 | |||||||||||||||||||||
| Proceeds from disposals of leased assets and property, plant and equipment | 877 | 71 | 818 | (12) | 2 | |||||||||||||||||||||
| Additions to finance receivables | (9,603) | — | (10,292) | 689 | 3 | |||||||||||||||||||||
| Collections of finance receivables | 9,221 | — | 9,946 | (725) | 3 | |||||||||||||||||||||
| Net intercompany purchased receivables | — | — | 100 | (100) | 3 | |||||||||||||||||||||
| Proceeds from sale of finance receivables | 44 | — | 44 | — | ||||||||||||||||||||||
| Net intercompany borrowings | — | 1,000 | 3 | (1,003) | 4 | |||||||||||||||||||||
| Investments and acquisitions (net of cash acquired) | (449) | (449) | — | — | ||||||||||||||||||||||
| Proceeds from sale of businesses and investments (net of cash sold) | 23 | 23 | — | — | ||||||||||||||||||||||
| Proceeds from sale of securities | 424 | 44 | 380 | — | ||||||||||||||||||||||
| Investments in securities | (934) | (542) | (392) | — | ||||||||||||||||||||||
| Other – net | (8) | 59 | (67) | — | ||||||||||||||||||||||
| Net cash provided by (used for) investing activities | (2,092) | (487) | (468) | (1,137) | ||||||||||||||||||||||
| Cash flow from financing activities: | ||||||||||||||||||||||||||
| Dividends paid | (1,733) | (1,733) | (350) | 350 | 5 | |||||||||||||||||||||
| Common stock issued, including treasury shares reissued | 122 | 122 | — | — | ||||||||||||||||||||||
| Common shares repurchased | (1,622) | (1,622) | — | — | ||||||||||||||||||||||
| Net intercompany borrowings | — | (3) | (1,000) | 1,003 | 4 | |||||||||||||||||||||
| Proceeds from debt issued (original maturities greater than three months) | 6,931 | 494 | 6,437 | — | ||||||||||||||||||||||
| Payments on debt (original maturities greater than three months) | (8,620) | (1,910) | (6,710) | — | ||||||||||||||||||||||
| Short-term borrowings – net (original maturities three months or less) | 1,324 | (10) | 1,334 | — | ||||||||||||||||||||||
| Other – net | (4) | (4) | — | — | ||||||||||||||||||||||
| Net cash provided by (used for) financing activities | (3,602) | (4,666) | (289) | 1,353 | ||||||||||||||||||||||
| Effect of exchange rate changes on cash | (9) | (14) | 5 | — | ||||||||||||||||||||||
| Increase (decrease) in cash, cash equivalents and restricted cash | 83 | (268) | 351 | — | ||||||||||||||||||||||
| Cash, cash equivalents and restricted cash at beginning of period | 9,366 | 8,822 | 544 | — | ||||||||||||||||||||||
| Cash, cash equivalents and restricted cash at end of period | $ | 9,449 | $ | 8,554 | $ | 895 | $ | — | ||||||||||||||||||
| Supplemental Consolidating Data | ||||||||||||||||
| Consolidated | Machinery, Energy & Transportation 1 | Financial Products | Consolidating Adjustments | |||||||||||||
| Cash flow from operating activities: | ||||||||||||||||
| Profit of consolidated and affiliated companies | $ | 1,108 | $ | 1,104 | $ | 373 | $ | (369 | ) | 2 | ||||||
| Adjustments for non-cash items: | ||||||||||||||||
| Depreciation and amortization | 2,255 | 1,591 | 664 | — | ||||||||||||
| Undistributed profit of Financial Products | — | (362 | ) | — | 362 | 3 | ||||||||||
| Other | 640 | 503 | (11 | ) | 148 | 4 | ||||||||||
| Changes in assets and liabilities, net of acquisitions and divestitures: | ||||||||||||||||
| Receivables - trade and other | 1,128 | 252 | 42 | 834 | 4, 5 | |||||||||||
| Inventories | 331 | 335 | — | (4 | ) | 4 | ||||||||||
| Accounts payable | (163 | ) | (130 | ) | 16 | (49 | ) | 4 | ||||||||
| Accrued expenses | (153 | ) | (93 | ) | (60 | ) | — | |||||||||
| Accrued wages, salaries and employee benefits | (727 | ) | (713 | ) | (14 | ) | — | |||||||||
| Customer advances | (24 | ) | (24 | ) | — | — | ||||||||||
| Other assets – net | (141 | ) | (278 | ) | 102 | 35 | 4 | |||||||||
| Other liabilities – net | (279 | ) | (390 | ) | 146 | (35 | ) | 4 | ||||||||
| Net cash provided by (used for) operating activities | 3,975 | 1,795 | 1,258 | 922 | ||||||||||||
| Cash flow from investing activities: | ||||||||||||||||
| Capital expenditures - excluding equipment leased to others | (807 | ) | (802 | ) | (6 | ) | 1 | 4 | ||||||||
| Expenditures for equipment leased to others | (1,393 | ) | (56 | ) | (1,377 | ) | 40 | 4 | ||||||||
| Proceeds from disposals of leased assets and property, plant and equipment | 572 | 89 | 510 | (27 | ) | 4 | ||||||||||
| Additions to finance receivables | (6,911 | ) | — | (8,888 | ) | 1,977 | 5 | |||||||||
| Collections of finance receivables | 6,968 | — | 9,308 | (2,340 | ) | 5 | ||||||||||
| Net intercompany purchased receivables | — | — | 580 | (580 | ) | 5 | ||||||||||
| Proceeds from sale of finance receivables | 55 | — | 55 | — | ||||||||||||
| Net intercompany borrowings | — | (716 | ) | (999 | ) | 1,715 | 6 | |||||||||
| Investments and acquisitions (net of cash acquired) | (72 | ) | (72 | ) | — | — | ||||||||||
| Proceeds from sale of securities | 304 | 25 | 279 | — | ||||||||||||
| Investments in securities | (339 | ) | (22 | ) | (317 | ) | — | |||||||||
| Other – net | 5 | 15 | (17 | ) | 7 | 8 | ||||||||||
| Net cash provided by (used for) investing activities | (1,618 | ) | (1,539 | ) | (872 | ) | 793 | |||||||||
| Cash flow from financing activities: | ||||||||||||||||
| Dividends paid | (1,348 | ) | (1,348 | ) | (7 | ) | 7 | 7 | ||||||||
| Distribution to noncontrolling interests | (8 | ) | (8 | ) | — | — | ||||||||||
| Common stock issued, including treasury shares reissued | (54 | ) | (54 | ) | 7 | (7 | ) | 8 | ||||||||
| Net intercompany borrowings | — | 999 | 716 | (1,715 | ) | 6 | ||||||||||
| Proceeds from debt issued (original maturities greater than three months) | 4,430 | 6 | 4,424 | — | ||||||||||||
| Payments on debt (original maturities greater than three months) | (5,602 | ) | (525 | ) | (5,077 | ) | — | |||||||||
| Short-term borrowings – net (original maturities three months or less) | (111 | ) | 254 | (365 | ) | — | ||||||||||
| Net cash provided by (used for) financing activities | (2,693 | ) | (676 | ) | (302 | ) | (1,715 | ) | ||||||||
| Effect of exchange rate changes on cash | (11 | ) | (26 | ) | 15 | — | ||||||||||
| Increase (decrease) in cash and short-term investments | (347 | ) | (446 | ) | 99 | — | ||||||||||
| Cash and short-term investments at beginning of period | 6,460 | 5,340 | 1,120 | — | ||||||||||||
| Cash and short-term investments at end of period | $ | 6,113 | $ | 4,894 | $ | 1,219 | $ | — | ||||||||
| Period | Total Number of Shares Purchased 1 | Average Price Paid per Share | Total Number of Shares Purchased Under the Program | Approximate Dollar Value of Shares that may yet be Purchased under the Program | |||||||
| July 1-31, 2017 | 414 | $ | 114.18 | N/A | N/A | ||||||
| August 1-31, 2017 | — | $ | — | N/A | N/A | ||||||
| September 1-30, 2017 | 9,129 | $ | 118.48 | N/A | N/A | ||||||
| Total | 9,543 | $ | 118.29 | ||||||||
| Period | Total Number of Shares Purchased2 | Average Price Paid per Share2 | Total Number of Shares Purchased as Part of Publicly Announced Program | Approximate Dollar Value of Shares that May Yet be Purchased under the Program (in billions)1 | ||||||||||||||||||||||
| July 1-31, 2022 | 591,861 | $ | 177.08 | 591,861 | $ | 0.070 | ||||||||||||||||||||
| August 1-31, 2022 | 3,015,701 | $ | 192.33 | 3,015,701 | $ | 14.420 | ||||||||||||||||||||
| September 1-30, 2022 | 3,967,760 | $ | 176.42 | 3,967,760 | $ | 13.720 | ||||||||||||||||||||
| Total | 7,575,322 | $ | 182.80 | 7,575,322 | ||||||||||||||||||||||
1 In July 2018, the Board approved a share repurchase authorization (the 2018 Authorization) of up to $10.0 billion of Caterpillar common stock effective January 1, 2019, with no expiration. In May 2022, the Board approved a new share repurchase authorization (the 2022 Authorization) of up to $15.0 billion of Caterpillar common stock effective August 1, 2022, with no expiration. Utilization of the 2022 Authorization for all share repurchases commenced on August 1, 2022, leaving approximately $70 million unutilized under the 2018 Authorization as of September 30, 2022. As of September 30, 2022, $13.7 billion remained available under the 2022 Authorization. | ||||||||||||||||||||||||||
2 In July, August and September of 2022, we repurchased 0.6 million, 3.0 million and 4.0 million shares respectively, for an aggregate of $1.4 billion in open market transactions at an average price per share of $177.08, $192.33 and $176.42, respectively. | ||||||||||||||||||||||||||
| 10.1 | ||||||||
| 10.2 | ||||||||
| 10.3 | ||||||||
| 10.4 | ||||||||
| 10.5 | ||||||||
| 10.6 | ||||||||
| 10.7 | ||||||||
| 10.8 | ||||||||
| 10.9 | ||||||||
| 10.12 | ||||||||
| 31.1 | ||||||||
| 31.2 | ||||||||
| 32 | ||||||||
| 101.INS | Inline XBRL Instance Document (the instance document does not appear in the Interactive Data File because its XBRL tags are embedded within the Inline XBRL document) | |||||||
| 101.SCH | Inline XBRL Taxonomy Extension Schema Document | |||||||
| 101.CAL | Inline XBRL Taxonomy Extension Calculation Linkbase Document | |||||||
| 101.DEF | Inline XBRL Taxonomy Extension Definition Linkbase Document | |||||||
| 101.LAB | Inline XBRL Taxonomy Extension Label Linkbase Document | |||||||
| 101.PRE | Inline XBRL Taxonomy Extension Presentation Linkbase Document | |||||||
| 104 | Cover Page Interactive File (embedded within the Inline XBRL document and included in Exhibit 101) | |||||||
| CATERPILLAR INC. | ||||||||
| November 2, 2022 | /s/ D. James Umpleby III | Chairman of the Board and Chief Executive Officer | ||||||
| D. James Umpleby III | ||||||||
| November 2, 2022 | ||||||||
| /s/ | ||||||||
| November | /s/ Suzette M. Long | Chief Legal Officer and General Counsel | ||||||
| November | /s/ | Vice President and Chief Accounting Officer | ||||||