UNITED STATES
SECURITIES AND EXCHANGE COMMISSION
Washington, D.C. 20549
FORM 10-Q
[X] QUARTERLY REPORT PURSUANT TO SECTION 13 OR 15(d) OF THE SECURITIES EXCHANGE ACT OF 1934
For the quarterly period ended March 31,September 30, 2018
OR
[ ] TRANSITION REPORT PURSUANT TO SECTION 13 OR 15(d) OF THE SECURITIES EXCHANGE ACT OF 1934
For the transition period from to
Commission File Number: 1-768
CATERPILLAR INC.
(Exact name of registrant as specified in its charter)
|
| | |
Delaware (State or other jurisdiction of incorporation) | | 37-0602744 (IRS Employer I.D. No.) |
| | | |
510 Lake Cook Road, Suite 100, Deerfield, Illinois (Address of principal executive offices) | | 60015 (Zip Code) |
Registrant’s telephone number, including area code: (224) 551-4000
Indicate by check mark whether the registrant (1) has filed all reports required to be filed by Section 13 or 15(d) of the Securities Exchange Act of 1934 during the preceding 12 months (or for such shorter period that the registrant was required to file such reports), and (2) has been subject to such filing requirements for the past 90 days. Yes x No ¨
Indicate by check mark whether the registrant has submitted electronically and posted on its corporate Web site, if any, every Interactive Data File required to be submitted and posted pursuant to Rule 405 of Regulation S-T (§232.405 of this chapter) during the preceding 12 months (or for such shorter period that the registrant was required to submit and post such files). Yes x No ¨
Indicate by check mark whether the registrant is a large accelerated filer, an accelerated filer, a non-accelerated filer, smaller reporting company, or an emerging growth company. See definitions of “large accelerated filer,” “accelerated filer,” “smaller reporting company,” and "emerging growth company" in Rule 12b-2 of the Exchange Act. (Check one):
|
| | | |
| Large accelerated filer | x | Accelerated filer | o |
| | | | |
| Non-accelerated filer | o | (Do not check if a smaller reporting company) | |
| | | |
| | Smaller reporting company | o |
| | | | |
| | | Emerging growth company | o |
If an emerging growth company, indicate by check mark if the registrant has elected not to use the extended transition period for complying with any new or revised financial accounting standards provided pursuant to Section 13(a) of the Exchange Act. o
Indicate by check mark whether the registrant is a shell company (as defined in Rule 12b-2 of the Exchange Act). Yes o No x
At March 31,September 30, 2018, 597,904,900590,106,711 shares of common stock of the registrant were outstanding.
Table of Contents
|
| | |
| | |
| | |
| | |
| | |
| | |
| | | |
| | |
| | |
| Item 1A. | Risk Factors | * |
| | |
| Item 3. | Defaults Upon Senior Securities | * |
| Item 4. | Mine Safety Disclosures | * |
| Item 5. | Other Information | * |
| | |
* Item omitted because no answer is called for or item is not applicable.
Part I. FINANCIAL INFORMATION
Item 1. Financial Statements
Caterpillar Inc.
Consolidated Statement of Results of Operations
(Unaudited)
(Dollars in millions except per share data)
| | | | Three Months Ended
March 31 | Three Months Ended
September 30 |
| | 2018 | | 2017 | 2018 | | 2017 |
| Sales and revenues: | | | | | | |
| Sales of Machinery, Energy & Transportation | $ | 12,150 |
| | $ | 9,130 |
| $ | 12,763 |
| | $ | 10,713 |
|
| Revenues of Financial Products | 709 |
| | 692 |
| 747 |
| | 700 |
|
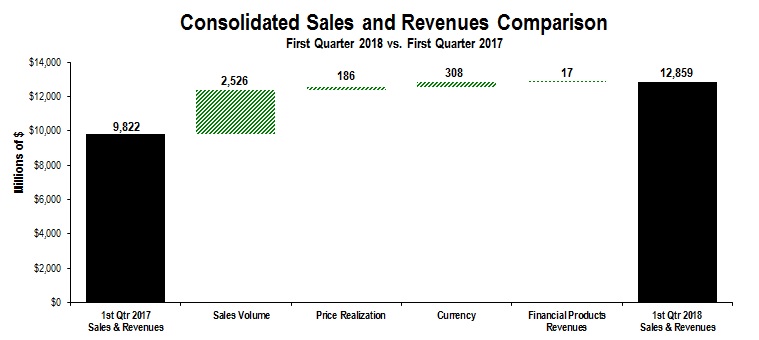
| Total sales and revenues | 12,859 |
| | 9,822 |
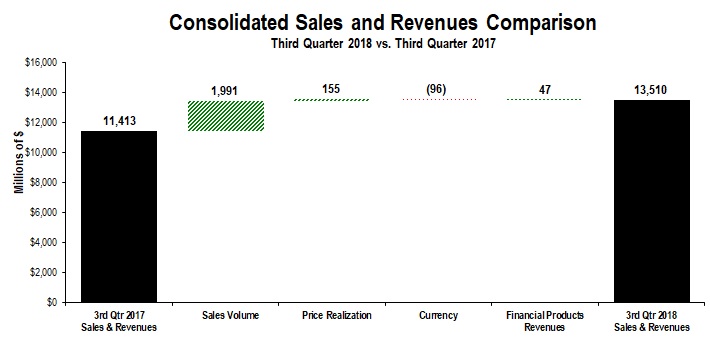
| 13,510 |
| | 11,413 |
|
| | | | | | | |
| Operating costs: | |
| | |
| |
| | |
|
| Cost of goods sold | 8,566 |
| | 6,801 |
| 9,022 |
| | 7,678 |
|
| Selling, general and administrative expenses | 1,276 |
| | 1,061 |
| 1,299 |
| | 1,254 |
|
| Research and development expenses | 443 |
| | 425 |
| 479 |
| | 461 |
|
| Interest expense of Financial Products | 166 |
| | 159 |
| 185 |
| | 163 |
|
| Other operating (income) expenses | 300 |
| | 996 |
| 390 |
| | 348 |
|
| Total operating costs | 10,751 |
| | 9,442 |
| 11,375 |
| | 9,904 |
|
| | | | | | | |
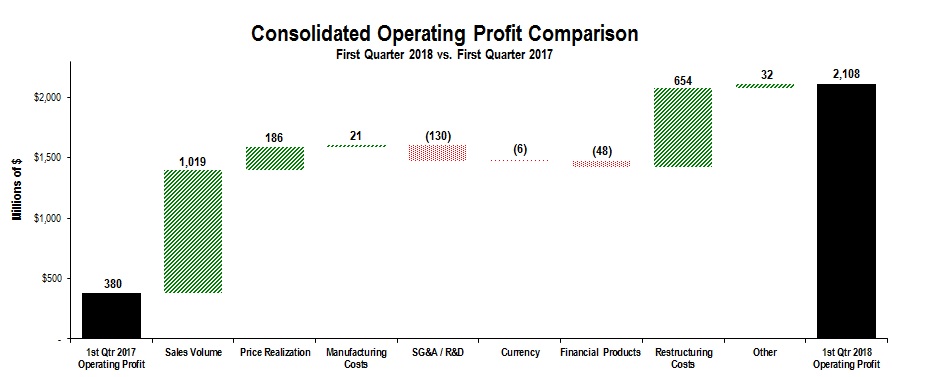
| Operating profit | 2,108 |
| | 380 |
| 2,135 |
| | 1,509 |
|
| | | | | | | |
| Interest expense excluding Financial Products | 101 |
| | 123 |
| 102 |
| | 118 |
|
| Other income (expense) | 127 |
| | 32 |
| 102 |
| | 132 |
|
| | | | | | | |
| Consolidated profit before taxes | 2,134 |
| | 289 |
| 2,135 |
| | 1,523 |
|
| | | | | | | |
| Provision (benefit) for income taxes | 472 |
| | 90 |
| 415 |
| | 470 |
|
| Profit of consolidated companies | 1,662 |
| | 199 |
| 1,720 |
| | 1,053 |
|
| | | | | | | |
| Equity in profit (loss) of unconsolidated affiliated companies | 5 |
| | (5 | ) | 7 |
| | 8 |
|
| | | | | | | |
| Profit of consolidated and affiliated companies | 1,667 |
| | 194 |
| 1,727 |
| | 1,061 |
|
| | | | | | | |
| Less: Profit (loss) attributable to noncontrolling interests | 2 |
| | 2 |
| — |
| | 2 |
|
| | | | | | | |
Profit 1 | $ | 1,665 |
| | $ | 192 |
| $ | 1,727 |
| | $ | 1,059 |
|
| | | | | | | |
| Profit per common share | $ | 2.78 |
| | $ | 0.33 |
| $ | 2.92 |
| | $ | 1.79 |
|
| | | | | | | |
Profit per common share – diluted 2 | $ | 2.74 |
| | $ | 0.32 |
| $ | 2.88 |
| | $ | 1.77 |
|
| | | | | | | |
| Weighted-average common shares outstanding (millions) | |
| | |
| |
| | |
|
| – Basic | 598.0 |
| | 587.5 |
| 592.1 |
| | 592.9 |
|
– Diluted 2 | 608.0 |
| | 593.2 |
| 599.4 |
| | 600.1 |
|
| | | | | | | |
| Cash dividends declared per common share | $ | — |
| | $ | — |
| $ | — |
| | $ | — |
|
1 Profit attributable to common shareholders.
2 Diluted by assumed exercise of stock-based compensation awards using the treasury stock method.
See accompanying notes to Consolidated Financial Statements.
Caterpillar Inc.
Consolidated Statement of Comprehensive Income
(Unaudited)
(Dollars in millions)
| | | | Three Months Ended
March 31 | Three Months Ended
September 30 |
| | 2018 | | 2017 | 2018 | | 2017 |
| | | | | | | |
| Profit of consolidated and affiliated companies | $ | 1,667 |
| | $ | 194 |
| $ | 1,727 |
| | $ | 1,061 |
|
| Other comprehensive income (loss), net of tax: | | | | | | |
| Foreign currency translation, net of tax (provision)/benefit of: 2018 - $15; 2017 - $7 | 184 |
| | 147 |
| |
| Foreign currency translation, net of tax (provision)/benefit of: 2018 - $(3); 2017 - $28 | | (65 | ) | | 248 |
|
| | | | | | | |
| Pension and other postretirement benefits: |
| | |
| | |
| Current year prior service credit (cost), net of tax (provision)/benefit of: 2018 - $1; 2017 - $(4) | (2 | ) | | 8 |
| |
| Amortization of prior service (credit) cost, net of tax (provision)/benefit of: 2018 - $2; 2017 - $1 | (7 | ) | | (4 | ) | |
| Amortization of prior service (credit) cost, net of tax (provision)/benefit of: 2018 - $2; 2017 - $2 | | (7 | ) | | (4 | ) |
| | | | | | | |
| Derivative financial instruments: | | | | | | |
| Gains (losses) deferred, net of tax (provision)/benefit of: 2018 - $(1); 2017 - $(5) | 5 |
| | 10 |
| |
| (Gains) losses reclassified to earnings, net of tax (provision)/benefit of: 2018 - $(6); 2017 - $(22) | 18 |
| | 40 |
| |
| Gains (losses) deferred, net of tax (provision)/benefit of: 2018 - $(9); 2017 - $2 | | 32 |
| | (4 | ) |
| (Gains) losses reclassified to earnings, net of tax (provision)/benefit of: 2018 - $8; 2017 - $(5) | | (31 | ) | | 11 |
|
| | | | | | | |
| Available-for-sale securities: | | | | | | |
| Gains (losses) deferred, net of tax (provision)/benefit of: 2018 - $2; 2017 - $(6) | (11 | ) | | 8 |
| |
| (Gains) losses reclassified to earnings, net of tax (provision)/benefit of: 2018 - $0; 2017 - $(1) | — |
| | 3 |
| |
| Gains (losses) deferred, net of tax (provision)/benefit of: 2018 - $0; 2017 - $(8) | | (1 | ) | | 11 |
|
| (Gains) losses reclassified to earnings, net of tax (provision)/benefit of: 2018 - $0; 2017 - $12 | | — |
| | (24 | ) |
| | | | | | | |
| Total other comprehensive income (loss), net of tax | 187 |
| | 212 |
| (72 | ) | | 238 |
|
| Comprehensive income | 1,854 |
| | 406 |
| 1,655 |
| | 1,299 |
|
| Less: comprehensive income attributable to the noncontrolling interests | (2 | ) | | (2 | ) | — |
| | (2 | ) |
| Comprehensive income attributable to shareholders | $ | 1,852 |
| | $ | 404 |
| $ | 1,655 |
| | $ | 1,297 |
|
| | | | | | | |
See accompanying notes to Consolidated Financial Statements.
Caterpillar Inc.
Consolidated Statement of Results of Operations
(Unaudited)
(Dollars in millions except per share data)
|
| | | | | | | |
| | Nine Months Ended
September 30 |
| | 2018 | | 2017 |
| Sales and revenues: | | | |
| Sales of Machinery, Energy & Transportation | $ | 38,192 |
| | $ | 30,482 |
|
| Revenues of Financial Products | 2,188 |
| | 2,084 |
|
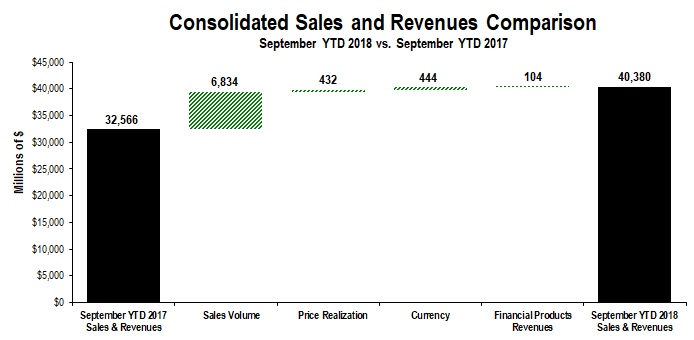
| Total sales and revenues | 40,380 |
| | 32,566 |
|
| | | | |
| Operating costs: | |
| | |
|
| Cost of goods sold | 27,010 |
| | 22,295 |
|
| Selling, general and administrative expenses | 4,015 |
| | 3,619 |
|
| Research and development expenses | 1,384 |
| | 1,344 |
|
| Interest expense of Financial Products | 533 |
| | 484 |
|
| Other operating (income) expenses | 1,028 |
| | 1,751 |
|
| Total operating costs | 33,970 |
| | 29,493 |
|
| | | | |
| Operating profit | 6,410 |
| | 3,073 |
|
| | | | |
| Interest expense excluding Financial Products | 305 |
| | 362 |
|
| Other income (expense) | 350 |
| | 260 |
|
| | | | |
| Consolidated profit before taxes | 6,455 |
| | 2,971 |
|
| | | | |
| Provision (benefit) for income taxes | 1,377 |
| | 921 |
|
| Profit of consolidated companies | 5,078 |
| | 2,050 |
|
| | | | |
| Equity in profit (loss) of unconsolidated affiliated companies | 21 |
| | 8 |
|
| | | | |
| Profit of consolidated and affiliated companies | 5,099 |
| | 2,058 |
|
| | | | |
| Less: Profit (loss) attributable to noncontrolling interests | — |
| | 5 |
|
| | | | |
Profit 1 | $ | 5,099 |
| | $ | 2,053 |
|
| | | | |
| Profit per common share | $ | 8.57 |
| | $ | 3.48 |
|
| | | | |
Profit per common share – diluted 2 | $ | 8.45 |
| | $ | 3.44 |
|
| | | | |
| Weighted-average common shares outstanding (millions) | | | |
|
| – Basic | 595.3 |
| | 590.3 |
|
– Diluted 2 | 603.8 |
| | 596.5 |
|
| | | | |
| Cash dividends declared per common share | $ | 1.64 |
| | $ | 1.55 |
|
1 Profit attributable to common shareholders.
2 Diluted by assumed exercise of stock-based compensation awards using the treasury stock method.
See accompanying notes to Consolidated Financial Statements.
Caterpillar Inc.
Consolidated Statement of Comprehensive Income
(Unaudited)
(Dollars in millions)
|
| | | | | | | |
| | Nine Months Ended
September 30 |
| | 2018 | | 2017 |
| | | | |
| Profit of consolidated and affiliated companies | $ | 5,099 |
| | $ | 2,058 |
|
| Other comprehensive income (loss), net of tax: | | | |
| Foreign currency translation, net of tax (provision)/benefit of: 2018 - $(18); 2017 - $86 | (292 | ) | | 719 |
|
| | | | |
| Pension and other postretirement benefits: | | | |
| Current year prior service credit (cost), net of tax (provision)/benefit of: 2018 - $1; 2017 - $(4) | (2 | ) | | 8 |
|
| Amortization of prior service (credit) cost, net of tax (provision)/benefit of: 2018 - $5; 2017 - $6 | (21 | ) | | (12 | ) |
| | | | |
| Derivative financial instruments: | | | |
| Gains (losses) deferred, net of tax (provision)/benefit of: 2018 - $(23); 2017 - $(3) | 73 |
| | 6 |
|
| (Gains) losses reclassified to earnings, net of tax (provision)/benefit of: 2018 - $32; 2017 - $(41) | (109 | ) | | 77 |
|
| | | | |
| Available-for-sale securities: | | | |
| Gains (losses) deferred, net of tax (provision)/benefit of: 2018 - $3; 2017 - $(17) | (14 | ) | | 29 |
|
| (Gains) losses reclassified to earnings, net of tax (provision)/benefit of: 2018 - $0; 2017 - $11 | — |
| | (21 | ) |
| | | | |
| Total other comprehensive income (loss), net of tax | (365 | ) | | 806 |
|
| Comprehensive income | 4,734 |
| | 2,864 |
|
| Less: comprehensive income attributable to the noncontrolling interests | — |
| | (5 | ) |
| Comprehensive income attributable to shareholders | $ | 4,734 |
| | $ | 2,859 |
|
| | | | |
See accompanying notes to Consolidated Financial Statements.
Caterpillar Inc.
Consolidated Statement of Financial Position
(Unaudited)
(Dollars in millions)
| | | | March 31,
2018 | | December 31,
2017 | September 30,
2018 | | December 31,
2017 |
| Assets | | | | | | |
| Current assets: | |
| | |
| |
| | |
|
| Cash and short-term investments | $ | 7,888 |
| | $ | 8,261 |
| $ | 8,007 |
| | $ | 8,261 |
|
| Receivables – trade and other | 7,894 |
| | 7,436 |
| 7,974 |
| | 7,436 |
|
| Receivables – finance | 8,772 |
| | 8,757 |
| 8,824 |
| | 8,757 |
|
| Prepaid expenses and other current assets | 1,856 |
| | 1,772 |
| 1,835 |
| | 1,772 |
|
| Inventories | 10,947 |
| | 10,018 |
| 11,814 |
| | 10,018 |
|
| Total current assets | 37,357 |
| | 36,244 |
| 38,454 |
| | 36,244 |
|
| | | | | | | |
| Property, plant and equipment – net | 13,912 |
| | 14,155 |
| 13,607 |
| | 14,155 |
|
| Long-term receivables – trade and other | 1,004 |
| | 990 |
| 1,129 |
| | 990 |
|
| Long-term receivables – finance | 13,359 |
| | 13,542 |
| 13,244 |
| | 13,542 |
|
| Noncurrent deferred and refundable income taxes | 1,687 |
| | 1,693 |
| 1,288 |
| | 1,693 |
|
| Intangible assets | 2,163 |
| | 2,111 |
| 1,976 |
| | 2,111 |
|
| Goodwill | 6,376 |
| | 6,200 |
| 6,233 |
| | 6,200 |
|
| Other assets | 2,156 |
| | 2,027 |
| 2,278 |
| | 2,027 |
|
| Total assets | $ | 78,014 |
| | $ | 76,962 |
| $ | 78,209 |
| | $ | 76,962 |
|
| | | | | | | |
| Liabilities | |
| | |
| |
| | |
|
| Current liabilities: | |
| | |
| |
| | |
|
| Short-term borrowings: | |
| | |
| |
| | |
|
| Machinery, Energy & Transportation | $ | 7 |
| | $ | 1 |
| $ | 59 |
| | $ | 1 |
|
| Financial Products | 5,726 |
| | 4,836 |
| 4,462 |
| | 4,836 |
|
| Accounts payable | 6,938 |
| | 6,487 |
| 6,788 |
| | 6,487 |
|
| Accrued expenses | 3,551 |
| | 3,220 |
| 3,423 |
| | 3,220 |
|
| Accrued wages, salaries and employee benefits | 1,474 |
| | 2,559 |
| 2,132 |
| | 2,559 |
|
| Customer advances | 1,399 |
| | 1,426 |
| 1,491 |
| | 1,426 |
|
| Dividends payable | — |
| | 466 |
| — |
| | 466 |
|
| Other current liabilities | 1,890 |
| | 1,742 |
| 1,867 |
| | 1,742 |
|
| Long-term debt due within one year: | |
| | |
| |
| | |
|
| Machinery, Energy & Transportation | 8 |
|
| 6 |
| 10 |
|
| 6 |
|
| Financial Products | 6,409 |
| | 6,188 |
| 5,801 |
| | 6,188 |
|
| Total current liabilities | 27,402 |
| | 26,931 |
| 26,033 |
| | 26,931 |
|
| | | | | | | |
| Long-term debt due after one year: | |
| | |
| |
| | |
|
| Machinery, Energy & Transportation | 7,980 |
| | 7,929 |
| 7,991 |
| | 7,929 |
|
| Financial Products | 15,185 |
| | 15,918 |
| 17,450 |
| | 15,918 |
|
| Liability for postemployment benefits | 8,233 |
| | 8,365 |
| 7,046 |
| | 8,365 |
|
| Other liabilities | 3,942 |
| | 4,053 |
| 3,799 |
| | 4,053 |
|
| Total liabilities | 62,742 |
| | 63,196 |
| 62,319 |
| | 63,196 |
|
| Commitments and contingencies (Notes 10 and 13) |
|
| |
|
|
|
| |
|
|
| Shareholders’ equity | |
| | |
| |
| | |
|
| Common stock of $1.00 par value: | |
| | |
| |
| | |
|
Authorized shares: 2,000,000,000
Issued shares: (3/31/18 and 12/31/17 – 814,894,624) at paid-in amount | 5,640 |
| | 5,593 |
| |
| Treasury stock (3/31/18 – 216,989,724 shares; 12/31/17 – 217,268,852 shares) at cost | (17,347 | ) | | (17,005 | ) | |
Authorized shares: 2,000,000,000
Issued shares: (9/30/18 and 12/31/17 – 814,894,624) at paid-in amount | | 5,715 |
| | 5,593 |
|
| Treasury stock (9/30/18 – 224,787,913 shares; 12/31/17 – 217,268,852 shares) at cost | | (18,681 | ) | | (17,005 | ) |
| Profit employed in the business | 27,929 |
| | 26,301 |
| 30,384 |
| | 26,301 |
|
| Accumulated other comprehensive income (loss) | (1,016 | ) | | (1,192 | ) | (1,568 | ) | | (1,192 | ) |
| Noncontrolling interests | 66 |
| | 69 |
| 40 |
| | 69 |
|
| Total shareholders’ equity | 15,272 |
| | 13,766 |
| 15,890 |
| | 13,766 |
|
| Total liabilities and shareholders’ equity | $ | 78,014 |
| | $ | 76,962 |
| $ | 78,209 |
| | $ | 76,962 |
|
See accompanying notes to Consolidated Financial Statements.
Caterpillar Inc.
Consolidated Statement of Changes in Shareholders’ Equity
(Unaudited)
(Dollars in millions)
| | | | Common stock | | Treasury stock | | Profit employed in the business | | Accumulated other comprehensive income (loss) | | Noncontrolling interests | | Total | Common stock | | Treasury stock | | Profit employed in the business | | Accumulated other comprehensive income (loss) | | Noncontrolling interests | | Total |
| Three Months Ended March 31, 2017 | | | | | | | | | | | | |
| Nine Months Ended September 30, 2017 | | | | | | | | | | | | |
| Balance at December 31, 2016 | $ | 5,277 |
| | $ | (17,478 | ) | | $ | 27,377 |
| | $ | (2,039 | ) | | $ | 76 |
| | $ | 13,213 |
| $ | 5,277 |
| | $ | (17,478 | ) | | $ | 27,377 |
| | $ | (2,039 | ) | | $ | 76 |
| | $ | 13,213 |
|
Adjustment to adopt stock-based compensation guidance1 | — |
| | — |
| | 15 |
| | — |
| | — |
| | 15 |
| — |
| | — |
| | 15 |
| | — |
| | — |
| | 15 |
|
| Balance at January 1, 2017 | $ | 5,277 |
| | $ | (17,478 | ) | | $ | 27,392 |
| | $ | (2,039 | ) | | $ | 76 |
| | $ | 13,228 |
| $ | 5,277 |
| | $ | (17,478 | ) | | $ | 27,392 |
| | $ | (2,039 | ) | | $ | 76 |
| | $ | 13,228 |
|
| Profit of consolidated and affiliated companies | — |
| | — |
| | 192 |
| | — |
| | 2 |
| | 194 |
| — |
| | — |
| | 2,053 |
| | — |
| | 5 |
| | 2,058 |
|
| Foreign currency translation, net of tax | — |
| | — |
| | — |
| | 147 |
| | — |
| | 147 |
| — |
| | — |
| | — |
| | 719 |
| | — |
| | 719 |
|
| Pension and other postretirement benefits, net of tax | — |
| | — |
| | — |
| | 4 |
| | — |
| | 4 |
| — |
| | — |
| | — |
| | (4 | ) | | — |
| | (4 | ) |
| Derivative financial instruments, net of tax | — |
| | — |
| | — |
| | 50 |
| | — |
| | 50 |
| — |
| | — |
| | — |
| | 83 |
| | — |
| | 83 |
|
| Available-for-sale securities, net of tax | — |
| | — |
| | — |
| | 11 |
| | — |
| | 11 |
| — |
| | — |
| | — |
| | 8 |
| | — |
| | 8 |
|
| Change in ownership from noncontrolling interests | | 4 |
| | — |
| | — |
| | — |
| | (3 | ) | | 1 |
|
| Dividends declared | | — |
| | — |
| | (915 | ) | | — |
| | — |
| | (915 | ) |
| Distribution to noncontrolling interests | — |
| | — |
| | — |
| | — |
| | (6 | ) | | (6 | ) | — |
| | — |
| | — |
| | — |
| | (8 | ) | | (8 | ) |
| Common shares issued from treasury stock for stock-based compensation: 2,604,284 | (106 | ) | | 87 |
| | — |
| | — |
| | — |
| | (19 | ) | |
| Common shares issued from treasury stock for stock-based compensation: 8,447,558 | | 5 |
| | 348 |
| | — |
| | — |
| | — |
| | 353 |
|
| Stock-based compensation expense | 49 |
| | — |
| | — |
| | — |
| | — |
| | 49 |
| 165 |
| | — |
| | — |
| | — |
| | — |
| | 165 |
|
| Other | 2 |
| | — |
| | — |
| | — |
| | — |
| | 2 |
| 9 |
| | — |
| | — |
| | — |
| | — |
| | 9 |
|
| Balance at March 31, 2017 | $ | 5,222 |
| | $ | (17,391 | ) | | $ | 27,584 |
| | $ | (1,827 | ) | | $ | 72 |
| | $ | 13,660 |
| |
| Balance at September 30, 2017 | | $ | 5,460 |
| | $ | (17,130 | ) | | $ | 28,530 |
| | $ | (1,233 | ) | | $ | 70 |
| | $ | 15,697 |
|
| | | | | | | | | | | | | | | | | | | | | | | |
| Three Months Ended March 31, 2018 | |
| | |
| | |
| | |
| | |
| | |
| |
| Nine Months Ended September 30, 2018 | | |
| | |
| | |
| | |
| | |
| | |
|
| Balance at December 31, 2017 | $ | 5,593 |
| | $ | (17,005 | ) | | $ | 26,301 |
| | $ | (1,192 | ) | | $ | 69 |
| | $ | 13,766 |
| $ | 5,593 |
| | $ | (17,005 | ) | | $ | 26,301 |
| | $ | (1,192 | ) | | $ | 69 |
| | $ | 13,766 |
|
Adjustments to adopt new accounting guidance1 | | | | | | | | | | | | | | | | | | | | | | |
| Revenue recognition | — |
| | — |
| | (12 | ) | | — |
| | — |
| | $ | (12 | ) | — |
| | — |
| | (12 | ) | | — |
| | — |
| | (12 | ) |
| Tax accounting for intra-entity asset transfers | — |
| | — |
| | (35 | ) | | — |
| | — |
| | $ | (35 | ) | — |
| | — |
| | (35 | ) | | — |
| | — |
| | (35 | ) |
| Recognition and measurement of financial assets and liabilities | — |
| | — |
| | 11 |
| | (11 | ) | | — |
| | $ | — |
| — |
| | — |
| | 11 |
| | (11 | ) | | — |
| | — |
|
| Balance at January 1, 2018 | $ | 5,593 |
| | $ | (17,005 | ) | | $ | 26,265 |
| | $ | (1,203 | ) | | $ | 69 |
| | $ | 13,719 |
| $ | 5,593 |
| | $ | (17,005 | ) | | $ | 26,265 |
| | $ | (1,203 | ) | | $ | 69 |
| | $ | 13,719 |
|
| Profit of consolidated and affiliated companies | — |
| | — |
| | 1,665 |
| | — |
| | 2 |
| | 1,667 |
| — |
| | — |
| | 5,099 |
| | — |
| | — |
| | 5,099 |
|
| Foreign currency translation, net of tax | — |
| | — |
| | — |
| | 184 |
| | — |
| | 184 |
| — |
| | — |
| | — |
| | (292 | ) | | — |
| | (292 | ) |
| Pension and other postretirement benefits, net of tax | — |
| | — |
| | — |
| | (9 | ) | | — |
| | (9 | ) | — |
| | — |
| | — |
| | (23 | ) | | — |
| | (23 | ) |
| Derivative financial instruments, net of tax | — |
| | — |
| | — |
| | 23 |
| | — |
| | 23 |
| — |
| | — |
| | — |
| | (36 | ) | | — |
| | (36 | ) |
| Available-for-sale securities, net of tax | — |
| | — |
| | — |
| | (11 | ) | | — |
| | (11 | ) | — |
| | — |
| | — |
| | (14 | ) | | — |
| | (14 | ) |
| Change in ownership from noncontrolling interests | 2 |
| | — |
| | — |
| | — |
| | (5 | ) | | (3 | ) | (25 | ) | | — |
| | — |
| | — |
| | (18 | ) | | (43 | ) |
| Dividends declared | — |
| | — |
| | (1 | ) | | — |
| | — |
| | (1 | ) | — |
| | — |
| | (980 | ) | | — |
| | — |
| | (980 | ) |
| Common shares issued from treasury stock for stock-based compensation: 3,426,757 | (9 | ) | | 158 |
| | — |
| | — |
| | — |
| | 149 |
| |
| Distribution to noncontrolling interests | | — |
| | — |
| | — |
| | — |
| | (1 | ) | | (1 | ) |
| Common shares issued from treasury stock for stock-based compensation: 5,284,974 | | 36 |
| | 256 |
| | — |
| | — |
| | — |
| | 292 |
|
| Stock-based compensation expense | 50 |
| | — |
| | — |
| | — |
| | — |
| | 50 |
| 164 |
| | — |
| | — |
| | — |
| | — |
| | 164 |
|
Common shares repurchased: 3,147,629 2 | — |
| | (500 | ) | | — |
| | — |
| | — |
| | (500 | ) | |
Common shares repurchased: 12,804,035 2 | | — |
| | (1,932 | ) | | — |
| | — |
| | — |
| | (1,932 | ) |
| Other | 4 |
| | — |
| | — |
| | — |
| | — |
| | 4 |
| (53 | ) | | — |
| | — |
| | — |
| | (10 | ) | | (63 | ) |
| Balance at March 31, 2018 | $ | 5,640 |
| | $ | (17,347 | ) | | $ | 27,929 |
| | $ | (1,016 | ) | | $ | 66 |
| | $ | 15,272 |
| |
| Balance at September 30, 2018 | | $ | 5,715 |
| | $ | (18,681 | ) | | $ | 30,384 |
| | $ | (1,568 | ) | | $ | 40 |
| | $ | 15,890 |
|
| | | | | | | | | | | | | | | | | | | | | | | |
1 See Note 2 for additional information. | | | | | | | | | | | | | | | | | | | | | | |
2 See Note 11 for additional information. | | | | | | | | | | | | | | | | | | | | | | |
See accompanying notes to Consolidated Financial Statements.
Caterpillar Inc.
Consolidated Statement of Cash Flow
(Unaudited)
(Millions of dollars)
| | | | Three Months Ended
March 31 | Nine Months Ended
September 30 |
| | 2018 | | 2017 | 2018 | | 2017 |
| Cash flow from operating activities: | | | | | | |
| Profit of consolidated and affiliated companies | $ | 1,667 |
| | $ | 194 |
| $ | 5,099 |
| | $ | 2,058 |
|
| Adjustments for non-cash items: | |
| | |
| |
| | |
|
| Depreciation and amortization | 681 |
| | 710 |
| 2,065 |
| | 2,153 |
|
| Other | 148 |
| | 302 |
| 630 |
| | 596 |
|
| Changes in assets and liabilities, net of acquisitions and divestitures: | |
| | |
| |
| | |
|
| Receivables – trade and other | (326 | ) | | (353 | ) | (725 | ) | | (455 | ) |
| Inventories | (803 | ) | | (444 | ) | (1,822 | ) | | (1,489 | ) |
| Accounts payable | 486 |
| | 732 |
| 496 |
| | 1,371 |
|
| Accrued expenses | 66 |
| | 132 |
| (32 | ) | | 121 |
|
| Accrued wages, salaries and employee benefits | (1,110 | ) | | 360 |
| (418 | ) | | 962 |
|
| Customer advances | (46 | ) | | 234 |
| 59 |
| | 358 |
|
| Other assets – net | 165 |
| | (261 | ) | 394 |
| | (137 | ) |
| Other liabilities – net | 7 |
| | (64 | ) | (1,271 | ) | | (373 | ) |
| Net cash provided by (used for) operating activities | 935 |
| | 1,542 |
| 4,475 |
| | 5,165 |
|
| | | | | | | |
| Cash flow from investing activities: | |
| | |
| |
| | |
|
| Capital expenditures – excluding equipment leased to others | (412 | ) | | (204 | ) | (921 | ) | | (566 | ) |
| Expenditures for equipment leased to others | (345 | ) | | (305 | ) | (1,208 | ) | | (1,071 | ) |
| Proceeds from disposals of leased assets and property, plant and equipment | 258 |
| | 234 |
| 732 |
| | 864 |
|
| Additions to finance receivables | (2,621 | ) | | (2,122 | ) | (9,092 | ) | | (8,246 | ) |
| Collections of finance receivables | 2,671 |
| | 2,272 |
| 8,032 |
| | 8,532 |
|
| Proceeds from sale of finance receivables | 69 |
| | 17 |
| 416 |
| | 98 |
|
| Investments and acquisitions (net of cash acquired) | (340 | ) | | (18 | ) | (357 | ) | | (47 | ) |
| Proceeds from sale of businesses and investments (net of cash sold) | 12 |
| | — |
| 14 |
| | 93 |
|
| Proceeds from sale of securities | 89 |
| | 89 |
| 363 |
| | 431 |
|
| Investments in securities | (197 | ) | | (65 | ) | (417 | ) | | (594 | ) |
| Other – net | 16 |
| | 9 |
| 24 |
| | 73 |
|
| Net cash provided by (used for) investing activities | (800 | ) | | (93 | ) | (2,414 | ) | | (433 | ) |
| | | | | | | |
| Cash flow from financing activities: | |
| | |
| |
| | |
|
| Dividends paid | (467 | ) | | (452 | ) | (1,444 | ) | | (1,367 | ) |
| Common stock issued, including treasury shares reissued | 149 |
| | (19 | ) | 292 |
| | 353 |
|
| Common shares repurchased | (500 | ) | | — |
| (2,000 | ) | | — |
|
| Proceeds from debt issued (original maturities greater than three months): | |
| | |
| |
| | |
|
| Machinery, Energy & Transportation | — |
| | 360 |
| 47 |
| | 362 |
|
| Financial Products | 1,541 |
| | 2,355 |
| 7,026 |
| | 6,972 |
|
| Payments on debt (original maturities greater than three months): | |
| | |
| |
| | |
|
| Machinery, Energy & Transportation | (1 | ) | | (4 | ) | (6 | ) | | (506 | ) |
| Financial Products | (2,408 | ) | | (1,974 | ) | (5,636 | ) | | (5,718 | ) |
| Short-term borrowings – net (original maturities three months or less) | 1,151 |
| | 618 |
| (465 | ) | | (2,403 | ) |
| Other – net | (3 | ) | | (6 | ) | (32 | ) | | (7 | ) |
| Net cash provided by (used for) financing activities | (538 | ) | | 878 |
| (2,218 | ) | | (2,314 | ) |
| Effect of exchange rate changes on cash | 10 |
| | 9 |
| (117 | ) | | 40 |
|
| Increase (decrease) in cash and short-term investments and restricted cash | (393 | ) | | 2,336 |
| (274 | ) | | 2,458 |
|
| Cash and short-term investments and restricted cash at beginning of period | 8,320 |
| | 7,199 |
| 8,320 |
| | 7,199 |
|
| Cash and short-term investments and restricted cash at end of period | $ | 7,927 |
| | $ | 9,535 |
| $ | 8,046 |
| | $ | 9,657 |
|
All short-term investments, which consist primarily of highly liquid investments with original maturities of three months or less, are considered to be cash equivalents.
See accompanying notes to Consolidated Financial Statements.
NOTES TO CONSOLIDATED FINANCIAL STATEMENTS
(Unaudited)
| |
| 1. | A. Nature of operations |
Information in our financial statements and related commentary are presented in the following categories:
Machinery, Energy & Transportation (ME&T) – Represents the aggregate total of Construction Industries, Resource Industries, Energy & Transportation and All Other operating segments and related corporate items and eliminations.
Financial Products – Primarily includes the company’s Financial Products Segment. This category includes Caterpillar Financial Services Corporation (Cat Financial), Caterpillar Insurance Holdings Inc. (Insurance Services) and their respective subsidiaries.
B. Basis of presentation
In the opinion of management, the accompanying unaudited financial statements include all adjustments, consisting only of normal recurring adjustments, necessary for a fair statement of (a) the consolidated results of operations for the three and nine months ended March 31,September 30, 2018 and 2017, (b) the consolidated comprehensive income for the three and nine months ended March 31,September 30, 2018 and 2017, (c) the consolidated financial position at March 31,September 30, 2018 and December 31, 2017, (d) the consolidated changes in shareholders’ equity for the threenine months ended March 31,September 30, 2018 and 2017 and (e) the consolidated cash flow for the threenine months ended March 31,September 30, 2018 and 2017. The financial statements have been prepared in conformity with generally accepted accounting principles in the United States of America (U.S. GAAP) and pursuant to the rules and regulations of the Securities and Exchange Commission (SEC).
Interim results are not necessarily indicative of results for a full year. The information included in this Form 10-Q should be read in conjunction with the audited financial statements and notes thereto included in our company’s annual report on Form 10-K for the year ended December 31, 2017 (2017 Form 10-K).
The December 31, 2017 financial position data included herein is derived from the audited consolidated financial statements included in the 2017 Form 10-K but does not include all disclosures required by U.S. GAAP. Certain amounts for prior periods have been reclassified to conform to the current period financial statement presentation. See Note 2 for more information. In addition, deferred revenue of $233 million was reclassified from Other current liabilities to Customer advances in the December 31, 2017 Consolidated Statement of Financial Position.
Unconsolidated Variable Interest Entities (VIEs)
We have affiliates, suppliers and dealers that are VIEs of which we are not the primary beneficiary. Although we have provided financial support, we do not have the power to direct the activities that most significantly impact the economic performance of each entity.
Our maximum exposure to loss from VIEs for which we are not the primary beneficiary was as follows:
| | | | | | | | | | | | | |
| (Millions of dollars) | | March 31, 2018 | | December 31, 2017 | | | September 30, 2018 | | December 31, 2017 | |
| Receivables - trade and other | | $ | 30 |
| | $ | 34 |
| | | $ | 29 |
| | $ | 34 |
| |
| Receivables - finance | | 43 |
| | 42 |
| | | 47 |
| | 42 |
| |
| Long-term receivables - finance | | 34 |
| | 38 |
| | | 26 |
| | 38 |
| |
| Investments in unconsolidated affiliated companies | | 30 |
| | 39 |
| | | 30 |
| | 39 |
| |
Guarantees1 | | — |
| | 259 |
| | | — |
| | 259 |
| |
| Total | | $ | 137 |
| | $ | 412 |
| | | $ | 132 |
| | $ | 412 |
| |
| | | | | | | | | | | |
1 Related contract was terminated during the first quarter of 2018. No payments were made under the guarantee.
In addition, Cat Financial has end-user customers that are VIEs of which we are not the primary beneficiary. Although we have provided financial support to these entities and therefore have a variable interest, we do not have the power to direct the activities that most significantly impact their economic performance. Our maximum exposure to loss from our involvement with these VIEs is limited to the credit risk inherently present in the financial support that we have provided. These risks are evaluated and reflected in our financial statements as part of our overall portfolio of finance receivables and related allowance for credit losses.
2.�� New accounting guidance
Revenue recognition – In May 2014, the Financial Accounting Standards Board (FASB) issued new revenue recognition guidance to provide a single, comprehensive revenue recognition model for all contracts with customers. Under the new guidance, an entity will recognize revenue to depict the transfer of promised goods or services to customers at an amount that the entity expects to be entitled to in exchange for those goods or services. A five step model has been introduced for an entity to apply when recognizing revenue. The new guidance also includes enhanced disclosure requirements. The guidance was effective January 1, 2018, and was applied to contracts that were not completed at the date of initial application on a modified retrospective basis through a cumulative effect adjustment to retained earnings as of January 1, 2018. The prior period comparative information has not been recasted and continues to be reported under the accounting guidance in effect for those periods.
Under the new guidance, sales of certain turbine machinery units changed to a point-in-time recognition model. Under previous guidance, we accounted for these sales under an over-time model following the percentage-of-completion method as the product was manufactured. In addition, under the new guidance we began to recognize an asset for the value of expected replacement part returns and discontinued lease accounting treatment for certain product sales containing residual value guarantees.
See Note 3 for additional information.
The cumulative effect of initially applying the new revenue recognition guidance to our consolidated financial statements on January 1, 2018 was as follows:
|
| | | | | | | | | | | | |
| Consolidated Statement of Financial Position | | | | | | |
| (Millions of dollars) | | Balance as of December 31, 2017 | | Cumulative Impact from Adopting New Revenue Guidance | | Balance as of January 1, 2018 |
| Assets | | | | | | |
| Receivables - trade and other | | $ | 7,436 |
| | $ | (66 | ) | | $ | 7,370 |
|
| Prepaid expenses and other current assets | | $ | 1,772 |
| | $ | 327 |
| | $ | 2,099 |
|
| Inventories | | $ | 10,018 |
| | $ | 4 |
| | $ | 10,022 |
|
| Property, plant and equipment - net | | $ | 14,155 |
| | $ | (190 | ) | | $ | 13,965 |
|
| Noncurrent deferred and refundable income taxes | | $ | 1,693 |
| | $ | 2 |
| | $ | 1,695 |
|
| | | | | | | |
| Liabilities | | | | | | |
| Accrued expenses | | $ | 3,220 |
| | $ | 226 |
| | $ | 3,446 |
|
| Customer advances | | $ | 1,426 |
| | $ | 46 |
| | $ | 1,472 |
|
| Other current liabilities | | $ | 1,742 |
| | $ | (17 | ) | | $ | 1,725 |
|
| Other liabilities | | $ | 4,053 |
| | $ | (166 | ) | | $ | 3,887 |
|
| | | | | | | |
| Shareholders' equity | | | | | | |
| Profit employed in the business | | $ | 26,301 |
| | $ | (12 | ) | | $ | 26,289 |
|
| | | | | | | |
The impact from adopting the new revenue recognition guidance on our consolidated financial statements was as follows:
| | | Consolidated Statement of Results of Operations | | | Three Months Ended September 30, 2018 |
| | | Three Months Ended March 31, 2018 | | As Reported | | Previous Accounting Guidance | | Impact from Adopting New Revenue Guidance |
| (Millions of dollars) | | As Reported | | Previous Accounting Guidance | | Impact from Adopting New Revenue Guidance | | | | | | |
| Sales of Machinery, Energy & Transportation | | | $ | 12,763 |
| | $ | 12,719 |
| | $ | 44 |
|
| Cost of goods sold | | | $ | 9,022 |
| | $ | 8,997 |
| | $ | 25 |
|
| Operating profit | | | $ | 2,135 |
| | $ | 2,116 |
| | $ | 19 |
|
| Consolidated profit before taxes | | | $ | 2,135 |
| | $ | 2,116 |
| | $ | 19 |
|
| Provision (benefit) for income taxes | | | $ | 415 |
| | $ | 411 |
| | $ | 4 |
|
| Profit of consolidated companies | | | $ | 1,720 |
| | $ | 1,705 |
| | $ | 15 |
|
| Profit of consolidated and affiliated companies | | | $ | 1,727 |
| | $ | 1,712 |
| | $ | 15 |
|
| Profit | | | $ | 1,727 |
| | $ | 1,712 |
| | $ | 15 |
|
| | | | | | | | |
| Consolidated Statement of Results of Operations | | | | | | | | Nine Months Ended September 30, 2018 |
| | | | As Reported | | Previous Accounting Guidance | | Impact from Adopting New Revenue Guidance |
| (Millions of dollars) | | | | | | | |
| Sales of Machinery, Energy & Transportation | | $ | 12,150 |
| | $ | 12,145 |
| | $ | 5 |
| | $ | 38,192 |
| | $ | 38,194 |
| | $ | (2 | ) |
| Cost of goods sold | | $ | 8,566 |
| | $ | 8,560 |
| | $ | 6 |
| | $ | 27,010 |
| | $ | 27,020 |
| | $ | (10 | ) |
| Other operating (income) expenses | | $ | 300 |
| | $ | 306 |
| | $ | (6 | ) | | $ | 1,028 |
| | $ | 1,034 |
| | $ | (6 | ) |
| Operating profit | | $ | 2,108 |
| | $ | 2,103 |
| | $ | 5 |
| | $ | 6,410 |
| | $ | 6,396 |
| | $ | 14 |
|
| Consolidated profit before taxes | | $ | 2,134 |
| | $ | 2,129 |
| | $ | 5 |
| | $ | 6,455 |
| | $ | 6,441 |
| | $ | 14 |
|
| Provision (benefit) for income taxes | | $ | 472 |
| | $ | 471 |
| | $ | 1 |
| | $ | 1,377 |
| | $ | 1,374 |
| | $ | 3 |
|
| Profit (loss) of consolidated companies | | $ | 1,662 |
| | $ | 1,658 |
| | $ | 4 |
| |
| Profit (loss) of consolidated and affiliated companies | | $ | 1,667 |
| | $ | 1,663 |
| | $ | 4 |
| |
| Profit of consolidated companies | | | $ | 5,078 |
| | $ | 5,067 |
| | $ | 11 |
|
| Profit of consolidated and affiliated companies | | | $ | 5,099 |
| | $ | 5,088 |
| | $ | 11 |
|
| Profit | | $ | 1,665 |
| | $ | 1,661 |
| | $ | 4 |
| | $ | 5,099 |
| | $ | 5,088 |
| | $ | 11 |
|
| | | | | | | | | | | | | |
| Consolidated Statement of Financial Position | | | | | | | | September 30, 2018 |
| | | | As Reported | | Previous Accounting Guidance | | Impact from Adopting New Revenue Guidance |
| (Millions of dollars) | | | | | | | |
| Assets | | | | | | | | | | | | |
| Receivables - trade and other | | $ | 7,894 |
| | $ | 7,907 |
| | $ | (13 | ) | | $ | 7,974 |
| | $ | 8,011 |
| | $ | (37 | ) |
| Prepaid expenses and other current assets | | $ | 1,856 |
| | $ | 1,568 |
| | $ | 288 |
| | $ | 1,835 |
| | $ | 1,502 |
| | $ | 333 |
|
| Inventories | | $ | 10,947 |
| | $ | 10,956 |
| | $ | (9 | ) | | $ | 11,814 |
| | $ | 11,807 |
| | $ | 7 |
|
| Noncurrent deferred and refundable income taxes | | $ | 1,687 |
| | $ | 1,686 |
| | $ | 1 |
| | $ | 1,288 |
| | $ | 1,289 |
| | $ | (1 | ) |
| | | | | | | | | | | | | |
| Liabilities | | | | | | | | | | | | |
| Accrued expenses | | $ | 3,551 |
| | $ | 3,325 |
| | $ | 226 |
| | $ | 3,423 |
| | $ | 3,203 |
| | $ | 220 |
|
| Customer advances | | $ | 1,399 |
| | $ | 1,350 |
| | $ | 49 |
| | $ | 1,491 |
| | $ | 1,408 |
| | $ | 83 |
|
| | | | | | | | | | | | | |
| Shareholders' equity | | | | | | | | | | | | |
| Profit employed in the business | | $ | 27,929 |
| | $ | 27,937 |
| | $ | (8 | ) | | $ | 30,384 |
| | $ | 30,385 |
| | $ | (1 | ) |
| | | | | | | | | | | | | |
Recognition and measurement of financial assets and financial liabilities – In January 2016, the FASB issued accounting guidance that affects the accounting for equity investments, financial liabilities accounted for under the fair value option and the presentation and disclosure requirements for financial instruments. Under the new guidance, all equity investments in unconsolidated entities (other than those accounted for using the equity method of accounting) will generally be measured at fair value through earnings. There will no longer be an available-for-sale classification for equity securities with readily determinable fair values. For financial liabilities when the fair value option has been elected, changes in fair value due to instrument-specific credit risk will be recognized separately in other comprehensive income. In addition, the FASB clarified guidance related to the valuation allowance assessment when recognizing deferred tax assets resulting from unrealized losses on available-for-sale debt securities. The guidance was effective January 1, 2018, and was applied on a modified retrospective basis through a cumulative effect adjustment to retained earnings as of January 1, 2018. The adoption did not have a material impact on our financial statements.
Lease accounting – In February 2016, the FASB issued accounting guidance that revises the accounting for leases. Under the new guidance, lessees are required to recognize a right-of-use asset and a lease liability for substantially all leases. The new guidance will continue to classify leases as either financing or operating, with classification affecting the pattern of expense recognition. The accounting applied by a lessor under the new guidance will be substantially equivalent to current lease accounting guidance. TheEntities have the option to adopt the new guidance isusing a modified retrospective approach through a cumulative effect adjustment to retained earnings applied either to the beginning of the earliest period presented or the beginning of the period of adoption. We will adopt the new guidance effective January 1, 2019 with early adoption permitted. The new standard is required to be applied withusing a modified retrospective approach through a cumulative effect adjustment to eachretained earnings as of the beginning of the period of adoption.
The new guidance provides a number of optional practical expedients in transition. We plan to elect the ‘package of practical expedients’, which allows us not to reassess under the new guidance our prior reporting period presentedconclusions about lease identification, lease classification and initial direct costs. We do not expect to elect the use-of-hindsight practical expedient. In addition, the new guidance provides practical expedients for certain practical expedients. An implementation team isan entity’s ongoing accounting that we are still evaluating such as whether or not to separate lease and non-lease components. We plan to elect the short-term lease recognition exemption for all leases that qualify which means we will not recognize right-of-use assets or lease liabilities for these leases.
We are currently designing new processes and controls, cataloging and entering our leases into a recently implemented software solution and evaluating our population of leased assets to assess the effect of the new guidance on our financial statements. While we continue to assess the effects of adoption, we believe the most significant effects relate to the recognition of right-of-use assets and lease liabilities on our balance sheet, and providing new disclosures about our leasing activities. In addition, we expect to derecognize about $125 million of existing assets and $375 million of debt obligations for a sale-leaseback transaction that qualifies for sale accounting under the new guidance. The gain associated with this change in accounting will be recognized through opening retained earnings as of January 1, 2019. We planare continuing to adoptevaluate the impact of the new guidance on lessor accounting, which will primarily impact Cat Financial. We do not expect the new guidance to have a material impact on our results of operations.
Stock-based compensation– In March 2016, the FASB issued accounting guidance to simplify several aspects of the accounting for share-based payments. The new guidance changes how reporting entities account for certain aspects of share-based payments, including the accounting for income taxes and the classification of the tax impact on the Consolidated Statement of Cash Flow. Under the new guidance, all excess tax benefits and deficiencies during the period are recognized in income (rather than equity) on a prospective basis. The guidance removes the requirement to delay recognition of excess tax benefits until it reduces income taxes currently payable. This change was required to be applied on a modified retrospective basis, resulting in a cumulative-effect adjustment to opening retained earnings in the period of adoption. In addition, Cash flows related to excess tax benefits are now included in Cash provided by operating activities and will no longer be separately classified as a financing activity. This change was adopted retrospectively. The guidance was effective January 1, 2019.2017, and did not have a material impact on our financial statements.
Measurement of credit losses on financial instruments – In June 2016, the FASB issued accounting guidance to introduce a new model for recognizing credit losses on financial instruments based on an estimate of current expected credit losses. The new guidance will apply to loans, accounts receivable, trade receivables, other financial assets measured at amortized cost, loan commitments and other off-balance sheet credit exposures. The new guidance will also apply to debt securities and other financial assets measured at fair value through other comprehensive income. The new guidance is effective January 1, 2020, with early adoption permitted beginning January 1, 2019. We are in the process of evaluating the effect of the new guidance on our financial statements.
Classification for certain cash receipts and cash payments – In August 2016, the FASB issued accounting guidance related to the presentation and classification of certain transactions in the statement of cash flows where diversity in practice exists. The guidance was effective January 1, 2018, and was applied on a retrospective basis. The adoption did not have a material impact on our financial statements.
Tax accounting for intra-entity asset transfers – In October 2016, the FASB issued accounting guidance that requires the recognition of tax expense from the sales of intra-entity assets in the seller's tax jurisdiction at the time of transfer. The new guidance does not apply to intra-entity transfers of inventory. Under previous guidance, the tax effects of these assets were deferred until the transferred asset was sold to a third party or otherwise recovered through use. The guidance was effective January 1, 2018, and was applied on a modified retrospective basis through a cumulative effect adjustment to retained earnings as of January 1, 2018. The adoption did not have a material impact on our financial statements.
Classification of restricted cash – In November 2016, the FASB issued accounting guidance related to the presentation and classification of changes in restricted cash on the statement of cash flows where diversity in practice exists. The guidance was effective January 1, 2018, and was applied on a retrospective basis. The adoption did not have a material impact on our financial statements.
Presentation of net periodic pension costs and net periodic postretirement benefit costs – In March 2017, the FASB issued accounting guidance that requires that an employer to disaggregate the service cost component from the other components of net periodic benefit cost. Service cost is required to be reported in the same line item or items as other compensation costs arising from services rendered by the pertinent employees during the period. The other components of net periodic benefit cost are required to be reported outside the subtotal for income from operations. Additionally, only the service cost component of net periodic benefit costs is eligible for capitalization. The guidance was effective January 1, 2018. We applied the presentation changes retrospectively and the capitalization change prospectively. The adoption primarily resulted in the reclassification of other components of net periodic benefit cost outside of Operating profit in the Consolidated Statement of Results of Operations.
| | | Consolidated Statement of Results of Operations | Three Months Ended March 31, 2017 | |
| | | |
| | | Three Months Ended September 30, 2017 |
| (Millions of dollars) | As Revised | | Previously Reported | | Effect of Change | As Revised | | Previously Reported | | Effect of Change |
| Cost of goods sold | | $ | 7,678 |
| | $ | 7,633 |
| | $ | 45 |
|
| Selling, general and administrative expenses | | $ | 1,254 |
| | $ | 1,237 |
| | $ | 17 |
|
| Research and development expenses | | $ | 461 |
| | $ | 455 |
| | $ | 6 |
|
| Total operating costs | | $ | 9,904 |
| | $ | 9,836 |
| | $ | 68 |
|
| Operating profit | | $ | 1,509 |
| | $ | 1,577 |
| | $ | (68 | ) |
| Other income (expense) | | $ | 132 |
| | $ | 64 |
| | $ | 68 |
|
| | | | | | | |
| | | Nine Months Ended September 30, 2017 |
| | | As Revised | | Previously Reported | | Effect of Change |
| Cost of goods sold | $ | 6,801 |
| | $ | 6,758 |
| | $ | 43 |
| $ | 22,295 |
| | $ | 22,160 |
| | $ | 135 |
|
| Selling, general and administrative expenses | $ | 1,061 |
| | $ | 1,045 |
| | $ | 16 |
| $ | 3,619 |
| | $ | 3,571 |
| | $ | 48 |
|
| Research and development expenses | $ | 425 |
| | $ | 418 |
| | $ | 7 |
| $ | 1,344 |
| | $ | 1,326 |
| | $ | 18 |
|
| Other operating (income) expenses | $ | 996 |
| | $ | 1,025 |
| | $ | (29 | ) | $ | 1,751 |
| | $ | 1,780 |
| | $ | (29 | ) |
| Total operating costs | $ | 9,442 |
| | $ | 9,405 |
| | $ | 37 |
| $ | 29,493 |
| | $ | 29,321 |
| | $ | 172 |
|
| Operating profit | $ | 380 |
| | $ | 417 |
| | $ | (37 | ) | $ | 3,073 |
| | $ | 3,245 |
| | $ | (172 | ) |
| Other income (expense) | $ | 32 |
| | $ | (5 | ) | | $ | 37 |
| $ | 260 |
| | $ | 88 |
| | $ | 172 |
|
| | | | | | | | | | | |
Premium amortization on purchased callable debt securities – In March 2017, the FASB issued accounting guidance related to the amortization period for certain purchased callable debt securities held at a premium. Securities held at a premium will be required to be amortized to the earliest call date rather than the maturity date. The new standard is required to be applied with a modified retrospective approach through a cumulative-effect adjustment directly to retained earnings as of the beginning of the period of adoption. TheWe will adopt the new guidance is effective January 1, 2019, with early adoption permitted.2019. We do not expect the adoption to have a material impact on our financial statements.
Clarification on stock-based compensation – In May 2017, the FASB issued accounting guidance to clarify which changes to the terms or conditions of a share-based payment award require an entity to apply modification accounting.
The guidance was effective January 1, 2018, and was applied prospectively. The adoption did not have a material impact on our financial statements.
Derivatives and hedging – In August 2017, the FASB issued accounting guidance to better align hedge accounting with a company’s risk management activities, simplify the application of hedge accounting and improve the disclosures of hedging arrangements. The new guidance is required to be applied on a modified retrospective basis, resulting in a cumulative-effect adjustment to opening retained earnings in the period of adoption. TheWe will adopt the new guidance is effective January 1, 2019, with early adoption permitted.2019. The impact on our financial statements at the time of adoption will primarily be reclassification of our gains (losses) for designated ME&T foreign exchange contracts from Other income (expense) to components of Operating profit in the Consolidated Statement of Results of Operations.
Reclassification of certain tax effects from accumulated other comprehensive income – In February 2018, the FASB issued accounting guidance to allow a reclassification from accumulated other comprehensive income to retained earnings for stranded tax effects resulting from U.S. tax reform legislation. The new guidance is required to be applied either in the period of adoption or retrospectively to each period affected by U.S. tax reform legislation. The guidance is effective January 1, 2019, with early adoption permitted. We are in the process of evaluating the effect of the new guidance on our financial statements.
Defined benefit plan disclosures– In August 2018, the FASB issued accounting guidance that revises the annual disclosure requirements for employers by removing and adding certain disclosures for these plans. The applicable requirements that were removed include the amount of prior service cost (credit) that will be amortized from Accumulated other comprehensive income (loss) into net periodic benefit cost for the next fiscal year and the effect of a one-percentage-point change in the assumed health care cost trend rates on the service and interest cost components of other postretirement benefit cost and on the accumulated postretirement benefit obligations. The new disclosure requirements include the weighted average interest crediting rates for cash balance plans and other plans with promised interest crediting rates and narrative description of the reasons for significant actuarial gains and losses related to changes in benefit plan obligations or assets for the period. The new guidance is required to be applied on a retrospective basis. The guidance is effective January 1, 2020, with early adoption permitted. We do not expect the adoption to have a material impact on our financial statements.
| |
| 3. | Sales and revenue recognition |
A. Sales of Machinery, Energy & Transportation
Sales of Machinery, Energy & Transportation are recognized when all the following criteria are satisfied: (i) a contract with an independently owned and operated dealer or an end user exists which has commercial substance; (ii) it is probable we will collect the amount charged to the dealer or end user; and (iii) we have completed our performance obligation whereby the dealer or end user has obtained control of the product. A contract with commercial substance exists once we receive and accept a purchase order under a dealer sales agreement, or once we enter into a contract with an end user. If collectabilitycollectibility is not probable, the sale is deferred and not recognized until collection is probable or payment is received. Control of our products typically transfers when title and risk of ownership of the product has transferred to the dealer or end user. Typically, where product is produced and sold in the same country, title and risk of ownership transfer when the product is shipped. Products that are exported from a country for sale typically transfer title and risk of ownership at the border of the destination country.
Our remanufacturing operations are primarily focused on the remanufacture of Cat engines and components and rail related products. In this business, used engines and related components (core) are inspected, cleaned and remanufactured. In connection with the sale of our remanufactured product to dealers, we collect a deposit that is repaid if the dealer returns an acceptable core within a specified time period. Caterpillar owns and has title to the cores when they are returned from dealers. The rebuilt engine or component (the core plus any new content) is then sold as a remanufactured product to dealers and end users. Revenue is recognized pursuant to the same criteria as Machinery, Energy & Transportation sales noted above (title and risk of ownership of the entire remanufactured product passes to the dealer or end user upon sale). At the time of sale, the deposit is recognized in Other current liabilities in the Consolidated Statement of Financial Position, and the core to be returned is recognized as an asset in Prepaid expenses and other current assets in the Consolidated Statement of Financial Position at the estimated replacement cost (based on historical experience with usable cores). Upon receipt of an acceptable core, we repay the deposit and relieve the liability. The returned core is then included in inventory. In the event that the deposit is forfeited (i.e., upon failure by the dealer to return an acceptable core in the specified time period), we recognize the core deposit and the cost of the core in Sales and Cost of goods sold, respectively.
We provide discounts to dealers through merchandising programs. We have numerous programs that are designed to promote the sale of our products. The most common dealer programs provide a discount when the dealer sells a product to a targeted end user. Generally, the cost of these discounts is estimated for each product by model by geographic region based on historical experience and known changes in merchandising programs. The cost of these discounts is reported as a reduction to the transaction price when the product sale is recognized. A corresponding post-sale discount reserve is accrued in the Consolidated Statement of Financial Position, which represents discounts we expect to pay on previously sold units. If discounts paid differ from those estimated, the difference is reported as a change in the transaction price.
Except for replacement parts, no right of return exists on the sale of our products. We estimate replacement part returns based on historical experience and recognize a parts return asset in Prepaid expenses and other current assets in the
Consolidated Statement of Financial Position, which represents our right to recover replacement parts we expect will be returned. We also recognize a refund liability in Other current liabilities in the Consolidated Statement of Financial Position for the refund we expect to pay for returned parts. If actual replacement part returns differ from those estimated, the difference in the estimated replacement part return asset and refund liability is recognized in Cost of goods sold and Sales, respectively.
Our standard dealer invoice terms are established by marketing region. Our invoice terms for end user sales are established by the responsible business unit. Payments from dealers are due shortly after the time of sale. When a sale is made to a dealer, the dealer is responsible for payment even if the product is not sold to an end user. Dealers and end users must make payment within the established invoice terms to avoid potential interest costs. Interest at or above prevailing market rates may be charged on any past due balance, and generally our practice is to not forgive this interest. In addition, Cat Financial provides wholesale inventory financing for a dealer's purchase of inventory. Wholesale inventory receivables have varying payment terms and are included in Receivables -– trade and other and Long-term receivables -– trade and other in the Consolidated Statement of Financial Position. Trade receivables from dealers and end users were $6,821$6,902 million and $6,399 million as of March 31,September 30, 2018 and January 1, 2018, respectively, and are recognized in Receivables -– trade and other in the Consolidated Statement of Financial Position. Long-term trade receivables from dealers and end users were $614$664 million and $639 million as of March 31,September 30, 2018 and January 1, 2018, respectively, and are recognized in Long-term receivables -– trade and other in the Consolidated Statement of Financial Position.
We establish a bad debt allowance for Machinery, Energy & Transportation receivables when it becomes probable that the receivable will not be collected. Our allowance for bad debts is not significant.
We invoice in advance of recognizing the sale of certain products. Advanced customer payments are recognized as a contract liability in Customer advances and Other liabilities in the Consolidated Statement of Financial Position. Long-term customer advances recognized in Other liabilities in the Consolidated Statement of Financial Position were $424$432 million and $396 million as of March 31,September 30, 2018 and January 1, 2018, respectively. We reduce the contract liability when revenue is recognized. During the three-month period ending March 31,three and nine months ended September 30, 2018, we recognized $617$145 million and $1,124 million, respectively, of revenue that was recorded as a contract liability at the beginning of the period.2018.
We have elected the practical expedient to not adjust the amount of revenue to be recognized under a contract with a dealer or end user for the effects of time value of money when the timing difference between receipt of payment and recognition of revenue is less than one year.
As of March 31,September 30, 2018, we have entered into contracts with dealers and end users for which sales have not been recognized as we have not satisfied our performance obligations and transferred control of the products. The dollar amount of unsatisfied performance obligations for contracts with an original duration greater than one year is $5.5$5.9 billion, of which $2.4$2.7 billion is expected to be completed and revenue recognized in the twelve months following March 31,September 30, 2018. We have elected the practical expedient to not disclose unsatisfied performance obligations with an original contract duration of one year or less. Contracts with an original duration of one year or less are primarily sales to dealers for machinery, engines and replacement parts.
Sales and other related taxes are excluded from the transaction price. Shipping and handling costs associated with outbound freight after control over a product has transferred are accounted for as a fulfillment cost and are included in Cost of goods sold.
We provide a standard manufacturer’s warranty of our products at no additional cost. At the time a sale is recognized, we record estimated future warranty costs. See Note 10 for further discussion of our product warranty liabilities.
See Note 15 for further disaggregated sales and revenues information.
B. Revenues of Financial Products
Revenues of Financial Products are generated primarily from finance revenue on finance receivables and rental payments on operating leases. Finance revenue is recorded over the life of the related finance receivable using the interest method, including the accretion of certain direct origination costs that are deferred. Revenue from rental payments received on operating leases is recognized on a straight-line basis over the term of the lease.
Recognition of finance revenue and rental revenue is suspended and the account is placed on non-accrual status when management determines that collection of future income is not probable (generally after 120 days past due). Recognition is resumed, and previously suspended income is recognized, when the account becomes current and collection of remaining amounts is considered probable. See Note 16 for more information.
Revenues are presented net of sales and other related taxes.
4. Stock-based compensation
Accounting for stock-based compensation requires that the cost resulting from all stock-based payments be recognized in the financial statements based on the grant date fair value of the award. Our stock-based compensation primarily consists of stock options, restricted stock units (RSUs), and performance-based restricted stock units (PRSUs) and stock-settled stock appreciation rights (SARs).
Beginning with the 2018 grant, RSU and PRSU awards are credited with dividend equivalent units on each date that a cash dividend is paid to holders of Common Stock. The fair value of the RSU and PRSU awards granted in 2018 was determined as the closing stock price on the date of grant. Prior to 2018, RSU and PRSU awards were not credited with dividend equivalent units and the fair value was determined by reducing the stock price on the date of grant by the present value of the estimated dividends to be paid during the vesting period. The estimated dividends were based on Caterpillar's quarterly dividend per share at the time of grant.
We recognized pretax stock-based compensation expense of $50$52 million and $49$164 million for the three and nine months ended March 31,September 30, 2018, respectively, and $48 million and $165 million for the three and nine months ended September 30, 2017, respectively.
The following table illustrates the type and fair value of the stock-based compensation awards granted during the threenine months ended March 31,September 30, 2018 and 2017, respectively:
| | | | | | | | | | | | | | | | | | | | | | | | | |
| | Three Months Ended March 31, 2018 | | Three Months Ended March 31, 2017 | Nine Months Ended September 30, 2018 | | Nine Months Ended September 30, 2017 |
| | Shares Granted | | Weighted-Average Fair Value Per Share | | Weighted-Average Grant Date Stock Price | | Shares Granted | | Weighted-Average Fair Value Per Share | | Weighted-Average Grant Date Stock Price | Shares Granted | | Weighted-Average Fair Value Per Share | | Weighted-Average Grant Date Stock Price | | Shares Granted | | Weighted-Average Fair Value Per Share | | Weighted-Average Grant Date Stock Price |
| Stock options | 1,566,788 |
| | $ | 46.18 |
| | $ | 151.12 |
| | 2,701,644 |
| | $ | 25.01 |
| | $ | 95.66 |
| 1,605,220 |
| | $ | 46.11 |
| | $ | 150.90 |
| | 2,701,644 |
| | $ | 25.01 |
| | $ | 95.66 |
|
| RSUs | 676,228 |
| | $ | 151.12 |
| | $ | 151.12 |
| | 906,068 |
| | $ | 89.76 |
| | $ | 95.63 |
| 722,521 |
| | $ | 150.64 |
| | $ | 150.64 |
| | 924,421 |
| | $ | 90.11 |
| | $ | 96.01 |
|
| PRSUs | 339,559 |
| | $ | 151.12 |
| | $ | 151.12 |
| | 437,385 |
| | $ | 86.78 |
| | $ | 95.66 |
| 344,866 |
| | $ | 150.93 |
| | $ | 150.93 |
| | 437,385 |
| | $ | 86.78 |
| | $ | 95.66 |
|
| | | | | | | | | | | | | | | | | | | | | | | |
The following table provides the assumptions used in determining the fair value of the stock-based awards for the threenine months ended March 31,September 30, 2018 and 2017, respectively:
| | | | | | | |
| | Grant Year | Grant Year |
| | 2018 | | 2017 | 2018 | | 2017 |
| Weighted-average dividend yield | 2.70% | | 3.42% | 2.70 | % | | 3.42 | % |
| Weighted-average volatility | 30.2% | | 29.2% | 30.2 | % | | 29.2 | % |
| Range of volatilities | 21.5-33.0% | | 22.1-33.0% | 21.5-33.0% |
| | 22.1-33.0% |
|
| Range of risk-free interest rates | 2.02-2.87% | | 0.81-2.35% | 2.02-2.87% |
| | 0.81-2.35% |
|
| Weighted-average expected lives | 8 years | | 8 years | 8 years |
| | 8 years |
|
| | | | | |
As of March 31,September 30, 2018, the total remaining unrecognized compensation expense related to nonvested stock-based compensation awards was $327$217 million, which will be amortized over the weighted-average remaining requisite service periods of approximately 2.01.9 years.
5. Derivative financial instruments and risk management
Our earnings and cash flow are subject to fluctuations due to changes in foreign currency exchange rates, interest rates and commodity prices. Our Risk Management Policy (policy) allows for the use of derivative financial instruments to prudently manage foreign currency exchange rate, interest rate and commodity price exposures. Our policy specifies that derivatives are not to be used for speculative purposes. Derivatives that we use are primarily foreign currency forward, option and cross currency contracts, interest rate contracts and commodity forward and option contracts. Our derivative activities are subject to the management, direction and control of our senior financial officers. Risk management practices, including the use of financial derivative instruments, are presented to the Audit Committee of the Board of Directors at least annually.
All derivatives are recognized on the Consolidated Statement of Financial Position at their fair value. On the date the derivative contract is entered into, we designate the derivative as (1) a hedge of the fair value of a recognized asset or liability (fair value hedge), (2) a hedge of a forecasted transaction or the variability of cash flow (cash flow hedge) or (3) an undesignated instrument. Changes in the fair value of a derivative that is qualified, designated and highly effective as a fair value hedge, along with the gain or loss on the hedged recognized asset or liability that is attributable to the hedged risk, are recorded in current earnings. Changes in the fair value of a derivative that is qualified, designated and highly effective as a cash flow hedge are recorded in Accumulated other comprehensive income (loss) (AOCI), to the extent effective, on the Consolidated Statement of Financial Position until they are reclassified to earnings in the same period or periods during which the hedged transaction affects earnings. Changes in the fair value of undesignated derivative instruments and the ineffective portion of designated derivative instruments are reported in current earnings. Cash flows from designated derivative financial instruments are classified within the same category as the item being hedged on the Consolidated Statement of Cash Flow. Cash flows from undesignated derivative financial instruments are included in the investing category on the Consolidated Statement of Cash Flow.
We formally document all relationships between hedging instruments and hedged items, as well as the risk-management objective and strategy for undertaking various hedge transactions. This process includes linking all derivatives that are designated as fair value hedges to specific assets and liabilities on the Consolidated Statement of Financial Position and linking cash flow hedges to specific forecasted transactions or variability of cash flow.
We also formally assess, both at the hedge’s inception and on an ongoing basis, whether the designated derivatives that are used in hedging transactions are highly effective in offsetting changes in fair values or cash flow of hedged items. When a derivative is determined not to be highly effective as a hedge or the underlying hedged transaction is no longer probable, we discontinue hedge accounting prospectively, in accordance with the derecognition criteria for hedge accounting.
Foreign Currency Exchange Rate Risk
Foreign currency exchange rate movements create a degree of risk by affecting the U.S. dollar value of sales made and costs incurred in foreign currencies. Movements in foreign currency rates also affect our competitive position as these changes may affect business practices and/or pricing strategies of non-U.S.-based competitors. Additionally, we have balance sheet positions denominated in foreign currencies, thereby creating exposure to movements in exchange rates.
Our Machinery, Energy & Transportation operations purchase, manufacture and sell products in many locations around the world. As we have a diversified revenue and cost base, we manage our future foreign currency cash flow exposure on a net basis. We use foreign currency forward and option contracts to manage unmatched foreign currency cash inflow and outflow. Our objective is to minimize the risk of exchange rate movements that would reduce the U.S. dollar value of our foreign currency cash flow. Our policy allows for managing anticipated foreign currency cash flow for up to five years. As of March 31,September 30, 2018, the maximum term of these outstanding contracts was approximately 51 months.
We generally designate as cash flow hedges at inception of the contract any Australian dollar, Brazilian real, British pound, Canadian dollar, Chinese yuan, Indian rupee, Japanese yen, Mexican peso, Singapore dollar or Thailand baht forward or option contracts that meet the requirements for hedge accounting and the maturity extends beyond the current quarter-end. Designation is performed on a specific exposure basis to support hedge accounting. The remainder of Machinery, Energy & Transportation foreign currency contracts are undesignated.
As of March 31,September 30, 2018, $16$33 million of deferred net gains,losses, net of tax, included in equity (AOCI in the Consolidated Statement of Financial Position), are expected to be reclassified to current earnings (Other income (expense) in the Consolidated Statement of Results of Operations) over the next twelve months when earnings are affected by the hedged
transactions. The actual amount recorded in Other income (expense) will vary based on exchange rates at the time the hedged transactions impact earnings.
In managing foreign currency risk for our Financial Products operations, our objective is to minimize earnings volatility resulting from conversion and the remeasurement of net foreign currency balance sheet positions, and future transactions denominated in foreign currencies. Our policy allows the use of foreign currency forward, option and cross currency contracts to offset the risk of currency mismatch between our assets and liabilities, and exchange rate risk associated with future transactions denominated in foreign currencies. Our foreign currency forward and option contracts are primarily undesignated. We designate fixed-to-fixed cross currency contracts as cash flow hedges to protect against movements in exchange rates on foreign currency fixed-rate assets and liabilities.
Interest Rate Risk
Interest rate movements create a degree of risk by affecting the amount of our interest payments and the value of our fixed-rate debt. Our practice is to use interest rate contracts to manage our exposure to interest rate changes.
Our Machinery, Energy & Transportation operations generally use fixed-rate debt as a source of funding. Our objective is to minimize the cost of borrowed funds. Our policy allows us to enter into fixed-to-floating interest rate contracts and forward rate agreements to meet that objective. We designate fixed-to-floating interest rate contracts as fair value hedges at inception of the contract, and we designate certain forward rate agreements as cash flow hedges at inception of the contract.
Financial Products operations has a match-funding policy that addresses interest rate risk by aligning the interest rate profile (fixed or floating rate) of Cat Financial’s debt portfolio with the interest rate profile of their receivables portfolio within predetermined ranges on an ongoing basis. In connection with that policy, we use interest rate derivative instruments to modify the debt structure to match assets within the receivables portfolio. This matched funding reduces the volatility of margins between interest-bearing assets and interest-bearing liabilities, regardless of which direction interest rates move.
Our policy allows us to use fixed-to-floating, floating-to-fixed and floating-to-floating interest rate contracts to meet the match-funding objective. We designate fixed-to-floating interest rate contracts as fair value hedges to protect debt against
changes in fair value due to changes in the benchmark interest rate. We designate most floating-to-fixed interest rate contracts as cash flow hedges to protect against the variability of cash flows due to changes in the benchmark interest rate.
We have, at certain times, liquidated fixed-to-floating and floating-to-fixed interest rate contracts at both Machinery, Energy & Transportation and Financial Products. The gains or losses associated with these contracts at the time of liquidation are amortized into earnings over the original term of the previously designated hedged item.
Commodity Price Risk
Commodity price movements create a degree of risk by affecting the price we must pay for certain raw material. Our policy is to use commodity forward and option contracts to manage the commodity risk and reduce the cost of purchased materials.
Our Machinery, Energy & Transportation operations purchase base and precious metals embedded in the components we purchase from suppliers. Our suppliers pass on to us price changes in the commodity portion of the component cost. In addition, we are subject to price changes on energy products such as natural gas and diesel fuel purchased for operational use.
Our objective is to minimize volatility in the price of these commodities. Our policy allows us to enter into commodity forward and option contracts to lock in the purchase price of a portion of these commodities within a five-year horizon. All such commodity forward and option contracts are undesignated.
The location and fair value of derivative instruments reported in the Consolidated Statement of Financial Position are as follows:
| | | | | | | | | | | | | |
(Millions of dollars) | Consolidated Statement of Financial | | Asset (Liability) Fair Value | Consolidated Statement of Financial | | Asset (Liability) Fair Value |
| | Position Location | | March 31, 2018 | | December 31, 2017 | Position Location | | September 30, 2018 | | December 31, 2017 |
| Designated derivatives | | | | | | | | | | |
| Foreign exchange contracts | | | |
| | |
| | | |
| | |
|
| Machinery, Energy & Transportation | Receivables – trade and other | | $ | 24 |
| | $ | 8 |
| Receivables – trade and other | | $ | 4 |
| | $ | 8 |
|
| Machinery, Energy & Transportation | Long-term receivables – trade and other | | 13 |
| | 4 |
| Long-term receivables – trade and other | | — |
| | 4 |
|
| Machinery, Energy & Transportation | Accrued expenses | | (4 | ) | | (14 | ) | Accrued expenses | | (46 | ) | | (14 | ) |
| Machinery, Energy & Transportation | Other liabilities | | — |
| | (2 | ) | Other liabilities | | (6 | ) | | (2 | ) |
| Financial Products | Long-term receivables – trade and other | | 1 |
| | 7 |
| Receivables – trade and other | | 50 |
| | — |
|
| Financial Products | Accrued expenses | | (94 | ) | | (57 | ) | Long-term receivables – trade and other | | 31 |
| | 7 |
|
| Financial Products | | Accrued expenses | | (17 | ) | | (57 | ) |
| Interest rate contracts | | | | | |
| | | | | |
|
| Financial Products | | Receivables – trade and other | | 1 |
| | — |
|
| Financial Products | Long-term receivables – trade and other | | 2 |
| | 3 |
| Long-term receivables – trade and other | | 9 |
| | 3 |
|
| Financial Products | Accrued expenses | | (3 | ) | | (2 | ) | Accrued expenses | | (3 | ) | | (2 | ) |
| | | | $ | (61 | ) | | $ | (53 | ) | | | $ | 23 |
| | $ | (53 | ) |
| Undesignated derivatives | | | |
| | |
| | | |
| | |
|
| Foreign exchange contracts | | | |
| | |
| | | |
| | |
|
| Machinery, Energy & Transportation | Receivables – trade and other | | $ | 19 |
| | $ | 19 |
| Receivables – trade and other | | $ | 4 |
| | $ | 19 |
|
| Machinery, Energy & Transportation | Accrued expenses | | (3 | ) | | (9 | ) | Accrued expenses | | (37 | ) | | (9 | ) |
| Financial Products | Receivables – trade and other | | 14 |
| | 12 |
| Receivables – trade and other | | 42 |
| | 12 |
|
| Financial Products | Accrued expenses | | (19 | ) | | (9 | ) | Long-term receivables – trade and other | | 7 |
| | — |
|
| Financial Products | | Accrued expenses | | (19 | ) | | (9 | ) |
| Commodity contracts | | | | | |
| | | | | |
|
| Machinery, Energy & Transportation | Receivables – trade and other | | 9 |
| | 21 |
| Receivables – trade and other | | 10 |
| | 21 |
|
| Machinery, Energy & Transportation | Accrued expenses | | (3 | ) | | — |
| Accrued expenses | | (8 | ) | | — |
|
| | | | $ | 17 |
| | $ | 34 |
| | | $ | (1 | ) | | $ | 34 |
|
| | | | | | | | | |
The total notional amounts of the derivative instruments are as follows:
| | | | | | | | | | | |
| (Millions of dollars) | | March 31, 2018 | | December 31, 2017 | | September 30, 2018 | | December 31, 2017 |
| | | | | | | | | |
| Machinery, Energy & Transportation | | $ | 2,683 |
| | $ | 3,190 |
| | $ | 2,129 |
| | $ | 3,190 |
|
| Financial Products | | $ | 5,360 |
| | $ | 3,691 |
| | $ | 7,517 |
| | $ | 3,691 |
|
| | | | | | | | | |
The notional amounts of the derivative financial instruments do not represent amounts exchanged by the parties. The amounts exchanged by the parties are calculated by reference to the notional amounts and by other terms of the derivatives, such as foreign currency exchange rates, interest rates or commodity prices.
The effect of derivatives designated as hedging instruments on the Consolidated Statement of Results of Operations is as follows:
|
| | | | | | | | | | | | | | | | | | |
| Fair Value Hedges | | | | | | |
| | | | Three Months Ended
March 31, 2018 | | Three Months Ended
March 31, 2017 | |
(Millions of dollars) | Classification | | Gains (Losses) on Derivatives | | Gains (Losses) on Borrowings | | Gains (Losses) on Derivatives | | Gains (Losses) on Borrowings | |
| Interest rate contracts | | | | | | | | | |
| |
| Financial Products | Other income (expense) | | $ | (2 | ) | | $ | 2 |
| | $ | (1 | ) | | $ | 1 |
| |
| | | | $ | (2 | ) | | $ | 2 |
| | $ | (1 | ) | | $ | 1 |
| |
|
| | | | | | | | | | | | | | |
| | | | | | | | | |
| Cash Flow Hedges | | | | | | | | |
| | Three Months Ended March 31, 2018 | |
| | | | Recognized in Earnings | |
(Millions of dollars) | Amount of Gains (Losses) Recognized in AOCI (Effective Portion) | | Classification of Gains (Losses) | | Amount of Gains (Losses) Reclassified from AOCI to Earnings | | Recognized in Earnings (Ineffective Portion) | |
| Foreign exchange contracts | |
| | | | |
| | |
| |
| Machinery, Energy & Transportation | $ | 39 |
| | Other income (expense) | | $ | 1 |
| | $ | — |
| |
| Financial Products | (33 | ) | | Other income (expense) | | (29 | ) | | — |
| |
| Financial Products | — |
| | Interest expense of Financial Products | | 3 |
| | — |
| |
| Interest rate contracts | | | | | | | | |
| Machinery, Energy & Transportation | — |
| | Interest expense excluding Financial Products | | — |
| | — |
| |
| Financial Products | — |
| | Interest expense of Financial Products | | 1 |
| | — |
|
|
| | $ | 6 |
| | | | $ | (24 | ) | | $ | — |
| |
|
| | | | | | | | | | | | | | |
| | Three Months Ended March 31, 2017 | |
| | | | Recognized in Earnings | |
| | Amount of Gains (Losses) Recognized in AOCI (Effective Portion) | | Classification of Gains (Losses) | | Amount of Gains (Losses) Reclassified from AOCI to Earnings | | Recognized in Earnings (Ineffective Portion) | |
| Foreign exchange contracts | | | | | | | | |
| Machinery, Energy & Transportation | $ | 33 |
| | Other income (expense) | | $ | (39 | ) | | $ | — |
| |
| Financial Products | (18 | ) | | Other income (expense) | | (22 | ) | | — |
| |
| Interest rate contracts | |
| | | | |
| | |
| |
| Machinery, Energy & Transportation | — |
| | Interest expense excluding Financial Products | | (2 | ) | | — |
| |
| Financial Products | — |
| | Interest expense of Financial Products | | 1 |
| | — |
|
|
| | $ | 15 |
| | | | $ | (62 | ) | | $ | — |
| |
|
| | | | | | | | | | | | | | |
| | | | | | | | | |
| Cash Flow Hedges | | | | | | | | |
| | Three Months Ended September 30, 2018 | |
| | | | Recognized in Earnings | |
(Millions of dollars) | Amount of Gains (Losses) Recognized in AOCI (Effective Portion) | | Classification of Gains (Losses) | | Amount of Gains (Losses) Reclassified from AOCI to Earnings | | Recognized in Earnings (Ineffective Portion) | |
| Foreign exchange contracts | |
| | | | |
| | |
| |
| Machinery, Energy & Transportation | $ | (15 | ) | | Other income (expense) | | $ | (17 | ) | | $ | — |
| |
| Financial Products | 53 |
| | Other income (expense) | | 51 |
| | — |
| |
| Financial Products | — |
| | Interest expense of Financial Products | | 5 |
| | — |
| |
| Interest rate contracts | | | | | | | | |
| Machinery, Energy & Transportation | — |
| | Interest expense excluding Financial Products | | — |
| | — |
| |
| Financial Products | 3 |
| | Interest expense of Financial Products | | — |
| | — |
|
|
| | $ | 41 |
| | | | $ | 39 |
| | $ | — |
| |
|
| | | | | | | | | | | | | | |
| | Three Months Ended September 30, 2017 | |
| | | | Recognized in Earnings | |
| | Amount of Gains (Losses) Recognized in AOCI (Effective Portion) | | Classification of Gains (Losses) | | Amount of Gains (Losses) Reclassified from AOCI to Earnings | | Recognized in Earnings (Ineffective Portion) | |
| Foreign exchange contracts | | | | | | | | |
| Machinery, Energy & Transportation | $ | 16 |
| | Other income (expense) | | $ | 4 |
| | $ | — |
| |
| Financial Products | (21 | ) | | Other income (expense) | | (20 | ) | | — |
| |
| Interest rate contracts | |
| | | | |
| | |
| |
| Machinery, Energy & Transportation | — |
| | Interest expense excluding Financial Products | | (2 | ) | | — |
| |
| Financial Products | (1 | ) | | Interest expense of Financial Products | | 2 |
| | — |
|
|
| | $ | (6 | ) | | | | $ | (16 | ) | | $ | — |
| |
|
| | | | | | | | | | | | | | |
| | | | | | | | | |
| | Nine Months Ended September 30, 2018 | |
| | | | Recognized in Earnings | |
| | Amount of Gains (Losses) Recognized in AOCI (Effective Portion) | | Classification of Gains (Losses) | | Amount of Gains (Losses) Reclassified from AOCI to Earnings | | Recognized in Earnings (Ineffective Portion) | |
| Foreign exchange contracts | | | | | | | | |
| Machinery, Energy & Transportation | $ | (55 | ) | | Other income (expense) | | $ | (12 | ) |
| $ | — |
| |
| Financial Products | 143 |
| | Other income (expense) | | 141 |
| | — |
| |
| Financial Products | — |
| | Interest expense of Financial Products | | 13 |
| | — |
| |
| Interest rate contracts | | | | | |
| | |
| |
| Machinery, Energy & Transportation | — |
| | Interest expense excluding Financial Products | | (2 | ) | | — |
| |
| Financial Products | 8 |
| | Interest expense of Financial Products | | 1 |
| | — |
|
|
| | $ | 96 |
| | | | $ | 141 |
| | $ | — |
| |
| | | | | | | | | |
| | Nine Months Ended September 30, 2017 | |
| | | | Recognized in Earnings | |
| | Amount of Gains (Losses) Recognized in AOCI (Effective Portion) | | Classification of Gains (Losses) | | Amount of Gains (Losses) Reclassified from AOCI to Earnings | | Recognized in Earnings (Ineffective Portion) | |
| Foreign exchange contracts | | | | | | | | |
| Machinery, Energy & Transportation | $ | 72 |
| | Other income (expense) | | $ | (49 | ) |
| $ | — |
| |
| Financial Products | (62 | ) | | Other income (expense) | | (69 | ) | | — |
| |
| Interest rate contracts | |
| | | | |
| | |
| |
| Machinery, Energy & Transportation | — |
| | Interest expense excluding Financial Products | | (5 | ) | | — |
| |
| Financial Products | (1 | ) | | Interest expense of Financial Products | | 5 |
| | — |
|
|
| | $ | 9 |
| | | | $ | (118 | ) | | $ | — |
| |
| | | | | | | | | |
The effect of derivatives not designated as hedging instruments on the Consolidated Statement of Results of Operations is as follows:
| | | | | | |
| | | | | |
| | |
(Millions of dollars) | Classification of Gains (Losses) | | Three Months Ended
March 31, 2018 | | Three Months Ended
March 31, 2017 | Classification of Gains (Losses) | | Three Months Ended September 30, 2018 | | Three Months Ended September 30, 2017 |
| Foreign exchange contracts | | | | | | | | | | |
| Machinery, Energy & Transportation | Other income (expense) | | $ | 16 |
| | $ | 13 |
| Other income (expense) | | $ | (5 | ) | | $ | 15 |
|
| Financial Products | Other income (expense) | | (7 | ) | | (7 | ) | Other income (expense) | | 13 |
| | 11 |
|
| Commodity contracts | | | |
| | | | | |
| | |
| Machinery, Energy & Transportation | Other income (expense) | | (9 | ) | | 1 |
| Other income (expense) | | (5 | ) | | 11 |
|
| | | | $ | — |
| | $ | 7 |
| | | $ | 3 |
| | $ | 37 |
|
| | | | | | | | | |
| | | Classification of Gains (Losses) | | Nine Months Ended September 30, 2018 | | Nine Months Ended September 30, 2017 |
| Foreign exchange contracts | | | | | | |
| Machinery, Energy & Transportation | | Other income (expense) | | $ | (43 | ) | | $ | 67 |
|
| Financial Products | | Other income (expense) | | 29 |
| | 21 |
|
| Commodity contracts | | | | | | |
| Machinery, Energy & Transportation | | Other income (expense) | | (5 | ) | | 12 |
|
| | | | | $ | (19 | ) | | $ | 100 |
|
| | | | | | |
We enter into International Swaps and Derivatives Association (ISDA) master netting agreements within Machinery, Energy & Transportation and Financial Products that permit the net settlement of amounts owed under their respective derivative contracts. Under these master netting agreements, net settlement generally permits the company or the counterparty to determine the net amount payable for contracts due on the same date and in the same currency for similar types of derivative transactions. The master netting agreements generally also provide for net settlement of all outstanding contracts with a counterparty in the case of an event of default or a termination event.
Collateral is generally not required of the counterparties or of our company under the master netting agreements. As of March 31,September 30, 2018 and December 31, 2017, no cash collateral was received or pledged under the master netting agreements.
The effect of the net settlement provisions of the master netting agreements on our derivative balances upon an event of default or termination event is as follows:
| | | | | | | | | | | | | | | | | | | | | | | | | | | |
| March 31, 2018 | | | | | | | | Gross Amounts Not Offset in the Statement of Financial Position | | | |
| September 30, 2018 | | | | | | | | | Gross Amounts Not Offset in the Statement of Financial Position | | |
| (Millions of dollars) | | Gross Amount of Recognized Assets | | Gross Amounts Offset in the Statement of Financial Position | | Net Amount of Assets Presented in the Statement of Financial Position | | Financial Instruments | | Cash Collateral Received | | Net Amount of Assets | | Gross Amount of Recognized Assets | | Gross Amounts Offset in the Statement of Financial Position | | Net Amount of Assets Presented in the Statement of Financial Position | | Financial Instruments | | Cash Collateral Received | | Net Amount of Assets |
| Derivatives | | | | | | | | | | | | | | | | | | | | | | | | |
| Machinery, Energy & Transportation | | $ | 65 |
| | $ | — |
| | $ | 65 |
| | $ | (9 | ) | | $ | — |
| | $ | 56 |
| | $ | 18 |
| | $ | — |
| | $ | 18 |
| | $ | (18 | ) | | $ | — |
| | $ | — |
|
| Financial Products | | 17 |
| | — |
| | 17 |
| | (4 | ) | | — |
| | 13 |
| | 140 |
| | — |
| | 140 |
| | (31 | ) | | — |
| | 109 |
|
| Total | | $ | 82 |
| | $ | — |
| | $ | 82 |
| | $ | (13 | ) | | $ | — |
| | $ | 69 |
| | $ | 158 |
| | $ | — |
| | $ | 158 |
| | $ | (49 | ) | | $ | — |
| | $ | 109 |
|
| | | March 31, 2018 | | | | | | | | Gross Amounts Not Offset in the Statement of Financial Position | | | |
| September 30, 2018 | | | | | | | | | Gross Amounts Not Offset in the Statement of Financial Position | | |
| (Millions of dollars) | | Gross Amount of Recognized Liabilities | | Gross Amounts Offset in the Statement of Financial Position | | Net Amount of Liabilities Presented in the Statement of Financial Position | | Financial Instruments | | Cash Collateral Pledged | | Net Amount of Liabilities | | Gross Amount of Recognized Liabilities | | Gross Amounts Offset in the Statement of Financial Position | | Net Amount of Liabilities Presented in the Statement of Financial Position | | Financial Instruments | | Cash Collateral Pledged | | Net Amount of Liabilities |
| Derivatives | | | | | | | | | | | | | | | | | | | | | | | | |
| Machinery, Energy & Transportation | | $ | (10 | ) | | $ | — |
| | $ | (10 | ) | | $ | 9 |
| | $ | — |
| | $ | (1 | ) | | $ | (97 | ) | | $ | — |
| | $ | (97 | ) | | $ | 18 |
| | $ | — |
| | $ | (79 | ) |
| Financial Products | | (116 | ) | | — |
| | (116 | ) | | 4 |
| | — |
| | (112 | ) | | (39 | ) | | — |
| | (39 | ) | | 31 |
| | — |
| | (8 | ) |
| Total | | $ | (126 | ) | | $ | — |
| | $ | (126 | ) | | $ | 13 |
| | $ | — |
| | $ | (113 | ) | | $ | (136 | ) | | $ | — |
| | $ | (136 | ) | | $ | 49 |
| | $ | — |
| | $ | (87 | ) |
|
| | | | | | | | | | | | | | | | | | | | | | | | |
| December 31, 2017 | | | | | | | | Gross Amounts Not Offset in the Statement of Financial Position | | |
| (Millions of dollars) | | Gross Amount of Recognized Assets | | Gross Amounts Offset in the Statement of Financial Position | | Net Amount of Assets Presented in the Statement of Financial Position | | Financial Instruments | | Cash Collateral Received | | Net Amount of Assets |
| Derivatives | | | | | | | | | | | | |
| Machinery, Energy & Transportation | | $ | 52 |
| | $ | — |
| | $ | 52 |
| | $ | (22 | ) | | $ | — |
| | $ | 30 |
|
| Financial Products | | 22 |
| | — |
| | 22 |
| | (10 | ) | | — |
| | 12 |
|
| Total | | $ | 74 |
| | $ | — |
| | $ | 74 |
| | $ | (32 | ) | | $ | — |
| | $ | 42 |
|
|
| | | | | | | | | | | | | | | | | | | | | | | | |
| December 31, 2017 | | | | | | | | Gross Amounts Not Offset in the Statement of Financial Position | | |
| (Millions of dollars) | | Gross Amount of Recognized Liabilities | | Gross Amounts Offset in the Statement of Financial Position | | Net Amount of Liabilities Presented in the Statement of Financial Position | | Financial Instruments | | Cash Collateral Pledged | | Net Amount of Liabilities |
| Derivatives | | | | | | | | | | | | |
| Machinery, Energy & Transportation | | $ | (25 | ) | | $ | — |
| | $ | (25 | ) | | $ | 22 |
| | $ | — |
| | $ | (3 | ) |
| Financial Products | | (68 | ) | | — |
| | (68 | ) | | 10 |
| | — |
| | (58 | ) |
| Total | | $ | (93 | ) | | $ | — |
| | $ | (93 | ) | | $ | 32 |
| | $ | — |
| | $ | (61 | ) |
| | | | | | | | | | | | | |
6. Inventories
Inventories (principally using the last-in, first-out (LIFO) method) are comprised of the following:
| | | | | | | | | |
| (Millions of dollars) | March 31,
2018 | | December 31,
2017 | September 30,
2018 | | December 31,
2017 |
| Raw materials | $ | 3,179 |
| | $ | 2,802 |
| $ | 3,413 |
| | $ | 2,802 |
|
| Work-in-process | 2,465 |
| | 2,254 |
| 2,764 |
| | 2,254 |
|
| Finished goods | 5,114 |
| | 4,761 |
| 5,425 |
| | 4,761 |
|
| Supplies | 189 |
| | 201 |
| 212 |
| | 201 |
|
| Total inventories | $ | 10,947 |
| | $ | 10,018 |
| $ | 11,814 |
| | $ | 10,018 |
|
| | | | | | | |
During the first nine months of 2017, there was a liquidation of LIFO inventory resulting from closure of our facility in Gosselies, Belgium. The liquidated inventory was carried at lower costs prevailing in prior years as compared with current costs. The effect of this reduction of inventory decreased Cost of goods sold by approximately $62 million and increased Profit by approximately $45 million or $0.07 per share.
7. Intangible assets and goodwill
A. Intangible assets
Intangible assets are comprised of the following:
| | | | | | | | | | | | | | | |
| | | | March 31, 2018 | | | September 30, 2018 |
| (Millions of dollars) | Weighted Amortizable Life (Years) | | Gross Carrying Amount | | Accumulated Amortization | | Net | Weighted Amortizable Life (Years) | | Gross Carrying Amount | | Accumulated Amortization | | Net |
| Customer relationships | 15 | | $ | 2,527 |
| | $ | (1,159 | ) | | $ | 1,368 |
| 15 | | $ | 2,462 |
| | $ | (1,212 | ) | | $ | 1,250 |
|
| Intellectual property | 11 | | 1,569 |
| | (878 | ) | | 691 |
| 12 | | 1,562 |
| | (933 | ) | | 629 |
|
| Other | 13 | | 197 |
| | (93 | ) | | 104 |
| 13 | | 198 |
| | (101 | ) | | 97 |
|
| Total finite-lived intangible assets | 14 | | $ | 4,293 |
| | $ | (2,130 | ) | | $ | 2,163 |
| 14 | | $ | 4,222 |
| | $ | (2,246 | ) | | $ | 1,976 |
|
|
| | | | | | | | | | | | | |
| | | | December 31, 2017 |
| | Weighted Amortizable Life (Years) | | Gross Carrying Amount | | Accumulated Amortization | | Net |
| Customer relationships | 15 | | $ | 2,441 |
| | $ | (1,122 | ) | | $ | 1,319 |
|
| Intellectual property | 11 | | 1,538 |
| | (851 | ) | | 687 |
|
| Other | 13 | | 198 |
| | (93 | ) | | 105 |
|
| Total finite-lived intangible assets | 14 | | $ | 4,177 |
| | $ | (2,066 | ) | | $ | 2,111 |
|
| | | | | | | | |
During the first quarter of 2018, we acquired finite-lived intangible assets of $112 million and $5 million due to the purchase of ECM S.p.A. and Downer Freight Rail, respectively. See Note 20 for details on these acquisitions.
Amortization expense for the three and nine months ended March 31,September 30, 2018 was $82 million and $248 million, respectively. Amortization expense for the three and nine months ended September 30, 2017 was $83$82 million and $79$241 million, respectively. Amortization expense related to intangible assets is expected to be:
|
| | | | | | | | | | |
| (Millions of dollars) |
| | | | | | | | | | | |
| Remaining Nine Months of 2018 | | 2019 | | 2020 | | 2021 | | 2022 | | Thereafter |
| $251 | | $328 | | $317 | | $299 | | $279 | | $689 |
| | | | | | | | | | | |
|
| | | | | | | | | | |
| (Millions of dollars) |
| | | | | | | | | | | |
| Remaining Three Months of 2018 | | 2019 | | 2020 | | 2021 | | 2022 | | Thereafter |
| $84 | | $326 | | $311 | | $293 | | $274 | | $688 |
| | | | | | | | | | | |
B. Goodwill
No goodwill was impaired during the threenine months ended March 31,September 30, 2018 or 2017.
During the first quarter of 2018, we acquired net assets with related goodwill of $124$121 million in the Energy & Transportation segment. We recorded goodwill of $112$109 million related to the acquisition of ECM S.p.A. and $12 million related to the acquisition of Downer Freight Rail. See Note 20 for details on these acquisitions.
The changes in carrying amount of goodwill by reportable segment for the threenine months ended March 31,September 30, 2018 were as follows:
| | | | | | | | | | | | | | | | | | | |
| (Millions of dollars) | | December 31,
2017 | | Acquisitions 1 | | Other Adjustments 2 | | March 31,
2018 | | December 31,
2017 | | Acquisitions 1 | | Other Adjustments 2 | | September 30,
2018 |
| Construction Industries | | | | | | | |
|
| | | | | | | |
|
|
| Goodwill | | $ | 305 |
| | $ | — |
| | $ | 8 |
| | $ | 313 |
| | $ | 305 |
| | $ | — |
| | $ | — |
| | $ | 305 |
|
| Impairments | | (22 | ) | | — |
| | — |
| | (22 | ) | | (22 | ) | | — |
| | — |
| | (22 | ) |
| Net goodwill | | 283 |
| | — |
| | 8 |
| | 291 |
| | 283 |
| | — |
| | — |
| | 283 |
|
| Resource Industries | | | | | | | | | | | | | | | | |
| Goodwill | | 4,232 |
| | — |
| | 24 |
| | 4,256 |
| | 4,232 |
| | — |
| | (46 | ) | | 4,186 |
|
| Impairments | | (1,175 | ) | | — |
| | — |
| | (1,175 | ) | | (1,175 | ) | | — |
| | — |
| | (1,175 | ) |
| Net goodwill | | 3,057 |
| | — |
| | 24 |
| | 3,081 |
| | 3,057 |
| | — |
| | (46 | ) | | 3,011 |
|
| Energy & Transportation | | | | | | | | | | | | | | | | |
| Goodwill | | 2,806 |
| | 124 |
| | 16 |
| | 2,946 |
| | 2,806 |
| | 121 |
| | (44 | ) | | 2,883 |
|
All Other 3 | | | | | | | | | | | | | | | | |
| Goodwill | | 54 |
| | — |
| | 4 |
| | 58 |
| | 54 |
| | — |
| | 2 |
| | 56 |
|
| Consolidated total | | | | | | | | | | | | | | | | |
| Goodwill | | 7,397 |
| | 124 |
| | 52 |
| | 7,573 |
| | 7,397 |
| | 121 |
| | (88 | ) | | 7,430 |
|
| Impairments | | (1,197 | ) | | — |
| | — |
| | (1,197 | ) | | (1,197 | ) | | — |
| | — |
| | (1,197 | ) |
| Net goodwill | | $ | 6,200 |
| | $ | 124 |
| | $ | 52 |
| | $ | 6,376 |
| | $ | 6,200 |
| | $ | 121 |
| | $ | (88 | ) | | $ | 6,233 |
|
1 See Note 20 for additional details.
2 Other adjustments are comprised primarily of foreign currency translation.
3 Includes All Other operating segments (See Note 15).
8. Investments in debt and equity securities
We have investments in certain debt and equity securities, primarily at Insurance Services, which are recorded at fair value and are primarily included in Other assets in the Consolidated Statement of Financial Position.
Debt securities have been classified as available-for-sale and the unrealized gains and losses arising from the revaluation of these debt securities are included, net of applicable deferred income taxes, in equity (Accumulated other comprehensive income (loss) in the Consolidated Statement of Financial Position). Realized gains and losses on sales of debt investments are generally determined using the specific identification method and are included in Other income (expense) in the Consolidated Statement of Results of Operations.
Beginning January 1, 2018, we adopted new accounting guidance issued by the FASB resulting in the unrealized gains and losses arising from the revaluation of these equity securities to be included in Other income (expense) in the Consolidated Statement of Results of Operations. Prior to January 1, 2018, the unrealized gains and losses arising from revaluation of the available-for-sale equity securities and the Real Estate Investment Trust were included, net of applicable deferred income taxes, in equity (Accumulated other comprehensive income (loss) in the Consolidated Statement of Financial Position). See Note 2 for additional information.
The cost basis and fair value of debt and equity securities with unrealized gains and losses included in equity (Accumulated other comprehensive income (loss) in the Consolidated Statement of Financial Position) were as follows: |
| | | | | | | | | | | | | | | | | | | | | | | |
| | March 31, 2018 | | December 31, 2017 |
| (Millions of dollars) | Cost Basis | | Unrealized Pretax Net Gains (Losses) | | Fair Value | | Cost Basis | | Unrealized Pretax Net Gains (Losses) | | Fair Value |
| Government debt | | | | | | | | | | | |
| U.S. treasury bonds | $ | 13 |
| | $ | — |
| | $ | 13 |
| | $ | 10 |
| | $ | — |
| | $ | 10 |
|
| Other U.S. and non-U.S. government bonds | 51 |
| | — |
| | 51 |
| | 42 |
| | — |
| | 42 |
|
| | | | | | | | | | | | |
| Corporate bonds | |
| | |
| | | | |
| | |
| | |
|
| Corporate bonds | 649 |
| | (9 | ) | | 640 |
| | 585 |
| | (1 | ) | | 584 |
|
| Asset-backed securities | 63 |
| | — |
| | 63 |
| | 67 |
| | — |
| | 67 |
|
| | | | | | | | | | | | |
| Mortgage-backed debt securities | | | | | | | |
| | |
| | |
|
| U.S. governmental agency | 292 |
| | (7 | ) | | 285 |
| | 265 |
| | (4 | ) | | 261 |
|
| Residential | 8 |
| | — |
| | 8 |
| | 8 |
| | — |
| | 8 |
|
| Commercial | 17 |
| | (1 | ) | | 16 |
| | 17 |
| | — |
| | 17 |
|
| Total debt securities | $ | 1,093 |
| | $ | (17 | ) | | $ | 1,076 |
| | $ | 994 |
| | $ | (5 | ) | | $ | 989 |
|
| | | | | | | | | | | | |
Equity securities1 | | | | | | | |
| | |
| | |
|
| Large capitalization value | | | | | | | 287 |
| | (3 | ) | | 284 |
|
| Real estate investment trust (REIT) | | | | | | | 104 |
| | 6 |
| | 110 |
|
| Smaller company growth | | | | | | | 40 |
| | 16 |
| | 56 |
|
| Total equity securities | | | | | | | $ | 431 |
| | $ | 19 |
| | $ | 450 |
|
| | | | | | | | | | | | |
1 Beginning January 1, 2018, the unrealized gains and losses arising from the revaluation of the equity securities are included in Other income (expense) in the Consolidated Statement of Results of Operations. See Note 2 for additional information. |
| | | | | | | | | | | | |
|
| | | | | | | | | | | | | | | | | | | | | | | |
| Available-for-sale investments in an unrealized loss position that are not other-than-temporarily impaired: |
| | |
| | March 31, 2018 |
| | Less than 12 months 1 | | 12 months or more 1 | | Total |
| (Millions of dollars) | Fair Value | | Unrealized Losses | | Fair Value | | Unrealized Losses | | Fair Value | | Unrealized Losses |
| Corporate bonds | | | | | | | | | | | |
| Corporate bonds | $ | 501 |
| | $ | 9 |
| | $ | 35 |
| | $ | 1 |
| | $ | 536 |
| | $ | 10 |
|
| Mortgage-backed debt securities | | | | | | | | | | | |
| U.S. governmental agency | 160 |
| | 3 |
| | 103 |
| | 4 |
| | 263 |
| | 7 |
|
| Total | $ | 661 |
| | $ | 12 |
| | $ | 138 |
| | $ | 5 |
| | $ | 799 |
| | $ | 17 |
|
|
| | | | | | | | | | | | | | | | | | | | | | | |
| | September 30, 2018 | | December 31, 2017 |
| (Millions of dollars) | Cost Basis | | Unrealized Pretax Net Gains (Losses) | | Fair Value | | Cost Basis | | Unrealized Pretax Net Gains (Losses) | | Fair Value |
| Government debt | | | | | | | | | | | |
| U.S. treasury bonds | $ | 9 |
| | $ | — |
| | $ | 9 |
| | $ | 10 |
| | $ | — |
| | $ | 10 |
|
| Other U.S. and non-U.S. government bonds | 48 |
| | — |
| | 48 |
| | 42 |
| | — |
| | 42 |
|
| | | | | | | | | | | | |
| Corporate bonds | |
| | |
| | | | |
| | |
| | |
|
| Corporate bonds | 721 |
| | (11 | ) | | 710 |
| | 585 |
| | (1 | ) | | 584 |
|
| Asset-backed securities | 61 |
| | — |
| | 61 |
| | 67 |
| | — |
| | 67 |
|
| | | | | | | | | | | | |
| Mortgage-backed debt securities | | | | | | | |
| | |
| | |
|
| U.S. governmental agency | 300 |
| | (10 | ) | | 290 |
| | 265 |
| | (4 | ) | | 261 |
|
| Residential | 7 |
| | — |
| | 7 |
| | 8 |
| | — |
| | 8 |
|
| Commercial | 15 |
| | (1 | ) | | 14 |
| | 17 |
| | — |
| | 17 |
|
| Total debt securities | $ | 1,161 |
| | $ | (22 | ) | | $ | 1,139 |
| | $ | 994 |
| | $ | (5 | ) | | $ | 989 |
|
| | | | | | | | | | | | |
Equity securities1 | | | | | | | |
| | |
| | |
|
| Large capitalization value | | | | | | | 287 |
| | (3 | ) | | 284 |
|
| Real estate investment trust (REIT) | | | | | | | 104 |
| | 6 |
| | 110 |
|
| Smaller company growth | | | | | | | 40 |
| | 16 |
| | 56 |
|
| Total equity securities | | | | | | | $ | 431 |
| | $ | 19 |
| | $ | 450 |
|
| | | | | | | | | | | | |
1 Beginning January 1, 2018, the unrealized gains and losses arising from the revaluation of the equity securities are included in Other income (expense) in the Consolidated Statement of Results of Operations. See Note 2 for additional information. |
| | | | | | | | | | | | |
|
| | | | | | | | | | | | | | | | | | | | | | | |
| Available-for-sale investments in an unrealized loss position that are not other-than-temporarily impaired: |
| | |
| | September 30, 2018 |
| | Less than 12 months 1 | | 12 months or more 1 | | Total |
| (Millions of dollars) | Fair Value | | Unrealized Losses | | Fair Value | | Unrealized Losses | | Fair Value | | Unrealized Losses |
| Corporate bonds | | | | | | | | | | | |
| Corporate bonds | $ | 498 |
| | $ | 8 |
| | $ | 93 |
| | $ | 3 |
| | $ | 591 |
| | $ | 11 |
|
| Mortgage-backed debt securities | | | | | | | | | | | |
| U.S. governmental agency | 119 |
| | 3 |
| | 163 |
| | 8 |
| | 282 |
| | 11 |
|
| Commercial | 8 |
| | — |
| | 6 |
| | 1 |
| | 14 |
| | 1 |
|
| Total | $ | 625 |
| | $ | 11 |
| | $ | 262 |
| | $ | 12 |
| | $ | 887 |
| | $ | 23 |
|
|
| | | | | | | | | | | | | | | | | | | | | | | |
| | December 31, 2017 |
| | Less than 12 months 1 | | 12 months or more 1 | | Total |
| (Millions of dollars) | Fair Value | | Unrealized Losses | | Fair Value | | Unrealized Losses | | Fair Value | | Unrealized Losses |
| Corporate bonds | | | | | | | | | | | |
| Corporate bonds | $ | 312 |
| | $ | 2 |
| | $ | 38 |
| | $ | — |
| | $ | 350 |
| | $ | 2 |
|
| Mortgage-backed debt securities | |
| | |
| | |
| | |
| | |
| | |
|
| U.S. governmental agency | 129 |
| | 1 |
| | 110 |
| | 3 |
| | 239 |
| | 4 |
|
| Equity securities | |
| | |
| | |
| | |
| | |
| | |
|
| Large capitalization value | 129 |
| | 5 |
| | 14 |
| | 2 |
| | 143 |
| | 7 |
|
| Smaller company growth | 17 |
| | 1 |
| | 1 |
| | — |
| | 18 |
| | 1 |
|
| Total | $ | 587 |
| | $ | 9 |
| | $ | 163 |
| | $ | 5 |
| | $ | 750 |
| | $ | 14 |
|
| | | | | | | | | | | | |
1 Indicates the length of time that individual securities have been in a continuous unrealized loss position. |
| | | | | | | | | | | | |
Corporate Bonds. The unrealized losses on our investments in corporate bonds relate to changes in interest rates and credit-related yield spreads since time of purchase. We do not intend to sell the investments, and it is not likely that we will be required to sell the investments before recovery of their amortized cost basis. We do not consider these investments to be other-than-temporarily impaired as of March 31,September 30, 2018.
Mortgage-Backed Debt Securities. The unrealized losses on our investments in U.S. government agency mortgage-backed securities and commercial mortgage-backed securities relate to changes in interest rates and credit-related yield spreads since time of purchase. We do not intend to sell the investments, and it is not likely that we will be required to sell the investments before recovery of their amortized cost basis. We do not consider these investments to be other-than-temporarily impaired as of March 31,September 30, 2018.
The cost basis and fair value of the available-for-sale debt securities at
March 31,September 30, 2018, by contractual maturity, is shown below. Expected maturities will differ from contractual maturities because borrowers may have the right to prepay and creditors may have the right to call obligations.
|
| | | | | | | |
| | March 31, 2018 |
| (Millions of dollars) | Cost Basis | | Fair Value |
| Due in one year or less | $ | 127 |
| | $ | 127 |
|
| Due after one year through five years | 513 |
| | 506 |
|
| Due after five years through ten years | 117 |
| | 115 |
|
| Due after ten years | 19 |
| | 19 |
|
| U.S. governmental agency mortgage-backed securities | 292 |
| | 285 |
|
| Residential mortgage-backed securities | 8 |
| | 8 |
|
| Commercial mortgage-backed securities | 17 |
| | 16 |
|
| Total debt securities – available-for-sale | $ | 1,093 |
| | $ | 1,076 |
|
| | | | |
|
|
| | | | | | | |
| Sales of available-for-sale securities: | |
| | Three Months Ended
March 31 |
| (Millions of dollars) | 20181 | | 2017 |
| Proceeds from the sale of available-for-sale securities | $ | 73 |
| | $ | 89 |
|
| Gross gains from the sale of available-for-sale securities | $ | — |
| | $ | 1 |
|
| Gross losses from the sale of available-for-sale securities | $ | — |
| | $ | 1 |
|
| | | | |
1 Beginning January 1, 2018, equity securities are no longer classified as available-for-sale securities. See Note 2 for additional information. |
| | | | |
|
| | | | | | | |
| | September 30, 2018 |
| (Millions of dollars) | Cost Basis | | Fair Value |
| Due in one year or less | $ | 160 |
| | $ | 159 |
|
| Due after one year through five years | 540 |
| | 531 |
|
| Due after five years through ten years | 122 |
| | 120 |
|
| Due after ten years | 17 |
| | 18 |
|
| U.S. governmental agency mortgage-backed securities | 300 |
| | 290 |
|
| Residential mortgage-backed securities | 7 |
| | 7 |
|
| Commercial mortgage-backed securities | 15 |
| | 14 |
|
| Total debt securities – available-for-sale | $ | 1,161 |
| | $ | 1,139 |
|
| | | | |
|
|
| | | | | | | | | | | | | | | |
| Sales of available-for-sale securities: | | | |
| | Three Months Ended
September 30 | | Nine Months Ended
September 30 |
| (Millions of dollars) | 20181 | | 2017 | | 20181 | | 2017 |
| Proceeds from the sale of available-for-sale securities | $ | 41 |
| | $ | 244 |
| | $ | 181 |
| | $ | 431 |
|
| Gross gains from the sale of available-for-sale securities | $ | — |
| | $ | 38 |
| | $ | — |
| | $ | 40 |
|
| Gross losses from the sale of available-for-sale securities | $ | — |
| | $ | 1 |
| | $ | — |
| | $ | 3 |
|
| | | | | | | | |
1 Beginning January 1, 2018, equity securities are no longer classified as available-for-sale securities. See Note 2 for additional information. |
| | | | | | | | |
For the three and nine months ended March 31,September 30, 2018, the net unrealized lossesgains (losses) for equity securities with a readily determinable fair value were $2$10 million and $14 million, respectively. For the three and nine months ended September 30, 2018, there were no$4 million of realized net gains (losses) recognized on the sale of equity securities with a readily determinable fair value.securities. 9. Postretirement benefits
A. Pension and postretirement benefit costs
In the first quarter of 2017, we announced the closure of our Gosselies, Belgium, facility. This announcement impacted certain employees that participated in a defined benefit pension plan and resulted in a net loss of $20 million in the first quarter of 2017 for curtailment and termination benefits. In addition during the first quarter of 2017, we announced the decision to phase out production at our Aurora, Illinois, facility, which resulted in termination benefits of $9 million for certain hourly employees that participate in our U.S. hourly defined benefit pension plan.
See Note 19 for more information on the Gosselies closure.
| | | | U.S. Pension Benefits | | Non-U.S. Pension Benefits | | Other Postretirement Benefits | U.S. Pension Benefits | | Non-U.S. Pension Benefits | | Other Postretirement Benefits |
(Millions of dollars)
| March 31 | | March 31 | | March 31 | September 30 | | September 30 | | September 30 |
| | 2018 | | 2017 | | 2018 | | 2017 | | 2018 | | 2017 | 2018 | | 2017 | | 2018 | | 2017 | | 2018 | | 2017 |
| For the three months ended: | | | | | | | | | | | | | | | | | | | | | | |
| Components of net periodic benefit cost: | | | | | | | | | | | | |
| Service cost | | $ | 31 |
| | $ | 29 |
| | $ | 22 |
| | $ | 23 |
| | $ | 22 |
| | $ | 19 |
|
| Interest cost | | 134 |
| | 131 |
| | 25 |
| | 23 |
| | 31 |
| | 33 |
|
| Expected return on plan assets | | (202 | ) | | (184 | ) | | (55 | ) | | (55 | ) | | (9 | ) | | (10 | ) |
Amortization of prior service cost (credit) 1 | | — |
| | — |
| | — |
| | — |
| | (9 | ) | | (6 | ) |
Net periodic benefit cost (benefit) 2 | | $ | (37 | ) | | $ | (24 | ) | | $ | (8 | ) | | $ | (9 | ) | | $ | 35 |
| | $ | 36 |
|
| | | | | | | | | | | | | |
| For the nine months ended: | | | | | | | | | | | | |
| Components of net periodic benefit cost: | | | | | | | | | | | | | | | | | | | | | | |
| Service cost | $ | 32 |
| | $ | 29 |
| | $ | 22 |
| | $ | 23 |
| | $ | 21 |
| | $ | 19 |
| $ | 94 |
| | $ | 87 |
| | $ | 67 |
| | $ | 70 |
| | $ | 64 |
| | $ | 58 |
|
| Interest cost | 133 |
| | 131 |
| | 25 |
| | 25 |
| | 31 |
| | 33 |
| 401 |
| | 393 |
| | 74 |
| | 73 |
| | 93 |
| | 98 |
|
| Expected return on plan assets | (202 | ) | | (184 | ) | | (56 | ) | | (57 | ) | | (8 | ) | | (9 | ) | (607 | ) | | (551 | ) | | (167 | ) | | (168 | ) | | (25 | ) | | (28 | ) |
Amortization of prior service cost (credit) 1 | — |
| | — |
| | — |
| | — |
| | (9 | ) | | (5 | ) | — |
| | — |
| | — |
| | (1 | ) | | (26 | ) | | (17 | ) |
| Curtailments and termination benefits | — |
| | 9 |
| | — |
| | 20 |
| | — |
| | — |
| — |
| | 9 |
| | — |
| | 20 |
| | — |
| | — |
|
Net periodic benefit cost (benefit) 2 | $ | (37 | ) | | $ | (15 | ) | | $ | (9 | ) | | $ | 11 |
| | $ | 35 |
| | $ | 38 |
| $ | (112 | ) | | $ | (62 | ) | | $ | (26 | ) | | $ | (6 | ) | | $ | 106 |
| | $ | 111 |
|
| |
| |
| |
| |
| | | | |
| |
| |
| |
| | | | |
| Weighted-average assumptions used to determine net cost: | Weighted-average assumptions used to determine net cost: | | | | | | | | | | | Weighted-average assumptions used to determine net cost: | | | | | | | | | | |
| Discount rate used to measure service cost | 3.7 | % | | 4.2 | % | | 2.3 | % | | 2.3 | % | | 3.5 | % | | 3.9 | % | 3.7 | % | | 4.2 | % | | 2.3 | % | | 2.3 | % | | 3.5 | % | | 3.9 | % |
| Discount rate used to measure interest cost | 3.2 | % | | 3.3 | % | | 2.2 | % | | 2.3 | % | | 3.2 | % | | 3.3 | % | 3.2 | % | | 3.3 | % | | 2.2 | % | | 2.3 | % | | 3.2 | % | | 3.3 | % |
| Expected rate of return on plan assets | 6.3 | % | | 6.7 | % | | 5.2 | % | | 5.9 | % | | 7.5 | % | | 7.5 | % | 6.3 | % | | 6.7 | % | | 5.2 | % | | 5.9 | % | | 7.5 | % | | 7.5 | % |
| Rate of compensation increase | 4.0 | % | | 4.0 | % | | 4.0 | % | | 4.0 | % | | 4.6 | % | | 4.0 | % | 4.0 | % | | 4.0 | % | | 4.0 | % | | 4.0 | % | | 4.6 | % | | 4.0 | % |
| | | | | | | | | | | | | | | | | | | | | | | |
| |
1 | Prior service cost (credit) for both pension and other postretirement benefits is generally amortized using the straight-line method over the average remaining service period of active employees expected to receive benefits from the plan. For pension plans in which all or almost all of the plan's participants are inactive and other postretirement benefit plans in which all or almost all of the plan's participants are fully eligible for benefits under the plan, prior service cost (credit) is amortized using the straight-line method over the remaining life expectancy of those participants. |
| |
2 | The service cost component of net periodic pension and other postretirement benefits cost (benefit) is included in Operating costs in the Consolidated Statement of Results of Operations. All other components of net periodic pension and other postretirement benefits cost (benefit) are included in Other income (expense) in the Consolidated Statement of Results of Operations. |
We made $152$1,064 million and $1,291 million of contributions to our pension and other postretirement plans during the three and nine months ended March 31,September 30, 2018., respectively. The 2018 contributions include a $1.0 billion discretionary contribution made to our U.S. pension plans in September 2018. We currently anticipate full-year 2018 contributions of approximately $365$1,362 million. We made $106$324 million and $522 million of contributions to our pension and other postretirement plans during the three and nine months ended March 31,September 30, 2017., respectively.
B. Defined contribution benefit costs
Total company costs related to our defined contribution plans were as follows:
| | | | | | | | | | | | | |
| | Three Months Ended
March 31 | Three Months Ended
September 30 | | Nine Months Ended
September 30 |
| (Millions of dollars) | 2018 | | 2017 | 2018 | | 2017 | | 2018 | | 2017 |
| U.S. Plans | $ | 73 |
| | $ | 80 |
| $ | 97 |
| | $ | 97 |
| | $ | 247 |
| | $ | 267 |
|
| Non-U.S. Plans | 22 |
| | 16 |
| 21 |
| | 19 |
| | 64 |
| | 54 |
|
| | $ | 95 |
| | $ | 96 |
| $ | 118 |
| | $ | 116 |
| | $ | 311 |
| | $ | 321 |
|
| | | | | | | | | | | |
10. Guarantees and product warranty
Caterpillar dealer performance guarantees
We have provided an indemnity to a third-party insurance company for potential losses related to performance bonds issued on behalf of Caterpillar dealers. The bonds have varying terms and are issued to insure governmental agencies against nonperformance by certain dealers. We also provided guarantees to third-parties related to the performance of contractual obligations by certain Caterpillar dealers. These guarantees have varying terms and cover potential financial losses incurred by the third-parties resulting from the dealers’ nonperformance.
In 2016, we provided a guarantee to an end user related to the performance of contractual obligations by a Caterpillar dealer. Under the guarantee, which expires in 2025, non-performance by the Caterpillar dealer could require Caterpillar to satisfy the contractual obligations by providing goods, services or financial compensation to the end user up to an annual designated cap.
Customer loan guarantees
We provide loan guarantees to third-party lenders for financing associated with machinery purchased by customers. These guarantees have varying terms and are secured by the machinery. In addition, Cat Financial participates in standby letters of credit issued to third parties on behalf of their customers. These standby letters of credit have varying terms and beneficiaries and are secured by customer assets.
Supplier consortium performance guarantees
We have provided guarantees to a customer in Brazil and a customer in Europe related to the performance of contractual obligations by supplier consortiums to which our Caterpillar subsidiaries are members. The guarantees cover potential damages incurred by the customers resulting from the supplier consortiums' non-performance. The damages are capped except for failure of the consortiums to meet certain obligations outlined in the contract in the normal course of business. The guarantees will expire when the supplier consortiums perform all their contractual obligations, which are expected to be completed in 2022 for the customer in Europe and 2025 for the customer in Brazil.
Third party logistics business lease guarantees
We have provided guarantees to third-party lessors for certain properties leased by a third party logistics business, formerly Caterpillar Logistics Services LCC, in which we sold our equity interest in 2015. The guarantees are for the possibility that the third party logistics business would default on real estate lease payments. The guarantees were granted at lease inception and generally will expire at the end of the lease terms.
We have dealer performance guarantees and third party performance guarantees that do not limit potential payment to end users related to indemnities and other commercial contractual obligations. In addition, we have entered into contracts involving industry standard indemnifications that do not limit potential payment. For these unlimited guarantees, we are unable to estimate a maximum potential amount of future payments that could result from claims made.
No significant loss has been experienced or is anticipated under any of these guarantees. At both March 31,September 30, 2018 and December 31, 2017, the related liability was $8 million. The maximum potential amount of future payments (undiscounted and without reduction for any amounts that may possibly be recovered under recourse or collateralized provisions) we could be required to make under the guarantees are as follows:
| | | (Millions of dollars) | March 31,
2018 | | December 31,
2017 | September 30,
2018 | | December 31,
2017 |
| Caterpillar dealer performance guarantees | $ | 1,341 |
| | $ | 1,313 |
| $ | 1,375 |
| | $ | 1,313 |
|
| Customer loan guarantees | 27 |
| | 40 |
| 31 |
| | 40 |
|
| Supplier consortium performance guarantees | 574 |
| | 565 |
| 556 |
| | 565 |
|
| Third party logistics business lease guarantees | 69 |
| | 69 |
| 68 |
| | 69 |
|
| Other guarantees | 123 |
| | 118 |
| 122 |
| | 118 |
|
| Total guarantees | $ | 2,134 |
| | $ | 2,105 |
| $ | 2,152 |
| | $ | 2,105 |
|
| | | | | | | |
Cat Financial provides guarantees to repurchase certain loans of Caterpillar dealers from a special-purpose corporation (SPC) that qualifies as a variable interest entity. The purpose of the SPC is to provide short-term working capital loans
to Caterpillar dealers. This SPC issues commercial paper and uses the proceeds to fund its loan program. Cat Financial has a loan purchase agreement with the SPC that obligates Cat Financial to purchase certain loans that are not paid at maturity. Cat Financial receives a fee for providing this guarantee, which provides a source of liquidity for the SPC. Cat Financial is the primary beneficiary of the SPC as its guarantees result in Cat Financial having both the power to direct the activities that most significantly impact the SPC’s economic performance and the obligation to absorb losses, and therefore Cat Financial has consolidated the financial statements of the SPC. As of March 31,September 30, 2018 and December 31, 2017, the SPC’s assets of $1,084$1,133 million and $1,107 million, respectively, were primarily comprised of loans to dealers, and the SPC’s liabilities of $1,083$1,133 million and $1,106 million, respectively, were primarily comprised of commercial paper. The assets of the SPC are not available to pay Cat Financial's creditors. Cat Financial may be obligated to perform under the guarantee if the SPC experiences losses. No loss has been experienced or is anticipated under this loan purchase agreement.
Our product warranty liability is determined by applying historical claim rate experience to the current field population and dealer inventory. Generally, historical claim rates are based on actual warranty experience for each product by machine model/engine size by customer or dealer location (inside or outside North America). Specific rates are developed for each product shipment month and are updated monthly based on actual warranty claim experience.
| | | (Millions of dollars) | 2018 | 2018 |
| Warranty liability, January 1 | $ | 1,419 |
| $ | 1,419 |
|
| Reduction in liability (payments) | (175 | ) | (561 | ) |
| Increase in liability (new warranties) | 174 |
| 556 |
|
| Warranty liability, March 31 | $ | 1,418 |
| |
| Warranty liability, September 30 | | $ | 1,414 |
|
| | |
| |
|
|
| | | |
| (Millions of dollars) | 2017 |
| Warranty liability, January 1 | $ | 1,258 |
|
| Reduction in liability (payments) | (860 | ) |
| Increase in liability (new warranties) | 1,021 |
|
| Warranty liability, December 31 | $ | 1,419 |
|
| | |
|
11. Profit per share
| | | | | | | | | | | | | | | |
| Computations of profit per share: | Computations of profit per share: | Three Months Ended
March 31 | Computations of profit per share: | Three Months Ended
September 30 | | Nine Months Ended
September 30 |
| (Dollars in millions except per share data) | (Dollars in millions except per share data) | 2018 | | 2017 | (Dollars in millions except per share data) | 2018 | | 2017 | | 2018 | | 2017 |
Profit for the period (A) 1 | Profit for the period (A) 1 | $ | 1,665 |
| | $ | 192 |
| Profit for the period (A) 1 | $ | 1,727 |
| | $ | 1,059 |
| | $ | 5,099 |
| | $ | 2,053 |
|
| Determination of shares (in millions): | Determination of shares (in millions): | | | |
| Determination of shares (in millions): | | | |
| | | | |
| Weighted-average number of common shares outstanding (B) | Weighted-average number of common shares outstanding (B) | 598.0 |
| | 587.5 |
| Weighted-average number of common shares outstanding (B) | 592.1 |
| | 592.9 |
| | 595.3 |
| | 590.3 |
|
| Shares issuable on exercise of stock awards, net of shares assumed to be purchased out of proceeds at average market price | Shares issuable on exercise of stock awards, net of shares assumed to be purchased out of proceeds at average market price | 10.0 |
| | 5.7 |
| Shares issuable on exercise of stock awards, net of shares assumed to be purchased out of proceeds at average market price | 7.3 |
| | 7.2 |
| | 8.5 |
| | 6.2 |
|
Average common shares outstanding for fully diluted computation (C) 2 | Average common shares outstanding for fully diluted computation (C) 2 | 608.0 |
| | 593.2 |
| Average common shares outstanding for fully diluted computation (C) 2 | 599.4 |
| | 600.1 |
| | 603.8 |
| | 596.5 |
|
| Profit per share of common stock: | Profit per share of common stock: | |
| | |
| Profit per share of common stock: | |
| | |
| | | | |
| Assuming no dilution (A/B) | Assuming no dilution (A/B) | $ | 2.78 |
| | $ | 0.33 |
| Assuming no dilution (A/B) | $ | 2.92 |
| | $ | 1.79 |
| | $ | 8.57 |
| | $ | 3.48 |
|
Assuming full dilution (A/C) 2 | Assuming full dilution (A/C) 2 | $ | 2.74 |
| | $ | 0.32 |
| Assuming full dilution (A/C) 2 | $ | 2.88 |
| | $ | 1.77 |
| | $ | 8.45 |
| | $ | 3.44 |
|
| Shares outstanding as of March 31 (in millions) | 597.9 |
| | 589.1 |
| |
| Shares outstanding as of September 30 (in millions) | | Shares outstanding as of September 30 (in millions) | | | | | 590.1 |
|
| 594.9 |
|
| | | | | | | | | | | | | |
1 Profit attributable to common shareholders. | 1 Profit attributable to common shareholders. | | | | 1 Profit attributable to common shareholders. | | | | | | | |
2 Diluted by assumed exercise of stock-based compensation awards using the treasury stock method. | 2 Diluted by assumed exercise of stock-based compensation awards using the treasury stock method. | 2 Diluted by assumed exercise of stock-based compensation awards using the treasury stock method. |
| | | | | | | | | | | | | |
SARs and stock options to purchase 1,557,2751,471,071 and 12,644,6545,136,715 common shares were outstanding for the three and nine months ended March 31,September 30, 2018 and 2017, respectively, which were not included in the computation of diluted earnings per share because the effect would have been anti-dilutive.
In January 2014, the Board authorized the repurchase of up to $10.0 billion of Caterpillar common stock, which will expire on December 31, 2018. During the first quarter of 2018, a total of 3.1 million shares of our common stock were repurchased at an aggregate cost to Caterpillar of $500 million.
During the second quarter of 2018, we repurchased $750 million of common stock. In May 2018, we entered into an accelerated stock repurchase agreement (ASR) with a third-party financial institution to purchase shares of our common stock. Pursuant to the terms of the ASR Agreement, 3.3 million shares of our common stock were repurchased at an aggregate cost to Caterpillar of $500 million. In May 2018, we repurchased 1.6 million shares for $250 million in open market transactions.
During the third quarter of 2018, we entered into an ASR with a third-party financial institution to purchase $750 million of our common stock. In August 2018, upon payment of $750 million to the financial institution, we received 4.8 million shares. In October 2018, upon final settlement of the ASR, we received an additional 0.4 million shares. In total, we repurchased 5.2 million shares under this ASR. As of March 31,September 30, 2018, approximately $5.0$3.5 billion of the 2014 $10.0 billion authorization was spent.remained.
In July 2018, the Board approved a new share repurchase authorization of up to $10.0 billion of Caterpillar common stock effective January 1, 2019, with no expiration.
12. Accumulated other comprehensive income (loss)
Comprehensive income and its components are presented in the Consolidated Statement of Comprehensive Income. Changes in Accumulated other comprehensive income (loss), net of tax, included in the Consolidated Statement of Changes in Shareholders’ Equity, consisted of the following:
|
| | | | | | | | | | | | | | | | | | | | |
| | | | | | | | | | | |
| (Millions of dollars) | | Foreign currency translation | | Pension and other postretirement benefits | | Derivative financial instruments | | Available-for-sale securities | | Total |
| | | | | | | | | | | |
| Three Months Ended March 31, 2018 | | | | | | | | | | |
| Balance at December 31, 2017 | | $ | (1,205 | ) | | $ | 46 |
| | $ | (41 | ) | | $ | 8 |
| | $ | (1,192 | ) |
Adjustment to adopt recognition and measurement of financial assets and liabilities guidance1 | | — |
| | — |
| | — |
| | (11 | ) | | (11 | ) |
| Balance at January 1, 2018 | | (1,205 | ) | | 46 |
| | (41 | ) | | (3 | ) | | (1,203 | ) |
| Other comprehensive income (loss) before reclassifications | | 183 |
| | (2 | ) | | 5 |
| | (11 | ) | | 175 |
|
| Amounts reclassified from accumulated other comprehensive (income) loss | | 1 |
| | (7 | ) | | 18 |
| | — |
| | 12 |
|
| Other comprehensive income (loss) | | 184 |
| | (9 | ) | | 23 |
| | (11 | ) | | 187 |
|
| Balance at March 31, 2018 | | $ | (1,021 | ) | | $ | 37 |
| | $ | (18 | ) | | $ | (14 | ) | | $ | (1,016 | ) |
| | | | | | | | | | | |
| Three Months Ended March 31, 2017 | | | | | | | | | | |
| Balance at December 31, 2016 | | $ | (1,970 | ) | | $ | 14 |
| | $ | (115 | ) | | $ | 32 |
| | $ | (2,039 | ) |
| Other comprehensive income (loss) before reclassifications | | 145 |
| | 8 |
| | 10 |
| | 8 |
| | 171 |
|
| Amounts reclassified from accumulated other comprehensive (income) loss | | 2 |
| | (4 | ) | | 40 |
| | 3 |
| | 41 |
|
| Other comprehensive income (loss) | | 147 |
| | 4 |
| | 50 |
| | 11 |
| | 212 |
|
| Balance at March 31, 2017 | | $ | (1,823 | ) | | $ | 18 |
| | $ | (65 | ) | | $ | 43 |
| | $ | (1,827 | ) |
| | | | | | | | | | | |
1 See Note 2 for additional information. |
| | | | | | | | | | | |
|
| | | | | | | | | | | | | | | | | | | | |
| | | | | | | | | | | |
| (Millions of dollars) | | Foreign currency translation | | Pension and other postretirement benefits | | Derivative financial instruments | | Available-for-sale securities | | Total |
| | | | | | | | | | | |
| Three Months Ended September 30, 2018 | | | | | | | | | | |
| Balance at June 30, 2018 | | $ | (1,432 | ) | | $ | 30 |
| | $ | (78 | ) | | $ | (16 | ) | | $ | (1,496 | ) |
| Other comprehensive income (loss) before reclassifications | | (65 | ) | | — |
| | 32 |
| | (1 | ) | | (34 | ) |
| Amounts reclassified from accumulated other comprehensive (income) loss | | — |
| | (7 | ) | | (31 | ) | | — |
| | (38 | ) |
| Other comprehensive income (loss) | | (65 | ) | | (7 | ) | | 1 |
| | (1 | ) | | (72 | ) |
| Balance at September 30, 2018 | | $ | (1,497 | ) | | $ | 23 |
| | $ | (77 | ) | | $ | (17 | ) | | $ | (1,568 | ) |
| | | | | | | | | | | |
| Three Months Ended September 30, 2017 | | | | | | | | | | |
| Balance at June 30, 2017 | | $ | (1,499 | ) | | $ | 14 |
| | $ | (39 | ) | | $ | 53 |
| | $ | (1,471 | ) |
| Other comprehensive income (loss) before reclassifications | | 237 |
| | — |
| | (4 | ) | | 11 |
| | 244 |
|
| Amounts reclassified from accumulated other comprehensive (income) loss | | 11 |
| | (4 | ) | | 11 |
| | (24 | ) | | (6 | ) |
| Other comprehensive income (loss) | | 248 |
| | (4 | ) | | 7 |
| | (13 | ) | | 238 |
|
| Balance at September 30, 2017 | | $ | (1,251 | ) | | $ | 10 |
| | $ | (32 | ) | | $ | 40 |
| | $ | (1,233 | ) |
| | | | | | | | | | | |
| |
| | | | | | | | | | | |
|
| | | | | | | | | | | | | | | | | | | | |
| (Millions of dollars) | | Foreign currency translation | | Pension and other postretirement benefits | | Derivative financial instruments | | Available-for-sale securities | | Total |
| | | | | | | | | | | |
| Nine Months Ended September 30, 2018 | | | | | | | | | | |
| Balance at December 31, 2017 | | $ | (1,205 | ) | | $ | 46 |
| | $ | (41 | ) | | $ | 8 |
| | $ | (1,192 | ) |
Adjustment to adopt recognition and measurement of financial assets and liabilities guidance1 | | — |
| | — |
| | — |
| | (11 | ) | | (11 | ) |
| Balance at January 1, 2018 | | (1,205 | ) | | 46 |
| | (41 | ) | | (3 | ) | | (1,203 | ) |
| Other comprehensive income (loss) before reclassifications | | (293 | ) | | (2 | ) | | 73 |
| | (14 | ) | | (236 | ) |
| Amounts reclassified from accumulated other comprehensive (income) loss | | 1 |
| | (21 | ) | | (109 | ) | | — |
| | (129 | ) |
| Other comprehensive income (loss) | | (292 | ) | | (23 | ) | | (36 | ) | | (14 | ) | | (365 | ) |
| Balance at September 30, 2018 | | $ | (1,497 | ) | | $ | 23 |
| | $ | (77 | ) | | $ | (17 | ) | | $ | (1,568 | ) |
| | | | | | | | | | | |
| Nine Months Ended September 30, 2017 | | | | | | | | | | |
| Balance at December 31, 2016 | | $ | (1,970 | ) | | $ | 14 |
| | $ | (115 | ) | | $ | 32 |
| | $ | (2,039 | ) |
| Other comprehensive income (loss) before reclassifications | | 706 |
| | 8 |
| | 6 |
| | 29 |
| | 749 |
|
| Amounts reclassified from accumulated other comprehensive (income) loss | | 13 |
| | (12 | ) | | 77 |
| | (21 | ) | | 57 |
|
| Other comprehensive income (loss) | | 719 |
| | (4 | ) | | 83 |
| | 8 |
| | 806 |
|
| Balance at September 30, 2017 | | $ | (1,251 | ) | | $ | 10 |
| | $ | (32 | ) | | $ | 40 |
| | $ | (1,233 | ) |
1 See Note 2 for additional information. |
| | | | | | | | | | | |
The effect of the reclassifications out of Accumulated other comprehensive income (loss) on the Consolidated Statement of Results of Operations is as follows:
| | | | | | | | | | | |
| | | | | Three Months Ended March 31 | | | | Three Months Ended September 30 |
| (Millions of dollars) | | Classification of income (expense) | | 2018 |
| 2017 | | Classification of income (expense) | | 2018 |
| 2017 |
| | | | | | | | | | | | | |
| Foreign currency translation | | | | | | | | |
| Gain (loss) on foreign currency translation | | Other income (expense) | | $ | (1 | ) | | $ | (2 | ) | | Other income (expense) | | $ | — |
| | $ | (11 | ) |
| Tax (provision) benefit | Tax (provision) benefit | | — |
| | — |
| Tax (provision) benefit | | — |
| | — |
|
| Reclassifications net of tax | Reclassifications net of tax | | $ | (1 | ) | | $ | (2 | ) | Reclassifications net of tax | | $ | — |
| | $ | (11 | ) |
| | | | | | | | | |
| Pension and other postretirement benefits: | | | | | | | | |
| Amortization of prior service credit (cost) | | Other income (expense) | | $ | 9 |
| | $ | 5 |
| | Other income (expense) | | $ | 9 |
| | $ | 6 |
|
| Tax (provision) benefit | Tax (provision) benefit | | (2 | ) | | (1 | ) | Tax (provision) benefit | | (2 | ) | | (2 | ) |
| Reclassifications net of tax | Reclassifications net of tax | | $ | 7 |
| | $ | 4 |
| Reclassifications net of tax | | $ | 7 |
| | $ | 4 |
|
| | | | | | | | | |
| Derivative financial instruments: | | | | | | | | |
| Foreign exchange contracts | | Other income (expense) | | $ | (28 | ) | | $ | (61 | ) | | Other income (expense) | | $ | 34 |
| | $ | (16 | ) |
| Foreign exchange contracts | | Interest expense of Financial Products | | 3 |
| | — |
| | Interest expense of Financial Products | | 5 |
| | — |
|
| Interest rate contracts | | Interest expense excluding Financial Products | | — |
| | (2 | ) | | Interest expense excluding Financial Products | | — |
| | (2 | ) |
| Interest rate contracts | | Interest expense of Financial Products | | 1 |
| | 1 |
| | Interest expense of Financial Products | | — |
| | 2 |
|
| Reclassifications before tax | Reclassifications before tax | | (24 | ) | | (62 | ) | Reclassifications before tax | | 39 |
| | (16 | ) |
| Tax (provision) benefit | Tax (provision) benefit | | 6 |
| | 22 |
| Tax (provision) benefit | | (8 | ) | | 5 |
|
| Reclassifications net of tax | Reclassifications net of tax | | $ | (18 | ) | | $ | (40 | ) | Reclassifications net of tax | | $ | 31 |
| | $ | (11 | ) |
| | | | | | | | | |
| Available-for-sale securities: | | | | | | | | |
| Realized gain (loss) | | Other income (expense) | | $ | — |
| | $ | (4 | ) | | Other income (expense) | | $ | — |
| | $ | 36 |
|
| Tax (provision) benefit | Tax (provision) benefit | | — |
| | 1 |
| Tax (provision) benefit | | — |
| | (12 | ) |
| Reclassifications net of tax | Reclassifications net of tax | | $ | — |
| | $ | (3 | ) | Reclassifications net of tax | | $ | — |
| | $ | 24 |
|
| | | | | | | | | |
| Total reclassifications from Accumulated other comprehensive income (loss) | Total reclassifications from Accumulated other comprehensive income (loss) | | $ | (12 | ) | | $ | (41 | ) | Total reclassifications from Accumulated other comprehensive income (loss) | | $ | 38 |
| | $ | 6 |
|
| | | | | | | | | |
| | | | | | | | | |
|
| | | | | | | | | | |
| | | | | | | |
| | | | | Nine Months Ended September 30 |
| (Millions of dollars) | | Classification of income (expense) | | 2018 | | 2017 |
| | | | | | | |
| Foreign currency translation | | | | | | |
| Gain (loss) on foreign currency translation | | Other income (expense) | | $ | (1 | ) | | $ | (13 | ) |
| Tax (provision) benefit | | — |
| | — |
|
| Reclassifications net of tax | | $ | (1 | ) | | $ | (13 | ) |
| | | | | | | |
| Pension and other postretirement benefits: | | | | | | |
| Amortization of prior service credit (cost) | | Other income (expense) | | $ | 26 |
| | $ | 18 |
|
| Tax (provision) benefit | | (5 | ) | | (6 | ) |
| Reclassifications net of tax | | $ | 21 |
| | $ | 12 |
|
| | | | | | | |
| Derivative financial instruments: | | | | | | |
| Foreign exchange contracts | | Other income (expense) | | $ | 129 |
| | $ | (118 | ) |
| Foreign exchange contracts | | Interest expense of Financial Products | | 13 |
| | — |
|
| Interest rate contracts | | Interest expense excluding Financial Products | | (2 | ) | | (5 | ) |
| Interest rate contracts | | Interest expense of Financial Products | | 1 |
| | 5 |
|
| Reclassifications before tax | | 141 |
| | (118 | ) |
| Tax (provision) benefit | | (32 | ) | | 41 |
|
| Reclassifications net of tax | | $ | 109 |
| | $ | (77 | ) |
| | | | | | | |
| Available-for-sale securities: | | | | | | |
| Realized gain (loss) | | Other income (expense) | | $ | — |
| | $ | 32 |
|
| Tax (provision) benefit | | — |
| | (11 | ) |
| Reclassifications net of tax | | $ | — |
| | $ | 21 |
|
| | | | | | | |
| Total reclassifications from Accumulated other comprehensive income (loss) | | $ | 129 |
| | $ | (57 | ) |
| | | | | | | |
| | | | | | | |
13. Environmental and legal matters
The Company is regulated by federal, state and international environmental laws governing ourits use, transport and disposal of substances and control of emissions. In addition to governing our manufacturing and other operations, these laws often impact the development of our products, including, but not limited to, required compliance with air emissions standards applicable to internal combustion engines. We have made, and will continue to make, significant research and development and capital expenditures to comply with these emissions standards.
We are engaged in remedial activities at a number of locations, often with other companies, pursuant to federal and state laws. When it is probable we will pay remedial costs at a site, and those costs can be reasonably estimated, the investigation, remediation, and operating and maintenance costs are accrued against our earnings. Costs are accrued based on consideration of currently available data and information with respect to each individual site, including available technologies, current applicable laws and regulations, and prior remediation experience. Where no amount within a range of estimates is more likely, we accrue the minimum. Where multiple potentially responsible parties are involved, we
consider our proportionate share of the probable costs. In formulating the estimate of probable costs, we do not consider amounts expected to be recovered from insurance companies or others. We reassess these accrued amounts on a quarterly basis. The amount recorded for environmental remediation is not material and is included in Accrued expenses. We believe there is no more than a remote chance that a material amount for remedial activities at any individual site, or at all the sites in the aggregate, will be required.
On January 7, 2015, the Company received a grand jury subpoena from the U.S. District Court for the Central District of Illinois. The subpoena requests documents and information from the Company relating to, among other things, financial information concerning U.S. and non-U.S. Caterpillar subsidiaries (including undistributed profits of non-U.S. subsidiaries and the movement of cash among U.S. and non-U.S. subsidiaries). The Company has received additional subpoenas relating to this investigation requesting additional documents and information relating to, among other things, the purchase and resale of replacement parts by Caterpillar Inc. and non-U.S. Caterpillar subsidiaries, dividend distributions of certain non-U.S. Caterpillar subsidiaries, and Caterpillar SARL and related structures. On March 2-3, 2017, agents with the Department of Commerce, the Federal Deposit Insurance Corporation and the Internal Revenue Service executed search and seizure warrants at three facilities of the Company in the Peoria, Illinois area, including its former corporate headquarters. The warrants identify, and agents seized, documents and information related to, among other things, the export of products from the United States, the movement of products between the United States and Switzerland, the relationship between Caterpillar Inc. and Caterpillar SARL, and sales outside the United States. It is the Company’s understanding that the warrants, which concern both tax and export activities, are related to the ongoing grand jury investigation. The Company is continuing to cooperate with this investigation. The Company is unable to predict the outcome or reasonably estimate any potential loss; however, we currently believe that this matter will not have a material adverse effect on the Company’s consolidated results of operations, financial position or liquidity.
On March 20, 2014, Brazil’s Administrative Council for Economic Defense (CADE) published a Technical Opinion which named 18 companies and over 100 individuals as defendants, including two subsidiaries of Caterpillar Inc., MGE - Equipamentos e Serviços Ferroviários Ltda. (MGE) and Caterpillar Brasil Ltda. The publication of the Technical Opinion opened CADE's official administrative investigation into allegations that the defendants participated in anticompetitive bid activity for the construction and maintenance of metro and train networks in Brazil. While companies cannot be held criminally liable for anticompetitive conduct in Brazil, criminal charges have been brought against two current employees of MGE and one former employee of MGE involving the same conduct alleged by CADE. The Company has responded to all requests for information from the authorities. The Company is unable to predict the outcome or reasonably estimate the potential loss; however, we currently believe that this matter will not have a material adverse effect on the Company's consolidated results of operations, financial position or liquidity.
In addition, we are involved in other unresolved legal actions that arise in the normal course of business. The most prevalent of these unresolved actions involve disputes related to product design, manufacture and performance liability (including claimed asbestos and welding fumes exposure), contracts, employment issues, environmental matters, intellectual property rights, taxes (other than income taxes) and securities laws. The aggregate range of reasonably possible losses in excess of accrued liabilities, if any, associated with these unresolved legal actions is not material. In some cases, we cannot reasonably estimate a range of loss because there is insufficient information regarding the matter. However, we believe there is no more than a remote chance that any liability arising from these matters would be material. Although it is not possible to predict with certainty the outcome of these unresolved legal actions, we believe that these actions will not individually or in the aggregate have a material adverse effect on our consolidated results of operations, financial position or liquidity.
14. Income taxes
The provision for income taxes for the first threenine months of 2018 reflectsreflected an estimated annual tax rate of 24 percent, compared to 32 percent for the first threenine months of 2017, excluding the discrete items discussed in the following paragraph. The decrease iswas primarily due to the reduction in the U.S. corporate tax rate beginning January 1, 2018, along with other changes in the geographic mix of profits from a tax perspective.
The 2018 provision for income taxes for the first nine months of 2018 also included a $154 million reduction to the provisionally estimated charge of $2.371 billion recognized during the fourth quarter of 2017 due to enactment of U.S. tax reform legislation. The $154 million benefit revises the estimated impact of the write-down of U.S. net deferred tax assets to reflect the reduction in the U.S. corporate tax rate from 35 percent to 21 percent. This benefit primarily related to the decision to make an additional discretionary pension contribution of $1.0 billion to U.S. pension plans in the third quarter of 2018 treated as deductible on the 2017 U.S. tax return. The provision for income taxes for the first nine months of 2018 also includes a charge of $59 million to correct for an error which resulted in an understatement of the valuation allowance offsetting deferred tax assets for prior years. This error had the effect of overstating profit by $17 million, $33 million and $9 million for the years ended December 31, 2017, 2016 and 2015, respectively. Management has concluded that the error was not material to any period presented. In addition, a discrete tax benefit of $40$52 million was recorded in the first threenine months of 2018, compared to $17$45 million in the first threenine months of 2017, for the settlement of stock-based compensation awards with associated tax deductions in excess of cumulative U.S. GAAP compensation expense. The provision for income taxes infor the first threenine months of 2018 also included a $25 million benefit for the release of a valuation allowance against the deferred tax assets of a non-U.S. subsidiary. The provision for income taxes for the first nine months of 2017 also included a $15 million increase to prior year taxes related to non-U.S. restructuring costs.
Our analysis of U.S. tax reform legislation, updated through March 31,September 30, 2018, resulted in no changeother changes to the 2017 year-end provisional charge of $2.371 billion.charge. We will continue to update our calculations as additional required information is prepared and analyzed, interpretations and assumptions are refined, and additional guidance is issued, and due to actions we may take as a result of the legislation.issued. These updates could significantly impact the provision for income taxes, the amount of taxes payable and the deferred tax asset and liability balances. We account for the new U.S. tax on global intangible low-taxed income as a period cost.
On January 31, 2018, we received a Revenue Agent's Report from the Internal Revenue Service (IRS) indicating the end of the field examination of our U.S. income tax returns for 2010 to 2012. In the audits of 2007 to 2012 including the impact of a loss carryback to 2005, the IRS has proposed to tax in the United States profits earned from certain parts transactions by Caterpillar SARL, based on the IRS examination team's application of the "substance-over-form" or "assignment-of-income" judicial doctrines. We are vigorously contesting the proposed increases to tax and penalties for these years of approximately $2.3 billion. We believe that the relevant transactions complied with applicable tax laws and did not violate judicial doctrines. We have filed U.S. income tax returns on this same basis for years after 2012. Based on the information currently available, we do not anticipate a significant increase or decrease to our unrecognized tax benefits for this matter within the next 12 months. We currently believe the ultimate disposition of this matter will not have a material adverse effect on our consolidated financial position, liquidity or results of operations.
15. Segment information
| |
| A. | Basis for segment information |
Our Executive Office is comprised of a Chief Executive Officer (CEO), fivefour Group Presidents, a Chief Financial Officer (CFO), a General Counsel & Corporate Secretary and a Chief Human Resources Officer. The Group Presidents and CFO are accountable for a related set of end-to-end businesses that they manage. The General Counsel & Corporate Secretary leads the Law, Security and Public Policy Division. The Chief Human Resources Officer leads the Human Resources Organization. The CEO allocates resources and manages performance at the Group PresidentPresident/CFO level. As such, the CEO serves as our Chief Operating Decision Maker, and operating segments are primarily based on the Group PresidentPresident/CFO reporting structure.
Three of our operating segments, Construction Industries, Resource Industries and Energy & Transportation, are led by Group Presidents. One operating segment, Financial Products, is led by a Group Presidentthe CFO who also has responsibility for Corporate Services. Corporate Services is a cost center primarily responsible for the performance of certain support functions globally and to provide centralized services; it does not meet the definition of an operating segment. One Group President leads two smaller operating segments that are included in the All Other operating segments. The Law, Security and Public Policy Division and the Human Resources Organization are cost centers and do not meet the definition of an operating segment.
Segment information for 2017 has been recast due to our adoption of new accounting guidance issued by the FASB related to the presentation of net periodic pension costs and net periodperiodic postretirement benefit costs. Prior service cost (credits) is no longer included in segment profit. See Note 2 for additional information.
| |
| B. | Description of segments |
We have six operating segments, of which four are reportable segments. Following is a brief description of our reportable segments and the business activities included in the All Other operating segments:
Construction Industries: A segment primarily responsible for supporting customers using machinery in infrastructure, forestry and building construction applications. Responsibilities include business strategy, product design, product management and development, manufacturing, marketing and sales and product support. The product portfolio includes asphalt pavers, backhoe loaders, compactors, cold planers, compact track and multi-terrain loaders, mini, small, medium and large track excavators, forestry excavators, feller bunchers, harvesters, knuckleboom loaders, motor graders, pipelayers, road reclaimers, site prep tractors, skidders, skid steer loaders, telehandlers, small and medium track-type tractors, track-type loaders, utility vehicles, wheel excavators, compact, small and medium wheel loaders and related parts and work tools. Inter-segment sales are a source of revenue for this segment.
Resource Industries: A segment primarily responsible for supporting customers using machinery in mining, quarry and aggregates, waste and material handling applications. Responsibilities include business strategy, product design, product management and development, manufacturing, marketing and sales and product support. The product portfolio includes large track-type tractors, large mining trucks, hard rock vehicles, longwall miners, electric rope shovels, draglines,
hydraulic shovels, rotary drills, large wheel loaders, off-highway trucks, articulated trucks, wheel tractor scrapers, wheel dozers, landfill compactors, soil compactors, hard rock continuous mining systems, select work tools, machinery components, electronics and control systems and related parts. In addition to equipment, Resource Industries also develops and sells technology products and services to provide customers fleet management, equipment management analytics and autonomous machine capabilities. Resource Industries also manages areas that provide services to other parts of the company, including integrated manufacturing and research and development. Inter-segment sales are a source of revenue for this segment.
Energy & Transportation: A segment primarily responsible for supporting customers using reciprocating engines, turbines, diesel-electric locomotives and related parts across industries serving Oil and Gas, Power Generation, Industrial and Transportation applications, including marine and rail-related businesses. Responsibilities include business strategy, product design, product management and development, manufacturing, marketing and sales and product support of turbine machinery and integrated systems and solutions and turbine-related services, reciprocating engine-powered generator sets, integrated systems used in the electric power generation industry, reciprocating engines and integrated systems and solutions for the marine and oil and gas industries; reciprocating engines supplied to the industrial industry as well as Cat machinery; the remanufacturing of Cat engines and components and remanufacturing services for other companies; the business strategy, product design, product management and development, manufacturing, remanufacturing, leasing and service of diesel-electric locomotives and components and other rail-related products and services and product support of on-highway vocational trucks for North America. Inter-segment sales are a source of revenue for this segment.
Financial Products Segment: Provides financing alternatives to customers and dealers around the world for Caterpillar products, as well as financing for vehicles, power generation facilities and marine vessels that, in most cases, incorporate Caterpillar products. Financing plans include operating and finance leases, installment sale contracts, working capital loans and wholesale financing plans. The segment also provides insurance and risk management products and services that help customers and dealers manage their business risk. Insurance and risk management products offered include physical damage insurance, inventory protection plans, extended service coverage for machines and engines, and dealer property and casualty insurance. The various forms of financing, insurance and risk management products offered to customers and dealers help support the purchase and lease of our equipment. The segment also earns revenues from Machinery, Energy & Transportation, but the related costs are not allocated to operating segments.
All Other operating segments: Primarily includes activities such as: business strategy, product management and development, and manufacturing of filters and fluids, undercarriage, ground engaging tools, fluid transfer products, precision seals, and rubber sealing and connecting components primarily for Cat products; parts distribution; integrated logistics solutions, distribution services responsible for dealer development and administration including a wholly owned dealer in Japan, dealer portfolio management and ensuring the most efficient and effective distribution of machines, engines and parts; digital investments for new customer and dealer solutions that integrate data analytics with state-of-the-art digital technologies while transforming the buying experience. Results for the All Other operating segments are included as a reconciling item between reportable segments and consolidated external reporting.
| |
| C. | Segment measurement and reconciliations |
There are several methodology differences between our segment reporting and our external reporting. The following is a list of the more significant methodology differences:
Machinery, Energy & Transportation segment net assets generally include inventories, receivables, property, plant and equipment, goodwill, intangibles, accounts payable and customer advances. Liabilities other than accounts payable and customer advances are generally managed at the corporate level and are not included in segment operations. Financial Products Segment assets generally include all categories of assets.
Segment inventories and cost of sales are valued using a current cost methodology.
Goodwill allocated to segments is amortized using a fixed amount based on a 20 year useful life. This methodology difference only impacts segment assets; no goodwill amortization expense is included in segment profit. In addition, only a portion of goodwill for certain acquisitions made in 2011 or later has been allocated to segments.
The present value of future lease payments for certain Machinery, Energy & Transportation operating leases is included in segment assets. The estimated financing component of the lease payments is excluded.
Currency exposures for Machinery, Energy & Transportation are generally managed at the corporate level and the effects of changes in exchange rates on results of operations within the year are not included in segment profit. The net difference created in the translation of revenues and costs between exchange rates used for U.S. GAAP reporting and exchange rates used for segment reporting is reported as a methodology difference.
Stock-based compensation expense is not included in segment profit.
Postretirement benefit expenses are split; segments are generally responsible for service costs, with the remaining elements of net periodic benefit cost included as a methodology difference.
Machinery, Energy & Transportation segment profit is determined on a pretax basis and excludes interest expense and most other income/expense items. Financial Products Segment profit is determined on a pretax basis and includes other income/expense items.
Reconciling items are created based on accounting differences between segment reporting and our consolidated external reporting. Please refer to pages 3445 to 3851 for financial information regarding significant reconciling items. Most of our reconciling items are self-explanatory given the above explanations. For the reconciliation of profit, we have grouped the reconciling items as follows:
Corporate costs: These costs are related to corporate requirements primarily for compliance and legal functions for the benefit of the entire organization.
Restructuring costs: Primarily costs for employee separation, long-lived asset impairments and contract terminations. These costs are included in Other operating (income) expenses except for defined-benefit plan curtailment losses and special termination benefits, which are included in Other income (expense). Restructuring costs also include other exit-related costs primarily for accelerated depreciation, inventory write-downs, equipment relocation and project management costs and LIFO inventory decrement benefits from inventory liquidations at closed facilities, all of which are primarily included in Cost of goods sold. A table, Reconciliation of Restructuring costs on page 36,48, has been included to illustrate how segment profit would have been impacted by the restructuring costs. See Note 1819 for more information.
Methodology differences: See previous discussion of significant accounting differences between segment reporting and consolidated external reporting.
Timing: Timing differences in the recognition of costs between segment reporting and consolidated external reporting. For example, certain costs are reported on the cash basis for segment reporting and the accrual basis for consolidated external reporting.
| | | | | | | | | | | | | | | | | | | | | | | | | | | | | |
Reportable Segments | | Three Months Ended March 31 | |
| Three Months Ended September 30 | | Three Months Ended September 30 |
(Millions of dollars) | | | 2018 | 2018 |
| | External sales and revenues | | Inter- segment sales and revenues | | Total sales and revenues | | Depreciation and amortization | | Segment profit | | Segment assets at March 31 | | Capital expenditures | External sales and revenues | | Inter- segment sales and revenues | | Total sales and revenues | | Depreciation and amortization | | Segment profit | | Segment assets at September 30 | | Capital expenditures |
| Construction Industries | $ | 5,659 |
| | $ | 18 |
| | $ | 5,677 |
| | $ | 89 |
| | $ | 1,117 |
| | $ | 4,961 |
| | $ | 42 |
| $ | 5,654 |
| | $ | 29 |
| | $ | 5,683 |
| | $ | 93 |
| | $ | 1,058 |
| | $ | 5,071 |
| | $ | 58 |
|
| Resource Industries | 2,208 |
| | 101 |
| | 2,309 |
| | 116 |
| | 378 |
| | 6,172 |
| | 23 |
| 2,538 |
| | 100 |
| | 2,638 |
| | 115 |
| | 414 |
| | 6,439 |
| | 49 |
|
| Energy & Transportation | 4,276 |
| | 943 |
| | 5,219 |
| | 158 |
| | 874 |
| | 8,119 |
| | 162 |
| 4,577 |
| | 978 |
| | 5,555 |
| | 159 |
| | 973 |
| | 8,302 |
| | 161 |
|
| Machinery, Energy & Transportation | $ | 12,143 |
| | $ | 1,062 |
| | $ | 13,205 |
| | $ | 363 |
| | $ | 2,369 |
| | $ | 19,252 |
| | $ | 227 |
| $ | 12,769 |
| | $ | 1,107 |
| | $ | 13,876 |
| | $ | 367 |
| | $ | 2,445 |
| | $ | 19,812 |
| | $ | 268 |
|
| Financial Products Segment | 793 |
| 1 | — |
| | 793 |
| | 203 |
| | 141 |
| | 35,332 |
| | 361 |
| 845 |
| 1 | — |
| | 845 |
| | 212 |
| | 201 |
| | 35,729 |
| | 298 |
|
| Total | $ | 12,936 |
| | $ | 1,062 |
| | $ | 13,998 |
| | $ | 566 |
| | $ | 2,510 |
| | $ | 54,584 |
| | $ | 588 |
| $ | 13,614 |
| | $ | 1,107 |
| | $ | 14,721 |
| | $ | 579 |
| | $ | 2,646 |
| | $ | 55,541 |
| | $ | 566 |
|
| | | | | | | | | | | | | | | | | | | | | | | | | | | |
| | 2017 | 2017 |
| | External sales and revenues | | Inter- segment sales and revenues | | Total sales and revenues | | Depreciation and amortization | | Segment profit | | Segment assets at December 31 | | Capital expenditures | External sales and revenues | | Inter- segment sales and revenues | | Total sales and revenues | | Depreciation and amortization | | Segment profit | | Segment assets at December 31 | | Capital expenditures |
| Construction Industries | $ | 4,091 |
| | $ | 9 |
| | $ | 4,100 |
| | $ | 102 |
| | $ | 634 |
| | $ | 4,838 |
| | $ | 21 |
| $ | 4,854 |
| | $ | 32 |
| | $ | 4,886 |
| | $ | 99 |
| | $ | 884 |
| | $ | 4,838 |
| | $ | 50 |
|
| Resource Industries | 1,670 |
| | 91 |
| | 1,761 |
| | 127 |
| | 160 |
| | 6,403 |
| | 21 |
| 1,870 |
| | 86 |
| | 1,956 |
| | 129 |
| | 229 |
| | 6,403 |
| | 41 |
|
| Energy & Transportation | 3,356 |
| | 780 |
| | 4,136 |
| | 158 |
| | 545 |
| | 7,564 |
| | 116 |
| 3,961 |
| | 877 |
| | 4,838 |
| | 165 |
| | 743 |
| | 7,564 |
| | 113 |
|
| Machinery, Energy & Transportation | $ | 9,117 |
| | $ | 880 |
| | $ | 9,997 |
| | $ | 387 |
| | $ | 1,339 |
| | $ | 18,805 |
| | $ | 158 |
| $ | 10,685 |
| | $ | 995 |
| | $ | 11,680 |
| | $ | 393 |
| | $ | 1,856 |
| | $ | 18,805 |
| | $ | 204 |
|
| Financial Products Segment | 760 |
| 1 | — |
| | 760 |
| | 208 |
| | 183 |
| | 34,893 |
| | 271 |
| 774 |
| 1 | — |
| | 774 |
| | 204 |
| | 185 |
| | 34,893 |
| | 308 |
|
| Total | $ | 9,877 |
| | $ | 880 |
| | $ | 10,757 |
| | $ | 595 |
| | $ | 1,522 |
| | $ | 53,698 |
| | $ | 429 |
| $ | 11,459 |
| | $ | 995 |
| | $ | 12,454 |
| | $ | 597 |
| | $ | 2,041 |
| | $ | 53,698 |
| | $ | 512 |
|
| | | | | | | | | | | | | | | | | | | | | | | | | | | |
1 Includes revenues from Machinery, Energy & Transportation of $105$122 million and $86$93 million in the firstthird quarter of 2018 and 2017, respectively.
|
| | | | | | | | | | | | | | | | | | | | | | | | | | | |
| | | | | | | | | | | | | | |
| Reportable Segments |
| Nine Months Ended September 30 |
| (Millions of dollars) |
| | 2018 |
| | External sales and revenues | | Inter- segment sales and revenues | | Total sales and revenues | | Depreciation and amortization | | Segment profit | | Segment
assets at
September 30 | | Capital expenditures |
| Construction Industries | $ | 17,450 |
| | $ | 82 |
| | $ | 17,532 |
| | $ | 272 |
| | $ | 3,329 |
| | $ | 5,071 |
| | $ | 162 |
|
| Resource Industries | 7,177 |
| | 296 |
| | 7,473 |
| | 346 |
| | 1,203 |
| | 6,439 |
| | 111 |
|
| Energy & Transportation | 13,567 |
| | 2,931 |
| | 16,498 |
| | 474 |
| | 2,859 |
| | 8,302 |
| | 463 |
|
| Machinery, Energy & Transportation | $ | 38,194 |
| | $ | 3,309 |
| | $ | 41,503 |
| | $ | 1,092 |
| | $ | 7,391 |
| | $ | 19,812 |
| | $ | 736 |
|
| Financial Products Segment | 2,467 |
| 1 | — |
| | 2,467 |
| | 627 |
| | 476 |
| | 35,729 |
| | 1,192 |
|
| Total | $ | 40,661 |
| | $ | 3,309 |
| | $ | 43,970 |
| | $ | 1,719 |
| | $ | 7,867 |
| | $ | 55,541 |
| | $ | 1,928 |
|
| | | | | | | | | | | | | | |
| | 2017 |
| | External sales and revenues | | Inter- segment sales and revenues | | Total sales and revenues | | Depreciation and amortization | | Segment profit | | Segment assets at December 31 | | Capital expenditures |
| Construction Industries | $ | 13,875 |
| | $ | 70 |
| | $ | 13,945 |
| | $ | 301 |
| | $ | 2,418 |
| | $ | 4,838 |
| | $ | 107 |
|
| Resource Industries | 5,299 |
| | 254 |
| | 5,553 |
| | 386 |
| | 488 |
| | 6,403 |
| | 93 |
|
| Energy & Transportation | 11,258 |
| | 2,484 |
| | 13,742 |
| | 485 |
| | 1,982 |
| | 7,564 |
| | 320 |
|
| Machinery, Energy & Transportation | $ | 30,432 |
| | $ | 2,808 |
| | $ | 33,240 |
| | $ | 1,172 |
| | $ | 4,888 |
| | $ | 18,805 |
| | $ | 520 |
|
| Financial Products Segment | 2,310 |
| 1 | — |
| | 2,310 |
| | 616 |
| | 559 |
| | 34,893 |
| | 1,018 |
|
| Total | $ | 32,742 |
| | $ | 2,808 |
| | $ | 35,550 |
| | $ | 1,788 |
| | $ | 5,447 |
| | $ | 53,698 |
| | $ | 1,538 |
|
| | | | | | | | | | | | | | |
1 Includes revenues from Machinery, Energy & Transportation of $345 million and $281 million through the first three quarters of 2018 and 2017, respectively.
For the three and nine months ending March 31,September 30, 2018, sales and revenues by geographic region reconciled to consolidated sales and revenues were as follows:
| | | Sales and Revenues by Geographic Region | | | | | | | | | | | | | | | | | | | | |
| (Millions of dollars) | | North
America | | Latin
America | | EAME | | Asia/
Pacific | | External Sales and Revenues | | North
America | | Latin
America | | EAME | | Asia/
Pacific | | External Sales and Revenues |
| First Quarter 2018 | | |
| | |
| | |
| | |
| | | |
| Three Months Ended September 30, 2018 | | | |
| | |
| | |
| | |
| | |
| Construction Industries | | $ | 2,620 |
| | $ | 344 |
| | $ | 1,067 |
| | $ | 1,628 |
| | $ | 5,659 |
| | $ | 2,646 |
| | $ | 369 |
| | $ | 1,109 |
| | $ | 1,530 |
| | $ | 5,654 |
|
| Resource Industries | | 798 |
| | 360 |
| | 520 |
| | 530 |
| | 2,208 |
| | 849 |
| | 427 |
| | 574 |
| | 688 |
| | 2,538 |
|
| Energy & Transportation | | 2,225 |
| | 280 |
| | 1,092 |
| | 679 |
| | 4,276 |
| | 2,309 |
| | 330 |
| | 1,180 |
| | 758 |
| | 4,577 |
|
| All Other operating segments | | 15 |
| | — |
| | 4 |
| | 18 |
| | 37 |
| | 15 |
| | — |
| | 4 |
| | 18 |
| | 37 |
|
| Corporate Items and Eliminations | | (28 | ) | | 1 |
| | (3 | ) | | — |
| | (30 | ) | | (40 | ) | | 1 |
| | (5 | ) | | 1 |
| | (43 | ) |
| Machinery, Energy & Transportation Sales | | 5,630 |
| | 985 |
| | 2,680 |
| | 2,855 |
| | 12,150 |
| | 5,779 |
| | 1,127 |
| | 2,862 |
| | 2,995 |
| | 12,763 |
|
| | | | | | | | | | | | | | | | | | | | | |
| Financial Products Segment | | 512 |
| | 74 |
| | 101 |
| | 106 |
| | 793 |
| | 559 |
| | 68 |
| | 101 |
| | 117 |
| | 845 |
|
| Corporate Items and Eliminations | | (49 | ) | | (13 | ) | | (5 | ) | | (17 | ) | | (84 | ) | | (62 | ) | | (12 | ) | | (6 | ) | | (18 | ) | | (98 | ) |
| Financial Products Revenues | | 463 |
| | 61 |
| | 96 |
| | 89 |
| | 709 |
| | 497 |
| | 56 |
| | 95 |
| | 99 |
| | 747 |
|
| | | | | | | | | | | | | | | | | | | | | |
| Consolidated Sales and Revenues | | $ | 6,093 |
| | $ | 1,046 |
| | $ | 2,776 |
| | $ | 2,944 |
| | $ | 12,859 |
| | $ | 6,276 |
| | $ | 1,183 |
| | $ | 2,957 |
| | $ | 3,094 |
| | $ | 13,510 |
|
| | | | | | | | | | | | | | | | | | | | | |
| Nine Months Ended September 30, 2018 | | | |
| | |
| | |
| | |
| | |
| Construction Industries | | | $ | 8,005 |
| | $ | 1,105 |
| | $ | 3,347 |
| | $ | 4,993 |
| | $ | 17,450 |
|
| Resource Industries | | | 2,451 |
| | 1,181 |
| | 1,663 |
| | 1,882 |
| | 7,177 |
|
| Energy & Transportation | | | 7,116 |
| | 897 |
| | 3,425 |
| | 2,129 |
| | 13,567 |
|
| All Other operating segments | | | 47 |
| | 1 |
| | 12 |
| | 55 |
| | 115 |
|
| Corporate Items and Eliminations | | | (108 | ) | | (1 | ) | | (8 | ) | | — |
| | (117 | ) |
| Machinery, Energy & Transportation Sales | | | 17,511 |
| | 3,183 |
| | 8,439 |
| | 9,059 |
| | 38,192 |
|
| | | | | | | | | | | | |
| Financial Products Segment | | | 1,608 |
| | 213 |
| | 303 |
| | 343 |
| | 2,467 |
|
| Corporate Items and Eliminations | | | (168 | ) | | (36 | ) | | (18 | ) | | (57 | ) | | (279 | ) |
| Financial Products Revenues | | | 1,440 |
| | 177 |
| | 285 |
| | 286 |
| | 2,188 |
|
| | | | | | | | | | | | |
| Consolidated Sales and Revenues | | | $ | 18,951 |
| | $ | 3,360 |
| | $ | 8,724 |
| | $ | 9,345 |
| | $ | 40,380 |
|
| | | | | | | | | | | | |
For the three and nine months ending March 31,September 30, 2018, Energy & Transportation segment sales by end user application were as follows:
|
| | | | |
| Energy & Transportation External Sales | | |
| (Millions of dollars) | | Three Months Ended March 31, 2018 |
| Oil and gas | | $ | 1,215 |
|
| Power generation | | 969 |
|
| Industrial | | 906 |
|
| Transportation | | 1,186 |
|
| Energy & Transportation External Sales | | $ | 4,276 |
|
| | | |
|
| | | | | | | | | | | | | | | |
| | | | | | | | |
| Reconciliation of Sales and revenues: | | | | | | | |
| (Millions of dollars) | Machinery, Energy & Transportation | | Financial Products | | Consolidating Adjustments | | Consolidated Total |
| Three Months Ended March 31, 2017 | |
| | |
| | |
| | |
|
| Total external sales and revenues from reportable segments | $ | 9,117 |
| | $ | 760 |
| | $ | — |
| | $ | 9,877 |
|
| All Other operating segments | 37 |
| | — |
| | — |
| | 37 |
|
| Other | (24 | ) | | 17 |
| | (85 | ) | 1 | (92 | ) |
| Total sales and revenues | $ | 9,130 |
| | $ | 777 |
| | $ | (85 | ) | | $ | 9,822 |
|
1 Elimination of Financial Products revenues from Machinery, Energy & Transportation. | | | | |
|
| | | | | | | | |
| Energy & Transportation External Sales | | | | |
| (Millions of dollars) | | Three Months Ended September 30, 2018 | | Nine Months Ended September 30, 2018 |
| Oil and gas | | $ | 1,362 |
| | $ | 4,044 |
|
| Power generation | | 1,102 |
| | 3,063 |
|
| Industrial | | 863 |
| | 2,738 |
|
| Transportation | | 1,250 |
| | 3,722 |
|
| Energy & Transportation External Sales | | $ | 4,577 |
| | $ | 13,567 |
|
| | | | | |
|
| | | | | | | | | | | |
| Reconciliation of Consolidated profit before taxes: | | | | | |
| (Millions of dollars) | Machinery, Energy & Transportation | | Financial Products | | Consolidated Total |
| Three Months Ended March 31, 2018 | | | | | |
| Total profit from reportable segments | $ | 2,369 |
| | $ | 141 |
| | $ | 2,510 |
|
| All Other operating segments | 57 |
| | — |
| | 57 |
|
| Cost centers | 27 |
| | — |
| | 27 |
|
| Corporate costs | (168 | ) | | — |
| | (168 | ) |
| Timing | (84 | ) | | — |
| | (84 | ) |
| Restructuring costs | (69 | ) | | — |
| | (69 | ) |
| Methodology differences: | | | |
| |
|
|
| Inventory/cost of sales | (8 | ) | | — |
| | (8 | ) |
| Postretirement benefit expense | 87 |
| | — |
| | 87 |
|
| Stock-based compensation expense | (48 | ) | | (2 | ) | | (50 | ) |
| Financing costs | (78 | ) | | — |
| | (78 | ) |
| Currency | 3 |
| | — |
| | 3 |
|
| Other income/expense methodology differences | (78 | ) | | — |
| | (78 | ) |
| Other methodology differences | (13 | ) | | (2 | ) | | (15 | ) |
| Total consolidated profit before taxes | $ | 1,997 |
| | $ | 137 |
| | $ | 2,134 |
|
| | | | | | |
| Three Months Ended March 31, 2017 | |
| | |
| | |
|
| Total profit from reportable segments | $ | 1,339 |
| | $ | 183 |
| | $ | 1,522 |
|
| All Other operating segments | (14 | ) | | — |
| | (14 | ) |
| Cost centers | 7 |
| | — |
| | 7 |
|
| Corporate costs | (115 | ) | | — |
| | (115 | ) |
| Timing | (38 | ) | | — |
| | (38 | ) |
| Restructuring costs | (751 | ) | | (1 | ) | | (752 | ) |
| Methodology differences: | | | | | — |
|
| Inventory/cost of sales | (68 | ) | | — |
| | (68 | ) |
| Postretirement benefit expense | 47 |
| | — |
| | 47 |
|
| Stock-based compensation expense | (47 | ) | | (2 | ) | | (49 | ) |
| Financing costs | (130 | ) | | — |
| | (130 | ) |
| Currency | (39 | ) | | — |
| | (39 | ) |
| Other income/expense methodology differences | (55 | ) | | — |
| | (55 | ) |
| Other methodology differences | (31 | ) | | 4 |
| | (27 | ) |
| Total consolidated profit before taxes | $ | 105 |
| | $ | 184 |
| | $ | 289 |
|
| | | | | | |
|
| | | | | | | | | | | | | | | |
| | | | | | | | |
| Reconciliation of Sales and revenues: | | | | | | | |
| (Millions of dollars) | Machinery, Energy & Transportation | | Financial Products | | Consolidating Adjustments | | Consolidated Total |
| Three Months Ended September 30, 2017 | |
| | |
| | |
| | |
|
| Total external sales and revenues from reportable segments | $ | 10,685 |
| | $ | 774 |
| | $ | — |
| | $ | 11,459 |
|
| All Other operating segments | 56 |
| | — |
| | — |
| | 56 |
|
| Other | (28 | ) | | 19 |
| | (93 | ) | 1 | (102 | ) |
| Total sales and revenues | $ | 10,713 |
| | $ | 793 |
| | $ | (93 | ) | | $ | 11,413 |
|
| | | | | |
|
| | | | | | | | | | | | | | | |
| | | | | | | | |
| | Machinery, Energy & Transportation | | Financial Products | | Consolidating Adjustments | | Consolidated Total |
| Nine Months Ended September 30, 2017 | |
| | |
| | |
| | |
|
| Total external sales and revenues from reportable segments | $ | 30,432 |
| | $ | 2,310 |
| | $ | — |
| | $ | 32,742 |
|
| All Other operating segments | 126 |
| | — |
| | — |
| | 126 |
|
| Other | (76 | ) | | 53 |
| | (279 | ) | 1 | (302 | ) |
| Total sales and revenues | $ | 30,482 |
| | $ | 2,363 |
| | $ | (279 | ) | | $ | 32,566 |
|
1 Elimination of Financial Products revenues from Machinery, Energy & Transportation. | | | | |
|
| | | | | | | | | | | |
| Reconciliation of Consolidated profit before taxes: | | | | | |
| (Millions of dollars) | Machinery, Energy & Transportation | | Financial Products | | Consolidated Total |
| Three Months Ended September 30, 2018 | | | | | |
| Total profit from reportable segments | $ | 2,445 |
| | $ | 201 |
| | $ | 2,646 |
|
| All Other operating segments | (10 | ) | | — |
| | (10 | ) |
| Cost centers | 29 |
| | — |
| | 29 |
|
| Corporate costs | (134 | ) | | — |
| | (134 | ) |
| Timing | (18 | ) | | — |
| | (18 | ) |
| Restructuring costs | (96 | ) | | (14 | ) | | (110 | ) |
| Methodology differences: | | | |
| |
|
|
| Inventory/cost of sales | (20 | ) | | — |
| | (20 | ) |
| Postretirement benefit expense | 58 |
| | — |
| | 58 |
|
| Stock-based compensation expense | (50 | ) | | (2 | ) | | (52 | ) |
| Financing costs | (56 | ) | | — |
| | (56 | ) |
| Currency | (96 | ) | | — |
| | (96 | ) |
| Other income/expense methodology differences | (88 | ) | | — |
| | (88 | ) |
| Other methodology differences | (19 | ) | | 5 |
| | (14 | ) |
| Total consolidated profit before taxes | $ | 1,945 |
| | $ | 190 |
| | $ | 2,135 |
|
| | | | | | |
| Three Months Ended September 30, 2017 | |
| | |
| | |
|
| Total profit from reportable segments | $ | 1,856 |
| | $ | 185 |
| | $ | 2,041 |
|
| All Other operating segments | 5 |
| | — |
| | 5 |
|
| Cost centers | 17 |
| | — |
| | 17 |
|
| Corporate costs | (158 | ) | | — |
| | (158 | ) |
| Timing | (21 | ) | | — |
| | (21 | ) |
| Restructuring costs | (89 | ) | | (1 | ) | | (90 | ) |
| Methodology differences: | | | | | |
| Inventory/cost of sales | (4 | ) | | — |
| | (4 | ) |
| Postretirement benefit expense | 38 |
| | — |
| | 38 |
|
| Stock-based compensation expense | (46 | ) | | (2 | ) | | (48 | ) |
| Financing costs | (116 | ) | | — |
| | (116 | ) |
| Currency | (37 | ) | | — |
| | (37 | ) |
| Other income/expense methodology differences | (71 | ) | | — |
| | (71 | ) |
| Other methodology differences | (32 | ) | | (1 | ) | | (33 | ) |
| Total consolidated profit before taxes | $ | 1,342 |
| | $ | 181 |
| | $ | 1,523 |
|
| | | | | | |
|
| | | | | | | | | | | |
| Reconciliation of Consolidated profit before taxes: | | | | | |
| (Millions of dollars) | Machinery, Energy & Transportation | | Financial Products | | Consolidated Total |
| Nine Months Ended September 30, 2018 | | | | | |
| Total profit from reportable segments | $ | 7,391 |
| | $ | 476 |
| | $ | 7,867 |
|
| All Other operating segments | 70 |
| | — |
| | 70 |
|
| Cost centers | 55 |
| | — |
| | 55 |
|
| Corporate costs | (480 | ) | | — |
| | (480 | ) |
| Timing | (168 | ) | | — |
| | (168 | ) |
| Restructuring costs | (278 | ) | | (15 | ) | | (293 | ) |
| Methodology differences: | | | | |
|
|
| Inventory/cost of sales | 3 |
| | — |
| | 3 |
|
| Postretirement benefit expense | 227 |
| | — |
| | 227 |
|
| Stock-based compensation expense | (158 | ) | | (6 | ) | | (164 | ) |
| Financing costs | (203 | ) | | — |
| | (203 | ) |
| Currency | (145 | ) | | — |
| | (145 | ) |
| Other income/expense methodology differences | (261 | ) | | — |
| | (261 | ) |
| Other methodology differences | (61 | ) | | 8 |
| | (53 | ) |
| Total consolidated profit before taxes | $ | 5,992 |
| | $ | 463 |
| | $ | 6,455 |
|
| | | | | | |
| Nine Months Ended September 30, 2017 | |
| | |
| | |
|
| Total profit from reportable segments | $ | 4,888 |
| | $ | 559 |
| | $ | 5,447 |
|
| All Other operating segments | (28 | ) | | — |
| | (28 | ) |
| Cost centers | 13 |
| | — |
| | 13 |
|
| Corporate costs | (447 | ) | | — |
| | (447 | ) |
| Timing | (128 | ) | | — |
| | (128 | ) |
| Restructuring costs | (1,009 | ) | | (2 | ) | | (1,011 | ) |
| Methodology differences: | | | | | |
| Inventory/cost of sales | (80 | ) | | — |
| | (80 | ) |
| Postretirement benefit expense | 129 |
| | — |
| | 129 |
|
| Stock-based compensation expense | (158 | ) | | (7 | ) | | (165 | ) |
| Financing costs | (369 | ) | | — |
| | (369 | ) |
| Currency | (195 | ) | | — |
| | (195 | ) |
| Other income/expense methodology differences | (105 | ) | | — |
| | (105 | ) |
| Other methodology differences | (93 | ) | | 3 |
| | (90 | ) |
| Total consolidated profit before taxes | $ | 2,418 |
| | $ | 553 |
| | $ | 2,971 |
|
| | | | | | |
Reconciliation of Restructuring costs:
As noted above, restructuring costs are a reconciling item between Segment profit and Consolidated profit before taxes. Had we included the amounts in the segments' results, the profit would have been as shown below:
| | | Reconciliation of Restructuring costs: | | | | | | | | | | | | |
| (Millions of dollars) | | Segment profit (loss) | | Restructuring costs | | Segment profit (loss) with restructuring costs | | Segment profit (loss) | | Restructuring costs | | Segment profit (loss) with restructuring costs |
| Three Months Ended March 31, 2018 | | | | | | | |
| Three Months Ended September 30, 2018 | | | | | | | |
| Construction Industries | | $ | 1,117 |
| | $ | (14 | ) | | $ | 1,103 |
| | $ | 1,058 |
| | $ | (19 | ) | | $ | 1,039 |
|
| Resource Industries | | 378 |
| | (44 | ) | | 334 |
| | 414 |
| | (53 | ) | | 361 |
|
| Energy & Transportation | | 874 |
| | (5 | ) | | 869 |
| | 973 |
| | (31 | ) | | 942 |
|
| Financial Products Segment | | 141 |
| | — |
| | 141 |
| | 201 |
| | — |
| | 201 |
|
| All Other operating segments | | 57 |
| | (4 | ) | | 53 |
| | (10 | ) | | (4 | ) | | (14 | ) |
| Total | | $ | 2,567 |
| | $ | (67 | ) | | $ | 2,500 |
| | $ | 2,636 |
| | $ | (107 | ) | | $ | 2,529 |
|
| | | | | | | | | | | | | |
| Three Months Ended March 31, 2017 | | | | | | | |
| Three Months Ended September 30, 2017 | | | | | | | |
| Construction Industries | | $ | 634 |
| | $ | (667 | ) | | $ | (33 | ) | | $ | 884 |
| | $ | (15 | ) | | $ | 869 |
|
| Resource Industries | | 160 |
| | (59 | ) | | 101 |
| | 229 |
| | (59 | ) | | 170 |
|
| Energy & Transportation | | 545 |
| | (14 | ) | | 531 |
| | 743 |
| | (28 | ) | | 715 |
|
| Financial Products Segment | | 183 |
| | (1 | ) | | 182 |
| | 185 |
| | — |
| | 185 |
|
| All Other operating segments | | (14 | ) | | (6 | ) | | (20 | ) | | 5 |
| | (13 | ) | | (8 | ) |
| Total | | $ | 1,508 |
| | $ | (747 | ) | | $ | 761 |
| | $ | 2,046 |
| | $ | (115 | ) | | $ | 1,931 |
|
| | | | | | | | | | | | | |
|
| | | | | | | | | | | | |
| Reconciliation of Restructuring costs: | | | | | | |
| (Millions of dollars) | | Segment profit (loss) | | Restructuring costs | | Segment profit (loss) with restructuring costs |
| Nine Months Ended September 30, 2018 | | | | | | |
| Construction Industries | | $ | 3,329 |
| | $ | (62 | ) | | $ | 3,267 |
|
| Resource Industries | | 1,203 |
| | (149 | ) | | 1,054 |
|
| Energy & Transportation | | 2,859 |
| | (60 | ) | | 2,799 |
|
| Financial Products Segment | | 476 |
| | (1 | ) | | 475 |
|
| All Other operating segments | | 70 |
| | (13 | ) | | 57 |
|
| Total | | $ | 7,937 |
| | $ | (285 | ) | | $ | 7,652 |
|
| | | | | | | |
| Nine Months Ended September 30, 2017 | | | | | | |
| Construction Industries | | $ | 2,418 |
| | $ | (709 | ) | | $ | 1,709 |
|
| Resource Industries | | 488 |
| | (229 | ) | | 259 |
|
| Energy & Transportation | | 1,982 |
| | (86 | ) | | 1,896 |
|
| Financial Products Segment | | 559 |
| | (2 | ) | | 557 |
|
| All Other operating segments | | (28 | ) | | (32 | ) | | (60 | ) |
| Total | | $ | 5,419 |
| | $ | (1,058 | ) | | $ | 4,361 |
|
| | | | | | | |
| | | Reconciliation of Assets: | | | | | | | | | | | | | | |
| (Millions of dollars) | Machinery, Energy & Transportation | | Financial Products | | Consolidating Adjustments | | Consolidated Total | Machinery, Energy & Transportation | | Financial Products | | Consolidating Adjustments | | Consolidated Total |
| March 31, 2018 | | | | | | | | |
| September 30, 2018 | | | | | | | | |
| Total assets from reportable segments | $ | 19,252 |
| | $ | 35,332 |
| | $ | — |
| | $ | 54,584 |
| $ | 19,812 |
| | $ | 35,729 |
| | $ | — |
| | $ | 55,541 |
|
| All Other operating segments | 1,342 |
| | — |
| | — |
| | 1,342 |
| 1,273 |
| | — |
| | — |
| | 1,273 |
|
| Items not included in segment assets: | |
| | |
| | |
| | |
| |
| | |
| | |
| | |
|
| Cash and short-term investments | 7,034 |
| | — |
| | — |
| | 7,034 |
| 7,189 |
| | — |
| | — |
| | 7,189 |
|
| Intercompany receivables | 1,630 |
| | — |
| | (1,630 | ) | | — |
| 1,644 |
| | — |
| | (1,644 | ) | | — |
|
| Investment in Financial Products | 4,225 |
| | — |
| | (4,225 | ) | | — |
| 4,165 |
| | — |
| | (4,165 | ) | | — |
|
| Deferred income taxes | 2,116 |
| | — |
| | (537 | ) | | 1,579 |
| 1,818 |
| | — |
| | (628 | ) | | 1,190 |
|
| Goodwill and intangible assets | 4,572 |
| | — |
| | — |
| | 4,572 |
| 4,304 |
| | — |
| | — |
| | 4,304 |
|
| Property, plant and equipment – net and other assets | 2,261 |
| | — |
| | — |
| | 2,261 |
| 2,035 |
| | — |
| | — |
| | 2,035 |
|
| Operating lease methodology difference | (174 | ) | | — |
| | — |
| | (174 | ) | (184 | ) | | — |
| | — |
| | (184 | ) |
| Inventory methodology differences | (2,214 | ) | | — |
| | — |
| | (2,214 | ) | (2,374 | ) | | — |
| | — |
| | (2,374 | ) |
| Liabilities included in segment assets | 9,657 |
| | — |
| | — |
| | 9,657 |
| 9,814 |
| | — |
| | — |
| | 9,814 |
|
| Other | (589 | ) | | (8 | ) | | (30 | ) | | (627 | ) | (510 | ) | | (13 | ) | | (56 | ) | | (579 | ) |
| Total assets | $ | 49,112 |
| | $ | 35,324 |
| | $ | (6,422 | ) | | $ | 78,014 |
| $ | 48,986 |
| | $ | 35,716 |
| | $ | (6,493 | ) | | $ | 78,209 |
|
| | | | | | | | | | | | | | | |
| December 31, 2017 | |
| | |
| | |
| | |
| |
| | |
| | |
| | |
|
| Total assets from reportable segments | $ | 18,805 |
| | $ | 34,893 |
| | $ | — |
| | $ | 53,698 |
| $ | 18,805 |
| | $ | 34,893 |
| | $ | — |
| | $ | 53,698 |
|
| All Other operating segments | 1,312 |
| | — |
| | — |
| | 1,312 |
| 1,312 |
| | — |
| | — |
| | 1,312 |
|
| Items not included in segment assets: | |
| | |
| | |
| | |
| |
| | |
| | |
| | |
|
| Cash and short-term investments | 7,381 |
| | — |
| | — |
| | 7,381 |
| 7,381 |
| | — |
| | — |
| | 7,381 |
|
| Intercompany receivables | 1,733 |
| | — |
| | (1,733 | ) | | — |
| 1,733 |
| | — |
| | (1,733 | ) | | — |
|
| Investment in Financial Products | 4,064 |
| | — |
| | (4,064 | ) | | — |
| 4,064 |
| | — |
| | (4,064 | ) | | — |
|
| Deferred income taxes | 2,166 |
| | — |
| | (574 | ) | | 1,592 |
| 2,166 |
| | — |
| | (574 | ) | | 1,592 |
|
| Goodwill and intangible assets | 4,210 |
| | — |
| | — |
| | 4,210 |
| 4,210 |
| | — |
| | — |
| | 4,210 |
|
| Property, plant and equipment – net and other assets | 2,341 |
| | — |
| | — |
| | 2,341 |
| 2,341 |
| | — |
| | — |
| | 2,341 |
|
| Operating lease methodology difference | (191 | ) | | — |
| | — |
| | (191 | ) | (191 | ) | | — |
| | — |
| | (191 | ) |
| Inventory methodology differences | (2,287 | ) | | — |
| | — |
| | (2,287 | ) | (2,287 | ) | | — |
| | — |
| | (2,287 | ) |
| Liabilities included in segment assets | 9,352 |
| | — |
| | — |
| | 9,352 |
| 9,352 |
| | — |
| | — |
| | 9,352 |
|
| Other | (399 | ) | | (14 | ) | | (33 | ) | | (446 | ) | (399 | ) | | (14 | ) | | (33 | ) | | (446 | ) |
| Total assets | $ | 48,487 |
| | $ | 34,879 |
| | $ | (6,404 | ) | | $ | 76,962 |
| $ | 48,487 |
| | $ | 34,879 |
| | $ | (6,404 | ) | | $ | 76,962 |
|
| | | | | | | | | | | | | | | |
| | | Reconciliations of Depreciation and amortization: | | | | | | | | | | |
| (Millions of dollars) | Machinery, Energy & Transportation | | Financial Products | | Consolidated Total | Machinery, Energy & Transportation | | Financial Products | | Consolidated Total |
| Three Months Ended March 31, 2018 | | | | | | |
| Three Months Ended September 30, 2018 | | | | | | |
| Total depreciation and amortization from reportable segments | $ | 363 |
| | $ | 203 |
| | $ | 566 |
| $ | 367 |
| | $ | 212 |
| | $ | 579 |
|
| Items not included in segment depreciation and amortization: | |
| | |
| | |
| |
| | |
| | |
|
| All Other operating segments | 57 |
| | — |
| | 57 |
| 55 |
| | — |
| | 55 |
|
| Cost centers | 31 |
| | — |
| | 31 |
| 33 |
| | — |
| | 33 |
|
| Other | 17 |
| | 10 |
| | 27 |
| 22 |
| | 9 |
| | 31 |
|
| Total depreciation and amortization | $ | 468 |
| | $ | 213 |
| | $ | 681 |
| $ | 477 |
| | $ | 221 |
| | $ | 698 |
|
| | | | | | | | | | | |
| Three Months Ended March 31, 2017 | |
| | |
| | |
| |
| Three Months Ended September 30, 2017 | | |
| | |
| | |
|
| Total depreciation and amortization from reportable segments | $ | 387 |
| | $ | 208 |
| | $ | 595 |
| $ | 393 |
| | $ | 204 |
| | $ | 597 |
|
| Items not included in segment depreciation and amortization: | |
| | |
| | |
| |
| | |
| | |
|
| All Other operating segments | 54 |
| | — |
| | 54 |
| 52 |
| | — |
| | 52 |
|
| Cost centers | 35 |
| | — |
| | 35 |
| 36 |
| | — |
| | 36 |
|
| Other | 15 |
| | 11 |
| | 26 |
| 28 |
| | 10 |
| | 38 |
|
| Total depreciation and amortization | $ | 491 |
| | $ | 219 |
| | $ | 710 |
| $ | 509 |
| | $ | 214 |
| | $ | 723 |
|
| | | | | | | | | | | |
|
| | | | | | | | | | | |
| Reconciliations of Depreciation and amortization: | | | | | |
| (Millions of dollars) | Machinery, Energy & Transportation | | Financial Products | | Consolidated Total |
| Nine Months Ended September 30, 2018 | | | | | |
| Total depreciation and amortization from reportable segments | $ | 1,092 |
| | $ | 627 |
| | $ | 1,719 |
|
| Items not included in segment depreciation and amortization: | | | | | |
|
| All Other operating segments | 170 |
| | — |
| | 170 |
|
| Cost centers | 96 |
| | — |
| | 96 |
|
| Other | 52 |
| | 28 |
| | 80 |
|
| Total depreciation and amortization | $ | 1,410 |
| | $ | 655 |
| | $ | 2,065 |
|
| | | | | | |
| Nine Months Ended September 30, 2017 | |
| | |
| | |
|
| Total depreciation and amortization from reportable segments | $ | 1,172 |
| | $ | 616 |
| | $ | 1,788 |
|
| Items not included in segment depreciation and amortization: | | | | | |
|
| All Other operating segments | 162 |
| | — |
| | 162 |
|
| Cost centers | 106 |
| | — |
| | 106 |
|
| Other | 67 |
| | 30 |
| | 97 |
|
| Total depreciation and amortization | $ | 1,507 |
| | $ | 646 |
| | $ | 2,153 |
|
| | | | | | |
| | | Reconciliations of Capital expenditures: | | | | | | | | | | | | | | |
| (Millions of dollars) | Machinery, Energy & Transportation | | Financial Products | | Consolidating Adjustments | | Consolidated Total | Machinery, Energy & Transportation | | Financial Products | | Consolidating Adjustments | | Consolidated Total |
| Three Months Ended March 31, 2018 | |
| | |
| | |
| | |
| |
| Three Months Ended September 30, 2018 | | |
| | |
| | |
| | |
|
| Total capital expenditures from reportable segments | $ | 227 |
| | $ | 361 |
| | $ | — |
| | $ | 588 |
| $ | 268 |
| | $ | 298 |
| | $ | — |
| | $ | 566 |
|
| Items not included in segment capital expenditures: | |
| | |
| | |
| | |
| |
| | |
| | |
| | |
|
| All Other operating segments | 11 |
| | — |
| | — |
| | 11 |
| 63 |
| | — |
| | — |
| | 63 |
|
| Cost centers | 14 |
| | — |
| | — |
| | 14 |
| 30 |
| | — |
| | — |
| | 30 |
|
| Timing | 175 |
| | — |
| | — |
| | 175 |
| (5 | ) | | — |
| | — |
| | (5 | ) |
| Other | (104 | ) | | 77 |
| | (4 | ) | | (31 | ) | (65 | ) | | 45 |
| | (33 | ) | | (53 | ) |
| Total capital expenditures | $ | 323 |
| | $ | 438 |
| | $ | (4 | ) | | $ | 757 |
| $ | 291 |
| | $ | 343 |
| | $ | (33 | ) | | $ | 601 |
|
| | | | | | | | | | | | | | | |
| Three Months Ended March 31, 2017 | |
| | |
| | |
| | |
| |
| Three Months Ended September 30, 2017 | | |
| | |
| | |
| | |
|
| Total capital expenditures from reportable segments | $ | 158 |
| | $ | 271 |
| | $ | — |
| | $ | 429 |
| $ | 204 |
| | $ | 308 |
| | $ | — |
| | $ | 512 |
|
| Items not included in segment capital expenditures: | |
| | |
| | |
| | |
| |
| | |
| | |
| | |
|
| All Other operating segments | 20 |
| | — |
| | — |
| | 20 |
| 26 |
| | — |
| | — |
| | 26 |
|
| Cost centers | 9 |
| | — |
| | — |
| | 9 |
| 17 |
| | — |
| | — |
| | 17 |
|
| Timing | 88 |
| | — |
| | — |
| | 88 |
| (21 | ) | | — |
| | — |
| | (21 | ) |
| Other | (66 | ) | | 32 |
| | (3 | ) | | (37 | ) | (31 | ) | | 19 |
| | (9 | ) | | (21 | ) |
| Total capital expenditures | $ | 209 |
| | $ | 303 |
| | $ | (3 | ) | | $ | 509 |
| $ | 195 |
| | $ | 327 |
| | $ | (9 | ) | | $ | 513 |
|
| | | | | | | | | | | | | | | |
|
| | | | | | | | | | | | | | | |
| Reconciliations of Capital expenditures: | | | | | | | |
| (Millions of dollars) | Machinery, Energy & Transportation | | Financial Products | | Consolidating Adjustments | | Consolidated Total |
| Nine Months Ended September 30, 2018 | |
| | |
| | |
| | |
|
| Total capital expenditures from reportable segments | $ | 736 |
| | $ | 1,192 |
| | $ | — |
| | $ | 1,928 |
|
| Items not included in segment capital expenditures: | | | | | |
| | |
|
| All Other operating segments | 101 |
| | — |
| | — |
| | 101 |
|
| Cost centers | 70 |
| | — |
| | — |
| | 70 |
|
| Timing | 152 |
| | — |
| | — |
| | 152 |
|
| Other | (214 | ) | | 165 |
| | (73 | ) | | (122 | ) |
| Total capital expenditures | $ | 845 |
| | $ | 1,357 |
| | $ | (73 | ) | | $ | 2,129 |
|
| | | | | | | | |
| Nine Months Ended September 30, 2017 | |
| | |
| | |
| | |
|
| Total capital expenditures from reportable segments | $ | 520 |
| | $ | 1,018 |
| | $ | — |
| | $ | 1,538 |
|
| Items not included in segment capital expenditures: | | | | | |
| | |
|
| All Other operating segments | 71 |
| | — |
| | — |
| | 71 |
|
| Cost centers | 40 |
| | — |
| | — |
| | 40 |
|
| Timing | 58 |
| | — |
| | — |
| | 58 |
|
| Other | (115 | ) | | 62 |
| | (17 | ) | | (70 | ) |
| Total capital expenditures | $ | 574 |
| | $ | 1,080 |
| | $ | (17 | ) | | $ | 1,637 |
|
| | | | | | | | |
16. Cat Financial financing activities
Allowance for credit losses
The allowance for credit losses is an estimate of the losses inherent in Cat Financial’s finance receivable portfolio and includes consideration of accounts that have been individually identified as impaired, as well as pools of finance receivables where it is probable that certain receivables in the pool are impaired but the individual accounts cannot yet be identified. In identifying and measuring impairment, management takes into consideration past loss experience, known and inherent risks in the portfolio, adverse situations that may affect the borrower’s ability to repay, estimated value of underlying collateral and current economic conditions.
Accounts are identified for individual review based on past-due status and information available about the customer, such as financial statements, news reports and published credit ratings, as well as general information regarding industry trends and the economic environment in which Cat Financial’s customers operate. The allowance for credit losses attributable to finance receivables that are individually evaluated and determined to be impaired is based on the present value of expected future cash flows discounted at the receivables' effective interest rate, the fair value of the collateral for collateral-dependent receivables or the observable market price of the receivable. In determining collateral value, Cat Financial estimates the current fair market value of the collateral less selling costs. Cat Financial also considers credit enhancements such as additional collateral and contractual third-party guarantees. The allowance for credit losses attributable to the remaining accounts not yet individually identified as impaired is estimated based on loss forecast models utilizing probabilities of default, our estimate of the loss emergence period and the estimated loss given default. In addition, qualitative factors not able to be fully captured in the loss forecast models including industry trends, macroeconomic factors and model imprecision are considered in the evaluation of the adequacy of the allowance for credit losses. These qualitative factors are subjective and require a degree of management judgment.
Cat Financial’s allowance for credit losses is segregated into two portfolio segments:
•Customer - Finance receivables with retail customers.
•Dealer - Finance receivables with Caterpillar dealers.
A portfolio segment is the level at which the company develops a systematic methodology for determining its allowance for credit losses.
Cat Financial further evaluates portfolio segments by the class of finance receivables, which is defined as a level of information (below a portfolio segment) in which the finance receivables have the same initial measurement attribute and a similar method for assessing and monitoring credit risk. Typically, Cat Financial’s finance receivables within a geographic area have similar credit risk profiles and methods for assessing and monitoring credit risk. Cat Financial’s classes, which align with management reporting for credit losses, are as follows:
North America - Finance receivables originated in the United States or Canada.
Europe - Finance receivables originated in Europe, Africa, the Middle East and the Commonwealth of Independent States.
Asia Pacific - Finance receivables originated in Australia, New Zealand, China, Japan and Southeast Asia.
Mining - Finance receivables related to large mining customers worldwide and project financing in various countries.
Latin America - Finance receivables originated in Mexico, and Central and South American countries.
Caterpillar Power Finance - Finance receivables originated worldwide related to marine vessels with Caterpillar engines and Caterpillar electrical power generation, gas compression and co-generation systems and non-Caterpillar equipment that is powered by these systems.
An analysis of the allowance for credit losses was as follows:
| | | | | | | | | | | | | |
(Millions of dollars) | March 31, 2018 | September 30, 2018 |
| Allowance for Credit Losses: | Customer | | Dealer | | Total | Customer | | Dealer | | Total |
| Balance at beginning of year | $ | 353 |
| | $ | 9 |
| | $ | 362 |
| $ | 353 |
| | $ | 9 |
| | $ | 362 |
|
| Receivables written off | (40 | ) | | — |
| | (40 | ) | (181 | ) | | — |
| | (181 | ) |
| Recoveries on receivables previously written off | 10 |
| | — |
| | 10 |
| 31 |
| | — |
| | 31 |
|
| Provision for credit losses | 66 |
| | — |
| | 66 |
| 216 |
| | (2 | ) | | 214 |
|
| Other | 1 |
| | — |
| | 1 |
| (14 | ) | | — |
| | (14 | ) |
| Balance at end of period | $ | 390 |
| | $ | 9 |
| | $ | 399 |
| $ | 405 |
| | $ | 7 |
| | $ | 412 |
|
| | |
| | |
| | |
| |
| | |
| | |
|
| Individually evaluated for impairment | $ | 194 |
| | $ | — |
| | $ | 194 |
| $ | 229 |
| | $ | — |
| | $ | 229 |
|
| Collectively evaluated for impairment | 196 |
| | 9 |
| | 205 |
| 176 |
| | 7 |
| | 183 |
|
| Ending Balance | $ | 390 |
| | $ | 9 |
| | $ | 399 |
| $ | 405 |
| | $ | 7 |
| | $ | 412 |
|
| | | | | | | | | | | |
| Recorded Investment in Finance Receivables: | |
| | |
| | |
| |
| | |
| | |
|
| Individually evaluated for impairment | $ | 971 |
| | $ | — |
| | $ | 971 |
| $ | 802 |
| | $ | — |
| | $ | 802 |
|
| Collectively evaluated for impairment | 18,164 |
| | 3,367 |
| | 21,531 |
| 18,193 |
| | 3,467 |
| | 21,660 |
|
| Ending Balance | $ | 19,135 |
| | $ | 3,367 |
| | $ | 22,502 |
| $ | 18,995 |
| | $ | 3,467 |
| | $ | 22,462 |
|
| | | | | | | | | | | |
|
| | | | | | | | | | | |
| | | | | | |
(Millions of dollars) | December 31, 2017 |
| Allowance for Credit Losses: | Customer | | Dealer | | Total |
| Balance at beginning of year | $ | 331 |
| | $ | 10 |
| | $ | 341 |
|
| Receivables written off | (157 | ) | | — |
| | (157 | ) |
| Recoveries on receivables previously written off | 43 |
| | — |
| | 43 |
|
| Provision for credit losses | 129 |
| | (1 | ) | | 128 |
|
| Other | 7 |
| | — |
| | 7 |
|
| Balance at end of year | $ | 353 |
| | $ | 9 |
| | $ | 362 |
|
| | | | | | |
| Individually evaluated for impairment | $ | 149 |
| | $ | — |
| | $ | 149 |
|
| Collectively evaluated for impairment | 204 |
| | 9 |
| | 213 |
|
| Ending Balance | $ | 353 |
| | $ | 9 |
| | $ | 362 |
|
| | | | | | |
| Recorded Investment in Finance Receivables: | |
| | |
| | |
|
| Individually evaluated for impairment | $ | 942 |
| | $ | — |
| | $ | 942 |
|
| Collectively evaluated for impairment | 18,226 |
| | 3,464 |
| | 21,690 |
|
| Ending Balance | $ | 19,168 |
| | $ | 3,464 |
| | $ | 22,632 |
|
| | | | | | |
Credit quality of finance receivables
At origination, Cat Financial evaluates credit risk based on a variety of credit quality factors including prior payment experience, customer financial information, credit-rating agency ratings, loan-to-value ratios and other internal metrics. On an ongoing basis, Cat Financial monitors credit quality based on past-due status and collection experience as there is a meaningful correlation between the past-due status of customers and the risk of loss.
In determining past-due status, Cat Financial considers the entire recorded investment in finance receivables past due when any installment is over 30 days past due. The tables below summarize the recorded investment in finance receivables by aging category.
| | | | | | | | | | | | | | | | | | | | | | | | | | | | | |
| | March 31, 2018 | September 30, 2018 |
(Millions of dollars) | 31-60 Days Past Due | | 61-90 Days Past Due | | 91+ Days Past Due | | Total Past Due | | Current | | Recorded Investment in Finance Receivables | | 91+ Still Accruing | 31-60 Days Past Due | | 61-90 Days Past Due | | 91+ Days Past Due | | Total Past Due | | Current | | Recorded Investment in Finance Receivables | | 91+ Still Accruing |
| Customer | |
| | |
| | |
| | |
| | |
| | |
| | |
| |
| | |
| | |
| | |
| | |
| | |
| | |
|
| North America | $ | 73 |
| | $ | 28 |
| | $ | 38 |
| | $ | 139 |
| | $ | 7,934 |
| | $ | 8,073 |
| | $ | 6 |
| $ | 74 |
| | $ | 17 |
| | $ | 46 |
| | $ | 137 |
| | $ | 7,834 |
| | $ | 7,971 |
| | $ | 7 |
|
| Europe | 20 |
| | 23 |
| | 54 |
| | 97 |
| | 2,759 |
| | 2,856 |
| | 10 |
| 19 |
| | 9 |
| | 122 |
| | 150 |
| | 2,848 |
| | 2,998 |
| | 6 |
|
| Asia Pacific | 23 |
| | 11 |
| | 13 |
| | 47 |
| | 2,114 |
| | 2,161 |
| | 6 |
| 30 |
| | 14 |
| | 8 |
| | 52 |
| | 2,399 |
| | 2,451 |
| | 5 |
|
| Mining | 7 |
| | 1 |
| | 12 |
| | 20 |
| | 1,755 |
| | 1,775 |
| | 1 |
| 5 |
| | — |
| | 9 |
| | 14 |
| | 1,623 |
| | 1,637 |
| | — |
|
| Latin America | 49 |
| | 43 |
| | 143 |
| | 235 |
| | 1,460 |
| | 1,695 |
| | 3 |
| 35 |
| | 15 |
| | 84 |
| | 134 |
| | 1,380 |
| | 1,514 |
| | — |
|
| Caterpillar Power Finance | 41 |
| | 57 |
| | 209 |
| | 307 |
| | 2,268 |
| | 2,575 |
| | 28 |
| 116 |
| | 45 |
| | 298 |
| | 459 |
| | 1,965 |
| | 2,424 |
| | 8 |
|
| Dealer | |
| | |
| | |
| | | | | | | | |
| |
| | |
| | |
| | | | | | | | |
|
| North America | — |
| | — |
| | — |
| | — |
| | 1,937 |
| | 1,937 |
| | — |
| — |
| | — |
| | — |
| | — |
| | 1,978 |
| | 1,978 |
| | — |
|
| Europe | — |
| | — |
| | — |
| | — |
| | 191 |
| | 191 |
| | — |
| — |
| | — |
| | — |
| | — |
| | 321 |
| | 321 |
| | — |
|
| Asia Pacific | — |
| | — |
| | — |
| | — |
| | 486 |
| | 486 |
| | — |
| — |
| | — |
| | — |
| | — |
| | 473 |
| | 473 |
| | — |
|
| Mining | — |
| | — |
| | — |
| | — |
| | 4 |
| | 4 |
| | — |
| — |
| | — |
| | — |
| | — |
| | 4 |
| | 4 |
| | — |
|
| Latin America | 1 |
| | 2 |
| | 73 |
| | 76 |
| | 671 |
| | 747 |
| | — |
| — |
| | — |
| | 79 |
| | 79 |
| | 610 |
| | 689 |
| | — |
|
| Caterpillar Power Finance | — |
| | — |
| | — |
| | — |
| | 2 |
| | 2 |
| | — |
| — |
| | — |
| | — |
| | — |
| | 2 |
| | 2 |
| | — |
|
| Total | $ | 214 |
| | $ | 165 |
| | $ | 542 |
| | $ | 921 |
| | $ | 21,581 |
| | $ | 22,502 |
| | $ | 54 |
| $ | 279 |
| | $ | 100 |
| | $ | 646 |
| | $ | 1,025 |
| | $ | 21,437 |
| | $ | 22,462 |
| | $ | 26 |
|
| | | | | | | | | | | | | | | | | | | | | | | | | | | |
|
| | | | | | | | | | | | | | | | | | | | | | | | | | | |
| | | | | | | | | | | | | | |
| | December 31, 2017 |
(Millions of dollars) | 31-60 Days Past Due | | 61-90 Days Past Due | | 91+ Days Past Due | | Total Past Due | | Current | | Recorded Investment in Finance Receivables | | 91+ Still Accruing |
| Customer | |
| | |
| | |
| | |
| | |
| | |
| | |
|
| North America | $ | 71 |
| | $ | 15 |
| | $ | 42 |
| | $ | 128 |
| | $ | 7,950 |
| | $ | 8,078 |
| | $ | 8 |
|
| Europe | 21 |
| | 10 |
| | 46 |
| | 77 |
| | 2,718 |
| | 2,795 |
| | 13 |
|
| Asia Pacific | 13 |
| | 7 |
| | 14 |
| | 34 |
| | 2,009 |
| | 2,043 |
| | 5 |
|
| Mining | 3 |
| | 1 |
| | 60 |
| | 64 |
| | 1,751 |
| | 1,815 |
| | 9 |
|
| Latin America | 37 |
| | 55 |
| | 142 |
| | 234 |
| | 1,531 |
| | 1,765 |
| | — |
|
| Caterpillar Power Finance | 20 |
| | 32 |
| | 144 |
| | 196 |
| | 2,476 |
| | 2,672 |
| | 1 |
|
| Dealer | |
| | |
| | |
| | |
| | |
| | |
| | |
|
| North America | — |
| | — |
| | — |
| | — |
| | 1,920 |
| | 1,920 |
| | — |
|
| Europe | — |
| | — |
| | — |
| | — |
| | 222 |
| | 222 |
| | — |
|
| Asia Pacific | — |
| | — |
| | — |
| | — |
| | 553 |
| | 553 |
| | — |
|
| Mining | — |
| | — |
| | — |
| | — |
| | 4 |
| | 4 |
| | — |
|
| Latin America | — |
| | 72 |
| | — |
| | 72 |
| | 691 |
| | 763 |
| | — |
|
| Caterpillar Power Finance | — |
| | — |
| | — |
| | — |
| | 2 |
| | 2 |
| | — |
|
| Total | $ | 165 |
| | $ | 192 |
| | $ | 448 |
| | $ | 805 |
| | $ | 21,827 |
| | $ | 22,632 |
| | $ | 36 |
|
| | | | | | | | | | | | | | |
As of March 31, 2018, Cat Financial had $221 million of finance receivables classified as held for sale.
Impaired finance receivables
For all classes, a finance receivable is considered impaired, based on current information and events, if it is probable that Cat Financial will be unable to collect all amounts due according to the contractual terms. Impaired finance receivables include finance receivables that have been restructured and are considered to be troubled debt restructurings.
There were no impaired finance receivables as of March 31,September 30, 2018 or December 31, 2017, for the Dealer portfolio segment. Cat Financial’s recorded investment in impaired finance receivables and the related unpaid principal balances and allowance for the Customer portfolio segment were as follows:
| | | | March 31, 2018 | | December 31, 2017 | September 30, 2018 | | December 31, 2017 |
| (Millions of dollars) | Recorded Investment | | Unpaid Principal Balance | | Related Allowance | | Recorded Investment | | Unpaid Principal Balance | | Related Allowance | Recorded Investment | | Unpaid Principal Balance | | Related Allowance | | Recorded Investment | | Unpaid Principal Balance | | Related Allowance |
| Impaired Finance Receivables With No Allowance Recorded | |
| | |
| | |
| | |
| | |
| | |
| |
| | |
| | |
| | |
| | |
| | |
|
| North America | $ | 16 |
| | $ | 16 |
| | $ | — |
| | $ | 19 |
| | $ | 19 |
| | $ | — |
| $ | 17 |
| | $ | 17 |
| | $ | — |
| | $ | 19 |
| | $ | 19 |
| | $ | — |
|
| Europe | 7 |
| | 7 |
| | — |
| | 45 |
| | 45 |
| | — |
| 2 |
| | 1 |
| | — |
| | 45 |
| | 45 |
| | — |
|
| Asia Pacific | 27 |
| | 27 |
| | — |
| | 34 |
| | 33 |
| | — |
| 28 |
| | 28 |
| | — |
| | 34 |
| | 33 |
| | — |
|
| Mining | 50 |
| | 50 |
| | — |
| | 121 |
| | 121 |
| | — |
| 34 |
| | 34 |
| | — |
| | 121 |
| | 121 |
| | — |
|
| Latin America | 46 |
| | 46 |
| | — |
| | 45 |
| | 45 |
| | — |
| 31 |
| | 31 |
| | — |
| | 45 |
| | 45 |
| | — |
|
| Caterpillar Power Finance | 195 |
| | 207 |
| | — |
| | 160 |
| | 172 |
| | — |
| 61 |
| | 74 |
| | — |
| | 160 |
| | 172 |
| | — |
|
| Total | $ | 341 |
| | $ | 353 |
| | $ | — |
| | $ | 424 |
| | $ | 435 |
| | $ | — |
| $ | 173 |
| | $ | 185 |
| | $ | — |
| | $ | 424 |
| | $ | 435 |
| | $ | — |
|
| | | | | | | | | | | | | | | | | | | | | | | |
| Impaired Finance Receivables With An Allowance Recorded | |
| | |
| | |
| | |
| | |
| | |
| |
| | |
| | |
| | |
| | |
| | |
|
| North America | $ | 60 |
| | $ | 58 |
| | $ | 21 |
| | $ | 44 |
| | $ | 43 |
| | $ | 17 |
| $ | 41 |
| | $ | 39 |
| | $ | 18 |
| | $ | 44 |
| | $ | 43 |
| | $ | 17 |
|
| Europe | 49 |
| | 49 |
| | 13 |
| | 9 |
| | 8 |
| | 5 |
| 66 |
| | 66 |
| | 36 |
| | 9 |
| | 8 |
| | 5 |
|
| Asia Pacific | 4 |
| | 4 |
| | 1 |
| | 8 |
| | 8 |
| | 2 |
| 2 |
| | 2 |
| | 1 |
| | 8 |
| | 8 |
| | 2 |
|
| Mining | 67 |
| | 67 |
| | 18 |
| | — |
| | — |
| | — |
| 58 |
| | 58 |
| | 22 |
| | — |
| | — |
| | — |
|
| Latin America | 71 |
| | 71 |
| | 40 |
| | 95 |
| | 106 |
| | 42 |
| 61 |
| | 61 |
| | 34 |
| | 95 |
| | 106 |
| | 42 |
|
| Caterpillar Power Finance | 379 |
| | 381 |
| | 101 |
| | 362 |
| | 365 |
| | 83 |
| 401 |
| | 408 |
| | 118 |
| | 362 |
| | 365 |
| | 83 |
|
| Total | $ | 630 |
| | $ | 630 |
| | $ | 194 |
| | $ | 518 |
| | $ | 530 |
| | $ | 149 |
| $ | 629 |
| | $ | 634 |
| | $ | 229 |
| | $ | 518 |
| | $ | 530 |
| | $ | 149 |
|
| | | | | | | | | | | | | | | | | | | | | | | |
| Total Impaired Finance Receivables | |
| | |
| | |
| | |
| | |
| | |
| |
| | |
| | |
| | |
| | |
| | |
|
| North America | $ | 76 |
| | $ | 74 |
| | $ | 21 |
| | $ | 63 |
| | $ | 62 |
|
| $ | 17 |
| $ | 58 |
| | $ | 56 |
| | $ | 18 |
| | $ | 63 |
| | $ | 62 |
|
| $ | 17 |
|
| Europe | 56 |
| | 56 |
| | 13 |
| | 54 |
| | 53 |
|
| 5 |
| 68 |
| | 67 |
| | 36 |
| | 54 |
| | 53 |
|
| 5 |
|
| Asia Pacific | 31 |
| | 31 |
| | 1 |
| | 42 |
| | 41 |
|
| 2 |
| 30 |
| | 30 |
| | 1 |
| | 42 |
| | 41 |
|
| 2 |
|
| Mining | 117 |
| | 117 |
| | 18 |
| | 121 |
| | 121 |
| | — |
| 92 |
| | 92 |
| | 22 |
| | 121 |
| | 121 |
| | — |
|
| Latin America | 117 |
| | 117 |
| | 40 |
| | 140 |
| | 151 |
|
| 42 |
| 92 |
| | 92 |
| | 34 |
| | 140 |
| | 151 |
|
| 42 |
|
| Caterpillar Power Finance | 574 |
| | 588 |
| | 101 |
| | 522 |
| | 537 |
|
| 83 |
| 462 |
| | 482 |
| | 118 |
| | 522 |
| | 537 |
|
| 83 |
|
| Total | $ | 971 |
| | $ | 983 |
| | $ | 194 |
| | $ | 942 |
| | $ | 965 |
| | $ | 149 |
| $ | 802 |
| | $ | 819 |
| | $ | 229 |
| | $ | 942 |
| | $ | 965 |
| | $ | 149 |
|
| | | | | | | | | | | | | | | | | | | | | | | |
| | | | Three Months Ended
March 31, 2018 | | Three Months Ended
March 31, 2017 | Three Months Ended September 30, 2018 | | Three Months Ended September 30, 2017 |
| (Millions of dollars) | Average Recorded Investment | | Interest Income Recognized | | Average Recorded Investment | | Interest Income Recognized | Average Recorded Investment | | Interest Income Recognized | | Average Recorded Investment | | Interest Income Recognized |
| Impaired Finance Receivables With No Allowance Recorded | |
| | |
| | |
| | |
| |
| | |
| | |
| | |
|
| North America | $ | 17 |
| | $ | — |
| | $ | 10 |
| | $ | — |
| $ | 19 |
| | $ | — |
| | $ | 14 |
| | $ | 1 |
|
| Europe | 36 |
| | — |
| | 49 |
| | — |
| 4 |
| | — |
| | 47 |
| | — |
|
| Asia Pacific | 31 |
| | 1 |
| | 9 |
| | — |
| 29 |
| | 1 |
| | 30 |
| | 1 |
|
| Mining | 103 |
| | 1 |
| | 128 |
| | 1 |
| 35 |
| | — |
| | 128 |
| | 1 |
|
| Latin America | 45 |
| | 1 |
| | 72 |
| | 1 |
| 37 |
| | 1 |
| | 68 |
| | 1 |
|
| Caterpillar Power Finance | 172 |
| | 2 |
| | 267 |
| | 3 |
| 94 |
| | 2 |
| | 171 |
| | 1 |
|
| Total | $ | 404 |
| | $ | 5 |
| | $ | 535 |
| | $ | 5 |
| $ | 218 |
| | $ | 4 |
| | $ | 458 |
| | $ | 5 |
|
| | | | | | | | | | | | | | | |
| Impaired Finance Receivables With An Allowance Recorded | |
| | |
| | |
| | |
| |
| | |
| | |
| | |
|
| North America | $ | 51 |
| | $ | 1 |
| | $ | 61 |
| | $ | — |
| $ | 47 |
| | $ | — |
| | $ | 44 |
| | $ | — |
|
| Europe | 19 |
| | — |
| | 6 |
| | — |
| 59 |
| | — |
| | 6 |
| | — |
|
| Asia Pacific | 6 |
| | — |
| | 45 |
| | 1 |
| 2 |
| | — |
| | 28 |
| | 1 |
|
| Mining | 17 |
| | — |
| | — |
| | — |
| 60 |
| | 1 |
| | — |
| | — |
|
| Latin America | 87 |
| | 1 |
| | 96 |
| | 1 |
| 51 |
| | 1 |
| | 102 |
| | 1 |
|
| Caterpillar Power Finance | 360 |
| | 1 |
| | 63 |
| | 1 |
| 374 |
| | 4 |
| | 251 |
| | 3 |
|
| Total | $ | 540 |
| | $ | 3 |
| | $ | 271 |
| | $ | 3 |
| $ | 593 |
| | $ | 6 |
| | $ | 431 |
| | $ | 5 |
|
| | | | | | | | | | | | | | | |
| Total Impaired Finance Receivables | |
| | |
| | |
| | |
| |
| | |
| | |
| | |
|
| North America | $ | 68 |
| | $ | 1 |
| | $ | 71 |
| | $ | — |
| $ | 66 |
| | $ | — |
| | $ | 58 |
| | $ | 1 |
|
| Europe | 55 |
| | — |
| | 55 |
| | — |
| 63 |
| | — |
| | 53 |
| | — |
|
| Asia Pacific | 37 |
| | 1 |
| | 54 |
| | 1 |
| 31 |
| | 1 |
| | 58 |
| | 2 |
|
| Mining | 120 |
| | 1 |
| | 128 |
| | 1 |
| 95 |
| | 1 |
| | 128 |
| | 1 |
|
| Latin America | 132 |
| | 2 |
| | 168 |
| | 2 |
| 88 |
| | 2 |
| | 170 |
| | 2 |
|
| Caterpillar Power Finance | 532 |
| | 3 |
| | 330 |
| | 4 |
| 468 |
| | 6 |
| | 422 |
| | 4 |
|
| Total | $ | 944 |
| | $ | 8 |
| | $ | 806 |
| | $ | 8 |
| $ | 811 |
| | $ | 10 |
| | $ | 889 |
| | $ | 10 |
|
|
|
| | | | | | | | | | | | | | | |
| | Nine Months Ended September 30, 2018 | | Nine Months Ended September 30, 2017 |
| (Millions of dollars) | Average Recorded Investment | | Interest Income Recognized | | Average Recorded Investment | | Interest Income Recognized |
| Impaired Finance Receivables With No Allowance Recorded | |
| | |
| | |
| | |
|
| Customer | |
| | |
| | |
| | |
|
| North America | $ | 17 |
| | $ | 1 |
| | $ | 12 |
| | $ | 1 |
|
| Europe | 17 |
| | — |
| | 48 |
| | 1 |
|
| Asia Pacific | 30 |
| | 2 |
| | 22 |
| | 2 |
|
| Mining | 65 |
| | 2 |
| | 128 |
| | 5 |
|
| Latin America | 41 |
| | 2 |
| | 69 |
| | 2 |
|
| Caterpillar Power Finance | 149 |
| | 5 |
| | 233 |
| | 7 |
|
| Total | $ | 319 |
| | $ | 12 |
| | $ | 512 |
| | $ | 18 |
|
| | | | | | | | |
| Impaired Finance Receivables With An Allowance Recorded | |
| | |
| | |
| | |
|
| Customer | |
| | |
| | |
| | |
|
| North America | $ | 51 |
| | $ | 1 |
| | $ | 52 |
| | $ | 1 |
|
| Europe | 41 |
| | 1 |
| | 6 |
| | — |
|
| Asia Pacific | 4 |
| | — |
| | 35 |
| | 2 |
|
| Mining | 43 |
| | 2 |
| | — |
| | — |
|
| Latin America | 69 |
| | 3 |
| | 101 |
| | 3 |
|
| Caterpillar Power Finance | 364 |
| | 8 |
| | 141 |
| | 4 |
|
| Total | $ | 572 |
| | $ | 15 |
| | $ | 335 |
| | $ | 10 |
|
| | | | | | | | |
| Total Impaired Finance Receivables | |
| | |
| | |
| | |
|
| Customer | |
| | |
| | |
| | |
|
| North America | $ | 68 |
| | $ | 2 |
| | $ | 64 |
| | $ | 2 |
|
| Europe | 58 |
| | 1 |
| | 54 |
| | 1 |
|
| Asia Pacific | 34 |
| | 2 |
| | 57 |
| | 4 |
|
| Mining | 108 |
| | 4 |
| | 128 |
| | 5 |
|
| Latin America | 110 |
| | 5 |
| | 170 |
| | 5 |
|
| Caterpillar Power Finance | 513 |
| | 13 |
| | 374 |
| | 11 |
|
| Total | $ | 891 |
| | $ | 27 |
| | $ | 847 |
| | $ | 28 |
|
| | | | | | | | |
Recognition of income is suspended and the finance receivable is placed on non-accrual status when management determines that collection of future income is not probable (generally after 120 days past due). Recognition is resumed and previously suspended income is recognized when the finance receivable becomes current and collection of remaining amounts is considered probable. Payments received while the finance receivable is on non-accrual status are applied to interest and principal in accordance with the contractual terms.
As of March 31,September 30, 2018, there were finance receivables on non-accrual status for the Dealer portfolio segment of $73$79 million, all of which were in the Latin America finance receivable class. As of December 31, 2017, there were no finance receivables on non-accrual status for the Dealer portfolio segment. The recorded investment in customer finance receivables on non-accrual status was as follows:
| | | | | | | | | |
(Millions of dollars) | March 31, 2018 | | December 31, 2017 | September 30, 2018 | | December 31, 2017 |
| North America | $ | 50 |
| | $ | 38 |
| $ | 44 |
| | $ | 38 |
|
| Europe | 50 |
| | 37 |
| 124 |
| | 37 |
|
| Asia Pacific | 8 |
| | 10 |
| 4 |
| | 10 |
|
| Mining | 14 |
| | 63 |
| 10 |
| | 63 |
|
| Latin America | 174 |
| | 192 |
| 118 |
| | 192 |
|
| Caterpillar Power Finance | 339 |
| | 343 |
| 451 |
| | 343 |
|
| Total | $ | 635 |
| | $ | 683 |
| $ | 751 |
| | $ | 683 |
|
| | | | | | | |
Troubled Debt Restructurings
A restructuring of a finance receivable constitutes a troubled debt restructuring (TDR) when the lender grants a concession it would not otherwise consider to a borrower experiencing financial difficulties. Concessions granted may include extended contract maturities, inclusion of interest only periods, below market interest rates, extended skip payment periods and reduction of principal and/or accrued interest.
As of March 31,September 30, 2018 and December 31, 2017, there were no additional funds committed to lend to a borrower whose terms have been modified in a TDR.
There were no finance receivables modified as TDRs during the three or nine months ended March 31,September 30, 2018 or 2017 for the Dealer portfolio segment. Cat Financial's investment in finance receivables in the Customer portfolio segment modified as TDRs during the three and nine months ended March 31,September 30, 2018 and 2017, were as follows:
| | | | | | | | | | | | | | | | | | | | | | | | | |
| | | Three Months Ended March 31, 2018 | | Three Months Ended March 31, 2017 | | Three Months Ended September 30, 2018 | | Three Months Ended September 30, 2017 |
(Millions of dollars) | | Number of Contracts | | Pre-TDR Recorded Investment | | Post-TDR Recorded Investment | | Number of Contracts | | Pre-TDR Recorded Investment | | Post-TDR Recorded Investment | | Number of Contracts | | Pre-TDR Recorded Investment | | Post-TDR Recorded Investment | | Number of Contracts | | Pre-TDR Recorded Investment | | Post-TDR Recorded Investment |
| North America | | 13 | | $ | 6 |
| | $ | 6 |
| | 9 | | $ | 1 |
| | $ | 1 |
| | 4 | | $ | — |
| | $ | — |
| | 11 | | $ | 4 |
| | $ | 5 |
|
| Europe | | — | | — |
| | — |
| | 1 | | — |
| | — |
| | — | | — |
| | — |
| | 1 | | — |
| | — |
|
| Latin America | | | — | | — |
| | — |
| | 3 | | 21 |
| | 22 |
|
| Caterpillar Power Finance | | | 2 | | 40 |
| | 40 |
| | 5 | | 51 |
| | 44 |
|
| Total | | | 6 | | $ | 40 |
| | $ | 40 |
| | 20 | | $ | 76 |
| | $ | 71 |
|
| | | | | | | | | | | | | | |
| | | | Nine Months Ended September 30, 2018 | | Nine Months Ended September 30, 2017 |
| | | | Number of Contracts | | Pre-TDR Outstanding Recorded Investment | | Post-TDR Outstanding Recorded Investment | | Number of Contracts | | Pre-TDR Outstanding Recorded Investment | | Post-TDR Outstanding Recorded Investment |
| North America | | | 34 |
| | $ | 13 |
| | $ | 13 |
| | 37 |
| | $ | 13 |
| | $ | 13 |
|
| Europe | | | — |
| | — |
| | — |
| | 2 |
| | — |
| | — |
|
| Asia Pacific | | — | | — |
| | — |
| | 5 | | 39 |
| | 30 |
| | — |
| | — |
| | — |
| | 6 |
| | 39 |
| | 30 |
|
| Mining | | 1 | | 29 |
| | 29 |
| | 2 | | 57 |
| | 56 |
| | 1 |
| | 29 |
| | 29 |
| | 2 |
| | 57 |
| | 56 |
|
| Latin America | | 1 | | 3 |
| | 3 |
| | 7 | | 2 |
| | 2 |
| | 1 |
| | 3 |
| | 3 |
| | 17 |
| | 26 |
| | 27 |
|
| Caterpillar Power Finance | | 3 | | 3 |
| | 3 |
| | 6 | | 25 |
| | 24 |
| |
Caterpillar Power Finance 1 | | | 7 |
| | 93 |
| | 60 |
| | 59 |
| | 319 |
| | 305 |
|
| Total | | 18 | | $ | 41 |
| | $ | 41 |
| | 30 | | $ | 124 |
| | $ | 113 |
| | 43 |
| | $ | 138 |
| | $ | 105 |
| | 123 |
| | $ | 454 |
| | $ | 431 |
|
| | | | | | | | | | | | | | |
1In Caterpillar Power Finance, during the nine months ended September 30, 2017, 44 contracts with a pre-TDR recorded investment of $200 million and a post-TDR recorded investment of $200 million were related to four customers.
TDRs in the Customer portfolio segment with a payment default (defined as 91+ days past due) which had been modified within twelve months prior to the default date, were as follows:
|
| | | | | | | | | | | |
| | | | | | | | |
| | Three Months Ended September 30, 2018 | | Three Months Ended September 30, 2017 |
(Millions of dollars) | Number of Contracts | | Post-TDR Recorded Investment | | Number of Contracts | | Post-TDR Recorded Investment |
| Customer | | | |
| | | | |
| North America | 7 | | $ | 9 |
| | — | | $ | — |
|
| Latin America | 1 | | — |
| | 1 | | — |
|
| Caterpillar Power Finance | 3 | | 33 |
| | — | | — |
|
| Total | 11 | | $ | 42 |
| | 1 | | $ | — |
|
| | | | | | | | |
|
| | | | | | | | | | | |
| | | | | | | | |
| | Nine Months Ended September 30, 2018 | | Nine Months Ended September 30, 2017 |
| | Number of Contracts | | Post-TDR Recorded Investment | | Number of Contracts | | Post-TDR Recorded Investment |
| Customer | | | |
| | | | |
| North America | 10 | | $ | 10 |
| | — | | $ | — |
|
| Latin America | 3 | | 1 |
| | 241 | | 16 |
|
| Caterpillar Power Finance | 3 | | 33 |
| | — | | — |
|
| Total | 16 | | $ | 44 |
| | 241 | | $ | 16 |
|
| | | | | | | | |
17. Fair value disclosures
A. Fair value measurements
The guidance on fair value measurements defines fair value as the exchange price that would be received for an asset or paid to transfer a liability (an exit price) in the principal or most advantageous market for the asset or liability in an orderly transaction between market participants. This guidance also specifies a fair value hierarchy based upon the observability of inputs used in valuation techniques. Observable inputs (highest level) reflect market data obtained from independent sources, while unobservable inputs (lowest level) reflect internally developed market assumptions. In accordance with this guidance, fair value measurements are classified under the following hierarchy:
Level 1 – Quoted prices for identical instruments in active markets.
Level 2 – Quoted prices for similar instruments in active markets; quoted prices for identical or similar instruments in markets that are not active; and model-derived valuations in which all significant inputs or significant value-drivers are observable in active markets.
Level 3 – Model-derived valuations in which one or more significant inputs or significant value-drivers are unobservable.
When available, we use quoted market prices to determine fair value, and we classify such measurements within Level 1. In some cases where market prices are not available, we make use of observable market based inputs to calculate fair value, in which case the measurements are classified within Level 2. If quoted or observable market prices are not available, fair value is based upon valuations in which one or more significant inputs are unobservable, including internally developed models that use, where possible, current market-based parameters such as interest rates, yield curves and currency rates. These measurements are classified within Level 3.
Fair value measurements are classified according to the lowest level input or value-driver that is significant to the valuation. A measurement may therefore be classified within Level 3 even though there may be significant inputs that are readily observable.
Fair value measurement includes the consideration of nonperformance risk. Nonperformance risk refers to the risk that an obligation (either by a counterparty or Caterpillar) will not be fulfilled. For financial assets traded in an active market (Level 1 and certain Level 2), the nonperformance risk is included in the market price. For certain other financial assets and liabilities (certain Level 2 and Level 3), our fair value calculations have been adjusted accordingly.
Investments in debt and equity securities
We have investments in certain debt and equity securities, primarily at Insurance Services, that are recorded at fair value. Fair values for our U.S. treasury bonds and large capitalization value and smaller company growth equity securities are based upon valuations for identical instruments in active markets. Fair values for other government bonds, corporate bonds and mortgage-backed debt securities are based upon models that take into consideration such market-based factors as recent sales, risk-free yield curves and prices of similarly rated bonds.
In addition, Insurance Services has an equity investment in a real estate investment trust (REIT) which is recorded at fair value based on the net asset value (NAV) of the investment. Beginning January 1, 2018, we adopted new accounting guidance issued by the FASB which results in the fair value of the REIT no longer being classified within the fair value hierarchy. Prior to January 1, 2018, the fair value was classified as Level 3.
See Note 8 for additional information on our investments in debt and equity securities.
Derivative financial instruments
The fair value of interest rate contracts is primarily based on models that utilize the appropriate market-based forward swap curves and zero-coupon interest rates to determine discounted cash flows. The fair value of foreign currency and commodity forward, option and cross currency contracts is based on a valuation model that discounts cash flows resulting from the differential between the contract price and the market-based forward rate.
Assets and liabilities measured on a recurring basis at fair value, primarily related to Financial Products, included in our Consolidated Statement of Financial Position as of March 31,September 30, 2018 and December 31, 2017 are summarized below:
| | | | March 31, 2018 | September 30, 2018 |
(Millions of dollars) | Level 1 | | Level 2 | | Level 3 | | Measured at NAV | | Total Assets / Liabilities, at Fair Value | Level 1 | | Level 2 | | Level 3 | | Measured at NAV | | Total Assets / Liabilities, at Fair Value |
| Assets | |
| | |
| | |
| | | | |
| |
| | |
| | |
| | | | |
|
| Debt securities | |
| | |
| | |
| | | | |
| |
| | |
| | |
| | | | |
|
| Government debt | |
| | |
| | |
| | | | |
| |
| | |
| | |
| | | | |
|
| U.S. treasury bonds | $ | 13 |
| | $ | — |
| | $ | — |
| | $ | — |
| | $ | 13 |
| $ | 9 |
| | $ | — |
| | $ | — |
| | $ | — |
| | $ | 9 |
|
| Other U.S. and non-U.S. government bonds | — |
| | 51 |
| | — |
| | — |
| | 51 |
| — |
| | 48 |
| | — |
| | — |
| | 48 |
|
| Corporate bonds | |
| | |
| | |
| | | | |
| |
| | |
| | |
| | | | |
|
| Corporate bonds | — |
| | 640 |
| | — |
| | — |
| | 640 |
| — |
| | 710 |
| | — |
| | — |
| | 710 |
|
| Asset-backed securities | — |
| | 63 |
| | — |
| | — |
| | 63 |
| — |
| | 61 |
| | — |
| | — |
| | 61 |
|
| Mortgage-backed debt securities | |
| | |
| | |
| | | | |
| |
| | |
| | |
| | | | |
|
| U.S. governmental agency | — |
| | 285 |
| | — |
| | — |
| | 285 |
| — |
| | 290 |
| | — |
| | — |
| | 290 |
|
| Residential | — |
| | 8 |
| | — |
| | — |
| | 8 |
| — |
| | 7 |
| | — |
| | — |
| | 7 |
|
| Commercial | — |
| | 16 |
| | — |
| | — |
| | 16 |
| — |
| | 14 |
| | — |
| | — |
| | 14 |
|
| Total debt securities | 13 |
| | 1,063 |
| | — |
| | — |
| | 1,076 |
| 9 |
| | 1,130 |
| | — |
| | — |
| | 1,139 |
|
| Equity securities | |
| | |
| | |
| | | | |
| |
| | |
| | |
| | | | |
|
| Large capitalization value | 281 |
| | — |
| | — |
| | — |
| | 281 |
| 298 |
| | — |
| | — |
| | — |
| | 298 |
|
| Smaller company growth | 58 |
| | — |
| | — |
| | — |
| | 58 |
| 65 |
| | — |
| | — |
| | — |
| | 65 |
|
| REIT | — |
| | — |
| | — |
| | 112 |
| | 112 |
| — |
| | — |
| | — |
| | 117 |
| | 117 |
|
| Total equity securities | 339 |
| | — |
| | — |
| | 112 |
| | 451 |
| 363 |
| | — |
| | — |
| | 117 |
| | 480 |
|
| Derivative financial instruments, net | | — |
| | 22 |
| | — |
| | — |
| | 22 |
|
| Total assets | $ | 352 |
| | $ | 1,063 |
| | $ | — |
| | $ | 112 |
| | $ | 1,527 |
| $ | 372 |
| | $ | 1,152 |
| | $ | — |
| | $ | 117 |
| | $ | 1,641 |
|
| Liabilities | |
| | |
| | |
| | | | |
| |
| Derivative financial instruments, net | — |
| | 44 |
| | — |
| | — |
| | 44 |
| |
| Total liabilities | $ | — |
| | $ | 44 |
| | $ | — |
| | $ | — |
| | $ | 44 |
| |
| | | | | | | | | | | | | | | | | | | |
| | | | | | | | | | | | | | | | | | | |
|
| | | | | | | | | | | | | | | |
| | December 31, 2017 |
(Millions of dollars) | Level 1 | | Level 2 | | Level 3 | | Total Assets / Liabilities, at Fair Value |
| Assets | |
| | |
| | |
| | |
|
| Debt securities | |
| | |
| | |
| | |
|
| Government debt | |
| | |
| | |
| | |
|
| U.S. treasury bonds | $ | 10 |
| | $ | — |
| | $ | — |
| | $ | 10 |
|
| Other U.S. and non-U.S. government bonds | — |
| | 42 |
| | — |
| | 42 |
|
| Corporate bonds | |
| | |
| | |
| | |
|
| Corporate bonds | — |
| | 584 |
| | — |
| | 584 |
|
| Asset-backed securities | — |
| | 67 |
| | — |
| | 67 |
|
| Mortgage-backed debt securities | |
| | | | |
| | |
|
| U.S. governmental agency | — |
| | 261 |
| | — |
| | 261 |
|
| Residential | — |
| | 8 |
| | — |
| | 8 |
|
| Commercial | — |
| | 17 |
| | — |
| | 17 |
|
| Total debt securities | 10 |
| | 979 |
| | — |
| | 989 |
|
| Equity securities | |
| | |
| | |
| | |
|
| Large capitalization value | 284 |
| | — |
| | — |
| | 284 |
|
| Smaller company growth | 56 |
| | — |
| | — |
| | 56 |
|
| REIT | — |
| | — |
| | 110 |
| | 110 |
|
| Total equity securities | 340 |
| | — |
| | 110 |
| | 450 |
|
| Total assets | $ | 350 |
| | $ | 979 |
| | $ | 110 |
| | $ | 1,439 |
|
| Liabilities | |
| | |
| | |
| | |
|
| Derivative financial instruments, net | $ | — |
| | $ | 19 |
| | $ | — |
| | $ | 19 |
|
| Total liabilities | $ | — |
| | $ | 19 |
| | $ | — |
| | $ | 19 |
|
| | | | | | | | |
| | | | | | | | |
In addition to the amounts above, Cat Financial impaired loans are subject to measurement at fair value on a nonrecurring basis and are classified as Level 3 measurements. A loan is considered impaired when management determines that collection of contractual amounts due is not probable. In these cases, an allowance for credit losses may be established based either on the present value of expected future cash flows discounted at the receivables' effective interest rate, the fair value of the collateral for collateral-dependent receivables, or the observable market price of the receivable. In determining collateral value, Cat Financial estimates the current fair market value of the collateral less selling costs. Cat Financial had impaired loans with a fair value of $390$366 million and $341 million as of March 31,September 30, 2018 and December 31, 2017, respectively.
B. Fair values of financial instruments
In addition to the methods and assumptions we use to record the fair value of financial instruments as discussed in the Fair value measurements section above, we used the following methods and assumptions to estimate the fair value of our financial instruments:
Cash and short-term investments
Carrying amount approximated fair value.
Restricted cash and short-term investments
Carrying amount approximated fair value. Restricted cash and short-term investments are included in Prepaid expenses and other current assets in the Consolidated Statement of Financial Position.
Finance receivables
Fair value was estimated by discounting the future cash flows using current rates, representative of receivables with similar remaining maturities.
Wholesale inventory receivables
Fair value was estimated by discounting the future cash flows using current rates, representative of receivables with similar remaining maturities.
Short-term borrowings
Carrying amount approximated fair value.
Long-term debt
Fair value for fixed and floating rate debt was estimated based on quoted market prices.
Guarantees
The fair value of guarantees is based upon our estimate of the premium a market participant would require to issue the same guarantee in a stand-alone arms-length transaction with an unrelated party. If quoted or observable market prices are not available, fair value is based upon internally developed models that utilize current market-based assumptions.
Please refer to the table below for the fair values of our financial instruments.
| | | | | Fair Value of Financial Instruments | | | Fair Value of Financial Instruments | |
| | | March 31, 2018 | | December 31, 2017 | | | | September 30, 2018 | | December 31, 2017 | | |
| (Millions of dollars) | | Carrying Amount | | Fair Value | | Carrying Amount | | Fair Value | | Fair Value Levels | | Reference | | Carrying Amount | | Fair Value | | Carrying Amount | | Fair Value | | Fair Value Levels | | Reference |
| Assets | | |
| | |
| | |
| | |
| | | | |
| | |
| | |
| | |
| | |
| Cash and short-term investments | | $ | 7,888 |
| | $ | 7,888 |
| | $ | 8,261 |
| | $ | 8,261 |
| | 1 | | | | $ | 8,007 |
| | $ | 8,007 |
| | $ | 8,261 |
| | $ | 8,261 |
| | 1 | | |
| Restricted cash and short-term investments | | $ | 174 |
| | $ | 174 |
| | $ | 194 |
| | $ | 194 |
| | 1 | | | | $ | 39 |
| | $ | 39 |
| | $ | 194 |
| | $ | 194 |
| | 1 | | |
| Investments in debt and equity securities | | $ | 1,527 |
| | $ | 1,527 |
| | $ | 1,439 |
| | $ | 1,439 |
| | 1, 2 & 3 | | Note 8 | | $ | 1,619 |
| | $ | 1,619 |
| | $ | 1,439 |
| | $ | 1,439 |
| | 1, 2 & 3 | | Note 8 |
Finance receivables – net (excluding finance leases 1) | | $ | 15,174 |
| | $ | 15,157 |
| | $ | 15,452 |
| | $ | 15,438 |
| | 3 | | Note 16 | | $ | 14,815 |
| | $ | 14,764 |
| | $ | 15,452 |
| | $ | 15,438 |
| | 3 | | Note 16 |
Wholesale inventory receivables – net (excluding finance leases 1) | | $ | 1,068 |
| | $ | 1,041 |
| | $ | 1,153 |
| | $ | 1,123 |
| | 3 | | Note 16 | | $ | 1,194 |
| | $ | 1,168 |
| | $ | 1,153 |
| | $ | 1,123 |
| | 3 | |
| Foreign currency contracts – net | | | $ | 13 |
| | $ | 13 |
| | $ | — |
| | $ | — |
| | 2 | | Note 5 |
| Interest rate contracts – net | | $ | — |
| | $ | — |
| | $ | 1 |
| | $ | 1 |
| | 2 | | Note 5 | | $ | 7 |
| | $ | 7 |
| | $ | 1 |
| | $ | 1 |
| | 2 | | Note 5 |
| Commodity contracts – net | | $ | 6 |
| | $ | 6 |
| | $ | 21 |
| | $ | 21 |
| | 2 | | Note 5 | | $ | 2 |
| | $ | 2 |
| | $ | 21 |
| | $ | 21 |
| | 2 | | Note 5 |
| | | | | | | | | | |
| | | | | | | | | |
|
| Liabilities | | |
| | |
| | |
| | |
| | | | |
| | |
| | |
| | |
| | |
| Short-term borrowings | | $ | 5,733 |
| | $ | 5,733 |
| | $ | 4,837 |
| | $ | 4,837 |
| | 1 | | | | $ | 4,521 |
| | $ | 4,521 |
| | $ | 4,837 |
| | $ | 4,837 |
| | 1 | | |
| Long-term debt (including amounts due within one year) | | |
| | |
| | |
| | |
| | | | |
| | |
| | |
| | |
| | |
| Machinery, Energy & Transportation | | $ | 7,988 |
| | $ | 9,466 |
| | $ | 7,935 |
| | $ | 9,863 |
| | 2 | | | | $ | 8,001 |
| | $ | 9,155 |
| | $ | 7,935 |
| | $ | 9,863 |
| | 2 | | |
| Financial Products | | $ | 21,594 |
| | $ | 21,504 |
| | $ | 22,106 |
| | $ | 22,230 |
| | 2 | | | | $ | 23,251 |
| | $ | 23,110 |
| | $ | 22,106 |
| | $ | 22,230 |
| | 2 | | |
| Foreign currency contracts – net | | $ | 49 |
| | $ | 49 |
| | $ | 41 |
| | $ | 41 |
| | 2 | | Note 5 | | $ | — |
| | $ | — |
| | $ | 41 |
| | $ | 41 |
| | 2 | | Note 5 |
| Interest rate contracts – net | | $ | 1 |
| | $ | 1 |
| | $ | — |
| | $ | — |
| | 2 | | Note 5 | |
| Guarantees | | $ | 8 |
| | $ | 8 |
| | $ | 8 |
| | $ | 8 |
| | 3 | | Note 10 | | $ | 8 |
| | $ | 8 |
| | $ | 8 |
| | $ | 8 |
| | 3 | | Note 10 |
| |
1 | Total excluded items have a net carrying value at March 31,September 30, 2018 and December 31, 2017 of $7,180$7,481 million and $7,063 million, respectively. |
18. Other income (expense)
| | | | | Three Months Ended
March 31 | | Three Months Ended
September 30 | | Nine Months Ended September 30 | |
| (Millions of dollars) | | 2018 | | 2017 | | 2018 | | 2017 | | 2018 | | 2017 | |
| Investment and interest income | | $ | 36 |
| | $ | 22 |
| | $ | 59 |
| | $ | 32 |
| | $ | 139 |
| | $ | 86 |
| |
| Foreign exchange gains (losses) | | (19 | ) | | (48 | ) | |
Foreign exchange gains (losses) 1 | | | (81 | ) | | (29 | ) | | (160 | ) | | (189 | ) | |
| License fee income | | 31 |
| | 22 |
| | 29 |
| | 27 |
| | 96 |
| | 74 |
| |
| Gain on sale of securities and affiliated company | | | 4 |
| | 36 |
| | 4 |
| | 121 |
| 2 |
|
| Net periodic pension and OPEB income (cost), excluding service cost | | 86 |
| | 37 |
| | 85 |
| | 68 |
| | 257 |
| | 172 |
| |
| Miscellaneous income (loss) | | (7 | ) | | (1 | ) | | 6 |
| | (2 | ) | | 14 |
| | (4 | ) | |
| Total | | $ | 127 |
| | $ | 32 |
| | $ | 102 |
| | $ | 132 |
| | $ | 350 |
| | $ | 260 |
| |
1Includes gains (losses) from foreign exchange derivative contracts. See Note 5 for further details.
2Includes pretax gain of $85 million related to the sale of Caterpillar's equity interest in Iron Planet Holdings Inc.
19. Restructuring costs
Our accounting for employee separations is dependent upon how the particular program is designed. For voluntary programs, eligible separation costs are recognized at the time of employee acceptance unless the acceptance requires explicit approval by the company. For involuntary programs, eligible costs are recognized when management has approved the program, the affected employees have been properly notified and the costs are estimable.
Restructuring costs for the three and nine months ended March 31,September 30, 2018 and 2017 were as follows:
| | | | | | | | | | | |
| (Millions of dollars) | | Three Months Ended March 31 | | Three Months Ended September 30 |
| | | 2018 | | 2017 | | 2018 | | 2017 |
Employee separations 1 | | $ | 33 |
| | $ | 464 |
| | $ | 44 |
| | $ | 8 |
|
Contract terminations 1 | | — |
| | 9 |
| | — |
| | 6 |
|
Long-lived asset impairments 1 | | — |
| | 212 |
| | 18 |
| | 31 |
|
Defined benefit plan curtailments and termination benefits 2 | | — |
| | 29 |
| |
Other 3 | | 36 |
| | 38 |
| |
Other 2 | | | 48 |
| | 45 |
|
| Total restructuring costs | | | $ | 110 |
| | $ | 90 |
|
| | | | | | |
| | | | | | |
| | | | Nine Months Ended September 30 |
| | | | 2018 | | 2017 |
Employee separations 1 | | | $ | 121 |
| | $ | 514 |
|
Contract terminations 1 | | | — |
| | 32 |
|
Long-lived asset impairments 1 | | | 49 |
| | 306 |
|
Defined benefit plan curtailments and termination benefits 3 | | | — |
| | 29 |
|
Other 2 | | | 123 |
| | 130 |
|
| Total restructuring costs | | $ | 69 |
| | $ | 752 |
| | $ | 293 |
| | $ | 1,011 |
|
| | | | | | | | | |
1 Recognized in Other operating (income) expenses. | 1 Recognized in Other operating (income) expenses. | 1 Recognized in Other operating (income) expenses. |
2 Recognized in Other income (expense). | |
3 Represents costs related to our restructuring programs, primarily for accelerated depreciation, project management costs and equipment | |
| relocation (all of which are primarily included in Cost of Goods sold). | |
2 Represents costs related to our restructuring programs, primarily for accelerated depreciation, project management costs, equipment relocation, inventory write-downs and LIFO inventory decrement benefits from inventory liquidations at closed facilities, all of which are primarily included in Cost of goods sold. | | 2 Represents costs related to our restructuring programs, primarily for accelerated depreciation, project management costs, equipment relocation, inventory write-downs and LIFO inventory decrement benefits from inventory liquidations at closed facilities, all of which are primarily included in Cost of goods sold. |
3 Recognized in Other income (expense). | | 3 Recognized in Other income (expense). |
| | | | | | | | | |
For the threenine months ended March 31,September 30, 2018, the restructuring costs were primarily related to ongoing facility closures across the company.
The restructuringRestructuring costs of $649 million for the threenine months ended March 31,September 30, 2017, were primarily related to the closure of the facility in Gosselies, Belgium, within Construction Industries. The remaining restructuring costs for the first nine months of 2017 were primarily related to our decision to move production from the Aurora, Illinois, facility into other U.S. manufacturing facilities, as well as other ongoing manufacturing facility consolidations.restructuring actions in Resource Industries.
Restructuring costs are a reconciling item between Segment profit and Consolidated profit before taxes. See Note 15 for more information.
The following table summarizes the 2017 and 2018 employee separation activity:
| | | | | | | |
| (Millions of dollars) | | | | |
| Liability balance at December 31, 2016 | Liability balance at December 31, 2016 | $ | 147 |
| Liability balance at December 31, 2016 | $ | 147 |
|
| Increase in liability (separation charges) | Increase in liability (separation charges) | 525 |
| Increase in liability (separation charges) | 525 |
|
| Reduction in liability (payments) | Reduction in liability (payments) | (423 | ) | Reduction in liability (payments) | (423 | ) |
| Liability balance at December 31, 2017 | Liability balance at December 31, 2017 | $ | 249 |
| Liability balance at December 31, 2017 | $ | 249 |
|
| Increase in liability (separation charges) | Increase in liability (separation charges) | 33 |
| Increase in liability (separation charges) | 121 |
|
| Reduction in liability (payments) | Reduction in liability (payments) | (90 | ) | Reduction in liability (payments) | (233 | ) |
| Liability balance at March 31, 2018 | $ | 192 |
| |
| Liability balance at September 30, 2018 | | Liability balance at September 30, 2018 | $ | 137 |
|
| | | | | |
Most of the liability balance at March 31,September 30, 2018 is expected to be paid in 2018 and primarily includes2019. About one-third of this balance is for employee separation payments related to closure of the Gosselies, Belgium, facility.
In March 2017, Caterpillar informed Belgian authorities of the decision to proceed to a collective dismissal, which will leadled to the closure of the Gosselies site, impacting about 2,000 employees. Production of Caterpillar products at the Gosselies site ended during the second quarter of 2017. The other operations and functions at the Gosselies site are expected to be graduallywere phased out by the end of the second quarter of 2018. We estimate restructuring costs incurred under this program to be about $675 million. In the first threenine months of 2018, we incurred $10$11 million of restructuring costs, and we incurred $653 million in 2017 for a total of $663$664 million through March 31,September 30, 2018. We expect to recognize the remaining costs in 2018.
In September 2015, we announced a large scale restructuring plan (the Plan) including a voluntary retirement enhancement program for qualifying U.S. employees, several voluntary separation programs outside of the U.S., additional involuntary programs throughout the company and manufacturing facility consolidations and closures expected to occur through 2018. The largest action among those included in the Plan was related to our European manufacturing footprint, which led to the Gosselies, Belgium, facility closure as discussed above. In the first threenine months of 2018, we incurred $38$109 million of restructuring costs related to the Plan, and we have incurred $817$1,776 million $281 million and $569 million in 2017, 2016 and 2015, respectively, for a total of $1,705 millionrelated to the Plan through March 31,September 30, 2018. We expect to recognize approximately $150$50 million of additional restructuring costs related to the Plan in 2018.
20. Acquisitions
ECM S.p.A.
On January 2, 2018, we acquired 100 percent of the equity in privately held ECM S.p.A. (ECM). Headquartered in Pistoia, Italy, ECM designs, manufactures, sells and services advanced signal systems for the rail industry. The ECM acquisition will enable uswas executed to expand our presence in the international freight and transit industries through a combination of broad product offerings and strong reputation in the signaling market. The purchase price for the acquisition was $225 million, consisting of $249 million paid at closing, net of $25 million of cash acquired and $1 million of debt assumed.
The transaction was financed with available cash. Tangible assets as of the acquisition date were $107$109 million, recorded at their fair values, and primarily included cash of $25 million, receivables of $31$28 million, inventories of $29 million, and property, plant and equipment of $17 million. Finite-lived intangible assets acquired of $112 million included customer relationships, developed technology and trade names. The finite lived intangible assets are being amortized on a straight-line basis over a weighted-average amortization period of approximately 13 years. Liabilities assumed as of the acquisition date were $80$79 million, recorded at their fair values, and primarily included accounts payable of $38 million and net deferred tax liabilities of $25$29 million. Goodwill of $112$109 million, non-deductible for income tax purposes, represented the excess of the consideration transferred over the net assets recognized and represented the estimated future economic benefits arising from other assets acquired that could not be individually identified and separately recognized. Factors that contributed to a purchase price resulting in the recognition of goodwill include ECM’s strategic fit into our rail product portfolio, the opportunity to provide a complete line-up of signaling and train control systems and the acquired assembled workforce. These values represent a preliminary allocation of purchase price subject to finalization of post-closing procedures. The results of the acquired business for the period from the acquisition date are included in the accompanying consolidated financial statements and reported in the Energy & Transportation segment in Note 15. Assuming this transaction had been made at the beginning of any period presented, the consolidated pro forma results would not be materially different from reported results.
Downer Freight Rail
On January 2, 2018, we completed the acquisition of certain assets and liabilities of the Downer Freight Rail business (Downer Freight Rail). Headquartered in North Ryde, Australia, Downer Freight Rail provides a full suite of rolling stock, aftermarket parts and services throughout Australia. The acquisition willwas executed to strengthen our existing Rail footprint in Australia, which currently includes rolling stock maintenance facilities, as well as infrastructure and signaling facilities. The purchase price for the acquisition was $99 million.
The transaction was financed with available cash. Tangible assets as of the acquisition date were $92 million, recorded at their fair values, and primarily included receivables of $26 million, inventories of $42 million, and property, plant and equipment of $17 million. Finite-lived customer relationship intangible assets acquired were $5 million. The finite lived intangible assets are being amortized on a straight-line basis over an amortization period of 15 years. Liabilities assumed as of the acquisition date were $10 million, which represented their fair values. Goodwill of $12 million, not expected to be deducted for income tax purposes, represented the excess of the consideration transferred over the net assets recognized and represented the estimated future economic benefits arising from other assets acquired that could not be individually identified and separately recognized. Factors that contributed to a purchase price resulting in the recognition of goodwill include Downer Freight Rail’s strategic fit into our rail product portfolio, the opportunity to expand our aftermarket parts and maintenance service portfolio in Australia and the acquired assembled workforce. These values represent a preliminary allocation of purchase price subject to finalization of post-closing procedures. The results of the acquired business for the period from the acquisition date are included in the accompanying consolidated financial statements and reported in the Energy & Transportation segment in Note 15. Assuming this transaction had been made at the beginning of any period presented, the consolidated pro forma results would not be materially different from reported results.
Item 2. Management’s Discussion and Analysis of Financial Condition and Results of Operations
Overview
First-quarterThird-quarter 2018 sales and revenues were $12.859$13.510 billion, a 31an 18 percent increase from first-quarterthird-quarter 2017 sales and revenues of $9.822$11.413 billion. The increase was primarily due to higher sales volume driven by improved end-user demand and favorable changes in dealer inventories. The improvement in end-user demand was across all regions and most end markets. The impact of changes in dealer inventories was favorable as there was a more significant increase in the first quarter of 2018 than in the first quarter of 2017.
Strong end-user demand and favorable changes in dealer inventories drove higher sales volume across the three primary segments with the largest increase in Construction Industries. Sales were also higher due to currency impacts, primarily from a stronger euro and Chinese yuan. Favorable price realization also contributed to the sales improvement.
segments. Profit per share for the firstthird quarter of 2018 was $2.74,$2.88, an increase of $2.42 profit per share$1.11 from the firstthird quarter of 2017. Profit was $1.665$1.727 billion in the firstthird quarter of 2018, an increase of $1.473 billion$668 million from the firstthird quarter of 2017. Profit increased primarily due to higher sales volume and lower tax expense. Higher restructuringmanufacturing costs. Improved price realization was largely offset by higher and selling, general and administrative (SG&A) and research and development (R&D) expenses were partially offset by favorable price realization.
Sales and lower operatingrevenues for the nine months ended September 30, 2018, were $40.380 billion, up $7.814 billion, or 24 percent, from $32.566 billion for the nine months ended September 30, 2017. Profit per share for the nine months ended September 30, 2018, was $8.45, up significantly from profit per share of $3.44 for the same period last year. Profit was $5.099 billion for the nine months ended September 30, 2018, a substantial increase from Financial Products.$2.053 billion for the nine months ended September 30, 2017.
Highlights for the firstthird quarter of 2018 include:
First-quarterThird-quarter sales and revenues were $12.859$13.510 billion, compared with $9.822$11.413 billion in the firstthird quarter of 2017. Sales increased in Construction Industries, Energy & Transportation and Resource Industries. Financial Products’ revenues were about flat.increased slightly.
Operating profit as a percent of sales and revenues was 15.8 percent in the third quarter of 2018, compared with 13.2 percent in the third quarter of 2017. Adjusted operating profit margin was 16.6 percent in the third quarter of 2018, compared with 14.0 percent in the third quarter of 2017.
Profit per share was $2.74$2.88 in the firstthird quarter of 2018, compared with $0.32$1.77 in the firstthird quarter of 2017. Excluding restructuring costs of $0.08$0.14 per share first-quarterand a net tax benefit to adjust deferred tax balances of $0.16 per share, third-quarter 2018 adjusted profit per share was $2.82, compared to first-quarter 2017$2.86. In comparison, adjusted profit per share for the third quarter of $1.28.2017, which excluded restructuring costs of $0.18 per share, was $1.95.
During the firstthird quarter of 2018, Machinery, Energy & Transportation (ME&T)operating cash flow was $948 million and$848 million. In the quarter, the company repurchased $500deployed significant capital, including a discretionary pension contribution of $1.0 billion, the repurchase of $750 million of Caterpillar common stock.stock and a dividend payment of $511 million. The company endedenterprise cash balance at the firstend of the third quarter of 2018 with an enterprise cash balance of $7.9was $8.0 billion.
Highlights for the nine months ended September 30, 2018, include:
Sales and revenues for the nine months ended September 30, 2018, were $40.380 billion, compared with $32.566 billion for the nine months ended September 30, 2017. Sales increased in Construction Industries, Energy & Transportation and Resource Industries. Financial Products’ revenues increased slightly.
Operating profit as a percent of sales and revenues was 15.9 percent for the nine months ended September 30, 2018, compared with 9.4 percent for the nine months ended September 30, 2017. Adjusted operating profit margin was 16.6 percent for the nine months ended September 30, 2018, compared with 12.5 percent for the nine months ended September 30, 2017.
Profit per share was $8.45 for the nine months ended September 30, 2018, compared with $3.44 in the nine months ended September 30, 2017. Excluding restructuring costs of $0.37 per share and a net tax benefit to adjust deferred tax balances of $0.16 per share, adjusted profit per share was $8.66 for the nine months ended September 30, 2018. In comparison, adjusted profit per share for the nine months ended September 30, 2017, was $4.72, which excluded restructuring costs of $1.37 and a gain on the sale of an equity investment of $0.09 per share.
Machinery, Energy & Transportation (ME&T) operating cash flow was $3.9 billion for the nine months ended September 30, 2018, compared to $4.2 billion for the nine months ended September 30, 2017.
Restructuring Costs
In recent years, we have incurred substantial restructuring costs to achieve a flexible and competitive cost structure. During the first quarter of 2018, weWe incurred $69 million of restructuring costs. During the first quarter of 2017, we incurred $752$110 million of restructuring costs primarily related toduring the closurethird quarter of 2018 and $293 million during the facility in Gosselies, Belgium. In 2018, wenine months ended September 30, 2018. We incurred $90 million of restructuring costs during the third quarter of 2017 and $1.011 billion during the nine months ended September 30, 2017. We expect restructuring actions to continue and anticipate costs of about $400 million.
million for the full year of 2018.
Notes:
Glossary of terms is included on pages 61-62;80-82; first occurrence of terms shown in bold italics.
Information on non-GAAP financial measures is included on page 67.87.
Consolidated Results of Operations
THREE MONTHS ENDED MARCH 31,SEPTEMBER 30, 2018 COMPARED WITH THREE MONTHS ENDED MARCH 31,SEPTEMBER 30, 2017
CONSOLIDATED SALES AND REVENUES
The chart above graphically illustrates reasons for the change in Consolidated Sales and Revenues between the firstthird quarter of 2017 (at left) and the firstthird quarter of 2018 (at right). Items favorably impacting sales and revenues appear as upward stair steps with the corresponding dollar amounts above each bar, while items negatively impacting sales and revenues appear as downward stair steps with dollar amounts reflected in parentheses above each bar. Caterpillar management utilizes these charts internally to visually communicate with the company's board of directors and employees.
Total sales and revenues were $13.510 billion in the third quarter of 2018, an increase of $2.097 billion, or 18 percent, compared with $11.413 billion in the third quarter of 2017. The increase was due to higher sales volume driven by improved demand across the three primary segments, which included an increase in dealer inventories. Favorable price realization, primarily in Resource Industries, also contributed to the sales improvement. The increase was partially offset by unfavorable currency impacts, primarily due to a weaker Australian dollar and Brazilian real.
Sales increased in all regions. The largest sales increase was in North America, which improved 24 percent as strong economic conditions in key end markets drove higher demand, including favorable changes in dealer inventories. Dealer inventories increased in the third quarter of 2018 and were about flat in the third quarter of 2017.
Sales increased 11 percent in Latin America primarily due to stabilizing economic conditions in several countries in the region that resulted in improved demand from low levels, partially offset by a weaker Brazilian real.
EAME sales increased 7 percent primarily due to higher demand as economic conditions have improved in several countries in the region, however, this was partially offset by economic uncertainty in a few countries in the Middle East.
Asia/Pacific sales increased 28 percent mostly due to higher demand in several countries across the region, including favorable changes in dealer inventories. Dealer inventories increased more significantly in the third quarter of 2018 than during the third quarter of 2017. The increase in sales was partially offset by the unfavorable impact of a weaker Australian dollar.
Dealer machine and engine inventories increased about $800 million during the third quarter of 2018, compared to an increase of about $200 million during the third quarter of 2017. Dealers are independent, and there could be many reasons for changes in their inventory levels, including their expectations of future demand and product delivery times. Dealers’ demand expectations take into account seasonal changes, macroeconomic conditions, machine rental rates and other factors. Delivery times can vary based on availability of product from Caterpillar factories and product distribution centers.
|
|
| Sales and Revenues by Geographic Region |
|
| | | | | | | | | | | | | | | | | | | | | | | | | | | | | | | | | | | | | | | | | | | | | | | | |
| | North America | | Latin America | | EAME | | Asia/Pacific | | External Sales and Revenues | | Inter-Segment | | Total Sales and Revenues |
| (Millions of dollars) | $ | | % Chg | | $ | | % Chg | | $ | | % Chg | | $ | | % Chg | | $ | | % Chg | | $ | | % Chg | | $ | | % Chg |
| Third Quarter 2018 | |
| | |
| | |
| | |
| | |
| | |
| | |
| | |
| | |
| | |
| | | | | | | | |
| Construction Industries | $ | 2,646 |
| | 22 | % | | $ | 369 |
| | (5 | %) | | $ | 1,109 |
| | 10 | % | | $ | 1,530 |
| | 19 | % | | $ | 5,654 |
| | 16 | % | | $ | 29 |
| | (9 | %) | | $ | 5,683 |
| | 16 | % |
| Resource Industries | 849 |
| | 46 | % | | 427 |
| | 30 | % | | 574 |
| | 18 | % | | 688 |
| | 46 | % | | 2,538 |
| | 36 | % | | 100 |
| | 16 | % | | 2,638 |
| | 35 | % |
| Energy & Transportation | 2,309 |
| | 20 | % | | 330 |
| | 10 | % | | 1,180 |
| | 1 | % | | 758 |
| | 34 | % | | 4,577 |
| | 16 | % | | 978 |
| | 12 | % | | 5,555 |
| | 15 | % |
| All Other Segments | 15 |
| | (50 | %) | | — |
| | (100 | %) | | 4 |
| | (69 | %) | | 18 |
| | 50 | % | | 37 |
| | (34 | %) | | 76 |
| | (15 | %) | | 113 |
| | (22 | %) |
| Corporate Items and Eliminations | (40 | ) | | | | 1 |
| | | | (5 | ) | | | | 1 |
| | | | (43 | ) | | | | (1,183 | ) | | | | (1,226 | ) | | |
| Machinery, Energy & Transportation Sales | 5,779 |
| | 24 | % | | 1,127 |
| | 11 | % | | 2,862 |
| | 7 | % | | 2,995 |
| | 28 | % | | 12,763 |
| | 19 | % | | — |
| | — |
| | 12,763 |
| | 19 | % |
| | | | | | | | | | | | | | | | | | | | | | | | | | | | |
| Financial Products Segment | 559 |
| | 10 | % | | 68 |
| | 6 | % | | 101 |
| | (8 | %) | | 117 |
| | 30 | % | | 845 |
| 1 | 9 | % | | — |
| | — |
| | 845 |
| | 9 | % |
| Corporate Items and Eliminations | (62 | ) | | | | (12 | ) | | | | (6 | ) | | | | (18 | ) | | | | (98 | ) | | | | — |
| | | | (98 | ) | | |
| Financial Products Revenues | 497 |
| | 8 | % | | 56 |
| | (5 | %) | | 95 |
| | (10 | %) | | 99 |
| | 30 | % | | 747 |
| | 7 | % | | — |
| | — |
| | 747 |
| | 7 | % |
| | | | | | | | | | | | | | | | | | | | | | | | | | | | |
| Consolidated Sales and Revenues | $ | 6,276 |
| | 22 | % | | $ | 1,183 |
| | 10 | % | | $ | 2,957 |
| | 6 | % | | $ | 3,094 |
| | 28 | % | | $ | 13,510 |
| | 18 | % | | $ | — |
| | — |
| | $ | 13,510 |
| | 18 | % |
| | | | | | | | | | | | | | | | | | | | | | | | | | | | |
| Third Quarter 2017 | |
| | |
| | |
| | |
| | |
| | |
| | |
| | |
| | |
| | |
| | |
| | |
| | |
| | |
|
| Construction Industries | $ | 2,165 |
| | | | $ | 390 |
| | | | $ | 1,008 |
| | | | $ | 1,291 |
| | |
| | $ | 4,854 |
| | | | $ | 32 |
| | |
| | $ | 4,886 |
| | |
| Resource Industries | 581 |
| | | | 329 |
| | | | 488 |
| | | | 472 |
| | |
| | 1,870 |
| | | | 86 |
| | |
| | 1,956 |
| | |
| Energy & Transportation | 1,928 |
| | | | 300 |
| | | | 1,166 |
| | | | 567 |
| | |
| | 3,961 |
| | | | 877 |
| | |
| | 4,838 |
| | |
| All Other Segments | 30 |
| | | | 1 |
| | | | 13 |
| | | | 12 |
| | |
| | 56 |
| | | | 89 |
| | |
| | 145 |
| | |
| Corporate Items and Eliminations | (25 | ) | | | | (1 | ) | | | | (2 | ) | | | | — |
| | | | (28 | ) | | | | (1,084 | ) | | | | (1,112 | ) | | |
| Machinery, Energy & Transportation Sales | 4,679 |
| | |
| | 1,019 |
| | |
| | 2,673 |
| | |
| | 2,342 |
| | |
| | 10,713 |
| | |
| | — |
| | |
| | 10,713 |
| | |
|
| | | | | | | | | | | | | | | | | | | | | | | | | | | | |
| Financial Products Segment | 510 |
| | | | 64 |
| | | | 110 |
| | | | 90 |
| | |
| | 774 |
| 1 | | | — |
| | |
| | 774 |
| | |
| Corporate Items and Eliminations | (51 | ) | | | | (5 | ) | | | | (4 | ) | | | | (14 | ) | | |
| | (74 | ) | | | | — |
| | |
| | (74 | ) | | |
| Financial Products Revenues | 459 |
| | |
| | 59 |
| | |
| | 106 |
| | |
| | 76 |
| | |
| | 700 |
| | |
| | — |
| | |
| | 700 |
| | |
|
| | | | | | | | | | | | | | | | | | | | | | | | | | | | |
| Consolidated Sales and Revenues | $ | 5,138 |
| | |
| | $ | 1,078 |
| | |
| | $ | 2,779 |
| | |
| | $ | 2,418 |
| | |
| | $ | 11,413 |
| | |
| | $ | — |
| | |
| | $ | 11,413 |
| | |
|
1 Includes revenues from Machinery, Energy & Transportation of $122 million and $93 million in the third quarter of 2018 and 2017, respectively.
|
| | | | | | | | | | | | | | | | | | | | | | | | | | | | | | |
| Sales and Revenues by Segment | | | | | | | | | | | | | | |
| (Millions of dollars) | Third Quarter 2017 | | Sales Volume | | Price Realization | | Currency | | Inter-Segment / Other | | Third Quarter 2018 | | $ Change | | % Change |
| | | | | | | | | | | | | | | | |
| Construction Industries | $ | 4,886 |
| | $ | 815 |
| | $ | 20 |
| | $ | (35 | ) | | $ | (3 | ) | | $ | 5,683 |
| | $ | 797 |
| | 16 | % |
| Resource Industries | 1,956 |
| | 579 |
| | 112 |
| | (23 | ) | | 14 |
| | 2,638 |
| | 682 |
| | 35 | % |
| Energy & Transportation | 4,838 |
| | 628 |
| | 25 |
| | (37 | ) | | 101 |
| | 5,555 |
| | 717 |
| | 15 | % |
| All Other Segments | 145 |
| | (18 | ) | | (1 | ) | | — |
| | (13 | ) | | 113 |
| | (32 | ) | | (22 | %) |
| Corporate Items and Eliminations | (1,112 | ) | | (13 | ) | | (1 | ) | | (1 | ) | | (99 | ) | | (1,226 | ) | | (114 | ) | | |
|
| Machinery, Energy & Transportation Sales | 10,713 |
| | 1,991 |
| | 155 |
| | (96 | ) | | — |
| | 12,763 |
| | 2,050 |
| | 19 | % |
| | | | | | | | | | | | | | | | |
| Financial Products Segment | 774 |
| | — |
| | — |
| | — |
| | 71 |
| | 845 |
| | 71 |
| | 9 | % |
| Corporate Items and Eliminations | (74 | ) | | — |
| | — |
| | — |
| | (24 | ) | | (98 | ) | | (24 | ) | | |
|
| Financial Products Revenues | 700 |
| | — |
| | — |
| | — |
| | 47 |
| | 747 |
| | 47 |
| | 7 | % |
| | | | | | | | | | | | | | | | |
| Consolidated Sales and Revenues | $ | 11,413 |
| | $ | 1,991 |
| | $ | 155 |
| | $ | (96 | ) | | $ | 47 |
| | $ | 13,510 |
| | $ | 2,097 |
| | 18 | % |
| | | | | | | | | | | | | | | | |
CONSOLIDATED OPERATING PROFIT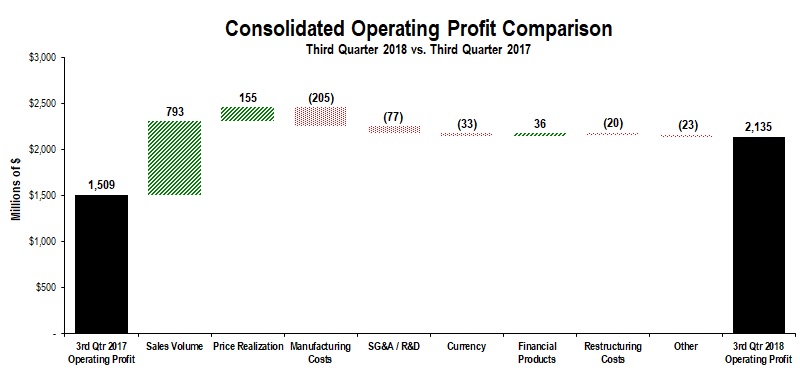
The chart above graphically illustrates reasons for the change in Consolidated Operating Profit between the third quarter of 2017 (at left) and the third quarter of 2018 (at right). Items favorably impacting operating profitappear as upward stair steps with the corresponding dollar amounts above each bar, while items negatively impacting operating profit appear as downward stair steps with dollar amounts reflected in parentheses above each bar. Caterpillar management utilizes these charts internally to visually communicate with the company's board of directors and employees. The bar entitled Other includes consolidating adjustments and Machinery, Energy & Transportation other operating (income) expenses.
Operating profit for the third quarter of 2018 was $2.135 billion, compared to $1.509 billion in the third quarter of 2017. The increase of $626 million was mostly due to higher sales volume and favorable price realization.
Manufacturing costs were higher due to increased material and freight costs. Material costs were higher primarily due to increases in steel prices and tariffs. Freight costs increased primarily due to supply chain inefficiencies as the industry continues to respond to strong global demand. SG&A/R&D expenses increased primarily due to investments aligned with the company’s strategic growth initiatives.
Short-term incentive compensation expense was about $350 million in the third quarter of 2018, compared to about $400 million in the third quarter of 2017. For the full year, we expect short-term incentive compensation will be about $1.4 billion, nearly the same as 2017.
Other Profit/Loss Items
| |
| ▪ | Other income/expense in the third quarter of 2018 was income of $102 million, compared with income of $132 million in the third quarter of 2017. The unfavorable change was primarily a result of higher currency translation and hedging net losses. |
| |
| ▪ | The provision for income taxes in the third quarter of 2018 reflected an estimated annual tax rate of 24 percent, compared to 32 percent in the third quarter of 2017, excluding the discrete items discussed in the following paragraph. The decrease was primarily due to the reduction in the U.S. corporate tax rate beginning January 1, 2018, along with other changes in the geographic mix of profits from a tax perspective. |
The 2018 provision for income taxes in the third quarter of 2018 also included a $154 million reduction to the provisionally estimated charge of $2.371 billion recognized during the fourth quarter of 2017 due to enactment of U.S. tax reform legislation. The $154 million benefit revises the estimated impact of the write-down of U.S. net deferred tax assets to reflect the reduction in the U.S. corporate tax rate from 35 percent to 21 percent. This benefit primarily related to the decision to make an additional discretionary pension contribution of $1.0 billion to U.S. pension plans in the third quarter of 2018 which was treated as deductible on the 2017 U.S. tax return. The provision for income taxes in the third quarter of 2018 also includes a charge of $59 million to correct for an error which resulted in an understatement of the valuation allowance offsetting deferred tax assets for prior years. This error had the effect of overstating profit by $17 million, $33 million and $9 million for the years ended December 31, 2017, 2016 and 2015, respectively. Management has concluded that the error was not material to any period presented. In addition, a discrete tax benefit of $3 million was recorded in the third quarter of 2018, compared to $18 million in the third quarter of 2017, for the settlement of stock-based compensation awards with associated tax deductions in excess of cumulative U.S. GAAP compensation expense.
|
| | | | | | | | | | | | | | |
| Profit (Loss) by Segment | | | | | | | |
| (Millions of dollars) | Third Quarter 2018 | | Third Quarter 2017 | | $ Change | | % Change |
| Construction Industries | $ | 1,058 |
| | $ | 884 |
| | $ | 174 |
| | 20 | % |
| Resource Industries | 414 |
| | 229 |
| | 185 |
| | 81 | % |
| Energy & Transportation | 973 |
| | 743 |
| | 230 |
| | 31 | % |
| All Other Segments | (10 | ) | | 5 |
| | (15 | ) | | n/a |
|
| Corporate Items and Eliminations | (371 | ) | | (422 | ) | | 51 |
| | |
|
| Machinery, Energy & Transportation | 2,064 |
| | 1,439 |
| | 625 |
| | 43 | % |
| | | | | | | | |
| Financial Products Segment | 201 |
| | 185 |
| | 16 |
| | 9 | % |
| Corporate Items and Eliminations | (30 | ) | | (37 | ) | | 7 |
| | |
|
| Financial Products | 171 |
| | 148 |
| | 23 |
| | 16 | % |
| Consolidating Adjustments | (100 | ) | | (78 | ) | | (22 | ) | | |
|
| Consolidated Operating Profit | $ | 2,135 |
| | $ | 1,509 |
| | $ | 626 |
| | 41 | % |
| | | | | | | | |
Construction Industries
Construction Industries’ total sales were $5.683 billion in the third quarter of 2018, compared with $4.886 billion in the third quarter of 2017. The increase was mostly due to higher sales volume for construction equipment.
Sales increased in all regions except Latin America.
| |
| ▪ | In North America, the sales increase was mostly due to higher demand for new equipment, primarily to support oil and gas activities, including pipelines, and non-residential building construction activities. |
| |
| ▪ | Sales in Latin America were about flat as economic conditions remained weak. |
| |
| ▪ | Sales increased in EAME as infrastructure and building construction activities drove higher demand across several countries in the region. |
| |
| ▪ | Sales in Asia/Pacific were higher across the region, with the most significant impact from improved demand in China, including an increase in dealer inventories from low levels, stemming from increased non-residential building construction and infrastructure activities. |
Construction Industries’ profit was $1.058 billion in the third quarter of 2018, compared with $884 million in the third quarter of 2017. The increase in profit was a result of higher sales volume, partially offset by higher manufacturing costs. Manufacturing costs were higher primarily due to increased material and freight costs.
Construction Industries’ profit as a percent of total sales was 18.6 percent in the third quarter of 2018, compared with 18.1 percent in the third quarter of 2017.
Resource Industries
Resource Industries’ total sales were $2.638 billion in the third quarter of 2018, an increase of $682 million from the third quarter of 2017. The increase was primarily due to higher demand for both mining and heavy construction equipment. Commodity market fundamentals remained positive, contributing to higher mining equipment sales. In addition, increased sales to heavy construction and quarry and aggregate customers were driven by positive global economic growth. Resource Industries’ customers globally continue to focus on improving the productivity and efficiency of existing machine assets, thereby extending equipment life cycles and lowering operating costs. Rebuild, overhaul and maintenance activity remains strong, resulting in higher aftermarket parts sales. Favorable price realization also contributed to the sales improvement.
Resource Industries’ profit was $414 million in the third quarter of 2018, compared with $229 million in the third quarter of 2017. The improvement was mostly due to higher sales volume and favorable price realization. The increase was partially offset by higher manufacturing costs, including freight and material costs, and increased SG&A/R&D expenses primarily due to investments aligned with strategic growth initiatives.
Resource Industries’ profit as a percent of total sales was 15.7 percent in the third quarter of 2018, compared with 11.7 percent in the third quarter of 2017.
Energy & Transportation
|
| | | | | | | | | | | | | | | |
| Sales by Application | | | | | | | | |
| (Millions of dollars) | | Third Quarter 2018 | | Third Quarter 2017 | | $ Change | | % Change |
| Oil and Gas | | $ | 1,362 |
| | $ | 1,065 |
| | $ | 297 |
| | 28 | % |
| Power Generation | | 1,102 |
| | 898 |
| | 204 |
| | 23 | % |
| Industrial | | 863 |
| | 885 |
| | (22 | ) | | (2 | %) |
| Transportation | | 1,250 |
| | 1,113 |
| | 137 |
| | 12 | % |
| External Sales | | 4,577 |
| | 3,961 |
| | 616 |
| | 16 | % |
| Inter-Segment | | 978 |
| | 877 |
| | 101 |
| | 12 | % |
| Total Sales | | $ | 5,555 |
| | $ | 4,838 |
| | $ | 717 |
| | 15 | % |
| | | | | | | | | |
| | | | | | | | | |
Energy & Transportation’s total sales were $5.555 billion in the third quarter of 2018, compared with $4.838 billion in the third quarter of 2017. The increase was primarily due to higher sales volume across all applications except Industrial.
| |
| ▪ | Oil and Gas - Sales increased due to higher demand in North America for well servicing and gas compression applications. Higher energy prices and growth in U.S. onshore oil and gas drove increased sales for reciprocating engines. |
| |
| ▪ | Power Generation - Sales improved across all regions, with the largest increases in North America and Asia/Pacific primarily for reciprocating engine applications, including data centers and power plants, and for aftermarket parts. |
| |
| ▪ | Industrial - Sales were lower in EAME primarily due to economic uncertainty in a few countries in the Middle East, partially offset by slightly higher sales in Asia/Pacific and North America. |
| |
| ▪ | Transportation - Sales were higher primarily due to rail services, driven by acquisitions in Asia/Pacific and EAME, and increased rail traffic in North America. |
Energy & Transportation’s profit was $973 million in the third quarter of 2018, compared with $743 million in the third quarter of 2017. The improvement was mostly due to higher sales volume. The increase was partially offset by higher manufacturing costs, including freight costs, and increased SG&A/R&D expenses primarily due to investments aligned with strategic growth initiatives.
Energy & Transportation’s profit as a percent of total sales was 17.5 percent in the third quarter of 2018, compared with 15.4 percent in the third quarter of 2017.
Financial Products Segment
Financial Products’ segment revenues were $845 million in the third quarter of 2018, an increase of $71 million, or 9 percent, from the third quarter of 2017. The increase was primarily due to higher average financing rates and higher average earning assets in North America and Asia/Pacific as well as a favorable impact from returned or repossessed equipment. These favorable impacts were partially offset by lower intercompany lending activity in North America, lower average earning assets in Latin America and lower average financing rates in Europe.
Financial Products’ segment profit was $201 million in the third quarter of 2018, compared with $185 million in the third quarter of 2017. The increase was primarily due to a favorable impact from returned or repossessed equipment, higher average earning assets and an increase in net yield on average earning assets. This was partially offset by an unfavorable impact from available for sale securities in Insurance Services.
At the end of the third quarter of 2018, past dues at Cat Financial were 3.47 percent, compared with 2.73 percent at the end of the third quarter of 2017. The increase in past dues was primarily driven by the Cat Power Finance portfolio. Write-offs, net of recoveries, in the third quarter of 2018 were $40 million, compared with $47 million in the third quarter of 2017.
As of September 30, 2018, Cat Financial’s allowance for credit losses totaled $416 million, or 1.49 percent of finance receivables, compared with $416 million, or 1.48 percent of finance receivables at June 30, 2018. The allowance for credit losses at December 31, 2017, was $365 million, or 1.33 percent of finance receivables.
Corporate Items and Eliminations
Expense for corporate items and eliminations was $401 million in the third quarter of 2018, a decrease of $58 million from the third quarter of 2017, primarily due to methodology differences and lower corporate costs. Restructuring costs were $110 million in the third quarter of 2018, compared to $90 million in the third quarter of 2017.
NINE MONTHS ENDED SEPTEMBER 30, 2018 COMPARED WITH NINE MONTHS ENDED SEPTEMBER 30, 2017
CONSOLIDATED SALES AND REVENUES
The chart above graphically illustrates reasons for the change in Consolidated Sales and Revenues between the nine months ended September 30, 2017 (at left) and the nine months ended September 30, 2018 (at right). Items favorably impacting sales and revenues appear as upward stair steps with the corresponding dollar amounts above each bar, while items negatively impacting sales and revenues appear as downward stair steps with dollar amounts reflected in parentheses above each bar. Caterpillar management utilizes these charts internally to visually communicate with the company's board of directors and employees.
Total sales and revenues were $12.859$40.380 billion in the first quarter ofnine months ended September 30, 2018, an increase of $3.037$7.814 billion, or 3124 percent, compared with $9.822$32.566 billion in the first quarter ofnine months ended September 30, 2017. The increase was primarily due to higher sales volume driven by improved end-user demand for equipment across the three primary segments. Sales were also higher due to currency impacts, primarily from a stronger euro and Chinese yuan. Favorable price realization in Resource Industries and Energy & Transportation also contributed to the sales improvement. Financial Products’ revenues increased slightly.
Sales increased in all regions, and mostwith the largest sales increase in North America, which improved 27 percent as strong economic conditions in key end markets as well asdrove higher end-user demand. Also contributing to higher sales was an increase in dealer inventories in the nine months ended September 30, 2018, compared to a decrease in the nine months ended September 30, 2017.
Sales increased 14 percent in Latin America primarily due to stabilizing economic conditions in several countries in the region that resulted in improved demand from low levels.
EAME sales increased 16 percent primarily due to higher demand, including favorable changes in dealer inventories.inventories, as economic conditions have improved in several countries in the region. The impact of a stronger euro and favorable price realization also contributed to higher sales. The impact of changes in dealer inventories was favorable as dealer inventories increased about $1.2 billionmore significantly in the nine months ended September 30, 2018, than during the nine months ended September 30, 2017.
Asia/Pacific sales increased 37 percent primarily due to higher demand in several countries across the region, including favorable changes in dealer inventories, the impact of a stronger Chinese yuan and favorable price realization. Dealer inventories increased in the nine months ended September 30, 2018, and were about flat in the nine months ended September 30, 2017.
The sharp increase in demand has led to supply chain challenges. Although the company is making efforts to improve material flows, constraints remain for some parts and components that are impacting lead times and availability.
During the first quarternine months of 2018, dealer machine and engine inventories increased about $2.1 billion, compared to an increase of about $200$100 million in the first quarternine months of 2017. Dealers generally increase inventories during first quarter in preparation for the spring selling season and theThe company believes the increase in dealer inventories during the first quarternine months of 2018 is reflective of current end-user demand. However, dealers are independent, and there could be many reasons for changes in their inventory levels, including their expectations of future demand and product delivery times. Dealers’ demand expectations take into account seasonal changes, macroeconomic conditions, machine rental rates and other factors. Delivery times can vary based on availability of product from Caterpillar factories and product distribution centers.
Strong end-user demand
|
|
| Sales and Revenues by Geographic Region |
|
| | | | | | | | | | | | | | | | | | | | | | | | | | | | | | | | | | | | | | | | | | | | | | | | |
| | North America | | Latin America | | EAME | | Asia/Pacific | | External Sales and Revenues | | Inter-Segment | | Total Sales and Revenues |
| (Millions of dollars) | $ | | % Chg | | $ | | % Chg | | $ | | % Chg | | $ | | % Chg | | $ | | % Chg | | $ | | % Chg | | $ | | % Chg |
| Nine Months Ended September 30, 2018 | |
| | |
| | |
| | |
| | |
| | |
| | |
| | |
| | |
| | |
| | | | | | | | |
| Construction Industries | $ | 8,005 |
| | 25 | % | | $ | 1,105 |
| | 10 | % | | $ | 3,347 |
| | 20 | % | | $ | 4,993 |
| | 35 | % | | $ | 17,450 |
| | 26 | % | | $ | 82 |
| | 17 | % | | $ | 17,532 |
| | 26 | % |
| Resource Industries | 2,451 |
| | 37 | % | | 1,181 |
| | 32 | % | | 1,663 |
| | 28 | % | | 1,882 |
| | 44 | % | | 7,177 |
| | 35 | % | | 296 |
| | 17 | % | | 7,473 |
| | 35 | % |
| Energy & Transportation | 7,116 |
| | 26 | % | | 897 |
| | 1 | % | | 3,425 |
| | 9 | % | | 2,129 |
| | 34 | % | | 13,567 |
| | 21 | % | | 2,931 |
| | 18 | % | | 16,498 |
| | 20 | % |
| All Other Segments | 47 |
| | (2 | %) | | 1 |
| | (50 | %) | | 12 |
| | (70 | %) | | 55 |
| | 53 | % | | 115 |
| | (9 | %) | | 238 |
| | (18 | %) | | 353 |
| | (15 | %) |
| Corporate Items and Eliminations | (108 | ) | | | | (1 | ) | | | | (8 | ) | | | | — |
| | | | (117 | ) | | | | (3,547 | ) | | | | (3,664 | ) | | |
| Machinery, Energy & Transportation Sales | 17,511 |
| | 27 | % | | 3,183 |
| | 14 | % | | 8,439 |
| | 16 | % | | 9,059 |
| | 37 | % | | 38,192 |
| | 25 | % | | — |
| | — | % | | 38,192 |
| | 25 | % |
| | | | | | | | | | | | | | | | | | | | | | | | | | | | |
| Financial Products Segment | 1,608 |
| | 7 | % | | 213 |
| | (6 | %) | | 303 |
| | (3 | )% | | 343 |
| | 26 | % | | 2,467 |
| 1 | 7 | % | | — |
| | — | % | | 2,467 |
| | 7 | % |
| Corporate Items and Eliminations | (168 | ) | | | | (36 | ) | | | | (18 | ) | | | | (57 | ) | | | | (279 | ) | | | | — |
| | | | (279 | ) | | |
| Financial Products Revenues | 1,440 |
| | 6 | % | | 177 |
| | (8 | %) | | 285 |
| | (4 | %) | | 286 |
| | 23 | % | | 2,188 |
| | 5 | % | | — |
| | — | % | | 2,188 |
| | 5 | % |
| | | | | | | | | | | | | | | | | | | | | | | | | | | | |
| Consolidated Sales and Revenues | $ | 18,951 |
| | 25 | % | | $ | 3,360 |
| | 13 | % | | $ | 8,724 |
| | 15 | % | | $ | 9,345 |
| | 36 | % | | $ | 40,380 |
| | 24 | % | | $ | — |
| | — | % | | $ | 40,380 |
| | 24 | % |
| | | | | | | | | | | | | | | | | | | | | | | | | | | | |
| Nine Months Ended September 30, 2017 | |
| | |
| | |
| | |
| | |
| | |
| | |
| | |
| | |
| | |
| | |
| | |
| | |
| | |
|
| Construction Industries | $ | 6,396 |
| | | | $ | 1,004 |
| | | | $ | 2,784 |
| | | | $ | 3,691 |
| | |
| | $ | 13,875 |
| | | | $ | 70 |
| | |
| | $ | 13,945 |
| | |
| Resource Industries | 1,791 |
| | | | 897 |
| | | | 1,300 |
| | | | 1,311 |
| | |
| | 5,299 |
| | | | 254 |
| | |
| | 5,553 |
| | |
| Energy & Transportation | 5,632 |
| | | | 887 |
| | | | 3,145 |
| | | | 1,594 |
| | |
| | 11,258 |
| | | | 2,484 |
| | |
| | 13,742 |
| | |
| All Other Segments | 48 |
| | | | 2 |
| | | | 40 |
| | | | 36 |
| | |
| | 126 |
| | | | 289 |
| | |
| | 415 |
| | |
| Corporate Items and Eliminations | (70 | ) | | | | (1 | ) | | | | (6 | ) | | | | 1 |
| | | | (76 | ) | | | | (3,097 | ) | | | | (3,173 | ) | | |
| Machinery, Energy & Transportation Sales | 13,797 |
| | |
| | 2,789 |
| | |
| | 7,263 |
| | |
| | 6,633 |
| | |
| | 30,482 |
| | |
| | — |
| | |
| | 30,482 |
| | |
|
| | | | | | | | | | | | | | | | | | | | | | | | | | | | |
| Financial Products Segment | 1,501 |
| | | | 226 |
| | | | 311 |
| | | | 272 |
| | |
| | 2,310 |
| 1 | | | — |
| | |
| | 2,310 |
| | |
| Corporate Items and Eliminations | (140 | ) | | | | (34 | ) | | | | (13 | ) | | | | (39 | ) | | |
| | (226 | ) | | | | — |
| | |
| | (226 | ) | | |
| Financial Products Revenues | 1,361 |
| | |
| | 192 |
| | |
| | 298 |
| | |
| | 233 |
| | |
| | 2,084 |
| | |
| | — |
| | |
| | 2,084 |
| | |
|
| | | | | | | | | | | | | | | | | | | | | | | | | | | | |
| Consolidated Sales and Revenues | $ | 15,158 |
| | |
| | $ | 2,981 |
| | |
| | $ | 7,561 |
| | |
| | $ | 6,866 |
| | |
| | $ | 32,566 |
| | |
| | $ | — |
| | |
| | $ | 32,566 |
| | |
|
1 Includes revenues from Machinery, Energy & Transportation of $345 million and favorable changes in dealer inventories drove higher sales volume across the three primary segments with the largest increase in Construction Industries. Sales were also higher due to currency impacts, primarily from a stronger euro and Chinese yuan. Favorable price realization across the three primary segments also contributed to the sales improvement.
The largest sales increase was in North America, which improved 33 percent as strong economic conditions in key end markets drove higher end-user demand. Also contributing to the increase was the impact of a more significant increase in dealer inventories$281 million in the first quarter ofnine months ended September 30, 2018 than in the first quarter of 2017.
Asia/Pacific sales increased 44 percent mostly due to higher end-user demand, primarily for construction equipment in China, the impact of favorable changes in dealer inventories and a stronger Chinese yuan. The impact of changes in dealer inventories was favorable as dealer inventories increased slightly in the first quarter of 2018, compared to a decrease in the first quarter of 2017.
EAME sales increased 25 percent primarily due to the impact of a stronger euro, the impact of favorable changes in dealer inventories and higher end-user demand as economic conditions have improved. The impact of changes in dealer inventories was favorable as increases were greater in the first quarter of 2018 than in the first quarter of 2017.2017, respectively.
Sales increased 24 percent in Latin America primarily due to stabilizing economic conditions in several countries in the region that resulted in improved demand from low levels.We continue to work with our global suppliers to respond to significant increases in demand. Although constraints remain for some parts and components, we are seeing improvements in material flows. |
| | | | | | | | | | | | | | | | | | | | | | | | | | | | | | |
| Sales and Revenues by Segment | | | | | | | | | | | | | | |
| (Millions of dollars) | Nine Months Ended September 30, 2017 | | Sales Volume | | Price Realization | | Currency | | Other | | Nine Months Ended September 30, 2018 | | $ Change | | % Change |
| | | | | | | | | | | | | | | | |
| Construction Industries | $ | 13,945 |
| | $ | 3,281 |
| | $ | 11 |
| | $ | 283 |
| | $ | 12 |
| | $ | 17,532 |
| | $ | 3,587 |
| | 26 | % |
| Resource Industries | 5,553 |
| | 1,568 |
| | 292 |
| | 18 |
| | 42 |
| | 7,473 |
| | 1,920 |
| | 35 | % |
| Energy & Transportation | 13,742 |
| | 2,038 |
| | 130 |
| | 141 |
| | 447 |
| | 16,498 |
| | 2,756 |
| | 20 | % |
| All Other Segments | 415 |
| | (13 | ) | | (1 | ) | | 3 |
| | (51 | ) | | 353 |
| | (62 | ) | | (15 | )% |
| Corporate Items and Eliminations | (3,173 | ) | | (40 | ) | | — |
| | (1 | ) | | (450 | ) | | (3,664 | ) | | (491 | ) | | |
|
| Machinery, Energy & Transportation Sales | 30,482 |
| | 6,834 |
| | 432 |
| | 444 |
| | — |
| | 38,192 |
| | 7,710 |
| | 25 | % |
| | | | | | | | | | | | | | | | |
| Financial Products Segment | 2,310 |
| | — |
| | — |
| | — |
| | 157 |
| | 2,467 |
| | 157 |
| | 7 | % |
| Corporate Items and Eliminations | (226 | ) | | — |
| | — |
| | — |
| | (53 | ) | | (279 | ) | | (53 | ) | | |
|
| Financial Products Revenues | 2,084 |
| | — |
| | — |
| | — |
| | 104 |
| | 2,188 |
| | 104 |
| | 5 | % |
| | | | | | | | | | | | | | | | |
| Consolidated Sales and Revenues | $ | 32,566 |
| | $ | 6,834 |
| | $ | 432 |
| | $ | 444 |
| | $ | 104 |
| | $ | 40,380 |
| | $ | 7,814 |
| | 24 | % |
| | | | | | | | | | | | | | | | |
Financial Products Segment
Financial Products’ segment revenues were $845 million in the third quarter of 2018, an increase of $71 million, or 9 percent, from the third quarter of 2017. The increase was primarily due to higher average financing rates and higher average earning assets in North America and Asia/Pacific as well as a favorable impact from returned or repossessed equipment. These favorable impacts were partially offset by lower intercompany lending activity in North America, lower average earning assets in Latin America and lower average financing rates in Europe.
Financial Products’ segment profit was $201 million in the third quarter of 2018, compared with $185 million in the third quarter of 2017. The increase was primarily due to a favorable impact from returned or repossessed equipment, higher average earning assets and an increase in net yield on average earning assets. This was partially offset by an unfavorable impact from available for sale securities in Insurance Services.
At the end of the third quarter of 2018, past dues at Cat Financial were 3.47 percent, compared with 2.73 percent at the end of the third quarter of 2017. The increase in past dues was primarily driven by the Cat Power Finance portfolio. Write-offs, net of recoveries, in the third quarter of 2018 were $40 million, compared with $47 million in the third quarter of 2017.
As of September 30, 2018, Cat Financial’s allowance for credit losses totaled $416 million, or 1.49 percent of finance receivables, compared with $416 million, or 1.48 percent of finance receivables at June 30, 2018. The allowance for credit losses at December 31, 2017, was $365 million, or 1.33 percent of finance receivables.
Corporate Items and Eliminations
Expense for corporate items and eliminations was $401 million in the third quarter of 2018, a decrease of $58 million from the third quarter of 2017, primarily due to methodology differences and lower corporate costs. Restructuring costs were $110 million in the third quarter of 2018, compared to $90 million in the third quarter of 2017.
NINE MONTHS ENDED SEPTEMBER 30, 2018 COMPARED WITH NINE MONTHS ENDED SEPTEMBER 30, 2017
CONSOLIDATED OPERATING PROFITSALES AND REVENUES
The chart above graphically illustrates reasons for the change in Consolidated Operating ProfitSales and Revenues between the first quarter ofnine months ended September 30, 2017 (at left) and the first quarter ofnine months ended September 30, 2018 (at right). Items favorably impacting operating profitsales and revenues appear as upward stair steps with the corresponding dollar amounts above each bar, while items negatively impacting operating profitsales and revenues appear as downward stair steps with dollar amounts reflected in parentheses above each bar. Caterpillar management utilizes these charts internally to visually communicate with the company's board of directors and employees. The bar entitled Other includes consolidating adjustments
Total sales and Machinery, Energy & Transportation other operating (income) expenses.
Operating profit for the first quarter of 2018 was $2.108revenues were $40.380 billion compared to $380 million in the first quarternine months ended September 30, 2018, an increase of $7.814 billion, or 24 percent, compared with $32.566 billion in the nine months ended September 30, 2017. The increase of $1.728 billion was mostlyprimarily due to higher sales volume driven by improved demand for equipment across the three primary segments. Sales were also higher due to currency impacts, primarily from a stronger euro and lower restructuring costs.Chinese yuan. Favorable price realization in Resource Industries and Energy & Transportation also contributed to the sales improvement. Financial Products’ revenues increased slightly.
Sales increased in all regions, with the largest sales increase in North America, which improved 27 percent as strong economic conditions in key end markets drove higher end-user demand. Also contributing to higher sales was largely offset byan increase in dealer inventories in the nine months ended September 30, 2018, compared to a decrease in the nine months ended September 30, 2017.
Sales increased 14 percent in Latin America primarily due to stabilizing economic conditions in several countries in the region that resulted in improved demand from low levels.
EAME sales increased 16 percent primarily due to higher selling, generaldemand, including favorable changes in dealer inventories, as economic conditions have improved in several countries in the region. The impact of a stronger euro and administrative (SG&A)favorable price realization also contributed to higher sales. The impact of changes in dealer inventories was favorable as dealer inventories increased more significantly in the nine months ended September 30, 2018, than during the nine months ended September 30, 2017.
Asia/Pacific sales increased 37 percent primarily due to higher demand in several countries across the region, including favorable changes in dealer inventories, the impact of a stronger Chinese yuan and researchfavorable price realization. Dealer inventories increased in the nine months ended September 30, 2018, and development (R&D) expenses and lower operating profit from Financial Products.
Manufacturing costs were about flat as lower warranty expense and the favorable impact from cost absorption were about offset by higher material costs, freight costs and short-term incentive compensation expense. Cost absorption was favorable as inventory increased more in the nine months ended September 30, 2017.
The sharp increase in demand has led to supply chain challenges. Although the company is making efforts to improve material flows, constraints remain for some parts and components that are impacting lead times and availability.
During the first quarternine months of 2018, than in the first quarterdealer machine and engine inventories increased about $2.1 billion, compared to an increase of 2017 due to higher production volumes in 2018. Material costs were unfavorable primarily due to increases in steel prices. SG&A/R&D expenses were unfavorable mostly due to higher short-term incentive compensation expense and targeted investments that primarily impacted SG&A. During the remainder of 2018, we expect unfavorable cost absorption from decreasing inventory levels, higher material costs due to further increases in steel and other commodity prices and increased spending from targeted investments, including expanded offerings and services to support profitable growth initiatives. For the full year, we expect favorable price realization will more than offset higher material costs.
Restructuring costs were $69about $100 million in the first quarternine months of 2018. In2017. The company believes the increase in dealer inventories during the first quarter of 2017, restructuring costs of $723 million were primarily related to the announced closure of the facility in Gosselies, Belgium.
Short-term incentive compensation expense was about $360 million in the first quarternine months of 2018 compared to about $235 millionis reflective of current end-user demand. However, dealers are independent, and there could be many reasons for changes in the first quartertheir inventory levels, including their expectations of 2017. For the full year, we expect short-term incentive compensation will be about $1.4 billion, nearly the same as 2017.
Other Profit/Loss Items
| |
▪ | Interest expense excluding Financial Products in the first quarter of 2018 was $101 million, a decrease of $22 million from the first quarter of 2017, primarily due to an early debt retirement in the fourth quarter of 2017.
|
| |
▪ | Other income/expense in the first quarter of 2018 was income of $127 million, compared with income of $32 million in the first quarter of 2017. The favorable change was primarily due to pension and other postemployment benefit (OPEB) plans, including the absence of restructuring costs and higher expected return on plan assets. Also contributing to the favorable change were lower net losses from currency translation and hedging in the first quarter of 2018 than in the first quarter of 2017.
|
| |
▪ | The provision for income taxes in the first quarter of 2018 reflects an estimated annual tax rate of 24 percent, compared to 32 percent for the first quarter of 2017, excluding the discrete items discussed in the following paragraph. The decrease is primarily due to the reduction in the U.S. corporate tax rate beginning January 1, 2018, along with other changes in the geographic mix of profits from a tax perspective.
|
In addition, a discrete tax benefitfuture demand and product delivery times. Dealers’ demand expectations take into account seasonal changes, macroeconomic conditions, machine rental rates and other factors. Delivery times can vary based on availability of $40 million was recorded in the first quarter of 2018, compared to $17 million in the first quarter of 2017, for the settlement of stock-based compensation awards with associated tax deductions in excess of cumulative U.S. GAAP compensation expense. The provision for income taxes in the first quarter of 2017 also included a $15 million increase to prior year taxes related to non-U.S. restructuring costs.
Our analysis of U.S. tax reform legislation, updated through March 31, 2018, resulted in no change to the 2017 year-end provisional charge of $2.371 billion. We will continue to update our calculations as additional required information is preparedproduct from Caterpillar factories and analyzed, interpretations and assumptions are refined, additional guidance is issued, and due to actions we may take as a result of the legislation. These updates could significantly impact the provision for income taxes, the amount of taxes payable and the deferred tax asset and liability balances.product distribution centers.
Segment Information
|
|
| Sales and Revenues by Geographic Region |
| | | | North America | | Latin America | | EAME | | Asia/Pacific | | External Sales and Revenues | | Inter-Segment | | Total Sales and Revenues | North America | | Latin America | | EAME | | Asia/Pacific | | External Sales and Revenues | | Inter-Segment | | Total Sales and Revenues |
| (Millions of dollars) | $ | | % Chg | | $ | | % Chg | | $ | | % Chg | | $ | | % Chg | | $ | | % Chg | | $ | | % Chg | | $ | | % Chg | $ | | % Chg | | $ | | % Chg | | $ | | % Chg | | $ | | % Chg | | $ | | % Chg | | $ | | % Chg | | $ | | % Chg |
| First Quarter 2018 | |
| | |
| | |
| | |
| | |
| | |
| | |
| | |
| | |
| | |
| | | | | | | | | |
| Nine Months Ended September 30, 2018 | | |
| | |
| | |
| | |
| | |
| | |
| | |
| | |
| | |
| | |
| | | | | | | | |
| Construction Industries | $ | 2,620 |
| | 37 | % | | $ | 344 |
| | 38 | % | | $ | 1,067 |
| | 31 | % | | $ | 1,628 |
| | 46 | % | | $ | 5,659 |
| | 38 | % | | $ | 18 |
| | 100 | % | | $ | 5,677 |
| | 38 | % | $ | 8,005 |
| | 25 | % | | $ | 1,105 |
| | 10 | % | | $ | 3,347 |
| | 20 | % | | $ | 4,993 |
| | 35 | % | | $ | 17,450 |
| | 26 | % | | $ | 82 |
| | 17 | % | | $ | 17,532 |
| | 26 | % |
| Resource Industries | 798 |
| | 33 | % | | 360 |
| | 34 | % | | 520 |
| | 25 | % | | 530 |
| | 37 | % | | 2,208 |
| | 32 | % | | 101 |
| | 11 | % | | 2,309 |
| | 31 | % | 2,451 |
| | 37 | % | | 1,181 |
| | 32 | % | | 1,663 |
| | 28 | % | | 1,882 |
| | 44 | % | | 7,177 |
| | 35 | % | | 296 |
| | 17 | % | | 7,473 |
| | 35 | % |
| Energy & Transportation | 2,225 |
| | 29 | % | | 280 |
| | 2 | % | | 1,092 |
| | 21 | % | | 679 |
| | 48 | % | | 4,276 |
| | 27 | % | | 943 |
| | 21 | % | | 5,219 |
| | 26 | % | 7,116 |
| | 26 | % | | 897 |
| | 1 | % | | 3,425 |
| | 9 | % | | 2,129 |
| | 34 | % | | 13,567 |
| | 21 | % | | 2,931 |
| | 18 | % | | 16,498 |
| | 20 | % |
| All Other Segments | 15 |
| | 88 | % | | — |
| | — | % | | 4 |
| | (75 | %) | | 18 |
| | 38 | % | | 37 |
| | — | % | | 79 |
| | (17 | %) | | 116 |
| | (12 | %) | 47 |
| | (2 | %) | | 1 |
| | (50 | %) | | 12 |
| | (70 | %) | | 55 |
| | 53 | % | | 115 |
| | (9 | %) | | 238 |
| | (18 | %) | | 353 |
| | (15 | %) |
| Corporate Items and Eliminations | (28 | ) | | | | 1 |
| | | | (3 | ) | | | | — |
| | | | (30 | ) | | | | (1,141 | ) | | | | (1,171 | ) | | | (108 | ) | | | | (1 | ) | | | | (8 | ) | | | | — |
| | | | (117 | ) | | | | (3,547 | ) | | | | (3,664 | ) | | |
| Machinery, Energy & Transportation Sales | 5,630 |
| | 33 | % | | 985 |
| | 24 | % | | 2,680 |
| | 25 | % | | 2,855 |
| | 44 | % | | 12,150 |
| | 33 | % | | — |
| | — | % | | 12,150 |
| | 33 | % | 17,511 |
| | 27 | % | | 3,183 |
| | 14 | % | | 8,439 |
| | 16 | % | | 9,059 |
| | 37 | % | | 38,192 |
| | 25 | % | | — |
| | — | % | | 38,192 |
| | 25 | % |
| | | | | | | | | | | | | | | | | | | | | | | | | | | | | | | | | | | | | | | | | | | | | | | | | | | | | | | |
| Financial Products Segment | 512 |
| | 5 | % | | 74 |
| | (11 | %) | | 101 |
| | 1 | % | | 106 |
| | 16 | % | | 793 |
| 1 | 4 | % | | — |
| | — | % | | 793 |
| | 4 | % | 1,608 |
| | 7 | % | | 213 |
| | (6 | %) | | 303 |
| | (3 | )% | | 343 |
| | 26 | % | | 2,467 |
| 1 | 7 | % | | — |
| | — | % | | 2,467 |
| | 7 | % |
| Corporate Items and Eliminations | (49 | ) | | | | (13 | ) | | | | (5 | ) | | | | (17 | ) | | | | (84 | ) | | | | — |
| | | | (84 | ) | | | (168 | ) | | | | (36 | ) | | | | (18 | ) | | | | (57 | ) | | | | (279 | ) | | | | — |
| | | | (279 | ) | | |
| Financial Products Revenues | 463 |
| | 3 | % | | 61 |
| | (12 | %) | | 96 |
| | — | % | | 89 |
| | 13 | % | | 709 |
| | 2 | % | | — |
| | — | % | | 709 |
| | 2 | % | 1,440 |
| | 6 | % | | 177 |
| | (8 | %) | | 285 |
| | (4 | %) | | 286 |
| | 23 | % | | 2,188 |
| | 5 | % | | — |
| | — | % | | 2,188 |
| | 5 | % |
| | | | | | | | | | | | | | | | | | | | | | | | | | | | | | | | | | | | | | | | | | | | | | | | | | | | | | | |
| Consolidated Sales and Revenues | $ | 6,093 |
| | 31 | % | | $ | 1,046 |
| | 21 | % | | $ | 2,776 |
| | 24 | % | | $ | 2,944 |
| | 43 | % | | $ | 12,859 |
| | 31 | % | | $ | — |
| | — | % | | $ | 12,859 |
| | 31 | % | $ | 18,951 |
| | 25 | % | | $ | 3,360 |
| | 13 | % | | $ | 8,724 |
| | 15 | % | | $ | 9,345 |
| | 36 | % | | $ | 40,380 |
| | 24 | % | | $ | — |
| | — | % | | $ | 40,380 |
| | 24 | % |
| | | | | | | | | | | | | | | | | | | | | | | | | | | | | | | | | | | | | | | | | | | | | | | | | | | | | | | |
| First Quarter 2017 | |
| | |
| | |
| | |
| | |
| | |
| | |
| | |
| | |
| | |
| | |
| | |
| | |
| | |
| |
| Nine Months Ended September 30, 2017 | | |
| | |
| | |
| | |
| | |
| | |
| | |
| | |
| | |
| | |
| | |
| | |
| | |
| | |
|
| Construction Industries | $ | 1,913 |
| | | | $ | 250 |
| | | | $ | 812 |
| | | | $ | 1,116 |
| | |
| | $ | 4,091 |
| | | | $ | 9 |
| | |
| | $ | 4,100 |
| | | $ | 6,396 |
| | | | $ | 1,004 |
| | | | $ | 2,784 |
| | | | $ | 3,691 |
| | |
| | $ | 13,875 |
| | | | $ | 70 |
| | |
| | $ | 13,945 |
| | |
| Resource Industries | 598 |
| | | | 269 |
| | | | 416 |
| | | | 387 |
| | |
| | 1,670 |
| | | | 91 |
| | |
| | 1,761 |
| | | 1,791 |
| | | | 897 |
| | | | 1,300 |
| | | | 1,311 |
| | |
| | 5,299 |
| | | | 254 |
| | |
| | 5,553 |
| | |
| Energy & Transportation | 1,722 |
| | | | 275 |
| | | | 900 |
| | | | 459 |
| | |
| | 3,356 |
| | | | 780 |
| | |
| | 4,136 |
| | | 5,632 |
| | | | 887 |
| | | | 3,145 |
| | | | 1,594 |
| | |
| | 11,258 |
| | | | 2,484 |
| | |
| | 13,742 |
| | |
| All Other Segments | 8 |
| | | | — |
| | | | 16 |
| | | | 13 |
| | |
| | 37 |
| | | | 95 |
| | |
| | 132 |
| | | 48 |
| | | | 2 |
| | | | 40 |
| | | | 36 |
| | |
| | 126 |
| | | | 289 |
| | |
| | 415 |
| | |
| Corporate Items and Eliminations | (23 | ) | | | | — |
| | | | (2 | ) | | | | 1 |
| | | | (24 | ) | | | | (975 | ) | | | | (999 | ) | | | (70 | ) | | | | (1 | ) | | | | (6 | ) | | | | 1 |
| | | | (76 | ) | | | | (3,097 | ) | | | | (3,173 | ) | | |
| Machinery, Energy & Transportation Sales | 4,218 |
| | |
| | 794 |
| | |
| | 2,142 |
| | |
| | 1,976 |
| | |
| | 9,130 |
| | |
| | — |
| | |
| | 9,130 |
| | |
| 13,797 |
| | |
| | 2,789 |
| | |
| | 7,263 |
| | |
| | 6,633 |
| | |
| | 30,482 |
| | |
| | — |
| | |
| | 30,482 |
| | |
|
| | | | | | | | | | | | | | | | | | | | | | | | | | | | | | | | | | | | | | | | | | | | | | | | | | | | | | | |
| Financial Products Segment | 486 |
| | | | 83 |
| | | | 100 |
| | | | 91 |
| | |
| | 760 |
| 1 | | | — |
| | |
| | 760 |
| | | 1,501 |
| | | | 226 |
| | | | 311 |
| | | | 272 |
| | |
| | 2,310 |
| 1 | | | — |
| | |
| | 2,310 |
| | |
| Corporate Items and Eliminations | (38 | ) | | | | (14 | ) | | | | (4 | ) | | | | (12 | ) | | |
| | (68 | ) | | | | — |
| | |
| | (68 | ) | | | (140 | ) | | | | (34 | ) | | | | (13 | ) | | | | (39 | ) | | |
| | (226 | ) | | | | — |
| | |
| | (226 | ) | | |
| Financial Products Revenues | 448 |
| | |
| | 69 |
| | |
| | 96 |
| | |
| | 79 |
| | |
| | 692 |
| | |
| | — |
| | |
| | 692 |
| | |
| 1,361 |
| | |
| | 192 |
| | |
| | 298 |
| | |
| | 233 |
| | |
| | 2,084 |
| | |
| | — |
| | |
| | 2,084 |
| | |
|
| | | | | | | | | | | | | | | | | | | | | | | | | | | | | | | | | | | | | | | | | | | | | | | | | | | | | | | |
| Consolidated Sales and Revenues | $ | 4,666 |
| | |
| | $ | 863 |
| | |
| | $ | 2,238 |
| | |
| | $ | 2,055 |
| | |
| | $ | 9,822 |
| | |
| | $ | — |
| | |
| | $ | 9,822 |
| | |
| $ | 15,158 |
| | |
| | $ | 2,981 |
| | |
| | $ | 7,561 |
| | |
| | $ | 6,866 |
| | |
| | $ | 32,566 |
| | |
| | $ | — |
| | |
| | $ | 32,566 |
| | |
|
1 Includes revenues from Machinery, Energy& Transportation of $105$345 million and $86$281 million in the first quarter ofnine months ended September 30, 2018 and 2017, respectively.
| | | Sales and Revenues by Segment | Sales and Revenues by Segment | | | | | | | | | | | | | | | Sales and Revenues by Segment | | | | | | | | | | | | | | |
| (Millions of dollars) | First Quarter 2017 | | Sales Volume | | Price Realization | | Currency | | Inter-Segment / Other | | First Quarter 2018 | | $ Change | | % Change | Nine Months Ended September 30, 2017 | | Sales Volume | | Price Realization | | Currency | | Other | | Nine Months Ended September 30, 2018 | | $ Change | | % Change |
| | | | | | | | | | | | | | | | | | | | | | | | | | | | | | | |
| Construction Industries | $ | 4,100 |
| | $ | 1,340 |
| | $ | 59 |
| | $ | 169 |
| | $ | 9 |
| | $ | 5,677 |
| | $ | 1,577 |
| | 38 | % | $ | 13,945 |
| | $ | 3,281 |
| | $ | 11 |
| | $ | 283 |
| | $ | 12 |
| | $ | 17,532 |
| | $ | 3,587 |
| | 26 | % |
| Resource Industries | 1,761 |
| | 424 |
| | 86 |
| | 28 |
| | 10 |
| | 2,309 |
| | 548 |
| | 31 | % | 5,553 |
| | 1,568 |
| | 292 |
| | 18 |
| | 42 |
| | 7,473 |
| | 1,920 |
| | 35 | % |
| Energy & Transportation | 4,136 |
| | 769 |
| | 41 |
| | 110 |
| | 163 |
| | 5,219 |
| | 1,083 |
| | 26 | % | 13,742 |
| | 2,038 |
| | 130 |
| | 141 |
| | 447 |
| | 16,498 |
| | 2,756 |
| | 20 | % |
| All Other Segments | 132 |
| | (1 | ) | | — |
| | 1 |
| | (16 | ) | | 116 |
| | (16 | ) | | (12 | %) | 415 |
| | (13 | ) | | (1 | ) | | 3 |
| | (51 | ) | | 353 |
| | (62 | ) | | (15 | )% |
| Corporate Items and Eliminations | (999 | ) | | (6 | ) | | — |
| | — |
| | (166 | ) | | (1,171 | ) | | (172 | ) | | |
| (3,173 | ) | | (40 | ) | | — |
| | (1 | ) | | (450 | ) | | (3,664 | ) | | (491 | ) | | |
|
| Machinery, Energy & Transportation Sales | 9,130 |
| | 2,526 |
| | 186 |
| | 308 |
| | — |
| | 12,150 |
| | 3,020 |
| | 33 | % | 30,482 |
| | 6,834 |
| | 432 |
| | 444 |
| | — |
| | 38,192 |
| | 7,710 |
| | 25 | % |
| | | | | | | | | | | | | | | | | | | | | | | | | | | | | | | |
| Financial Products Segment | 760 |
| | — |
| | — |
| | — |
| | 33 |
| | 793 |
| | 33 |
| | 4 | % | 2,310 |
| | — |
| | — |
| | — |
| | 157 |
| | 2,467 |
| | 157 |
| | 7 | % |
| Corporate Items and Eliminations | (68 | ) | | — |
| | — |
| | — |
| | (16 | ) | | (84 | ) | | (16 | ) | | |
| (226 | ) | | — |
| | — |
| | — |
| | (53 | ) | | (279 | ) | | (53 | ) | | |
|
| Financial Products Revenues | 692 |
| | — |
| | — |
| | — |
| | 17 |
| | 709 |
| | 17 |
| | 2 | % | 2,084 |
| | — |
| | — |
| | — |
| | 104 |
| | 2,188 |
| | 104 |
| | 5 | % |
| | | | | | | | | | | | | | | | | | | | | | | | | | | | | | | |
| Consolidated Sales and Revenues | $ | 9,822 |
| | $ | 2,526 |
| | $ | 186 |
| | $ | 308 |
| | $ | 17 |
| | $ | 12,859 |
| | $ | 3,037 |
| | 31 | % | $ | 32,566 |
| | $ | 6,834 |
| | $ | 432 |
| | $ | 444 |
| | $ | 104 |
| | $ | 40,380 |
| | $ | 7,814 |
| | 24 | % |
| | | | | | | | | | | | | | | | | | | | | | | | | | | | | | | |
|
| | | | | | | | | | | | | | |
| Profit by Segment | | | | | | | |
| (Millions of dollars) | First Quarter 2018 | | First Quarter 2017 | | $ Change | | % Change |
| Construction Industries | $ | 1,117 |
| | $ | 634 |
| | $ | 483 |
| | 76 | % |
| Resource Industries | 378 |
| | 160 |
| | 218 |
| | 136 | % |
| Energy & Transportation | 874 |
| | 545 |
| | 329 |
| | 60 | % |
| All Other Segments | 57 |
| | (14 | ) | | 71 |
| | n/a |
|
| Corporate Items and Eliminations | (371 | ) | | (1,060 | ) | | 689 |
| | |
|
| Machinery, Energy & Transportation | 2,055 |
| | 265 |
| | 1,790 |
| | 675 | % |
| | | | | | | | |
| Financial Products Segment | 141 |
| | 183 |
| | (42 | ) | | (23 | %) |
| Corporate Items and Eliminations | (2 | ) | | 3 |
| | (5 | ) | | |
|
| Financial Products | 139 |
| | 186 |
| | (47 | ) | | (25 | %) |
| Consolidating Adjustments | (86 | ) | | (71 | ) | | (15 | ) | | |
|
| Consolidated Operating Profit | $ | 2,108 |
| | $ | 380 |
| | $ | 1,728 |
| | 455 | % |
| | | | | | | | |
Construction Industries
Construction Industries’ total sales were $5.677 billion in the first quarter of 2018, compared with $4.100 billion in the first quarter of 2017. The increase was primarily due to higher sales volume.
| |
▪ | Sales volume increased primarily due to the impact of favorable changes in dealer inventories and higher end-user demand for construction equipment. Dealer inventories increased significantly more in the first quarter of 2018 than in the first quarter of 2017. The company believes the increase in dealer inventories is reflective of current end-user demand. |
Sales increased across all regions with the largest increases in North America and Asia/Pacific.
| |
▪ | In North America, the sales increase was mostly due to the impact of favorable changes in dealer inventories, which increased significantly more in the first quarter of 2018 than in the first quarter of 2017. In addition, sales increased due to higher end-user demand for construction equipment, primarily due to non-residential, infrastructure and oil and gas construction activities, including pipelines. |
| |
▪ | Sales in Asia/Pacific were higher across the region, with about half due to improved end-user demand in China stemming from increased building construction and infrastructure investment. In addition, the impact of changes in dealer inventories was favorable as dealer inventories decreased more in the first quarter of 2017 than in the first quarter of 2018. The favorable impact of a stronger Chinese yuan also contributed to the increase. |
| |
▪ | Sales increased in EAME primarily due to the impact of favorable changes in dealer inventories, the impact from a stronger euro and higher end-user demand for construction equipment. Dealer inventories increased more in the first quarter of 2018 than in the first quarter of 2017. |
| |
▪ | Although construction activity remained weak in Latin America, sales were higher as end-user demand increased from low levels due to stabilizing economic conditions in several countries in the region. |
Construction Industries’ profit was $1.117 billion in the first quarter of 2018, compared with $634 million in the first quarter of 2017. The increase in profit was a result of higher sales volume and favorable price realization. The increase was partially offset by higher SG&A/R&D expenses, material costs, primarily for steel, and freight costs. The increase in SG&A/R&D expenses was primarily due to higher short-term incentive compensation expense and targeted investments.
Construction Industries’ profit as a percent of total sales was 19.7 percent in the first quarter of 2018, compared with 15.5 percent in the first quarter of 2017.
Resource Industries
Resource Industries’ total sales were $2.309 billion in the first quarter of 2018, an increase of $548 million from the first quarter of 2017. The increase was primarily due to higher end-user demand for equipment in all regions. Compared to the first quarter of 2017, commodity prices remained strong and drove improved market conditions and financial health of mining companies. As a result, mining customers invested in delayed replacement cycles and initiated expansions, resulting in higher equipment sales in the first quarter of 2018. Macroeconomic growth globally also contributed to stronger sales for quarry and aggregate and heavy construction equipment. In addition, favorable price realization and the favorable impact of changes in dealer inventories contributed to increased sales. Dealer inventories increased more in the first quarter of 2018 than in the first quarter of 2017. Aftermarket parts
sales have also experienced growth related to increased production and higher machine utilization in the industries the company serves.
Resource Industries’ profit was $378 million in the first quarter of 2018, compared with $160 million in the first quarter of 2017. The improvement was primarily due to higher sales volume. Favorable price realization and variable manufacturing costs, including cost absorption, were partially offset by higher short-term incentive compensation expense and a slightly unfavorable impact from currency. Cost absorption was favorable as inventory increased in the first quarter of 2018 to support higher production and was about flat in the first quarter of 2017.
Resource Industries’ profit as a percent of total sales was 16.4 percent in the first quarter of 2018, compared with 9.1 percent in the first quarter of 2017.
Energy & Transportation
|
| | | | | | | | | | | | | | | |
| Sales by Application | | | | | | | | |
| (Millions of dollars) | | First Quarter 2018 | | First Quarter 2017 | | $ Change | | % Change |
| Oil and gas | | $ | 1,215 |
| | 809 |
| | $ | 406 |
| | 50 | % |
| Power generation | | 969 |
| | 716 |
| | 253 |
| | 35 | % |
| Industrial | | 906 |
| | 777 |
| | 129 |
| | 17 | % |
| Transportation | | 1,186 |
| | 1,054 |
| | 132 |
| | 13 | % |
| External Sales | | 4,276 |
| | 3,356 |
| | 920 |
| | 27 | % |
| Inter-Segment | | 943 |
| | 780 |
| | 163 |
| | 21 | % |
| Total Sales | | $ | 5,219 |
| | $ | 4,136 |
| | $ | 1,083 |
| | 26 | % |
| | | | | | | | | |
| | | | | | | | | |
Energy & Transportation’s total sales were $5.219 billion in the first quarter of 2018, compared with $4.136 billion in the first quarter of 2017. The increase was primarily due to higher external sales volume across all applications.
| |
▪ | Oil and Gas - Sales increased primarily due to higher demand in North America for gas compression, production and well servicing applications. Higher energy prices and growth in U.S. onshore oil and gas drove increased sales for reciprocating engines and related aftermarket parts. Sales in North America were also positively impacted by the timing of turbine project deliveries.
|
| |
▪ | Power Generation - Sales improved across all regions, with the largest increase in EAME primarily due to the timing of several large projects and favorable impacts from currency. In addition, sales in North America increased due to higher sales for turbines and aftermarket parts for reciprocating engines.
|
| |
▪ | Industrial - Sales were higher across all regions except Latin America, primarily due to improving global economic conditions supporting higher engine sales into industrial end-user applications. Sales in EAME were also positively impacted by favorable currency.
|
| |
▪ | Transportation - Sales were higher in Asia/Pacific and North America for rail services, driven primarily by growth in Australia and increased rail traffic in North America. Marine sales were higher primarily in Asia/Pacific due to timing of deliveries.
|
Energy & Transportation’s profit was $874 million in the first quarter of 2018, compared with $545 million in the first quarter of 2017. The increase was mostly due to higher sales volume and favorable price realization, partially offset by higher short-term incentive compensation expense and targeted investments.
Energy & Transportation’s profit as a percent of total sales was 16.7 percent in the first quarter of 2018, compared with 13.2 percent in the first quarter of 2017.
Financial Products Segment
Financial Products’ segment revenues were $793$845 million in the firstthird quarter of 2018, an increase of $33$71 million, or 49 percent, from the firstthird quarter of 2017. The increase was primarily due to higher average financing rates and higher average earning assets in North America and Asia/Pacific as well as a favorable impact from returned or repossessed equipment. These favorable impacts were partially offset by lower intercompany lending activity in North America, lower average earning assets in Latin America and higherlower average financing rates in North America,Europe.
Financial Products’ segment profit was $201 million in the third quarter of 2018, compared with $185 million in the third quarter of 2017. The increase was primarily due to a favorable impact from returned or repossessed equipment, higher average earning assets and an increase in net yield on average earning assets. This was partially offset by an unfavorable impact from available for sale securities in Insurance Services.
At the end of the third quarter of 2018, past dues at Cat Financial were 3.47 percent, compared with 2.73 percent at the end of the third quarter of 2017. The increase in past dues was primarily driven by the Cat Power Finance portfolio. Write-offs, net of recoveries, in the third quarter of 2018 were $40 million, compared with $47 million in the third quarter of 2017.
As of September 30, 2018, Cat Financial’s allowance for credit losses totaled $416 million, or 1.49 percent of finance receivables, compared with $416 million, or 1.48 percent of finance receivables at June 30, 2018. The allowance for credit losses at December 31, 2017, was $365 million, or 1.33 percent of finance receivables.
Corporate Items and Eliminations
Expense for corporate items and eliminations was $401 million in the third quarter of 2018, a decrease of $58 million from the third quarter of 2017, primarily due to methodology differences and lower corporate costs. Restructuring costs were $110 million in the third quarter of 2018, compared to $90 million in the third quarter of 2017.
NINE MONTHS ENDED SEPTEMBER 30, 2018 COMPARED WITH NINE MONTHS ENDED SEPTEMBER 30, 2017
CONSOLIDATED SALES AND REVENUES
The chart above graphically illustrates reasons for the change in Consolidated Sales and Revenues between the nine months ended September 30, 2017 (at left) and the nine months ended September 30, 2018 (at right). Items favorably impacting sales and revenues appear as upward stair steps with the corresponding dollar amounts above each bar, while items negatively impacting sales and revenues appear as downward stair steps with dollar amounts reflected in parentheses above each bar. Caterpillar management utilizes these charts internally to visually communicate with the company's board of directors and employees.
Total sales and revenues were $40.380 billion in the nine months ended September 30, 2018, an increase of $7.814 billion, or 24 percent, compared with $32.566 billion in the nine months ended September 30, 2017. The increase was primarily due to higher sales volume driven by improved demand for equipment across the three primary segments. Sales were also higher due to currency impacts, primarily from a stronger euro and Chinese yuan. Favorable price realization in Resource Industries and Energy & Transportation also contributed to the sales improvement. Financial Products’ revenues increased slightly.
Sales increased in all regions, with the largest sales increase in North America, which improved 27 percent as strong economic conditions in key end markets drove higher end-user demand. Also contributing to higher sales was an increase in dealer inventories in the nine months ended September 30, 2018, compared to a decrease in the nine months ended September 30, 2017.
Sales increased 14 percent in Latin America primarily due to stabilizing economic conditions in several countries in the region that resulted in improved demand from low levels.
EAME sales increased 16 percent primarily due to higher demand, including favorable changes in dealer inventories, as economic conditions have improved in several countries in the region. The impact of a stronger euro and favorable price realization also contributed to higher sales. The impact of changes in dealer inventories was favorable as dealer inventories increased more significantly in the nine months ended September 30, 2018, than during the nine months ended September 30, 2017.
Asia/Pacific sales increased 37 percent primarily due to higher demand in several countries across the region, including favorable changes in dealer inventories, the impact of a stronger Chinese yuan and favorable price realization. Dealer inventories increased in the nine months ended September 30, 2018, and were about flat in the nine months ended September 30, 2017.
The sharp increase in demand has led to supply chain challenges. Although the company is making efforts to improve material flows, constraints remain for some parts and components that are impacting lead times and availability.
During the first nine months of 2018, dealer machine and engine inventories increased about $2.1 billion, compared to an increase of about $100 million in the first nine months of 2017. The company believes the increase in dealer inventories during the first nine months of 2018 is reflective of current end-user demand. However, dealers are independent, and there could be many reasons for changes in their inventory levels, including their expectations of future demand and product delivery times. Dealers’ demand expectations take into account seasonal changes, macroeconomic conditions, machine rental rates and other factors. Delivery times can vary based on availability of product from Caterpillar factories and product distribution centers.
|
|
| Sales and Revenues by Geographic Region |
|
| | | | | | | | | | | | | | | | | | | | | | | | | | | | | | | | | | | | | | | | | | | | | | | | |
| | North America | | Latin America | | EAME | | Asia/Pacific | | External Sales and Revenues | | Inter-Segment | | Total Sales and Revenues |
| (Millions of dollars) | $ | | % Chg | | $ | | % Chg | | $ | | % Chg | | $ | | % Chg | | $ | | % Chg | | $ | | % Chg | | $ | | % Chg |
| Nine Months Ended September 30, 2018 | |
| | |
| | |
| | |
| | |
| | |
| | |
| | |
| | |
| | |
| | | | | | | | |
| Construction Industries | $ | 8,005 |
| | 25 | % | | $ | 1,105 |
| | 10 | % | | $ | 3,347 |
| | 20 | % | | $ | 4,993 |
| | 35 | % | | $ | 17,450 |
| | 26 | % | | $ | 82 |
| | 17 | % | | $ | 17,532 |
| | 26 | % |
| Resource Industries | 2,451 |
| | 37 | % | | 1,181 |
| | 32 | % | | 1,663 |
| | 28 | % | | 1,882 |
| | 44 | % | | 7,177 |
| | 35 | % | | 296 |
| | 17 | % | | 7,473 |
| | 35 | % |
| Energy & Transportation | 7,116 |
| | 26 | % | | 897 |
| | 1 | % | | 3,425 |
| | 9 | % | | 2,129 |
| | 34 | % | | 13,567 |
| | 21 | % | | 2,931 |
| | 18 | % | | 16,498 |
| | 20 | % |
| All Other Segments | 47 |
| | (2 | %) | | 1 |
| | (50 | %) | | 12 |
| | (70 | %) | | 55 |
| | 53 | % | | 115 |
| | (9 | %) | | 238 |
| | (18 | %) | | 353 |
| | (15 | %) |
| Corporate Items and Eliminations | (108 | ) | | | | (1 | ) | | | | (8 | ) | | | | — |
| | | | (117 | ) | | | | (3,547 | ) | | | | (3,664 | ) | | |
| Machinery, Energy & Transportation Sales | 17,511 |
| | 27 | % | | 3,183 |
| | 14 | % | | 8,439 |
| | 16 | % | | 9,059 |
| | 37 | % | | 38,192 |
| | 25 | % | | — |
| | — | % | | 38,192 |
| | 25 | % |
| | | | | | | | | | | | | | | | | | | | | | | | | | | | |
| Financial Products Segment | 1,608 |
| | 7 | % | | 213 |
| | (6 | %) | | 303 |
| | (3 | )% | | 343 |
| | 26 | % | | 2,467 |
| 1 | 7 | % | | — |
| | — | % | | 2,467 |
| | 7 | % |
| Corporate Items and Eliminations | (168 | ) | | | | (36 | ) | | | | (18 | ) | | | | (57 | ) | | | | (279 | ) | | | | — |
| | | | (279 | ) | | |
| Financial Products Revenues | 1,440 |
| | 6 | % | | 177 |
| | (8 | %) | | 285 |
| | (4 | %) | | 286 |
| | 23 | % | | 2,188 |
| | 5 | % | | — |
| | — | % | | 2,188 |
| | 5 | % |
| | | | | | | | | | | | | | | | | | | | | | | | | | | | |
| Consolidated Sales and Revenues | $ | 18,951 |
| | 25 | % | | $ | 3,360 |
| | 13 | % | | $ | 8,724 |
| | 15 | % | | $ | 9,345 |
| | 36 | % | | $ | 40,380 |
| | 24 | % | | $ | — |
| | — | % | | $ | 40,380 |
| | 24 | % |
| | | | | | | | | | | | | | | | | | | | | | | | | | | | |
| Nine Months Ended September 30, 2017 | |
| | |
| | |
| | |
| | |
| | |
| | |
| | |
| | |
| | |
| | |
| | |
| | |
| | |
|
| Construction Industries | $ | 6,396 |
| | | | $ | 1,004 |
| | | | $ | 2,784 |
| | | | $ | 3,691 |
| | |
| | $ | 13,875 |
| | | | $ | 70 |
| | |
| | $ | 13,945 |
| | |
| Resource Industries | 1,791 |
| | | | 897 |
| | | | 1,300 |
| | | | 1,311 |
| | |
| | 5,299 |
| | | | 254 |
| | |
| | 5,553 |
| | |
| Energy & Transportation | 5,632 |
| | | | 887 |
| | | | 3,145 |
| | | | 1,594 |
| | |
| | 11,258 |
| | | | 2,484 |
| | |
| | 13,742 |
| | |
| All Other Segments | 48 |
| | | | 2 |
| | | | 40 |
| | | | 36 |
| | |
| | 126 |
| | | | 289 |
| | |
| | 415 |
| | |
| Corporate Items and Eliminations | (70 | ) | | | | (1 | ) | | | | (6 | ) | | | | 1 |
| | | | (76 | ) | | | | (3,097 | ) | | | | (3,173 | ) | | |
| Machinery, Energy & Transportation Sales | 13,797 |
| | |
| | 2,789 |
| | |
| | 7,263 |
| | |
| | 6,633 |
| | |
| | 30,482 |
| | |
| | — |
| | |
| | 30,482 |
| | |
|
| | | | | | | | | | | | | | | | | | | | | | | | | | | | |
| Financial Products Segment | 1,501 |
| | | | 226 |
| | | | 311 |
| | | | 272 |
| | |
| | 2,310 |
| 1 | | | — |
| | |
| | 2,310 |
| | |
| Corporate Items and Eliminations | (140 | ) | | | | (34 | ) | | | | (13 | ) | | | | (39 | ) | | |
| | (226 | ) | | | | — |
| | |
| | (226 | ) | | |
| Financial Products Revenues | 1,361 |
| | |
| | 192 |
| | |
| | 298 |
| | |
| | 233 |
| | |
| | 2,084 |
| | |
| | — |
| | |
| | 2,084 |
| | |
|
| | | | | | | | | | | | | | | | | | | | | | | | | | | | |
| Consolidated Sales and Revenues | $ | 15,158 |
| | |
| | $ | 2,981 |
| | |
| | $ | 7,561 |
| | |
| | $ | 6,866 |
| | |
| | $ | 32,566 |
| | |
| | $ | — |
| | |
| | $ | 32,566 |
| | |
|
1 Includes revenues from Machinery, Energy & Transportation of $345 million and $281 million in the nine months ended September 30, 2018 and 2017, respectively.
|
| | | | | | | | | | | | | | | | | | | | | | | | | | | | | | |
| Sales and Revenues by Segment | | | | | | | | | | | | | | |
| (Millions of dollars) | Nine Months Ended September 30, 2017 | | Sales Volume | | Price Realization | | Currency | | Other | | Nine Months Ended September 30, 2018 | | $ Change | | % Change |
| | | | | | | | | | | | | | | | |
| Construction Industries | $ | 13,945 |
| | $ | 3,281 |
| | $ | 11 |
| | $ | 283 |
| | $ | 12 |
| | $ | 17,532 |
| | $ | 3,587 |
| | 26 | % |
| Resource Industries | 5,553 |
| | 1,568 |
| | 292 |
| | 18 |
| | 42 |
| | 7,473 |
| | 1,920 |
| | 35 | % |
| Energy & Transportation | 13,742 |
| | 2,038 |
| | 130 |
| | 141 |
| | 447 |
| | 16,498 |
| | 2,756 |
| | 20 | % |
| All Other Segments | 415 |
| | (13 | ) | | (1 | ) | | 3 |
| | (51 | ) | | 353 |
| | (62 | ) | | (15 | )% |
| Corporate Items and Eliminations | (3,173 | ) | | (40 | ) | | — |
| | (1 | ) | | (450 | ) | | (3,664 | ) | | (491 | ) | | |
|
| Machinery, Energy & Transportation Sales | 30,482 |
| | 6,834 |
| | 432 |
| | 444 |
| | — |
| | 38,192 |
| | 7,710 |
| | 25 | % |
| | | | | | | | | | | | | | | | |
| Financial Products Segment | 2,310 |
| | — |
| | — |
| | — |
| | 157 |
| | 2,467 |
| | 157 |
| | 7 | % |
| Corporate Items and Eliminations | (226 | ) | | — |
| | — |
| | — |
| | (53 | ) | | (279 | ) | | (53 | ) | | |
|
| Financial Products Revenues | 2,084 |
| | — |
| | — |
| | — |
| | 104 |
| | 2,188 |
| | 104 |
| | 5 | % |
| | | | | | | | | | | | | | | | |
| Consolidated Sales and Revenues | $ | 32,566 |
| | $ | 6,834 |
| | $ | 432 |
| | $ | 444 |
| | $ | 104 |
| | $ | 40,380 |
| | $ | 7,814 |
| | 24 | % |
| | | | | | | | | | | | | | | | |
CONSOLIDATED OPERATING PROFIT
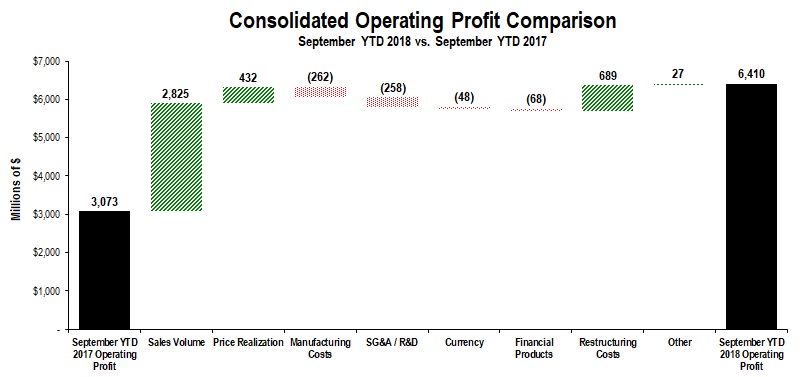 The chart above graphically illustrates reasons for the change in Consolidated Operating Profit between the nine months ended September 30, 2017 (at left) and the nine months ended September 30, 2018 (at right). Items favorably impacting operating profitappear as upward stair steps with the corresponding dollar amounts above each bar, while items negatively impacting operating profit appear as downward stair steps with dollar amounts reflected in parentheses above each bar. Caterpillar management utilizes these charts internally to visually communicate with the company's board of directors and employees. The bar entitled Other includes consolidating adjustments and Machinery, Energy & Transportation other operating (income) expenses.
Operating profit for the nine months ended September 30, 2018, was $6.410 billion, compared with $3.073 billion for the nine months ended September 30, 2017. The increase of $3.337 billion was primarily due to higher sales volume and lower restructuring costs. Higher manufacturing costs and increased SG&A/R&D were partially offset by favorable price realization. Financial Products operating profit declined. The company expects price realization in the fourth quarter of 2018 will be favorably impacted by previously announced mid-year price increases.
Manufacturing costs were higher due to increased freight and material costs, partially offset by lower warranty expense. Freight costs were unfavorable primarily due to supply chain inefficiencies as the industry responds to strong global demand. Material costs were higher primarily due to increases in steel prices. The impact of recently imposed tariffs was about $40 million during the nine months ended September 30, 2018. For the full year of 2018, we expect the impact of recently imposed tariffs will be at the low end of the previously provided range of $100 million to $200 million. In addition, the company expects supply chain challenges to continue to impact freight costs during the fourth quarter of 2018.
SG&A/R&D expenses increased primarily due to investments aligned with the company’s strategic growth initiatives.
Restructuring costs were $293 million for the nine months ended September 30, 2018. In the first nine months of 2017, restructuring costs impacting operating profit of $982 million were primarily related to the closure of the facility in Gosselies, Belgium, and restructuring actions in Resource Industries.
Short-term incentive compensation expense is directly related to financial and operational performance, measured against targets set annually. Expense for the nine months ended September 30, 2018, was about $1.070 billion compared to about $1.050 billion for the nine months ended September 30, 2017. For the full year, we expect short-term incentive compensation will be about $1.4 billion, nearly the same as 2017.
Other Profit/Loss Items
| |
| ▪ | Other income/expense for the nine months ended September 30, 2018, was income of $350 million, compared with income of $260 million for the nine months ended September 30, 2017. The favorable change was primarily a result of the impact from pension and other postemployment benefits (OPEB) plans and other miscellaneous items, partially offset by the absence of a pretax gain of $85 million on the sale of Caterpillar’s equity investment in IronPlanet in the nine months ended September 30, 2017. |
| |
| ▪ | The provision for income taxes for the first nine months of 2018 reflected an estimated annual tax rate of 24 percent, compared to 32 percent for the first nine months of 2017, excluding the discrete items discussed in the following paragraph. The decrease was primarily due to the reduction in the U.S. corporate tax rate beginning January 1, 2018, along with other changes in the geographic mix of profits from a tax perspective. |
The 2018 provision for income taxes for the first nine months of 2018 also included a $154 million reduction to the provisionally estimated charge of $2.371 billion recognized during the fourth quarter of 2017 due to enactment of U.S. tax reform legislation. The $154 million benefit revises the estimated impact of the write-down of U.S. net deferred tax assets to reflect the reduction in the U.S. corporate tax rate from 35 percent to 21 percent. This benefit primarily related to the decision to make an additional discretionary pension contribution of $1.0 billion to U.S. pension plans in the third quarter of 2018 which was treated as deductible on the 2017 U.S. tax return. The provision for income taxes for the first nine months of 2018 also includes a charge of $59 million to correct for an error which resulted in an understatement of the valuation allowance offsetting deferred tax assets for prior years. This error had the effect of overstating profit by $17 million, $33 million and $9 million for the years ended December 31, 2017, 2016 and 2015, respectively. Management has concluded that the error was not material to any period presented. In addition, a discrete tax benefit of $52 million was recorded in the first nine months of 2018, compared to $45 million in the first nine months of 2017, for the settlement of stock-based compensation awards with associated tax deductions in excess of cumulative U.S. GAAP compensation expense. The provision for income taxes for the first nine months of 2018 also included a $25 million benefit for the release of a valuation allowance against the deferred tax assets of a non-U.S. subsidiary. The provision for income taxes for the first nine months of 2017 also included a $15 million increase to prior year taxes related to non-U.S. restructuring costs.
Our analysis of U.S. tax reform legislation, updated through September 30, 2018, resulted in no other changes to the 2017 year-end provisional charge. We will continue to update our calculations as additional required information is prepared and analyzed, interpretations and assumptions are refined, and additional guidance is issued. These updates could significantly impact the provision for income taxes, the amount of taxes payable and the deferred tax asset and liability balances. We account for the new U.S. tax on global intangible low-taxed income as a period cost.
|
| | | | | | | | | | | | | | |
| Profit (Loss) by Segment | | | | | | | |
| (Millions of dollars) | Nine Months Ended September 30, 2018 | | Nine Months Ended September 30, 2017 | | $ Change | | % Change |
| Construction Industries | $ | 3,329 |
| | $ | 2,418 |
| | $ | 911 |
| | 38 | % |
| Resource Industries | 1,203 |
| | 488 |
| | 715 |
| | 147 | % |
| Energy & Transportation | 2,859 |
| | 1,982 |
| | 877 |
| | 44 | % |
| All Other Segments | 70 |
| | (28 | ) | | 98 |
| | n/a |
|
| Corporate Items and Eliminations | (1,208 | ) | | (2,071 | ) | | 863 |
| | |
|
| Machinery, Energy & Transportation | 6,253 |
| | 2,789 |
| | 3,464 |
| | 124 | % |
| | | | | | | | |
| Financial Products Segment | 476 |
| | 559 |
| | (83 | ) | | (15 | )% |
| Corporate Items and Eliminations | (37 | ) | | (39 | ) | | 2 |
| | |
|
| Financial Products | 439 |
| | 520 |
| | (81 | ) | | (16 | )% |
| Consolidating Adjustments | (282 | ) | | (236 | ) | | (46 | ) | | |
|
| Consolidated Operating Profit | $ | 6,410 |
| | $ | 3,073 |
| | $ | 3,337 |
| | 109 | % |
| | | | | | | | |
Construction Industries
Construction Industries’ total sales were $17.532 billion in the nine months ended September 30, 2018, compared with $13.945 billion in the nine months ended September 30, 2017. The increase was mostly due to higher sales volume for construction equipment. Sales were also higher due to currency impacts, primarily from a stronger euro and Chinese yuan.
| |
| ▪ | Sales volume increased primarily due to higher demand for construction equipment and the impact of favorable changes in dealer inventories. Dealer inventories increased significantly more in the nine months ended September 30, 2018, than in the nine months ended September 30, 2017. |
Sales increased in all regions.
In North America, the sales increase was primarily due to higher demand for construction equipment, primarily to support oil and gas activities, including pipelines, non-residential building construction and infrastructure activities. In addition, sales increased due to the favorable impact of dealer inventories, which increased in the nine months ended September 30, 2018, compared to a slight decrease in the nine months ended September 30, 2017.
Although construction activities remained weak in Latin America, sales were higher in the region.
Sales increased in EAME primarily due to higher demand, including favorable changes in dealer inventories, and the favorable impact of currency, mostly from a stronger euro. Higher demand was driven by increased construction activities across several countries in the region. Dealer inventories increased more in the nine months ended September 30, 2018, than during the nine months ended September 30, 2017. Favorable price realization also contributed to the sales increase.
Sales in Asia/Pacific were higher in several countries in the region, with most of the improved demand in China, including an increase in dealer inventories, stemming from increased building construction and infrastructure investment. The favorable impact of a stronger Chinese yuan also contributed to increased sales.
Construction Industries’ profit was $3.329 billion for the nine months ended September 30, 2018, compared with $2.418 billion for the nine months ended September 30, 2017. The increase in profit was a result of higher sales volume, partially offset by higher material and freight costs, and increased SG&A/R&D expenses, partially due to spending for strategic growth initiatives.
Construction Industries’ profit as a percent of total sales was 19.0 percent for the nine months ended September 30, 2018, compared with 17.3 percent for the nine months ended September 30, 2017.
Resource Industries
Resource Industries’ total sales were $7.473 billion in the nine months ended September 30, 2018, an increase of $1.920 billion from the nine months ended September 30, 2017. The increase was primarily due to higher demand for both mining and heavy construction equipment, including aftermarket parts. Commodity market fundamentals remained positive contributing to higher mining equipment sales. In addition, increased sales to heavy construction and quarry and aggregate customers were driven by positive global economic growth. Resource Industries’ customers globally continue to focus on improving productivity and efficiency of existing machine assets, thereby extending equipment life cycle and lowering operating costs. Rebuild, overhaul and maintenance activity remains strong, resulting in higher aftermarket parts sales. Favorable price realization also contributed to the sales improvement.
Resource Industries’ profit was $1.203 billion for the nine months ended September 30, 2018, compared with $488 million for the nine months ended September 30, 2017. The improvement was mostly due to higher sales volume and favorable price realization, partially offset by increased SG&A/R&D expenses, unfavorable currency impacts, and higher manufacturing costs. SG&A/R&D expenses increased primarily due to investments aligned with strategic growth initiatives. Manufacturing costs were unfavorable as lower warranty expense was more than offset by higher freight and material costs.
Resource Industries’ profit as a percent of total sales was 16.1 percent for the nine months ended September 30, 2018, compared with 8.8 percent for the nine months ended September 30, 2017.
Energy & Transportation
|
| | | | | | | | | | | | | | | |
| Sales by Application | | | | | | | | |
| (Millions of dollars) | | Nine Months Ended September 30, 2018 | | Nine Months Ended September 30, 2017 | | $ Change | | % Change |
| Oil and Gas | | $ | 4,044 |
| | $ | 2,927 |
| | $ | 1,117 |
| | 38 | % |
| Power Generation | | 3,063 |
| | 2,491 |
| | 572 |
| | 23 | % |
| Industrial | | 2,738 |
| | 2,546 |
| | 192 |
| | 8 | % |
| Transportation | | 3,722 |
| | 3,294 |
| | 428 |
| | 13 | % |
| External Sales | | 13,567 |
| | 11,258 |
| | 2,309 |
| | 21 | % |
| Inter-Segment | | 2,931 |
| | 2,484 |
| | 447 |
| | 18 | % |
| Total Sales | | $ | 16,498 |
| | $ | 13,742 |
| | $ | 2,756 |
| | 20 | % |
| | | | | | | | | |
| | | | | | | | | |
Energy & Transportation’s total sales were $16.498 billion in the nine months ended September 30, 2018, compared with $13.742 billion in the nine months ended September 30, 2017. The increase was primarily due to higher sales volume across all applications. Favorable currency impacts, mostly from a stronger euro, and favorable price realization also contributed to the increase in sales.
Oil and Gas - Sales increased due to higher demand in North America for gas compression and well servicing applications. Higher energy prices and growth in U.S. onshore oil and gas drove increased sales for reciprocating engines and related aftermarket parts.
Power Generation - Sales improved across all regions, with the largest increases in EAME from turbines and turbine-related services, reciprocating engine projects and favorable currency. In addition, sales increased in North America and Asia/Pacific primarily for reciprocating engine applications, including data centers and power plants, and for aftermarket parts.
Industrial - Sales were higher in North America and Asia/Pacific, primarily due to improving economic conditions supporting higher engine sales into industrial applications. Sales in EAME were about flat as economic uncertainty in a few countries in the Middle East were mostly offset by favorable currency impacts.
Transportation - Sales were higher for rail services driven by acquisitions in Asia/Pacific and EAME and increased rail traffic in North America. Marine sales were higher in Asia/Pacific, led by increased activity in the ferry sector.
Energy & Transportation’s profit was $2.859 billion for the nine months ended September 30, 2018, compared with $1.982 billion for the nine months ended September 30, 2017. The improvement was due to higher sales volume and favorable price realization. This was partially offset due to increased spending for strategic growth initiatives and higher freight costs.
Energy & Transportation’s profit as a percent of total sales was 17.3 percent for the nine months ended September 30, 2018, compared with 14.4 percent for the nine months ended September 30, 2017.
Financial Products Segment
Financial Products’ segment revenues were $2.467 billion for the nine months ended September 30, 2018, an increase of $157 million, or 7 percent, from the nine months ended September 30, 2017. The increase was primarily due to higher average financing rates and higher average earning assets in North America and Asia/Pacific. These favorable impacts were partially offset by lower intercompany lending activity in North America.
America, lower average earning assets in Latin America and lower average financing rates in Europe.
Financial Products’ segment profit was $141$476 million infor the first quarter ofnine months ended September 30, 2018, compared with $183$559 million infor the first quarter ofnine months ended September 30, 2017. The decrease was primarily due to an increase in the provision for credit losses at Cat Financial, lower intercompany lending activity and an unfavorable impact from available for sale securities in Insurance Services. These unfavorable impacts were partially offset by an increase in net yield on average earning assets.
At the end of the first quarter of 2018, past dues at Cat Financial were 3.17 percent, compared with 2.64 percent at the end of the first quarter of 2017, primarily due to increases in the Caterpillar Power Financeassets, higher average earning assets and Latin America portfolios. Write-offs, net of recoveries, in the first quarter of 2018 were $30 million, compared with $15 million in the first quarter of 2017. The largest contributors to the increase were the Latin America and Caterpillar Power Finance portfolios.
As of March 31, 2018, Cat Financial’s allowance for credit losses totaled $403 million,a favorable impact from returned or 1.45 percent of finance receivables, compared with $346 million, or 1.28 percent of finance receivables at March 31, 2017. The allowance for credit losses at year-end 2017 was $365 million, or 1.33 percent of finance receivables. The increase in the allowance for credit losses was primarily driven by the Caterpillar Power Finance and mining portfolios.repossessed equipment.
Corporate Items and Eliminations
Expense for corporate items and eliminations was $373 million$1.245 billion in the first quarter ofnine months ended September 30, 2018, a decrease of $684$865 million from the first quarter ofnine months ended September 30, 2017. Corporate items and eliminations include: restructuring costs; corporate-level expenses; timing differences, as some expenses are reported in segment profit on a cash basis; currency differences for ME&T, as segment profit is reported using annual fixed exchange rates; cost of sales methodology differences, as segments use a current cost methodology; and inter-segment eliminations.
The decrease in expense was primarilymostly due to lower restructuring costs whichand methodology differences. Restructuring costs were $69$293 million infor the first quarter ofnine months ended September 30, 2018. In the first quarternine months of 2017, restructuring costs impacting operating profit of $723$982 million were primarily related to the announced closure of the facility in Gosselies, Belgium.
RESTRUCTURING COSTS
Restructuring costs for the three and nine months ended March 31,September 30, 2018 and 2017 were as follows:
| | | | | | | | | | | | |
| (Millions of dollars) | | Three Months Ended March 31 | | | Three Months Ended September 30 |
| | | 2018 | | 2017 | | | 2018 | | 2017 |
Employee separations 1 | | $ | 33 |
| | $ | 464 |
| | | $ | 44 |
| | $ | 8 |
|
Contract terminations 1 | | — |
| | 9 |
| | | — |
| | 6 |
|
Long-lived asset impairments 1 | | — |
| | 212 |
| | | 18 |
| | 31 |
|
Defined benefit plan curtailments and termination benefits 2 | | — |
| | 29 |
| | |
Other 3 | | 36 |
| | 38 |
| | |
Other 2 | | | 48 |
| | 45 |
|
| Total restructuring costs | | | $ | 110 |
| | $ | 90 |
|
| | | | | | |
| | | | | | |
| | | | Nine Months Ended September 30 |
| | | | 2018 | | 2017 |
Employee separations 1 | | | $ | 121 |
| | $ | 514 |
|
Contract terminations 1 | | | — |
| | 32 |
|
Long-lived asset impairments 1 | | | 49 |
| | 306 |
|
Defined benefit plan curtailments and termination benefits 3 | | | — |
| | 29 |
|
Other 2 | | | 123 |
| | 130 |
|
| Total restructuring costs | | $ | 69 |
| | $ | 752 |
| | | $ | 293 |
| | $ | 1,011 |
|
| | | | | | | | | | |
1 Recognized in Other operating (income) expenses. | 1 Recognized in Other operating (income) expenses. | | 1 Recognized in Other operating (income) expenses. |
2 Recognized in Other income (expense). | | |
3 Represents costs related to our restructuring programs, primarily for accelerated depreciation, project management costs and equipment | | |
| relocation (all of which are primarily included in Cost of Goods sold.) | |
2 Represents costs related to our restructuring programs, primarily for accelerated depreciation, project management costs, equipment relocation, inventory write-downs and LIFO inventory decrement benefits from inventory liquidations at closed facilities, all of which are primarily included in Cost of goods sold. | | 2 Represents costs related to our restructuring programs, primarily for accelerated depreciation, project management costs, equipment relocation, inventory write-downs and LIFO inventory decrement benefits from inventory liquidations at closed facilities, all of which are primarily included in Cost of goods sold. |
3 Recognized in Other income (expense). | | 3 Recognized in Other income (expense). |
| | | | | | | | | | |
For the threenine months ended March 31,September 30, 2018, the restructuring costs were primarily related to ongoing facility closures across the company.
The restructuringRestructuring costs of $649 million for the threenine months ended March 31,September 30, 2017, were primarily related to the closure of the facility in Gosselies, Belgium, within Construction Industries. The remaining costs for the first nine months of 2017 were primarily related to our decision to move production from the Aurora, Illinois, facility into other U.S. manufacturing facilities, as well as other ongoing manufacturing facility consolidations.restructuring actions in Resource Industries.
Restructuring costs are a reconciling item between Segment profit and Consolidated profit before taxes.
The following table summarizes the 2017 and 2018 employee separation activity:
| | | | | | | |
| (Millions of dollars) | | | | |
| Liability balance at December 31, 2016 | Liability balance at December 31, 2016 | $ | 147 |
| Liability balance at December 31, 2016 | $ | 147 |
|
| Increase in liability (separation charges) | Increase in liability (separation charges) | 525 |
| Increase in liability (separation charges) | 525 |
|
| Reduction in liability (payments) | Reduction in liability (payments) | (423 | ) | Reduction in liability (payments) | (423 | ) |
| Liability balance at December 31, 2017 | Liability balance at December 31, 2017 | $ | 249 |
| Liability balance at December 31, 2017 | $ | 249 |
|
| Increase in liability (separation charges) | Increase in liability (separation charges) | 33 |
| Increase in liability (separation charges) | 121 |
|
| Reduction in liability (payments) | Reduction in liability (payments) | (90 | ) | Reduction in liability (payments) | (233 | ) |
| Liability balance at March 31, 2018 | $ | 192 |
| |
| Liability balance at September 30, 2018 | | Liability balance at September 30, 2018 | $ | 137 |
|
| | | | | |
Most of the liability balance at March 31,September 30, 2018 is expected to be paid in 2018 and primarily includes2019. About one-third of this balance is for employee separation payments related to closure of the Gosselies, Belgium, facility.
In March 2017, Caterpillar informed Belgian authorities of the decision to proceed to a collective dismissal, which will leadled to the closure of the Gosselies site, impacting about 2,000 employees. Production of Caterpillar products at the Gosselies site ended during the second quarter of 2017. The other operations and functions at the Gosselies site are expected to be graduallywere phased out by the end of the second quarter of 2018. We estimate restructuring costs incurred under this program to be about $675 million. In the first threenine months of 2018, we incurred $10$11 million of restructuring costs, and we incurred $653 million in 2017 for a total of $663$664 million through March 31,September 30, 2018. We expect to recognize the remaining costs in 2018.
In September 2015, we announced a large scale restructuring plan (the Plan) including a voluntary retirement enhancement program for qualifying U.S. employees, several voluntary separation programs outside of the U.S., additional involuntary programs throughout the company and manufacturing facility consolidations and closures expected to occur through 2018. The largest action among those included in the Plan was related to our European manufacturing footprint, which led to the Gosselies, Belgium, facility closure as discussed above. In the first threenine months of 2018, we incurred $38$109 million of restructuring costs related to the
Plan, and we have incurred $817$1,776 million $281 million and $569 million in 2017, 2016 and 2015, respectively, for a total of $1,705 millionrelated to the Plan through March 31,September 30, 2018. We expect to recognize approximately $150$50 million of additional restructuring costs related to the Plan in 2018.
We expect 2018 restructuring costs will be about $400 million, unchanged from the previous estimate. We expect that restructuring actions will result in a benefit to operating costs, primarily SG&A expenses and Cost of goods sold and SG&A expenses of about $150$180 million in 2018 compared with 2017. Although we expect restructuring activities to continue in 2019, restructuring costs should decline compared to 2018.
GLOSSARY OF TERMS
| |
| 1. | Adjusted Operating Profit Margin - Operating profit excluding restructuring costs as a percent of sales and revenues. |
| |
| 2. | Adjusted Profit Per Share - Profit per share excluding restructuring costs for 2018 and 2017. For 2018, adjusted profit per share also excludes a net tax benefit to adjust deferred tax balances. For 2017, adjusted profit per share also excludes a gain on the sale of an equity investment in IronPlanet recognized in the second quarter. |
| |
2.3. | All Other Segments - Primarily includes activities such as: business strategy, product management and development, manufacturing of filters and fluids, undercarriage, ground engaging tools, fluid transfer products, precision seals, rubber sealing and connecting components primarily for Cat® products; parts distribution; integrated logistics solutions, distribution services responsible for dealer development and administration including a wholly owned dealer in Japan, dealer portfolio management and ensuring the most efficient and effective distribution of machines, engines and parts; digital investments for new customer and dealer solutions that integrate data analytics with state-of-the-art digital technologies while transforming the buying experience. |
| |
3.4. | Consolidating Adjustments - Elimination of transactions between Machinery, Energy & Transportation and Financial Products. |
| |
4.5. | Construction Industries - A segment primarily responsible for supporting customers using machinery in infrastructure, forestry and building construction applications. Responsibilities include business strategy, product design, product management and development, manufacturing, marketing and sales and product support. The product portfolio includes asphalt pavers, backhoe loaders, compactors, cold planers, compact track and multi-terrain loaders, mini, small, medium and large track excavators, forestry excavators, feller bunchers, harvesters, knuckleboom loaders, motor graders, pipelayers, road reclaimers, site prep tractors, skidders, skid steer loaders, telehandlers, small and medium track-type tractors, track-type loaders, utility vehicles, wheel excavators, compact, small and medium wheel loaders and related parts and work tools. |
| |
5.6. | Corporate Items and Eliminations - Includes restructuring costs; corporate-level expenses; timing differences, as some expenses are reported in segment profit on a cash basis; methodology differences between segment and consolidated external reporting; and inter-segment eliminations. |
| |
| 7. | Currency- With respect to sales and revenues, currency represents the translation impact on sales resulting from changes in foreign currency exchange rates versus the U.S. dollar. With respect to operating profit, currency represents the net translation impact on sales and operating costs resulting from changes in foreign currency exchange rates versus the U.S. dollar. Currency only includes the impact on sales and operating profit for the Machinery, Energy & Transportation lines of business excluding restructuring costs; currency impacts on Financial Products’ revenues and operating profit are included in the Financial Products’ portions of the respective analyses. With respect to other income/expense, currency represents the effects of forward and option contracts entered into by the company to reduce the risk of fluctuations in exchange rates (hedging) and the net effect of changes in foreign currency exchange rates on our foreign currency assets and liabilities for consolidated results (translation). |
| |
6.8. | EAME - A geographic region including Europe, Africa, the Middle East and the Commonwealth of Independent States (CIS). |
| |
7.9. | Earning Assets - Assets consisting primarily of total finance receivables net of unearned income, plus equipment on operating leases, less accumulated depreciation at Cat Financial. |
| |
8.10. | Energy & Transportation - A segment primarily responsible for supporting customers using reciprocating engines, turbines, diesel-electric locomotives and related parts across industries serving Oil and Gas, Power Generation, Industrial and Transportation applications, including marine and rail-related businesses. Responsibilities include business strategy, product design, product management and development, manufacturing, marketing and sales and product support of turbine machinery and integrated systems and solutions and turbine-related services, reciprocating engine-powered generator sets, integrated systems used in the electric power generation industry, reciprocating engines and integrated systems and solutions for the marine and oil and gas industries; reciprocating engines supplied to the industrial industry as well as Cat machinery; the remanufacturing of Cat engines and components and remanufacturing services for other companies; the business strategy, product design, product management and development, manufacturing, remanufacturing, leasing and service of diesel-electric locomotives and components and other rail-related products and services and product support of on-highway vocational trucks for North America. |
| |
9.11. | Financial Products Segment - Provides financing alternatives to customers and dealers around the world for Caterpillar products, as well as financing for vehicles, power generation facilities and marine vessels that, in most cases, incorporate Caterpillar products. Financing plans include operating and finance leases, installment sale contracts, working capital loans and wholesale financing plans. The segment also provides insurance and risk management products and services that help customers and dealers manage their business risk. Insurance and risk management products offered include physical damage insurance, inventory protection plans, extended service coverage for machines and engines, and dealer property and casualty insurance. The various forms of financing, insurance and risk management products offered to customers and dealers help support the purchase and lease of our equipment. The segment also earns revenues from Machinery, Energy & Transportation, but the related costs are not allocated to operating segments. Financial Products segment profit is determined on a pretax basis and includes other income/expense items. |
insurance, inventory protection plans, extended service coverage for machines and engines, and dealer property and casualty insurance. The various forms of financing, insurance and risk management products offered to customers and dealers help support the purchase and lease of our equipment. The segment also earns revenues from Machinery, Energy & Transportation but the related costs are not allocated to operating segments. Financial Products segment profit is determined on a pretax basis and includes other income/expense items.
| |
10.12. | Latin America - A geographic region including Central and South American countries and Mexico. |
| |
11.13. | Machinery, Energy & Transportation (ME&T) - Represents the aggregate total of Construction Industries, Resource Industries, Energy & Transportation, All Other Segments and related corporate items and eliminations. |
| |
12.14. | Machinery, Energy & Transportation Other Operating (Income) Expenses - Comprised primarily of gains/losses on disposal of long-lived assets, gains/losses on divestitures and legal settlements and accruals. Restructuring costs classified as other operating expenses on the Results of Operations are presented separately on the Operating Profit Comparison. |
| |
13.15. | Manufacturing Costs - Manufacturing costs exclude the impacts of currency and restructuring costs (see definition below) and represent the volume-adjusted change for variable costs and the absolute dollar change for period manufacturing costs. Variable manufacturing costs are defined as having a direct relationship with the volume of production. This includes material costs, direct labor and other costs that vary directly with production volume such as freight, power to operate machines and supplies that are consumed in the manufacturing process. Period manufacturing costs support production but are defined as generally not having a direct relationship to short-term changes in volume. Examples include machinery and equipment repair, depreciation on manufacturing assets, facility support, procurement, factory scheduling, manufacturing planning and operations management. |
| |
14.16. | Pension and Other Postemployment Benefit (OPEB) - The company’s defined-benefit pension and postretirement benefit plans. |
| |
15.17. | Price Realization - The impact of net price changes excluding currency and new product introductions. Price realization includes geographic mix of sales, which is the impact of changes in the relative weighting of sales prices between geographic regions. |
| |
16.18. | Resource Industries - A segment primarily responsible for supporting customers using machinery in mining, quarry and aggregates, waste and material handling applications. Responsibilities include business strategy, product design, product management and development, manufacturing, marketing and sales and product support. The product portfolio includes large track-type tractors, large mining trucks, hard rock vehicles, longwall miners, electric rope shovels, draglines, hydraulic shovels, rotary drills, large wheel loaders, off-highway trucks, articulated trucks, wheel tractor scrapers, wheel dozers, landfill compactors, soil compactors, hard rock continuous mining systems, select work tools, machinery components, electronics and control systems and related parts. In addition to equipment, Resource Industries also develops and sells technology products and services to provide customers fleet management, equipment management analytics and autonomous machine capabilities. Resource Industries also manages areas that provide services to other parts of the company, including integrated manufacturing and research and development. |
| |
17.19. | Restructuring Costs - Primarily costs for employee separation, long-lived asset impairments and contract terminations. These costs are included in Other operating (income) expenses except for defined-benefit plan curtailment losses and special termination benefits, which are included in Other income (expense). Restructuring costs also include other exit-related costs primarily for accelerated depreciation, inventory write-downs, equipment relocation and project management costs and LIFO inventory decrement benefits from inventory liquidations at closed facilities, all of which are primarily included in Cost of goods sold. |
| |
18.20. | Sales Volume - With respect to sales and revenues, sales volume represents the impact of changes in the quantities sold for Machinery, Energy & Transportation as well as the incremental sales impact of new product introductions, including emissions-related product updates. With respect to operating profit, sales volume represents the impact of changes in the quantities sold for Machinery, Energy & Transportation combined with product mix as well as the net operating profit impact of new product introductions, including emissions-related product updates. Product mix represents the net operating profit impact of changes in the relative weighting of Machinery, Energy & Transportation sales with respect to total sales. The impact of sales volume on segment profit includes inter-segment sales. |
LIQUIDITY AND CAPITAL RESOURCES
Sources of funds
We generate significant capital resources from operating activities, which are the primary source of funding for our ME&T operations. Funding for these businesses is also available from commercial paper and long-term debt issuances. Financial Products' operations are funded primarily from commercial paper, term debt issuances and collections from its existing portfolio. During the first quarternine months of 2018, we experienced favorable liquidity conditions globally in both our ME&T and Financial Products' operations. On a consolidated basis, we ended the first quarternine months of 2018 with $7.89$8.01 billion of cash, a decrease of $373$254 million from year-end 2017. We intend to maintain a strong cash and liquidity position.
Our cash balances are held in numerous locations throughout the world with approximately $6.9$7.1 billion held by our non-U.S. subsidiaries. As a result of U.S. tax reform legislation enacted in December 2017, we expect to be able to use cash held by non-U.S. subsidiaries in the United States in the future with minimal U.S. tax consequences.
Consolidated operating cash flow for the first quarternine months of 2018 was $935 million,$4.48 billion, down from $1.54$5.17 billion for the same period last year. The decrease was primarily due to higher short-term incentive compensation payments and higher working capital requirements to support increasing production volumes, partiallyhigher short-term incentive compensation payments and a $1.0 billion discretionary pension contribution made to our U.S. pension plans in the third quarter of 2018, mostly offset by higher profit, in the first quarter of 2018, compared with the first quarter of 2017.profit. See further discussion of operating cash flow under ME&T and Financial Products.
Total debt as of March 31,September 30, 2018 was $35.31$35.77 billion, an increase of $437$895 million from year-end 2017. Debt related to Financial Products increased $378$771 million, reflecting increasing portfolio balances. Debt related to ME&T increased $59$124 million in the first quarternine months of 2018. In the first quarternine months of 2018, we repurchased $500 million$2.0 billion of Caterpillar common stock.
We have three global credit facilities with a syndicate of banks totaling $10.50 billion (Credit Facility) available in the aggregate to both Caterpillar and Cat Financial for general liquidity purposes. Based on management's allocation decision, which can be revised from time to time, the portion of the Credit Facility available to ME&T as of March 31,September 30, 2018 was $2.75 billion. Information on our Credit Facility is as follows:
In September 2018, we entered into a new 364-day facility. The 364-day facility of $3.15 billion (of which $0.82 billion is available to ME&T) expires in September 2018.2019.
In September 2018, we amended and extended the three-year facility. The three-year facility of $2.73 billion (of which $0.72 billion is available to ME&T) now expires in September 2020.2021.
In September 2018, we amended and extended the five-year facility. The five-year facility of $4.62 billion (of which $1.21 billion is available to ME&T) now expires in September 2022.2023.
At March 31,September 30, 2018, Caterpillar's consolidated net worth was $15.24$15.87 billion, which was above the $9.00 billion required under the Credit Facility. The consolidated net worth is defined as the consolidated shareholders' equity including preferred stock but excluding the pension and other postretirement benefits balance within Accumulated other comprehensive income (loss).
At March 31,September 30, 2018, Cat Financial's covenant interest coverage ratio was 1.801.70 to 1. This is above the 1.15 to 1 minimum ratio calculated as (1) profit excluding income taxes, interest expense and net gain/(loss) from interest rate derivatives to (2) interest expense calculated at the end of each calendar quarter for the rolling four quarter period then most recently ended, required by the Credit Facility.
In addition, at March 31,September 30, 2018, Cat Financial's covenant leverage ratio was 7.657.56 to 1. This is below the maximum ratio of debt to net worth of 10 to 1, calculated (1) on a monthly basis as the average of the leverage ratios determined on the last day of each of the six preceding calendar months and (2) at each December 31, required by the Credit Facility.
In the event Caterpillar or Cat Financial does not meet one or more of their respective financial covenants under the Credit Facility in the future (and are unable to obtain a consent or waiver), the syndicate of banks may terminate the commitments allocated to the party that does not meet its covenants. Additionally, in such event, certain of Cat Financial's other lenders under other loan agreements where similar financial covenants or cross default provisions are applicable, may, at their election, choose to pursue remedies under those loan agreements, including accelerating the repayment of outstanding borrowings. At March 31,September 30, 2018, there were no borrowings under the Credit Facility.
Our total credit commitments and available credit as of March 31,September 30, 2018 were:
| | | | March 31, 2018 | September 30, 2018 |
| (Millions of dollars) | Consolidated | | Machinery, Energy & Transportation | | Financial Products | Consolidated | | Machinery, Energy & Transportation | | Financial Products |
| Credit lines available: | |
| | |
| | |
| |
| | |
| | |
|
| Global credit facilities | $ | 10,500 |
| | $ | 2,750 |
| | $ | 7,750 |
| $ | 10,500 |
| | $ | 2,750 |
| | $ | 7,750 |
|
| Other external | 4,895 |
| | 7 |
| | 4,888 |
| 4,523 |
| | 59 |
| | 4,464 |
|
| Total credit lines available | 15,395 |
| | 2,757 |
| | 12,638 |
| 15,023 |
| | 2,809 |
| | 12,214 |
|
| Less: Commercial paper outstanding | (4,681 | ) | | — |
| | (4,681 | ) | (3,636 | ) | | — |
| | (3,636 | ) |
| Less: Utilized credit | (1,366 | ) | | (7 | ) | | (1,359 | ) | (1,101 | ) | | (59 | ) | | (1,042 | ) |
| Available credit | $ | 9,348 |
| | $ | 2,750 |
| | $ | 6,598 |
| $ | 10,286 |
| | $ | 2,750 |
| | $ | 7,536 |
|
| | | | | |
The other external consolidated credit lines with banks as of March 31,September 30, 2018 totaled $4.90$4.52 billion. These committed and uncommitted credit lines, which may be eligible for renewal at various future dates or have no specified expiration date, are used primarily by our subsidiaries for local funding requirements. Caterpillar or Cat Financial may guarantee subsidiary borrowings under these lines.
We receive debt ratings from the major credit rating agencies. In December 2016, Moody's Investors Service downgraded our long-term ratings to A3 from A2, and short-term ratings to Prime-2 from Prime-1. The Moody's downgrade did not have a material impact on our borrowing costs or our overall financial health. A further downgrade of our credit ratings by Moody's or one of the other major credit rating agencies would result in increased borrowing costs and could make access to certain credit markets more difficult. However, our long-term ratings with Fitch and S&P continue to be "mid-A". In the event economic conditions deteriorate such that access to debt markets becomes unavailable, ME&T's operations would rely on cash flow from operations, use of existing cash balances, borrowings from Cat Financial and access to our Credit Facility. Our Financial Products' operations would rely on cash flow from its existing portfolio, existing cash balances, access to our Credit Facility and other credit line facilities of Cat Financial and potential borrowings from Caterpillar. In addition, we maintain a support agreement with Cat Financial, which requires Caterpillar to remain the sole owner of Cat Financial and may, under certain circumstances, require Caterpillar to make payments to Cat Financial should Cat Financial fail to maintain certain financial ratios.
Machinery, Energy & Transportation
Net cash provided by operating activities was $948 million$3.88 billion in the first quarternine months of 2018, compared with $1.52$4.16 billion for the same period in 2017. The decrease was primarily due to higher short-term incentive compensation payments and higher working capital requirements to support increasing production volumes, partiallyhigher short-term incentive compensation payments and a $1.0 billion discretionary pension contribution made to our U.S. pension plans in the third quarter of 2018, mostly offset by higher profit, in the first quarter of 2018, compared with the first quarter of 2017.profit. Within working capital, changes to inventories,accounts payable, customer advances and accounts payableinventories unfavorably impacted cash flow.
Net cash used for investing activities in the first quarternine months of 2018 was $484$836 million, compared with net cash used of $133$300 million in the first quarternine months of 2017. The change was primarily due to the acquisition of ECM S.p.A. and Downer Freight Rail in the first quarternine months of 2018.2018, as well as increased cash used for capital expenditures.
Net cash used for financing activities during the first quarternine months of 2018 was $816 million,$3.13 billion, compared with net cash providedused of $1.61 billion$361 million in the same period of 2017. In the first nine months of 2018, we repurchased $2.0 billion of Caterpillar common stock. The first quarternine months of 2017 included $1.5$1.0 billion in borrowings from Financial Products, and proceeds of $360 million related to a sale-leaseback transaction in Japan. In the first quarterJapan and a long-term debt maturity of 2018, we repurchased $500 million of Caterpillar common stock.million.
While our short-term priorities for the use of cash may vary from time to time as business needs and conditions dictate, our long-term cash deployment strategy is focused on the following priorities. Our top priority is to maintain a strong financial position in support of a Mid-A rating. Next, we intend to fund operational requirements and commitments. Then, we intend to fund priorities
that profitably grow the company and return capital to shareholders through dividend growth and share repurchases. Additional information on cash deployment is as follows:
Strong financial position – Our top priority is to maintain a strong financial position in support of a Mid-A rating. We historically tracked a period ending debt-to-capital ratio and a target range as a key measure of ME&T’s financial strength. We have transitioned to tracking a diverse group of financial metrics that focus on liquidity, leverage, cash flow and margins to better align with the various methodologies used by the major credit rating agencies and our cash deployment actions.
Operational excellence and commitments – Capital expenditures were $323$845 million during the first quarternine months of 2018, compared to $209$574 million for the same period in 2017. We expect ME&T's capital expenditures in 2018 to be about the same asbetween $1.0 and $1.5 billion, up from $916 million in 2017. We made $152$1.29 billion of contributions to our pension and other postretirement benefit plans during the first nine months of 2018, including a $1.0 billion discretionary contribution made to our U.S. pension plans in September 2018. We currently anticipate full-year 2018 contributions of approximately $1.36 billion. We made $522 million of contributions to our pension and other postretirement benefit plans during the quarter ended March 31, 2018. We currently anticipate full-year 2018 contributionsfirst nine months of approximately $365 million. We made $106 million of contributions to our pension and other postretirement benefit plans during the quarter ended March 31, 2017.
Fund strategic growth initiatives and return capital to shareholders – We intend to fund initiatives that drive long-term profitable growth that will be focused in the areas of expanded offerings and services, including acquisitions. In the first quarternine months of 2018, we acquired ECM S.p.A. and Downer Freight Rail. Each quarter, our Board of Directors reviews the company's dividend for the applicable quarter. The Board evaluates the financial condition of the company and considers the economic outlook, corporate cash flow, the company's liquidity needs, and the health and stability of global credit markets to determine whether to maintain or change the quarterly dividend. Dividends totaled $467 million$1.44 billion in the first quarternine months of 2018, representing 78 cents per share paid in the first and second quarters, and 86 cents per share paid in the third quarter. In January 2014, the Board of Directors approved an authorization to repurchase up to $10 billion of Caterpillar common stock (the 2014 Authorization), which will expire on December 31, 2018. As of January 1, 2018, $5.47 billion remained available under the 2014 Authorization, and in the first quarternine months of 2018, we repurchased $500 million$2.0 billion of Caterpillar common stock, leaving $4.97$3.47 billion in the 2014 Authorization.Authorization as of September 30, 2018. In July 2018, the Board of Directors approved a new share repurchase authorization of up to $10 billion of Caterpillar common stock effective January 1, 2019, with no expiration. We currently expect to continuerepurchase more than $750 million of common stock during the fourth quarter, bringing total repurchases to repurchase common stockmore than $2.75 billion in 2018. Our share repurchase plans are always subject to the company’s cash deployment priorities and will continue to beare evaluated on an ongoing basis,basis; however, we plan to more consistently repurchase common stock with the intent to, at a minimum, offset the impact of dilution over time. The timing and amount of future repurchases may vary depending on market conditions and investing priorities. Caterpillar's basic shares outstanding as of March 31,September 30, 2018 were approximately 598590 million.
Financial Products
Financial Products operating cash flow was $311 million$1.08 billion in the first quarternine months of 2018, compared with $376 million$1.03 billion for the same period a year ago. Net cash used for investing activities was $533 million$2.00 billion for the first quarternine months of 2018, compared with $1.77 billion$992 million for the same period in 2017. The change was primarily due to the impact of portfolio related activity, partially offset by the impact of lending with ME&T. Net cash provided by financing activities was $171$846 million for the first quarternine months of 2018, compared with $723 millioncash used for financing activities of $1.12 billion for the same period in 2017. The change was primarily due to the impact of net borrowings.
CRITICAL ACCOUNTING POLICIES
For a discussion of the Company'scompany's critical accounting policies, see Part II, Item 7. Management’s Discussion and Analysis of Financial Condition and Results of Operations in our 2017 Annual Report on Form 10-K. There have been no significant changes to our Criticalcritical accounting policies since our 2017 Annual Report on Form 10-K.
OTHER MATTERS
Environmental and Legal Matters
The Company is regulated by federal, state and international environmental laws governing ourits use, transport and disposal of substances and control of emissions. In addition to governing our manufacturing and other operations, these laws often impact the development of our products, including, but not limited to, required compliance with air emissions standards applicable to internal combustion engines. We have made, and will continue to make, significant research and development and capital expenditures to comply with these emissions standards.
We are engaged in remedial activities at a number of locations, often with other companies, pursuant to federal and state laws. When it is probable we will pay remedial costs at a site, and those costs can be reasonably estimated, the investigation, remediation, and operating and maintenance costs are accrued against our earnings. Costs are accrued based on consideration of currently available data and information with respect to each individual site, including available technologies, current applicable laws and regulations, and prior remediation experience. Where no amount within a range of estimates is more likely, we accrue the minimum. Where multiple potentially responsible parties are involved, we consider our proportionate share of the probable costs. In formulating the estimate of probable costs, we do not consider amounts expected to be recovered from insurance companies or others. We reassess these accrued amounts on a quarterly basis. The amount recorded for environmental remediation is not material and is included in Accrued expenses. We believe there is no more than a remote chance that a material amount for remedial activities at any individual site, or at all the sites in the aggregate, will be required.
On January 7, 2015, the Company received a grand jury subpoena from the U.S. District Court for the Central District of Illinois. The subpoena requests documents and information from the Company relating to, among other things, financial information concerning U.S. and non-U.S. Caterpillar subsidiaries (including undistributed profits of non-U.S. subsidiaries and the movement
of cash among U.S. and non-U.S. subsidiaries). The Company has received additional subpoenas relating to this investigation requesting additional documents and information relating to, among other things, the purchase and resale of replacement parts by Caterpillar Inc. and non-U.S. Caterpillar subsidiaries, dividend distributions of certain non-U.S. Caterpillar subsidiaries, and Caterpillar SARL and related structures. On March 2-3, 2017, agents with the Department of Commerce, the Federal Deposit Insurance Corporation and the Internal Revenue Service executed search and seizure warrants at three facilities of the Company in the Peoria, Illinois area, including its former corporate headquarters. The warrants identify, and agents seized, documents and information related to, among other things, the export of products from the United States, the movement of products between the United States and Switzerland, the relationship between Caterpillar Inc. and Caterpillar SARL, and sales outside the United States. It is the Company’s understanding that the warrants, which concern both tax and export activities, are related to the ongoing grand jury investigation. The Company is continuing to cooperate with this investigation. The Company is unable to predict the outcome or reasonably estimate any potential loss; however, we currently believe that this matter will not have a material adverse effect on the Company’s consolidated results of operations, financial position or liquidity.
On March 20, 2014, Brazil’s Administrative Council for Economic Defense (CADE) published a Technical Opinion which named 18 companies and over 100 individuals as defendants, including two subsidiaries of Caterpillar Inc., MGE - Equipamentos e Serviços Ferroviários Ltda. (MGE) and Caterpillar Brasil Ltda. The publication of the Technical Opinion opened CADE's official administrative investigation into allegations that the defendants participated in anticompetitive bid activity for the construction and maintenance of metro and train networks in Brazil. While companies cannot be held criminally liable for anticompetitive conduct in Brazil, criminal charges have been brought against two current employees of MGE and one former employee of MGE involving the same conduct alleged by CADE. The Company has responded to all requests for information from the authorities. The Company is unable to predict the outcome or reasonably estimate the potential loss; however, we currently believe that this matter will not have a material adverse effect on the Company's consolidated results of operations, financial position or liquidity.
In addition, we are involved in other unresolved legal actions that arise in the normal course of business. The most prevalent of these unresolved actions involve disputes related to product design, manufacture and performance liability (including claimed asbestos and welding fumes exposure), contracts, employment issues, environmental matters, intellectual property rights, taxes (other than income taxes) and securities laws. The aggregate range of reasonably possible losses in excess of accrued liabilities, if any, associated with these unresolved legal actions is not material. In some cases, we cannot reasonably estimate a range of loss because there is insufficient information regarding the matter. However, we believe there is no more than a remote chance that any liability arising from these matters would be material. Although it is not possible to predict with certainty the outcome of these unresolved legal actions, we believe that these actions will not individually or in the aggregate have a material adverse effect on our consolidated results of operations, financial position or liquidity.
Retirement Benefits
We recognize mark-to-market gains and losses immediately through earnings upon the remeasurement of our pension and OPEB plans. Mark-to-market gains and losses represent the effects of actual results differing from our assumptions and the effects of changing assumptions. We will record a mark-to-market adjustment as of the measurement date, December 31, 2018. Based on market conditions as of September 30, 2018, we would recognize an increase to the funded status of our plans of approximately $500 million. This would result in a decrease in our Liability for postemployment benefits and the recognition of a net mark-to-market gain in earnings of approximately $500 million pre-tax, $375 million net of tax or $0.63 per share. The gain would be primarily due to higher discount rates at September 30, 2018 (approximately 4.2 percent for our U.S. pension plans) as compared to the discount rates used at December 31, 2017 (approximately 3.5 percent for our U.S. pension plans), partially offset by losses resulting from lower than expected returns on plan assets. It is difficult to predict the December 31, 2018 adjustment amount, as it is dependent on several factors including the discount rate, actual returns on plan assets and other actuarial assumptions.
Order Backlog
At the end of the firstthird quarter of 2018, the dollar amount of backlog believed to be firm was approximately $17.5$17.3 billion, an increaseabout $400 million lower than the second quarter of 2018, with decreases across the three primary segments. Compared with the third quarter of 2017, the order backlog increased about $1.7$1.9 billion, fromwith increases across the end of 2017. The increase was in Energy & Transportation and Construction Industries, while Resource Industries was about flat.three primary segments. Of the total backlog at March 31,September 30, 2018, approximately $3.2$3.4 billion was not expected to be filled in the following twelve months.
NON-GAAP FINANCIAL MEASURES
The following definitions are provided for the non-GAAP financial measures used in this report. These non-GAAP financial measures have no standardized meaning prescribed by U.S. GAAP and therefore are unlikely to be comparable to the calculation of similar measures for other companies. Management does not intend for these items to be considered in isolation or as a substitute for the related GAAP measures.
We incurred restructuring costs in 2017 and in the first quarter of 2018 and expect to incur additional restructuring costs during the remainder of 2018. We believe it is important to separately quantify the profit per share impact of restructuring costsseveral significant items in order for our results to be meaningful to readers as theseour readers. These items consist of (i) restructuring costs, which are incurred in the current year to generate longer-term benefits. Reconciliationlonger term benefits, (ii) a net tax benefit to adjust deferred tax balances and (iii) a gain on the sale of an equity investment. We do not consider these items indicative of earnings from ongoing business activities and believe the non-GAAP measures will provide investors with useful perspective on underlying business results and trends and aids with assessing our period-over-period results.
Reconciliations of adjusted operating profit margin to the most directly comparable GAAP measure, operating profit as a percent of sales and revenues are as follows:
|
| | | | | | | | | | | | |
| | | Three Months Ended September 30 | | Nine Months Ended September 30 |
| | | 2018 | | 2017 | | 2018 | | 2017 |
| Operating profit as a percent of total sales and revenues | | 15.8 | % | | 13.2 | % | | 15.9 | % | | 9.4 | % |
| Restructuring costs | | 0.8 | % | | 0.8 | % | | 0.7 | % | | 3.1 | % |
| Adjusted operating profit margin | | 16.6 | % | | 14.0 | % | | 16.6 | % | | 12.5 | % |
| | | | | | | | | |
Reconciliations of adjusted profit per share to the most directly comparable GAAP measure, profit per share - diluted are as follows:
| | | | | Three Months Ended March 31 | | Three Months Ended September 30 | | Nine Months Ended September 30 |
| | | 2018 | | 2017 | | 2018 | | 2017 | | 2018 | | 2017 |
| Profit per share - diluted | | $ | 2.74 |
| | $ | 0.32 |
| | $ | 2.88 |
| | $ | 1.77 |
| | $ | 8.45 |
| | $ | 3.44 |
|
Per share restructuring costs 1 | | 0.08 |
| | 0.96 |
| | 0.14 |
| | 0.18 |
| | 0.37 |
| | 1.37 |
|
Per share gain on sale of equity investment 2 | | | — |
| | — |
| | — |
| | (0.09 | ) |
| Per share deferred tax balance adjustment | | | $ | (0.16 | ) | | $ | — |
| | $ | (0.16 | ) | | $ | — |
|
| Adjusted profit per share | | $ | 2.82 |
| | $ | 1.28 |
| | $ | 2.86 |
| | $ | 1.95 |
| | $ | 8.66 |
| | $ | 4.72 |
|
1 At estimated annual tax rate based on full-year outlook for per share restructuring costs at statutory tax rates. 2018 at estimated annual tax rate of 24 percent. First-quarter 2017 at estimated annual tax rate of 22 percent plus a $15 million increase to prior year taxes related to non-U.S. restructuring costs. First-quarter 2017 also includes a favorable interim adjustment of $0.06 per share resulting from the difference in the estimated annual tax rate for consolidated reporting of 32 percent and the estimated annual tax rate for profit per share excluding restructuring costs and discrete items of 28 percent. | |
1 At estimated annual tax rate based on full-year outlook for per share restructuring costs at statutory tax rates. Three and nine months ended September 30, 2018 at estimated annual rate of 24 percent. Three and nine months ended September 30, 2017 at estimated annual rate of 20 percent. Nine months ended September 30, 2017 also includes $15 million increase to prior year taxes related to non-U.S. restructuring costs recognized in the first quarter of 2017. Third-quarter 2017 includes an unfavorable interim adjustment of $0.06 per share and nine months ended September 30, 2017 includes a favorable interim adjustment of $0.01 per share resulting from the difference in the estimated annual tax rate for consolidated reporting of 32 percent and the estimated annual tax rate for profit per share excluding restructuring costs, gain on sale of equity investment and discrete items of 29 percent. 2 At U.S. statutory tax rate of 35 percent. | | 1 At estimated annual tax rate based on full-year outlook for per share restructuring costs at statutory tax rates. Three and nine months ended September 30, 2018 at estimated annual rate of 24 percent. Three and nine months ended September 30, 2017 at estimated annual rate of 20 percent. Nine months ended September 30, 2017 also includes $15 million increase to prior year taxes related to non-U.S. restructuring costs recognized in the first quarter of 2017. Third-quarter 2017 includes an unfavorable interim adjustment of $0.06 per share and nine months ended September 30, 2017 includes a favorable interim adjustment of $0.01 per share resulting from the difference in the estimated annual tax rate for consolidated reporting of 32 percent and the estimated annual tax rate for profit per share excluding restructuring costs, gain on sale of equity investment and discrete items of 29 percent. 2 At U.S. statutory tax rate of 35 percent. |
| | | | | | | |
Supplemental Consolidating Data
We are providing supplemental consolidating data for the purpose of additional analysis. The data has been grouped as follows:
Consolidated – Caterpillar Inc. and its subsidiaries.
Machinery, Energy & Transportation – Caterpillar defines Machinery, Energy & Transportation as it is presented in the supplemental data as Caterpillar Inc. and its subsidiaries with Financial Products accounted for on the equity basis. Machinery, Energy & Transportation information relates to the design, manufacturing and marketing of our products. Financial Products' information relates to the financing to customers and dealers for the purchase and lease of Caterpillar and other equipment. The nature of these businesses is different, especially with regard to the financial position and cash flow items. Caterpillar management utilizes this presentation internally to highlight these differences. We also believe this presentation will assist readers in understanding our business.
Financial Products – Our finance and insurance subsidiaries, primarily Cat Financial and Insurance Services.
Consolidating Adjustments – Eliminations of transactions between Machinery, Energy & Transportation and Financial Products.
Pages 6889 to 7396 reconcile Machinery, Energy & Transportation with Financial Products on the equity basis to Caterpillar Inc. consolidated financial information.
Caterpillar Inc.
Supplemental Data for Results of Operations
For the Three Months Ended March 31,September 30, 2018
(Unaudited)
(Millions of dollars)
| | | | | | Supplemental Consolidating Data | | | | Supplemental Consolidating Data | |
| | Consolidated | | Machinery, Energy & Transportation 1 | | Financial Products | | Consolidating Adjustments | | Consolidated | | Machinery, Energy & Transportation 1 | | Financial Products | | Consolidating Adjustments | |
| Sales and revenues: | |
| | |
| | |
| | |
| | |
| | |
| | |
| | |
| |
| Sales of Machinery, Energy & Transportation | $ | 12,150 |
| | $ | 12,150 |
| | $ | — |
| | $ | — |
| | $ | 12,763 |
| | $ | 12,763 |
| | $ | — |
| | $ | — |
| |
| Revenues of Financial Products | 709 |
| | — |
| | 811 |
| | (102 | ) | 2 |
| 747 |
| | — |
| | 867 |
| | (120 | ) | 2 |
|
| Total sales and revenues | 12,859 |
| | 12,150 |
| | 811 |
| | (102 | ) | | 13,510 |
| | 12,763 |
| | 867 |
| | (120 | ) | |
| | | | | | | | | | | | | | | | | |
| Operating costs: | |
| | |
| | |
| | |
| | |
| | |
| | |
| | |
| |
| Cost of goods sold | 8,566 |
| | 8,566 |
| | — |
| | — |
| | 9,022 |
| | 9,022 |
| | — |
| | — |
| |
| Selling, general and administrative expenses | 1,276 |
| | 1,087 |
| | 189 |
| | — |
| | 1,299 |
| | 1,135 |
| | 169 |
| | (5 | ) | 3 |
|
| Research and development expenses | 443 |
| | 443 |
| | — |
| | — |
| | 479 |
| | 479 |
| | — |
| | — |
| |
| Interest expense of Financial Products | 166 |
| | — |
| | 173 |
| | (7 | ) | 4 |
| 185 |
| | — |
| | 194 |
| | (9 | ) | 4 |
|
| Other operating (income) expenses | 300 |
| | (1 | ) | | 310 |
| | (9 | ) | 3 |
| 390 |
| | 63 |
| | 333 |
| | (6 | ) | 3 |
|
| Total operating costs | 10,751 |
| | 10,095 |
| | 672 |
| | (16 | ) | | 11,375 |
| | 10,699 |
| | 696 |
| | (20 | ) | |
| | | | | | | | | | | | | | | | | |
| Operating profit | 2,108 |
| | 2,055 |
| | 139 |
| | (86 | ) | | 2,135 |
| | 2,064 |
| | 171 |
| | (100 | ) | |
| | | | | | | | | | | | | | | | | |
| Interest expense excluding Financial Products | 101 |
| | 112 |
| | — |
| | (11 | ) | 4 |
| 102 |
| | 114 |
| | — |
| | (12 | ) | 4 |
|
| Other income (expense) | 127 |
| | 54 |
| | (2 | ) | | 75 |
| 5 |
| 102 |
| | (5 | ) | | 19 |
| | 88 |
| 5 |
|
| | | | | | | | | | | | | | | | | |
| Consolidated profit before taxes | 2,134 |
| | 1,997 |
| | 137 |
| | — |
| | 2,135 |
| | 1,945 |
| | 190 |
| | — |
| |
| | | | | | | | | | | | | | | | | |
| Provision (benefit) for income taxes | 472 |
| | 441 |
| | 31 |
| | — |
| | 415 |
| | 376 |
| | 39 |
| | — |
| |
| Profit of consolidated companies | 1,662 |
| | 1,556 |
| | 106 |
| | — |
| | 1,720 |
| | 1,569 |
| | 151 |
| | — |
| |
| | | | | | | | | | | | | | | | | |
| Equity in profit (loss) of unconsolidated affiliated companies | 5 |
| | 5 |
| | — |
| | — |
| | 7 |
| | 7 |
| | — |
| | — |
| |
| Equity in profit of Financial Products’ subsidiaries | — |
| | 102 |
| | — |
| | (102 | ) | 6 |
| — |
| | 145 |
| | — |
| | (145 | ) | 6 |
|
| | | | | | | | | | | | | | | | | |
| Profit of consolidated and affiliated companies | 1,667 |
| | 1,663 |
| | 106 |
| | (102 | ) | | 1,727 |
| | 1,721 |
| | 151 |
| | (145 | ) | |
| | | | | | | | | | | | | | | | | |
| Less: Profit (loss) attributable to noncontrolling interests | 2 |
| | (2 | ) | | 4 |
| | — |
| | — |
| | (6 | ) | | 6 |
| | — |
| |
| | | | | | | | | | | | | | | | | |
Profit 7 | $ | 1,665 |
| | $ | 1,665 |
| | $ | 102 |
| | $ | (102 | ) | | $ | 1,727 |
| | $ | 1,727 |
| | $ | 145 |
| | $ | (145 | ) | |
| |
1 | Represents Caterpillar Inc. and its subsidiaries with Financial Products accounted for on the equity basis. |
| |
2 | Elimination of Financial Products’ revenues earned from Machinery, Energy & Transportation. |
| |
3 | Elimination of net expenses recorded by Machinery, Energy & Transportation paid to Financial Products. |
| |
4 | Elimination of interest expense recorded between Financial Products and Machinery, Energy & Transportation. |
| |
5 | Elimination of discount recorded by Machinery, Energy & Transportation on receivables sold to Financial Products and of interest earned between Machinery, Energy & Transportation and Financial Products. |
| |
6 | Elimination of Financial Products’ profit due to equity method of accounting. |
| |
7 | Profit attributable to common shareholders. |
Caterpillar Inc.
Supplemental Data for Results of Operations
For the Nine Months Ended September 30, 2018
(Unaudited)
(Millions of dollars)
|
| | | | | | | | | | | | | | | | | |
| | | | Supplemental Consolidating Data | |
| | Consolidated | | Machinery, Energy & Transportation 1 | | Financial Products | | Consolidating Adjustments | |
| Sales and revenues: | |
| | |
| | |
| | |
| |
| Sales of Machinery, Energy & Transportation | $ | 38,192 |
| | $ | 38,192 |
| | $ | — |
| | $ | — |
| |
| Revenues of Financial Products | 2,188 |
| | — |
| | 2,527 |
| | (339 | ) | 2 |
|
| Total sales and revenues | 40,380 |
| | 38,192 |
| | 2,527 |
| | (339 | ) | |
| | | | | | | | | |
| Operating costs: | |
| | |
| | |
| | |
| |
| Cost of goods sold | 27,010 |
| | 27,010 |
| | — |
| | — |
| |
| Selling, general and administrative expenses | 4,015 |
| | 3,445 |
| | 581 |
| | (11 | ) | 3 |
|
| Research and development expenses | 1,384 |
| | 1,384 |
| | — |
| | — |
| |
| Interest expense of Financial Products | 533 |
| | — |
| | 558 |
| | (25 | ) | 4 |
|
| Other operating (income) expenses | 1,028 |
| | 100 |
| | 949 |
| | (21 | ) | 3 |
|
| Total operating costs | 33,970 |
| | 31,939 |
| | 2,088 |
| | (57 | ) | |
| | | | | | | | | |
| Operating profit | 6,410 |
| | 6,253 |
| | 439 |
| | (282 | ) | |
| | | | | | | | | |
| Interest expense excluding Financial Products | 305 |
| | 337 |
| | — |
| | (32 | ) | 4 |
|
| Other income (expense) | 350 |
| | 76 |
| | 24 |
| | 250 |
| 5 |
|
| | | | | | | | | |
| Consolidated profit before taxes | 6,455 |
| | 5,992 |
| | 463 |
| | — |
| |
| | | | | | | | | |
| Provision (benefit) for income taxes | 1,377 |
| | 1,274 |
| | 103 |
| | — |
| |
| Profit of consolidated companies | 5,078 |
| | 4,718 |
| | 360 |
| | — |
| |
| | | | | | | | | |
| Equity in profit (loss) of unconsolidated affiliated companies | 21 |
| | 21 |
| | — |
| | — |
| |
| Equity in profit of Financial Products’ subsidiaries | — |
| | 345 |
| | — |
| | (345 | ) | 6 |
|
| | | | | | | | | |
| Profit of consolidated and affiliated companies | 5,099 |
| | 5,084 |
| | 360 |
| | (345 | ) | |
| | | | | | | | | |
| Less: Profit (loss) attributable to noncontrolling interests | — |
| | (15 | ) | | 15 |
| | — |
| |
| | | | | | | | | |
Profit 7 | $ | 5,099 |
| | $ | 5,099 |
| | $ | 345 |
| | $ | (345 | ) | |
| |
1 | Represents Caterpillar Inc. and its subsidiaries with Financial Products accounted for on the equity basis. |
| |
2 | Elimination of Financial Products’ revenues earned from Machinery, Energy & Transportation. |
| |
3 | Elimination of net expenses recorded by Machinery, Energy & Transportation paid to Financial Products. |
| |
4 | Elimination of interest expense recorded between Financial Products and Machinery, Energy & Transportation. |
| |
5 | Elimination of discount recorded by Machinery, Energy & Transportation on receivables sold to Financial Products and of interest earned between Machinery, Energy & Transportation and Financial Products. |
| |
6 | Elimination of Financial Products’ profit due to equity method of accounting. |
| |
7 | Profit attributable to common shareholders. |
Caterpillar Inc.
Supplemental Data for Results of Operations
For the Three Months Ended March 31,September 30, 2017
(Unaudited)
(Millions of dollars)
| | | | | | Supplemental Consolidating Data | | | | Supplemental Consolidating Data | |
| | Consolidated | | Machinery, Energy & Transportation 1 | | Financial Products | | Consolidating Adjustments | | Consolidated | | Machinery, Energy & Transportation 1 | | Financial Products | | Consolidating Adjustments | |
| Sales and revenues: | |
| | |
| | |
| | |
| | |
| | |
| | |
| | |
| |
| Sales of Machinery, Energy & Transportation | $ | 9,130 |
| | $ | 9,130 |
| | $ | — |
| | $ | — |
| | $ | 10,713 |
| | $ | 10,713 |
| | $ | — |
| | $ | — |
| |
| Revenues of Financial Products | 692 |
| | — |
| | 777 |
| | (85 | ) | 2 |
| 700 |
| | — |
| | 793 |
| | (93 | ) | 2 |
|
| Total sales and revenues | 9,822 |
| | 9,130 |
| | 777 |
| | (85 | ) | | 11,413 |
| | 10,713 |
| | 793 |
| | (93 | ) | |
| | | | | | | | | | | | | | | | | |
| Operating costs: | |
| | |
| | |
| | |
| | |
| | |
| | |
| | |
| |
| Cost of goods sold | 6,801 |
| | 6,801 |
| | — |
| | — |
| | 7,678 |
| | 7,678 |
| | — |
| | — |
| |
| Selling, general and administrative expenses | 1,061 |
| | 940 |
| | 126 |
| | (5 | ) | 3 |
| 1,254 |
| | 1,084 |
| | 173 |
| | (3 | ) | 3 |
|
| Research and development expenses | 425 |
| | 425 |
| | — |
| | — |
| | 461 |
| | 461 |
| | — |
| | — |
| |
| Interest expense of Financial Products | 159 |
| | — |
| | 163 |
| | (4 | ) | 4 |
| 163 |
| | — |
| | 169 |
| | (6 | ) | 4 |
|
| Other operating (income) expenses | 996 |
| | 699 |
| | 302 |
| | (5 | ) | 3 |
| 348 |
| | 51 |
| | 303 |
| | (6 | ) | 3 |
|
| Total operating costs | 9,442 |
| | 8,865 |
| | 591 |
| | (14 | ) | | 9,904 |
| | 9,274 |
| | 645 |
| | (15 | ) | |
| | | | | | | | | | | | | | | | | |
| Operating profit | 380 |
| | 265 |
| | 186 |
| | (71 | ) | | 1,509 |
| | 1,439 |
| | 148 |
| | (78 | ) | |
| | | | | | | | | | | | | | | | | |
| Interest expense excluding Financial Products | 123 |
| | 144 |
| | — |
| | (21 | ) | 4 |
| 118 |
| | 143 |
| | — |
| | (25 | ) | 4 |
|
| Other income (expense) | 32 |
| | (16 | ) | | (2 | ) | | 50 |
| 5 |
| 132 |
| | 46 |
| | 33 |
| | 53 |
| 5 |
|
| | | | | | | | | | | | | | | | | |
| Consolidated profit before taxes | 289 |
| | 105 |
| | 184 |
| | — |
| | 1,523 |
| | 1,342 |
| | 181 |
| | — |
| |
| | | | | | | | | | | | | | | | | |
| Provision (benefit) for income taxes | 90 |
| | 34 |
| | 56 |
| | — |
| | 470 |
| | 413 |
| | 57 |
| | — |
| |
| Profit of consolidated companies | 199 |
| | 71 |
| | 128 |
| | — |
| | 1,053 |
| | 929 |
| | 124 |
| | — |
| |
| | | | | | | | | | | | | | | | | |
| Equity in profit (loss) of unconsolidated affiliated companies | (5 | ) | | (5 | ) | | — |
| | — |
| | 8 |
| | 8 |
| | — |
| | — |
| |
| Equity in profit of Financial Products’ subsidiaries | — |
| | 126 |
| | — |
| | (126 | ) | 6 |
| — |
| | 122 |
| | — |
| | (122 | ) | 6 |
|
| | | | | | | | | | | | | | | | | |
| Profit of consolidated and affiliated companies | 194 |
| | 192 |
| | 128 |
| | (126 | ) | | 1,061 |
| | 1,059 |
| | 124 |
| | (122 | ) | |
| | | | | | | | | | | | | | | | | |
| Less: Profit (loss) attributable to noncontrolling interests | 2 |
| | — |
| | 2 |
| | — |
| | 2 |
| | — |
| | 2 |
| | — |
| |
| | | | | | | | | | | | | | | | | |
Profit 7 | $ | 192 |
| | $ | 192 |
| | $ | 126 |
| | $ | (126 | ) | | $ | 1,059 |
| | $ | 1,059 |
| | $ | 122 |
| | $ | (122 | ) | |
| |
1 | Represents Caterpillar Inc. and its subsidiaries with Financial Products accounted for on the equity basis. |
| |
2 | Elimination of Financial Products’ revenues earned from Machinery, Energy & Transportation. |
| |
3 | Elimination of net expenses recorded by Machinery, Energy & Transportation paid to Financial Products. |
| |
4 | Elimination of interest expense recorded between Financial Products and Machinery, Energy & Transportation. |
| |
5 | Elimination of discount recorded by Machinery, Energy & Transportation on receivables sold to Financial Products and of interest earned between Machinery, Energy & Transportation and Financial Products. |
| |
6 | Elimination of Financial Products’ profit due to equity method of accounting. |
| |
7 | Profit attributable to common shareholders. |
Caterpillar Inc.
Supplemental Data for Results of Operations
For the Nine Months Ended September 30, 2017
(Unaudited)
(Millions of dollars)
|
| | | | | | | | | | | | | | | | | |
| | | | Supplemental Consolidating Data | |
| | Consolidated | | Machinery, Energy & Transportation 1 | | Financial Products | | Consolidating Adjustments | |
| Sales and revenues: | |
| | |
| | |
| | |
| |
| Sales of Machinery, Energy & Transportation | $ | 30,482 |
| | $ | 30,482 |
| | $ | — |
| | $ | — |
| |
| Revenues of Financial Products | 2,084 |
| | — |
| | 2,363 |
| | (279 | ) | 2 |
|
| Total sales and revenues | 32,566 |
| | 30,482 |
| | 2,363 |
| | (279 | ) | |
| | | | | | | | | |
| Operating costs: | |
| | |
| | |
| | |
| |
| Cost of goods sold | 22,295 |
| | 22,295 |
| | — |
| | — |
| |
| Selling, general and administrative expenses | 3,619 |
| | 3,193 |
| | 438 |
| | (12 | ) | 3 |
|
| Research and development expenses | 1,344 |
| | 1,344 |
| | — |
| | — |
| |
| Interest expense of Financial Products | 484 |
| | — |
| | 499 |
| | (15 | ) | 4 |
|
| Other operating (income) expenses | 1,751 |
| | 861 |
| | 906 |
| | (16 | ) | 3 |
|
| Total operating costs | 29,493 |
| | 27,693 |
| | 1,843 |
| | (43 | ) | |
| | | | | | | | | |
| Operating profit | 3,073 |
| | 2,789 |
| | 520 |
| | (236 | ) | |
| | | | | | | | | |
| Interest expense excluding Financial Products | 362 |
| | 433 |
| | — |
| | (71 | ) | 4 |
|
| Other income (expense) | 260 |
| | 62 |
| | 33 |
| | 165 |
| 5 |
|
| | | | | | | | | |
| Consolidated profit before taxes | 2,971 |
| | 2,418 |
| | 553 |
| | — |
| |
| | | | | | | | | |
| Provision (benefit) for income taxes | 921 |
| | 750 |
| | 171 |
| | — |
| |
| Profit of consolidated companies | 2,050 |
| | 1,668 |
| | 382 |
| | — |
| |
| | | | | | | | | |
| Equity in profit (loss) of unconsolidated affiliated companies | 8 |
| | 8 |
| | — |
| | — |
| |
| Equity in profit of Financial Products’ subsidiaries | — |
| | 377 |
| | — |
| | (377 | ) | 6 |
|
| | | | | | | | | |
| Profit of consolidated and affiliated companies | 2,058 |
| | 2,053 |
| | 382 |
| | (377 | ) | |
| | | | | | | | | |
| Less: Profit (loss) attributable to noncontrolling interests | 5 |
| | — |
| | 5 |
| | — |
| |
| | | | | | | | | |
Profit 7 | $ | 2,053 |
| | $ | 2,053 |
| | $ | 377 |
| | $ | (377 | ) | |
| |
1 | Represents Caterpillar Inc. and its subsidiaries with Financial Products accounted for on the equity basis. |
| |
2 | Elimination of Financial Products’ revenues earned from Machinery, Energy & Transportation. |
| |
3 | Elimination of net expenses recorded by Machinery, Energy & Transportation paid to Financial Products. |
| |
4 | Elimination of interest expense recorded between Financial Products and Machinery, Energy & Transportation. |
| |
5 | Elimination of discount recorded by Machinery, Energy & Transportation on receivables sold to Financial Products and of interest earned between Machinery, Energy & Transportation and Financial Products. |
| |
6 | Elimination of Financial Products’ profit due to equity method of accounting. |
| |
7 | Profit attributable to common shareholders. |
Caterpillar Inc.
Supplemental Data for Financial Position
At March 31,September 30, 2018
(Unaudited)
(Millions of dollars)
| | | | | | Supplemental Consolidating Data | | | | Supplemental Consolidating Data | |
| | Consolidated | | Machinery, Energy & Transportation 1 | | Financial Products | | Consolidating Adjustments | | Consolidated | | Machinery, Energy & Transportation 1 | | Financial Products | | Consolidating Adjustments | |
| Assets | | | | | | | | | | | | | | | | |
| Current assets: | | | | | | | | | | | | | | | | |
| Cash and short-term investments | $ | 7,888 |
| | $ | 7,034 |
| | $ | 854 |
| | $ | — |
| | $ | 8,007 |
| | $ | 7,189 |
| | $ | 818 |
| | $ | — |
| |
| Receivables – trade and other | 7,894 |
| | 4,399 |
| | 383 |
| | 3,112 |
| 2,3 | 7,974 |
| | 4,342 |
| | 475 |
| | 3,157 |
| 2,3 |
| Receivables – finance | 8,772 |
| | — |
| | 13,508 |
| | (4,736 | ) | 3 | 8,824 |
| | — |
| | 13,630 |
| | (4,806 | ) | 3 |
| Prepaid expenses and other current assets | 1,856 |
| | 1,269 |
| | 594 |
| | (7 | ) | 4 | 1,835 |
| | 1,245 |
| | 602 |
| | (12 | ) | 4 |
| Inventories | 10,947 |
| | 10,947 |
| | — |
| | — |
| | 11,814 |
| | 11,814 |
| | — |
| | — |
| |
| Total current assets | 37,357 |
| | 23,649 |
| | 15,339 |
| | (1,631 | ) | | 38,454 |
| | 24,590 |
| | 15,525 |
| | (1,661 | ) | |
| | | | | | | | | | | | | | | | | |
| Property, plant and equipment – net | 13,912 |
| | 9,486 |
| | 4,426 |
| | — |
| | 13,607 |
| | 9,106 |
| | 4,501 |
| | — |
| |
| Long-term receivables – trade and other | 1,004 |
| | 265 |
| | 174 |
| | 565 |
| 2,3 | 1,129 |
| | 269 |
| | 243 |
| | 617 |
| 2,3 |
| Long-term receivables – finance | 13,359 |
| | — |
| | 13,953 |
| | (594 | ) | 3 | 13,244 |
| | — |
| | 13,900 |
| | (656 | ) | 3 |
| Investments in Financial Products subsidiaries | — |
| | 4,225 |
| | — |
| | (4,225 | ) | 5 | — |
| | 4,165 |
| | — |
| | (4,165 | ) | 5 |
| Noncurrent deferred and refundable income taxes | 1,687 |
| | 2,116 |
| | 108 |
| | (537 | ) | 6 | 1,288 |
| | 1,818 |
| | 98 |
| | (628 | ) | 6 |
| Intangible assets | 2,163 |
| | 2,159 |
| | 4 |
| | — |
| | 1,976 |
| | 1,976 |
| | — |
| | — |
| |
| Goodwill | 6,376 |
| | 6,359 |
| | 17 |
| | — |
| | 6,233 |
| | 6,233 |
| | — |
| | — |
| |
| Other assets | 2,156 |
| | 853 |
| | 1,303 |
| | — |
| | 2,278 |
| | 829 |
| | 1,449 |
| | — |
| |
| Total assets | $ | 78,014 |
| | $ | 49,112 |
| | $ | 35,324 |
| | $ | (6,422 | ) | | $ | 78,209 |
| | $ | 48,986 |
| | $ | 35,716 |
| | $ | (6,493 | ) | |
| | | | | | | | | | | | | | | | | |
| Liabilities | |
| | |
| | |
| | |
| | |
| | |
| | |
| | |
| |
| Current liabilities: | |
| | |
| | |
| | |
| | |
| | |
| | |
| | |
| |
| Short-term borrowings | $ | 5,733 |
| | $ | 7 |
| | $ | 5,726 |
| | $ | — |
| | $ | 4,521 |
| | $ | 59 |
| | $ | 4,462 |
| | $ | — |
| |
| Short-term borrowings with consolidated companies | — |
| | — |
| | 1,516 |
| | (1,516 | ) | 7 | — |
| | — |
| | 1,548 |
| | (1,548 | ) | 7 |
| Accounts payable | 6,938 |
| | 6,793 |
| | 253 |
| | (108 | ) | 8 | 6,788 |
| | 6,693 |
| | 196 |
| | (101 | ) | 8 |
| Accrued expenses | 3,551 |
| | 3,153 |
| | 398 |
| | — |
| | 3,423 |
| | 3,084 |
| | 339 |
| | — |
| |
| Accrued wages, salaries and employee benefits | 1,474 |
| | 1,446 |
| | 28 |
| | — |
| | 2,132 |
| | 2,092 |
| | 40 |
| | — |
| |
| Customer advances | 1,399 |
| | 1,399 |
| | — |
| | — |
| | 1,491 |
| | 1,491 |
| | — |
| | — |
| |
| Dividends payable | — |
| | — |
| | — |
| | — |
| | — |
| | — |
| | — |
| | — |
| |
| Other current liabilities | 1,890 |
| | 1,474 |
| | 423 |
| | (7 | ) | 6,9 | 1,867 |
| | 1,450 |
| | 429 |
| | (12 | ) | 6,9 |
| Long-term debt due within one year | 6,417 |
| | 8 |
| | 6,409 |
| | — |
| | 5,811 |
| | 10 |
| | 5,801 |
| | — |
| |
| Total current liabilities | 27,402 |
| | 14,280 |
| | 14,753 |
| | (1,631 | ) | | 26,033 |
| | 14,879 |
| | 12,815 |
| | (1,661 | ) | |
| | | | | | | | | | | | | | | | | |
| Long-term debt due after one year | 23,165 |
| | 8,009 |
| | 15,185 |
| | (29 | ) | 7 | 25,441 |
| | 8,030 |
| | 17,450 |
| | (39 | ) | 7 |
| Liability for postemployment benefits | 8,233 |
| | 8,233 |
| | — |
| | — |
| | 7,046 |
| | 7,046 |
| | — |
| | — |
| |
| Other liabilities | 3,942 |
| | 3,318 |
| | 1,161 |
| | (537 | ) | 6 | 3,799 |
| | 3,141 |
| | 1,286 |
| | (628 | ) | 6 |
| Total liabilities | 62,742 |
| | 33,840 |
| | 31,099 |
| | (2,197 | ) | | 62,319 |
| | 33,096 |
| | 31,551 |
| | (2,328 | ) | |
| Commitments and contingencies | |
| | |
| | |
| | |
| | |
| | |
| | |
| | |
| |
| Shareholders’ equity | |
| | |
| | |
| | |
| | |
| | |
| | |
| | |
| |
| Common stock | 5,640 |
| | 5,640 |
| | 918 |
| | (918 | ) | 5 | 5,715 |
| | 5,715 |
| | 919 |
| | (919 | ) | 5 |
| Treasury stock | (17,347 | ) | | (17,347 | ) | | — |
| | — |
| | (18,681 | ) | | (18,681 | ) | | — |
| | — |
| |
| Profit employed in the business | 27,929 |
| | 27,929 |
| | 3,702 |
| | (3,702 | ) | 5 | 30,384 |
| | 30,384 |
| | 3,945 |
| | (3,945 | ) | 5 |
| Accumulated other comprehensive income (loss) | (1,016 | ) | | (1,016 | ) | | (545 | ) | | 545 |
| 5 | (1,568 | ) | | (1,568 | ) | | (846 | ) | | 846 |
| 5 |
| Noncontrolling interests | 66 |
| | 66 |
| | 150 |
| | (150 | ) | 5 | 40 |
| | 40 |
| | 147 |
| | (147 | ) | 5 |
| Total shareholders’ equity | 15,272 |
| | 15,272 |
| | 4,225 |
| | (4,225 | ) | | 15,890 |
| | 15,890 |
| | 4,165 |
| | (4,165 | ) | |
| Total liabilities and shareholders’ equity | $ | 78,014 |
| | $ | 49,112 |
| | $ | 35,324 |
| | $ | (6,422 | ) | | $ | 78,209 |
| | $ | 48,986 |
| | $ | 35,716 |
| | $ | (6,493 | ) | |
| |
1 | Represents Caterpillar Inc. and its subsidiaries with Financial Products accounted for on the equity basis. |
| |
2 | Elimination of receivables between Machinery, Energy & Transportation and Financial Products. |
| |
3 | Reclassification of Machinery, Energy & Transportation's trade receivables purchased by Financial Products and Financial Products’ wholesale inventory receivables. |
| |
4 | Elimination of Machinery, Energy & Transportation's insurance premiums that are prepaid to Financial Products. |
| |
5 | Elimination of Financial Products’ equity which is accounted for by Machinery, Energy & Transportation on the equity basis. |
| |
6 | Reclassification reflecting required netting of deferred tax assets / liabilities by taxing jurisdiction. |
| |
7 | Elimination of debt between Machinery, Energy & Transportation and Financial Products. |
| |
8 | Elimination of payables between Machinery, Energy & Transportation and Financial Products. |
| |
9 | Elimination of prepaid insurance in Financial Products’ other liabilities.
|
Caterpillar Inc.
Supplemental Data for Financial Position
At December 31, 2017
(Unaudited)
(Millions of dollars)
|
| | | | | | | | | | | | | | | | |
| | | | Supplemental Consolidating Data | |
| | Consolidated | | Machinery, Energy & Transportation 1 | | Financial Products | | Consolidating Adjustments | |
| Assets | | | | | | | | |
| Current assets: | | | | | | | | |
| Cash and short-term investments | $ | 8,261 |
| | $ | 7,381 |
| | $ | 880 |
| | $ | — |
| |
| Receivables – trade and other | 7,436 |
| | 4,596 |
| | 343 |
| | 2,497 |
| 2,3 |
| Receivables – finance | 8,757 |
| | — |
| | 12,985 |
| | (4,228 | ) | 3 |
| Prepaid expenses and other current assets | 1,772 |
| | 1,099 |
| | 679 |
| | (6 | ) | 4 |
| Inventories | 10,018 |
| | 10,018 |
| | — |
| | — |
| |
| Total current assets | 36,244 |
| | 23,094 |
| | 14,887 |
| | (1,737 | ) | |
| | | | | | | | | |
| Property, plant and equipment – net | 14,155 |
| | 9,823 |
| | 4,332 |
| | — |
| |
| Long-term receivables – trade and other | 990 |
| | 229 |
| | 162 |
| | 599 |
| 2,3 |
| Long-term receivables – finance | 13,542 |
| | — |
| | 14,170 |
| | (628 | ) | 3 |
| Investments in Financial Products subsidiaries | — |
| | 4,064 |
| | — |
| | (4,064 | ) | 5 |
| Noncurrent deferred and refundable income taxes | 1,693 |
| | 2,166 |
| | 101 |
| | (574 | ) | 6 |
| Intangible assets | 2,111 |
| | 2,106 |
| | 5 |
| | — |
| |
| Goodwill | 6,200 |
| | 6,183 |
| | 17 |
| | — |
| |
| Other assets | 2,027 |
| | 822 |
| | 1,205 |
| | — |
| |
| Total assets | $ | 76,962 |
| | $ | 48,487 |
| | $ | 34,879 |
| | $ | (6,404 | ) | |
| | | | | | | | | |
| Liabilities | |
| | |
| | |
| | |
| |
| Current liabilities: | |
| | |
| | |
| | |
| |
| Short-term borrowings | $ | 4,837 |
| | $ | 1 |
| | $ | 4,836 |
| | $ | — |
| |
| Short-term borrowings with consolidated companies | — |
| | — |
| | 1,623 |
| | (1,623 | ) | 7 |
| Accounts payable | 6,487 |
| | 6,330 |
| | 265 |
| | (108 | ) | 8 |
| Accrued expenses | 3,220 |
| | 2,880 |
| | 340 |
| | — |
| |
| Accrued wages, salaries and employee benefits | 2,559 |
| | 2,504 |
| | 55 |
| | — |
| |
| Customer advances | 1,426 |
| | 1,426 |
| | — |
| | — |
| |
| Dividends payable | 466 |
| | 466 |
| | — |
| | — |
| |
| Other current liabilities | 1,742 |
| | 1,327 |
| | 423 |
| | (8 | ) | 6,9 |
| Long-term debt due within one year | 6,194 |
| | 6 |
| | 6,188 |
| | — |
| |
| Total current liabilities | 26,931 |
| | 14,940 |
| | 13,730 |
| | (1,739 | ) | |
| | | | | | | | | |
| Long-term debt due after one year | 23,847 |
| | 7,958 |
| | 15,918 |
| | (29 | ) | 7 |
| Liability for postemployment benefits | 8,365 |
| | 8,365 |
| | — |
| | — |
| |
| Other liabilities | 4,053 |
| | 3,458 |
| | 1,167 |
| | (572 | ) | 6 |
| Total liabilities | 63,196 |
| | 34,721 |
| | 30,815 |
| | (2,340 | ) | |
| Commitments and contingencies | |
| | |
| | |
| | |
| |
| Shareholders’ equity | |
| | |
| | |
| | |
| |
| Common stock | 5,593 |
| | 5,593 |
| | 918 |
| | (918 | ) | 5 |
| Treasury stock | (17,005 | ) | | (17,005 | ) | | — |
| | — |
| |
| Profit employed in the business | 26,301 |
| | 26,301 |
| | 3,598 |
| | (3,598 | ) | 5 |
| Accumulated other comprehensive income (loss) | (1,192 | ) | | (1,192 | ) | | (592 | ) | | 592 |
| 5 |
| Noncontrolling interests | 69 |
| | 69 |
| | 140 |
| | (140 | ) | 5 |
| Total shareholders’ equity | 13,766 |
| | 13,766 |
| | 4,064 |
| | (4,064 | ) | |
| Total liabilities and shareholders’ equity | $ | 76,962 |
| | $ | 48,487 |
| | $ | 34,879 |
| | $ | (6,404 | ) | |
| |
1 | Represents Caterpillar Inc. and its subsidiaries with Financial Products accounted for on the equity basis. |
| |
2 | Elimination of receivables between Machinery, Energy & Transportation and Financial Products. |
| |
3 | Reclassification of Machinery, Energy & Transportation's trade receivables purchased by Financial Products and Financial Products’ wholesale inventory receivables. |
| |
4 | Elimination of Machinery, Energy & Transportation's insurance premiums that are prepaid to Financial Products. |
| |
5 | Elimination of Financial Products’ equity which is accounted for by Machinery, Energy & Transportation on the equity basis. |
| |
6 | Reclassification reflecting required netting of deferred tax assets / liabilities by taxing jurisdiction. |
| |
7 | Elimination of debt between Machinery, Energy & Transportation and Financial Products. |
| |
8 | Elimination of payables between Machinery, Energy & Transportation and Financial Products. |
| |
9 | Elimination of prepaid insurance in Financial Products’ other liabilities. |
Caterpillar Inc.
Supplemental Data for Cash Flow
For the ThreeNine Months Ended March 31,September 30, 2018
(Unaudited)
(Millions of dollars)
| | | | | | Supplemental Consolidating Data | | | | Supplemental Consolidating Data | |
| | Consolidated | | Machinery, Energy & Transportation 1 | | Financial Products | | Consolidating Adjustments | | Consolidated | | Machinery, Energy & Transportation 1 | | Financial Products | | Consolidating Adjustments | |
| Cash flow from operating activities: | | | | | | | | | | | | | | | | |
| Profit of consolidated and affiliated companies | $ | 1,667 |
| | $ | 1,663 |
| | $ | 106 |
| | $ | (102 | ) | 2 | $ | 5,099 |
| | $ | 5,084 |
| | $ | 360 |
| | $ | (345 | ) | 2 |
| Adjustments for non-cash items: | |
| | |
| | |
| | |
| | |
| | |
| | |
| | |
| |
| Depreciation and amortization | 681 |
| | 468 |
| | 213 |
| | — |
| | 2,065 |
| | 1,410 |
| | 655 |
| | — |
| |
| Undistributed profit of Financial Products | — |
| | (102 | ) | | — |
| | 102 |
| 3 | — |
| | (345 | ) | | — |
| | 345 |
| 3 |
| Other | 148 |
| | 62 |
| | (6 | ) | | 92 |
| 4 | 630 |
| | 327 |
| | 36 |
| | 267 |
| 4 |
| Changes in assets and liabilities, net of acquisitions and divestitures: |
| | | | | | | |
| | | | | | | |
| Receivables - trade and other | (326 | ) | | 90 |
| | — |
| | (416 | ) | 4, 5 | |
| Receivables – trade and other | | (725 | ) | | 19 |
| | (33 | ) | | (711 | ) | 4, 5 |
| Inventories | (803 | ) | | (803 | ) | | — |
| | — |
| | (1,822 | ) | | (1,774 | ) | | — |
| | (48 | ) | 4 |
| Accounts payable | 486 |
| | 505 |
| | (19 | ) | | — |
| | 496 |
| | 544 |
| | (55 | ) | | 7 |
| 4 |
| Accrued expenses | 66 |
| | 43 |
| | 23 |
| | — |
| | (32 | ) | | (63 | ) | | 31 |
| | — |
| |
| Accrued wages, salaries and employee benefits | (1,110 | ) | | (1,083 | ) | | (27 | ) | | — |
| | (418 | ) | | (403 | ) | | (15 | ) | | — |
| |
| Customer advances | (46 | ) | | (46 | ) | | — |
| | — |
| | 59 |
| | 59 |
| | — |
| | — |
| |
| Other assets – net | 165 |
| | 173 |
| | 28 |
| | (36 | ) | 4 | 394 |
| | 343 |
| | (9 | ) | | 60 |
| 4 |
| Other liabilities – net | 7 |
| | (22 | ) | | (7 | ) | | 36 |
| 4 | (1,271 | ) | | (1,321 | ) | | 110 |
| | (60 | ) | 4 |
| Net cash provided by (used for) operating activities | 935 |
| | 948 |
| | 311 |
| | (324 | ) | | 4,475 |
| | 3,880 |
| | 1,080 |
| | (485 | ) | |
| | | | | | | | | | | | | | | | | |
| Cash flow from investing activities: | |
| | |
| | |
| | |
| | |
| | |
| | |
| | |
| |
| Capital expenditures - excluding equipment leased to others | (412 | ) | | (321 | ) | | (92 | ) | | 1 |
| 4 | |
| Capital expenditures – excluding equipment leased to others | | (921 | ) | | (822 | ) | | (99 | ) | | — |
| |
| Expenditures for equipment leased to others | (345 | ) | | (2 | ) | | (346 | ) | | 3 |
| 4 | (1,208 | ) | | (23 | ) | | (1,258 | ) | | 73 |
| 4 |
| Proceeds from disposals of leased assets and property, plant and equipment | 258 |
| | 54 |
| | 207 |
| | (3 | ) | 4 | 732 |
| | 122 |
| | 632 |
| | (22 | ) | 4 |
| Additions to finance receivables | (2,621 | ) | | — |
| | (2,955 | ) | | 334 |
| 5 | (9,092 | ) | | — |
| | (10,151 | ) | | 1,059 |
| 5,7 |
| Collections of finance receivables | 2,671 |
| | — |
| | 3,171 |
| | (500 | ) | 5 | 8,032 |
| | — |
| | 9,135 |
| | (1,103 | ) | 5 |
| Net intercompany purchased receivables | — |
| | — |
| | (489 | ) | | 489 |
| 5 | — |
| | — |
| | (484 | ) | | 484 |
| 5 |
| Proceeds from sale of finance receivables | 69 |
| | — |
| | 69 |
| | — |
| | 416 |
| | — |
| | 416 |
| | — |
| |
| Net intercompany borrowings | — |
| | 107 |
| | — |
| | (107 | ) | 6 | — |
| | 66 |
| | — |
| | (66 | ) | 6 |
| Investments and acquisitions (net of cash acquired) | (340 | ) | | (340 | ) | | — |
| | — |
| | (357 | ) | | (357 | ) | | — |
| | — |
| |
| Proceeds from sale of businesses and investments (net of cash sold) | 12 |
| | 12 |
| | — |
| | — |
| | 14 |
| | 20 |
| | — |
| | (6 | ) | 7 |
| Proceeds from sale of securities | 89 |
| | 5 |
| | 84 |
| | — |
| | 363 |
| | 154 |
| | 209 |
| | — |
| |
| Investments in securities | (197 | ) | | (18 | ) | | (179 | ) | | — |
| | (417 | ) | | (21 | ) | | (396 | ) | | — |
| |
| Other – net | 16 |
| | 19 |
| | (3 | ) | | — |
| | 24 |
| | 25 |
| | (2 | ) | | 1 |
| 8 |
| Net cash provided by (used for) investing activities | (800 | ) | | (484 | ) | | (533 | ) | | 217 |
| | (2,414 | ) | | (836 | ) | | (1,998 | ) | | 420 |
| |
| | | | | | | | | | | | | | | | | |
| Cash flow from financing activities: | |
| | |
| | |
| | |
| | |
| | |
| | |
| | |
| |
| Dividends paid | (467 | ) | | (467 | ) | | — |
| | — |
| | (1,444 | ) | | (1,444 | ) | | — |
| | — |
| |
| Common stock issued, including treasury shares reissued | 149 |
| | 149 |
| | — |
| | — |
| | 292 |
| | 292 |
| | 1 |
| | (1 | ) | 8 |
| Common shares repurchased | (500 | ) | | (500 | ) | | — |
| | — |
| | (2,000 | ) | | (2,000 | ) | | — |
| | — |
| |
| Net intercompany borrowings | — |
| | — |
| | (107 | ) | | 107 |
| 6 | — |
| | — |
| | (66 | ) | | 66 |
| 6 |
| Proceeds from debt issued (original maturities greater than three months) | 1,541 |
| | — |
| | 1,541 |
| | — |
| | 7,073 |
| | 47 |
| | 7,026 |
| | — |
| |
| Payments on debt (original maturities greater than three months) | (2,409 | ) | | (1 | ) | | (2,408 | ) | | — |
| | (5,642 | ) | | (6 | ) | | (5,636 | ) | | — |
| |
| Short-term borrowings – net (original maturities three months or less) | 1,151 |
| | 6 |
| | 1,145 |
| | — |
| | (465 | ) | | 14 |
| | (479 | ) | | — |
| |
| Other – net | (3 | ) | | (3 | ) | | — |
| | — |
| | (32 | ) | | (32 | ) | | — |
| | — |
| |
| Net cash provided by (used for) financing activities | (538 | ) | | (816 | ) | | 171 |
| | 107 |
| | (2,218 | ) | | (3,129 | ) | | 846 |
| | 65 |
| |
| Effect of exchange rate changes on cash | 10 |
| | 6 |
| | 4 |
| | — |
| | (117 | ) | | (106 | ) | | (11 | ) | | — |
| |
| Increase (decrease) in cash and short-term investments and restricted cash | (393 | ) | | (346 | ) | | (47 | ) | | — |
| | (274 | ) | | (191 | ) | | (83 | ) | | — |
| |
| Cash and short-term investments and restricted cash at beginning of period | 8,320 |
| | 7,416 |
| | 904 |
| | — |
| | 8,320 |
| | 7,416 |
| | 904 |
| | — |
| |
| Cash and short-term investments and restricted cash at end of period | $ | 7,927 |
| | $ | 7,070 |
| | $ | 857 |
| | $ | — |
| | $ | 8,046 |
| | $ | 7,225 |
| | $ | 821 |
| | $ | — |
| |
| |
1 | Represents Caterpillar Inc. and its subsidiaries with Financial Products accounted for on the equity basis. |
| |
2 | Elimination of Financial Products’ profit after tax due to equity method of accounting. |
| |
3 | Elimination of non-cash adjustment for the undistributed earnings from Financial Products. |
| |
4 | Elimination of non-cash adjustments and changes in assets and liabilities related to consolidated reporting. |
| |
5 | Reclassification of Financial Products' cash flow activity from investing to operating for receivables that arose from the sale of inventory. |
| |
6 | Elimination of net proceeds and payments to/from Machinery, Energy & Transportation and Financial Products. |
| |
7 | Elimination of proceeds received from Financial Products related to Machinery, Energy & Transportation's sale of businesses and investments. |
| |
8 | Elimination of change in investment and common stock related to Financial Products. |
Caterpillar Inc.
Supplemental Data for Cash Flow
For the ThreeNine Months Ended March 31,September 30, 2017
(Unaudited)
| | | | | | Supplemental Consolidating Data | | | | Supplemental Consolidating Data | |
| | Consolidated | | Machinery, Energy & Transportation 1 | | Financial Products | | Consolidating Adjustments | | Consolidated | | Machinery, Energy & Transportation 1 | | Financial Products | | Consolidating Adjustments | |
| Cash flow from operating activities: | | | | | | | | | | | | | | | | |
| Profit of consolidated and affiliated companies | $ | 194 |
| | $ | 192 |
| | $ | 128 |
| | $ | (126 | ) | 2 | $ | 2,058 |
| | $ | 2,053 |
| | $ | 382 |
| | $ | (377 | ) | 2 |
| Adjustments for non-cash items: | |
| | |
| | |
| | |
| | |
| | |
| | |
| | |
| |
| Depreciation and amortization | 710 |
| | 491 |
| | 219 |
| | — |
| | 2,153 |
| | 1,507 |
| | 646 |
| | — |
| |
| Undistributed profit of Financial Products | — |
| | (126 | ) | | — |
| | 126 |
| 3 | — |
| | (377 | ) | | — |
| | 377 |
| 3 |
| Other | 302 |
| | 302 |
| | (47 | ) | | 47 |
| 4 | 596 |
| | 524 |
| | (107 | ) | | 179 |
| 4 |
| Changes in assets and liabilities, net of acquisitions and divestitures: |
|
| | | | | | | |
|
| | | | | | | |
| Receivables - trade and other | (353 | ) | | (8 | ) | | 52 |
| | (397 | ) | 4, 5 | |
| Receivables – trade and other | | (455 | ) | | (324 | ) | | 62 |
| | (193 | ) | 4, 5 |
| Inventories | (444 | ) | | (444 | ) | | — |
| | — |
| | (1,489 | ) | | (1,487 | ) | | — |
| | (2 | ) | 4 |
| Accounts payable | 732 |
| | 734 |
| | 6 |
| | (8 | ) | 4 | 1,371 |
| | 1,412 |
| | (33 | ) | | (8 | ) | 4 |
| Accrued expenses | 132 |
| | 130 |
| | 2 |
| | — |
| | 121 |
| | 118 |
| | 3 |
| | — |
| |
| Accrued wages, salaries and employee benefits | 360 |
| | 364 |
| | (4 | ) | | — |
| | 962 |
| | 943 |
| | 19 |
| | — |
| |
| Customer advances | 234 |
| | 234 |
| | — |
| | — |
| | 358 |
| | 358 |
| | — |
| | — |
| |
| Other assets – net | (261 | ) | | (196 | ) | | (25 | ) | | (40 | ) | 4 | (137 | ) | | 18 |
| | (54 | ) | | (101 | ) | 4 |
| Other liabilities – net | (64 | ) | | (149 | ) | | 45 |
| | 40 |
| 4 | (373 | ) | | (581 | ) | | 107 |
| | 101 |
| 4 |
| Net cash provided by (used for) operating activities | 1,542 |
| | 1,524 |
| | 376 |
| | (358 | ) | | 5,165 |
| | 4,164 |
| | 1,025 |
| | (24 | ) | |
| | | | | | | | | | | | | | | | | |
| Cash flow from investing activities: | |
| | |
| | |
| | |
| | |
| | |
| | |
| | |
| |
| Capital expenditures - excluding equipment leased to others | (204 | ) | | (203 | ) | | (1 | ) | | — |
| | |
| Capital expenditures – excluding equipment leased to others | | (566 | ) | | (561 | ) | | (6 | ) | | 1 |
| 4 |
| Expenditures for equipment leased to others | (305 | ) | | (6 | ) | | (302 | ) | | 3 |
| 4 | (1,071 | ) | | (13 | ) | | (1,074 | ) | | 16 |
| 4 |
| Proceeds from disposals of leased assets and property, plant and equipment | 234 |
| | 41 |
| | 194 |
| | (1 | ) | 4 | 864 |
| | 142 |
| | 733 |
| | (11 | ) | 4 |
| Additions to finance receivables | (2,122 | ) | | — |
| | (2,535 | ) | | 413 |
| 5 | (8,246 | ) | | — |
| | (9,765 | ) | | 1,519 |
| 5 |
| Collections of finance receivables | 2,272 |
| | — |
| | 2,788 |
| | (516 | ) | 5 | 8,532 |
| | — |
| | 10,194 |
| | (1,662 | ) | 5 |
| Net intercompany purchased receivables | — |
| | — |
| | (459 | ) | | 459 |
| 5 | — |
| | — |
| | (161 | ) | | 161 |
| 5 |
| Proceeds from sale of finance receivables | 17 |
| | — |
| | 17 |
| | — |
| | 98 |
| | — |
| | 98 |
| | — |
| |
| Net intercompany borrowings | — |
| | 50 |
| | (1,500 | ) | | 1,450 |
| 6 | — |
| | 165 |
| | (1,000 | ) | | 835 |
| 6 |
| Investments and acquisitions (net of cash acquired) | (18 | ) | | (18 | ) | | — |
| | — |
| | (47 | ) | | (47 | ) | | — |
| | — |
| |
| Proceeds from sale of businesses and investments (net of cash sold) | | 93 |
| | 93 |
| | — |
| | — |
| |
| Proceeds from sale of securities | 89 |
| | 6 |
| | 83 |
| | — |
| | 431 |
| | 36 |
| | 395 |
| | — |
| |
| Investments in securities | (65 | ) | | (2 | ) | | (63 | ) | | — |
| | (594 | ) | | (165 | ) | | (429 | ) | | — |
| |
| Other – net | 9 |
| | (1 | ) | | 10 |
| | — |
| | 73 |
| | 50 |
| | 23 |
| | — |
| |
| Net cash provided by (used for) investing activities | (93 | ) | | (133 | ) | | (1,768 | ) | | 1,808 |
| | (433 | ) | | (300 | ) | | (992 | ) | | 859 |
| |
| | | | | | | | | | | | | | | | | |
| Cash flow from financing activities: | |
| | |
| | |
| | |
| | |
| | |
| | |
| | |
| |
| Dividends paid | (452 | ) | | (452 | ) | | — |
| | — |
| | (1,367 | ) | | (1,367 | ) | | — |
| | — |
| |
| Common stock issued, including treasury shares reissued | (19 | ) | | (19 | ) | | — |
| | — |
| | 353 |
| | 353 |
| | — |
| | — |
| |
| Net intercompany borrowings | — |
| | 1,500 |
| | (50 | ) | | (1,450 | ) | 6 | — |
| | 1,000 |
| | (165 | ) | | (835 | ) | 6 |
| Proceeds from debt issued (original maturities greater than three months) | 2,715 |
| | 360 |
| | 2,355 |
| | — |
| | 7,334 |
| | 362 |
| | 6,972 |
| | — |
| |
| Payments on debt (original maturities greater than three months) | (1,978 | ) | | (4 | ) | | (1,974 | ) | | — |
| | (6,224 | ) | | (506 | ) | | (5,718 | ) | | — |
| |
| Short-term borrowings – net (original maturities three months or less) | 618 |
| | 226 |
| | 392 |
| | — |
| | (2,403 | ) | | (196 | ) | | (2,207 | ) | | — |
| |
| Other – net | (6 | ) | | (6 | ) | | — |
| | — |
| | (7 | ) | | (7 | ) | | — |
| | — |
| |
| Net cash provided by (used for) financing activities | 878 |
| | 1,605 |
| | 723 |
| | (1,450 | ) | | (2,314 | ) | | (361 | ) | | (1,118 | ) | | (835 | ) | |
| Effect of exchange rate changes on cash | 9 |
| | 3 |
| | 6 |
| | — |
| | 40 |
| | 9 |
| | 31 |
| | — |
| |
| Increase (decrease) in cash and short-term investments and restricted cash | 2,336 |
| | 2,999 |
| | (663 | ) | | — |
| | 2,458 |
| | 3,512 |
| | (1,054 | ) | | — |
| |
| Cash and short-term investments and restricted cash at beginning of period | 7,199 |
| | 5,259 |
| | 1,940 |
| | — |
| | 7,199 |
| | 5,259 |
| | 1,940 |
| | — |
| |
| Cash and short-term investments and restricted cash at end of period | $ | 9,535 |
| | $ | 8,258 |
| | $ | 1,277 |
| | $ | — |
| | $ | 9,657 |
| | $ | 8,771 |
| | $ | 886 |
| | $ | — |
| |
| |
1 | Represents Caterpillar Inc. and its subsidiaries with Financial Products accounted for on the equity basis. |
| |
2 | Elimination of Financial Products' profit after tax due to equity method of accounting. |
| |
3 | Elimination of non-cash adjustment for the undistributed earnings from Financial Products. |
| |
4 | Elimination of non-cash adjustments and changes in assets and liabilities related to consolidated reporting. |
| |
5 | Reclassification of Financial Products' cash flow activity from investing to operating for receivables that arose from the sale of inventory. |
| |
6 | Elimination of net proceeds and payments to/from Machinery, Energy & Transportation and Financial Products. |
Forward-looking Statements
Certain statements in this Form 10-Q relate to future events and expectations and are forward-looking statements within the meaning of the Private Securities Litigation Reform Act of 1995. Words such as “believe,” “estimate,” “will be,” “will,” “would,” “expect,” “anticipate,” “plan,” “project,” “intend,” “could,” “should” or other similar words or expressions often identify forward-looking statements. All statements other than statements of historical fact are forward-looking statements, including, without limitation, statements regarding our outlook, projections, forecasts or trend descriptions. These statements do not guarantee future performance and speak only as of the date they are made, and we do not undertake to update our forward-looking statements.
Caterpillar’s actual results may differ materially from those described or implied in our forward-looking statements based on a number of factors, including, but not limited to: (i) global and regional economic conditions and economic conditions in the industries we serve; (ii) commodity price changes, material price increases, fluctuations in demand for our products or significant shortages of material; (iii) government monetary or fiscal policies; (iv) political and economic risks, commercial instability and events beyond our control in the countries in which we operate; (v) international trade policies and their impact on demand for our products and our competitive position, including the imposition of new tariffs or changes in existing tariff rates; (vi) our ability to develop, produce and market quality products that meet our customers’ needs; (vi)(vii) the impact of the highly competitive environment in which we operate on our sales and pricing; (vii)(viii) information technology security threats and computer crime; (viii)(ix) additional restructuring costs or a failure to realize anticipated savings or benefits from past or future cost reduction actions; (ix)(x) failure to realize all of the anticipated benefits from initiatives to increase our productivity, efficiency and cash flow and to reduce costs; (x)(xi) inventory management decisions and sourcing practices of our dealers and our OEM customers; (xi)(xii) a failure to realize, or a delay in realizing, all of the anticipated benefits of our acquisitions, joint ventures or divestitures; (xii)(xiii) union disputes or other employee relations issues; (xiii)(xiv) adverse effects of unexpected events including natural disasters; (xiv)(xv) disruptions or volatility in global financial markets limiting our sources of liquidity or the liquidity of our customers, dealers and suppliers; (xv)(xvi) failure to maintain our credit ratings and potential resulting increases to our cost of borrowing and adverse effects on our cost of funds, liquidity, competitive position and access to capital markets; (xvi)(xvii) our Financial Products segment’s risks associated with the financial services industry; (xvii)(xviii) changes in interest rates or market liquidity conditions; (xviii)(xix) an increase in delinquencies, repossessions or net losses of Cat Financial’s customers; (xix)(xx) currency fluctuations; (xx)(xxi) our or Cat Financial’s compliance with financial and other restrictive covenants in debt agreements; (xxi)(xxii) increased pension plan funding obligations; (xxii)(xxiii) alleged or actual violations of trade or anti-corruption laws and regulations; (xxiii) international trade policies and their impact on demand for our products and our competitive position; (xxiv) additional tax expense or exposure including the impact of U.S. tax reform; (xxv) significant legal proceedings, claims, lawsuits or government investigations; (xxvi) new regulations or changes in financial services regulations; (xxvii) compliance with environmental laws and regulations; and (xxviii) other factors described in more detail in Caterpillar’s Forms 10-Q, 10-K and other filings with the Securities and Exchange Commission.
Item 3. Quantitative and Qualitative Disclosures About Market Risk
The information required by this Item is incorporated by reference from Note 5 – “Derivative financial instruments and risk management” included in Part I, Item 1 and Management’s Discussion and Analysis included in Part I, Item 2 of this Form 10-Q.
Item 4. Controls and Procedures
Evaluation of disclosure controls and procedures
An evaluation was performed under the supervision and with the participation of the company’s management, including the Chief Executive Officer (CEO) and Chief Financial Officer (CFO), of the effectiveness of the design and operation of the company’s disclosure controls and procedures, as that term is defined in Rule 13a-15(e) under the Securities Exchange Act of 1934, as amended, as of the end of the period covered by this quarterly report. Based on that evaluation, the CEO and CFO concluded that the company’s disclosure controls and procedures arewere effective as of the end of the period covered by this quarterly report.
Changes in internal control over financial reporting
During the firstthird quarter of 2018, there has been no change in the company's internal control over financial reporting that has materially affected, or is reasonably likely to materially affect, the company’s internal control over financial reporting.
PART II. OTHER INFORMATION
Item 1. Legal Proceedings
The information required by this Item is incorporated by reference from Note 13 – "Environmental and legal matters" included in Part I, Item 1 of this Form 10-Q.
Item 2. Unregistered Sales of Equity Securities and Use of Proceeds
Issuer Purchases of Equity Securities
|
| | | | | | | | | | | | | | |
| Period | | Total Number of Shares Purchased | | Average Price Paid per Share | | Total Number of Shares Purchased Under the Program | | Approximate Dollar Value of Shares that may yet be Purchased under the Program (in billions)1 |
| January 1-31, 2018 | | — |
| | $ | — |
| | — |
| | $ | 5.475 |
|
| February 1-28, 2018 | | 3,147,629 |
| | $ | 158.85 |
| | 3,147,629 |
| | $ | 4.975 |
|
| March 1-31, 2018 | | — |
| | $ | — |
| | — |
| | $ | 4.975 |
|
| Total | | 3,147,629 |
| | $ | 158.85 |
| | 3,147,629 |
| | |
|
| | | | | | | | | |
1 In January 2014, the Board of Directors authorized the repurchase of up to $10.0 billion of Caterpillar common stock, which will expire on December 31, 2018 (the 2014 Authorization). As of March 31, 2018, approximately $5.0 billion remained available under the 2014 Authorization.
Share repurchases in the table above are reported based on the trade dates.
Other Purchases of Equity Securities
|
| | | | | | | | | | | |
| Period | | Total Number of Shares Purchased 1 | | Average Price Paid per Share | | Total Number of Shares Purchased Under the Program | | Approximate Dollar Value of Shares that may yet be Purchased under the Program |
| January 1-31, 2018 | | 11,050 |
| | $ | 158.28 |
| | N/A | | N/A |
| February 1-28, 2018 | | 51,764 |
| | $ | 153.19 |
| | N/A | | N/A |
| March 1-31, 2018 | | 281,323 |
| | $ | 150.25 |
| | N/A | | N/A |
| Total | | 344,137 |
| | $ | 150.95 |
| | | | |
| | | | | | | | | |
1 Represents shares delivered back to issuer for the payment of taxes resulting from the vesting of restricted stock units for employees and Directors.
|
| | | | | | | | | | | | | | |
| Period | | Total Number of Shares Purchased2 | | Average Price Paid per Share2 | | Total Number of Shares Purchased Under the Program | | Approximate Dollar Value of Shares that may yet be Purchased under the Program (in billions)1 |
| July 1-31, 2018 | | — |
| | $ | — |
| | — |
| | $ | 4.225 |
|
| August 1-31, 2018 | | 4,774,613 |
| | $ | 143.31 |
| | 4,774,613 |
| | $ | 3.543 |
|
| September 1-30, 2018 | | — |
| | $ | — |
| | — |
| | $ | 3.543 |
|
| Total | | 4,774,613 |
| | $ | 143.31 |
| | 4,774,613 |
| | |
| | | | | | | | | |
1 In January 2014, the Board of Directors authorized the repurchase of up to $10.0 billion of Caterpillar common stock, which will expire on December 31, 2018 (the 2014 Authorization). As of September 30, 2018, approximately $3.5 billion remained available under the 2014 Authorization. |
2 During the third quarter of 2018, we entered into an Accelerated Stock Repurchase Agreement (ASR) with a third-party financial institution to purchase $750 million of our common stock. In August 2018, upon payment of $750 million to the financial institution, we received 4.8 million shares. In October 2018, upon final settlement of the ASR, we received an additional 0.4 million shares. In total, we repurchased 5.2 million shares under this ASR at an average price per share of $143.31. |
| |
| Share repurchases in the table above are reported based on the trade dates. |
| | | | | | | | | |
Non-U.S. Employee Stock Purchase Plans
As of March 31,September 30, 2018, we had 2423 employee stock purchase plans (the "EIP Plans") that are administered outside the United States for our non-U.S. employees, which had approximately 12,000 active participants in the aggregate. During the firstthird quarter of 2018, approximately 86,00091,000 shares of Caterpillar common stock were purchased by the EIP Plans pursuant to the terms of such plans.
|
| | |
| 10.1 | | First AmendmentCredit Agreement (2018 364-Day Facility) dated September 6, 2018 among the Company, Caterpillar Financial Services Corporation, Caterpillar International Finance Designated Activity Company, Caterpillar Finance Kabushiki Kaisha, certain financial institutions named therein, Citibank N.A., as Agent, Citibank Europe plc, UK Branch, as Local Currency Agent, and MUFG Bank, LTD., as Japan Local Currency Agent (incorporated by reference from Exhibit 99.1 to Retention and Retirement Agreement between Caterpillar Inc. and Bradley M. Halverson dated February 19, 2018.the Company's Current Report on Form 8-K filed September 12, 2018). |
| | | |
| 10.2 | | Local Currency Addendum to the 2018 364-Day Facility dated September 6, 2018, among Caterpillar Inc. 2014 Long-Term Incentive Plan Restricted Stock Unit Award Notice dated March 5, 2018.Financial Services Corporation, Caterpillar International Finance Designated Activity Company, the Local Currency Banks named therein, Citibank, N.A., as Agent, and Citibank Europe plc, UK Branch, as Local Currency Agent (incorporated by reference from Exhibit 99.2 to the Company's Current Report on Form 8-K filed September 12, 2018). |
| | | |
| 10.3 | | Japan Local Currency Addendum to the 2018 364-Day Facility dated September 6, 2018, among Caterpillar Inc. 2014 Long-Term Incentive Plan Nonqualified Stock Option Award Notice dated March 5, 2018.Financial Services Corporation, Caterpillar Finance Kabushiki Kaisha, the Japan Local Currency Banks named therein, Citibank, N.A., as Agent, and MUFG Bank, Ltd., as Japan Local Currency Agent (incorporated by reference from Exhibit 99.3 to the Company's Current Report on Form 8-K filed September 12, 2018). |
| | | |
| 10.4 | | Omnibus Amendment No. 3 to the Amended and Restated Credit Agreement (Three-Year Facility), Amendment No. 2 to the Local Currency Addendum and Amendment No. 3 to the Japan Local Currency Addendum, dated September 10, 2018, among the Company, Caterpillar Financial Services Corporation, Caterpillar International Finance Designated Activity Company, Caterpillar Finance Kabushiki Kaisha, certain financial institutions named therein, Citibank N.A., as Agent, Citibank Europe plc, UK Branch, as Local Currency Agent, and MUFG Bank, LTD., as Japan Local Currency Agent (incorporated by reference from Exhibit 99.4 to the Company's Current Report on Form 8-K filed September 12, 2018). |
| | |
| 10.5 | | Omnibus Amendment No. 3 to the Amended and Restated Credit Agreement (Five-Year Facility), Amendment No. 2 to the Local Currency Addendum and Amendment No. 3 to the Japan Local Currency Addendum, dated September 10, 2018, among the Company, Caterpillar Financial Services Corporation, Caterpillar International Finance Designated Activity Company, Caterpillar Finance Kabushiki Kaisha, certain financial institutions named therein, Citibank N.A., as Agent, Citibank Europe plc, UK Branch, as Local Currency Agent, and MUFG Bank, LTD., as Japan Local Currency Agent (incorporated by reference from Exhibit 99.5 to the Company's Current Report on Form 8-K filed September 12, 2018). |
| | |
| 10.6 | | |
| | | |
| 11 | | Computations of Earnings per Share (included in Note 11 of this Form 10-Q filed for the quarter ended March 31,September 30, 2018). |
| | | |
| 31.1 | | |
| | | |
| 31.2 | | |
| | | |
| 32 | | |
| | | |
| 101.INS | | XBRL Instance Document |
| | | |
| 101.SCH | | XBRL Taxonomy Extension Schema Document |
| | | |
| 101.CAL | | XBRL Taxonomy Extension Calculation Linkbase Document |
| | | |
| 101.DEF | | XBRL Taxonomy Extension Definition Linkbase Document |
| | | |
| 101.LAB | | XBRL Taxonomy Extension Label Linkbase Document |
| | | |
| 101.PRE | | XBRL Taxonomy Extension Presentation Linkbase Document |
SIGNATURES
Pursuant to the requirements of the Securities Exchange Act of 1934, the Registrant has duly caused this report to be signed on its behalf by the undersigned thereunto duly authorized.
|
| | |
| | CATERPILLAR INC. | |
| | | |
| | | |
May 2,October 31, 2018 | /s/ D. James Umpleby, III | Chief Executive Officer |
| | (D. James Umpleby, III)III | |
| | | |
| | | |
May 2,October 31, 2018 | /s/ Bradley M. HalversonAndrew R.J. Bonfield | Group President and Chief Financial Officer |
| | (Bradley M. Halverson)Andrew R.J. Bonfield | |
| | | |
| | | |
May 2,October 31, 2018 | /s/ Suzette M. Long | General Counsel & Corporate Secretary |
| | (Suzette M. Long)Long | |
| | | |
| | | |
May 2,October 31, 2018 | /s/ Jananne A. Copeland | Chief Accounting Officer |
| | (Jananne A. Copeland)Copeland | |