UNITED STATES
SECURITIES AND EXCHANGE COMMISSION
WASHINGTON, D.C. 20549
FORM 10-Q
x ☒QUARTERLY REPORT PURSUANT TO SECTION 13 OR 15(d) OF THE SECURITIES EXCHANGE ACT OF 1934
For the Quarterly Period Ended September 30, 2017March 31, 2021
OR
¨ ☐TRANSITION REPORT PURSUANT TO SECTION 13 OR 15(d) OF THE SECURITIES EXCHANGE ACT OF 1934
For the Transition Period from to
COMMISSION FILE NUMBER: 000-16509
|
| |
| CITIZENS, INC. |
| (Exact name of registrant as specified in its charter) |
|
| |
Colorado | 84-0755371 |
(State or other jurisdiction of | (I.R.S. Employer |
incorporation or organization) | Identification No.) |
| |
2900 Esperanza Crossing, 2nd Floor | |
Austin, Texas | 78758 |
(Address of principal executive offices) | (Zip Code) |
|
| | |
| (Registrant's telephone number, including area code:) (512) 837-7100
| |
|
|
(Former name, former address and former fiscal year, if changed since last report:) 400 East Anderson Lane, Austin, TX
|
|
| | | | | |
| Colorado | 84-0755371 |
| (State or other jurisdiction of incorporation or organization) | (I.R.S. Employer Identification No.) |
11815 Alterra Pkwy, Floor 15, Austin, TX 78758
(Current Address)
Registrant's telephone number, including area code: (512) 837-7100
Indicate by check mark whether the registrant: (1) has filed all reports required | | | | | | | | |
Securities registered pursuant to be filed by Section 13 or 15(d)12(b) of the Securities Exchange Act of 1934 during the preceding 12 months (or for such shorter period that the registrant was required to file such reports), and (2) has been subject to such filing requirements for the past 90 days. x Yes o No |
|
Indicate by check mark whether the registrant has submitted electronically and posted on its corporate Web site, if any, every Interactive Data File required to be submitted and posted pursuant to Rule 405 of Regulation S-T (§232.405 of this chapter) during the preceding 12 months (or for such shorter period that the registrant was required to submit and post such files). x Yes o No
Class A Common Stock | CIA | NYSE |
|
Indicate by check mark whether the registrant is a large accelerated filer, an accelerated filer, a non-accelerated filer, a smaller reporting company or an emerging growth company. See the definition(Title of "large accelerated filer", "accelerated filer," "smaller reporting company" and "emerging growth company" in Rule 12b-2each class) | (Trading symbol(s)) | (Name of the Exchange Act. (Check one): |
| Large accelerated
filer ¨
| Accelerated
filer x
| Non-accelerated
filer ¨
| Smaller reporting
company ¨
| Emerging growth
company ¨
|
| | | | | |
If an emerging growth company, indicate by check mark if the registrant has elected not to use the extended transition period forcomplying with anyneworrevisedfinancialaccountingstandardsprovidedpursuanttoSection13(a)oftheExchangeAct. ¨
|
|
Indicate by check mark whether the registrant is a shell company (as defined in Rule 12b-2 of the Exchange Act). ¨ Yes x No
each exchange on which registered) |
Indicate by check mark whether the registrant: (1) has filed all reports required to be filed by Section 13 or 15(d) of the Securities Exchange Act of 1934 during the preceding 12 months (or for such shorter period that the registrant was required to file such reports), and (2) has been subject to such filing requirements for the past 90 days.x Yes oNo
Indicate by check mark whether the registrant has submitted electronically every Interactive Data File required to be submitted pursuant to Rule 405 of Regulation S-T (§232.405 of this chapter) during the preceding 12 months (or for such shorter period that the registrant was required to submit such files). xYes oNo
Indicate by check mark whether the registrant is a large accelerated filer, an accelerated filer, a non-accelerated filer, a smaller reporting company or an emerging growth company. See the definitions of "large accelerated filer," "accelerated filer," "smaller reporting company" and "emerging growth company" in Rule 12b-2 of the Exchange Act:
| | | | | | | | | | | |
| Large accelerated filer | ☐ | Accelerated filer | ☒ |
| Non-accelerated filer | ☐ | Smaller reporting company | ☐ |
| | Emerging growth company | ☐ |
If an emerging growth company, indicate by check mark if the registrant has elected not to use the extended transition period for complying with any new or revised financial accounting standards provided pursuant to Section 13(a) of the Exchange Act. o
Indicate by check mark whether the registrant is a shell company (as defined in Rule 12b-2 of the Exchange Act). ☐ Yes x No
As of November 2, 2017,April 30, 2021, the Registrant had 49,080,11449,603,606 shares of Class A common stock no par value, outstanding and 1,001,7140 shares of Class B common stock outstanding.
THIS PAGE INTENTIONALLY LEFT BLANK
TABLE OF CONTENTS
| | | | | | | | | | | |
| | | Page Number |
| Part I. FINANCIAL INFORMATION | |
| | | |
| | | Page Number |
Part I. | Financial Information | |
| Item 1. | | |
| | | |
| | | |
| | | |
| | | |
| | | |
| | | |
| | | |
| | | |
| | | |
| | | |
| | | |
| | | |
| | | |
| Item 2. | | |
| | | |
| Item 3. | | |
| | | |
| Item 4. | | |
| | | |
| Part II. OTHER INFORMATION | Other Information | |
| | | |
| Item 1. | | |
| | | |
| Item 1A. | | |
| | | |
| Item 2. | | |
| | | |
| Item 3. | | |
| | | |
| Item 4. | | |
| | | |
| Item 5. | | |
| | | |
| Item 6. | | |
PART I. FINANCIAL INFORMATION
Item 1.1. FINANCIAL STATEMENTS
CITIZENS, INC. AND CONSOLIDATED SUBSIDIARIES Consolidated Statements of Financial Position (In thousands) (Unaudited) |
| | | | | | |
| | | | |
| | | | |
| | September 30, 2017 | | December 31, 2016 |
| Assets | | | |
| Investments: | | | |
| Fixed maturities available-for-sale, at fair value (cost: $920,700 and $860,473 in 2017 and 2016, respectively) | $ | 955,244 |
| | 881,668 |
|
| Fixed maturities held-to-maturity, at amortized cost (fair value: $244,064 and $252,545 in 2017 and 2016, respectively) | 236,353 |
| | 247,004 |
|
| Equity securities available-for-sale, at fair value (cost: $15,479 and $17,765 in 2017 and 2016, respectively) | 16,146 |
| | 18,159 |
|
| Mortgage loans on real estate | 197 |
| | 232 |
|
| Policy loans | 71,215 |
| | 66,672 |
|
| Real estate held for investment (less $1,158 and $1,083 accumulated depreciation in 2017 and 2016, respectively) | 5,843 |
| | 5,919 |
|
| Real estate held for sale (less $1,008 accumulated depreciation in 2016) | — |
| | 1,939 |
|
| Other long-term investments | 37 |
| | 38 |
|
| Short-term investments | — |
| | 508 |
|
| Total investments | 1,285,035 |
| | 1,222,139 |
|
| Cash and cash equivalents | 45,000 |
| | 35,510 |
|
| Accrued investment income | 18,243 |
| | 17,903 |
|
| Reinsurance recoverable | 3,917 |
| | 3,862 |
|
| Deferred policy acquisition costs | 166,567 |
| | 167,790 |
|
| Cost of customer relationships acquired | 18,012 |
| | 19,415 |
|
| Goodwill | 17,255 |
| | 17,255 |
|
| Other intangible assets | 963 |
| | 966 |
|
| Deferred tax asset | 74,974 |
| | 76,869 |
|
| Property and equipment, net | 8,396 |
| | 7,890 |
|
| Due premiums, net (less $1,399 and $1,600 allowance for doubtful accounts in 2017 and 2016, respectively) | 10,905 |
| | 12,852 |
|
| Prepaid expenses | 938 |
| | 299 |
|
| Other assets | 1,069 |
| | 918 |
|
| Total assets | $ | 1,651,274 |
| | 1,583,668 |
|
Consolidated Balance Sheets
(Continued) | | | | | | | | | | | |
| | | |
| | | |
| (In thousands) | March 31, 2021 | | December 31, 2020 |
| Assets | (Unaudited) | | |
| Investments: | | | |
| Fixed maturity securities available-for-sale, at fair value (amortized cost: $1,332,632 and $1,321,487 in 2021 and 2020, respectively) | $ | 1,420,587 | | | 1,489,383 | |
| | | |
| Equity securities, at fair value | 22,366 | | | 22,102 | |
| | | |
| Policy loans | 82,674 | | | 83,318 | |
| | | |
| Real estate held-for-sale | 2,571 | | | 2,571 | |
| Other long-term investments (portion measured at fair value $16,982 and $11,923 in 2021 and 2020, respectively; less allowance for losses of $11 in 2021 and 2020) | 17,347 | | | 27,294 | |
| | | |
| Total investments | 1,545,545 | | | 1,624,668 | |
| Cash and cash equivalents | 19,493 | | | 34,131 | |
| Accrued investment income | 15,862 | | | 16,137 | |
| Receivable for securities | 2,808 | | | 0 | |
| Reinsurance recoverable | 4,343 | | | 5,753 | |
| Deferred policy acquisition costs | 128,914 | | | 104,913 | |
| Cost of insurance acquired | 11,443 | | | 11,541 | |
| Goodwill and other intangible assets | 13,569 | | | 13,570 | |
| | | |
| | | |
| Property and equipment, net | 15,684 | | | 16,312 | |
| Due premiums | 9,538 | | | 11,309 | |
| | | |
| Other assets (less allowance for losses of $304 and $297 in 2021 and 2020, respectively) | 14,454 | | | 5,086 | |
| Total assets | $ | 1,781,653 | | | 1,843,420 | |
See accompanying notesNotes to consolidated financial statements.
Consolidated Financial Statements.
CITIZENS, INC. AND CONSOLIDATED SUBSIDIARIES Consolidated Statements of Financial Position (In thousands, except share amounts) (Unaudited) |
| | | | | | |
| | | | |
| | | | |
| | September 30, 2017 | | December 31, 2016 |
| Liabilities and Stockholders' Equity | | | |
| Liabilities: | | | |
| Policy liabilities: | | | |
| Future policy benefit reserves: | | | |
| Life insurance | $ | 1,110,486 |
| | 1,060,297 |
|
| Annuities | 72,825 |
| | 69,003 |
|
| Accident and health | 978 |
| | 1,022 |
|
| Dividend accumulations | 23,016 |
| | 20,897 |
|
| Premiums paid in advance | 52,516 |
| | 48,198 |
|
| Policy claims payable | 8,066 |
| | 9,538 |
|
| Other policyholders' funds | 8,398 |
| | 7,744 |
|
| Total policy liabilities | 1,276,285 |
| | 1,216,699 |
|
| Commissions payable | 2,343 |
| | 3,540 |
|
| Federal income tax payable | 83,802 |
| | 81,270 |
|
| Payable for securities in process of settlement | 3,735 |
| | 3,061 |
|
| Other liabilities | 20,888 |
| | 29,998 |
|
| Total liabilities | 1,387,053 |
| | 1,334,568 |
|
| Commitments and contingencies (Note 8) |
|
| |
|
|
| Stockholders' equity: | |
| | |
|
| Class A, no par value, 100,000,000 shares authorized, 52,215,852 shares issued and outstanding in 2017 and 2016, including shares in treasury of 3,135,738 in 2017 and 2016 | 259,383 |
| | 259,383 |
|
| Class B, no par value, 2,000,000 shares authorized, 1,001,714 shares issued and outstanding in 2017 and 2016 | 3,184 |
| | 3,184 |
|
| Accumulated deficit | (10,171 | ) | | (16,248 | ) |
| Accumulated other comprehensive income: | |
| | |
|
| Unrealized gains on securities, net of tax | 22,836 |
| | 13,792 |
|
| Treasury stock, at cost | (11,011 | ) | | (11,011 | ) |
| Total stockholders' equity | 264,221 |
| | 249,100 |
|
| Total liabilities and stockholders' equity | $ | 1,651,274 |
| | 1,583,668 |
|
CITIZENS, INC. AND CONSOLIDATED SUBSIDIARIES
Consolidated Balance Sheets, Continued
| | | | | | | | | | | |
| | | |
| (In thousands, except share amounts) | March 31, 2021 | | December 31, 2020 |
| Liabilities and Stockholders' Equity | (Unaudited) | | |
| Liabilities: | | | |
| Policy liabilities: | | | |
| Future policy benefit reserves: | | | |
| Life insurance | $ | 1,250,930 | | | 1,246,423 | |
| Annuities | 81,003 | | | 78,304 | |
| Accident and health | 785 | | | 761 | |
| Dividend accumulations | 33,997 | | | 33,336 | |
| Premiums paid in advance | 41,639 | | | 40,605 | |
| Policy claims payable | 13,398 | | | 13,206 | |
| Other policyholders' funds | 25,088 | | | 22,447 | |
| Total policy liabilities | 1,446,840 | | | 1,435,082 | |
| Commissions payable | 2,192 | | | 2,572 | |
| Current federal income tax payable | 45,173 | | | 43,916 | |
| Deferred federal income tax payable | 9,717 | | | 9,564 | |
| Payable for securities in process of settlement | 2,075 | | | 5,265 | |
| Other liabilities | 34,816 | | | 46,076 | |
| Total liabilities | 1,540,813 | | | 1,542,475 | |
Commitments and contingencies (Note 7) | 0 | | 0 |
| Stockholders' Equity: | | | |
| Common stock: | | | |
| Class A, 0 par value, 100,000,000 shares authorized, 52,694,778 and 52,654,016 shares issued and outstanding in 2021 and 2020, respectively, including shares in treasury of 3,135,738 in 2021 and 2020 | 262,855 | | | 262,869 | |
| Class B, 0 par value, 2,000,000 shares authorized, 1,001,714 shares issued and outstanding in 2021 and 2020 | 3,184 | | | 3,184 | |
| Accumulated deficit | (85,925) | | | (82,352) | |
| Accumulated other comprehensive income: | | | |
| Net unrealized gains (losses) on fixed maturity securities, net of tax | 71,737 | | | 128,255 | |
| Treasury stock, at cost | (11,011) | | | (11,011) | |
| Total stockholders' equity | 240,840 | | | 300,945 | |
| Total liabilities and stockholders' equity | $ | 1,781,653 | | | 1,843,420 | |
See accompanying notesNotes to consolidated financial statements.Consolidated Financial Statements.
CITIZENS, INC. AND CONSOLIDATED SUBSIDIARIES
Consolidated Statements of Operations and Comprehensive Income
Three Months Ended September 30,
(In thousands, except per share amounts) (Loss)
(Unaudited)
| | | | | | | | | | | | | | Three Months Ended March 31, |
| | 2017 | | 2016 | |
| (In thousands, except per share amounts) | | (In thousands, except per share amounts) | | | 2021 | | 2020 |
| Revenues: | | | | Revenues: | | | | |
| Premiums: | | | | | | Premiums: | | | | | |
| Life insurance | | | $ | 48,644 |
| | | | 47,513 |
| Life insurance | | | $ | 37,642 | | | 39,946 | |
| Accident and health insurance | | | 360 |
| | | | 385 |
| Accident and health insurance | | | 343 | | | 261 | |
| Property insurance | | | 1,243 |
| | | | 1,274 |
| Property insurance | | | 1,047 | | | 1,110 | |
| Net investment income | | | 13,828 |
| | | | 12,320 |
| Net investment income | | | 15,244 | | | 15,169 | |
| Realized investment gains (losses), net | | | (404 | ) | | | | 46 |
| Realized investment gains (losses), net | | | 292 | | | (1,306) | |
| Other income | | | 660 |
| | | | 203 |
| Other income | | | 915 | | | 542 | |
| Total revenues | | | 64,331 |
| | | | 61,741 |
| Total revenues | | | 55,483 | | | 55,722 | |
| Benefits and expenses: | | | |
| | | | |
| |
| Benefits and Expenses: | | Benefits and Expenses: | | | | | |
| Insurance benefits paid or provided: | | | | | | | | Insurance benefits paid or provided: | | | | | |
| Claims and surrenders | | | 21,454 |
| | | | 21,014 |
| Claims and surrenders | | | 30,589 | | | 26,449 | |
| Increase in future policy benefit reserves | | | 19,597 |
| | | | 18,997 |
| Increase in future policy benefit reserves | | | 5,232 | | | 9,471 | |
| Policyholders' dividends | | | 1,613 |
| | | | 1,620 |
| Policyholders' dividends | | | 1,306 | | | 1,233 | |
| Total insurance benefits paid or provided | | | 42,664 |
| | | | 41,631 |
| Total insurance benefits paid or provided | | | 37,127 | | | 37,153 | |
| Commissions | | | 10,801 |
| | | | 10,852 |
| Commissions | | | 8,157 | | | 7,853 | |
| Other general expenses | | | 7,254 |
| | | | 4,992 |
| Other general expenses | | | 11,382 | | | 11,473 | |
| Capitalization of deferred policy acquisition costs | | | (7,756 | ) | | | | (7,890 | ) | Capitalization of deferred policy acquisition costs | | | (4,985) | | | (5,009) | |
| Amortization of deferred policy acquisition costs | | | 7,623 |
| | | | 6,908 |
| Amortization of deferred policy acquisition costs | | | 6,183 | | | 6,119 | |
| Amortization of cost of customer relationships acquired | | | 635 |
| | | | 641 |
| |
| Amortization of cost of insurance acquired | | Amortization of cost of insurance acquired | | | 367 | | | 368 | |
| Total benefits and expenses | | | 61,221 |
| | | | 57,134 |
| Total benefits and expenses | | | 58,231 | | | 57,957 | |
| Income before federal income tax | | | 3,110 |
| | | | 4,607 |
| |
| Income (loss) before federal income tax | | Income (loss) before federal income tax | | | (2,748) | | | (2,235) | |
| Federal income tax expense (benefit) | | | (339 | ) | | | | 1,845 |
| Federal income tax expense (benefit) | | | 825 | | | 1,349 | |
| Net income | | | 3,449 |
| | | | 2,762 |
| |
| Net income (loss) | | Net income (loss) | | | (3,573) | | | (3,584) | |
| Per Share Amounts: | | | |
| | |
| | |
| Per Share Amounts: | | | | | |
| Basic earnings per share of Class A common stock | $ | 0.07 |
| | |
| | 0.06 |
| | |
| |
| Basic earnings per share of Class B common stock | 0.03 |
| | |
| | 0.03 |
| | |
| |
| Diluted earnings per share of Class A common stock | 0.07 |
| | |
| | 0.06 |
| | |
| |
| Diluted earnings per share of Class B common stock | 0.03 |
| | |
| | 0.03 |
| | |
| |
| Other comprehensive income: | | | |
| | |
| | |
| |
| Unrealized gains (losses) on available-for-sale securities: | |
| | |
| | |
| | |
| |
| Unrealized holding gains (losses) arising during period | |
| | 3,875 |
| | |
| | (1,261 | ) | |
| Reclassification adjustment for gains (losses) included in net income | |
| | 370 |
| | |
| | (47 | ) | |
| Unrealized gains (losses) on available-for-sale securities, net | |
| | 4,245 |
| | |
| | (1,308 | ) | |
| Income tax expense (benefit) on unrealized gains (losses) on available-for-sale securities | |
| | 1,486 |
| | |
| | (458 | ) | |
| Other comprehensive income (loss) | |
| | 2,759 |
| | |
| | (850 | ) | |
| Comprehensive income | |
| | $ | 6,208 |
| | |
| | 1,912 |
| |
| | | | | | | | | |
| Basic and diluted earnings (losses) per share of Class A common stock | | Basic and diluted earnings (losses) per share of Class A common stock | | | (0.07) | | | (0.07) | |
| Basic and diluted earnings (losses) per share of Class B common stock | | Basic and diluted earnings (losses) per share of Class B common stock | | | (0.04) | | | (0.04) | |
| Other Comprehensive Income (Loss): | | Other Comprehensive Income (Loss): | | | | | |
| Unrealized losses on fixed maturity securities: | | Unrealized losses on fixed maturity securities: | | | | | |
| Unrealized holding losses arising during period | | Unrealized holding losses arising during period | | | (55,898) | | | (42,929) | |
| Reclassification adjustment for losses (gains) included in net income (loss) | | Reclassification adjustment for losses (gains) included in net income (loss) | | | (35) | | | 132 | |
| Unrealized losses on fixed maturity securities, net | | Unrealized losses on fixed maturity securities, net | | | (55,933) | | | (42,797) | |
| Income tax expense (benefit) on unrealized losses on fixed maturity securities | | Income tax expense (benefit) on unrealized losses on fixed maturity securities | | | 585 | | | (2,727) | |
| Other comprehensive loss | | Other comprehensive loss | | | (56,518) | | | (40,070) | |
| Total comprehensive loss | | Total comprehensive loss | | | $ | (60,091) | | | (43,654) | |
CITIZENS, INC. AND CONSOLIDATED SUBSIDIARIES Consolidated Statements of Comprehensive Income Nine Months Ended September 30, (In thousands, except per share amounts) (Unaudited)
|
| | | | | | | | | | | | | |
| | 2017 | | 2016 |
| Revenues: | | | | | |
| Premiums: | | | | | | | |
| Life insurance | | | $ | 138,603 |
| | | | 137,637 |
|
| Accident and health insurance | | | 1,033 |
| | | | 1,170 |
|
| Property insurance | | | 3,731 |
| | | | 3,811 |
|
| Net investment income | | | 39,640 |
| | | | 36,051 |
|
| Realized investment gains (losses), net | | | 742 |
| | | | (1,776 | ) |
| Other income | | | 1,015 |
| | | | 610 |
|
| Total revenues | | | 184,764 |
| | | | 177,503 |
|
| Benefits and expenses: | | | |
| | | | |
|
| Insurance benefits paid or provided: | | | |
| | | | |
|
| Claims and surrenders | | | 62,130 |
| | | | 60,988 |
|
| Increase in future policy benefit reserves | | | 51,953 |
| | | | 52,095 |
|
| Policyholders' dividends | | | 4,418 |
| | | | 4,985 |
|
| Total insurance benefits paid or provided | | | 118,501 |
| | | | 118,068 |
|
| Commissions | | | 30,620 |
| | | | 31,097 |
|
| Other general expenses | | | 26,765 |
| | | | 22,732 |
|
| Capitalization of deferred policy acquisition costs | | | (21,540 | ) | | | | (22,257 | ) |
| Amortization of deferred policy acquisition costs | | | 22,640 |
| | | | 20,418 |
|
| Amortization of cost of customer relationships acquired | | | 1,629 |
| | | | 1,588 |
|
| Total benefits and expenses | | | 178,615 |
| | | | 171,646 |
|
| Income before federal income tax | | | 6,149 |
| | | | 5,857 |
|
| Federal income tax expense | | | 72 |
| | | | 4,004 |
|
| Net income | | | 6,077 |
| | | | 1,853 |
|
| Per Share Amounts: | | | |
| | |
| | |
|
| Basic earnings per share of Class A common stock | $ | 0.12 |
| | |
| | 0.04 |
| | |
|
| Basic earnings per share of Class B common stock | 0.06 |
| | |
| | 0.02 |
| | |
|
| Diluted earnings per share of Class A common stock | 0.12 |
| | |
| | 0.04 |
| | |
|
| Diluted earnings per share of Class B common stock | 0.06 |
| | |
| | 0.02 |
| | |
|
| Other comprehensive income: | |
| | |
| | |
| | |
|
| Unrealized gains on available-for-sale securities: | |
| | |
| | |
| | |
|
| Unrealized holding gains arising during period | |
| | 13,585 |
| | |
| | 26,446 |
|
| Reclassification adjustment for losses included in net income | |
| | 329 |
| | |
| | 1,769 |
|
| Unrealized gains on available-for-sale securities, net | |
| | 13,914 |
| | |
| | 28,215 |
|
| Income tax expense on unrealized gains on available-for-sale securities | |
| | 4,870 |
| | |
| | 9,875 |
|
| Other comprehensive income | |
| | 9,044 |
| | |
| | 18,340 |
|
| Comprehensive income | |
| | $ | 15,121 |
| | |
| | 20,193 |
|
See accompanying notesNotes to consolidated financial statements.Consolidated Financial Statements.
CITIZENS, INC. AND CONSOLIDATED SUBSIDIARIES Consolidated Statements of Cash Flows Nine Months Ended September 30, (In thousands) (Unaudited) |
| | | | | | |
| | 2017 | | 2016 |
| Cash flows from operating activities: | | | |
| Net income | $ | 6,077 |
| | 1,853 |
|
| Adjustments to reconcile net income to net cash provided by operating activities: | |
| | |
|
| Realized (gains) losses on sale of investments and other assets | (742 | ) | | 1,776 |
|
| Net deferred policy acquisition costs | 1,100 |
| | (1,833 | ) |
| Amortization of cost of customer relationships acquired | 1,629 |
| | 1,588 |
|
| Depreciation | 763 |
| | 600 |
|
| Amortization of premiums and discounts on investments | 12,398 |
| | 10,709 |
|
| Deferred federal income tax benefit | (2,975 | ) | | (6,616 | ) |
| Change in: | |
| | |
|
| Accrued investment income | (340 | ) | | (1,333 | ) |
| Reinsurance recoverable | (55 | ) | | 484 |
|
| Due premiums | 1,947 |
| | 882 |
|
| Future policy benefit reserves | 51,876 |
| | 51,559 |
|
| Other policyholders' liabilities | 5,619 |
| | 3,241 |
|
| Federal income tax payable | 2,532 |
| | 7,254 |
|
| Commissions payable and other liabilities | (10,307 | ) | | (317 | ) |
| Other, net | (663 | ) | | (670 | ) |
| Net cash provided by operating activities | 68,859 |
| | 69,177 |
|
| Cash flows from investing activities: | |
| | |
|
| Sale of fixed maturities, available-for-sale | 508 |
| | — |
|
| Maturities and calls of fixed maturities, available-for-sale | 65,456 |
| | 44,301 |
|
| Maturities and calls of fixed maturities, held-to-maturity | 7,685 |
| | 9,790 |
|
| Purchase of fixed maturities, available-for-sale | (135,538 | ) | | (165,539 | ) |
| Purchase of fixed maturities, held-to-maturity | — |
| | (5,507 | ) |
| Sale of equity securities, available-for-sale | 1,940 |
| | 403 |
|
| Calls of equity securities, available-for-sale | 450 |
| | 422 |
|
| Principal payments on mortgage loans | 35 |
| | 357 |
|
| Increase in policy loans, net | (4,543 | ) | | (4,548 | ) |
| Sale of other long-term investments and real estate | 3,040 |
| | 1 |
|
| Purchase of other long-term investments | — |
| | (36 | ) |
| Sale of property and equipment | 41 |
| | 59 |
|
| Purchase of property and equipment | (1,223 | ) | | (978 | ) |
| Maturity of short-term investments | 500 |
| | 250 |
|
| Purchase of short-term investments | — |
| | (522 | ) |
| Net cash used in investing activities | (61,649 | ) | | (121,547 | ) |
| | | | |
CITIZENS, INC. AND CONSOLIDATED SUBSIDIARIES Consolidated Statements of Cash Flows, Continued Nine Months Ended September 30, (In thousands) (Unaudited) |
| | | | | | |
| | 2017 | | 2016 |
| Cash flows from financing activities: | | | |
| Annuity deposits | $ | 7,240 |
| | 6,243 |
|
| Annuity withdrawals | (4,960 | ) | | (4,438 | ) |
| Net cash provided by financing activities | 2,280 |
| | 1,805 |
|
| Net increase (decrease) in cash and cash equivalents | 9,490 |
| | (50,565 | ) |
| Cash and cash equivalents at beginning of year | 35,510 |
| | 82,827 |
|
| Cash and cash equivalents at end of period | $ | 45,000 |
| | 32,262 |
|
| Supplemental disclosures of operating activities: | |
| | |
|
| Cash paid during the period for income taxes, net | $ | 515 |
| | 2,234 |
|
Supplemental Disclosures of Non-Cash Activities:
None.
See accompanying notes to consolidated financial statements.
CITIZENS, INC. AND CONSOLIDATED SUBSIDIARIES
Consolidated Statements of Stockholders' Equity
(Unaudited)
| | | | | | | | | | | | | | | | | | | | | | | | | | | | | | | | | | | |
| | | | | | | | | | | |
| | | | | | | | | | | |
| | Common Stock | | Accumulated
deficit | | Accumulated other
comprehensive
income (loss) | | Treasury
stock | | Total
Stock-holders'
equity |
| (In thousands) | Class A | | Class B | | | | |
| | | | | | | | | | |
| Balance at December 31, 2020 | $ | 262,869 | | | 3,184 | | | (82,352) | | | 128,255 | | | (11,011) | | | 300,945 | |
| Comprehensive income (loss): | | | | | | | | | | | |
| Net income (loss) | 0 | | | 0 | | | (3,573) | | | 0 | | | 0 | | | (3,573) | |
| Unrealized investment gains (losses), net | 0 | | | 0 | | | 0 | | | (56,518) | | | 0 | | | (56,518) | |
| Total comprehensive income (loss) | 0 | | | 0 | | | (3,573) | | | (56,518) | | | 0 | | | (60,091) | |
| Stock-based compensation | (14) | | | 0 | | | 0 | | | 0 | | | 0 | | | (14) | |
| Balance at March 31, 2021 | $ | 262,855 | | | 3,184 | | | (85,925) | | | 71,737 | | | (11,011) | | | 240,840 | |
| | | | | | | | | | | |
| | | | | | | | | | | |
| | | | | | | | | | | |
| | | | | | | | | | | |
| | | | | | | | | | | |
| | | | | | | | | | | |
| | | | | | | | | | | |
| | | | | | | | | | | |
| | | | | | | | | | | |
| | | | | | | | | | | |
| | | | | | | | | | | |
| | | | | | | | | | | |
| | | | | | | | | | | | | | | | | | | | | | | | | | | | | | | | | | | |
| | | | | | | | | | | |
| | | | | | | | | | | |
|
|
|
| | | | | | | | | | | |
| | | | | | | | | |
| | | | | | | |
| | | | | | | | | | |
| Balance at December 31, 2019 | $ | 261,515 | | | 3,184 | | | (70,969) | | | 77,117 | | | (11,011) | | | 259,836 | |
| Accounting standards adopted January 1, 2020 | 0 | | | 0 | | | (395) | | | 0 | | | 0 | | | (395) | |
| Comprehensive income (loss): | | | | | | | | | | | |
| Net income (loss) | 0 | | | 0 | | | (3,584) | | | 0 | | | 0 | | | (3,584) | |
| Unrealized investment gains (losses), net | 0 | | | 0 | | | 0 | | | (40,070) | | | 0 | | | (40,070) | |
| Total comprehensive income (loss) | 0 | | | 0 | | | (3,584) | | | (40,070) | | | 0 | | | (43,654) | |
| Stock-based compensation | (53) | | | 0 | | | 0 | | | 0 | | | 0 | | | (53) | |
| Balance at March 31, 2020 | $ | 261,462 | | | 3,184 | | | (74,948) | | | 37,047 | | | (11,011) | | | 215,734 | |
| | | | | | | | | | | |
| | | | | | | | | | | |
| | | | | | | | | | | |
| | | | | | | | | | | |
| | | | | | | | | | | |
| | | | | | | | | | | |
| | | | | | | | | | | |
| | | | | | | | | | | |
| | | | | | | | | | | |
| | | | | | | | | | | |
| | | | | | | | | | | |
| | | | | | | | | | | |
| | | | | | | | | | | |
| | | | | | | | | | | |
| | | | | | | | | | | |
| | | | | | | | | | | |
| | | | | | | | | | | |
| | | | | | | | | | | |
| | | | | | | | | | | |
See accompanying Notes to Consolidated Financial StatementsStatements.
September 30, 2017
CITIZENS, INC. AND CONSOLIDATED SUBSIDIARIES
Consolidated Statements of Cash Flows
(Unaudited)
| | | | | | | | | | | |
Three Months Ended March 31, (In thousands) | 2021 | | 2020 |
| Cash flows from operating activities: | | | |
| Net income (loss) | $ | (3,573) | | | (3,584) | |
| Adjustments to reconcile net gain (loss) to net cash provided by operating activities: | | | |
| Realized investment (gains) losses on sale of investments and other assets | (292) | | | 1,306 | |
| Net deferred policy acquisition costs | 1,198 | | | 1,110 | |
| Amortization of cost of insurance acquired | 367 | | | 368 | |
| Depreciation | 308 | | | 70 | |
| Amortization of premiums and discounts on investments | 1,323 | | | 2,393 | |
| Stock-based compensation | 76 | | | 193 | |
| Deferred federal income tax expense (benefit) | (432) | | | (280) | |
| Change in: | | | |
| Accrued investment income | 275 | | | 348 | |
| Reinsurance recoverable | 1,410 | | | 444 | |
| Due premiums | 1,771 | | | 1,045 | |
| Future policy benefit reserves | 5,185 | | | 9,414 | |
| Other policyholders' liabilities | 4,528 | | | 2,318 | |
| Federal income tax payable | 1,257 | | | 1,850 | |
| Commissions payable and other liabilities | (11,317) | | | (2,865) | |
| Other, net | (275) | | | (37) | |
| Net cash provided by (used in) operating activities | 1,809 | | | 14,093 | |
| Cash flows from investing activities: | | | |
| Purchases of fixed maturity securities, available-for-sale | (37,294) | | | (65,714) | |
| Sales of fixed maturity securities, available-for-sale | 4,445 | | | 940 | |
| Maturities and calls of fixed maturity securities, available-for-sale | 14,376 | | | 44,612 | |
| Purchases of equity securities | 0 | | | (4,473) | |
| Principal payments on mortgage loans | 4 | | | 4 | |
| (Increase) decrease in policy loans, net | 644 | | | 676 | |
| Sales of other long-term investments and real estate | 15,089 | | | 0 | |
| Purchases of other long-term investments | (4,619) | | | (2,810) | |
| | | |
| Purchases of property and equipment | (15) | | | (5) | |
| Maturities of short-term investments | 0 | | | 650 | |
| Purchases of short-term investments | 0 | | | (45) | |
| | | |
| | | |
| Net cash provided by (used in) investing activities | (7,370) | | | (26,165) | |
| | | |
| See accompanying Notes to Consolidated Financial Statements. |
| | | |
| | | | | | | | | | | |
| CITIZENS, INC. AND CONSOLIDATED SUBSIDIARIES |
| Consolidated Statements of Cash Flows, Continued |
| (Unaudited) |
| | | |
| | | |
Three Months Ended March 31, (In thousands) | 2021 | | 2020 |
| Cash flows from financing activities: | | | |
| Annuity deposits | $ | 2,431 | | | 1,618 | |
| Annuity withdrawals | (2,329) | | | (561) | |
| Purchase of treasury stock | (9,090) | | | 0 | |
| Other | (89) | | | (246) | |
| Net cash provided by (used in) financing activities | (9,077) | | | 811 | |
| Net increase (decrease) in cash and cash equivalents | (14,638) | | | (11,261) | |
| Cash and cash equivalents at beginning of year | 34,131 | | | 46,205 | |
| Cash and cash equivalents at end of period | $ | 19,493 | | | 34,944 | |
| | | |
| | | |
| | | |
| | | |
| | | |
| | | |
| | | |
SUPPLEMENTAL DISCLOSURES OF NONCASH INVESTING AND FINANCING ACTIVITIES:
During the three months ended March 31, 2021 and 2020, various fixed maturity issuers exchanged securities with book values of $2.0 million and $3.1 million, respectively, for securities of equal value.
The Company accrued purchases of property and equipment of $0.8 million as of March 31, 2021, which is reflected in other liabilities on the consolidated Balance Sheets and recorded NaN as of March 31, 2020.
The Company had $0.7 million net unsettled security trades at March 31, 2021 and $3.4 million at March 31, 2020.
See accompanying Notes to Consolidated Financial Statements.
| | | | | | | | |
CITIZENS, INC. | NOTES TO CONSOLIDATED FINANCIAL STATEMENTS |
| | (Unaudited) |
(1) Financial StatementsFINANCIAL STATEMENTS
Basis of Presentation and ConsolidationBASIS OF PRESENTATION AND CONSOLIDATION
The consolidated financial statements include the accounts and operations of Citizens, Inc. ("Citizens" or the "Company"), a Colorado corporation, and its wholly-owned subsidiaries, CICA Life Insurance Company of America ("CICA"), CICA Life Ltd. ("CICA Ltd."), Citizens National Life Insurance Company ("CNLIC"), Security Plan Life Insurance Company ("SPLIC"), Security Plan Fire Insurance Company ("SPFIC"), Citizens National Life Insurance Company ("CNLIC"), Magnolia Guaranty Life Insurance Company ("MGLIC"), and Computing Technology, Inc. ("CTI"), Insurance Investors, Inc. ("III"). All significant inter-company accounts and CICA Life Ltd.interactions have been eliminated. Citizens and its wholly-owned subsidiaries are collectively referred to as "the Company," "we,"the "Company", "we", "us" or "our.""our".
The consolidated statement of financial positionbalance sheets as of September 30, 2017,March 31, 2021 and the consolidated statements of operations and comprehensive income for the three and nine months ended September 30, 2017 and 2016(loss), stockholders' equity and cash flows for the nine-month periodsthree months ended September 30, 2017March 31, 2021 and 2016,March 31, 2020 have been prepared by the Company without audit. In the opinion of management, all normal and recurring adjustments to present fairly the financial position, results of operations, and changes in cash flows at September 30, 2017March 31, 2021 and for comparative periods have been made. The consolidated financial statements have been prepared in accordance with U.S. GAAPgenerally accepted accounting principles ("U.S. GAAP") for interim financial information and with the instructions to Form 10-Q adopted by the Securities and Exchange Commission (“SEC”("SEC"). Accordingly, the consolidated financial statements do not include all of the information and footnotes required for complete financial statements and should be read in conjunction with the Company’s consolidated financial statements and notes thereto included in our Annual Report on Form 10-Kfor the year ended December 31, 20162020 ("Form 10-K"). Operating results for the interim periods disclosed herein are not necessarily indicative of the results that may be expected for a full year or any future period.
We provide primarilyOur Life Insurance segment operates through CICA Ltd., CICA and CNLIC. Our international life insurance business, which operates through CICA Ltd., issues U.S. dollar-denominated endowment contracts internationally, which are principally accumulation contracts that incorporate an element of life insurance protection and ordinary whole life insurance in U.S. dollar-denominated amounts sold to non-U.S. residents. These contracts are designed to provide a smallfixed amount of health insurance policiescoverage over the life of the insured and may utilize rider benefits to provide additional increasing or decreasing coverage and annuity benefits to enhance accumulations. Our domestic life insurance business, which operates through our insurance subsidiaries: CICA, SPLIC, MGLIC and CNLIC. Until the end of 2016, CICA and CNLIC, issued ordinary whole-life policies, credit lifeprimarily focused on living needs and disability, burial insurance, pre-need policies, and accident and health related policies,provided benefits toward accumulating financial benefits for the policyowners throughout the Midwest and southern United States. BeginningU.S. until they ceased most domestic sales beginning January 1, 2017, CICA2017. We have recently developed a whole life insurance product and CNLIC ceasedhave begun selling this product in Florida in 2021.
Our Home Service Insurance segment operates through our subsidiaries SPLIC, MGLIC and SPFIC, and focuses on the life insurance needs of the middle- and lower-income markets, primarily in Louisiana, Mississippi and Arkansas. Our products domestically as the products failedin this segment consist primarily of small face amount ordinary whole life, industrial life and pre-need policies, which are designed to qualifyfund final expenses for the favorable U.S. federal income tax treatment afforded by Section 7702insured, primarily consisting of the Internal Revenue Code ("IRC") of 1986. The Company is developing Section 7702 compliant productsfuneral and will resume sales domestically once the products receive regulatory approval. CICA primarily issues ordinary whole-lifeburial costs as well as limited liability, named peril property policies covering dwelling and endowment policies to non-U.S. residents. SPLIC offers final expense and home service life insurance in Louisiana, Arkansas and Mississippi, and SPFIC, a wholly-owned subsidiary of SPLIC, writes a limited amount of property insurance in Louisiana. MGLIC provides industrial life policies through independent funeral homes in Mississippi.contents.
CTI provides data processing systems and services as well as furniture and equipment, to the Company. III provided aviation transportation to the Company, until the corporate plane was sold in the third quarter of 2017. As III's sole purpose was to provide aviation transportation to the Company, we plan to dissolve III and merge it into Citizens. CICA Life Ltd. is a newly established Bermuda entity with no operations to date.
ReclassificationsUSE OF ESTIMATES
Certain amounts presented in the prior year have been reclassified to conform to the current presentation. No individual amounts were material.
Use of Estimates
The preparation of consolidated financial statements in conformity with U.S. GAAP requires management to make estimates and assumptions that affect the reported amounts of assets and liabilities and the disclosure of contingent assets and liabilities at the date of the consolidated financial statements and the reported amounts of revenues and expenses during the reporting period. Actual results could differ from those estimates.
CITIZENS, INC. AND CONSOLIDATED SUBSIDIARIES
Notes to Consolidated Financial Statements, Continued
September 30, 2017
(Unaudited) | | | | | | | | |
CITIZENS, INC. | NOTES TO CONSOLIDATED FINANCIAL STATEMENTS |
| | (Unaudited) |
The most significantSignificant estimates include those used in the evaluation of other-than-temporary impairments on debt and equity securities and valuationcredit allowances on investments,fixed maturity securities, actuarially determined assets and liabilities and assumptions, tests of goodwill impairment and valuation allowance on deferred tax assets, and contingencies relating to litigation and regulatory matters.assets. Certain of these estimates are particularly sensitive to market conditions, and deterioration and/or volatility in the worldwide debt or equity markets could have a material impact on the consolidated financial statements.
Significant Accounting PoliciesSIGNIFICANT ACCOUNTING POLICIES
For a description of our significant accounting policies, see Part IV, Item 15, Note 11. Summary of Significant Accounting Policies in the notes to our consolidated financial statements included in our Annual Report on Form 10-K for the year ended December 31, 2016,, which should be read in conjunction with these accompanying consolidated financial statements.
(2) Accounting PronouncementsACCOUNTING PRONOUNCEMENTS
Accounting Standards Recently AdoptedACCOUNTING STANDARDS RECENTLY ADOPTED
None.
Accounting Standards Not Yet Adopted
In May 2014,June 2016, the Financial Accounting Standards Board ("FASB") issued Accounting Standards Update ("ASU") No. 2014-09, Revenue from Contracts with Customers (Topic 606), which supersedes the revenue recognition requirements in ASC 605, Revenue Recognition. The core principle of ASU 2014-09 is that an entity should recognize revenue to depict the transfer of promised goods or services to customers in an amount that reflects the consideration to which the entity expects to be entitled in exchange for those goods or services. The guidance provides a five-step process to achieve that core principle. ASU 2014-09 requires disclosures enabling users of financial statements to understand the nature, amount, timing and uncertainty of revenue and cash flows arising from contracts with customers. Additionally, qualitative and quantitative disclosures are required about contracts with customers, significant judgments and changes in judgments, and assets recognized from the costs to obtain or fulfill a contract. ASU 2014-09 is effective for annual reporting periods beginning after December 15, 2017, including interim periods within that reporting period, using one of two retrospective application methods. We have evaluated the effect the guidance will have on our consolidated financial statements. We do not expect that any portion of our revenue will be affected by the new standard, primarily as the new guidance does not apply to revenue from insurance contracts and our non-insurance subsidiaries do not receive revenues from customers.
The FASB’s new lease accounting standard, ASU 2016-02, Leases (Topic 842), was issued on February 25, 2016. The ASU will require organizations that lease assets, referred to as “lessees”, to recognize on the balance sheet the assets and liabilities for the rights and obligations created by those leases. The ASU also will require disclosures to help investors and other financial statement users better understand the amount, timing, and uncertainty of cash flows arising from leases. These disclosures include qualitative and quantitative requirements, providing additional information about the amounts recorded in the financial statements. The accounting by organizations that own the assets leased by the lessee, also known as lessor accounting, will remain largely unchanged from current GAAP. However, the ASU contains some targeted improvements that are intended to align, where necessary, lessor accounting with the lessee accounting model and with the updated revenue recognition guidance issued in 2014. The ASU on leases will take effect for public companies for fiscal years, and interim periods within those fiscal years, beginning after December 15, 2018. The Company is assessing the impact of this new standard, but currently the Company does not anticipate the new standard to have a significant effect on the Company's consolidated financial statements.
In June 2016, the FASB issued ASU 2016-13, Financial Instruments-Credit Losses (Topic 326), with the main objective to provide financial statement users with more decision-useful information about the expected credit losses on financial instruments and other commitments to extend credit held by a reporting entity at each reporting date. The amendments in this ASU requirerequires a financial asset (or a group of financial assets) measured at amortized cost basis to be presented at the net amount expected to be collected. The allowance for credit losses is a valuation account that is deducted from the amortized cost basis of the financial asset(s) to present the net carrying value at the amount expected to be collected on the financial asset. The income statement reflects the measurement of credit losses for newly recognized financial assets, as well as the expected increases or decreases of expected credit losses that have taken place during the period. Credit losses on available-for-sale debt("AFS") fixed maturity securities should be measured in a
CITIZENS, INC. AND CONSOLIDATED SUBSIDIARIES
Notes to Consolidated Financial Statements, Continued
September 30, 2017
(Unaudited)
manner similar to current U.S. GAAP; however, the credit losses are recorded through an allowance for credit losses rather than as a write-down. This approach is an improvement to currentprior U.S. GAAP because an entity will be able to record reversals of credit losses (in situations in which the estimate of credit losses declines) in current period net income, which in turn should align the income statement recognition of credit losses with the reporting period in which changes occur. CurrentPrior U.S. GAAP prohibitsprohibited reflecting those improvements in current-period earnings. The Company adopted this standard effective January 1, 2020 using the modified retrospective approach. The adoption resulted in an increase in accumulated deficit of $0.4 million related to agents' debit balance collectability.
ACCOUNTING STANDARDS NOT YET ADOPTED
In August 2018, the FASB issued ASU No. 2018-12, Financial Services-Insurance (Topic 944): Targeted Improvements to the Accounting for Long-Duration Contracts. This ASU amends four key areas of the accounting and impacts disclosures for long-duration insurance and investment contracts:
•Requires updated assumptions for liability measurement. Assumptions used to measure the liability for traditional insurance contracts, which are typically determined at contract inception, will now be reviewed at least annually, and, if there is a change, updated, with the effect recorded in net income;
•Standardizes the liability discount rate. The liability discount rate will be a market-observable discount rate (upper-medium grade fixed-income instrument yield), with the effect of rate changes recorded in other comprehensive income;
•Provides greater consistency in measurement of market risk benefits. The two previous measurement models have been reduced to one measurement model (fair value), resulting in greater uniformity across similar market-based benefits and better alignment with the fair value measurement of derivatives used to hedge capital market risk;
•Simplifies amortization of deferred acquisition costs ("DAC"). Previous earnings-based amortization methods have been replaced with a more level amortization basis; and
| | | | | | | | |
CITIZENS, INC. | NOTES TO CONSOLIDATED FINANCIAL STATEMENTS |
| | (Unaudited) |
•Requires enhanced disclosures. The new disclosures include rollforwards and information about significant assumptions and the effects of changes in those assumptions.
For calendar-year public business entities,companies, the amendments in this ASU arechanges will be effective for fiscal years beginning after December 15, 2019, including interim periods within those fiscal years.on January 1, 2023, however, early adoption is permitted. The Company is evaluating the impact of this new guidance, willand it is expected to have a material impact on our consolidated financial statements, but it is not expected to have a significant impact on the Company's financial statements compared with the previous guidance, except for potential reversals of previous credit losses which were not allowed under prior guidance.statements.
In January 2017, the FASB issued Accounting Standards Update ("ASU") No. 2017-04, Simplifying the Test for Goodwill Impairment. An entity will no longer perform a hypothetical purchase price allocation to measure impairment, eliminating step 2 of the goodwill impairment test. Instead, impairment will be measured using the difference of the carrying amount to the fair value of the reporting unit. The ASU is effective prospectively for annual and interim periods in fiscal year beginning after December 15, 2019, but early adoption is permitted for goodwill impairment tests with measurement dates after January 1, 2017. The Company is not planning on early adoption of this ASU and has not yet quantified any potential impact of the ASU on the Company's consolidated financial statements.
In March 2017, the FASB issued Accounting Standards Update ("ASU") No. 2017-08, Receivables-Nonrefundable Fees and Other Costs (Subtopic 310-20). The amendments in this ASU shorten the amortization period for certain callable debt securities held at a premium. Specifically, the amendments require the premium to be amortized to the earliest call date. The amendments do not require an accounting change for securities held at a discount; the discount continues to be amortized to maturity. The Company has a large portfolio of callable debt securities purchased at a premium. As such, the Company had already been amortizing the premium to the earliest call date to reduce volatility in earnings by eliminating reporting large realized losses when debt securities are called. For public business entities, the amendments in this Update are effective for fiscal years, and interim periods within those fiscal years, beginning after December 15, 2018.
No other new accounting pronouncement issued or effective during the fiscal year had, or is expected to have, a material impact on our Consolidated Financial Statements.consolidated financial statements.
(3) Segment InformationSEGMENT INFORMATION
The Company has three2 reportable segments: Life Insurance and Home Service Insurance.
Our Life Insurance segment primarily issues endowment contracts, which are principally accumulation contracts that incorporate an element of life insurance protection and ordinary whole life insurance, to non-U.S. residents through CICA Ltd. These contracts are designed to provide a fixed amount of insurance coverage over the life of the insured and may utilize rider benefits to provide additional coverage and annuity benefits to enhance accumulations. CICA and CNLIC issued ordinary whole-life, credit life and disability and accident and health related policies, throughout the Midwest and southern U.S. until they ceased most domestic sales beginning January 1, 2017. We restarted domestic sales in Florida in 2021.
Our domestic Home Service Insurance segment operates through our subsidiaries SPLIC, MGLIC and SPFIC, and focuses on the life insurance needs of the middle- and lower-income markets, primarily in Louisiana, Mississippi and Arkansas. Our policies are sold and serviced through funeral homes and independent agents who sell policies, collect premiums and service policyholders. To a lesser extent, our Home Service Insurance segment sells limited liability, named peril property policies covering dwelling and contents.
The Company also operates other non-insurance portions of the Company ("Other Non-Insurance Enterprises. Enterprises"), which primarily include the Company’s IT and Corporate-support functions that are included in the tables presented. The Company's Other Non-Insurance Enterprises are the only reportable difference between segments and consolidated operations.
The accounting policies of the reportable segments and Other Non-Insurance Enterprises are presented in accordance with U.S. GAAP and are the same as those used in the preparation of the consolidated financial statements. The Company evaluates profit and loss performance based on U.S. GAAP income before federal income taxes for its three2 reportable segments.
CITIZENS, INC. AND CONSOLIDATED SUBSIDIARIES
Notes to Consolidated Financial Statements, Continued
September 30, 2017
(Unaudited) | | | | | | | | |
CITIZENS, INC. | NOTES TO CONSOLIDATED FINANCIAL STATEMENTS |
| | (Unaudited) |
| | | | | | | | | | | | | | | | | | | | | | | |
| Life Insurance | | Home Service Insurance | | Other Non-Insurance Enterprises | | Consolidated |
| Three Months Ended March 31, 2021 | | | |
| (In thousands) | | | |
| | | | | | | |
| Revenues: | | | | | | | |
| Premiums | $ | 27,063 | | | 11,969 | | | 0 | | | 39,032 | |
| Net investment income | 11,598 | | | 3,345 | | | 301 | | | 15,244 | |
| Realized investment gains (losses), net | (108) | | | 223 | | | 177 | | | 292 | |
| Other income | 913 | | | 2 | | | 0 | | | 915 | |
| Total revenues | 39,466 | | | 15,539 | | | 478 | | | 55,483 | |
| Benefits and expenses: | | | | | | | |
| Insurance benefits paid or provided: | | | | | | | |
| Claims and surrenders | 23,270 | | | 7,319 | | | 0 | | | 30,589 | |
| Increase in future policy benefit reserves | 3,658 | | | 1,574 | | | 0 | | | 5,232 | |
| Policyholders' dividends | 1,296 | | | 10 | | | 0 | | | 1,306 | |
| Total insurance benefits paid or provided | 28,224 | | | 8,903 | | | 0 | | | 37,127 | |
| Commissions | 4,231 | | | 3,926 | | | 0 | | | 8,157 | |
| Other general expenses | 5,226 | | | 3,794 | | | 2,362 | | | 11,382 | |
| Capitalization of deferred policy acquisition costs | (3,561) | | | (1,424) | | | 0 | | | (4,985) | |
| Amortization of deferred policy acquisition costs | 5,348 | | | 835 | | | 0 | | | 6,183 | |
| Amortization of cost of insurance acquired | 104 | | | 263 | | | 0 | | | 367 | |
| Total benefits and expenses | 39,572 | | | 16,297 | | | 2,362 | | | 58,231 | |
| Loss before federal income tax expense | $ | (106) | | | (758) | | | (1,884) | | | (2,748) | |
The Company has no reportable differences between segments and consolidated operations.
|
| | | | | | | | | | | | |
| | Three Months Ended |
| | September 30, 2017 |
| | Life
Insurance | | Home
Service
Insurance | | Other
Non-Insurance
Enterprises | | Consolidated |
| | (In thousands) |
| Revenues: | | | | | | | |
| Premiums | $ | 38,472 |
| | 11,775 |
| | — |
| | 50,247 |
|
| Net investment income | 10,051 |
| | 3,355 |
| | 422 |
| | 13,828 |
|
| Realized investment losses, net | (355 | ) | | (49 | ) | | — |
| | (404 | ) |
| Other income | 561 |
| | — |
| | 99 |
| | 660 |
|
| Total revenue | 48,729 |
| | 15,081 |
| | 521 |
| | 64,331 |
|
| Benefits and expenses: | | | |
| | |
| | |
|
| Insurance benefits paid or provided: | |
| | |
| | |
| | |
|
| Claims and surrenders | 15,700 |
| | 5,754 |
| | — |
| | 21,454 |
|
| Increase in future policy benefit reserves | 18,045 |
| | 1,552 |
| | — |
| | 19,597 |
|
| Policyholders' dividends | 1,602 |
| | 11 |
| | — |
| | 1,613 |
|
| Total insurance benefits paid or provided | 35,347 |
| | 7,317 |
| | — |
| | 42,664 |
|
| Commissions | 6,892 |
| | 3,909 |
| | — |
| | 10,801 |
|
| Other general expenses | 2,200 |
| | 4,025 |
| | 1,029 |
| | 7,254 |
|
| Capitalization of deferred policy acquisition costs | (6,242 | ) | | (1,514 | ) | | — |
| | (7,756 | ) |
| Amortization of deferred policy acquisition costs | 6,431 |
| | 1,192 |
| | — |
| | 7,623 |
|
| Amortization of cost of customer relationships acquired | 118 |
| | 517 |
| | — |
| | 635 |
|
| Total benefits and expenses | 44,746 |
| | 15,446 |
| | 1,029 |
| | 61,221 |
|
| Income (loss) before income tax expense | $ | 3,983 |
| | (365 | ) | | (508 | ) | | 3,110 |
|
CITIZENS, INC. AND CONSOLIDATED SUBSIDIARIES
Notes to Consolidated Financial Statements, Continued
September 30, 2017
(Unaudited) | | | | | | | | |
CITIZENS, INC. | NOTES TO CONSOLIDATED FINANCIAL STATEMENTS |
| | (Unaudited) |
| | | | | | | | | | | | | | | | | | | | | | | |
| Life Insurance | | Home Service Insurance | | Other Non-Insurance Enterprises | | Consolidated |
| Three Months Ended March 31, 2020 | | | |
| (In thousands) | | | |
| | | | | | | |
| Revenues: | | | | | | | |
| Premiums | $ | 29,819 | | | 11,498 | | | 0 | | | 41,317 | |
| Net investment income | 11,480 | | | 3,332 | | | 357 | | | 15,169 | |
| Realized investment gains (losses), net | 735 | | | (1,717) | | | (324) | | | (1,306) | |
| Other income | 524 | | | 18 | | | 0 | | | 542 | |
| Total revenues | 42,558 | | | 13,131 | | | 33 | | | 55,722 | |
| Benefits and expenses: | | | | | | | |
| Insurance benefits paid or provided: | | | | | | | |
| Claims and surrenders | 20,160 | | | 6,289 | | | 0 | | | 26,449 | |
| Increase in future policy benefit reserves | 8,146 | | | 1,325 | | | 0 | | | 9,471 | |
| Policyholders' dividends | 1,225 | | | 8 | | | 0 | | | 1,233 | |
| Total insurance benefits paid or provided | 29,531 | | | 7,622 | | | 0 | | | 37,153 | |
| Commissions | 4,478 | | | 3,375 | | | 0 | | | 7,853 | |
| Other general expenses | 4,948 | | | 4,316 | | | 2,209 | | | 11,473 | |
| Capitalization of deferred policy acquisition costs | (3,921) | | | (1,088) | | | 0 | | | (5,009) | |
| Amortization of deferred policy acquisition costs | 5,318 | | | 801 | | | 0 | | | 6,119 | |
| Amortization of cost of insurance acquired | 118 | | | 250 | | | 0 | | | 368 | |
| Total benefits and expenses | 40,472 | | | 15,276 | | | 2,209 | | | 57,957 | |
| Income (loss) before federal income tax expense | $ | 2,086 | | | (2,145) | | | (2,176) | | | (2,235) | |
|
| | | | | | | | | | | | |
| | Nine Months Ended |
| | September 30, 2017 |
| | Life Insurance | | Home Service Insurance | | Other Non-Insurance Enterprises | | Consolidated |
| | (In thousands) |
| Revenues: | | | | | | | |
| Premiums | $ | 107,995 |
| | 35,372 |
| | — |
| | 143,367 |
|
| Net investment income | 28,678 |
| | 9,864 |
| | 1,098 |
| | 39,640 |
|
| Realized investment gains (losses), net | (419 | ) | | 1,161 |
| | — |
| | 742 |
|
| Other income | 856 |
| | 2 |
| | 157 |
| | 1,015 |
|
| Total revenue | 137,110 |
| | 46,399 |
| | 1,255 |
| | 184,764 |
|
| Benefits and expenses: | | | |
| | |
| | |
|
| Insurance benefits paid or provided: | |
| | |
| | |
| | |
|
| Claims and surrenders | 45,218 |
| | 16,912 |
| | — |
| | 62,130 |
|
| Increase in future policy benefit reserves | 47,818 |
| | 4,135 |
| | — |
| | 51,953 |
|
| Policyholders' dividends | 4,387 |
| | 31 |
| | — |
| | 4,418 |
|
| Total insurance benefits paid or provided | 97,423 |
| | 21,078 |
| | — |
| | 118,501 |
|
| Commissions | 18,765 |
| | 11,855 |
| | — |
| | 30,620 |
|
| Other general expenses | 10,399 |
| | 13,182 |
| | 3,184 |
| | 26,765 |
|
| Capitalization of deferred policy acquisition costs | (16,843 | ) | | (4,697 | ) | | — |
| | (21,540 | ) |
| Amortization of deferred policy acquisition costs | 19,350 |
| | 3,290 |
| | — |
| | 22,640 |
|
| Amortization of cost of customer relationships acquired | 434 |
| | 1,195 |
| | — |
| | 1,629 |
|
| Total benefits and expenses | 129,528 |
| | 45,903 |
| | 3,184 |
| | 178,615 |
|
| Income (loss) before income tax expense | $ | 7,582 |
| | 496 |
| | (1,929 | ) | | 6,149 |
|
CITIZENS, INC. AND CONSOLIDATED SUBSIDIARIES
Notes to Consolidated Financial Statements, Continued
September 30, 2017
(Unaudited) | | | | | | | | |
CITIZENS, INC. | NOTES TO CONSOLIDATED FINANCIAL STATEMENTS |
| | (Unaudited) |
(4) STOCKHOLDERS' EQUITY AND RESTRICTIONS
|
| | | | | | | | | | | | |
| | Three Months Ended |
| | September 30, 2016 |
| | Life
Insurance | | Home
Service
Insurance | | Other
Non-Insurance
Enterprises | | Consolidated |
| | (In thousands) |
| Revenues: | | | | | | | |
| Premiums | $ | 37,572 |
| | 11,600 |
| | — |
| | 49,172 |
|
| Net investment income | 8,473 |
| | 3,467 |
| | 380 |
| | 12,320 |
|
| Realized investment gains, net | — |
| | 46 |
| | — |
| | 46 |
|
| Other income | 166 |
| | 2 |
| | 35 |
| | 203 |
|
| Total revenue | 46,211 |
| | 15,115 |
| | 415 |
| | 61,741 |
|
| Benefits and expenses: | |
| | |
| | |
| | |
|
| Insurance benefits paid or provided: | |
| | |
| | |
| | |
|
| Claims and surrenders | 14,980 |
| | 6,034 |
| | — |
| | 21,014 |
|
| Increase in future policy benefit reserves | 18,009 |
| | 988 |
| | — |
| | 18,997 |
|
| Policyholders' dividends | 1,604 |
| | 16 |
| | — |
| | 1,620 |
|
| Total insurance benefits paid or provided | 34,593 |
| | 7,038 |
| | — |
| | 41,631 |
|
| Commissions | 6,973 |
| | 3,879 |
| | — |
| | 10,852 |
|
| Other general expenses | 990 |
| | 3,610 |
| | 392 |
| | 4,992 |
|
| Capitalization of deferred policy acquisition costs | (6,346 | ) | | (1,544 | ) | | — |
| | (7,890 | ) |
| Amortization of deferred policy acquisition costs | 5,889 |
| | 1,019 |
| | — |
| | 6,908 |
|
| Amortization of cost of customer relationships acquired | 119 |
| | 522 |
| | — |
| | 641 |
|
| Total benefits and expenses | 42,218 |
| | 14,524 |
| | 392 |
| | 57,134 |
|
| Income before income tax expense | $ | 3,993 |
| | 591 |
| | 23 |
| | 4,607 |
|
CITIZENS, INC. AND CONSOLIDATED SUBSIDIARIES
Notes to Consolidated Financial Statements, Continued
September 30, 2017
(Unaudited)
|
| | | | | | | | | | | | |
| | Nine Months Ended |
| | September 30, 2016 |
| | Life Insurance | | Home Service Insurance | | Other Non-Insurance Enterprises | | Consolidated |
| | (In thousands) |
| Revenues: | | | | | | | |
| Premiums | $ | 107,531 |
| | 35,087 |
| | — |
| | 142,618 |
|
| Net investment income | 24,534 |
| | 10,386 |
| | 1,131 |
| | 36,051 |
|
| Realized investment losses, net | (660 | ) | | (1,116 | ) | | — |
| | (1,776 | ) |
| Other income | 537 |
| | 5 |
| | 68 |
| | 610 |
|
| Total revenue | 131,942 |
| | 44,362 |
| | 1,199 |
| | 177,503 |
|
| Benefits and expenses: | |
| | |
| | |
| | |
|
| Insurance benefits paid or provided: | |
| | |
| | |
| | |
|
| Claims and surrenders | 43,601 |
| | 17,387 |
| | — |
| | 60,988 |
|
| Increase in future policy benefit reserves | 48,525 |
| | 3,570 |
| | — |
| | 52,095 |
|
| Policyholders' dividends | 4,942 |
| | 43 |
| | — |
| | 4,985 |
|
| Total insurance benefits paid or provided | 97,068 |
| | 21,000 |
| | — |
| | 118,068 |
|
| Commissions | 19,544 |
| | 11,553 |
| | — |
| | 31,097 |
|
| Other general expenses | 9,115 |
| | 11,357 |
| | 2,260 |
| | 22,732 |
|
| Capitalization of deferred policy acquisition costs | (17,764 | ) | | (4,493 | ) | | — |
| | (22,257 | ) |
| Amortization of deferred policy acquisition costs | 17,807 |
| | 2,611 |
| | — |
| | 20,418 |
|
| Amortization of cost of customer relationships acquired | 419 |
| | 1,169 |
| | — |
| | 1,588 |
|
| Total benefits and expenses | 126,189 |
| | 43,197 |
| | 2,260 |
| | 171,646 |
|
| Income (loss) before income tax expense | $ | 5,753 |
| | 1,165 |
| | (1,061 | ) | | 5,857 |
|
CITIZENS, INC. AND CONSOLIDATED SUBSIDIARIES
Notes to Consolidated Financial Statements, Continued
September 30, 2017
(Unaudited)
(4) Earnings Per Share
The following tables set forth the computation of basic and diluted earnings (loss) per share.
| | | | | | | | | | | |
| Three Months Ended March 31, | 2021 | | 2020 |
| (In thousands, except per share amounts) | |
| Basic and diluted earnings (loss) per share: | | | |
| Numerator: | | | |
| Net income (loss) | $ | (3,573) | | | (3,584) | |
| Net income (loss) allocated to Class A common stock | $ | (3,537) | | | (3,548) | |
| Net income (loss) allocated to Class B common stock | (36) | | | (36) | |
| Net income (loss) | $ | (3,573) | | | (3,584) | |
| | | |
| Denominator: | | | |
| Weighted average shares of Class A outstanding - basic | 49,549 | | | 49,305 | |
| Weighted average shares of Class A outstanding - diluted | 50,116 | | | 49,455 | |
| Weighted average shares of Class B outstanding - basic and diluted | 1,002 | | | 1,002 | |
| Basic and diluted earnings (loss) per share of Class A common stock | $ | (0.07) | | | (0.07) | |
| Basic and diluted earnings (loss) per share of Class B common stock | (0.04) | | | (0.04) | |
CAPITAL AND SURPLUS
Each of our regulated insurance subsidiaries is required to meet stipulated regulatory capital requirements. These include capital requirements imposed by the U.S. National Association of Insurance Commissioners ("NAIC") and the Bermuda Monetary Authority ("BMA"). All insurance subsidiaries exceeded the minimum capital requirements at March 31, 2021.
In order to minimize the risk of a shortfall in capital arising from an unexpected adverse deviation or excess risk, the BMA has established a threshold capital level (termed the Target Capital Level ("TCL")), which is set at 120% of a company’s enhanced capital requirement. The TCL serves as an early warning tool for the BMA. As of March 31, 2021, CICA Ltd. was above the TCL threshold. At the request of the BMA, on April 15, 2021, Citizens and CICA Ltd. entered into a Keep Well Agreement. The Keep Well Agreement requires Citizens to contribute up to $10 million in capital to CICA Ltd. as necessary to ensure that CICA Ltd. has a minimum capital level of 120% (equal to the TCL). Since CICA Ltd.’s capital level currently exceeds 120%, Citizens is not currently required to make a capital contribution.
|
| | | | | | |
| | Three Months Ended |
| | September 30, 2017 | | September 30, 2016 |
| | (In thousands,
except per share amounts) |
| Basic and diluted earnings per share: | | | |
| Numerator: | | | |
| Net income | $ | 3,449 |
| | 2,762 |
|
| Net income allocated to Class A common stock | 3,415 |
| | 2,734 |
|
| Net income allocated to Class B common stock | 34 |
| | 28 |
|
| Net income | $ | 3,449 |
| | 2,762 |
|
| Denominator: | | | |
| Weighted average shares of Class A outstanding - basic | 49,080 |
| | 49,080 |
|
| Weighted average shares of Class A outstanding - diluted | 49,080 |
| | 49,080 |
|
| Weighted average shares of Class B outstanding - basic and diluted | 1,002 |
| | 1,002 |
|
| Basic earnings per share of Class A common stock | $ | 0.07 |
| | 0.06 |
|
| Basic earnings per share of Class B common stock | 0.03 |
| | 0.03 |
|
| Diluted earnings per share of Class A common stock | 0.07 |
| | 0.06 |
|
| Diluted earnings per share of Class B common stock | 0.03 |
| | 0.03 |
|
|
| | | | | | |
| | Nine Months Ended |
| | September 30, 2017 | | September 30, 2016 |
| | (In thousands, except per share amounts) |
| Basic and diluted earnings per share: | | | |
| Numerator: | | | |
| Net income | $ | 6,077 |
| | 1,853 |
|
| Net income allocated to Class A common stock | $ | 6,016 |
| | 1,834 |
|
| Net income allocated to Class B common stock | 61 |
| | 19 |
|
| Net income | $ | 6,077 |
| | 1,853 |
|
| Denominator: | | | |
| Weighted average shares of Class A outstanding - basic | 49,080 |
| | 49,080 |
|
| Weighted average shares of Class A outstanding - diluted | 49,080 |
| | 49,080 |
|
| Weighted average shares of Class B outstanding - basic and diluted | 1,002 |
| | 1,002 |
|
| Basic earnings per share of Class A common stock | $ | 0.12 |
| | 0.04 |
|
| Basic earnings per share of Class B common stock | 0.06 |
| | 0.02 |
|
| Diluted earnings per share of Class A common stock | 0.12 |
| | 0.04 |
|
| Diluted earnings per share of Class B common stock | 0.06 |
| | 0.02 |
|
CITIZENS, INC. AND CONSOLIDATED SUBSIDIARIES
Notes to Consolidated Financial Statements, Continued
September 30, 2017
(Unaudited) | | | | | | | | |
CITIZENS, INC. | NOTES TO CONSOLIDATED FINANCIAL STATEMENTS |
| | (Unaudited) |
(5) INVESTMENTS
(5) Investments
The Company invests primarily in fixed maturity securities, which totaled 89.6%90.8% of total cash cash equivalents and investmentsinvested assets at September 30, 2017.March 31, 2021, as shown below.
| Carrying Value (In thousands, except for %) | | Carrying Value (In thousands, except for %) | March 31, 2021 | | December 31, 2020 |
| Amount | | % | | Amount | | % |
| | | September 30, 2017 | | December 31, 2016 | |
| | Carrying Value | | % of Total Carrying Value | | Carrying Value | | % of Total Carrying Value | |
| | (In thousands) | | | | (In thousands) | | | |
| Cash and invested assets: | | Cash and invested assets: | |
| Fixed maturity securities | $ | 1,191,597 |
| | 89.6 |
| | $ | 1,128,672 |
| | 89.7 |
| Fixed maturity securities | $ | 1,420,587 | | | 90.8 | % | | 1,489,383 | | | 89.8 | % |
| Equity securities | 16,146 |
| | 1.2 |
| | 18,159 |
| | 1.6 |
| Equity securities | 22,366 | | | 1.4 | % | | 22,102 | | | 1.3 | % |
| Mortgage loans | 197 |
| | — |
| | 232 |
| | — |
| |
| Policy loans | 71,215 |
| | 5.4 |
| | 66,672 |
| | 5.3 |
| Policy loans | 82,674 | | | 5.3 | % | | 83,318 | | | 5.0 | % |
| Real estate and other long-term investments | 5,880 |
| | 0.4 |
| | 7,896 |
| | 0.6 |
| Real estate and other long-term investments | 19,918 | | | 1.3 | % | | 29,865 | | | 1.8 | % |
| Short-term investments | — |
| | — |
| | 508 |
| | — |
| |
| | Cash and cash equivalents | 45,000 |
| | 3.4 |
| | 35,510 |
| | 2.8 |
| Cash and cash equivalents | 19,493 | | | 1.2 | % | | 34,131 | | | 2.1 | % |
| Total cash, cash equivalents and investments | $ | 1,330,035 |
| | 100.0 |
| | $ | 1,257,649 |
| | 100.0 |
| |
| | Total cash and invested assets | | Total cash and invested assets | $ | 1,565,038 | | | 100.0 | % | | 1,658,799 | | | 100.0 | % |
CITIZENS, INC. AND CONSOLIDATED SUBSIDIARIES
Notes to Consolidated Financial Statements, Continued
September 30, 2017
(Unaudited)
The following tables represent the amortized cost, gross unrealized gains and losses and fair value forof fixed maturities and equitymaturity securities as of the periodsdates indicated.
| | | | | | | | | | | | | | | | | | | | | | | |
| Amortized
Cost | | Gross
Unrealized
Gains | | Gross
Unrealized
Losses | | Fair
Value |
| March 31, 2021 | | | |
| (In thousands) | | | |
| | | | | | | |
| Fixed maturity securities: | | | | | | | |
| Available-for-sale: | | | | | | | |
| U.S. Treasury securities | $ | 9,508 | | | 1,513 | | | 0 | | | 11,021 | |
| U.S. Government-sponsored enterprises | 3,483 | | | 1,034 | | | 0 | | | 4,517 | |
| States and political subdivisions | 370,995 | | | 24,819 | | | 1,955 | | | 393,859 | |
| Corporate: | | | | | | | |
| Financial | 207,547 | | | 15,269 | | | 1,621 | | | 221,195 | |
| Consumer | 204,988 | | | 16,745 | | | 3,034 | | | 218,699 | |
| Energy | 79,422 | | | 4,904 | | | 1,092 | | | 83,234 | |
| All Other | 294,528 | | | 21,395 | | | 4,261 | | | 311,662 | |
| | | | | | | |
| Residential mortgage-backed | 118,186 | | | 14,006 | | | 46 | | | 132,146 | |
| Asset-backed | 43,874 | | | 327 | | | 63 | | | 44,138 | |
| Foreign governments | 101 | | | 15 | | | 0 | | | 116 | |
| Total fixed maturity securities | $ | 1,332,632 | | | 100,027 | | | 12,072 | | | 1,420,587 | |
|
| | | | | | | | | | | | |
| | September 30, 2017 |
| | Cost or Amortized Cost | | Gross Unrealized Gains | | Gross Unrealized Losses | | Fair Value |
| | (In thousands) |
| Fixed maturities: | | | | | | | |
| Available-for-sale: | | | | | | | |
| U.S. Treasury securities | $ | 9,878 |
| | 2,124 |
| | — |
| | 12,002 |
|
| U.S. Government-sponsored enterprises | 3,576 |
| | 943 |
| | — |
| | 4,519 |
|
| States and political subdivisions | 555,890 |
| | 17,991 |
| | 1,886 |
| | 571,995 |
|
| Foreign governments | 103 |
| | 21 |
| | — |
| | 124 |
|
| Corporate | 349,291 |
| | 17,273 |
| | 2,066 |
| | 364,498 |
|
| Residential mortgage-backed | 1,962 |
| | 146 |
| | 2 |
| | 2,106 |
|
| Total available-for-sale securities | 920,700 |
| | 38,498 |
| | 3,954 |
| | 955,244 |
|
| Held-to-maturity securities: | |
| | |
| | |
| | |
|
| States and political subdivisions | 215,414 |
| | 8,076 |
| | 632 |
| | 222,858 |
|
| Corporate | 20,939 |
| | 989 |
| | 722 |
| | 21,206 |
|
| Total held-to-maturity securities | 236,353 |
| | 9,065 |
| | 1,354 |
| | 244,064 |
|
| Total fixed maturities | $ | 1,157,053 |
| | 47,563 |
| | 5,308 |
| | 1,199,308 |
|
| | | | | | | | |
| Equity securities: | |
| | |
| | |
| | |
|
| Stock mutual funds | $ | 2,867 |
| | 301 |
| | — |
| | 3,168 |
|
| Bond mutual funds | 12,071 |
| | 458 |
| | 134 |
| | 12,395 |
|
| Common stock | 22 |
| | 1 |
| | — |
| | 23 |
|
| Redeemable preferred stock | 519 |
| | 41 |
| | — |
| | 560 |
|
| Total equity securities | $ | 15,479 |
| | 801 |
| | 134 |
| | 16,146 |
|
17
March 31, 2021 | 10-Q 14
CITIZENS, INC. AND CONSOLIDATED SUBSIDIARIES
Notes to Consolidated Financial Statements, Continued
September 30, 2017
(Unaudited) | | | | | | | | |
CITIZENS, INC. | NOTES TO CONSOLIDATED FINANCIAL STATEMENTS |
| | (Unaudited) |
|
| | | | | | | | | | | | |
| | December 31, 2016 |
| | Cost or Amortized Cost | | Gross Unrealized Gains | | Gross Unrealized Losses | | Fair Value |
| | (In thousands) |
| Fixed maturities: | | | | | | | |
| Available-for-sale securities: | | | | | | | |
| U.S. Treasury securities | $ | 9,929 |
| | 2,261 |
| | — |
| | 12,190 |
|
| U.S. Government-sponsored enterprises | 7,639 |
| | 863 |
| | — |
| | 8,502 |
|
| States and political subdivisions | 563,279 |
| | 15,017 |
| | 5,022 |
| | 573,274 |
|
| Foreign governments | 103 |
| | 23 |
| | — |
| | 126 |
|
| Corporate | 277,226 |
| | 12,095 |
| | 4,222 |
| | 285,099 |
|
| Commercial mortgage-backed | 50 |
| | 1 |
| | — |
| | 51 |
|
| Residential mortgage-backed | 2,247 |
| | 181 |
| | 2 |
| | 2,426 |
|
| Total available-for-sale securities | 860,473 |
| | 30,441 |
| | 9,246 |
| | 881,668 |
|
| Held-to-maturity securities: | |
| | |
| | |
| | |
|
| U.S. Government-sponsored enterprises | 2,003 |
| | 28 |
| | — |
| | 2,031 |
|
| States and political subdivisions | 223,966 |
| | 6,916 |
| | 1,599 |
| | 229,283 |
|
| Corporate | 21,035 |
| | 888 |
| | 692 |
| | 21,231 |
|
| Total held-to-maturity securities | 247,004 |
| | 7,832 |
| | 2,291 |
| | 252,545 |
|
| Total fixed maturity securities | $ | 1,107,477 |
| | 38,273 |
| | 11,537 |
| | 1,134,213 |
|
| | | | | | | | |
| Equity securities: | |
| | |
| | |
| | |
|
| Stock mutual funds | $ | 2,867 |
| | 79 |
| | — |
| | 2,946 |
|
| Bond mutual funds | 14,040 |
| | 265 |
| | 108 |
| | 14,197 |
|
| Common stock | 39 |
| | 3 |
| | 17 |
| | 25 |
|
| Redeemable preferred stock | 819 |
| | 174 |
| | 2 |
| | 991 |
|
| Total equity securities | $ | 17,765 |
| | 521 |
| | 127 |
| | 18,159 |
|
| | | | | | | | | | | | | | | | | | | | | | | |
| Amortized
Cost | | Gross
Unrealized
Gains | | Gross
Unrealized
Losses | | Fair
Value |
| December 31, 2020 | | | |
| (In thousands) | | | |
| |
| Fixed maturity securities: | | | | | | | |
| Available-for-sale: | | | | | | | |
| U.S. Treasury securities | $ | 9,529 | | | 1,797 | | | 0 | | | 11,326 | |
| U.S. Government-sponsored enterprises | 3,490 | | | 1,301 | | | 0 | | | 4,791 | |
| States and political subdivisions | 377,462 | | | 32,751 | | | 548 | | | 409,665 | |
| Corporate: | | | | | | | |
| Financial | 204,160 | | | 31,000 | | | 13 | | | 235,147 | |
| Consumer | 196,648 | | | 30,116 | | | 245 | | | 226,519 | |
| Energy | 81,223 | | | 8,174 | | | 536 | | | 88,861 | |
| All Other | 284,209 | | | 42,554 | | | 82 | | | 326,681 | |
| Commercial mortgage-backed | 225 | | | 0 | | | 4 | | | 221 | |
| Residential mortgage-backed | 118,144 | | | 21,819 | | | 0 | | | 139,963 | |
| Asset-backed | 46,295 | | | 278 | | | 482 | | | 46,091 | |
| Foreign governments | 102 | | | 16 | | | 0 | | | 118 | |
| Total fixed maturity securities | $ | 1,321,487 | | | 169,806 | | | 1,910 | | | 1,489,383 | |
The majorityMost of the Company's equity securities are diversified stock and bond mutual funds.
Valuation of Investments in Fixed Maturity and Equity Securities | | | | | | | | | | | |
Fair Value (In thousands) | March 31, 2021 | | December 31, 2020 |
| | | |
| Equity securities: | | | |
| Stock mutual funds | $ | 3,386 | | | 3,174 | |
| Bond mutual funds | 12,452 | | | 12,354 | |
| Common stock | 1,190 | | | 1,143 | |
| Non-redeemable preferred stock | 276 | | | 281 | |
| Non-redeemable preferred stock fund | 5,062 | | | 5,150 | |
| Total equity securities | $ | 22,366 | | | 22,102 | |
Held-to-maturityVALUATION OF INVESTMENTS
Available-for-sale securities are reported in the consolidated financial statements at amortized cost and available-for-salefair value. Equity securities are reportedmeasured at fair value.
value with the change in fair value recorded through net income. The Company monitors all debt andrecognized net realized gains of $0.3 million on equity securities on an on-going basis relative to changes in credit ratings, market prices, earnings trends and financial performance, in addition to specific region or industry reviews. The assessment of whether other-than-temporary impairments have occurred is based on a case-by-case evaluation of underlying reasonsheld for the decline in fair value. The Company determines other-than-temporary impairment by reviewing relevant evidence related to the specific security issuer as well as the Company's intent to sell the security, or if it is more likely than not that the Company would be required to sell a security before recovery of its amortized cost.
When an other-than-temporary impairment has occurred, the amount of the other-than-temporary impairment recognized in earnings depends on whether the Company intends to sell the security or more likely than not will be required to sell the security before recovery of its amortized cost basis. If the Company intends to sell the security or more likely than not will be required to sell the security before recovery of its amortized cost basis, the other-than-temporary impairment is recognized in earnings equal to the entire difference between the investment's cost and its fair value at the balance sheet date. If the Company does not intend to sell the security and it is more likely than not that the Company will not be required to sell the security before recovery of its amortized
CITIZENS, INC. AND CONSOLIDATED SUBSIDIARIES
Notes to Consolidated Financial Statements, Continued
September 30, 2017
(Unaudited)
cost basis, the other-than-temporary impairment is separated into the following: (a) the amount representing the credit loss; and (b) the amount related to all other factors. The amount of the total other-than-temporary impairment related to the credit loss is recognized in earnings. The amount of the total other-than-temporary impairment related to other factors is recognized in other comprehensive income, net of applicable taxes. The previous amortized cost basis less the other-than-temporary impairment recognized in earnings becomes the new amortized cost basis of the investment. The new amortized cost basis is not adjusted for subsequent recoveries in fair value.
The Company evaluates whether a credit impairment exists for debt securities by considering primarily the following factors: (a) changes in the financial condition of the security's underlying collateral; (b) whether the issuer is current on contractually obligated interest and principal payments; (c) changes in the financial condition, credit rating and near-term prospects of the issuer; (d) the length of time to which the fair value has been less than the amortized cost of the security; and (e) the payment structure of the security. The Company's best estimate of expected future cash flows used to determine the credit loss amount is a quantitative and qualitative process. Quantitative review includes information received from third party sources such as financial statements, pricing and rating changes, liquidity and other statistical information. Qualitative factors include judgments related to business strategies, economic impacts on the issuer and overall judgment related to estimates and industry factors. The Company's best estimate of future cash flows involves assumptions including, but not limited to, various performance indicators, such as historical and projected default and recovery rates, credit ratings, and current delinquency rates. These assumptions require the use of significant management judgment and include the probability of issuer default and estimates regarding timing and amount of expected recoveries, which may include estimating the underlying collateral value. In addition, projections of expected future debt security cash flows may change based upon new information regarding the performance of the issuer.
The primary factors considered in evaluating whether an impairment exists for an equity security include, but are not limited to: (a) the length of time and the extent to which the fair value has been less than the cost of the security; (b) changes in the financial condition, credit rating and near-term prospects of the issuer; (c) whether the issuer is current on contractually obligated payments; and (d) the intent and ability of the Company to retain the investment for a period of time sufficient to allow for recovery.
Other-than-temporary impairment ("OTTI") on one equity security totaling $17,000 was recognized during the nine months ended September 30, 2017 and OTTI of $2.3 million was recognized during the nine months ended September 30, 2016 related to one available-for-sale fixed maturity security and several mutual funds. No OTTI was recorded for either the three months ended September 30, 2017 or September 30, 2016.March 31, 2021 and losses of $1.1 million for the same period ended March 31, 2020.
The Company considers several factors in its review and evaluation of individual investments, using the process described in Part IV, Item 15, Note 2. Investments in the notes to the consolidated financial statements of our Form 10-K to determine whether a credit loss impairment exists. For the three months ended March 31, 2021 and 2020, the Company recorded 0 credit valuation losses on fixed maturity securities.
19
March 31, 2021 | 10-Q 15
CITIZENS, INC. AND CONSOLIDATED SUBSIDIARIES
Notes to Consolidated Financial Statements, Continued | | | | | | | | |
CITIZENS, INC. | NOTES TO CONSOLIDATED FINANCIAL STATEMENTS |
| | (Unaudited) |
September 30, 2017
(Unaudited)
The following tables present the fair values and gross unrealized losses of fixed maturities and equitymaturity securities that are not deemed to have remainedcredit losses, aggregated by investment category and length of time that individual securities have been in a continuous unrealized loss position for the periods indicated.at March 31, 2021 and December 31, 2020.
|
| | | | | | | | | | | | | | | | | | | | | | | | | | | |
| | September 30, 2017 |
| | Less than 12 months | | Greater than 12 months | | Total |
| | Fair Value | | Unrealized Losses | | # of Securities | | Fair Value | | Unrealized Losses | | # of Securities | | Fair Value | | Unrealized Losses | | # of Securities |
| | (In thousands, except for # of securities) |
| Fixed maturities: | | | | | | | | | | | | | | | | | |
| Available-for-sale securities: | | | | | | | | | | | | | | | | | |
| States and political subdivisions | $ | 101,119 |
| | 910 |
| | 77 |
| | 25,467 |
| | 976 |
| | 29 |
| | 126,586 |
| | 1,886 |
| | 106 |
|
| Corporate | 86,326 |
| | 1,287 |
| | 54 |
| | 5,543 |
| | 779 |
| | 9 |
| | 91,869 |
| | 2,066 |
| | 63 |
|
| Residential mortgage-backed | 41 |
| | — |
| | 1 |
| | 161 |
| | 2 |
| | 4 |
| | 202 |
| | 2 |
| | 5 |
|
| Total available-for-sale securities | 187,486 |
| | 2,197 |
| | 132 |
| | 31,171 |
| | 1,757 |
| | 42 |
| | 218,657 |
| | 3,954 |
| | 174 |
|
| Held-to-maturity securities: | |
| | |
| | |
| | |
| | |
| | |
| | |
| | |
| | |
|
| States and political subdivisions | 17,239 |
| | 93 |
| | 26 |
| | 2,736 |
| | 539 |
| | 4 |
| | 19,975 |
| | 632 |
| | 30 |
|
| Corporate | — |
| | — |
| | — |
| | 2,111 |
| | 722 |
| | 2 |
| | 2,111 |
| | 722 |
| | 2 |
|
| Total held-to-maturity securities | 17,239 |
| | 93 |
| | 26 |
| | 4,847 |
| | 1,261 |
| | 6 |
| | 22,086 |
| | 1,354 |
| | 32 |
|
| Total fixed maturities | $ | 204,725 |
| | 2,290 |
| | 158 |
| | 36,018 |
| | 3,018 |
| | 48 |
| | 240,743 |
| | 5,308 |
| | 206 |
|
| Equity securities: | |
| | |
| | |
| | |
| | |
| | |
| | |
| | |
| | |
|
| Bond mutual funds | $ | 8,297 |
| | 134 |
| | 4 |
| | — |
| | — |
| | — |
| | 8,297 |
| | 134 |
| | 4 |
|
| Common stocks | 1 |
| | — |
| | 1 |
| | — |
| | — |
| | — |
| | 1 |
| | — |
| | 1 |
|
| | $ | 8,298 |
| | 134 |
| | 5 |
| | — |
| | — |
| | — |
| | 8,298 |
| | 134 |
| | 5 |
|
| | | | | | | | | | | | | | | | | | | | | | | | | | | | | |
| March 31, 2021 | Less than 12 months | Greater than 12 months | Total |
| (In thousands, except for # of securities) | Fair
Value | Unrealized
Losses | # of
Securities | Fair
Value | Unrealized
Losses | # of
Securities | Fair
Value | Unrealized
Losses | # of
Securities |
| | | | | | | | | |
| Fixed maturity securities: | | | | | | | | |
| Available-for-sale securities: | | | | | | | | | |
| | | | | | | | | |
| States and political subdivisions | $ | 49,464 | | 1,955 | | 48 | | $ | 0 | | 0 | | 0 | | $ | 49,464 | | 1,955 | | 48 | |
| Corporate: | | | | | | | | | |
| Financial | 35,670 | | 1,621 | | 40 | | 0 | | 0 | | 0 | | 35,670 | | 1,621 | | 40 | |
| Consumer | 51,477 | | 3,034 | | 49 | | 0 | | 0 | | 0 | | 51,477 | | 3,034 | | 49 | |
| Energy | 14,151 | | 593 | | 14 | | 2,557 | | 499 | | 6 | | 16,708 | | 1,092 | | 20 | |
| All Other | 74,922 | | 4,261 | | 96 | | 0 | | 0 | | 0 | | 74,922 | | 4,261 | | 96 | |
| | | | | | | | | |
| Residential mortgage-backed | 1,595 | | 46 | | 9 | | 0 | | 0 | | 0 | | 1,595 | | 46 | | 9 | |
| Asset-backed | 6,434 | | 48 | | 11 | | 9,253 | | 15 | | 8 | | 15,687 | | 63 | | 19 | |
| | | | | | | | | |
| Total fixed maturity securities | $ | 233,713 | | 11,558 | | 267 | | $ | 11,810 | | 514 | | 14 | | $ | 245,523 | | 12,072 | | 281 | |
As | | | | | | | | | | | | | | | | | | | | | | | | | | | | | |
| December 31, 2020 | Less than 12 months | Greater than 12 months | Total |
| (In thousands, except for # of securities) | Fair
Value | Unrealized
Losses | # of
Securities | Fair
Value | Unrealized
Losses | # of
Securities | Fair
Value | Unrealized
Losses | # of
Securities |
| | | | | | | | | |
| Fixed maturity securities: | | | | | | | | |
| Available-for-sale securities: | | | | | | | | | |
| | | | | | | | | |
| States and political subdivisions | $ | 32,487 | | 548 | | 27 | | $ | 0 | | 0 | | 0 | | $ | 32,487 | | 548 | | 27 | |
| Corporate: | | | | | | | | | |
| Financial | 1,308 | | 13 | | 1 | | 0 | | 0 | | 0 | | 1,308 | | 13 | | 1 | |
| Consumer | 10,740 | | 230 | | 5 | | 1,667 | | 15 | | 1 | | 12,407 | | 245 | | 6 | |
| Energy | 6,350 | | 536 | | 8 | | 0 | | 0 | | 0 | | 6,350 | | 536 | | 8 | |
| All Other | 9,418 | | 82 | | 11 | | 0 | | 0 | | 0 | | 9,418 | | 82 | | 11 | |
| Commercial mortgage-backed | 221 | | 4 | | 1 | | 0 | | 0 | | 0 | | 221 | | 4 | | 1 | |
| Residential mortgage-backed | 83 | | 0 | | 1 | | 0 | | 0 | | 0 | | 83 | | 0 | | 1 | |
| Asset-backed | 26,353 | | 481 | | 26 | | 994 | | 1 | | 1 | | 27,347 | | 482 | | 27 | |
| Total fixed maturity securities | $ | 86,960 | | 1,894 | | 80 | | $ | 2,661 | | 16 | | 2 | | $ | 89,621 | | 1,910 | | 82 | |
In each category of September 30, 2017, the Company had 42 available-for-saleour fixed maturity securities and 6 held-to-maturity fixed maturity securities that were in an unrealized loss position for greater than 12 months. There were no equity securities in an unrealized loss position for greater than 12 months as of September 30, 2017.
CITIZENS, INC. AND CONSOLIDATED SUBSIDIARIES
Notes to Consolidated Financial Statements, Continued
September 30, 2017
(Unaudited)
|
| | | | | | | | | | | | | | | | | | | | | | | | | | | |
| | December 31, 2016 |
| | Less than 12 months | | Greater than 12 months | | Total |
| | Fair Value | | Unrealized Losses | | # of Securities | | Fair Value | | Unrealized Losses | | # of Securities | | Fair Value | | Unrealized Losses | | # of Securities |
| | (In thousands, except for # of securities) |
| Fixed maturities: | | | | | | | | | | | | | | | | | |
| Available-for-sale securities: | | | | | | | | | | | | | | | | | |
| States and political subdivisions | $ | 202,788 |
| | 3,513 |
| | 184 |
| | 8,018 |
| | 1,509 |
| | 8 |
| | 210,806 |
| | 5,022 |
| | 192 |
|
| Corporate | 91,527 |
| | 3,578 |
| | 70 |
| | 6,102 |
| | 644 |
| | 8 |
| | 97,629 |
| | 4,222 |
| | 78 |
|
| Residential mortgage-backed | 116 |
| | 1 |
| | 4 |
| | 105 |
| | 1 |
| | 2 |
| | 221 |
| | 2 |
| | 6 |
|
| Total available-for-sale securities | 294,431 |
| | 7,092 |
| | 258 |
| | 14,225 |
| | 2,154 |
| | 18 |
| | 308,656 |
| | 9,246 |
| | 276 |
|
| Held-to-maturity securities: | |
| | | | |
| | |
| | |
| | |
| | |
| | |
| | |
|
| States and political subdivisions | 43,659 |
| | 1,562 |
| | 47 |
| | 509 |
| | 37 |
| | 1 |
| | 44,168 |
| | 1,599 |
| | 48 |
|
| Corporate | 3,587 |
| | 12 |
| | 3 |
| | 2,171 |
| | 680 |
| | 2 |
| | 5,758 |
| | 692 |
| | 5 |
|
| Total held-to-maturity securities | 47,246 |
| | 1,574 |
| | 50 |
| | 2,680 |
| | 717 |
| | 3 |
| | 49,926 |
| | 2,291 |
| | 53 |
|
| Total fixed maturities | $ | 341,677 |
| | 8,666 |
| | 308 |
| | 16,905 |
| | 2,871 |
| | 21 |
| | 358,582 |
| | 11,537 |
| | 329 |
|
| Equity securities: | | | | | | | | | | | | | | | | | |
| Bond mutual funds | $ | 10,160 |
| | 108 |
| | 2 |
| | — |
| | — |
| | — |
| | 10,160 |
| | 108 |
| | 2 |
|
| Common stock | — |
| | — |
| | — |
| | — |
| | 17 |
| | 1 |
| | — |
| | 17 |
| | 1 |
|
| Redeemable preferred stocks | 201 |
| | 2 |
| | 2 |
| | — |
| | — |
| | — |
| | 201 |
| | 2 |
| | 2 |
|
| Total equities | $ | 10,361 |
| | 110 |
| | 4 |
| | — |
| | 17 |
| | 1 |
| | 10,361 |
| | 127 |
| | 5 |
|
We have reviewed these securities in an unrealized loss position for the periods ended September 30, 2017 and December 31, 2016 and determined that no other-than-temporary impairment exists that have not been recognized based on our evaluation of the credit worthiness of the issuers and the fact thatdescribed above, we do not intend to sell our investments and it is not more likely than not that the investments nor is it likely that weCompany will be required to sell the securitiesinvestments before recovery of their amortized cost bases which may bebases.
We did not recognize credit losses on securities with unrealized losses that were due to interest rate sensitivity and changes in credit spreads. We believe that fluctuations caused by movements in interest rates and credit spreads have little bearing on the recoverability of our investments. The fair value is expected to recover as the securities approach maturity. We continue to monitor all securities on an on-going basis, and future information may become available which could result in other-than-temporary impairments being recorded.
21
March 31, 2021 | 10-Q 16
CITIZENS, INC. AND CONSOLIDATED SUBSIDIARIES
Notes to Consolidated Financial Statements, Continued
September 30, 2017
(Unaudited) | | | | | | | | |
CITIZENS, INC. | NOTES TO CONSOLIDATED FINANCIAL STATEMENTS |
| | (Unaudited) |
The amortized cost and fair value of fixed maturity securities at September 30, 2017March 31, 2021 by contractual maturity are shown in the table below. Actual maturities may differ from contractual maturities because borrowers may have the right to call or prepay obligations with or without call or prepayment penalties. Securities not due at a single maturity date have been reflected based upon final stated maturity.
| | | | September 30, 2017 | |
| | Amortized Cost | | Fair Value | |
| | (In thousands) | |
| Available-for-sale securities: | | | | |
| March 31, 2021 | | March 31, 2021 | Amortized
Cost | | Fair
Value |
| (In thousands) | | (In thousands) | |
| Fixed maturity securities: | | Fixed maturity securities: | | | |
| Due in one year or less | $ | 47,490 |
| | 47,913 |
| Due in one year or less | $ | 25,079 | | | 25,438 | |
| Due after one year through five years | 92,764 |
| | 96,733 |
| Due after one year through five years | 114,900 | | | 125,058 | |
| Due after five years through ten years | 117,822 |
| | 125,611 |
| Due after five years through ten years | 214,052 | | | 231,241 | |
| Due after ten years | 662,624 |
| | 684,987 |
| Due after ten years | 978,601 | | | 1,038,850 | |
| Total available-for-sale securities | 920,700 |
| | 955,244 |
| |
| Held-to-maturity securities: | |
| | |
| |
| Due in one year or less | 20,245 |
| | 20,446 |
| |
| Due after one year through five years | 44,884 |
| | 46,472 |
| |
| Due after five years through ten years | 46,584 |
| | 48,740 |
| |
| Due after ten years | 124,640 |
| | 128,406 |
| |
| Total held-to-maturity securities | 236,353 |
| | 244,064 |
| |
| Total fixed maturities | $ | 1,157,053 |
| | 1,199,308 |
| |
| Total fixed maturity securities | | Total fixed maturity securities | $ | 1,332,632 | | | 1,420,587 | |
The Company uses the specific identification method of the individual security to determine the cost basis used in the calculation of realized gains and losses related to security sales.
| | | | Fixed Maturities, Available-for-Sale | | Equity Securities | | | | Three Months Ended | |
| | Three Months Ended | | Nine Months Ended | | Three Months Ended | | Nine Months Ended | |
| | September 30, | | September 30, | | September 30, | | September 30, | |
| | 2017 | | 2016 | | 2017 | | 2016 | | 2017 | | 2016 | | 2017 | | 2016 | |
| Fixed Maturity Securities, Available-for-Sale | | Fixed Maturity Securities, Available-for-Sale | | | March 31, | |
| (In thousands) | | (In thousands) | | | 2021 | 2020 | |
| | (In thousands) | | | | |
| Proceeds | $ | — |
| | — |
| | 508 |
| | — |
| | — |
| | — |
| | 1,940 |
| | 403 |
| Proceeds | | | $ | 7,254 | | 940 | | |
| Gross realized gains | $ | — |
| | — |
| | 6 |
| | — |
| | — |
| | — |
| | — |
| | 40 |
| Gross realized gains | | | $ | 100 | | 0 | | |
| Gross realized losses | $ | — |
| | — |
| | — |
| | — |
| | — |
| | — |
| | 30 |
| | 36 |
| Gross realized losses | | | $ | 1 | | 38 | | |
There were no sales of available-for-saleThe Company sold 18 and 1 AFS fixed maturity securities forduring the three month periodmonths ended September 30, 2017 or 2016. ThereMarch 31, 2021 and 2020, respectively. NaN equity securities were no securities sold from the held-to-maturity portfolio forduring the three and nine months ended September 30, 2017 or 2016. Realized investment losses recorded for the three month period ending September 30, 2017 were due to fixed maturity call activity.March 31, 2021 and 2020.
(6) FAIR VALUE MEASUREMENTS CITIZENS, INC. AND CONSOLIDATED SUBSIDIARIES
Notes to Consolidated Financial Statements, Continued
September 30, 2017
(Unaudited)
(6) Fair Value Measurements
Fair value is the price that would be received to sell an asset or paid to transfer a liability in an orderly transaction between market participants at the measurement date. We hold available-for-saleAFS fixed maturity securities and equity securities, which are carried at fair value. We also report our equity securities at fair value with changes in fair value reported through the consolidated statements of operations and comprehensive income (loss).
Fair value measurements are generally based upon observable and unobservable inputs. Observable inputs reflect market data obtained from independent sources, while unobservable inputs reflect our view of market assumptions in the absence of observable market information. We utilize valuation techniques that maximize the use of observable inputs and minimize the use of unobservable inputs. All assets and liabilities carried at fair value are required to be classified and disclosed in one of the following three categories:
•Level 1 - Quoted prices for identical instruments in active markets.
•Level 2 - Quoted prices for similar instruments in active markets; quoted prices for identical or similar instruments in markets that are not active; and model-derived valuations whose inputs or whose significant value drivers are observable.
•Level 3 - Instruments whose significant value drivers are unobservable.
Level 1 primarily consists of financial instruments whose value is based on quoted market prices such as U.S. Treasury securities and actively traded mutual fund and stock investments.
| | | | | | | | |
CITIZENS, INC. | NOTES TO CONSOLIDATED FINANCIAL STATEMENTS |
| | (Unaudited) |
Level 2 includes those financial instruments that are valued by independent pricing services or broker quotes. These pricing models are primarily industry-standard models that consider various inputs, such as interest rates, credit spreads and foreign exchange rates for the underlying financial instruments. All significant inputs are observable or derived from observable information in the marketplace or are supported by observable levels at which transactions are executed in the marketplace. Financial instruments in this category primarily include corporate securities, U.S. Government-sponsored enterprise securities, municipal securities issued by states and political subdivisions and certain mortgage and asset-backed securities.
Level 3 is comprised of financial instruments whose fair value is estimated based on non-binding broker prices utilizing significant inputs not based on or corroborated by readily available market information. There were no securitiesReal estate held-for-sale is in this category at September 30, 2017.category.
CITIZENS, INC. AND CONSOLIDATED SUBSIDIARIES
Notes to Consolidated Financial Statements, Continued
September 30, 2017
(Unaudited)
The following tables set forth our assets that are measured at fair value on a recurring basis as of the dates indicated.
| | | | September 30, 2017 | |
| Available-for-sale investments | Level 1 | | Level 2 | | Level 3 | | Total Fair Value | |
| | (In thousands) | |
| Financial assets: | | | | | | | | |
| Fixed maturities: | | | | | | | | |
| March 31, 2021 | | March 31, 2021 | Level 1 | | Level 2 | | Level 3 | | Total
Fair Value |
| (In thousands) | | (In thousands) | |
| Financial Assets | | Financial Assets | |
| Fixed maturity securities available-for-sale | | Fixed maturity securities available-for-sale | | | | | | | |
| U.S. Treasury and U.S. Government-sponsored enterprises | $ | 12,002 |
| | 4,519 |
| | — |
| | 16,521 |
| U.S. Treasury and U.S. Government-sponsored enterprises | $ | 11,021 | | | 4,517 | | | 0 | | | 15,538 | |
| States and political subdivisions | — |
| | 571,995 |
| | — |
| | 571,995 |
| States and political subdivisions | 0 | | | 393,859 | | | 0 | | | 393,859 | |
| Corporate | — |
| | 364,498 |
| | — |
| | 364,498 |
| Corporate | 52 | | | 834,738 | | | 0 | | | 834,790 | |
| | Residential mortgage-backed | — |
| | 2,106 |
| | — |
| | 2,106 |
| Residential mortgage-backed | 0 | | | 132,146 | | | 0 | | | 132,146 | |
| Asset-backed | | Asset-backed | 0 | | | 44,138 | | | 0 | | | 44,138 | |
| Foreign governments | — |
| | 124 |
| | — |
| | 124 |
| Foreign governments | 0 | | | 116 | | | 0 | | | 116 | |
| Total fixed maturities | 12,002 |
| | 943,242 |
| | — |
| | 955,244 |
| |
| Equity securities: | |
| | |
| | |
| | |
| |
| Total fixed maturity securities available-for-sale | | Total fixed maturity securities available-for-sale | 11,073 | | | 1,409,514 | | | 0 | | | 1,420,587 | |
| | Equity securities | | Equity securities | | | | | | | |
| Stock mutual funds | 3,168 |
| | — |
| | — |
| | 3,168 |
| Stock mutual funds | 3,386 | | | 0 | | | 0 | | | 3,386 | |
| Bond mutual funds | 12,395 |
| | — |
| | — |
| | 12,395 |
| Bond mutual funds | 12,452 | | | 0 | | | 0 | | | 12,452 | |
| Common stock | 23 |
| | — |
| | — |
| | 23 |
| Common stock | 1,190 | | | 0 | | | 0 | | | 1,190 | |
| Redeemable preferred stock | 560 |
| | — |
| | — |
| | 560 |
| |
| Non-redeemable preferred stock | | Non-redeemable preferred stock | 276 | | | 0 | | | 0 | | | 276 | |
| Non-redeemable preferred stock fund | | Non-redeemable preferred stock fund | 5,062 | | | 0 | | | 0 | | | 5,062 | |
| Total equity securities | 16,146 |
| | — |
| | — |
| | 16,146 |
| Total equity securities | 22,366 | | | 0 | | | 0 | | | 22,366 | |
Other long-term investments (1) | | Other long-term investments (1) | 0 | | | 0 | | | 0 | | | 16,982 | |
| Total financial assets | $ | 28,148 |
| | 943,242 |
| | — |
| | 971,390 |
| Total financial assets | $ | 33,439 | | | 1,409,514 | | | 0 | | | 1,459,935 | |
(1) In accordance with Subtopic 820-10, certain investments that are measured at fair value using the net asset value per share (or its equivalent) practical expedient have not been classified in the fair value hierarchy. The fair value amounts presented in this table are intended to permit reconciliation of the fair value hierarchy to the amounts presented in the balance sheet.
|
| | | | | | | | | | | | |
| | December 31, 2016 |
| Available-for-sale investments | Level 1 | | Level 2 | | Level 3 | | Total Fair Value |
| | (In thousands) |
| Financial assets: | | | | | | | |
| Fixed maturities: | | | | | | | |
| U.S. Treasury and U.S. Government-sponsored enterprises | $ | 12,190 |
| | 8,502 |
| | — |
| | 20,692 |
|
| States and political subdivisions | — |
| | 573,274 |
| | — |
| | 573,274 |
|
| Corporate | — |
| | 285,099 |
| | — |
| | 285,099 |
|
| Commercial mortgage-backed | — |
| | — |
| | 51 |
| | 51 |
|
| Residential mortgage-backed | — |
| | 2,426 |
| | — |
| | 2,426 |
|
| Foreign governments | — |
| | 126 |
| | — |
| | 126 |
|
| Total fixed maturities | 12,190 |
| | 869,427 |
| | 51 |
| | 881,668 |
|
| Equity securities: | |
| | |
| | |
| | |
|
| Stock mutual funds | 2,946 |
| | — |
| | — |
| | 2,946 |
|
| Bond mutual funds | 14,197 |
| | — |
| | — |
| | 14,197 |
|
| Common stock | 25 |
| | — |
| | — |
| | 25 |
|
| Redeemable preferred stock | 991 |
| | — |
| | — |
| | 991 |
|
| Total equity securities | 18,159 |
| | — |
| | — |
| | 18,159 |
|
| Total financial assets | $ | 30,349 |
| | 869,427 |
| | 51 |
| | 899,827 |
|
CITIZENS, INC. AND CONSOLIDATED SUBSIDIARIES
Notes to Consolidated Financial Statements, Continued
September 30, 2017
(Unaudited) | | | | | | | | |
CITIZENS, INC. | NOTES TO CONSOLIDATED FINANCIAL STATEMENTS |
| | (Unaudited) |
| | | | | | | | | | | | | | | | | | | | | | | |
| December 31, 2020 | Level 1 | | Level 2 | | Level 3 | | Total
Fair Value |
| (In thousands) | | | |
| Financial Assets | | | | | | | |
| Fixed maturity securities available-for-sale | | | | | | | |
| U.S. Treasury and U.S. Government-sponsored enterprises | $ | 11,326 | | | 4,791 | | | 0 | | | 16,117 | |
| States and political subdivisions | 0 | | | 409,665 | | | 0 | | | 409,665 | |
| Corporate | 52 | | | 877,156 | | | 0 | | | 877,208 | |
| Commercial mortgage-backed | 0 | | | 221 | | | 0 | | | 221 | |
| Residential mortgage-backed | 0 | | | 139,963 | | | 0 | | | 139,963 | |
| Asset-backed | 0 | | | 46,091 | | | 0 | | | 46,091 | |
| Foreign governments | 0 | | | 118 | | | 0 | | | 118 | |
| Total fixed maturity securities available-for-sale | 11,378 | | | 1,478,005 | | | 0 | | | 1,489,383 | |
| | | | | | | |
| Equity securities | | | | | | | |
| Stock mutual funds | 3,174 | | | 0 | | | 0 | | | 3,174 | |
| Bond mutual funds | 12,354 | | | 0 | | | 0 | | | 12,354 | |
| Common stock | 1,143 | | | 0 | | | 0 | | | 1,143 | |
| Non-redeemable preferred stock | 281 | | | 0 | | | 0 | | | 281 | |
| Non-redeemable preferred stock fund | 5,150 | | | 0 | | | 0 | | | 5,150 | |
| Total equity securities | 22,102 | | | 0 | | | 0 | | | 22,102 | |
Other long-term investments (1) | 0 | | | 0 | | | 0 | | | 11,923 | |
| Total financial assets | $ | 33,480 | | | 1,478,005 | | | 0 | | | 1,523,408 | |
| (1) In accordance with Subtopic 820-10, certain investments that are measured at fair value using the net asset value per share (or its equivalent) practical expedient have not been classified in the fair value hierarchy. The fair value amounts presented in this table are intended to permit reconciliation of the fair value hierarchy to the amounts presented in the balance sheet. |
Financial Instruments Valuation
FINANCIAL INSTRUMENTS VALUATION
FINANCIAL INSTRUMENTS CARRIED AT FAIR VALUE
Fixed maturity securities, available-for-sale.available-for-sale. At September 30, 2017,March 31, 2021, our fixed maturity securities, valued using a third-party pricing source, totaled $943.2 million$1.4 billion for Level 2 assets and comprised 97.1%96.5% of total reported fair value of our financial assets. The Level 1 and Level 2 valuations are reviewed and updated quarterly through random testing by comparisons to separate pricing models, other third-party pricing services, and back tested to recent trades. In addition, we obtain information annually relative to the third-party pricing models and review model parameters for reasonableness. There were no0 Level 3 assets at September 30, 2017.March 31, 2021. For the ninethree months ended September 30, 2017,March 31, 2021, there were no material changes to the valuation methods or assumptions used to determine fair values, and no0 broker or third partythird-party prices were changed from the values received.
Equity securities, available-for-sale.securities. Our available-for-sale equity securities are classified as Level 1 assets as their fair values are based upon quoted market prices.
Private equity funds. The Company considers the net asset value ("NAV") to represent the value of the investment fund and is measured by the total value of assets minus the total value of liabilities. The following table presents additionaltables include information about fixed maturity securitiesrelated to our investments in private equity funds that calculate NAV per share. For these investments,
| | | | | | | | |
CITIZENS, INC. | NOTES TO CONSOLIDATED FINANCIAL STATEMENTS |
| | (Unaudited) |
which are measured at fair value on a recurring basis, thatwe use the NAV per share to measure fair value. These investments are classified as Level 3 assets and forincluded in other long-term investments on the consolidated balance sheets.
| | | | | | | | | | | | | | | | | | | | | | | | | | |
| | March 31, 2021 | | December 31, 2020 |
| | Fair Value
Using NAV Per Share | Unfunded Commit-
ments | Life
in years | | Fair Value
Using NAV Per Share | Unfunded Commit-
ments | Life
in years |
| (In thousands, except years) | |
| Private equity funds | | | | | | | |
| Middle market | Investments in privately-originated, performing senior secured debt primarily in North America-based companies | $ | 8,457 | | 31,777 | | 10 | | $ | 10,542 | | 29,783 | | 10 |
Term
liquidity facility | Investments in a facility established by the U.S. Federal Reserve that provides financing to U.S. company market participants for levered asset purchases with a focus on asset-backed, commercial mortgage and collateralized loan obligation markets | 36 | | 0 | | 1 | | 1,381 | | 0 | | 3 |
| Late-stage growth | Investments in private late-stage, established companies seeking capital to accelerate growth prior to an IPO or sale | 6,199 | | 14,198 | | 7 | | 0 | | 16,291 | | 7 |
| Infrastructure | Investments in climate infrastructure assets, focusing on renewable power generation in wind and solar energy | 2,290 | | 17,485 | | 12 | | 0 | | 17,497 | | 12 |
| Total private equity funds | $ | 16,982 | | 63,460 | | | | $ | 11,923 | | 63,571 | | |
Our private equity fund investments are not redeemable because distributions from the funds will be received when the underlying investments of the funds are liquidated. The life spans indicated above may be shortened or extended at the fund manager's discretion, typically in one or two-year increments.
We initially estimate the fair value of investments in private equity funds by reference to the transaction price. Subsequently, we obtain the fair value of these investments from net asset value information provided by the general partner or manager of the investments, the financial statements of which we have utilized significant unobservable inputs to determine fair value.are audited annually.
|
| | | | | | |
| September 30,
2017 | | December 31,
2016 |
| | (In thousands) |
| | | | |
| Balance at beginning of period | $ | 51 |
| | 145 |
|
| Total realized and unrealized gains (losses) |
|
| |
|
|
| Included in net income | — |
| | — |
|
| Included in other comprehensive income | — |
| | (4 | ) |
| Principal paydowns | (51 | ) | | (90 | ) |
| Transfer in and (out) of Level 3 | — |
| | — |
|
| Balance at end of period | $ | — |
| | 51 |
|
We review the fair value hierarchy classifications each reporting period. Changes in the observability of the valuation attributes may result in a reclassification of certain financial assets. Such reclassifications are reported as transfers in and out of Level 3 at the beginning fair value for the reporting period in which the changes occur. There were no0 transfers in or out of Level 3.3 during the three months ended March 31, 2021.
Financial Instruments not Carried at Fair ValueFINANCIAL INSTRUMENTS NOT CARRIED AT FAIR VALUE
Estimates of fair values are made at a specific point in time, based on relevant market prices and information about the financial instruments. The estimated fair values of financial instruments presented below are not necessarily indicative of the amounts the Company might realize in actual market transactions.
25
March 31, 2021 | 10-Q 20
CITIZENS, INC. AND CONSOLIDATED SUBSIDIARIES
Notes to Consolidated Financial Statements, Continued | | | | | | | | |
CITIZENS, INC. | NOTES TO CONSOLIDATED FINANCIAL STATEMENTS |
| | (Unaudited) |
September 30, 2017
(Unaudited)
The carrying amount and fair value for the financial assets and liabilities on the consolidated balance sheets not otherwise disclosed for the periods indicated are as follows:
| | | | | | | | | | | | March 31, 2021 | | December 31, 2020 |
| (In thousands) | | (In thousands) | Carrying
Value | | Fair
Value | | Carrying
Value | | Fair
Value |
| | September 30, 2017 | | December 31, 2016 | |
| Financial Assets: | | Financial Assets: | | | | | | | |
| Policy loans | | Policy loans | $ | 82,674 | | | 82,674 | | | 83,318 | | | 83,318 | |
| Mortgage loans | | Mortgage loans | 153 | | | 190 | | | 157 | | | 195 | |
| | Carrying Value | | Fair Value | | Carrying Value | | Fair Value | |
| | (In thousands) | |
| Financial assets: | | | | | | | | |
| Fixed maturities, held-to-maturity | $ | 236,353 |
| | 244,064 |
| | 247,004 |
| | 252,545 |
| |
| Mortgage loans | 197 |
| | 229 |
| | 232 |
| | 269 |
| |
| Policy loans | 71,215 |
| | 71,215 |
| | 66,672 |
| | 66,672 |
| |
| Short-term investments | — |
| | — |
| | 508 |
| | 508 |
| |
| Cash and cash equivalents | 45,000 |
| | 45,000 |
| | 35,510 |
| | 35,510 |
| Cash and cash equivalents | 19,493 | | | 19,493 | | | 34,131 | | | 34,131 | |
| Financial liabilities: | |
| | |
| | |
| | |
| |
| Financial Liabilities: | | Financial Liabilities: | | | | | | | |
| Annuity - investment contracts | 54,470 |
| | 52,711 |
| | 50,952 |
| | 52,173 |
| Annuity - investment contracts | 61,716 | | | 68,360 | | | 60,861 | | | 71,547 | |
Fair values for fixed income securities, which are characterized as Level 2 assets in the fair value hierarchy, are based on quoted market prices for the same or similar securities. In cases where quoted market prices are not available, fair values are based on estimates using present value or other assumptions, including a discount rate and estimates of future cash flows.
Mortgage loans are secured principally by residential properties. Weighted average interest rates for these loans were approximately 6.56% at September 30, 2017 and 6.80% at December 31, 2016. At September 30, 2017, maturities ranged from 1 to 25 years. Management estimated the fair value using an annual interest rate of 6.25% at September 30, 2017. Our mortgage loans are considered Level 3 assets in the fair value hierarchy.
Policy loans.Policy loans had a weighted average annual interest rate of 7.71% as of September 30, 20177.7% at March 31, 2021 and December 31, 2016,2020, and no specified maturity dates. The aggregate fair value of policy loans approximates the carrying value reflected on the consolidated balance sheets. These loans typically carry an interest rate that is tied to the crediting rate applied to the related policy and contract reserves. Policy loans are an integral part of the life insurance policies we have in force, cannot be valued separately and are not marketable. Therefore, the fair value of policy loans approximates the carrying value and policy loans are considered Level 3 assets in the fair value hierarchy.
TheMortgage loans. Mortgage loans are secured principally by residential properties. Weighted average interest rates for these loans were approximately 6.4% at March 31, 2021 and December 31, 2020. At March 31, 2021, maturities ranged from 7 to 19 years. Management estimated the fair value using an annual interest rate of short-term investments approximate carrying value due to their short-term nature.6.25% at March 31, 2021. Our short-term investmentsmortgage loans are considered Level 23 assets in the fair value hierarchy.hierarchy and are included in other long-term investments on the consolidated balance sheets.
Cash and cash equivalents.The fair value of cash and cash equivalents approximate carrying value and are characterized as Level 1 assets in the fair value hierarchy.
Annuity liabilities.The fair value of the Company's liabilities under annuity contract policies, which are considered Level 3 assets,liabilities, was estimated at September 30, 2017March 31, 2021 and December 31, 2020 using discounted cash flows based upon spot rates ranging from 1.49% to 3.51% based upon swap rates adjusted for various risk adjustments.adjustments ranging from 0.20% to 2.86% and 0.22% to 2.34%, respectively. The fair value of liabilities under all insurance contracts are taken into consideration in the overall management of interest rate risk, which seeks to minimize exposure to changing interest rates through the matching of investment maturities with amounts due under insurance contracts.
Other long-term investments. Financial instruments included in other long-term investments are classified in various levels of the fair value hierarchy. The following table summarizes the carrying amounts of these investments.
| | | | | | | | | | | |
Carrying Value (In thousands) | March 31, 2021 | | December 31, 2020 |
| Other long-term investments: | | | |
| Private equity funds | $ | 16,982 | | | 18,135 | |
| FHLB common stock | 190 | | | 190 | |
| Mortgage loans | 153 | | | 157 | |
| All other investments | 22 | | | 8,811 | |
| Total other long-term investments | $ | 17,347 | | | 27,293 | |
26
March 31, 2021 | 10-Q 21
CITIZENS, INC. AND CONSOLIDATED SUBSIDIARIES
Notes to Consolidated Financial Statements, Continued
September 30, 2017
(Unaudited) | | | | | | | | |
CITIZENS, INC. | NOTES TO CONSOLIDATED FINANCIAL STATEMENTS |
| | (Unaudited) |
(7) Short Duration Contracts
Special Property Insurance (AlliedWe are a member of the Federal Home Loan Bank ("FHLB") of Dallas and Fire)
The Company's short duration contracts consist of credit life and credit disabilitysuch membership requires members to own stock in the Life segment and property insuranceFHLB. Our FHLB stock is carried at amortized cost, which approximates fair value. Included in the Home Service segment. The following table presents information on changesall other investments in the liability for credit life, credit disability, and property policy and contract claims2020 was a Rabbi Trust holding $8.8 million for the periods ended September 30, 2017 and September 30, 2016.benefit of our former Chief Executive Officer, Geoffrey Kolander, which represented his severance payment under the terms of his employment agreement in connection with his resignation following a change in control of the Company, that was paid during the first quarter of 2021.
|
| | | | | | |
| | September 30, | | September 30, |
| | 2017 | | 2016 |
| | | | |
| Policy claims payable at January 1 | $ | 543 |
| | 514 |
|
| Less: reinsurance recoverable | — |
| | — |
|
| Net balance at January 1 | 543 |
| | 514 |
|
| Add claims incurred, related to: | |
| | |
|
| Current year | 1,435 |
| | 1,642 |
|
| Prior years | (11 | ) | | (110 | ) |
| | 1,424 |
| | 1,532 |
|
| Deduct claims paid, related to: | |
| | |
|
| Current year | 1,106 |
| | 1,243 |
|
| Prior years | 407 |
| | 269 |
|
| | 1,513 |
| | 1,512 |
|
| Net balance September 30 | 454 |
| | 534 |
|
| Plus: reinsurance recoverable | — |
| | — |
|
| Policy claims payable, September 30 | $ | 454 |
| | 534 |
|
QUALIFICATION OF LIFE PRODUCTS (8) Commitments and Contingencies
Qualification of Life Products
As of December 31, 2014, we determinedWe have previously reported that a portion of the life insurance policies issued by our subsidiary insurance companies failed to qualify for the favorable U.S. federal income tax treatment afforded by SectionSections 7702 and 72(s) of the Internal Revenue Code ("IRC") of 1986. This tax code section allows for qualifying products sold to clients to have favorable tax treatment such as the product's inside build up is not taxable. Because these policies were sold with the intention that they would qualify for this favorable tax treatment, holders of these policies and the Company may now be subject to additional tax liabilities. The policies at issue were sold most substantially to non-U.S. citizens residing abroad and to a lesser extent domestically. Based upon a review of the options available to the Company,Further, we have determined we will not remediatethat the structure of our endowments and life products under IRC 7702 we havepolicies sold to non-U.S. citizens. We do intendpersons, which were novated to remediateCICA Ltd. effective July 1, 2018, may have inadvertently generated U.S. source income over time, which subjected the domestic products we have soldCompany to U.S. citizens. In addition, as part of our continuing review, we determined in July 2015 that certain annuity contracts do not contain qualifying languagetax withholding and information reporting requirements for the Company under IRC 72(s) as intended that would have provided for favorable tax treatmentChapters 3 or 4 of the annuities. This issue affects both our domestic and international contract holders. The Company has continued to refine the understanding of the tax failures as previously reported by preparing an individual policy calculation and has reflected the related exposure for the current reporting period as noted below. Failure of these policies to qualify under IRC Sections 7702 and 72(s) has resulted in additional liabilities and expenses as described below.IRC. The products have been and continue to be appropriately reported as life insurance under U.S. GAAP for financial reporting.
The failure of theseTo satisfy the Internal Revenue Service ("IRS") tax withholding and information reporting requirements for the novated policies sold to qualify under Sections 7702 and 72(s) results in an estimated liabilitynon-U.S. persons as of September 30, 2017 of $10.7 million, afterdescribed above, the Company submitted withholding tax related to projected IRS toll charges and fees reported in other general expenses of $10.4 million and reserves increases to bring policies into compliance totaling $0.3 million. The range of financial estimates relative to this issue is $5.6 million to $34.0 million, after tax. This estimated range includes projected toll charges and fees payablereturns to the IRS as well as estimated increased payout obligations to currentin December 2019, and former holders of non-compliant domestic life insurance policies expected
CITIZENS, INC. AND CONSOLIDATED SUBSIDIARIES
Notes to Consolidated Financial Statements, Continued
September 30, 2017
(Unaudited)
to result from remediation of those policies.amended returns in August 2020 and paid the associated withholding tax. The estimated liabilityIRS processed these withholding tax returns in 2021 and the estimated range will be updated as we continue to refine our estimates. The amount of our liabilities and expenses depends on a number of uncertainties, including the number of prior tax years for which we may be liable to the IRS, the number of domestic life insurance policies we will be required to remediate, and the methodology applicable to the calculation of taxable benefits under non-compliant policies. Given the range of potential outcomes and the significant variables assumed in establishing our estimates, actual amounts incurred may exceed our reserve and also could exceed the high end of our estimated range of liabilities and expenses. To the extent the amount reserved by the Company is insufficient to meet the actual amount of our liability and expenses, or if our estimates of those liabilities and expenses change in the future, our financial condition and results of operation may be materially adversely affected. Management believes that based upon current information we have recorded the best estimate liability to date.considers this matter closed.
Accruals for loss contingencies are recorded when it is probable that a liability has been incurred and the amount can be reasonably estimated. The process of determining our best estimate and the estimated range was a complex undertaking including insight from external consultants and involved management’s judgment based upon a variety of factors known at the time. We recorded additional general expenses of $1.6 million in the first nine months of 2017 related to our 7702 and 72(s) issues. Additional costs will be incurred in 2017 associated with these issues. We believe these costs could be an additional $0.75 million to $1.25 million, but due to the uncertainty of actions, we cannot reasonably estimate these costs with any reliability. Actual amounts incurred may exceed this estimate and will be recorded as they become probable and can be reasonably estimated.LITIGATION AND REGULATORY ACTIONS
Unclaimed Property Contingencies
The Company was informed in 2012 by the Louisiana Department of Treasury, Arkansas Auditor of State and the Texas State Comptroller, that they authorized an audit of Citizens, Inc. and its affiliates for compliance with unclaimed property laws. This audit is being conducted by Verus Financial LLC on behalf of the states.
The external audit may result in additional payments to beneficiaries, additional escheatment of funds deemed abandoned under state laws, administrative penalties, interest, and changes to the Company's procedures for the identification and escheatment of abandoned property. The Company believes additional escheatment of funds in Arkansas or Texas will not be material to our financial condition or results of operations. However, additional escheatment of funds in Louisiana, which may subsequently be deemed abandoned under the Louisiana Department of Treasury’s audit, could be substantial for SPLIC if the Louisiana Department of Treasury chooses to disregard recent court decisions regarding unclaimed property litigation in favor of the insurance industry. At this time, the Company is not able to estimate any of these possible amounts.
Litigation
From time to time, we are subject to legal and regulatory actions relating to our business. We defend all claims vigorously. As a result, wemay incur defense costs, including attorneys' fees, and other direct litigation costs associated with defending claims. If we suffer an adverse judgment as a result of litigation claims, it could have a material adverse effect on our business, results of operations and financial condition.
CONTRACTUAL OBLIGATIONS
As of March 31, 2021, CICA Ltd. is committed to fund investments up to $68.5 million related to private equity funds and other investments.
CREDIT FACILITY
On May 5, 2021, the expenditureCompany entered into a $20 million senior secured revolving credit facility with Regions Bank (the “Credit Facility”). The Credit Facility has a three-year term and allows the Company to borrow up to $20 million for working capital purposes, capital expenditures and other lawful corporate purposes. The Credit Facility is secured by a first priority lien on most of management time that otherwise would be devotedCitizens’ assets, excluding its ownership interests in all of the regulated insurance subsidiaries and contains standard representations, warranties and covenants. For a more detailed description of the Credit Facility, see the Company’s Current Report on Form 8-K filed on May 5, 2021. As of May 5, 2021, the Company had not borrowed any funds against the Credit Facility.
| | | | | | | | |
CITIZENS, INC. | NOTES TO CONSOLIDATED FINANCIAL STATEMENTS |
| | (Unaudited) |
(8) INCOME TAXES
Our provision for income taxes may not have the customary relationship of taxes to our business.
(9) Income Taxes
The effectiveincome. CICA Ltd., a wholly owned subsidiary of Citizens, is considered a controlled foreign corporation for federal tax rate was (10.9)%purposes. As a result, the insurance activity of CICA Ltd. is subject to Subpart F of the IRC and 40.0% foris included in Citizens’ taxable income. For the three months and 1.2% and 68.4% forended March 31, 2021, the nine months ended September 30, 2017 and 2016, respectively. Additionally there were $1.0Subpart F income inclusion generated $0.4 million of federal income tax benefitexpense. A reconciliation between the U.S. corporate income tax rate and $1.8 million tax expense related to an uncertain tax position in the nine months ended September 30, 2017 and September 30, 2016, respectively. The effective income tax rate is affected by our tax compliance issues, as IRS toll charge penalties are not tax deductible and can move up or down depending on the net adjustment to our best estimate liability. In addition, we report the interest component of our uncertain tax positions in incomefollows:
| | | | | | | | | | | | | | | | | | | | | | | |
| Three Months Ended March 31, | 2021 | | 2020 |
| (In thousands, except for %) | Amount | | % | | Amount | | % |
| Federal income tax expense: | | | | | | | |
| Expected tax expense (benefit) | $ | (577) | | | 21.0 | % | | (469) | | | 21.0 | % |
| | | | | | | |
| Foreign income tax rate differential | (152) | | | 5.5 | % | | (550) | | | 24.6 | % |
| | | | | | | |
| | | | | | | |
| Tax-exempt interest and dividends-received deduction | (30) | | | 1.1 | % | | (40) | | | 1.8 | % |
| | | | | | | |
| Annualized effective tax rate adjustment | 655 | | | (23.8) | % | | 617 | | | (27.6) | % |
| Adjustment of prior year taxes | 0 | | | 0 | % | | (5) | | | 0.2 | % |
| | | | | | | |
| Effect of uncertain tax position | 603 | | | (21.9) | % | | 1,015 | | | (45.4) | % |
| | | | | | | |
| CICA Ltd. Subpart F income | 392 | | | (14.3) | % | | 675 | | | (30.2) | % |
| | | | | | | |
| | | | | | | |
| Nondeductible officer compensation | (73) | | | 2.7 | % | | 0 | | | 0 | % |
| Other | 7 | | | (0.3) | % | | 106 | | | (4.7) | % |
| Total federal income tax expense (benefit) | $ | 825 | | | (30.0) | % | | 1,349 | | | (60.3) | % |
Income tax expense which can move up or down depending on the tax compliance issues as well as statute expirations. Absent the effect on our effective tax rate of our tax compliance issues, in most periods where our effective tax rate is lower than the statutory tax rate of 35%, the difference is primarily due to tax-exempt state and local bond income which reduce the effective tax rate. For the nine months ended September 30, 2017, our effective tax rate was significantly lower than the nine months ended September 30, 2016, as the Company recorded a net reduction in the overall IRS toll charge penalties and a tax benefit on the Company's uncertain tax position interest accrual compared to a net increase for these items in the nine months ended September 30, 2016.consists of:
| | | | | | | | | | | |
| Three Months Ended March 31, | 2021 | | 2020 |
| (In thousands) | |
| Federal income tax expense: | | | |
| Current | $ | 1,257 | | | 1,629 | |
| Deferred | (432) | | | (280) | |
| Total federal income tax expense | $ | 825 | | | 1,349 | |
28
March 31, 2021 | 10-Q 23
CITIZENS, INC. AND CONSOLIDATED SUBSIDIARIES
Notes to Consolidated Financial Statements, Continued
September 30, 2017
(Unaudited) | | | | | | | | |
CITIZENS, INC. | NOTES TO CONSOLIDATED FINANCIAL STATEMENTS |
| | (Unaudited) |
The components of deferred federal income taxes are as follows:
(10) Benefit Plans
| | | | | | | | | | | |
Net Deferred Tax Asset (Liability) (In thousands) | March 31, 2021 | | December 31, 2020 |
| Deferred tax assets: | | | |
| Future policy benefit reserves | $ | 2,732 | | | 2,657 | |
| Net operating and capital loss carryforwards | 1,774 | | | 1,395 | |
| Accrued policyholder dividends and expenses | 134 | | | 124 | |
| Investments | 198 | | | 147 | |
| Deferred intercompany loss | 1,967 | | | 2,002 | |
| | | |
| Fixed assets | 481 | | | 420 | |
| Lease liability | 2,446 | | | 2,514 | |
| Accrued compensation | 376 | | | 513 | |
| Other | 166 | | | 164 | |
| Total gross deferred tax assets | 10,274 | | | 9,936 | |
| | | |
| | | |
| Deferred tax liabilities: | | | |
| Deferred policy acquisition costs, cost of insurance acquired and intangible assets | (8,531) | | | (8,693) | |
| Unrealized gains on investments available-for-sale | (5,430) | | | (4,522) | |
| | | |
| Tax reserves transition liability | (3,549) | | | (3,736) | |
| Right-of-use lease asset | (2,446) | | | (2,514) | |
| Other | (35) | | | (35) | |
| Total gross deferred tax liabilities | (19,991) | | | (19,500) | |
| Net deferred tax liability | $ | (9,717) | | | (9,564) | |
| | | | | | | | |
CITIZENS, INC. | NOTES TO CONSOLIDATED FINANCIAL STATEMENTS |
| | (Unaudited) |
(9) OTHER COMPREHENSIVE INCOME
The Company has an employer-sponsored 401(k) plan available to all eligible employees. This is an additional benefit offered to employees, which supplements the defined contribution profit-sharing plan. Employees with one year of service can participatechanges in the plan. Contributionscomponents of other comprehensive income (loss) are made by employees andreported net of the Company provides a matching contribution based uponeffects of income taxes of 21% as of the employee's level of contribution. The Company's expense related to the 401(k) plan totaled $184,000 and $574,000 for the three and nine months ended September 30, 2017, respectively,March 31, 2021 and $75,000 and $367,000 for the same periods in 2016.2020, as indicated below.
| | | | | | | | | | | | | | | | | |
| (In thousands) | Amount | | Tax Effect | | Total |
| Three months ended March 31, 2021 | | | | | |
| Unrealized gains (losses): | | | | | |
| Unrealized holding gains (losses) arising during the period | $ | (79,422) | | | 5,373 | | | (74,049) | |
| Reclassification adjustment for (gains) losses included in net income | (35) | | | 7 | | | (28) | |
| Effects on deferred policy acquisition costs | 25,198 | | | (6,317) | | | 18,881 | |
| Effects on cost of insurance acquired | 269 | | | (56) | | | 213 | |
| Effects on unearned revenue reserves | (1,943) | | | 408 | | | (1,535) | |
| Other comprehensive income (loss) | $ | (55,933) | | | (585) | | | (56,518) | |
| | | | | |
| Three months ended March 31, 2020 | | | | | |
| Unrealized gains (losses): | | | | | |
| Unrealized holding gains (losses) arising during the period | $ | (42,906) | | | 2,750 | | | (40,156) | |
| Reclassification adjustment for (gains) losses included in net income | 132 | | | (28) | | | 104 | |
| Effects on deferred policy acquisition costs | 211 | | | (44) | | | 167 | |
| Effects on cost of insurance acquired | 115 | | | (24) | | | 91 | |
| Effects on unearned revenue reserves | (349) | | | 73 | | | (276) | |
| Other comprehensive income (loss) | $ | (42,797) | | | 2,727 | | | (40,070) | |
(11) Related Party Transactions
(10) RELATED PARTY TRANSACTIONS
The Company has various routine related party transactions in conjunction with our holding company structure, such as a management service agreement related to costs incurred, a tax sharing agreement between entities, and inter-company dividends and capital contributions. There were no changes related to these relationships during the ninethree months ended September 30, 2017.March 31, 2021. See our Annual Report on Form 10-K for the year ended December 31, 2016 for a comprehensive discussion of related party transactions.
(11) SUBSEQUENT EVENTS
The Company has evaluated the impact of subsequent events as defined by the accounting guidance through the date this report was issued.
CHANGE IN CONTROL
As previously disclosed, on February 5, 2021, Citizens, Inc. (the “Company”) entered into a Purchase and Sale Agreement (the “Purchase Agreement”) with the Harold E. Riley Foundation (the “Foundation”) to purchase 100% of the Company’s Class B common stock (the “Class B Shares”) from the Foundation at an aggregate purchase price of $9.1 million (the “Class B Transaction”). In accordance with the first quarterPurchase Agreement, the purchase price was paid to the Foundation on March 5, 2021 and is reported within other assets rather than treasury stock on the consolidated balance sheets as all regulatory approvals had not been received as of 2017, Citizens made a $5.0 million capital contribution to CICA Life. In the third quarter of 2017, Citizens contributed $250,000 to CICA Life Ltd. to capitalize a newly formed Bermuda entity, SPLIC contributed $250,000 in capital to MGLIC, and SPLIC declared a dividend payable to CICA of $395,000 which will be paid in October of 2017.March 31, 2021.
29
March 31, 2021 | 10-Q 25
CITIZENS, INC. AND CONSOLIDATED SUBSIDIARIES
September 30, 2017 | | | | | | | | |
CITIZENS, INC. | NOTES TO CONSOLIDATED FINANCIAL STATEMENTS |
| | (Unaudited) |
Because the Class B Shares have the right to elect a simple majority of the Board, the Foundation was able to exercise control over the Company as the holder of 100% of the Class B Shares. Thus, in order to consummate the Class B Transaction, the Company and the Foundation were required to obtain regulatory approvals by the insurance regulators in Colorado, Louisiana, Mississippi, Texas and Bermuda, the jurisdictions in which the Company and its insurance subsidiaries are domiciled. On April 12, 2021, the Company and the Foundation received the last of the regulatory approvals required for the Foundation to divest control of the Company and thus all of the Foundation’s Class B Shares were transferred to the Company as of such date. In accordance with Colorado law, the Class B Shares are now classified as authorized, but unissued shares. On March 9, 2021, the Board passed a resolution stating that as long as the Class B Shares are being held as unissued shares, the Company will not vote, nor permit any other person or entity to exercise any voting rights or other rights, with respect to the Class B Shares. Accordingly, there is no party that now controls the Company.
| | | | | | | | |
| CITIZENS, INC. | MANAGEMENT'S DISCUSSION & ANALYSIS |
| | |
Item 2.2. MANAGEMENT'S DISCUSSION AND ANALYSIS OF FINANCIAL CONDITION AND RESULTS OF OPERATIONS
FORWARD-LOOKING STATEMENTS
Certain statements contained inThis section and other parts of this report are not statements of historical fact and constituteQuarterly Report on Form 10-Q ("Form 10-Q") contain forward-looking statements, within the meaning of the federal securities laws, including, without limitation,Private Securities Litigation Reform Act of 1995, that involve risks and uncertainties. Forward-looking statements specificallyprovide current expectations of future events based on certain assumptions and include any statement that does not directly relate to any historical or current fact. Forward-looking statements can also be identified by words such as forward-looking“future,” “anticipates,” “believes,” “estimates,” “expects,” “intends,” “plans,” “predicts,” “will,” “would,” “could,” “can,” “may,” and similar terms. Forward-looking statements within this document. Many of these statements contain risk factors as well. In addition, certain statements in future filings by the Company with the Securities and Exchange Commission, in press releases, and in oral and written statements made by us or with the approval of the Company, which are not statementsguarantees of historical fact, constitutefuture performance and the Company’s actual results may differ significantly from the results discussed in the forward-looking statements. Examples of forward-looking statementsFactors that might cause such differences include, but are not limited to: (i) projectionsto, those discussed in Part II, Item 1A of revenues, income or loss, earnings or loss per share, the payment or non-payment of dividends, capital structure, and other financial items, (ii) statementsthis Form 10-Q as well as in Part I, Item 1A of our plans and objectivesAnnual Report on Form 10-K for the year ended December 31, 2020 under the heading “Risk Factors,” which are incorporated herein by our managementreference.The Company assumes no obligation to revise or Board of Directors, including those relating to products or services, (iii) statements of future economic performance and (iv) statements of assumptions underlying such statements. Words such as "believes," "anticipates," "assumes," "estimates," "plans," "projects," "could," "expects," "intends," "targeted," "may," "will" and similar expressions are intended to identifyupdate any forward-looking statements butfor any reason, except as required by law.
The impacts of COVID-19 and related economic conditions on the Company's financial results, which began to affect the Company late in the first quarter of 2020, continue to be highly uncertain and outside the Company’s control. The scope, duration and magnitude of the direct and indirect effects of COVID-19 are difficult or impossible to anticipate. As a result, it is not possible to predict its impact on the exclusive meansCompany's results for the remainder of identifying such statements.
Forward-looking statements are subject to known and unknown risks, uncertainties and other2021. Currently, some of the most significant factors that maycould cause our actual results to differ materiallysignificantly from our forward-looking statements are those contemplated byrelating to the forward-looking statements. Factors thatadverse effects of the COVID-19 pandemic, including:
•Decreased premium revenue and cash flow from disruption to our distribution channel of independent agents, customer self-isolation, travel limitations, business restrictions and decreased economic activity; and
•An unusually high level of claims, lapses or surrenders in our insurance operations, which could cause the Company's future results to differ materially from expected results include, but are not limited to:affect our liquidity and cash flow.
ChangesThe following discussion should be read in the application, interpretation or enforcement of foreign insurance laws that impact our business, which derives the majority of its revenues from residents of foreign countries;
Potential changes in amounts reserved for in connectionconjunction with the noncompliance of a portion of our insurance policies with Sections 7702 under the Internal Revenue Code, the failure of certain annuity contracts to qualify under Section 72(s) of the Internal Revenue Codeconsolidated financial statements and the anticipated timing of our filings with the IRS to address these matters;
The outcome of our international business model review and strategic initiatives;
Changesaccompanying notes included in foreign and U.S. general economic, market, and political conditions, including the performance of financial markets and interest rates;
Changes in consumer behavior or regulatory oversight, which may affect the Company's ability to sell its products and retain business;
The timely development of and acceptance of new products of the Company and perceived overall value of these products and services by existing and potential customers;
Fluctuations in experience regarding current mortality, morbidity, persistency and interest rates relative to expected amounts used in pricing the Company's products;
The performance of our investment portfolio, which may be adversely affected by changes in interest rates, adverse developments and ratings of issuers whose debt securities we may hold, and other adverse macroeconomic events;
Results of litigation we may be involved in;
Changes in assumptions related to deferred acquisition costs and the value of any businesses we may acquire;
Regulatory, accounting or tax changes that may affect the cost of, or the demand for, the Company's products or services;
Our concentration of business from persons residing in Latin America and the Pacific Rim;
Changes in tax laws;
Effects of acquisitions and restructuring, including possible difficulties in integrating and realizing the projected results of acquisitions;
Changes in statutory or U.S. Generally Accepted Accounting Principles ("U.S. GAAP"), policies or practices;
Changes in leadership among our board and senior management team.
Our success at managing risks involved in the foregoing; and
The risk factors discussed in "Part II-Item 1A-Risk Factors"Part I, Item 1 of this report.
Such forward-looking statements speak only as of the date on which such statements are made, and theForm 10-Q. The Company undertakesassumes no obligation to revise or update any forward-looking statement to reflect events or circumstances afterstatements for any reason, except as required by law.
The U.S. Securities and Exchange Commission ("SEC") maintains a website that contains reports, proxy and information statements, and other information regarding issuers, including the date on which such statement is made.
CITIZENS, INC. AND CONSOLIDATED SUBSIDIARIES
September 30, 2017
Company, that file electronically with the SEC. The public can obtain any documents that the Company files with the SEC at http://www.sec.gov. We also make available, free of charge, through our Internet website (http://www.citizensinc.com), our Annual Report on Form 10-K, Quarterly Reports on Form 10-Q, Current Reports on Form 8-K, Section 16 Reports filed by officers and directors, news releases, and, if applicable, amendments to those reports filed or furnished pursuant to Section 13(a) or 15(d) of the Securities Exchange Act of 1934, as soon as reasonably practicable after we electronically file such reports with, or furnish such reports to, the Securities and Exchange Commission.SEC. We are not including any of the information contained on our website as part of, or incorporating it by reference into, this report.Form 10-Q.
OverviewOVERVIEW
Citizens, Inc. (“Citizens”("Citizens" or the "Company") is an insurance holding company incorporated in Colorado serving the life insurance needs of individuals in the United States since 1969 and internationally since 1975. Through our insurance subsidiaries, we provide insurance benefits to residents in 31 U.S. states and more than 75 different countries. We pursue a strategy of offering traditional insurance products in niche markets where we believe we are able to achieve competitive advantages. As of September 30, 2017, we had approximately $1.7 billion of total assets and approximately $4.5 billion of insuranceWe operate in force. Our core insurance operations include issuing and servicing:two business segments:
•Life Insurance segment - U.S. Dollar-denominateddollar-denominated ordinary whole life insurance and endowment policies predominantly sold to foreignnon-U.S. residents, located principally in Latin America and the Pacific Rim, through independent marketing consultants; and
| | | | | | | | |
| CITIZENS, INC. | MANAGEMENT'S DISCUSSION & ANALYSIS |
| | |
•Home Service Insurance segment - final expense life insurance policies to middle income households concentrated in the Midwest, Mountain West and southern United States through independent marketing consultants; and
final expense and limited liability property insurance policies marketed to middlemiddle- and lower incomelower-income households in Louisiana, Mississippi and Arkansas, and Mississippisold through employee and independent agents in our home service distribution channel and through funeral homes.
We were formed in 1969CURRENT FINANCIAL HIGHLIGHTS
In both the three months ended March 31, 2021 and historically,2020, we had a net loss of $3.6 million; however, our Company has experienced growth through acquisitionsnet loss before federal income tax increased by $0.5 million in the domestic market and through organic market expansionthree months ended March 31, 2021 compared to prior year period. The increase in the international market.pre-tax net loss in the 2021 period was driven by a $4.1 million increase in claims and surrender benefits, which was higher in both our Life Insurance and our Home Service Insurance segments. The higher claim expense was a result of a higher volume of reported claims, including those COVID-19 related, in addition to an increase in the average death claim amount in both segments. We strivealso continued to generate bottom line returns using knowledgeexperience an increase in surrender benefits and matured endowments in the Life Insurance segment, which we believe is due primarily to the aging block of business and other economic circumstances.
Our realized investment gains improved by $1.6 million in the three months ended March 31, 2021, to $0.3 million, from a $1.3 million loss in the prior year period. As discussed in Part I, Item 1, Note 5. Investments, changes in realized gains reflect the changes in fair values of our niche markets and our well-established distribution channels.equity securities. In the three months ended March 31, 2020, we recorded realized losses of $1.1 million, which were primarily the result of the sudden stock market decline resulting from the onset of the COVID-19 pandemic.
Recent Developments
In September of 2017, followingOur other general expenses continued to be negatively impacted in the conclusion of an auditor selection process ledthree months ended March 31, 2021 by the Company's Audit Committee,expenses related to professional fees incurred in connection with the Company formally engaged Deloitte & Touche LLP to serve as its independent registered public accounting firm forchange in control of the year ending December 31, 2017.
In addition,Company. A detailed description of the change in
the third quartercontrol of
2017, the Company's Audit Committee engaged the audit firm of BDO USA, LLP to perform internal audit services for the Company and
assist with management's assessmentexpenses related thereto are included in the Company’s Annual Report on Form 10-K for the fiscal year ended December 31, 2020 ("Form 10-K"). The settlement of internal controls.
Strategic Initiatives
The Company's Boardall legal issues related to the change in control occurred in the first quarter of
Directors2021 and
new executive management team are assessingthus, we do not expect any additional expenses related to this matter. See Part I, Item 1, Business – "Change in Control; Agreement to Purchase the
Company's domestic and international business models and business strategies with the assistance and supportClass B Shares; Anticipated Divestiture of
external consultants and advisors. Specifically, we are evaluating the Company's international business model and are considering potential options, the current economic and regulatory environment and sustainable business objectives. IncorporatedControl” in our
overall business model review are analyses of (1) new productsForm 10-K and our profitability; (2) a potential restructuring of our international business and operations; (3) potential upgradesPart I, Item 1, Note. 11 Subsequent Events in the notes to our technology systems and operations withconsolidated financial statements herein for a strategic focus on our future business needs and cyber risk; and (4) final additions to our executive management team and equity compensation incentives for our employees.
We have made significant progress in filling vacancies and recruiting additional talented, experienced executives to our management team in 2017, including the addition of a Chief Operating Officer, a Chief Accounting Officer, a Chief Actuary and a Chief Marketing Officer. We are currently recruiting a Chief Information Officer. We are also adding talent at various levels to build expertise within the Company.
On September 12, 2017, the Company announced the appointment of David S. Jorgensen as General Manager for International Operations of CICA Life Ltd. (Bermuda). Prior to his appointment Mr. Jorgensen served as Vice President, Chief Financial Officer
CITIZENS, INC. AND CONSOLIDATED SUBSIDIARIES
September 30, 2017
and Treasurer of Citizens Inc. Through CICA Life Ltd., we expect to expand our international footprint and implement strategic changes to the Company's current international business model.
The following pages describe the operations of our three business segments: Life Insurance, Home Service and Other Non-Insurance Enterprises. Revenues derived from any single customer did not exceed 10% of consolidated revenues in anyfurther discussion of the last three years.
Current Financial Highlights
Financial highlightschange in control. Despite the change in control costs, our other general expenses decreased slightly for the three and nine month periodsmonths ended September 30, 2017,March 31, 2021 compared to the same periodsperiod in 2016 were:2020. The change in control costs were offset by lower salary and benefit expenses resulting from converting our Home Service Insurance sales agents to independent agents and lower audit and consulting fees.
Consolidated Revenue Highlights
Insurance premiums increased slightly forand investment income are our primary sources of revenue. In the three and nine month periodsmonths ended September 30, 2017March 31, 2021 as compared to $50.2the same period in 2020:
•Insurance premiums declined by $2.3 million, and $143.4or 5.5%, to $39.0 million from $49.2$41.3 million and $142.6 million forin the corresponding periodssame period in 2016, an increase of 2.2% and 0.5%2020. The decline was driven by an increaseour Life Insurance segment as renewal premiums declined 9.3% to $24.6 million in the first quarter of 2021 from $27.1 million in the same period in 2020. The decrease in renewal premiums resulted primarily from a decline in our Lifein force business in this segment, which is due in additionpart to a slight increase in first year premiums in bothchanges we made to our Lifeproducts and Home Service segments.
distribution over the last few years.•Net investment income was $15.2 million in both periods.
Additionally, realized investment gains increased 12.2% and 10.0%by $1.6 million primarily for the three and nine month periods ended September 30, 2017, comparedreason discussed above. Other income increased 68.8% to the corresponding periods in 2016, primarily due to a growing asset base$0.9 million from strong cash flows from our insurance operations. The average yield on the consolidated portfolio as of the nine months ended September 30, 2017 increased to an annualized rate of 4.31% up from 4.29%$0.5 million for the same period in 2016. 2020. Other income consists primarily of policyholders selecting supplemental contracts upon maturity of their original policies, which has been increasing over the past few quarters.
| | | | | | | | |
| CITIZENS, INC. | MANAGEMENT'S DISCUSSION & ANALYSIS |
| | |
A realized gainConsolidated Benefits and Expenses Highlights
The primary use of $1.1our funds is payment of insurance benefits. As discussed above, our claims and surrender benefits increased by $4.1 million was recorded for the nine month period ended September 30, 2017 related to the sale of an office building in Little Rock, Arkansas in the first quarter of 2017. The Company recorded a small other-than-temporary impairment on a common stock in 2017. Other-than-temporary impairments were recorded for the nine month periodthree months ended September 30, 2016 totaling $2.3 million, respectively, related to mutual fund impairments in the second quarter of 2016 and one available-for-sale fixed maturity security impairment in the first quarter of 2016.
Claims and surrenders expense increased 2.1% and 1.9% for the three and nine month periods ended September 30, 2017, compared to corresponding periods in 2016.
General expenses increased 45.3% and 17.7% for the three and nine month periods ended September 30, 2017, respectively,March 31, 2021 as compared to the corresponding periodssame period in 2016, due primarily to additional audit fees related toprior year; however, total insurance benefits paid or provided was essentially flat year-over-year, as the 2016 audit, higher legalincrease in claims and consulting fees and higher permanent and temporary salaries,surrender benefits was offset by a decrease in future policy benefit reserves. Future policy benefit reserves decreased due to the lower in force block of business.
The other primary use of funds are the costs of selling our 7702/72(s) tax compliance best estimate liability.
insurance products (e.g., commissions, underwriting, marketing expenses) and general expenses. Costs incurred related to selling our insurance products remained flat in the three months ended March 31, 2021 as compared to the same period in prior year and as discussed above, general expenses slightly decreased for the period.
2021 First Quarter Financial Condition
CITIZENS, INC. AND CONSOLIDATED SUBSIDIARIES•Total assets of $1.8 billion.
September 30, 2017
•$4.6 billion of direct insurance in force.
•No debt.
Our Operating Segments
OUR OPERATING SEGMENTS
Our business is comprised of threetwo operating business segments, as detailed below.
•Life Insurance
•Home Service Insurance
Other Non-Insurance Enterprises
Our insurance operations are the primary focus of the Company, as thosethese operations generate the majoritymost of our income. See the discussion under Segment Operations below for detailed analysis. The amount of insurance, number of policies, and average face amounts of ordinary life policies issued during the periods indicated are shown below. |
| | | | | | | | | | | | | | | | | | | | | |
| | Nine Months Ended September 30, |
| | 2017 | | 2016 |
| | Amount of
Insurance
Issued | | Number of
Policies
Issued | | Average Policy
Face Amount
Issued | | Amount of
Insurance
Issued | | Number of
Policies
Issued | | Average Policy
Face Amount
Issued |
| Life | $ | 219,592,550 |
| | 3,988 |
| | $ | 55,063 |
| | $ | 248,234,181 |
| | 4,416 |
| | $ | 56,212 |
|
| Home Service | 141,400,866 |
| | 20,795 |
| | 6,800 |
| | 137,691,263 |
| | 20,847 |
| | 6,605 |
|
| | | | | | | | | | | | | | | | | | | | | | | | | | | | | | | | | | | |
| Three Months Ended March 31, | 2021 | | 2020 |
| | Amount of
Insurance
Issued | | Number of
Policies
Issued | | Average Policy
Face Amount
Issued | | Amount of
Insurance
Issued | | Number of
Policies
Issued | | Average Policy
Face Amount
Issued |
| Life Insurance | $ | 50,330,540 | | | 863 | | | $ | 58,320 | | | $ | 49,611,100 | | | 728 | | | $ | 68,147 | |
| Home Service Insurance | 44,658,259 | | | 6,361 | | | 7,021 | | | 36,117,767 | | | 5,174 | | | 6,981 | |
| Total | $ | 94,988,799 | | | 7,224 | | | | | $ | 85,728,867 | | | 5,902 | | | |
We issued $95.0 million of insurance in the three months ended March 31, 2021 as compared to $85.7 million in 2020, as both our Life Insurance and Home Service Insurance segments experienced growth. We issued 7,224 new policies in 2021, as compared to 5,902 new policies in 2020. Note: All discussions below compare or state results
The number of policies issued in the three months ended March 31, 2021 increased 18.5% in the Life Insurance segment. The increase in applications in the first quarter was primarily due to enhancements to our business operations and sales practices to account for the threeimpact of the COVID-19 pandemic, including sales promotions and nine-month periods ended September 30, 2017campaigns, focused training on virtual selling and strategically prioritizing selling lower face amount policies, which typically have less stringent underwriting requirements and, in some cases, may not require the completion of medical tests, as many of our top international markets remain in quarantine due to the COVID-19 pandemic. In
| | | | | | | | |
| CITIZENS, INC. | MANAGEMENT'S DISCUSSION & ANALYSIS |
| | |
addition, in order to address the decreasing first year premiums we have seen in recent years in this segment, we prioritized recruiting new independent contractors in the first quarter of 2021, and we began to see the impact of these efforts in March. Although applications increased during the first quarter of 2021 compared to the same period last year due to these enhancements, average policy face amount declined by almost $10,000 per policy, as we continued to emphasize the selling of lower face amount policies, as noted above.
The number of policies issued in the three months ended March 31, 2021 increased 22.9% in the Home Service Insurance segment compared to the same period in 2020. The increase in new business applications in our Home Service Insurance segment was driven by the broadening of a sales campaign introduced during the third quarter of last year targeted at existing policyholders that emphasizes increased coverage as well as lower applications received in the prior year period as the onset of the COVID-19 pandemic and nine-month periods ended September 30, 2016.stay-at-home orders negatively impacted our business. During the first quarter of 2021, as part of the campaign, we increased the target face amount of insurance. As a result, the overall average face amount of policies issued for the Home Service Insurance segment increased slightly compared to the first quarter of 2020.
Consolidated Results of Operations
CONSOLIDATED RESULTS OF OPERATIONS
A discussion of consolidated results is presented below, followed by a discussion of segment operations and financial results by segment.
RevenuesREVENUES
RevenuesOur revenues are generated primarily by insurance renewal premiums and investment income on invested assets.
| | | | | | | | | | | | | | | Three Months Ended |
| | Three Months Ended | | Nine Months Ended | | | | March 31, |
| | September 30, | | September 30, | |
| | 2017 | | 2016 | | 2017 | | 2016 | |
| (In thousands) | | (In thousands) | | | 2021 | | 2020 |
| | (In thousands) | | | |
| Revenues: | | | | | | | | Revenues: | | | | | |
| Premiums: | | | | | | | | Premiums: | | | | | |
| Life insurance | $ | 48,644 |
| | 47,513 |
| | 138,603 |
| | 137,637 |
| Life insurance | | | $ | 37,642 | | | 39,946 | |
| Accident and health insurance | 360 |
| | 385 |
| | 1,033 |
| | 1,170 |
| Accident and health insurance | | | 343 | | | 261 | |
| Property insurance | 1,243 |
| | 1,274 |
| | 3,731 |
| | 3,811 |
| Property insurance | | | 1,047 | | | 1,110 | |
| Net investment income | 13,828 |
| | 12,320 |
| | 39,640 |
| | 36,051 |
| Net investment income | | | 15,244 | | | 15,169 | |
| Realized investment gains (losses), net | (404 | ) | | 46 |
| | 742 |
| | (1,776 | ) | Realized investment gains (losses), net | | | 292 | | | (1,306) | |
| Other income | 660 |
| | 203 |
| | 1,015 |
| | 610 |
| Other income | | | 915 | | | 542 | |
| Total revenues | $ | 64,331 |
| | 61,741 |
| | 184,764 |
| | 177,503 |
| Total revenues | | | $ | 55,483 | | | 55,722 | |
CITIZENS, INC. AND CONSOLIDATED SUBSIDIARIES
September 30, 2017
Premium Income.Income. Premium income derived from life, accident and health, and property insurance sales increased 2.2% and 0.5%decreased $2.3 million, or 5.5% for the three and nine month periodsmonths ended September 30, 2017March 31, 2021 compared to the same periods ended September 30, 2016.period in 2020. The increase isoverall decrease in premium income was driven primarily by an increasea $2.5 million decline throughout the first three months of 2021 in renewal premiums in our Life SegmentInsurance segment. The decrease in addition to slight increases in first yearrenewal premiums in boththe Life Insurance segment continues to result from a decline in our Lifein force business in this segment over the past few years, which is due in part to changes we made to our products and Home Service segments.distribution and surrenders outpacing new sales. Premium revenues continue to be negatively impacted by high levels of surrenders, which we believe are due not only to an aging block of business (i.e., maturities and surrenders of products where the surrender charges are close to expiring or have expired) and our decision to cease issuing new policies in Brazil in 2017 (where we see many policies lapsing), but also due to economic circumstances in Latin America. See the detailed distribution of premiums within Segment Operations discussed below.
| | | | | | | | |
| CITIZENS, INC. | MANAGEMENT'S DISCUSSION & ANALYSIS |
| | |
Net Investment Income. Our annualized net investment income performance is summarized as follows.
| | | | | | | | | | March 31, | | December 31, | | March 31, |
| | September 30, | | December 31, | | September 30, | |
| | 2017 | | 2016 | | 2016 | |
| (In thousands, except for %) | | (In thousands, except for %) | 2021 | | 2020 | | 2020 |
| | (In thousands, except for %) | | |
| Net investment income, annualized | $ | 52,853 |
| | 48,560 |
| | 48,068 |
| Net investment income, annualized | $ | 60,976 | | | 60,197 | | | 60,676 | |
| Average invested assets, at amortized cost | 1,225,187 |
| | 1,133,705 |
| | 1,120,356 |
| Average invested assets, at amortized cost | 1,449,518 | | | 1,420,129 | | | 1,408,688 | |
| Annualized yield on average invested assets | 4.31 | % | | 4.28 | % | | 4.29 | % | Annualized yield on average invested assets | 4.21 | % | | 4.24 | % | | 4.31 | % |
Annualized net investment income increased slightly in the three months ended March 31, 2021 as compared to the same annualized performance in the 2020 period as an increase in average invested assets derived from cash flows from our insurance operations and a one-time benefit described below offset a lower portfolio yield. The annualized yield has remained relatively consistentdecreased by ten basis points during the first quarter of 2021 compared to the same period in 2020, as we continue to face a changechallenging investment environment for fixed maturity assets, which account for the majority of our investment portfolio. As part of the ongoing process of managing our portfolio and optimizing performance, we are continuing to identify and invest in portfolio mix has somewhat mitigated the impact of reinvestment in the current low rate environment. new asset classes, including private equities.
Investment income from debtfixed maturity securities accounted for approximately 88.0%87.9% of total investment income for the ninethree months ended September 30, 2017. March 31, 2021.
| | | | | | | | | | | | | | | | | Three Months Ended |
| | Three Months Ended | | Nine Months Ended | | | | March 31, |
| | September 30, | | September 30, | |
| | 2017 | | 2016 | | 2017 | | 2016 | |
| (In thousands) | | (In thousands) | | | 2021 | | 2020 |
| | (In thousands) | | | |
| Gross investment income: | | | | | | | | Gross investment income: | | | | | |
| Fixed maturity securities | $ | 12,466 |
| | 10,984 |
| | 35,879 |
| | 32,432 |
| Fixed maturity securities | | | $ | 14,100 | | | 13,868 | |
| Equity securities | 154 |
| | 247 |
| | 521 |
| | 635 |
| Equity securities | | | 207 | | | 180 | |
| Mortgage loans | 3 |
| | 3 |
| | 8 |
| | 20 |
| |
| Policy loans | 1,454 |
| | 1,353 |
| | 4,242 |
| | 3,903 |
| Policy loans | | | 1,644 | | | 1,623 | |
| Long-term investments | — |
| | 77 |
| | 66 |
| | 229 |
| Long-term investments | | | 73 | | | 1 | |
| Other investment income | 20 |
| | 40 |
| | 44 |
| | 70 |
| Other investment income | | | 15 | | | 68 | |
| Total investment income | 14,097 |
| | 12,704 |
| | 40,760 |
| | 37,289 |
| Total investment income | | | 16,039 | | | 15,740 | |
| Investment expenses | (269 | ) | | (384 | ) | | (1,120 | ) | | (1,238 | ) | Investment expenses | | | (795) | | | (571) | |
| Net investment income | $ | 13,828 |
| | 12,320 |
| | 39,640 |
| | 36,051 |
| Net investment income | | | $ | 15,244 | | | 15,169 | |
|
The consolidated invested asset portfolio has increased approximately 5.1%Income from year end 2016 to September 30, 2017 with investments in the fixed maturity securities portfolio accountingincome increased 1.7% for the most significant increase in investment income. In addition, the increase in policy loans, which represents policyholders utilizing their accumulated policy cash value, contributedthree months ended March 31, 2021, compared to the increasesame period in 2020 and our total investment income.income increased by 1.9% in the same period due to the recognition of accelerated interest payments resulting from a “make-whole” call redemption, whereby the borrower was required to pay a lump sum based on the net present value of interest payments foregone due to the call. Investment expenses were slightly higher due to our increased investments in private equity, which often include start-up fees.
Realized Investment Gains (Losses), Net. Realized lossesNet. We recorded realized gains of $0.3 million during the first quarter of 2021 related to fair value changes in our equity securities owned at March 31, 2021. The fair value of our equity securities owned at March 31, 2020 was negatively impacted by the onset of the COVID-19 pandemic as discussed above.
| | | | | | | | |
| CITIZENS, INC. | MANAGEMENT'S DISCUSSION & ANALYSIS |
| | |
BENEFITS AND EXPENSES
| | | | | | | | | | | | | | | | | |
| | | | Three Months Ended |
| | | March 31, |
| (In thousands) | | | | | 2021 | | 2020 |
| | | | | | | | |
| Benefits and expenses: | | | | | | | |
| Insurance benefits paid or provided: | | | | | | | |
| Claims and surrenders | | | | | $ | 30,589 | | | 26,449 | |
| Increase in future policy benefit reserves | | | | | 5,232 | | | 9,471 | |
| Policyholders' dividends | | | | | 1,306 | | | 1,233 | |
| Total insurance benefits paid or provided | | | | | 37,127 | | | 37,153 | |
| Commissions | | | | | 8,157 | | | 7,853 | |
| Other general expenses | | | | | 11,382 | | | 11,473 | |
| Capitalization of deferred policy acquisition costs | | | | | (4,985) | | | (5,009) | |
| Amortization of deferred policy acquisition costs | | | | | 6,183 | | | 6,119 | |
| Amortization of cost of insurance acquired | | | | | 367 | | | 368 | |
| Total benefits and expenses | | | | | $ | 58,231 | | | 57,957 | |
Claims and Surrenders. Death claim and surrender benefits are our primary use of cash. As reflected in the table below, claims and surrender benefits increased 16.6%, from $18.6 million in the three months ended September 30, 2017 were relatedMarch 31, 2020, to losses on calls of securities$21.7 million in the current period. A realized gain was recorded for the nine month periodthree months ended September 30, 2017 resulting from a $1.1 million gain on the sale of an office building in Little Rock, Arkansas in the first quarter of 2017. One small other-than-temporary impairment was recorded on a common stock in 2017. Other-than-temporary impairments were recorded for the nine month period ended September 30, 2016 totaling $2.3 million related to mutual fund impairments in the second quarter of 2016 and one available-for-sale fixed maturity security impairment in the first quarter of 2016. No other-than-temporary impairments were recordedMarch 31, 2021.
| | | | | | | | | | | | | | | | | |
| | | Three Months Ended |
| | | March 31, |
| (In thousands) | | | | | 2021 | | 2020 |
| | | | | | | | |
| Claims and Surrenders: | | | | | | | |
| Death claim benefits | | | | | $ | 8,940 | | | 6,589 | |
| Surrender benefits | | | | | 12,807 | | | 12,055 | |
| Endowment benefits | | | | | 2,401 | | | 2,739 | |
| Matured endowment benefits | | | | | 5,122 | | | 3,753 | |
| Property claims | | | | | 321 | | | 487 | |
| Accident and health benefits | | | | | 59 | | | 53 | |
| Other policy benefits | | | | | 939 | | | 773 | |
| Total claims and surrenders | | | | | $ | 30,589 | | | 26,449 | |
•Death claim benefits increased 35.7% for the three month period ended September 30, 2017 or 2016.
CITIZENS, INC. AND CONSOLIDATED SUBSIDIARIES
September 30, 2017
Benefits and Expenses
|
| | | | | | | | | | | | |
| | Three Months Ended | | Nine Months Ended |
| | September 30, | | September 30, |
| | 2017 | | 2016 | | 2017 | | 2016 |
| | (In thousands) |
| Benefits and expenses: | | | | | | | |
| Insurance benefits paid or provided: | | | | | | | |
| Claims and surrenders | $ | 21,454 |
| | 21,014 |
| | 62,130 |
| | 60,988 |
|
| Increase in future policy benefit reserves | 19,597 |
| | 18,997 |
| | 51,953 |
| | 52,095 |
|
| Policyholders' dividends | 1,613 |
| | 1,620 |
| | 4,418 |
| | 4,985 |
|
| Total insurance benefits paid or provided | 42,664 |
| | 41,631 |
| | 118,501 |
| | 118,068 |
|
| Commissions | 10,801 |
| | 10,852 |
| | 30,620 |
| | 31,097 |
|
| Other general expenses | 7,254 |
| | 4,992 |
| | 26,765 |
| | 22,732 |
|
| Capitalization of deferred policy acquisition costs | (7,756 | ) | | (7,890 | ) | | (21,540 | ) | | (22,257 | ) |
| Amortization of deferred policy acquisition costs | 7,623 |
| | 6,908 |
| | 22,640 |
| | 20,418 |
|
| Amortization of cost of customer relationships acquired | 635 |
| | 641 |
| | 1,629 |
| | 1,588 |
|
| Total benefits and expenses | $ | 61,221 |
| | 57,134 |
| | 178,615 |
| | 171,646 |
|
Claims and Surrenders. A detail of claims and surrender benefits is provided below.
|
| | | | | | | | | | | | |
| | Three Months Ended | | Nine Months Ended |
| | September 30, | | September 30, |
| | 2017 | | 2016 | | 2017 | | 2016 |
| | (In thousands) |
| Death claims | $ | 6,128 |
| | 5,795 |
| | 17,441 |
| | 17,775 |
|
| Surrender benefits | 9,448 |
| | 8,488 |
| | 27,933 |
| | 25,432 |
|
| Endowments | 3,969 |
| | 4,170 |
| | 11,148 |
| | 11,862 |
|
| Matured endowments | 654 |
| | 1,149 |
| | 1,888 |
| | 2,178 |
|
| Property claims | 373 |
| | 593 |
| | 1,373 |
| | 1,477 |
|
| Accident and health benefits | 108 |
| | 158 |
| | 196 |
| | 327 |
|
| Other policy benefits | 774 |
| | 661 |
| | 2,151 |
| | 1,937 |
|
| Total claims and surrenders | $ | 21,454 |
| | 21,014 |
| | 62,130 |
| | 60,988 |
|
Death claims increased 5.7% and decreased 1.9% for the three and ninemonths ended September 30, 2017March 31, 2021, compared to the same periodsperiod in 2016. Mortality experience is closely monitored by2020 - Life Insurance segment claims increased 55.6% and Home Service Insurance segment claims increased 28.6%. As discussed above in "Current Financial Highlights", the Companyincrease was due to increases in reported claims, including COVID-19 related deaths, and the activity is within expected levels.
average dollar amount of claims incurred.Surrenders•Surrender benefits increased 11.3% and increased 9.8%6.2% for the three and nine months ended September 30, 2017March 31, 2021, compared to 2016 primarily duethe same period in 2020. Surrender benefits represented less than 0.3% of total direct ordinary whole life insurance in force of $4.6 billion as of March 31, 2021. A significant portion of surrender benefits relates to activityinternational policies that have been in force and have little or no associated surrender charges.
| | | | | | | | |
| CITIZENS, INC. | MANAGEMENT'S DISCUSSION & ANALYSIS |
| | |
•Matured endowment benefits increased 36.5% for the three months ended March 31, 2021, compared to the same period in 2020. We anticipated this increase based upon the dates when our endowment contracts were sold and the maturity dates set forth in the life insurance segment. This increased surrender activity is in the later durations after the surrender charges are reduced or for periods in which the surrender charges have concluded. This is due to a maturing book of business.
contracts.
Increase in Future Policy Benefit Reserves.Reserves. The change in future policy benefit reserves decreased 44.8% for the three and nine months ended September 30, 2017,March 31, 2021, compared to the same period in 2016, increased2020. Future policy benefit reserves decreased as our block of in force business decreased.
Commissions. Commission expenses are a cost of acquiring business, as commissions are the primary compensation paid to our independent consultants and independent agents for selling our products. First year commission rates are higher than renewal commission rates. Commissions fluctuate directly in relation to sales and were higher in the three months ended March 31, 2021 due to a reserve adjustment recorded of approximately $400,000, before tax, related to a reserve review on our Home Service purchased block of business and decreased for the nine months ended in 2017 due to the changes in surrenders noted above, as premiums have remained relatively consistent between periods.
CITIZENS, INC. AND CONSOLIDATED SUBSIDIARIES
September 30, 2017
Policyholders' Dividends. Policyholders' dividends decreased related to our life segment for both the three and nine months ended September 30, 2017, as we adjusted our dividend rates for later durations in our policies beginning in 2016 and we are seeing a decrease in dividends as policies mature.
Commissions. Commission expense is directly related to new and renewal insurance premium fluctuations and production levels. Commission expense for the three and nine months ended September 30, 2017 fluctuated directly in relation to the increase in first year and renewal premiumssales in our Home Service Insurance segment.
Other General Expenses. As mentioned above, general expenses decreased slightly in the three months ended March 31, 2021 compared to premium levels for the threesame period in 2020, driven primarily by lower incentive compensation costs, and nine months ended September 30, 2016.
Other General Expenses. Expenses increased for the three and nine months ended September 30, 2017 due primarily to additionallower audit fees related to the 2016 audit, higher legal and consulting feescosts.
Capitalization and higher permanent and temporary salaries, somewhat offset by a decrease in our 7702/72(s) tax compliance best estimate liability.
Capitalized and AmortizedAmortization of Deferred Policy Acquisition Costs.Costs. Costs capitalized include certain commissions, policy issuance costs, and underwriting and agency expenses that relate to successful sales efforts for insurance contracts. The decrease forCapitalized costs decreased slightly during the three and nine months ended September 30, 2017,March 31, 2021 compared to the same periodsperiod in 2016 was the result of2020 as we experienced a declinedecrease in first year premium production in our Life Insurance segment as previously discussed. Amortization of deferred policy acquisition costs was slightly higher during the current period, which decreased capitalized amounts. Commissions paid on renewal premiums are significantly lower than those paid on first year business.
Amortization for the ninethree months ended September 30, 2017, increasedMarch 31, 2021 compared to the same period in 2016 due to higher surrender activity in 2017.the prior year. Amortization of deferred policy acquisition costs is impacted by persistency, surrenders, and new sales production and thus it may fluctuate from yearquarter to year.quarter.
Federal Income Tax.Tax. The effective tax rate was (10.9)% and 40.0% expense decreased for the three months ended March 31, 2021 compared to the same period in 2020 resulting in effective tax rates of (30.0)% and 1.2% and 68.4% for(60.3)%, respectively. For the ninethree months ended September 30, 2017 and 2016, respectively. Additionally there is $1.0 million of tax benefit and $1.8 millionMarch 31, 2020, the Company's federal income tax expense related to an uncertainwas impacted by the gain realized on the sale of our former corporate headquarters. The Company's tax position in the nine months ended September 30, 2017 and September 30, 2016, respectively. Differencesrate was impacted by differences between our effective tax rate and the statutory tax rate resultresulting from income and expense items that are treated differently for financial reporting and tax purposes. In addition, CICA Ltd., a wholly-owned Bermuda subsidiary of Citizens, is considered a controlled foreign corporation for federal tax purposes and CICA Ltd.'s activity gives rise to taxable income in the U.S. as wellSubpart F Income, which is treated as impacts from oura permanent tax compliance issuesdifference and uncertaintherefore included in the Company's effective tax positions.rate calculation. See Part I, Item 1, Note 9 -8. Income Taxes in the notes to our consolidated financial statements for further discussion.herein.
Segment OperationsSEGMENT OPERATIONS
The Company has three reportable segments: Our business is comprised of two operating business segments, as detailed below.
•Life Insurance
•Home Service Insurance and Other Non-Insurance Enterprises.
These segments are reported in accordance with U.S. GAAP. The Company evaluates profitCompany's Other Non-Insurance enterprises include non-insurance operations such as IT and loss performancecorporate-support functions, which are included in the table presented below to properly reconcile the segment information with the consolidated financial statements of itsthe Company.
| | | | | | | | |
| CITIZENS, INC. | MANAGEMENT'S DISCUSSION & ANALYSIS |
| | |
The following table shows income (loss) before federal income taxes by segments based on net income before income taxes.during the periods indicated.
| | | | | | | | | | | | | | | | | Three Months Ended |
| | Three Months Ended | | Nine Months Ended | | | | March 31, |
| | September 30, | | September 30, | |
| | 2017 | | 2016 | | 2017 | | 2016 | |
| | (In thousands) | |
| (In thousands) | | (In thousands) | | | 2021 | | 2020 |
| Income (loss) before federal income tax expense: | | Income (loss) before federal income tax expense: | | |
| Segments: | | Segments: | | |
| Life Insurance | $ | 3,983 |
| | 3,993 |
| | 7,582 |
| | 5,753 |
| Life Insurance | | | $ | (106) | | | 2,086 | |
| Home Service Insurance | (365 | ) | | 591 |
| | 496 |
| | 1,165 |
| Home Service Insurance | | | (758) | | | (2,145) | |
| Other Non-Insurance Enterprises | (508 | ) | | 23 |
| | (1,929 | ) | | (1,061 | ) | |
| Income before federal income tax | $ | 3,110 |
| | 4,607 |
| | 6,149 |
| | 5,857 |
| |
| Total segments | | Total segments | | | (864) | | | (59) | |
| Other Non-Insurance enterprises | | Other Non-Insurance enterprises | | | (1,884) | | | (2,176) | |
| Total loss before federal income tax expense | | Total loss before federal income tax expense | | | $ | (2,748) | | | (2,235) | |
Life InsuranceLIFE INSURANCE
Our Life Insurance segment primarily operates through CICA Ltd. (a Bermuda company), which issues ordinary whole life insurance in the United States and endowment policies in U.S. Dollar-denominated amounts to foreign residents. These contractsnon-U.S. residents in more than 75 countries through independent marketing consultants. The whole life products are designed to provide a fixed amount of insurance coverage over the life of the insured and can utilizeinclude rider benefits to provide additional increasing or decreasing coverage and annuity benefits to enhance
CITIZENS, INC. AND CONSOLIDATED SUBSIDIARIES
September 30, 2017
accumulations. Additionally,The endowment contracts are issued by the Company, which are principally accumulation contracts that incorporate an element of life insurance protection. For the majority of our business, we retain the first $100,000 of risk$0.1 million on any one life reinsuringand reinsure the remainder of the risk. We operate thisthe Life Insurance segment internationally through CICA Ltd. and domestically through our CICA and CNLIC insurance subsidiaries.
International Sales
We focus our sales of U.S. Dollar-denominated ordinary whole life insurance and endowment policies to residents in Latin America and the Pacific Rim. We have participated in the foreign marketplace since 1975, and we continue to seek opportunities for expansion of our foreign operations. We believe positive attributes of our international insurance business include:
larger face amount policies typically issued when compared to our U.S. operations, which results in lower underwriting and administrative costs per unit of coverage;
premiums typically paid annually rather than monthly or quarterly, which reduces our administrative expenses, accelerates cash flow and results in lower policy lapse rates than premiums with more frequently scheduled payments; and
persistency experience and mortality rates that are comparable to U.S. policies.
International Products
We offer several ordinary whole life insurance and endowment products designed to meet the needs of our non-U.S. policyowners. These policies have been structured to provide:
U.S. Dollar-denominated cash values that accumulate, beginning in the first policy year, to a policyholder during his or her lifetime;
premium rates that are competitive with or better than most foreign local companies;
a hedge against local currency inflation;
protection against devaluation of foreign currency;
capital investment in a more secure economic environment (i.e., the United States); and
lifetime income guarantees for an insured or for surviving beneficiaries.
Our international products have living benefit features. Every policy contains guaranteed cash values and most are participating (i.e., provides for cash dividends as apportioned by the board of directors). Once a policyowner pays the annual premium and the policy is issued, the owner becomes entitled to a cash dividend as well as an annual guaranteed endowment, if elected. The policyowner has several options with regard to the dividend and annual guaranteed endowments, including the right to assign policy values to the Citizens, Inc. Stock Investment Plan, registered under the Securities Act of 1933 (the "Securities Act"), and administered in the United States by Computershare, our plan administrator and transfer agent.
37
March 31, 2021 | 10-Q 34
CITIZENS, INC. AND CONSOLIDATED SUBSIDIARIES
September 30, 2017 | | | | | | | | |
| CITIZENS, INC. | MANAGEMENT'S DISCUSSION & ANALYSIS |
| | |
The results of operations for the Life Insurance segment for the periods indicated are as follows:
| | | | | | | | | | | | | | | | | |
| | | Three Months Ended |
| | | March 31, |
| (In thousands) | | | | | 2021 | | 2020 |
| Revenues: | | | | | | | |
| Premiums | | | | | $ | 27,063 | | | 29,819 | |
| Net investment income | | | | | 11,598 | | | 11,480 | |
| Realized investment gains (losses), net | | | | | (108) | | | 735 | |
| Other income | | | | | 913 | | | 524 | |
| Total revenues | | | | | 39,466 | | | 42,558 | |
| Benefits and expenses: | | | | | | | |
| Insurance benefits paid or provided: | | | | | | | |
| Claims and surrenders | | | | | 23,270 | | | 20,160 | |
| Increase in future policy benefit reserves | | | | | 3,658 | | | 8,146 | |
| Policyholders' dividends | | | | | 1,296 | | | 1,225 | |
| Total insurance benefits paid or provided | | | | | 28,224 | | | 29,531 | |
| Commissions | | | | | 4,231 | | | 4,478 | |
| Other general expenses | | | | | 5,226 | | | 4,948 | |
| Capitalization of deferred policy acquisition costs | | | | | (3,561) | | | (3,921) | |
| Amortization of deferred policy acquisition costs | | | | | 5,348 | | | 5,318 | |
| Amortization of cost of insurance acquired | | | | | 104 | | | 118 | |
| Total benefits and expenses | | | | | 39,572 | | | 40,472 | |
| Income (loss) before federal income tax expense | | | | | $ | (106) | | | 2,086 | |
Life Insurance segment premium breakout is detailed below.
| | | | | | | | | | | | | | | | | |
| | | Three Months Ended |
| | | March 31, |
| (In thousands) | | | | | 2021 | | 2020 |
| Premiums: | | | | | | | |
| First year | | | | | $ | 2,479 | | | 2,715 | |
| Renewal | | | | | 24,584 | | | 27,104 | |
| Total premiums | | | | | $ | 27,063 | | | 29,819 | |
| | | | | | | |
Premiums. We derive most of our premium revenue in the Life Insurance segment from renewal premiums. Total premium revenues declined 9.2% for the three months ended March 31, 2021 compared to the same period in 2020 and renewal premiums declined by 9.3%. See “Consolidated Results of Operations” above for a discussion regarding the decline in renewal premiums in this segment. As previously mentioned, first year policies issued increased in the three months ended March 31, 2021, but lower issued face amounts led to the decline in first year premium revenue. Endowment sales totaled approximately $2.2 million of first year premiums in the three months ended March 31, 2021, as compared to $2.0 million in the prior year period.
| | | | | | | | |
| CITIZENS, INC. | MANAGEMENT'S DISCUSSION & ANALYSIS |
| | |
The following table sets forth, by country,for our top five producing countries, our direct premiums from our international life insurance business for the periods indicated.three months ended March 31, 2021 and 2020.
|
| | | | | | | | | | | | |
| | Three Months Ended | | Nine Months Ended |
| | September 30, | | September 30, |
| | 2017 | | 2016 | | 2017 | | 2016 |
| | (In thousands) |
| Country | | | | | | | |
| Colombia | $ | 7,390 |
| | 7,276 |
| | 20,635 |
| | 20,643 |
|
| Venezuela | 6,744 |
| | 7,833 |
| | 20,602 |
| | 22,690 |
|
| Taiwan | 4,408 |
| | 3,868 |
| | 13,673 |
| | 12,682 |
|
| Ecuador | 4,359 |
| | 3,925 |
| | 12,104 |
| | 11,170 |
|
| Argentina | 3,216 |
| | 2,542 |
| | 7,772 |
| | 6,932 |
|
| Other Non-U.S. | 11,222 |
| | 10,990 |
| | 29,988 |
| | 30,183 |
|
| Total | $ | 37,339 |
| | 36,434 |
| | 104,774 |
| | 104,300 |
|
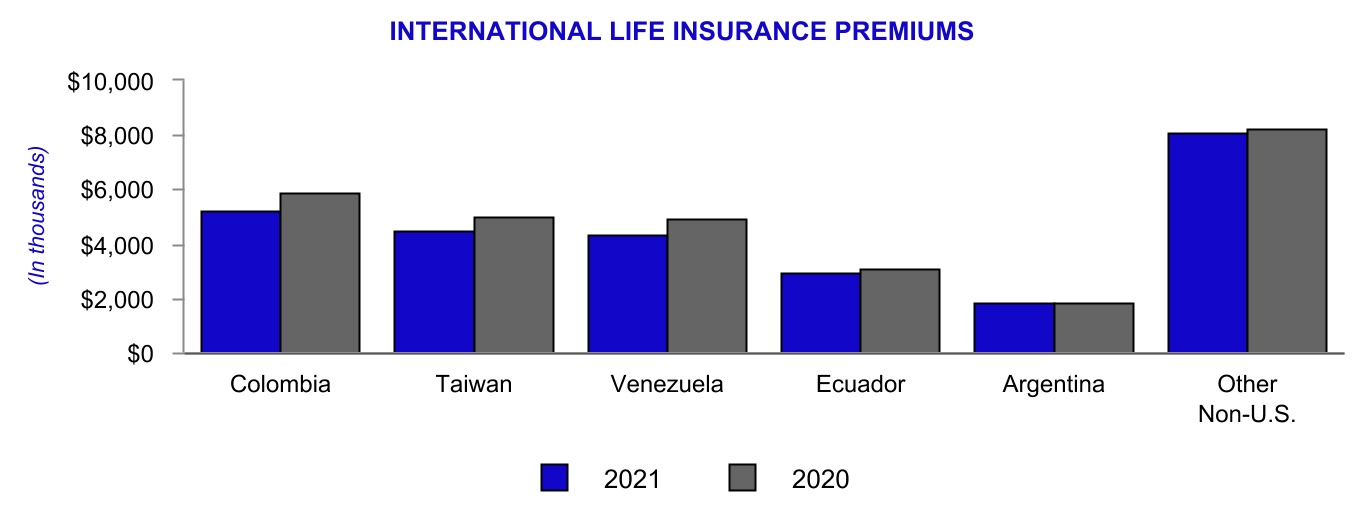
| | | | | | | | | | | | | | | | | |
| | | Three Months Ended |
| | | March 31, |
| (In thousands) | | | | | 2021 | | 2020 |
| Country: | | | | | | | |
| Colombia | | | | | $ | 5,244 | | | 5,888 | |
| Taiwan | | | | | 4,484 | | | 4,974 | |
| Venezuela | | | | | 4,368 | | | 4,953 | |
| Ecuador | | | | | 2,921 | | | 3,111 | |
| Argentina | | | | | 1,828 | | | 1,823 | |
| Other Non-U.S. | | | | | 8,105 | | | 8,201 | |
| Total | | | | | $ | 26,950 | | | 28,950 | |
We continueSales from Colombia, Taiwan and Venezuela continued to report strong first yearrepresent the majority of the new and renewal business premiums in our top producing countries as noted above; however, this business is dependent on our clients having access to U.S. dollars. Our international business and premium collections could be impacted by our inability to comply with current or future foreign laws or regulations applicable to the Company or our independent consultants in the countries from which we accept applications as well as by marketing or operational changes made by the Company to comply with those laws or regulations. Our international business may also be affected by economic or other events in foreign countries in which our policies are marketed. Venezuela, for example, is continuing to experience civil unrest due to local demonstrations against crime, corruption and soaring inflation and conditions have recently worsened due to political unrest and deteriorating economic conditions. As shown above, direct premiums from Venezuela have already begun to decline, and we expect that overall premiums from Venezuela will continue to decline if the deteriorating political and economic environment continues to adversely impact our ability to make sales and collect premiums. See "Item 1A. Risk Factors" for additional information.
Domestic Sales
The majority of our inforce business in the three months ended March 31, 2021. Overall, four of our top five countries listed above experienced a decline in premium levels in the current year period due primarily to decreases in renewal premiums. As we discussed above, our in force business, in terms of policy counts and amount of in force insurance, has been declining for several years due to changes we made to our products and distribution over the last few years, which resulted in the pace of new policies issued lagging the number of policies terminated from death, surrender or lapse.
DOMESTIC SALES
Domestic premiums in our Life Insurance segment were $1.2 million in the three months ended March 31, 2021, down from $1.3 million in the prior year period. Our domestic life insurance segmentin force business results from blocks of business of insurance companies that we have acquired over the past 17 years. We have aspired to serve middle income households through the salediscontinued new sales of cash accumulationdomestic ordinary whole life and endowment life insurance products however overwithin our Life Insurance segment in 2017 while we evaluated our domestic life strategy; therefore, the past few years, new product sales have been very modest while existing policies have been running off at a greater pace, which has compressedmajority of the block of insurancepremium recorded is related to renewal business. We began marketing our products again domestically in force. Beginning January 1, 2017, CICAearly 2021, beginning in Florida. We believe that our experience in developing and CNLIC ceased selling products domestically asin Latin America will help us expand into the products failed to qualify forlarge Hispanic market in the favorable U.S. federal income tax treatment afforded by IRC Section 7702. The Company is developing Section 7702 compliant products and will resume sales domestically once the products receive regulatory approval.
38
March 31, 2021 | 10-Q 36
CITIZENS, INC. AND CONSOLIDATED SUBSIDIARIES
September 30, 2017 | | | | | | | | |
| CITIZENS, INC. | MANAGEMENT'S DISCUSSION & ANALYSIS |
| | |
Net Investment Income. Annualized net investment income in our Life Insurance segment was as follows:
| | | | | | | | | | | | | | | | | |
| March 31, | | December 31, | | March 31, |
| (In thousands, except for %) | 2021 | | 2020 | | 2020 |
| Net investment income, annualized | $ | 46,393 | | | 45,885 | | | 45,920 | |
| Average invested assets, at amortized cost | 1,107,540 | | | 1,071,792 | | | 1,057,428 | |
| Annualized yield on average invested assets | 4.19 | % | | 4.28 | % | | 4.34 | % |
Annualized net investment income in our Life Insurance segment increased in the three months ended March 31, 2021 compared to the same period annualized in 2020 and the twelve months ended December 31, 2020, due to continued growth in average invested assets. The annualized yield in the first three months of 2021 decreased compared to the same period in 2020 and from December 31, 2020 as a substantial portion of our fixed maturity investments were called or matured during the past year and we face challenges in finding investments with comparable yields in the continued low interest rate environment. See the Investments section below for more detailed information on our investments.
Realized Investment Gains (Losses), Net. The realized loss for the three months ended March 31, 2021 and the realized gain for the prior year period were primarily due to changes in the market value of a preferred stock exchange traded fund purchased during the first quarter of 2020.
Claims and Surrenders.The following table sets forth our direct premiums by stateshows the claims and surrender benefits paid within the Life Insurance segment for the periods indicated.three months ended March 31, 2021 compared to the same period in 2020.
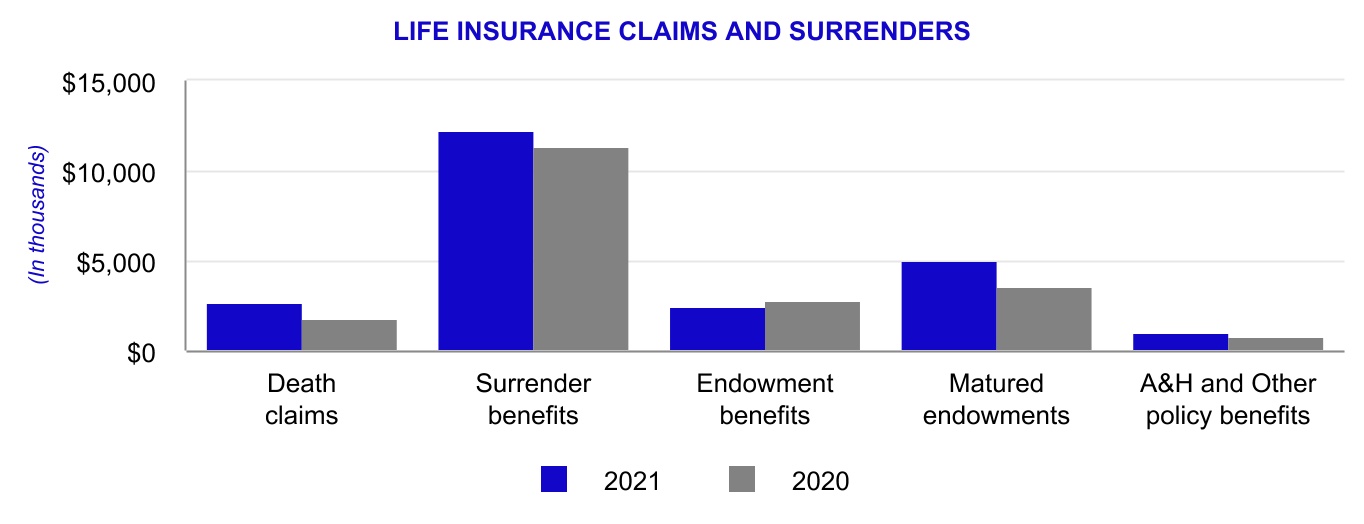
|
| | | | | | | | | | | | |
| | Three Months Ended | | Nine Months Ended |
| | September 30, | | September 30, |
| | 2017 | | 2016 | | 2017 | | 2016 |
| | (In thousands) |
| State | | | | | | | |
| Texas | $ | 529 |
| | 538 |
| | 1,501 |
| | 1,639 |
|
| Indiana | 289 |
| | 300 |
| | 923 |
| | 928 |
|
| Florida | 241 |
| | 204 |
| | 502 |
| | 440 |
|
| Missouri | 87 |
| | 92 |
| | 306 |
| | 319 |
|
| Kentucky | 64 |
| | 92 |
| | 219 |
| | 284 |
|
| Other States | 512 |
| | 533 |
| | 1,528 |
| | 1,394 |
|
| Total | $ | 1,722 |
| | 1,759 |
| | 4,979 |
| | 5,004 |
|
We report premiums based upon the current residence of our policyholders and therefore the increase in premiums received from Florida are related to policyholders moving into that state and updating their state of residence. A number of domestic life insurance companies we acquired had blocks of accident and health insurance policies, which we did not consider to be a core part of our business. We have ceded the majority of our accident and health insurance business to an unaffiliated insurance company under a coinsurance agreement.
CITIZENS, INC. AND CONSOLIDATED SUBSIDIARIES
September 30, 2017 | | | | | | | | |
| CITIZENS, INC. | MANAGEMENT'S DISCUSSION & ANALYSIS |
| | |
| | | | | | | | | | | | | | | | | |
| | | Three Months Ended |
| | | March 31, |
| (In thousands) | | | | | 2021 | | 2020 |
| Claims and Surrenders: | | | | | | | |
| Death claim benefits | | | | | $ | 2,684 | | | 1,725 | |
| Surrender benefits | | | | | 12,251 | | | 11,303 | |
| Endowment benefits | | | | | 2,399 | | | 2,736 | |
| Matured endowment benefits | | | | | 4,980 | | | 3,600 | |
| Accident and health benefits | | | | | 21 | | | 27 | |
| Other policy benefits | | | | | 935 | | | 769 | |
| Total claims and surrenders | | | | | $ | 23,270 | | | 20,160 | |
The majority of our claims and surrender benefits in our Life Insurance segment are related to payment of surrender benefits and matured endowment benefits. Policy surrenders increased 8.4% in the three months ended March 31, 2021 as compared to the prior year period and matured endowment benefits increased by 38.3% in the current year. These expenses have been increasing over the last several years, which is expected, due to the aging of this block of business - a significant portion of surrenders relates to policies that have been in force and have little to no associated surrender charges and endowment products reaching their stated maturities. These expenses are within expected levels.
The other key component of claims and surrender benefits is death claim benefits, which increased 55.6% in the three months ended March 31, 2021 as compared to the prior year period due to the reasons discussed above in “Current Financial Highlights”.
HOME SERVICE INSURANCE
We operate in the Home Service Insurance market through our subsidiaries SPLIC, MGLIC and SPFIC, and focus on the life insurance needs of the middle- and lower-income markets, primarily in Louisiana, Mississippi and Arkansas. Premium revenue of 89.4% and 89.7% in the three months ended March 31, 2021 and March 31, 2020, respectively, were from policyholders in Louisiana. Our policies are sold and serviced through a home service insurance marketing distribution system of independent agents who work on a debit route system and through funeral homes that sell policies, collect premiums and service policyholders.
| | | | | | | | |
| CITIZENS, INC. | MANAGEMENT'S DISCUSSION & ANALYSIS |
| | |
The results of operations for the life insuranceHome Service Insurance segment for the periods indicated are as follows.follows:
| | | | | | | | | | | | | | | | | Three Months Ended |
| | Three Months Ended | | Nine Months Ended | | | | March 31, |
| | September 30, | | September 30, | |
| | 2017 | | 2016 | | 2017 | | 2016 | |
| | (In thousands) | |
| Revenue: | | | | | | | | |
| (In thousands) | | (In thousands) | | | 2021 | | 2020 |
| Revenues: | | Revenues: | | | | | |
| Premiums | $ | 38,472 |
| | 37,572 |
| | 107,995 |
| | 107,531 |
| Premiums | | | $ | 11,969 | | | 11,498 | |
| Net investment income | 10,051 |
| | 8,473 |
| | 28,678 |
| | 24,534 |
| Net investment income | | | 3,345 | | | 3,332 | |
| Realized investment losses, net | (355 | ) | | — |
| | (419 | ) | | (660 | ) | |
| Realized investment gains (losses), net | | Realized investment gains (losses), net | | | 223 | | | (1,717) | |
| Other income | 561 |
| | 166 |
| | 856 |
| | 537 |
| Other income | | | 2 | | | 18 | |
| Total revenue | 48,729 |
| | 46,211 |
| | 137,110 |
| | 131,942 |
| |
| Total revenues | | Total revenues | | | 15,539 | | | 13,131 | |
| Benefits and expenses: | | | | | | | | Benefits and expenses: | | |
| Insurance benefits paid or provided: | | | | | | | | Insurance benefits paid or provided: | | |
| Claims and surrenders | 15,700 |
| | 14,980 |
| | 45,218 |
| | 43,601 |
| Claims and surrenders | | | 7,319 | | | 6,289 | |
| Increase in future policy benefit reserves | 18,045 |
| | 18,009 |
| | 47,818 |
| | 48,525 |
| Increase in future policy benefit reserves | | | 1,574 | | | 1,325 | |
| Policyholders' dividends | 1,602 |
| | 1,604 |
| | 4,387 |
| | 4,942 |
| Policyholders' dividends | | | 10 | | | 8 | |
| Total insurance benefits paid or provided | 35,347 |
| | 34,593 |
| | 97,423 |
| | 97,068 |
| Total insurance benefits paid or provided | | | 8,903 | | | 7,622 | |
| Commissions | 6,892 |
| | 6,973 |
| | 18,765 |
| | 19,544 |
| Commissions | | | 3,926 | | | 3,375 | |
| Other general expenses | 2,200 |
| | 990 |
| | 10,399 |
| | 9,115 |
| Other general expenses | | | 3,794 | | | 4,316 | |
| Capitalization of deferred policy acquisition costs | (6,242 | ) | | (6,346 | ) | | (16,843 | ) | | (17,764 | ) | Capitalization of deferred policy acquisition costs | | | (1,424) | | | (1,088) | |
| Amortization of deferred policy acquisition costs | 6,431 |
| | 5,889 |
| | 19,350 |
| | 17,807 |
| Amortization of deferred policy acquisition costs | | | 835 | | | 801 | |
| Amortization of cost of customer relationships acquired | 118 |
| | 119 |
| | 434 |
| | 419 |
| |
| Amortization of cost of insurance acquired | | Amortization of cost of insurance acquired | | | 263 | | | 250 | |
| Total benefits and expenses | 44,746 |
| | 42,218 |
| | 129,528 |
| | 126,189 |
| Total benefits and expenses | | | 16,297 | | | 15,276 | |
| Income (loss) before income tax expense | $ | 3,983 |
| | 3,993 |
| | 7,582 |
| | 5,753 |
| |
| Loss before federal income tax expense | | Loss before federal income tax expense | | | $ | (758) | | | (2,145) | |
Premiums.Premiums. Premium revenues increased for the three and nine month periods ended September 30, 2017, compared to the same periodsby 4.1% in2016 due primarily to an increase in renewal international business. Higher renewal business is typically positive for the Company indicating strong persistency as this block of insurance ages. First year premium revenues have declined for the nine months ended September 30, 2017, primarily as a result of the decrease in applications received from Venezuela as noted previously. Sales internationally have continued to be driven by our endowment to age sixty-five and the twenty-year endowment products which have been the top performers in the last several years.
Life insurance premium breakout is detailed below.
|
| | | | | | | | | | | | |
| | Three Months Ended | | Nine Months Ended |
| | September 30, | | September 30, |
| | 2017 | | 2016 | | 2017 | | 2016 |
| | (In thousands) |
| Premiums: | | | | | | | |
| First year | $ | 4,800 |
| | 4,785 |
| | 12,815 |
| | 13,544 |
|
| Renewal | 33,672 |
| | 32,787 |
| | 95,180 |
| | 93,987 |
|
| Total premiums | $ | 38,472 |
| | 37,572 |
| | 107,995 |
| | 107,531 |
|
CITIZENS, INC. AND CONSOLIDATED SUBSIDIARIES
September 30, 2017
Net Investment Income. Net investment income increased primarily due to the growth in average invested assets.
|
| | | | | | | | | |
| | Nine Months Ended | | Year Ended | | Nine Months Ended |
| | September 30, | | December 31, | | September 30, |
| | 2017 | | 2016 | | 2016 |
| | (In thousands, except for %) |
| Net investment income, annualized | $ | 38,228 |
| | 33,350 |
| | 32,712 |
|
| Average invested assets, at amortized cost | 882,034 |
| | 779,592 |
| | 756,730 |
|
| Annualized yield on average invested assets | 4.33 | % | | 4.28 | % | | 4.32 | % |
Realized Investment Losses, Net. Realized investment losses recorded for the three and nine month periods ended September 30, 2017 were primarily due to fixed maturity call activity. Other-than-temporary impairments were recorded for the nine month period ended September 30, 2016 totaling $959,000 related to one available-for-sale fixed maturity impairment in the first quarter of 2016.
Claims and Surrenders. These amounts fluctuate from period to period but were within anticipated ranges based upon management's expectations.
|
| | | | | | | | | | | | |
| | Three Months Ended | | Nine Months Ended |
| | September 30, | | September 30, |
| | 2017 | | 2016 | | 2017 | | 2016 |
| | (In thousands) |
| Death claims | $ | 1,755 |
| | 1,407 |
| | 4,576 |
| | 4,666 |
|
| Surrender benefits | 8,611 |
| | 7,587 |
| | 25,721 |
| | 23,049 |
|
| Endowment benefits | 3,963 |
| | 4,168 |
| | 11,129 |
| | 11,852 |
|
| Matured endowments | 531 |
| | 1,050 |
| | 1,487 |
| | 1,821 |
|
| Accident and health benefits | 70 |
| | 112 |
| | 167 |
| | 290 |
|
| Other policy benefits | 770 |
| | 656 |
| | 2,138 |
| | 1,923 |
|
| Total claims and surrenders | $ | 15,700 |
| | 14,980 |
| | 45,218 |
| | 43,601 |
|
Death claims expense was unfavorable for the three months ended September 30, 2017 compared with the same period in 2016. However, the claims reported for the nine months ended September 30, 2017, were lowerMarch 31, 2021 compared to the same period in 2016.2020, with increases in both first year premiums and renewal premiums despite the continuing effects of the COVID-19 pandemic in the states in which this segment operates. First year premiums increased due to an automatic issue product we offered to existing policyholders, which resulted in a higher number of policies issued as well as lower premiums in the prior year period due to the onset of the COVID-19 pandemic and stay-at-home orders, which negatively impacted our business. Renewal premiums increased based on continued strong collections by our independent agents.
Net Investment Income. Net investment income for the three months ended March 31, 2021 increased slightly compared to the same period in 2020 due to an increase in average invested assets and a one-time benefit from a “make-whole” call redemption offsetting a decline in portfolio yield.
Realized Investment Gains (Losses), Net. Changes in realized gains/losses, which reflect changes in fair values of our equity securities, were primarily due to the sudden stock market decline at the quarter ended March 31, 2020 due to the onset of the COVID-19 pandemic.
| | | | | | | | |
| CITIZENS, INC. | MANAGEMENT'S DISCUSSION & ANALYSIS |
| | |
Claims and Surrenders. Claims and surrender benefits for the Home Service Insurance segment is summarized as follows:
| | | | | | | | | | | | | | | | | |
| | | Three Months Ended |
| | | March 31, |
| (In thousands) | | | | | 2021 | | 2020 |
| Claims and Surrenders: | | | | | | | |
| Death claim benefits | | | | | $ | 6,256 | | | 4,864 | |
| Surrender benefits | | | | | 556 | | | 752 | |
| Endowment benefits | | | | | 2 | | | 3 | |
| Matured endowment benefits | | | | | 142 | | | 153 | |
| Property claims | | | | | 321 | | | 487 | |
| Accident and health benefits | | | | | 38 | | | 26 | |
| Other policy benefits | | | | | 4 | | | 4 | |
| Total claims and surrenders | | | | | $ | 7,319 | | | 6,289 | |
The vast majority of claims and surrender benefits in our Home Service Insurance segment relate to death claim benefits. Death claim benefits increased 28.6% in the three months ended March 31, 2021 compared to the 2020 period due to the reasons discussed above in “Current Financial Highlights”. Mortality experience is closely monitored by the Company as a key performance indicator and these amounts were within expected levels.
Surrenders increased in the three and nine month periods ended September 30, 2017 by 13.5% and 11.6% compared to 2016. The majority of policy surrender benefits paid is attributable to our international business and is in the later durations after the surrender charges are reduced or for periods in which the surrender charges have concluded. This is due to a maturing book of business.
Endowment benefit expense primarily results from the election by policyholders of a product feature providing an annual guaranteed benefit. This is a fixed benefit over the life of the contract, thus this expense will vary with new sales and persistency of the business.
Matured endowments decreased for the three and nine month periods ended September 30, 2017, compared to 2016, as fewer policies reached maturity in the current periods.
Other policy benefits resulted primarily from interest paidcan fluctuate based on premium deposits and policy benefit accumulations.
Increase in Future Policy Benefit Reserves. The change in policy benefit reserves decreased for the nine months ended September 30, 2017 compared to the same period in 2016, while increasing in the three months ended September 30, 2017 primarily impacted by the surrender activity noted above.
CITIZENS, INC. AND CONSOLIDATED SUBSIDIARIES
September 30, 2017
Policyholders' Dividends. Policyholders' dividends decreased for both the three and nine months ended September 30, 2017, as we adjusted our dividend rates for later durations in our policies beginning in 2016 and we are seeing a decrease in dividends as policies mature and new sales are not generating the same expense level.
Commissions. Commission expense decreased for the three and nine months ended September 30, 2017, compared to the same period in 2016. This expense fluctuates directly with new premium revenues and commission rates paid are higher on first year premium sales, which were down for the three and nine months ended September 30, 2017, compared to the same period in 2016. Renewal premiums for the three and nine months, for which we pay commissions at lower rates, were up from the prior year.
Other General Expenses. These expenses are allocated by segment, based upon an annual expense study performed by the Company. Expenses were up for the three and nine months ended September 30, 2017, compared to the same period in 2016 due primarily to additional audit fees related to the 2016 audit, higher legal and consulting fees and higher permanent and temporary salaries. This increase is offset by a decrease in our 7702/72(s) tax compliance best estimate liability of approximately $1.6 million and $3.7 million for the three and nine months ended September 30, 2017.
Capitalization of Deferred Policy Acquisition Costs ("DAC"). Capitalized costs fluctuate in direct relation to commissions, decreasing for the three and nine months ended September 30, 2017, based upon first year and renewal premiums and commissions paid compared to 2016.
Amortization of Deferred Policy Acquisition Costs. Amortization for the three and nine months ended September 30, 2017 increased and was impacted by higher surrenders in this segment. As previously noted, persistency is monitored closely by the Company and was within expectations.
Home Service Insurance
We operate in the Home Service insurance market through our subsidiaries Security Plan Life Insurance Company ("SPLIC"), Magnolia Guaranty Life Insurance Company ("MGLIC") and Security Plan Fire Insurance Company ("SPFIC"), and focus on the life insurance needs of the middle and lower income markets, primarily in Louisiana, Mississippi and Arkansas. Our policies are sold and serviced through a home service marketing distribution system of employee-agents who work full time on a route system and through funeral homes that sell policies, collect premiums and service policyholders.
The following table sets forth our direct premiums by state for the periods indicated.
|
| | | | | | | | | | | | |
| | Three Months Ended | | Nine Months Ended |
| | September 30, | | September 30, |
| | 2017 | | 2016 | | 2017 | | 2016 |
| | (In thousands) |
| State | | | | | | | |
| Louisiana | $ | 10,774 |
| | 10,673 |
| | 32,160 |
| | 31,991 |
|
| Mississippi | 591 |
| | 549 |
| | 1,854 |
| | 1,919 |
|
| Arkansas | 387 |
| | 399 |
| | 1,299 |
| | 1,192 |
|
| Other States | 236 |
| | 193 |
| | 680 |
| | 635 |
|
| Total | $ | 11,988 |
| | 11,814 |
| | 35,993 |
| | 35,737 |
|
CITIZENS, INC. AND CONSOLIDATED SUBSIDIARIES
September 30, 2017
Home Service Insurance Products
Our home service insurance products consist primarily of small face amount ordinary whole life and pre-need policies, which are designed to fund final expenses for the insured, primarily consisting of funeral and burial costs. To a much lesser extent, our home service insurance segment sells limited-liability, named-peril property policies covering dwellings and contents. We provide $30,000 maximum coverage on any one dwelling and contents, while content only coverage and dwelling only coverage is limited to $20,000, respectively.
We provide final expense ordinary life insurance and annuity products primarily to middle and lower income individuals in Louisiana, Mississippi and Arkansas.
The results of operations for the home service insurance segment for the periods indicated are as follows.
|
| | | | | | | | | | | | |
| | Three Months Ended | | Nine Months Ended |
| | September 30, | | September 30, |
| | 2017 | | 2016 | | 2017 | | 2016 |
| | (In thousands) |
| Revenue: | | | | | | | |
| Premiums | $ | 11,775 |
| | 11,600 |
| | 35,372 |
| | 35,087 |
|
| Net investment income | 3,355 |
| | 3,467 |
| | 9,864 |
| | 10,386 |
|
| Realized investment gains (losses), net | (49 | ) | | 46 |
| | 1,161 |
| | (1,116 | ) |
| Other income | — |
| | 2 |
| | 2 |
| | 5 |
|
| Total revenue | 15,081 |
| | 15,115 |
| | 46,399 |
| | 44,362 |
|
| Benefits and expenses: | | | | | | | |
| Insurance benefits paid or provided: | | | | | | | |
| Claims and surrenders | 5,754 |
| | 6,034 |
| | 16,912 |
| | 17,387 |
|
| Increase in future policy benefit reserves | 1,552 |
| | 988 |
| | 4,135 |
| | 3,570 |
|
| Policyholders' dividends | 11 |
| | 16 |
| | 31 |
| | 43 |
|
| Total insurance benefits paid or provided | 7,317 |
| | 7,038 |
| | 21,078 |
| | 21,000 |
|
| Commissions | 3,909 |
| | 3,879 |
| | 11,855 |
| | 11,553 |
|
| Other general expenses | 4,025 |
| | 3,610 |
| | 13,182 |
| | 11,357 |
|
| Capitalization of deferred policy acquisition costs | (1,514 | ) | | (1,544 | ) | | (4,697 | ) | | (4,493 | ) |
| Amortization of deferred policy acquisition costs | 1,192 |
| | 1,019 |
| | 3,290 |
| | 2,611 |
|
| Amortization of cost of customer relationships acquired | 517 |
| | 522 |
| | 1,195 |
| | 1,169 |
|
| Total benefits and expenses | 15,446 |
| | 14,524 |
| | 45,903 |
| | 43,197 |
|
| Income (loss) before income tax expense | $ | (365 | ) | | 591 |
| | 496 |
| | 1,165 |
|
Premiums. Premiums were up slightly for the three and nine month periods ended September 30, 2017, compared to 2016. For the nine month period ended September 30, 2017, first year premiums were up 2.2% and renewal premiums were up 0.6%.
CITIZENS, INC. AND CONSOLIDATED SUBSIDIARIES
September 30, 2017
Net Investment Income. Net investment income for our home service insurance segment was as follows.
|
| | | | | | | | | |
| | Nine Months Ended | | Year Ended | | Nine Months Ended |
| | September 30, | | December 31, | | September 30, |
| | 2017 | | 2016 | | 2016 |
| | (In thousands, except for %) |
| Net investment income, annualized | $ | 13,149 |
| | 13,705 |
| | 13,848 |
|
| Average invested assets, at amortized cost | 289,928 |
| | 294,132 |
| | 302,871 |
|
| Annualized yield on average invested assets | 4.54 | % | | 4.66 | % | | 4.57 | % |
Realized Investment Gains (Losses), Net. During the three months ended September 30, 2017 net losses were recorded related to issuer calls on bond investments. A realized gain was recorded for the nine month period ended September 30, 2017 of $1.1 million related to our first quarter 2017 sale of an office building in Little Rock, Arkansas. Other-than-temporary impairments were recorded for the nine month period ended September 30, 2016 totaling $1.3 million related to one available-for-sale fixed maturity security in the first quarter and four mutual fund impairments in the second quarter of 2016.
Claims and Surrenders. Claims and surrenders decreased for the three and nine months ended September 30, 2017, compared to the same periods in 2016, based upon reported claims compared to the prior year, but were within expected ranges.
|
| | | | | | | | | | | | |
| | Three Months Ended | | Nine Months Ended |
| | September 30, | | September 30, |
| | 2017 | | 2016 | | 2017 | | 2016 |
| | (In thousands) |
| Death claims | $ | 4,373 |
| | 4,387 |
| | 12,865 |
| | 13,109 |
|
| Surrender benefits | 837 |
| | 902 |
| | 2,212 |
| | 2,383 |
|
| Endowment benefits | 6 |
| | 2 |
| | 19 |
| | 10 |
|
| Matured endowments | 123 |
| | 99 |
| | 401 |
| | 357 |
|
| Property claims | 373 |
| | 593 |
| | 1,373 |
| | 1,477 |
|
| Accident and health benefits | 38 |
| | 46 |
| | 29 |
| | 37 |
|
| Other policy benefits | 4 |
| | 5 |
| | 13 |
| | 14 |
|
| Total claims and surrenders | $ | 5,754 |
| | 6,034 |
| | 16,912 |
| | 17,387 |
|
Death claims expense fluctuates based upon reported claims. We experienced a smaller number of reported claims in the three and nine months ended September 30, 2017. Mortality experience is closely monitored by the Company as a key performance indicator and amounts were within expected levels.
Surrender benefits decreased slightly for the three and nine months ended September 30, 2017 compared to the same period in 2016.
Property claims decreased for the three and nine months ended September 30, 2017 as we experienced less weather-related claims in the first nine months of 2017.
OTHER NON-INSURANCE ENTERPRISES
Increase in Future Policy Benefit Reserves. The change in future policy benefit reserves for the three and nine months ended September 30, 2017, increased due to a reserve adjustment recorded of approximately $400,000, before tax, in the current period related to a reserve review on a purchased block of business.
| | | | | | | | | | | |
| Three Months Ended |
| March 31, |
| (In thousands) | 2021 | | 2020 |
| Income (loss) before income tax expense | $ | (1,884) | | | (2,176) | |
Commissions. Commission expense increased for the three and nine months ended September 30, 2017, compared to the same period in 2016, consistent with premium collections.
CITIZENS, INC. AND CONSOLIDATED SUBSIDIARIES
September 30, 2017
Other General Expenses. Expenses are allocated by segment based upon an annual expense study performed by the Company. The expenses increased between 2017 and 2016 due primarily to additional audit fees related to the 2016 audit.
Capitalization of Deferred Policy Acquisition Costs ("DAC"). Capitalized costs increased for the nine months ended September 30, 2017, as commission expense increased during the period. DAC capitalization is directly correlated to fluctuations in new business and commissions.
Amortization of Deferred Policy Acquisition Costs. Amortization for the three and nine months ended September 30, 2017 increased compared to the corresponding period in 2016 and remained generally in line with this segment experienced persistency.
Other Non-Insurance Enterprises
This segmentoperating unit represents the administrative support entities to the insurance operations whose revenues are primarily intercompany and have been eliminated in consolidation under GAAP. TheU.S. GAAP, which typically results in a segment loss. Revenue in this operating unit consists primarily of net investment income and realized investment gains or losses, while expenses consist of other general expenses. In the three months ended March 31, 2021, the Other Non-Insurance Enterprises had a loss reportedof $1.9 million compared to a loss of $2.2 million for the three and nine months of 2017 and 2016 is typical since the elimination of intercompany revenue is its primary source of revenue.ended 2020 as realized investment gains improved.
InvestmentsINVESTMENTS
The administrationOur investments are an integral part of our investment portfolios is handled by our management, pursuant to board-approved investment guidelines, with all trading activity approved by a committee of each entity's respective boards of directors. The guidelines used require that fixed maturities, both government and corporate, are investment grade and comprise abusiness success, as we invest the majority of premiums collected to pay for future benefits and rely on net investment income for our ongoing operations. Our cash and invested assets at March 31, 2021 were $1.6 billion, of which 90.8% was invested in fixed maturity securities, all of which are classified as available-for-sale. We closely monitor the duration of our fixed maturity investments, and investment portfolio. State insurance statutes prescribe the qualitypurchases and percentage of the various types of investments that may be made by insurance companies and generally permit investment in qualified state, municipal, federal and foreign government obligations, high quality corporate bonds, preferred and common stock, mortgage loans and real estate within certain specified percentages. The assetssales are intended to mature in accordanceexecuted with the average maturityobjective of the insurance products andhaving adequate funds available to provide the cash flow forsatisfy our insurance company subsidiaries to meet their respective policyholder obligations.
45
March 31, 2021 | 10-Q 40
CITIZENS, INC. AND CONSOLIDATED SUBSIDIARIES
September 30, 2017 | | | | | | | | |
| CITIZENS, INC. | MANAGEMENT'S DISCUSSION & ANALYSIS |
| | |
The following table shows the carrying value of our investments by investment category and cash and cash equivalents, and the percentage of each to total cash and invested cash, cash equivalents and investments.assets.
| | | | September 30, 2017 | | December 31, 2016 | |
| | Carrying Value | | % of Total Carrying Value | | Carrying Value | | % of Total Carrying Value | |
| | (In thousands) | | (In thousands) | | |
| Marketable debt securities: | | | | | | | | |
| Carrying Value | | Carrying Value | March 31, 2021 | | December 31, 2020 |
| (In thousands, except for %) | | (In thousands, except for %) | Amount | | % | | Amount | | % |
| Cash and Invested Assets | | Cash and Invested Assets | |
| Fixed maturity securities: | | Fixed maturity securities: | | | | | | | |
| U.S. Treasury and U.S. Government-sponsored enterprises | $ | 16,521 |
| | 1.2 | | $ | 22,695 |
| | 1.8 | U.S. Treasury and U.S. Government-sponsored enterprises | $ | 15,538 | | | 1.0 | % | | $ | 16,117 | | | 1.0 | % |
| Corporate | | Corporate | 834,790 | | | 53.4 | % | | 877,208 | | | 52.8 | % |
States and political subdivisions | 787,409 |
| | 59.2 | | 797,240 |
| | 63.4 | 393,859 | | | 25.2 | % | | 409,665 | | | 24.7 | % |
| Corporate | 385,437 |
| | 29.0 | | 306,134 |
| | 24.3 | |
| Mortgage-backed (1) | 2,106 |
| | 0.2 | | 2,477 |
| | 0.2 | |
Mortgage-backed (2) | | Mortgage-backed (2) | 132,146 | | | 8.4 | % | | 140,184 | | | 8.5 | % |
| Asset-backed | | Asset-backed | 44,138 | | | 2.8 | % | | 46,091 | | | 2.8 | % |
| Foreign governments | 124 |
| | — | | 126 |
| | — | Foreign governments | 116 | | | — | % | | 118 | | | — | % |
| Total fixed maturity securities | 1,191,597 |
| | 89.6 | | 1,128,672 |
| | 89.7 | Total fixed maturity securities | 1,420,587 | | | 90.8 | % | | 1,489,383 | | | 89.8 | % |
| Short-term investments | — |
| | — | | 508 |
| | — | |
| | Cash and cash equivalents | 45,000 |
| | 3.4 | | 35,510 |
| | 2.8 | Cash and cash equivalents | 19,493 | | | 1.2 | % | | 34,131 | | | 2.1 | % |
| Other investments: | |
| | | | |
| | | Other investments: | | | | | | | |
| Policy loans | 71,215 |
| | 5.4 | | 66,672 |
| | 5.3 | Policy loans | 82,674 | | | 5.3 | % | | 83,318 | | | 5.0 | % |
| Equity securities | 16,146 |
| | 1.2 | | 18,159 |
| | 1.5 | Equity securities | 22,366 | | | 1.4 | % | | 22,102 | | | 1.3 | % |
| Mortgage loans | 197 |
| | — | | 232 |
| | — | |
| Real estate held for investment | 5,843 |
| | 0.4 | | 5,919 |
| | 0.5 | |
| Real estate held for sale | — |
| | — | | 1,939 |
| | 0.2 | |
| Other long-term investments | 37 |
| | — | | 38 |
| | — | |
| Total cash, cash equivalents and investments | $ | 1,330,035 |
| | 100.0 | | $ | 1,257,649 |
| | 100.0 | |
| | Real estate and other long-term investments | | Real estate and other long-term investments | 19,918 | | | 1.3 | % | | 29,865 | | | 1.8 | % |
| Total cash and invested assets | | Total cash and invested assets | $ | 1,565,038 | | | 100.0 | % | | $ | 1,658,799 | | | 100.0 | % |
(1)Includes $1.9$161.8 million and $2.2$164.0 million of securities guaranteed by third parties at March 31, 2021 and December 31, 2020, respectively.
(2) Includes $132.0 million and $139.8 million of U.S. Government-sponsored enterprises at September 30, 2017March 31, 2021 and December 31, 2016,2020, respectively.
Cash and cash equivalents increased as of September 30, 2017 due to timing of cash inflows and investment of cash into marketable securities.
The held-to-maturity portfolio as of September 30, 2017 represented 19.8%carrying value of the totalCompany’s fixed maturity securities owned based upon carrying values, with the remaining 80.2% classified as available-for-sale. Held-to-maturity securities are reported in the financial statementsinvestment portfolio at amortized cost and available-for-sale securities are reported at fair value.
March 31, 2021 was $1.4 billion. The following table sets forth the distribution of the credit ratings of our portfolio of fixed maturity securities by carrying value as of September 30, 2017March 31, 2021 did not materially change from December 31, 2020 – the weighted average was “A” at both dates.
Cash and cash equivalents decreased as of March 31, 2021 compared to December 31, 2020due primarily to the purchase of 100% of the Company’s Class B common stock from the Foundation for $9.1 million.
Real estate and other long-term investments decreased to $19.9 million as of March 31, 2021 as compared to $29.9 million as of December 31, 2020 primarily due a $8.8 million payment from a Rabbi Trust (which was considered a long-term investment) to our former Chief Executive Officer, Geoffrey Kolander, representing the severance payments due to him in connection with his resignation following the change in control.
Obligations of States and Political Subdivisions
The Company’s fixed maturity securities investment portfolio at March 31, 2021 and December 31, 2016.2020 included $393.9 million and $409.7 million, respectively, of securities that are obligations of states and political subdivisions, including municipalities (collectively referred to as the municipal bond portfolio).
|
| | | | | | | | | | | |
| | September 30, 2017 | | December 31, 2016 |
| | Carrying Value | | % of Total Carrying Value | | Carrying Value | | % of Total Carrying Value |
| | (In thousands) | | | | (In thousands) | | |
| AAA | $ | 94,510 |
| | 7.9 | | $ | 88,853 |
| | 7.9 |
| AA | 501,593 |
| | 42.1 | | 554,211 |
| | 49.1 |
| A | 310,639 |
| | 26.1 | | 238,350 |
| | 21.1 |
| BBB | 254,988 |
| | 21.4 | | 215,499 |
| | 19.1 |
| BB and other | 29,867 |
| | 2.5 | | 31,759 |
| | 2.8 |
| Totals | $ | 1,191,597 |
| | 100.0 | | $ | 1,128,672 |
| | 100.0 |
CITIZENS, INC. AND CONSOLIDATED SUBSIDIARIES
September 30, 2017 | | | | | | | | |
| CITIZENS, INC. | MANAGEMENT'S DISCUSSION & ANALYSIS |
| | |
Credit ratings reported for the periods indicated are assigned by a Nationally Recognized Statistical Rating Organization (“NRSRO”) such as Moody’s Investors Service, Standard & Poor’s or Fitch Ratings. A credit rating assigned by an NRSRO is a quality based rating, with AAA representing the highest quality and D the lowest, with BBB and above being considered investment grade. In addition, the Company may use credit ratings of the National Association of Insurance Commissioners (“NAIC”) Securities Valuation Office (“SVO”) as assigned, if there is no NRSRO rating. Securities rated by the SVO are grouped in the equivalent NRSRO category as stated by the SVO and securities that are not rated by an NRSRO are included in the “other” category.
The Company has no direct sovereign European debt exposure as of September 30, 2017. We do have indirect exposure in one bond mutual fund holding, but the amount is deemed immaterial to the current investment holdings and consolidated financials.
As of September 30, 2017,March 31, 2021, the Company heldCompany's municipal securities that include third partybond portfolio included third-party guarantees. Detailed below is a presentation by NRSROthe Nationally Recognized Statistical Rating Organization ("NRSRO") rating of our municipalthese holdings by funding type.type as of March 31, 2021.
Municipal securities shown including third party guarantees | | | | | | | | | | | | | | | | | | | | | | | | | | | | | | | | | | | | | | | | | | | | | | | | | | | | | |
| General Obligation | | Special Revenue | | Other | | Total | | % Based on Amortized
Cost |
| (In thousands, except for %) | Fair
Value | | Amortized
Cost | | Fair
Value | | Amortized
Cost | | Fair
Value | | Amortized
Cost | | Fair
Value | | Amortized
Cost | |
| State and political subdivision fixed maturity securities including third-party guarantees | | |
| AAA | $ | 21,343 | | | 20,768 | | | 3,307 | | | 3,091 | | | — | | | — | | | 24,650 | | | 23,859 | | | 6.4 | % |
| AA | 63,196 | | | 59,413 | | | 123,848 | | | 118,507 | | | 12,191 | | | 10,838 | | | 199,235 | | | 188,758 | | | 50.9 | % |
| A | 14,779 | | | 13,429 | | | 125,958 | | | 117,391 | | | 5,017 | | | 4,417 | | | 145,754 | | | 135,237 | | | 36.5 | % |
| BBB | 3,952 | | | 3,669 | | | 13,330 | | | 12,987 | | | 1,511 | | | 1,450 | | | 18,793 | | | 18,106 | | | 4.9 | % |
| BB and other | 4,758 | | | 4,428 | | | 669 | | | 607 | | | — | | | — | | | 5,427 | | | 5,035 | | | 1.3 | % |
| Total | $ | 108,028 | | | 101,707 | | | 267,112 | | | 252,583 | | | 18,719 | | | 16,705 | | | 393,859 | | | 370,995 | | | 100.0 | % |
| | | | | | | | | | | | | | | | | |
| State and political subdivision fixed maturity securities excluding third-party guarantees | | |
| AAA | $ | 3,248 | | | 3,156 | | | — | | | — | | | — | | | — | | | 3,248 | | | 3,156 | | | 0.9 | % |
| AA | 43,591 | | | 42,435 | | | 43,473 | | | 41,198 | | | 7,633 | | | 6,538 | | | 94,697 | | | 90,171 | | | 24.3 | % |
| A | 28,833 | | | 26,827 | | | 159,425 | | | 149,410 | | | 7,914 | | | 7,145 | | | 196,172 | | | 183,382 | | | 49.4 | % |
| BBB | 7,250 | | | 6,662 | | | 35,561 | | | 34,211 | | | 56 | | | 55 | | | 42,867 | | | 40,928 | | | 11.0 | % |
| BB and other | 25,106 | | | 22,627 | | | 28,653 | | | 27,764 | | | 3,116 | | | 2,967 | | | 56,875 | | | 53,358 | | | 14.4 | % |
| Total | $ | 108,028 | | | 101,707 | | | 267,112 | | | 252,583 | | | 18,719 | | | 16,705 | | | 393,859 | | | 370,995 | | | 100.0 | % |
|
| | | | | | | | | | | | | | | | | | | | | | | | | | |
| | September 30, 2017 |
| | General Obligation | | Special Revenue | | Other | | Total | | % Based on |
| | Fair
Value | | Amortized
Cost | | Fair
Value | | Amortized
Cost | | Fair
Value | | Amortized
Cost | | Fair
Value | | Amortized
Cost | | Amortized
Cost |
| | (In thousands) | | |
| AAA | $ | 59,502 |
| | 57,439 |
| | 32,771 |
| | 32,196 |
| | — |
| | — |
| | 92,273 |
| | 89,635 |
| | 11.6 |
| AA | 170,256 |
| | 165,008 |
| | 273,224 |
| | 265,301 |
| | 23,918 |
| | 22,965 |
| | 467,398 |
| | 453,274 |
| | 58.8 |
| A | 26,551 |
| | 26,156 |
| | 157,799 |
| | 151,415 |
| | 12,516 |
| | 11,828 |
| | 196,866 |
| | 189,399 |
| | 24.6 |
| BBB | 7,488 |
| | 7,616 |
| | 22,530 |
| | 22,189 |
| | 2,004 |
| | 2,015 |
| | 32,022 |
| | 31,820 |
| | 4.1 |
| BB and other | 3,348 |
| | 3,719 |
| | 2,946 |
| | 3,457 |
| | — |
| | — |
| | 6,294 |
| | 7,176 |
| | 0.9 |
| Total | $ | 267,145 |
| | 259,938 |
| | 489,270 |
| | 474,558 |
| | 38,438 |
| | 36,808 |
| | 794,853 |
| | 771,304 |
| | 100.0 |
Municipal securities shown excluding third party guarantees
|
| | | | | | | | | | | | | | | | | | | | | | | | | | |
| | September 30, 2017 |
| | General Obligation | | Special Revenue | | Other | | Total | | % Based on |
| | Fair
Value | | Amortized
Cost | | Fair
Value | | Amortized
Cost | | Fair
Value | | Amortized
Cost | | Fair
Value | | Amortized
Cost | | Amortized
Cost |
| | (In thousands) | | |
| AAA | $ | 39,389 |
| | 38,288 |
| | 11,722 |
| | 11,720 |
| | — |
| | — |
| | 51,111 |
| | 50,008 |
| | 6.5 |
| AA | 144,583 |
| | 140,227 |
| | 223,788 |
| | 217,343 |
| | 16,815 |
| | 15,865 |
| | 385,186 |
| | 373,435 |
| | 48.4 |
| A | 40,552 |
| | 39,205 |
| | 160,060 |
| | 153,553 |
| | 12,976 |
| | 12,266 |
| | 213,588 |
| | 205,024 |
| | 26.6 |
| BBB | 12,292 |
| | 12,246 |
| | 44,042 |
| | 43,153 |
| | — |
| | — |
| | 56,334 |
| | 55,399 |
| | 7.2 |
| BB and other | 30,329 |
| | 29,972 |
| | 49,658 |
| | 48,789 |
| | 8,647 |
| | 8,677 |
| | 88,634 |
| | 87,438 |
| | 11.3 |
| Total | $ | 267,145 |
| | 259,938 |
| | 489,270 |
| | 474,558 |
| | 38,438 |
| | 36,808 |
| | 794,853 |
| | 771,304 |
| | 100.0 |
CITIZENS, INC. AND CONSOLIDATED SUBSIDIARIES
September 30, 2017
The table below shows the categories in which the Company held investments in special revenue bonds that had awere greater than 10% exposureof fair value based upon activity as noted in the table below.Company's municipal bond portfolio at March 31, 2021.
| | (In thousands) | | (In thousands) | Fair
Value | | Amortized
Cost | | % of Total
Fair Value |
| | | | | | | | | | |
| Education | | Education | $ | 70,289 | | | 66,134 | | | 17.9 | % |
| Utilities | | Utilities | 65,579 | | | 59,591 | | | 16.7 | % |
| Transportation | | Transportation | 39,432 | | | 38,709 | | | 10.0 | % |
| Fair Value | | Amortized
Cost | | % of Total
Fair Value | |
| | (In thousands) | | | |
| Utilities | $ | 160,854 |
| | 154,352 |
| | 20.2 | % | |
| Education | 113,352 |
| | 109,661 |
| | 14.3 | % | |
| General Obligations | 86,947 |
| | 84,627 |
| | 10.9 | % | |
The Company's exposure of municipal holdings isbond portfolio are spread across many states, withhowever, municipal bonds from Texas and Florida asCalifornia comprise the two states withmost significant concentration of the largesttotal municipal holdingsbond portfolio as of September 30, 2017.March 31, 2021. The Company holds 22.8%21.1% and 10.0% of its municipal security holdingsbond portfolio in Texas and California issuers, and 11.9% in Florida issuers based on fair value.respectively, as of March 31, 2021. There were no other states or individual issuer holdings that represented or exceeded 10% of the total municipal bond portfolio as of September 30, 2017. The tables below represent the exposure the Company holds in these two states.March 31, 2021.
|
| | | | | | | | | | | | | | | | | | | | | | | | |
| | September 30, 2017 |
| | General Obligation | | Special Revenue | | Other | | Total |
| | Fair
Value | | Amortized
Cost | | Fair
Value | | Amortized
Cost | | Fair
Value | | Amortized
Cost | | Fair
Value | | Amortized
Cost |
| | (In thousands) |
| Texas securities including third party guarantees | |
| | |
| | |
| | |
| | |
| | |
| | |
| | |
|
| AAA | $ | 57,444 |
| | 55,442 |
| | 15,017 |
| | 14,568 |
| | — |
| | — |
| | 72,461 |
| | 70,010 |
|
| AA | 52,563 |
| | 51,644 |
| | 30,753 |
| | 29,773 |
| | — |
| | — |
| | 83,316 |
| | 81,417 |
|
| A | 200 |
| | 199 |
| | 16,402 |
| | 15,781 |
| | — |
| | — |
| | 16,602 |
| | 15,980 |
|
| BBB | — |
| | — |
| | 7,101 |
| | 6,640 |
| | — |
| | — |
| | 7,101 |
| | 6,640 |
|
| BB and other | — |
| | — |
| | 1,577 |
| | 2,097 |
| | — |
| | — |
| | 1,577 |
| | 2,097 |
|
| Total | $ | 110,207 |
| | 107,285 |
| | 70,850 |
| | 68,859 |
| | — |
| | — |
| | 181,057 |
| | 176,144 |
|
| Texas securities excluding third party guarantees | |
| | |
| | |
| | |
| | |
| | |
| | |
| | |
|
| AAA | $ | 33,529 |
| | 33,084 |
| | 996 |
| | 994 |
| | — |
| | — |
| | 34,525 |
| | 34,078 |
|
| AA | 67,509 |
| | 65,344 |
| | 30,570 |
| | 29,504 |
| | — |
| | — |
| | 98,079 |
| | 94,848 |
|
| A | 7,880 |
| | 7,653 |
| | 22,907 |
| | 21,994 |
| | — |
| | — |
| | 30,787 |
| | 29,647 |
|
| BBB | 200 |
| | 199 |
| | 10,311 |
| | 9,821 |
| | — |
| | — |
| | 10,511 |
| | 10,020 |
|
| BB and other | 1,089 |
| | 1,005 |
| | 6,066 |
| | 6,546 |
| | — |
| | — |
| | 7,155 |
| | 7,551 |
|
| Total | $ | 110,207 |
| | 107,285 |
| | 70,850 |
| | 68,859 |
| | — |
| | — |
| | 181,057 |
| | 176,144 |
|
CITIZENS, INC. AND CONSOLIDATED SUBSIDIARIES
September 30, 2017 | | | | | | | | |
| CITIZENS, INC. | MANAGEMENT'S DISCUSSION & ANALYSIS |
| | |
The table below represents the Company's detailed exposure to municipal bond portfolio in Texas at March 31, 2021.
| | | | | | | | | | | | | | | | | | | | | | | | | | | | | | | | | | | | | | | | | | | | | | | |
| March 31, 2021 | General Obligation | | Special Revenue | | Other | | Total |
| (In thousands) | Fair
Value | | Amortized
Cost | | Fair
Value | | Amortized
Cost | | Fair
Value | | Amortized
Cost | | Fair
Value | | Amortized
Cost |
| Texas state and political subdivision fixed maturity securities including third-party guarantees |
| AAA | $ | 20,757 | | | 20,259 | | | 3,307 | | | 3,091 | | | — | | | — | | | 24,064 | | | 23,350 | |
| AA | 21,754 | | | 21,407 | | | 13,426 | | | 12,811 | | | 56 | | | 55 | | | 35,236 | | | 34,273 | |
| A | — | | | — | | | 21,385 | | | 21,849 | | | — | | | — | | | 21,385 | | | 21,849 | |
| BBB | — | | | — | | | 1,905 | | | 1,827 | | | — | | | — | | | 1,905 | | | 1,827 | |
| BB and other | — | | | — | | | 554 | | | 508 | | | — | | | — | | | 554 | | | 508 | |
| Total | $ | 42,511 | | | 41,666 | | | 40,577 | | | 40,086 | | | 56 | | | 55 | | | 83,144 | | | 81,807 | |
| Texas state and political subdivision fixed maturity securities excluding third-party guarantees |
| AAA | $ | 3,248 | | | 3,156 | | | — | | | — | | | — | | | — | | | 3,248 | | | 3,156 | |
| AA | 32,080 | | | 31,541 | | | 3,299 | | | 3,061 | | | — | | | — | | | 35,379 | | | 34,602 | |
| A | 5,985 | | | 5,818 | | | 28,939 | | | 29,020 | | | — | | | — | | | 34,924 | | | 34,838 | |
| BBB | 1,198 | | | 1,151 | | | 5,483 | | | 5,207 | | | 56 | | | 55 | | | 6,737 | | | 6,413 | |
| BB and other | — | | | — | | | 2,856 | | | 2,798 | | | — | | | — | | | 2,856 | | | 2,798 | |
| Total | $ | 42,511 | | | 41,666 | | | 40,577 | | | 40,086 | | | 56 | | | 55 | | | 83,144 | | | 81,807 | |
The table below represents the Company's detailed exposure to municipal bond portfolio in California at March 31, 2021.
| | | | | | | | | | | | | | | | | | | | | | | | | | | | | | | | | | | | | | | | | | | | | | | |
| March 31, 2021 | General Obligation | | Special Revenue | | Other | | Total |
| (In thousands) | Fair
Value | | Amortized
Cost | | Fair
Value | | Amortized
Cost | | Fair
Value | | Amortized
Cost | | Fair
Value | | Amortized
Cost |
| California state and political subdivision fixed maturity securities including third-party guarantees |
| AAA | $ | — | | | — | | | — | | | — | | | — | | | — | | | — | | | — | |
| AA | 1,681 | | | 1,650 | | | 25,068 | | | 24,333 | | | 2,898 | | | 2,728 | | | 29,647 | | | 28,711 | |
| A | — | | | — | | | 4,682 | | | 4,726 | | | — | | | — | | | 4,682 | | | 4,726 | |
| BBB | — | | | — | | | 4,888 | | | 4,669 | | | — | | | — | | | 4,888 | | | 4,669 | |
| BB and other | — | | | — | | | — | | | — | | | — | | | — | | | — | | | — | |
| Total | $ | 1,681 | | | 1,650 | | | 34,638 | | | 33,728 | | | 2,898 | | | 2,728 | | | 39,217 | | | 38,106 | |
| California state and political subdivision fixed maturity securities excluding third-party guarantees |
| AAA | $ | — | | | — | | | — | | | — | | | — | | | — | | | — | | | — | |
| AA | 1,681 | | | 1,650 | | | 2,664 | | | 2,632 | | | — | | | — | | | 4,345 | | | 4,282 | |
| A | — | | | — | | | 10,496 | | | 10,294 | | | 2,898 | | | 2,728 | | | 13,394 | | | 13,022 | |
| BBB | — | | | — | | | 8,521 | | | 7,970 | | | — | | | — | | | 8,521 | | | 7,970 | |
| BB and other | — | | | — | | | 12,957 | | | 12,832 | | | — | | | — | | | 12,957 | | | 12,832 | |
| Total | $ | 1,681 | | | 1,650 | | | 34,638 | | | 33,728 | | | 2,898 | | | 2,728 | | | 39,217 | | | 38,106 | |
|
| | | | | | | | | | | | | | | | | | | | | | | | |
| | September 30, 2017 |
| | General Obligation | | Special Revenue | | Other | | Total |
| | Fair
Value | | Amortized
Cost | | Fair
Value | | Amortized
Cost | | Fair
Value | | Amortized
Cost | | Fair
Value | | Amortized
Cost |
| | (In thousands) |
| Florida securities including third party guarantees | | | | | | | | | | | | | | | |
| AAA | $ | 530 |
| | 513 |
| | 3,704 |
| | 3,586 |
| | — |
| | — |
| | 4,234 |
| | 4,099 |
|
| AA | — |
| | — |
| | 60,200 |
| | 58,928 |
| | 3,766 |
| | 3,798 |
| | 63,966 |
| | 62,726 |
|
| A | — |
| | — |
| | 13,609 |
| | 13,248 |
| | 12,516 |
| | 11,828 |
| | 26,125 |
| | 25,076 |
|
| BBB | — |
| | — |
| | — |
| | — |
| | — |
| | — |
| | — |
| | — |
|
| BB and other | — |
| | — |
| | 483 |
| | 477 |
| | — |
| | — |
| | 483 |
| | 477 |
|
| Total | $ | 530 |
| | 513 |
| | 77,996 |
| | 76,239 |
| | 16,282 |
| | 15,626 |
| | 94,808 |
| | 92,378 |
|
| | | | | | | | | | | | | | | | |
| Florida securities excluding third party guarantees | | | | | | | | | | | | | | | |
| AAA | $ | — |
| | — |
| | 1,057 |
| | 1,037 |
| | — |
| | — |
| | 1,057 |
| | 1,037 |
|
| AA | 530 |
| | 513 |
| | 43,434 |
| | 42,498 |
| | 3,766 |
| | 3,799 |
| | 47,730 |
| | 46,810 |
|
| A | — |
| | — |
| | 27,284 |
| | 26,765 |
| | 10,991 |
| | 10,302 |
| | 38,275 |
| | 37,067 |
|
| BBB | — |
| | — |
| | 1,831 |
| | 1,705 |
| | — |
| | — |
| | 1,831 |
| | 1,705 |
|
| BB and other | — |
| | — |
| | 4,390 |
| | 4,234 |
| | 1,525 |
| | 1,525 |
| | 5,915 |
| | 5,759 |
|
| Total | $ | 530 |
| | 513 |
| | 77,996 |
| | 76,239 |
| | 16,282 |
| | 15,626 |
| | 94,808 |
| | 92,378 |
|
CITIZENS, INC. AND CONSOLIDATED SUBSIDIARIES
September 30, 2017 | | | | | | | | |
| CITIZENS, INC. | MANAGEMENT'S DISCUSSION & ANALYSIS |
| | |
IMPAIRMENT CONSIDERATIONS RELATED TO INVESTMENTS IN FIXED MATURITY AND EQUITY SECURITIES
The
For the three months ended March 31, 2021 and 2020, the Company investsrecorded no credit valuation losses on fixed maturity securities.
Information on both unrealized and realized gains and losses by category is set forth in municipal securitiesPart I, Item 1, Note 5. Investments of issuersthe notes to our consolidated financial statements herein.
LIQUIDITY AND CAPITAL RESOURCES
Although the Company experienced increased death claim benefits in the statefirst three months of Louisiana and receives a credit2021, we do not believe that reduces its premium tax liability in that state. At September 30, 2017, total holdings of municipal securities in Louisiana represented 4.4% of all municipal holdings based upon fair value.
|
| | | | | | | | | | | | | | | | | | | | | | | | | |
| | September 30, 2017 |
| | General Obligation | | Special Revenue | | Other | | Total |
| | Fair
Value | | Amortized
Cost | | Fair
Value | | Amortized
Cost | | Fair
Value | | Amortized
Cost | | Fair
Value | | Amortized
Cost |
| | (In thousands) |
| Louisiana securities including third party guarantees | | | | | | | | | | | | | | | |
| AAA | $ | — |
| | — |
| | — |
| | — |
| | — |
| | — |
| | — |
| | — |
|
| AA | 7,040 |
| | 6,809 |
| | 15,575 |
| | 15,044 |
| | — |
| | — |
| | 22,615 |
| | 21,853 |
|
| A | 5,310 |
| | 5,145 |
| | 6,623 |
| | 6,471 |
| | — |
| | — |
| | 11,933 |
| | 11,616 |
|
| BBB | — |
| | — |
| | 376 |
| | 375 |
| | — |
| | — |
| | 376 |
| | 375 |
|
| BB and other | — |
| | — |
| | 362 |
| | 358 |
| | — |
| | — |
| | 362 |
| | 358 |
|
| Total | $ | 12,350 |
| | 11,954 |
| | 22,936 |
| | 22,248 |
| | — |
| | — |
| | 35,286 |
| | 34,202 |
|
| Louisiana securities excluding third party guarantees | | | | | | | | | | | | | | | |
| AAA | $ | — |
| | — |
| | — |
| | — |
| | — |
| | — |
| | — |
| — |
| — |
|
| AA | 9,597 |
| | 9,256 |
| | 11,688 |
| | 11,352 |
| | — |
| | — |
| | 21,285 |
| | 20,608 |
|
| A | 2,242 |
| | 2,174 |
| | 7,774 |
| | 7,567 |
| | — |
| | — |
| | 10,016 |
| | 9,741 |
|
| BBB | — |
| | — |
| | 1,048 |
| | 1,004 |
| | — |
| | — |
| | 1,048 |
| | 1,004 |
|
| BB and other | 511 |
| | 524 |
| | 2,426 |
| | 2,325 |
| | — |
| | — |
| | 2,937 |
| | 2,849 |
|
| Total | $ | 12,350 |
| | 11,954 |
| | 22,936 |
| | 22,248 |
| | — |
| | — |
| | 35,286 |
| | 34,202 |
|
Valuation of Investments
We evaluate the carrying value of our fixed maturity and equity securities at least quarterly. The Company monitors all debt and equity securities on an on-going basis relative to changes in credit ratings, market prices, earnings trends and financial performance, in addition to specific region or industry reviews. The assessment of whether other-than-temporary impairments have occurred is based on a case-by-case evaluation of underlying reasons for the decline in fair value. The Company determines other-than-temporary impairment by reviewing all relevant evidence related to the specific security issuer as well as the Company's
intent to sellliquidity and capital resources were materially impacted by COVID-19 in the
security, or if it is more likely than not thatperiod. For further discussion regarding the
Company would be required to sell a security before recoverypotential future impacts of
its amortized cost.COVID-19 and related economic conditions on the Company's liquidity and capital resources, see Part I, Item 1A, Risk Factors in the Company's Form 10-K.
When an other-than-temporary impairment has occurred, the amount of the other-than-temporary impairment recognized in earnings depends on whether the Company intends to sell the security or more likely than not will be required to sell the security before recovery of its amortized cost basis. If the Company intends to sell the security or more likely than not will be required to sell the security before recovery of its amortized cost basis, the other-than-temporary impairment is recognized in earnings equal to the entire difference between the investment's cost and its fair value at the balance sheet date. If the Company does not intend to sell the security and it is not more likely than not that the Company will be required to sell the security before recovery of its amortized cost basis, the other-than-temporary impairment is separated into the following: a) the amount representing the credit loss; and b) the amount related to all other factors. The amount of the total other-than-temporary impairment related to the credit loss is recognized in earnings. The amount of the total other-than-temporary impairment related to other factors is recognized in other comprehensive income, net of applicable taxes. The previous amortized cost basis less the other-than-temporary impairment recognized in earnings becomes the new amortized cost basis of the investment. The new amortized cost basis is not adjusted for subsequent recoveries in fair value.
CITIZENS, INC. AND CONSOLIDATED SUBSIDIARIES
September 30, 2017
The Company recognized other-than-temporary impairments of $17,000 for the nine months ended September 30, 2017 for one equity security that was in an unrealized loss position for greater than one year. The Company recognized an other-than-temporary impairment of $2.3 million for the nine months ended September 30, 2016.
Liquidity and Capital Resources
Liquidity refers to a company's ability to generate sufficient cash flows to meet the needs of its operations. Liquidity is managed onWe manage our insurance operations as described herein in order to ensure that we have stable and reliable sources of cash flows to meet obligations providedour obligations. We expect to meet our cash needs for the next 12 months with cash generated by our insurance operations and from our invested assets. At March 31, 2021, we had $19.5 million in cash and cash equivalents and $1.5 billion in invested assets.
PARENT COMPANY LIQUIDITY AND CAPITAL RESOURCES
Liquidity is the ability to generate amounts of cash adequate to meet our cash needs. Citizens is a varietyholding company and has minimal operations of sources.
Liquidity requirementsits own. Our assets consist of the Companycapital stock of our subsidiaries, cash and investments. Our liquidity requirements are met primarily from two sources: cash generated from our operating subsidiaries and our invested assets. Our ability to obtain cash from our insurance subsidiaries depends primarily upon the availability of statutorily permissible payments, including payments Citizens receives from service agreements with our life insurance subsidiaries and dividends from the subsidiaries. The ability to make payments to the holding company is limited by funds providedapplicable laws and regulations of Bermuda and U.S. states of domicile which subject insurance operations to significant regulatory restrictions. These laws and regulations require, among other things, that our insurance subsidiaries maintain minimum solvency requirements, which limit the amount of dividends that can be paid to the holding company. The regulations also require approval of our service agreements with the applicable regulatory authority in order to prevent insurance subsidiaries from operations. Premium depositsmoving large amounts of cash to the unregulated holding company.
Our cash and cash equivalents decreased from $34.1 million at December 31, 2020 to $19.5 million at March 31, 2021. In the three months ended March 31, 2021, uses of cash included:
•$8.8 million severance payment to our former Chief Executive Officer, Geoffrey Kolander, following his resignation pursuant to the terms of his employment agreement and the Chief Executive Officer Separation of Service and Consulting Agreement dated July 29, 2020 (See Part I, Item 1, Note 6.Fair Value Measurements – "Other Long-Term Investments”, herein, and our Form 10-K for additional discussion about the severance payment to Mr. Kolander); and •$9.1 million payment to the Harold E. Riley Foundation ("Foundation") for the purchase of 100% of the outstanding Class B common stock.
On May 5, 2021, we entered into a Credit Facility with Regions Bank. See Part I, Item 1, Note 7. Commitments and Contingencies in the notes to our consolidated financial statements, herein, for a description of the Credit Facility.
| | | | | | | | |
| CITIZENS, INC. | MANAGEMENT'S DISCUSSION & ANALYSIS |
| | |
The Credit Facility provides additional liquidity to the Company for short-term and longer-term needs. As of May 5, 2021, we had not borrowed any money under the Credit Facility and do not expect to do so immediately.
INSURANCE COMPANY SUBSIDIARY LIQUIDITY AND CAPITAL RESOURCES
The liquidity requirements of our insurance operations are primarily met by premium revenues, investment income and investment maturities are the primary sourcesmaturities. Primary cash needs relate to payments of funds, whilepolicy benefits to policyholders, investment purchases policy benefits, and operating expenses are the primary uses of funds. We historicallyexpenses. Historically, we have not had to liquidate a material amount of investments to provide cash flow for our insurance operations and we did not do so duringin the first ninethree months of 2017. Our investments as of September 30, 2017, consist of 74.3% of marketable debt securities classified as available-for-saleended March 31, 2021. We believe that could be readily convertedwe have adequate capital resources to cash forsupport the liquidity needs.
A primary liquidity concern is the riskrequirements of an extraordinary level of early policyholder withdrawals. We include provisions within our insurance policies, such as surrender charges, that help limit and discourage early withdrawals. Since these contractual withdrawals, as well asoperations if the level of surrenders experienced, have been largely consistent with our assumptions in asset liability management, our associated cash outflows have, historically, not had an adverse impact on our overall liquidity. Individual life insurance policies are less susceptible to withdrawal than annuity reserves and deposit liabilities because policyholders may incur surrender charges and undergo a new underwriting process in order to obtain a new insurance policy. Cash flow projections and cash flow tests under various market interest rate scenarios are also performed annually to assist in evaluating liquidity needs and adequacy. We currently anticipate that available liquidity sources and future cash flows will be adequate to meet our needs for funds.
Cash flows from our insurance operations historically have been sufficientis insufficient to meet currentour cash needs. Cash flows from operating activities were $68.9 millionSee Contractual Obligations and $69.2 millionOff-balance Sheet Arrangements in our Form 10-K for a discussion of known and estimated cash needs.
In the ninethree months ended September 30, 2017March 31, 2021, our operations provided $1.8 million in net cash as compared to $14.1 million provided by operations in the same period in 2020. As mentioned above, we used $8.8 million in cash in the quarter to pay Mr. Kolander’s severance. Cash provided by operations was also lower, as surrenders and 2016, respectively.lower renewal premiums in our international business are not being replaced by new sales. We have traditionally also had significant cash flows from investing activities due to both scheduled and unscheduled investment security maturities, redemptions, and prepayments. These cash flows, for the most part, are reinvested in fixed income securities.securities and to a lesser extent private equity funds and other alternative investments. Net cash outflows fromused in investing activities totaled $61.6$7.4 million and $121.5 million for the ninethree months ended September 30, 2017 and 2016, respectively.March 31, 2021 as opposed to $26.2 million used in investing activities for the three months ended March 31, 2020. The investing activities fluctuate from period to period due to timing of securities activities such as calls and maturities and reinvestment of those funds. Cash used in financing activities was $9.1 million in the three months ended March 31, 2021, due to the purchase of the Class B common stock from the Foundation.
In 2015, we determined thatBecause claims and surrender benefits are our largest expense, a primary liquidity concern is the risk of an extraordinary level of early policyholder surrenders. While these expenses increased in the three months ended March 31, 2021 and have been increasing over the last several years, the increases are within expected levels due to the aging of this block of business - a significant portion of surrenders relates to policies that have been in force and have little to no associated surrender charges and endowment products reaching their stated maturities.
For reasons previously discussed, death claim benefits in our Home Service Insurance segment increased in the life insurance and annuity policies issued by our subsidiary insurance companies failedfirst quarter of 2021. We continue to qualifyclosely monitor claim volumes to evaluate whether there is a delay in reporting or filing for the favorable U.S. federal income tax treatment afforded by Sections 7702 and 72(s)benefits as a result of the Internal Revenue Code ("IRC") of 1986. COVID-19 pandemic.
As of September 30, 2017,discussed above, we are subject to regulatory capital requirements that could affect the Company’s ability to access capital from our insurance operations or cause the Company to have established a liability reserve of $10.7 million, net of tax, for probable liabilities and expenses associated with this tax compliance matter, which represents management’s estimate and we have disclosed an estimated range related to probable liabilities and expenses of $5.6 millionput additional cash in our wholly-owned subsidiaries.
Our domestic companies are subject to $34.0 million, net of tax. This estimate and range includes projected toll charges and fees payable to the IRS, as well as estimated increased payout obligations to current and former holders of non-compliant domestic life insurance policies expected to result from remediation of those policies. The amount of our liabilities and expenses depends on a number of uncertainties, including the number of prior tax years for which we may be liable to the IRS, the number of domestic life insurance policies we will be required to remediate, and the methodology applicable to the calculation of taxable benefits under non-compliant policies. Given the range of potential outcomes and the significant variables assumed in establishing our estimates, actual amounts incurred may exceed our reserve and also could exceed the high end of our estimated range of liabilities and expenses.
In May 2017, we submitted an offer under Rev Proc 2008-40 to enter into closing agreements with the IRS covering certain CICA and CNLIC domestic life insurance contracts. A voluntary, taxpayer-initiated closing agreement under this IRS revenue procedure generally addresses situations where a taxpayer has inadvertently failed to meet the requirements of Internal Revenue Code section 7702, which defines life insurance for federal tax purposes. A voluntary closing agreement allows taxpayers to come forward to the IRS with self-identified violations or deficiencies and work with the IRS towards a mutual resolution to correct the violations or deficiencies. The consideration offered by CICA and CNLIC under the proposed closing agreements totaled approximately $124,000 and $4,000, respectively. The consideration that will be required under the final closing agreements could be different
CITIZENS, INC. AND CONSOLIDATED SUBSIDIARIES
September 30, 2017
and will depend on how the IRS responds to the closing agreements offer. We expect to file other offers for additional closing agreements with the IRS for the SPLIC and MGLIC life insurance businesses, the CICA international life insurance business and our annuity business in 2018.
This tax compliance issue impacts our policyholders and their tax liabilities relative to these products that fail 7702 and 72(s) for those that will not be remediated. The exposure related to future sales or products in force is unknown at this time. Policyholders could decide to surrender their policies due to this issue which would subsequently result in higher cash outflows due to an increase in surrender activity.
Dividends are declared and paid from time to time from the insurance affiliates as determined by their respective boards.
The NAIC has established minimum capital requirements set by the NAIC in the form of Risk-Based Capitalrisk-based capital ("RBC"). RBC factorsconsiders the type of business written by an insurance company, the quality of its assets, and various other aspects of an insurance company's business to develop a minimum level of capital called "authorized control"Authorized Control Level Risk-Based Capital". This level risk-based capital" and compares this levelof capital is then compared to an adjusted statutory capital that includes capital and surplus as reported under statutory accounting principles, plus certain investment reserves. Should the ratio of adjusted statutory capital to control level RBC fall below 200%, for our domestic companies, a series of remedial actions by the affected company would be required. Capital balances could be impacted by this tax compliance issue for the insurance companies affected. The holding company would anticipate funding the life companies as neededAdditionally, we have a parental guarantee between Citizens and CICA, Citizens' wholly-owned subsidiary domiciled in Colorado, to keep capital amounts within required levels.
Allmaintain a RBC level above 350%. At March 31, 2021, our domestic insurance subsidiaries were above the required minimum RBC minimumslevels.
CICA Ltd. is a Bermuda domiciled company. The BMA requires Bermuda insurers to maintain available statutory economic capital and surplus at September 30, 2017. a level equal to or in excess of the BMA's Enhanced Capital Requirement, which
| | | | | | | | |
| CITIZENS, INC. | MANAGEMENT'S DISCUSSION & ANALYSIS |
| | |
requires a certain Target Capital Level ("TCL"). As of March 31, 2021, CICA Ltd. was above the TCL threshold. At the request of the BMA, on April 15, 2021, Citizens and Off-balance Sheet ArrangementsCICA Ltd. entered into a Keep Well Agreement. The Keep Well Agreement requires Citizens to contribute up to $10 million in capital to CICA Ltd. as necessary to ensure that CICA Ltd. has a minimum capital level of 120%. Since CICA Ltd.’s capital level currently exceeds 120%, Citizens is not currently required to make a capital contribution. Any capital injection that Citizens is required to make under the parental guarantee with CICA or under the Keep Well Agreement with CICA Ltd. could negatively impact the Company’s capital resources and liquidity.
CONTRACTUAL OBLIGATIONS AND OFF-BALANCE SHEET ARRANGEMENTS
As of March 31, 2021, the Company is committed to fund investments up to $68.5 million related to private equity funds and other investments. There have been no other material changes in contractual obligations from those reporteddescribed in the Company's Annual Report on Part II, Item 7, Contractual Obligations and Off-Balance Sheet Arrangements in our Form 10-K for the year ended December 31, 2016. The Company does not have off-balance sheet arrangements at September 30, 2017.March 31, 2021. We do not utilize special purpose entities as investment vehicles, nor are there any such entities in which we have an investment that engage in speculative activities of any nature, and we do not use such investments to hedge our investment positions.
Parent Company Liquidity and Capital ResourcesCRITICAL ACCOUNTING POLICIES
Citizens is a holding company and has had minimal operations of its own. Its assets consist primarily of the capital stock of its subsidiaries, cash, fixed income securities, mutual funds and investment real estate. Accordingly, Citizens' cash flows depend upon the availability of statutorily permissible payments, primarily payments under management agreements from its two primary life insurance subsidiaries, CICA and SPLIC. The ability to make payments is limited by applicable laws and regulations of Colorado, CICA's state of domicile, and Louisiana, SPLIC's state of domicile, which subject insurance operations to significant regulatory restrictions. These laws and regulations require, among other things, that these insurance subsidiaries maintain minimum solvency requirements and limit the amount of dividends these subsidiaries can pay to the holding company. Citizens historically has not relied upon dividends from subsidiaries for its cash flow needs. However, CICA and SPLIC do dividend available funds from time to time in relation to new acquisition target strategies.
In the first quarter of 2017, Citizens made a $5.0 million capital contribution to CICA Life. In the third quarter of 2017, Citizens contributed $250,000 to CICA Life Ltd. to capitalize a newly formed Bermuda entity, SPLIC contributed $250,000 in capital to MGLIC, and SPLIC declared a dividend payable to CICA of $395,000 which will be paid in October of 2017.
Critical Accounting Policies
We have prepared a current assessment of our critical accounting policies and estimates in connection with preparing our interim unaudited consolidated financial statements as of and for the three and nine months ended September 30, 2017 and 2016. We believe that the accounting policies set forth in the Notes to our Consolidated Financial Statements and “Critical Accounting Policies and Estimates” in thePart I, Item 7, Management’s Discussion and Analysis of Consolidated Financial Condition and Results of
CITIZENS, INC. AND CONSOLIDATED SUBSIDIARIES
September 30, 2017
OperationsSignificant Accounting Policies of our consolidated financial statements in our Annual Report on Form 10-K for the year ended December 31, 2016 continue to describe the significant judgments and estimates used in the preparation of our consolidated financial statements.
Item 3.QUANTITATIVE AND QUALITATIVE DISCLOSURES ABOUT MARKET RISK
GeneralGENERAL
The natureFor the Company’s disclosures about market risk, please see Part II, Item 7A, Quantitative and Qualitative Disclosures About Market Risk in our Form 10-K. Except as set forth below, there have been no material changes to the Company’s disclosures about market risk in Part II, Item 7A. of our business exposes us to market risk relative to our invested assets and policy liabilities. Market risk is the risk of loss that may occur when changes in interest rates and public equity prices adversely affect the value of our invested assets. Interest rate risk is our primary market risk exposure. Substantial and sustained increases and decreases in market interest rates can affect the fair value of our investments. The fair value of our fixed maturity portfolio generally increases when interest rates decrease and decreases when interest rates increase.Form 10-K. For additional information regarding market risks to which we are subject, see "ItemPart I, Item 1, Financial Statements - Note 5. Investments - Valuation"Valuation of InvestmentsInvestments" in Fixed Maturity and Equity Securities" above.the notes to our consolidated financial statements herein.
The following table summarizes net unrealized gains and losses as of the dates indicated.MARKET RISK RELATED TO INTEREST RATES
|
| | | | | | | | | | | | | | | | | | |
| | September 30, 2017 | | December 31, 2016 |
| | Amortized
Cost | | Fair
Value | | Net
Unrealized
Gains | | Amortized
Cost | | Fair
Value | | Net
Unrealized
Gains |
| | (In thousands) |
| Fixed maturities, available-for-sale | $ | 920,700 |
| | 955,244 |
| | 34,544 |
| | 860,473 |
| | 881,668 |
| | 21,195 |
|
| Fixed maturities, held-to-maturity | 236,353 |
| | 244,064 |
| | 7,711 |
| | 247,004 |
| | 252,545 |
| | 5,541 |
|
| Total fixed maturities | $ | 1,157,053 |
| | 1,199,308 |
| | 42,255 |
| | 1,107,477 |
|
| 1,134,213 |
| | 26,736 |
|
| Total equity securities | $ | 15,479 |
| | 16,146 |
| | 667 |
| | 17,765 |
| | 18,159 |
| | 394 |
|
Market Risk Related to Interest Rates
Our exposure to interest rate changes results from our significant holdings of fixed maturity investments, which comprised 92.7%90.8% of our investment portfolio based on carrying value as of September 30, 2017.March 31, 2021. These investments are mainly exposed to changes in U.S. Treasury rates. OurChanges in interest rates typically have a sizable effect on the fair values of our fixed maturity investments includesecurities. The interest rate of the ten-year U.S. Government-sponsored enterprises,Treasury bond increased to 1.74% at March 31, 2021 from 0.93% at December 31, 2020. Net unrealized gains on fixed maturity securities totaled $88.0 million at March 31, 2021, compared to $167.9 million at December 31, 2020, based upon bond interest rates in relation to the U.S. Government bonds, securities issued by government agencies, municipal bonds and corporate bonds. ten-year Treasury yield.
To manage interest rate risk, we perform periodic projections of asset and liability cash flows to evaluate the potential sensitivity of our investments and liabilities. We assess interest rate sensitivity annually with respect to our available-for-saleAFS fixed maturitiesmaturity securities investments using hypothetical test scenarios that assume either upward or downward shifts in the prevailing interest rates. The changes in fair values of our debt and equityfixed maturity securities as of September 30, 2017March 31, 2021 were within the expected range of this analysis.
Changes in interest rates typically have a sizable effect on the fair values of our debt and equity securities. The interest rate of the ten-year U.S. Treasury bond decreased to 2.33% during the nine months ended September 30, 2017, from 2.45% at December 31, 2016. Net unrealized gains on fixed maturity securities totaled $42.3 million at September 30, 2017, compared to $26.7 million at December 31, 2016.
The fixed maturity portfolio is exposed to call risk, as a significant portion of the current bond holdings are callable. A decreasing interest rate environment can result in increased call activity as experienced over the past several years, and an increasing rate environment will likely result in securities being paid at their stated maturity.
CITIZENS, INC. AND CONSOLIDATED SUBSIDIARIES
September 30, 2017
There are no fixed maturitiesmaturity securities or other investments classified as trading instruments. Approximately 79.6%All of the Company's fixed maturitiesmaturity securities were held in available-for-saleclassified as AFS at March 31, 2021. At March 31, 2021 and 20.4% in held-to-maturity based upon fair value at September 30, 2017. At September 30, 2017 and December 31, 2016,2020, we had no investments in derivative instruments nor did we have anyor subprime or collateralized debt obligation risk.loans.
Market Risk Related to Equity Prices
Changes in the level or volatility of equity prices affect the value of equity securities we hold as investments. Our equity investments portfolio represented 1.3% of our total investments at September 30, 2017, with 96.4% invested in diversified equity and bond mutual funds. We believe that significant decreases in the equity markets would not have a material adverse impact on our total investment portfolio.
Item 4.CONTROLS AND PROCEDURES
EVALUATION OF DISCLOSURE CONTROLS AND PROCEDURES
DisclosureWe maintain disclosure controls and procedures (as defined in Rules 13a-15(e) and 15d-15(e) under the Securities Exchange Act of 1934, as amended (the “Exchange Act”"Exchange Act")) that are designed to ensure that information required to be disclosed in our reports filed or submitted under the Exchange Act is recorded, processed, summarized and reported within the time periods specified in SECthe SEC’s rules and forms, and that such information is accumulated and communicated to our management, including our principal executive officer and principal financial officer, to allow timely decisions regarding required disclosures.
Our management, including our principal executive officer and principal financial officer, evaluated the design and operationeffectiveness of our disclosure controls and procedures pursuant to Rules 13a-15(e) and 15d-15(e) under the Exchange Act as of September 30, 2017.March 31, 2021. Based on such evaluation, our principal executive officer and principal financial officer concluded that our disclosure controls and procedures were not effective due to the material weaknesses in internal control over financial reporting that were reported in the Company's Annual Report on Form 10-K for the year ended December 31, 2016 (“2016 Annual Report”), which remain unremediatedat a reasonable assurance level as of September 30, 2017.
In the 2016 Annual Report, management concluded, based on its evaluation at the time, that our disclosure controls and procedures were ineffective due to the existenceend of the material weaknesses in internal control over financial reporting as of December 31, 2016. For the quarters ended March 31, 2017 and June 30, 2017, however, management concluded that its disclosure controls and procedures were effective, notwithstanding the material weaknesses, due to the breadth of the Company’s controls and their overall effectiveness in accumulating and communicating information required to be disclosed in the Company’s Exchange Act reports, including its proxy statement and current reports on Form 8-K. In connection with its most recent evaluation, however, management re-evaluated those conclusions and concluded that, in light of the unremediated material weaknesses disclosed in the 2016 Annual Report, our disclosure controls and procedures as of March 31, 2017 and June 30, 2017, as reported in our Quarterly Reports on Form 10-Q for the quarters then ended, were not effective as of those dates.period covered by this quarterly report.
CHANGES IN INTERNAL CONTROL OVER FINANCIAL REPORTING
During the three months ended September 30, 2017,March 31, 2021, there were no changes in the Company's internal controlscontrol over financial reporting (as defined in rules 13a-15(f) and 15d-15(f) under the Exchange Act) that materially affected, or are reasonably likely to materially affect, our internal control over financial reporting.
54
March 31, 2021 | 10-Q 47
CITIZENS, INC. AND CONSOLIDATED SUBSIDIARIES
STATUS OF REMEDIATION OF MATERIAL WEAKNESSES
While we have made meaningful progress on strengthening our internal controls relative to the previously identified material weaknesses, material weaknesses continue to exist. Management, with oversight from our principal executive officer and principal financial officer, has identified and initiated actions that, once fully implemented and operating for a sufficient period of time, are designed to remediate the material weaknesses. identified in the Company’s 2016 Annual Report. Specifically, the Company has begun to execute the following actions to remediate the Company’s material weaknesses relating to ineffective data validation in connection with spreadsheet and system generated reports, ineffective management review controls and inadequate staff competency and expertise on complex tax and actuarial matters:
Hired experienced executives in key management roles to strengthen the Company's expertise in and execution of its actuarial, accounting and operation functions, including a Chief Actuary, Chief Accounting Officer, and Director of Audit Quality Control and refocused personnel to strengthen management review controls over third party provided data,
Formed an internal control task force consisting of our Chief Financial Officer, Chief Operating Officer, and Director of Audit Quality Control to actively direct, manage and implement our control improvements and material weakness remediation plans,
Enhanced our internal control program and remediation efforts by co-sourcing our internal audit function to BDO USA LLP (“BDO”), an experienced, nationally recognized audit firm. Specifically BDO continues to assist the internal control task force in improving the enterprise risk assessment, control documentation, assessing and testing controls, and to develop and deliver company-wide internal control training to deepen our employees’ understanding of their role in relation to our overall control environment.
Replaced our third-party tax professionals with experienced tax team from Ernst & Young, LLP to improve our tax reporting process; and
Added an information technology (“IT”) executive who will focus on enhancing our general IT controls and required remediation or control improvements.
We continue to monitor and enhance our control environment and will make further changes as appropriate. We believe the remediation steps outlined above have improved and will continue to improve the effectiveness of our internal control over financial reporting. We will test the ongoing operating effectiveness of all new controls subsequent to implementation and consider the material weaknesses remediated after the applicable remedial controls operate effectively for a sufficient period of time.
PART II. OTHER INFORMATION
Item 1.LEGAL PROCEEDINGS
On or about March 16, 2017, Juan Gamboa filedPart I, Item 3, Legal Proceedings of our Form 10-K for a putative class action lawsuit against the Company and fivediscussion of its current and former directors and executive officersour legal proceedings. There have been no material developments in the United States District Court, Western District of Texas. The lawsuit alleges the defendants violated Sections 10(b) and 20(a) of the Securities Exchange Act of 1934 and Rule 10b-5 promulgated thereunder by making false and/or misleading statements, as well as failing to disclose material adverse facts about the Company’s business, operations and prospects. The complaint seeks an award of damages in an unspecified amount on behalf of a putative class consisting of persons who purchased the Company’s common stock betweenthree months ended March 11, 2015 and March 8, 2017, inclusive. The Company believes that the lawsuit is without merit, and it intends to vigorously defend against all claims asserted. At this time, the Company is unable to reasonably determine the outcome of this litigation.
In the normal course of business, the Company is subject to various legal and regulatory actions which are immaterial to the Company's financial statements. For more information about the risks related to litigation and regulatory actions, please see the risk factor titled “We are a defendant in lawsuits, which may adversely affect our financial condition and detract31, 2021 from the
timelegal proceedings described in our
management is able to devote to our business, and we are subject to risks related to litigation and regulatory matters.” in Item 1A. Risk Factors.Form 10-K.
CITIZENS, INC. AND CONSOLIDATED SUBSIDIARIES
September 30, 2017
Item 1A. RISK FACTORS
InvestingPart I, Item 1A, Risk Factors of our Form 10-K includes a discussion of our risk factors. There have been no material changes in our Company involves certain risks.Set forth below are certain risks with respect to our Company. Readers should carefully review these risks, together with the other information contained in this report. The risks and uncertainties we have described in this report are not the only ones we face. Additional risks and uncertainties not presently known to us, or that we currently deem not material, may also adversely affect our business. Any of the risks discussed in this report or that are presently unknown or not material, if they were to actually occur, could result in a significant adverse impact on our business, operating results, prospects or financial condition. References inthree months ended March 31, 2021 from the risk factors below to "we," "us," "our," "Citizens" and like terms relate to Citizens, Inc. and its subsidiaries on a U.S. GAAP consolidated financial statement basis, unless specifically identified otherwise. We operate our subsidiaries as separate and distinct entities with respect to corporate formalities.
Risks Relating to Our Business
The majority of our sales derive from residents of foreign countries and are subject to risks associated with political instability, currency control laws and foreign insurance laws. A significant loss of sales in these foreign markets could have a material adverse effect on our results of operations and financial condition.
The majority of our direct premiums, approximately 72% in 2017, are from foreign countries, primarily those in Latin America and the Pacific Rim. These sales are made through independent consultants who are located in these foreign countries. Many of these countries have a history of political instability, including regime changes, political uprisings, currency fluctuations and anti-democratic or anti-U.S. policies. There is a risk that political instability in these countries could have a material adverse effect on the ability of people living in these countries to purchase our insurance policies or our ability to sell our policies in those countries through our independent consultants or otherwise. Our Company’s future sales and financial results depend upon avoiding significant regulatory restraints on receiving insurance policy applications and premiums from, and issuing insurance policies to, residents outside of the United States.
Currency control laws or other currency exchange restrictions in foreign countries could materially adversely affect our revenues by imposing restrictions on asset transfers outside of a country where our insureds reside. Difficulties in transferring funds from or converting currencies to U.S. dollars in certain countries could prevent our insureds in those countries from purchasing or paying premiums on our policies. There can be no assurance that such restrictions will not be imposed and that our revenues, results of operations and financial condition will not be materially adversely affected if they do occur.
We also face risks associated with the application of foreign laws to our sales of policies to residents in foreign countries. Generally, all foreign countries in which we offer insurance products require a license or other authority to conduct insurance business in that country. Some of these countries also require that local regulatory authorities approve the terms of any insurance product sold to residents of that country. We have never sought to qualify to do business in any foreign country and have never submitted the insurance policies that we issue to residents of foreign countries for approval by any foreign or domestic insurance regulatory agency. Traditionally, we have sought to address risks associated with the potential application of foreign laws to our sales of insurance policies in our foreign markets by, among other things, not locating any of our offices or assets in foreign countries, selling policies only through independent consultants rather than our own employees, requiring that all applications for insurance be submitted to and accepted only in our offices in the U.S., and requiring that policy premiums be paid to us only in U.S. Dollars. We rely on our independent consultants to comply with laws applicable to them in marketing our insurance products in their respective countries.
We have undertaken a comprehensive compliance review of risks associated with the potential application of foreign laws to our sales of insurance policies in foreign countries. The application of foreign laws to our sales of insurance policies in foreign countries varies by country. There is a lack of uniform regulation, lack of clarity in certain regulations and lack of legal precedent addressing circumstances similar to ours. The preliminary results of our compliance review have confirmed the previously disclosed risks related to foreign insurance laws associated with our current business model, at least in certain foreign countries. There are risks that a foreign government could determine under its existing laws that its residents may not purchase life insurance from us unless we become qualified to do business in that country or unless our policies purchased by its residents receive prior approval from its insurance regulators. There also is a risk that foreign regulators may become more aggressive in enforcing any perceived violations of their laws and seek to impose monetary fines, criminal penalties, and/or order us to cease our sales in that jurisdiction. There is no assurance that, if a foreign country were to deem our sales of policies in that country to require that we qualify to do business in that country or submit our policies for approval by that country’s regulatory authorities, we would be able to, or would conclude that it is advisable to, comply with those requirements. Any determination by a foreign country that we or our policy
CITIZENS, INC. AND CONSOLIDATED SUBSIDIARIES
September 30, 2017
sales are subject to regulation under their laws, or any actions by a foreign country to enforce such laws more aggressively, could therefore have a material adverse effect on our ability to sell policies in that country and, in turn, on our results of operations and financial condition. Depending on the ultimate outcome of our compliance review, we may explore alternatives to our current business model in one or more jurisdictions, including withdrawing from a particular market.
Any disruption to the marketing and sale of our policies to residents of a foreign country, resulting from the action of foreign regulatory authorities or otherwise, could have a material adverse effect on our results of operations and financial condition.
Our operating results and financial condition may be affected if the liabilities actually incurred differ, or if our estimates of those liabilities change, from the amounts we have reserved for in connection with the noncompliance of a portion of our life insurance policies with Section 7702 of the Internal Revenue Code and the failure of certain annuity contracts to qualify under Section 72(s) of the Internal Revenue Code.
We previously announced that we determined that a portion of the life and annuity insurance policies issued by our subsidiary insurance companies failed to qualify for the favorable U.S. federal income tax treatment afforded by Sections 7702 and 72(s) of the Internal Revenue Code ("IRC") of 1986. To the extent that these policies had unreported income build-up, we may be liable to the IRS for failure to withhold taxes or to notify policyholders of their obligation to pay taxes directly to the IRS. We have undertaken an analysis of our potential liability to the IRS arising from this matter, as well as other expenses we may incur to remediate (i.e., conform to the requirements of the IRS) certain previously issued domestic life insurance and annuity policies and to address any missed reporting for policies issued to non-U.S. citizens and have established a best estimate reserve of $10.7 million, net of tax as of September 30, 2017, for probable liabilities and expenses. The probability weighted range of financial estimates relative to this issue is $5.6 million to $34.0 million, net of tax. This estimated range includes projected toll charges and fees payable to the IRS, as well as estimated increased payout obligations to current and former holders of non-compliant domestic life insurance policies expected to result from remediation of those policies. The amount of our liabilities and expenses depends on a number of uncertainties, including the number of prior tax years for which we may be liable to the IRS, the number of domestic life insurance policies we will be required to remediate, the methodology applicable to the calculation of taxable benefits under non-compliant policies and the amount of time and resources we will require from external advisors who are assisting us with resolving these issues. Given the range of potential outcomes and the significant variables assumed in establishing our estimates, actual amounts incurred may exceed our reserve and also could exceed the high end of our estimated range of liabilities and expenses. To the extent the amount reserved is insufficient to meet the actual amount of our liabilities and expenses, or if our estimates of those liabilities and expenses change in the future, our financial condition and results of operations may be materially adversely affected.
On May 17, 2017, we submitted an offer to enter into Closing Agreements with the IRS covering the CICA and CNLIC domestic life insurance business. The toll charges calculated and enumerated in the Closing Agreements totaled $124,000 and $4,000 for the CICA and CNLIC domestic life insurance businesses, respectively.
We expect to file Closing Agreements with the IRS for the SPLIC and MGLIC life insurance business and for the CICA international business and our annuity business in 2018.
We face financial and capital market risks in our operations.
As an insurance holding company with significant investment exposure, we face material financial and capital markets risk in our operations. Due to the low interest rate environment in recent years, we experienced significant call activity on our fixed income portfolio that decreased our investment yields compared to prior years. We also have recorded other-than-temporary impairments in the past several years due to credit related market declines and equity market volatility.
Economic uncertainty has recently been exacerbated by the increased potential for default by one or more European sovereign debt issuers, the potential partial or complete dissolution of the Eurozone and its common currency, Brexit, potential changes in U.S. international trade policies and agreements and the negative impact of such events on global financial institutions and capital markets generally. Actions or inactions of European governments may impact these actual or perceived risks. Future actions or inactions of the United States government, including a shutdown of the federal government, could increase the actual or perceived risk that the U.S. may not ultimately pay its obligations when due and may disrupt financial markets.
CITIZENS, INC. AND CONSOLIDATED SUBSIDIARIES
September 30, 2017
Changes in market interest rates may significantly affect our profitability.
Some of our products, principally traditional whole life insurance with annuity riders, expose us to the risk that changes in interest rates will reduce our "spread," or the difference between the amounts we are required to pay under our contracts to policyholders and the rate of return we are able to earn on our investments intended to support obligations under the contracts. Our spread is an integral component of our net income.
If interest rates decrease or remain at low levels, we may be forced to reinvest proceeds from investments that have matured, prepaid, been sold, or called at lower yields, reducing our investment margin. Our fixed income bond portfolio is exposed to interest rate risk as a significant portion of the portfolio is callable. Lowering interest crediting rates can help offset decreases in investment margins on some of our products. However, our ability to lower these rates could be limited by competition or contractually guaranteed minimum rates, and may not match the timing or magnitude of changes in asset yields.
An increase in interest rates will increase the net unrealized loss position of our investment portfolio and may subject us to disintermediation risk. Disintermediation risk is the risk that in a change from a low interest rate period to a significantly higher and increasing interest rate period, policyholders may surrender their policies or make early withdrawals in order to increase their returns, requiring us to liquidate investments in an unrealized loss position (i.e. the market value less the carrying value of the investments). This risk is discussed further in the two risk factors below.
Due to the sustained low interest rate environment, we re-priced certain products at the end of 2016 that result in lower potential investment returns for our customers, which is a key pricing assumption. This price increase could result in a decrease in sales that may negatively impact our revenues and profitability.
Our investment portfolio is subject to various risks that may result in realized investment losses. In particular, decreases in the fair value of fixed maturities may significantly reduce the value of our investments, and as a result, our financial condition may suffer.
We are subject to credit risk in our investment portfolio. Defaults by third parties in the payment or performance of their obligations under these securities could reduce our investment income and realized investment gains or result in the recognition of investment losses. The value of our investments may be materially adversely affected by increases in interest rates, downgrades in the bonds included in our portfolio and by other factors that may result in the recognition of other-than-temporary impairments. Each of these events may cause us to reduce the carrying value of our investment portfolio.
In particular, at September 30, 2017, fixed maturities represented $1.2 billion, or 92.7% of our total investments of $1.3 billion. The fair value of fixed maturities and the related investment income fluctuates depending on general economic and market conditions. The fair value of these investments generally increases or decreases in an inverse relationship with fluctuations in interest rates, while net investment income realized by us will generally increase or decrease in line with changes in market interest rates. In addition, actual net investment income and/or cash flows from investments that carry prepayment risk, such as mortgage-backed and other asset-backed securities, may differ from those anticipated at the time of investment as a result of interest rate fluctuations. An investment has prepayment risk when there is a risk that the timing of cash flows resulting from the repayment of principal might occur earlier than anticipated because of declining interest rates or later than anticipated because of rising interest rates. The impact of value fluctuations affects our consolidated financial statements, as a large portion of our fixed maturities are classified as available-for- sale, with changes in fair value reflected in our stockholders' equity (accumulated other comprehensive income or loss). No similar adjustment is made for liabilities to reflect a change in interest rates. Therefore, interest rate fluctuations and economic conditions could adversely affect our stockholders' equity, total comprehensive income and/or cash flows. Although at September 30, 2017, approximately 97.5% of our fixed maturities were investment grade with 76.1% rated A or above, all of our fixed maturities are subject to credit risk. If any of the issuers of our fixed maturities suffer financial setbacks, the ratings on the fixed maturities could be downgraded (with a concurrent decrease in fair value) and, in a worst-case scenario, the issuer could default on its financial obligations. If the issuer defaults, we could have realized losses associated with the impairment of the securities.
Valuation of our investments and the determination of whether a decline in the fair value of our invested assets is other-than-temporary are based on estimates that may prove to be incorrect.
U.S. GAAP requires that when the fair value of any of our invested assets declines and the decline is deemed to be other-than-temporary, we recognize a loss in either other comprehensive income or in our statement of income based on certain criteria in
CITIZENS, INC. AND CONSOLIDATED SUBSIDIARIES
September 30, 2017
the period for which the determination is made. The determination of the fair value of certain invested assets, particularly those that do not trade on a regular basis, requires an assessment of available data and the use of assumptions and estimates. Once it is determined that the fair value of an asset is below its carrying value, we must determine whether the decline in fair value is other-than-temporary, which is based on subjective factors and involves a variety of assumptions and estimates.
There are risks and uncertainties associated with determining whether declines in market value are other-than-temporary. These include significant changes in general economic conditions and business markets, trends in certain industry segments, interest rate fluctuations, rating agency actions, changes in significant accounting estimates and assumptions and legislative actions. In the case of mortgage- and asset-backed securities, there is added uncertainty as to the performance of the underlying collateral assets. To the extent that we are incorrect in our determination of the fair value of our investment securities or our determination that a decline in their value is other-than-temporary, we may realize losses that never actually materialize or may fail to recognize losses within the appropriate reporting period.
Gross unrealized losses on fixed maturity and equity securities may be realized or result in future impairments, resulting in a reduction in our net income.
Fixed maturity and equity securities classified as available-for-sale are reported at fair value. Unrealized gains and losses on available-for-sale securities are recognized as a component of other comprehensive income (loss) and are, therefore, excluded from our net income. Our total gross unrealized losses on our available-for-sale securities portfolio at September 30, 2017 were $4.1 million. The accumulated change in estimated fair value of these securities is recognized in net income when the gain or loss is realized upon sale of the security or in the event that the decline in estimated fair value is determined to be other-than-temporary and an impairment charge to earnings is taken. Realized losses or impairments may have a material adverse effect on our net income in a particular quarterly or annual period.
Our actual claims losses may exceed our reserves for claims, and we may be required to establish additional reserves, which in turn may adversely impact our results of operations and financial condition.
We maintain reserves to cover our estimated exposure for claims relating to our issued insurance policies. Reserves, whether calculated under U.S. generally accepted accounting principles or statutory accounting practices prescribed by various state insurance regulators, do not represent an exact calculation of exposure, but instead represent our best estimates, generally involving actuarial projections, of what we expect claims will be based on mortality assumptions that are determined by various regulatory authorities. Many reserve assumptions are not directly quantifiable, particularly on a prospective basis. In addition, when we acquire other domestic life insurance companies, our assessment of the adequacy of acquired policy liabilities is subject to our estimates and assumptions. Reserve estimates are refined as experience develops, and adjustments to reserves are reflected in our statements of operations for the period in which such estimates are updated. Because establishing reserves is an inherently uncertain process involving estimates of future losses, future developments may require us to increase policy benefit reserves, which may have a material adverse effect on our results of operations and financial condition in the periods in which such increases occur.
Unanticipated increases in early policyholder withdrawals or surrenders could negatively impact liquidity.
A primary liquidity concern is the risk of unanticipated or extraordinary early policyholder withdrawals or surrenders. Our insurance policies include provisions, such as surrender charges, that help limit and discourage early withdrawals, and we track and manage liabilities and attempt to align our investment portfolio to maintain sufficient liquidity to support anticipated withdrawal demands. However, early withdrawal and surrender levels may differ from anticipated levels for a variety of reasons, including changes in economic conditions, changes in policyholder behavior or financial needs, changes in relationships with our independent consultants, changes in our claims-paying ability, or increases in surrenders among policies that have been in force for more than fifteen years and are no longer subject to surrender charges. Any of these occurrences could adversely affect our liquidity, profitability and financial condition.
While we own a significant amount of liquid assets, a certain portion of investment assets are relatively illiquid. If we experience unanticipated early withdrawal or surrender activity, we could exhaust all other sources of liquidity and be forced to obtain additional financing or liquidate assets, perhaps on unfavorable terms. The availability of additional financing will depend on a variety of factors, such as market conditions, the availability of credit in general or more specifically in the insurance industry, the strength or weakness of the capital markets, the volume of trading activities, our credit capacity, and the perception of our long- or short-term financial prospects if we incur large realized or unrealized investment losses or if the level of business activity declines due
CITIZENS, INC. AND CONSOLIDATED SUBSIDIARIES
September 30, 2017
to a market downturn. If we are forced to dispose of assets on unfavorable terms, it could have an adverse effect on our liquidity, results of operations and financial condition.
Catastrophes may adversely impact liabilities for policyholder claims and reinsurance availability.
Our insurance operations are exposed to the risk of catastrophic events. The extent of losses from a catastrophe is a function of both the total amount of insured exposure in the area affected by the event and the severity of the event. Most catastrophes are restricted to small geographic areas; however, hurricanes, earthquakes, tsunamis and man-made catastrophes may produce significant damage or loss of life in larger areas, especially those that are heavily populated. Claims resulting from catastrophic events could cause substantial volatility in our financial results for any fiscal quarter or year and could materially reduce our profitability or harm our financial condition. In addition, catastrophic events could harm the financial condition of issuers of obligations we hold in our investment portfolio, resulting in impairments to these obligations, and the financial condition of our reinsurers, thereby increasing the probability of default on reinsurance recoveries. Large-scale catastrophes may also reduce the overall level of economic activity in affected countries, which could hurt our business and the value of our investments or our ability to sell new policies.
Our life insurance operations are exposed to the risk of catastrophic mortality, such as a pandemic or other event that causes a large number of deaths, especially if concentrated in our top foreign markets. A significant pandemic could have a major impact on the global economy or the economies of particular countries or regions, including travel, trade, tourism, the health system, food supply, consumption, overall economic output and, eventually, on the financial markets. In addition, a pandemic that affected our employees, our policyholders, our independent consultants or other companies with which we do business could disrupt our business operations. The effectiveness of external parties, including governmental and non-governmental organizations, in combating the spread and severity of such a pandemic could have a material impact on the losses experienced by us. These events could cause a material adverse effect on our results of operations in any period and, depending on their severity, could also materially and adversely affect our financial condition.
We may be required to accelerate the amortization of deferred acquisition costs and the costs of customer relationships acquired, which would increase our expenses and adversely affect our results of operations and financial condition.
At September 30, 2017, we had $166.6 million of deferred policy acquisition costs, or DAC. DAC represents costs that vary with and are primarily related to the successful sale and issuance of our insurance policies and are deferred and amortized over the estimated life of the related insurance policies. These costs include commissions in excess of ultimate renewal commissions, solicitation and printing costs, sales material costs and some support costs, such as underwriting and contract and policy issuance expenses. Under U.S. GAAP, DAC is amortized to income over the lives of the underlying policies, in relation to the premium-paying period of the policies.
In addition, when we acquire a block of insurance policies, we assign a portion of the purchase price to the right to receive future net cash flows from existing insurance and investment contracts and policies. This intangible asset, called the cost of customer relationships acquired, or CCRA, represents the actuarially estimated present value of future cash flows from the acquired policies. At September 30, 2017, we had $18.0 million of CCRA. We amortize the value of this intangible asset in a manner similar to the amortization of DAC.
Our recoverability of DAC and CCRA generally depends upon anticipated profits from investments, surrender and other policy charges, mortality, morbidity, persistency and maintenance expense margins. For example, if our insurance policy lapse and surrender rates were to exceed the assumptions upon which we priced our insurance policies, or if actual persistency proves to be less than our persistency assumptions, especially in the early years of a policy, we might be required to accelerate the amortization of expenses we deferred in connection with the acquisition of the policy. We regularly review the quality of our DAC and CCRA to determine if they are recoverable from future income. If these costs are not recoverable, the amount that is not recoverable is charged to expenses in the financial period in which we make this determination.
Unfavorable experience with regard to expected expenses, investment returns, surrender and other policy charges, mortality, morbidity, lapses or persistency may cause us to increase the amortization of DAC or CCRA, or both, or to record a current period expense to increase benefit reserves, any of which could have a material adverse effect on our results of operations and financial condition.
CITIZENS, INC. AND CONSOLIDATED SUBSIDIARIES
September 30, 2017
We may be required to recognize an impairment on the value of our goodwill, which would increase our expenses and materially adversely affect our results of operations and financial condition.
Goodwill represents the excess of the amount paid by us to acquire various life insurance companies over the fair value of their net assets at the date of the acquisition. Under U.S. GAAP, we test the carrying value of goodwill for impairment at least annually at the "reporting unit" level, which is either an operating segment or a business that is one level below the operating segment. Goodwill is impaired if its carrying value exceeds its implied fair value. This may occur for various reasons, including changes in actual or expected earnings or cash flows of a reporting unit, generation of earnings by a reporting unit at a lower rate than similar businesses or declines in market prices for publicly traded businesses similar to our reporting units. If any portion of our goodwill becomes impaired, we would be required to recognize the amount of the impairment as a current-period expense, which could have a material adverse effect on our results of operations and financial condition. Goodwill in our consolidated financial statements was $17.3 million as of September 30, 2017.
Due to changes in certain accounting standards issued by the Financial Accounting Standards Board (“FASB”) which become effective for the first fiscal year beginning after December 15, 2019 (subject to early adoption), all or a portion of the 4.6 million in goodwill value of our Home Services segment may become impaired. The impairment methodology within the FASB Accounting Standards Codification ("ASC") Topic 350, Intangibles-Goodwill and Other ("ASC 350") follows a quantitative two step process. In the first step of the goodwill impairment test, the fair value of a reporting unit is compared to its carrying value. If the carrying value of a reporting unit exceeds its fair value, the second step of the impairment test is performed for purposes of measuring the impairment.
In the second step, the Company performs a hypothetical purchase price allocation to measure impairment. If the hypothetical purchase price allocation of the reporting unit is lower than the goodwill value, an impairment loss is recognized in an amount equal to that difference.
Management’s determination of the fair value of each reporting unit incorporates multiple inputs including discounted cash flow calculations based on assumptions that market participants would make in valuing the reporting unit. Other assumptions can include levels of economic capital, future business growth, and earnings projections.
In 2016, the Company's Home Service Segment failed the first step and thus the second impairment step had to be performed. The Company's Home Service Segment passed step two, so the goodwill value for the Home Service Segment was not impaired.
On January 26, 2017, the FASB issued Accounting Standards Update ("ASU") No. 2017-04, Simplifying the Test for Goodwill Impairment. An entity will no longer perform a hypothetical purchase price allocation to measure impairment, eliminating step two. Instead, impairment will be measured using the difference of the carrying amount to the fair value of the reporting unit. The ASU is effective prospectively for annual and interim periods in fiscal year beginning after December 15, 2019, but early adoption is permitted for goodwill impairment tests with measurement dates after January 1, 2017.
With the elimination of step two, there is risk that in the Home Service Segment all or a portion of the goodwill value could be impaired upon adoption of the ASU.
Our conversion to a new actuarial valuation system is not yet complete and contains known uncertainties that could result in identification of additional errors in our financial reporting.
As discussed in Note 1 - "Correction of Immaterial Errors and Reclassification of Certain Amounts to the Consolidated Financial Statements" to our December 31, 2016 consolidated financial statements in our Annual Report on Form 10-K for the year ended December 31, 2016, the Company is in the process of converting its actuarial valuation from a third party service provider to an actuarial valuation modeling software system purchased from a vendor. In connection with our ongoing actuarial valuation conversion, certain legacy system errors were discovered..
As part of this conversion, the Company could identify additional differences that will be evaluated for financial reporting purposes. The conversion to the new system is expected to be completed in 2018.
CITIZENS, INC. AND CONSOLIDATED SUBSIDIARIES
September 30, 2017
We are a defendant in lawsuits, which may adversely affect our financial condition and detract from the time our management is able to devote to our business, and we are subject to risks related to litigation and regulatory matters.
From time to time we are, and have been, subject to a variety of legal and regulatory actions and investigations relating to our business operations, including, but not limited to:
•disputes over insurance coverage or claims adjudication;
•regulatory compliance with state laws, including insurance and securities regulations;
regulatory compliance with U.S. federal securities laws, tax, anti-money laundering, bank secrecy, anti-bribery, anti-corruption and foreign asset control laws, among others;
disputes with our independent marketing firms, independent consultants and employee-agents over compensation, termination of contracts, noncompliance with applicable laws and regulations and related claims;
•disputes regarding our tax liabilities;
•disputes relating to reinsurance and coinsurance agreements; and
•disputes relating to businesses acquired and operated by us.
In the absence of countervailing considerations, we would expect to defend any such claims vigorously. However, in doing so, we could incur significant defense costs, including attorneys' fees, other direct litigation costs and the expenditure of substantial amounts of management time that otherwise would be devoted to our business. Further, if we suffer an adverse judgment as a result of any claim, it could have a material adverse effect on our business, results of operations and financial condition.
A number of U.S. jurisdictions have been investigating life insurer practices for compliance with unclaimed property laws. Highly publicized incidents disclosed the practice by certain companies of using data available on the U.S. Social Security Administration's Death Master File or a similar database in order to avoid paying periodic benefits under annuity contracts, but not using the same data base to determine when death benefits were owed. This asymmetric conduct by certain insurers has led a number of jurisdictions to require life insurers to use this same data to identify instances where amounts under life insurance policies and annuity contracts are payable and to locate and pay beneficiaries under such contracts. The National Conference of Insurance Legislators ("NCOIL") has adopted the Model Unclaimed Life Insurance Benefits Act ("Model Act") and several states have adopted legislation that is substantially similar to the Model Act adopted by NCOIL. The Model Act imposes new requirements on insurers to periodically compare their in force life insurance and annuity policies against the Death Master File, investigate any identified matches to confirm the death of the insured and determine whether benefits are due and attempt to locate the beneficiaries or, if no beneficiary can be located, escheat the policy benefit to the respective state government as unclaimed property. The Model Act could result in additional payments to beneficiaries, additional escheatment of funds deemed abandoned under state laws, and/or administrative penalties. It is also possible that life insurers may be subject to claims regarding their business practices as a result given the legal uncertainty in this area. However, court decisions in West Virginia and Florida have upheld the well-established insurance law principal that life insurance policies are not due and payable until the insurance company receives due proof of death, and have further held an insurance company has no duty to search the Death Master File or other databases to determine whether deaths have occurred that have not been reported to the company.
Despite the fact we have no history of the asymmetric conduct in question, we have received notices from the Louisiana Department of Treasury, the Arkansas Auditor of State and the Texas State Comptroller, indicating they intend to audit Citizens, Inc. and certain of its affiliates for compliance with unclaimed property laws. The audits may result in additional payments to beneficiaries, additional escheatment of funds deemed abandoned under state laws, administrative penalties, interest, and changes to our Company's procedures for the identification and escheatment of abandoned property. At this time, our Company is not able to estimate any of these possible amounts.
Reinsurers with which we do business could increase their premium rates and may not honor their obligations, leaving us liable for the reinsured coverage.
We reinsure certain risks underwritten by our various insurance subsidiaries. Market conditions beyond our control determine the availability and cost of the reinsurance protection we purchase. The high cost of reinsurance or lack of affordable coverage could adversely affect our results of operations and financial condition.
Our reinsurance facilities are generally subject to annual renewal. We may not be able to maintain our current reinsurance facilities and, even if highly desirable or necessary, we may not be able to obtain replacement reinsurance facilities in adequate amounts or at rates economic to us. If we are unable to renew our expiring facilities or to obtain new reinsurance facilities, either our net
CITIZENS, INC. AND CONSOLIDATED SUBSIDIARIES
September 30, 2017
exposures would increase or, if we are unwilling or unable to bear an increase in net exposures, we may have to reduce the level of our underwriting commitments. In addition, our reinsurance facilities may be canceled for new business, pursuant to their terms, upon the occurrence of certain specified events, including a change of control of our Company (generally defined as the acquisition of 10% or more of our voting equity securities) or the failure of our insurance company subsidiaries to maintain the minimum required levels of statutory surplus. Any of these potential developments could materially adversely affect our revenues, results of operations and financial condition.
In 2016, we reinsured $522.8 million of the face amount of our life insurance policies. Amounts reinsured in 2016 represented 10.5% of the face amount of direct life insurance in force in that year. Although the cost of reinsurance is, in some cases, reflected in premium rates, under certain reinsurance agreements, the reinsurer may increase the rate it charges us for reinsurance. If our cost of reinsurance were to increase, we might not be able to recover these increased costs, and our results of operations and financial condition could be materially adversely affected. See Note 5 to the Company's Consolidated Financial Statements.
Our international and domestic markets face significant competition. If we are unable to compete effectively in our markets, our business, results of operations and profitability may be adversely affected.
Our international marketing plan focuses on making available U.S. Dollar-denominated life insurance products to individuals residing in more than 30 countries. New competition could increase the supply of available insurance, which could adversely affect our ability to price our products at attractive profitable rates and thereby adversely affect our revenues, results of operations and financial condition. Existing barriers to entry in the foreign markets we serve may not be sufficient to impede potential competitors from entering such markets. In connection with our business with foreign nationals, we experience competition primarily from the following sources, many of which have substantially greater financial, marketing and other resources than we have:
Foreign operated companies with U.S. Dollar-denominated policies. We face direct competition from companies that operate in the same manner as we operate in our international markets.
Companies foreign to the countries in which their policies are sold but that issue local currency policies. Another group of our competitors in the international marketplace consists of companies that are foreign to the countries in which their policies are sold but issue life insurance policies denominated in the local currencies of those countries. Local currency policies provide the benefit of assets located in the country of foreign residents, but entail risks of uncertainty due to local currency fluctuations, as well as the perceived instability and weakness of local currencies.
Locally operated companies with local currency policies. We compete with companies formed and operated in the country in which our foreign insureds reside. Generally, these companies are subject to risks of currency fluctuations, and they primarily use mortality tables based on experience of the local population as a whole. These mortality tables are typically based on significantly shorter life spans than those we use. As a result, the cost of insurance from these companies tends to be higher than ours. Although these companies typically market their policies to a broader section of the population than do our independent marketing firms and independent consultants, there can be no assurance that these companies will not endeavor to place a greater emphasis on our target market and compete more directly with us.
In the United States, we compete with more than 800 other life insurance companies of various sizes. The life insurance business in the United States is highly competitive, in part because it is a mature industry that, in recent years, has experienced little to no growth in life insurance sales. Many domestic life insurance companies have substantially greater financial resources, longer business histories, larger sales forces and more diversified lines of insurance coverage than we do. Competition in the United States has also increased recently because the life insurance industry is consolidating, with larger, more efficient organizations emerging from the consolidation.
In addition, from time to time, companies enter and exit the markets in which we operate, thereby increasing competition at times when there are new entrants. We may lose business to competitors offering competitive products at lower prices, or for other reasons.
There can be no assurance that we will be able to compete effectively in any of our markets. If we do not, our business, results of operations and financial condition will be materially adversely affected.
CITIZENS, INC. AND CONSOLIDATED SUBSIDIARIES
September 30, 2017
Sales of our insurance products may be reduced if we are unable to (i) establish and maintain commercial relationships with independent marketing firms and independent consultants, (ii) attract and retain employee agents or (iii) develop and maintain our distribution sources.
We distribute our insurance products through several distribution channels, including independent marketing firms, independent consultants and our employee agents. These relationships are significant for both our revenues and our profits. In our life insurance segment, we depend almost exclusively on the services of independent marketing firms and independent consultants. In our home service insurance segment, we depend on employee agents whose role in our distribution process is integral to developing and maintaining relationships with policyholders. Significant competition exists among insurers in attracting and maintaining marketers of demonstrated ability. Some of our competitors may offer better compensation packages for marketing firms, independent consultants and agents and broader arrays of products and have a greater diversity of distribution resources, better brand recognition, more competitive pricing, lower cost structures and greater financial strength or claims paying ratings than we do. We compete with other insurers for marketing firms, independent consultants and employee agents primarily on the basis of our compensation and support services. Any reduction in our ability to attract and retain effective sales representatives could materially adversely affect our revenues, results of operations and financial condition.
As of January 1, 2017, we have discontinued sales of all of our domestic life insurance products that are not compliant with Section 7702 of the Internal Revenue Code. We are currently developing compliant products to be sold in the domestic market. We expect 2017 sales to decline due to lack of compliant products to sell and we are unsure of the impact this will have on our domestic distribution sources.
There may be adverse tax, legal or financial consequences if our sales representatives are determined not to be independent contractors.
Our sales representatives are independent contractors who operate their own businesses. Although we believe that we have properly classified our representatives as independent contractors, there is nevertheless a risk that the IRS, a foreign agency, a court or other authority will take the different view that our sales representatives should be treated like employees. Furthermore, the tests governing the determination of whether an individual is considered to be an independent contractor or an employee are typically fact-sensitive and vary from jurisdiction to jurisdiction. Laws and regulations that govern the status and misclassification of independent sales representatives are subject to change or interpretation.
If there is a change in the manner in which our independent contractors are classified or an adverse determination with respect to some or all of our independent contractors by a court or governmental agency, we could incur significant costs in complying with such laws and regulations, including in respect of tax withholding, social security payments, government and private pension plan contributions and recordkeeping, or we may be required to modify our business model, any of which could have a material adverse effect on our business, financial condition and results of operations. In addition, there is the risk that we may be subject to significant monetary liabilities arising from fines or judgments as a result of any such actual or alleged non-compliance with applicable federal, state, local or foreign laws.
Changes among our board and senior management team, or the failure to fill key vacancies or effectively manage succession, could hinder our operations, marketing and business strategy and adversely impact our results of operations, financial condition or prospects.
Significant changes have occurred recently in our board and executive leadership, including: the retirement in 2015 of our founder, who was our initial Chairman and Chief Executive Officer; the retirement in 2016 of our founder’s son, who succeeded our founder as Chairman and Chief Executive Officer; the resignation in 2016 of a long-serving board member and Audit Committee Chairman; the appointment in 2016 of a new Chairman of the Board; the appointment in 2016 of our former Chief Legal Officer Geoffrey M. Kolander as our Chief Executive Officer; and the appointments in 2017 of a new Chief Financial Officer, Chief Operating Officer, Chief Accounting Officer, Chief Actuary, and Chief Marketing Officer, along with four new independent directors. The effectiveness of new leaders in these roles, and further transition as a result of these changes, could have a significant impact on our results of operations, financial condition and prospects. We rely on our senior executive team comprised of Chief Executive Officer and President Geoffrey M. Kolander, Executive Vice President, Chief Financial Officer and Chief Investments Officer Kay Osbourn, Vice President and Chief Operating Officer, Terry Festervand, Vice President and Chief Accounting Officer, Jeff Conklin, Vice President and Chief Actuary, Greg Broer and Vice President and Chief Marketing Officer, Robert Mauldin to develop and execute our operating and marketing plans and strategy for expanding our business. We anticipate that their expertise will continue to be of substantial value in connection with our business and compliance strategies. The loss of the services of any of
CITIZENS, INC. AND CONSOLIDATED SUBSIDIARIES
September 30, 2017
these individuals, or the failure to effectively manage succession or fill key vacancies for an extended period of time, could have a significant adverse effect on our business and prospects. While we have entered into employment and change of control agreements with our top two executives, there is no assurance that these executives will complete the term of their employment agreements or that the Company will renew the agreements upon expiration. Our ability to retain and effectively incentivize our key executives and our ability to attract directors and new executive talent in the competitive insurance industry may be limited. Further, we do not carry key-man insurance policies on any of their lives.
We are subject to extensive governmental regulation in the United States, which is subject to change and may increase our costs of doing business, restrict the conduct of our business and negatively impact our results of operations, liquidity and financial condition.
We are subject to extensive regulation and supervision in U.S. jurisdictions where we do business, including state insurance regulations and U.S. federal securities, tax, financial services, privacy, anti-money laundering, bank secrecy, anti-corruption and foreign asset control laws. Insurance company regulation is generally designed to protect the interests of policyholders, with substantially lesser protections to shareholders of the regulated insurance companies. To that end, all the states in which we do business have insurance regulatory agencies with broad legal powers with respect to licensing companies to transact business; mandating capital and surplus requirements; regulating trade and claims practices; approving policy forms; and restricting companies' ability to enter and exit markets.
The capacity for an insurance company's growth in premiums is partially a function of its required statutory surplus. Maintaining appropriate levels of statutory surplus, as measured by statutory accounting practices prescribed or permitted by a company's state of domicile, is considered important by all state insurance regulatory authorities. Failure to maintain required levels of statutory surplus could result in increased regulatory scrutiny and enforcement action by regulatory authorities.
Most insurance regulatory authorities have broad discretion to grant, renew, suspend and revoke licenses and approvals, and could preclude or temporarily suspend us from carrying on some or all of our activities, including acquisitions of other insurance companies, require us to add capital to our insurance company subsidiaries, or fine us. If we are unable to maintain all required licenses and approvals, or if our insurance business is determined not to comply fully with the wide variety of applicable laws and regulations and their interpretations, including the USA Patriot Act, our revenues, results of operations and financial condition could be materially adversely affected.
Although the U.S. federal government historically has not regulated the insurance business, legislation proposing federal regulation of insurance has been proposed from time to time and the Dodd-Frank Act enacted in 2010 expanded the federal presence in insurance oversight. Its requirements include streamlining the state-based regulation of reinsurance and non-admitted insurance (also known as surplus lines insurance, which is property or casualty insurance written by a company that is not licensed to sell policies of insurance in a given state) and establishing a new Federal Insurance Office within the U.S. Department of the Treasury with powers over all lines of insurance except health insurance, certain long-term care insurance and crop insurance. The Federal Insurance Office is authorized to, among other things, gather data and information to monitor aspects of the insurance industry, identify issues in the regulation of insurers about insurance matters and preempt state insurance measures under certain circumstances. The Dodd-Frank Act calls for numerous studies and significant rulemaking across numerous federal agencies, some of which has been implemented. The rulemaking process going forward may change with the new presidential administration. We are currently unable to determine the ultimate impact of the Dodd-Frank Act on our business, results of operations, liquidity and capital resources.
Our failure to maintain effective information systems could adversely affect our business.
We must maintain and enhance our existing information systems and develop new information systems in order to keep pace with continuing changes in information processing technology, evolving industry and regulatory standards and changing customer preferences. If we do not maintain adequate systems, we could experience adverse consequences, including products acquired through acquisition, inadequate information on which to base pricing, underwriting and reserve decisions, regulatory problems, failure to meet prompt payment obligations, increases in administrative expenses and loss of customers.
Some of our information technology systems and software are mainframe-based, legacy-type systems that require an ongoing commitment of resources to maintain current standards. Our systems utilize proprietary code requiring highly skilled personnel. Due to the unique nature of our proprietary operating environment, we could have difficulty finding personnel with the skills required to provide ongoing system maintenance and development as we seek to keep pace with changes in our products
CITIZENS, INC. AND CONSOLIDATED SUBSIDIARIES
September 30, 2017
and business models, information processing technology, evolving industry and regulatory standards and policyholder needs. Our success is dependent upon, among other things, maintaining and enhancing the effectiveness of existing systems, as well as continuing to integrate, develop and enhance our information systems to support business processes in a cost-effective manner.
Our failure to maintain effective and efficient information systems, or our failure to efficiently and effectively consolidate our information systems to eliminate redundant or obsolete applications, could have a material adverse effect on our results of operations and financial condition.
Failures of disclosure controls and internal control over financial reporting could materially and adversely affect our business, financial condition and results of operations, impair our ability to timely file reports with the SEC and subject us to litigation and/or regulatory scrutiny and penalties.
We maintain disclosure controls and procedures designed to ensure that we timely report information as specified in SEC rules and regulations. We also maintain a system of internal control over financial reporting. However, these controls may not achieve, and in some cases have not achieved, their intended objectives. Control processes that involve human diligence and compliance, such as our disclosure controls and procedures and internal control over financial reporting, are subject to lapses in judgment and breakdowns. Controls that rely on models may be subject to inadequate design or inaccurate assumptions or estimates. Controls also can be circumvented by collusion or improper management override of such controls. Because of such limitations, there are risks that material misstatements due to error or fraud may not be prevented or detected, and that information may not be reported on a timely basis. The failure of our controls to be effective could have a material adverse effect on our business, financial condition, results of operations and the market for our common stock, and could subject us to litigation, regulatory scrutiny and/or penalties.
As disclosed in Part II, Item 9A of our Annual Report on Form 10-K for the year ended December 31, 2016, we have identified control deficiencies in our disclosure controls and financial reporting process that constitute material weaknesses and for which remediation is still in process as of September 30, 2017. If we fail to design effective controls, fail to remediate control deficiencies or fail to otherwise maintain effective internal controls over financial reporting in the future, such failures could result in a material misstatement of our annual or quarterly financial statements that would not be prevented or detected on a timely basis and which could cause investors to lose confidence in our financial statements, have a negative effect on the trading price of our common stock, limit our ability to obtain financing if needed or increase the cost of any financing we may obtain. In addition, these failures may negatively impact our business, financial condition and results of operations, impair our ability to timely file our periodic reports with the SEC, subject us to litigation and regulatory scrutiny and cause us to incur substantial additional costs in future periods relating to the implementation of remedial measures.
Our failure to protect confidential information and privacy could result in the unauthorized disclosure of sensitive or confidential corporate or customer information, damage to our reputation, loss of customers, fines, penalties and adverse effects on our results of operations and financial condition.
Our insurance subsidiaries are subject to privacy regulations. The actions we take to protect confidential information include among other things: monitoring our record retention plans and policies and any changes in state or federal privacy and compliance requirements; maintaining secure storage facilities for tangible records; and limiting access to electronic information in order to safeguard certain information.
In addition, the Gramm-Leach-Bliley Act requires that we deliver a notice regarding our privacy policy both at the delivery of an insurance policy and annually thereafter. Certain exceptions are allowed for sharing of information under joint marketing agreements. However, certain state laws may require us to obtain a policyholder's consent before we share information.
We have a written information security program with appropriate administrative, technical and physical safeguards to protect such confidential information. Cyber security attacks are on the rise throughout the world and while we believe we have taken reasonable steps to secure our customer information we could experience a breach of data. We closely monitor cyber attack attempts on our system, and we are not aware of any material breach of our cybersecurity, administrative, technical and physical safeguards or client data. Nevertheless, it is possible a cyber attack could go undetected and that preventative actions we take to reduce this risk of cyber-incidents and protect our information may be insufficient to prevent cyber attacks or other security breaches.
If we do not comply with privacy regulations and protect confidential information, we could experience adverse consequences, including regulatory sanctions, loss of reputation, litigation exposure, disruptions to our operations or significant technical, legal
CITIZENS, INC. AND CONSOLIDATED SUBSIDIARIES
September 30, 2017
and operating expenses, any of which could have a material adverse effect on our business, results of operations and financial condition.
General economic, financial market and political conditions may materially adversely affect our results of operations and financial condition.
Our results of operations and financial condition may be materially adversely affected from time to time by general economic, financial market and political conditions, both in the United States and in the foreign countries where our policyowners reside. These conditions include economic cycles such as: levels of consumer spending; levels of inflation; movements of the financial markets; availability of credit; fluctuations in interest rates, monetary policy or demographics; and legislative and competitive changes.
During periods of economic downturn, our insureds may choose not to purchase our insurance products, may terminate existing policies, permit policies to lapse or may choose to reduce the amount of coverage purchased, any of which could have a material adverse effect on our results of operations and financial condition. Also, our sales of new insurance policies might decrease.
Our insurance subsidiaries are restricted by applicable laws and regulations in the amounts of fees, dividends and other distributions they may make to us. The inability of our subsidiaries to make payments to us in sufficient amounts for us to conduct our operations could adversely affect our ability to meet our obligations or expand our business.
As a holding company, our principal asset is the stock of our subsidiaries. We rely primarily on statutorily permissible payments from our insurance company subsidiaries, principally through service agreements we have with our subsidiaries, to meet our working capital and other corporate expenses. The ability of our insurance company subsidiaries to make payments to us is subject to regulation by the states in which they are domiciled, and these payments depend primarily on approved service agreements between us and these subsidiaries and, to a lesser extent, the statutory surplus (which is the excess of assets over liabilities as determined under statutory accounting practices prescribed by an insurance company's state of domicile), future statutory earnings (which are earnings as determined in accordance with statutory accounting practices) and regulatory restrictions.
Generally, the net assets of our insurance company subsidiaries available for dividends are limited to either the lesser or greater (depending on the state of domicile) of the subsidiary's net gain from operations during the preceding year and 10% of the subsidiary's net statutory surplus as of the end of the preceding year as determined in accordance with accounting practices prescribed by insurance regulatory authorities.
Except to the extent that we are a creditor with recognized claims against our subsidiaries, claims of our subsidiaries' creditors, including policyholders, have priority with respect to the assets and earnings of the subsidiaries over the claims of our creditors and shareholders. If any of our subsidiaries becomes insolvent, liquidates or otherwise reorganizes, our creditors and shareholders will have no right to proceed in their own right against the assets of that subsidiary or to cause the liquidation, bankruptcy or winding-up of the subsidiary under applicable liquidation, bankruptcy or winding-up laws.
Adverse capital and credit market conditions may significantly affect our access to debt and equity capital and our cost of capital in seeking to expand our business.
The availability of equity and debt financing to us will depend on a variety of factors such as market conditions, the general availability of credit, the overall availability of credit to the financial services industry, our credit capacity, as well as the possibility that investors or lenders could develop a negative perception of our long- or short-term financial prospects. Disruptions, uncertainty or volatility in the capital markets may also limit our access to equity capital for us to seek to expand our business. As such, we may be forced to delay raising debt or equity capital, or bear an unattractive cost of capital, which could adversely affect our ability to seek any acquisitions and negatively impact profitability of an acquisition.
Unexpected losses in future reporting periods may require us to adjust the valuation allowance against our deferred tax assets.
We evaluate our deferred tax asset (“DTA”) quarterly for recoverability based on available evidence. This process involves management's judgment about assumptions, which are subject to change from period to period due to tax rate changes or variances between our projected operating performance and our actual results. Ultimately, future adjustments to the DTA valuation allowance, if any, will be determined based upon changes in the expected realization of the net deferred tax assets. The realization of the deferred tax assets depends on the existence of sufficient taxable income in either the carry back or carry forward periods under applicable tax law. Due to significant estimates utilized in establishing the valuation allowance and the potential for changes in
CITIZENS, INC. AND CONSOLIDATED SUBSIDIARIES
September 30, 2017
facts and circumstances, it is reasonably possible that we may be required to record a valuation allowance in future reporting periods. Such an adjustment could have a material adverse effect on our results of operation, financial condition and capital position.
We face a greater risk of money laundering activity associated with sales derived from residents of certain foreign countries.
Some of our top international markets are in countries identified by the U.S. Department of State as jurisdictions of high risk for money laundering. As required by Bank Secrecy Act ("BSA”) regulations applicable to insurance companies, we have developed and implemented an anti-money laundering program that includes policies and procedures for complying with applicable BSA program, reporting and recordkeeping requirements and for deterring, preventing and detecting potential money laundering and other criminal activity (“BSA Program”). Based on a prior internal risk assessment, we have enhanced our BSA Program with additional controls, such as list screening software beyond sanctions screening required by the Office of Foreign Assets Control (“OFAC”), enhanced payment due diligence and transaction controls. However, there can be no assurance that these enhanced controls will entirely mitigate money laundering risk associated with these jurisdictions.
Risks Relating to Our Capital Stock
If our foreign policyholders reduced or ceased participation in our Stock Investment Plan (the “Plan”) or if a securities regulatory authority were to deem the Plan's operation contrary to securities laws, the volume of Class A common stock purchased on the open market through the Plan, and the price of our Class A common stock, could fall.
More than 95% percent of the shares of Class A common stock purchased under the Plan in 2016 were purchased by foreign holders of life insurance policies (or related brokers); the remaining 5% of the shares of Class A common stock purchased under the Plan in 2016 were purchased by approximately 2,123 participants resident in the United States. The Plan is registered with the SEC pursuant to a registration statement under the Securities Act of 1933, but is not registered under the laws of any foreign jurisdiction. If a foreign securities regulatory authority were to determine the offer and sale of our Class A common stock under the Plan were contrary to applicable laws and regulations of its jurisdiction, such authority may issue or assert a fine, penalty or cease and desist order against us in that foreign jurisdiction. There is a risk our Class A common stock price could be negatively impacted by a decrease in participation in the Plan. If fewer policyholders elect to participate in the Plan, or our international premium collections were to decrease as a result of regulatory, economic, or marketing impediments, the trading volume of our Class A common stock may decline from its present levels, the demand for our Class A common stock could be negatively impacted and the price of our Class A common stock could fall.
CITIZENS, INC. AND CONSOLIDATED SUBSIDIARIES
September 30, 2017
Control of our Company, through the ownership of our Class B Common Stock, has transferred from our founder to a 501(c)(3) charitable foundation established by our founder, and we cannot determine whether any change in our management, operations, or operating strategies will occur as a result of this ownership change.
Harold E. Riley, our founder, was the beneficial owner of 100% of our Class B common stock, which was held in the name of the Harold E. Riley Trust ("Trust"), of which he had served as Trustee until his death in September 2017. Our Class A and Class B common stock are identical in all respects, except the Class B common stock elects a simple majority of the Board and receives one-half of any cash dividends paid, on a per share basis, to the Class A shares. The Class A common stock elects the remainder of the Board. The Trust documents provided that upon Mr. Riley's death, the Class B common stock was transferred from the Trust to the Harold E. Riley Foundation, a charitable organization established under 501(c)(3) of the Internal Revenue Code (the "Foundation"). Therefore, the Foundation controls our Company. The Foundation is organized as a public support charity for the benefit of its charitable beneficiaries, Baylor University and Southwestern Baptist Theological Seminary. The Foundation is governed by 11 trustees, five of which were appointed by its sole member, Harold Riley, three of which were appointed by Baylor University and three of which were appointed by Southwestern Baptist Theological Seminary. The trustees appointed by Harold Riley include himself, Dottie Riley and Rick Riley. It is unclear what, if any, change will occur to our board, management, or corporate operating strategies as a result of different ownership of our Class B common stock. A transfer of our Class B common stock from the Trust also may trigger certain “change in control” provisions in the employment agreements of our top two executives. Under each employment agreement, a “change in control" includes, among other things (1) the transfer of at least a majority of the Company’s Class B Common Stock from the Harold E. Riley Trust to an individual other than Harold E. Riley, an entity not beneficially owned by Harold E. Riley or a trust not controlled by Harold E. Riley and (2) the exercise of a power of attorney granted by Harold E. Riley over the Company’s Class B Common Stock. Upon a termination by Citizens without cause or the executive’s voluntary termination with Good Reason, in each case other than within the ninety (90) day period prior to the consummation of a change in control or within one (1) year following a change in control, each executive is entitled to certain cash payments and benefits.
There are a substantial number of our shares of Class A common stock issued to our executive officers and directors which are eligible for future sale in the public market. The sale of these shares could cause the market price of our Class A common stock to fall.
There were 49,080,114 shares of our Class A common stock issued and outstanding as of December 31, 2016. Our executive officers and directors owned approximately 2,480,354 shares of our Class A common stock as of December 31, 2016, representing approximately 5.1% of our then outstanding Class A common stock. Almost all of these shares have been registered for public resale and generally may be sold freely. In the event of a sale of some or all of these shares or the perceived sale of these shares, the market price of our Class A common stock could fall substantially.
The price of our Class A common stock may be volatile and may be affected by market conditions beyond our control.
Our Class A common stock price has historically fluctuated and is likely to fluctuate in the future and could decline materially because of the volatility of the stock market in general, decreased participation in the Plan referred to above or a variety of other factors, many of which are beyond our control, including: quarterly or annual variations in actual or anticipated results of our operations; interest rate fluctuations; changes in financial estimates by securities analysts; competition and other factors affecting the life insurance business generally; and conditions in the U.S. and world economies.
Our international markets, and the specific manner in which we conduct our business in those jurisdictions, may be subject to negative publicity in social media or other channels, which may negatively impact the market price of our Class A common stock.
We interface with and distribute our products to residents of foreign countries that may be subject to the risks disclosed in our Item 1A. Risk Factor under the heading, “The majority of our sales derive from residents of foreign countries and are subject to risks associated with widespread political instability, currency control laws and foreign insurance laws. A significant loss of sales in these foreign markets could have a material adverse effect on our results of operations and financial condition". Venezuela is one such example. Accordingly, from time to time, bloggers or other social media outlets relevant to investors may focus attention on our exposure to these countries and the negative circumstances surrounding their governments, thereby subjecting us to periodic negative publicity. Negative publicity on investor blogs or through other media channels could impact trading in our stock and ultimately cause the market price of our Class A common stock to fall.
CITIZENS, INC. AND CONSOLIDATED SUBSIDIARIES
September 30, 2017
Our articles of incorporation and bylaws, as well as applicable state insurance laws, may discourage takeovers and business combinations that our shareholders might consider to be in their best interests.
Our articles of incorporation and bylaws, as well as various state insurance laws, may delay, deter, render more difficult or prevent a takeover attempt our shareholders might consider in their best interests. As a result, our shareholders will be prevented from receiving the benefit from any premium to the market price of our Class A common stock that may be offered by a bidder in a takeover context. Even in the absence of a takeover attempt, the existence of these provisions may adversely affect the prevailing market price of our Class A common stock if they are viewed as discouraging takeover attempts in the future.
The following provisions in our articles of incorporation and bylaws make it difficult for our Class A shareholders to replace or remove our directors and have other anti-takeover effects that may delay, deter or prevent a takeover attempt:
holders of shares of our Class B common stock elect a simple majority of our board of directors, and all of these shares are owned by the Harold E. Riley Foundation; and
our board of directors may issue one or more series of preferred stock without the approval of our shareholders.
State insurance laws generally require prior approval of a change in control of an insurance company. Generally, such laws provide that control over an insurer is presumed to exist if any person, directly or indirectly, owns, controls, holds with the power to vote, or holds proxies representing 10% or more of the voting securities of the insurer. In considering an application to acquire control of an insurer, an insurance commissioner generally will consider such factors as the experience, competence and financial strength of the proposed acquirer, the integrity of the proposed acquirer's board of directors and executive officers, the proposed acquirer's plans for the management and operation of the insurer, and any anti-competitive results that may arise from the acquisition. In addition, a person seeking to acquire control of an insurance company is required in some states to make filings prior to completing an acquisition if the acquirer and the target insurance company and their affiliates have sufficiently large market shares in particular lines of insurance in those states. These state insurance requirements may delay, deter or prevent our ability to complete an acquisition.
We have never paid any cash dividends on our Class A common stock and do not anticipate doing so in the foreseeable future.
We have never paid cash dividends on our Class A common stock, as it is our policy to retain earnings for use in the operation and expansion of our business. We do not expect to pay cash dividends on our Class A common stock for the foreseeable future.
Item 2.UNREGISTERED SALES OF EQUITY SECURITIES AND USE OF PROCEEDS
None.
Item 3. DEFAULTS UPON SENIOR SECURITIES
None.Not applicable.
Item 4.MINE SAFETY DISCLOSURES
Not applicable.
Item 5.OTHER INFORMATION
None.
CITIZENS, INC. AND CONSOLIDATED SUBSIDIARIES
September 30, 2017
Item 6.EXHIBITS
| | | | | | | | |
Exhibit Number | | The following exhibits are filed herewith: |
| | |
Exhibit Number | | The following exhibits are filed herewith: |
| | |
| | |
| | |
| | |
| | |
| | |
| | |
| | |
| | �� |
| | |
| | |
| | |
| | |
| | |
| | |
| | |
| 101* | | Inline XBRL Document Set for the condensed consolidated financial statements and accompanying notes in Part I, Item 1, Financial Statements of this Quarterly Report on Form 10-Q* |
101.INS104* | | Inline XBRL Instance Document* |
| | |
101.SCH | | for the cover page of this Quarterly Report on Form 10-Q, included in the Exhibit 101 Inline XBRL Taxonomy Extension Schema* |
| | |
101.CAL | | XBRL Taxonomy Extension Calculation Linkbase* |
| | |
101.DEF | | XBRL Taxonomy Extension Definition Linkbase* |
| | |
101.LAB | | XBRL Taxonomy Extension Label Linkbase* |
| | |
101.PRE | | XBRL Taxonomy Extension Presentation Linkbase* |
| | __________________Document Set* |
* Filed herewith.
(a) Filed on † Indicates management contract or compensatory plan or arrangement.
March 15, 2004 with the Registrant's Annual Report on Form 10-K for the Year Ended December 31, 2003 as Exhibit 3.1, and incorporated herein by reference.2021 | 10-Q 48
(b) Filed on June 10, 2016 with the Registrants' Current Report on Form 8-K as Exhibit 3.2 and incorporated herein by reference.
(c) Filed on September 13, 2017 as Exhibit 10.1 with the Registrant's Current Report on Form 8-K and incorporated herein by reference.
SIGNATURES
Pursuant to the requirements of the Securities Exchange Act of 1934, the Registrant has duly caused this report to be signed on its behalf by the undersigned thereunto duly authorized.
| | | | | | | | | | | |
| | CITIZENS, INC. |
| | |
| | | |
| | By: | /s/ Gerald W. Shields |
| | | Gerald W. Shields |
| | | Interim Chief Executive Officer & President |
| | | |
| | | |
| | CITIZENS, INC.By: | /s/ Jeffery P. Conklin |
| | | Jeffery P. Conklin |
| | | |
| | By: | /s/ Geoffrey M. Kolander |
| | | Geoffrey M. Kolander |
| | | President and Chief Executive Officer |
| | | |
| | | |
| | By: | /s/ Kay E. Osbourn |
| | | Kay E. Osbourn |
| | | Executive Vice President, Chief Financial Officer & Treasurer |
| | | and Chief Investment Officer |
| | | |
| | | |
| Date: | November 7, 2017May 5, 2021 | | |
72
March 31, 2021 | 10-Q 49