UNITED STATES
SECURITIES AND EXCHANGE COMMISSION
WASHINGTON, D.C. 20549
FORM 10-Q
☒ QUARTERLY REPORT PURSUANT TO SECTION 13 OR 15(d) OF THE SECURITIES EXCHANGE ACT OF 1934
For the Quarterly Period Ended March 31, 20212022
OR
☐ TRANSITION REPORT PURSUANT TO SECTION 13 OR 15(d) OF THE SECURITIES EXCHANGE ACT OF 1934
For the Transition Period from to
COMMISSION FILE NUMBER: 000-16509

| | |
| CITIZENS, INC. |
| (Exact name of registrant as specified in its charter) |
| | | | | |
| Colorado | 84-0755371 |
| (State or other jurisdiction of incorporation or organization) | (I.R.S. Employer Identification No.) |
11815 Alterra Pkwy, Floor 15, Austin, TX 78758
(Current Address)
Registrant's telephone number, including area code: (512) 837-7100
| | | | | | | | |
| Securities registered pursuant to Section 12(b) of the Act |
|
| Class A Common Stock | CIA | NYSE |
| (Title of each class) | (Trading symbol(s)) | (Name of each exchange on which registered) |
Indicate by check mark whether the registrant: (1) has filed all reports required to be filed by Section 13 or 15(d) of the Securities Exchange Act of 1934 during the preceding 12 months (or for such shorter period that the registrant was required to file such reports), and (2) has been subject to such filing requirements for the past 90 days. x Yes o No
Indicate by check mark whether the registrant has submitted electronically every Interactive Data File required to be submitted pursuant to Rule 405 of Regulation S-T (§232.405 of this chapter) during the preceding 12 months (or for such shorter period that the registrant was required to submit such files). x Yes o No
Indicate by check mark whether the registrant is a large accelerated filer, an accelerated filer, a non-accelerated filer, a smaller reporting company or an emerging growth company. See the definitions of "large accelerated filer," "accelerated filer," "smaller reporting company" and "emerging growth company" in Rule 12b-2 of the Exchange Act:
| | | | | | | | | | | | | | | | | | | | | | | |
| Large accelerated filer | ☐ | | Accelerated filer | ☒ | | Emerging growth company | ☐ |
| Non-accelerated filer | ☐ | | Smaller reporting company | ☐ |
| | Emerging growth company | ☐ |
If an emerging growth company, indicate by check mark if the registrant has elected not to use the extended transition period for complying with any new or revised financial accounting standards provided pursuant to Section 13(a) of the Exchange Act. o
Indicate by check mark whether the registrant is a shell company (as defined in Rule 12b-2 of the Exchange Act). ☐ Yes x No
As of April 30, 2021,May 2, 2022, the Registrant had 49,603,60650,508,640 shares of Class A common stock outstanding and 0 shares of Class B common stock outstanding.
THIS PAGE INTENTIONALLY LEFT BLANK
TABLE OF CONTENTS
| | | | | | | | | | | |
| | | Page Number |
| Part I. FINANCIAL INFORMATION | |
| | | |
| | Item 1. | | |
| | | |
| | | | |
| | | |
| | | |
| | | |
| | | |
| | | |
| | | | |
| | | |
| | | | |
| | | |
| | Item 2. | | |
| | | |
| | Item 3. | | |
| | | |
| | Item 4. | | |
| | | |
| Part II. OTHER INFORMATION | |
| | | |
| | Item 1. | | |
| | | |
| Item 1A. | | |
| | | |
| | Item 2. | | |
| | | |
| | Item 3. | | |
| | | |
| | Item 4. | | |
| | | |
| | Item 5. | | |
| | | |
| | Item 6. | | |
March 31, 20212022 | 10-Q 1
PART I. FINANCIAL INFORMATION
Item 1. FINANCIAL STATEMENTS
CITIZENS, INC. AND CONSOLIDATED SUBSIDIARIES
Consolidated Balance Sheets
| | | | | | | | | | | |
| | | |
| | | |
| (In thousands) | March 31, 2021 | | December 31, 2020 |
| Assets | (Unaudited) | | |
| Investments: | | | |
| Fixed maturity securities available-for-sale, at fair value (amortized cost: $1,332,632 and $1,321,487 in 2021 and 2020, respectively) | $ | 1,420,587 | | | 1,489,383 | |
| | | |
| Equity securities, at fair value | 22,366 | | | 22,102 | |
| | | |
| Policy loans | 82,674 | | | 83,318 | |
| | | |
| Real estate held-for-sale | 2,571 | | | 2,571 | |
| Other long-term investments (portion measured at fair value $16,982 and $11,923 in 2021 and 2020, respectively; less allowance for losses of $11 in 2021 and 2020) | 17,347 | | | 27,294 | |
| | | |
| Total investments | 1,545,545 | | | 1,624,668 | |
| Cash and cash equivalents | 19,493 | | | 34,131 | |
| Accrued investment income | 15,862 | | | 16,137 | |
| Receivable for securities | 2,808 | | | 0 | |
| Reinsurance recoverable | 4,343 | | | 5,753 | |
| Deferred policy acquisition costs | 128,914 | | | 104,913 | |
| Cost of insurance acquired | 11,443 | | | 11,541 | |
| Goodwill and other intangible assets | 13,569 | | | 13,570 | |
| | | |
| | | |
| Property and equipment, net | 15,684 | | | 16,312 | |
| Due premiums | 9,538 | | | 11,309 | |
| | | |
| Other assets (less allowance for losses of $304 and $297 in 2021 and 2020, respectively) | 14,454 | | | 5,086 | |
| Total assets | $ | 1,781,653 | | | 1,843,420 | |
| | | | | | | | | | | |
| | | |
| | | |
| (In thousands) | March 31, 2022 | | December 31, 2021 |
| Assets | (Unaudited) | | |
| Investments: | | | |
| Fixed maturity securities available-for-sale, at fair value (amortized cost: $1,361,254 and $1,343,755 in 2022 and 2021, respectively) | $ | 1,355,410 | | | 1,470,617 | |
| | | |
| Equity securities, at fair value | 13,902 | | | 14,844 | |
| | | |
| Policy loans | 79,345 | | | 80,307 | |
| | | |
| | | |
| Other long-term investments (portion measured at fair value $62,564 and $56,038 in 2022 and 2021, respectively) | 63,927 | | | 57,399 | |
| | | |
| Total investments | 1,512,584 | | | 1,623,167 | |
| Cash and cash equivalents | 21,298 | | | 27,294 | |
| Accrued investment income | 15,755 | | | 16,197 | |
| | | |
| Reinsurance recoverable | 3,574 | | | 5,539 | |
| Deferred policy acquisition costs | 139,688 | | | 140,380 | |
| Cost of insurance acquired | 10,528 | | | 10,611 | |
| Current federal income tax receivable | 589 | | | 762 | |
| | | |
| Property and equipment, net | 14,088 | | | 14,074 | |
| Due premiums | 8,971 | | | 10,748 | |
| | | |
| Other assets (less allowance for losses of $109 and $111 in 2022 and 2021, respectively) | 5,886 | | | 5,739 | |
| Total assets | $ | 1,732,961 | | | 1,854,511 | |
See accompanying Notes to Consolidated Financial Statements.
March 31, 20212022 | 10-Q 2
CITIZENS, INC. AND CONSOLIDATED SUBSIDIARIES
Consolidated Balance Sheets, Continued
| | | | (In thousands, except share amounts) | (In thousands, except share amounts) | March 31, 2021 | | December 31, 2020 | (In thousands, except share amounts) | March 31, 2022 | | December 31, 2021 |
| Liabilities and Stockholders' Equity | Liabilities and Stockholders' Equity | (Unaudited) | | Liabilities and Stockholders' Equity | (Unaudited) | |
| Liabilities: | Liabilities: | | | | Liabilities: | | | |
| Policy liabilities: | Policy liabilities: | | | | Policy liabilities: | | | |
| Future policy benefit reserves: | Future policy benefit reserves: | | | | Future policy benefit reserves: | | | |
| Life insurance | Life insurance | $ | 1,250,930 | | | 1,246,423 | | Life insurance | $ | 1,284,792 | | | 1,278,987 | |
| Annuities | Annuities | 81,003 | | | 78,304 | | Annuities | 85,662 | | | 83,918 | |
| Accident and health | Accident and health | 785 | | | 761 | | Accident and health | 766 | | | 784 | |
| Dividend accumulations | Dividend accumulations | 33,997 | | | 33,336 | | Dividend accumulations | 38,576 | | | 37,760 | |
| Premiums paid in advance | Premiums paid in advance | 41,639 | | | 40,605 | | Premiums paid in advance | 40,433 | | | 40,690 | |
| Policy claims payable | Policy claims payable | 13,398 | | | 13,206 | | Policy claims payable | 9,659 | | | 14,590 | |
| Other policyholders' funds | Other policyholders' funds | 25,088 | | | 22,447 | | Other policyholders' funds | 32,656 | | | 30,690 | |
| Total policy liabilities | Total policy liabilities | 1,446,840 | | | 1,435,082 | | Total policy liabilities | 1,492,544 | | | 1,487,419 | |
| Commissions payable | Commissions payable | 2,192 | | | 2,572 | | Commissions payable | 1,816 | | | 2,285 | |
| Current federal income tax payable | 45,173 | | | 43,916 | | |
| | Deferred federal income tax payable | Deferred federal income tax payable | 9,717 | | | 9,564 | | Deferred federal income tax payable | 6,577 | | | 15,456 | |
| Payable for securities in process of settlement | Payable for securities in process of settlement | 2,075 | | | 5,265 | | Payable for securities in process of settlement | 3,815 | | | — | |
| Other liabilities | Other liabilities | 34,816 | | | 46,076 | | Other liabilities | 31,307 | | | 28,780 | |
| Total liabilities | Total liabilities | 1,540,813 | | | 1,542,475 | | Total liabilities | 1,536,059 | | | 1,533,940 | |
Commitments and contingencies (Note 7) | Commitments and contingencies (Note 7) | 0 | | 0 | Commitments and contingencies (Note 7) | 0 | | 0 |
| Stockholders' Equity: | Stockholders' Equity: | | | | Stockholders' Equity: | | | |
| Common stock: | Common stock: | | Common stock: | |
| Class A, 0 par value, 100,000,000 shares authorized, 52,694,778 and 52,654,016 shares issued and outstanding in 2021 and 2020, respectively, including shares in treasury of 3,135,738 in 2021 and 2020 | 262,855 | | | 262,869 | | |
| Class B, 0 par value, 2,000,000 shares authorized, 1,001,714 shares issued and outstanding in 2021 and 2020 | 3,184 | | | 3,184 | | |
| Class A, no par value, 100,000,000 shares authorized, 53,532,873 and 53,170,413 shares issued and outstanding in 2022 and 2021, respectively, including shares in treasury of 3,135,738 in 2022 and 2021 | | Class A, no par value, 100,000,000 shares authorized, 53,532,873 and 53,170,413 shares issued and outstanding in 2022 and 2021, respectively, including shares in treasury of 3,135,738 in 2022 and 2021 | 267,442 | | | 265,561 | |
| Class B, no par value, 2,000,000 shares authorized, 1,001,714 shares issued and outstanding in 2022 and 2021, including shares in treasury of 1,001,714 in 2022 and 2021 | | Class B, no par value, 2,000,000 shares authorized, 1,001,714 shares issued and outstanding in 2022 and 2021, including shares in treasury of 1,001,714 in 2022 and 2021 | 3,184 | | | 3,184 | |
| Accumulated deficit | Accumulated deficit | (85,925) | | | (82,352) | | Accumulated deficit | (46,898) | | | (45,565) | |
| Accumulated other comprehensive income: | | | | |
| Accumulated other comprehensive income (loss): | | Accumulated other comprehensive income (loss): | | | |
| Net unrealized gains (losses) on fixed maturity securities, net of tax | Net unrealized gains (losses) on fixed maturity securities, net of tax | 71,737 | | | 128,255 | | Net unrealized gains (losses) on fixed maturity securities, net of tax | (6,725) | | | 117,492 | |
| Treasury stock, at cost | Treasury stock, at cost | (11,011) | | | (11,011) | | Treasury stock, at cost | (20,101) | | | (20,101) | |
| Total stockholders' equity | Total stockholders' equity | 240,840 | | | 300,945 | | Total stockholders' equity | 196,902 | | | 320,571 | |
| Total liabilities and stockholders' equity | Total liabilities and stockholders' equity | $ | 1,781,653 | | | 1,843,420 | | Total liabilities and stockholders' equity | $ | 1,732,961 | | | 1,854,511 | |
See accompanying Notes to Consolidated Financial Statements.
March 31, 20212022 | 10-Q 3
CITIZENS, INC. AND CONSOLIDATED SUBSIDIARIES
Consolidated Statements of Operations and Comprehensive Income (Loss)
(Unaudited)
| | | | | | Three Months Ended March 31, | | | | Three Months Ended March 31, |
| (In thousands, except per share amounts) | (In thousands, except per share amounts) | | | 2021 | | 2020 | (In thousands, except per share amounts) | | | 2022 | | 2021 |
| Revenues: | Revenues: | | | | | Revenues: | | | | |
| Premiums: | Premiums: | | | | | | Premiums: | | | | | |
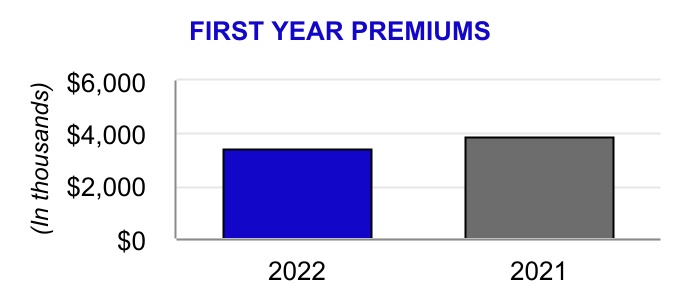
| Life insurance | Life insurance | | | $ | 37,642 | | | 39,946 | | Life insurance | | | $ | 37,746 | | | 37,642 | |
| Accident and health insurance | Accident and health insurance | | | 343 | | | 261 | | Accident and health insurance | | | 286 | | | 343 | |
| Property insurance | Property insurance | | | 1,047 | | | 1,110 | | Property insurance | | | 1,332 | | | 1,047 | |
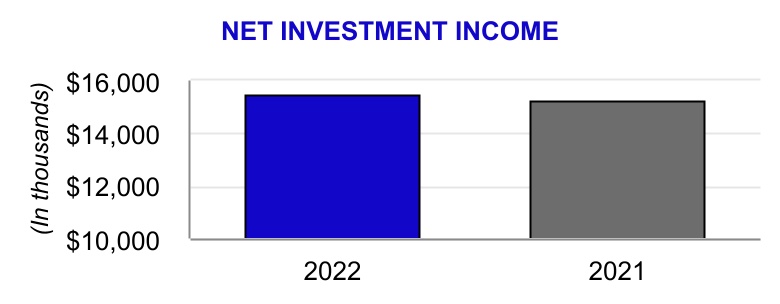
| Net investment income | Net investment income | | | 15,244 | | | 15,169 | | Net investment income | | | 15,487 | | | 15,244 | |
| Realized investment gains (losses), net | | | 292 | | | (1,306) | | |
| Investment related gains (losses), net | | Investment related gains (losses), net | | | (582) | | | 292 | |
| Other income | Other income | | | 915 | | | 542 | | Other income | | | 1,088 | | | 915 | |
| Total revenues | Total revenues | | | 55,483 | | | 55,722 | | Total revenues | | | 55,357 | | | 55,483 | |
| Benefits and Expenses: | Benefits and Expenses: | | | | | | Benefits and Expenses: | | | | | |
| Insurance benefits paid or provided: | Insurance benefits paid or provided: | | | | | | Insurance benefits paid or provided: | | | | | |
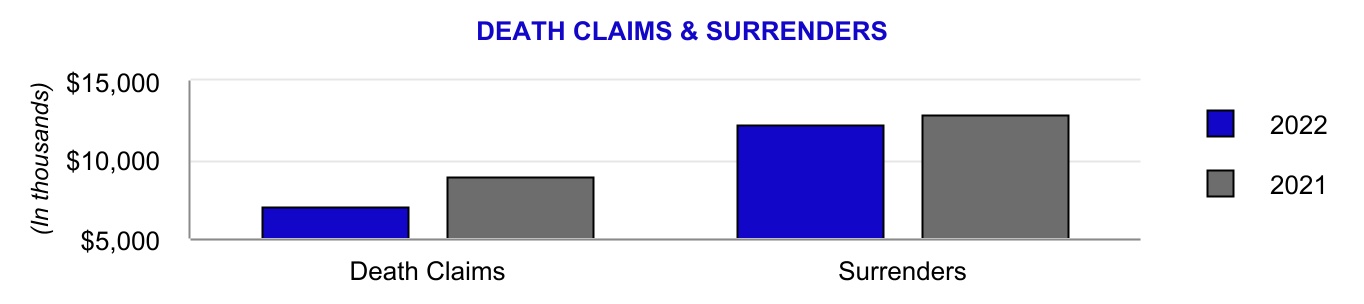
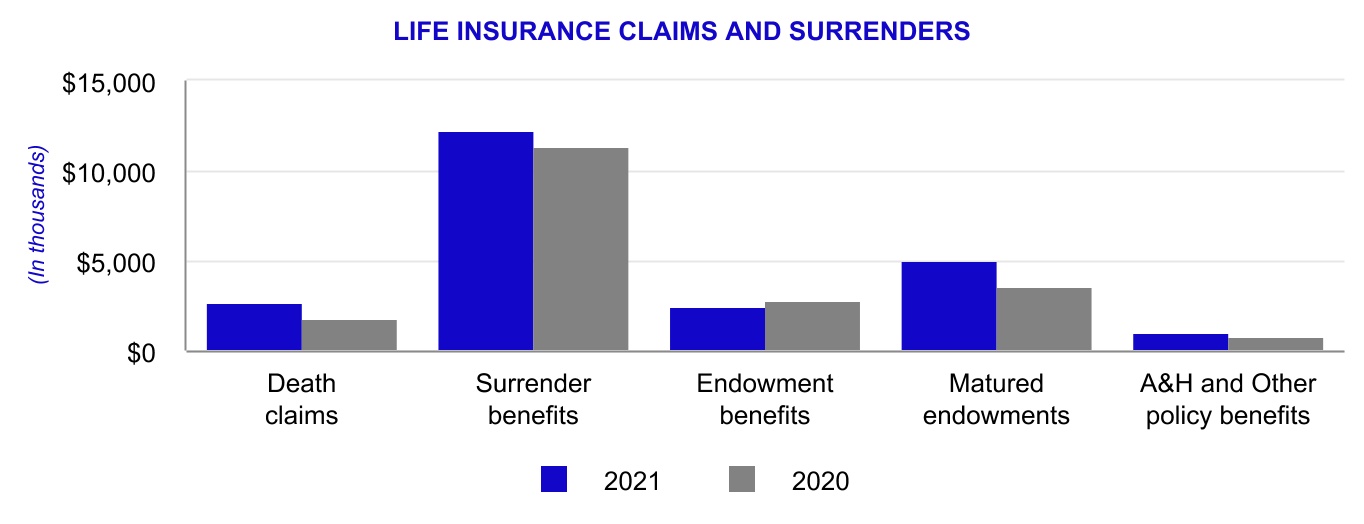
| Claims and surrenders | Claims and surrenders | | | 30,589 | | | 26,449 | | Claims and surrenders | | | 28,434 | | | 30,589 | |
| Increase in future policy benefit reserves | Increase in future policy benefit reserves | | | 5,232 | | | 9,471 | | Increase in future policy benefit reserves | | | 6,569 | | | 5,232 | |
| Policyholders' dividends | Policyholders' dividends | | | 1,306 | | | 1,233 | | Policyholders' dividends | | | 1,353 | | | 1,306 | |
| Total insurance benefits paid or provided | Total insurance benefits paid or provided | | | 37,127 | | | 37,153 | | Total insurance benefits paid or provided | | | 36,356 | | | 37,127 | |
| Commissions | Commissions | | | 8,157 | | | 7,853 | | Commissions | | | 7,673 | | | 8,157 | |
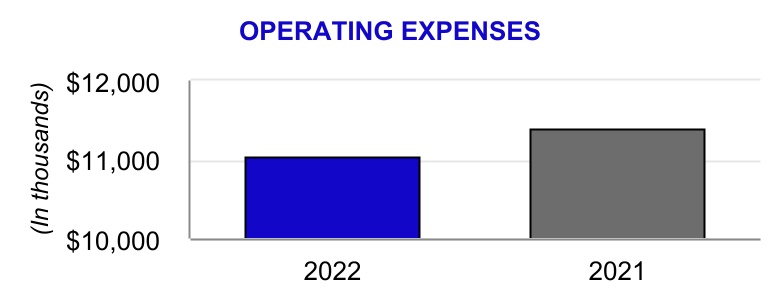
| Other general expenses | Other general expenses | | | 11,382 | | | 11,473 | | Other general expenses | | | 11,030 | | | 11,382 | |
| Capitalization of deferred policy acquisition costs | Capitalization of deferred policy acquisition costs | | | (4,985) | | | (5,009) | | Capitalization of deferred policy acquisition costs | | | (4,781) | | | (4,985) | |
| Amortization of deferred policy acquisition costs | Amortization of deferred policy acquisition costs | | | 6,183 | | | 6,119 | | Amortization of deferred policy acquisition costs | | | 5,817 | | | 6,183 | |
| Amortization of cost of insurance acquired | Amortization of cost of insurance acquired | | | 367 | | | 368 | | Amortization of cost of insurance acquired | | | 236 | | | 367 | |
| Total benefits and expenses | Total benefits and expenses | | | 58,231 | | | 57,957 | | Total benefits and expenses | | | 56,331 | | | 58,231 | |
| Income (loss) before federal income tax | Income (loss) before federal income tax | | | (2,748) | | | (2,235) | | Income (loss) before federal income tax | | | (974) | | | (2,748) | |
| Federal income tax expense (benefit) | Federal income tax expense (benefit) | | | 825 | | | 1,349 | | Federal income tax expense (benefit) | | | 359 | | | 825 | |
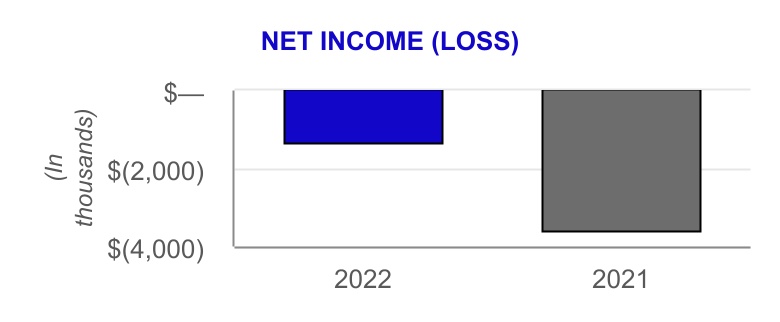
| Net income (loss) | Net income (loss) | | | (3,573) | | | (3,584) | | Net income (loss) | | | (1,333) | | | (3,573) | |
| Per Share Amounts: | Per Share Amounts: | | | | | | Per Share Amounts: | | | | | |
| Basic and diluted earnings (losses) per share of Class A common stock | Basic and diluted earnings (losses) per share of Class A common stock | | | (0.07) | | | (0.07) | | Basic and diluted earnings (losses) per share of Class A common stock | | | (0.03) | | | (0.07) | |
| Basic and diluted earnings (losses) per share of Class B common stock | Basic and diluted earnings (losses) per share of Class B common stock | | | (0.04) | | | (0.04) | | Basic and diluted earnings (losses) per share of Class B common stock | | | — | | | (0.04) | |
| Other Comprehensive Income (Loss): | Other Comprehensive Income (Loss): | | | | | | Other Comprehensive Income (Loss): | | | | | |
| Unrealized losses on fixed maturity securities: | | | | | | |
| Unrealized holding losses arising during period | | | (55,898) | | | (42,929) | | |
| Unrealized gains (losses) on fixed maturity securities: | | Unrealized gains (losses) on fixed maturity securities: | | | | | |
| Unrealized holding gains (losses) arising during period | | Unrealized holding gains (losses) arising during period | | | (133,342) | | | (55,898) | |
| Reclassification adjustment for losses (gains) included in net income (loss) | Reclassification adjustment for losses (gains) included in net income (loss) | | | (35) | | | 132 | | Reclassification adjustment for losses (gains) included in net income (loss) | | | 59 | | | (35) | |
| Unrealized losses on fixed maturity securities, net | | | (55,933) | | | (42,797) | | |
| Income tax expense (benefit) on unrealized losses on fixed maturity securities | | | 585 | | | (2,727) | | |
| Other comprehensive loss | | | (56,518) | | | (40,070) | | |
| Total comprehensive loss | | | $ | (60,091) | | | (43,654) | | |
| Unrealized gains (losses) on fixed maturity securities, net | | Unrealized gains (losses) on fixed maturity securities, net | | | (133,283) | | | (55,933) | |
| Income tax expense (benefit) on unrealized gains (losses) on fixed maturity securities | | Income tax expense (benefit) on unrealized gains (losses) on fixed maturity securities | | | (9,066) | | | 585 | |
| Other comprehensive income (loss) | | Other comprehensive income (loss) | | | (124,217) | | | (56,518) | |
| Total comprehensive income (loss) | | Total comprehensive income (loss) | | | $ | (125,550) | | | (60,091) | |
See accompanying Notes to Consolidated Financial Statements.
March 31, 20212022 | 10-Q 4
CITIZENS, INC. AND CONSOLIDATED SUBSIDIARIES
Consolidated Statements of Stockholders' Equity
(Unaudited)
| | | | | | | | | | | | | | | | | | | | | | | | | | | | | | | | | | | |
| | | | | | | | | | | |
| | | | | | | | | | | |
| | Common Stock | | Accumulated
deficit | | Accumulated other
comprehensive
income (loss) | | Treasury
stock | | Total
Stock-holders'
equity |
| (In thousands) | Class A | | Class B | | | | |
| | | | | | | | | | |
| Balance at December 31, 2020 | $ | 262,869 | | | 3,184 | | | (82,352) | | | 128,255 | | | (11,011) | | | 300,945 | |
| Comprehensive income (loss): | | | | | | | | | | | |
| Net income (loss) | 0 | | | 0 | | | (3,573) | | | 0 | | | 0 | | | (3,573) | |
| Unrealized investment gains (losses), net | 0 | | | 0 | | | 0 | | | (56,518) | | | 0 | | | (56,518) | |
| Total comprehensive income (loss) | 0 | | | 0 | | | (3,573) | | | (56,518) | | | 0 | | | (60,091) | |
| Stock-based compensation | (14) | | | 0 | | | 0 | | | 0 | | | 0 | | | (14) | |
| Balance at March 31, 2021 | $ | 262,855 | | | 3,184 | | | (85,925) | | | 71,737 | | | (11,011) | | | 240,840 | |
| | | | | | | | | | | |
| | | | | | | | | | | |
| | | | | | | | | | | |
| | | | | | | | | | | |
| | | | | | | | | | | |
| | | | | | | | | | | |
| | | | | | | | | | | |
| | | | | | | | | | | |
| | | | | | | | | | | |
| | | | | | | | | | | |
| | | | | | | | | | | |
| | | | | | | | | | | |
| | | | | | | | | | | | | | | | | | | | | | | | | | | | | | | | | | | |
| | | | | | | | | | | |
| | | | | | | | | | | |
| | Common Stock | | Accumulated
deficit | | Accumulated other
comprehensive
income (loss) | | Treasury
stock | | Total
Stock-holders'
equity |
| (In thousands) | Class A | | Class B | | | | |
| | | | | | | | | | |
| Balance at December 31, 2021 | $ | 265,561 | | | 3,184 | | | (45,565) | | | 117,492 | | | (20,101) | | | 320,571 | |
| Comprehensive income (loss): | | | | | | | | | | | |
| Net income (loss) | — | | | — | | | (1,333) | | | — | | | — | | | (1,333) | |
| Unrealized investment gains (losses), net | — | | | — | | | — | | | (124,217) | | | — | | | (124,217) | |
| Total comprehensive income (loss) | — | | | — | | | (1,333) | | | (124,217) | | | — | | | (125,550) | |
| Common stock issuance | 1,788 | | | — | | | — | | | — | | | — | | | 1,788 | |
| Stock-based compensation | 93 | | | — | | | — | | | — | | | — | | | 93 | |
| Balance at March 31, 2022 | $ | 267,442 | | | 3,184 | | | (46,898) | | | (6,725) | | | (20,101) | | | 196,902 | |
| | | | | | | | | | | |
| | | | | | | | | | | |
| | | | | | | | | | | |
| | | | | | | | | | | |
| | | | | | | | | | | |
| | | | | | | | | | | |
| | | | | | | | | | | |
| | | | | | | | | | | |
| | | | | | | | | | | |
| | | | | | | | | | | |
| | | | | | | | | | | |
| | | | | | | | | | | |
| | | | | | | | | | | |
| | | | | | | | Balance at December 31, 2019 | $ | 261,515 | | | 3,184 | | | (70,969) | | | 77,117 | | | (11,011) | | | 259,836 | | |
| Accounting standards adopted January 1, 2020 | 0 | | | 0 | | | (395) | | | 0 | | | 0 | | | (395) | | |
| Balance at December 31, 2020 | | Balance at December 31, 2020 | $ | 262,869 | | | 3,184 | | | (82,352) | | | 128,255 | | | (11,011) | | | 300,945 | |
| Comprehensive income (loss): | Comprehensive income (loss): | | Comprehensive income (loss): | |
| Net income (loss) | Net income (loss) | 0 | | | 0 | | | (3,584) | | | 0 | | | 0 | | | (3,584) | | Net income (loss) | — | | | — | | | (3,573) | | | — | | | — | | | (3,573) | |
| Unrealized investment gains (losses), net | Unrealized investment gains (losses), net | 0 | | | 0 | | | 0 | | | (40,070) | | | 0 | | | (40,070) | | Unrealized investment gains (losses), net | — | | | — | | | — | | | (56,518) | | | — | | | (56,518) | |
| Total comprehensive income (loss) | Total comprehensive income (loss) | 0 | | | 0 | | | (3,584) | | | (40,070) | | | 0 | | | (43,654) | | Total comprehensive income (loss) | — | | | — | | | (3,573) | | | (56,518) | | | — | | | (60,091) | |
| Stock-based compensation | Stock-based compensation | (53) | | | 0 | | | 0 | | | 0 | | | 0 | | | (53) | | Stock-based compensation | (14) | | | — | | | — | | | — | | | — | | | (14) | |
| Balance at March 31, 2020 | $ | 261,462 | | | 3,184 | | | (74,948) | | | 37,047 | | | (11,011) | | | 215,734 | | |
| Balance at March 31, 2021 | | Balance at March 31, 2021 | $ | 262,855 | | | 3,184 | | | (85,925) | | | 71,737 | | | (11,011) | | | 240,840 | |
|
See accompanying Notes to Consolidated Financial Statements.
March 31, 20212022 | 10-Q 5
CITIZENS, INC. AND CONSOLIDATED SUBSIDIARIES
Consolidated Statements of Cash Flows
(Unaudited)
| Three Months Ended March 31, (In thousands) | Three Months Ended March 31, (In thousands) | 2021 | | 2020 | Three Months Ended March 31, (In thousands) | 2022 | | 2021 |
| Cash flows from operating activities: | Cash flows from operating activities: | | | Cash flows from operating activities: | | |
| Net income (loss) | Net income (loss) | $ | (3,573) | | | (3,584) | | Net income (loss) | $ | (1,333) | | | (3,573) | |
| Adjustments to reconcile net gain (loss) to net cash provided by operating activities: | | | | |
| Realized investment (gains) losses on sale of investments and other assets | (292) | | | 1,306 | | |
| Adjustments to reconcile net income (loss) to net cash provided by operating activities: | | Adjustments to reconcile net income (loss) to net cash provided by operating activities: | | | |
| Investment related (gains) losses on sale of investments and other assets | | Investment related (gains) losses on sale of investments and other assets | 582 | | | (292) | |
| Net deferred policy acquisition costs | Net deferred policy acquisition costs | 1,198 | | | 1,110 | | Net deferred policy acquisition costs | 1,036 | | | 1,198 | |
| Amortization of cost of insurance acquired | Amortization of cost of insurance acquired | 367 | | | 368 | | Amortization of cost of insurance acquired | 236 | | | 367 | |
| Depreciation | Depreciation | 308 | | | 70 | | Depreciation | 153 | | | 308 | |
| Amortization of premiums and discounts on investments | Amortization of premiums and discounts on investments | 1,323 | | | 2,393 | | Amortization of premiums and discounts on investments | 1,386 | | | 1,323 | |
| Stock-based compensation | Stock-based compensation | 76 | | | 193 | | Stock-based compensation | 132 | | | 76 | |
| Deferred federal income tax expense (benefit) | Deferred federal income tax expense (benefit) | (432) | | | (280) | | Deferred federal income tax expense (benefit) | 187 | | | (432) | |
| Change in: | Change in: | | | | Change in: | | | |
| Accrued investment income | Accrued investment income | 275 | | | 348 | | Accrued investment income | 442 | | | 275 | |
| Reinsurance recoverable | Reinsurance recoverable | 1,410 | | | 444 | | Reinsurance recoverable | 1,965 | | | 1,410 | |
| Due premiums | Due premiums | 1,771 | | | 1,045 | | Due premiums | 1,777 | | | 1,771 | |
| Future policy benefit reserves | Future policy benefit reserves | 5,185 | | | 9,414 | | Future policy benefit reserves | 6,494 | | | 5,185 | |
| Other policyholders' liabilities | Other policyholders' liabilities | 4,528 | | | 2,318 | | Other policyholders' liabilities | (2,406) | | | 4,528 | |
| Federal income tax payable | Federal income tax payable | 1,257 | | | 1,850 | | Federal income tax payable | 172 | | | 1,257 | |
| Commissions payable and other liabilities | Commissions payable and other liabilities | (11,317) | | | (2,865) | | Commissions payable and other liabilities | 1,489 | | | (11,317) | |
| Other, net | Other, net | (275) | | | (37) | | Other, net | (172) | | | (275) | |
| Net cash provided by (used in) operating activities | Net cash provided by (used in) operating activities | 1,809 | | | 14,093 | | Net cash provided by (used in) operating activities | 12,140 | | | 1,809 | |
| Cash flows from investing activities: | Cash flows from investing activities: | | | | Cash flows from investing activities: | | | |
| Purchases of fixed maturity securities, available-for-sale | Purchases of fixed maturity securities, available-for-sale | (37,294) | | | (65,714) | | Purchases of fixed maturity securities, available-for-sale | (26,050) | | | (37,294) | |
| Sales of fixed maturity securities, available-for-sale | Sales of fixed maturity securities, available-for-sale | 4,445 | | | 940 | | Sales of fixed maturity securities, available-for-sale | 1,100 | | | 4,445 | |
| Maturities and calls of fixed maturity securities, available-for-sale | Maturities and calls of fixed maturity securities, available-for-sale | 14,376 | | | 44,612 | | Maturities and calls of fixed maturity securities, available-for-sale | 10,435 | | | 14,376 | |
| Purchases of equity securities | 0 | | | (4,473) | | |
| | Principal payments on mortgage loans | Principal payments on mortgage loans | 4 | | | 4 | | Principal payments on mortgage loans | 2 | | | 4 | |
| | (Increase) decrease in policy loans, net | (Increase) decrease in policy loans, net | 644 | | | 676 | | (Increase) decrease in policy loans, net | 962 | | | 644 | |
| Sales of other long-term investments and real estate | 15,089 | | | 0 | | |
| Sales of other long-term investments | | Sales of other long-term investments | 1,681 | | | 15,089 | |
| Purchases of other long-term investments | Purchases of other long-term investments | (4,619) | | | (2,810) | | Purchases of other long-term investments | (7,940) | | | (4,619) | |
| | Purchases of property and equipment | Purchases of property and equipment | (15) | | | (5) | | Purchases of property and equipment | (34) | | | (15) | |
| Maturities of short-term investments | 0 | | | 650 | | |
| | Purchases of short-term investments | Purchases of short-term investments | 0 | | | (45) | | Purchases of short-term investments | (5) | | | — | |
| | Net cash provided by (used in) investing activities | Net cash provided by (used in) investing activities | (7,370) | | | (26,165) | | Net cash provided by (used in) investing activities | (19,849) | | | (7,370) | |
| | See accompanying Notes to Consolidated Financial Statements. | See accompanying Notes to Consolidated Financial Statements. | See accompanying Notes to Consolidated Financial Statements. |
|
March 31, 20212022 | 10-Q 6
| | CITIZENS, INC. AND CONSOLIDATED SUBSIDIARIES | CITIZENS, INC. AND CONSOLIDATED SUBSIDIARIES | CITIZENS, INC. AND CONSOLIDATED SUBSIDIARIES |
| Consolidated Statements of Cash Flows, Continued | Consolidated Statements of Cash Flows, Continued | Consolidated Statements of Cash Flows, Continued |
| (Unaudited) | (Unaudited) | (Unaudited) |
| Three Months Ended March 31, (In thousands) | Three Months Ended March 31, (In thousands) | 2021 | | 2020 | Three Months Ended March 31, (In thousands) | 2022 | | 2021 |
| Cash flows from financing activities: | Cash flows from financing activities: | | | | Cash flows from financing activities: | | | |
| Annuity deposits | Annuity deposits | $ | 2,431 | | | 1,618 | | Annuity deposits | $ | 2,227 | | | 2,431 | |
| Annuity withdrawals | Annuity withdrawals | (2,329) | | | (561) | | Annuity withdrawals | (2,263) | | | (2,329) | |
| Purchase of treasury stock | (9,090) | | | 0 | | |
| Acquisition of treasury stock | | Acquisition of treasury stock | — | | | (9,090) | |
| Issuance of common stock | | Issuance of common stock | 1,788 | | | — | |
| Other | Other | (89) | | | (246) | | Other | (39) | | | (89) | |
| Net cash provided by (used in) financing activities | Net cash provided by (used in) financing activities | (9,077) | | | 811 | | Net cash provided by (used in) financing activities | 1,713 | | | (9,077) | |
| Net increase (decrease) in cash and cash equivalents | Net increase (decrease) in cash and cash equivalents | (14,638) | | | (11,261) | | Net increase (decrease) in cash and cash equivalents | (5,996) | | | (14,638) | |
| Cash and cash equivalents at beginning of year | Cash and cash equivalents at beginning of year | 34,131 | | | 46,205 | | Cash and cash equivalents at beginning of year | 27,294 | | | 34,131 | |
| Cash and cash equivalents at end of period | Cash and cash equivalents at end of period | $ | 19,493 | | | 34,944 | | Cash and cash equivalents at end of period | $ | 21,298 | | | 19,493 | |
| |
SUPPLEMENTAL DISCLOSURES OF NONCASH INVESTING AND FINANCING ACTIVITIES:
During the three months ended March 31, 20212022 and 2020,2021, various fixed maturity issuers exchanged securities with book values of $2.0$0.6 million and $3.1$2.0 million, respectively, for securities of equal value.
The Company had $3.8 million net unsettled security trades at March 31, 2022 and $0.7 million at March 31, 2021.
The Company accrued purchases of property and equipment of $0.8 million as of March 31, 2021 which is reflected in other liabilities on the consolidated Balance Sheets and recorded NaNnone as of March 31, 2020.2022.
The Company had $0.7recognized right-of-use assets of $0.4 million net unsettled security trades atin exchange for new operating lease liabilities during the three months ended March 31, 20212022 and $3.4 million atnone during the three months ended March 31, 2020.2021.
See accompanying Notes to Consolidated Financial Statements.
March 31, 20212022 | 10-Q 7
| | | | | | | | |
CITIZENS, INC. | NOTES TO CONSOLIDATED FINANCIAL STATEMENTS |
| | (Unaudited) |
(1) FINANCIAL STATEMENTS
BASIS OF PRESENTATION AND CONSOLIDATION
The consolidated financial statements include the accounts and operations of Citizens, Inc. ("Citizens" or the "Company"), a Colorado corporation, and its wholly-owned subsidiaries, CICA Life Insurance Company of America ("CICA"), CICA Life Ltd. ("CICA Ltd."International"), Citizens National Life Insurance Company ("CNLIC"), Security Plan Life Insurance Company ("SPLIC"), Security Plan Fire Insurance Company ("SPFIC"), Magnolia Guaranty Life Insurance Company ("MGLIC") and Computing Technology, Inc. ("CTI"). All significant inter-company accounts and interactionstransactions have been eliminated. Citizens and its wholly-owned subsidiaries are collectively referred to as the "Company", "it", "we", "us" or "our".
The consolidated balance sheetssheet as of March 31, 2021 and2022, the consolidated statements of operations and comprehensive income (loss), and stockholders' equity for the three months ended March 31, 2022 and March 31, 2021 and the consolidated statements of cash flows for the three months ended March 31, 20212022 and March 31, 20202021 have been prepared by the Company without audit and are not subject to audit. In the opinion of management, all normal and recurring adjustments to present fairly the financial position, results of operations, and changes in cash flows at March 31, 20212022 and for comparative periods have been made. The consolidated financial statements have been prepared in accordance with U.S. generally accepted accounting principles ("U.S. GAAP") for interim financial information and with the instructions to Form 10-Q adopted by the Securities and Exchange Commission ("SEC"). Accordingly, the consolidated financial statements do not include all the information and footnotes required for complete financial statements and should be read in conjunction with the Company’s consolidated financial statements and notes thereto included in our Annual Report on Form 10-K for the year ended December 31, 20202021 ("Form 10-K"). Operating results for the interim periods disclosed herein are not necessarily indicative of the results that may be expected for a full year or any future period.
Our Life Insurance segment operates through CICA Ltd.,International, CICA and CNLIC. Our international life insurance business, which operates through CICA Ltd.,International, issues U.S. dollar-denominated endowment contracts internationally, which are principally accumulation contracts that incorporate an element of life insurance protection and ordinary whole life insurance in U.S. dollar-denominated amounts sold to non-U.S. residents. These contracts are designed to provide a fixed amount of insurance coverage over the life of the insured and may utilize rider benefits to provide additional increasing or decreasing coverage and annuity benefits to enhance accumulations. Our domestic life insurance business which operates through CICA and CNLIC. CICA issues credit life and disability policies and CNLIC issues ordinary whole life policies mainly in Texas and Florida and services whole life and accident and health policies primarily focused on living needs and provided benefits toward accumulating financial benefits forin the policyowners throughout theSouthern U.S., Midwest and southern U.S. until they ceased most domestic sales beginning January 1, 2017. We have recently developed a whole life insurance product and have begun selling this product in Florida in 2021.Mountain West.
Our Home Service Insurance segment operates through our subsidiaries SPLIC, MGLIC and SPFIC, and focuses on the life insurance needs of the middle- and lower-income markets, primarily in Louisiana, Mississippi and Arkansas. Our products in this segment consist primarily of small face amount ordinary whole life, industrial life and pre-need policies, which are designed to fund final expenses for the insured, primarily consisting of funeral and burial costs as well as limited liability, named peril property insurance policies, coveringwhich cover dwelling and contents.
CTI provides data processing systems and services to the Company.
USE OF ESTIMATES
The preparation of consolidated financial statements in conformity with U.S. GAAP requires management to make estimates and assumptions that affect the reported amounts of assets and liabilities and the disclosure of contingent assets and liabilities at the date of the consolidated financial statements and the reported amounts of revenues and expenses during the reporting period. Actual results could differ from those estimates.
March 31, 20212022 | 10-Q 8
| | | | | | | | |
CITIZENS, INC. | NOTES TO CONSOLIDATED FINANCIAL STATEMENTS |
| | (Unaudited) |
Significant estimates include those used in the evaluation of credit allowances on fixed maturity securities, actuarially determined assets and liabilities and assumptions tests of goodwill impairment and valuation allowance on deferred tax assets. Certain of these estimates are particularly sensitive to market conditions, and deterioration and/or volatility in the worldwide debt or equity markets could have a material impact on the consolidated financial statements.
SIGNIFICANT ACCOUNTING POLICIES
For a description of our significant accounting policies, see Part IV, Item 15, Note 1. Summary of Significant Accounting Policies in the notes to our consolidated financial statements included in our Form 10-K, which should be read in conjunction with these accompanying consolidated financial statements.
(2) ACCOUNTING PRONOUNCEMENTS
ACCOUNTING STANDARDS RECENTLYNOT YET ADOPTED
In June 2016,August 2018, the Financial Accounting Standards Board ("FASB") issued Accounting Standards Update ("ASU") No. 2016-13, Financial Instruments-Credit Losses (Topic 326), with the main objective to provide financial statement users with more decision-useful information about the expected credit losses on financial instruments and other commitments to extend credit held by a reporting entity at each reporting date. The ASU requires a financial asset (or a group of financial assets) measured at amortized cost to be presented at the net amount expected to be collected. The allowance for credit losses is a valuation account that is deducted from the amortized cost of the financial asset(s) to present the net carrying value at the amount expected to be collected on the financial asset. The income statement reflects the measurement of credit losses for newly recognized financial assets, as well as the increases or decreases of expected credit losses that have taken place during the period. Credit losses on available-for-sale ("AFS") fixed maturity securities should be measured in a manner similar to current U.S. GAAP; however, the credit losses are recorded through an allowance for credit losses rather than as a write-down. This approach is an improvement to prior U.S. GAAP because an entity will be able to record reversals of credit losses (in situations in which the estimate of credit losses declines) in current period net income, which in turn should align the income statement recognition of credit losses with the reporting period in which changes occur. Prior U.S. GAAP prohibited reflecting those improvements in current-period earnings. The Company adopted this standard effective January 1, 2020 using the modified retrospective approach. The adoption resulted in an increase in accumulated deficit of $0.4 million related to agents' debit balance collectability.
ACCOUNTING STANDARDS NOT YET ADOPTED
In August 2018, the FASB issued ASU No. 2018-12, Financial Services-Insurance (Topic 944): Targeted Improvements to the Accounting for Long-Duration Contracts. This ASU amends four key areas of the accounting and impacts disclosures for long-duration insurance and investment contracts:
•Requires updated assumptions for liability measurement. Assumptions used to measure the liability for traditional insurance contracts, which are typically determined at contract inception, will now be reviewed at least annually, and, if there is a change, updated, with the effect recorded in net income;
•Standardizes the liability discount rate. The liability discount rate will be a market-observable discount rate (upper-medium grade fixed-income instrument yield), with the effect of rate changes recorded in other comprehensive income;
•Provides greater consistency in measurement of market risk benefits. The two previous measurement models have been reduced to one measurement model (fair value), resulting in greater uniformity across similar market-based benefits and better alignment with the fair value measurement of derivatives used to hedge capital market risk;
•Simplifies amortization of deferred acquisition costs ("DAC"). Previous earnings-based amortization methods have been replaced with a more level amortization basis; and
•Requires enhanced disclosures. The new disclosures include rollforwards and information about significant assumptions and the effects of changes in those assumptions.
For calendar-year public companies, the changes will be effective on January 1, 2023, however, early adoption is permitted. We will adopt this ASU effective January 1, 2023 with a transition date of January 1, 2021 using a modified retrospective approach. We continue to make progress in our implementation process that includes, but is not limited to, making significant accounting policy decisions, employing appropriate internal controls, building and updating actuarial models and systems, revising reporting processes and developing informative qualitative and quantitative disclosures. In 2022, we will begin the process of calculating our transition adjustments and preparing for the restatement of applicable periods. We are currently evaluating the impact of adopting this ASU on our consolidated financial condition and results of operations and will be able to better assess the effects as we progress with our implementation efforts. While it is not possible to estimate the expected impact of adoption at this time, the Company believes there is a reasonable possibility that implementation this ASU may result in a material impact to accumulated other comprehensive income and future earnings patterns.
No other new accounting pronouncements issued or effective during the year had, or is expected to have, a material impact on our consolidated financial statements.
March 31, 20212022 | 10-Q 9
| | | | | | | | |
CITIZENS, INC. | NOTES TO CONSOLIDATED FINANCIAL STATEMENTS |
| | (Unaudited) |
•Requires enhanced disclosures. The new disclosures include rollforwards and information about significant assumptions and the effects of changes in those assumptions.
For calendar-year public companies, the changes will be effective on January 1, 2023, however, early adoption is permitted. The Company is evaluating the impact of this new guidance, and it is expected to have a material impact on our consolidated financial statements.
No other new accounting pronouncement issued or effective during the year had, or is expected to have, a material impact on our consolidated financial statements.
(3) SEGMENT INFORMATION
The Company has 2 reportable segments: Life Insurance and Home Service Insurance.
Our Life Insurance segment primarily issues endowment contracts, which are principally accumulation contracts that incorporate an element of life insurance protection and ordinary whole life insurance, to non-U.S. residents through CICA Ltd.International These contracts are designed to provide a fixed amount of insurance coverage over the life of the insured and may utilize rider benefits to provide additional coverage and annuity benefits to enhance accumulations. CICA and CNLIC issued ordinary whole-life,issues credit life and disability and accident and health related policies throughout the Midwest and southern U.S. until they ceased most domestic sales beginning January 1, 2017. We restarted domestic salesCNLIC issues ordinary whole life in Florida in 2021.Florida.
Our domestic Home Service Insurance segment operates through our subsidiaries SPLIC, MGLIC and SPFIC, and focuses on the life insurance needs of the middle- and lower-income markets, primarily in Louisiana, Mississippi and Arkansas. Our policies are sold and serviced through funeral homes and independent agents who sell policies, collect premiums and service policyholders. To a lesser extent, ourOur Home Service Insurance segment also sells limited liability, named peril property insurance policies covering dwellingin Louisiana and contents.Arkansas.
The Life Insurance and Home Service Insurance portions of the company constitute separate businesses. The Company also operates other non-insurance portions of the Company ("Other Non-Insurance Enterprises"), which primarily include the Company’s IT and Corporate-supportcorporate-support functions that are included in the tables presented.presented below to properly reconcile the segment information with the consolidated financial statements of the Company. The Company's Other Non-Insurance Enterprises are the only reportable difference between segments and consolidated operations.
The accounting policies of the reportable segments and Other Non-Insurance Enterprises are presented in accordance with U.S. GAAP and are the same as those used in the preparation of the consolidated financial statements. The Company evaluates profit and loss performance based on U.S. GAAP income or loss before federal income taxes for its 2 reportable segments.
March 31, 20212022 | 10-Q 10
| | | | | | | | |
CITIZENS, INC. | NOTES TO CONSOLIDATED FINANCIAL STATEMENTS |
| | (Unaudited) |
| | | | | | | | | | | | | | | | | | | | | | | |
| Life Insurance | | Home Service Insurance | | Other Non-Insurance Enterprises | | Consolidated |
| Three Months Ended March 31, 2021 | | | |
| (In thousands) | | | |
| | | | | | | |
| Revenues: | | | | | | | |
| Premiums | $ | 27,063 | | | 11,969 | | | 0 | | | 39,032 | |
| Net investment income | 11,598 | | | 3,345 | | | 301 | | | 15,244 | |
| Realized investment gains (losses), net | (108) | | | 223 | | | 177 | | | 292 | |
| Other income | 913 | | | 2 | | | 0 | | | 915 | |
| Total revenues | 39,466 | | | 15,539 | | | 478 | | | 55,483 | |
| Benefits and expenses: | | | | | | | |
| Insurance benefits paid or provided: | | | | | | | |
| Claims and surrenders | 23,270 | | | 7,319 | | | 0 | | | 30,589 | |
| Increase in future policy benefit reserves | 3,658 | | | 1,574 | | | 0 | | | 5,232 | |
| Policyholders' dividends | 1,296 | | | 10 | | | 0 | | | 1,306 | |
| Total insurance benefits paid or provided | 28,224 | | | 8,903 | | | 0 | | | 37,127 | |
| Commissions | 4,231 | | | 3,926 | | | 0 | | | 8,157 | |
| Other general expenses | 5,226 | | | 3,794 | | | 2,362 | | | 11,382 | |
| Capitalization of deferred policy acquisition costs | (3,561) | | | (1,424) | | | 0 | | | (4,985) | |
| Amortization of deferred policy acquisition costs | 5,348 | | | 835 | | | 0 | | | 6,183 | |
| Amortization of cost of insurance acquired | 104 | | | 263 | | | 0 | | | 367 | |
| Total benefits and expenses | 39,572 | | | 16,297 | | | 2,362 | | | 58,231 | |
| Loss before federal income tax expense | $ | (106) | | | (758) | | | (1,884) | | | (2,748) | |
| | | | | | | | | | | | | | | | | | | | | | | |
| Life Insurance | | Home Service Insurance | | Other Non-Insurance Enterprises | | Consolidated |
| Three Months Ended March 31, 2022 | | | |
| (In thousands) | | | |
| | | | | | | |
| Revenues: | | | | | | | |
| Premiums | $ | 26,931 | | | 12,433 | | | — | | | 39,364 | |
| Net investment income | 11,971 | | | 3,244 | | | 272 | | | 15,487 | |
| Investment related gains (losses), net | (293) | | | (242) | | | (47) | | | (582) | |
| Other income | 1,088 | | | — | | | — | | | 1,088 | |
| Total revenues | 39,697 | | | 15,435 | | | 225 | | | 55,357 | |
| Benefits and expenses: | | | | | | | |
| Insurance benefits paid or provided: | | | | | | | |
| Claims and surrenders | 21,458 | | | 6,976 | | | — | | | 28,434 | |
| Increase in future policy benefit reserves | 5,130 | | | 1,439 | | | — | | | 6,569 | |
| Policyholders' dividends | 1,350 | | | 3 | | | — | | | 1,353 | |
| Total insurance benefits paid or provided | 27,938 | | | 8,418 | | | — | | | 36,356 | |
| Commissions | 3,806 | | | 3,867 | | | — | | | 7,673 | |
| Other general expenses | 5,691 | | | 4,350 | | | 989 | | | 11,030 | |
| Capitalization of deferred policy acquisition costs | (3,306) | | | (1,475) | | | — | | | (4,781) | |
| Amortization of deferred policy acquisition costs | 4,482 | | | 1,335 | | | — | | | 5,817 | |
| Amortization of cost of insurance acquired | 56 | | | 180 | | | — | | | 236 | |
| Total benefits and expenses | 38,667 | | | 16,675 | | | 989 | | | 56,331 | |
| Income (loss) before federal income tax expense | $ | 1,030 | | | (1,240) | | | (764) | | | (974) | |
March 31, 20212022 | 10-Q 11
| | | | | | | | |
CITIZENS, INC. | NOTES TO CONSOLIDATED FINANCIAL STATEMENTS |
| | (Unaudited) |
| | | Life Insurance | | Home Service Insurance | | Other Non-Insurance Enterprises | | Consolidated | | Life Insurance | | Home Service Insurance | | Other Non-Insurance Enterprises | | Consolidated |
| Three Months Ended March 31, 2020 | | |
| Three Months Ended March 31, 2021 | | Three Months Ended March 31, 2021 | |
| (In thousands) | (In thousands) | Life Insurance | | Home Service Insurance | | Other Non-Insurance Enterprises | | Consolidated | (In thousands) | Life Insurance | | Home Service Insurance | | Other Non-Insurance Enterprises | | Consolidated |
| | Revenues: | Revenues: | | Revenues: | |
| Premiums | Premiums | $ | 29,819 | | | 11,498 | | | 0 | | | 41,317 | | Premiums | $ | 27,063 | | | 11,969 | | | — | | | 39,032 | |
| Net investment income | Net investment income | 11,480 | | | 3,332 | | | 357 | | | 15,169 | | Net investment income | 11,598 | | | 3,345 | | | 301 | | | 15,244 | |
| Realized investment gains (losses), net | 735 | | | (1,717) | | | (324) | | | (1,306) | | |
| Investment related gains (losses), net | | Investment related gains (losses), net | (108) | | | 223 | | | 177 | | | 292 | |
| Other income | Other income | 524 | | | 18 | | | 0 | | | 542 | | Other income | 913 | | | 2 | | | — | | | 915 | |
| Total revenues | Total revenues | 42,558 | | | 13,131 | | | 33 | | | 55,722 | | Total revenues | 39,466 | | | 15,539 | | | 478 | | | 55,483 | |
| Benefits and expenses: | Benefits and expenses: | | | | | | | | Benefits and expenses: | | | | | | | |
| Insurance benefits paid or provided: | Insurance benefits paid or provided: | | | | | | | | Insurance benefits paid or provided: | | | | | | | |
| Claims and surrenders | Claims and surrenders | 20,160 | | | 6,289 | | | 0 | | | 26,449 | | Claims and surrenders | 23,270 | | | 7,319 | | | — | | | 30,589 | |
| Increase in future policy benefit reserves | Increase in future policy benefit reserves | 8,146 | | | 1,325 | | | 0 | | | 9,471 | | Increase in future policy benefit reserves | 3,658 | | | 1,574 | | | — | | | 5,232 | |
| Policyholders' dividends | Policyholders' dividends | 1,225 | | | 8 | | | 0 | | | 1,233 | | Policyholders' dividends | 1,296 | | | 10 | | | — | | | 1,306 | |
| Total insurance benefits paid or provided | Total insurance benefits paid or provided | 29,531 | | | 7,622 | | | 0 | | | 37,153 | | Total insurance benefits paid or provided | 28,224 | | | 8,903 | | | — | | | 37,127 | |
| Commissions | Commissions | 4,478 | | | 3,375 | | | 0 | | | 7,853 | | Commissions | 4,231 | | | 3,926 | | | — | | | 8,157 | |
| Other general expenses | Other general expenses | 4,948 | | | 4,316 | | | 2,209 | | | 11,473 | | Other general expenses | 5,226 | | | 3,794 | | | 2,362 | | | 11,382 | |
| Capitalization of deferred policy acquisition costs | Capitalization of deferred policy acquisition costs | (3,921) | | | (1,088) | | | 0 | | | (5,009) | | Capitalization of deferred policy acquisition costs | (3,561) | | | (1,424) | | | — | | | (4,985) | |
| Amortization of deferred policy acquisition costs | Amortization of deferred policy acquisition costs | 5,318 | | | 801 | | | 0 | | | 6,119 | | Amortization of deferred policy acquisition costs | 5,348 | | | 835 | | | — | | | 6,183 | |
| Amortization of cost of insurance acquired | Amortization of cost of insurance acquired | 118 | | | 250 | | | 0 | | | 368 | | Amortization of cost of insurance acquired | 104 | | | 263 | | | — | | | 367 | |
| Total benefits and expenses | Total benefits and expenses | 40,472 | | | 15,276 | | | 2,209 | | | 57,957 | | Total benefits and expenses | 39,572 | | | 16,297 | | | 2,362 | | | 58,231 | |
| Income (loss) before federal income tax expense | Income (loss) before federal income tax expense | $ | 2,086 | | | (2,145) | | | (2,176) | | | (2,235) | | Income (loss) before federal income tax expense | $ | (106) | | | (758) | | | (1,884) | | | (2,748) | |
March 31, 20212022 | 10-Q 12
| | | | | | | | |
CITIZENS, INC. | NOTES TO CONSOLIDATED FINANCIAL STATEMENTS |
| | (Unaudited) |
(4) STOCKHOLDERS' EQUITY AND RESTRICTIONS
STOCK
Our Restated and Amended Articles of Incorporation authorize the issuance of 127,000,000 shares, of which 100,000,000 shares shall be Class A common stock, 2,000,000 shares shall be Class B common stock, and 25,000,000 shall be preferred stock. The 2 authorized classes of common stock are equal in all respects, except (a) each share of Class A common stock is entitled to receive twice the cash dividends paid on a per share basis to the Class B common stock, if any; and (b) the holders of the Class B common stock have the exclusive right to elect a simple majority of the board of Directors of Citizens. In April 2021, we repurchased all of the outstanding Class B common stock, which is now classified as treasury stock. As a result, all of the directors are elected by the holders of the Class A common stock. Citizens has never issued any preferred stock.
EARNINGS PER SHARE
The following tables set forth the computation of basic and diluted earnings (loss) per share.
| | Three Months Ended March 31, | Three Months Ended March 31, | 2021 | | 2020 | Three Months Ended March 31, | 2022 | | 2021 |
| (In thousands, except per share amounts) | (In thousands, except per share amounts) | | (In thousands, except per share amounts) | |
| Basic and diluted earnings (loss) per share: | Basic and diluted earnings (loss) per share: | | Basic and diluted earnings (loss) per share: | |
| Numerator: | Numerator: | | Numerator: | |
| Net income (loss) | Net income (loss) | $ | (3,573) | | | (3,584) | | Net income (loss) | $ | (1,333) | | | (3,573) | |
| Net income (loss) allocated to Class A common stock | Net income (loss) allocated to Class A common stock | $ | (3,537) | | | (3,548) | | Net income (loss) allocated to Class A common stock | $ | (1,333) | | | (3,537) | |
| Net income (loss) allocated to Class B common stock | Net income (loss) allocated to Class B common stock | (36) | | | (36) | | Net income (loss) allocated to Class B common stock | — | | | (36) | |
| Net income (loss) | Net income (loss) | $ | (3,573) | | | (3,584) | | Net income (loss) | $ | (1,333) | | | (3,573) | |
| | Denominator: | Denominator: | | Denominator: | |
| Weighted average shares of Class A outstanding - basic | Weighted average shares of Class A outstanding - basic | 49,549 | | | 49,305 | | Weighted average shares of Class A outstanding - basic | 50,236 | | | 49,549 | |
| Weighted average shares of Class A outstanding - diluted | Weighted average shares of Class A outstanding - diluted | 50,116 | | | 49,455 | | Weighted average shares of Class A outstanding - diluted | 50,906 | | | 50,116 | |
| Weighted average shares of Class B outstanding - basic and diluted | Weighted average shares of Class B outstanding - basic and diluted | 1,002 | | | 1,002 | | Weighted average shares of Class B outstanding - basic and diluted | — | | | 1,002 | |
| Basic and diluted earnings (loss) per share of Class A common stock | Basic and diluted earnings (loss) per share of Class A common stock | $ | (0.07) | | | (0.07) | | Basic and diluted earnings (loss) per share of Class A common stock | $ | (0.03) | | | (0.07) | |
| Basic and diluted earnings (loss) per share of Class B common stock | Basic and diluted earnings (loss) per share of Class B common stock | (0.04) | | | (0.04) | | Basic and diluted earnings (loss) per share of Class B common stock | — | | | (0.04) | |
CAPITAL AND SURPLUS
Each of our regulated insurance subsidiaries is required to meet stipulated regulatory capital requirements. These include capital requirements imposed by the U.S. National Association of Insurance Commissioners ("NAIC") and the Bermuda Monetary Authority ("BMA"). All insurance subsidiaries exceeded the minimum capital requirements at March 31, 2021.2022.
In order to minimize the risk of a shortfall in capital arising from an unexpected adverse deviation or excess risk, the BMA has established a threshold capital level (termed the Target Capital Level ("TCL")), which is set at 120% of a company’s enhanced capital requirement. The TCL serves as an early warning tool for the BMA. As of March 31, 2021,2022, CICA Ltd.International was above the TCL threshold. At the request of the BMA, on April 15, 2021, Citizens and CICA Ltd.International entered into a Keep Well Agreement. The Keep Well Agreement requires Citizens to contribute up to $10 million in capital to CICA Ltd.International as necessary to ensure that CICA Ltd.International has a minimum capital level of 120% (equal to the TCL). Since CICA Ltd.’sInternational’s capital level currently exceeds 120%, Citizens is not currently required to make a capital contribution.
March 31, 20212022 | 10-Q 13
| | | | | | | | |
CITIZENS, INC. | NOTES TO CONSOLIDATED FINANCIAL STATEMENTS |
| | (Unaudited) |
(5) INVESTMENTS
The Company invests primarily in fixed maturity securities, which totaled 90.8%88.4% of total cash and invested assets at March 31, 2021,2022, as shown below.
| Carrying Value (In thousands, except for %) | Carrying Value (In thousands, except for %) | March 31, 2021 | | December 31, 2020 | Carrying Value (In thousands, except for %) | March 31, 2022 | | December 31, 2021 |
| Amount | | % | | Amount | | % | Amount | | % | | Amount | | % |
| | Cash and invested assets: | Cash and invested assets: | | Cash and invested assets: | |
| Fixed maturity securities | Fixed maturity securities | $ | 1,420,587 | | | 90.8 | % | | 1,489,383 | | | 89.8 | % | Fixed maturity securities | $ | 1,355,410 | | | 88.4 | % | | 1,470,617 | | | 89.0 | % |
| Equity securities | Equity securities | 22,366 | | | 1.4 | % | | 22,102 | | | 1.3 | % | Equity securities | 13,902 | | | 0.9 | % | | 14,844 | | | 0.9 | % |
| Policy loans | Policy loans | 82,674 | | | 5.3 | % | | 83,318 | | | 5.0 | % | Policy loans | 79,345 | | | 5.2 | % | | 80,307 | | | 4.9 | % |
| Real estate and other long-term investments | 19,918 | | | 1.3 | % | | 29,865 | | | 1.8 | % | |
| Other long-term investments | | Other long-term investments | 63,927 | | | 4.2 | % | | 57,399 | | | 3.5 | % |
| | Cash and cash equivalents | Cash and cash equivalents | 19,493 | | | 1.2 | % | | 34,131 | | | 2.1 | % | Cash and cash equivalents | 21,298 | | | 1.3 | % | | 27,294 | | | 1.7 | % |
| | Total cash and invested assets | Total cash and invested assets | $ | 1,565,038 | | | 100.0 | % | | 1,658,799 | | | 100.0 | % | Total cash and invested assets | $ | 1,533,882 | | | 100.0 | % | | 1,650,461 | | | 100.0 | % |
The following tables represent the amortized cost, gross unrealized gains and losses and fair value of fixed maturity securities as of the dates indicated.
| | | Amortized
Cost | | Gross
Unrealized
Gains | | Gross
Unrealized
Losses | | Fair
Value | | Amortized
Cost | | Gross
Unrealized
Gains | | Gross
Unrealized
Losses | | Fair
Value |
| March 31, 2021 | | |
| March 31, 2022 | | March 31, 2022 | |
| (In thousands) | (In thousands) | Amortized
Cost | | Gross
Unrealized
Gains | | Gross
Unrealized
Losses | | Fair
Value | (In thousands) | Amortized
Cost | | Gross
Unrealized
Gains | | Gross
Unrealized
Losses | | Fair
Value |
| | Fixed maturity securities: | Fixed maturity securities: | | Fixed maturity securities: | |
| Available-for-sale: | Available-for-sale: | | | | | | | | Available-for-sale: | | | | | | | |
| U.S. Treasury securities | U.S. Treasury securities | $ | 9,508 | | | 1,513 | | | 0 | | | 11,021 | | U.S. Treasury securities | $ | 9,494 | | | 681 | | | 5 | | | 10,170 | |
| U.S. Government-sponsored enterprises | U.S. Government-sponsored enterprises | 3,483 | | | 1,034 | | | 0 | | | 4,517 | | U.S. Government-sponsored enterprises | 3,456 | | | 693 | | | — | | | 4,149 | |
| States and political subdivisions | States and political subdivisions | 370,995 | | | 24,819 | | | 1,955 | | | 393,859 | | States and political subdivisions | 354,513 | | | 13,363 | | | 9,481 | | | 358,395 | |
| Corporate: | Corporate: | | Corporate: | |
| Financial | Financial | 207,547 | | | 15,269 | | | 1,621 | | | 221,195 | | Financial | 220,033 | | | 4,394 | | | 9,036 | | | 215,391 | |
| Consumer | Consumer | 204,988 | | | 16,745 | | | 3,034 | | | 218,699 | | Consumer | 227,963 | | | 7,180 | | | 12,375 | | | 222,768 | |
| Energy | Energy | 79,422 | | | 4,904 | | | 1,092 | | | 83,234 | | Energy | 76,884 | | | 1,684 | | | 1,905 | | | 76,663 | |
| All Other | 294,528 | | | 21,395 | | | 4,261 | | | 311,662 | | |
| All other | | All other | 305,831 | | | 7,191 | | | 13,714 | | | 299,308 | |
| | Residential mortgage-backed | Residential mortgage-backed | 118,186 | | | 14,006 | | | 46 | | | 132,146 | | Residential mortgage-backed | 117,848 | | | 5,549 | | | 235 | | | 123,162 | |
| Asset-backed | Asset-backed | 43,874 | | | 327 | | | 63 | | | 44,138 | | Asset-backed | 45,131 | | | 268 | | | 102 | | | 45,297 | |
| Foreign governments | Foreign governments | 101 | | | 15 | | | 0 | | | 116 | | Foreign governments | 101 | | | 6 | | | — | | | 107 | |
| Total fixed maturity securities | Total fixed maturity securities | $ | 1,332,632 | | | 100,027 | | | 12,072 | | | 1,420,587 | | Total fixed maturity securities | $ | 1,361,254 | | | 41,009 | | | 46,853 | | | 1,355,410 | |
March 31, 20212022 | 10-Q 14
| | | | | | | | |
CITIZENS, INC. | NOTES TO CONSOLIDATED FINANCIAL STATEMENTS |
| | (Unaudited) |
| | | Amortized
Cost | | Gross
Unrealized
Gains | | Gross
Unrealized
Losses | | Fair
Value | | Amortized
Cost | | Gross
Unrealized
Gains | | Gross
Unrealized
Losses | | Fair
Value |
| December 31, 2020 | | |
| December 31, 2021 | | December 31, 2021 | |
| (In thousands) | (In thousands) | Amortized
Cost | | Gross
Unrealized
Gains | | Gross
Unrealized
Losses | | Fair
Value | (In thousands) | Amortized
Cost | | Gross
Unrealized
Gains | | Gross
Unrealized
Losses | | Fair
Value |
| | Fixed maturity securities: | Fixed maturity securities: | | Fixed maturity securities: | |
| Available-for-sale: | Available-for-sale: | | | | | | | | Available-for-sale: | | | | | | | |
| U.S. Treasury securities | U.S. Treasury securities | $ | 9,529 | | | 1,797 | | | 0 | | | 11,326 | | U.S. Treasury securities | $ | 9,515 | | | 1,097 | | | 1 | | | 10,611 | |
| U.S. Government-sponsored enterprises | U.S. Government-sponsored enterprises | 3,490 | | | 1,301 | | | 0 | | | 4,791 | | U.S. Government-sponsored enterprises | 3,463 | | | 996 | | | — | | | 4,459 | |
| States and political subdivisions | States and political subdivisions | 377,462 | | | 32,751 | | | 548 | | | 409,665 | | States and political subdivisions | 356,594 | | | 28,056 | | | 692 | | | 383,958 | |
| Corporate: | Corporate: | | Corporate: | |
| Financial | Financial | 204,160 | | | 31,000 | | | 13 | | | 235,147 | | Financial | 213,652 | | | 22,477 | | | 172 | | | 235,957 | |
| Consumer | Consumer | 196,648 | | | 30,116 | | | 245 | | | 226,519 | | Consumer | 219,223 | | | 23,658 | | | 900 | | | 241,981 | |
| Energy | Energy | 81,223 | | | 8,174 | | | 536 | | | 88,861 | | Energy | 76,989 | | | 7,334 | | | 68 | | | 84,255 | |
| All Other | 284,209 | | | 42,554 | | | 82 | | | 326,681 | | |
| Commercial mortgage-backed | 225 | | | 0 | | | 4 | | | 221 | | |
| All other | | All other | 302,141 | | | 29,855 | | | 1,181 | | | 330,815 | |
| | Residential mortgage-backed | Residential mortgage-backed | 118,144 | | | 21,819 | | | 0 | | | 139,963 | | Residential mortgage-backed | 117,755 | | | 16,046 | | | 6 | | | 133,795 | |
| Asset-backed | Asset-backed | 46,295 | | | 278 | | | 482 | | | 46,091 | | Asset-backed | 44,322 | | | 368 | | | 14 | | | 44,676 | |
| Foreign governments | Foreign governments | 102 | | | 16 | | | 0 | | | 118 | | Foreign governments | 101 | | | 9 | | | — | | | 110 | |
| Total fixed maturity securities | Total fixed maturity securities | $ | 1,321,487 | | | 169,806 | | | 1,910 | | | 1,489,383 | | Total fixed maturity securities | $ | 1,343,755 | | | 129,896 | | | 3,034 | | | 1,470,617 | |
Most of the Company's equity securities are diversified stock and bond mutual funds.
| | | | | | | | | | | |
Fair Value (In thousands) | March 31, 2021 | | December 31, 2020 |
| | | |
| Equity securities: | | | |
| Stock mutual funds | $ | 3,386 | | | 3,174 | |
| Bond mutual funds | 12,452 | | | 12,354 | |
| Common stock | 1,190 | | | 1,143 | |
| Non-redeemable preferred stock | 276 | | | 281 | |
| Non-redeemable preferred stock fund | 5,062 | | | 5,150 | |
| Total equity securities | $ | 22,366 | | | 22,102 | |
| | | | | | | | | | | |
Fair Value (In thousands) | March 31, 2022 | | December 31, 2021 |
| | | |
| Equity securities: | | | |
| Stock mutual funds | $ | 3,476 | | | 3,571 | |
| Bond mutual funds | 4,880 | | | 5,060 | |
| Common stock | 957 | | | 990 | |
| Non-redeemable preferred stock | 10 | | | 161 | |
| Non-redeemable preferred stock fund | 4,579 | | | 5,062 | |
| Total equity securities | $ | 13,902 | | | 14,844 | |
VALUATION OF INVESTMENTS
Available-for-sale ("AFS") fixed maturity securities are reported in the consolidated financial statements at fair value. Equity securities are measured at fair value with the change in fair value recorded through net income. The Company recognized net realized gainsinvestment related losses of $0.3$0.8 million on equity securities held for the three months ended March 31, 20212022 and lossesgains of $1.1$0.3 million for the same period ended March 31, 2020.2021.
The Company considers several factors in its review and evaluation of individual investments, using the process described in Part IV, Item 15, Note 2. Investments in the notes to the consolidated financial statements of our Form 10-K to determine whether a credit loss impairment exists. For the three months ended March 31, 20212022 and 2020,2021, the Company recorded 0no credit valuation losses on fixed maturity securities.
March 31, 20212022 | 10-Q 15
| | | | | | | | |
CITIZENS, INC. | NOTES TO CONSOLIDATED FINANCIAL STATEMENTS |
| | (Unaudited) |
The following tables present the fair values and gross unrealized losses of fixed maturity securities that are not deemed to have credit losses, aggregated by investment category and length of time that individual securities have been in a continuous loss position at March 31, 20212022 and December 31, 2020.2021.
| | March 31, 2021 | Less than 12 months | Greater than 12 months | Total | |
| March 31, 2022 | | March 31, 2022 | Less than 12 months | Greater than 12 months | Total |
| (In thousands, except for # of securities) | (In thousands, except for # of securities) | Fair
Value | Unrealized
Losses | # of
Securities | Fair
Value | Unrealized
Losses | # of
Securities | Fair
Value | Unrealized
Losses | # of
Securities | (In thousands, except for # of securities) | Fair
Value | Unrealized
Losses | # of
Securities | Fair
Value | Unrealized
Losses | # of
Securities | Fair
Value | Unrealized
Losses | # of
Securities |
| | Fixed maturity securities: | Fixed maturity securities: | | Fixed maturity securities: | |
| Available-for-sale securities: | Available-for-sale securities: | | Available-for-sale securities: | |
| | U.S. Treasury securities | | U.S. Treasury securities | $ | 68 | | 5 | | 2 | | — | | — | | — | | 68 | | 5 | | 2 | |
| States and political subdivisions | States and political subdivisions | $ | 49,464 | | 1,955 | | 48 | | $ | 0 | | 0 | | 0 | | $ | 49,464 | | 1,955 | | 48 | | States and political subdivisions | 93,810 | | 9,274 | | 103 | | 807 | | 207 | | 2 | | 94,617 | | 9,481 | | 105 | |
| Corporate: | Corporate: | | Corporate: | |
| Financial | Financial | 35,670 | | 1,621 | | 40 | | 0 | | 0 | | 0 | | 35,670 | | 1,621 | | 40 | | Financial | 100,331 | | 8,800 | | 124 | | 1,075 | | 236 | | 1 | | 101,406 | | 9,036 | | 125 | |
| Consumer | Consumer | 51,477 | | 3,034 | | 49 | | 0 | | 0 | | 0 | | 51,477 | | 3,034 | | 49 | | Consumer | 118,748 | | 11,657 | | 139 | | 3,348 | | 718 | | 7 | | 122,096 | | 12,375 | | 146 | |
| Energy | Energy | 14,151 | | 593 | | 14 | | 2,557 | | 499 | | 6 | | 16,708 | | 1,092 | | 20 | | Energy | 30,597 | | 1,905 | | 37 | | — | | — | | — | | 30,597 | | 1,905 | | 37 | |
| All Other | All Other | 74,922 | | 4,261 | | 96 | | 0 | | 0 | | 0 | | 74,922 | | 4,261 | | 96 | | All Other | 139,085 | | 11,752 | | 187 | | 8,747 | | 1,962 | | 6 | | 147,832 | | 13,714 | | 193 | |
| | Residential mortgage-backed | Residential mortgage-backed | 1,595 | | 46 | | 9 | | 0 | | 0 | | 0 | | 1,595 | | 46 | | 9 | | Residential mortgage-backed | 4,793 | | 235 | | 14 | | — | | — | | — | | 4,793 | | 235 | | 14 | |
| Asset-backed | Asset-backed | 6,434 | | 48 | | 11 | | 9,253 | | 15 | | 8 | | 15,687 | | 63 | | 19 | | Asset-backed | 21,315 | | 99 | | 24 | | 662 | | 3 | | 1 | | 21,977 | | 102 | | 25 | |
| | Total fixed maturity securities | Total fixed maturity securities | $ | 233,713 | | 11,558 | | 267 | | $ | 11,810 | | 514 | | 14 | | $ | 245,523 | | 12,072 | | 281 | | Total fixed maturity securities | $ | 508,747 | | 43,727 | | 630 | | 14,639 | | 3,126 | | 17 | | 523,386 | | 46,853 | | 647 | |
| | December 31, 2020 | Less than 12 months | Greater than 12 months | Total | |
| December 31, 2021 | | December 31, 2021 | Less than 12 months | Greater than 12 months | Total |
| (In thousands, except for # of securities) | (In thousands, except for # of securities) | Fair
Value | Unrealized
Losses | # of
Securities | Fair
Value | Unrealized
Losses | # of
Securities | Fair
Value | Unrealized
Losses | # of
Securities | (In thousands, except for # of securities) | Fair
Value | Unrealized
Losses | # of
Securities | Fair
Value | Unrealized
Losses | # of
Securities | Fair
Value | Unrealized
Losses | # of
Securities |
| | Fixed maturity securities: | Fixed maturity securities: | | Fixed maturity securities: | |
| Available-for-sale securities: | Available-for-sale securities: | | Available-for-sale securities: | |
| | U.S. Government-sponsored enterprises | | U.S. Government-sponsored enterprises | $ | 72 | | 1 | | 2 | | — | | — | | — | | 72 | | 1 | | 2 | |
| States and political subdivisions | States and political subdivisions | $ | 32,487 | | 548 | | 27 | | $ | 0 | | 0 | | 0 | | $ | 32,487 | | 548 | | 27 | | States and political subdivisions | 21,715 | | 692 | | 15 | | — | | — | | — | | 21,715 | | 692 | | 15 | |
| Corporate: | Corporate: | | Corporate: | |
| Financial | Financial | 1,308 | | 13 | | 1 | | 0 | | 0 | | 0 | | 1,308 | | 13 | | 1 | | Financial | 8,059 | | 86 | | 15 | | 1,227 | | 86 | | 1 | | 9,286 | | 172 | | 16 | |
| Consumer | Consumer | 10,740 | | 230 | | 5 | | 1,667 | | 15 | | 1 | | 12,407 | | 245 | | 6 | | Consumer | 29,494 | | 777 | | 28 | | 2,419 | | 123 | | 1 | | 31,913 | | 900 | | 29 | |
| Energy | Energy | 6,350 | | 536 | | 8 | | 0 | | 0 | | 0 | | 6,350 | | 536 | | 8 | | Energy | 7,381 | | 68 | | 8 | | — | | — | | — | | 7,381 | | 68 | | 8 | |
| All Other | All Other | 9,418 | | 82 | | 11 | | 0 | | 0 | | 0 | | 9,418 | | 82 | | 11 | | All Other | 33,384 | | 781 | | 30 | | 4,523 | | 400 | | 4 | | 37,907 | | 1,181 | | 34 | |
| Commercial mortgage-backed | 221 | | 4 | | 1 | | 0 | | 0 | | 0 | | 221 | | 4 | | 1 | | |
| | Residential mortgage-backed | Residential mortgage-backed | 83 | | 0 | | 1 | | 0 | | 0 | | 0 | | 83 | | 0 | | 1 | | Residential mortgage-backed | 1,084 | | 6 | | 6 | | — | | — | | — | | 1,084 | | 6 | | 6 | |
| Asset-backed | Asset-backed | 26,353 | | 481 | | 26 | | 994 | | 1 | | 1 | | 27,347 | | 482 | | 27 | | Asset-backed | 9,078 | | 12 | | 11 | | 663 | | 2 | | 1 | | 9,741 | | 14 | | 12 | |
| Total fixed maturity securities | Total fixed maturity securities | $ | 86,960 | | 1,894 | | 80 | | $ | 2,661 | | 16 | | 2 | | $ | 89,621 | | 1,910 | | 82 | | Total fixed maturity securities | $ | 110,267 | | 2,423 | | 115 | | 8,832 | | 611 | | 7 | | 119,099 | | 3,034 | | 122 | |
In each category of our fixed maturity securities described above, we do not intend to sell our investments and it is not more likely than not that the Company will be required to sell the investments before recovery of their amortized cost bases.
We did not recognize credit These unrealized losses on fixed maturity securities with unrealized losses that wereare due to noncredit-related factors, including interest rate sensitivity and changes in credit spreads. We believe that fluctuations caused by movements in interest rates and credit spreadsother market conditions, which have little bearing on the recoverability of our investments.investments, hence they are not recognized as credit losses. The fair value is expected to recover as the securities approach maturity.maturity or if market yields for such investments decline. While the losses are currently unrealized, we
March 31, 20212022 | 10-Q 16
| | | | | | | | |
CITIZENS, INC. | NOTES TO CONSOLIDATED FINANCIAL STATEMENTS |
| | (Unaudited) |
continue to monitor all fixed maturity securities on an ongoing basis as future information may become available which could result in an allowance being recorded.
The amortized cost and fair value of fixed maturity securities at March 31, 20212022 by contractual maturity are shown in the table below. Actual maturities may differ from contractual maturities because borrowers may have the right to call or prepay obligations with or without call or prepayment penalties. Securities not due at a single maturity date have been reflected based upon final stated maturity.
| | March 31, 2021 | Amortized
Cost | | Fair
Value | |
| March 31, 2022 | | March 31, 2022 | Amortized
Cost | | Fair
Value |
| (In thousands) | (In thousands) | Amortized
Cost | | Fair
Value | (In thousands) | |
| Fixed maturity securities: | Fixed maturity securities: | | Fixed maturity securities: | | | |
| Due in one year or less | Due in one year or less | $ | 25,079 | | | 25,438 | | Due in one year or less | $ | 43,909 | | | 44,649 | |
| Due after one year through five years | Due after one year through five years | 114,900 | | | 125,058 | | Due after one year through five years | 110,505 | | | 113,784 | |
| Due after five years through ten years | Due after five years through ten years | 214,052 | | | 231,241 | | Due after five years through ten years | 214,028 | | | 221,903 | |
| Due after ten years | Due after ten years | 978,601 | | | 1,038,850 | | Due after ten years | 992,812 | | | 975,074 | |
| Total fixed maturity securities | Total fixed maturity securities | $ | 1,332,632 | | | 1,420,587 | | Total fixed maturity securities | $ | 1,361,254 | | | 1,355,410 | |
The Company uses the specific identification method of the individual security to determine the cost basis used in the calculation of realized gains and losses related to security sales.
| | | | | | Three Months Ended | | | | | Three Months Ended | |
| Fixed Maturity Securities, Available-for-Sale | Fixed Maturity Securities, Available-for-Sale | | | March 31, | | Fixed Maturity Securities, Available-for-Sale | | | March 31, | |
| (In thousands) | (In thousands) | | | 2021 | 2020 | | (In thousands) | | | 2022 | 2021 | |
| | Proceeds | Proceeds | | | $ | 7,254 | | 940 | | | Proceeds | | | $ | 1,100 | | 7,254 | | |
| Gross realized gains | Gross realized gains | | | $ | 100 | | 0 | | | Gross realized gains | | | $ | — | | 100 | | |
| Gross realized losses | Gross realized losses | | | $ | 1 | | 38 | | | Gross realized losses | | | $ | — | | 1 | | |
The Company sold 181 and 118 AFS fixed maturity securities during the three months ended March 31, 2022 and 2021, and 2020, respectively. NaN equity securities were sold during the three months ended March 31, 2021 and 2020.
(6) FAIR VALUE MEASUREMENTS
Fair value is the price that would be received to sell an asset or paid to transfer a liability in an orderly transaction between market participants at the measurement date. We hold AFS fixed maturity securities, which are carried at fair value. We also report our equity securities and other long-term investments at fair value with changes in fair value reported through the consolidated statements of operations and comprehensive income (loss).
Fair value measurements are generally based upon observable and unobservable inputs. Observable inputs reflect market data obtained from independent sources, while unobservable inputs reflect our view of market assumptions in the absence of observable market information. We utilize valuation techniques that maximize the use of observable inputs and minimize the use of unobservable inputs. All assets and liabilities carried at fair value are required to be classified and disclosed in one of the following three categories:
•Level 1 - Quoted prices for identical instruments in active markets.
•Level 2 - Quoted prices for similar instruments in active markets; quoted prices for identical or similar instruments in markets that are not active; and model-derived valuations whose inputs or whose significant value drivers are observable.
•Level 3 - Instruments whose significant value drivers are unobservable.
Level 1 primarily consists of financial instruments whose value is based on quoted market prices such as U.S. Treasury securities and actively traded mutual fund and stock investments.
March 31, 20212022 | 10-Q 17
| | | | | | | | |
CITIZENS, INC. | NOTES TO CONSOLIDATED FINANCIAL STATEMENTS |
| | (Unaudited) |
whose significant value drivers are observable.
•Level 3 - Instruments whose significant value drivers are unobservable.
Level 1 primarily consists of financial instruments whose value is based on quoted market prices such as U.S. Treasury securities and actively traded mutual fund and stock investments.
Level 2 includes those financial instruments that are valued by independent pricing services or broker quotes. These pricing models are primarily industry-standard models that consider various inputs, such as interest rates, credit spreads and foreign exchange rates for the underlying financial instruments. All significant inputs are observable or derived from observable information in the marketplace or are supported by observable levels at which transactions are executed in the marketplace. Financial instruments in this category primarily include corporate securities, U.S. Government-sponsored enterprise securities, securities issued by states and political subdivisions and certain mortgage and asset-backed securities.
Level 3 is comprised of financial instruments whose fair value is estimated based on non-binding broker prices utilizing significant inputs not based on or corroborated by readily available market information. Real estate held-for-sale isWe have no investments in this category.
The following tables set forth our assets that are measured at fair value on a recurring basis as of the dates indicated.
| | March 31, 2021 | Level 1 | | Level 2 | | Level 3 | | Total
Fair Value | |
| March 31, 2022 | | March 31, 2022 | Level 1 | | Level 2 | | Level 3 | | Total
Fair Value |
| (In thousands) | (In thousands) | Level 1 | | Level 2 | | Level 3 | | Total
Fair Value | (In thousands) | |
| Financial Assets | Financial Assets | | Financial Assets | |
| Fixed maturity securities available-for-sale | Fixed maturity securities available-for-sale | | | | | | | | Fixed maturity securities available-for-sale | | | | | | | |
| U.S. Treasury and U.S. Government-sponsored enterprises | U.S. Treasury and U.S. Government-sponsored enterprises | $ | 11,021 | | | 4,517 | | | 0 | | | 15,538 | | U.S. Treasury and U.S. Government-sponsored enterprises | $ | 10,170 | | | 4,149 | | | — | | | 14,319 | |
| States and political subdivisions | States and political subdivisions | 0 | | | 393,859 | | | 0 | | | 393,859 | | States and political subdivisions | — | | | 358,395 | | | — | | | 358,395 | |
| Corporate | Corporate | 52 | | | 834,738 | | | 0 | | | 834,790 | | Corporate | 50 | | | 814,080 | | | — | | | 814,130 | |
| | Residential mortgage-backed | Residential mortgage-backed | 0 | | | 132,146 | | | 0 | | | 132,146 | | Residential mortgage-backed | — | | | 123,162 | | | — | | | 123,162 | |
| Asset-backed | Asset-backed | 0 | | | 44,138 | | | 0 | | | 44,138 | | Asset-backed | — | | | 45,297 | | | — | | | 45,297 | |
| Foreign governments | Foreign governments | 0 | | | 116 | | | 0 | | | 116 | | Foreign governments | — | | | 107 | | | — | | | 107 | |
| Total fixed maturity securities available-for-sale | Total fixed maturity securities available-for-sale | 11,073 | | | 1,409,514 | | | 0 | | | 1,420,587 | | Total fixed maturity securities available-for-sale | 10,220 | | | 1,345,190 | | | — | | | 1,355,410 | |
| | Equity securities | Equity securities | | | | | | | | Equity securities | | | | | | | |
| Stock mutual funds | Stock mutual funds | 3,386 | | | 0 | | | 0 | | | 3,386 | | Stock mutual funds | 3,476 | | | — | | | — | | | 3,476 | |
| Bond mutual funds | Bond mutual funds | 12,452 | | | 0 | | | 0 | | | 12,452 | | Bond mutual funds | 4,880 | | | — | | | — | | | 4,880 | |
| Common stock | Common stock | 1,190 | | | 0 | | | 0 | | | 1,190 | | Common stock | 957 | | | — | | | — | | | 957 | |
| Non-redeemable preferred stock | Non-redeemable preferred stock | 276 | | | 0 | | | 0 | | | 276 | | Non-redeemable preferred stock | 10 | | | — | | | — | | | 10 | |
| Non-redeemable preferred stock fund | Non-redeemable preferred stock fund | 5,062 | | | 0 | | | 0 | | | 5,062 | | Non-redeemable preferred stock fund | 4,579 | | | — | | | — | | | 4,579 | |
| Total equity securities | Total equity securities | 22,366 | | | 0 | | | 0 | | | 22,366 | | Total equity securities | 13,902 | | | — | | | — | | | 13,902 | |
Other long-term investments (1) | Other long-term investments (1) | 0 | | | 0 | | | 0 | | | 16,982 | | Other long-term investments (1) | — | | | — | | | — | | | 62,564 | |
| Total financial assets | Total financial assets | $ | 33,439 | | | 1,409,514 | | | 0 | | | 1,459,935 | | Total financial assets | $ | 24,122 | | | 1,345,190 | | | — | | | 1,431,876 | |
(1) In accordance with Subtopic 820-10, certain investments that are measured at fair value using the net asset value per share (or its equivalent) practical expedient haveare not been classified in the fair value hierarchy. The fair value amounts presented in this table are intended to permit reconciliation of the fair value hierarchy to the amounts presented in the consolidated balance sheet.
March 31, 20212022 | 10-Q 18
| | | | | | | | |
CITIZENS, INC. | NOTES TO CONSOLIDATED FINANCIAL STATEMENTS |
| | (Unaudited) |
| | December 31, 2020 | Level 1 | | Level 2 | | Level 3 | | Total
Fair Value | |
| December 31, 2021 | | December 31, 2021 | Level 1 | | Level 2 | | Level 3 | | Total
Fair Value |
| (In thousands) | (In thousands) | Level 1 | | Level 2 | | Level 3 | | Total
Fair Value | (In thousands) | |
| Financial Assets | Financial Assets | | Financial Assets | |
| Fixed maturity securities available-for-sale | Fixed maturity securities available-for-sale | | | | | | | | Fixed maturity securities available-for-sale | | | | | | | |
| U.S. Treasury and U.S. Government-sponsored enterprises | U.S. Treasury and U.S. Government-sponsored enterprises | $ | 11,326 | | | 4,791 | | | 0 | | | 16,117 | | U.S. Treasury and U.S. Government-sponsored enterprises | $ | 10,611 | | | 4,459 | | | — | | | 15,070 | |
| States and political subdivisions | States and political subdivisions | 0 | | | 409,665 | | | 0 | | | 409,665 | | States and political subdivisions | — | | | 383,958 | | | — | | | 383,958 | |
| Corporate | Corporate | 52 | | | 877,156 | | | 0 | | | 877,208 | | Corporate | 51 | | | 892,957 | | | — | | | 893,008 | |
| Commercial mortgage-backed | 0 | | | 221 | | | 0 | | | 221 | | |
| | Residential mortgage-backed | Residential mortgage-backed | 0 | | | 139,963 | | | 0 | | | 139,963 | | Residential mortgage-backed | — | | | 133,795 | | | — | | | 133,795 | |
| Asset-backed | Asset-backed | 0 | | | 46,091 | | | 0 | | | 46,091 | | Asset-backed | — | | | 44,676 | | | — | | | 44,676 | |
| Foreign governments | Foreign governments | 0 | | | 118 | | | 0 | | | 118 | | Foreign governments | — | | | 110 | | | — | | | 110 | |
| Total fixed maturity securities available-for-sale | Total fixed maturity securities available-for-sale | 11,378 | | | 1,478,005 | | | 0 | | | 1,489,383 | | Total fixed maturity securities available-for-sale | 10,662 | | | 1,459,955 | | | — | | | 1,470,617 | |
| | Equity securities | Equity securities | | | | | | | | Equity securities | | | | | | | |
| Stock mutual funds | Stock mutual funds | 3,174 | | | 0 | | | 0 | | | 3,174 | | Stock mutual funds | 3,571 | | | — | | | — | | | 3,571 | |
| Bond mutual funds | Bond mutual funds | 12,354 | | | 0 | | | 0 | | | 12,354 | | Bond mutual funds | 5,060 | | | — | | | — | | | 5,060 | |
| Common stock | Common stock | 1,143 | | | 0 | | | 0 | | | 1,143 | | Common stock | 990 | | | — | | | — | | | 990 | |
| Non-redeemable preferred stock | Non-redeemable preferred stock | 281 | | | 0 | | | 0 | | | 281 | | Non-redeemable preferred stock | 161 | | | — | | | — | | | 161 | |
| Non-redeemable preferred stock fund | Non-redeemable preferred stock fund | 5,150 | | | 0 | | | 0 | | | 5,150 | | Non-redeemable preferred stock fund | 5,062 | | | — | | | — | | | 5,062 | |
| Total equity securities | Total equity securities | 22,102 | | | 0 | | | 0 | | | 22,102 | | Total equity securities | 14,844 | | | — | | | — | | | 14,844 | |
Other long-term investments (1) | Other long-term investments (1) | 0 | | | 0 | | | 0 | | | 11,923 | | Other long-term investments (1) | — | | | — | | | — | | | 56,038 | |
| Total financial assets | Total financial assets | $ | 33,480 | | | 1,478,005 | | | 0 | | | 1,523,408 | | Total financial assets | $ | 25,506 | | | 1,459,955 | | | — | | | 1,541,499 | |
| (1) In accordance with Subtopic 820-10, certain investments that are measured at fair value using the net asset value per share (or its equivalent) practical expedient have not been classified in the fair value hierarchy. The fair value amounts presented in this table are intended to permit reconciliation of the fair value hierarchy to the amounts presented in the balance sheet. | |
(1) In accordance with Subtopic 820-10, certain investments that are measured at fair value using the net asset value per share (or its equivalent) practical expedient are not classified in the fair value hierarchy. The fair value amounts presented in this table are intended to permit reconciliation of the fair value hierarchy to the amounts presented in the consolidated balance sheet. | | (1) In accordance with Subtopic 820-10, certain investments that are measured at fair value using the net asset value per share (or its equivalent) practical expedient are not classified in the fair value hierarchy. The fair value amounts presented in this table are intended to permit reconciliation of the fair value hierarchy to the amounts presented in the consolidated balance sheet. |
FINANCIAL INSTRUMENTS VALUATION
FINANCIAL INSTRUMENTS CARRIED AT FAIR VALUE
Fixed maturity securities, available-for-sale. At March 31, 2021, our2022, fixed maturity securities, valued using a third-party pricing source, totaled $1.4$1.3 billion for Level 2 assets and comprised 96.5%93.9% of total reported fair value of our financial assets. The Level 1 and Level 2 valuations are reviewed and updated quarterly through testing by comparisons to separate pricing models, other third-party pricing services, and back tested to recent trades. In addition, we obtain information annually relative to the third-party pricing models and review model parameters for reasonableness. There were 0no Level 3 assets at March 31, 2021.2022. For the three months ended March 31, 2021,2022, there were no material changes to the valuation methods or assumptions used to determine fair values, and 0no broker or third-party prices were changed from the values received.
Equity securities. Our equity securities are classified as Level 1 assets as their fair values are based upon quoted market prices.
Private equity funds.Limited partnerships. The Company considers the net asset value ("NAV") to represent the value of the investment fund and is measured by the total value of assets minus the total value of liabilities. The following tables include information related to our investments in private equity fundslimited partnerships that calculate NAV per share. For these investments, which are measured at fair value on a recurring basis, we use the NAV per share to measure fair value. Changes in the NAV of our limited partnerships are recorded through net income. The Company recognized net investment
March 31, 20212022 | 10-Q 19
| | | | | | | | |
CITIZENS, INC. | NOTES TO CONSOLIDATED FINANCIAL STATEMENTS |
| | (Unaudited) |
which are measured at fair valuerelated losses of $0.8 million on a recurring basis, we uselimited partnerships held for the NAV per share to measure fair value.three months ended March 31, 2022. These investments are included in other long-term investments on the consolidated balance sheets.
| | | March 31, 2021 | | December 31, 2020 | | March 31, 2022 | | December 31, 2021 |
| | Fair Value
Using NAV Per Share | Unfunded Commit-
ments | Life
in years | | Fair Value
Using NAV Per Share | Unfunded Commit-
ments | Life
in years | | Fair Value
Using NAV Per Share | Unfunded Commit-
ments | Life
in years | | Fair Value
Using NAV Per Share | Unfunded Commit-
ments | Life
in years |
| (In thousands, except years) | (In thousands, except years) | | (In thousands, except years) | |
| Private equity funds | | |
| Limited partnerships | | Limited partnerships | |
| Middle market | Middle market | Investments in privately-originated, performing senior secured debt primarily in North America-based companies | $ | 8,457 | | 31,777 | | 10 | | $ | 10,542 | | 29,783 | | 10 | Middle market | Investments in privately-originated, performing senior secured debt primarily in North America-based companies | $ | 27,336 | | 13,593 | | 9 | | $ | 21,947 | | 18,712 | | 10 |
Term
liquidity facility | Investments in a facility established by the U.S. Federal Reserve that provides financing to U.S. company market participants for levered asset purchases with a focus on asset-backed, commercial mortgage and collateralized loan obligation markets | 36 | | 0 | | 1 | | 1,381 | | 0 | | 3 | |
| Global equity fund | | Global equity fund | Investments in common stocks of U.S., international developed and emerging markets with a focus on long-term capital growth | 9,890 | | — | | 0 | | 10,607 | | — | | 0 |
| | Late-stage growth | Late-stage growth | Investments in private late-stage, established companies seeking capital to accelerate growth prior to an IPO or sale | 6,199 | | 14,198 | | 7 | | 0 | | 16,291 | | 7 | Late-stage growth | Investments in private late-stage, established companies seeking capital to accelerate growth prior to an IPO or sale | 21,564 | | 7,256 | | 6 | | 20,468 | | 4,459 | | 6 |
| Infrastructure | Infrastructure | Investments in climate infrastructure assets, focusing on renewable power generation in wind and solar energy | 2,290 | | 17,485 | | 12 | | 0 | | 17,497 | | 12 | Infrastructure | Investments in climate infrastructure assets, focusing on renewable power generation in wind and solar energy | 3,774 | | 15,970 | | 11 | | 3,016 | | 16,653 | | 12 |
| Total private equity funds | $ | 16,982 | | 63,460 | | | $ | 11,923 | | 63,571 | | | |
| Total limited partnerships | | Total limited partnerships | $ | 62,564 | | 36,819 | | | $ | 56,038 | | 39,824 | | |
Our private equity fundThe majority of our limited partnership investments are not redeemable because distributions from the funds will be received when the underlying investments of the fundspartnerships are liquidated. The life spans indicated above may be shortened or extended at the fund manager's discretion, typically in one or two-year increments. The global equity fund is redeemable monthly.
We initially estimate the fair value of investments in private equity fundslimited partnerships by reference to the transaction price. Subsequently, we obtain the fair value of these investments from net asset value information provided by the general partner or manager of the investments, the financial statements of which are audited annually. We carried no limited partnership investments at cost at March 31, 2022 and December 31, 2021.
We review the fair value hierarchy classifications each reporting period. Changes in the observability of the valuation attributes may result in a reclassification of certain financial assets. Such reclassifications are reported as transfers in and out of Level 3 at the beginning fair value for the reporting period in which the changes occur. There were 0no transfers in or out of Level 3 during the three months ended March 31, 2022 or 2021.
FINANCIAL INSTRUMENTS NOT CARRIED AT FAIR VALUE
Estimates of fair values are made at a specific point in time, based on relevant market prices and information about the financial instruments. The estimated fair values of financial instruments presented below are not necessarily indicative of the amounts the Company might realize in actual market transactions.
March 31, 20212022 | 10-Q 20
| | | | | | | | |
CITIZENS, INC. | NOTES TO CONSOLIDATED FINANCIAL STATEMENTS |
| | (Unaudited) |
The carrying amount and fair value for the financial assets and liabilities on the consolidated balance sheets not otherwise disclosed for the periods indicated are as follows:
| | | | March 31, 2021 | | December 31, 2020 | | March 31, 2022 | | December 31, 2021 |
| (In thousands) | (In thousands) | Carrying
Value | | Fair
Value | | Carrying
Value | | Fair
Value | (In thousands) | Carrying
Value | | Fair
Value | | Carrying
Value | | Fair
Value |
| | Financial Assets: | Financial Assets: | | | | | | | | Financial Assets: | | | | | | | |
| Policy loans | Policy loans | $ | 82,674 | | | 82,674 | | | 83,318 | | | 83,318 | | Policy loans | $ | 79,345 | | | 79,345 | | | 80,307 | | | 80,307 | |
| Mortgage loans | 153 | | | 190 | | | 157 | | | 195 | | |
| Commercial mortgage loan | | Commercial mortgage loan | 1,000 | | | 1,000 | | | 1,000 | | | 1,000 | |
| Residential mortgage loans | | Residential mortgage loans | 145 | | | 167 | | | 148 | | | 169 | |
| | Cash and cash equivalents | Cash and cash equivalents | 19,493 | | | 19,493 | | | 34,131 | | | 34,131 | | Cash and cash equivalents | 21,298 | | | 21,298 | | | 27,294 | | | 27,294 | |
| Financial Liabilities: | Financial Liabilities: | | | | | | | | Financial Liabilities: | | | | | | | |
| Annuity - investment contracts | Annuity - investment contracts | 61,716 | | | 68,360 | | | 60,861 | | | 71,547 | | Annuity - investment contracts | 65,063 | | | 67,272 | | | 64,384 | | | 72,352 | |
Policy loans. Policy loans had a weighted average annual interest rate of 7.7% at March 31, 20212022 and December 31, 2020,2021 and no specified maturity dates. The aggregate fair value of policy loans approximates the carrying value reflected on the consolidated balance sheets. Policy loans are an integral part of the life insurance policies we have in force, cannot be valued separately and are not marketable. Therefore, the fair value of policy loans approximates the carrying value and policy loans are considered Level 3 assets in the fair value hierarchy.
MortgageCommercial mortgage loan. We financed $1.0 million of the sale of our training facility at a 6.0% interest rate. The loan is due in less than 1 year. Due to the short-term nature of the loan, the carrying value approximates fair value and is considered a Level 3 asset in the fair value hierarchy.
Residential mortgage loans. Mortgage loans are secured principally by residential properties. Weighted average interest rates for these loans were approximately 6.4% at March 31, 20212022 and December 31, 2020.2021. At March 31, 2021,2022, maturities ranged from 75 to 1918 years. Management estimated the fair value using an annual interest rate of 6.25% at March 31, 2021.2022. Our mortgage loans are considered Level 3 assets in the fair value hierarchy and are included in other long-term investments on the consolidated balance sheets.
Cash and cash equivalents. The fair value of cash and cash equivalents approximate carrying value and are characterized as Level 1 assets in the fair value hierarchy.
Annuity liabilities. The fair value of the Company's liabilities under annuity contract policies, which are considered Level 3 liabilities, was estimated at March 31, 20212022 and December 31, 20202021 using discounted cash flows based upon spot rates adjusted for various risk adjustments ranging from 0.20%1.57% to 2.86%3.23% and 0.22%0.50% to 2.34%2.63%, respectively. The fair value of liabilities under all insurance contracts are taken into consideration in the overall management of interest rate risk, which seeks to minimize exposure to changing interest rates through the matching of investment maturities with amounts due under insurance contracts.
Other long-term investments. Financial instruments included in other long-term investments are classified in various levels of the fair value hierarchy. The following table summarizes the carrying amounts of these investments.
| | | | | | | | | | | |
Carrying Value (In thousands) | March 31, 2021 | | December 31, 2020 |
| Other long-term investments: | | | |
| Private equity funds | $ | 16,982 | | | 18,135 | |
| FHLB common stock | 190 | | | 190 | |
| Mortgage loans | 153 | | | 157 | |
| All other investments | 22 | | | 8,811 | |
| Total other long-term investments | $ | 17,347 | | | 27,293 | |
March 31, 20212022 | 10-Q 21
| | | | | | | | |
CITIZENS, INC. | NOTES TO CONSOLIDATED FINANCIAL STATEMENTS |
| | (Unaudited) |
Other long-term investments. Financial instruments included in other long-term investments are classified in various levels of the fair value hierarchy. The following table summarizes the carrying amounts of these investments.
| | | | | | | | | | | |
Carrying Value (In thousands) | March 31, 2022 | | December 31, 2021 |
| Other long-term investments: | | | |
| Limited partnerships | $ | 62,564 | | | 56,038 | |
| FHLB common stock | 192 | | | 192 | |
| Mortgage loans | 1,145 | | | 1,148 | |
| All other investments | 26 | | | 21 | |
| Total other long-term investments | $ | 63,927 | | | 57,399 | |
We are a member of the Federal Home Loan Bank ("FHLB") of Dallas and such membership requires members to own stock in the FHLB. Our FHLB stock is carried at amortized cost, which approximates fair value. Included in all other investments in 2020 was a Rabbi Trust holding $8.8 million for the benefit of our former Chief Executive Officer, Geoffrey Kolander, which represented his severance payment under the terms of his employment agreement in connection with his resignation following a change in control of the Company, that was paid during the first quarter of 2021.
(7) COMMITMENTS AND CONTINGENCIES
QUALIFICATION OF LIFE PRODUCTS
We have previously reported that a portion of the life insurance policies issued by our subsidiary insurance companies failed to qualify for the favorable U.S. federal income tax treatment afforded by Sections 7702 and 72(s) of the Internal Revenue Code ("IRC") of 1986. Further, we have determined that the structure of our policies sold to non-U.S. persons, which were novated to CICA Ltd. effective July 1, 2018, may have inadvertently generated U.S. source income over time, which subjected the Company to certain tax withholding and information reporting requirements for the Company under Chapters 3 or 4 of the IRC. The products have been and continue to be appropriately reported as life insurance under U.S. GAAP for financial reporting.
To satisfy the Internal Revenue Service ("IRS") tax withholding and information reporting requirements for the novated policies sold to non-U.S. persons as described above, the Company submitted withholding tax returns to the IRS in December 2019, and amended returns in August 2020 and paid the associated withholding tax. The IRS processed these withholding tax returns in 2021 and the Company considers this matter closed.
LITIGATION AND REGULATORY ACTIONS
From time to time, we are subject to legal and regulatory actions relating to our business. We may incur defense costs, including attorneys' fees, and other direct litigation costs associated with defending claims. If we suffer an adverse judgment as a result of litigation claims, it could have a material adverse effect on our business, results of operations and financial condition.
CONTRACTUAL OBLIGATIONS
As of March 31, 2021,2022, CICA Ltd.International is committed to fund investments up to $68.5$36.8 million related to private equity fundslimited partnerships previously described and other investments.
CREDIT FACILITY
On May 5, 2021, the Company entered into a $20 million senior secured revolving credit facility (the “Credit Facility”) with Regions Bank (the “Credit Facility”("Regions"). The Credit Facility has a three-yearthree-year term, maturing on May 5, 2024, and allows the Company to borrow up to $20 million for working capital purposes, capital expenditures and other lawful corporate purposes.
Revolving loans may be requested by the Company in aggregate minimum principal amounts of $0.5 million per loan. At the Company's election, the revolving loans may either bear a base rate, which is 1.75% plus a base rate (a fluctuating rate per annum) equal to the greatest of (a) Regions' prime rate, (b) the federal funds rate plus 0.50%, (c) the one-month LIBOR rate plus 1%, and (d) 0.75%; or an adjusted LIBOR rate, which is 2.75% plus an adjusted LIBOR rate but cannot be less than 0.75%. The Company is required to pay Regions a quarterly commitment fee of 0.375% of the unused portion of the Credit Facility, which the Company expenses as it is incurred.
Obligations under the Credit Facility are secured by a first priority lien on mostsubstantially all of Citizens’the assets excluding its ownershipof the Company other than the equity interests in all of the regulated insurance subsidiaries, real estate owned by the Company, and contains standard representations, warranties and covenants. For a more detailed description of theother limited exceptions. The Credit Facility see the Company’s Current Reportcontains customary events of default and financial, affirmative and negative covenants, including but not limited to restrictions on Form 8-K filed on May 5, 2021.indebtedness, liens, investments, asset dispositions and restricted payments. As of May 5, 2021,March 31, 2022, the Company had not borrowed any funds against the Credit Facility.Facility and was not in violation of any covenants.
March 31, 20212022 | 10-Q 22
| | | | | | | | |
CITIZENS, INC. | NOTES TO CONSOLIDATED FINANCIAL STATEMENTS |
| | (Unaudited) |
(8) INCOME TAXES
Our provision for income taxes may not have the customary relationship of taxes to income. CICA Ltd.,International, a wholly owned subsidiary of Citizens, is considered a controlled foreign corporation for federal tax purposes. As a result, the insurance activity of CICA Ltd.International is subject to Subpart F of the IRC and is included in Citizens’ taxable income. Due to the 0% enacted tax rate in Bermuda, there are no deferred taxes recorded for CICA International's temporary differences. For the three months ended March 31, 2022 and March 31, 2021, the Subpart F income inclusion generated $0.8 million and $0.4 million, respectively, of federal income tax expense.
A reconciliation between the U.S. corporate income tax rate and the effective income tax rate is as follows:
| | Three Months Ended March 31, | Three Months Ended March 31, | 2021 | | 2020 | Three Months Ended March 31, | 2022 | | 2021 |
| (In thousands, except for %) | (In thousands, except for %) | Amount | | % | | Amount | | % | (In thousands, except for %) | Amount | | % | | Amount | | % |
| Federal income tax expense: | Federal income tax expense: | | Federal income tax expense: | |
| Expected tax expense (benefit) | Expected tax expense (benefit) | $ | (577) | | | 21.0 | % | | (469) | | | 21.0 | % | Expected tax expense (benefit) | $ | (205) | | | 21.0 | % | | $ | (577) | | | 21.0 | % |
| | Foreign income tax rate differential | Foreign income tax rate differential | (152) | | | 5.5 | % | | (550) | | | 24.6 | % | Foreign income tax rate differential | (299) | | | 30.7 | % | | (152) | | | 5.5 | % |
| | Tax-exempt interest and dividends-received deduction | Tax-exempt interest and dividends-received deduction | (30) | | | 1.1 | % | | (40) | | | 1.8 | % | Tax-exempt interest and dividends-received deduction | (25) | | | 2.6 | % | | (30) | | | 1.1 | % |
| | Annualized effective tax rate adjustment | Annualized effective tax rate adjustment | 655 | | | (23.8) | % | | 617 | | | (27.6) | % | Annualized effective tax rate adjustment | 97 | | | (10.0) | % | | 655 | | | (23.8) | % |
| Adjustment of prior year taxes | 0 | | | 0 | % | | (5) | | | 0.2 | % | |
| | | Effect of uncertain tax position | Effect of uncertain tax position | 603 | | | (21.9) | % | | 1,015 | | | (45.4) | % | Effect of uncertain tax position | 12 | | | (1.2) | % | | 603 | | | (21.9) | % |
| | CICA Ltd. Subpart F income | 392 | | | (14.3) | % | | 675 | | | (30.2) | % | |
| CICA International Subpart F income | | CICA International Subpart F income | 754 | | | (77.4) | % | | 392 | | | (14.3) | % |
| | Nondeductible officer compensation | Nondeductible officer compensation | (73) | | | 2.7 | % | | 0 | | | 0 | % | Nondeductible officer compensation | 21 | | | (2.2) | % | | (73) | | | 2.7 | % |
| Other | Other | 7 | | | (0.3) | % | | 106 | | | (4.7) | % | Other | 4 | | | (0.4) | % | | 7 | | | (0.3) | % |
| Total federal income tax expense (benefit) | Total federal income tax expense (benefit) | $ | 825 | | | (30.0) | % | | 1,349 | | | (60.3) | % | Total federal income tax expense (benefit) | $ | 359 | | | (36.9) | % | | $ | 825 | | | (30.0) | % |
Income tax expense consists of:
| | Three Months Ended March 31, | 2021 | | 2020 | |
| | | | Three Months Ended |
| | | | March 31, |
| (In thousands) | (In thousands) | 2021 | | 2020 | (In thousands) | | 2022 | | 2021 |
| Federal income tax expense: | Federal income tax expense: | | Federal income tax expense: | | |
| Current | Current | $ | 1,257 | | | 1,629 | | Current | | $ | 172 | | | 1,257 | |
| Deferred | Deferred | (432) | | | (280) | | Deferred | | 187 | | | (432) | |
| Total federal income tax expense | Total federal income tax expense | $ | 825 | | | 1,349 | | Total federal income tax expense | | $ | 359 | | | 825 | |
March 31, 20212022 | 10-Q 23
| | | | | | | | |
CITIZENS, INC.
| NOTES TO CONSOLIDATED FINANCIAL STATEMENTS |
| | (Unaudited)
|
The components of deferred federal income taxes are as follows:
| | | | | | | | | | | |
Net Deferred Tax Asset (Liability) (In thousands) | March 31, 2021 | | December 31, 2020 |
| Deferred tax assets: | | | |
| Future policy benefit reserves | $ | 2,732 | | | 2,657 | |
| Net operating and capital loss carryforwards | 1,774 | | | 1,395 | |
| Accrued policyholder dividends and expenses | 134 | | | 124 | |
| Investments | 198 | | | 147 | |
| Deferred intercompany loss | 1,967 | | | 2,002 | |
| | | |
| Fixed assets | 481 | | | 420 | |
| Lease liability | 2,446 | | | 2,514 | |
| Accrued compensation | 376 | | | 513 | |
| Other | 166 | | | 164 | |
| Total gross deferred tax assets | 10,274 | | | 9,936 | |
| | | |
| | | |
| Deferred tax liabilities: | | | |
| Deferred policy acquisition costs, cost of insurance acquired and intangible assets | (8,531) | | | (8,693) | |
| Unrealized gains on investments available-for-sale | (5,430) | | | (4,522) | |
| | | |
| Tax reserves transition liability | (3,549) | | | (3,736) | |
| Right-of-use lease asset | (2,446) | | | (2,514) | |
| Other | (35) | | | (35) | |
| Total gross deferred tax liabilities | (19,991) | | | (19,500) | |
| Net deferred tax liability | $ | (9,717) | | | (9,564) | |
| | | | | | | | |
CITIZENS, INC. | NOTES TO CONSOLIDATED FINANCIAL STATEMENTS |
| | (Unaudited) |
(9) OTHER COMPREHENSIVE INCOME
The changes in the components of other comprehensive income (loss) are reported net of the effects of income taxes of 21% as of the three months ended March 31, 20212022 and 2020,2021, as indicated below.
| | | | | Three Months Ended March 31, | | Three Months Ended March 31, | 2022 | | 2021 |
| (In thousands) | (In thousands) | Amount | | Tax Effect | | Total | (In thousands) | Amount | | Tax Effect | | Total | | Amount | | Tax Effect | | Total |
| Three months ended March 31, 2021 | | | | | | |
| Unrealized gains (losses): | Unrealized gains (losses): | | | | | | Unrealized gains (losses): | | | | | | |
| Unrealized holding gains (losses) arising during the period | Unrealized holding gains (losses) arising during the period | $ | (79,422) | | | 5,373 | | | (74,049) | | Unrealized holding gains (losses) arising during the period | $ | (132,765) | | | 8,957 | | | (123,808) | | | (79,422) | | | 5,373 | | | (74,049) | |
| Reclassification adjustment for (gains) losses included in net income | Reclassification adjustment for (gains) losses included in net income | (35) | | | 7 | | | (28) | | Reclassification adjustment for (gains) losses included in net income | 59 | | | (12) | | | 47 | | | (35) | | | 7 | | | (28) | |
| Effects on deferred policy acquisition costs | Effects on deferred policy acquisition costs | 25,198 | | | (6,317) | | | 18,881 | | Effects on deferred policy acquisition costs | 344 | | | (72) | | | 272 | | | 25,198 | | | (6,317) | | | 18,881 | |
| Effects on cost of insurance acquired | Effects on cost of insurance acquired | 269 | | | (56) | | | 213 | | Effects on cost of insurance acquired | 152 | | | (32) | | | 120 | | | 269 | | | (56) | | | 213 | |
| Effects on unearned revenue reserves | Effects on unearned revenue reserves | (1,943) | | | 408 | | | (1,535) | | Effects on unearned revenue reserves | (1,073) | | | 225 | | | (848) | | | (1,943) | | | 408 | | | (1,535) | |
| Other comprehensive income (loss) | Other comprehensive income (loss) | $ | (55,933) | | | (585) | | | (56,518) | | Other comprehensive income (loss) | $ | (133,283) | | | 9,066 | | | (124,217) | | | (55,933) | | | (585) | | | (56,518) | |
| | Three months ended March 31, 2020 | | | | | | |
| Unrealized gains (losses): | | | | | | |
| Unrealized holding gains (losses) arising during the period | $ | (42,906) | | | 2,750 | | | (40,156) | | |
| Reclassification adjustment for (gains) losses included in net income | 132 | | | (28) | | | 104 | | |
| Effects on deferred policy acquisition costs | 211 | | | (44) | | | 167 | | |
| Effects on cost of insurance acquired | 115 | | | (24) | | | 91 | | |
| Effects on unearned revenue reserves | (349) | | | 73 | | | (276) | | |
| Other comprehensive income (loss) | $ | (42,797) | | | 2,727 | | | (40,070) | | |
(10) RELATED PARTY TRANSACTIONS
The Company has various routine related party transactions in conjunction with our holding company structure, such as a management service agreement related to costs incurred, a tax sharing agreement between entities, and inter-company dividends and capital contributions. There were no changes related to these relationships during the three months ended March 31, 2021.2022. See our Form 10-K for a comprehensive discussion of related party transactions.
(11) SUBSEQUENT EVENTS
The Company has evaluated the impact of subsequent events as defined by the accounting guidance through the date this report was issued.
CHANGE IN CONTROL
As previously disclosed, on February 5, 2021, Citizens, Inc. (the “Company”) entered into a Purchaseissued and Sale Agreement (the “Purchase Agreement”) with the Harold E. Riley Foundation (the “Foundation”)determined that no significant subsequent events need to purchase 100% of the Company’s Class B common stock (the “Class B Shares”) from the Foundation at an aggregate purchase price of $9.1 million (the “Class B Transaction”). In accordance with the Purchase Agreement, the purchase price was paid to the Foundation on March 5, 2021 and is reported within other assets rather than treasury stock on the consolidated balance sheets as all regulatory approvals had not been received as of March 31, 2021.be recognized or disclosed.
March 31, 20212022 | 10-Q 25
| | | | | | | | |
CITIZENS, INC.
| NOTES TO CONSOLIDATED FINANCIAL STATEMENTS |
| | (Unaudited)
|
Because the Class B Shares have the right to elect a simple majority of the Board, the Foundation was able to exercise control over the Company as the holder of 100% of the Class B Shares. Thus, in order to consummate the Class B Transaction, the Company and the Foundation were required to obtain regulatory approvals by the insurance regulators in Colorado, Louisiana, Mississippi, Texas and Bermuda, the jurisdictions in which the Company and its insurance subsidiaries are domiciled. On April 12, 2021, the Company and the Foundation received the last of the regulatory approvals required for the Foundation to divest control of the Company and thus all of the Foundation’s Class B Shares were transferred to the Company as of such date. In accordance with Colorado law, the Class B Shares are now classified as authorized, but unissued shares. On March 9, 2021, the Board passed a resolution stating that as long as the Class B Shares are being held as unissued shares, the Company will not vote, nor permit any other person or entity to exercise any voting rights or other rights, with respect to the Class B Shares. Accordingly, there is no party that now controls the Company.
March 31, 2021 | 10-Q 2624
| | | | | | | | |
| CITIZENS, INC. | MANAGEMENT'S DISCUSSION & ANALYSIS |
| | |
Item 2. MANAGEMENT'S DISCUSSION AND ANALYSIS OF FINANCIAL CONDITION AND RESULTS OF OPERATIONS
FORWARD-LOOKING STATEMENTS
This section and other parts of this Quarterly Report on Form 10-Q ("Form 10-Q") contain forward-looking statements, within the meaning of the Private Securities Litigation Reform Act of 1995, that involve risks and uncertainties. Forward-looking statements provide current expectations of future events based on certain assumptions and include any statement that does not directly relate to any historical or current fact. Forward-looking statements can also be identified by words such as “future,” “anticipates,” “believes,” “estimates,” “expects,” “intends,” “plans,” “predicts,” “will,” “would,” “could,” “can,” “may,” and similar terms. Forward-looking statements are not guarantees of future performance and the Company’s actual results may differ significantly from the results discussed in the forward-looking statements. Factors that might cause such differences include, but are not limited to, those discussed in Part II, Item 1Astatements concerning any potential future impact of this Form 10-Qthe coronavirus disease (“COVID-19”) pandemic on our business, as well as factors discussed in Part I, Item 1A ofthe "Risk Factors" contained in our Annual Report on Form 10-K for the year ended December 31, 2020 under the heading “Risk Factors,”2021, which are incorporated herein by reference.The Company assumes no obligation to revise or update any forward-looking statements for any reason, except as required by law.
The impacts of COVID-19 and related economic conditions on the Company's financial results, which began to affect the Company late in the first quarter of 2020, continue to be highly uncertain and outside the Company’s control. The scope, duration and magnitude of the direct and indirect effects of COVID-19 are difficult or impossible to anticipate. As a result, it is not possible to predict its impact on the Company's results for the remainder of 2021. Currently, some of the most significant factors that could cause our actual results to differ significantly from our forward-looking statements are those relating to the adverse effects of the COVID-19 pandemic, including:
•Decreased premium revenue and cash flow from disruption to our distribution channel of independent agents, customer self-isolation, travel limitations, business restrictions and decreased economic activity; and
•An unusually high level of claims, lapses or surrenders in our insurance operations, which could affect our liquidity and cash flow.
The following discussion should be read in conjunction with the consolidated financial statements and accompanying notes included in
Part I, Item 1 of this Form 10-Q. The Company assumes no obligation to revise or update any forward-looking statements for any reason, except as required by law.
The U.S. Securities and Exchange Commission ("SEC") maintains a website that contains reports, proxy and information statements, and other information regarding issuers, including the Company, that file electronically with the SEC. The public can obtain any documents that the Company files with the SEC at http://www.sec.gov. We also make available, free of charge, through our Internet website (http://www.citizensinc.com), our Annual Report on Form 10-K, Quarterly Reports on Form 10-Q, Current Reports on Form 8-K, Section 16 Reports filed by officers and directors, news releases, and, if applicable, amendments to those reports filed or furnished pursuant to Section 13(a) or 15(d) of the Securities Exchange Act of 1934, as soon as reasonably practicable after we electronically file such reports with, or furnish such reports to, the SEC. We are not including any of the information contained on our website as part of, or incorporating it by reference into, this Form 10-Q.
OVERVIEW
Citizens, Inc. ("Citizens" orFor over 45 years, we have been fulfilling the "Company") is an insurance holding company incorporated in Colorado serving the life insurance needs of individuals in the United States since 1969our policyholders and internationally since 1975. Through ourtheir families by providing insurance products that offer both living and death benefits. Citizens conducts insurance related operations through its insurance subsidiaries, wewhich provide insurance benefits to residents in 31 U.S. states and more than 7570 different countries. We pursue a strategy ofspecialize in offering traditionalprimarily ordinary whole life insurance, endowment products and final expense insurance in niche markets where we believe we are able to achievecan optimize our competitive advantages. We operate in two business segments:position.
•As an insurance provider, we collect premiums on an ongoing basis from our policyholders and invest the majority of the premiums to pay future benefits, including claims and surrenders and policyholder dividends. Accordingly, the Company derives its revenues principally from: (1) life insurance premiums earned for insurance coverages provided to insureds in our two operating segments – Life Insurance segment - U.S. dollar-denominated ordinary whole lifeand Home Service Insurance; and (2) net investment income. In addition to paying and reserving for insurance benefits that we pay to our policyholders, our expenses consist primarily of the costs of selling our insurance products (e.g., commissions, underwriting, marketing expenses), operating expenses and endowment policies predominantly soldincome taxes.
Objective of our Management's Discussion and Analysis
We refer to non-U.S. residents, located principallyour Management’s Discussion and Analysis of Financial Condition and Results of Operations as our “MD&A”. The objective of our MD&A is to provide investors with information in Latin Americaorder to assess the material changes in our financial condition from December 31, 2021 to March 31, 2022 and the Pacific Rim, through independent marketing consultants; andmaterial changes in our results of operations from March 31, 2021 to March 31, 2022. We also discuss in the MD&A any trends that we believe may materially affect our future operations or financial condition.
| | | | | | | | |
| CITIZENS, INC. | MANAGEMENT'S DISCUSSION & ANALYSIS |
| | |
The Factors that Drive our Operating Results
We see the following as the primary factors that drive our operating results:
•Sales (i.e., premium revenues)
•Investments
•Death claims and surrenders
•Operating expenses
As premium revenues and investment income are our two primary sources of income, both new sales and "resells" (i.e. retaining the policy) as well as our investments and the interest we receive on such investments, are key to our profitability.
Our premium revenue increased in the first three months of 2022 compared to 2021 as growth in renewal premiums in both segments more than offset lower first-year premiums in our Life Insurance segment, which in 2022 decreased by 19.8% compared to 2021. Renewal premiums increased 2.4% in 2022 as compared to 2021, which we believe is due to strong first year sales in 2021 and continued retention and collection efforts.
While interest rates have recently started to increase, our yield declined 1 basis point to 4.20% in the first three months of 2022 as a substantial portion of our fixed maturity portfolio was called or matured over the past few years and we faced challenges in finding comparable yields. Our net investment income increased by $0.2 million from the 2021 period to the 2022 period due to a growing asset base and positive returns from our middle market private equity investment.
As part of the ongoing process of managing our portfolio and optimizing performance we have been diversifying our investment portfolio in order to help mitigate the effects of the sustained low interest rate environment, however, this diversification comes with some volatility and accordingly, due to the general market decline in the first quarter of 2022, we incurred investment related losses of $0.6 million in the current period compared to gains of $0.3 million in prior year quarter.
Payment of policyholder benefits for death claims and surrenders is our largest expense and thus also key to our profitability. In the first quarter of 2022, our death claims decreased. Death claims in the 2021 period in our Life Insurance segment were negatively impacted by higher reported claims, including COVID-19 related deaths and the average dollar amount of claims incurred. Our surrenders decreased in the first quarter of 2022 compared to the
| | | | | | | | |
| CITIZENS, INC. | MANAGEMENT'S DISCUSSION & ANALYSIS |
| | |
same period in 2021, which we believe was in large part due to our retention initiatives.
Operating expenses are our second largest expense and thus drive our operating results. Our general operating expenses decreased by $0.4 million in 2022 as compared to 2021.
FINANCIAL HIGHLIGHTS
Financial Condition at March 31, 2022
•Total investments of $1.5 billion; fixed maturity securities comprised 89.6% of total investments.
•Total assets of $1.7 billion.
•Total stockholders' equity of $0.2 billion.
•$4.6 billion of direct insurance in force.
•No debt.
•Fully diluted loss per share of Class A common stock of $0.03.
Our net loss decreased by $2.2 million in the three months ended March 31, 2022 to $1.3 million compared to $3.6 million in prior year period. The decrease in our net loss was primarily due to a decrease in death claims, federal income tax and other general expenses partially offset by investment losses reflecting changes in fair value of our equity investments, as discussed in Part I, Item 1, Note 5. Investments, changes in fair values of our equity securities are reflected in investment gains or losses, in addition to executed transactions that result in a gain or loss.
| | | | | | | | |
| CITIZENS, INC. | MANAGEMENT'S DISCUSSION & ANALYSIS |
| | |
•Home Service Insurance segment - final expense life insurance and limited liability property insurance policies marketed to middle- and lower-income households in Louisiana, Mississippi and Arkansas, sold through independent agents and through funeral homes.COVID-19 PANDEMIC
CURRENT FINANCIAL HIGHLIGHTS
In bothThe overall impact of COVID-19 and its related economic conditions on the three monthsCompany's financial results continue to be highly uncertain and unpredictable. While the Company has implemented new strategies and processes to mitigate this impact, the scope, duration and magnitude of the direct and indirect effects of COVID-19 are difficult or impossible to anticipate. As a result, it is not possible to predict its impact on the Company's results in 2022 or beyond. While we don't believe that COVID-19 materially impacted our results of operations for the quarter ended March 31, 2021 and 2020, we had a net loss of $3.6 million; however, our net loss before federal income tax increased by $0.5 million in the three months ended March 31, 2021 compared to prior year period. The increase in the pre-tax net loss in the 2021 period was driven by a $4.1 million increase in claims and surrender benefits, which was higher in both our Life Insurance and our Home Service Insurance segments. The higher claim expense was a result of a higher volume of reported claims, including those COVID-19 related, in addition to an increase in the average death claim amount in both segments. We also continued to experience an increase in surrender benefits and matured endowments in the Life Insurance segment, which we believe is due primarily to the aging block of business and other economic circumstances.
Our realized investment gains improved by $1.6 million in the three months ended March 31, 2021, to $0.3 million, from a $1.3 million loss in the prior year period. As discussed in Part I, Item 1, Note 5. Investments, changes in realized gains reflect the changes in fair values of our equity securities. In the three months ended March 31, 2020, we recorded realized losses of $1.1 million, which were primarily the result2022, some of the sudden stock market decline resulting from the onset of the COVID-19 pandemic.
Our other general expenses continued to be negatively impacted in the three months ended March 31, 2021 by the expensesmost significant factors related to professional fees incurred in connection with the change in control of the Company. A detailed description of the change in control of the Company and expenses related thereto are included in the Company’s Annual Report on Form 10-K for the fiscal year ended December 31, 2020 ("Form 10-K"). The settlement of all legal issues relatedCOVID-19 that could cause our future results to the change in control occurred in the first quarter of 2021 and thus, we do not expect any additional expenses related to this matter. See Part I, Item 1, Business – "Change in Control; Agreement to Purchase the Class B Shares; Anticipated Divestiture of Control” indiffer significantly from our Form 10-K and Part I, Item 1, Note. 11 Subsequent Events in the notes to our consolidated financial statements herein for a further discussion of the change in control. Despite the change in control costs, our other general expenses decreased slightly for the three months ended March 31, 2021 compared to the same period in 2020. The change in control costs were offset by lower salary and benefit expenses resulting from converting our Home Service Insurance sales agents to independent agents and lower audit and consulting fees.
Consolidated Revenue Highlights
Insurance premiums and investment income are our primary sources of revenue. In the three months ended March 31, 2021 as compared to the same period in 2020:prior results or expectations include:
•Insurance premiums declined by $2.3 million, or 5.5%,a higher level of claims due to $39.0 million from $41.3 million in the same period in 2020. The decline was driven by our Life Insurance segment as renewal premiums declined 9.3% to $24.6 million in the first quarter of 2021 from $27.1 million in the same period in 2020. The decrease in renewal premiums resulted primarily from a decline in our in force business in this segment, which is due in part to changes we made to our products and distribution over the last few years.COVID-19 deaths;
•Netdecreased premium revenue due to disruption to our workforce or distribution channel resulting from required isolation, travel limitations and business restrictions;
•higher surrenders and lapses due to cash needs our policyholders may have due to concerns over COVID-19 economic impacts; and
•volatility in our investment income was $15.2 million in both periods.portfolio due to market disruptions caused by COVID-19 related concerns such as inflation.
Additionally, realized investment gains increased by $1.6 million primarily forWe continue to monitor the reason discussed above. Other income increased 68.8% to $0.9 million from $0.5 million forimpact of the same period in 2020. Other income consists primarily of policyholders selecting supplemental contracts upon maturity of their original policies, which has been increasing over the past few quarters.
| | | | | | | | |
CITIZENS, INC. | MANAGEMENT'S DISCUSSION & ANALYSIS |
| | |
Consolidated Benefits and Expenses Highlights
The primary use ofCOVID-19 pandemic on our funds is payment of insurance benefits. As discussed above, our claims and surrender benefits increased by $4.1 million in the three months ended March 31, 2021 as compared to the same period in prior year; however, total insurance benefits paid or provided was essentially flat year-over-year, as the increase in claims and surrender benefits was offset by a decrease in future policy benefit reserves. Future policy benefit reserves decreased due to the lower in force block of business.
The other primary use of funds are the costs of selling our insurance products (e.g., commissions, underwriting, marketing expenses) and general expenses. Costs incurred related to selling our insurance products remained flat in the three months ended March 31, 2021 as compared to the same period in prior year and as discussed above, general expenses slightly decreased for the period.
2021 First Quarter Financial Condition
•Total investments of $1.5 billion; fixed maturity securities comprised 91.9% of total investments.
•Total assets of $1.8 billion.
•$4.6 billion of direct insurance in force.
•No debt.operations.
OUR OPERATING SEGMENTS
OurWe manage our business is comprised ofin two operating business segments, as detailed below.
•Life Insurance
• and Home Service InsuranceInsurance.
Our insurance operations are the primary focus of the Company, as these operations generate most of our income. See the discussion under Segment Operations below for detailed analysis. The amount of insurance, number of policies, and average face amounts of ordinary life policies issued during the periods indicated are shown below.
| | Three Months Ended March 31, | Three Months Ended March 31, | 2021 | | 2020 | Three Months Ended March 31, | | 2022 | | 2021 |
| | | Amount of
Insurance
Issued | | Number of
Policies
Issued | | Average Policy
Face Amount
Issued | | Amount of
Insurance
Issued | | Number of
Policies
Issued | | Average Policy
Face Amount
Issued | | Amount of
Insurance
Issued | | Number of
Policies
Issued | | Average Policy
Face Amount
Issued | | Amount of
Insurance
Issued | | Number of
Policies
Issued | | Average Policy
Face Amount
Issued |
| Life Insurance | Life Insurance | $ | 50,330,540 | | | 863 | | | $ | 58,320 | | | $ | 49,611,100 | | | 728 | | | $ | 68,147 | | Life Insurance | $ | 42,524,454 | | | 633 | | | $ | 67,179 | | | $ | 50,330,540 | | | 863 | | | $ | 58,320 | |
| Home Service Insurance | Home Service Insurance | 44,658,259 | | | 6,361 | | | 7,021 | | | 36,117,767 | | | 5,174 | | | 6,981 | | Home Service Insurance | 54,823,369 | | | 5,431 | | | 10,095 | | | 44,658,259 | | | 6,361 | | | 7,021 | |
| Total | Total | $ | 94,988,799 | | | 7,224 | | | $ | 85,728,867 | | | 5,902 | | | Total | $ | 97,347,823 | | | 6,064 | | | $ | 94,988,799 | | | 7,224 | | |
WeTotal insurance issued $95.0 million of insuranceincreased by 2.5% in the three months ended March 31, 2021 as compared to $85.72022, from $95.0 million in 2020, as boththe first three months of 2021 to $97.3 million in 2022. The growth was driven by our Life Insurance and Home Service Insurance segments experienced growth. Wesegment. Total insurance issued 7,224 new policies in 2021, as compared to 5,902 new policies in 2020.
The number of policies issuedour Home Service Insurance segment increased by $10.2 million, or 22.8% in the three months ended March 31, 2022 as compared to the same period in 2021, increased 18.5%despite the decrease in the Life Insurance segment.number of policies issued. The increase in applicationshigher average policy face amounts issued is attributable to sales campaigns that focused on increasing the face amount of insurance sold as well as the introduction of our new whole life product in this segment, which has a higher maximum face value.
Despite higher average policy face values, total insurance issued in our Life Insurance segment decreased in the first quarter was primarily due to enhancements to our business operations and sales practices to account for the impact of the COVID-19 pandemic, including sales promotions and campaigns, focused training on virtual selling and strategically prioritizing selling lower face amount policies, which typically have less stringent underwriting requirements and, in some cases, may not require the completion of medical tests,three months ended March 31, 2022 as many of our top international markets remain in quarantine duecompared to the COVID-19 pandemic. Inprior year period as the number of policies issued decreased 26.7%. We continue to prioritize recruiting new independent consultants.
March 31, 20212022 | 10-Q 2928
| | | | | | | | |
| CITIZENS, INC. | MANAGEMENT'S DISCUSSION & ANALYSIS |
| | |
addition, in order to address the decreasing first year premiums we have seen in recent years in this segment, we prioritized recruiting new independent contractors in the first quarter of 2021, and we began to see the impact of these efforts in March. Although applications increased during the first quarter of 2021 compared to the same period last year due to these enhancements, average policy face amount declined by almost $10,000 per policy, as we continued to emphasize the selling of lower face amount policies, as noted above.
The number of policies issued in the three months ended March 31, 2021 increased 22.9% in the Home Service Insurance segment compared to the same period in 2020. The increase in new business applications in our Home Service Insurance segment was driven by the broadening of a sales campaign introduced during the third quarter of last year targeted at existing policyholders that emphasizes increased coverage as well as lower applications received in the prior year period as the onset of the COVID-19 pandemic and stay-at-home orders negatively impacted our business. During the first quarter of 2021, as part of the campaign, we increased the target face amount of insurance. As a result, the overall average face amount of policies issued for the Home Service Insurance segment increased slightly compared to the first quarter of 2020.
CONSOLIDATED RESULTS OF OPERATIONS
A discussion of consolidated results is presented below, followed by a discussion of segment operations and financial results by segment.
REVENUES
Our revenues are generated primarily by insurance renewal premiums and investment income onfrom invested assets.assets, both of which increased in the first quarter of 2022 as compared to the first quarter of 2021.
| | | | | Three Months Ended | | | | Three Months Ended |
| | | | March 31, | | | | March 31, |
| (In thousands) | (In thousands) | | | 2021 | | 2020 | (In thousands) | | | 2022 | | 2021 |
| | Revenues: | Revenues: | | | | | | Revenues: | | | | | |
| Premiums: | Premiums: | | | | | | Premiums: | | | | | |
| Life insurance | Life insurance | | | $ | 37,642 | | | 39,946 | | Life insurance | | | $ | 37,746 | | | 37,642 | |
| Accident and health insurance | Accident and health insurance | | | 343 | | | 261 | | Accident and health insurance | | | 286 | | | 343 | |
| Property insurance | Property insurance | | | 1,047 | | | 1,110 | | Property insurance | | | 1,332 | | | 1,047 | |
| Net investment income | Net investment income | | | 15,244 | | | 15,169 | | Net investment income | | | 15,487 | | | 15,244 | |
| Realized investment gains (losses), net | | | 292 | | | (1,306) | | |
| Investment related gains (losses), net | | Investment related gains (losses), net | | | (582) | | | 292 | |
| Other income | Other income | | | 915 | | | 542 | | Other income | | | 1,088 | | | 915 | |
| Total revenues | Total revenues | | | $ | 55,483 | | | 55,722 | | Total revenues | | | $ | 55,357 | | | 55,483 | |
Premium Income. PremiumTotal premium income derived from life, accident and health, and property insurance sales decreased $2.3increased $0.3 million, or 5.5%0.9%, for the three months ended March 31, 20212022 compared to the same period in 2020. The overall decrease2021 due to higher renewal year premiums in premiumboth our segments.
Net Investment Income. Asummary of our net investment income was driven primarilyand annualized net investment income performance are summarized as follows:
| | | | | | | | | | | | | | | | | |
| | | Three Months Ended |
| | | March 31, |
| (In thousands, except for %) | | | | | 2022 | | 2021 |
| | | | | | | |
| Gross investment income: | | | | | | | |
| Fixed maturity securities | | | | | $ | 13,883 | | | 14,100 | |
| Equity securities | | | | | 151 | | | 207 | |
| Policy loans | | | | | 1,589 | | | 1,644 | |
| Long-term investments | | | | | 523 | | | 73 | |
| Other investment income | | | | | 21 | | | 15 | |
| Total investment income | | | | | 16,167 | | | 16,039 | |
| Investment expenses | | | | | (680) | | | (795) | |
| Net investment income | | | | | $ | 15,487 | | | 15,244 | |
| | | | | | | |
| | | | | | | |
| | | | | | | |
| Net investment income, annualized | | | | | $ | 61,948 | | | 60,976 | |
| Average invested assets, at amortized cost | | | | | 1,473,240 | | | 1,449,518 | |
| Annualized yield on average invested assets | | | | | 4.20 | % | | 4.21 | % |
| | | | | | | | |
| CITIZENS, INC. | MANAGEMENT'S DISCUSSION & ANALYSIS |
| | |
Our total investment income increased by 0.8%. Income from fixed maturity securities income decreased 1.5% for the three months ended March 31, 2022, compared to the same period in 2021 as the three months ended March 31, 2021 included a $2.5non-recurring "make-whole" call redemption. Long-term investment income increased as our limited partnership investments asset base grew, in addition to some early distribution income.
Annualized net investment income increased by $1.0 million decline throughoutin the firstthree months ended March 31, 2022 as compared to the same three months of 2021 despite a slightly lower annualized yield due to our growing asset base and to strong yields from our middle market private equity investment.
Investment Related Gains (Losses), Net. We recorded investment related losses of $0.6 million during the three months ended March 31, 2022 as compared to investment gains of $0.3 million during the three months ended March 31, 2021. The gains and losses are related to fair value change in renewal premiumsour equity securities owned.
Other income consists primarily of policyholders in our Life Insurance segment. The decrease in renewal premiums insegment selecting supplemental contracts upon the Life Insurance segment continues to result from a decline in our in force business in this segmentsurrender or maturity of their original policies, which has been increasing over the past few years, which is due in part to changes we made to our products and distributionquarters.
BENEFITS AND EXPENSES | | | | | | | | | | | | | | | | | |
| | | | Three Months Ended |
| | | March 31, |
| (In thousands) | | | | | 2022 | | 2021 |
| | | | | | | | |
| Benefits and expenses: | | | | | | | |
| Insurance benefits paid or provided: | | | | | | | |
| Claims and surrenders | | | | | $ | 28,434 | | | 30,589 | |
| Increase in future policy benefit reserves | | | | | 6,569 | | | 5,232 | |
| Policyholders' dividends | | | | | 1,353 | | | 1,306 | |
| Total insurance benefits paid or provided | | | | | 36,356 | | | 37,127 | |
| Commissions | | | | | 7,673 | | | 8,157 | |
| Other general expenses | | | | | 11,030 | | | 11,382 | |
| Capitalization of deferred policy acquisition costs | | | | | (4,781) | | | (4,985) | |
| Amortization of deferred policy acquisition costs | | | | | 5,817 | | | 6,183 | |
| Amortization of cost of insurance acquired | | | | | 236 | | | 367 | |
| Total benefits and expenses | | | | | $ | 56,331 | | | 58,231 | |
Claims and surrenders
outpacing new sales. Premium revenues continuebenefits and general expenses are our primary uses of cash, both of which decreased in the first quarter of 2022 as compared to
be negatively impacted by high levelsthe first quarter of
surrenders, which we believe are due not only to an aging block of business (i.e., maturities and surrenders of products where the surrender charges are close to expiring or have expired) and our decision to cease issuing new policies in Brazil in 2017 (where we see many policies lapsing), but also due to economic circumstances in Latin America. See the detailed distribution of premiums within Segment Operations discussed below.2021.
March 31, 20212022 | 10-Q 30
| | | | | | | | |
| CITIZENS, INC. | MANAGEMENT'S DISCUSSION & ANALYSIS |
| | |
Net Investment Income.Claims and Surrenders. Our annualized net investment income performance is summarized as follows.
| | | | | | | | | | | | | | | | | |
| March 31, | | December 31, | | March 31, |
| (In thousands, except for %) | 2021 | | 2020 | | 2020 |
| | | | | | |
| Net investment income, annualized | $ | 60,976 | | | 60,197 | | | 60,676 | |
| Average invested assets, at amortized cost | 1,449,518 | | | 1,420,129 | | | 1,408,688 | |
| Annualized yield on average invested assets | 4.21 | % | | 4.24 | % | | 4.31 | % |
| | | | | | | | | | | | | | | | | |
| | | Three Months Ended |
| | | March 31, |
| (In thousands) | | | | | 2022 | | 2021 |
| | | | | | | | |
| Claims and Surrenders: | | | | | | | |
| Death claim benefits | | | | | $ | 7,017 | | | 8,940 | |
| Surrender benefits | | | | | 12,259 | | | 12,807 | |
| Endowment benefits | | | | | 2,134 | | | 2,401 | |
| Matured endowment benefits | | | | | 6,134 | | | 5,122 | |
| Property claims | | | | | 142 | | | 321 | |
| A&H and other policy benefits | | | | | 748 | | | 998 | |
| | | | | | | |
| | | | | | | |
| Total claims and surrenders | | | | | $ | 28,434 | | | 30,589 | |
Annualized net investment incomeDeath claim benefits decreased 21.5% for the three months ended March 31, 2022 compared to the same period in 2021. Death claims in our Life Insurance segment decreased 63.1% during the first three months of 2022 compared to the same period in 2021 and Home Service Insurance segment claims decreased 3.7%. The decrease in both segments during the first three months of 2022 compared to the same period last year was due primarily a lower volume of reported death claims, including COVID-19 related deaths.
Surrender benefits decreased 4.3% for the three months ended March 31, 2022 compared to the same period in 2021. Surrender benefits represented less than 0.3% of total direct ordinary whole life insurance in force of $4.6 billion as of March 31, 2022. We have focused our efforts on retaining policyholders and believe we have begun to see positive benefits from these efforts starting in the second half of 2021.
Matured endowment benefits increased slightly19.8% for the three months ended March 31, 2022, compared to the same period in 2021. We anticipated this increase based upon the dates when our endowment contracts were sold and the maturity dates set forth in the contracts.
Property claims decreased 55.8% in the three months ended March 31, 2021 as compared to the same annualized performance in the 2020 period as an increase in average invested assets derived from cash flows from our insurance operations and a one-time benefit described below offset a lower portfolio yield. The annualized yield decreased by ten basis points during the first quarter of 20212022 compared to the same period in 2020, as we continue2021 due to face a challenging investment environment for fixed maturity assets, which account for the majority of our investment portfolio. As part of the ongoing process of managing our portfolio and optimizing performance, we are continuing to identify and invest in new asset classes, including private equities.lower hurricane property claims.
Investment income from fixed maturity securities accountedOther General Expenses. General expenses decreased 3.1% in the three months ended March 31, 2022 compared to the same period in 2021. In the first quarter of 2022 we had lower operating expenses primarily due to consulting fees paid to our former CEO and professional fees incurred in connection with the change in control of the Company, both in the first quarter of 2021, partially offset by higher current quarter expenses associated with our home office.
Explanation of other benefits and expenses
Increase in Future Policy Benefit Reserves. Future policy benefit reserves reflect the liability established to provide for approximately 87.9%the payment of total investment incomepolicy benefits that we expect to pay in the future and thus increase when we have a higher in force block of business due to higher sales and persistency (i.e., more policies on which we expect to pay future benefits) and decrease when we have lower sales and persistency. The change in future policy benefit reserves increased 25.6% for the three months ended March 31, 2021.
| | | | | | | | | | | | | | | | | |
| | | Three Months Ended |
| | | March 31, |
| (In thousands) | | | | | 2021 | | 2020 |
| | | | | | | |
| Gross investment income: | | | | | | | |
| Fixed maturity securities | | | | | $ | 14,100 | | | 13,868 | |
| Equity securities | | | | | 207 | | | 180 | |
| Policy loans | | | | | 1,644 | | | 1,623 | |
| Long-term investments | | | | | 73 | | | 1 | |
| Other investment income | | | | | 15 | | | 68 | |
| Total investment income | | | | | 16,039 | | | 15,740 | |
| Investment expenses | | | | | (795) | | | (571) | |
| Net investment income | | | | | $ | 15,244 | | | 15,169 | |
| | | | | | | |
| | | | | | | |
Income from fixed maturity securities income increased 1.7% for the three months ended March 31, 2021,2022, compared to the same period in 2020 and our total investment income increased by 1.9% in the same period2021 due to the recognition of accelerated interest payments resulting from a “make-whole” call redemption, whereby the borrower was required to pay a lump sum based on the net present value of interest payments foregone due to the call. Investment expenses were slightly higher due to our increased investments in private equity, which often include start-up fees.better persistency.
Realized Investment Gains (Losses), Net.Commissions. We recorded realized gainsCommission expenses are a cost of $0.3 million duringacquiring business, as commissions are the primary compensation paid to our independent consultants and independent agents for selling our products. First year commission rates are higher than renewal commission rates and thus commissions fluctuate directly in relation to first quarter of 2021 related to fair value changes in our equity securities owned at March 31, 2021. The fair value of our equity securities owned at March 31, 2020 was negatively impacted by the onset of the COVID-19 pandemic as discussed above.year sales.
March 31, 20212022 | 10-Q 31
| | | | | | | | |
| CITIZENS, INC. | MANAGEMENT'S DISCUSSION & ANALYSIS |
| | |
BENEFITS AND EXPENSES
| | | | | | | | | | | | | | | | | |
| | | | Three Months Ended |
| | | March 31, |
| (In thousands) | | | | | 2021 | | 2020 |
| | | | | | | | |
| Benefits and expenses: | | | | | | | |
| Insurance benefits paid or provided: | | | | | | | |
| Claims and surrenders | | | | | $ | 30,589 | | | 26,449 | |
| Increase in future policy benefit reserves | | | | | 5,232 | | | 9,471 | |
| Policyholders' dividends | | | | | 1,306 | | | 1,233 | |
| Total insurance benefits paid or provided | | | | | 37,127 | | | 37,153 | |
| Commissions | | | | | 8,157 | | | 7,853 | |
| Other general expenses | | | | | 11,382 | | | 11,473 | |
| Capitalization of deferred policy acquisition costs | | | | | (4,985) | | | (5,009) | |
| Amortization of deferred policy acquisition costs | | | | | 6,183 | | | 6,119 | |
| Amortization of cost of insurance acquired | | | | | 367 | | | 368 | |
| Total benefits and expenses | | | | | $ | 58,231 | | | 57,957 | |
Claims and Surrenders. Death claim and surrender benefits are our primary use of cash. As reflected in the table below, claims and surrender benefits increased 16.6%, from $18.6 million in the three months ended March 31, 2020, to $21.7 million in the three months ended March 31, 2021.
| | | | | | | | | | | | | | | | | |
| | | Three Months Ended |
| | | March 31, |
| (In thousands) | | | | | 2021 | | 2020 |
| | | | | | | | |
| Claims and Surrenders: | | | | | | | |
| Death claim benefits | | | | | $ | 8,940 | | | 6,589 | |
| Surrender benefits | | | | | 12,807 | | | 12,055 | |
| Endowment benefits | | | | | 2,401 | | | 2,739 | |
| Matured endowment benefits | | | | | 5,122 | | | 3,753 | |
| Property claims | | | | | 321 | | | 487 | |
| Accident and health benefits | | | | | 59 | | | 53 | |
| Other policy benefits | | | | | 939 | | | 773 | |
| Total claims and surrenders | | | | | $ | 30,589 | | | 26,449 | |
•Death claim benefits increased 35.7% for the three months ended March 31, 2021, compared to the same period in 2020 - Life Insurance segment claims increased 55.6% and Home Service Insurance segment claims increased 28.6%. As discussed above in "Current Financial Highlights", the increase was due to increases in reported claims, including COVID-19 related deaths, and the average dollar amount of claims incurred.
•Surrender benefits increased 6.2% for the three months ended March 31, 2021, compared to the same period in 2020. Surrender benefits represented less than 0.3% of total direct ordinary whole life insurance in force of $4.6 billion as of March 31, 2021. A significant portion of surrender benefits relates to international policies that have been in force and have little or no associated surrender charges.
| | | | | | | | |
CITIZENS, INC. | MANAGEMENT'S DISCUSSION & ANALYSIS |
| | |
•Matured endowment benefits increased 36.5% for the three months ended March 31, 2021, compared to the same period in 2020. We anticipated this increase based upon the dates when our endowment contracts were sold and the maturity dates set forth in the contracts.
Increase in Future Policy Benefit Reserves. The change in future policy benefit reserves decreased 44.8% for the three months ended March 31, 2021, compared to the same period in 2020. Future policy benefit reserves decreased as our block of in force business decreased.
Commissions. Commission expenses are a cost of acquiring business, as commissions are the primary compensation paid to our independent consultants and independent agents for selling our products. First year commission rates are higher than renewal commission rates. Commissions fluctuate directly in relation to sales and were higher in the three months ended March 31, 2021 due to the increase in first year sales in our Home Service Insurance segment.
Other General Expenses. As mentioned above, general expenses decreased slightly in the three months ended March 31, 2021 compared to the same period in 2020, driven primarily by lower incentive compensation costs, and lower audit and consulting costs.
Capitalization and Amortization of Deferred Policy Acquisition Costs. Costs capitalized include certain commissions, policy issuance costs, and underwriting and agency expenses that relate to successful sales efforts for insurance contracts. Capitalized costs decreased slightly during the three months ended March 31, 2021 compared to the same period in 2020 as we experienced a decrease incontracts and thus fluctuate primarily with first year premium production in our Life Insurance segment as previously discussed. Amortization of deferred policy acquisition costs was slightly higher during the three months ended March 31, 2021 compared to the same period in the prior year.sales. Amortization is impacted by persistency, surrenders, and new sales production and thus it may fluctuate from quarter to quarter.
Federal Income Tax. Tax expense decreased for the three months ended March 31, 2021 compared to the same period in 2020 resulting in effective tax rates of (30.0)% and (60.3)%, respectively. For the three months ended March 31, 2020, the Company's federal income tax expense was impacted by the gain realizedquarter depending on the sale of our former corporate headquarters. The Company's tax rate was impacted by differences between our effective tax rate and the statutory tax rate resulting from income and expense items that are treated differently for financial reporting and tax purposes. In addition, CICA Ltd., a wholly-owned Bermuda subsidiary of Citizens, is considered a controlled foreign corporation for federal tax purposes and CICA Ltd.'s activity gives rise to taxable income in the U.S. as Subpart F Income, which is treated as a permanent tax difference and therefore included in the Company's effective tax rate calculation. See Part I, Item 1, Note 8. Income Taxes in the notes to our consolidated financial statements herein.these factors.
SEGMENT OPERATIONS
Our business is comprised of two operating business segments, as detailed below.
•Life Insurance
•Home Service Insurance
These segments are reported in accordance with U.S. GAAP. The Company's Other Non-Insurance enterprises include non-insurance operations such as IT and corporate-support functions, which are included in the table presented below to properly reconcile the segment information with the consolidated financial statements of the Company.
The following table shows income (loss) before federal income taxes by segments during the periods indicated.
| | | | | | | | | | | | | | | | | |
| | | Three Months Ended |
| | | March 31, |
| (In thousands) | | | | | 2022 | | 2021 |
| Income (loss) before federal income tax expense: | | | | | | | |
| Segments: | | | | | | | |
| Life Insurance | | | | | $ | 1,030 | | | (106) | |
| Home Service Insurance | | | | | (1,240) | | | (758) | |
| Total segments | | | | | (210) | | | (864) | |
| Other Non-Insurance enterprises | | | | | (764) | | | (1,884) | |
| Total income (loss) before federal income tax expense | | | | | $ | (974) | | | (2,748) | |
LIFE INSURANCE
Income before federal income tax expense in our Life Insurance segment increased by $1.1 million in the first three months of 2022 as compared to the prior year period driven by higher net investment income and lower death benefits, partially offset by higher investment related losses and higher operating expenses.
| | | | | | | | |
| CITIZENS, INC. | MANAGEMENT'S DISCUSSION & ANALYSIS |
| | |
Detailed results of operations for the Life Insurance segment for the periods indicated are as follows:
| | | | | | | | | | | | | | | | | |
| | | Three Months Ended |
| | | March 31, |
| (In thousands) | | | | | 2022 | | 2021 |
| Revenues: | | | | | | | |
| Premiums | | | | | $ | 26,931 | | | 27,063 | |
| Net investment income | | | | | 11,971 | | | 11,598 | |
| Investment related gains (losses), net | | | | | (293) | | | (108) | |
| Other income | | | | | 1,088 | | | 913 | |
| Total revenues | | | | | 39,697 | | | 39,466 | |
| Benefits and expenses: | | | | | | | |
| Insurance benefits paid or provided: | | | | | | | |
| Claims and surrenders | | | | | 21,458 | | | 23,270 | |
| Increase in future policy benefit reserves | | | | | 5,130 | | | 3,658 | |
| Policyholders' dividends | | | | | 1,350 | | | 1,296 | |
| Total insurance benefits paid or provided | | | | | 27,938 | | | 28,224 | |
| Commissions | | | | | 3,806 | | | 4,231 | |
| Other general expenses | | | | | 5,691 | | | 5,226 | |
| Capitalization of deferred policy acquisition costs | | | | | (3,306) | | | (3,561) | |
| Amortization of deferred policy acquisition costs | | | | | 4,482 | | | 5,348 | |
| Amortization of cost of insurance acquired | | | | | 56 | | | 104 | |
| Total benefits and expenses | | | | | 38,667 | | | 39,572 | |
| Income (loss) before federal income tax expense | | | | | $ | 1,030 | | | (106) | |
Life Insurance segment premium breakout is detailed below.
| | | | | | | | | | | | | | | | | |
| | | Three Months Ended |
| | | March 31, |
| (In thousands) | | | | | 2022 | | 2021 |
| Premiums: | | | | | | | |
| First year | | | | | $ | 1,987 | | | 2,479 | |
| Renewal | | | | | 24,944 | | | 24,584 | |
| Total premiums | | | | | $ | 26,931 | | | 27,063 | |
| | | | | | | |
Premiums. We derive most of our premium revenue in the Life Insurance segment from renewal premiums, which increased 1.5% in the three months ended March 31, 2022 as compared to the same period in 2021. Despite this increase, total premium revenues decreased slightly for the three months ended March 31, 2022 compared to the same period in 2021 due to a decrease in first year premiums. We believe that the decline in first year premiums in our Life Insurance segment is primarily related to a reduction of sales in existing products in anticipation of our new whole life product, which was released March 10, 2022, as well as a continued decline in production in Venezuela due to one of our top distributors leaving our Company. We discussed in Item 3 - Legal Proceedings in our Annual Report on Form 10-K for the year ended December 31, 2021 this agent who we believe is illegally competing with us and stealing our trade secrets and business.
| | | | | | | | |
| CITIZENS, INC. | MANAGEMENT'S DISCUSSION & ANALYSIS |
| | |
International Life Insurance Premiums. The following table shows income (loss) before federal income taxes by segments duringgraph sets forth, for our top five producing countries, our direct premiums from our international life insurance business for the periods indicated.three months ended March 31, 2022 and 2021.
| | | | | | | | | | | | | | | | | |
| | | Three Months Ended |
| | | March 31, |
| (In thousands) | | | | | 2021 | | 2020 |
| Income (loss) before federal income tax expense: | | | | | | | |
| Segments: | | | | | | | |
| Life Insurance | | | | | $ | (106) | | | 2,086 | |
| Home Service Insurance | | | | | (758) | | | (2,145) | |
| Total segments | | | | | (864) | | | (59) | |
| Other Non-Insurance enterprises | | | | | (1,884) | | | (2,176) | |
| Total loss before federal income tax expense | | | | | $ | (2,748) | | | (2,235) | |
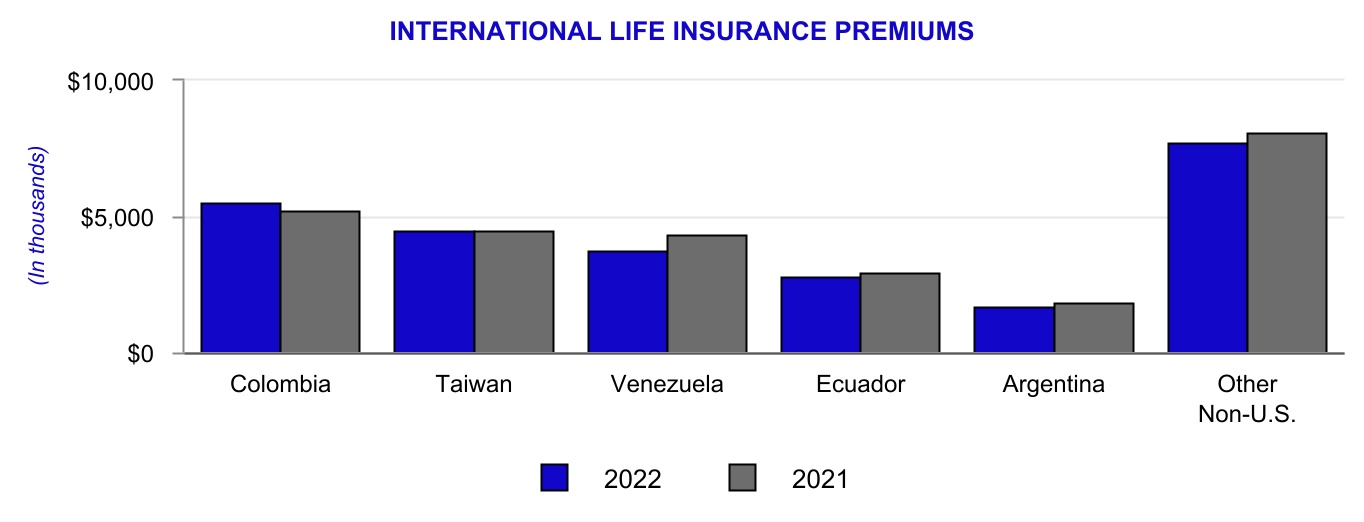
| | | | | | | | | | | | | | | | | |
| | | Three Months Ended |
| | | March 31, |
| (In thousands) | | | | | 2022 | | 2021 |
| Country: | | | | | | | |
| Colombia | | | | | $ | 5,531 | | | 5,244 | |
| Taiwan | | | | | 4,515 | | | 4,484 | |
| Venezuela | | | | | 3,751 | | | 4,368 | |
| Ecuador | | | | | 2,775 | | | 2,921 | |
| Argentina | | | | | 1,707 | | | 1,828 | |
| Other Non-U.S. | | | | | 7,690 | | | 8,105 | |
| Total | | | | | $ | 25,969 | | | 26,950 | |
Domestic Life Insurance Premiums. Domestic premiums in our Life Insurance segment were $1.0 million in the three months ended March 31, 2022, compared to $1.2 million in the prior year period. Our domestic in force business results primarily from blocks of business of insurance companies we have acquired over the years. We discontinued new sales in these blocks in 2017 and therefore the majority of the premium recorded is related to renewal business that has been decreasing over the last several years.
LIFE INSURANCENet Investment Income. Annualized net investment income in our Life Insurance segment was as follows:
Our | | | | | | | | | | | | | | | |
| March 31, | | | | March 31, |
| (In thousands, except for %) | 2022 | | | | 2021 |
| Net investment income, annualized | $ | 47,883 | | | | | 46,393 | |
| Average invested assets, at amortized cost | 1,134,903 | | | | | 1,107,540 | |
| Annualized yield on average invested assets | 4.22 | % | | | | 4.19 | % |
Annualized net investment income in our Life Insurance segment primarily operates through CICA Ltd. (a Bermuda company), which issues ordinary whole life insurance and endowment policiesincreased in U.S. Dollar-denominated amountsthe three months ended March 31, 2022 compared to non-U.S. residentsthe same period annualized in more than 75 countries through independent marketing consultants. The whole life products are designed2021 due to provide a fixed amount of insurance coverage over the life of the insured and can include rider benefits to provide additional coverage and annuity benefits to enhance accumulations. The endowment contracts are principally accumulation contracts that incorporate an element of life insurance protection. For the majority of our business, we retain the first $0.1 million on any one life and reinsure the remainder of the risk. We operate the Life Insurance segment internationally through CICA Ltd. and domestically through our CICA and CNLIC insurance subsidiaries.
March 31, 20212022 | 10-Q 34
| | | | | | | | |
| CITIZENS, INC. | MANAGEMENT'S DISCUSSION & ANALYSIS |
| | |
Theincluding strong results of operationsfrom our middle market private equity investment. See "Investments" below for the Life Insurance segment for the periods indicated are as follows:
| | | | | | | | | | | | | | | | | |
| | | Three Months Ended |
| | | March 31, |
| (In thousands) | | | | | 2021 | | 2020 |
| Revenues: | | | | | | | |
| Premiums | | | | | $ | 27,063 | | | 29,819 | |
| Net investment income | | | | | 11,598 | | | 11,480 | |
| Realized investment gains (losses), net | | | | | (108) | | | 735 | |
| Other income | | | | | 913 | | | 524 | |
| Total revenues | | | | | 39,466 | | | 42,558 | |
| Benefits and expenses: | | | | | | | |
| Insurance benefits paid or provided: | | | | | | | |
| Claims and surrenders | | | | | 23,270 | | | 20,160 | |
| Increase in future policy benefit reserves | | | | | 3,658 | | | 8,146 | |
| Policyholders' dividends | | | | | 1,296 | | | 1,225 | |
| Total insurance benefits paid or provided | | | | | 28,224 | | | 29,531 | |
| Commissions | | | | | 4,231 | | | 4,478 | |
| Other general expenses | | | | | 5,226 | | | 4,948 | |
| Capitalization of deferred policy acquisition costs | | | | | (3,561) | | | (3,921) | |
| Amortization of deferred policy acquisition costs | | | | | 5,348 | | | 5,318 | |
| Amortization of cost of insurance acquired | | | | | 104 | | | 118 | |
| Total benefits and expenses | | | | | 39,572 | | | 40,472 | |
| Income (loss) before federal income tax expense | | | | | $ | (106) | | | 2,086 | |
Life Insurance segment premium breakout ismore detailed below.
| | | | | | | | | | | | | | | | | |
| | | Three Months Ended |
| | | March 31, |
| (In thousands) | | | | | 2021 | | 2020 |
| Premiums: | | | | | | | |
| First year | | | | | $ | 2,479 | | | 2,715 | |
| Renewal | | | | | 24,584 | | | 27,104 | |
| Total premiums | | | | | $ | 27,063 | | | 29,819 | |
| | | | | | | |
Premiums.Investment Related Gains (Losses), Net. We derive most of our premium revenue in the Life Insurance segment from renewal premiums. Total premium revenues declined 9.2%The investment related loss for the three months ended March 31, 20212022 was due primarily to equity securities negatively impacted by fair value changes.
Claims and Surrenders. The following table shows the primary claims and surrender benefits paid within the Life Insurance segment for the three months ended March 31, 2022 compared to the same period in 20202021.
| | | | | | | | | | | | | | | | | |
| | | Three Months Ended |
| | | March 31, |
| (In thousands) | | | | | 2022 | | 2021 |
| Claims and Surrenders: | | | | | | | |
| Death claim benefits | | | | | $ | 990 | | | 2,684 | |
| Surrender benefits | | | | | 11,637 | | | 12,251 | |
| Endowment benefits | | | | | 2,129 | | | 2,399 | |
| Matured endowment benefits | | | | | 6,007 | | | 4,980 | |
| A&H and other policy benefits | | | | | 695 | | | 956 | |
| | | | | | | |
| | | | | | | |
| Total claims and surrenders | | | | | $ | 21,458 | | | 23,270 | |
During the three months ended March 31, 2022 and renewal premiums declined by 9.3%. See “Consolidated Results2021, the majority of Operations” above for a discussion regardingour claims and surrender benefits in our Life Insurance segment were related to payment of surrender benefits. Surrenders decreased 5.0% in the declinethree months ended March 31, 2022, as compared to the prior year period, as we have instituted retention programs aimed at curbing surrenders. The $1.8 million decrease in renewal premiumsclaims and surrenders expense drove our improved income in this segment. As previously mentioned, firstsegment in the three months ended March 31, 2022 as compared to the prior year policies issuedperiod. We believe that the COVID-19 pandemic contributed to high death claims in the 2021 period. The decrease in death claims and surrenders was partially offset by higher matured endowment benefits paid, which we expected due to the timing of maturities.
Other General Expenses. General expenses increased in the three months ended March 31, 2021, but lower issued face amounts led2022 compared to the declinesame period in first year premium revenue. Endowment sales totaled approximately $2.2 million of first year premiums2021 due primarily to expenses associated with our home office and convention expenses. We did not have a convention in the three months ended March 31, 2021 as compareddue to $2.0 million in the prior year period.COVID-19.
March 31, 20212022 | 10-Q 35
| | | | | | | | |
| CITIZENS, INC. | MANAGEMENT'S DISCUSSION & ANALYSIS |
| | |
The following table sets forth, for our top five producing countries, our direct premiums from our international life insurance business for the three months ended March 31, 2021 and 2020.HOME SERVICE INSURANCE
| | | | | | | | | | | | | | | | | |
| | | Three Months Ended |
| | | March 31, |
| (In thousands) | | | | | 2021 | | 2020 |
| Country: | | | | | | | |
| Colombia | | | | | $ | 5,244 | | | 5,888 | |
| Taiwan | | | | | 4,484 | | | 4,974 | |
| Venezuela | | | | | 4,368 | | | 4,953 | |
| Ecuador | | | | | 2,921 | | | 3,111 | |
| Argentina | | | | | 1,828 | | | 1,823 | |
| Other Non-U.S. | | | | | 8,105 | | | 8,201 | |
| Total | | | | | $ | 26,950 | | | 28,950 | |
Sales from Colombia, TaiwanInvestment related losses and Venezuela continuedhigher general expenses led to representan increase loss in the majority of the new and renewal business premiums in our international businessHome Service Insurance segment in the three months ended March 31, 2021. Overall, four of our top five countries listed above experienced a decline in premium levels in2022 as compared to the 2021 period. The current year period due primarily to decreases in renewal premiums. As we discussed above, our in force business, in terms of policy counts and amount of in force insurance, has been declining for several years due to changes we made to our products and distribution over the last few years, which resulted in the pace of new policies issued lagging the number of policies terminatedbenefited from death, surrender or lapse.lower hurricane property claims.
DOMESTIC SALESDetailed results of operations for the Home Service Insurance segment for the periods indicated are as follows:
Domestic premiums in our Life Insurance segment were $1.2 million | | | | | | | | | | | | | | | | | |
| | | Three Months Ended |
| | | March 31, |
| (In thousands) | | | | | 2022 | | 2021 |
| Revenues: | | | | | | | |
| Premiums | | | | | $ | 12,433 | | | 11,969 | |
| Net investment income | | | | | 3,244 | | | 3,345 | |
| Investment related gains (losses), net | | | | | (242) | | | 223 | |
| Other income | | | | | — | | | 2 | |
| Total revenues | | | | | 15,435 | | | 15,539 | |
| Benefits and expenses: | | | | | | | |
| Insurance benefits paid or provided: | | | | | | | |
| Claims and surrenders | | | | | 6,976 | | | 7,319 | |
| Increase in future policy benefit reserves | | | | | 1,439 | | | 1,574 | |
| Policyholders' dividends | | | | | 3 | | | 10 | |
| Total insurance benefits paid or provided | | | | | 8,418 | | | 8,903 | |
| Commissions | | | | | 3,867 | | | 3,926 | |
| Other general expenses | | | | | 4,350 | | | 3,794 | |
| Capitalization of deferred policy acquisition costs | | | | | (1,475) | | | (1,424) | |
| Amortization of deferred policy acquisition costs | | | | | 1,335 | | | 835 | |
| Amortization of cost of insurance acquired | | | | | 180 | | | 263 | |
| Total benefits and expenses | | | | | 16,675 | | | 16,297 | |
| Loss before federal income tax expense | | | | | $ | (1,240) | | | (758) | |
Total premium revenue increased by 3.9% in the three months ended March 31, 2021, down from $1.3 million2022, compared to the same period in 2021. The increase is a result of higher renewal year premiums during the prior year period. Our domesticthree months ended March 31, 2022 due to improvements in force business results from blocks of business of insurance companies we have acquired over the years. We discontinued new sales of domestic ordinary whole lifeour collection and endowment life insurance products withinpayment processes and strong collection efforts by our Life Insurance segment in 2017 while we evaluated our domestic life strategy; therefore, the majority of the premium recorded is related to renewal business. We began marketing our products again domestically in early 2021, beginning in Florida. We believe that our experience in developing and selling products in Latin America will help us expand into the large Hispanic market in the U.S.independent agents.
March 31, 20212022 | 10-Q 36
| | | | | | | | |
| CITIZENS, INC. | MANAGEMENT'S DISCUSSION & ANALYSIS |
| | |
Net Investment Income. Annualized net investment income in our Life Insurance segment was as follows:
| | | | | | | | | | | | | | | | | |
| March 31, | | December 31, | | March 31, |
| (In thousands, except for %) | 2021 | | 2020 | | 2020 |
| Net investment income, annualized | $ | 46,393 | | | 45,885 | | | 45,920 | |
| Average invested assets, at amortized cost | 1,107,540 | | | 1,071,792 | | | 1,057,428 | |
| Annualized yield on average invested assets | 4.19 | % | | 4.28 | % | | 4.34 | % |
Annualized net investment income in our Life Insurance segment increased in the three months ended March 31, 2021 compared to the same period annualized in 2020 and the twelve months ended December 31, 2020, due to continued growth in average invested assets. The annualized yield in the first three months of 2021 decreased compared to the same period in 2020 and from December 31, 2020 as a substantial portion of our fixed maturity investments were called or matured during the past year and we face challenges in finding investments with comparable yields in the continued low interest rate environment. See the Investments section below for more detailed information on our investments.
Realized Investment Gains (Losses), Net. The realized loss for the three months ended March 31, 2021 and the realized gain for the prior year period were primarily due to changes in the market value of a preferred stock exchange traded fund purchased during the first quarter of 2020.
Claims and Surrenders. The following table shows the claims and surrender benefits paid within the Life Insurance segment for the three months ended March 31, 2021 compared to the same period in 2020.
| | | | | | | | |
CITIZENS, INC. | MANAGEMENT'S DISCUSSION & ANALYSIS |
| | |
| | | | | | | | | | | | | | | | | |
| | | Three Months Ended |
| | | March 31, |
| (In thousands) | | | | | 2021 | | 2020 |
| Claims and Surrenders: | | | | | | | |
| Death claim benefits | | | | | $ | 2,684 | | | 1,725 | |
| Surrender benefits | | | | | 12,251 | | | 11,303 | |
| Endowment benefits | | | | | 2,399 | | | 2,736 | |
| Matured endowment benefits | | | | | 4,980 | | | 3,600 | |
| Accident and health benefits | | | | | 21 | | | 27 | |
| Other policy benefits | | | | | 935 | | | 769 | |
| Total claims and surrenders | | | | | $ | 23,270 | | | 20,160 | |
The majority of our claims and surrender benefits in our Life Insurance segment are related to payment of surrender benefits and matured endowment benefits. Policy surrenders increased 8.4% in the three months ended March 31, 2021 as compared to the prior year period and matured endowment benefits increased by 38.3% in the current year. These expenses have been increasing over the last several years, which is expected, due to the aging of this block of business - a significant portion of surrenders relates to policies that have been in force and have little to no associated surrender charges and endowment products reaching their stated maturities. These expenses are within expected levels.
The other key component of claims and surrender benefits is death claim benefits, which increased 55.6% in the three months ended March 31, 2021 as compared to the prior year period due to the reasons discussed above in “Current Financial Highlights”.
HOME SERVICE INSURANCE
We operate in the Home Service Insurance market through our subsidiaries SPLIC, MGLIC and SPFIC, and focus on the life insurance needs of the middle- and lower-income markets, primarily in Louisiana, Mississippi and Arkansas. Premium revenue of 89.4% and 89.7% in the three months ended March 31, 2021 and March 31, 2020, respectively, were from policyholders in Louisiana. Our policies are sold and serviced through a home service insurance marketing distribution system of independent agents who work on a debit route system and through funeral homes that sell policies, collect premiums and service policyholders.
| | | | | | | | |
CITIZENS, INC. | MANAGEMENT'S DISCUSSION & ANALYSIS |
| | |
The results of operations for the Home Service Insurance segment for the periods indicated are as follows:
| | | | | | | | | | | | | | | | | |
| | | Three Months Ended |
| | | March 31, |
| (In thousands) | | | | | 2021 | | 2020 |
| Revenues: | | | | | | | |
| Premiums | | | | | $ | 11,969 | | | 11,498 | |
| Net investment income | | | | | 3,345 | | | 3,332 | |
| Realized investment gains (losses), net | | | | | 223 | | | (1,717) | |
| Other income | | | | | 2 | | | 18 | |
| Total revenues | | | | | 15,539 | | | 13,131 | |
| Benefits and expenses: | | | | | | | |
| Insurance benefits paid or provided: | | | | | | | |
| Claims and surrenders | | | | | 7,319 | | | 6,289 | |
| Increase in future policy benefit reserves | | | | | 1,574 | | | 1,325 | |
| Policyholders' dividends | | | | | 10 | | | 8 | |
| Total insurance benefits paid or provided | | | | | 8,903 | | | 7,622 | |
| Commissions | | | | | 3,926 | | | 3,375 | |
| Other general expenses | | | | | 3,794 | | | 4,316 | |
| Capitalization of deferred policy acquisition costs | | | | | (1,424) | | | (1,088) | |
| Amortization of deferred policy acquisition costs | | | | | 835 | | | 801 | |
| Amortization of cost of insurance acquired | | | | | 263 | | | 250 | |
| Total benefits and expenses | | | | | 16,297 | | | 15,276 | |
| Loss before federal income tax expense | | | | | $ | (758) | | | (2,145) | |
Premiums. Premiums increased by 4.1% in the three months ended March 31, 2021 compared to the same period in 2020, with increases in both first year premiums and renewal premiums despite the continuing effects of the COVID-19 pandemic in the states in which this segment operates. First year premiums increased due to an automatic issue product we offered to existing policyholders, which resulted in a higher number of policies issued as well as lower premiums in the prior year period due to the onset of the COVID-19 pandemic and stay-at-home orders, which negatively impacted our business. Renewal premiums increased based on continued strong collections by our independent agents.
Net Investment Income. Net investment income for the three months ended March 31, 2021 increased slightly compared to the same period in 2020 due to an increase in average invested assets and a one-time benefit from a “make-whole” call redemption offsetting a decline in portfolio yield.
Realized Investment Gains (Losses), Net. Changes in realized gains/losses, which reflect changes in fair values of our equity securities, were primarily due to the sudden stock market decline at the quarter ended March 31, 2020 due to the onset of the COVID-19 pandemic.
| | | | | | | | |
CITIZENS, INC. | MANAGEMENT'S DISCUSSION & ANALYSIS |
| | |
Claims and Surrenders. Claims and surrender benefits, forwhich are the largest portion of our expenses in the Home Service Insurance segment, isare summarized as follows:
| | | | | Three Months Ended | | | | Three Months Ended |
| | | | March 31, | | | | March 31, |
| (In thousands) | (In thousands) | | | 2021 | | 2020 | (In thousands) | | | 2022 | | 2021 |
| Claims and Surrenders: | Claims and Surrenders: | | | Claims and Surrenders: | | |
| Death claim benefits | Death claim benefits | | | $ | 6,256 | | | 4,864 | | Death claim benefits | | | $ | 6,027 | | | 6,256 | |
| Surrender benefits | Surrender benefits | | | 556 | | | 752 | | Surrender benefits | | | 622 | | | 556 | |
| Endowment benefits | Endowment benefits | | | 2 | | | 3 | | Endowment benefits | | | 5 | | | 2 | |
| Matured endowment benefits | Matured endowment benefits | | | 142 | | | 153 | | Matured endowment benefits | | | 127 | | | 142 | |
| Property claims | Property claims | | | 321 | | | 487 | | Property claims | | | 142 | | | 321 | |
| Accident and health benefits | | | 38 | | | 26 | | |
| Other policy benefits | | | 4 | | | 4 | | |
| A&H and other policy benefits | | A&H and other policy benefits | | | 53 | | | 42 | |
| | Total claims and surrenders | Total claims and surrenders | | | $ | 7,319 | | | 6,289 | | Total claims and surrenders | | | $ | 6,976 | | | 7,319 | |
The vast majority of claims and surrender benefits in our Home Service Insurance segment relate to death claim benefits. Death claim benefits increased 28.6%decreased 3.7% in the three months ended March 31, 20212022, compared to the 2020 period2021 periods. The decrease in death claim benefits was due primarily to the reasons discussed above in “Current Financial Highlights”.a slightly lower volume of reported claims, including COVID-19 related deaths. Mortality experience is closely monitored by the Company as a key performance indicator and can fluctuatefluctuates from quarter-to-quarter based on reported claims. Property claims decreased due to fewer hurricane property claims.
Other General Expenses. General expenses increased in the three months ended March 31, 2022 compared to the same period in 2021, primarily due to higher employee health benefit costs and insurance department examination fees.
OTHER NON-INSURANCE ENTERPRISES
| | | Three Months Ended | | | | Three Months Ended |
| | March 31, | | | | March 31, |
| (In thousands) | (In thousands) | 2021 | | 2020 | (In thousands) | | | 2022 | | 2021 |
| Income (loss) before income tax expense | Income (loss) before income tax expense | $ | (1,884) | | | (2,176) | | Income (loss) before income tax expense | | | $ | (764) | | | (1,884) | |
This operating unit represents the administrative support entities to the insurance operations whose revenues are primarily intercompany and have been eliminated in consolidation under U.S. GAAP, which typically results in a segment loss. Revenue in this operating unit consists primarily of net investment income and realized investment related gains or losses, while expenses consist of other general expenses.expenses related to corporate functions. In the three months ended March 31, 2021,2022, the Other Non-Insurance Enterprises had a loss of $1.9$0.8 million compared to a loss of $2.2$1.9 million for the three months ended 2020same period in 2021, as realized investment gains improved.other general expenses decreased in the current year period due to the change of control expenses paid in 2021.
INVESTMENTS
Our investments are an integral part of our business success, as we invest the majority of premiums collected to pay for future benefits and rely on net investment income for our ongoing operations.success. Our cash and invested assets at March 31, 20212022 were $1.6$1.5 billion, of which 90.8%88.4% was invested in fixed maturity securities, all of which are classified as available-for-sale. We closely monitor the duration of our fixed maturity investments, and investment purchases and sales are executed with the objective of having adequate funds available to satisfy our insurance obligations.
March 31, 20212022 | 10-Q 4037
| | | | | | | | |
| CITIZENS, INC. | MANAGEMENT'S DISCUSSION & ANALYSIS |
| | |
The following table shows the carrying value of our investments by investment category and cash, cash equivalents and the percentage of each to total cash and invested assets.
| | Carrying Value | Carrying Value | March 31, 2021 | | December 31, 2020 | Carrying Value | March 31, 2022 | | December 31, 2021 |
| (In thousands, except for %) | (In thousands, except for %) | Amount | | % | | Amount | | % | (In thousands, except for %) | Amount | | % | | Amount | | % |
| Cash and Invested Assets | | |
| Cash, Cash Equivalents and Invested Assets | | Cash, Cash Equivalents and Invested Assets | |
| Fixed maturity securities: | Fixed maturity securities: | | | | | | | | Fixed maturity securities: | | | | | | | |
| U.S. Treasury and U.S. Government-sponsored enterprises | U.S. Treasury and U.S. Government-sponsored enterprises | $ | 15,538 | | | 1.0 | % | | $ | 16,117 | | | 1.0 | % | U.S. Treasury and U.S. Government-sponsored enterprises | $ | 14,319 | | | 0.9 | % | | $ | 15,070 | | | 0.9 | % |
| Corporate | Corporate | 834,790 | | | 53.4 | % | | 877,208 | | | 52.8 | % | Corporate | 814,130 | | | 53.1 | % | | 893,008 | | | 54.0 | % |
States and political subdivisions (1) | States and political subdivisions (1) | 393,859 | | | 25.2 | % | | 409,665 | | | 24.7 | % | States and political subdivisions (1) | 358,395 | | | 23.4 | % | | 383,958 | | | 23.3 | % |
Mortgage-backed (2) | Mortgage-backed (2) | 132,146 | | | 8.4 | % | | 140,184 | | | 8.5 | % | Mortgage-backed (2) | 123,162 | | | 8.0 | % | | 133,795 | | | 8.1 | % |
| Asset-backed | Asset-backed | 44,138 | | | 2.8 | % | | 46,091 | | | 2.8 | % | Asset-backed | 45,297 | | | 3.0 | % | | 44,676 | | | 2.7 | % |
| Foreign governments | Foreign governments | 116 | | | — | % | | 118 | | | — | % | Foreign governments | 107 | | | — | % | | 110 | | | — | % |
| Total fixed maturity securities | Total fixed maturity securities | 1,420,587 | | | 90.8 | % | | 1,489,383 | | | 89.8 | % | Total fixed maturity securities | 1,355,410 | | | 88.4 | % | | 1,470,617 | | | 89.0 | % |
| | Cash and cash equivalents | Cash and cash equivalents | 19,493 | | | 1.2 | % | | 34,131 | | | 2.1 | % | Cash and cash equivalents | 21,298 | | | 1.3 | % | | 27,294 | | | 1.7 | % |
| Other investments: | Other investments: | | | | | | | | Other investments: | | | | | | | |
| Policy loans | Policy loans | 82,674 | | | 5.3 | % | | 83,318 | | | 5.0 | % | Policy loans | 79,345 | | | 5.2 | % | | 80,307 | | | 4.9 | % |
| Equity securities | Equity securities | 22,366 | | | 1.4 | % | | 22,102 | | | 1.3 | % | Equity securities | 13,902 | | | 0.9 | % | | 14,844 | | | 0.9 | % |
| | Real estate and other long-term investments | 19,918 | | | 1.3 | % | | 29,865 | | | 1.8 | % | |
| Total cash and invested assets | $ | 1,565,038 | | | 100.0 | % | | $ | 1,658,799 | | | 100.0 | % | |
| Other long-term investments | | Other long-term investments | 63,927 | | | 4.2 | % | | 57,399 | | | 3.5 | % |
| Total cash, cash equivalents and invested assets | | Total cash, cash equivalents and invested assets | $ | 1,533,882 | | | 100.0 | % | | $ | 1,650,461 | | | 100.0 | % |
(1) Includes $161.8$154.8 million and $164.0$161.8 million of securities guaranteed by third parties at March 31, 20212022 and December 31, 2020,2021, respectively.
(2) Includes $132.0$122.9 million and $139.8$132.0 million of U.S. Government-sponsored enterprises at March 31, 20212022 and December 31, 2020,2021, respectively.
The carrying value of the Company’s fixed maturity securities investment portfolio at March 31, 20212022 was $1.4 billion.billion compared to $1.5 billion at December 31, 2021. This decline reflects interest rate sensitivity on fixed maturity securities. The distribution of the credit ratings of our portfolio of fixed maturity securities by carrying value as of March 31, 20212022 did not materially change from December 31, 20202021 – the weighted average was “A” at both dates. Our portfolio mix did not materially change during the three months.
Cash and cash equivalents decreased as of March 31, 2021 compared to2022 from December 31, 20202021 due primarily to the purchasereinvestment of 100% of the Company’s Class B common stock from the Foundation for $9.1 million.funds in higher interest rate securities.
Real estate and otherOther long-term investments decreased to $19.9increased by $6.5 million as of March 31, 2021 as compared to $29.9 million as of2022 from December 31, 2020 primarily2021 due a $8.8 million payment from a Rabbi Trust (which was considered a long-term investment)to additional contributions to our former Chief Executive Officer, Geoffrey Kolander, representing the severance payments due to him in connection with his resignation following the change in control.limited partnerships.
Obligations of States and Political Subdivisions
The Company’s fixed maturity securities investment portfolio at March 31, 20212022 and December 31, 20202021 included $393.9$358.4 million and $409.7$384.0 million, respectively, of securities that are obligations of states and political subdivisions, including municipalities (collectively referred to as the municipal bond portfolio).
March 31, 20212022 | 10-Q 4138
| | | | | | | | |
| CITIZENS, INC. | MANAGEMENT'S DISCUSSION & ANALYSIS |
| | |
As of March 31, 2021, theThe Company's municipal bond portfolio includedincludes third-party guarantees. Detailed below is a presentation by the Nationally Recognized Statistical Rating Organization ("NRSRO") rating of these holdings by funding type as of March 31, 2021.2022.
| | | General Obligation | | Special Revenue | | Other | | Total | | % Based on Amortized
Cost | | General Obligation | | Special Revenue | | Other | | Total | | % Based on Amortized
Cost |
| (In thousands, except for %) | (In thousands, except for %) | Fair
Value | | Amortized
Cost | | Fair
Value | | Amortized
Cost | | Fair
Value | | Amortized
Cost | | Fair
Value | | Amortized
Cost | | (In thousands, except for %) | Fair
Value | | Amortized
Cost | | Fair
Value | | Amortized
Cost | | Fair
Value | | Amortized
Cost | | Fair
Value | | Amortized
Cost | |
| State and political subdivision fixed maturity securities including third-party guarantees | State and political subdivision fixed maturity securities including third-party guarantees | | State and political subdivision fixed maturity securities including third-party guarantees | |
| AAA | AAA | $ | 21,343 | | | 20,768 | | | 3,307 | | | 3,091 | | | — | | | — | | | 24,650 | | | 23,859 | | | 6.4 | % | AAA | $ | 18,182 | | | 17,366 | | | 3,193 | | | 3,073 | | | — | | | — | | | 21,375 | | | 20,439 | | | 5.8 | % |
| AA | AA | 63,196 | | | 59,413 | | | 123,848 | | | 118,507 | | | 12,191 | | | 10,838 | | | 199,235 | | | 188,758 | | | 50.9 | % | AA | 49,708 | | | 47,453 | | | 116,639 | | | 118,395 | | | 13,238 | | | 12,620 | | | 179,585 | | | 178,468 | | | 50.3 | % |
| A | A | 14,779 | | | 13,429 | | | 125,958 | | | 117,391 | | | 5,017 | | | 4,417 | | | 145,754 | | | 135,237 | | | 36.5 | % | A | 16,527 | | | 16,099 | | | 102,645 | | | 101,891 | | | 4,789 | | | 4,410 | | | 123,961 | | | 122,400 | | | 34.5 | % |
| BBB | BBB | 3,952 | | | 3,669 | | | 13,330 | | | 12,987 | | | 1,511 | | | 1,450 | | | 18,793 | | | 18,106 | | | 4.9 | % | BBB | 2,683 | | | 2,548 | | | 15,530 | | | 15,559 | | | 1,458 | | | 1,450 | | | 19,671 | | | 19,557 | | | 5.5 | % |
| BB and other | BB and other | 4,758 | | | 4,428 | | | 669 | | | 607 | | | — | | | — | | | 5,427 | | | 5,035 | | | 1.3 | % | BB and other | 4,415 | | | 4,406 | | | 9,388 | | | 9,243 | | | — | | | — | | | 13,803 | | | 13,649 | | | 3.9 | % |
| Total | Total | $ | 108,028 | | | 101,707 | | | 267,112 | | | 252,583 | | | 18,719 | | | 16,705 | | | 393,859 | | | 370,995 | | | 100.0 | % | Total | $ | 91,515 | | | 87,872 | | | 247,395 | | | 248,161 | | | 19,485 | | | 18,480 | | | 358,395 | | | 354,513 | | | 100.0 | % |
| | State and political subdivision fixed maturity securities excluding third-party guarantees | State and political subdivision fixed maturity securities excluding third-party guarantees | | State and political subdivision fixed maturity securities excluding third-party guarantees | |
| AAA | AAA | $ | 3,248 | | | 3,156 | | | — | | | — | | | — | | | — | | | 3,248 | | | 3,156 | | | 0.9 | % | AAA | $ | 1,873 | | | 1,862 | | | — | | | — | | | — | | | — | | | 1,873 | | | 1,862 | | | 0.5 | % |
| AA | AA | 43,591 | | | 42,435 | | | 43,473 | | | 41,198 | | | 7,633 | | | 6,538 | | | 94,697 | | | 90,171 | | | 24.3 | % | AA | 32,505 | | | 31,154 | | | 46,278 | | | 46,249 | | | 7,001 | | | 6,522 | | | 85,784 | | | 83,925 | | | 23.7 | % |
| A | A | 28,833 | | | 26,827 | | | 159,425 | | | 149,410 | | | 7,914 | | | 7,145 | | | 196,172 | | | 183,382 | | | 49.4 | % | A | 28,828 | | | 27,941 | | | 126,766 | | | 127,238 | | | 7,622 | | | 7,139 | | | 163,216 | | | 162,318 | | | 45.8 | % |
| BBB | BBB | 7,250 | | | 6,662 | | | 35,561 | | | 34,211 | | | 56 | | | 55 | | | 42,867 | | | 40,928 | | | 11.0 | % | BBB | 4,746 | | | 4,458 | | | 36,542 | | | 36,506 | | | 1,836 | | | 1,855 | | | 43,124 | | | 42,819 | | | 12.1 | % |
| BB and other | BB and other | 25,106 | | | 22,627 | | | 28,653 | | | 27,764 | | | 3,116 | | | 2,967 | | | 56,875 | | | 53,358 | | | 14.4 | % | BB and other | 23,563 | | | 22,457 | | | 37,809 | | | 38,168 | | | 3,026 | | | 2,964 | | | 64,398 | | | 63,589 | | | 17.9 | % |
| Total | Total | $ | 108,028 | | | 101,707 | | | 267,112 | | | 252,583 | | | 18,719 | | | 16,705 | | | 393,859 | | | 370,995 | | | 100.0 | % | Total | $ | 91,515 | | | 87,872 | | | 247,395 | | | 248,161 | | | 19,485 | | | 18,480 | | | 358,395 | | | 354,513 | | | 100.0 | % |
The table below shows the categories in which the Company held investments in special revenue bonds that were greater than 10% of fair value based upon the Company's municipal bond portfolio at March 31, 2021.2022.
| | (In thousands) | (In thousands) | Fair
Value | | Amortized
Cost | | % of Total
Fair Value | (In thousands) | Fair
Value | | Amortized
Cost | | % of Total
Fair Value |
| | | | | | | |
| Education | Education | $ | 70,289 | | | 66,134 | | | 17.9 | % | Education | $ | 64,873 | | | 65,009 | | | 18.1 | % |
| Utilities | Utilities | 65,579 | | | 59,591 | | | 16.7 | % | Utilities | 55,101 | | | 53,629 | | | 15.4 | % |
| Transportation | Transportation | 39,432 | | | 38,709 | | | 10.0 | % | Transportation | 40,411 | | | 42,552 | | | 11.3 | % |
|
The Company's municipal bond portfolio areis spread across many states, however, municipal bonds from Texas and California comprise the most significant concentration of the total municipal bond portfolio as of March 31, 2021.2022. The Company holds 21.1%21.2% and 10.0%12.8% of its municipal bond portfolio in Texas and California issuers, respectively, as of March 31, 2021.2022. There were no other states or individual issuer holdings that represented or exceeded 10% of the total municipal bond portfolio as of March 31, 2021.2022.
March 31, 20212022 | 10-Q 4239
| | | | | | | | |
| CITIZENS, INC. | MANAGEMENT'S DISCUSSION & ANALYSIS |
| | |
The table below represents the Company's detailed exposure to municipal bond portfolio in Texas at March 31, 2021.2022.
| | March 31, 2021 | General Obligation | | Special Revenue | | Other | | Total | |
| March 31, 2022 | | March 31, 2022 | General Obligation | | Special Revenue | | Other | | Total |
| (In thousands) | (In thousands) | Fair
Value | | Amortized
Cost | | Fair
Value | | Amortized
Cost | | Fair
Value | | Amortized
Cost | | Fair
Value | | Amortized
Cost | (In thousands) | Fair
Value | | Amortized
Cost | | Fair
Value | | Amortized
Cost | | Fair
Value | | Amortized
Cost | | Fair
Value | | Amortized
Cost |
| Texas state and political subdivision fixed maturity securities including third-party guarantees | Texas state and political subdivision fixed maturity securities including third-party guarantees | Texas state and political subdivision fixed maturity securities including third-party guarantees |
| AAA | AAA | $ | 20,757 | | | 20,259 | | | 3,307 | | | 3,091 | | | — | | | — | | | 24,064 | | | 23,350 | | AAA | $ | 17,641 | | | 16,858 | | | 3,193 | | | 3,073 | | | — | | | — | | | 20,834 | | | 19,931 | |
| AA | AA | 21,754 | | | 21,407 | | | 13,426 | | | 12,811 | | | 56 | | | 55 | | | 35,236 | | | 34,273 | | AA | 20,732 | | | 20,152 | | | 12,861 | | | 12,821 | | | — | | | — | | | 33,593 | | | 32,973 | |
| A | A | — | | | — | | | 21,385 | | | 21,849 | | | — | | | — | | | 21,385 | | | 21,849 | | A | — | | | — | | | 19,122 | | | 21,827 | | | — | | | — | | | 19,122 | | | 21,827 | |
| BBB | BBB | — | | | — | | | 1,905 | | | 1,827 | | | — | | | — | | | 1,905 | | | 1,827 | | BBB | — | | | — | | | 1,952 | | | 1,824 | | | — | | | — | | | 1,952 | | | 1,824 | |
| BB and other | BB and other | — | | | — | | | 554 | | | 508 | | | — | | | — | | | 554 | | | 508 | | BB and other | — | | | — | | | 519 | | | 504 | | | — | | | — | | | 519 | | | 504 | |
| Total | Total | $ | 42,511 | | | 41,666 | | | 40,577 | | | 40,086 | | | 56 | | | 55 | | | 83,144 | | | 81,807 | | Total | $ | 38,373 | | | 37,010 | | | 37,647 | | | 40,049 | | | — | | | — | | | 76,020 | | | 77,059 | |
| Texas state and political subdivision fixed maturity securities excluding third-party guarantees | Texas state and political subdivision fixed maturity securities excluding third-party guarantees | Texas state and political subdivision fixed maturity securities excluding third-party guarantees |
| AAA | AAA | $ | 3,248 | | | 3,156 | | | — | | | — | | | — | | | — | | | 3,248 | | | 3,156 | | AAA | $ | 1,873 | | | 1,862 | | | — | | | — | | | — | | | — | | | 1,873 | | | 1,862 | |
| AA | AA | 32,080 | | | 31,541 | | | 3,299 | | | 3,061 | | | — | | | — | | | 35,379 | | | 34,602 | | AA | 29,345 | | | 28,221 | | | 3,103 | | | 3,023 | | | — | | | — | | | 32,448 | | | 31,244 | |
| A | A | 5,985 | | | 5,818 | | | 28,939 | | | 29,020 | | | — | | | — | | | 34,924 | | | 34,838 | | A | 5,974 | | | 5,780 | | | 26,294 | | | 28,984 | | | — | | | — | | | 32,268 | | | 34,764 | |
| BBB | BBB | 1,198 | | | 1,151 | | | 5,483 | | | 5,207 | | | 56 | | | 55 | | | 6,737 | | | 6,413 | | BBB | 1,181 | | | 1,147 | | | 5,491 | | | 5,252 | | | — | | | — | | | 6,672 | | | 6,399 | |
| BB and other | BB and other | — | | | — | | | 2,856 | | | 2,798 | | | — | | | — | | | 2,856 | | | 2,798 | | BB and other | — | | | — | | | 2,759 | | | 2,790 | | | — | | | — | | | 2,759 | | | 2,790 | |
| Total | Total | $ | 42,511 | | | 41,666 | | | 40,577 | | | 40,086 | | | 56 | | | 55 | | | 83,144 | | | 81,807 | | Total | $ | 38,373 | | | 37,010 | | | 37,647 | | | 40,049 | | | — | | | — | | | 76,020 | | | 77,059 | |
The table below represents the Company's detailed exposure to municipal bond portfolio in California at March 31, 2021.2022.
| | March 31, 2021 | General Obligation | | Special Revenue | | Other | | Total | |
| March 31, 2022 | | March 31, 2022 | General Obligation | | Special Revenue | | Other | | Total |
| (In thousands) | (In thousands) | Fair
Value | | Amortized
Cost | | Fair
Value | | Amortized
Cost | | Fair
Value | | Amortized
Cost | | Fair
Value | | Amortized
Cost | (In thousands) | Fair
Value | | Amortized
Cost | | Fair
Value | | Amortized
Cost | | Fair
Value | | Amortized
Cost | | Fair
Value | | Amortized
Cost |
| California state and political subdivision fixed maturity securities including third-party guarantees | California state and political subdivision fixed maturity securities including third-party guarantees | California state and political subdivision fixed maturity securities including third-party guarantees |
| AAA | $ | — | | | — | | | — | | | — | | | — | | | — | | | — | | | — | | |
| | AA | | AA | $ | — | | | — | | | 29,405 | | | 30,825 | | | 2,833 | | | 2,729 | | | 32,238 | | | 33,554 | |
| A | | A | 1,507 | | | 1,650 | | | 7,362 | | | 8,108 | | | — | | | — | | | 8,869 | | | 9,758 | |
| BBB | | BBB | — | | | — | | | 4,684 | | | 4,647 | | | — | | | — | | | 4,684 | | | 4,647 | |
| | Total | | Total | $ | 1,507 | | | 1,650 | | | 41,451 | | | 43,580 | | | 2,833 | | | 2,729 | | | 45,791 | | | 47,959 | |
| California state and political subdivision fixed maturity securities excluding third-party guarantees | | California state and political subdivision fixed maturity securities excluding third-party guarantees |
| | AA | AA | 1,681 | | | 1,650 | | | 25,068 | | | 24,333 | | | 2,898 | | | 2,728 | | | 29,647 | | | 28,711 | | AA | $ | — | | | — | | | 2,374 | | | 2,632 | | | — | | | — | | | 2,374 | | | 2,632 | |
| A | A | — | | | — | | | 4,682 | | | 4,726 | | | — | | | — | | | 4,682 | | | 4,726 | | A | 1,507 | | | 1,650 | | | 15,180 | | | 16,465 | | | 2,833 | | | 2,729 | | | 19,520 | | | 20,844 | |
| BBB | BBB | — | | | — | | | 4,888 | | | 4,669 | | | — | | | — | | | 4,888 | | | 4,669 | | BBB | — | | | — | | | 7,996 | | | 7,833 | | | — | | | — | | | 7,996 | | | 7,833 | |
| BB and other | BB and other | — | | | — | | | — | | | — | | | — | | | — | | | — | | | — | | BB and other | — | | | — | | | 15,900 | | | 16,650 | | | — | | | — | | | 15,900 | | | 16,650 | |
| Total | Total | $ | 1,681 | | | 1,650 | | | 34,638 | | | 33,728 | | | 2,898 | | | 2,728 | | | 39,217 | | | 38,106 | | Total | $ | 1,507 | | | 1,650 | | | 41,450 | | | 43,580 | | | 2,833 | | | 2,729 | | | 45,790 | | | 47,959 | |
| California state and political subdivision fixed maturity securities excluding third-party guarantees | |
| AAA | $ | — | | | — | | | — | | | — | | | — | | | — | | | — | | | — | | |
| AA | 1,681 | | | 1,650 | | | 2,664 | | | 2,632 | | | — | | | — | | | 4,345 | | | 4,282 | | |
| A | — | | | — | | | 10,496 | | | 10,294 | | | 2,898 | | | 2,728 | | | 13,394 | | | 13,022 | | |
| BBB | — | | | — | | | 8,521 | | | 7,970 | | | — | | | — | | | 8,521 | | | 7,970 | | |
| BB and other | — | | | — | | | 12,957 | | | 12,832 | | | — | | | — | | | 12,957 | | | 12,832 | | |
| Total | $ | 1,681 | | | 1,650 | | | 34,638 | | | 33,728 | | | 2,898 | | | 2,728 | | | 39,217 | | | 38,106 | | |
March 31, 20212022 | 10-Q 4340
| | | | | | | | |
| CITIZENS, INC. | MANAGEMENT'S DISCUSSION & ANALYSIS |
| | |
IMPAIRMENT CONSIDERATIONS RELATED TO INVESTMENTS IN FIXED MATURITY AND EQUITY SECURITIES
For the three months ended March 31, 20212022 and 2020,2021, the Company recorded no credit valuation losses on fixed maturity securities.
Information on both unrealized and realized gains and losses by category is set forth in Part I, Item 1, Note 5. Investments of the notes to our consolidated financial statements herein.
LIQUIDITY AND CAPITAL RESOURCES
Although the Company experienced increased death claim benefits in the first three months of 2021, we do not believe that the Company's liquidity andBelow are our primary capital resources were materially impacted by COVID-19 in(based on carrying value of each) as of the period. For further discussion regarding the potential future impacts of COVID-19 and related economic conditions on the Company's liquidity and capital resources, see Part I, Item 1A, Risk Factors in the Company's periods indicated below.
| | | | | | | | | | | |
| (In thousands) | March 31, 2022 | | December 31, 2021 |
| Fixed maturity securities | $ | 1,355,410 | | | 1,470,617 | |
| Cash and cash equivalents | 21,298 | | | 27,294 | |
Liquidity refers to a company's ability to generate sufficient cash flows to meet the needs of its operations. We manage our insurance operations as described herein in order to ensure that we have stable and reliable sources of cash flows to meet our obligations. We expect to meetcurrently anticipate meeting our short-term and long-term cash needs for the next 12 months with cash generated by our insurance operations and from our invested assets. At March 31, 2021,2022, we had $19.5$21.3 million in cash and cash equivalents and $1.5 billion in invested assets. From time-to-time we may raise capital by selling shares in our SIP (as defined below) and we may also access our Credit Facility if needed (both as described below).
PARENT COMPANY LIQUIDITY AND CAPITAL RESOURCES
Liquidity is the ability to generate amounts of cash adequate to meet our cash needs. Citizens is a holding company and has minimal operations of its own. Our assets consist of the capital stock of our subsidiaries, cash and investments. Our liquidity requirements are met primarily from two sources: cash generated from our operating subsidiaries and our invested assets. Our ability to obtain cash from our insurance subsidiaries depends primarily upon the availability of statutorily permissible payments, including payments Citizens receives from service agreements with our life insurance subsidiaries and dividends from the subsidiaries. The ability to make payments to the holding company is limited by applicable laws and regulations of Bermuda and U.S. states of domicile which subject insurance operations to significant regulatory restrictions. These laws and regulations require, among other things, that our insurance subsidiaries maintain minimum solvency requirements, which limit the amount of dividends that can be paid to the holding company. The regulations also require approval of our service agreements with the applicable regulatory authority in order to prevent insurance subsidiaries from moving large amounts of cash to the unregulated holding company.
Our cash and cash equivalents decreased from $34.1 million at December 31, 2020In addition to $19.5 million at March 31, 2021. In the three months ended March 31, 2021, usesabove-mentioned sources of cash, included:we offer a Stock Investment Plan ("SIP"), whereby investors, policyholders, independent contractors and agents, employees and directors can directly purchase our stock. At our option, purchases of stock under the SIP can be made from newly issued or treasury stock, rather than in the open market, in which case, we can raise capital by selling our shares.
•$8.8 million severance payment to our former Chief Executive Officer, Geoffrey Kolander, following his resignation pursuant to the terms of his employment agreement and the Chief Executive Officer Separation of Service and Consulting Agreement dated July 29, 2020 (See Part I, Item 1, Note 6.Fair Value Measurements – "Other Long-Term Investments”, herein, and our Form 10-K for additional discussion about the severance payment to Mr. Kolander); and•$9.1 million payment to the Harold E. Riley Foundation ("Foundation") for the purchase of 100% of the outstanding Class B common stock.
On May 5,In 2021, we entered into a Credit Facility with Regions Bank. See Part I, Item 1, Note 7.7. Commitments and Contingencies in the notes to our consolidated financial statements, herein, for a description of the Credit Facility. The Credit Facility provides additional liquidity to the Company for short-term and longer-term needs. As of March 31, 2022, we have not borrowed any money under the Credit Facility and have no immediate plans to do so.
March 31, 20212022 | 10-Q 4441
| | | | | | | | |
| CITIZENS, INC. | MANAGEMENT'S DISCUSSION & ANALYSIS |
| | |
INSURANCE COMPANY SUBSIDIARY LIQUIDITY AND CAPITAL RESOURCES
The liquidity requirements of our insurance operations are primarily met by premium revenues, investment income and investment maturities or sales. Primary cash needs relate to payments of policyholder benefits, investment purchases and operating expenses. Historically, cash flow from our operations has been sufficient to meet our cash needs. We have not had to liquidate a material amount of investments to pay our expenses and we did not do so in the three months ended March 31, 2022. We believe that we have adequate capital resources to support the liquidity requirements of our insurance operations if the cash flow from our insurance operations is insufficient to meet our cash needs. See Contractual Obligations and Off-balance Sheet Arrangements in our Form 10-K and below for a discussion of known and estimated cash needs.
Cash from Operations. Cash provided by or used in operating activities is an important liquidity metric because it reflects, during a given period, the amount of cash generated that is available to pay our operating expenses or make strategic acquisitions. In the three months ended March 31, 2022, our operations provided $12.1 million in net cash.
Cash from/used in Investments. We have traditionally also had significant cash flows from investing activities due to both scheduled and unscheduled investment security maturities, redemptions, and prepayments. These cash flows, for the most part, are reinvested in new investments. Net cash used in investing activities totaled $19.8 million for the three months ended March 31, 2022. The investing activities fluctuate from period to period due to timing of securities activities such as calls and maturities and reinvestment of those funds.
Cash from Financing Activities. Cash provided by financing activities was $1.7 million in the three months ended March 31, 2022, due primarily to the issuance of shares under the SIP.
Trends, Demands and Restrictions on our Uses of Cash
Because claims and surrender benefits are our largest expense, a primary liquidity concern is the risk of either (i) an extraordinary level of early policyholder surrenders, or (ii) higher than expected mortality. In order to mitigate the risk of early policyholder surrenders, we include provisions in our insurance policies, such as surrender charges, that help limit and discourage early withdrawals. As previously discussed, surrender benefits have been higher than usual the last several years as many of our policies have reached the age where surrender charges have expired and due to other reasons, like the loss of one of our biggest distributors in Venezuela (see Item 3. Legal Proceedings). However, we have been aggressively managing policyholder retention efforts and in the three months ended March 31, 2022, surrender benefits slightly decreased.
Our whole life and endowment products provide the policyholder with alternatives once the policy matures - they can choose to take a lump sum payout or leave the money on deposit at interest with the Company. As of March 31, 2022, 40% of the Company's total insurance in force was in endowment products. Approximately 13% of the endowments in force will mature in the next five years. Policyholder election behavior is unknown, but if too many policyholders elect lump sum distributions, the Company could be exposed to liquidity risk in years of high maturities. Meeting these distributions could require the Company to sell securities at inopportune times to pay policyholder withdrawals. Alternatively, if the policyholders were to leave the money on deposit with the Company at interest, our profitability could be impacted if the product guaranteed rate is higher than the market rate we are earning on our investments. We currently anticipate that our available operating cash flow and capital resources will be adequate to meet our needs for funds, but we will monitor closely our policyholder behavior patterns.
Death claims, which were high in 2021 due in part to COVID, have decreased to normal levels so far in 2022. We continue to closely monitor claim volumes to evaluate whether there is a delay in reporting or filing for benefits as a result of the COVID-19 pandemic.
| | | | | | | | |
| CITIZENS, INC. | MANAGEMENT'S DISCUSSION & ANALYSIS |
| | |
The Credit Facility provides additional liquidity to the Company for short-term and longer-term needs. As of May 5, 2021, we had not borrowed any money under the Credit Facility and do not expect to do so immediately.
INSURANCE COMPANY SUBSIDIARY LIQUIDITY AND CAPITAL RESOURCES
The liquidity requirements of our insurance operations are primarily met by premium revenues, investment income and investment maturities. Primary cash needs relate to payments of policy benefits to policyholders, investment purchases and operating expenses. Historically, we have not had to liquidate a material amount of investments to provide cash flow for our insurance operations and we did not do so in the three months ended March 31, 2021. We believe that we have adequate capital resources to support the liquidity requirements of our insurance operations if the cash flow from our insurance operations is insufficient to meet our cash needs. See Contractual Obligations and Off-balance Sheet Arrangements in our Form 10-K for a discussion of known and estimated cash needs.
In the three months ended March 31, 2021, our operations provided $1.8 million in net cash as compared to $14.1 million provided by operations in the same period in 2020. As mentioned above, we used $8.8 million in cash in the quarter to pay Mr. Kolander’s severance. Cash provided by operations was also lower, as surrenders and lower renewal premiums in our international business are not being replaced by new sales. We have traditionally also had significant cash flows from investing activities due to both scheduled and unscheduled investment security maturities, redemptions, and prepayments. These cash flows, for the most part, are reinvested in fixed income securities and to a lesser extent private equity funds and other alternative investments. Net cash used in investing activities totaled $7.4 million for the three months ended March 31, 2021 as opposed to $26.2 million used in investing activities for the three months ended March 31, 2020. The investing activities fluctuate from period to period due to timing of securities activities such as calls and maturities and reinvestment of those funds. Cash used in financing activities was $9.1 million in the three months ended March 31, 2021, due to the purchase of the Class B common stock from the Foundation.
Because claims and surrender benefits are our largest expense, a primary liquidity concern is the risk of an extraordinary level of early policyholder surrenders. While these expenses increased in the three months ended March 31, 2021 and have been increasing over the last several years, the increases are within expected levels due to the aging of this block of business - a significant portion of surrenders relates to policies that have been in force and have little to no associated surrender charges and endowment products reaching their stated maturities.
For reasons previously discussed, death claim benefits in our Home Service Insurance segment increased in the first quarter of 2021. We continue to closely monitor claim volumes to evaluate whether there is a delay in reporting or filing for benefits as a result of the COVID-19 pandemic.
As discussed above, we are subject to regulatory capital requirements that could affect the Company’s ability to access capital from our insurance operations or cause the Company to have to put additional cash in our wholly-owned subsidiaries.
Our domestic companies are subject to minimum capital requirements set by the NAIC in the form of risk-based capital ("RBC"). RBC considers the type of business written by an insurance company, the quality of its assets, and various other aspects of an insurance company's business to develop a minimum level of capital called "Authorized Control Level Risk-Based Capital". This level of capital is then compared to an adjusted statutory capital that includes capital and surplus as reported under statutory accounting principles, plus certain investment reserves. Should the ratio of adjusted statutory capital to control level RBC fall below 200% for our domestic companies, a series of remedial actions by the affected company would be required. Additionally, we have a parental guarantee between Citizens and CICA, Citizens' wholly-owned subsidiary domiciled in Colorado, to maintain a RBC level above 350%. At March 31, 2021,2022, our domestic insurance subsidiaries were above the required minimum RBC levels.
CICA Ltd.International is a Bermuda domiciled company. The BMA requires Bermuda insurers to maintain available statutory economic capital and surplus at a level equal to or in excess of the BMA's Enhanced Capital Requirement, which
| | | | | | | | |
CITIZENS, INC. | MANAGEMENT'S DISCUSSION & ANALYSIS |
| | |
requires a certain Target Capital Level ("TCL"). As of March 31, 2021,2022, CICA Ltd.International was above the TCL threshold. At the request of the BMA, on April 15, 2021, Citizens and CICA Ltd.International entered into a Keep Well Agreement. The Keep Well Agreement requires Citizens to contribute up to $10 million in capital to CICA Ltd.International as necessary to ensure that CICA Ltd.International has a minimum capital level of 120%. Since CICA Ltd.’sInternational’s capital level currently exceeds 120%, Citizens is not currently required to make a capital contribution. Any capital injection that Citizens is required to make under the parental guarantee with CICA or under the Keep Well Agreement with CICA Ltd.International could negatively impact the Company’s capital resources and liquidity.
CONTRACTUAL OBLIGATIONS AND OFF-BALANCE SHEET ARRANGEMENTS
As of March 31, 2021, the Company is committed to fund investments up to $68.5 million related to private equity funds and other investments. There2022, we have been no other material changes inadditional contractual obligations fromor off-balance sheet arrangements other than those described in Part I. Item 1, Note 7. Commitments and Contingencies in the notes to our consolidated financial statements herein and in Part II, Item 7, Contractual Obligations and Off-Balance Sheet Arrangements in our Form 10-K. The Company does not have off-balance sheet arrangements at March 31, 2021. We do not utilize special purpose entities as investment vehicles, nor are there any such entities in which we have an investment that engage in speculative activities of any nature, and we do not use such investments to hedge our investment positions.
CRITICAL ACCOUNTING POLICIES
We believe that the accounting policies set forth in Part I, Item 7, Management’s Discussion and Analysis of Financial Condition and Results of Operations - "Critical Accounting Policies" and Part IV, Item 15, Note 1. Summary of Significant Accounting Policies of our consolidated financial statements in our Form 10-K continue to describe the significant judgments and estimates used in the preparation of our consolidated financial statements.
Item 3. QUANTITATIVE AND QUALITATIVE DISCLOSURES ABOUT MARKET RISK
GENERAL
For the Company’s disclosures about market risk, please see Part II, Item 7A, Quantitative and Qualitative Disclosures About Market Risk in our Form 10-K. Except as set forth below, there have been no material changes to the Company’s disclosures about market risk in Part II, Item 7A. of our Form 10-K. For additional information regarding market risks to which we are subject, see Part I, Item 1, Note 5. Investments - "Valuation of Investments" in the notes to our consolidated financial statements herein.
MARKET RISK RELATED TO INTEREST RATES
Our exposure to interest rate changes results from our significant holdings of fixed maturity investments, which comprised 90.8%88.4% of our investment portfolio based on carrying value as of March 31, 2021.2022. These investments are mainly exposed to changes in U.S. Treasury rates. Changes in interest rates typically have a sizable effect on the fair values of our fixed maturity securities. The interest rate of the ten-year U.S. Treasury bond increased to 1.74%2.32% at March 31, 20212022 from 0.93%1.52% at December 31, 2020.2021. Net unrealized gainslosses on fixed maturity securities totaled $88.0$5.8 million at March 31, 2021,2022, compared to $167.9gains of $126.9 million at December 31, 2020,2021, based upon bond interest rates in relation to the U.S. ten-year Treasury yield.
To manage interest risk, we perform periodic projections of asset and liability cash flows to evaluate the potential sensitivity of our investments and liabilities. We assess interest rate sensitivity annually with respect to our AFS fixed maturity securities investments using hypothetical test scenarios that assume either upward or downward shifts in the prevailing interest rates. The changes in fair values of our fixed maturity securities as of March 31, 20212022 were within the expected range of this analysis.
There are no fixed maturity securities or other investments classified as trading instruments. All of the Company's fixed maturity securities were classified as AFS at March 31, 2021.2022. At March 31, 20212022 and December 31, 2020,2021, we had no investments in derivative instruments or subprime loans.
Item 4. CONTROLS AND PROCEDURES
EVALUATION OF DISCLOSURE CONTROLS AND PROCEDURES
We maintain disclosure controls and procedures (as defined in Rules 13a-15(e) and 15d-15(e) under the Securities Exchange Act of 1934, as amended (the "Exchange Act")) that are designed to ensure that information required to be disclosed in our reports filed or submitted under the Exchange Act is recorded, processed, summarized and reported within the time periods specified in the SEC’s rules and forms, and that such information is accumulated and communicated to our management, including our principal executive officer and principal financial officer, to allow timely decisions regarding required disclosures.
Our management, including our principal executive officer and principal financial officer, evaluated the effectiveness of our disclosure controls and procedures pursuant to Rules 13a-15(e) and 15d-15(e) under the Exchange Act as of March 31, 2021.2022. Based on such evaluation, our principal executive officer and principal financial officer concluded that our disclosure controls and procedures were effective at aas of March 31, 2022 to provide reasonable assurance level asthat information required to be disclosed by us in the reports that we file or submit under the Exchange Act is recorded, processed, summarized and reported within the time periods specified in the rules and forms of the end of the period covered by this quarterly report.SEC and such information is accumulated and reported to management, including our principal executive and financial officers, as appropriate to allow timely decisions regarding disclosure.
CHANGES IN INTERNAL CONTROL OVER FINANCIAL REPORTING
During the three months ended March 31, 2021,2022, there were no changes in the Company's internal control over financial reporting (as defined in rules 13a-15(f) and 15d-15(f) under the Exchange Act) that materially affected, or are reasonably likely to materially affect, our internal control over financial reporting.
March 31, 20212022 | 10-Q 4744
PART II. OTHER INFORMATION
Item 1. LEGAL PROCEEDINGS
Part I, Item 3, Legal Proceedings of our Form 10-K forincludes a discussion of our legal proceedings. There have been no material developments in the three months ended March 31, 20212022 from the legal proceedings described in our Form 10-K.
Item 1A. RISK FACTORS
Part I, Item 1A, Risk Factors of our Form 10-K includes a discussion of our risk factors. There have been no material changes in the three months ended March 31, 20212022 from the risk factors included in our Form 10-K.
Item 2. UNREGISTERED SALES OF EQUITY SECURITIES AND USE OF PROCEEDS
None.
Item 3. DEFAULTS UPON SENIOR SECURITIES
Not applicable.
Item 4. MINE SAFETY DISCLOSURES
Not applicable.
Item 5. OTHER INFORMATION
None.Not applicable.
Item 6. EXHIBITS
| | | | | | | | |
Exhibit Number | | The following exhibits are filed herewith: |
| | |
| | |
| | |
| | |
| | |
| | |
| | |
| | |
| 101* | | Inline XBRL Document Set for the condensed consolidated financial statements and accompanying notes in Part I, Item 1, Financial Statements of this Quarterly Report on Form 10-Q* |
| 104* | | Inline XBRL for the cover page of this Quarterly Report on Form 10-Q, included in the Exhibit 101 Inline XBRL Document Set* |
* Filed herewith.
† Indicates management contract or compensatory plan or arrangement.
March 31, 20212022 | 10-Q 4845
SIGNATURES
Pursuant to the requirements of the Securities Exchange Act of 1934, the Registrant has duly caused this report to be signed on its behalf by the undersigned thereunto duly authorized.
| | | | | | | | | | | |
| | CITIZENS, INC. |
| | |
| | | |
| | By: | /s/ Gerald W. Shields |
| | | Gerald W. Shields |
| | | Interim Chief Executive Officer & President |
| | | |
| | | |
| | By: | /s/ Jeffery P. Conklin |
| | | Jeffery P. Conklin |
| | | Vice President, Chief Financial Officer, Chief Investment Officer & Treasurer |
| | | |
| | | |
| | | |
| Date: | May 5, 20212022 | | |
March 31, 20212022 | 10-Q 4946