UNITED STATES
SECURITIES AND EXCHANGE COMMISSION
WASHINGTON, D.C. 20549
FORM 10-Q
☒ QUARTERLY REPORT PURSUANT TO SECTION 13 OR 15(d) OF THE SECURITIES EXCHANGE ACT OF 1934
For the Quarterly Period Ended September 30, 2023March 31, 2024
OR
☐ TRANSITION REPORT PURSUANT TO SECTION 13 OR 15(d) OF THE SECURITIES EXCHANGE ACT OF 1934
For the Transition Period from to
COMMISSION FILE NUMBER: 000-16509

| | |
| CITIZENS, INC. |
| (Exact name of registrant as specified in its charter) |
| | | | | |
| Colorado | 84-0755371 |
| (State or other jurisdiction of incorporation or organization) | (I.R.S. Employer Identification No.) |
11815 Alterra Pkwy, Floor 15, Austin, TX 78758
(Current Address)
Registrant's telephone number, including area code: (512) 837-7100
| | | | | | | | |
| Securities registered pursuant to Section 12(b) of the Act |
|
| Class A Common Stock | CIA | NYSE |
| (Title of each class) | (Trading symbol(s)) | (Name of each exchange on which registered) |
Indicate by check mark whether the registrant: (1) has filed all reports required to be filed by Section 13 or 15(d) of the Securities Exchange Act of 1934 during the preceding 12 months (or for such shorter period that the registrant was required to file such reports), and (2) has been subject to such filing requirements for the past 90 days. x Yes o No
Indicate by check mark whether the registrant has submitted electronically every Interactive Data File required to be submitted pursuant to Rule 405 of Regulation S-T (§232.405 of this chapter) during the preceding 12 months (or for such shorter period that the registrant was required to submit such files). x Yes o No
Indicate by check mark whether the registrant is a large accelerated filer, an accelerated filer, a non-accelerated filer, a smaller reporting company or an emerging growth company. See the definitions of "large accelerated filer," "accelerated filer," "smaller reporting company" and "emerging growth company" in Rule 12b-2 of the Exchange Act:
| | | | | | | | | | | | | | | | | | | | | | | | | | | | | | | | | | | | | | | | | | | | | | | |
| Large accelerated filer | ☐ | | Accelerated filer | ☒ | | Non-accelerated filer | ☐ | | Smaller reporting company | ☒ | | Emerging growth company | ☐ | |
If an emerging growth company, indicate by check mark if the registrant has elected not to use the extended transition period for complying with any new or revised financial accounting standards provided pursuant to Section 13(a) of the Exchange Act. o
Indicate by check mark whether the registrant is a shell company (as defined in Rule 12b-2 of the Exchange Act). ☐ Yes x No
As of NovemberMay 1, 2023,2024, the Registrant had 49,552,54949,633,705 shares of Class A common stock outstanding.
THIS PAGE INTENTIONALLY LEFT BLANK
TABLE OF CONTENTS | | | | | | | | | | | |
| | | Page Number |
| Part I. FINANCIAL INFORMATION | |
| | | |
| | Item 1. | | |
| | | |
| | | | |
| | | |
| | | |
| | | |
| | | |
| | | |
| | | | |
| | | |
| | | | |
| | | |
| | Item 2. | | |
| | | |
| | Item 3. | | |
| | | |
| | Item 4. | | |
| | | |
| Part II. OTHER INFORMATION | |
| | | |
| | Item 1. | | |
| | | |
| Item 1A. | | |
| | | |
| | Item 2. | | |
| | | |
| | Item 3. | | |
| | | |
| | Item 4. | | |
| | | |
| | Item 5. | | |
| | | |
| | Item 6. | | |
September 30, 2023March 31, 2024 | 10-Q 1
PART I. FINANCIAL INFORMATION
Item 1. FINANCIAL STATEMENTS
CITIZENS, INC. AND CONSOLIDATED SUBSIDIARIES
Consolidated Balance Sheets
(Unaudited)
| | | | | | | | | | | |
| | | |
| | | |
| (In thousands) | September 30, 2023 | | December 31, 2022 |
| Assets | | | |
| Investments: | | | |
| Fixed maturity securities available-for-sale, at fair value (amortized cost: $1,389,390 and $1,381,318 in 2023 and 2022, respectively) | $ | 1,151,353 | | | 1,179,619 | |
| | | |
| Equity securities, at fair value | 10,555 | | | 11,590 | |
| | | |
| Policy loans | 75,750 | | | 78,773 | |
| | | |
| | | |
| Other long-term investments (portion measured at fair value $79,535 and $66,846 in 2023 and 2022, respectively) | 79,798 | | | 69,558 | |
| Short-term investments | — | | | 1,241 | |
| Total investments | 1,317,456 | | | 1,340,781 | |
| Cash and cash equivalents | 16,785 | | | 22,973 | |
| Accrued investment income | 17,123 | | | 17,131 | |
| | | |
| Reinsurance recoverable | 3,782 | | | 4,560 | |
| Deferred policy acquisition costs | 171,417 | | | 162,927 | |
| Cost of insurance acquired | 10,182 | | | 10,647 | |
| Current federal income tax receivable | — | | | 601 | |
| | | |
| Property and equipment, net | 12,009 | | | 12,926 | |
| Due premiums | 9,661 | | | 11,829 | |
| | | |
| Other assets (less allowance for losses of $357 and $347 in 2023 and 2022, respectively) | 6,225 | | | 6,328 | |
| Total assets | $ | 1,564,640 | | | 1,590,703 | |
| | | | | | | | | | | |
| | | |
| | | |
| (In thousands) | March 31, 2024 | | December 31, 2023 |
| (Unaudited) | | |
| Assets: | | | |
| Investments: | | | |
| Fixed maturity securities available-for-sale, at fair value (amortized cost: $1,397,074 and $1,389,038 in 2024 and 2023, respectively) | $ | 1,234,048 | | | 1,238,981 | |
| | | |
| Equity securities, at fair value | 5,419 | | | 5,282 | |
| | | |
| Policy loans | 75,274 | | | 75,359 | |
| | | |
| | | |
| Other long-term investments (portion measured at fair value $84,853 and $82,460 in 2024 and 2023, respectively) | 85,118 | | | 82,725 | |
| | | |
| Total investments | 1,399,859 | | | 1,402,347 | |
| Cash and cash equivalents | 23,242 | | | 26,997 | |
| Accrued investment income | 17,290 | | | 17,360 | |
| | | |
| Reinsurance recoverable | 4,208 | | | 3,991 | |
| Deferred policy acquisition costs | 180,061 | | | 175,768 | |
| Cost of insurance acquired | 9,871 | | | 10,043 | |
| Current federal income tax receivable | 192 | | | 1,546 | |
| | | |
| Property and equipment, net | 11,408 | | | 11,809 | |
| Due premiums | 9,880 | | | 11,264 | |
| | | |
| Other assets (less allowance for losses of $431 and $408 in 2024 and 2023, respectively) | 9,652 | | | 7,803 | |
| Total assets | $ | 1,665,663 | | | 1,668,928 | |
See accompanying Notes to Consolidated Financial Statements.
September 30, 2023March 31, 2024 | 10-Q 2
CITIZENS, INC. AND CONSOLIDATED SUBSIDIARIES
Consolidated Balance Sheets, Continued
(Unaudited)
| | | (In thousands, except share amounts) | (In thousands, except share amounts) | September 30, 2023 | | December 31, 2022 |
| Liabilities and Stockholders' Equity | |
| | (In thousands, except share amounts) | |
| | (In thousands, except share amounts) | | March 31, 2024 | | December 31, 2023 |
| (Unaudited) | |
| Liabilities and Stockholders' Equity: | |
| Liabilities and Stockholders' Equity: | |
| Liabilities and Stockholders' Equity: | |
| Liabilities: | |
| Liabilities: | |
| Liabilities: | Liabilities: | | | | | | |
| Policy liabilities: | Policy liabilities: | | | | Policy liabilities: | | | |
| Future policy benefit reserves: | Future policy benefit reserves: | | | | Future policy benefit reserves: | | | |
| Life insurance | Life insurance | $ | 1,147,601 | | | 1,198,647 | |
| Accident and health insurance | Accident and health insurance | 877 | | | 767 | |
| Total future policy benefit reserves | Total future policy benefit reserves | 1,148,478 | | | 1,199,414 | |
| Policyholders' funds: | Policyholders' funds: | |
| Annuities | Annuities | 129,909 | | | 121,422 | |
| Annuities | |
| Annuities | |
| Dividend accumulations | Dividend accumulations | 44,102 | | | 41,663 | |
| Premiums paid in advance | Premiums paid in advance | 35,453 | | | 36,384 | |
| Policy claims payable | Policy claims payable | 5,943 | | | 9,884 | |
| Other policyholders' funds | Other policyholders' funds | 7,218 | | | 7,501 | |
| Total policyholders' funds | Total policyholders' funds | 222,625 | | | 216,854 | |
| Total policy liabilities | Total policy liabilities | 1,371,103 | | | 1,416,268 | |
| Commissions payable | Commissions payable | 1,681 | | | 1,967 | |
| Current federal income tax payable | 652 | | | — | |
| | Deferred federal income tax liability | |
| Deferred federal income tax liability | |
| Deferred federal income tax liability | Deferred federal income tax liability | 2,097 | | | 3,653 | |
| Payable for securities in process of settlement | Payable for securities in process of settlement | 250 | | | — | |
| Other liabilities | Other liabilities | 36,110 | | | 41,025 | |
| Total liabilities | Total liabilities | 1,411,893 | | | 1,462,913 | |
Commitments and contingencies (Note 7) | Commitments and contingencies (Note 7) | | Commitments and contingencies (Note 7) | | | |
| Stockholders' Equity: | Stockholders' Equity: | | | | Stockholders' Equity: | | | |
| Common stock: | Common stock: | |
| Class A, no par value, 100,000,000 shares authorized, 53,880,359 and 53,758,176 shares issued and outstanding in 2023 and 2022, respectively, including shares in treasury of 4,261,005 in 2023 and 3,935,581 in 2022 | 268,423 | | | 268,147 | |
| Class B, no par value, 2,000,000 shares authorized, 1,001,714 shares issued and outstanding in 2023 and 2022, including shares in treasury of 1,001,714 in 2023 and 2022 | 3,184 | | | 3,184 | |
| Class A, no par value, 100,000,000 shares authorized, 53,900,208 and 53,882,661 shares issued and outstanding in 2024 and 2023, respectively, including shares in treasury of 4,327,810 in 2024 and 2023 | |
| Class A, no par value, 100,000,000 shares authorized, 53,900,208 and 53,882,661 shares issued and outstanding in 2024 and 2023, respectively, including shares in treasury of 4,327,810 in 2024 and 2023 | |
| Class A, no par value, 100,000,000 shares authorized, 53,900,208 and 53,882,661 shares issued and outstanding in 2024 and 2023, respectively, including shares in treasury of 4,327,810 in 2024 and 2023 | |
| Class B, no par value, 2,000,000 shares authorized, 1,001,714 shares issued and outstanding in 2024 and 2023, including shares in treasury of 1,001,714 in 2024 and 2023 | |
| Retained earnings | Retained earnings | 31,332 | | | 16,309 | |
| Accumulated other comprehensive income (loss) | Accumulated other comprehensive income (loss) | (126,667) | | | (137,044) | |
| Treasury stock, at cost | Treasury stock, at cost | (23,525) | | | (22,806) | |
| Total stockholders' equity | Total stockholders' equity | 152,747 | | | 127,790 | |
| Total liabilities and stockholders' equity | Total liabilities and stockholders' equity | $ | 1,564,640 | | | 1,590,703 | |
See accompanying Notes to Consolidated Financial Statements.
September 30, 2023March 31, 2024 | 10-Q 3
CITIZENS, INC. AND CONSOLIDATED SUBSIDIARIES
Consolidated Statements of Operations and Comprehensive Income (Loss)
(Unaudited)
| | | | | Three Months Ended | |
| | Three Months Ended | | Nine Months Ended |
| | | Three Months Ended | |
| | September 30, | | September 30, |
| | | Three Months Ended | |
| | | March 31, | | | | | March 31, |
| (In thousands, except per share amounts) | (In thousands, except per share amounts) | 2023 | | 2022 | | 2023 | | 2022 | (In thousands, except per share amounts) | | | | | 2024 | | 2023 |
| Revenues: | Revenues: | | | |
| Premiums: | |
| Premiums: | |
| Premiums: | Premiums: | | | | | | | | | | | |
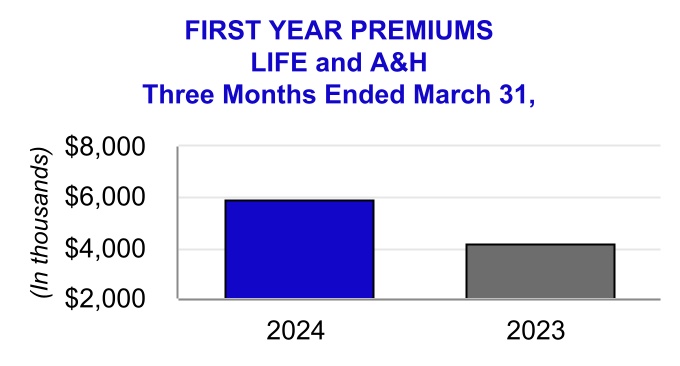
| Life insurance | Life insurance | $ | 41,794 | | | 42,423 | | | 118,020 | | | 120,930 | |
| Accident and health insurance | Accident and health insurance | 296 | | | 299 | | | 1,201 | | | 865 | |
| Property insurance | Property insurance | (64) | | | 1,153 | | | 780 | | | 3,668 | |
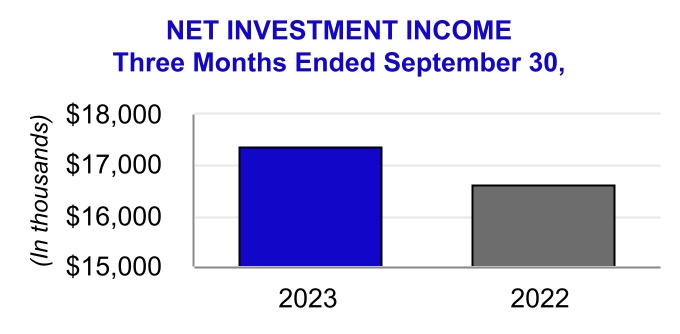
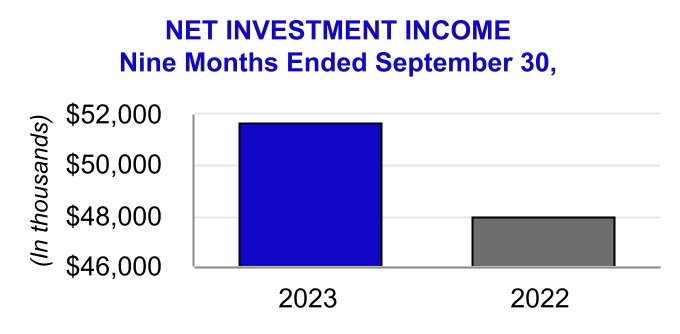
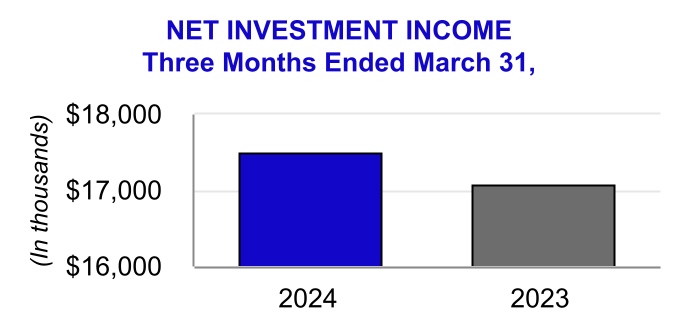
| Net investment income | Net investment income | 17,372 | | | 16,604 | | | 51,687 | | | 47,983 | |
| Investment related gains (losses), net | Investment related gains (losses), net | (892) | | | (4,991) | | | (477) | | | (10,589) | |
| Other income | Other income | 884 | | | 688 | | | 2,620 | | | 2,410 | |
| Total revenues | Total revenues | 59,390 | | | 56,176 | | | 173,831 | | | 165,267 | |
| Benefits and Expenses: | Benefits and Expenses: | | | | | | Benefits and Expenses: | | | | | | | |
| Insurance benefits paid or provided: | Insurance benefits paid or provided: | | | | | Insurance benefits paid or provided: | | | | | | | |
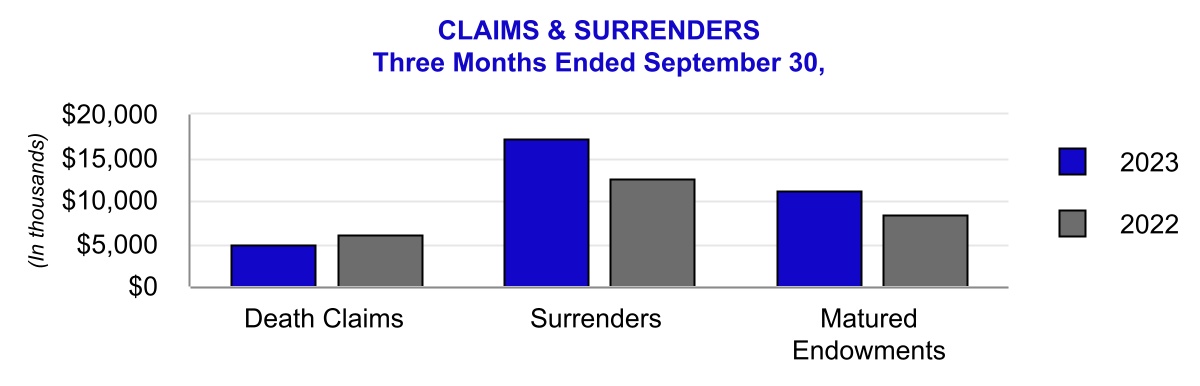
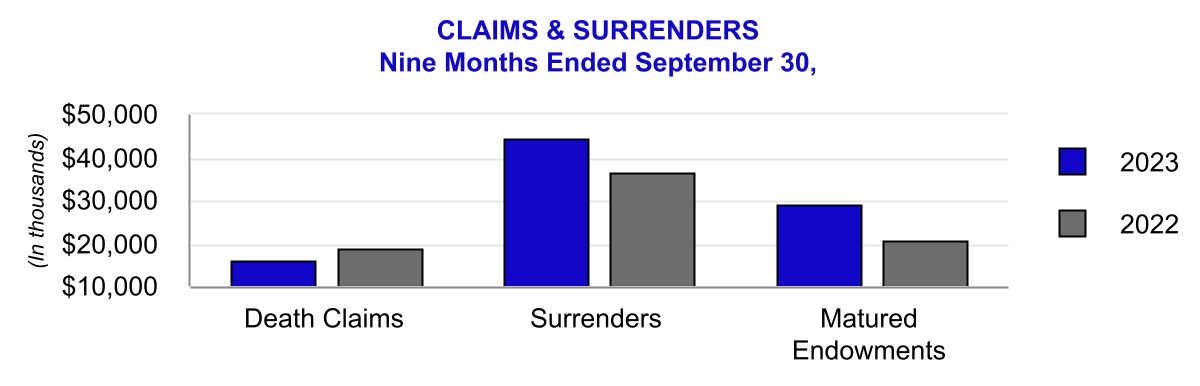
| Claims and surrenders | Claims and surrenders | 37,723 | | | 30,729 | | | 100,798 | | | 86,260 | |
| Increase (decrease) in future policy benefit reserves | Increase (decrease) in future policy benefit reserves | (3,880) | | | 653 | | | (5,802) | | | 4,497 | |
| Policyholder liability remeasurement (gain) loss | Policyholder liability remeasurement (gain) loss | 1,024 | | | 396 | | | 2,860 | | | 1,731 | |
| Policyholders' dividends | Policyholders' dividends | 1,414 | | | 1,389 | | | 3,783 | | | 4,257 | |
| Total insurance benefits paid or provided | Total insurance benefits paid or provided | 36,281 | | | 33,167 | | | 101,639 | | | 96,745 | |
| | Commissions | Commissions | 9,444 | | | 9,210 | | | 27,340 | | | 25,807 | |
| Commissions | |
| Commissions | |
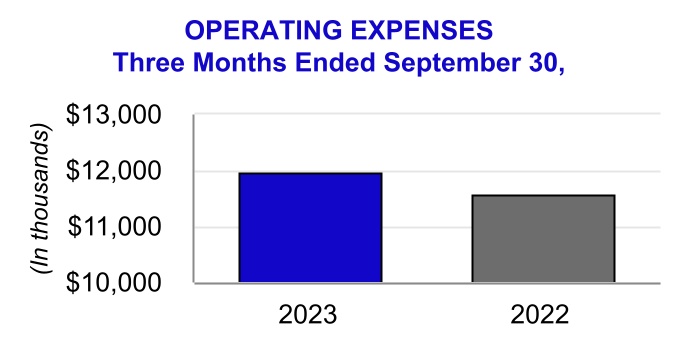
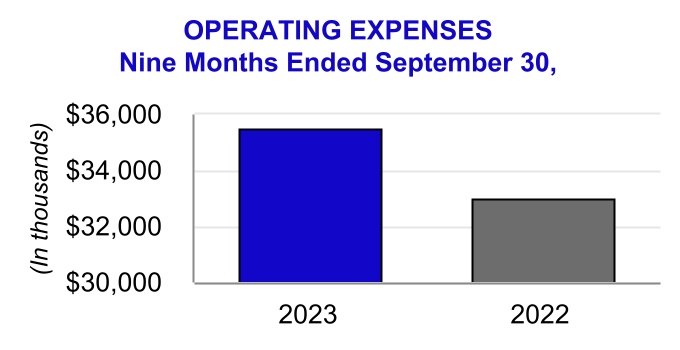
| Other general expenses | Other general expenses | 11,949 | | | 11,559 | | | 35,477 | | | 32,989 | |
| Capitalization of deferred policy acquisition costs | Capitalization of deferred policy acquisition costs | (7,132) | | | (6,372) | | | (20,034) | | | (17,337) | |
| Amortization of deferred policy acquisition costs | Amortization of deferred policy acquisition costs | 4,056 | | | 3,624 | | | 11,544 | | | 10,651 | |
| Amortization of cost of insurance acquired | Amortization of cost of insurance acquired | 151 | | | 166 | | | 465 | | | 446 | |
| Total benefits and expenses | Total benefits and expenses | 54,749 | | | 51,354 | | | 156,431 | | | 149,301 | |
| Income (loss) before federal income tax | 4,641 | | | 4,822 | | | 17,400 | | | 15,966 | |
| Federal income tax expense (benefit) | 1,943 | | | 1,415 | | | 3,704 | | | 3,618 | |
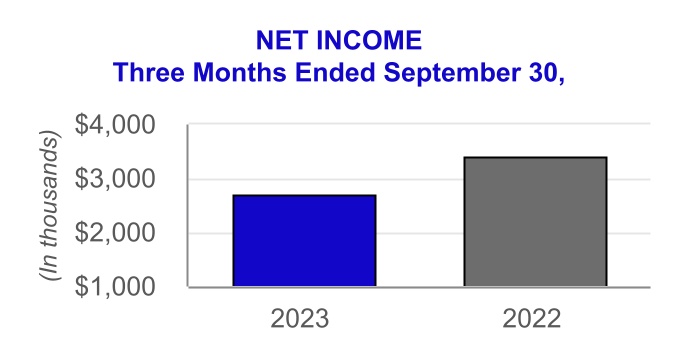
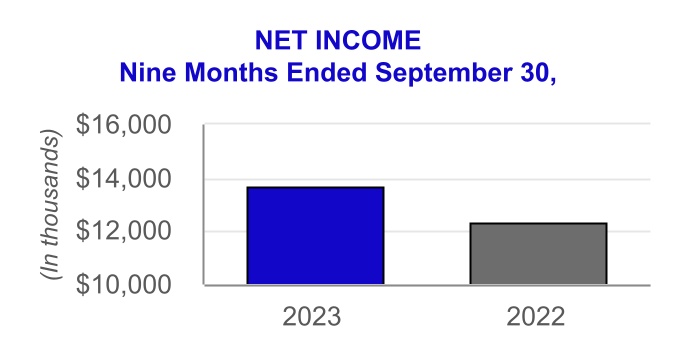
| Net income (loss) | 2,698 | | | 3,407 | | | 13,696 | | | 12,348 | |
| Income before federal income tax | |
| Federal income tax expense | |
| Net income | |
| | Per Share Amounts: | Per Share Amounts: | | | | | |
| Basic earnings (losses) per share of Class A common stock | 0.06 | | | 0.07 | | | 0.28 | | | 0.25 | |
| Diluted earnings (losses) per share of Class A common stock | 0.05 | | | 0.06 | | | 0.27 | | | 0.24 | |
| Per Share Amounts: | |
| Per Share Amounts: | | | | | | | | |
| Basic and diluted earnings per share of Class A common stock | |
| | Other Comprehensive Income (Loss): | |
| | Other Comprehensive Income (Loss): | |
| | Other Comprehensive Income (Loss): | Other Comprehensive Income (Loss): | | | | | | | | | | | |
| | Unrealized gains (losses) on fixed maturity securities: | Unrealized gains (losses) on fixed maturity securities: | | | | |
| Unrealized gains (losses) on fixed maturity securities: | |
| Unrealized gains (losses) on fixed maturity securities: | | | | | | | | |
| Unrealized holding gains (losses) arising during period | Unrealized holding gains (losses) arising during period | (59,817) | | | (88,382) | | | (36,811) | | | (340,678) | |
| Reclassification adjustment for losses (gains) included in net income (loss) | 419 | | | 43 | | | 481 | | | 78 | |
| Reclassification adjustment for losses (gains) included in net income | |
| Unrealized gains (losses) on fixed maturity securities, net | Unrealized gains (losses) on fixed maturity securities, net | (59,398) | | | (88,339) | | | (36,330) | | | (340,600) | |
| Change in current discount rate for liability for future policy benefits | Change in current discount rate for liability for future policy benefits | 60,054 | | | 73,214 | | | 45,825 | | | 345,258 | |
| Income tax expense (benefit) on other comprehensive income items | Income tax expense (benefit) on other comprehensive income items | (1,040) | | | (184) | | | (882) | | | 6,162 | |
| Other comprehensive income (loss) | Other comprehensive income (loss) | 1,696 | | | (14,941) | | | 10,377 | | | (1,504) | |
| Total comprehensive income (loss) | Total comprehensive income (loss) | $ | 4,394 | | | (11,534) | | | 24,073 | | | 10,844 | |
See accompanying Notes to Consolidated Financial Statements.
September 30, 2023March 31, 2024 | 10-Q 4
CITIZENS, INC. AND CONSOLIDATED SUBSIDIARIES
Consolidated Statements of Stockholders' Equity
(Unaudited) | | | | | | | | | | | | | | | | | | | | |
| | | | | | |
| | | | | | |
| | Common Stock | Retained Earnings (Accumulated
Deficit) | Accumulated Other
Comprehensive
Income (Loss) | Treasury
Stock | Total Stockholders' Equity |
| (In thousands) | Class A | Class B |
| | | | | |
| | | | | | |
| | | | | | |
| | | | | | |
| | | | | | |
| | | | | | |
| | | | | | |
| | | | | | |
| | | | | | |
| | | | | | |
| | | | | | |
| | | | | | |
| | | | | | |
| | | | | | |
| | | | | | |
| | | | | | |
| | | | | | |
| | | | | | |
| | | | | | |
| | | | | | |
| | | | | | |
| | | | | | |
| | | | | | |
| | | | | | |
| | | | | | Balance at December 31, 2022 | $ | 268,147 | | | 3,184 | | | 16,309 | | | (137,044) | | | (22,806) | | | 127,790 | |
| Balance at December 31, 2023 | |
| | Balance at December 31, 2023 | |
| | Balance at December 31, 2023 | |
| Comprehensive income (loss): | Comprehensive income (loss): | |
| Net income (loss) | — | | | — | | | 4,872 | | | — | | | — | | | 4,872 | |
| Net income | |
| Net income | |
| Net income | |
| Other comprehensive income (loss) | Other comprehensive income (loss) | — | | | — | | | — | | | 21,579 | | | — | | | 21,579 | |
| Total comprehensive income (loss) | Total comprehensive income (loss) | — | | | — | | | 4,872 | | | 21,579 | | | — | | | 26,451 | |
| | Stock-based compensation | Stock-based compensation | 50 | | | — | | | — | | | — | | | — | | | 50 | |
| Balance at March 31, 2023 | 268,197 | | | 3,184 | | | 21,181 | | | (115,465) | | | (22,806) | | | 154,291 | |
| Comprehensive income (loss): | | | | | | | | | | | |
| Net income (loss) | — | | | — | | | 6,126 | | | — | | | — | | | 6,126 | |
| Other comprehensive income (loss) | — | | | — | | | — | | | (12,898) | | | — | | | (12,898) | |
| Total comprehensive income (loss) | — | | | — | | | 6,126 | | | (12,898) | | | — | | | (6,772) | |
| Stock-based compensation | |
| Stock-based compensation | |
| Balance at March 31, 2024 | |
| | Acquisition of treasury stock | — | | | — | | | — | | | — | | | (719) | | | (719) | |
| Stock-based compensation | 46 | | | — | | | — | | | — | | | — | | | 46 | |
| Balance at June 30, 2023 | 268,243 | | | 3,184 | | | 27,307 | | | (128,363) | | | (23,525) | | | 146,846 | |
| | Comprehensive income (loss): | | | | | | | | | | | |
| Net income (loss) | — | | | — | | | 2,698 | | | — | | | — | | | 2,698 | |
| Other comprehensive income (loss) | — | | | — | | | — | | | 1,696 | | | — | | | 1,696 | |
| Total comprehensive income (loss) | — | | | — | | | 2,698 | | | 1,696 | | | — | | | 4,394 | |
| | Stock-based compensation | 180 | | | — | | | — | | | — | | | — | | | 180 | |
Other1 | — | | | — | | | 1,327 | | | — | | | — | | | 1,327 | |
| Balance at September 30, 2023 | $ | 268,423 | | | 3,184 | | | 31,332 | | | (126,667) | | | (23,525) | | | 152,747 | |
|
1 See Note 10 - Income Taxes for details. | | | | | | | | | | | | | | | | | | | | | | | | | | | | | | | | | | | |
| | | | | | | | | | | |
| | | | | | | | | | | |
|
|
|
| | | | | | | | | | | |
| | | | | | | | | |
| | | | | | | |
| Balance at December 31, 2022 | $ | 268,147 | | | 3,184 | | | 16,309 | | | (137,044) | | | (22,806) | | | 127,790 | |
| Comprehensive income (loss): | | | | | | | | | | | |
| Net income | — | | | — | | | 4,872 | | | — | | | — | | | 4,872 | |
| Other comprehensive income (loss) | — | | | — | | | — | | | 21,579 | | | — | | | 21,579 | |
| Total comprehensive income (loss) | — | | | — | | | 4,872 | | | 21,579 | | | — | | | 26,451 | |
| | | | | | | | | | | |
| Stock-based compensation | 50 | | | — | | | — | | | — | | | — | | | 50 | |
| Balance at March 31, 2023 | $ | 268,197 | | | 3,184 | | | 21,181 | | | (115,465) | | | (22,806) | | | 154,291 | |
| | | | | | | | | | | |
| | | | | | | | | | | |
| | | | | | | | | | | |
| | | | | | | | | | | |
| | | | | | | | | | | |
| | | | | | | | | | | |
| | | | | | | | | | | |
| | | | | | | | | | | |
| | | | | | | | | | | |
| | | | | | | | | | | |
| | | | | | | | | | | |
| | | | | | | | | | | |
| | | | | | | | | | | |
| | | | | | | | | | | |
| | | | | | | | | | | |
| | | | | | | | | | | |
| | | | | | | | | | | |
| | | | | | | | | | | |
| | | | | | | | | | | |
| | | | | | | | | | | |
| | | | | | | | | | | |
| | | | | | | | | | | |
See accompanying Notes to Consolidated Financial Statements.
September 30, 2023March 31, 2024 | 10-Q 5
| | | | | | | | | | | | | | | | | | | | | | | | | | | | | | | | | | | |
| | | | | | | | | | | |
| | | | | | | | | | | |
CITIZENS, INC. AND CONSOLIDATED SUBSIDIARIES |
Consolidated Statements of Stockholders' Equity, Continued |
(Unaudited) |
| | | | | | | | | | | |
| | | | | | | | | | | |
| | | | | | | | | | | |
| | | | | | | | | | | |
| | | | | | | | | | | |
| | | | | | | | | | | |
| | | | | | | | | | | |
| | | | | | | | | | | | | | | | | | | | |
| | | | | | |
| | | | | | |
| Common Stock | Retained Earnings (Accumulated
Deficit) | Accumulated Other
Comprehensive
Income (Loss) | Treasury
Stock | Total
Stockholders' Equity
|
(In thousands) | Class A | Class B |
| | | | | |
| | | | | | |
| | | | | | |
| | | | | | |
| | | | | | |
| | | | | | |
| | | | | | |
| | | | | | |
| | | | | | |
| | | | | | |
| | | | | | |
| | | | | | |
| | | | | | |
| | | | | | |
| | | | | | |
| | | | | | |
| | | | | | |
| | | | | | |
| | | | | | |
| | | | | | |
| | | | | | |
| | | | | | |
| | | | | | |
| | | | | | |
| | | | | | | | | | | | | | | | | | | | | | | | | | | | | | | | | | | |
| | | | | | | | | | | |
| | | | | | | | | | | |
|
|
|
| | | | | | | | | | | |
| | | | | | | | | |
| | | | | | | |
| | | | | | | | | | |
| Balance at December 31, 2021 | $ | 265,561 | | | 3,184 | | | (9,698) | | | (138,989) | | | (20,101) | | | 99,957 | |
| Comprehensive income (loss): | | | | | | | | | | | |
| Net income (loss) | — | | | — | | | 6,449 | | | — | | | — | | | 6,449 | |
| Other comprehensive income (loss) | — | | | — | | | — | | | 17,189 | | | — | | | 17,189 | |
| Total comprehensive income (loss) | — | | | — | | | 6,449 | | | 17,189 | | | — | | | 23,638 | |
| Issuance of common stock | 1,788 | | | — | | | — | | | — | | | — | | | 1,788 | |
| Stock-based compensation | 93 | | | — | | | — | | | — | | | — | | | 93 | |
| Balance at March 31, 2022 | 267,442 | | | 3,184 | | | (3,249) | | | (121,800) | | | (20,101) | | | 125,476 | |
| Comprehensive income (loss): | | | | | | | | | | | |
| Net income (loss) | — | | | — | | | 2,492 | | | — | | | — | | | 2,492 | |
| Other comprehensive income (loss) | — | | | — | | | — | | | (3,752) | | | — | | | (3,752) | |
| Total comprehensive income (loss) | — | | | — | | | 2,492 | | | (3,752) | | | — | | | (1,260) | |
| Issuance of common stock | 455 | | | — | | | — | | | — | | | — | | | 455 | |
| Acquisition of treasury stock | — | | | — | | | — | | | — | | | (1,300) | | | (1,300) | |
| Stock-based compensation | (47) | | | — | | | — | | | — | | | — | | | (47) | |
| Balance at June 30, 2022 | 267,850 | | | 3,184 | | | (757) | | | (125,552) | | | (21,401) | | | 123,324 | |
| Comprehensive income (loss): | | | | | | | | | | | |
| Net income (loss) | — | | | — | | | 3,407 | | | — | | | — | | | 3,407 | |
| Other comprehensive income (loss) | — | | | — | | | — | | | (14,941) | | | — | | | (14,941) | |
| Total comprehensive income (loss) | — | | | — | | | 3,407 | | | (14,941) | | | — | | | (11,534) | |
| Acquisition of treasury stock | — | | | — | | | — | | | — | | | (883) | | | (883) | |
| Stock-based compensation | 138 | | | — | | | — | | | — | | | — | | | 138 | |
| Balance at September 30, 2022 | $ | 267,988 | | | 3,184 | | | 2,650 | | | (140,493) | | | (22,284) | | | 111,045 | |
| | | | | | | | | | | |
| | | | | | | | | | | |
| | | | | | | | | | | |
| | | | | | | | | | | |
| | | | | | | | | | | |
| | | | | | | | | | | |
| | | | | | | | | | | |
See accompanying Notes to Consolidated Financial Statements.
September 30, 2023 | 10-Q 6
CITIZENS, INC. AND CONSOLIDATED SUBSIDIARIES
Consolidated Statements of Cash Flows
(Unaudited)
| Nine Months Ended September 30, (In thousands) | 2023 | | 2022 |
Three Months Ended March 31, (In thousands) | | Three Months Ended March 31, (In thousands) | 2024 | | 2023 |
| Cash flows from operating activities: | Cash flows from operating activities: | | |
| Net income (loss) | $ | 13,696 | | | 12,348 | |
| Adjustments to reconcile net income (loss) to net cash provided by operating activities: | | | |
| Investment related (gains) losses on sale of investments and other assets | 477 | | | 10,589 | |
| Net income | |
| Net income | |
| Net income | |
| Adjustments to reconcile net income to net cash provided by operating activities: | | Adjustments to reconcile net income to net cash provided by operating activities: | | | |
| Investment related (gains) losses on sale of investments and other assets, net | |
| Net deferred policy acquisition costs | Net deferred policy acquisition costs | (8,490) | | | (6,686) | |
| Amortization of cost of insurance acquired | Amortization of cost of insurance acquired | 465 | | | 446 | |
| Depreciation | Depreciation | 380 | | | 413 | |
| Amortization of premiums and discounts on investments | Amortization of premiums and discounts on investments | 3,761 | | | 3,456 | |
| Stock-based compensation | Stock-based compensation | 333 | | | 300 | |
| Deferred federal income tax expense (benefit) | Deferred federal income tax expense (benefit) | 652 | | | 1,623 | |
| Change in: | Change in: | | | | Change in: | | | |
| Accrued investment income | Accrued investment income | 8 | | | (418) | |
| Reinsurance recoverable | Reinsurance recoverable | 778 | | | 2,054 | |
| Due premiums | Due premiums | 2,168 | | | 197 | |
| Future policy benefit reserves | Future policy benefit reserves | (5,111) | | | 3,993 | |
| Other policyholders' liabilities | Other policyholders' liabilities | 8,156 | | | 3,222 | |
| Federal income tax payable | Federal income tax payable | 1,253 | | | 2,754 | |
| Commissions payable and other liabilities | Commissions payable and other liabilities | (3,116) | | | 6,367 | |
| Other, net | Other, net | 34 | | | (895) | |
| Net cash provided by (used in) operating activities | 15,444 | | | 39,763 | |
| Net cash provided by operating activities | |
| Cash flows from investing activities: | Cash flows from investing activities: | | | | Cash flows from investing activities: | | | |
| Purchases of fixed maturity securities, available-for-sale | Purchases of fixed maturity securities, available-for-sale | (50,077) | | | (102,348) | |
| Sales of fixed maturity securities, available-for-sale | Sales of fixed maturity securities, available-for-sale | 13,690 | | | 30,348 | |
| Maturities and calls of fixed maturity securities, available-for-sale | Maturities and calls of fixed maturity securities, available-for-sale | 23,128 | | | 37,890 | |
| | Sales of equity securities | 770 | | | — | |
| | Principal payments on mortgage loans | Principal payments on mortgage loans | 6 | | | 1,097 | |
| | Principal payments on mortgage loans | |
| | Principal payments on mortgage loans | |
| | (Increase) decrease in policy loans, net | |
| (Increase) decrease in policy loans, net | |
| (Increase) decrease in policy loans, net | (Increase) decrease in policy loans, net | 3,023 | | | 2,222 | |
| Sales of other long-term investments | Sales of other long-term investments | 3,793 | | | 4,130 | |
| Purchases of other long-term investments | Purchases of other long-term investments | (13,262) | | | (18,150) | |
| | Purchases of property and equipment | Purchases of property and equipment | (292) | | | (76) | |
| Maturities of short-term investments | 750 | | | — | |
| Purchases of short-term investments | — | | | (1,250) | |
| Purchases of property and equipment | |
| Purchases of property and equipment | |
| | Net cash provided by (used in) investing activities | (18,471) | | | (46,137) | |
| | Net cash used in investing activities | |
| | Net cash used in investing activities | |
| | Net cash used in investing activities | |
| See accompanying Notes to Consolidated Financial Statements. | | See accompanying Notes to Consolidated Financial Statements. | |
| See accompanying Notes to Consolidated Financial Statements. | |
|
September 30, 2023March 31, 2024 | 10-Q 76
| | CITIZENS, INC. AND CONSOLIDATED SUBSIDIARIES | CITIZENS, INC. AND CONSOLIDATED SUBSIDIARIES | CITIZENS, INC. AND CONSOLIDATED SUBSIDIARIES |
| Consolidated Statements of Cash Flows, Continued | Consolidated Statements of Cash Flows, Continued | Consolidated Statements of Cash Flows, Continued |
| (Unaudited) | (Unaudited) | (Unaudited) |
| Nine Months Ended September 30, (In thousands) | 2023 | | 2022 |
Three Months Ended March 31, (In thousands) | |
Three Months Ended March 31, (In thousands) | |
Three Months Ended March 31, (In thousands) | | 2024 | | 2023 |
| Cash flows from financing activities: | Cash flows from financing activities: | | | | Cash flows from financing activities: | | | |
| Annuity deposits | Annuity deposits | $ | 5,443 | | | 6,777 | |
| Annuity withdrawals | Annuity withdrawals | (7,828) | | | (6,634) | |
| Acquisition of treasury stock | (719) | | | (2,183) | |
| Issuance of common stock | — | | | 2,244 | |
| | Other | Other | (57) | | | (117) | |
| Net cash provided by (used in) financing activities | (3,161) | | | 87 | |
| Net increase (decrease) in cash and cash equivalents | (6,188) | | | (6,287) | |
| | Other | |
| | Other | |
| Net cash used in financing activities | |
| Net decrease in cash and cash equivalents | |
| Cash and cash equivalents at beginning of year | Cash and cash equivalents at beginning of year | 22,973 | | | 27,294 | |
| Cash and cash equivalents at end of period | Cash and cash equivalents at end of period | $ | 16,785 | | | 21,007 | |
| |
SUPPLEMENTAL DISCLOSURES OF NONCASH INVESTING AND FINANCING ACTIVITIES:
During the ninethree months ended September 30,March 31, 2023, and 2022, various fixed maturity issuers exchanged securities with book values of $5.4$2.1 million and $6.1 million, respectively, for securities of equal value.value while none were exchanged during the three months ended March 31, 2024.
The Company had $0.3$1.4 million of net unsettled security trades at September 30, 2023March 31, 2024 and none at September 30, 2022.
The Company recognized $36 thousand right-of-use assets in exchange for new operating lease liabilities during the nine months ended September 30, 2023 and $0.4 million during the nine months ended September 30, 2022.March 31, 2023.
See accompanying Notes to Consolidated Financial Statements.
September 30, 2023March 31, 2024 | 10-Q 87
| | | | | | | | |
CITIZENS, INC. | NOTES TO CONSOLIDATED FINANCIAL STATEMENTS |
| | (Unaudited) |
(1) FINANCIAL STATEMENTS
BASIS OF PRESENTATION AND CONSOLIDATION
The consolidated financial statements include the accounts and operations of Citizens, Inc. ("Citizens" or the "Company"), a Colorado corporation, and its wholly-owned subsidiaries, CICA Life Insurance Company of America ("CICA"CICA Domestic"), CICA Life Ltd. ("CICA International"Bermuda"), CICA Life A.I., a Puerto Rico company ("CICA PR"), Citizens National Life Insurance Company ("CNLIC"International"), Security Plan Life Insurance Company ("SPLIC"), Security Plan Fire Insurance Company ("SPFIC"), Magnolia Guaranty Life Insurance Company ("MGLIC"), Computing Technology, Inc. ("CTI"), Nexo Enrollment Services LLC, a Puerto Rico service company ("NES") and Nexo Global Services LLC, a Puerto Rico holding company ("Nexo"). All significant inter-company accounts and transactions have been eliminated. Citizens and its wholly-owned subsidiaries are collectively referred to as the "Company," "it," "we," "us" or "our".
The consolidated balance sheet as of September 30, 2023,March 31, 2024, the consolidated statements of operations and comprehensive income (loss) and stockholders' equity for the three and nine months ended September 30,March 31, 2024 and March 31, 2023 and September 30, 2022 and the consolidated statements of cash flows for the ninethree months ended September 30,March 31, 2024 and March 31, 2023 and September 30, 2022 have been prepared by the Company without audit and are not subject to audit. In the opinion of management, all normal and recurring adjustments to present fairly the financial position, results of operations, and changes in cash flows at September 30, 2023March 31, 2024 and for comparative periods have been made. The consolidated financial statements have been prepared in accordance with U.S. generally accepted accounting principles ("U.S. GAAP") for interim financial information and with the instructions to Form 10-Q adopted by the Securities and Exchange Commission ("SEC"). Accordingly, the consolidated financial statements do not include all the information and footnotes required for complete financial statements and should be read in conjunction with the Company’s consolidated financial statements and notes thereto included in our Annual Report on Form 10-K for the year ended December 31, 20222023 ("Form 10-K"). Operating results for the interim periods disclosed herein are not necessarily indicative of the results that may be expected for a full year or any future period.
Our Life Insurance segment operates through CICA PRInternational and CICA.CICA Domestic. Until December 31, 2022, our international life insurance business operated through CICA International.Bermuda. Beginning January 1, 2023, all new international policies are issued by CICA PR.International. These companies provide U.S. dollar-denominated endowment contracts internationally, which are principally accumulation contracts that incorporate an element of life insurance protection and ordinary whole life insurance in U.S. dollar-denominated amounts sold to non-U.S. residents. These contracts are designed to provide a fixed amount of insurance coverage over the life of the insured and may utilize rider benefits to provide additional increasing or decreasing coverage and annuity benefits to enhance accumulations. On August 31, 2023, CICA InternationalBermuda transferred all of its insurance in force business to CICA PR.International. Prior to July 1, 2023, our domestic life insurance business operated through CICA Domestic and CNLIC.Citizens National Life Insurance Company ("CNLIC"). CICA Domestic issues ordinary whole life, final expense, life products with living benefits, critical illness, and credit life and disability policies throughout the U.S. and CNLIC issued ordinary whole life and critical illness policies through June 30, 2023. CNLIC merged into CICA Domestic on July 1, 2023.
Our Home Service Insurance segment operates through our subsidiaries SPLIC, MGLIC and SPFIC, and focuses on the life insurance needs of the middle- and lower-income markets, primarily in Louisiana, Mississippi and Arkansas. Our products in this segment consist primarily of small face amount ordinary whole life, industrial life and pre-need policies, which are designed to fund final expenses for the insured, primarily consisting of funeral and burial costs as well as critical illness and property insurance policies, which cover dwelling and contents. As of June 30, 2023, the Company ceased all operations for SPFIC.
CTI provides data processing systems and services to the Company. NES provides services to policyholders of CICA International.
| | | | | | | | |
CITIZENS, INC. | NOTES TO CONSOLIDATED FINANCIAL STATEMENTS |
| | (Unaudited) |
USE OF ESTIMATES
The preparation of consolidated financial statements in conformity with U.S. GAAP requires management to make estimates and assumptions that affect the reported amounts of assets and liabilities and the disclosure of contingent
September 30, 2023 | 10-Q 9
| | | | | | | | |
CITIZENS, INC.
| NOTES TO CONSOLIDATED FINANCIAL STATEMENTS |
| | (Unaudited)
|
assets and liabilities at the date of the consolidated financial statements and the reported amounts of revenues and expenses during the reporting period. Actual results could differ materially from thosethese estimates.
Significant estimates include those used in the evaluation of credit allowanceslosses on fixed maturity securities, valuation allowances on deferred tax assets, actuarially determined assets and liabilities and assumptions and valuation allowance on deferred tax assets.contingencies related to litigation and regulatory matters. Certain of these estimates are particularly sensitive to market conditions, and deterioration and/or volatility in the worldwide debt or equity markets could have a material impact on the consolidated financial statements.
SIGNIFICANT ACCOUNTING POLICIES
For a description of all significant accounting policies, see Part IV, Item 15, Note 1. Summary of Significant Accounting Policies in the notes to our consolidated financial statements included in our Form 10-K, which should be read in conjunction with these accompanying consolidated financial statements.
DEFERRED POLICY ACQUISITION COSTS
Deferred policy acquisition costs (“DAC”) are costs that are incremental and directly related to the successful acquisition of new or renewal insurance contracts. Such costs include the incremental direct costs of contract acquisition, such as sales commissions; the portion of employees’ total compensation and payroll-related fringe benefits related directly to time spent performing acquisition activities, such as underwriting, issuing, and processing policies for contracts that have actually been acquired; and other costs related directly to acquisition activities that would not have been incurred if the contract had not been acquired.
Contracts are grouped by contract type and issue year into cohorts consistent with the grouping used in estimating the associated liability. DAC is amortized on a constant level basis for the grouped contracts over the expected term of the related contracts to approximate straight-line amortization. For the Life Insurance segment, the constant level basis used is policy count in force. For the Home Service Insurance segment, the constant level basis used is face amount in force. The constant level bases used for amortization are projected using mortality and lapse assumptions that are based on the Company’s experience, industry data, and other factors at the end of each reporting period and are consistent with those used for the liability for future policy benefit life reserves. Annually, the Company completes experience studies with respect to mortality and lapse. If those assumptions are updated, the DAC amortization basis is recalculated and the effect of the assumption change will be reflected in the cohort level amortization in future periods.
Amortization of DAC is included in the consolidated statements of comprehensive income or loss. The DAC balance on the consolidated balance sheets is reduced for actual experience in excess of expected experience. Changes in future estimates are recognized prospectively over the remaining expected contract term.
COST OF INSURANCE ACQUIRED
The Company recognizes an intangible asset that arises in the application of U.S. GAAP purchase accounting as the difference between the reported value and the fair value of insurance contract liabilities, or comparable amounts determined in purchased insurance business combinations. This intangible asset is referred to as the Cost of Insurance Acquired (“COIA”), which is amortized on a basis consistent with DAC, such that it is amortized in proportion to policies in force for the Life Insurance segment and face amount in force for the Home Service Insurance segment to approximate straight-line amortization.
FUTURE POLICY BENEFITS AND EXPENSES
As premium revenue is recognized, a liability for future policy benefits, which is the present value of estimated future policy benefits to be paid to or on behalf of policyholders less the present value of estimated future net premiums to be collected from policyholders, is accrued. The liability is estimated using current assumptions that include discount rate, mortality and lapses. These current assumptions are based on judgements that consider the Company’s historical experience, industry data, and other factors.
September 30, 2023 | 10-Q 10
| | | | | | | | |
CITIZENS, INC.
| NOTES TO CONSOLIDATED FINANCIAL STATEMENTS |
| | (Unaudited)
|
Our traditional and limited-payment contracts are grouped into cohorts by contract type and issue year. Our reporting cohorts are (i) Permanent, which summarizes insurance policies with premiums payable over the lifetime of the policy, and (ii) Permanent Limited Pay, which summarizes insurance policies with premiums payable for a limited time after which the policy is fully paid up. Both reporting cohorts include whole life and endowment policies. The liability is adjusted for differences between actual and expected experience. The Company reviews its historical cash flow assumptions quarterly and in the third quarter of the year, the Company reviews its future cash flow assumptions. The net premium ratio used to calculate the liability is updated each quarter based on the current period's actual experience relative to expected experience. The revised net premium ratio is used to derive an updated liability for future policy benefits as of the beginning of the current reporting period, discounted at the locked-in discount rate. This amount is then compared to the carrying amount of the liability as of that same date, before the updating of cash flow assumptions, to determine the current period change in liability estimate. The current period change in the liability is the policyholder liability remeasurement gain or loss and is presented as a separate component of total insurance benefits paid or provided in the consolidated statements of comprehensive income or loss. In subsequent periods, the revised net premiums are used to measure the liability for future policy benefits, subject to future revisions.
For traditional and limited-payment contracts, the current discount rate assumption is a yield curve that equals the yield of an upper-medium grade fixed income instrument, based on an A-quality corporate bonds. The Company selects fixed-income instruments that have been A rated by one of the major credit rating agencies, such as Moody’s, Standard & Poor’s, or Fitch. The current discount rate assumption is updated quarterly and used to remeasure the liability at the reporting date, with the resulting change reflected in other comprehensive income. For liability cash flows that are projected beyond the duration of market-observable A credit-rated fixed-income instruments, the Company uses the last market-observable yield level and uses linear interpolation to determine yield assumptions for durations that do not have market observable yields. The locked-in discount rate for policies issued prior to transition equals the rate set at contract issuance. For current year issues, the locked-in discount rate is the average of the current year quarterly discount rates and will change throughout the year as new discount rates are calculated, with the change reflected in net income.
DEFERRED PROFIT LIABILITY
For limited-payment products, gross premiums received in excess of net premiums are deferred at initial recognition as a deferred profit liability (“DPL”). Gross premiums are measured using assumptions consistent with those used in the measurement of the liability for future policy benefit life reserves, including discount rate, mortality and lapses.
The DPL is amortized and recognized in net income within the increase in future policy benefit reserves. The amortization basis for the DPL is the present value of insurance in force for life insurance contracts. Interest is accreted on the balance of the DPL using the locked-in discount rate. The Company reviews and updates its estimates of cash flows for the DPL at the same time as the estimates of cash flows for the liability for future policy benefit life reserves. The DPL is updated each quarter based on the current period's actual experience relative to expected experience with the changes recorded within the increase in future policy benefit reserves in the consolidated statements of comprehensive income or loss. On the consolidated balance sheets, DPL is recorded as a component of the liability for future policy benefits.
September 30, 2023 | 10-Q 11
| | | | | | | | |
CITIZENS, INC.
| NOTES TO CONSOLIDATED FINANCIAL STATEMENTS |
| | (Unaudited)
|
(2) ACCOUNTING PRONOUNCEMENTS
ACCOUNTING STANDARDS RECENTLY ADOPTED
Impacts at Transition Date
In August 2018, the Financial Accounting Standards Board ("FASB") issued Accounting Standard Update ("ASU") No. 2018-12, Financial Services-Insurance (Topic 944): Targeted Improvements to the Accounting for Long-Duration Contracts. The Company adopted ASU 2018-12 for the liability for future policy benefits, DAC and COIA on a modified retrospective basis such that those balances were adjusted to conform to ASU 2018-12 effective January 1, 2021. The following table summarizes the balance of and changes in the liability for future policy benefits, annuity reserves, DAC and COIA due to the adoption of ASU 2018-12.
| | | | | | | | | | | | | |
| (In thousands) | Life Insurance | Home Service Insurance | | | Consolidated |
| Liability for Future Policy Benefits | | | | | |
| Pre-adoption liability as of 12/31/2020 | $ | 987,373 | | 255,513 | | | | 1,242,886 | |
| | | | | |
| Change in discount rate assumptions | 261,823 | | 108,468 | | | | 370,291 | |
| Effect of reserve changes | 6 | | 96 | | | | 102 | |
| Post-adoption liability as of 1/1/2021 | $ | 1,249,202 | | 364,077 | | | | 1,613,279 | |
| | | | | |
| Fixed Annuity Liability | | | | | |
| Pre-adoption liability as of 12/31/2020 | $ | 60,027 | | 18,277 | | | | 78,304 | |
| Adjustments for the removal of shadow adjustments | — | | 3,426 | | | | 3,426 | |
| Post-adoption liability as of 1/1/2021 | $ | 60,027 | | 21,703 | | | | 81,730 | |
| | | | | |
| Deferred Acquisition Costs | | | | | |
| Pre-adoption balance as of 12/31/2020 | $ | 94,771 | | 10,142 | | | | 104,913 | |
| Adjustments for the removal of shadow adjustments | 8,270 | | 29,905 | | | | 38,175 | |
| Impact of flooring cohorts at zero | 23 | | 12 | | | | 35 | |
| Post adoption balance as of 1/1/2021 | $ | 103,064 | | 40,059 | | | | 143,123 | |
| | | | | |
| Cost of Insurance Acquired | | | | | |
| Pre-adoption balance as of 12/31/2020 | $ | 1,734 | | 9,807 | | | | 11,541 | |
| Adjustments for the removal of shadow adjustments | — | | 484 | | | | 484 | |
| Post adoption balance as of 1/1/2021 | $ | 1,734 | | 10,291 | | | | 12,025 | |
| | | | | |
At transition, the Company recorded a charge of $0.1 million to retained earnings, net of tax, primarily from capping net premium ratios for certain policyholder benefit cohorts at 100%, increasing reserves for certain non-premium paying cohorts and flooring certain DAC cohorts at zero. Other comprehensive income ("OCI") was reduced by $316.8 million primarily due to the difference in the discount rate used prior to transition and the discount rate at January 1, 2021. The Company also removed shadow adjustments previously recorded in OCI for the impact of unrealized gains and losses on annuity products that previously amortized unearned revenue, DAC and COIA over expected future gross profits.
September 30, 2023 | 10-Q 12
| | | | | | | | |
CITIZENS, INC.
| NOTES TO CONSOLIDATED FINANCIAL STATEMENTS |
| | (Unaudited)
|
Impacts to Previously Reported Results
Adoption of the standard impacted our previously reported consolidated financial results as follows:
| | | | | | | | | | | |
(In thousands) | As Previously Reported | Adoption of New Standard | Post Adoption |
| As of December 31, 2022 | | | |
| Consolidated Balance Sheet | | | |
| Deferred policy acquisition costs | $ | 140,167 | | 22,760 | | 162,927 | |
| Cost of insurance acquired | 10,260 | | 387 | | 10,647 | |
| Deferred tax asset, net | 2,414 | | (2,414) | | — | |
| Total assets | 1,569,970 | | 20,733 | | 1,590,703 | |
| | | |
| Future policy benefit reserves: | | | |
| Life insurance | 1,305,506 | | (106,859) | | 1,198,647 | |
| Annuities | 91,234 | | (91,234) | | — | |
| Policyholders' funds: | | | |
| Annuities | — | | 121,422 | | 121,422 | |
| Other policyholders' funds | 40,497 | | (32,996) | | 7,501 | |
| Deferred federal income tax liability | — | | 3,653 | | 3,653 | |
| Total liabilities | 1,568,927 | | (106,014) | | 1,462,913 | |
| | | |
| Retained earnings (accumulated deficit) | (52,203) | | 68,512 | | 16,309 | |
| Accumulated other comprehensive income (loss) | (195,279) | | 58,235 | | (137,044) | |
| Total stockholders' equity | 1,043 | | 126,747 | | 127,790 | |
| | | |
| | | |
| | | |
| | | |
| | | |
| | | |
| | | |
| | | |
| | | |
| | | |
| | |
| | | |
| | | |
| | | |
| | | |
| | | |
| | | |
| | | |
| | | |
| | | |
| | | |
| | | |
| | | |
| | | |
| | |
| | | |
| | | |
| | | |
September 30, 2023 | 10-Q 13
| | | | | | | | |
CITIZENS, INC.
| NOTES TO CONSOLIDATED FINANCIAL STATEMENTS |
| | (Unaudited)
|
| | | | | | | | | | | |
(In thousands, except per share amounts) | As Previously Reported | Adoption of New Standard | Post Adoption |
| | | |
| | | |
| | | |
| | | |
| | | |
| | | |
| | | |
| | | |
| | | |
| | | |
| | | |
| | | |
| | | |
| | | |
| | | |
| | | |
| For the Three Months Ended September 30, 2022 | | | |
| Consolidated Statement of Operations | | | |
| Increase (decrease) in future policy benefit reserves | $ | 7,090 | | (6,437) | | 653 | |
| Policyholder liability remeasurement (gain) loss | — | | 396 | | 396 | |
| Amortization of deferred policy acquisition costs | 7,082 | | (3,458) | | 3,624 | |
| Amortization of cost of insurance acquired | 276 | | (110) | | 166 | |
| Federal income tax expense (benefit) | 344 | | 1,071 | | 1,415 | |
| Net income (loss) | (5,131) | | 8,538 | | 3,407 | |
| Basic earnings (losses) per share of Class A common stock | (0.10) | | 0.17 | | 0.07 | |
| Diluted earnings (losses) per share of Class A common stock | (0.10) | | 0.16 | | 0.06 | |
| | | |
| Consolidated Statement of Comprehensive Income (Loss) | | |
| Unrealized holding gains (losses) arising during period | $ | (89,713) | | 1,331 | | (88,382) | |
| Change in current discount rate for liability for future policy benefits | — | | 73,214 | | 73,214 | |
| Income tax expense (benefit) on other comprehensive income items | (5,079) | | 4,895 | | (184) | |
| Other comprehensive income (loss) | (84,591) | | 69,650 | | (14,941) | |
| Total comprehensive income (loss) | (89,722) | | 78,188 | | (11,534) | |
| | | |
| For the Nine Months Ended September 30, 2022 | | | |
| Consolidated Statement of Operations | | | |
| Increase (decrease) in future policy benefit reserves | $ | 23,037 | | (18,540) | | 4,497 | |
| Policyholder liability remeasurement (gain) loss | — | | 1,731 | | 1,731 | |
| Amortization of deferred policy acquisition costs | 18,869 | | (8,218) | | 10,651 | |
| Amortization of cost of insurance acquired | 775 | | (329) | | 446 | |
| Federal income tax expense (benefit) | 622 | | 2,996 | | 3,618 | |
| Net income (loss) | (10,012) | | 22,360 | | 12,348 | |
| Basic earnings (losses) per share of Class A common stock | (0.20) | | 0.45 | | 0.25 | |
| Diluted earnings (losses) per share of Class A common stock | (0.20) | | 0.44 | | 0.24 | |
| | | |
| Consolidated Statement of Comprehensive Income (Loss) | | |
| Unrealized holding gains (losses) arising during period | $ | (343,989) | | 3,311 | | (340,678) | |
| Change in current discount rate for liability for future policy benefits | — | | 345,258 | | 345,258 | |
| Income tax expense (benefit) on other comprehensive income items | (18,880) | | 25,042 | | 6,162 | |
| Other comprehensive income (loss) | (325,031) | | 323,527 | | (1,504) | |
| Total comprehensive income (loss) | (335,043) | | 345,887 | | 10,844 | |
ACCOUNTING STANDARDS NOT YET ADOPTED
On June 30, 2022,November 27, 2023, the FASB issued ASU No. 2022-03,2023-07, Fair Value MeasurementSegment Reporting (Topic 820)280): Fair Value Measurement of Equity Securities SubjectImprovements to Contractual Sale Restrictions. Reportable Segment Disclosures. This standard clarifiesamendment expands a public entity's segment disclosures by requiring disclosure of significant segment expenses that contractual restrictions on equity security sales are not considered part ofregularly provided to the security unit of account and, therefore, are not
September 30, 2023 | 10-Q 14
| | | | | | | | |
CITIZENS, INC.
| NOTES TO CONSOLIDATED FINANCIAL STATEMENTS |
| | (Unaudited)
|
considered in measuring fair value. In addition, the amendments clarify thatchief operating decision maker, clarifying when an entity cannot, asmay report one or more additional measures to assess segment performance, requiring enhanced interim disclosures, providing new disclosure requirements for entities with a separate unit of account, recognizesingle reportable segment, and measure a contractual sale restriction. Disclosures on such restrictions are also required.requiring other new disclosures. The amendments are effective for fiscal years beginning after December 15, 2023 includingand interim periods within those fiscal years and are required to be applied prospectively, with any adjustments from the adoption recognized in earnings and disclosed.beginning after December 15, 2024. Early adoption is available. AdoptionAlthough the ASU only requires additional disclosures about the Company's operating segments, the Company is currently evaluating the effects of adopting this standard will have no impactguidance on ourthe consolidated financial statements.
On December 14, 2023, the FASB issued ASU No. 2023-09, Income Taxes (Topic 740): Improvements to Income Tax Disclosures, which is intended to enhance the transparency, decision usefulness and effectiveness of income tax disclosures.The amendments in this ASU require a public entity to disclose a tabular tax rate reconciliation, using both percentages and currency, with specific categories. A public entity is also required to provide a qualitative description of the state and local jurisdictions that make up the majority of the effect of the state and local income tax category and the net amount of income taxes paid, disaggregated by federal, state and foreign taxes and also disaggregated by individual jurisdictions. The amendments also remove certain disclosures that are no longer considered cost beneficial. The amendments are effective prospectively for annual periods beginning after December 15, 2024 and early adoption and retrospective application are permitted. The Company is currently evaluating the impact of adopting this pronouncement on the consolidated financial statements.
No other new accounting pronouncements issued or effective during the year had, or is expected to have, a material impact on our consolidated financial statements.
| | | | | | | | |
CITIZENS, INC. | NOTES TO CONSOLIDATED FINANCIAL STATEMENTS |
| | (Unaudited) |
(3) INVESTMENTS
The Company invests primarily in fixed maturity securities, which totaled 86.3%86.7% of total cash and invested assets at September 30, 2023,March 31, 2024, as shown below.
| Carrying Value (In thousands, except for %) | Carrying Value (In thousands, except for %) | September 30, 2023 | | December 31, 2022 | Carrying Value (In thousands, except for %) | March 31, 2024 | | December 31, 2023 |
| Amount | | % | | Amount | | % | Amount | | % | | Amount | | % |
| | Cash and invested assets: | Cash and invested assets: | |
| Cash and invested assets: | |
| Cash and invested assets: | |
| Fixed maturity securities | |
| Fixed maturity securities | |
| Fixed maturity securities | Fixed maturity securities | $ | 1,151,353 | | | 86.3 | % | | 1,179,619 | | | 86.5 | % | $ | 1,234,048 | | | 86.7 | | 86.7 | % | | 1,238,981 | | | 86.7 | | 86.7 | % |
| Equity securities | Equity securities | 10,555 | | | 0.8 | | | 11,590 | | | 0.8 | |
| Policy loans | Policy loans | 75,750 | | | 5.7 | | | 78,773 | | | 5.8 | |
| Other long-term investments | Other long-term investments | 79,798 | | | 5.9 | | | 69,558 | | | 5.1 | |
| Short-term investments | — | | | — | | | 1,241 | | | 0.1 | |
| | Cash and cash equivalents | |
| Cash and cash equivalents | |
| Cash and cash equivalents | Cash and cash equivalents | 16,785 | | | 1.3 | | | 22,973 | | | 1.7 | |
| | Total cash and invested assets | Total cash and invested assets | $ | 1,334,241 | | | 100.0 | % | | 1,363,754 | | | 100.0 | % |
| Total cash and invested assets | |
| Total cash and invested assets | | $ | 1,423,101 | | | 100.0 | % | | 1,429,344 | | | 100.0 | % |
The following tables represent the amortized cost, gross unrealized gains and losses and fair value of fixed maturity securities as of the dates indicated.
| | | | | | | | | | | | | | | | | | | | | | | |
| Amortized
Cost | | Gross
Unrealized
Gains | | Gross
Unrealized
Losses | | Fair
Value |
| March 31, 2024 | | | |
| (In thousands) | | | |
| | | | | | | |
| Fixed maturity securities: | | | | | | | |
| Available-for-sale: | | | | | | | |
| U.S. Treasury securities | $ | 5,972 | | | 76 | | | 74 | | | 5,974 | |
| U.S. Government-sponsored enterprises | 3,396 | | | 201 | | | 1 | | | 3,596 | |
| States and political subdivisions | 313,364 | | | 1,718 | | | 30,027 | | | 285,055 | |
| Corporate: | | | | | | | |
| Financial | 273,436 | | | 1,701 | | | 32,459 | | | 242,678 | |
| Consumer | 252,953 | | | 1,321 | | | 39,615 | | | 214,659 | |
| Utilities | 127,577 | | | 369 | | | 21,576 | | | 106,370 | |
| Energy | 72,733 | | | 27 | | | 8,576 | | | 64,184 | |
| Communications | 73,354 | | | 247 | | | 9,843 | | | 63,758 | |
| All other | 111,641 | | | 444 | | | 14,289 | | | 97,796 | |
| Commercial mortgage-backed | 276 | | | 1 | | | 5 | | | 272 | |
| Residential mortgage-backed | 106,977 | | | 7 | | | 12,136 | | | 94,848 | |
| Asset-backed | 55,395 | | | 511 | | | 1,048 | | | 54,858 | |
| | | | | | | |
| Total fixed maturity securities | $ | 1,397,074 | | | 6,623 | | | 169,649 | | | 1,234,048 | |
September 30, 2023March 31, 2024 | 10-Q 1510
| | | | | | | | |
CITIZENS, INC. | NOTES TO CONSOLIDATED FINANCIAL STATEMENTS |
| | (Unaudited) |
The following tables represent the amortized cost, gross unrealized gains and losses and fair value of fixed maturity securities as of the dates indicated.
| | | | | | | | | | | | | | | | | | | | | | | |
| Amortized
Cost | | Gross
Unrealized
Gains | | Gross
Unrealized
Losses | | Fair
Value |
| September 30, 2023 | | | |
| (In thousands) | | | |
| | | | | | | |
| Fixed maturity securities: | | | | | | | |
| Available-for-sale: | | | | | | | |
| U.S. Treasury securities | $ | 5,700 | | | 241 | | | 114 | | | 5,827 | |
| U.S. Government-sponsored enterprises | 3,411 | | | 122 | | | 3 | | | 3,530 | |
| States and political subdivisions | 325,314 | | | 1,607 | | | 42,965 | | | 283,956 | |
| Corporate: | | | | | | | |
| Financial | 256,108 | | | 149 | | | 48,576 | | | 207,681 | |
| Consumer | 249,857 | | | 545 | | | 54,802 | | | 195,600 | |
| Utilities | 121,874 | | | 1 | | | 28,583 | | | 93,292 | |
| Energy | 76,418 | | | — | | | 13,304 | | | 63,114 | |
| All other | 184,859 | | | 236 | | | 34,041 | | | 151,054 | |
| Commercial mortgage-backed | 171 | | | — | | | 4 | | | 167 | |
| Residential mortgage-backed | 108,976 | | | 3 | | | 16,460 | | | 92,519 | |
| Asset-backed | 56,702 | | | 417 | | | 2,506 | | | 54,613 | |
| | | | | | | |
| Total fixed maturity securities | $ | 1,389,390 | | | 3,321 | | | 241,358 | | | 1,151,353 | |
| | Amortized
Cost | | | Amortized
Cost | | Gross
Unrealized
Gains | | Gross
Unrealized
Losses | | Fair
Value |
| December 31, 2023 | |
| (In thousands) | |
| (In thousands) | |
| (In thousands) | |
| | Amortized
Cost | | Gross
Unrealized
Gains | | Gross
Unrealized
Losses | | Fair
Value |
| December 31, 2022 | |
| (In thousands) | |
| Fixed maturity securities: | |
| | Fixed maturity securities: | |
| | Fixed maturity securities: | Fixed maturity securities: | | | | | | | | | | |
| Available-for-sale: | Available-for-sale: | | | | | | | | Available-for-sale: | | | |
| U.S. Treasury securities | U.S. Treasury securities | $ | 9,425 | | | 152 | | | 9 | | | 9,568 | |
| U.S. Government-sponsored enterprises | U.S. Government-sponsored enterprises | 3,434 | | | 277 | | | 1 | | | 3,710 | |
| States and political subdivisions | States and political subdivisions | 344,208 | | | 1,114 | | | 37,964 | | | 307,358 | |
| Corporate: | Corporate: | |
| Financial | Financial | 243,758 | | | 512 | | | 42,383 | | | 201,887 | |
| Financial | |
| Financial | |
| Consumer | Consumer | 247,824 | | | 758 | | | 47,138 | | | 201,444 | |
| Utilities | Utilities | 115,738 | | | 39 | | | 23,790 | | | 91,987 | |
| Energy | Energy | 76,065 | | | — | | | 11,395 | | | 64,670 | |
| Communications | |
| All other | All other | 184,022 | | | 683 | | | 29,048 | | | 155,657 | |
| Commercial mortgage-backed | Commercial mortgage-backed | 171 | | | — | | | 2 | | | 169 | |
| Residential mortgage-backed | Residential mortgage-backed | 110,582 | | | 9 | | | 10,765 | | | 99,826 | |
| Asset-backed | Asset-backed | 45,991 | | | 18 | | | 2,767 | | | 43,242 | |
| Foreign governments | 100 | | | 1 | | | — | | | 101 | |
| | Total fixed maturity securities | Total fixed maturity securities | $ | 1,381,318 | | | 3,563 | | | 205,262 | | | 1,179,619 | |
| Total fixed maturity securities | |
| Total fixed maturity securities | |
September 30, 2023 | 10-Q 16
| | | | | | | | |
CITIZENS, INC.
| NOTES TO CONSOLIDATED FINANCIAL STATEMENTS |
| | (Unaudited)
|
Most of the Company's equity securities are diversifiedinvested in a non-redeemable preferred stock and bond mutual funds.fund.
| Fair Value (In thousands) | Fair Value (In thousands) | September 30, 2023 | | December 31, 2022 | Fair Value (In thousands) | March 31, 2024 | | December 31, 2023 |
| | Equity securities: | Equity securities: | | |
| Stock mutual funds | $ | 2,034 | | | 2,615 | |
| Equity securities: | |
| Equity securities: | |
| | Bond mutual funds | |
| | Bond mutual funds | |
| | Bond mutual funds | Bond mutual funds | 4,196 | | | 4,337 | |
| Common stock | Common stock | 622 | | | 857 | |
| Non-redeemable preferred stock | Non-redeemable preferred stock | 8 | | | 8 | |
| Non-redeemable preferred stock fund | Non-redeemable preferred stock fund | 3,695 | | | 3,773 | |
| Total equity securities | Total equity securities | $ | 10,555 | | | 11,590 | |
VALUATION OF INVESTMENTS
Available-for-sale ("AFS") fixed maturity securities are reported in the consolidated financial statements at fair value. Equity securities are measured at fair value with the change in fair value recorded through net income (loss).income. The Company recognized net investment related lossesgains of $0.4$0.1 million and $0.3 million on equity securities held for the three and nine months ended September 30,March 31, 2024 and 2023, and losses of $0.9 million and $2.9 million for the same periods ended September 30, 2022, respectively.
The Company considers several factors in its review and evaluation of individual investments, using the process described in Part IV, Item 15, Note 2. Investments in the notes to the consolidated financial statements of our Form 10-K to determine whether a credit valuation loss exists. For the three and nine months ended September 30,March 31, 2024 and 2023, and 2022, the Company recorded no credit valuation losses on fixed maturity securities.
September 30, 2023March 31, 2024 | 10-Q 1711
| | | | | | | | |
CITIZENS, INC. | NOTES TO CONSOLIDATED FINANCIAL STATEMENTS |
| | (Unaudited) |
The following tables present
For fixed maturity security investments that have unrealized losses as of March 31, 2024 and December 31, 2023, the fair values and gross unrealized losses of fixed maturity securitiesand related fair values that are not deemed to have credit losses, aggregated by investment category and length of time that individual securities have been in a continuous unrealized loss position at September 30, 2023 and December 31, 2022.by timeframe are as follows.
| | September 30, 2023 | Less than 12 months | Greater than 12 months | Total |
| March 31, 2024 | | March 31, 2024 | Less than 12 months | Greater than 12 months | Total |
| (In thousands, except for # of securities) | (In thousands, except for # of securities) | Fair
Value | Unrealized
Losses | # of
Securities | Fair
Value | Unrealized
Losses | # of
Securities | Fair
Value | Unrealized
Losses | # of
Securities | (In thousands, except for # of securities) | Fair
Value | Unrealized
Losses | # of
Securities | Fair
Value | Unrealized
Losses | # of
Securities | Fair
Value | Unrealized
Losses | # of
Securities |
| | Fixed maturity securities: | |
| Fixed maturity securities: | |
| Fixed maturity securities: | Fixed maturity securities: | | |
| Available-for-sale securities: | Available-for-sale securities: | | Available-for-sale securities: | |
| U.S. Treasury securities | U.S. Treasury securities | $ | 1,210 | | 105 | | 5 | | 65 | | 9 | | 2 | | 1,275 | | 114 | | 7 | |
| U.S. Government-sponsored enterprises | U.S. Government-sponsored enterprises | 219 | | 3 | | 1 | | — | | — | | — | | 219 | | 3 | | 1 | |
| States and political subdivisions | States and political subdivisions | 66,573 | | 2,405 | | 94 | | 157,245 | | 40,560 | | 198 | | 223,818 | | 42,965 | | 292 | |
| Corporate: | Corporate: | |
| Financial | Financial | 35,347 | | 2,343 | | 53 | | 164,356 | | 46,233 | | 221 | | 199,703 | | 48,576 | | 274 | |
| Financial | |
| Financial | |
| Consumer | Consumer | 23,441 | | 1,913 | | 33 | | 160,871 | | 52,889 | | 222 | | 184,312 | | 54,802 | | 255 | |
| Utilities | Utilities | 14,964 | | 1,173 | | 54 | | 78,285 | | 27,410 | | 138 | | 93,249 | | 28,583 | | 192 | |
| Energy | Energy | 6,103 | | 337 | | 9 | | 57,011 | | 12,967 | | 79 | | 63,114 | | 13,304 | | 88 | |
| Communications | |
| All Other | All Other | 16,510 | | 1,091 | | 25 | | 130,532 | | 32,950 | | 169 | | 147,042 | | 34,041 | | 194 | |
| Commercial mortgage-backed | Commercial mortgage-backed | 167 | | 4 | | 2 | | — | | — | | — | | 167 | | 4 | | 2 | |
| Residential mortgage-backed | Residential mortgage-backed | 1,159 | | 92 | | 20 | | 91,325 | | 16,368 | | 89 | | 92,484 | | 16,460 | | 109 | |
| Asset-backed | Asset-backed | 11,936 | | 666 | | 17 | | 32,756 | | 1,840 | | 40 | | 44,692 | | 2,506 | | 57 | |
| | Total fixed maturity securities | Total fixed maturity securities | $ | 177,629 | | 10,132 | | 313 | | 872,446 | | 231,226 | | 1,158 | | 1,050,075 | | 241,358 | | 1,471 | |
| Total fixed maturity securities | |
| Total fixed maturity securities | |
| | | | | | | | | | | | | | | | | | | | | | | | | | | | | |
| December 31, 2022 | Less than 12 months | Greater than 12 months | Total |
| (In thousands, except for # of securities) | Fair
Value | Unrealized
Losses | # of
Securities | Fair
Value | Unrealized
Losses | # of
Securities | Fair
Value | Unrealized
Losses | # of
Securities |
| | | | | | | | | |
| Fixed maturity securities: | | | | | | | | |
| Available-for-sale securities: | | | | | | | | | |
| U.S. Treasury securities | $ | — | | — | | — | | 64 | | 9 | | 2 | | 64 | | 9 | | 2 | |
| U.S. Government-sponsored enterprises | 223 | | 1 | | 1 | | — | | — | | — | | 223 | | 1 | | 1 | |
| States and political subdivisions | 189,084 | | 30,866 | | 242 | | 14,184 | | 7,098 | | 14 | | 203,268 | | 37,964 | | 256 | |
| Corporate: | | | | | | | | | |
| Financial | 182,447 | | 39,122 | | 237 | | 6,144 | | 3,261 | | 16 | | 188,591 | | 42,383 | | 253 | |
| Consumer | 164,224 | | 34,823 | | 220 | | 23,417 | | 12,315 | | 30 | | 187,641 | | 47,138 | | 250 | |
| Utilities | 73,483 | | 15,959 | | 152 | | 16,413 | | 7,831 | | 18 | | 89,896 | | 23,790 | | 170 | |
| Energy | 59,053 | | 9,601 | | 75 | | 5,617 | | 1,794 | | 8 | | 64,670 | | 11,395 | | 83 | |
| All Other | 140,955 | | 25,337 | | 171 | | 7,910 | | 3,711 | | 15 | | 148,865 | | 29,048 | | 186 | |
| Commercial mortgage-backed | 168 | | 2 | | 2 | | — | | — | | — | | 168 | | 2 | | 2 | |
| Residential mortgage-backed | 98,758 | | 10,514 | | 95 | | 759 | | 251 | | 5 | | 99,517 | | 10,765 | | 100 | |
| Asset-backed | 37,067 | | 2,485 | | 41 | | 4,264 | | 282 | | 9 | | 41,331 | | 2,767 | | 50 | |
| Total fixed maturity securities | $ | 945,462 | | 168,710 | | 1,236 | | 78,772 | | 36,552 | | 117 | | 1,024,234 | | 205,262 | | 1,353 | |
| | | | | | | | | | | | | | | | | | | | | | | | | | | | | |
| December 31, 2023 | Less than 12 months | Greater than 12 months | Total |
| (In thousands, except for # of securities) | Fair
Value | Unrealized
Losses | # of
Securities | Fair
Value | Unrealized
Losses | # of
Securities | Fair
Value | Unrealized
Losses | # of
Securities |
| | | | | | | | | |
| Fixed maturity securities: | | | | | | | | |
| Available-for-sale securities: | | | | | | | | |
| U.S. Treasury securities | $ | 1,203 | | 40 | | 5 | | 65 | | 8 | | 2 | | 1,268 | | 48 | | 7 | |
| U.S. Government-sponsored enterprises | 221 | | 1 | | 1 | | — | | — | | — | | 221 | | 1 | | 1 | |
| States and political subdivisions | 19,540 | | 357 | | 35 | | 164,264 | | 28,775 | | 192 | | 183,804 | | 29,132 | | 227 | |
| Corporate: | | | | | | | | | |
| Financial | 12,584 | | 383 | | 19 | | 176,521 | | 30,872 | | 217 | | 189,105 | | 31,255 | | 236 | |
| Consumer | 10,175 | | 265 | | 16 | | 176,725 | | 36,829 | | 223 | | 186,900 | | 37,094 | | 239 | |
| Utilities | 3,596 | | 66 | | 20 | | 85,169 | | 20,187 | | 137 | | 88,765 | | 20,253 | | 157 | |
| Energy | 3,291 | | 57 | | 1 | | 59,392 | | 7,992 | | 76 | | 62,683 | | 8,049 | | 77 | |
| Communications | 5,784 | | 153 | | 5 | | 56,108 | | 8,739 | | 69 | | 61,892 | | 8,892 | | 74 | |
| All Other | 2,080 | | 32 | | 5 | | 85,757 | | 12,407 | | 100 | | 87,837 | | 12,439 | | 105 | |
| | | | | | | | | |
| Residential mortgage-backed | 849 | | 38 | | 5 | | 95,806 | | 10,022 | | 86 | | 96,655 | | 10,060 | | 91 | |
| Asset-backed | 4,757 | | 111 | | 8 | | 32,764 | | 1,405 | | 40 | | 37,521 | | 1,516 | | 48 | |
| Total fixed maturity securities | $ | 64,080 | | 1,503 | | 120 | | 932,571 | | 157,236 | | 1,142 | | 996,651 | | 158,739 | | 1,262 | |
September 30, 2023March 31, 2024 | 10-Q 1812
| | | | | | | | |
CITIZENS, INC. | NOTES TO CONSOLIDATED FINANCIAL STATEMENTS |
| | (Unaudited) |
In each category of our fixed maturity securities described above, we do not intend to sell our investments and it is not more likely than not that the Company will be required to sell the investments before recovery of their amortized cost bases. As of September 30, 2023March 31, 2024 and December 31, 2022, 99%2023, 99.0% and 99.4% of the fair value of our fixed maturity securities portfolio, respectively, were rated investment grade. While the losses are currently unrealized, we continue to monitor all fixed maturity securities on an on-going basis as future information may become available which could result in an allowance being recorded. While we experience unrealized losses across all corporate sectors, the financial sector includes exposure to regional banks which have been impacted the most by recent economic and interest rate pressures. We have assessed our exposure in this sector and believe our investments have access to sufficient liquidity to meet their debt obligations.
These unrealized losses on fixed maturity securities are due to noncredit-related factors, including widening credit spreads and rising interest rates since purchase, which have little bearing on the recoverability of our investments, hence they are not recognized as credit losses. The fair value is expected to recover as the securities approach maturity or if market yields for such investments decline.
The amortized cost and fair value of fixed maturity securities at September 30, 2023March 31, 2024 by contractual maturity are shown in the table below. Actual maturities may differ from contractual maturities because borrowers may have the right to call or prepay obligations with or without call or prepayment penalties. Securities not due at a single maturity date have been reflected based upon final stated maturity.
| | September 30, 2023 | Amortized
Cost | | Fair
Value |
| March 31, 2024 | | March 31, 2024 | Amortized
Cost | | Fair
Value |
| (In thousands) | (In thousands) | Amortized
Cost | | Fair
Value |
| Fixed maturity securities: | |
| Fixed maturity securities: | |
| Fixed maturity securities: | Fixed maturity securities: | | | | | | |
| Due in one year or less | Due in one year or less | $ | 14,657 | | | 14,514 | |
| Due after one year through five years | Due after one year through five years | 129,118 | | | 125,520 | |
| Due after five years through ten years | Due after five years through ten years | 274,759 | | | 255,800 | |
| Due after ten years | Due after ten years | 970,856 | | | 755,519 | |
| Total fixed maturity securities | Total fixed maturity securities | $ | 1,389,390 | | | 1,151,353 | |
The Company uses the specific identification method of the individual security to determine the cost basis used in the calculation of realized gains and losses related to security sales.
| | | | | Three Months Ended | |
| | Three Months Ended | | Nine Months Ended | |
| | | Three Months Ended | |
| | September 30, | | September 30, | |
| | | Three Months Ended | |
| | | March 31, | |
| | | March 31, | |
| | | March 31, | |
| (In thousands) | |
| (In thousands) | |
| (In thousands) | (In thousands) | 2023 | 2022 | | 2023 | 2022 | |
| Fixed maturity securities, available-for-sale: | Fixed maturity securities, available-for-sale: | | |
| Fixed maturity securities, available-for-sale: | |
| Fixed maturity securities, available-for-sale: | |
| Proceeds | |
| Proceeds | |
| Proceeds | Proceeds | $ | 9,446 | | 1,520 | | | 13,690 | | 30,348 | | |
| Gross realized gains | Gross realized gains | $ | 38 | | 19 | | | 43 | | 120 | | |
| Gross realized gains | |
| Gross realized gains | |
| Gross realized losses | Gross realized losses | $ | 436 | | 1 | | | 453 | | 103 | | |
| Gross realized losses | |
| Gross realized losses | |
(4) FAIR VALUE MEASUREMENTS
Fair value is the price that would be received to sell an asset or paid to transfer a liability in an orderly transaction between market participants at the measurement date. We hold AFS fixed maturity securities, which are carried at fair value with changes in fair value reported through other comprehensive income (loss). We also report our equity securities and certain other long-term investments at fair value with changes in fair value reported through the consolidated statements of operations.operations and comprehensive income (loss).
September 30, 2023 | 10-Q 19
| | | | | | | | |
CITIZENS, INC.
| NOTES TO CONSOLIDATED FINANCIAL STATEMENTS |
| | (Unaudited)
|
Fair value measurements are generally based upon observable and unobservable inputs. Observable inputs reflect market data obtained from independent sources, while unobservable inputs reflect our view of market assumptions in the absence of observable market information. We utilize valuation techniques that maximize the use of
| | | | | | | | |
CITIZENS, INC. | NOTES TO CONSOLIDATED FINANCIAL STATEMENTS |
| | (Unaudited) |
observable inputs and minimize the use of unobservable inputs. All assets and liabilities carried at fair value are required to be classified and disclosed in one of the following three categories:
•Level 1 - Quoted prices for identical instruments in active markets.
•Level 2 - Quoted prices for similar instruments in active markets; quoted prices for identical or similar instruments in markets that are not active; and model-derived valuations whose inputs or whose significant value drivers are observable.
•Level 3 - Instruments whose significant value drivers are unobservable.
Level 1 primarily consists of financial instruments whose value is based on quoted market prices such as U.S. Treasury securities and actively traded mutual fund and stock investments.
Level 2 includes those financial instruments that are valued by independent pricing services or broker quotes. These pricing models are primarily industry-standard models that consider various inputs, such as interest rates, credit spreads and foreign exchange rates for the underlying financial instruments. All significant inputs are observable or derived from observable information in the marketplace or are supported by observable levels at which transactions are executed in the marketplace. Financial instruments in this category primarily include corporate securities, U.S. Government-sponsored enterprise securities, securities issued by states and political subdivisions and certain mortgage and asset-backed securities.
Level 3 is comprised of financial instruments whose fair value is estimated based on non-binding broker prices utilizing significant inputs not based on or corroborated by readily available market information. We have no investments in this category.
September 30, 2023 | 10-Q 20
| | | | | | | | |
CITIZENS, INC.
| NOTES TO CONSOLIDATED FINANCIAL STATEMENTS |
| | (Unaudited)
|
The following tables set forth our assets that are measured at fair value on a recurring basis as of the dates indicated.
| | September 30, 2023 | Level 1 | | Level 2 | | Level 3 | | Total
Fair Value |
| March 31, 2024 | | March 31, 2024 | Level 1 | | Level 2 | | Level 3 | | Total
Fair Value |
| (In thousands) | (In thousands) | Level 1 | | Level 2 | | Level 3 | | Total
Fair Value |
| Financial Assets | |
| Fixed maturity securities available-for-sale: | | | | | | | |
| Financial assets: | |
| Financial assets: | |
| Financial assets: | |
| Fixed maturity securities, available-for-sale: | |
| Fixed maturity securities, available-for-sale: | |
| Fixed maturity securities, available-for-sale: | | | | |
| U.S. Treasury and U.S. Government-sponsored enterprises | U.S. Treasury and U.S. Government-sponsored enterprises | $ | 5,827 | | | 3,530 | | | — | | | 9,357 | |
| States and political subdivisions | States and political subdivisions | — | | | 283,956 | | | — | | | 283,956 | |
| Corporate | Corporate | 43 | | | 710,698 | | | — | | | 710,741 | |
| Commercial mortgage-backed | Commercial mortgage-backed | — | | | 167 | | | — | | | 167 | |
| Residential mortgage-backed | Residential mortgage-backed | — | | | 92,519 | | | — | | | 92,519 | |
| Asset-backed | Asset-backed | — | | | 54,613 | | | — | | | 54,613 | |
| | Total fixed maturity securities available-for-sale | 5,870 | | | 1,145,483 | | | — | | | 1,151,353 | |
| Total fixed maturity securities, available-for-sale | |
| Total fixed maturity securities, available-for-sale | |
| Total fixed maturity securities, available-for-sale | |
| | Equity securities: | Equity securities: | | | | | | | |
| Stock mutual funds | 2,034 | | | — | | | — | | | 2,034 | |
| Equity securities: | |
| Equity securities: | | | | |
| | Bond mutual funds | |
| Bond mutual funds | |
| Bond mutual funds | Bond mutual funds | 4,196 | | | — | | | — | | | 4,196 | |
| Common stock | Common stock | 622 | | | — | | | — | | | 622 | |
| Non-redeemable preferred stock | Non-redeemable preferred stock | 8 | | | — | | | — | | | 8 | |
| Non-redeemable preferred stock fund | Non-redeemable preferred stock fund | 3,695 | | | — | | | — | | | 3,695 | |
| Total equity securities | Total equity securities | 10,555 | | | — | | | — | | | 10,555 | |
Other long-term investments (1) | Other long-term investments (1) | — | | | — | | | — | | | 79,535 | |
| Total financial assets | Total financial assets | $ | 16,425 | | | 1,145,483 | | | — | | | 1,241,443 | |
(1) In accordance with Subtopic 820-10, certain investments that are measured at fair value using the net asset value per share (or its equivalent) practical expedient are not classified in the fair value hierarchy. The fair value amounts presented in this table are intended to permit reconciliation of the fair value hierarchy to the amounts presented in the consolidated balance sheets.
September 30, 2023March 31, 2024 | 10-Q 2114
| | | | | | | | |
CITIZENS, INC. | NOTES TO CONSOLIDATED FINANCIAL STATEMENTS |
| | (Unaudited) |
| | December 31, 2022 | Level 1 | | Level 2 | | Level 3 | | Total
Fair Value |
| December 31, 2023 | | December 31, 2023 | Level 1 | | Level 2 | | Level 3 | | Total
Fair Value |
| (In thousands) | (In thousands) | Level 1 | | Level 2 | | Level 3 | | Total
Fair Value |
| Financial Assets | |
| Fixed maturity securities available-for-sale: | | | | | | | |
| Financial assets: | |
| Financial assets: | |
| Financial assets: | |
| Fixed maturity securities, available-for-sale: | |
| Fixed maturity securities, available-for-sale: | |
| Fixed maturity securities, available-for-sale: | | | | |
| U.S. Treasury and U.S. Government-sponsored enterprises | U.S. Treasury and U.S. Government-sponsored enterprises | $ | 9,567 | | | 3,711 | | | — | | | 13,278 | |
| States and political subdivisions | States and political subdivisions | — | | | 307,358 | | | — | | | 307,358 | |
| Corporate | Corporate | 44 | | | 715,601 | | | — | | | 715,645 | |
| Commercial mortgage-backed | Commercial mortgage-backed | — | | | 169 | | | — | | | 169 | |
| Residential mortgage-backed | Residential mortgage-backed | — | | | 99,826 | | | — | | | 99,826 | |
| Asset-backed | Asset-backed | — | | | 43,242 | | | — | | | 43,242 | |
| Foreign governments | — | | | 101 | | | — | | | 101 | |
| Total fixed maturity securities available-for-sale | 9,611 | | | 1,170,008 | | | — | | | 1,179,619 | |
| | Total fixed maturity securities, available-for-sale | |
| Total fixed maturity securities, available-for-sale | |
| Total fixed maturity securities, available-for-sale | |
| | Equity securities: | Equity securities: | | | | | | | |
| Stock mutual funds | 2,615 | | | — | | | — | | | 2,615 | |
| Equity securities: | |
| Equity securities: | | | | |
| | Bond mutual funds | |
| Bond mutual funds | |
| Bond mutual funds | Bond mutual funds | 4,337 | | | — | | | — | | | 4,337 | |
| Common stock | Common stock | 857 | | | — | | | — | | | 857 | |
| Non-redeemable preferred stock | Non-redeemable preferred stock | 8 | | | — | | | — | | | 8 | |
| Non-redeemable preferred stock fund | Non-redeemable preferred stock fund | 3,773 | | | — | | | — | | | 3,773 | |
| Total equity securities | Total equity securities | 11,590 | | | — | | | — | | | 11,590 | |
Other long-term investments (1) | Other long-term investments (1) | — | | | — | | | — | | | 66,846 | |
| Total financial assets | Total financial assets | $ | 21,201 | | | 1,170,008 | | | — | | | 1,258,055 | |
(1) In accordance with Subtopic 820-10, certain investments that are measured at fair value using the net asset value per share (or its equivalent) practical expedient are not classified in the fair value hierarchy. The fair value amounts presented in this table are intended to permit reconciliation of the fair value hierarchy to the amounts presented in the consolidated balance sheets. | (1) In accordance with Subtopic 820-10, certain investments that are measured at fair value using the net asset value per share (or its equivalent) practical expedient are not classified in the fair value hierarchy. The fair value amounts presented in this table are intended to permit reconciliation of the fair value hierarchy to the amounts presented in the consolidated balance sheets. | (1) In accordance with Subtopic 820-10, certain investments that are measured at fair value using the net asset value per share (or its equivalent) practical expedient are not classified in the fair value hierarchy. The fair value amounts presented in this table are intended to permit reconciliation of the fair value hierarchy to the amounts presented in the consolidated balance sheets. |
FINANCIAL INSTRUMENTS VALUATION
FINANCIAL INSTRUMENTS CARRIED AT FAIR VALUE
Fixed maturity securities, available-for-sale. At September 30, 2023,March 31, 2024, fixed maturity securities, valued using a third-party pricing source, totaled $1.1$1.2 billion for Level 2 assets and comprised 92%92.7% of total reported fair value of our financial assets. The Level 1 and Level 2 valuations are reviewed and updated quarterly through testing by comparisons to separate pricing models, other third-party pricing services, and back tested to recent trades. In addition, we obtain information annually relative to the third-party pricing models and review model parameters for reasonableness. There were no Level 3 assets at September 30, 2023.March 31, 2024. As of September 30, 2023,March 31, 2024, there were no material changes to the valuation methods or assumptions used to determine fair values, and no broker or third-party prices were changed from the values received.
Equity securities. Our equity securities are classified as Level 1 assets as their fair values are based upon quoted market prices.
Limited partnerships. The Company considers the net asset value ("NAV") to represent the value of the investment fund and is measured by the total value of assets minus the total value of liabilities. The following table includes information related to our investments in limited partnerships that calculate NAV per share. For these investments, which are measured at fair value on a recurring basis, we use the NAV per share to measure fair value. The Company recognized net investment related losses of $0.1 million and gains of $0.2$1.3 million and losses of $4.2 million and $9.4$0.6 million on limited partnerships held for the three and nine months ended September 30, 2023 and
September 30, 2023March 31, 2024 | 10-Q 2215
| | | | | | | | |
CITIZENS, INC. | NOTES TO CONSOLIDATED FINANCIAL STATEMENTS |
| | (Unaudited) |
September 30, 2022,held for the three months ended March 31, 2024 and March 31, 2023, respectively. These investments are included in other long-term investments on the consolidated balance sheets.
| | September 30, 2023 | | December 31, 2022 |
| | March 31, 2024 | | | | March 31, 2024 | | December 31, 2023 |
| (In thousands, except for years) | (In thousands, except for years) | | Fair Value
Using NAV Per Share | Unfunded Commit-
ments | Range (In years) | | Fair Value
Using NAV Per Share | Unfunded Commit-
ments | Range (In years) | (In thousands, except for years) | | Fair Value
Using NAV Per Share | Unfunded Commit-
ments | Range (In years) | | Fair Value
Using NAV Per Share | Unfunded Commit-
ments | Range (In years) |
| Description | |
| Limited partnerships | |
| Limited partnerships: | |
| Limited partnerships: | |
| Limited partnerships: | |
| Middle market | |
| Middle market | |
| Middle market | Middle market | Investments in privately-originated, performing senior secured debt primarily in North America-based companies | $ | 35,869 | | 3,452 | | 4 | | $ | 33,234 | | 6,011 | | 5 | Investments in privately-originated, performing senior secured debt primarily in North America-based companies | $ | 35,648 | | 3,452 | 3,452 | | 3 | 3 | | $ | 34,858 | | 3,452 | 3,452 | | 4 | 4 |
| Global equity fund | Global equity fund | Investments in common stocks of U.S., international developed and emerging markets with a focus on long-term capital growth | 9,383 | | — | | 0 | | 9,037 | | — | | 0 | Global equity fund | Investments in common stocks of U.S., international developed and emerging markets with a focus on long-term capital growth | 11,056 | | — | — | | 0 | 0 | | 10,345 | | — | — | | 0 | 0 |
| | Late-stage growth | Late-stage growth | Investments in private late-stage, established companies seeking capital to accelerate growth prior to an IPO or sale | 19,567 | | 15,629 | | 5 to 7 | | 16,892 | | 18,444 | | 5 to 7 |
| Late-stage growth | |
| Late-stage growth | | Investments in private late-stage, established companies seeking capital to accelerate growth prior to an IPO or sale | 21,116 | | 12,861 | | 4 to 6 | | 20,524 | | 14,271 | | 4 to 6 |
| Infrastructure | Infrastructure | Investments in climate infrastructure assets, focusing on renewable power generation in wind and solar energy | 14,716 | | 11,233 | | 10 to 12 | | 7,683 | | 4,107 | | 11 | Infrastructure | Investments in climate infrastructure assets, focusing on renewable power generation in wind and solar energy | 17,033 | | 9,367 | 9,367 | | 9 to 11 | 9 to 11 | | 16,733 | | 9,576 | 9,576 | | 10 | 10 |
| Total limited partnerships | Total limited partnerships | $ | 79,535 | | 30,314 | | | $ | 66,846 | | 28,562 | | |
The majority of our limited partnership investments are not redeemable because distributions from the funds will be received when the underlying investments of the funds are liquidated. The life spans indicated above may be shortened or extended at the fund manager's discretion, typically in one or two-year increments. The global equity fund is redeemable monthly.
FINANCIAL INSTRUMENTS NOT CARRIED AT FAIR VALUE
Estimates of fair values are made at a specific point in time, based on relevant market prices and information about the financial instruments. The estimated fair values of financial instruments presented below are not necessarily indicative of the amounts the Company might realize in actual market transactions.
The carrying amount and fair value for the financial assets and liabilities on the consolidated financial statements not otherwise disclosed for the periods indicated were as follows:
| | | | September 30, 2023 | | December 31, 2022 | | March 31, 2024 | | December 31, 2023 |
| (In thousands) | (In thousands) | Carrying
Value | | Fair
Value | | Carrying
Value | | Fair
Value | (In thousands) | Carrying
Value | | Fair
Value | | Carrying
Value | | Fair
Value |
| | Financial Assets: | | | | | | | |
| Financial assets: | |
| Financial assets: | |
| Financial assets: | | | | |
| Policy loans | Policy loans | $ | 75,750 | | | 75,750 | | | 78,773 | | | 78,773 | |
| | Residential mortgage loan | Residential mortgage loan | 43 | | | 44 | | | 49 | | | 50 | |
| Residential mortgage loan | |
| Residential mortgage loan | |
| | Cash and cash equivalents | Cash and cash equivalents | 16,785 | | | 16,785 | | | 22,973 | | | 22,973 | |
| Financial Liabilities: | | | | | | | |
| Cash and cash equivalents | |
| Cash and cash equivalents | |
| Financial liabilities: | | Financial liabilities: | | | | | |
| Annuity - investment contracts | Annuity - investment contracts | 67,224 | | | 59,063 | | | 67,344 | | | 61,701 | |
September 30, 2023March 31, 2024 | 10-Q 2316
| | | | | | | | |
CITIZENS, INC. | NOTES TO CONSOLIDATED FINANCIAL STATEMENTS |
| | (Unaudited) |
Policy loans. Policy loans had a weighted average annual interest rate of 7.7% at both September 30, 2023March 31, 2024 and December 31, 20222023 and no specified maturity dates. The aggregate fair value of policy loans approximates the carrying value reflected on the consolidated balance sheets. Policy loans are an integral part of the life insurance policies we have in force, cannot be valued separately and are not marketable. Therefore, the fair value of policy loans approximates the carrying value and policy loans are considered Level 3 assets in the fair value hierarchy.
Residential mortgage loan. The mortgage loan is secured principally by a residential property. The interest rate for this loan was 7.0% at both September 30, 2023March 31, 2024 and December 31, 2022.2023. At September 30, 2023,March 31, 2024, the remaining loan matures in fivefour years. Management estimated the fair value using an annual interest rate of 6.25% at September 30,both March 31, 2024 and December 31, 2023. Our mortgage loan is considered a Level 3 asset in the fair value hierarchy and is included in other long-term investments on the consolidated balance sheets.
Cash and cash equivalents. The fair value of cash and cash equivalents approximates carrying value and are characterized as Level 1 assets in the fair value hierarchy.
Annuity liabilities. The fair value of the Company's liabilities under annuity contract policies,contracts, which are considered Level 3 liabilities, was estimated at September 30, 2023March 31, 2024 and December 31, 20222023 using discounted cash flows based upon spot rates adjusted for various risk adjustments ranging from 4.57%4.13% to 5.01%4.63% and 4.74%3.80% to 5.09%4.50%, respectively. The fair value of liabilities under all insurance contracts are taken into consideration in the overall management of interest rate risk, which seeks to minimize exposure to changing interest rates through the matching of investment maturities with amounts due under insurance contracts.
Other long-term investments. Financial instruments included in other long-term investments are classified in various levels of the fair value hierarchy. The following table summarizes the carrying amounts of these investments.
| | | | | | | | | | | |
Carrying Value (In thousands) | September 30, 2023 | | December 31, 2022 |
| Other long-term investments: | | | |
| Limited partnerships | $ | 79,535 | | | 69,294 | |
| FHLB common stock | 199 | | | 193 | |
| Mortgage loans | 43 | | | 49 | |
| All other investments | 21 | | | 22 | |
| Total other long-term investments | $ | 79,798 | | | 69,558 | |
We carried no limited partnership investments at cost at September 30, 2023 while $2.4 million were carried at cost at December 31, 2022. | | | | | | | | | | | |
Carrying Value (In thousands) | March 31, 2024 | | December 31, 2023 |
| Other long-term investments: | | | |
| Limited partnerships | $ | 84,853 | | | 82,460 | |
| FHLB common stock | 204 | | | 202 | |
| Mortgage loans | 39 | | | 42 | |
| All other investments | 22 | | | 21 | |
| Total other long-term investments | $ | 85,118 | | | 82,725 | |
We are a member of the Federal Home Loan Bank ("FHLB") of Dallas and such membership requires members to own stock in the FHLB. Our FHLB stock is carried at amortized cost, which approximates fair value.
(5) DEFERRED POLICY ACQUISITION COSTS AND COST OF INSURANCE ACQUIRED
DAC
The following tables roll forward the DAC assetand COIA balances for the ninethree months ended September 30,March 31, 2024 and 2023 and 2022 by reporting cohort. Our reporting cohorts are Permanent, which summarizes insurance policies with premiums payable over the lifetime of the policy, and Permanent Limited Pay, which summarizes insurance policies with
September 30, 2023March 31, 2024 | 10-Q 2417
| | | | | | | | |
CITIZENS, INC. | NOTES TO CONSOLIDATED FINANCIAL STATEMENTS |
| | (Unaudited) |
premiums payable for a limited time after which the policy is fully paid up. Both reporting cohorts include whole life and endowment policies.
| | | | | | | | | | | | | | | |
| Nine Months Ended September 30, 2023 |
| (In thousands) | Permanent | Permanent Limited Pay | | Other Business | Total |
| Life Insurance: | | | | | |
| Balance, beginning of year | $ | 100,926 | | 11,542 | | | 1,016 | | 113,484 | |
| Capitalizations | 11,220 | | 2,385 | | | 353 | | 13,958 | |
| Amortization expense | (8,859) | | (586) | | | (197) | | (9,642) | |
| | | | | |
| Balance, end of period | 103,287 | | 13,341 | | | 1,172 | | 117,800 | |
| | | | | |
| Home Service Insurance: | | | | | |
| Balance, beginning of year | 38,793 | | 9,729 | | | 921 | | 49,443 | |
| Capitalizations | 5,026 | | 865 | | | 185 | | 6,076 | |
| Amortization expense | (1,542) | | (295) | | | (65) | | (1,902) | |
| | | | | |
| Balance, end of period | 42,277 | | 10,299 | | | 1,041 | | 53,617 | |
| | | | | |
| Consolidated: | | | | | |
| Balance, beginning of year | 139,719 | | 21,271 | | | 1,937 | | 162,927 | |
| Capitalizations | 16,246 | | 3,250 | | | 538 | | 20,034 | |
| Amortization expense | (10,401) | | (881) | | | (262) | | (11,544) | |
| | | | | |
| Balance, end of period | $ | 145,564 | | 23,640 | | | 2,213 | | 171,417 | |
| | | | | | | | | | | | | | | |
| Three Months Ended March 31, 2024 |
| (In thousands) | Permanent | Permanent Limited Pay | | Other Business | Total |
| Life Insurance: | | | | | |
| Balance, beginning of year | $ | 105,552 | | 14,075 | | | 1,213 | | 120,840 | |
| Capitalizations | 5,976 | | 766 | | | 74 | | 6,816 | |
| Amortization expense | (3,076) | | (227) | | | (55) | | (3,358) | |
| | | | | |
| Balance, end of period | 108,452 | | 14,614 | | | 1,232 | | 124,298 | |
| | | | | |
| Home Service Insurance: | | | | | |
| Balance, beginning of year | 43,280 | | 10,564 | | | 1,084 | | 54,928 | |
| Capitalizations | 1,174 | | 271 | | | 70 | | 1,515 | |
| Amortization expense | (554) | | (105) | | | (21) | | (680) | |
| | | | | |
| Balance, end of period | 43,900 | | 10,730 | | | 1,133 | | 55,763 | |
| | | | | |
| Consolidated: | | | | | |
| Balance, beginning of year | 148,832 | | 24,639 | | | 2,297 | | 175,768 | |
| Capitalizations | 7,150 | | 1,037 | | | 144 | | 8,331 | |
| Amortization expense | (3,630) | | (332) | | | (76) | | (4,038) | |
| | | | | |
| Balance, end of period | $ | 152,352 | | 25,344 | | | 2,365 | | 180,061 | |
| | Nine Months Ended September 30, 2022 |
| Three Months Ended March 31, 2023 | |
| Three Months Ended March 31, 2023 | |
| Three Months Ended March 31, 2023 | |
| (In thousands) | (In thousands) | Permanent | Permanent Limited Pay | | Other Business | Total | (In thousands) | Permanent | Permanent Limited Pay | | Other Business | Total |
| Life Insurance: | Life Insurance: | | | |
| Balance, beginning of year | |
| Balance, beginning of year | |
| Balance, beginning of year | Balance, beginning of year | $ | 97,675 | | 9,001 | | | 1,026 | | 107,702 | |
| Capitalizations | Capitalizations | 10,043 | | 2,121 | | | 41 | | 12,205 | |
| Amortization expense | Amortization expense | (8,462) | | (476) | | | (113) | | (9,051) | |
| | Balance, end of period | Balance, end of period | 99,256 | | 10,646 | | | 954 | | 110,856 | |
| Balance, end of period | |
| Balance, end of period | |
| | Home Service Insurance: | Home Service Insurance: | | | |
| Home Service Insurance: | |
| Home Service Insurance: | |
| Balance, beginning of year | |
| Balance, beginning of year | |
| Balance, beginning of year | Balance, beginning of year | 35,137 | | 8,723 | | | 856 | | 44,716 | |
| Capitalizations | Capitalizations | 4,049 | | 1,064 | | | 19 | | 5,132 | |
| Amortization expense | Amortization expense | (1,361) | | (271) | | | 32 | | (1,600) | |
| | Balance, end of period | Balance, end of period | 37,825 | | 9,516 | | | 907 | | 48,248 | |
| Balance, end of period | |
| Balance, end of period | |
| | Consolidated: | Consolidated: | | | |
| Consolidated: | |
| Consolidated: | |
| Balance, beginning of year | |
| Balance, beginning of year | |
| Balance, beginning of year | Balance, beginning of year | 132,812 | | 17,724 | | | 1,882 | | 152,418 | |
| Capitalizations | Capitalizations | 14,092 | | 3,185 | | | 60 | | 17,337 | |
| Amortization expense | Amortization expense | (9,823) | | (747) | | | (81) | | (10,651) | |
| | Balance, end of period | Balance, end of period | $ | 137,081 | | 20,162 | | | 1,861 | | 159,104 | |
| Balance, end of period | |
| Balance, end of period | |
September 30, 2023March 31, 2024 | 10-Q 2518
| | | | | | | | |
CITIZENS, INC. | NOTES TO CONSOLIDATED FINANCIAL STATEMENTS |
| | (Unaudited) |
DAC capitalization increased for the ninethree months ended September 30, 2023,March 31, 2024, compared to the same prior year period mainly from increased commissions from higher first year sales acrossin our business segments.Life Insurance segment.
COIA
The following tables provide rollforwards of the COIA balances for the nine months ended September 30, 2023 and 2022 by reporting cohort. Our reporting cohorts are Permanent, which summarizes insurance policies with premiums payable over the lifetime of the policy, and Permanent Limited Pay, which summarizes insurance policies with premiums payable for a limited time after which the policy is fully paid up. Both reporting cohorts include whole life and endowment policies. | | | | | | | | | | | | | | | |
| Three Months Ended March 31, 2024 |
| (In thousands) | Permanent | Permanent Limited Pay | | Other Business | Total |
| Life Insurance: | | | | | |
| Balance, beginning of year | $ | 249 | | 695 | | | 406 | | 1,350 | |
| Amortization expense | (4) | | (13) | | | (9) | | (26) | |
| | | | | |
| Balance, end of period | 245 | | 682 | | | 397 | | 1,324 | |
| | | | | |
| Home Service Insurance: | | | | | |
| Balance, beginning of year | 7,194 | | 168 | | | 1,331 | | 8,693 | |
| Amortization expense | (94) | | (2) | | | (50) | | (146) | |
| | | | | |
| Balance, end of period | 7,100 | | 166 | | | 1,281 | | 8,547 | |
| | | | | |
| Consolidated: | | | | | |
| Balance, beginning of year | 7,443 | | 863 | | | 1,737 | | 10,043 | |
| Amortization expense | (98) | | (15) | | | (59) | | (172) | |
| | | | | |
| Balance, end of period | $ | 7,345 | | 848 | | | 1,678 | | 9,871 | |
| | Nine Months Ended September 30, 2023 |
| Three Months Ended March 31, 2023 | |
| Three Months Ended March 31, 2023 | |
| Three Months Ended March 31, 2023 | |
| (In thousands) | (In thousands) | Permanent | Permanent Limited Pay | | Other Business | Total | (In thousands) | Permanent | Permanent Limited Pay | | Other Business | Total |
| Life Insurance: | Life Insurance: | | | |
| Balance, beginning of year | |
| Balance, beginning of year | |
| Balance, beginning of year | Balance, beginning of year | $ | 267 | | 750 | | | 444 | | 1,461 | |
| Amortization expense | Amortization expense | (14) | | (43) | | | (29) | | (86) | |
| | Balance, end of period | Balance, end of period | 253 | | 707 | | | 415 | | 1,375 | |
| Balance, end of period | |
| Balance, end of period | |
| | Home Service Insurance: | Home Service Insurance: | | | |
| Home Service Insurance: | |
| Home Service Insurance: | |
| Balance, beginning of year | |
| Balance, beginning of year | |
| Balance, beginning of year | Balance, beginning of year | 7,583 | | 176 | | | 1,427 | | 9,186 | |
| Amortization expense | Amortization expense | (293) | | (6) | | | (80) | | (379) | |
| | Balance, end of period | Balance, end of period | 7,290 | | 170 | | | 1,347 | | 8,807 | |
| Balance, end of period | |
| Balance, end of period | |
| | Consolidated: | Consolidated: | | | |
| Consolidated: | |
| Consolidated: | |
| Balance, beginning of year | |
| Balance, beginning of year | |
| Balance, beginning of year | Balance, beginning of year | 7,850 | | 926 | | | 1,871 | | 10,647 | |
| Amortization expense | Amortization expense | (307) | | (49) | | | (109) | | (465) | |
| | Balance, end of period | Balance, end of period | $ | 7,543 | | 877 | | | 1,762 | | 10,182 | |
| Balance, end of period | |
| Balance, end of period | |
| | | | | | | | | | | | | | | |
| Nine Months Ended September 30, 2022 |
| (In thousands) | Permanent | Permanent Limited Pay | | Other Business | Total |
| Life Insurance: | | | | | |
| Balance, beginning of year | $ | 287 | | 812 | | | 485 | | 1,584 | |
| Amortization expense | (15) | | (47) | | | (32) | | (94) | |
| | | | | |
| Balance, end of period | 272 | | 765 | | | 453 | | 1,490 | |
| | | | | |
| Home Service Insurance: | | | | | |
| Balance, beginning of year | 7,989 | | 184 | | | 1,511 | | 9,684 | |
| Amortization expense | (306) | | (6) | | | (40) | | (352) | |
| | | | | |
| Balance, end of period | 7,683 | | 178 | | | 1,471 | | 9,332 | |
| | | | | |
| Consolidated: | | | | | |
| Balance, beginning of year | 8,276 | | 996 | | | 1,996 | | 11,268 | |
| Amortization expense | (321) | | (53) | | | (72) | | (446) | |
| | | | | |
| Balance, end of period | $ | 7,955 | | 943 | | | 1,924 | | 10,822 | |
September 30, 2023 | 10-Q 26
| | | | | | | | |
CITIZENS, INC.
| NOTES TO CONSOLIDATED FINANCIAL STATEMENTS |
| | (Unaudited)
|
(6) POLICYHOLDERS’ LIABILITIES
LIABILITY FOR FUTURE POLICY BENEFITS
The following tables summarize balances of and changes in the liability for future policy benefits for our reporting cohorts: Permanent, which summarizes insurance policies with premiums payable over the lifetime of the policy,
| | | | | | | | |
CITIZENS, INC. | NOTES TO CONSOLIDATED FINANCIAL STATEMENTS |
| | (Unaudited) |
and Permanent Limited Pay, which summarizes insurance policies with premiums payable for a limited time after which the policy is fully paid up. Both reporting cohorts include whole life and endowment policies.
| September 30, 2023 (In thousands) | Life Insurance | | Home Service Insurance |
| Permanent | Permanent Limited Pay | | Total | | Permanent | Permanent Limited Pay | | Total |
| Present Value of Expected Net Premiums | | | | | | | |
March 31, 2024 (In thousands) | |
| March 31, 2024 (In thousands) | | March 31, 2024 (In thousands) | Life Insurance | | Home Service Insurance |
| Permanent | Permanent Limited Pay | | Total | | Permanent | Permanent Limited Pay | | Total |
| Present Value of Expected Net Premiums: | |
| Balance, beginning of year | |
| Balance, beginning of year | |
| Balance, beginning of year | Balance, beginning of year | $ | 235,228 | | 10,209 | | | 245,437 | | | 93,508 | | 13,255 | | | 106,763 | |
| Beginning balance at original discount rate | Beginning balance at original discount rate | 247,601 | | 10,682 | | | 258,283 | | | 100,225 | | 14,394 | | | 114,619 | |
| Effect of changes in cash flow assumptions | (210) | | 38 | | | (172) | | | (343) | | 85 | | | (258) | |
| | Effects of actual variances from expected experience | |
| Effects of actual variances from expected experience | |
| Effects of actual variances from expected experience | Effects of actual variances from expected experience | 4,156 | | 1,059 | | | 5,215 | | | (5,631) | | (4,477) | | | (10,108) | |
| Adjusted beginning of year balance | Adjusted beginning of year balance | 251,547 | | 11,779 | | | 263,326 | | | 94,251 | | 10,002 | | | 104,253 | |
| Issuances | Issuances | 20,918 | | 2,608 | | | 23,526 | | | 13,854 | | 3,107 | | | 16,961 | |
| Interest accrual | Interest accrual | 6,897 | | 248 | | | 7,145 | | | 3,019 | | 348 | | | 3,367 | |
| Net premiums collected | Net premiums collected | (31,480) | | (2,004) | | | (33,484) | | | (8,909) | | 2,019 | | | (6,890) | |
| Derecognition and other | Derecognition and other | 567 | | 240 | | | 807 | | | 475 | | 113 | | | 588 | |
| Ending balance at original discount rate | Ending balance at original discount rate | 248,449 | | 12,871 | | | 261,320 | | | 102,690 | | 15,589 | | | 118,279 | |
| Effect of changes in discount rates | Effect of changes in discount rates | (16,380) | | (501) | | | (16,881) | | | (9,438) | | (1,397) | | | (10,835) | |
| Balance, end of period | Balance, end of period | $ | 232,069 | | 12,370 | | | 244,439 | | | 93,252 | | 14,192 | | | 107,444 | |
| | Present Value of Expected Future Policy Benefits | | | | |
| Present Value of Expected Future Policy Benefits: | |
| Present Value of Expected Future Policy Benefits: | |
| Present Value of Expected Future Policy Benefits: | |
| Balance, beginning of year | |
| Balance, beginning of year | |
| Balance, beginning of year | Balance, beginning of year | $ | 947,415 | | 195,612 | | | 1,143,027 | | | 200,351 | | 116,356 | | | 316,707 | |
| Beginning balance at original discount rate | Beginning balance at original discount rate | 996,169 | | 208,051 | | | 1,204,220 | | | 214,188 | | 121,908 | | | 336,096 | |
| Effect of changes in cash flow assumptions | (389) | | (702) | | | (1,091) | | | (257) | | 331 | | | 74 | |
| | Effects of actual variances from expected experience | |
| Effects of actual variances from expected experience | |
| Effects of actual variances from expected experience | Effects of actual variances from expected experience | 6,338 | | 3,489 | | | 9,827 | | | (5,472) | | (1,337) | | | (6,809) | |
| Adjusted beginning of year balance | Adjusted beginning of year balance | 1,002,118 | | 210,838 | | | 1,212,956 | | | 208,459 | | 120,902 | | | 329,361 | |
| Issuances | Issuances | 21,360 | | 2,798 | | | 24,158 | | | 13,854 | | 3,115 | | | 16,969 | |
| Interest accrual | Interest accrual | 32,470 | | 6,288 | | | 38,758 | | | 6,987 | | 4,242 | | | 11,229 | |
| Benefit payments | Benefit payments | (63,211) | | (16,732) | | | (79,943) | | | (12,246) | | (4,707) | | | (16,953) | |
| Derecognition and other | Derecognition and other | 97 | | 42 | | | 139 | | | 464 | | 109 | | | 573 | |
| Ending balance at original discount rate | Ending balance at original discount rate | 992,834 | | 203,234 | | | 1,196,068 | | | 217,518 | | 123,661 | | | 341,179 | |
| Effect of changes in discount rates | Effect of changes in discount rates | (78,072) | | (18,778) | | | (96,850) | | | (23,934) | | (12,670) | | | (36,604) | |
| Balance, end of period | Balance, end of period | $ | 914,762 | | 184,456 | | | 1,099,218 | | | 193,584 | | 110,991 | | | 304,575 | |
| | Net liability for future policy benefits | Net liability for future policy benefits | $ | 682,693 | | 172,086 | | | 854,779 | | | 100,332 | | 96,799 | | | 197,131 | |
| Net liability for future policy benefits | |
| Net liability for future policy benefits | |
|
September 30, 2023March 31, 2024 | 10-Q 2720
| | | | | | | | |
CITIZENS, INC. | NOTES TO CONSOLIDATED FINANCIAL STATEMENTS |
| | (Unaudited) |
The Life Insurance segment impact of updating actual experience for the current period contributed to an increase in liabilities primarily due to higher benefits than expected. The Home Service Insurance segment impact of updating actual experience for the current period contributed to an increase in liabilities due to higher premiums collected than expected.
| | | | | | | | | | | | | | | | | | | | | | | | | |
September 30, 2022 (In thousands) | Life Insurance | | Home Service Insurance |
| Permanent | Permanent Limited Pay | | Total | | Permanent | Permanent Limited Pay | | Total |
| Present Value of Expected Net Premiums | | | | | | | | |
| Balance, beginning of year | $ | 269,528 | | 4,939 | | | 274,467 | | | 104,556 | | 10,196 | | | 114,752 | |
| Beginning balance at original discount rate | 246,386 | | 5,093 | | | 251,479 | | | 90,012 | | 9,532 | | | 99,544 | |
| Effect of changes in cash flow assumptions | (3,662) | | 237 | | | (3,425) | | | 4,253 | | 1,214 | | | 5,467 | |
| Effects of actual variances from expected experience | 1,705 | | 401 | | | 2,106 | | | (299) | | (5,603) | | | (5,902) | |
| Adjusted beginning of year balance | 244,429 | | 5,731 | | | 250,160 | | | 93,966 | | 5,143 | | | 99,109 | |
| Issuances | 25,049 | | 2,757 | | | 27,806 | | | 13,886 | | 4,041 | | | 17,927 | |
| Interest accrual | 6,259 | | 32 | | | 6,291 | | | 2,553 | | 166 | | | 2,719 | |
| Net premiums collected | (29,835) | | 455 | | | (29,380) | | | (8,331) | | 5,156 | | | (3,175) | |
| Derecognition and other | 445 | | 90 | | | 535 | | | (655) | | 117 | | | (538) | |
| Ending balance at original discount rate | 246,347 | | 9,065 | | | 255,412 | | | 101,419 | | 14,623 | | | 116,042 | |
| Effect of changes in discount rates | (15,999) | | (653) | | | (16,652) | | | (8,386) | | (1,629) | | | (10,015) | |
| Balance, end of period | $ | 230,348 | | 8,412 | | | 238,760 | | | 93,033 | | 12,994 | | | 106,027 | |
| | | | | | | | | |
| Present Value of Expected Future Policy Benefits | | | | | | | |
| Balance, beginning of year | $ | 1,168,282 | | 240,679 | | | 1,408,961 | | | 266,206 | | 161,715 | | | 427,921 | |
| Beginning balance at original discount rate | 990,921 | | 207,105 | | | 1,198,026 | | | 205,340 | | 117,425 | | | 322,765 | |
| Effect of changes in cash flow assumptions | (3,916) | | 374 | | | (3,542) | | | 4,822 | | 1,765 | | | 6,587 | |
| Effects of actual variances from expected experience | 2,127 | | 3,392 | | | 5,519 | | | 158 | | 7 | | | 165 | |
| Adjusted beginning of year balance | 989,132 | | 210,871 | | | 1,200,003 | | | 210,320 | | 119,197 | | | 329,517 | |
| Issuances | 25,567 | | 2,835 | | | 28,402 | | | 13,900 | | 4,038 | | | 17,938 | |
| Interest accrual | 31,922 | | 6,358 | | | 38,280 | | | 6,539 | | 4,076 | | | 10,615 | |
| Benefit payments | (51,604) | | (12,483) | | | (64,087) | | | (15,058) | | (5,277) | | | (20,335) | |
| Derecognition and other | (30) | | 12 | | | (18) | | | (669) | | 110 | | | (559) | |
| Ending balance at original discount rate | 994,987 | | 207,593 | | | 1,202,580 | | | 215,032 | | 122,144 | | | 337,176 | |
| Effect of changes in discount rates | (60,876) | | (13,695) | | | (74,571) | | | (14,624) | | (4,985) | | | (19,609) | |
| Balance, end of period | $ | 934,111 | | 193,898 | | | 1,128,009 | | | 200,408 | | 117,159 | | | 317,567 | |
| | | | | | | | | |
| Net liability for future policy benefits | $ | 703,763 | | 185,486 | | | 889,249 | | | 107,375 | | 104,165 | | | 211,540 | |
| Plus: Flooring impact | 2 | | — | | | 2 | | | — | | — | | | — | |
| | | | | | | | | |
| Net liability for future policy benefits, after flooring impact | $ | 703,765 | | 185,486 | | | 889,251 | | | 107,375 | | 104,165 | | | 211,540 | |
September 30, 2023 | 10-Q 28
| | | | | | | | |
CITIZENS, INC.
| NOTES TO CONSOLIDATED FINANCIAL STATEMENTS |
| | (Unaudited)
|
The Life Insurance segment impact of updating actual experience for the current period contributed to an increase in liabilities primarily due to higher benefits paid than expected. The Home Service Insurance segment impact of updating actual experience for the current period contributed to an increase in liabilities due to higher premiums collected than expected. | | | | | | | | | | | | | | | | | | | | | | | | | |
March 31, 2023 (In thousands) | Life Insurance | | Home Service Insurance |
| Permanent | Permanent Limited Pay | | Total | | Permanent | Permanent Limited Pay | | Total |
| Present Value of Expected Net Premiums: | | | | | | | | |
| Balance, beginning of year | $ | 235,228 | | 10,209 | | | 245,437 | | | 93,508 | | 13,255 | | | 106,763 | |
| Beginning balance at original discount rate | 247,601 | | 10,682 | | | 258,283 | | | 100,225 | | 14,394 | | | 114,619 | |
| | | | | | | | | |
| Effects of actual variances from expected experience | 1,742 | | 365 | | | 2,107 | | | (1,371) | | (809) | | | (2,180) | |
| Adjusted beginning of year balance | 249,343 | | 11,047 | | | 260,390 | | | 98,854 | | 13,585 | | | 112,439 | |
| Issuances | 6,236 | | 759 | | | 6,995 | | | 4,789 | | 1,176 | | | 5,965 | |
| Interest accrual | 2,272 | | 72 | | | 2,344 | | | 986 | | 114 | | | 1,100 | |
| Net premiums collected | (9,715) | | (751) | | | (10,466) | | | (2,967) | | 467 | | | (2,500) | |
| Derecognition and other | 153 | | 38 | | | 191 | | | 132 | | 46 | | | 178 | |
| Ending balance at original discount rate | 248,289 | | 11,165 | | | 259,454 | | | 101,794 | | 15,388 | | | 117,182 | |
| Effect of changes in discount rates | (8,766) | | (370) | | | (9,136) | | | (4,925) | | (873) | | | (5,798) | |
| Balance, end of period | $ | 239,523 | | 10,795 | | | 250,318 | | | 96,869 | | 14,515 | | | 111,384 | |
| | | | | | | | | |
| Present Value of Expected Future Policy Benefits: | | | | | | | |
| Balance, beginning of year | $ | 947,415 | | 195,612 | | | 1,143,027 | | | 200,351 | | 116,356 | | | 316,707 | |
| Beginning balance at original discount rate | 996,169 | | 208,051 | | | 1,204,220 | | | 214,188 | | 121,908 | | | 336,096 | |
| | | | | | | | | |
| Effects of actual variances from expected experience | 2,538 | | 1,045 | | | 3,583 | | | (1,299) | | 25 | | | (1,274) | |
| Adjusted beginning of year balance | 998,707 | | 209,096 | | | 1,207,803 | | | 212,889 | | 121,933 | | | 334,822 | |
| Issuances | 6,375 | | 785 | | | 7,160 | | | 4,789 | | 1,176 | | | 5,965 | |
| Interest accrual | 10,842 | | 2,112 | | | 12,954 | | | 2,310 | | 1,410 | | | 3,720 | |
| Benefit payments | (19,153) | | (4,873) | | | (24,026) | | | (4,178) | | (1,748) | | | (5,926) | |
| Derecognition and other | 14 | | 12 | | | 26 | | | 132 | | 45 | | | 177 | |
| Ending balance at original discount rate | 996,785 | | 207,132 | | | 1,203,917 | | | 215,942 | | 122,816 | | | 338,758 | |
| Effect of changes in discount rates | (31,065) | | (9,459) | | | (40,524) | | | (10,101) | | (3,712) | | | (13,813) | |
| Balance, end of period | $ | 965,720 | | 197,673 | | | 1,163,393 | | | 205,841 | | 119,104 | | | 324,945 | |
| | | | | | | | | |
| Net liability for future policy benefits | $ | 726,197 | | 186,878 | | | 913,075 | | | 108,972 | | 104,589 | | | 213,561 | |
| | | | | | | | | |
| | | | | | | | | |
| | | | | | | | | |
Net premiums collected is defined as the transactional gross premiums collected in the current period times the net premium ratio. Issuances are calculated as the present value, using the locked-in discount rate, of the expected net premiums or the expected future policy benefits related to new policies issued during the ninethree months ended September 30, 2023March 31, 2024 and 2022.2023. Interest accrual is the interest earned on the beginning present value of either the expected net premiums or the expected future policy benefits using the locked-in discount rate. Benefit payments are the transactional benefits (death, lapse, surrenders and maturities) paid in the current period. Derecognition refers to a subset of the issuances or the present value of future premiums released on new issues that lapsed during the ninethree months ended September 30,March 31, 2024 and 2023 and 2022 as well as other reconciling items. The effects of actual variances from expected experience lines are primarily impacted by the actual policy cash flows during the period compared to that which was expected in the reserve assumptions. If the net of the two lines is a positive number, the implication is an unfavorable result with policy cash flows less favorable than assumed while a negative number implies a favorable result compared to assumptions. Our policy experience will vary from actual experience in any one period, either favorably or unfavorably.
| | | | | | | | |
CITIZENS, INC. | NOTES TO CONSOLIDATED FINANCIAL STATEMENTS |
| | (Unaudited) |
The following table reconciles the net liability for future policy benefits shown above to the liability for future policy benefits reported in the consolidated balance sheets.
| | September 30, 2023 | | September 30, 2022 |
| March 31, 2024 | | | March 31, 2024 | | March 31, 2023 |
| (In thousands) | (In thousands) | Life
Insurance | Home Service
Insurance | Consolidated | | Life
Insurance | Home Service
Insurance | Consolidated | (In thousands) | Life
Insurance | Home Service
Insurance | Consolidated | | Life
Insurance | Home Service
Insurance | Consolidated |
| Life Insurance | | | |
| Life Insurance: | |
| Permanent | |
| Permanent | |
| Permanent | Permanent | $ | 682,693 | | 100,332 | | 783,025 | | | 703,765 | | 107,375 | | 811,140 | |
| Permanent limited pay | Permanent limited pay | 172,086 | | 96,799 | | 268,885 | | | 185,486 | | 104,165 | | 289,651 | |
| Deferred profit liability | Deferred profit liability | 27,616 | | 26,138 | | 53,754 | | | 23,749 | | 23,727 | | 47,476 | |
| Other | Other | 28,011 | | 13,926 | | 41,937 | | | 28,558 | | 13,677 | | 42,235 | |
| Total life insurance | Total life insurance | 910,406 | | 237,195 | | 1,147,601 | | | 941,558 | | 248,944 | | 1,190,502 | |
| Accident & Health | | | |
| Accident & Health: | |
| | Other | |
| | Other | |
| | Other | Other | 596 | | 281 | | 877 | | | 498 | | 231 | | 729 | |
| | Total future policy benefit reserves | Total future policy benefit reserves | $ | 911,002 | | 237,476 | | 1,148,478 | | | 942,056 | | 249,175 | | 1,191,231 | |
| Total future policy benefit reserves | |
| Total future policy benefit reserves | |
September 30, 2023 | 10-Q 29
| | | | | | | | |
CITIZENS, INC.
| NOTES TO CONSOLIDATED FINANCIAL STATEMENTS |
| | (Unaudited)
|
The following table provides the amount of undiscounted and discounted expected gross premiums and expected future benefit payments for long-term duration contracts.
| | September 30, 2023 | | September 30, 2022 |
| March 31, 2024 | | | March 31, 2024 | | March 31, 2023 |
| (In thousands) | (In thousands) | Life
Insurance | | Home Service
Insurance | | Life
Insurance | | Home Service
Insurance | (In thousands) | Life
Insurance | | Home Service
Insurance | | Life
Insurance | | Home Service
Insurance |
| Undiscounted: | Undiscounted: | | | |
| Permanent | |
| Permanent: | |
| Permanent: | |
| Permanent: | |
| Expected future gross premiums | |
| Expected future gross premiums | |
| Expected future gross premiums | Expected future gross premiums | $ | 604,059 | | | 459,405 | | | 614,123 | | | 465,752 | |
| Expected future benefit payments | Expected future benefit payments | 1,483,068 | | | 484,239 | | | 1,471,197 | | | 472,958 | |
| | Permanent Limited Pay | |
| Permanent Limited Pay: | |
| Permanent Limited Pay: | |
| Permanent Limited Pay: | |
| Expected future gross premiums | |
| Expected future gross premiums | |
| Expected future gross premiums | Expected future gross premiums | 47,868 | | | 77,544 | | | 48,132 | | | 74,126 | |
| Expected future benefit payments | Expected future benefit payments | 325,964 | | | 320,563 | | | 322,184 | | | 316,178 | |
| | | Discounted: | Discounted: | |
| Permanent | |
| | Discounted: | |
| | Discounted: | |
| Permanent: | |
| Permanent: | |
| Permanent: | |
| Expected future gross premiums | |
| Expected future gross premiums | |
| Expected future gross premiums | Expected future gross premiums | $ | 453,277 | | | 261,271 | | | 471,719 | | | 272,158 | |
| Expected future benefit payments | Expected future benefit payments | 914,762 | | | 193,584 | | | 934,111 | | | 200,408 | |
| | Permanent Limited Pay | |
| Permanent Limited Pay: | |
| Permanent Limited Pay: | |
| Permanent Limited Pay: | |
| Expected future gross premiums | |
| Expected future gross premiums | |
| Expected future gross premiums | Expected future gross premiums | 42,133 | | | 51,091 | | | 42,441 | | | 52,036 | |
| Expected future benefit payments | Expected future benefit payments | 184,456 | | | 110,991 | | | 193,898 | | | 117,159 | |
|
September 30, 2023March 31, 2024 | 10-Q 3022
| | | | | | | | |
CITIZENS, INC. | NOTES TO CONSOLIDATED FINANCIAL STATEMENTS |
| | (Unaudited) |
The following tables summarize the amount of revenue and interest related to long-term duration contracts recognized in the consolidated statement of operations:operations and comprehensive income (loss):
| | Three Months Ended September 30, | | Nine Months Ended September 30, |
| 2023 | | 2022 | | 2023 | | 2022 |
| | | Three Months Ended March 31, | |
| | | Three Months Ended March 31, | |
| | | Three Months Ended March 31, | |
| | | | | 2024 | | | | | | | 2024 | | 2023 |
| (In thousands) | (In thousands) | Gross Premiums | Interest Expense | | Gross Premiums | Interest Expense | | Gross Premiums | Interest Expense | | Gross Premiums | Interest Expense | (In thousands) | | | | | | | Gross Premiums | Interest Expense | | Gross Premiums | Interest Expense |
| Life Insurance Segment: | Life Insurance Segment: | | | |
| Life Insurance | |
| Life Insurance: | |
| Life Insurance: | |
| Life Insurance: | |
| Permanent | |
| Permanent | |
| Permanent | Permanent | $ | 23,654 | | 8,471 | | | 23,751 | | 8,537 | | | 68,619 | | 25,573 | | | 68,826 | | 25,663 | |
| Permanent Limited Pay | Permanent Limited Pay | 3,555 | | 2,308 | | | 3,399 | | 2,291 | | | 11,333 | | 6,811 | | | 10,391 | | 6,946 | |
| Other | Other | 4,279 | | — | | | 4,944 | | — | | | 7,094 | | — | | | 10,214 | | — | |
| Less: | Less: | |
| Reinsurance | Reinsurance | 392 | | — | | | 501 | | — | | | 1,452 | | — | | | 1,254 | | — | |
| Reinsurance | |
| Reinsurance | |
| Total, net of reinsurance | Total, net of reinsurance | 31,096 | | 10,779 | | | 31,593 | | 10,828 | | | 85,594 | | 32,384 | | | 88,177 | | 32,609 | |
| Accident & Health | | | | | | | |
| Accident & Health: | |
| | Other | |
| | Other | |
| | Other | Other | 53 | | — | | | 104 | | — | | | 537 | | — | | | 287 | | — | |
| Less: | Less: | |
| Reinsurance | |
| Reinsurance | |
| Reinsurance | Reinsurance | 1 | | — | | | 1 | | — | | | 3 | | — | | | 3 | | — | |
| Total, net of reinsurance | Total, net of reinsurance | 52 | | — | | | 103 | | — | | | 534 | | — | | | 284 | | — | |
| Total | Total | $ | 31,148 | | 10,779 | | | 31,696 | | 10,828 | | | 86,128 | | 32,384 | | | 88,461 | | 32,609 | |
| | Home Service Insurance Segment: | Home Service Insurance Segment: | |
| Life Insurance | |
| Home Service Insurance Segment: | |
| Home Service Insurance Segment: | |
| Life Insurance: | |
| Life Insurance: | |
| Life Insurance: | |
| Permanent | |
| Permanent | |
| Permanent | Permanent | $ | 8,372 | | 1,322 | | | 8,331 | | 1,319 | | | 25,012 | | 3,968 | | | 25,079 | | 3,986 | |
| Permanent Limited Pay | Permanent Limited Pay | 2,154 | | 1,599 | | | 2,136 | | 1,568 | | | 6,425 | | 4,777 | | | 6,279 | | 4,688 | |
| Other | Other | 178 | | — | | | 367 | | — | | | 1,012 | | — | | | 1,418 | | — | |
| Less: | Less: | |
| Reinsurance | Reinsurance | 6 | | — | | | 4 | | — | | | 23 | | — | | | 23 | | — | |
| Reinsurance | |
| Reinsurance | |
| Total, net of reinsurance | Total, net of reinsurance | 10,698 | | 2,921 | | | 10,830 | | 2,887 | | | 32,426 | | 8,745 | | | 32,753 | | 8,674 | |
| Accident & Health | | | | | | | |
| Accident & Health: | |
| | Other | |
| | Other | |
| | Other | Other | 244 | | — | | | 196 | | — | | | 667 | | — | | | 581 | | — | |
| | Total | Total | $ | 10,942 | | 2,921 | | | 11,026 | | 2,887 | | | 33,093 | | 8,745 | | | 33,334 | | 8,674 | |
| | Total | |
| | Total | |
The following table provides the weighted-average durations of the liability for future policy benefits.
| | September 30, 2023 | | September 30, 2022 |
| March 31, 2024 | | | March 31, 2024 | | March 31, 2023 |
| (In years) | (In years) | Life
Insurance | Home Service
Insurance | | Life
Insurance | Home Service
Insurance | (In years) | Life
Insurance | Home Service
Insurance | | Life
Insurance | Home Service
Insurance |
| Permanent | | | |
| Permanent: | |
| Duration at original discount rate | |
| Duration at original discount rate | |
| Duration at original discount rate | Duration at original discount rate | 7.8 | 15.7 | | 7.9 | 15.3 | 8.2 | 16.0 | | 8.1 | 15.9 |
| Duration at current discount rate | Duration at current discount rate | 8.2 | 15.6 | | 8.6 | 15.4 | Duration at current discount rate | 8.5 | 15.8 | | 8.4 | 16.1 |
| Permanent Limited Pay | |
| Permanent Limited Pay: | |
| Duration at original discount rate | |
| Duration at original discount rate | |
| Duration at original discount rate | Duration at original discount rate | 7.9 | 14.3 | | 7.5 | 14.3 | 8.1 | 14.5 | | 7.6 | 14.5 |
| Duration at current discount rate | Duration at current discount rate | 7.6 | 14.4 | | 7.6 | 15.3 | Duration at current discount rate | 7.8 | 14.5 | | 7.6 | 15.2 |
|
September 30, 2023March 31, 2024 | 10-Q 3123
| | | | | | | | |
CITIZENS, INC. | NOTES TO CONSOLIDATED FINANCIAL STATEMENTS |
| | (Unaudited) |
The following table provides the weighted-average interest rates for the liability for future policy benefits.
| | September 30, 2023 | | September 30, 2022 |
| Life
Insurance | Home Service
Insurance | | Life
Insurance | Home Service
Insurance |
| Permanent | | | |
| March 31, 2024 | | | March 31, 2024 | | March 31, 2023 |
| Life
Insurance | | | Life
Insurance | Home Service
Insurance | | Life
Insurance | Home Service
Insurance |
| Permanent: | |
| Interest rate at original discount rate | |
| Interest rate at original discount rate | |
| Interest rate at original discount rate | Interest rate at original discount rate | 4.92 | % | 4.98 | % | | 4.95 | % | 5.02 | % | 4.89 | % | 4.97 | % | | 4.92 | % | 4.99 | % |
| Interest rate at current discount rate | Interest rate at current discount rate | 5.62 | % | 5.71 | % | | 5.23 | % | 5.18 | % | Interest rate at current discount rate | 5.10 | % | 5.31 | % | | 4.86 | % | 5.09 | % |
| Permanent Limited Pay | |
| Permanent Limited Pay: | |
| Interest rate at original discount rate | |
| Interest rate at original discount rate | |
| Interest rate at original discount rate | Interest rate at original discount rate | 4.29 | % | 5.05 | % | | 4.31 | % | 5.06 | % | 4.28 | % | 5.03 | % | | 4.30 | % | 5.05 | % |
| Interest rate at current discount rate | Interest rate at current discount rate | 5.60 | % | 5.71 | % | | 5.17 | % | 5.17 | % | Interest rate at current discount rate | 5.09 | % | 5.31 | % | | 4.85 | % | 5.08 | % |
|
LIABILITY FOR POLICYHOLDERS’ ACCOUNT BALANCES
The following table presents the policyholders' account balances by range of guaranteed minimum crediting rates and the related range of the difference, in basis points, between rates being credited and the respective guaranteed minimums.
| | At Guaranteed Minimum | 1 Basis Point-50 Basis Points Above | 51 Basis Points-150 Basis Points Above | Greater Than 150 Basis Points Above | Total |
September 30, 2023 (In thousands) | | Range of Guaranteed Minimum Crediting Rates | |
| At Guaranteed Minimum | | | At Guaranteed Minimum | 1 Basis Point-50 Basis Points Above | 51 Basis Points-150 Basis Points Above | Greater Than 150 Basis Points Above | Total |
March 31, 2024 (In thousands) | | March 31, 2024 (In thousands) |
| Range of Guaranteed Minimum Crediting Rates: | |
| 0.00% - 1.49% | |
| 0.00% - 1.49% | |
| 0.00% - 1.49% | 0.00% - 1.49% | $ | 746 | | — | | 1,138 | | 37,233 | | 39,117 | |
| 1.50% - 2.99% | 1.50% - 2.99% | 30,256 | | 675 | | 63 | | — | | 30,994 | |
| 3.00% - 4.49% | 3.00% - 4.49% | 104,304 | | 10 | | — | | — | | 104,314 | |
| Greater or equal to 4.50% | Greater or equal to 4.50% | 31,374 | | — | | — | | — | | 31,374 | |
| Total | Total | $ | 166,680 | | 685 | | 1,201 | | 37,233 | | 205,799 | |
| | At Guaranteed Minimum | 1 Basis Point-50 Basis Points Above | 51 Basis Points-150 Basis Points Above | Greater Than 150 Basis Points Above | Total |
September 30, 2022 (In thousands) | | Range of Guaranteed Minimum Crediting Rates | | | |
| At Guaranteed Minimum | | | At Guaranteed Minimum | 1 Basis Point-50 Basis Points Above | 51 Basis Points-150 Basis Points Above | Greater Than 150 Basis Points Above | Total |
March 31, 2023 (In thousands) | | March 31, 2023 (In thousands) |
| Range of Guaranteed Minimum Crediting Rates: | |
| 0.00% - 1.49% | |
| 0.00% - 1.49% | |
| 0.00% - 1.49% | 0.00% - 1.49% | $ | 702 | | — | | 827 | | 40,055 | | 41,584 | |
| 1.50% - 2.99% | 1.50% - 2.99% | 22,370 | | 603 | | 30 | | — | | 23,003 | |
| 3.00% - 4.49% | 3.00% - 4.49% | 96,932 | | 10 | | — | | — | | 96,942 | |
| Greater or equal to 4.50% | Greater or equal to 4.50% | 31,762 | | — | | — | | — | | 31,762 | |
| Total | Total | $ | 151,766 | | 613 | | 857 | | 40,055 | | 193,291 | |
September 30, 2023March 31, 2024 | 10-Q 3224
| | | | | | | | |
CITIZENS, INC. | NOTES TO CONSOLIDATED FINANCIAL STATEMENTS |
| | (Unaudited) |
The following tables summarize balances of and changes in policyholders' account balances.
| September 30, 2023 (In thousands, except for %) | Supplemental Contracts Without Life Contingencies | Fixed Annuity | Dividend
Accumulations | Premiums Paid in Advance |
March 31, 2024 (In thousands, except for %) | | March 31, 2024 (In thousands, except for %) | Supplemental Contracts Without Life Contingencies | Fixed Annuity | Dividend
Accumulations | Premiums Paid in Advance |
| Balance, beginning of year | Balance, beginning of year | $ | 32,995 | | 86,807 | | 41,663 | | 34,603 | |
| Issuances | Issuances | 16,086 | | 2,160 | | 474 | | 3,200 | |
| Premiums received | Premiums received | 85 | | 3,273 | | 4,210 | | 659 | |
| | Interest credited | Interest credited | 1,103 | | 1,988 | | 993 | | 948 | |
| Other | 1 | | — | | — | | — | |
| Interest credited | |
| Interest credited | |
| | Less: | Less: | |
| Less: | |
| Less: | |
| Surrenders and withdrawals | |
| Surrenders and withdrawals | |
| Surrenders and withdrawals | Surrenders and withdrawals | — | | 7,647 | | 3,238 | | 6,098 | |
| Benefit payments | Benefit payments | 8,466 | | — | | — | | — | |
| Balance, end of period | Balance, end of period | $ | 41,804 | | 86,581 | | 44,102 | | 33,312 | |
| Weighted-average crediting rates | Weighted-average crediting rates | 4.01 | % | 3.57 | % | 3.05 | % | 2.96 | % | Weighted-average crediting rates | 3.96 | % | 3.57 | % | 3.28 | % | 2.93 | % |
| | Cash surrender value | Cash surrender value | $ | 41,804 | | 86,581 | | 44,102 | | 33,312 | |
| Cash surrender value | |
| Cash surrender value | |
| September 30, 2022 (In thousands, except for %) | Supplemental Contracts Without Life Contingencies | Fixed Annuity | Dividend
Accumulations | Premiums Paid in Advance |
March 31, 2023 (In thousands, except for %) | | March 31, 2023 (In thousands, except for %) | Supplemental Contracts Without Life Contingencies | Fixed Annuity | Dividend
Accumulations | Premiums Paid in Advance |
| Balance, beginning of year | Balance, beginning of year | $ | 23,950 | | 83,917 | | 37,760 | | 38,875 | |
| Issuances | Issuances | 8,787 | | 2,343 | | 435 | | 1,860 | |
| Premiums received | Premiums received | 57 | | 3,810 | | 4,044 | | 538 | |
| | Interest credited | Interest credited | 769 | | 1,966 | | 897 | | 750 | |
| Other | 2 | | — | | — | | — | |
| Interest credited | |
| Interest credited | |
| | Less: | Less: | |
| Less: | |
| Less: | |
| Surrenders and withdrawals | |
| Surrenders and withdrawals | |
| Surrenders and withdrawals | Surrenders and withdrawals | — | | 5,903 | | 2,653 | | 6,047 | |
| Benefit payments | Benefit payments | 2,866 | | — | | — | | — | |
| Balance, end of period | Balance, end of period | $ | 30,699 | | 86,133 | | 40,483 | | 35,976 | |
| Weighted-average crediting rates | Weighted-average crediting rates | 4.08 | % | 3.60 | % | 3.07 | % | 3.05 | % | Weighted-average crediting rates | 4.05 | % | 3.57 | % | 3.05 | % | 2.98 | % |
| | Cash surrender value | Cash surrender value | $ | 30,699 | | 86,133 | | 40,483 | | 35,976 | |
| Cash surrender value | |
| Cash surrender value | |
September 30, 2023March 31, 2024 | 10-Q 3325
| | | | | | | | |
CITIZENS, INC. | NOTES TO CONSOLIDATED FINANCIAL STATEMENTS |
| | (Unaudited) |
The following table reconciles policyholders' account balances shown above to the policyholders' account balances liability in the consolidated balance sheets.
| As of September 30, (In thousands) | | 2023 | | | 2022 |
As of March 31, (In thousands) | |
As of March 31, (In thousands) | |
As of March 31, (In thousands) | | | | 2024 | | | | 2023 |
| Annuities: | Annuities: | | | | |
| Supplemental contracts without life contingencies | |
| Supplemental contracts without life contingencies | |
| Supplemental contracts without life contingencies | Supplemental contracts without life contingencies | | $ | 41,804 | | | | 30,699 | |
| Fixed annuity | Fixed annuity | | 86,581 | | | | 86,133 | |
| Unearned revenue reserve | Unearned revenue reserve | | 1,524 | | | | 1,619 | |
| Other | Other | | — | | | | 1 | |
| Total annuities | Total annuities | | $ | 129,909 | | | | 118,452 | |
| | | | Premiums Paid in Advance: | Premiums Paid in Advance: | | | | |
| | Premiums Paid in Advance: | |
| | Premiums Paid in Advance: | |
| Premiums paid in advance | |
| Premiums paid in advance | |
| Premiums paid in advance | Premiums paid in advance | | $ | 33,312 | | | | 35,976 | |
| Other | Other | | 2,141 | | | | 2,461 | |
| Total premiums paid in advance | Total premiums paid in advance | | $ | 35,453 | | | | 38,437 | |
(7) COMMITMENTS AND CONTINGENCIES
LITIGATION AND REGULATORY ACTIONS
From time to time, we are subject to legal and regulatory actions relating to our business. We may incur defense costs, including attorneys' fees, and other direct litigation costs associated with defending claims. If we suffer an adverse judgment as a result of litigation claims, it could have a material adverse effect on our business, results of operations and financial condition.
CONTRACTUAL OBLIGATIONS
As of September 30, 2023,March 31, 2024, CICA International is committed to fund investments up to $30.3$25.7 million related to limited partnerships previously described.
CREDIT FACILITY
On May 5, 2021, the Company entered into a $20 million senior secured revolving credit facility (the “Credit Facility”) with Regions Bank ("Regions"). The Credit Facility has a three-year term, maturing on May 5, 2024, and allows the Company to borrow up to $20 million for working capital purposes, capital expenditures and other corporate purposes.
Revolving loans may be requested by the Company in aggregate minimum principal amounts of $0.5 million per loan. At the Company's election, the revolving loans may either bear a base rate, which is 1.75% plus a base rate (a fluctuating rate per annum) equal to the greatest of (a) Regions' prime rate, (b) the federal funds rate plus 0.50%, or (c) 0.75%. The Company is required to pay Regions an annual commitment fee of 0.375% of the unused portion of the Credit Facility in quarterly installments, which the Company expenses as it is incurred.
Obligations under the Credit Facility are secured by substantially all of the assets of the Company other than the equity interests in all of the regulated insurance subsidiaries, real estate owned by the Company, and other limited exceptions. The Credit Facility contains customary events of default and financial, affirmative and negative covenants, including but not limited to restrictions on indebtedness, liens, investments, asset dispositions and restricted payments. As of September 30, 2023,March 31, 2024, the Company had not borrowed any funds against the Credit Facility and was not in violation of any covenants.
September 30, 2023March 31, 2024 | 10-Q 3426
| | | | | | | | |
CITIZENS, INC. | NOTES TO CONSOLIDATED FINANCIAL STATEMENTS |
| | (Unaudited) |
We renewed the line of credit in May 2024 for an additional three years at substantially the same terms as described above.
(8) STOCKHOLDERS' EQUITY AND RESTRICTIONS
STOCK
Our Restated and Amended Articles of Incorporation authorize the issuance of 127,000,000 shares, of which 100,000,000 shares shall be Class A common stock, 2,000,000 shares shall be Class B common stock, and 25,000,000 shall be preferred stock. Both authorized classes of common stock are equal in all respects, except (a) each share of Class A common stock is entitled to receive twice the cash dividends paid on a per share basis to the Class B common stock, if any; and (b) the holders of the Class B common stock have the exclusive right to elect a simple majority of the Board of Directors of Citizens. In April 2021, we repurchased all of the outstanding Class B common stock, which is now classified as treasury stock. As a result, all of the directors are elected by the holders of the Class A common stock. Citizens has never issued any preferred stock.
A summary of the change in the number of shares of Class A and Class B common stock and treasury stock issued is as follows:
| | Three Months Ended March 31, | | | Three Months Ended March 31, |
| 2024 | | | 2024 | | 2023 |
| (In thousands) | | (In thousands) | Common Stock | | Treasury | | Common Stock | | Treasury |
| Class A | | Class B | | Stock | | Class A | | Class B | | Stock |
| Balance at beginning of year | |
| | Stock issued for compensation | |
| Stock issued for compensation | |
| Stock issued for compensation | |
| | | Nine Months Ended September 30, |
| | 2023 | | 2022 |
| (In thousands) | Common Stock | | Treasury | | Common Stock | | Treasury |
| Class A | | Class B | | Stock | | Class A | | Class B | | Stock |
| Balance at beginning of year | 53,758 | | | 1,002 | | | 4,937 | | | 53,170 | | | 1,002 | | | 4,138 | |
| Stock issued under stock investment plan | — | | | — | | | — | | | 475 | | | — | | | — | |
| Stock issued for compensation | 122 | | | — | | | — | | | 90 | | | — | | | — | |
| Acquisition of Class A shares | — | | | — | | | 325 | | | — | | | — | | | 615 | |
| Balance at end of period | |
| | Other share issuance | — | | | — | | | — | | | 22 | | | — | | | — | |
| | Balance at end of period | Balance at end of period | 53,880 | | | 1,002 | | | 5,262 | | | 53,757 | | | 1,002 | | | 4,753 | |
| | Balance at end of period | |
EARNINGS PER SHARE
The following table sets forth the computation of basic and diluted earnings (loss) per share.
| | | | | | | | | | | |
| Three Months Ended March 31, | 2024 | | 2023 |
| (In thousands, except per share amounts) | |
| Basic and diluted earnings per share: | | | |
| Numerator: | | | |
| Net income | $ | 4,542 | | | 4,872 | |
| Net income allocated to Class A common stock | $ | 4,542 | | | 4,872 | |
| | | |
| | | |
| | | |
| Denominator: | | | |
| Weighted average shares of Class A outstanding - basic | 49,564 | | | 49,840 | |
| Weighted average shares of Class A outstanding - diluted | 50,561 | | | 50,609 | |
| | | |
| | | |
| Basic and diluted earnings per share of Class A common stock | $ | 0.09 | | | 0.10 | |
| | | |
| | | |
| | | | | | | | | | | |
| | | |
| Three Months Ended September 30, | 2023 | | 2022 |
| (In thousands, except per share amounts) | |
| Basic and diluted earnings (loss) per share: | | | |
| Numerator: | | | |
| Net income (loss) | $ | 2,698 | | | 3,407 | |
| Net income (loss) allocated to Class A common stock | $ | 2,698 | | | 3,407 | |
| | | |
| | | |
| | | |
| Denominator: | | | |
| Weighted average shares of Class A outstanding - basic | 49,615 | | | 50,075 | |
| Weighted average shares of Class A outstanding - diluted | 50,522 | | | 50,799 | |
| | | |
| | | |
| Basic earnings (loss) per share of Class A common stock | $ | 0.06 | | | 0.07 | |
| Diluted earnings (loss) per share of Class A common stock | $ | 0.05 | | | 0.06 | |
| | | |
September 30, 2023 | 10-Q 35
| | | | | | | | |
CITIZENS, INC.
| NOTES TO CONSOLIDATED FINANCIAL STATEMENTS |
| | (Unaudited)
|
| | | | | | | | | | | |
| Nine Months Ended September 30, | 2023 | | 2022 |
| (In thousands, except per share amounts) | |
| Basic and diluted earnings (loss) per share: | | | |
| Numerator: | | | |
| Net income (loss) | $ | 13,696 | | | 12,348 | |
| Net income (loss) allocated to Class A common stock | $ | 13,696 | | | 12,348 | |
| | | |
| | | |
| | | |
| Denominator: | | | |
| Weighted average shares of Class A outstanding - basic | 49,739 | | | 50,203 | |
| Weighted average shares of Class A outstanding - diluted | 50,647 | | | 50,927 | |
| | | |
| | | |
| Basic earnings (loss) per share of Class A common stock | $ | 0.28 | | | 0.25 | |
| Diluted earnings (loss) per share of Class A common stock | 0.27 | | | 0.24 | |
| | | |
STATUTORY CAPITAL AND SURPLUS
Each of our regulated insurance subsidiaries is required to meet stipulated regulatory capital requirements. These include capital requirements imposed by the U.S. National Association of Insurance Commissioners ("NAIC") and the Bermuda Monetary Authority ("BMA"). All domestic insurance subsidiaries exceeded the minimum capital requirements at September 30, 2023.March 31, 2024. On March 27, 2024, Citizens and the Colorado Division of Insurance entered into
| | | | | | | | |
CITIZENS, INC. | NOTES TO CONSOLIDATED FINANCIAL STATEMENTS |
| | (Unaudited) |
a capital maintenance agreement that specifies that Citizens will infuse capital as needed to ensure that CICA Domestic's RBC remains above 350%. As CICA Domestic's RBC exceeded 350% at March 31, 2024, no capital contribution was necessary.
CICA PRInternational is a Puerto Rico domiciled company. The Insurance Code of Puerto Rico does not specifically set forth minimum capital and surplus standards, but rather requires that an insurer submit a business plan for approval to the Office of the Commissioner of Insurance ("OIC") that includes proposed minimum capital and surplus. CICA PRInternational is required to maintain a minimum of $750,000 in capital and maintain a premium to surplus ratio of 7 to 1. CICA PRInternational began issuing new business as of January 1, 2023 and received the transfer of all of CICA International'sBermuda's in force insurance business as of August 31, 2023. On that date, Citizens entered into a Keep Well Agreement with CICA PRInternational to replace the Keep Well Agreement that had been in place between Citizens and CICA International (Bermuda).Bermuda. The Keep Well Agreement requires Citizens to contribute up to $10 million in capital to CICA PRInternational as necessary to ensure that CICA PRInternational maintains at least either (i) 112% of its required ratio of premiums to capital and surplus, or (ii) 200% of the minimum capital and surplus requirement, whichever is higher. The initial term of the Keep Well Agreement is 12 months. Since CICA PR'sInternational's capital exceeds both of the metrics, Citizens is not required to make a capital contribution. Any capital that Citizens is required to contribute could negatively impact the Company's capital resources and liquidity.
(9) SEGMENT AND OTHER OPERATING INFORMATION
The Company has two reportable segments: Life Insurance and Home Service Insurance. Our Life Insurance segment issues endowment contracts, which are principally accumulation contracts that incorporate an element of life insurance protection, and ordinary whole life insurance to non-U.S. residents through CICA PR.International. These contracts are designed to provide a fixed amount of insurance coverage over the life of the insured and may utilize rider benefits to provide additional coverage and annuity benefits to enhance accumulations. CICA Domestic issues ordinary whole life, final expense, life products with living benefits, critical illness and credit life and credit disability policies throughout the U.S.
Our Home Service Insurance segment operates through our subsidiaries SPLIC, MGLIC and SPFIC, and focuses on the life insurance needs of the middle- and lower-income markets, primarily in Louisiana, Mississippi and Arkansas. Our policies are sold and serviced through funeral homes and independent agents who sell policies, collect premiums and service policyholders. Our Home Service Insurance segment also sold property insurance policies in Louisiana and Arkansas until operations were ceased effective June 30, 2023.
September 30, 2023 | 10-Q 36
| | | | | | | | |
CITIZENS, INC.
| NOTES TO CONSOLIDATED FINANCIAL STATEMENTS |
| | (Unaudited)
|
The Life Insurance and Home Service Insurance portions of the Company constitute separate businesses. In addition to the Life Insurance and Home Service Insurance businesses,business, the Company also operates other non-insurance portions of the Company ("Other Non-Insurance Enterprises"), which primarily include the Company’s IT and corporate-support functions.
The accounting policies of the reportable segments and Other Non-Insurance Enterprises are presented in accordance with U.S. GAAP and are the same as those described in the summary of significant accounting policies in our Form 10-K. The Company evaluates profit and loss performance based on U.S. GAAP net income (loss) before federal income taxes for its two reportable segments. The Company's Other Non-Insurance Enterprises isrepresents the only reportable difference between segments and consolidated operations. | | | | | | | | | | | | | | | | | | | | | | | |
| | | | | | | |
| Life Insurance | | Home Service Insurance | | Other Non-Insurance Enterprises | | Consolidated |
| Three Months Ended September 30, 2023 | | | |
| (In thousands) | | | |
| | | | | | | |
| Revenues: | | | | | | | |
| Premiums | $ | 31,148 | | | 10,878 | | | — | | | 42,026 | |
| Net investment income | 13,661 | | | 3,459 | | | 252 | | | 17,372 | |
| Investment related gains (losses), net | (424) | | | (370) | | | (98) | | | (892) | |
| Other income | 884 | | | — | | | — | | | 884 | |
| Total revenues | 45,269 | | | 13,967 | | | 154 | | | 59,390 | |
| Benefits and expenses: | | | | | | | |
| Insurance benefits paid or provided: | | | | | | | |
| Claims and surrenders | 32,419 | | | 5,304 | | | — | | | 37,723 | |
| Increase (decrease) in future policy benefit reserves | (5,587) | | | 1,707 | | | — | | | (3,880) | |
| Policyholder liability remeasurement (gain) loss | 840 | | | 184 | | | — | | | 1,024 | |
| Policyholders' dividends | 1,405 | | | 9 | | | — | | | 1,414 | |
| Total insurance benefits paid or provided | 29,077 | | | 7,204 | | | — | | | 36,281 | |
| Commissions | 5,406 | | | 4,038 | | | — | | | 9,444 | |
| Other general expenses | 6,036 | | | 4,293 | | | 1,620 | | | 11,949 | |
| Capitalization of deferred policy acquisition costs | (5,141) | | | (1,991) | | | — | | | (7,132) | |
| Amortization of deferred policy acquisition costs | 3,313 | | | 743 | | | — | | | 4,056 | |
| Amortization of cost of insurance acquired | 28 | | | 123 | | | — | | | 151 | |
| Total benefits and expenses | 38,719 | | | 14,410 | | | 1,620 | | | 54,749 | |
| Income (loss) before federal income tax | $ | 6,550 | | | (443) | | | (1,466) | | | 4,641 | |
September 30, 2023March 31, 2024 | 10-Q 3728
| | | | | | | | |
CITIZENS, INC. | NOTES TO CONSOLIDATED FINANCIAL STATEMENTS |
| | (Unaudited) |
| | Life Insurance | | | Life Insurance | | Home Service Insurance | | Other Non-Insurance Enterprises | | Consolidated |
| Three Months Ended March 31, 2024 | |
| (In thousands) | |
| (In thousands) | |
| (In thousands) | |
| | Life Insurance | | Home Service Insurance | | Other Non-Insurance Enterprises | | Consolidated |
| Nine Months Ended September 30, 2023 | |
| (In thousands) | |
| Revenues: | |
| | Revenues: | |
| | Revenues: | Revenues: | | | | | | | | | | |
| Premiums | Premiums | $ | 86,128 | | | 33,873 | | | — | | | 120,001 | |
| Net investment income | Net investment income | 40,470 | | | 10,379 | | | 838 | | | 51,687 | |
| Investment related gains (losses), net | Investment related gains (losses), net | (123) | | | (283) | | | (71) | | | (477) | |
| Other income | Other income | 2,619 | | | 1 | | | — | | | 2,620 | |
| Total revenues | Total revenues | 129,094 | | | 43,970 | | | 767 | | | 173,831 | |
| Benefits and expenses: | Benefits and expenses: | | | | | | | Benefits and expenses: | | | | | |
| Insurance benefits paid or provided: | Insurance benefits paid or provided: | | | | | | | | Insurance benefits paid or provided: | | | |
| Claims and surrenders | Claims and surrenders | 83,826 | | | 16,972 | | | — | | | 100,798 | |
| Increase (decrease) in future policy benefit reserves | Increase (decrease) in future policy benefit reserves | (9,270) | | | 3,468 | | | — | | | (5,802) | |
| Policyholder liability remeasurement (gain) loss | Policyholder liability remeasurement (gain) loss | 2,541 | | | 319 | | | — | | | 2,860 | |
| Policyholders' dividends | Policyholders' dividends | 3,761 | | | 22 | | | — | | | 3,783 | |
| Total insurance benefits paid or provided | Total insurance benefits paid or provided | 80,858 | | | 20,781 | | | — | | | 101,639 | |
| Commissions | Commissions | 14,930 | | | 12,410 | | | — | | | 27,340 | |
| Other general expenses | Other general expenses | 17,141 | | | 13,060 | | | 5,276 | | | 35,477 | |
| Capitalization of deferred policy acquisition costs | Capitalization of deferred policy acquisition costs | (13,958) | | | (6,076) | | | — | | | (20,034) | |
| Amortization of deferred policy acquisition costs | Amortization of deferred policy acquisition costs | 9,642 | | | 1,902 | | | — | | | 11,544 | |
| Amortization of cost of insurance acquired | Amortization of cost of insurance acquired | 86 | | | 379 | | | — | | | 465 | |
| Total benefits and expenses | Total benefits and expenses | 108,699 | | | 42,456 | | | 5,276 | | | 156,431 | |
| Income (loss) before federal income tax | Income (loss) before federal income tax | $ | 20,395 | | | 1,514 | | | (4,509) | | | 17,400 | |
September 30, 2023March 31, 2024 | 10-Q 3829
| | | | | | | | |
CITIZENS, INC. | NOTES TO CONSOLIDATED FINANCIAL STATEMENTS |
| | (Unaudited) |
| | | | | | | | | | | | | | | | | | | | | | | |
| Life Insurance | | Home Service Insurance | | Other Non-Insurance Enterprises | | Consolidated |
| Three Months Ended September 30, 2022 | | | |
| (In thousands) | | | |
| | | | | | | |
| Revenues: | | | | | | | |
| Premiums | $ | 31,696 | | | 12,179 | | | — | | | 43,875 | |
| Net investment income | 12,806 | | | 3,527 | | | 271 | | | 16,604 | |
| Investment related gains (losses), net | (4,367) | | | (462) | | | (162) | | | (4,991) | |
| Other income | 682 | | | — | | | 6 | | | 688 | |
| Total revenues | 40,817 | | | 15,244 | | | 115 | | | 56,176 | |
| Benefits and expenses: | | | | | | | |
| Insurance benefits paid or provided: | | | | | | | |
| Claims and surrenders | 24,742 | | | 5,987 | | | — | | | 30,729 | |
| Increase (decrease) in future policy benefit reserves | 426 | | | 227 | | | — | | | 653 | |
| Policyholder liability remeasurement (gain) loss | (445) | | | 841 | | | — | | | 396 | |
| Policyholders' dividends | 1,382 | | | 7 | | | — | | | 1,389 | |
| Total insurance benefits paid or provided | 26,105 | | | 7,062 | | | — | | | 33,167 | |
| Commissions | 5,103 | | | 4,107 | | | — | | | 9,210 | |
| Other general expenses | 6,016 | | | 4,228 | | | 1,315 | | | 11,559 | |
| Capitalization of deferred policy acquisition costs | (4,592) | | | (1,780) | | | — | | | (6,372) | |
| Amortization of deferred policy acquisition costs | 3,081 | | | 543 | | | — | | | 3,624 | |
| Amortization of cost of insurance acquired | 32 | | | 134 | | | — | | | 166 | |
| Total benefits and expenses | 35,745 | | | 14,294 | | | 1,315 | | | 51,354 | |
| Income (loss) before federal income tax | $ | 5,072 | | | 950 | | | (1,200) | | | 4,822 | |
September 30, 2023 | 10-Q 39
Table of Contents | | | | | | | | | | | | | | | | | | | | | | | |
| Life Insurance | | Home Service Insurance | | Other Non-Insurance Enterprises | | Consolidated |
| Three Months Ended March 31, 2023 | | | |
| (In thousands) | | | |
| | | | | | | |
| Revenues: | | | | | | | |
| Premiums | $ | 26,207 | | | 12,042 | | | — | | | 38,249 | |
| Net investment income | 13,311 | | | 3,470 | | | 293 | | | 17,074 | |
| Investment related gains (losses), net | (437) | | | 99 | | | 50 | | | (288) | |
| Other income | 879 | | | — | | | — | | | 879 | |
| Total revenues | 39,960 | | | 15,611 | | | 343 | | | 55,914 | |
| Benefits and expenses: | | | | | | | |
| Insurance benefits paid or provided: | | | | | | | |
| Claims and surrenders | 24,439 | | | 5,860 | | | — | | | 30,299 | |
| Increase (decrease) in future policy benefit reserves | (1,820) | | | 842 | | | — | | | (978) | |
| Policyholder liability remeasurement (gain) loss | 816 | | | 64 | | | — | | | 880 | |
| Policyholders' dividends | 1,101 | | | 7 | | | — | | | 1,108 | |
| Total insurance benefits paid or provided | 24,536 | | | 6,773 | | | — | | | 31,309 | |
| Commissions | 4,759 | | | 4,254 | | | — | | | 9,013 | |
| Other general expenses | 5,459 | | | 4,468 | | | 1,333 | | | 11,260 | |
| Capitalization of deferred policy acquisition costs | (4,360) | | | (1,998) | | | — | | | (6,358) | |
| Amortization of deferred policy acquisition costs | 3,162 | | | 652 | | | — | | | 3,814 | |
| Amortization of cost of insurance acquired | 32 | | | 129 | | | — | | | 161 | |
| Total benefits and expenses | 33,588 | | | 14,278 | | | 1,333 | | | 49,199 | |
| Income (loss) before federal income tax | $ | 6,372 | | | 1,333 | | | (990) | | | 6,715 | |
| | | | | | | | |
CITIZENS, INC.
| NOTES TO CONSOLIDATED FINANCIAL STATEMENTS |
| | (Unaudited)
|
| | | | | | | | | | | | | | | | | | | | | | | |
| Life Insurance | | Home Service Insurance | | Other Non-Insurance Enterprises | | Consolidated |
| Nine Months Ended September 30, 2022 | | | |
| (In thousands) | | | |
| | | | | | | |
| Revenues: | | | | | | | |
| Premiums | $ | 88,461 | | | 37,002 | | | — | | | 125,463 | |
| Net investment income | 37,124 | | | 10,054 | | | 805 | | | 47,983 | |
| Investment related gains (losses), net | (8,644) | | | (1,629) | | | (316) | | | (10,589) | |
| Other income | 2,403 | | | 1 | | | 6 | | | 2,410 | |
| Total revenues | 119,344 | | | 45,428 | | | 495 | | | 165,267 | |
| Benefits and expenses: | | | | | | | |
| Insurance benefits paid or provided: | | | | | | | |
| Claims and surrenders | 67,768 | | | 18,492 | | | — | | | 86,260 | |
| Increase (decrease) in future policy benefit reserves | 4,808 | | | (311) | | | — | | | 4,497 | |
| Policyholder liability remeasurement (gain) loss | 549 | | | 1,182 | | | — | | | 1,731 | |
| Policyholders' dividends | 4,241 | | | 16 | | | — | | | 4,257 | |
| Total insurance benefits paid or provided | 77,366 | | | 19,379 | | | — | | | 96,745 | |
| Commissions | 13,701 | | | 12,106 | | | — | | | 25,807 | |
| Other general expenses | 17,065 | | | 12,093 | | | 3,831 | | | 32,989 | |
| Capitalization of deferred policy acquisition costs | (12,205) | | | (5,132) | | | — | | | (17,337) | |
| Amortization of deferred policy acquisition costs | 9,051 | | | 1,600 | | | — | | | 10,651 | |
| Amortization of cost of insurance acquired | 94 | | | 352 | | | — | | | 446 | |
| Total benefits and expenses | 105,072 | | | 40,398 | | | 3,831 | | | 149,301 | |
| Income (loss) before federal income tax | $ | 14,272 | | | 5,030 | | | (3,336) | | | 15,966 | |
September 30, 2023 | 10-Q 40
| | | | | | | | |
CITIZENS, INC.
| NOTES TO CONSOLIDATED FINANCIAL STATEMENTS |
| | (Unaudited)
|
(10) INCOME TAXES
The effective tax rate is the ratio of tax expense (benefit) over pre-tax income (loss).income. The effective tax rate was 41.9% and 21.3%7.8% for the three and nine months ended September 30, 2023,March 31, 2024, compared to 29.3% and 22.7%27.4% for the same periodsperiod in 2022,2023, respectively. CICA InternationalBermuda and CICA PRInternational are considered controlled foreign corporations for federal income tax purposes. As a result, the insurance activity of CICA InternationalBermuda and CICA PRInternational are subject to Subpart F of the Internal Revenue Code and are included in Citizens’ taxable income. Due to the 0% enacted tax rate in Bermuda, there are no deferred taxes recorded for CICA International'sBermuda's temporary differences. CICA PR has applied forThe Government of Puerto Rico approved a tax exemption decree from the Government of Puerto Ricofor CICA International which will freezefreezes the income tax rate at 0% on taxable earnings up to $1.2 million and 4% on any taxable earnings in excess of $1.2 million.million for a minimum of 15 years. The effective tax rate varies from the prevailing corporate federal income tax rate of 21.0% mainly due to the impact of Subpart F and uncertain tax positions.
As a result of the AugustAt March 31, 2023 transfer of CICA International's in force business to CICA PR, the Company's consolidated deferred federal income tax liability was reduced by $4.3 million due to the difference in the tax rates in the jurisdictions in which the companies operate. Since the transfer was between companies under common control, the $4.3 million reduction in the deferred federal income tax liability was recorded as a credit to equity, $1.3 million of which increased retained earnings2024 and $3.0 million of which reduced accumulated other comprehensive income (loss), based on the nature of the tax components.
At September 30, 2023, we determined it was more likely than not that a portion of our capital deferred tax assets would not be realized in their entirety. The Company recorded a valuation allowanceallowances of $6.2$4.6 million and $3.7 million, respectively, through Other Comprehensive Income (Loss).
September 30, 2023March 31, 2024 | 10-Q 4130
| | | | | | | | |
CITIZENS, INC. | NOTES TO CONSOLIDATED FINANCIAL STATEMENTS |
| | (Unaudited) |
(11) OTHER COMPREHENSIVE INCOME (LOSS)
The changes in the components of other comprehensive income (loss) are reported net of the effects of income taxes of 21% for domestic entities domiciled in the United States and 4% for entities domiciled in Puerto RicoRican entities for the three and nine months ended September 30,March 31, 2024 and 2023, and 2022, as indicated below.
| | Three Months Ended September 30, | 2023 | | 2022 |
| | Three Months Ended March 31, | |
| | Three Months Ended March 31, | |
| | Three Months Ended March 31, | | 2024 | | 2023 |
| (In thousands) | (In thousands) | Amount | | Tax Effect | | Total | | Amount | | Tax Effect | | Total | (In thousands) | Amount | | Tax Effect | | Total | | Amount | | Tax Effect | | Total |
| Unrealized gains (losses): | Unrealized gains (losses): | | | | | | |
| Unrealized holding gains (losses) arising during the period | Unrealized holding gains (losses) arising during the period | $ | (59,817) | | | 8,717 | | | (51,100) | | | (88,382) | | | 398 | | | (87,984) | |
| Reclassification adjustment for losses (gains) included in net income (loss) | 419 | | | (88) | | | 331 | | | 43 | | | (9) | | | 34 | |
| Unrealized holding gains (losses), net | (59,398) | | | 8,629 | | | (50,769) | | | (88,339) | | | 389 | | | (87,950) | |
| Change in current discount rate for liability for future policy benefits | 60,054 | | | (7,589) | | | 52,465 | | | 73,214 | | | (205) | | | 73,009 | |
| Other comprehensive income (loss) | $ | 656 | | | 1,040 | | | 1,696 | | | (15,125) | | | 184 | | | (14,941) | |
| | Nine Months Ended September 30, | 2023 | | 2022 |
| (In thousands) | Amount | | Tax Effect | | Total | | Amount | | Tax Effect | | Total |
| Unrealized gains (losses): | | | | | | |
| Unrealized holding gains (losses) arising during the period | Unrealized holding gains (losses) arising during the period | $ | (36,811) | | | 7,548 | | | (29,263) | | | (340,678) | | | 13,790 | | | (326,888) | |
| Reclassification adjustment for losses (gains) included in net income (loss) | 481 | | | (101) | | | 380 | | | 78 | | | (16) | | | 62 | |
| Unrealized holding gains (losses) arising during the period | |
| Reclassification adjustment for losses (gains) included in net income | |
| Unrealized holding gains (losses), net | Unrealized holding gains (losses), net | (36,330) | | | 7,447 | | | (28,883) | | | (340,600) | | | 13,774 | | | (326,826) | |
| Change in current discount rate for liability for future policy benefits | Change in current discount rate for liability for future policy benefits | 45,825 | | | (6,565) | | | 39,260 | | | 345,258 | | | (19,936) | | | 325,322 | |
| | Other comprehensive income (loss) | Other comprehensive income (loss) | $ | 9,495 | | | 882 | | | 10,377 | | | 4,658 | | | (6,162) | | | (1,504) | |
| Other comprehensive income (loss) | |
| Other comprehensive income (loss) | |
(12) RELATED PARTY TRANSACTIONS
The Company has various routine related party transactions in conjunction with our holding company structure, such as a management service agreement related to costs incurred, a tax sharing agreement between entities, and inter-company dividends and capital contributions. There were no changes related to these relationships during the ninethree months ended September 30, 2023March 31, 2024 except as described in Note 1.1. Financial Statements under Basis of Presentation and Consolidation. See our Form 10-K for a comprehensive discussion of related party transactions.
(13) SUBSEQUENT EVENTS
The Company has evaluated the impact of subsequent events as defined by the accounting guidance through the date this report was issued and determined that no other significant subsequent events need to be recognized or disclosed at this time.
September 30, 2023March 31, 2024 | 10-Q 4231
| | | | | | | | |
| CITIZENS, INC. | MANAGEMENT'S DISCUSSION & ANALYSIS |
| | |
Item 2. MANAGEMENT'S DISCUSSION AND ANALYSIS OF FINANCIAL CONDITION AND RESULTS OF OPERATIONS
FORWARD-LOOKING STATEMENTS
This section and other parts of this Quarterly Report on Form 10-Q ("Form 10-Q") contain forward-looking statements, within the meaning of the Private Securities Litigation Reform Act of 1995, that involve risks and uncertainties. Forward-looking statements provide current expectations of future events based on certain assumptions and include any statement that does not directly relate to any historical or current fact. Forward-looking statements can also be identified by words such as “future,” “anticipates,” “believes,” “estimates,” “expects,” “intends,” “plans,” “predicts,” “will,” “would,” “could,” “can,” “may,” and similar terms. Forward-looking statements are not guarantees of future performance and the Company’s actual results may differ significantly from the results discussed in the forward-looking statements. These forward-looking statements are subject to a number of risks, uncertainties and assumptions including those factors discussed in the "Risk Factors" contained in our Annual Report on Form 10-K for the year ended December 31, 2022 and Quarterly Reports on Form 10-Q for the quarters ended March 31, 2023 and June 30, 2023, which areis incorporated herein by reference.
The following discussion should be read in conjunction with the consolidated financial statements and accompanying notes included in Part I, Item 1 of this Form 10-Q. The Company assumes no obligation to revise or update any forward-looking statements for any reason, except as required by law.
The U.S. Securities and Exchange Commission ("SEC") maintains a website that contains reports, proxy and information statements, and other information regarding issuers, including the Company, that file electronically with the SEC. The public can obtain any documents that the Company files with the SEC at http://www.sec.gov. We also make available, free of charge, through our website (http://www.citizensinc.com), our Annual Report on Form 10-K, Quarterly Reports on Form 10-Q, Current Reports on Form 8-K, Section 16 Reports filed by officers and directors, news releases, and, if applicable, amendments to those reports filed or furnished pursuant to Section 13(a) or 15(d) of the Securities Exchange Act of 1934, as soon as reasonably practicable after we electronically file such reports with, or furnish such reports to, the SEC. We are not including any of the information contained on our website as part of, or incorporating it by reference into, this Form 10-Q.
OVERVIEW
For almost 5055 years, we have been fulfilling the needs of our policyholders and their families by providing insurance products that offer both living and death benefits. Citizens operatesconducts insurance related operations through its insurance subsidiaries, located in the United States, including Puerto Rico, and provideswhich provide benefits to policyholders located throughout the United States and in over 75 different countries. We specialize in offering primarily ordinary whole life insurance, endowment products and final expense insurance in niche markets where we believe we can optimize our competitive position.
As an insurance provider, we collect premiums on an ongoing basis from our policyholders and invest the majority of the premiums to pay future benefits, including claims, and surrenders and policyholder dividends. Accordingly, the Company derives its revenues principally from: (1) life insurance premiums earned for insurance coverages provided to insureds in our two operating segments – Life Insurance and Home Service Insurance; and (2) net investment income. In addition to paying and reserving for insurance benefits that we pay to our policyholders, our expenses consist primarily of the costs of selling our insurance products (e.g., commissions, underwriting, marketing expenses), operating expenses and income taxes.
Objective of our Management's Discussion and Analysis
We refer to our Management’s Discussion and Analysis of Financial Condition and Results of Operations as our “MD&A”. The objective of our MD&A is to provide investors with information in order to assess the material changes in our financial condition from December 31, 20222023 to September 30, 2023March 31, 2024 and the material changes in our results of operations for the three and nine months ended September 30, 2023March 31, 2024 as compared to the same periodsperiod in 2022.2023. We also discuss in the MD&A any trends that we believe may materially affect our future operations or financial condition. Prior year amounts have been revised to reflect the implementation ASU 2018-12 as noted in Part I, Item
September 30, 2023March 31, 2024 | 10-Q 4332
| | | | | | | | |
| CITIZENS, INC. | MANAGEMENT'S DISCUSSION & ANALYSIS |
| | |
The Factors that Drive our Operating Results
We see the following as the primary factors that drive our operating results:
•Sales (i.e., premium revenues)
•Investments
•Claims and surrenders
•Operating expenses
Premium revenues and investment income are our two primary sources of income and thus key to our profitability.
Premium revenues consist of bothall money deposited by customers into new and existing insurance policies. We believe sales which leadstatistics are meaningful to first year premiums,gaining an understanding of, among other things, the attractiveness of our new products, how expansion of our distribution channels affects our revenue, customer retention and "resells" (i.e., retaining the policy), which leadperformance of our business from period-to-period. Throughout the MD&A, we describe the actions and initiatives that we are taking to renewal premiums.increase sales and improve retention, sales performance in each period and as compared to prior periods, and how we view trends with respect to sales and retention. Because we ceased operations in our property insurance business effective June 30, 2023, the premiums charts below only reflect life insurance and accident and health insurance ("A&H") premium results.
Our first year life and A&H premiums increased in the three and nine months ended September 30, 2023 by 15% due primarily to new products available for sale in both segments supported by focused marketing campaigns.
In the last 2 years, we have received 9 new state licenses, developed new final expense and living benefit products, and entered into new white label and other distribution agreements, leading to an increase in first year premiums (i.e., new sales) of 42% from 2023 to 2024.
Our renewal life and A&H premium revenues decreased in the three and nine months ended September 30, 2023 by 3% and 4%, respectively,March 31, 2024 decreased slightly primarily due to the impact of a higher level of surrenders and matured endowments during the last few years (i.e., fewer(and thus a lower amount of policies from which to collectpaying renewal premiums). and from matured endowment benefits, which we expected due to contractual expiration dates.
September 30, 2023March 31, 2024 | 10-Q 4433
| | | | | | | | |
| CITIZENS, INC. | MANAGEMENT'S DISCUSSION & ANALYSIS |
| | |
Our net investment income increased for the three and nine months ended September 30, 2023March 31, 2024 by 5% and 8%, respectively,2% compared to the same prior year periodsperiod due primarily to a higher average portfolio yield resulting from the higher interest rate environment and investment income from our limited partnership investments.investments and a growing diversified invested asset base.
Payment of policyholder benefits for claims and surrenders is our largest expense and thus also key to our profitability. The three mainlargest components of this expense are reflected in the graphs above. In the three and nine months ended September 30, 2023March 31, 2024 compared to the prior year periods:period:
•Death claim benefits decreasedincreased due to a lower number of reported death claims.the increase in policies issued over the last few years.
•Surrenders increased, whichdecreased slightly as we believe is duecontinue to the number of our international life policies that are nearing maturity as well as policies that have passed their surrender charge period.focus on retention efforts.
•Matured endowments increased as expected due to many of our endowment policies reaching their contractual maturity dates.
Operating expenses are our second largest expense and thus also drive our operating results. Our general operating expenses for the three months ended March 31, 2024 increased slightly compared to the prior year period as we continue to invest in the growth of our business.
September 30, 2023March 31, 2024 | 10-Q 4534
| | | | | | | | |
| CITIZENS, INC. | MANAGEMENT'S DISCUSSION & ANALYSIS |
| | |
Operating expenses are our second largest expense and thus also drive our operating results. Our general operating expenses for the three and nine months ended September 30, 2023 increased compared to the prior year periods. The increase was primarily driven by costs related to strategic growth initiatives and costs related to moving our international business from Bermuda to Puerto Rico. The transfer of the international business was completed on August 31, 2023.
FINANCIAL HIGHLIGHTS
Our net income was $2.7decreased from $4.9 million and $13.7 million for the three and nine months ended September 30, 2023, respectively, compared to net income of $3.4 million and $12.3 million in the prior year periods, respectively. The increase in net income for the nine months ended September 30, 2023 is primarily driven by the improvements in the fair value of our limited partnership investments, which are recorded as investment related gains (losses) in our financial statements, as well as higher net investment income in the current year period. These improvements were partially offset by lower renewal year premiums in our life insurance business, lower property insurance premiums due to ceasing this line of business on June 30, 2023, higher general operating expenses and higher insurance benefits paid or provided, which as explained above is primarily due to higher surrenders and matured endowments.
Net revenue in the three months ended September 30,March 31, 2023 improved as compared to $4.5 million in the three months ended September 30, 2022 for the same reasons as described above, however,March 31, 2024. Total revenues increased by $1.8 million due primarily to higher life insurance premium revenue, higher investment related gains and losses and higher net investment income. We also had a $1.5 million reduction in federal income tax expense. This was more than offset by total benefits and expenses, which increased by $3.6 million due primarily to $3.5 million of higher death claims and matured endowment benefits paid. We also incurred $1.4 million in the period was negatively impacted by $1.2 million lower property insurance premiumshigher commissions paid due to nothe large increase in first year sales, in the quarter versus the prior year quarter. Both current-year periods were negatively impacted bywhich have a higher policyholder remeasurement losses primarily due to unfavorable surrender experience in the Life Insurance segment.commission rate than renewal sales.
Our basic net income per share of Class A common stock was $0.06 and $0.28$0.09 for the three and nine months ended September 30, 2023,March 31, 2024, respectively, compared to $0.07 and $0.25$0.10 in prior year periods.period.
Financial Condition at September 30, 2023March 31, 2024
•Total assets of $1.6$1.7 billion
•Total investments of $1.3$1.4 billion; fixed maturity securities comprised 87%88% of total investments
•$4.85.0 billion of direct insurance in force
September 30, 2023 | 10-Q 46
| | | | | | | | |
CITIZENS, INC. | MANAGEMENT'S DISCUSSION & ANALYSIS |
| | |
•No debt
•Fully diluted income per share of Class A common stock of $0.27$0.09
•Book value per share of Class A common stock of $3.08.$3.94
EVENTS THAT IMPACTED OUR BUSINESS
From time-to-time, certain events may affect our business in ways that cause current or future results to differ from past results. In addition to factors described in See Part II, Item 1A, 7 - "Management's Discussion and Analysis of Financial Condition and Results of Operations - Events that Impacted Our Business" in our "Risk Factors"Annual Report on 10-K, for the followingperiod ended December 31, 2023 for a discussion of certain events maythat have impacted and continue to impact our results of operations or financial condition:
INFLATION
The impact of inflation, which has led to market volatility starting in early 2022, has affected the fair value of our equity securities, leading to investment related losses in 2022 and the three and nine months ended September 30, 2023. Investment related gains and losses can cause significant fluctuations from period to period and are not indicative of our operating results. We believe that investment related gains and losses, whether realized from dispositions or unrealized from changes in market prices of equity securities, have no bearing in understanding our reported results or in evaluating the economic performance of our business.These gains and losses have caused, and we believe will continue to cause, significant volatility in our periodic earnings.
We could experience higher surrenders and lapses and fewer sales as our policyholders conserve cash due to concerns overbusiness, including inflation and rising costs, particularly in our Home Service Insurance segment, whose customer base is primarily middle- and lower-income individuals.
RISING INTEREST RATES
Interest rates began to rise significantly in 2022 after being ultra-low for almost a decade, and have continued to rise in 2023. Higher interest rates typically reduce the market values of fixed income assets, as the interest payments on existing fixed income assets become less competitive relative to newer higher rate fixed income instruments. Because of this, we reported pre-tax net unrealized losses of $238.0 million on our available-for-sale securities at September 30, 2023. This compares to pre-tax net unrealized losses of $201.7 million at December 31, 2022, with the year-over-year change primarily driven by market interest rates. However, because we strive to match our asset duration to our liability duration, as a life insurer, the vast majority of our total investments are invested in longer-term fixed maturity securities and we expect the market values to recover prior to the maturity dates of most of these investments.
Another impactvolatility, rising interest rates may have on our business is that policyholders may surrender their policies in order to utilize the cash values to seek higher crediting rates through other types of investments.
CEASING OPERATIONS OF OUR PROPERTY INSURANCE BUSINESS
The Company made a strategic decision to exit the property insurance business on June 30, 2023. This business focused on selling limited liability property insurance policies in Louisiana and Arkansas. This decision has negatively impacted our current year premium revenues and financial results. We are contractually obligated to pay the majority of the remaining premiums for our catastrophic reinsurance through the end of 2023. Because we ceasedceasing operations at the end of the second quarter, the property insurance premium amounts reflected in our income statements for the nine months ended September 30, 2023 reflect the remaining amount due of $0.7 million under the reinsurance contract for 2023. Additionally, we did not collect premiums in the third quarter of 2023, as we did in the third quarter of 2022. Accordingly, property premium revenue is less for the three and nine months ended September 30, 2023 compared to the prior year periods.
The property insurance business operates through SPFIC and represented less than 1% of the Company’s total consolidated assets as of September 30, 2023 and less than 1% of the Company's total consolidated revenues for the nine months ended September 30, 2023. The cessation of this business is not reported as a discontinued
September 30, 2023 | 10-Q 47
| | | | | | | | |
CITIZENS, INC. | MANAGEMENT'S DISCUSSION & ANALYSIS |
| | |
operation because it is immaterial to our total operations. Additionally, there were no material charges incurred in relation to the exit of our property insurance operations.business.
OUR OPERATING SEGMENTS
We manage our business in two operating segments: Life Insurance and Home Service Insurance.
Our insurance operations are the primary focus of the Company, as these operations generate most of our income. See the discussion under Segment Operations below for detailed analysis. The amount of insurance,
| | | | | | | | |
| CITIZENS, INC. | MANAGEMENT'S DISCUSSION & ANALYSIS |
| | |
number of policies, and average face amounts for ordinary life policies issued during the periods indicated are shown below.
| | Nine Months Ended September 30, | | 2023 | | 2022 |
| Three Months Ended March 31, | | Three Months Ended March 31, | | 2024 | | | | 2023 |
| | | Amount of
Insurance
Issued | | Number of
Policies
Issued | | Average Policy
Face Amount
Issued | | Amount of
Insurance
Issued | | Number of
Policies
Issued | | Average Policy
Face Amount
Issued | | Amount of
Insurance
Issued | | Number of
Policies
Issued | | Average Policy
Face Amount
Issued | | Amount of
Insurance
Issued | | Number of
Policies
Issued | | Average Policy
Face Amount
Issued |
| Ordinary Life Policies: | Ordinary Life Policies: | |
| Life Insurance | $ | 277,867,815 | | | 3,481 | | | $ | 79,824 | | | $ | 253,040,853 | | | 3,022 | | | $ | 83,733 | |
| Life Insurance: | |
| Life Insurance: | |
| Life Insurance: | |
| International | |
| International | |
| International | |
| Domestic | |
| Total Life Insurance | |
| Home Service Insurance | Home Service Insurance | 226,307,076 | | | 17,501 | | | 12,931 | | | 205,218,816 | | | 21,045 | | | 9,751 | |
| Total | Total | $ | 504,174,891 | | | 20,982 | | | $ | 458,259,669 | | | 24,067 | | |
As we previously disclosed, our strategic initiatives include the introduction of new products tailored to our specific markets.markets and expansion of our distribution channels both domestically and internationally. These new products and distribution channels helped drive the 10%61% increase in total insurance issued in the ninethree months ended September 30, 2023,March 31, 2024, from $458.3$170.3 million in the first ninethree months of 20222023 to $504.2$274.5 million in 2023. Both of our segments experienced an increase in insurance issued with a higher number of policies issued in our Life Insurance segment and higher policy face amounts issued in our Home Service Insurance segment.2024.
The growth in our Life Insurance segment is primarily attributable to strong sales of our new domestic final expense products, which accounted for the majority of the insurance issued through March 31, 2024. The Life Insurance segment also benefited from sales from the international whole life product introduced in 2022, which accounted for 68%67% of total insurance issued internationally in this segment for the ninethree months ended September 30, 2023. The LifeMarch 31, 2024.
Insurance issued in our Home Service Insurance segment also benefited fromdecreased for the three months ended March 31, 2024 compared to prior year period as we continue to make changes to our agents' compensation structures to improve the quality of sales in this segment and believe the impact of inflation has affected new white label partnershipssales since the customer demographic is primarily middle- and final expense products introduced domestically, which accounted for over 18% of the number of policies issued.
September 30, 2023March 31, 2024 | 10-Q 4836
| | | | | | | | |
| CITIZENS, INC. | MANAGEMENT'S DISCUSSION & ANALYSIS |
| | |
CONSOLIDATED RESULTS OF OPERATIONS
A discussion of consolidated results is presented below, followed by a discussion of segment operations and financial results by segment.
REVENUES
Our revenues are generated primarily by insurance renewal premiums and investment income from invested assets.
| | Three Months Ended | | Nine Months Ended |
| September 30, | | September 30, |
| | | Three Months Ended | |
| | | Three Months Ended | |
| | | Three Months Ended | |
| | | March 31, | | | | | March 31, |
| (In thousands) | (In thousands) | 2023 | | 2022 | | 2023 | | 2022 | (In thousands) | | | | | 2024 | | 2023 |
| | Revenues: | |
| Revenues: | |
| Revenues: | Revenues: | | | | | | | | | | | | | | |
| Premiums: | Premiums: | | | | | | | | Premiums: | | | | | | | |
| Life insurance | Life insurance | $ | 41,794 | | | 42,423 | | | 118,020 | | | 120,930 | |
| Accident and health insurance | Accident and health insurance | 296 | | | 299 | | | 1,201 | | | 865 | |
| Property insurance | Property insurance | (64) | | | 1,153 | | | 780 | | | 3,668 | |
| Net investment income | Net investment income | 17,372 | | | 16,604 | | | 51,687 | | | 47,983 | |
| Investment related gains (losses), net | Investment related gains (losses), net | (892) | | | (4,991) | | | (477) | | | (10,589) | |
| Other income | Other income | 884 | | | 688 | | | 2,620 | | | 2,410 | |
| Total revenues | Total revenues | $ | 59,390 | | | 56,176 | | | 173,831 | | | 165,267 | |
Premium Income. DespiteTotal revenues increased in March 31, 2024, as we had higher first year premium revenues in both segments, life insurance premium revenues decreasedpremiums, investment related gains, compared to losses in the threesame period in 2023, and nine months ended September 30, 2023 compared to the same periods in 2022 due to lower renewal premiums. Accident and health insurance premiums increased for the nine months ended September 30, 2023 due to sales of our new critical illness products that were launched in late 2022. Property insurance premiums were negatively impacted for the three and nine months ended September 30, 2023 compared to the same periods in 2022 as wehigher net investment income. The Company stopped accepting renewal premiums for property insurance at the end of May and ceased our operations on June 30, 2023.
| | | | | | | | | | | |
| Three Months Ended |
| March 31, |
| (In thousands) | 2024 | | 2023 |
| Premiums: | | | |
| First year | $ | 5,931 | | | 4,206 | |
| Renewal | 32,742 | | | 34,043 | |
| Total premiums | $ | 38,673 | | | 38,249 | |
September 30, 2023March 31, 2024 | 10-Q 4937
| | | | | | | | |
| CITIZENS, INC. | MANAGEMENT'S DISCUSSION & ANALYSIS |
| | |
Net Investment Income. A summary of our net investment income and annualized net investment income performance are summarized as follows:
| | Three Months Ended | | Nine Months Ended |
| September 30, | | September 30, |
| | | Three Months Ended | |
| | | Three Months Ended | |
| | | Three Months Ended | |
| | | March 31, | | | | | March 31, |
| (In thousands, except for %) | (In thousands, except for %) | 2023 | | 2022 | | 2023 | | 2022 | (In thousands, except for %) | | | | | 2024 | | 2023 |
| | Gross investment income: | |
| Gross investment income: | |
| Gross investment income: | Gross investment income: | | | | | | | | | | | | | | |
| Fixed maturity securities | Fixed maturity securities | $ | 15,005 | | | 14,994 | | | 44,956 | | | 43,136 | |
| Equity securities | Equity securities | 127 | | | 158 | | | 451 | | | 453 | |
| Policy loans | Policy loans | 1,478 | | | 1,535 | | | 4,531 | | | 4,641 | |
| Long-term investments | Long-term investments | 1,249 | | | 505 | | | 3,261 | | | 1,604 | |
| Other investment income | Other investment income | 166 | | | 87 | | | 430 | | | 139 | |
| Total investment income | Total investment income | 18,025 | | | 17,279 | | | 53,629 | | | 49,973 | |
| Investment expenses | Investment expenses | (653) | | | (675) | | | (1,942) | | | (1,990) | |
| Net investment income | Net investment income | $ | 17,372 | | | 16,604 | | | 51,687 | | | 47,983 | |
| | | Net investment income, annualized | Net investment income, annualized | | $ | 68,916 | | | 63,977 | |
| | Net investment income, annualized | |
| | Net investment income, annualized | |
| Average invested assets, at amortized cost | Average invested assets, at amortized cost | | $ | 1,520,389 | | | 1,482,651 | |
| Annualized yield on average invested assets | Annualized yield on average invested assets | | 4.53 | % | | 4.30 | % | Annualized yield on average invested assets | | | | | 4.59 | % | | 4.50 | % |
Due to insurance regulations, fixed maturity securities constitute the vast majority, or 87%88%, of our investment portfolio based on fair value and thus provide the vast majority of our investment income. Our total investment income increased by 4% and 7%2% for the three and nine months ended September 30, 2023, respectively,March 31, 2024 compared to the same periodsperiod in 2022,2023, primarily due to a higher average portfolio yield on our fixed maturity securities in the current period. Long-term investment income increased as our private equity investment asset base grew. Our yield increased 23 basis points to 4.53% in the nine months of 2023 compared to the prior year period due to investing in the rising interest rate environment.
Investment Related Gains (Losses), Net. We recorded investment related lossesgains during the three and nine months ended September 30, 2023March 31, 2024 of $0.9 million and $0.5$1.0 million compared to losses of $5.0 million and $10.6$0.3 million during the same prior year periods.period. As described above, the gains and losses are primarily related to the fair value change of our limited partnership and equity securities investments, mostly in our Life Insurance segment, due to the volatility in equity markets over the past year. We did not sell these investments; however, the changes in fair values of our equity securities are reflected as investment related gains or losses in our income statement, in addition to executed transactions that result in a gain or loss.
Other Income. Other income consists primarily of supplemental contracts issued to policyholders in our Life Insurance segment upon the surrender or maturity of their original policies.
September 30, 2023March 31, 2024 | 10-Q 5038
| | | | | | | | |
| CITIZENS, INC. | MANAGEMENT'S DISCUSSION & ANALYSIS |
| | |
BENEFITS AND EXPENSES | | | | Three Months Ended | | Nine Months Ended |
| | September 30, | | September 30, |
| | | | | Three Months Ended |
| | | March 31, | | | | | March 31, |
| (In thousands) | (In thousands) | 2023 | | 2022 | | 2023 | | 2022 | (In thousands) | | | | | 2024 | | 2023 |
| | | |
| Benefits and expenses: | |
| Benefits and expenses: | |
| Benefits and expenses: | Benefits and expenses: | | | | | | | | | | | | | | |
| Insurance benefits paid or provided: | Insurance benefits paid or provided: | | | | | | | | Insurance benefits paid or provided: | | | | | | | |
| Claims and surrenders | Claims and surrenders | $ | 37,723 | | | 30,729 | | | 100,798 | | | 86,260 | |
| Increase (decrease) in future policy benefit reserves | Increase (decrease) in future policy benefit reserves | (3,880) | | | 653 | | | (5,802) | | | 4,497 | |
| Policyholder liability remeasurement (gain) loss | Policyholder liability remeasurement (gain) loss | 1,024 | | | 396 | | | 2,860 | | | 1,731 | |
| Policyholders' dividends | Policyholders' dividends | 1,414 | | | 1,389 | | | 3,783 | | | 4,257 | |
| Total insurance benefits paid or provided | Total insurance benefits paid or provided | 36,281 | | | 33,167 | | | 101,639 | | | 96,745 | |
| Commissions | Commissions | 9,444 | | | 9,210 | | | 27,340 | | | 25,807 | |
| Other general expenses | Other general expenses | 11,949 | | | 11,559 | | | 35,477 | | | 32,989 | |
| Capitalization of deferred policy acquisition costs | Capitalization of deferred policy acquisition costs | (7,132) | | | (6,372) | | | (20,034) | | | (17,337) | |
| Amortization of deferred policy acquisition costs | Amortization of deferred policy acquisition costs | 4,056 | | | 3,624 | | | 11,544 | | | 10,651 | |
| Amortization of cost of insurance acquired | Amortization of cost of insurance acquired | 151 | | | 166 | | | 465 | | | 446 | |
| Total benefits and expenses | Total benefits and expenses | $ | 54,749 | | | 51,354 | | | 156,431 | | | 149,301 | |
Payments of claims and surrenders benefits constitute the majority of our expenses. Total benefits and expenses increased in the three and nine months ended September 30, 2023March 31, 2024 as compared to same periodsperiod in 20222023 driven by higher surrendersdeath claims and matured endowments.
Claims and Surrenders.
| | Three Months Ended | | Nine Months Ended |
| September 30, | | September 30, |
| | | Three Months Ended | |
| | | Three Months Ended | |
| | | Three Months Ended | |
| | | March 31, | | | | | March 31, |
| (In thousands) | (In thousands) | 2023 | | 2022 | | 2023 | | 2022 | (In thousands) | | | | | 2024 | | 2023 |
| | | |
| Claims and Surrenders: | |
| Claims and surrenders: | |
| Claims and surrenders: | |
| Claims and surrenders: | |
| Death claim benefits | |
| Death claim benefits | |
| Death claim benefits | Death claim benefits | $ | 4,984 | | | 6,089 | | | 16,002 | | | 18,979 | |
| Surrender benefits | Surrender benefits | 17,264 | | | 12,597 | | | 44,570 | | | 36,463 | |
| Endowment benefits | Endowment benefits | 1,932 | | | 2,131 | | | 6,117 | | | 6,417 | |
| Matured endowment benefits | Matured endowment benefits | 11,080 | | | 8,470 | | | 28,907 | | | 20,737 | |
| Property claims | Property claims | 129 | | | 326 | | | 837 | | | 631 | |
| A&H and other policy benefits | A&H and other policy benefits | 2,334 | | | 1,116 | | | 4,365 | | | 3,033 | |
| | Total claims and surrenders | Total claims and surrenders | $ | 37,723 | | | 30,729 | | | 100,798 | | | 86,260 | |
| | Total claims and surrenders | |
| | Total claims and surrenders | |
Death claim benefits decreasedincreased for the three and nine months ended September 30, 2023March 31, 2024 compared to the same periodsperiod in 20222023 due primarily to a lowerhigher volume of reported death claims.claims as a result of the increase in policies issued over the past few years.
Surrender benefits increaseddecreased slightly for the three and nine months ended September 30, 2023March 31, 2024 compared to the same periodsperiod in 2022 due to surrenders2023. Surrenders are primarily related to international policies that are nearing maturity as well as policies that have passed their surrender charge period. While weWe have implemented retention initiatives over the past few years, which we believe are helping to decrease surrenders, but we believe that the high interest rates are negatively affecting these efforts, as policyholders surrender their policies to re-invest the cash values in higher interest rate products.
September 30, 2023March 31, 2024 | 10-Q 5139
| | | | | | | | |
| CITIZENS, INC. | MANAGEMENT'S DISCUSSION & ANALYSIS |
| | |
Matured endowment benefits increased for the three and nine months ended September 30, 2023March 31, 2024 compared to the same periodsperiod in 2022.2023. We anticipated this increase based upon the contractual maturity dates of the policies.
Explanation of other benefits and expenses
Increase (Decrease) in Future Policy Benefit Reserves. Future policy benefit reserves reflect the liability established to provide for the payment of policy benefits that we expect to pay in the future and thus generally increase when we have a larger in force block of business due to higher sales and better persistency (i.e., more policies on which we expect to pay future benefits) and decrease when we have lower sales and persistency. In the three and nine months ended September 30, 2023,March 31, 2024, the change in future policy benefit reserves decreasedincreased compared to the same prior year periods despiteperiod from increases in insurance issued and increases in our in force block of business due tosomewhat offset by the amount of reserves released in connection with the death claims, surrenders and higher matured endowments and surrenders.endowment benefits.
Policyholder Liability Remeasurement (Gain) Loss. Most of our products are long-duration contracts that provide a specified, fixed amount of insurance benefit in exchange for a fixed premium. When a policy is initially issued, we establish a "net premium ratio" ("NPR") using assumptions regarding expected premiums and policyholder benefit liabilities. On a quarterly basis, we review actual versus expected experience in such quarter, which is reported as a policyholder liability remeasurement gain (if better performance than assumptions) or loss (if lower performance than assumptions). Additionally, in the third quarter of each year, we update our cash flow assumptions to recalculate the NPR, with the impact on the liability for future policy benefits recognized as a policyholder liability remeasurement on a retrospective catch up basis.
Commissions. Commission expenses are a cost of acquiring business, as commissions are the primary compensation paid to our independent consultants and independent agents for selling our products. First year commission rates are higher than renewal commission rates and thus commissions fluctuate directly in relation to first year sales. As discussed above, in the three months ended March 31, 2024, we experienced a 41% increase in first year sales leading to an increase in commission related expenses.
Other General Expenses. General expenses increased slightly in the three and nine months ended September 30, 2023,March 31, 2024, compared to the same periodsperiod in 2022. The increase was primarily driven by costs related to strategic growth initiatives and costs related to moving our international business from Bermuda to Puerto Rico.2023.
Capitalization and Amortization of Deferred Policy Acquisition Costs. Costs capitalizedWe capitalize costs related to successful sales of our insurance products, which include certain commissions, policy issuance costs, and underwriting and agency expensesexpenses. These costs vary based upon amounts of premiums received related to new and renewal business. Capitalized DAC increased in the three months ended March 31, 2024, which is in line with the increases in new sales activity. Significantly lower amounts are capitalized related to renewal business in correlation with the lower commissions paid on that relatebusiness compared to successful sales efforts for insurance contracts and thus fluctuate primarily with first year sales. business, which has higher commission rates.
Amortization of Deferred Policy Acquisition Costs. Amortization of DAC increased in the three months ended March 31, 2024, compared to the same period in 2023. DAC is amortized on a constant level basis for the grouped contracts over the expected term of the related contracts to approximate straight-line amortization.
SEGMENT OPERATIONS
Our business is comprised of two operating business segments, as detailed below.segments:
•Life Insurance
•Home Service Insurance
These segments are reported in accordance with U.S. GAAP. The Company evaluates profit and loss performance based on net income before federal income taxes for these segments. The Company's Other Non-Insurance Enterprises include non-insurance operations such as IT and corporate-support functions, which are included in the table presented below to properly reconcile the segment information with the consolidated financial statements of the Company.
September 30, 2023March 31, 2024 | 10-Q 5240
| | | | | | | | |
| CITIZENS, INC. | MANAGEMENT'S DISCUSSION & ANALYSIS |
| | |
The following table sets forth income (loss) before federal income taxes by segment during the periods indicated.
| | Three Months Ended | | Nine Months Ended |
| September 30, | | September 30, |
| | | Three Months Ended | |
| | | Three Months Ended | |
| | | Three Months Ended | |
| | | March 31, | | | | | March 31, |
| (In thousands) | (In thousands) | 2023 | | 2022 | | 2023 | | 2022 | (In thousands) | | | | | 2024 | | 2023 |
| Income (loss) before federal income tax expense: | Income (loss) before federal income tax expense: | |
| Segments: | Segments: | |
| Segments: | |
| Segments: | |
| Life Insurance | |
| Life Insurance | |
| Life Insurance | Life Insurance | $ | 6,550 | | | 5,072 | | | 20,395 | | | 14,272 | |
| Home Service Insurance | Home Service Insurance | (443) | | | 950 | | | 1,514 | | | 5,030 | |
| Total segments | Total segments | 6,107 | | | 6,022 | | | 21,909 | | | 19,302 | |
| Other Non-Insurance Enterprises | Other Non-Insurance Enterprises | (1,466) | | | (1,200) | | | (4,509) | | | (3,336) | |
| Total income (loss) before federal income tax expense | $ | 4,641 | | | 4,822 | | | 17,400 | | | 15,966 | |
| Total income before federal income tax expense | |
LIFE INSURANCE
Net income in our Life Insurance segment before federal income tax of $6.6 million and $20.4 million in the three and nine months ended September 30, 2023, respectively, increased from $5.1 million and $14.3 million in the prior year periods, respectively. Detailed results of operations describing the year-over-year net income increases in the Life Insurance segment for the periods indicated are as follows:
| | Three Months Ended | | Nine Months Ended |
| September 30, | | September 30, |
| | | Three Months Ended | |
| | | Three Months Ended | |
| | | Three Months Ended | |
| | | March 31, | | | | | March 31, |
| (In thousands) | (In thousands) | 2023 | | 2022 | | 2023 | | 2022 | (In thousands) | | | | | 2024 | | 2023 |
| Revenues: | Revenues: | | | | | | | | Revenues: | | | | | | | |
| Premiums | Premiums | $ | 31,148 | | | 31,696 | | | 86,128 | | | 88,461 | |
| Net investment income | Net investment income | 13,661 | | | 12,806 | | | 40,470 | | | 37,124 | |
| Investment related gains (losses), net | Investment related gains (losses), net | (424) | | | (4,367) | | | (123) | | | (8,644) | |
| Other income | Other income | 884 | | | 682 | | | 2,619 | | | 2,403 | |
| Total revenues | Total revenues | 45,269 | | | 40,817 | | | 129,094 | | | 119,344 | |
| Benefits and expenses: | Benefits and expenses: | |
| Insurance benefits paid or provided: | Insurance benefits paid or provided: | |
| Insurance benefits paid or provided: | |
| Insurance benefits paid or provided: | |
| Claims and surrenders | |
| Claims and surrenders | |
| Claims and surrenders | Claims and surrenders | 32,419 | | | 24,742 | | | 83,826 | | | 67,768 | |
| Increase (decrease) in future policy benefit reserves | Increase (decrease) in future policy benefit reserves | (5,587) | | | 426 | | | (9,270) | | | 4,808 | |
| Policyholder liability remeasurement (gain) loss | Policyholder liability remeasurement (gain) loss | 840 | | | (445) | | | 2,541 | | | 549 | |
| Policyholders' dividends | Policyholders' dividends | 1,405 | | | 1,382 | | | 3,761 | | | 4,241 | |
| Total insurance benefits paid or provided | Total insurance benefits paid or provided | 29,077 | | | 26,105 | | | 80,858 | | | 77,366 | |
| Commissions | Commissions | 5,406 | | | 5,103 | | | 14,930 | | | 13,701 | |
| Other general expenses | Other general expenses | 6,036 | | | 6,016 | | | 17,141 | | | 17,065 | |
| Capitalization of deferred policy acquisition costs | Capitalization of deferred policy acquisition costs | (5,141) | | | (4,592) | | | (13,958) | | | (12,205) | |
| Amortization of deferred policy acquisition costs | Amortization of deferred policy acquisition costs | 3,313 | | | 3,081 | | | 9,642 | | | 9,051 | |
| Amortization of cost of insurance acquired | Amortization of cost of insurance acquired | 28 | | | 32 | | | 86 | | | 94 | |
| Total benefits and expenses | Total benefits and expenses | 38,719 | | | 35,745 | | | 108,699 | | | 105,072 | |
| Income (loss) before federal income tax | $ | 6,550 | | | 5,072 | | | 20,395 | | | 14,272 | |
| Income before federal income tax | |
In our Life Insurance segment, income before federal income tax of $5.8 million in the three months ended March 31, 2024 decreased from $6.4 million in the prior year period. Total revenue increased by $3.2 million from higher premium revenue, investment related gains (losses) and higher net investment income compared to the prior
September 30, 2023March 31, 2024 | 10-Q 5341
| | | | | | | | |
| CITIZENS, INC. | MANAGEMENT'S DISCUSSION & ANALYSIS |
| | |
The main drivers of the year-over-year increases in income before federal income tax in the 2023 periods areyear period. These improvements were more than offset by higher net investment incomeclaims and lower investment related losses. These increases were partially offset by lower renewal premiums, higher surrenders benefits paid and higher policyholder liability remeasurement losses due to the higher levels of surrenders.other general expenses supporting our domestic growth strategy.
Life Insurance segment premium breakout is detailed below.
| | Three Months Ended | | Nine Months Ended |
| September 30, | | September 30, |
| | | Three Months Ended | |
| | | Three Months Ended | |
| | | Three Months Ended | |
| | | March 31, | | | | | March 31, |
| (In thousands) | (In thousands) | 2023 | | 2022 | | 2023 | | 2022 | (In thousands) | | | | | 2024 | | 2023 |
| Premiums: | Premiums: | | | | | | | | Premiums: | | | | | | | |
| First year | First year | $ | 3,796 | | | 3,135 | | | 9,195 | | | 7,888 | |
| Renewal | Renewal | 27,352 | | | 28,561 | | | 76,933 | | | 80,573 | |
| Total premiums | Total premiums | $ | 31,148 | | | 31,696 | | | 86,128 | | | 88,461 | |
|
Premiums. First yearOur total premiums increased 21% and 17% forby 6% in the three and nine months ended September 30, 2023, respectively,March 31, 2024 as compared to the same periodsperiod in 2022,2023 due to the 77% increase in first year premiums. First year premiums rose significantly due to sales of our new products and expanded domestic distribution. Our totalRenewal premiums for three and nine months ended September 30, 2023 decreased 2% and 3%, respectively, compared to the same periods in 2022 as renewal premiums declined. We derive most of our premium revenue in the Life Insurance segment from renewal premiums, which decreased 4% and 5%, respectively,slightly in the three and nine months ended September 30, 2023March 31, 2024 as compared to the same periods in 2022.prior year period. As described above, this decline is due to high surrenders and matured endowments over the last several years.
International Life Insurance Premiums. LifeWhile our domestic life insurance business drove the significant increase in first year premiums, life insurance premiums are generated largely from our international policyholders living in over 75 different countries across the globe. The majority of our international premiums are derived from whole life and endowment products. The following table sets forth our premiums collected from the top five countries of our international life insurance businessby location for the three and nine months ended September 30,March 31, 2024 and 2023.
| | | | | | | | | | | | | | | | | |
| | | Three Months Ended |
| | | March 31, |
| (In thousands) | | | | | 2024 | | 2023 |
| International premiums: | | | | | | | |
| Colombia | | | | | $ | 5,983 | | | 6,057 | |
| Taiwan | | | | | 4,542 | | | 5,302 | |
| Venezuela | | | | | 3,315 | | | 3,722 | |
| Ecuador | | | | | 3,044 | | | 3,246 | |
| Argentina | | | | | 2,098 | | | 2,184 | |
| Other Non-U.S. | | | | | 8,815 | | | 8,841 | |
| Total international premiums | | | | | 27,797 | | | 29,352 | |
| Domestic premiums | | | | | 2,322 | | | 967 | |
| Change in premium accruals | | | | | (2,258) | | | (4,112) | |
| Total premiums | | | | | $ | 27,861 | | | 26,207 | |
Net Investment Income. Our net investment income increased by 3% for the three months ended March 31, 2024, compared to the same period in 2023 and 2022.due to our higher average portfolio yield. The majority of our investment income is derived from fixed maturity securities; however, long-term investment income continues to increase as our limited partnership asset base grows.
| | | | | | | | | | | | | | | | | | | | | | | |
| Three Months Ended | | Nine Months Ended |
| September 30, | | September 30, |
| (In thousands) | 2023 | | 2022 | | 2023 | | 2022 |
| Country: | | | | | | | |
| Colombia | $ | 6,077 | | | 5,869 | | | 18,415 | | | 17,765 | |
| Taiwan | 3,814 | | | 3,862 | | | 12,706 | | | 12,540 | |
| Venezuela | 3,804 | | | 4,388 | | | 11,208 | | | 12,343 | |
| Ecuador | 3,479 | | | 3,286 | | | 9,882 | | | 9,380 | |
| Argentina | 2,550 | | | 2,250 | | | 7,130 | | | 6,688 | |
| Other Non-U.S. | 9,866 | | | 10,141 | | | 28,241 | | | 28,711 | |
| Total | $ | 29,590 | | | 29,796 | | | 87,582 | | | 87,427 | |
Domestic Life Insurance Premiums. OurInvestment Related Gains (Losses), Net. domestic in-force life insurance business consists primarilyWe recorded investment related gains of closed blocks of business from various insurance companies we have acquired over the years. As discussed, we have recently re-launched our domestic life insurance business through CICA Life Insurance Company of America by expanding our licenses to new states, developing new final expense and living benefit products, entering into new white label and other distribution agreements and obtaining a B+ A.M. Best rating. Because the majority of this business still consists of closed blocks of business, premiums in our domestic Life Insurance segment were lower in$1.1 million during the three and nine months ended September 30, 2023March 31, 2024, compared to investment related losses of $0.4 million during the same prior year periods despite growthperiod, resulting primarily from the change in estimated fair market value of our newly relaunched business.limited partnership investments.
September 30, 2023March 31, 2024 | 10-Q 5442
| | | | | | | | |
| CITIZENS, INC. | MANAGEMENT'S DISCUSSION & ANALYSIS |
| | |
Net Investment Income. Our net investment income increased by 7% and 9% for the three and nine months ended September 30, 2023, respectively, compared to the same periods in 2022 due to our higher average portfolio yield. The majority of investment income is derived from fixed maturity securities; however, long-term investment income continued to increase as our limited partnership asset base grew.
Investment Related Gains (Losses), Net. We recorded investment related losses of $0.4 million and $0.1 million during the three and nine months ended September 30, 2023, respectively, compared to investment related losses of $4.4 million and $8.6 million during the same prior year periods, respectively, resulting from the change in estimated fair market value for our limited partnership investments.
Claims and Surrenders. The following table sets forth our primary claims and surrender benefits paid within our Life Insurance segment for the three and nine months ended September 30, 2023March 31, 2024 compared to the same periodsperiod in 2022.2023.
| | Three Months Ended | | Nine Months Ended |
| September 30, | | September 30, |
| | | Three Months Ended | |
| | | Three Months Ended | |
| | | Three Months Ended | |
| | | March 31, | | | | | March 31, |
| (In thousands) | (In thousands) | 2023 | | 2022 | | 2023 | | 2022 | (In thousands) | | | | | 2024 | | 2023 |
| Claims and Surrenders: | |
| Claims and surrenders: | |
| Death claim benefits | |
| Death claim benefits | |
| Death claim benefits | Death claim benefits | $ | 978 | | | 1,370 | | | 3,117 | | | 3,879 | |
| Surrender benefits | Surrender benefits | 16,317 | | | 11,817 | | | 41,927 | | | 34,230 | |
| Endowment benefits | Endowment benefits | 1,930 | | | 2,128 | | | 6,111 | | | 6,406 | |
| Matured endowment benefits | Matured endowment benefits | 10,912 | | | 8,335 | | | 28,447 | | | 20,323 | |
| A&H and other policy benefits | A&H and other policy benefits | 2,282 | | | 1,092 | | | 4,224 | | | 2,930 | |
| | Total claims and surrenders | Total claims and surrenders | $ | 32,419 | | | 24,742 | | | 83,826 | | | 67,768 | |
| | Total claims and surrenders | |
| | Total claims and surrenders | |
During the three and nine months ended September 30,March 31, 2024 and 2023, and 2022, the majority of our claims and surrender benefits in our Life Insurance segment were related to payment of surrender benefits and matured endowment benefits. Many of our endowment policies are reaching their contractual maturity dates and thus matured endowment benefits are increasing. We expect this trend to continue over the next few years. Surrender benefits increaseddecreased slightly for the three and nine months ended September 30, 2023 compared to the same periods in 2022, partially due to surrenders related to international policies that are nearing maturity as well as policies that have passed their surrender charge period. Death claims benefits decreased for the three and nine months ended September 30, 2023, respectively,March 31, 2024 compared to the prior year periods.period. Death claim benefits increased for the three months ended March 31, 2024, compared to the prior year period as we saw a higher number of reported claims due to the increase in policies issued. Mortality experience is closely monitored by the Company as a key performance indicator and these amounts were within expected levels.fluctuates from quarter-to-quarter based on reported claims.
Increase (Decrease) in Future Policy Benefit Reserves. The change in future policy benefit reserves decreased for the three months ended March 31, 2024 and 2023 as a result of reserves released from surrenders and higher matured endowment and surrender benefits, which was partially offset by increases in insurance issued and normal increases in our in force block of business policy benefit reserves for the three and nine months ended September 30, 2023 compared to the same periods in 2022.reserves.
September 30, 2023March 31, 2024 | 10-Q 5543
| | | | | | | | |
| CITIZENS, INC. | MANAGEMENT'S DISCUSSION & ANALYSIS |
| | |
HOME SERVICE INSURANCE
Detailed results of operations for the Home Service Insurance segment for the periods indicated are as follows:
| | Three Months Ended | | Nine Months Ended |
| September 30, | | September 30, |
| | | Three Months Ended | |
| | | Three Months Ended | |
| | | Three Months Ended | |
| | | March 31, | | | | | March 31, |
| (In thousands) | (In thousands) | 2023 | | 2022 | | 2023 | | 2022 | (In thousands) | | | | | 2024 | | 2023 |
| Revenues: | Revenues: | | | | | | | | Revenues: | | | | | | | |
| Premiums | Premiums | $ | 10,878 | | | 12,179 | | | 33,873 | | | 37,002 | |
| Net investment income | Net investment income | 3,459 | | | 3,527 | | | 10,379 | | | 10,054 | |
| Investment related gains (losses), net | Investment related gains (losses), net | (370) | | | (462) | | | (283) | | | (1,629) | |
| Other income | — | | | — | | | 1 | | | 1 | |
| | Total revenues | |
| Total revenues | |
| Total revenues | Total revenues | 13,967 | | | 15,244 | | | 43,970 | | | 45,428 | |
| Benefits and expenses: | Benefits and expenses: | |
| Insurance benefits paid or provided: | Insurance benefits paid or provided: | |
| Insurance benefits paid or provided: | |
| Insurance benefits paid or provided: | |
| Claims and surrenders | |
| Claims and surrenders | |
| Claims and surrenders | Claims and surrenders | 5,304 | | | 5,987 | | | 16,972 | | | 18,492 | |
| Increase (decrease) in future policy benefit reserves | Increase (decrease) in future policy benefit reserves | 1,707 | | | 227 | | | 3,468 | | | (311) | |
| Policyholder liability remeasurement (gain) loss | Policyholder liability remeasurement (gain) loss | 184 | | | 841 | | | 319 | | | 1,182 | |
| Policyholders' dividends | Policyholders' dividends | 9 | | | 7 | | | 22 | | | 16 | |
| Total insurance benefits paid or provided | Total insurance benefits paid or provided | 7,204 | | | 7,062 | | | 20,781 | | | 19,379 | |
| Commissions | Commissions | 4,038 | | | 4,107 | | | 12,410 | | | 12,106 | |
| Other general expenses | Other general expenses | 4,293 | | | 4,228 | | | 13,060 | | | 12,093 | |
| Capitalization of deferred policy acquisition costs | Capitalization of deferred policy acquisition costs | (1,991) | | | (1,780) | | | (6,076) | | | (5,132) | |
| Amortization of deferred policy acquisition costs | Amortization of deferred policy acquisition costs | 743 | | | 543 | | | 1,902 | | | 1,600 | |
| Amortization of cost of insurance acquired | Amortization of cost of insurance acquired | 123 | | | 134 | | | 379 | | | 352 | |
| Total benefits and expenses | Total benefits and expenses | 14,410 | | | 14,294 | | | 42,456 | | | 40,398 | |
| Income (loss) before federal income tax | $ | (443) | | | 950 | | | 1,514 | | | 5,030 | |
| Income before federal income tax | |
In our Home Service Insurance segment, we reported lossincome before federal income tax of $0.4 million and income of $1.5$0.6 million in the three and nine months ended September 30, 2023, respectively,March 31, 2024, as compared to income of $1.0 million and $5.0$1.3 million in the prior year periods. In both the three and nine month periods ended September 30, 2023, the decreases wereperiod. The lower income is primarily driven by lower premiums due to the impact of ceasingas we ceased our property insurance operations, as of June 30, 2023 described above and higherincreases in future policy benefit reserves. In the current year nine-month period, the decrease was also driven by higher other general expenses due to higher employee health benefit costs,reserves and investment related losses partially offset by the improvementa decrease in investment related losses due to the improvements in the fair value of our equity securities.other general expenses.
Premiums. Total premium revenue declined by 11% and 8%10% in the three and nine months ended September 30, 2023, respectively,March 31, 2024, compared to the same periods in 2022prior year period due primarily to the impact of ceasing our property insurance operations as of June 30, 2023. Our first year premiums increased 6%declined 16% in the ninethree months ended September 30, 2023March 31, 2024 compared to the same prior year period as we continue to make changes to our agents' compensation structures to improve the quality and the persistency of sales in 2022.this segment.
September 30, 2023March 31, 2024 | 10-Q 5644
| | | | | | | | |
| CITIZENS, INC. | MANAGEMENT'S DISCUSSION & ANALYSIS |
| | |
Claims and Surrenders. Payments of claims and surrender benefits, which are the largest portion of our expenses, are summarized as follows:
| | Three Months Ended | | Nine Months Ended |
| September 30, | | September 30, |
| | | Three Months Ended | |
| | | Three Months Ended | |
| | | Three Months Ended | |
| | | March 31, | | | | | March 31, |
| (In thousands) | (In thousands) | 2023 | | 2022 | | 2023 | | 2022 | (In thousands) | | | | | 2024 | | 2023 |
| Claims and Surrenders: | Claims and Surrenders: | |
| Death claim benefits | |
| Death claim benefits | |
| Death claim benefits | Death claim benefits | $ | 4,006 | | | 4,719 | | | 12,885 | | | 15,100 | |
| Surrender benefits | Surrender benefits | 947 | | | 780 | | | 2,643 | | | 2,233 | |
| Endowment benefits | Endowment benefits | 2 | | | 3 | | | 6 | | | 11 | |
| Matured endowment benefits | Matured endowment benefits | 168 | | | 135 | | | 460 | | | 414 | |
| Property claims | Property claims | 129 | | | 326 | | | 837 | | | 631 | |
| A&H and other policy benefits | A&H and other policy benefits | 52 | | | 24 | | | 141 | | | 103 | |
| | Total claims and surrenders | Total claims and surrenders | $ | 5,304 | | | 5,987 | | | 16,972 | | | 18,492 | |
| | Total claims and surrenders | |
| | Total claims and surrenders | |
The majority of claims and surrender benefits in our Home Service Insurance segment are death claim benefits. Death claim benefits decreased 15%increased 5% in the three and nine months ended September 30, 2023March 31, 2024 compared to the same three and nine months in 2022 due primarily to a lower volume of reported claims.prior year period. Mortality experience is closely monitored by the Company as a key performance indicator and fluctuates from quarter-to-quarter based on reported claims.
Other General Expenses. General expenses increaseddecreased in the ninethree months ended September 30, 2023March 31, 2024 compared to the same periodsperiod in 2022,2023, primarily due to higher employee health benefit costs.ceasing our property insurance business as discussed above.
OTHER NON-INSURANCE ENTERPRISES
| | Three Months Ended | | Nine Months Ended |
| September 30, | | September 30, |
| | | Three Months Ended | |
| | | Three Months Ended | |
| | | Three Months Ended | |
| | | March 31, | | | | | March 31, |
| (In thousands) | (In thousands) | 2023 | | 2022 | | 2023 | | 2022 | (In thousands) | | | | | 2024 | | 2023 |
| Income (loss) before federal income tax | $ | (1,466) | | | (1,200) | | | (4,509) | | | (3,336) | |
| Loss before federal income tax | |
This operating unit represents the administrative support functions for the insurance operations. Its revenues are primarily intercompany and have been eliminated in consolidation under U.S. GAAP, which typically results in a loss. Revenue in this operating unit consists primarily of net investment income and investment related gains or losses, while expenses consist of other general expenses related to corporate functions.
INVESTMENTS
Our investments are an integral part of our business success. Our cash and invested assets at September 30, 2023March 31, 2024 were $1.3$1.4 billion, of which 86%87% was invested in fixed maturity securities, all of which are classified as available-for-sale. We closely monitor the duration of our fixed maturity investments, and investment purchases and sales are executed with the objective of having adequate funds available to satisfy our insurance obligations.
September 30, 2023March 31, 2024 | 10-Q 5745
| | | | | | | | |
| CITIZENS, INC. | MANAGEMENT'S DISCUSSION & ANALYSIS |
| | |
The following table sets forth the carrying value of our investments by investment category and cash, cash equivalents and the percentage of each to total cash and invested assets.
| | Carrying Value | Carrying Value | September 30, 2023 | | December 31, 2022 | Carrying Value | March 31, 2024 | | December 31, 2023 |
| (In thousands, except for %) | (In thousands, except for %) | Amount | | % | | Amount | | % | (In thousands, except for %) | Amount | | % | | Amount | | % |
| Cash, Cash Equivalents and Invested Assets | |
| Cash, cash equivalents and invested assets: | |
| Fixed maturity securities: | |
| Fixed maturity securities: | |
| Fixed maturity securities: | Fixed maturity securities: | | | | | | | | | | |
| U.S. Treasury and U.S. Government-sponsored enterprises | U.S. Treasury and U.S. Government-sponsored enterprises | $ | 9,357 | | | 0.7 | % | | $ | 13,278 | | | 1.0 | % | U.S. Treasury and U.S. Government-sponsored enterprises | $ | 9,570 | | | 0.7 | | 0.7 | % | | $ | 9,715 | | | 0.7 | | 0.7 | % |
| Corporate | Corporate | 710,741 | | | 53.3 | | | 715,645 | | | 52.5 | |
States and political subdivisions (1) | States and political subdivisions (1) | 283,956 | | | 21.3 | | | 307,358 | | | 22.5 | |
Mortgage-backed (2) | Mortgage-backed (2) | 92,686 | | | 6.9 | | | 99,995 | | | 7.3 | |
| Asset-backed | Asset-backed | 54,613 | | | 4.1 | | | 43,242 | | | 3.2 | |
| Foreign governments | — | | | — | | | 101 | | | — | |
| | Total fixed maturity securities | Total fixed maturity securities | 1,151,353 | | | 86.3 | | | 1,179,619 | | | 86.5 | |
| Short-term investments | — | | | — | | | 1,241 | | | 0.1 | |
| Total fixed maturity securities | |
| Total fixed maturity securities | |
| | Cash and cash equivalents | |
| Cash and cash equivalents | |
| Cash and cash equivalents | Cash and cash equivalents | 16,785 | | | 1.3 | | | 22,973 | | | 1.7 | |
| Other investments: | Other investments: | | | | | | | | Other investments: | | | | | |
| Policy loans | Policy loans | 75,750 | | | 5.7 | | | 78,773 | | | 5.8 | |
| Equity securities | Equity securities | 10,555 | | | 0.8 | | | 11,590 | | | 0.8 | |
| | Other long-term investments | Other long-term investments | 79,798 | | | 5.9 | | | 69,558 | | | 5.1 | |
| Other long-term investments | |
| Other long-term investments | |
| Total cash, cash equivalents and invested assets | Total cash, cash equivalents and invested assets | $ | 1,334,241 | | | 100.0 | % | | $ | 1,363,754 | | | 100.0 | % | Total cash, cash equivalents and invested assets | $ | 1,423,101 | | | 100.0 | | 100.0 | % | | $ | 1,429,344 | | | 100.0 | | 100.0 | % |
(1) Includes $117.6$122.8 million and $133.2$124.2 million of securities guaranteed by third parties at September 30, 2023March 31, 2024 and December 31, 2022,2023, respectively.
(2) Includes $91.6$94.0 million and $98.8$96.1 million of U.S. Government-sponsored enterprises at September 30, 2023March 31, 2024 and December 31, 2022,2023, respectively.
The carrying value of the Company’s fixed maturity securities investment portfolio at September 30, 2023March 31, 2024 was $1.15$1.23 billion compared to $1.18$1.24 billion at December 31, 2022.2023. The distribution of the credit ratings of our portfolio of fixed maturity securities by carrying value as of September 30, 2023March 31, 2024 did not materially change from December 31, 20222023 – the weighted average was “A” at both dates.
Cash and cash equivalents decreased as of September 30, 2023March 31, 2024 from December 31, 20222023 and fluctuates from period-to-period primarily due to the timing of operating and investing activities.
Other long-term investments increased by $10.2$2.4 million as of September 30, 2023March 31, 2024 from December 31, 20222023 due to additional funding and increases in the fair market value of our limited partnership investments.
Obligations of States and Political Subdivisions
The Company’s fixed maturity securities investment portfolio at September 30, 2023March 31, 2024 and December 31, 20222023 included $284.0$285.1 million and $307.4$287.2 million, respectively, of securities that are obligations of states and political subdivisions, including municipalities (collectively referred to as the municipal bond portfolio).
September 30, 2023March 31, 2024 | 10-Q 5846
| | | | | | | | |
| CITIZENS, INC. | MANAGEMENT'S DISCUSSION & ANALYSIS |
| | |
The Company's municipal bond portfolio includes third-party guarantees. Detailed below is a presentation by the Nationally Recognized Statistical Rating Organization ("NRSRO") rating of these holdings by funding type as of September 30, 2023.March 31, 2024.
| | General Obligation | | Special Revenue | | Other | | Total | | % Based on Amortized
Cost |
| General Obligation | | | General Obligation | | Special Revenue | | Other | | Total | | % Based on Amortized
Cost |
| (In thousands, except for %) | (In thousands, except for %) | Fair
Value | | Amortized
Cost | | Fair
Value | | Amortized
Cost | | Fair
Value | | Amortized
Cost | | Fair
Value | | Amortized
Cost | | % Based on Amortized
Cost |
| State and political subdivision fixed maturity securities including third-party guarantees | |
| State and political subdivision fixed maturity securities including third-party guarantees: | |
| State and political subdivision fixed maturity securities including third-party guarantees: | |
| State and political subdivision fixed maturity securities including third-party guarantees: | |
| AAA | |
| AAA | |
| AAA | AAA | $ | 13,900 | | | 13,930 | | | 6,307 | | | 6,894 | | | — | | | — | | | 20,207 | | | 20,824 | | | 6.4 | % | $ | 13,911 | | | 13,913 | | 13,913 | | | 6,638 | | 6,638 | | | 6,890 | | 6,890 | | | — | | — | | | — | | — | | | 20,549 | | 20,549 | | | 20,803 | | 20,803 | | | 6.6 | | 6.6 | % |
| AA | AA | 43,135 | | | 43,935 | | | 108,386 | | | 131,470 | | | 10,224 | | | 11,082 | | | 161,745 | | | 186,487 | | | 57.3 | |
| A | A | 3,933 | | | 4,461 | | | 81,242 | | | 94,588 | | | 4,327 | | | 4,399 | | | 89,502 | | | 103,448 | | | 31.8 | |
| BBB | BBB | 604 | | | 654 | | | 7,575 | | | 9,192 | | | 1,328 | | | 1,450 | | | 9,507 | | | 11,296 | | | 3.5 | |
| BB and other | BB and other | 2,911 | | | 3,174 | | | 84 | | | 85 | | | — | | | — | | | 2,995 | | | 3,259 | | | 1.0 | |
| Total | Total | $ | 64,483 | | | 66,154 | | | 203,594 | | | 242,229 | | | 15,879 | | | 16,931 | | | 283,956 | | | 325,314 | | | 100.0 | % | Total | $ | 65,215 | | | 66,203 | | 66,203 | | | 207,727 | | 207,727 | | | 234,763 | | 234,763 | | | 12,113 | | 12,113 | | | 12,398 | | 12,398 | | | 285,055 | | 285,055 | | | 313,364 | | 313,364 | | | 100.0 | | 100.0 | % |
| | State and political subdivision fixed maturity securities excluding third-party guarantees | |
| State and political subdivision fixed maturity securities excluding third-party guarantees: | |
| State and political subdivision fixed maturity securities excluding third-party guarantees: | |
| State and political subdivision fixed maturity securities excluding third-party guarantees: | |
| | AA | |
| | AA | |
| | AA | AA | $ | 32,122 | | | 32,538 | | | 37,457 | | | 43,391 | | | 6,431 | | | 6,496 | | | 76,010 | | | 82,425 | | | 25.3 | % | $ | 31,926 | | | 32,136 | | 32,136 | | | 33,583 | | 33,583 | | | 37,612 | | 37,612 | | | 3,840 | | 3,840 | | | 3,820 | | 3,820 | | | 69,349 | | 69,349 | | | 73,568 | | 73,568 | | | 23.5 | | 23.5 | % |
| A | A | 17,806 | | | 18,702 | | | 88,677 | | | 103,216 | | | 5,650 | | | 6,130 | | | 112,133 | | | 128,048 | | | 39.4 | |
| BBB | BBB | 1,382 | | | 1,415 | | | 20,563 | | | 24,254 | | | 1,469 | | | 1,855 | | | 23,414 | | | 27,524 | | | 8.5 | |
| BB and other | BB and other | 13,173 | | | 13,499 | | | 56,897 | | | 71,368 | | | 2,329 | | | 2,450 | | | 72,399 | | | 87,317 | | | 26.8 | |
| Total | Total | $ | 64,483 | | | 66,154 | | | 203,594 | | | 242,229 | | | 15,879 | | | 16,931 | | | 283,956 | | | 325,314 | | | 100.0 | % | Total | $ | 65,215 | | | 66,203 | | 66,203 | | | 207,727 | | 207,727 | | | 234,763 | | 234,763 | | | 12,113 | | 12,113 | | | 12,398 | | 12,398 | | | 285,055 | | 285,055 | | | 313,364 | | 313,364 | | | 100.0 | | 100.0 | % |
The table below shows the categories in which the Company held investments in special revenue bonds that were greater than 10% of fair value based upon the Company's total municipal bond portfolio at September 30, 2023.March 31, 2024.
| | (In thousands, except for %) | (In thousands, except for %) | Fair
Value | | Amortized
Cost | | % of Total
Fair Value | (In thousands, except for %) | Fair
Value | | Amortized
Cost | | % of Total
Fair Value |
| | | | | | | | | | |
| Education | Education | $ | 47,346 | | | 55,750 | | | 16.7 | % | Education | $ | 47,253 | | | 53,236 | | 53,236 | | | 16.6 | | 16.6 | % |
| Utilities | Utilities | 42,086 | | | 48,115 | | | 14.8 | |
| Transportation | Transportation | 35,198 | | | 44,503 | | | 12.4 | |
|
The Company's municipal bond portfolio is spread across many states, however, municipal bonds from Texas and California comprise the most significant concentration of the total municipal bond portfolio as of September 30, 2023.March 31, 2024. The Company holds 22% and 14%15% of its municipal bond portfolio in Texas and California issuers, respectively, as of September 30, 2023.March 31, 2024. There were no other states or individual issuer holdings that represented or exceeded 10% of the total municipal bond portfolio as of September 30, 2023.March 31, 2024.
September 30, 2023March 31, 2024 | 10-Q 5947
| | | | | | | | |
| CITIZENS, INC. | MANAGEMENT'S DISCUSSION & ANALYSIS |
| | |
The table below represents the Company's detailed exposure to municipal bonds in Texas at September 30, 2023.March 31, 2024.
| | General Obligation | | Special Revenue | | Other | | Total |
| General Obligation | | | General Obligation | | Special Revenue | | Other | | Total |
| (In thousands) | (In thousands) | Fair
Value | | Amortized
Cost | | Fair
Value | | Amortized
Cost | | Fair
Value | | Amortized
Cost | | Fair
Value | | Amortized
Cost | (In thousands) | Fair
Value | | Amortized
Cost | | Fair
Value | | Amortized
Cost | | Fair
Value | | Amortized
Cost | | Fair
Value | | Amortized
Cost |
Texas state and political subdivision fixed maturity securities including third-party guarantees | | Texas state and political subdivision fixed maturity securities including third-party guarantees: | | Texas state and political subdivision fixed maturity securities including third-party guarantees: |
| AAA | AAA | $ | 13,405 | | | 13,425 | | | 2,466 | | | 2,639 | | | — | | | — | | | 15,871 | | | 16,064 | |
| AA | AA | 16,430 | | | 16,405 | | | 13,144 | | | 15,820 | | | — | | | — | | | 29,574 | | | 32,225 | |
| A | A | — | | | — | | | 16,059 | | | 21,896 | | | — | | | — | | | 16,059 | | | 21,896 | |
| | Total | Total | $ | 29,835 | | | 29,830 | | | 31,669 | | | 40,355 | | | — | | | — | | | 61,504 | | | 70,185 | |
Texas state and political subdivision fixed maturity securities excluding third-party guarantees | | | Total | |
| | Total | |
| Texas state and political subdivision fixed maturity securities excluding third-party guarantees: | | Texas state and political subdivision fixed maturity securities excluding third-party guarantees: |
| | AA | |
| AA | |
| AA | AA | $ | 25,016 | | | 24,980 | | | 4,827 | | | 5,625 | | | — | | | — | | | 29,843 | | | 30,605 | |
| A | A | 4,819 | | | 4,850 | | | 15,310 | | | 18,093 | | | — | | | — | | | 20,129 | | | 22,943 | |
| BBB | BBB | — | | | — | | | 3,037 | | | 3,417 | | | — | | | — | | | 3,037 | | | 3,417 | |
| BB and other | BB and other | — | | | — | | | 8,495 | | | 13,220 | | | — | | | — | | | 8,495 | | | 13,220 | |
| Total | Total | $ | 29,835 | | | 29,830 | | | 31,669 | | | 40,355 | | | — | | | — | | | 61,504 | | | 70,185 | |
The table below represents the Company's detailed exposure to municipal bonds in California at September 30, 2023.March 31, 2024.
| | General Obligation | | | General Obligation | | Special Revenue | | Other | | Total |
| (In thousands) | | (In thousands) | Fair
Value | | Amortized
Cost | | Fair
Value | | Amortized
Cost | | Fair
Value | | Amortized
Cost | | Fair
Value | | Amortized
Cost |
| California state and political subdivision fixed maturity securities including third-party guarantees: | | California state and political subdivision fixed maturity securities including third-party guarantees: |
| | General Obligation | | Special Revenue | | Other | | Total |
| (In thousands) | Fair
Value | | Amortized
Cost | | Fair
Value | | Amortized
Cost | | Fair
Value | | Amortized
Cost | | Fair
Value | | Amortized
Cost |
California state and political subdivision fixed maturity securities including third-party guarantees | | | AA | |
| AA | |
| AA | AA | $ | 1,880 | | | 2,049 | | | 27,278 | | | 35,293 | | | 2,323 | | | 2,732 | | | 31,481 | | | 40,074 | |
| A | A | 1,179 | | | 1,650 | | | 6,625 | | | 7,666 | | | — | | | — | | | 7,804 | | | 9,316 | |
| BBB | BBB | — | | | — | | | 570 | | | 570 | | | — | | | — | | | 570 | | | 570 | |
| | Total | Total | $ | 3,059 | | | 3,699 | | | 34,473 | | | 43,529 | | | 2,323 | | | 2,732 | | | 39,855 | | | 49,960 | |
California state and political subdivision fixed maturity securities excluding third-party guarantees | | Total | |
| Total | |
| California state and political subdivision fixed maturity securities excluding third-party guarantees: | | California state and political subdivision fixed maturity securities excluding third-party guarantees: |
| | AA | |
| AA | |
| AA | AA | $ | 419 | | | 445 | | | 4,214 | | | 5,258 | | | — | | | — | | | 4,633 | | | 5,703 | |
| A | A | 2,640 | | | 3,254 | | | 14,016 | | | 17,706 | | | 2,323 | | | 2,732 | | | 18,979 | | | 23,692 | |
| BBB | BBB | — | | | — | | | 3,143 | | | 3,523 | | | — | | | — | | | 3,143 | | | 3,523 | |
| BB and other | BB and other | — | | | — | | | 13,100 | | | 17,042 | | | — | | | — | | | 13,100 | | | 17,042 | |
| Total | Total | $ | 3,059 | | | 3,699 | | | 34,473 | | | 43,529 | | | 2,323 | | | 2,732 | | | 39,855 | | | 49,960 | |
IMPAIRMENT CONSIDERATIONS RELATED TO INVESTMENTS IN FIXED MATURITY AND EQUITY SECURITIES
The Company did not record any credit valuation allowances on fixed maturity securities in either of the three and nine months ended September 30, 2023March 31, 2024 or 2022.2023.
Information on both unrealized and realized gains and losses by category is set forth in Part I, Item 1, Note 3. Investments of the notes to our consolidated financial statements herein.
September 30, 2023March 31, 2024 | 10-Q 6048
| | | | | | | | |
| CITIZENS, INC. | MANAGEMENT'S DISCUSSION & ANALYSIS |
| | |
LIQUIDITY AND CAPITAL RESOURCES
Below are our primary capital resources (based on carrying value of each) as of the periods indicated.
| | (In thousands) | (In thousands) | September 30, 2023 | | December 31, 2022 | (In thousands) | March 31, 2024 | | December 31, 2023 |
| Fixed maturity securities | Fixed maturity securities | $ | 1,151,353 | | | 1,179,619 | |
| Cash and cash equivalents | Cash and cash equivalents | 16,785 | | | 22,973 | |
Liquidity refers to a company's ability to generate or obtain sufficient cash flows to meet the needs of its operations. In the nine months ended September 30, 2023,Our liquidity is primarily derived from our operations generated $15.4 million of net cash. We manage our insurance operations as described herein in order to ensure that we have stable and reliable sources of cash flow to meetfrom operations, our obligations.cash and cash equivalents, and our portfolio of marketable securities. We currently anticipate meetingmay also derive liquidity by accessing our short-term and long-term cash needs with cash generated by our insurance operations and from our invested assets. From time-to-time, weCredit Facility (described below) or may raise capital by selling shares in our SIP (as defined below) or by other traditional means. Citizens has no debt as of March 31, 2024.
Cash from Operating Activities. Cash provided by operating activities is an important liquidity metric because it reflects, during a given period, the amount of cash generated that is available to pay our operating expenses, invest in our business or make strategic acquisitions. In the three months ended March 31, 2024, our operations provided $6.8 million in net cash.
Cash from Investing Activities. We have traditionally also had significant cash flows from both scheduled and unscheduled investment security maturities, redemptions, and prepayments. These cash flows, for the most part, are reinvested in new investments. In the three months ended March 31, 2024, we may also accesshad net cash outflows from investing activities of $9.5 million as we continue to invest excess funds in this high interest rate environment. The investing activities fluctuate from period to period due to timing of security activities such as calls and maturities and reinvestment of those funds. 87% of our Credit Facility if needed (alsototal cash, cash equivalents and investments consist of marketable fixed maturity securities classified as described below).available-for-sale that could be readily converted to cash for liquidity needs.
PARENT COMPANY LIQUIDITY AND CAPITAL RESOURCES
Citizens is a holding company and has minimal operations of its own. OurCitizens' assets consist of the capital stock of ourits subsidiaries, cash and investments. OurCitizens' liquidity requirements are met primarily from two sources: cash generated from ourits operating subsidiaries and ourits invested assets. OurCitizens ability to obtain cash from ourits insurance subsidiaries depends primarily upon the availability of statutorily permissible payments, including payments Citizens receives from service agreements with ourits insurance subsidiaries and dividends from the subsidiaries. The ability to make payments to the holding company is limited by applicable laws of the U.S. states of domicile and by the Puerto Rico Office of Commissioner of Insurance, which all subject insurance operations to significant regulatory restrictions. These laws and regulations require, among other things, that our insurance subsidiaries maintain minimum solvency or premium to surplus ratio requirements, which limit the amount of dividends that can be paid to the holding company. The regulations also require approval of our service agreements with the applicable regulatory authority in order to prevent insurance subsidiaries from moving large amounts of cash to the unregulatedless regulated holding company.
In addition to the above-mentioned sources of cash, we offer a Stock Investment Plan ("SIP"), whereby investors, policyholders, independent contractors and agents, employees and directors can directly purchase our stock. At our option, purchases of stock under the SIP can be made from newly issued or treasury stock, rather than in the open market, in which case, we can raise capital by selling our shares.
In 2021, we entered into a Credit Facility with Regions Bank. The initial term of the Credit Facility expired on May 5, 2024 and we renewed it on substantially the same terms for an additional three years. See Part I, Item 1, Note 7. Commitments and Contingencies in the notes to our consolidated financial statements, herein, for a description of the Credit Facility. The Credit Facility provides additional liquidity to the Company for short-term and longer-term needs. As of September 30, 2023, we have not borrowed any money under the Credit Facility and have no immediate plans to do so.
INSURANCE COMPANY SUBSIDIARY LIQUIDITY AND CAPITAL RESOURCES
The liquidity requirements of our insurance operations are primarily met by premium revenues, investment income and investment maturities or sales. Primary cash needs relate to payments of policyholder benefits, investment purchases and operating expenses. Historically, cash flow from our operations has been sufficient to meet our cash needs. We have not had to liquidate a material amount of investments to pay our expenses. We believe that we have adequate capital resources to support the liquidity requirements of our insurance operations if the cash flow from our insurance operations is insufficient to meet our cash needs. See Contractual Obligations and Off-balance Sheet Arrangements in our Form 10-K and below for a discussion of known and estimated cash needs. Cash flow
September 30, 2023March 31, 2024 | 10-Q 6149
| | | | | | | | |
| CITIZENS, INC. | MANAGEMENT'S DISCUSSION & ANALYSIS |
| | |
the Credit Facility. The Credit Facility provides additional liquidity to the Company for short-term or longer-term needs. As of March 31, 2024, we have not borrowed any money under the Credit Facility.
INSURANCE COMPANY SUBSIDIARY LIQUIDITY AND CAPITAL RESOURCES
The liquidity requirements of our insurance operations are primarily met by premium revenues, investment income and proceeds from investment maturities, calls or sales. Primary cash needs are for payments of policyholder benefits, investment purchases, policy acquisition costs and other operating expenses. We manage our insurance operations in order to ensure that we have stable and reliable sources of cash flow to meet our obligations. As we have discussed, we recently re-launched our domestic business by developing new products and expanding our distribution channels, which has led to an increase in first year premiums (i.e., new sales) of 42% from 2023 to 2024. When selling new policies, we incur upfront policy acquisition costs, such as agent commission payments. While historically, cash flows from our operations have been sufficient to meet our cash needs, the insurance companies also have the available-for-sale fixed maturity investment portfolio available to create additional cash flows if required. Two of our insurance subsidiaries are members of the Federal Home Loan Bank (FHLB) of Dallas. FHLB membership provides the insurance subsidiaries with access to various low-cost collateralized borrowings and funding agreements. While not the only source of additional liquidity, the FHLB could provide the insurance subsidiaries with an additional source of liquidity, if needed.
We believe that we have adequate capital resources and ability to obtain additional capital if needed to support the short-term and longer-term liquidity requirements of our insurance operations. See Contractual Obligations and Off-balance Sheet Arrangements in our Form 10-K and below for a discussion of known and estimated cash needs. Cash flow projections and cash flow tests under various market interest rate scenarios are performed annually to assist in evaluating liquidity needs and adequacy.
Cash from Operating Activities. Cash provided by or used in operating activities is an important liquidity metric because it reflects, during a given period, the amount of cash generated that is available to pay our operating expenses, invest in our business or make strategic acquisitions. In the nine months ended September 30, 2023, our operations provided $15.4 million in net cash.
Cash from Investing Activities. We have traditionally also had significant cash flows from both scheduled and unscheduled investment security maturities, redemptions, and prepayments. These cash flows, for the most part, are reinvested in fixed income securities and to a lesser extent limited partnerships or other alternative investments. Net cash outflows from investing activities totaled $18.5 million for the nine months ended September 30, 2023. The investing activities fluctuate from period to period due to timing of security activities such as calls and maturities and reinvestment of those funds. We purchased $50.1 million in fixed maturity securities and we also used $13.3 million to purchase other long-term investments. 86% of our total cash, cash equivalents and investments consist of marketable fixed maturity securities classified as available-for-sale that could be readily converted to cash for liquidity needs.
Trends, Demands and Restrictions on our Uses of Cash
Because claims and surrenders are our largest expense, a primary liquidity concern is the risk of either (i) an extraordinary level of early policyholder surrenders, or (ii) higher than expected mortality experience. Our death benefit payments have declinedincreased in the ninethree months ended September 30, 2023 and we believe mortalityMarch 31, 2024 which is expected as the amount of insurance issued has normalized to pre-pandemic levels. However, as previously discussed, surrenderincreased significantly over the past couple of years. Surrender benefits, which have been higher than usual the last several years, and have continued to increaseslightly decreased in the first ninethree months of 2023 despite our retention initiatives.2024. In order to mitigate the risk of early policyholder surrenders, we include provisions in our insurance policies, such as surrender charges, that help limit and discourage early withdrawal, but as many of our policies have reached the age where surrender charges have expired or significantly decreased, we are experiencing higherhave experienced high levels of surrenders. Additionally, we believe that surrenders are increasinghave been high due to other reasons, including the loss of one of our biggest distributors in Venezuela in 2018, increasing interest rates, which may encourage policyholders to seek higher rates of returns in different investment products, post-pandemic beliefs that life insurance may not be as important as it was during the pandemic, and inflationary pressures, which may cause policyholders to want the cash values of their policies due to decreased purchasing power elsewhere. To the extent that early surrenders are higher than expected, our liquidity could be negatively impacted due to benefit payments as well as lower renewal premiums. We continue to monitor surrenders and early withdrawals as well as mortality experience.and focus on our retention initiatives.
Our endowment products have contractual maturity dates and provide the policyholder with alternatives once the policy matures - they can choose to take a lump sum payout or leave the money on deposit at interest with the Company. Approximately 18% of the endowments in force, totaling approximately 6% of our in force business as of September 30, 2023,March 31, 2024, will mature in the next five years. Policyholder election behavior is unknown, but if too many policyholders elect lump sum distributions, the Company could be exposed to liquidity risk in years of high maturities. Meeting these distributions could require the Company to sell its investments at inopportune times to pay policyholder withdrawals. Alternatively, if the policyholders were to leave the money on deposit with the Company at interest, our profitability could be impacted if the product guaranteed rate is higher than the market rate we are earning on our investments. We currently anticipate that our available operating cash flow and capital resources will be adequate to meet our needs for funds, but we are closely monitoring our policyholder behavior patterns.
| | | | | | | | |
| CITIZENS, INC. | MANAGEMENT'S DISCUSSION & ANALYSIS |
| | |
In our CICA Domestic business, we pay advance commissions on some of our insurance products, meaning we pay an agent their commission immediately upon sale of a policy, rather than "as earned", or when premiums are received by us. Because of this, another liquidity concern is the risk that rapid growth in first year sales of these products could create a significant increase in commission payments, which increases expenses and thus reduces our statutory capital until the commissions are recouped from premiums paid. CICA Domestic sales have increased significantly since the third quarter of 2023 and continue to grow rapidly. To mitigate this risk and strain on capital, we may seek options, such as reinsurance or loans at the holding company level (from the Credit Facility or otherwise) that would allow us to reduce the liquidity risk should CICA Domestic's required commission payments exceed current resources. If we are unable to purchase reinsurance protection in amounts that we consider sufficient or unable to borrow money to contribute capital to CICA Domestic, we could be exposed to cash flow strain.
As discussed above, we are subject to regulatory capital requirements that could affect the Company’s ability to access capital from our insurance operations or cause the Company to have to put additional cash in our wholly-owned subsidiaries.
Our domestic companies are subject to minimum capital requirements set by the NAIC in the form of risk-based capital ("RBC"). RBC considers the type of business written by an insurance company, the quality of its assets, and
September 30, 2023 | 10-Q 62
| | | | | | | | |
CITIZENS, INC. | MANAGEMENT'S DISCUSSION & ANALYSIS |
| | |
various other aspects of an insurance company's business to develop a minimum level of capital called "Authorized Control Level Risk-Based Capital". This level of capital is then compared to an adjusted statutory capital that includes capital and surplus as reported under statutory accounting principles, plus certain investment reserves. Should the ratio of adjusted statutory capital to control level RBC fall below 200% for our domestic companies, a series of remedial actions by the affected company would be required. Additionally, we have a parental guaranteeCapital Maintenance Agreement between Citizens and CICA Domestic, Citizens' wholly-owned subsidiary domiciled in Colorado, that would require Citizens to contribute capital to CICA Domestic in order to maintain a RBC level above 350%. At September 30, 2023,March 31, 2024, our domestic insurance subsidiaries were above the required minimum RBC levels.levels and CICA Domestic was above 350%.
For CICA Domestic, commission advances are non-admitted assets, which increases required regulatory capital and reduces the excess capital available. As discussed above, management is investigating various options in order to reduce both regulatory capital and liquidity risk should the capital required to support this pace of growth exceed current resources. Citizens may have to contribute capital to CICA Domestic to maintain the required RBC ratio.
CICA PRInternational is a Puerto Rico domiciled company. The Insurance Code of Puerto Rico does not specifically set forth minimum capital and surplus standards, but rather requires that an insurer submit a business plan for approval to the OIC that includes proposed minimum capital and surplus. CICA PRInternational is required to maintain a minimum of $750,000 in capital and maintain a premium to surplus ratio of 7 to 1. CICA PRInternational began issuing new business as of January 1, 2023 and received the transfer of all of CICA International'sBermuda's in force insurance business as of August 31, 2023. On that date, Citizens entered into a Keep Well Agreement with CICA PRInternational to replace the Keep Well Agreement that had been in place between Citizens and CICA International (Bermuda).Bermuda. The Keep Well Agreement requires Citizens to contribute up to $10 million in capital to CICA PRInternational as necessary to ensure that CICA PRInternational maintains at least either (i) 112% of its required ratio of premiums to capital and surplus, or (ii) 200% of the minimum capital and surplus requirement, whichever is higher. The initial term of the Keep Well Agreement is 12 months. Since CICA PR'sInternational's capital exceeds both of the metrics, Citizens is not required to make a capital contribution.
Any capital that Citizens is required to contribute to its insurance subsidiaries could negatively impact the Company's capital resources and liquidity.
| | | | | | | | |
| CITIZENS, INC. | MANAGEMENT'S DISCUSSION & ANALYSIS |
| | |
CONTRACTUAL OBLIGATIONS AND OFF-BALANCE SHEET ARRANGEMENTS
As of September 30, 2023,March 31, 2024, we have no additional contractual obligations or off-balance sheet arrangements other than those described in Part I. Item 1, Note 7. Commitments and Contingencies in the notes to our consolidated financial statements herein and in Part II, Item 7, Contractual Obligations and Off-Balance Sheet Arrangements in our Form 10-K. We do not utilize special purpose entities as investment vehicles, nor are there any such entities in which we have an investment that engage in speculative activities of any nature, and we do not use such investments to hedge our investment positions.
CRITICAL ACCOUNTING POLICIES
We believe that the accounting policies set forth in Part I, Item 7, Management’s Discussion and Analysis of Financial Condition and Results of Operations - "Critical Accounting Policies" and Part IV, Item 15, Note 1. Summary of Significant Accounting Policies of our consolidated financial statements in our Form 10-K continue to describe the significant judgments and estimates used in the preparation of our consolidated financial statements except as follows. The following items have changed due to adoption of Accounting Standard Update ("ASU") No. 2018-12, Financial Services-Insurance (Topic 944): Targeted Improvements to the Accounting for Long-Duration Contracts.
DEFERRED POLICY ACQUISITION COSTS
DAC are costs that are incremental and directly related to the successful acquisition of new or renewal insurance contracts. Such costs include the incremental direct costs of contract acquisition, such as sales commissions; the portion of employees’ total compensation and payroll-related fringe benefits related directly to time spent performing acquisition activities, such as underwriting, issuing, and processing policies for contracts that have actually been acquired; and other costs related directly to acquisition activities that would not have been incurred if the contract had not been acquired.
Inherent in the capitalization and amortization of DAC are certain management judgements about what acquisition costs are deferred. Approximately 93% of our capitalized DAC are attributed to first year and renewal excess commissions. The remaining 7% are attributed to other costs that vary with and are directly related to the
September 30, 2023 | 10-Q 63
| | | | | | | | |
CITIZENS, INC. | MANAGEMENT'S DISCUSSION & ANALYSIS |
| | |
successful acquisition of new insurance business. Those costs generally include costs related to the production, underwriting and issuance of new business.
DAC is amortized on a constant level basis over the expected term of the related contracts to approximate straight-line amortization. For the Life Insurance segment, the constant level basis used is policy count in force. For the Home Service Insurance segment, the constant level basis used is face amount in force. The constant level bases used for amortization are projected using mortality and lapse assumptions that are based on the Company’s experience, industry data, and other factors at the end of each reporting period and are consistent with those used for the liability for future policy benefit life reserves. Annually, the Company completes experience studies to evaluate mortality and lapse. If those assumptions are updated, the DAC amortization basis is recalculated and the impact of the assumption change will be reflected in the cohort level amortization in future periods.
COST OF INSURANCE ACQUIRED
The Company recognizes an intangible asset that arises in the application of U.S. GAAP purchase accounting as the difference between the reported value and the fair value of insurance contract liabilities, or comparable amounts determined in purchased insurance business combinations. This intangible asset is referred to as the Cost of Insurance Acquired (“COIA”), which is amortized on a basis consistent with DAC, such that it is amortized in proportion to policies in force for the Life Insurance segment and face amount in force for the Home Service Insurance segment to approximate straight-line amortization. Inherent in the amortization of COIA are certain management judgements about the ending asset balance and the annual amortization. The key assumptions are based upon interest, mortality and lapses at the time of purchase.
A recoverability test that considers, among other things, actual experience and projected future experience is performed at least annually. These annual recoverability tests are based initially on an estimate of the available premium (gross premium less the benefit and expense portion of premium) for the next 50 years using best estimate assumptions related to interest rates, mortality and lapses. Management believes that our COIA is recoverable for the three and nine months ended September 30, 2023. This belief is based upon the analysis performed on estimated future results of the block and our annual recoverability testing.
POLICY LIABILITIES
As premium revenue is recognized, a liability for future policy benefits is accrued. The liability for a future policy benefit is the present value of estimated future policy benefits to be paid to or on behalf of policyholders less the present value of estimated future net premiums to be collected from policyholders. The liability is estimated using current assumptions that include investment yields, discount rate, mortality and lapses and withdrawals. These current assumptions are based on judgements that consider the Company’s historical experience, industry data, and other factors. Annually, the Company completes experience studies to evaluate mortality and lapses. The results of these studies are used to update current year best estimate assumptions used in establishing benefit liabilities and DAC.
The current discount rate assumption is a yield curve that equals the yield of an upper-medium grade fixed income instrument, based on an A-quality corporate bond. The current discount rate assumption is updated quarterly and used to remeasure the liability at the reporting date, with the resulting change reflected in other comprehensive income. For liability cash flows that are projected beyond the duration of market-observable A credit-rated fixed-income instruments, the Company uses the last market-observable yield level and uses linear interpolation to determine yield assumptions for durations that do not have market observable yields. The locked-in discount rate for policies issued prior to transition equals the rate set at contract issuance. For current year issues, the locked-in discount rate is the average of the current year quarterly discount rates and will change throughout the year as new discount rates are calculated, with the change reflected in net income.
September 30, 2023 | 10-Q 64
Item 3. QUANTITATIVE AND QUALITATIVE DISCLOSURES ABOUT MARKET RISK
As a smaller reporting company, we have elected to comply with certain scaled disclosure reporting obligations and therefore are not required to provide the information required by this Item.
Item 4. CONTROLS AND PROCEDURES
EVALUATION OF DISCLOSURE CONTROLS AND PROCEDURES
We maintain disclosure controls and procedures (as defined in Rules 13a-15(e) and 15d-15(e) under the Securities Exchange Act of 1934, as amended (the "Exchange Act")) that are designed to ensure that information required to be disclosed in our reports filed or submitted under the Exchange Act is recorded, processed, summarized and reported within the time periods specified in the SEC’s rules and forms, and that such information is accumulated and communicated to our management, including our principal executive officer and principal financial officer, to allow timely decisions regarding required disclosures.
Our management, including our principal executive officer and principal financial officer, evaluated the effectiveness of our disclosure controls and procedures pursuant to Rules 13a-15(e) and 15d-15(e) under the Exchange Act as of September 30, 2023.March 31, 2024. Based on such evaluation, our principal executive officer and principal financial officer concluded that our disclosure controls and procedures were effective as of September 30, 2023March 31, 2024 to provide reasonable assurance that information required to be disclosed by us in the reports that we file or submit under the Exchange Act is recorded, processed, summarized and reported within the time periods specified in the rules and forms of the SEC and such information is accumulated and reported to management, including our principal executive and financial officers, as appropriate to allow timely decisions regarding disclosure.
CHANGES IN INTERNAL CONTROL OVER FINANCIAL REPORTING
During the three months ended September 30, 2023,March 31, 2024, there were no changes in the Company's internal control over financial reporting (as defined in rules 13a-15(f) and 15d-15(f) under the Exchange Act) that materially affected, or are reasonably likely to materially affect, our internal control over financial reporting.
September 30, 2023March 31, 2024 | 10-Q 6552
PART II. OTHER INFORMATION
Item 1. LEGAL PROCEEDINGS
Trade Secret Lawsuit
Part I, Item 3. Legal Proceedings
In the first quarter of
our Form 10-K includes2024, a discussionjury trial was held in the “trade secret lawsuit”. The trade secret lawsuit was filed in 2018 by Citizens, CICA Life Ltd. (Bermuda) and CICA Life Insurance Company of ourAmerica (collectively, the “Citizens Companies,” “we,” "us" or "our") against certain former employees and independent consultants who we alleged unlawfully took Citizens’ confidential information in order to unfairly compete with us. Our claims against these parties included various unfair competition, tortious interference, breach of contract and other related claims.
The jury found that (i) Defendant Carlos Nalsen Landa (“Landa”), a former independent consultant, misappropriated the Citizens’ Companies policyholder information, (ii) Citizens’ former chief underwriter, Michael P. Buchweitz (“Buchweitz”) and Randall Riley (“Riley”), a former Citizens executive and son of Citizens’ founder Harold E. Riley, failed to comply with their Citizens’ confidentiality agreements, and (iii) both Buchweitz and Riley intentionally interfered with former Chief Actuary Jonathan Pollio’s ("Pollio") Citizens’ confidentiality agreement. For Buchweitz, the jury also found that he did not have a good faith belief that he was acting in the bona fide exercise of his own rights when he interfered with Pollio’s Citizens’ confidentiality agreement. Despite these findings, the jury did not believe that the above-mentioned actions damaged the Citizens Companies economically and thus did not assess any monetary damages against any of the above parties. Additionally, the jury found that Citizens should pay Alexis Delgado (“Delgado”, a former independent consultant) and Landa approximately $1.3 million for “money had and received”, an equitable theory that claimed that the Citizens Companies would be unjustly enriched if they didn’t pay past and future commissions to Delgado and Landa, which was accrued at December 31, 2023.
On April 30, 2024, Defendants Riley (through his estate), Buchweitz and Delgado filed a motion against the Citizens Companies seeking approximately $3.9 million in legal
proceedings. Therefees. We do not believe that their claim has merit because they were found to have breached the contracts whose fee shifting provisions they seek to invoke and we intend to contest this motion, which is set for hearing on May 10, 2024, therefore no amounts have been
no material developments inaccrued for this claim. We also do not believe the
three months ended September 30, 2023 from the legal proceedings described in our Form 10-K exceptjury properly found that the trial in the Trade Secret Lawsuit (as definedDelgado or Landa were entitled to any prior or future commissions and described in Part I, Item 3. Legal Proceedings of our Form 10-K), which was delayed in October 2022 dueintend to the death of one of the defendants, has been rescheduled for February 2024.contest this verdict.
Item 1A. RISK FACTORS
Part I, Item 1A. Risk Factors of our Form 10-K includes a discussion of our risk factors. There have been no material changes in the three months ended September 30, 2023March 31, 2024 from the risk factors included in our Form 10-K.
Item 2. UNREGISTERED SALES OF EQUITY SECURITIES AND USE OF PROCEEDS
None.
Item 3. DEFAULTS UPON SENIOR SECURITIES
Not applicable.
Item 4. MINE SAFETY DISCLOSURES
Not applicable.
Item 5. OTHER INFORMATION
During the three months ended September 30, 2023,March 31, 2024, none of the Company’s directors or executive officers adopted or terminated any contract, instruction or written plan for the purchase or sale of Citizens, Inc. securities that was intended to satisfy the affirmative defense conditions of Rule 10b5-1(c) or any “non-Rule 10b5-1 trading arrangement.” Additionally, Citizens did not adopt or terminate any Rule 10b5-1 trading arrangement during the three months ended September 30, 2023.March 31, 2024.
September 30, 2023 | 10-Q 66
Item 6. EXHIBITS
| | | | | | | | |
Exhibit Number | | The following exhibits are filed herewith: |
| | |
| | |
| | |
| | |
| | |
| | |
| | |
| | |
| 101* | | Inline XBRL Document Set for the condensed consolidated financial statements and accompanying notes in Part I, Item 1, Financial Statements of this Quarterly Report on Form 10-Q* |
| 104* | | Inline XBRL for the cover page of this Quarterly Report on Form 10-Q, included in the Exhibit 101 Inline XBRL Document Set* |
* Filed herewith.
† Indicates management contract or compensatory plan or arrangement.
September 30, 2023March 31, 2024 | 10-Q 6754
SIGNATURES
Pursuant to the requirements of the Securities Exchange Act of 1934, the Registrant has duly caused this report to be signed on its behalf by the undersigned thereunto duly authorized.
| | | | | | | | | | | |
| | CITIZENS, INC. |
| | |
| | | |
| | By: | /s/ Gerald W. Shields |
| | | Gerald W. Shields |
| | | Chief Executive Officer & President |
| | | |
| | | |
| | By: | /s/ Jeffery P. Conklin |
| | | Jeffery P. Conklin |
| | | Vice President, Chief Financial Officer, Chief Investment Officer & Treasurer |
| | | |
| | | |
| | | |
| Date: | November 6, 2023May 7, 2024 | | |
September 30, 2023March 31, 2024 | 10-Q 6855