Use these links to rapidly review the document
UNITED STATES
SECURITIES AND EXCHANGE COMMISSION
Washington, D.C. 20549
FORM 10-Q
|
| |
| (Mark One) |
| ý | QUARTERLY REPORT PURSUANT TO SECTION 13 OR 15(d) OF THE SECURITIES EXCHANGE ACT OF 1934 |
For the Quarterly period ended March 31, 20172018 |
| OR |
| o | TRANSITION REPORT PURSUANT TO SECTION 13 OR 15(d) OF THE SECURITIES EXCHANGE ACT OF 1934 |
| For the transition period from ______ to ______ . |
Commission File Number: 1-14829
Molson Coors Brewing Company
(Exact name of registrant as specified in its charter)
|
| | |
DELAWARE (State or other jurisdiction of incorporation or organization) | | 84-0178360 (I.R.S. Employer Identification No.) |
1801 California Street, Suite 4600, Denver, Colorado, USA 1555 Notre Dame Street East, Montréal, Québec, Canada (Address of principal executive offices) | | 80202 H2L 2R5 (Zip Code) |
303-927-2337 (Colorado)
514-521-1786 (Québec)
(Registrant's telephone number, including area code)
Indicate by check mark whether the registrant (1) has filed all reports required to be filed by Section 13 or 15(d) of the Securities Exchange Act of 1934 during the preceding 12 months (or for such shorter period that the registrant was required to file such reports), and (2) has been subject to such filing requirements for the past 90 days. Yes ý No o
Indicate by check mark whether the registrant has submitted electronically and posted on its corporate Web site, if any, every Interactive Data File required to be submitted and posted pursuant to Rule 405 of Regulation S-T (§232.405 of this chapter) during the preceding 12 months (or for such shorter period that the registrant was required to submit and post such files). Yes ý No o
Indicate by check mark whether the registrant is a large accelerated filer, an accelerated filer, a non-accelerated filer, smaller reporting company, or an emerging growth company. See the definitions of "large accelerated filer," "accelerated filer," "smaller reporting company" and "emerging growth company" in Rule 12b-2 of the Exchange Act.
|
| | | | | | | | |
Large accelerated filer ý | | Accelerated filer o | | Non-accelerated filer o | | Smaller reporting company o | | Emerging growth company o |
| | | (Do not check if a smaller reporting company) |
Indicate by check mark whether the registrant is a shell company (as defined in Rule 12b-2 of the Exchange Act). Yes o No ý
If an emerging growth company, indicate by check mark if the registrant has elected not to use the extended transition period for complying with any new or revised financial accounting standards provided pursuant to Section 13(a) of the Exchange Act. o
Indicate by check mark whether the registrant is a shell company (as defined in Rule 12b-2 of the Exchange Act). Yes o No ý
Indicate the number of shares outstanding of each of the registrant's classes of common stock, as of April 28, 201726, 2018:
Class A Common Stock— 2,560,948Stock — 2,560,668 shares
Class B Common Stock—194,746,610Stock — 195,585,037 shares
Exchangeable shares:
As of April 28, 2017,26, 2018, the following number of exchangeable shares were outstanding for Molson Coors Canada, Inc.:
Class A Exchangeable shares—2,878,936shares — 2,878,432 shares
Class B Exchangeable shares—15,093,021shares — 14,691,564 shares
The Class A exchangeable shares and Class B exchangeable shares are shares of the share capital in Molson Coors Canada Inc., a wholly-owned subsidiary of the registrant. They are publicly traded on the Toronto Stock Exchange under the symbols TPX.A and TPX.B, respectively. These shares are intended to provide substantially the same economic and voting rights as the corresponding class of Molson Coors common stock in which they may be exchanged. In addition to the registered Class A common stock and the Class B common stock, the registrant has also issued and outstanding one share each of a Special Class A voting stock and Special Class B voting stock. The Special Class A voting stock and the Special Class B voting stock provide the mechanism for holders of Class A exchangeable shares and Class B exchangeable shares to be provided instructions to vote with the holders of the Class A common stock and the Class B common stock, respectively. The holders of the Special Class A voting stock and Special Class B voting stock are entitled to one vote for each outstanding Class A exchangeable share and Class B exchangeable share, respectively, excluding shares held by the registrant or its subsidiaries, and generally vote together with the Class A common stock and Class B common stock, respectively, on all matters on which the Class A common stock and Class B common stock are entitled to vote. The Special Class A voting stock and Special Class B voting stock are subject to a voting trust arrangement. The trustee which holds the Special Class A voting stock and the Special Class B voting stock is required to cast a number of votes equal to the number of then-outstanding Class A exchangeable shares and Class B exchangeable shares, respectively, but will only cast a number of votes equal to the number of Class A exchangeable shares and Class B exchangeable shares as to which it has received voting instructions from the owners of record of those Class A exchangeable shares and Class B exchangeable shares, other than the registrant or its subsidiaries, respectively, on the record date, and will cast the votes in accordance with such instructions so received.
MOLSON COORS BREWING COMPANY AND SUBSIDIARIES
INDEX
Glossary of Terms and Abbreviations
|
| |
| Acquisition | Refers to the acquisition of SABMiller plc's ("SABMiller") 58% economic interest and 50% voting interest in MillerCoors LLC ("MillerCoors") and all trademarks, contracts and other assets primarily related to the "Miller International Business," as defined in the purchase agreement, outside of the U.S. and Puerto Rico from Anheuser-Busch InBev SA/NV ("ABI"), on October 11, 2016. |
AOCI | Accumulated other comprehensive income (loss) |
CAD | Canadian dollar |
| CZK | Czech Koruna |
| DBRS | A global credit rating agency in Toronto |
| DSUs | Deferred stock units |
| EBITDA | Earnings before interest, tax, depreciation and amortization |
EPS | Earnings per share |
| EUR | Euro |
FASB | Financial Accounting Standards Board |
GBP | British Pound |
| HRK | Croatian Kuna |
JPY | Japanese Yen |
| Moody’s | Moody’s Investors Service Limited, a nationally recognized statistical rating organization designated by the SEC |
| OCI | Other comprehensive income (loss) |
OPEB | Other postretirement benefit plans |
| PSUs | Performance share units |
RSD | Serbian Dinar |
| RSUs | Restricted stock units |
| S&P 500 | Standard & Poor’s 500 Index® |
| SEC | Securities and Exchange Commission |
| Standard & Poor’s | Standard and Poor’s Ratings Services, a nationally recognized statistical rating organization designated by the SEC |
| SOSARs | Stock-only stock appreciation rights |
| STRs | Sales-to-retailers |
| STWs | Sales-to-wholesalers |
| U.K. | United Kingdom |
U.S. | United States |
| U.S. GAAP | Accounting principles generally accepted in the United States of America |
| USD or $ | U.S. dollar |
| VIEs | Variable interest entities |
Cautionary Statement Pursuant to Safe Harbor Provisions of the Private Securities Litigation Reform Act of 1995
This report contains forward-looking statements within the meaning of Section 27A of the Securities Act of 1933, as amended, and Section 21E of the Securities Exchange Act of 1934, as amended (the "Exchange Act"). From time to time, we may also provide oral or written forward-looking statements in other materials we release to the public. Such forward-looking statements are subject to the safe harbor created by the Private Securities Litigation Reform Act of 1995.
Statements that refer to projections of our future financial performance, anticipated trends in our businesses, and other characterizations of future events or circumstances are forward-looking statements, and include, but are not limited to, statements under the headings "Management's Discussion and Analysis of Financial Condition and Results of Operations," and under the heading "Outlook for 20172018" therein, relating to overall volume trends, consumer preferences, pricing trends, industry forces, cost reduction strategies, anticipated results, anticipated synergies, anticipated tax rates and benefits, expectations for funding future capital expenditures and operations, debt service capabilities, shipment levels and profitability, market share and the sufficiency of capital resources. In addition, statements that we make in this report that are not statements of historical fact may also be forward-looking statements. Words such as "expects," "goals," "plans," "believes," "continues," "may," "anticipate," "seek," "estimate," "outlook," "trends," "future benefits," "potential," "projects," "strategies," and variations of such words and similar expressions are intended to identify forward-looking statements.
Forward-looking statements are subject to risks and uncertainties that could cause actual results to be materially different from those indicated (both favorably and unfavorably). These risks and uncertainties include, but are not limited to those described under the heading "Risk Factors," elsewhere throughout this report, and those described from time to time in our past and future reports filed with the Securities and Exchange Commission ("SEC"),SEC, including in our Annual Report on Form 10-K for the year ended December 31, 20162017. Caution should be taken not to place undue reliance on any such forward-looking statements. Forward-looking statements speak only as of the date when made and we undertake no obligation to update any forward-looking statement, whether as a result of new information, future events or otherwise.
Market and Industry Data
The market and industry data used in this Quarterly Report on Form 10-Q are based on independent industry publications, customers, trade or business organizations, reports by market research firms and other published statistical information from third parties, as well as information based on management’s good faith estimates, which we derive from our review of internal information and independent sources. Although we believe these sources to be reliable, we have not independently verified the accuracy or completeness of the information.
PART I. FINANCIAL INFORMATION
ITEM 1. FINANCIAL STATEMENTS
MOLSON COORS BREWING COMPANY AND SUBSIDIARIES
CONDENSED CONSOLIDATED STATEMENTS OF OPERATIONS
(IN MILLIONS, EXCEPT PER SHARE DATA)
(UNAUDITED)
|
| | | | | | | |
| | Three Months Ended |
| | March 31, 2017 | | March 31, 2016 |
| Sales | $ | 2,913.8 |
| | $ | 950.8 |
|
| Excise taxes | (465.1 | ) | | (293.6 | ) |
| Net sales | 2,448.7 |
| | 657.2 |
|
| Cost of goods sold | (1,372.9 | ) | | (414.0 | ) |
| Gross profit | 1,075.8 |
| | 243.2 |
|
| Marketing, general and administrative expenses | (702.8 | ) | | (250.9 | ) |
| Special items, net | (3.8 | ) | | 108.6 |
|
| Equity income in MillerCoors | — |
| | 142.4 |
|
| Operating income (loss) | 369.2 |
| | 243.3 |
|
| Interest income (expense), net | (96.6 | ) | | (47.3 | ) |
| Other income (expense), net | 0.4 |
| | (15.3 | ) |
| Income (loss) from continuing operations before income taxes | 273.0 |
| | 180.7 |
|
| Income tax benefit (expense) | (64.6 | ) | | (16.7 | ) |
| Net income (loss) from continuing operations | 208.4 |
| | 164.0 |
|
| Income (loss) from discontinued operations, net of tax | (0.6 | ) | | (0.5 | ) |
| Net income (loss) including noncontrolling interests | 207.8 |
| | 163.5 |
|
| Net (income) loss attributable to noncontrolling interests | (6.5 | ) | | (0.8 | ) |
| Net income (loss) attributable to Molson Coors Brewing Company | $ | 201.3 |
| | $ | 162.7 |
|
| Basic net income (loss) attributable to Molson Coors Brewing Company per share: | | | |
| From continuing operations | $ | 0.94 |
| | $ | 0.80 |
|
| From discontinued operations | — |
| | — |
|
| Basic net income (loss) attributable to Molson Coors Brewing Company per share | $ | 0.94 |
| | $ | 0.80 |
|
| Diluted net income (loss) attributable to Molson Coors Brewing Company per share: | | | |
| From continuing operations | $ | 0.93 |
| | $ | 0.80 |
|
| From discontinued operations | — |
| | — |
|
| Diluted net income (loss) attributable to Molson Coors Brewing Company per share | $ | 0.93 |
| | $ | 0.80 |
|
| Weighted-average shares—basic | 215.0 |
| | 203.6 |
|
| Weighted-average shares—diluted | 216.5 |
| | 205.1 |
|
| Amounts attributable to Molson Coors Brewing Company | | | |
| Net income (loss) from continuing operations | $ | 201.9 |
| | $ | 163.2 |
|
| Income (loss) from discontinued operations, net of tax | (0.6 | ) | | (0.5 | ) |
| Net income (loss) attributable to Molson Coors Brewing Company | $ | 201.3 |
| | $ | 162.7 |
|
|
| | | | | | | |
| | Three Months Ended |
| | March 31, 2018 | | March 31, 2017 |
| Sales | $ | 2,868.0 |
| | $ | 2,913.8 |
|
| Excise taxes | (536.5 | ) | | (465.1 | ) |
| Net sales | 2,331.5 |
| | 2,448.7 |
|
| Cost of goods sold | (1,535.7 | ) | | (1,372.3 | ) |
| Gross profit | 795.8 |
| | 1,076.4 |
|
| Marketing, general and administrative expenses | (681.1 | ) | | (705.3 | ) |
| Special items, net | 314.8 |
| | (6.7 | ) |
| Operating income (loss) | 429.5 |
| | 364.4 |
|
| Interest income (expense), net | (83.2 | ) | | (96.6 | ) |
| Other pension and postretirement benefits (costs), net | 10.0 |
| | 13.3 |
|
| Other income (expense), net | 1.1 |
| | (0.2 | ) |
| Income (loss) before income taxes | 357.4 |
| | 280.9 |
|
| Income tax benefit (expense) | (74.9 | ) | | (65.9 | ) |
| Net income (loss) | 282.5 |
| | 215.0 |
|
| Net (income) loss attributable to noncontrolling interests | (4.4 | ) | | (6.5 | ) |
| Net income (loss) attributable to Molson Coors Brewing Company | $ | 278.1 |
| | $ | 208.5 |
|
| | | | |
| Net income (loss) attributable to Molson Coors Brewing Company per share: | | | |
| Basic | $ | 1.29 |
| | $ | 0.97 |
|
| Diluted | $ | 1.28 |
| | $ | 0.96 |
|
| | | | |
| Weighted-average shares outstanding: | | | |
| Basic | 215.8 |
| | 215.0 |
|
| Dilutive effect of share-based awards | 0.8 |
| | 1.5 |
|
| Diluted | 216.6 |
| | 216.5 |
|
| | | | |
| Anti-dilutive securities excluded from the computation of diluted EPS | 0.5 |
| | 0.2 |
|
| | | | |
| Dividends declared and paid per share | $ | 0.41 |
| | $ | 0.41 |
|
See notes to unaudited condensed consolidated financial statements.
MOLSON COORS BREWING COMPANY AND SUBSIDIARIES
CONDENSED CONSOLIDATED STATEMENTS OF COMPREHENSIVE INCOME (LOSS)
(IN MILLIONS)
(UNAUDITED)
| | | | Three Months Ended | Three Months Ended |
| | March 31, 2017 | | March 31, 2016 | March 31, 2018 | | March 31, 2017 |
| Net income (loss) including noncontrolling interests | $ | 207.8 |
| | $ | 163.5 |
| $ | 282.5 |
| | $ | 215.0 |
|
| Other comprehensive income (loss), net of tax: | | | | | | |
| Foreign currency translation adjustments | 81.6 |
| | 266.9 |
| 74.1 |
| | 81.6 |
|
| Unrealized gain (loss) on derivative and non-derivative financial instruments | (8.6 | ) | | (19.7 | ) | (25.8 | ) | | (8.6 | ) |
| Reclassification of derivative (gain) loss to income | — |
| | (2.4 | ) | 1.1 |
| | — |
|
| Pension and other postretirement benefit adjustments | 1.6 |
| | — |
| |
| Amortization of net prior service (benefit) cost and net actuarial (gain) loss to income | — |
| | 7.0 |
| 1.7 |
| | (1.0 | ) |
| Ownership share of unconsolidated subsidiaries' other comprehensive income (loss) | 1.1 |
| | 4.8 |
| (1.2 | ) | | 1.1 |
|
| Total other comprehensive income (loss), net of tax | 75.7 |
| | 256.6 |
| 49.9 |
| | 73.1 |
|
| Comprehensive income (loss) | 283.5 |
| | 420.1 |
| 332.4 |
| | 288.1 |
|
| Comprehensive (income) loss attributable to noncontrolling interests | (6.9 | ) | | (0.4 | ) | (5.2 | ) | | (6.9 | ) |
| Comprehensive income (loss) attributable to Molson Coors Brewing Company | $ | 276.6 |
| | $ | 419.7 |
| $ | 327.2 |
| | $ | 281.2 |
|
See notes to unaudited condensed consolidated financial statements.
MOLSON COORS BREWING COMPANY AND SUBSIDIARIES CONDENSED CONSOLIDATED BALANCE SHEETS (IN MILLIONS, EXCEPT PAR VALUE) (UNAUDITED) | MOLSON COORS BREWING COMPANY AND SUBSIDIARIES CONDENSED CONSOLIDATED BALANCE SHEETS (IN MILLIONS, EXCEPT PAR VALUE) (UNAUDITED) | MOLSON COORS BREWING COMPANY AND SUBSIDIARIES CONDENSED CONSOLIDATED BALANCE SHEETS (IN MILLIONS, EXCEPT PAR VALUE) (UNAUDITED) |
| | | As of | As of |
| | March 31, 2017 | | December 31, 2016 | March 31, 2018 | | December 31, 2017 |
| Assets | | | | | | |
| Current assets: | | | | | | |
| Cash and cash equivalents | $ | 395.0 |
| | $ | 560.9 |
| $ | 197.9 |
| | $ | 418.6 |
|
| Accounts receivable, net | 756.5 |
| | 669.5 |
| 779.3 |
| | 733.8 |
|
| Other receivables, net | 166.5 |
| | 135.8 |
| 168.0 |
| | 168.2 |
|
| Inventories, net | 663.5 |
| | 592.7 |
| 665.6 |
| | 591.5 |
|
| Other current assets, net | 297.7 |
| | 210.7 |
| 326.2 |
| | 277.6 |
|
| Total current assets | 2,279.2 |
| | 2,169.6 |
| 2,137.0 |
| | 2,189.7 |
|
| Properties, net | 4,528.8 |
| | 4,507.4 |
| 4,680.8 |
| | 4,673.7 |
|
| Goodwill | 8,276.2 |
| | 8,250.1 |
| 8,442.7 |
| | 8,405.5 |
|
| Other intangibles, net | 14,032.6 |
| | 14,031.9 |
| 14,237.6 |
| | 14,296.5 |
|
| Other assets | 426.1 |
| | 382.5 |
| 686.4 |
| | 681.5 |
|
| Total assets | $ | 29,542.9 |
| | $ | 29,341.5 |
| $ | 30,184.5 |
| | $ | 30,246.9 |
|
| Liabilities and equity | | | | | | |
| Current liabilities: | | | | | | |
| Accounts payable and other current liabilities | $ | 2,200.5 |
| | $ | 2,467.7 |
| $ | 2,537.1 |
| | $ | 2,684.5 |
|
| Current portion of long-term debt and short-term borrowings | 843.0 |
| | 684.8 |
| 1,591.3 |
| | 714.8 |
|
| Discontinued operations | 5.2 |
| | 5.0 |
| |
| Total current liabilities | 3,048.7 |
| | 3,157.5 |
| 4,128.4 |
| | 3,399.3 |
|
| Long-term debt | 11,443.1 |
| | 11,387.7 |
| 9,527.0 |
| | 10,598.7 |
|
| Pension and postretirement benefits | 1,157.9 |
| | 1,196.0 |
| 838.0 |
| | 848.5 |
|
| Deferred tax liabilities | 1,762.6 |
| | 1,699.0 |
| 1,688.7 |
| | 1,648.6 |
|
| Other liabilities | 307.2 |
| | 267.0 |
| 338.9 |
| | 316.8 |
|
| Discontinued operations | 13.1 |
| | 12.6 |
| |
| Total liabilities | 17,732.6 |
| | 17,719.8 |
| 16,521.0 |
| | 16,811.9 |
|
| Commitments and contingencies (Note 16) |
|
| |
|
| |
| Commitments and contingencies (Note 14) | |
|
| |
|
|
| Molson Coors Brewing Company stockholders' equity | | | | | | |
| Capital stock: | | | | | | |
| Preferred stock, $0.01 par value (authorized: 25.0 shares; none issued) | — |
| | — |
| — |
| | — |
|
| Class A common stock, $0.01 par value per share (authorized: 500.0 shares; issued and outstanding: 2.6 shares and 2.6 shares, respectively) | — |
| | — |
| — |
| | — |
|
| Class B common stock, $0.01 par value per share (authorized: 500.0 shares; issued: 204.2 shares and 203.7 shares, respectively) | 2.0 |
| | 2.0 |
| |
| Class B common stock, $0.01 par value per share (authorized: 500.0 shares; issued: 205.1 shares and 204.7 shares, respectively) | | 2.0 |
| | 2.0 |
|
| Class A exchangeable shares, no par value (issued and outstanding: 2.9 shares and 2.9 shares, respectively) | 108.4 |
| | 108.1 |
| 107.7 |
| | 107.7 |
|
| Class B exchangeable shares, no par value (issued and outstanding: 15.1 shares and 15.2 shares, respectively) | 567.6 |
| | 571.2 |
| |
| Class B exchangeable shares, no par value (issued and outstanding: 14.7 shares and 14.7 shares, respectively) | | 553.2 |
| | 553.2 |
|
| Paid-in capital | 6,629.9 |
| | 6,635.3 |
| 6,697.4 |
| | 6,688.5 |
|
| Retained earnings | 6,232.0 |
| | 6,119.0 |
| 7,367.9 |
| | 7,206.1 |
|
| Accumulated other comprehensive income (loss) | (1,470.2 | ) | | (1,545.5 | ) | (810.9 | ) | | (860.0 | ) |
| Class B common stock held in treasury at cost (9.5 shares and 9.5 shares, respectively) | (471.4 | ) | | (471.4 | ) | (471.4 | ) | | (471.4 | ) |
| Total Molson Coors Brewing Company stockholders' equity | 11,598.3 |
| | 11,418.7 |
| 13,445.9 |
| | 13,226.1 |
|
| Noncontrolling interests | 212.0 |
| | 203.0 |
| 217.6 |
| | 208.9 |
|
| Total equity | 11,810.3 |
| | 11,621.7 |
| 13,663.5 |
| | 13,435.0 |
|
| Total liabilities and equity | $ | 29,542.9 |
| | $ | 29,341.5 |
| $ | 30,184.5 |
| | $ | 30,246.9 |
|
See notes to unaudited condensed consolidated financial statements.
MOLSON COORS BREWING COMPANY AND SUBSIDIARIES
CONDENSED CONSOLIDATED STATEMENTS OF CASH FLOWS
(IN MILLIONS)
| | | | Three Months Ended | Three Months Ended |
| | March 31, 2017 | | March 31, 2016 | March 31, 2018 | | March 31, 2017 |
| Cash flows from operating activities: | | | | | | |
| Net income (loss) including noncontrolling interests | $ | 207.8 |
|
| $ | 163.5 |
| $ | 282.5 |
|
| $ | 215.0 |
|
| Adjustments to reconcile net income to net cash provided by operating activities: | | | |
| |
| Adjustments to reconcile net income (loss) to net cash provided by operating activities: | | | | |
|
| Depreciation and amortization | 197.1 |
| | 67.5 |
| 213.7 |
| | 197.1 |
|
| Amortization of debt issuance costs and discounts | 6.5 |
| | 16.7 |
| 4.1 |
| | 6.5 |
|
| Share-based compensation | 15.5 |
| | 6.1 |
| 14.8 |
| | 15.5 |
|
| (Gain) loss on sale or impairment of properties and other assets, net | (4.4 | ) | | (110.1 | ) | 0.7 |
| | (4.4 | ) |
| Equity income in MillerCoors | — |
| | (142.4 | ) | |
| Distributions from MillerCoors | — |
| | 142.4 |
| |
| Equity in net (income) loss of other unconsolidated affiliates | 7.3 |
| | 6.5 |
| |
| Unrealized (gain) loss on foreign currency fluctuations and derivative instruments, net | (63.0 | ) | | (4.0 | ) | 83.5 |
| | (62.4 | ) |
| Income tax (benefit) expense | 64.6 |
| | 16.7 |
| 74.9 |
| | 65.9 |
|
| Income tax (paid) received | (10.9 | ) | | (88.8 | ) | (8.9 | ) | | (10.9 | ) |
| Interest expense, excluding interest amortization | 91.7 |
| | 50.4 |
| 79.3 |
| | 91.7 |
|
| Interest paid | (120.7 | ) | | (46.9 | ) | (115.2 | ) | | (120.7 | ) |
| Pension expense (benefit) | (7.8 | ) | | 2.0 |
| (14.9 | ) | | (16.3 | ) |
| Pension contributions (paid) | (36.0 | ) | | (6.7 | ) | |
| Change in current assets and liabilities (net of impact of business combinations) and other | (466.6 | ) | | (161.7 | ) | |
| (Gain) loss from discontinued operations | 0.6 |
| | 0.5 |
| |
| Net cash used in operating activities | (118.3 | ) | | (88.3 | ) | |
| Pension contributions paid | | (2.5 | ) | | (36.0 | ) |
| Change in current assets and liabilities and other | | (296.8 | ) | | (459.3 | ) |
| Net cash provided by (used in) operating activities | | 315.2 |
| | (118.3 | ) |
| Cash flows from investing activities: | |
| | |
| |
| | |
|
| Additions to properties | (180.0 | ) | | (71.1 | ) | (208.3 | ) | | (180.0 | ) |
| Proceeds from sales of properties and other assets | 42.0 |
| | 2.4 |
| 1.6 |
| | 42.0 |
|
| Investment in MillerCoors | — |
| | (413.7 | ) | |
| Return of capital from MillerCoors | — |
| | 283.4 |
| |
| Other | 5.9 |
| | (6.5 | ) | (45.4 | ) | | 5.9 |
|
| Net cash used in investing activities | (132.1 | ) | | (205.5 | ) | |
| Net cash provided by (used in) investing activities | | (252.1 | ) | | (132.1 | ) |
| Cash flows from financing activities: | |
| | |
| |
| | |
|
| Proceeds from issuance of common stock, net | — |
| | 2,526.4 |
| |
| Exercise of stock options under equity compensation plans | 0.3 |
| | 4.2 |
| 6.1 |
| | 0.3 |
|
| Dividends paid | (88.3 | ) | | (88.3 | ) | (88.5 | ) | | (88.3 | ) |
| Debt issuance costs | (3.7 | ) | | (14.2 | ) | — |
| | (3.7 | ) |
| Payments on debt and borrowings | (1,501.1 | ) | | (10.3 | ) | (0.8 | ) | | (1,501.1 | ) |
| Proceeds on debt and borrowings | 1,536.0 |
| | 20.9 |
| — |
| | 1,536.0 |
|
| Net proceeds from (payments on) revolving credit facilities and commercial paper | 131.0 |
| | 2.5 |
| (248.7 | ) | | 131.0 |
|
| Change in overdraft balances and other | 6.1 |
| | 17.3 |
| 42.0 |
| | 6.1 |
|
| Net cash provided by financing activities | 80.3 |
| | 2,458.5 |
| |
| Net cash provided by (used in) financing activities | | (289.9 | ) | | 80.3 |
|
| Cash and cash equivalents: | |
| | |
| |
| | |
|
| Net increase (decrease) in cash and cash equivalents | (170.1 | ) | | 2,164.7 |
| (226.8 | ) | | (170.1 | ) |
| Effect of foreign exchange rate changes on cash and cash equivalents | 4.2 |
| | 7.3 |
| 6.1 |
| | 4.2 |
|
| Balance at beginning of year | 560.9 |
| | 430.9 |
| 418.6 |
| | 560.9 |
|
| Balance at end of period | $ | 395.0 |
| | $ | 2,602.9 |
| $ | 197.9 |
| | $ | 395.0 |
|
See notes to unaudited condensed consolidated financial statements.
MOLSON COORS BREWING COMPANY AND SUBSIDIARIES
CONDENSED CONSOLIDATED STATEMENTS OF STOCKHOLDERS' EQUITY
AND NONCONTROLLING INTERESTS
(IN MILLIONS)
(UNAUDITED)
| | | | | | MCBC Stockholders | | | | | MCBC Stockholders' Equity | | |
| | | | | | Accumulated | | | | | | Common Stock | | | | | | | | | | | | | | | | | | | | | | | Accumulated | | Common Stock | | |
| | | | | | other | | Common stock | | held in | | Exchangeable | | | | Non | | | Common stock | | Exchangeable | | | | | | other | | held in | | Non |
| | | | Retained | | comprehensive | | issued | | treasury | | shares issued | | Paid-in- | | controlling | | | issued | | shares issued | | Paid-in- | | Retained | | comprehensive | | treasury | | controlling |
| | Total | | earnings | | income (loss) | | Class A | | Class B | | Class B | | Class A | | Class B | | capital | | interests | Total | | Class A | | Class B | | Class A | | Class B | | capital | | earnings | | income (loss) | | Class B | | interests |
| Balance at December 31, 2015 | $ | 7,063.1 |
| | $ | 4,496.0 |
| | $ | (1,694.9 | ) | | $ | — |
| | $ | 1.7 |
| | $ | (471.4 | ) | | $ | 108.2 |
| | $ | 603.0 |
| | $ | 4,000.4 |
| | $ | 20.1 |
| |
| As of December 31, 2016 | | $ | 11,621.7 |
| | $ | — |
| | $ | 2.0 |
| | $ | 108.1 |
| | $ | 571.2 |
| | $ | 6,635.3 |
| | $ | 6,145.3 |
| | $ | (1,571.8 | ) | | $ | (471.4 | ) | | $ | 203.0 |
|
| Exchange of shares | — |
| | — |
| | — |
| | — |
| | — |
| | — |
| | — |
| | (21.6 | ) | | 21.6 |
| | — |
| — |
| | — |
| | — |
| | 0.3 |
| | (3.6 | ) | | 3.3 |
| | — |
| | — |
| | — |
| | — |
|
| Shares issued under equity compensation plan | (7.9 | ) | | — |
| | — |
| | — |
| | — |
| | — |
| | — |
| | — |
| | (7.9 | ) | | — |
| (23.5 | ) | | — |
| | — |
| | — |
| | — |
| | (23.5 | ) | | — |
| | — |
| | — |
| | — |
|
| Amortization of share-based compensation | 6.7 |
| | — |
| | — |
| | — |
| | — |
| | — |
| | — |
| | — |
| | 6.7 |
| | — |
| 14.8 |
| | — |
| | — |
| | — |
| | — |
| | 14.8 |
| | — |
| | — |
| | — |
| | — |
|
| Acquisition of business and purchase of noncontrolling interest | | 2.1 |
| | — |
| | — |
| | — |
| | — |
| | — |
| | — |
| | — |
| | — |
| | 2.1 |
|
| Net income (loss) including noncontrolling interests | 163.5 |
| | 162.7 |
| | — |
| | — |
| | — |
| | — |
| | — |
| | — |
| | — |
| | 0.8 |
| 215.0 |
| | — |
| | — |
| | — |
| | — |
| | — |
| | 208.5 |
| | — |
| | — |
| | 6.5 |
|
| Other comprehensive income (loss), net of tax | 256.6 |
| | — |
| | 257.0 |
| | — |
| | — |
| | — |
| | — |
| | — |
| | — |
| | (0.4 | ) | 73.1 |
| | — |
| | — |
| | — |
| | — |
| | — |
| | — |
| | 72.7 |
| | — |
| | 0.4 |
|
| Issuance of common stock | 2,525.6 |
| | — |
| | — |
| | — |
| | 0.3 |
| | — |
| | — |
| | — |
| | 2,525.3 |
| | — |
| |
| Dividends declared and paid | (88.3 | ) | | (88.3 | ) | | — |
| | — |
| | — |
| | — |
| | — |
| | — |
| | — |
| | — |
| (88.3 | ) | | — |
| | — |
| | — |
| | — |
| | — |
| | (88.3 | ) | | — |
| | — |
| | — |
|
| Balance at March 31, 2016 | $ | 9,919.3 |
| | $ | 4,570.4 |
| | $ | (1,437.9 | ) | | $ | — |
| | $ | 2.0 |
| | $ | (471.4 | ) | | $ | 108.2 |
| | $ | 581.4 |
| | $ | 6,546.1 |
| | $ | 20.5 |
| |
| As of March 31, 2017 | | $ | 11,814.9 |
| | $ | — |
| | $ | 2.0 |
| | $ | 108.4 |
| | $ | 567.6 |
| | $ | 6,629.9 |
|
| $ | 6,265.5 |
|
| $ | (1,499.1 | ) |
| $ | (471.4 | ) | | $ | 212.0 |
|
| | | | |
| MCBC Stockholders |
| | |
| MCBC Stockholders' Equity |
| |
| | |
| |
| Accumulated |
|
|
|
|
| Common Stock |
|
|
|
|
| |
| | |
|
|
|
|
|
|
|
|
| | | | | Accumulated | | Common Stock |
| |
| | |
| |
| other |
| Common stock |
| held in |
| Exchangeable |
|
|
| Non | |
| Common stock |
| Exchangeable |
|
| | | | other | | held in |
| Non |
| | |
| Retained |
| comprehensive |
| issued |
| treasury |
| shares issued |
| Paid-in- |
| controlling | |
| issued |
| shares issued |
| Paid-in- | | Retained | | comprehensive | | treasury |
| controlling |
| | Total |
| earnings |
| income (loss) |
| Class A |
| Class B |
| Class B |
| Class A |
| Class B |
| capital |
| interests | Total |
| Class A |
| Class B |
| Class A |
| Class B |
| capital | | earnings | | income (loss) | | Class B |
| interests |
| Balance at December 31, 2016 | $ | 11,621.7 |
|
| $ | 6,119.0 |
|
| $ | (1,545.5 | ) |
| $ | — |
|
| $ | 2.0 |
|
| $ | (471.4 | ) |
| $ | 108.1 |
|
| $ | 571.2 |
|
| $ | 6,635.3 |
|
| $ | 203.0 |
| |
| Exchange of shares | — |
|
| — |
|
| — |
|
| — |
|
| — |
|
| — |
|
| 0.3 |
|
| (3.6 | ) |
| 3.3 |
|
| — |
| |
| As of December 31, 2017 | | $ | 13,435.0 |
|
| $ | — |
|
| $ | 2.0 |
|
| $ | 107.7 |
|
| $ | 553.2 |
|
| $ | 6,688.5 |
| | $ | 7,206.1 |
| | $ | (860.0 | ) | | $ | (471.4 | ) |
| $ | 208.9 |
|
| Shares issued under equity compensation plan | (23.5 | ) |
| — |
|
| — |
|
| — |
|
| — |
|
| — |
|
| — |
|
| — |
|
| (23.5 | ) |
| — |
| (5.8 | ) |
| — |
|
| — |
|
| — |
|
| — |
|
| (5.8 | ) | | — |
| | — |
| | — |
|
| — |
|
| Amortization of share-based compensation | 14.8 |
|
| — |
|
| — |
|
| — |
|
| — |
|
| — |
|
| — |
|
| — |
|
| 14.8 |
|
| — |
| 14.7 |
|
| — |
|
| — |
|
| — |
|
| — |
|
| 14.7 |
| | — |
| | — |
| | — |
|
| — |
|
| Acquisition of business and purchase of noncontrolling interest | 2.1 |
|
| — |
|
| — |
|
| — |
|
| — |
|
| — |
|
| — |
|
| — |
|
| — |
|
| 2.1 |
| |
| Net income (loss) including noncontrolling interests | 207.8 |
|
| 201.3 |
|
| — |
|
| — |
|
| — |
|
| — |
|
| — |
|
| — |
|
| — |
|
| 6.5 |
| 282.5 |
|
| — |
|
| — |
|
| — |
|
| — |
|
| — |
| | 278.1 |
| | — |
| | — |
|
| 4.4 |
|
| Other comprehensive income (loss), net of tax | 75.7 |
|
| — |
|
| 75.3 |
|
| — |
|
| — |
|
| — |
|
| — |
|
| — |
|
| — |
|
| 0.4 |
| 49.9 |
|
| — |
|
| — |
|
| — |
|
| — |
|
| — |
| | — |
| | 49.1 |
| | — |
|
| 0.8 |
|
| Adoption of new accounting pronouncement (see Note 2) | | (27.8 | ) | | — |
| | — |
| | — |
| | — |
| | — |
| | (27.8 | ) | | — |
| | — |
| | — |
|
| Contributions from noncontrolling interests | | 6.4 |
| | — |
| | — |
| | — |
| | — |
| | — |
| | — |
| | — |
| | — |
| | 6.4 |
|
| Dividends declared and paid | (88.3 | ) |
| (88.3 | ) |
| — |
|
| — |
|
| — |
|
| — |
|
| — |
|
| — |
|
| — |
|
| — |
| (91.4 | ) |
| — |
|
| — |
|
| — |
|
| — |
|
| — |
| | (88.5 | ) | | — |
| | — |
|
| (2.9 | ) |
| Balance at March 31, 2017 | $ | 11,810.3 |
|
| $ | 6,232.0 |
|
| $ | (1,470.2 | ) |
| $ | — |
|
| $ | 2.0 |
|
| $ | (471.4 | ) |
| $ | 108.4 |
|
| $ | 567.6 |
|
| $ | 6,629.9 |
|
| $ | 212.0 |
| |
| As of March 31, 2018 | | $ | 13,663.5 |
|
| $ | — |
|
| $ | 2.0 |
|
| $ | 107.7 |
|
| $ | 553.2 |
|
| $ | 6,697.4 |
| | $ | 7,367.9 |
| | $ | (810.9 | ) | | $ | (471.4 | ) |
| $ | 217.6 |
|
See notes to unaudited condensed consolidated financial statements.
MOLSON COORS BREWING COMPANY AND SUBSIDIARIES
NOTES TO UNAUDITED CONDENSED CONSOLIDATED FINANCIAL STATEMENTS
1. Basis of Presentation and Summary of Significant Accounting Policies
Unless otherwise noted in this report, any description of "we," "us" or "our" includes Molson Coors Brewing Company ("MCBC" or the "Company"), principally a holding company, and its operating and non-operating subsidiaries included within our reporting segments and Corporate. Our reporting segments include: MillerCoors LLC ("MillerCoors" or U.S. segment), operating in the United States ("U.S.");States; Molson Coors Canada ("MCC" or Canada segment), operating in Canada; Molson Coors Europe (Europe segment), operating in Bulgaria, Croatia, Czech Republic, Hungary, Montenegro, Republic of Ireland, Romania, Serbia, the United Kingdom ("U.K.") and various other European countries; and Molson Coors International ("MCI" or MCIInternational segment), operating in various other countries.
On October 11, 2016, we completed the acquisition of SABMiller plc's ("SABMiller") 58% economic interest and 50% voting interest in MillerCoors and all trademarks, contracts and other assets primarily related to the "Miller International Business", as defined in the purchase agreement, outside of the U.S. and Puerto Rico (the "Acquisition") from Anheuser-Busch InBev SA/NV ("ABI"), and MillerCoors, previously a joint venture between MCBC and SABMiller, became a wholly-owned subsidiary of MCBC. Accordingly, for periods prior to October 11, 2016, our 42% economic ownership interest in MillerCoors was accounted for under the equity method of accounting, and, therefore, its results of operations were reported as equity income in MillerCoors in the unaudited condensed consolidated statements of operations, and our 42% share of MillerCoors' net assets were reported as investment in MillerCoors in the unaudited condensed consolidated balance sheets. Beginning October 11, 2016, MillerCoors was fully consolidated and continues to be reported as our U.S. segment. Additionally, our unaudited condensed consolidated balance sheets as of March 31, 2017, and December 31, 2016, include our acquired assets and liabilities, which were recorded at their respective acquisition-date fair values upon completion of the Acquisition. See Note 4, "Acquisition and Investments" for further discussion.
Unless otherwise indicated, information in this report is presented in U.S. dollars ("USD" or "$")USD and comparisons are to comparable prior periods. Our primary operating currencies, other than USD, include the Canadian Dollar ("CAD"),CAD, the British Pound ("GBP"),GBP, and our Central European operating currencies such as the Euro ("EUR"), Czech Koruna ("CZK"), Croatian Kuna ("HRK")EUR, CZK, HRK and Serbian Dinar ("RSD").RSD.
The accompanying unaudited condensed consolidated interim financial statements reflect all adjustments which are necessary for a fair statement of the financial position, results of operations and cash flows for the periods presented in accordance with accounting principles generally accepted in the U.S. ("U.S. GAAP").GAAP. Such unaudited interim condensed consolidated financial statements have been prepared in accordance with the instructions to Form 10-Q pursuant to the rules and regulations of the U.S. Securities and Exchange Commission ("SEC").SEC. Certain information and footnote disclosures normally included in financial statements prepared in accordance with U.S. GAAP have been condensed or omitted pursuant to such rules and regulations.
These unaudited condensed consolidated interim financial statements should be read in conjunction with our Annual Report on Form 10-K for the year ended December 31, 20162017 ("Annual Report"), and have been prepared on a consistent basis with the accounting policies described in Note 1 of the Notes to the Audited Consolidated Financial Statements included in our Annual Report. Report, except as noted below and in Note 2, "New Accounting Pronouncements". We adopted both the FASB's new revenue recognition standard and the presentation of net periodic pension and other postretirement benefit cost standard effective January 1, 2018.
Our accounting policies did nothistorical unaudited condensed consolidated financial statements have been revised to reflect the retrospective application of our change in accounting policy for calculating the first quartermarket-related value of 2017.pension plan assets used to determine net periodic pension cost as discussed in our Annual Report.
The results of operations for the three months ended March 31, 2017,2018, are not necessarily indicative of the results that may be achieved for the full year.
Non-Cash Activity
Non-cash activity includes non-cash issuances of share-based awards, as well as non-cash investing activities related to movements in our guarantee of indebtedness of certain equity method investments. See Note 4, "Investments" and Note 5, "Share-Based Payments" for further discussion. We also had non-cash activities related to capital expenditures incurred but not yet paid, and the recognition of capital leases. These non-cash activities are excluded from our unaudited condensed consolidated statements of cash flows and were $155.8 million and $176.0 million for the three months ended March 31, 2018, and March 31, 2017, respectively.
Discontinued Operations
We no longer present the activity related to foreign exchange movements nor the liabilities associated with our indemnities resulting from the historical sale of the Kaiser business (as discussed in Note 19 of the Notes included in our Annual Report) within discontinued operations and have accordingly reclassified the activity into other income within continuing operations of the unaudited condensed consolidated statements of operations, and the liabilities into other current and long-term liabilities within the unaudited condensed consolidated balance sheets. This change has been applied retrospectively and prospectively. As a result, we reclassified a foreign exchange loss from discontinued operations to other income (expense), net of $0.6 million for the three months ended March 31, 2017.
Revenue Recognition
We account for revenue in accordance with Accounting Standards Codification (“ASC”) Topic 606, Revenue from Contracts with Customers, which we adopted on January 1, 2018, using the modified retrospective transition approach (see Note 2, "New Accounting Pronouncements" for impacts of adoption).
Our net sales represent the sale of beer and other malt beverages (including adjacencies, such as cider and hard soda), net of excise tax. Sales are stated net of incentives, discounts and returns. Sales of products are for cash or otherwise agreed upon credit terms. Our payment terms vary by location and customer, however, the time period between when revenue is recognized and when payment is due is not significant. Our revenue generating activities have a single performance obligation and are recognized at the point in time when control transfers and our obligation has been fulfilled, which is when the related goods are shipped or delivered to the customer, depending upon the method of distribution and shipping terms. Where our products are sold under consignment arrangements, revenue is not recognized until control has transferred, which is when the product is sold to the end customer. Revenue is measured as the amount of consideration we expect to receive in exchange for the sale of our product. The cost of various programs, such as price promotions, rebates and coupons are treated as a reduction of sales. In certain of our markets, we make cash payments to customers such as slotting or listing fees, or payments for other marketing or promotional activities. These cash payments are recorded as a reduction of revenue unless we receive a distinct good or service as defined under ASC 606. Specifically, a good or service is considered distinct when it is separately identifiable from other promises in the contract, we receive a benefit from the good or service, and the benefit is separable from the sale of our product to the customer.
Certain payments made to customers are conditional on the achievement of volume targets, marketing commitments, or both. If paid in advance, we record such payments as prepayments and amortize them over the relevant period to which the customer commitment is made (generally up to five years). When the payment is not for a distinct good or service, or fair value cannot be reasonably estimated, the amortization of the prepayment or the cost as incurred is recorded as a reduction of revenue. Where a distinct good or service is received and fair value can be reasonably estimated, the cost is included as marketing, general and administrative expenses. The amounts deferred are reassessed regularly for recoverability over the contract period and are impaired where there is objective evidence that the benefits will not be realized or the asset is otherwise not recoverable. Separately, as discussed below, we analyze whether these advance payments contain a significant financing component for potential adjustment to the transaction price.
Our primary revenue generating activity represents the sale of beer and other malt beverages to customers, including both domestic and exported product sales. Our customer could be a distributor, retail or on-premise outlet, depending on the market. The majority of our revenues are generated from brands that we own and brew ourselves, however, we also import or brew and sell certain non-owned partner brands under licensing and related arrangements. In addition, primarily in the U.K., as well as certain other countries in our Europe segment, we sell other beverage companies' products to on-premise customers to provide them with a full range of products for their retail outlets. We refer to this as the "factored brand business." Sales from this business are included in our net sales and cost of goods sold when ultimately sold. In the factored brand business, we normally purchase inventory, which includes excise taxes charged by the vendor, take orders from customers for such brands, negotiate with the customers on pricing and invoice customers for the product and related costs of delivery. In addition, we incur the risk of loss at times we are in possession of the inventory and for the receivables due from the customers. Revenues for owned brands, partner and imported brands, as well as factored brands are recognized at the point in time when control is transferred to the customer as discussed above.
Other Revenue Generating Activities
We contract manufacture for other brewers in some of our markets. These contractual agreements require us to brew, package and ship certain brands to these brewers, who then sell the products to their own customers in their respective markets. Revenues under contract brewing arrangements are recognized when our obligation related to the finished product is fulfilled and control of the product transfers to these other brewers.
We also have licensing agreements with third party partners who brew and distribute our products in various markets across our segments. Under these agreements, we are compensated based on the amount of products sold by our partners in these markets at an agreed upon royalty rate or profit percentage. We apply the sales-based royalty practical expedient to these licensing arrangements and recognize revenue as product is sold by our partners at the agreed upon rate.
We have evaluated these other revenue generating activities under the disaggregation disclosure criteria outlined within the guidance and concluded that these other revenue generating activities are immaterial for separate disclosure. See Note 3, "Segment Reporting", for disclosure of revenues by geographic segment.
Variable Consideration
Our revenue generating activities include variable consideration which is recorded as a reduction of the transaction price based upon expected amounts at the time revenue for the corresponding product sale is recognized. For example, customer promotional discount programs are entered into with certain distributors for certain periods of time. The amount ultimately reimbursed to distributors is determined based upon agreed-upon promotional discounts which are applied to distributors sales to retailers. Other common forms of variable consideration include volume rebates for meeting established sales targets, and coupons and mail-in rebates offered to the end consumer. The determination of the reduction of the transaction price for variable consideration requires that we make certain estimates and assumptions that affect the timing and amounts of revenue and liabilities recorded. We estimate this variable consideration, including analyzing for a potential constraint on variable consideration, by taking into account factors such as the nature of the promotional activity, historical information and current trends, availability of actual results, and expectations of customer and consumer behavior.
We do not have standard terms that permit return of product; however, in certain markets where returns occur we estimate the amount of returns as variable consideration based on historical return experience and adjust our revenue accordingly. Products that do not meet our high quality standards are returned by the customer or recalled and destroyed and are recorded as a reduction of revenue. The reversal of revenue is recorded upon determination that the product will be recalled and destroyed. We estimate the costs required to facilitate product returns and record them in cost of goods sold as required.
During the three months ended March 31, 2018, adjustments to revenue from performance obligations satisfied in the prior period due to changes in estimates in variable consideration were immaterial.
Significant Financing Component and Costs to Obtain Contracts
In certain of our businesses where such practices are legally permitted, we make loans or advanced payments to retail outlets that sell our brands. For arrangements that do not span greater than one year, we apply the practical expedient available under ASC 606 and do not adjust the transaction price for the effects of a potential significant financing component. We further analyze arrangements that span greater than one year on an ongoing basis to determine whether a significant financing component exists. No such arrangements existed during the three months ended March 31, 2018.
Advance payments to customers, where legally permitted, are deferred and amortized as a reduction to revenue over the expected period of benefit and tested for recoverability as appropriate. All other costs to obtain contracts and fulfill are expensed as incurred based on the nature, significance and expected benefit of these costs relative to the contract.
Contract Assets and Liabilities
We continually evaluate whether our revenue generating activities and advanced payment arrangements with customers result in the recognition of contract assets or liabilities. No such assets or liabilities existed as of March 31, 2018, or December 31, 2017. Separately, trade accounts receivable, including affiliate receivables, approximates receivables from contracts with customers.
Shipping and Handling
Freight costs billed to customers for shipping and handling are recorded as revenue. Shipping and handling expense related to costs incurred to deliver product are recognized within cost of goods sold. We account for shipping and handling activities that occur after control has transferred as a fulfillment cost as opposed to a separate performance obligation, and the costs of shipping and handling are recognized concurrently with the related revenue.
Excise Tax
Excise tax remitted to tax authorities are government-imposed excise taxes on beer. Excise taxes are shown in a separate line item in the unaudited condensed consolidated statements of operations as a reduction of sales. Excise taxes are recognized as a current liability within accounts payable and other current liabilities on the unaudited condensed consolidated balance sheets, with the liability subsequently reduced when the taxes are remitted to the tax authority.
Net Periodic Pension Cost Revised Accounting Policy
The following table presents the impacts to our quarterly information resulting from the retrospective application of our change in accounting policy for calculating the market-related value of pension plan assets used to determine net periodic pension cost effective in the fourth quarter of 2017 as discussed in Note 1 of the Notes of our Annual Report. The below "As Adjusted" amounts have been further adjusted to reflect the adoption of the accounting standard on the presentation of net periodic pension and postretirement benefit cost. See Note 2, "New Accounting Pronouncements".
|
| | | | | | | | | | | | | | | | | | | | | | | | | | | | | | | |
| | Three Months Ended | | Three Months Ended | | Three Months Ended | | Three Months Ended |
| | March 31, 2017 | | June 30, 2017 | | September 30, 2017 | | December 31, 2017 |
| | As Reported | | As Adjusted | | As Reported | | As Adjusted | | As Reported | | As Adjusted | | Under Prior Method | | As Adjusted |
| | (In millions) |
| Unaudited Condensed Consolidated Statements of Operations: |
| Cost of goods sold | $ | (1,372.9 | ) | | $ | (1,367.7 | ) | | $ | (1,756.1 | ) | | $ | (1,750.7 | ) | | $ | (1,589.6 | ) | | $ | (1,584.1 | ) | | $ | (1,520.3 | ) | | $ | (1,514.7 | ) |
| Marketing, general and administrative expenses | $ | (702.8 | ) | | $ | (699.5 | ) | | $ | (781.2 | ) | | $ | (777.8 | ) | | $ | (782.8 | ) | | $ | (779.2 | ) | | $ | (779.4 | ) | | $ | (775.9 | ) |
| Special items, net | $ | (3.8 | ) | | $ | (3.8 | ) | | $ | (16.5 | ) | | $ | (16.5 | ) | | $ | (4.1 | ) | | $ | (4.1 | ) | | $ | (3.7 | ) | | $ | (3.7 | ) |
| Income tax benefit (expense) | $ | (64.6 | ) | | $ | (65.9 | ) | | $ | (123.0 | ) | | $ | (125.2 | ) | | $ | (145.3 | ) | | $ | (147.4 | ) | | $ | 392.4 |
| | $ | 391.7 |
|
| Net income (loss) attributable to MCBC | $ | 201.3 |
| | $ | 208.5 |
| | $ | 323.3 |
| | $ | 329.9 |
| | $ | 280.0 |
| | $ | 287.0 |
| | $ | 580.4 |
| | $ | 588.8 |
|
| Basic net income (loss) attributable to MCBC per share | $ | 0.94 |
| | $ | 0.97 |
| | $ | 1.50 |
| | $ | 1.53 |
| | $ | 1.30 |
| | $ | 1.33 |
| | $ | 2.69 |
| | $ | 2.73 |
|
| Diluted net income (loss) attributable to MCBC per share | $ | 0.93 |
| | $ | 0.96 |
| | $ | 1.49 |
| | $ | 1.52 |
| | $ | 1.29 |
| | $ | 1.33 |
| | $ | 2.68 |
| | $ | 2.72 |
|
2. New Accounting Pronouncements
New Accounting Pronouncements Previously Adopted
In March 2016, the Financial Accounting Standards Board ("FASB") issued authoritative guidance intended to simplify and improve several aspects of the accounting for share-based payment transactions. We early adopted this guidance in the third quarter of the prior year. The adoption of this guidance impacted our previously reported unaudited condensed consolidated financial statements as follows: |
| | | | | | | |
| | Three Months Ended March 31, 2016 |
| | As Reported | | As Adjusted |
| | (In millions) |
| Unaudited Condensed Consolidated Statements of Operations: | | | |
| Income tax benefit (expense) | $ | (20.6 | ) | | $ | (16.7 | ) |
| Net income (loss) attributable to Molson Coors Brewing Company | $ | 158.8 |
| | $ | 162.7 |
|
| Basic earnings per share | $ | 0.78 |
| | $ | 0.80 |
|
| Diluted earnings per share | $ | 0.78 |
| | $ | 0.80 |
|
| Diluted weighted-average shares outstanding | 204.8 |
| | 205.1 |
|
|
| | | | | | | |
| | Three Months Ended March 31, 2016 |
| | As Reported | | As Adjusted |
| | (In millions) |
| Unaudited Condensed Consolidated Statements of Cash Flows: | | | |
| Net cash provided by (used in) operating activities | $ | (93.4 | ) | | $ | (88.3 | ) |
| Net cash provided by (used in) financing activities | $ | 2,463.6 |
| | $ | 2,458.5 |
|
|
| | | | | | | |
| | As of |
| | March 31, 2016 |
| | As Reported | | As Adjusted |
| | (In millions) |
| Unaudited Condensed Consolidated Balance Sheets: | | | |
| Paid-in capital | $ | 6,550.0 |
| | $ | 6,546.1 |
|
| Retained earnings | $ | 4,566.5 |
| | $ | 4,570.4 |
|
New Accounting Pronouncements Recently Adopted
In January 2017, the FASB issued authoritative guidance intended to simplify the subsequent measurement of goodwill by eliminating Step 2 from the goodwill impairment test. Under the new guidance, the recognition of an impairment charge is calculated based on the amount by which the carrying amount exceeds the reporting unit’s fair value; however, the loss recognized should not exceed the total amount of goodwill allocated to that reporting unit. The guidance should be applied on a prospective basis,Pension and is effective for annual or any interim goodwill impairment tests in fiscal years beginning after December 15, 2019. We have early adopted this guidance, effective for our quarter ended March 31, 2017. The adoption of this guidance will impact our goodwill impairment testing on a prospective basis, to the extent that an impairment is identified in Step 1 of our testing procedures.
In July 2015, the FASB issued authoritative guidance intended to simplify the measurement of inventory. The amendment requires entities to measure in-scope inventory at the lower of cost and net realizable value, and replaces the current requirement to measure in-scope inventory at the lower of cost or market, which considers replacement cost, net realizable value, and net realizable value less an approximate normal profit margin. This guidance is effective for our quarter ended March 31, 2017, and was applied on a prospective basis. The adoption of this guidance did not have an impact on our financial position or results of operations.
New Accounting Pronouncements Not Yet AdoptedOther Postretirement Benefit Plans
In March 2017, the FASB issued authoritative guidance intended to improve the consistency, transparency and usefulness of financial information related to defined benefit pension or other postretirement plans. Under the new guidance, an employer
must disaggregate the service cost component from the other components of net benefit cost within the income statement.statements of operations. Specifically, the new guidance will requirerequires us only to report only the service cost component in the same line item as other compensation costs arising from services rendered by the pertinent employees during the period; while the other components of net benefit cost willare now be presented in the income statementunaudited condensed consolidated statements of operations separately from the service cost component and outside of operating income. The amendments in this update also allow only the service cost component to be eligible for capitalization when applicable. This guidance is effective for annual periods beginning after December 15, 2017, including interim periodsWe have also determined that only service cost will be reported within those annual periods.each operating segment and all other components will be reported within the Corporate segment. The guidance related to the income statement presentation of service costs and other pension and postretirement benefit costs should beis applied retrospectively, while the capitalization of service costs component should beis applied prospectively. We adopted this guidance as of January 1, 2018, which was a classification adjustment only and had no impact to our consolidated net income. The adoption of this guidance resulted in the following retrospective adjustments within our unaudited condensed consolidated results of operations:
|
| | | | | | | |
| | Three Months Ended March 31, 2017 |
| | As Adjusted - Pension Methodology(1) | | As Adjusted - Accounting Standard Update |
| | (In millions) |
| Unaudited Condensed Consolidated Statement of Operations: | | | |
| Cost of goods sold | $ | (1,367.7 | ) | | $ | (1,372.3 | ) |
| Marketing, general and administrative expenses | $ | (699.5 | ) | | $ | (705.3 | ) |
| Special items, net | $ | (3.8 | ) | | $ | (6.7 | ) |
| Operating income (loss) | $ | 377.7 |
| | $ | 364.4 |
|
| Other pension and postretirement benefits (costs), net | $ | — |
| | $ | 13.3 |
|
| |
| (1) | As discussed in detail within Note 1, "Basis of Presentation and Summary of Significant Accounting Policies", our historical unaudited condensed consolidated financial statements have been revised to reflect the retrospective application of our change in accounting policy for calculating the market-related value of pension plan assets used to determine net periodic pension cost. The change was effective in the fourth quarter of 2017. |
The following table shows the (increase) decrease for the respective line item within the unaudited condensed consolidated statement of operations for segment reporting for the three months ended March 31, 2017:
|
| | | | | | | | | | | | | | | |
| | Corporate | | Europe | | U.S. | | Canada |
| Cost of goods sold | $ | — |
| | $ | (6.6 | ) | | $ | 1.8 |
| | $ | 0.2 |
|
| Marketing, general and administrative expenses | — |
| | (4.7 | ) | | (0.8 | ) | | (0.3 | ) |
| Special items, net | — |
| | — |
| | — |
| | (2.9 | ) |
| Other pension and postretirement benefits (costs), net | 13.3 |
| | — |
| | — |
| | — |
|
| Total | $ | 13.3 |
| | $ | (11.3 | ) | | $ | 1.0 |
| | $ | (3.0 | ) |
Revenue Recognition
In May 2014, the FASB issued authoritative guidance related to new accounting requirements for the recognition of revenue from contracts with customers. The core principle of the guidance is that an entity should recognize revenue to depict the transfer of promised goods or services to customers in an amount that reflects the consideration to which the entity expects to be entitled to in exchange for the goods or services.
We adopted this guidance and related amendments as of January 1, 2018, applying the modified retrospective transition approach to all contracts. Based on our comprehensive assessment of the new guidance, including our evaluation of the five-step approach outlined within the guidance, we concluded that the adoption did not have a significant impact to our core revenue generating activities. However, the adoption resulted in a change in presentation of certain cash payments made to
customers as well as the timing of recognition of certain promotional discounts. Specifically, certain cash payments to customers were previously recorded within marketing, general and administrative expenses in the unaudited condensed consolidated statements of operations. Upon the adoption of the new guidance, many of these cash payments did not meet the specific criteria within the new guidance of providing a “distinct” good or service, and therefore, were required to be presented as a reduction of revenue. Based on foreign exchange rates as of March 31, 2018, we currently anticipate that the impact of this change will result in a reduction of revenue and marketing, general and administrative expenses by approximately $70 million to $90 million during 2018, primarily within our Canada segment, with no impact to net income. However, actual results may differ from these estimates. Furthermore, upon adoption of the new guidance, certain of our promotional discounts which are deemed variable consideration under the new guidance, are now recognized at the time of the related shipment of product, which is earlier than recognized under historical guidance. We anticipate that this change in recognition timing will shift financial statement recognition primarily amongst quarters, however, do not anticipate that the full-year impact will be significant to our financial results. We also evaluated the requirements of the new guidance on our other revenue generating activities such as contract brewing and license arrangements, and concluded that no changes to our historical accounting treatment was required.
As a result of the cumulative impact of adopting the new guidance, we recorded a reduction to opening retained earnings of $27.8 million as of January 1, 2018, with an offsetting increase primarily within accounts payable and other current liabilities and the related tax effects, related primarily to the accelerated recognition of certain promotional discounts. Results for reporting periods beginning after January 1, 2018, are presented under the new guidance, while prior period amounts have not been adjusted and continue to be reported in accordance with historical accounting guidance. The following tables provide a comparison of our current period results of operations and financial position under the new guidance, versus our financial statements if the historical guidance had continued to be applied:
|
| | | | | | | | | | | |
| | Three Months Ended March 31, 2018 |
| | Under Historical Guidance | | As Reported Under New Guidance | | Effect of Change |
| | (In millions, except per share data) |
| Unaudited Condensed Consolidated Statement of Operations: | |
| Sales | $ | 2,884.1 |
| | $ | 2,868.0 |
| | $ | (16.1 | ) |
| Excise taxes | (536.5 | ) | | (536.5 | ) | | — |
|
| Net sales | 2,347.6 |
| | 2,331.5 |
| | (16.1 | ) |
| Cost of goods sold | (1,535.7 | ) | | (1,535.7 | ) | | — |
|
| Gross profit | 811.9 |
| | 795.8 |
| | (16.1 | ) |
| Marketing, general and administrative expenses | (694.2 | ) | | (681.1 | ) | | 13.1 |
|
| Special items, net | 314.8 |
| | 314.8 |
| | — |
|
| Operating income (loss) | 432.5 |
| | 429.5 |
| | (3.0 | ) |
| Interest income (expense), net | (82.4 | ) | | (83.2 | ) | | (0.8 | ) |
| Other pension and postretirement benefits (costs), net | 10.0 |
| | 10.0 |
| | — |
|
| Other income (expense), net | 1.1 |
| | 1.1 |
| | — |
|
| Income (loss) before income taxes | 361.2 |
| | 357.4 |
| | (3.8 | ) |
| Income tax benefit (expense) | (75.7 | ) | | (74.9 | ) | | 0.8 |
|
| Net income (loss) | 285.5 |
| | 282.5 |
| | (3.0 | ) |
| Net (income) loss attributable to noncontrolling interests | (4.4 | ) | | (4.4 | ) | | — |
|
| Net income (loss) attributable to MCBC | $ | 281.1 |
| | $ | 278.1 |
| | $ | (3.0 | ) |
| Basic net income (loss) attributable to MCBC per share | $ | 1.30 |
| | $ | 1.29 |
| | $ | (0.01 | ) |
| Diluted net income (loss) attributable to MCBC per share | $ | 1.30 |
| | $ | 1.28 |
| | $ | (0.02 | ) |
|
| | | | | | | | | | | |
| | As of March 31, 2018 |
| | Under Historical Guidance | | As Reported Under New Guidance | | Effect of Change |
| | (In millions) |
| Unaudited Condensed Consolidated Balance Sheet: | |
| Assets | | | | | |
| Accounts receivable, net | $ | 779.2 |
| | $ | 779.3 |
| | $ | 0.1 |
|
| Other current assets, net | $ | 321.4 |
| | $ | 326.2 |
| | $ | 4.8 |
|
| Liabilities and equity | | | | | |
| Accounts payable and other current liabilities | $ | 2,491.6 |
| | $ | 2,537.1 |
| | $ | 45.5 |
|
| Deferred tax liabilities | $ | 1,698.5 |
| | $ | 1,688.7 |
| | $ | (9.8 | ) |
| Retained earnings | $ | 7,398.7 |
| | $ | 7,367.9 |
| | $ | (30.8 | ) |
These changes are primarily driven by the reclassification of certain cash payments to customers from marketing, general and administrative expenses to a reduction of revenue, as well as the change in the timing of recognition of certain promotional discounts and cash payments to customers. This adoption had no impact to our cash flows from operating, investing or financing activities. See Note 1, "Basis of Presentation and Summary of Significant Accounting Policies" for further details on our significant accounting policies for revenue recognition pursuant to the new guidance.
New Accounting Pronouncements Not Yet Adopted
In February 2018, the FASB issued authoritative guidance intended to improve the usefulness of financial information related to the enactment of the 2017 U.S. Tax Cuts and Jobs Act (the "2017 Tax Act"). This guidance provides an option to reclassify from accumulated other comprehensive income to retained earnings the stranded tax effects resulting from the change in the U.S. federal corporate income tax rate as a result of the 2017 Tax Act. This guidance is effective for annual periods beginning after December 15, 2018, including interim periods within those annual periods, with early adoption permitted. We are currently evaluating the potential impact on our financial statements in order to determine whether to elect to make this reclassification upon adoption of this guidance.
In August 2017, the FASB issued authoritative guidance intended to refine and expand hedge accounting for both financial and commodity risks. The revised guidance will create more transparency around how economic results are presented, both on the face of the financial statements and in the footnotes. In addition, this guidance makes certain targeted improvements to simplify the application of hedge accounting guidance. This guidance is effective for annual periods beginning after December 15, 2018, including interim periods within those annual periods, with early adoption permitted. We are currently evaluating the potential impact the presentation of net periodic pension costson our financial position and net periodic postretirement benefit costs within our results of operations upon adoption of this guidance.guidance, and do not anticipate that such impact will be significant.
In February 2016, the FASB issued authoritative guidance intended to increase transparency and comparability among organizations by recognizing lease assets and liabilities on the balance sheet and disclosing key information about leasing arrangements. Under the new guidance, lessees will be required to recognize a right-of-use asset and a lease liability, measured on a discounted basis, at the commencement date for all leases with terms greater than twelve months. Additionally, this guidance will require disclosures to help investors and other financial statement users to better understand the amount, timing, and uncertainty of cash flows arising from leases, including qualitative and quantitative requirements. The guidance should be applied under a modified retrospective transition approach for leases existing at the beginning of the earliest comparative period presented in the adoption-period financial statements. Any leases that expire before the initial application date will not require any accounting adjustment.approach. This guidance is effective for annual reporting periods beginning after December 15, 2018, including interim periods within those annual periods, with early adoption permitted. We are currently evaluating the potential impact on our financial position and results of operations upon adoption of this guidance.
In May 2014, the FASB issued authoritative This guidance related to new accounting requirementswill result in our existing operating leases, for the recognition of revenue from contracts with customers. The core principle of the guidance is that an entity should recognize revenue to depict the transfer of promised goods or services to customers in an amount that reflects the consideration to which the entity expectscertain real estate and equipment, to be entitled to in exchange for the goods or services. The guidance also includes enhanced disclosure requirements which are intended to help financial statement users better understand the nature, amount, timingrecognized on our balance sheet. We will further analyze our lease arrangements as we complete our assessment and uncertainty of revenue being recognized. Subsequent to the releaseimplementation of this guidance, the FASB has issued additional updates intended to provide interpretive clarifications and to reduce the cost and complexity of applying the new revenue recognition standard both at transition and on an ongoing basis. The new standard and related amendments are effective for annual reporting periods beginning after December 15, 2017, and interim periods within those annual periods. Upon adoption of the new standard, the use of either a full retrospective or cumulative effect transition method is permitted. We are currently in the process of evaluating the potential impact this new guidance will have on our financial statements. We have not completed this evaluation and therefore, cannot conclude whether the guidance will have a significant impact on our financial statements at this time. However, based on preliminary work completed, we are considering the implications that the new standard may have on our contract brewing arrangements, presentation of certain customer related trade spend, as well as the timing of recognition of certain promotional discounts, which are areas that could potentially be impacted by the adoption of the new guidance. We currently anticipate that we will utilize the cumulative effect transition method, however, this expectation may change following the completion of our evaluation of the impact of this guidance on our financial statements.
Other than the items noted above, there have been no new accounting pronouncements not yet effective or adopted in the current year that we believe have a significant impact, or potential significant impact, to our unaudited condensed consolidated interim financial statements.
3. Segment Reporting
Our reporting segments are based on the key geographic regions in which we operate, which are the basis on which our chief operating decision maker evaluates the performance of the business. Our reporting segments consist of the U.S., Canada, Europe and MCI.International. Corporate is not a segment and primarily includes interest and certain other general and
administrative costs that are not allocated to any of the operating segments as well as the unrealized changes in fair value on our commodity swaps not designated in hedging relationships recorded within cost of goods sold, which are later reclassified when realized to the segment in which the underlying exposure resides. Effective January 1, 2017, European markets including Sweden, Spain, Germany, UkraineAdditionally, only the service cost component of net periodic pension and Russia, which were previouslyOPEB cost are now reported under our MCIwithin each operating segment, as discussed in Note 2, "New Accounting Pronouncements", and all other components are reported, within our Europe segment. Additionally, effective January 1, 2017, the results of the MillerCoors Puerto Rico business, which were previously reported as part of the U.S. segment, are reportedretrospectively and prospectively, within the MCI segment. We have not recast historical results for these changes onCorporate segment in accordance with how our chief operating decision maker evaluates the basisperformance of immateriality.our business.
No single customer accounted for more than 10% of our consolidated sales for the three months ended March 31, 2017,2018, or March 31, 2016. Net2017. Consolidated net sales represent sales to third-party external customers less excise taxes. Inter-segment transactions impacting net sales revenues and income (loss) from continuing operations before income taxes eliminate in consolidation.consolidation and are primarily related to U.S. segment sales to the other segments.
The following table presentstables present net sales, income (loss) before income taxes and total assets by segment:
| | | | Three Months Ended | Three Months Ended |
| | March 31, 2017 | | March 31, 2016 | March 31, 2018 | | March 31, 2017 |
| | (In millions) | (In millions) |
U.S.(1) | $ | 1,749.9 |
| | $ | — |
| $ | 1,647.8 |
| | $ | 1,749.9 |
|
| Canada | 291.1 |
| | 268.0 |
| 283.8 |
| | 291.1 |
|
| Europe | 381.6 |
| | 358.7 |
| 374.3 |
| | 381.6 |
|
| MCI | 61.8 |
| | 31.0 |
| |
| International | | 57.5 |
| | 61.8 |
|
| Corporate | 0.3 |
| | 0.4 |
| 0.2 |
| | 0.3 |
|
Eliminations(2) | (36.0 | ) | | (0.9 | ) | |
| Inter-segment net sales eliminations | | (32.1 | ) | | (36.0 | ) |
| Consolidated net sales | $ | 2,448.7 |
| | $ | 657.2 |
| $ | 2,331.5 |
| | $ | 2,448.7 |
|
|
| | | | | | | |
| | Three Months Ended |
| | March 31, 2018 | | March 31, 2017(4) |
| | (In millions) |
| U.S. | $ | 261.7 |
| | $ | 316.6 |
|
Canada(1) | 9.1 |
| | 20.9 |
|
Europe(2) | (29.9 | ) | | 27.0 |
|
| International | 3.7 |
| | 1.5 |
|
Corporate(3) | 112.8 |
| | (85.1 | ) |
| Consolidated income (loss) before income taxes | $ | 357.4 |
| | $ | 280.9 |
|
| |
| (1) | PriorDuring the first quarter of 2017, we received payment and recorded a gain of CAD 10.6 million, or $8.1 million, resulting from a purchase price adjustment related to October 11, 2016, MCBC’s 42% sharethe historical sale of MillerCoors' results of operations was reported as equity income in MillerCoorsMolson Inc.’s ownership interest in the unaudited condensed consolidated statementsMontreal Canadiens, which is considered an affiliate of operations. As a result of the Acquisition, beginning October 11, 2016, MillerCoors' results were fully consolidated into MCBC’s consolidated financial statements.MCBC. |
| |
| (2) | Eliminations reflect gross inter-segment sales, purchases, and volumes which are eliminated inDuring the consolidated totals. |
The following table presents income (loss) from continuing operations before income taxes by segment:
|
| | | | | | | |
| | Three Months Ended |
| | March 31, 2017 | | March 31, 2016 |
| | (In millions) |
U.S.(1) | $ | 315.6 |
| | $ | 142.4 |
|
| Canada | 23.1 |
| | 146.6 |
|
Europe(2) | 30.6 |
| | (1.2 | ) |
| MCI | 1.5 |
| | (2.3 | ) |
| Corporate | (97.8 | ) | | (104.8 | ) |
| Consolidated income (loss) from continuing operations before income taxes | $ | 273.0 |
| | $ | 180.7 |
|
| |
(1) | Prior to October 11, 2016, MCBC’s 42% share of MillerCoors' results of operations was reported as equity income in MillerCoors in the unaudited condensed consolidated statements of operations. As a result of the Acquisition, beginning October 11, 2016, MillerCoors' results were fully consolidated into MCBC’s consolidated financial statements. |
| |
(2) | Recently, the largest food and retail company in Croatia, Agrokor, announced it is facing significant financial difficulties that have raised doubt about the collectibility of certain of our outstanding receivables with its direct subsidiaries. These subsidiaries are customers of ours within the Europe segment and, therefore, we are closely monitoring the situation. Specifically, Agrokor has entered into active discussions with local regulators, financial institutions and other creditors to stabilize its business and resume payments to suppliers and others as soon as possible. Our exposure related to Agrokor, as ofthree months ended March 31, 2017, was approximately EUR 18 million. Based on the facts and circumstances known at this time, we have recorded a provision for an estimate of uncollectible receivables of approximately $11 million.million related to Agrokor, a large customer in Croatia. The proceedings related to this matter have been formally extended to, and are currently expected to be resolved by, July 2018. Separately, during the first quarter of 2017, we released an indirect tax loss contingency, which was initially recorded in the fourth quarter of 2016, for a benefit of approximately $50 million during the first quarter of 2017; seemillion. See Note 16,14, "Commitments and Contingencies" for details. |
| |
| (3) | During the three months ended March 31, 2018, we recorded a gain of $328.0 million related to the Adjustment Amount as defined and further discussed in Note 6, "Special Items". Additionally, related to the unrealized mark-to-market valuation on our commodity hedge positions, we recorded an unrealized loss of $84.7 million during the three months ended March 31, 2018, compared to an unrealized gain of $63.1 million during the three months ended March 31, 2017. |
| |
| (4) | Segment results for the three months ended March 31, 2017, have been adjusted to reflect the adoption of the new accounting pronouncement for pension and other postretirement benefit costs as well as the reclassification of all non-service costs components of pension and other postretirement costs to Corporate. See Note 2, "New Accounting Pronouncements" for further details. |
Income (loss) from continuing operations before income taxes includes the impact of special items. Refer to Note 6, "Special Items" for further discussion. Additionally, various costs associated with the Acquisition and its related financing were recorded for the three months ended March 31, 2017, and March 31, 2016. Refer to Note 4, "Acquisition and Investments" for further details.
The following table presents total assets by segment:
| | | | As of | As of |
| | March 31, 2017 | | December 31, 2016 | March 31, 2018 | | December 31, 2017 |
| | (In millions) | (In millions) |
| U.S. | $ | 19,965.3 |
| | $ | 19,844.7 |
| $ | 19,319.4 |
| | $ | 19,353.6 |
|
| Canada | 4,256.6 |
|
| 4,206.8 |
| 4,688.5 |
|
| 4,835.7 |
|
| Europe | 4,771.1 |
|
| 4,673.7 |
| 5,691.6 |
|
| 5,522.0 |
|
| MCI | 254.6 |
|
| 255.6 |
| |
| International | | 275.6 |
|
| 294.8 |
|
| Corporate | 295.3 |
|
| 360.7 |
| 209.4 |
|
| 240.8 |
|
| Consolidated total assets | $ | 29,542.9 |
|
| $ | 29,341.5 |
| $ | 30,184.5 |
|
| $ | 30,246.9 |
|
4. Acquisition and Investments
Acquisition
On October 11, 2016, we completed the Acquisition for $12.0 billion in cash, subject to a downward adjustment as described in the purchase agreement. Prior to the Acquisition, MCBC owned a 50% voting and 42% economic interest in MillerCoors, and MillerCoors was accounted for under the equity method of accounting. Following the completion of the Acquisition, MillerCoors, which was previously a joint venture between MCBC and SABMiller, became a wholly-owned subsidiary of MCBC and its results were fully consolidated by MCBC prospectively beginning on October 11, 2016.
We have a downward purchase price adjustment, as described in the purchase agreement, if the unaudited U.S. GAAP earnings before interest, tax, depreciation and amortization ("EBITDA") for the Miller International Business for the twelve months prior to closing is below $70 million. The determination for the amount of the downward purchase price adjustment, if any, is ongoing pursuant to the terms of the purchase agreement.
Under the acquisition method of accounting, MCBC recorded all assets acquired and liabilities assumed at their respective acquisition-date fair values. The excess of total consideration, including the estimated fair value of our previously held equity interest in MillerCoors, over the net identifiable assets acquired and liabilities assumed was recorded as goodwill. The detailed valuation analyses necessary to assess the fair values of the tangible and intangible assets acquired and liabilities assumed and goodwill recognized have been completed, however, the analyses are preliminary in nature and are subject to adjustment as additional information is obtained about the facts and circumstances that existed as of the Acquisition date. Therefore, there may be adjustments to the valuation of our previously held equity interest, as well as to the assigned values of acquired assets and assumed liabilities, including but not limited to brands and other intangible assets and property, plant and equipment that may give rise to increases or decreases in the amounts of depreciation and amortization expense. There have been no changes to these allocated amounts in the first quarter of 2017. The final determination of the fair values will be completed within the measurement period of up to one year from the Acquisition date as permitted under U.S. GAAP and any adjustments to provisional amounts that are identified during the measurement period will be recorded in the reporting period in which the adjustment is determined. The size and complexity of the Acquisition could necessitate the need to use the full one year measurement period to adequately analyze and assess a number of the factors used in establishing the asset and liability fair values. Any potential adjustments made could be material in relation to these preliminary values.
Unaudited Pro Forma Financial Information
The following unaudited pro forma financial information gives effect to the Acquisition and the completed financing as if they were completed on January 1, 2016, the first day of our 2016 fiscal year and the pro forma adjustments are based on items that are factually supportable, are directly attributable to the Acquisition and are expected to have a continuing impact on MCBC's results of operations. The unaudited pro forma financial information has been calculated after applying MCBC’s accounting policies and adjusting the results of MillerCoors to reflect the additional depreciation and amortization that would have been charged assuming the preliminary fair value adjustments to property, plant and equipment, and intangible assets had been applied from January 1, 2016, together with the consequential tax effects. Pro forma adjustments have been made to remove non-recurring transaction-related costs included in historical results as well as to reflect the incremental interest expense to be prospectively incurred on the debt and term loans issued to finance the Acquisition, in addition to other pro forma adjustments. See below table for significant non-recurring costs. Also, see Note 7, "Other Income and Expense" for details related to certain financing-related expenses incurred.
Additionally, the following unaudited pro forma financial information does not reflect the impact of the acquisition of the Miller global brand portfolio and other assets primarily related to the Miller International Business as we are not able to
estimate the historical results of operations from this business and have concluded, based on the limited information available to MCBC, that it is insignificant to the overall Acquisition. The preliminary purchase price allocation reflects the estimated value allocated to the Miller global brand portfolio reported within identifiable intangible assets subject to amortization.Based on the limited information regarding such brands received to date, this estimated value allocated to these brands remains subject to change as additional information, reflective of the performance of the brands as of the Acquisition date, becomes available.
The unaudited pro forma financial information below does not reflect the realization of any expected ongoing synergies relating to the integration of MillerCoors. Further, the unaudited pro forma financial information should not be considered indicative of the results that would have occurred if the Acquisition and related financing had been consummated on January 1, 2016, nor are they indicative of future results.
|
| | | |
| | Three Months Ended |
| | March 31, 2016 |
| | (in millions) |
| Net sales | $ | 2,461.4 |
|
| Net income from continuing operations attributable to MCBC | $ | 257.4 |
|
| Net income attributable to MCBC | $ | 256.9 |
|
| Net income from continuing operations attributable to MCBC per share: | |
| Basic | $ | 1.20 |
|
| Diluted | $ | 1.19 |
|
For the three months ended March 31, 2016, the following non-recurring charges (benefits) directly attributable to the Acquisition were made as adjustments to our pro forma results to remove the impact from our historical operating results within the below noted line items. |
| | | | |
| | Three Months Ended | |
| | March 31, 2016 | |
| | (In millions) | |
| Non-recurring charges (benefits) | | Location |
| Other transaction-related costs | $ | 14.9 |
| Marketing, general and administrative expenses |
| Bridge loan - amortization of financing costs | $ | 18.4 |
| Other income (expense) |
| Term loan - commitment fee | $ | 1.2 |
| Interest expense, net |
| Swaption - unrealized loss | $ | 21.1 |
| Interest expense, net |
| Interest income earned on money market and fixed rate deposit accounts | $ | (2.5 | ) | Interest income, net |
MillerCoors Pre-Acquisition Financial Information
Summarized financial information for MillerCoors for the periods prior to the Acquisition under the equity method of accounting are as follows:
Results of Operations
|
| | | |
| | Three Months Ended |
| | March 31, 2016 |
| | (in millions) |
| Net sales | $ | 1,816.1 |
|
| Cost of goods sold | (1,033.0 | ) |
| Gross profit | $ | 783.1 |
|
Operating income(1) | $ | 336.5 |
|
Net income attributable to MillerCoors(1) | $ | 335.3 |
|
| |
(1) | Results include net special charges primarily related to the closure of the Eden, North Carolina brewery, which for the three months ended March 31, 2016, includes $35.9 million of accelerated depreciation in excess of normal depreciation associated with the brewery and $1.0 million of other charges. |
The following represents our proportionate share in net income attributable to MillerCoors reported under the equity method of accounting prior to the Acquisition:
|
| | | |
| | Three Months Ended |
| | March 31, 2016 |
| | (in millions, except percentages) |
| Net income attributable to MillerCoors | $ | 335.3 |
|
| MCBC's economic interest | 42 | % |
| MCBC's proportionate share of MillerCoors' net income | 140.8 |
|
| Amortization of the difference between MCBC's contributed cost basis and proportionate share of the underlying equity in net assets of MillerCoors | 1.1 |
|
Share-based compensation adjustment(1) | 0.5 |
|
| Equity income in MillerCoors | $ | 142.4 |
|
| |
(1) | The net adjustment is to eliminate all share-based compensation impacts related to pre-existing SABMiller equity awards held by former Miller Brewing Company employees employed by MillerCoors, as well as to add back all share-based compensation impacts related to pre-existing MCBC equity awards held by former MCBC employees who transferred to MillerCoors. |
The following table summarizes our transactions with MillerCoors:
|
| | | |
| | Three Months Ended |
| | March 31, 2016 |
| | (In millions) |
| Beer sales to MillerCoors | $ | 2.0 |
|
| Beer purchases from MillerCoors | $ | 9.9 |
|
| Service agreement costs and other charges to MillerCoors | $ | 0.7 |
|
| Service agreement costs and other charges from MillerCoors | $ | 0.1 |
|
Investments
Our investments include both equity method and consolidated investments. Those entities identified as variable interest entities ("VIEs")VIEs have been evaluated to determine whether we are the primary beneficiary. The VIEs included under "Consolidated VIEs" below are those for which we have concluded that we are the primary beneficiary and accordingly, consolidate these entities. None of our consolidated VIEs held debt as of March 31, 2017,2018, or December 31, 2016.2017. We have not provided any financial support to any of our VIEs during the year that we were not previously contractually obligated to provide. Amounts due to and due from our equity method investments are recorded as affiliate accounts payable and affiliate accounts receivable.
Authoritative guidance related to the consolidation of VIEs requires that we continually reassess whether we are the primary beneficiary of VIEs in which we have an interest. As such, the conclusion regarding the primary beneficiary status is subject to change and we continually evaluate circumstances that could require consolidation or deconsolidation. As of March 31, 2017,2018, and December 31, 2016,2017, our consolidated VIEs are Cobra Beer Partnership, Ltd. ("Cobra U.K.") and, Grolsch U.K. Ltd. ("Grolsch"), Rocky Mountain Metal Container ("RMMC") and Rocky Mountain Bottle Company ("RMBC"). RMMC and RMBC were previously consolidated VIEs of MillerCoors and as a result of the Acquisition, are now MCBC consolidated VIEs. Our unconsolidated VIEs are Brewers Retail Inc. ("BRI") and Brewers' Distributor Ltd. ("BDL").
Both BRI and BDL have outstanding third party debt which is guaranteed by its shareholders. As a result, we have a guarantee liability of $48.8$52.2 million and $31.7$38.1 million recorded as of March 31, 2017,2018, and December 31, 2016,2017, respectively, which is presented within accounts payable and other current liabilities on the unaudited condensed consolidated balance sheets and represents our proportionate share of the outstanding balance of these debt instruments. The carrying value of the
guarantee liability equals fair value, which considers an adjustment for our own non-performance risk and is considered a Level 2 measurement. The offset to the guarantee liability was recorded as an adjustment to our respective equity method investment within the unaudited condensed consolidated balance sheets. The resulting change in our equity method investments during the year due to movements in the guarantee represents a non-cash investing activity.
Consolidated VIEs
The following summarizes the assets and liabilities of our consolidated VIEs (including noncontrolling interests):
| | | | As of | As of |
| | March 31, 2017 | | December 31, 2016 | March 31, 2018 | | December 31, 2017 |
| | Total Assets | | Total Liabilities | | Total Assets | | Total Liabilities | Total Assets | | Total Liabilities | | Total Assets | | Total Liabilities |
| | (In millions) | (In millions) |
| Grolsch | $ | 5.1 |
| | $ | 0.5 |
| | $ | 4.4 |
| | $ | 0.5 |
| $ | 4.9 |
| | $ | 0.1 |
| | $ | 4.8 |
| | $ | 0.2 |
|
| Cobra U.K. | $ | 16.4 |
| | $ | 0.8 |
| | $ | 14.2 |
| | $ | 1.1 |
| $ | 17.7 |
| | $ | 1.2 |
| | $ | 20.2 |
| | $ | 2.1 |
|
| RMMC | $ | 74.9 |
| | $ | 4.4 |
| | $ | 70.2 |
| | $ | 3.5 |
| $ | 72.9 |
| | $ | 4.7 |
| | $ | 74.4 |
| | $ | 4.4 |
|
| RMBC | $ | 57.5 |
| | $ | 2.6 |
| | $ | 53.1 |
| | $ | 2.5 |
| $ | 67.6 |
| | $ | 6.4 |
| | $ | 56.2 |
| | $ | 4.6 |
|
5. Share-Based Payments
We have one share-based compensation plan, the MCBC Incentive Compensation Plan (the "Incentive Compensation Plan"), as of March 31, 2017,2018, and all outstanding awards fall under this plan. During the three months ended March 31, 2017,2018, and March 31, 2016,2017, we recognized share-based compensation expense related to the following Class B common stock awards to certain directors, officers and other eligible employees, pursuant to the Incentive Compensation Plan: restricted stock units ("RSUs"), deferred stock units ("DSUs"), performance share units ("PSUs")RSUs, DSUs, PSUs and stock options. The settlement amount of the PSUs is determined based on market and performance metrics, which include our total shareholder return performance relative to the S&P 500 and specified internal performance metrics designed to drive greater shareholder return. PSU compensation expense is based on a fair value assigned to the market metric using a Monte Carlo model upon grant, which remains constant throughout the vesting period of three years, and a performance multiplier, which will vary due to changing estimates of the performance metric condition.
The following table summarizes share-based compensation expense for the three months ended March 31, 2017, and March 31, 2016:
|
| | | | | | | |
| | Three Months Ended |
| | March 31, 2017 | | March 31, 2016 |
| | (In millions) |
| Pretax compensation expense | $ | 15.5 |
| | $ | 6.7 |
|
| Tax benefit | (5.3 | ) | | (1.9 | ) |
| After-tax compensation expense | $ | 10.2 |
| | $ | 4.8 |
|
The increase in expense in the first quarter of 2017 was primarily driven by the issuance of replacement awards to MillerCoors employees in connection with the completion of the Acquisition, as well as accelerated expense related to certain awards during the first quarter of 2017. |
| | | | | | | |
| | Three Months Ended |
| | March 31, 2018 | | March 31, 2017 |
| | (In millions) |
| Pretax compensation expense | $ | 14.8 |
| | $ | 15.5 |
|
| Tax benefit | (1.6 | ) | | (5.3 | ) |
| After-tax compensation expense | $ | 13.2 |
| | $ | 10.2 |
|
As of March 31, 2017,2018, there was $103.9$84.4 million of total unrecognized compensation expense from all share-based compensation arrangements granted under the Incentive Compensation Plan, related to unvested awards. This total compensation expense is expected to be recognized over a weighted-average period of 2.12.2 years.
The following table represents non-vested RSUs, DSUs and PSUs as of March 31, 2017, and the activity during the three months ended March 31, 2017:
| | | | RSUs and DSUs | | PSUs | RSUs and DSUs | | PSUs |
| | Units | | Weighted-average grant date fair value per unit | | Units | | Weighted-average grant date fair value per unit | Units | | Weighted-average grant date fair value per unit | | Units | | Weighted-average grant date fair value per unit |
| | (In millions, except per unit amounts) | (In millions, except per unit amounts) |
| Non-vested as of December 31, 2016 | 0.8 |
| | $87.01 | | 0.5 |
| | $81.67 | |
| Non-vested as of December 31, 2017 | | 1.0 |
| | $95.80 | | 0.4 |
| | $89.57 |
| Granted | 0.3 |
| | $92.00 | | 0.2 |
| | $97.13 | 0.4 |
| | $74.20 | | 0.2 |
| | $78.30 |
| Vested | (0.3 | ) | | $76.67 | | (0.2 | ) | | $57.29 | (0.3 | ) | | $91.55 | | (0.1 | ) | | $75.10 |
Converted(1) | 0.3 |
| | $106.17 | | (0.1 | ) | | $106.17 | |
| Forfeited | — |
| | $— | | — |
| | $— | — |
| | $— | | — |
| | $— |
| Non-vested as of March 31, 2017 | 1.1 |
| | $95.21 | | 0.4 |
| | $89.44 | |
| Non-vested as of March 31, 2018 | | 1.1 |
| | $89.93 | | 0.5 |
| | $86.95 |
| |
(1) | During the three months ended March 31, 2017, the MillerCoors 2016 PSU replacement awards were converted to RSUs under the Incentive Compensation Plan based on the achievement of the performance metric during the one year performance period ended December 31, 2016. These awards cliff vest at the end of a three year service period in the first quarter of 2019. |
The weighted-average fair value per unit for the non-vested PSUs is $103.82$86.76 as of March 31, 20172018.
The following table represents the summary of stock options and stock-only stock appreciation rights ("SOSARs") outstanding as of March 31, 2017, and the activity during the three months ended March 31, 2017:
|
| | | | | | | | | |
| | Awards | | Weighted-average exercise price per share | | Weighted-average remaining contractual life (years) | | Aggregate intrinsic value |
| | (In millions, except per share amounts and years) |
| Outstanding as of December 31, 2016 | 1.5 | | $59.79 | | 5.4 | | $ | 58.2 |
|
| Granted | 0.2 | | $96.77 | | | | |
| Exercised | (0.1) | | $54.81 | | | | |
| Forfeited | — | | $— | | | | |
| Outstanding as of March 31, 2017 | 1.6 | | $63.88 | | 5.9 | | $ | 51.4 |
|
| Expected to vest at March 31, 2017 | 0.4 | | $89.67 | | 9.2 | | $ | 2.3 |
|
| Exercisable at March 31, 2017 | 1.2 | | $56.28 | | 4.9 | | $ | 49.0 |
|
|
| | | | | | | | | |
| | Stock options and SOSARs |
| | Awards | | Weighted-average exercise price per share | | Weighted-average remaining contractual life (years) | | Aggregate intrinsic value |
| | (In millions, except per share amounts and years) |
| Outstanding as of December 31, 2017 | 1.5 | | $63.60 | | 4.6 | | $ | 31.3 |
|
| Granted | 0.2 | | $78.79 | | | | |
| Exercised | (0.1) | | $47.96 | | | | |
| Forfeited | — | | $— | | | | |
| Outstanding as of March 31, 2018 | 1.6 | | $66.80 | | 5.0 | | $ | 20.3 |
|
| Expected to vest as of March 31, 2018 | 0.4 | | $85.39 | | 9.0 | | $ | — |
|
| Exercisable as of March 31, 2018 | 1.2 | | $61.32 | | 3.9 | | $ | 20.3 |
|
The total intrinsic values of stock options and SOSARs exercised during the three months ended March 31, 2017,2018, and March 31, 2016,2017, were $4.8$4.6 million and $7.7$4.8 million, respectively. During the three months ended March 31, 2017,2018, and March 31, 2016,2017, cash received from stock option exercises was $0.3$6.1 million and $4.2$0.3 million, respectively, and total tax benefits realized, including excess tax benefits, from share-based awards vested or exercised was $17.0$5.4 million and $6.1$17.0 million, respectively.
The fair value of each option granted in the first quarter of 20172018 and 20162017 was determined on the date of grant using the Black-Scholes option-pricing model with the following weighted-average assumptions:
| | | | Three Months Ended | Three Months Ended |
| | March 31, 2017 | | March 31, 2016 | March 31, 2018 | | March 31, 2017 |
| Risk-free interest rate | 2.04% | | 1.40% | 2.65% | | 2.04% |
| Dividend yield | 1.64% | | 1.81% | 2.08% | | 1.64% |
| Volatility range | 22.40%-22.88% | | 23.16%-24.64% | 22.36%-24.14% | | 22.40%-22.88% |
| Weighted-average volatility | 22.52% | | 23.53% | 22.81% | | 22.52% |
| Expected term (years) | 5.1 | | 5.2 | 5.3 | | 5.1 |
| Weighted-average fair market value | $18.66 | | $16.65 | $15.44 | | $18.66 |
The risk-free interest rates utilized for periods throughout the contractual life of the stock options are based on a zero-coupon U.S. Treasury security yield at the time of grant. Expected volatility is based on a combination of historical and implied volatility of our stock. The expected term of stock options is estimated based upon observations of historical employee option exercise patterns and trends of those employees granted options in the respective year.
The fair value of the market metric for each PSU granted in the first quarter of 20172018 and 20162017 was determined on the date of grant using a Monte Carlo model to simulate total stockholder return for MCBC and peer companies with the following weighted-average assumptions:
| | | | Three Months Ended | Three Months Ended |
| | March 31, 2017 | | March 31, 2016 | March 31, 2018 | | March 31, 2017 |
| Risk-free interest rate | 1.59% | | 1.04% | 2.34% | | 1.59% |
| Dividend yield | 1.64% | | 1.81% | 2.08% | | 1.64% |
| Volatility range | 13.71%-80.59% | | 14.10%-77.11% | 13.03%-81.87% | | 13.71%-80.59% |
| Weighted-average volatility | 24.24% | | 23.68% | 22.76% | | 24.24% |
| Expected term (years) | 2.8 | | 2.8 | 2.8 | | 2.8 |
| Weighted-average fair market value | $97.13 | | $90.49 | $78.30 | | $97.13 |
The risk-free interest rates utilized for periods throughout the expected term of the PSUs are based on a zero-coupon U.S. Treasury security yield at the time of grant. Expected volatility is based on historical volatility of our stock as well as the stock of our peer firms, as shown within the volatility range above, for a period from the grant date consistent with the expected term. The expected term of PSUs is calculated based on the grant date to the end of the performance period.
As of March 31, 20172018, there were 4.33.5 million shares of the Company's Class B common stock available for issuance as awards under the Incentive Compensation Plan.
6. Special Items
We have incurred charges or realized benefits that either we do not believe to be indicative of our core operations, or we believe are significant to our current operating results warranting separate classification. As such, we have separately classified these charges (benefits) as special items. The table below summarizes special items recorded:
| | | | Three Months Ended | Three Months Ended |
| | March 31, 2017 | | March 31, 2016 | March 31, 2018 | | March 31, 2017 |
| | (In millions) | (In millions) |
| Employee-related charges | | | | | | |
| Restructuring | $ | 0.9 |
| | $ | (1.6 | ) | $ | 3.9 |
| | $ | 0.9 |
|
| Canada - OPEB curtailment gain | (2.9 | ) | | — |
| |
| Impairments or asset abandonment charges | | | | | | |
U.S. - Asset abandonment(1) | 2.0 |
| | — |
| 1.5 |
| | 2.0 |
|
Canada - Asset abandonment(2) | 1.2 |
| | 1.1 |
| 6.1 |
| | 1.2 |
|
Europe - Asset abandonment(3) | 2.6 |
| | 2.3 |
| 1.7 |
| | 2.6 |
|
| Termination fees and other (gains) losses | | | | | | |
Canada - Gain on sale of asset(2) | — |
| | (110.4 | ) | |
Acquisition purchase price adjustment settlement gain(4) | | (328.0 | ) | | — |
|
| Total Special items, net | $ | 3.8 |
| | $ | (108.6 | ) | $ | (314.8 | ) | | $ | 6.7 |
|
| |
| (1) | During the third quarter of 2015, MillerCoors announced plans to close its brewery in Eden, North Carolina, in an effort to optimize the brewery footprint and streamline operations for greater efficiencies. Products produced in Eden were transitioned to other breweries in the U.S. supply chain network and the Eden brewery is now closed. For the three months ended March 31, 2017, certain costs related to the closure of the brewery were recorded within special items. |
| |
(2) | As part of our ongoing strategic review of our Canadian supply chain network, we completed the sale of our Vancouver brewery on March 31, 2016, resulting in a gain of $110.4 million within special items in the first quarter of 2016. This amount represents a non-cash investing activity on the unaudited condensed consolidated statement of cash flowsCharges for the three months ended March 31, 2016. The net cash proceeds of CAD 183.1 million ($140.8 million), remained in trust following2018, relate to the completionplanned closure of the saleColfax, California, cidery, and were received on April 1, 2016. In conjunction with the saleconsist primarily of the brewery, we |
agreed to leaseback the existing property to continue operations on an uninterrupted basis while our new brewery is being constructed. We have evaluated this transaction pursuant to the accounting guidance for sale-leaseback transactions, and concluded that the relevant criteria had been met for full gain recognition. Additionally, during the three months ended March 31, 2017, and March 31, 2016, we incurred other abandonment charges, including accelerated depreciation charges in excess of normal depreciation of $1.2 million and $1.1 million, respectively, related to the planned closure of the Vancouver brewery.
| |
(3) | As a result of our continued strategic review of our European supply chain network,normal depreciation. Charges for the three months ended March 31, 2017, we incurred $2.6 million of charges associated withrelate to the planned closure of our Burton South brewery, of which $2.2 million represents accelerated depreciation charges in excess of our normal depreciation. the Eden, North Carolina, brewery. |
| |
| (2) | For the three months ended March 31, 2016,2018, we incurred $2.3 millioncharges consisting primarily of charges associated withaccelerated depreciation in excess of normal depreciation related to the planned closures of the Vancouver and Montreal breweries, which are currently expected to occur in 2019 and 2021, respectively. Charges for the three months ended March 31, 2017, relate primarily to accelerated depreciation in excess of normal depreciation related to the above mentioned planned closure of our Burton Souththe Vancouver brewery. |
| |
| (3) | For the three months ended March 31, 2018, and completed closuresMarch 31, 2017, we incurred charges consisting primarily of our Plovdiv and Alton breweries, of which $1.9 million represents accelerated depreciation charges in excess of our normal depreciation.depreciation related to the Burton South brewery, which closed during the first quarter of 2018. |
| |
| (4) | On October 11, 2016, we completed the Acquisition for $12.0 billion in cash, subject to a downward adjustment as described in the purchase agreement. This purchase price "Adjustment Amount," as defined in the purchase agreement, required payment to MCBC if the unaudited EBITDA for the Miller International Business for the twelve months prior to closing was below $70 million. |
Throughout the process outlined in the purchase agreement, significant uncertainty remained on the ultimate outcome of the Adjustment Amount. As a result, no adjustment to purchase accounting was made through the completion of the measurement period in October 2017. Subsequently, on January 21, 2018, MCBC and ABI entered into a settlement agreement related to the purchase price adjustment under the purchase agreement, and on January 26, 2018, pursuant to the settlement agreement, ABI paid to MCBC $330.0 million, of which $328.0 million constitutes the Adjustment Amount. As this settlement occurred following the finalization of purchase accounting, we recorded the settlement proceeds related to the Adjustment Amount as a gain within special items, net in our unaudited condensed consolidated statement of operations in our Corporate segment and within cash provided by operating activities within our unaudited condensed consolidated statement of cash flows for the three months ended March 31, 2018. MCBC and ABI also agreed to certain mutual releases as further described in the settlement agreement which was filed as an exhibit to a Current Report on Form 8-K filed January 22, 2018.
Restructuring Activities
Beginning in 2016, restructuring initiatives related to the integration of MillerCoors after the completion of the Acquisition were implemented in order to operate a more efficient business and achieve cost saving targets which to-date resulted in reduced employment levels by approximately 63103 employees. Total restructuring costs related to integration initiatives represent the majority of the charges within the table below by segment. Severance costs related to these restructuring activities were recorded as special items within our unaudited condensed consolidated statements of operations. As we continually evaluate our cost structure and seek opportunities for further efficiencies and cost savings as part of these initiatives, we may incur additional restructuring related charges in the future, however, we are unable to estimate the amount of charges at this time.
We have continued our ongoing assessment of our supply chain strategies across our segments in order to align with our cost saving objectives. As part of this strategic review, which began in 2014, we closedhave had restructuring activities related to the Alton and Plovdivclosure or planned closure of breweries, and we planas well as activities related to close the Vancouver and Burton South breweries.business efficiencies. As a result, of these restructuring activities, we have reduced employment levels by 403 employees,a total of which 331 and 72 relate to 2015 and 2014 restructuring programs, respectively.416 employees. Consequently, we recognized severance and other employee-related charges, which we have recorded as special items within our unaudited condensed consolidated statements of operations. We will continue to evaluate our supply chain network and seek opportunities for further efficiencies and cost savings, and we therefore may incur additional restructuring related charges or adjustments to previously recorded charges in the future, however, we are unable to estimate the amount of charges at this time.
The accrued restructuring balances represent expected future cash payments required to satisfy the remaining severance obligations to terminated employees, the majority of which we expect to be paid in the next 12 to 219 months. The table below summarizes the activity in the restructuring accruals by segment:
|
| | | | | | | | | | | | | | | | | | | | | | | |
| | U.S. | | Canada | | Europe | | MCI | | Corporate | | Total |
| | (In millions) |
| Total at December 31, 2016 | $ | 5.1 |
| | $ | 5.9 |
| | $ | 2.8 |
| | $ | 0.2 |
| | $ | 0.7 |
| | $ | 14.7 |
|
| Charges incurred | 0.5 |
| | — |
| | — |
| | 0.3 |
| | 0.1 |
| | 0.9 |
|
| Payments made | (3.6 | ) | | (0.4 | ) | | (0.3 | ) | | — |
| | — |
| | (4.3 | ) |
| Foreign currency and other adjustments | — |
| | — |
| | — |
| | — |
| | — |
| | — |
|
| Total at March 31, 2017 | $ | 2.0 |
|
| $ | 5.5 |
| | $ | 2.5 |
| | $ | 0.5 |
| | $ | 0.8 |
| | $ | 11.3 |
|
|
| | | | | | | | | | | | | | | | | | | | | | | |
| | U.S. | | Canada | | Europe | | International | | Corporate | | Total |
| | (In millions) |
| As of December 31, 2017 | $ | 0.6 |
| | $ | 4.3 |
| | $ | 1.8 |
| | $ | 0.2 |
| | $ | — |
| | $ | 6.9 |
|
| Charges incurred and changes in estimates | — |
| | (0.5 | ) | | 3.4 |
| | 1.0 |
| | — |
| | 3.9 |
|
| Payments made | (0.3 | ) | | (0.9 | ) | | (0.6 | ) | | (0.2 | ) | | — |
| | (2.0 | ) |
| Foreign currency and other adjustments | — |
| | (0.1 | ) | | — |
| | — |
| | — |
| | (0.1 | ) |
| As of March 31, 2018 | $ | 0.3 |
|
| $ | 2.8 |
| | $ | 4.6 |
| | $ | 1.0 |
| | $ | — |
| | $ | 8.7 |
|
|
| | | | | | | | | | | | | | | | | | | | | | | |
| | U.S. | | Canada | | Europe | | MCI | | Corporate | | Total |
| | (In millions) |
| Total at December 31, 2015 | $ | — |
| | $ | 2.3 |
| | $ | 5.6 |
| | $ | 1.3 |
| | $ | — |
| | $ | 9.2 |
|
| Payments made | — |
| | (0.1 | ) | | (0.3 | ) | | (1.3 | ) | | — |
| | (1.7 | ) |
| Changes in estimates | — |
| | — |
| | (1.6 | ) | | — |
| | — |
| | (1.6 | ) |
| Foreign currency and other adjustments | — |
| | 0.1 |
| | (0.1 | ) | | — |
| | — |
| | — |
|
| Total at March 31, 2016 | $ | — |
|
| $ | 2.3 |
| | $ | 3.6 |
| | $ | — |
| | $ | — |
| | $ | 5.9 |
|
|
| | | | | | | | | | | | | | | | | | | | | | | |
| | U.S. | | Canada | | Europe | | International | | Corporate | | Total |
| | (In millions) |
| As of December 31, 2016 | $ | 5.1 |
| | $ | 5.9 |
| | $ | 2.8 |
| | $ | 0.2 |
| | $ | 0.7 |
| | $ | 14.7 |
|
| Charges incurred and changes in estimates | 0.5 |
| | — |
| | — |
| | 0.3 |
| | 0.1 |
| | 0.9 |
|
| Payments made | (3.6 | ) | | (0.4 | ) | | (0.3 | ) | | — |
| | — |
| | (4.3 | ) |
| Foreign currency and other adjustments | — |
| | — |
| | — |
| | — |
| | — |
| | — |
|
| As of March 31, 2017 | $ | 2.0 |
|
| $ | 5.5 |
| | $ | 2.5 |
| | $ | 0.5 |
| | $ | 0.8 |
| | $ | 11.3 |
|
7. Other Income and Expense
The table below summarizes other income and (expense):
|
| | | | | | | |
| | Three Months Ended |
| | March 31, 2017 | | March 31, 2016 |
| | (In millions) |
Bridge loan commitment fees(1) | $ | — |
| | $ | (18.4 | ) |
| Gain (loss) from other foreign exchange and derivative activity, net | (8.2 | ) | | 3.7 |
|
Other, net(2) | 8.6 |
| | (0.6 | ) |
| Other income (expense), net | $ | 0.4 |
| | $ | (15.3 | ) |
| |
(1) | During the first quarter of 2016, we recognized amortization of commitment fees and other financing costs incurred in connection with our bridge loan agreement entered into subsequent to the announcement of the Acquisition. |
| |
(2) | During the first quarter of 2017, we recorded a gain of CAD 10.6 million, or $8.1 million, resulting from a purchase price adjustment related to the historical sale of Molson Inc.’s ownership interest in the Montreal Canadiens. The CAD 10.6 million was paid by the Montreal Canadiens, who are a considered an affiliate of MCBC, in the first quarter of 2017. |
8.7. Income Tax
Our effective tax rates for the first quarter of 2017 and 2016 were approximately 24% and 9%, respectively. Our effective tax rates were lower than the U.S. federal statutory rate of 35% primarily due to lower effective income tax rates applicable to our foreign businesses, driven by lower statutory income tax rates and tax planning impacts on statutory taxable income, as well as the impact of discrete items. |
| | | | | |
| | Three Months Ended |
| | March 31, 2018 | | March 31, 2017 |
| Effective tax rate | 21 | % | | 23 | % |
The increasedecrease in the effective tax rate during the first quarter of 20172018 versus 2016,2017, is primarily driven by the inclusion of 100% of MillerCoors' pretax income following the completionreduction of the Acquisition, which is subject to thestatutory U.S. federal and statecorporate income tax rates,rate from 35% to 21% as well asa result of the favorable impacts of tax benefits recognized in the prior year from transaction-related costs resulting from the Acquisition and favorable tax treatment associated with the sale of our Vancouver brewery in 2016. These drivers were2017 Tax Act. This decrease was partially offset by higherthe impact of discrete items. Specifically, we recognized net discrete tax benefits in 2017, including an increaseexpense of excess tax benefits from share-based compensation in 2017. Specifically, our total net discrete tax benefit was $8.4$5.5 million in the first quarter of 2017,2018, versus a $5.7an $8.4 million net discrete tax benefit recognized in the first quarter of 2016.2017. This change is driven primarily by the recognition of excess benefits from share-based compensation in the first quarter of 2017, versus other discrete tax expenses recognized in the first quarter of 2018.
Our tax rate is volatile and may move up or down with changes in, among other things, the amount and source of income or loss, our ability to utilize foreign tax credits, excess tax benefits or deficiencies from share-based compensation, changes in tax laws, and the movement of liabilities established pursuant to accounting guidance for uncertain tax positions as statutes of limitations expire, positions are effectively settled, or when additional information becomes available. There are proposed or pending tax law changes in various jurisdictions and other changes to regulatory environments in countries in which we do business that, if enacted, may have an impact on our effective tax rate.
Additionally, we continue to evaluate the impacts of the 2017 Tax Act. As we further understand its implications, as well as the related, and yet to be issued, regulator rules, regulations and interpretations, our effective tax rate could be impacted. For example, subsequent to the enactment, the FASB staff concluded that companies should make an accounting policy election to account for the tax effects of the global intangible low-taxed income (“GILTI”) either as a component of income tax expense in the future period the tax arises, or as a component of deferred taxes on the related investments in foreign subsidiaries. We are currently evaluating the GILTI provisions of the 2017 Tax Act and the related implications and have not finalized our accounting policy election, however, have preliminarily concluded that we will record as a periodic expense as incurred, and therefore, have not recorded deferred taxes for GILTI. We will continue to evaluate in future periods and will finalize our accounting policy election at that time.
9. Earnings Per Share ("EPS")
Basic EPS was computed usingWe did not make any material adjustments to the weighted-average numberamounts recorded as of sharesDecember 31, 2017, as a result of common stock outstandingthe 2017 Tax Act, however, we continue to consider these amounts provisional for the reasons discussed above. Additional impacts from the 2017 Tax Act will be recorded as they are identified during the period. Diluted EPS includesmeasurement period pursuant to SEC Staff Accounting Bulletin No. 118 ("SAB 118"). Our determination of the additional dilutive effect of our potentially dilutive securities, which include RSUs, DSUs, PSUs, stock options and SOSARs. The dilutivetax effects of our potentially dilutive securities are calculated using the treasury stock method. The following summarizes the effect of dilutive securities on diluted EPS:
|
| | | | | | | |
| | Three Months Ended |
| | March 31, 2017 | | March 31, 2016 |
| | (In millions, except per share amounts) |
| Amounts attributable to Molson Coors Brewing Company: | | | |
| Net income (loss) from continuing operations | $ | 201.9 |
| | $ | 163.2 |
|
| Income (loss) from discontinued operations, net of tax | (0.6 | ) | | (0.5 | ) |
| Net income (loss) attributable to Molson Coors Brewing Company | $ | 201.3 |
| | $ | 162.7 |
|
| Weighted-average shares for basic EPS | 215.0 |
| | 203.6 |
|
| Effect of dilutive securities: | | | |
| RSUs, DSUs, and PSUs | 0.9 |
| | 1.0 |
|
| Stock options and SOSARs | 0.6 |
| | 0.5 |
|
| Weighted-average shares for diluted EPS | 216.5 |
| | 205.1 |
|
| Basic net income (loss) attributable to Molson Coors Brewing Company per share: | | | |
| From continuing operations | $ | 0.94 |
| | $ | 0.80 |
|
| From discontinued operations | — |
| | — |
|
| Basic net income (loss) attributable to Molson Coors Brewing Company per share | $ | 0.94 |
| | $ | 0.80 |
|
| Diluted net income (loss) attributable to Molson Coors Brewing Company per share: | | | |
| From continuing operations | $ | 0.93 |
| | $ | 0.80 |
|
| From discontinued operations | — |
| | — |
|
| Diluted net income (loss) attributable to Molson Coors Brewing Company per share | $ | 0.93 |
| | $ | 0.80 |
|
| Dividends declared and paid per share | $ | 0.41 |
| | $ | 0.41 |
|
The following anti-dilutive securities were excluded2017 Tax Act will be completed no later than one year from the computationenactment date as permitted under SAB 118. Any adjustments to provisional amounts that are identified during the measurement period will be recorded and disclosed in the reporting period in which the adjustment is determined. The complexity of the effect2017 Tax Act could necessitate the need to use the full one year measurement period to adequately interpret, analyze and conclude upon the tax effects of dilutive securities on diluted EPS:
|
| | | | | |
| | Three Months Ended |
| | March 31, 2017 | | March 31, 2016 |
| | (In millions) |
| RSUs and stock options | 0.2 |
| | 0.1 |
|
Class B Common Stock Equity Issuance
On February 3, 2016, we completed an underwritten public offeringthe 2017 Tax Act as of our Class B common stock to partially fund the Acquisition, which increased the number of Class B common shares issued and outstanding by 29.9 million shares and received proceeds of $2.5 billion, net of issuance costs.enactment date.
10.8. Goodwill and Intangible Assets
The following summarizes the change in goodwill for the three months ended March 31, 2017:
|
| | | | | | | | | | | | | | | | | | | |
| | U.S. | | Canada | | Europe | | MCI | | Consolidated |
| | | | (In millions) |
| Balance at December 31, 2016 | $ | 6,415.6 |
| | $ | 567.6 |
| | $ | 1,260.5 |
| | $ | 6.4 |
| | $ | 8,250.1 |
|
| Foreign currency translation | — |
| | 5.3 |
| | 20.5 |
| | 0.3 |
| | 26.1 |
|
| Balance at March 31, 2017 | $ | 6,415.6 |
|
| $ | 572.9 |
| | $ | 1,281.0 |
| | $ | 6.7 |
| | $ | 8,276.2 |
|
|
| | | | | | | | | | | | | | | | | | | |
| | U.S. | | Canada | | Europe | | International | | Consolidated |
| Changes in Goodwill: | | | (In millions) |
| As of December 31, 2017 | $ | 5,928.5 |
| | $ | 932.1 |
| | $ | 1,538.0 |
| | $ | 6.9 |
| | $ | 8,405.5 |
|
Business acquisition(1) | — |
| | — |
| | 9.8 |
| | — |
| | 9.8 |
|
| Foreign currency translation | — |
| | (23.8 | ) | | 51.3 |
| | (0.1 | ) | | 27.4 |
|
| As of March 31, 2018 | $ | 5,928.5 |
|
| $ | 908.3 |
| | $ | 1,599.1 |
| | $ | 6.8 |
| | $ | 8,442.7 |
|
| |
| (1) | During the first quarter of 2018, we completed the acquisition of Aspall Cyder Limited, an established premium cider business in the U.K. As part of the preliminary purchase price accounting in the first quarter of 2018, goodwill generated in conjunction with this acquisition has been recorded within our Europe segment, subject to normal purchase accounting adjustments. |
The following table presents details of our intangible assets, other than goodwill, as of March 31, 2017:2018:
| | | | Useful life | | Gross | | Accumulated amortization | | Net | Useful life | | Gross | | Accumulated amortization | | Net |
| | (Years) | | (In millions) | (Years) | | (In millions) |
| Intangible assets subject to amortization: | | | | | | | | | | | | | | |
| Brands | 10 - 50 | | $ | 4,939.8 |
| | $ | (341.5 | ) | | $ | 4,598.3 |
| 10 - 50 | | $ | 5,200.0 |
| | $ | (567.2 | ) | | $ | 4,632.8 |
|
| License agreements and distribution rights | 15 - 28 | | 227.6 |
| | (92.5 | ) | | 135.1 |
| 15 - 28 | | 236.7 |
| | (104.9 | ) | | 131.8 |
|
| Other | 2 - 40 | | 133.0 |
| | (29.7 | ) | | 103.3 |
| 2 - 40 | | 149.7 |
| | (46.7 | ) | | 103.0 |
|
| Intangible assets not subject to amortization: | | | | | | | | | | | | | | |
| Brands | Indefinite | | 8,098.8 |
| | — |
| | 8,098.8 |
| Indefinite | | 8,248.2 |
| | — |
| | 8,248.2 |
|
| Distribution networks | Indefinite | | 759.6 |
| | — |
| | 759.6 |
| Indefinite | | 784.2 |
| | — |
| | 784.2 |
|
| Other | Indefinite | | 337.5 |
| | — |
| | 337.5 |
| Indefinite | | 337.6 |
| | — |
| | 337.6 |
|
| Total | | | $ | 14,496.3 |
| | $ | (463.7 | ) | | $ | 14,032.6 |
| | | $ | 14,956.4 |
| | $ | (718.8 | ) | | $ | 14,237.6 |
|
The following table presents details of our intangible assets, other than goodwill, as of December 31, 2016:2017:
| | | | Useful life | | Gross | | Accumulated amortization | | Net | Useful life | | Gross | | Accumulated amortization | | Net |
| | (Years) | | (In millions) | (Years) | | (In millions) |
| Intangible assets subject to amortization: | | | | | | | | | | | | | | |
| Brands | 10 - 50 | | $ | 4,876.3 |
| | $ | (288.2 | ) | | $ | 4,588.1 |
| 10 - 50 | | $ | 5,215.3 |
| | $ | (516.0 | ) | | $ | 4,699.3 |
|
| License agreements and distribution rights | 15 - 28 | | 225.9 |
| | (89.4 | ) | | 136.5 |
| 15 - 28 | | 236.3 |
| | (103.9 | ) | | 132.4 |
|
| Other | 2 - 40 | | 129.3 |
| | (26.4 | ) | | 102.9 |
| 2 - 40 | | 148.3 |
| | (42.4 | ) | | 105.9 |
|
| Intangible assets not subject to amortization: | | | | | | | | | | | | | | |
| Brands | Indefinite | | 8,114.2 |
| | — |
| | 8,114.2 |
| Indefinite | | 8,216.6 |
| | — |
| | 8,216.6 |
|
| Distribution networks | Indefinite | | 752.6 |
| | — |
| | 752.6 |
| Indefinite | | 804.7 |
| | — |
| | 804.7 |
|
| Other | Indefinite | | 337.6 |
| | — |
| | 337.6 |
| Indefinite | | 337.6 |
| | — |
| | 337.6 |
|
| Total | | | $ | 14,435.9 |
| | $ | (404.0 | ) | | $ | 14,031.9 |
| | | $ | 14,958.8 |
| | $ | (662.3 | ) | | $ | 14,296.5 |
|
The changes in the gross carrying amounts of intangibles from December 31, 2016,2017, to March 31, 2017,2018, are primarily driven by the impact of foreign exchange rates, as a significant amount of intangibles are denominated in foreign currencies.
Based on foreign exchange rates as of March 31, 2017, and the preliminary allocation of fair value to definite-lived intangible assets,2018, the estimated future amortization expense of intangible assets is as follows:
| | | Fiscal year | Amount | | Amount |
| | (In millions) | | (In millions) |
| 2017 - remaining | $ | 161.5 |
| |
| 2018 | $ | 214.4 |
| |
| 2018 - remaining | | | $ | 168.4 |
|
| 2019 | $ | 213.4 |
| | $ | 223.9 |
|
| 2020 | $ | 212.4 |
| | $ | 222.9 |
|
| 2021 | $ | 207.0 |
| | $ | 217.5 |
|
| 2022 | | | $ | 213.4 |
|
Amortization expense of intangible assets was $55.2$56.6 million and $9.6$55.2 million for the three months ended March 31, 2017,2018, and March 31, 2016,2017, respectively. The increase in amortization expense over the prior year is primarily attributable to the addition of MillerCoors definite-lived intangible asset amortization following the completion of the Acquisition, as well as the reclassification of the Molson core brand intangible assets from indefinite to definite-lived following the completion of our annual impairment test as of October 1, 2016. This expense is primarily presented within marketing, general and administrative expenses on the unaudited condensed consolidated statements of operations.
Annual Goodwill Impairment Testing
We completed our required annual goodwill and indefinite-lived intangible impairment testing as of October 1, 2016,2017, the first day of our fourth quarter, and concluded there were no impairments of goodwill within our Canada, Europereporting units or India reporting units; however, an impairment charge was recorded on the Molson core brand intangible asset in Canada as a result of
this review. Outside of the Molson core brands impairment, there were no other impairments of our indefinite-lived intangible assets as a result of the annual review process.
Annual Goodwill Impairment Testing
Our 2016 annual goodwill impairment testing determined that the fair value of our Canada reporting unit had declined, largely due to continued economic and competitive challenges negatively impacting our business, including sustained challenges facing the Molson core brands. Our Europe reporting unit continued to be considered at risk of failing step one of the goodwill impairment test. Specifically, the fair value of the Europe and Canada reporting units were estimated at approximately 14% and 29% in excess of carrying value, respectively, as of the October 1, 2016, testing date. The fair value of the India reporting unit approximated its carrying value, as there were no significant changes indicating a reduction in the fair value of the reporting unit since our completion of the interim impairment assessment during the second quarter of 2016 or annual impairment assessment as of October 1, 2016.
assets.
Key Assumptions
As of the date of our annual impairment test, performed as of October 1, the Europe reporting unit goodwill is at risk of future impairment in the event of significant unfavorable changes in the forecasted cash flows (including prolonged, or further weakening of, adverse economic conditions or significant unfavorable changes in tax, environmental or other regulations, including interpretations thereof), terminal growth rates, market multiples and/or weighted-average cost of capital utilized in the discounted cash flow analyses. For testing purposes, management's best estimates of the expected future results are the primary driver in determining the fair value. Current projections used for our Europe reporting unit testing reflect continued challenging environments in the future followed by growth resulting from a longer term recovery of the macroeconomic environment, as well as the benefit of anticipated cost savings and specific brand-building and innovation activities. Fair value determinations require considerable judgment and are sensitive to changes in underlying assumptions and factors. As a result, there can be no assurance that the estimates and assumptions made for purposes of the annual goodwill and indefinite-lived intangible impairment tests will prove to be an accurate prediction of the future. Examples of events or circumstances that could reasonably be expected to negatively affect the underlyingThe key assumptions and ultimately impactused to derive the estimated fair valuevalues of our reporting units and indefinite-lived intangibles may include such items as: (i) a decreaseare discussed in expected future cash flows, specifically, a decreasePart II—Item 8 Financial Statements, Note 11, "Goodwill and Intangible Assets" in sales volume and increase in costs that could significantly impact our immediate and long-range results, a decrease in sales volume driven by a prolonged weakness in consumer demand or other competitive pressures adversely affecting our long-term volume trends, a continuation of the trend away from core brands in certain of our markets, especially in markets where our core brands represent a significant portion of the market, unfavorable working capital changes and an inability to successfully achieve our cost savings targets, (ii) adverse changes in macroeconomic conditions or an economic recovery that significantly differs from our assumptions in timing and/or degree (such as a recession or worsening of the overall European economy), (iii) volatility in the equity and debt markets or other country specific factors which could result in a higher weighted-average cost of capital, (iv) sensitivity to market multiples; and (v) regulation limiting or banning the manufacturing, distribution or sale of alcoholic beverages.Annual Report.
Based on known facts and circumstances, we evaluate and consider recent events and uncertain items, as well as related potential implications, as part of our annual assessment and incorporate into the analyses as appropriate. These facts and circumstances are subject to change and may impact future analyses. For example, subsequent to the completion of our annual impairment testing, we considered the implications of the enactment of the 2017 Tax Act on our U.S. reporting unit and indefinite-lived brand valuations. The results of our preliminary analysis indicated that the implications are expected to be favorable, keeping all other assumptions constant.
While historical performance and current expectations have resulted in fair values of our reporting units and indefinite-lived intangible assets in excess of carrying values, if our assumptions are not realized, it is possible that an impairment charge may need to be recorded in the future.
Indefinite and Definite-Lived Intangibles
Regarding indefinite and definite-lived intangibles, we continuously monitor the performance of the underlying assets for potential triggering events suggesting an impairment review should be performed. No such triggering events were identified in the first quarter of 2017.2018 that resulted in an impairment.
11.9. Debt
Debt obligations
Our total borrowings as of March 31, 2017, and December 31, 2016, were comprised of the following:
| | | | As of | As of |
| | March 31, 2017 | | December 31, 2016 | March 31, 2018 | | December 31, 2017 |
| | (In millions) | (In millions) |
| Long-term debt: | | | | | | |
Senior notes(1)(2) | $ | 11,400.7 |
| | $ | 9,842.2 |
| |
Term loans(1)(3) | 800.0 |
| | 2,300.0 |
| |
| CAD 400 million 2.25% notes due 2018 | | $ | 310.1 |
| | $ | 318.2 |
|
| CAD 500 million 2.75% notes due 2020 | | 387.6 |
| | 397.7 |
|
| CAD 500 million 2.84% notes due 2023 | | 387.6 |
| | 397.7 |
|
| CAD 500 million 3.44% notes due 2026 | | 387.6 |
| | 397.7 |
|
| $500 million 1.45% notes due 2019 | | 500.0 |
| | 500.0 |
|
$500 million 1.90% notes due 2019(1) | | 498.8 |
| | 498.5 |
|
$500 million 2.25% notes due 2020(1) | | 498.4 |
| | 498.2 |
|
| $1.0 billion 2.10% notes due 2021 | | 1,000.0 |
| | 1,000.0 |
|
$500 million 3.5% notes due 2022(1) | | 511.5 |
| | 512.2 |
|
| $2.0 billion 3.0% notes due 2026 | | 2,000.0 |
| | 2,000.0 |
|
| $1.1 billion 5.0% notes due 2042 | | 1,100.0 |
| | 1,100.0 |
|
| $1.8 billion 4.2% notes due 2046 | | 1,800.0 |
| | 1,800.0 |
|
| EUR 500 million notes due 2019 | | 616.2 |
| | 600.3 |
|
| EUR 800 million 1.25% notes due 2024 | | 985.9 |
| | 960.4 |
|
| Other long-term debt | 2.2 |
| | 2.2 |
| 52.0 |
| | 22.1 |
|
| Less: unamortized debt discounts and debt issuance costs | (84.5 | ) | | (85.0 | ) | (73.2 | ) | | (75.9 | ) |
| Total long-term debt (including current portion) | | 10,962.5 |
| | 10,927.1 |
|
| Less: current portion of long-term debt | (675.3 | ) | | (671.7 | ) | (1,435.5 | ) | | (328.4 | ) |
| Total long-term debt | $ | 11,443.1 |
| | $ | 11,387.7 |
| $ | 9,527.0 |
| | $ | 10,598.7 |
|
| | | | | | | |
| Short-term borrowings: | | | | | | |
Commercial paper program(4) | $ | 130.0 |
| | $ | — |
| |
Cash pool overdrafts(5) | 26.5 |
| | 2.6 |
| |
Short-term facilities(6) | 8.6 |
| | 7.0 |
| |
| Other short-term borrowings | 2.6 |
| | 3.5 |
| |
Commercial paper program(2) | | $ | 128.0 |
| | $ | 379.0 |
|
Other short-term borrowings(3) | | 27.8 |
| | 7.4 |
|
| Current portion of long-term debt | 675.3 |
| | 671.7 |
| 1,435.5 |
| | 328.4 |
|
| Current portion of long-term debt and short-term borrowings | $ | 843.0 |
| | $ | 684.8 |
| $ | 1,591.3 |
| | $ | 714.8 |
|
| |
| (1) | AsThe fair value hedges related to these notes have been settled and are being amortized over the life of March 31, 2017, and December 31, 2016, our senior notes consist of CAD senior notes of $1,801.9 million and $1,785.6 million, respectively, with maturities ranging from 2017 to 2026; USD senior notes of $8,214.0 million and $7,215.2 million, respectively, with maturities ranging from 2017 to 2046; and EUR senior notes of $1,384.8 million with maturities ranging from 2019 to 2024 and $841.4 million maturing in 2024, respectively. As of March 31, 2017, and December 31, 2016, the aggregate weighted-average effective interest rates calculated including the effects of hedging were 2.95% and 3.33%, respectively.respective note. |
Our USD term loans have maturities in 2021 as of March 31, 2017, and maturities ranging from 2019 to 2021 as of December 31, 2016. As of March 31, 2017, and December 31, 2016, the aggregate weighted-average effective interest rates were 3.16% and 1.98%, respectively.
| |
| (2) | On March 15, 2017, MCBC issued approximately $1.5 billion of senior notes, consisting of $500 million 1.90% senior notes due March 15, 2019, and $500 million 2.25% senior notes due March 15, 2020 (collectively, the "2017 USD Notes") and EUR 500 million floating rate senior notes due March 15, 2019 ("2017 EUR Notes") (2017 USD Notes and 2017 EUR Notes, collectively, the "2017 Notes"). We bear quarterly interest on the 2017 EUR Notes at the rate of 0.35% + 3-month EURIBOR. These issuances resulted in total proceeds of approximately $1.5 billion, net of underwriting fees and discounts of $3.1 million and $0.7 million, respectively. Total estimated debt issuance costs capitalized in connection with these notes, including underwriting fees, discounts and other financing related costs, are $6.1 million and are being amortized over the respective terms of the 2017 Notes. The 2017 Notes began accruing interest upon issuance, with quarterly payments due on the 2017 EUR Notes beginning June 15, 2017 and semi-annual payments due on the 2017 USD Notes beginning September 15, 2017. |
In the first quarter of 2017, we entered into interest rate swaps to economically convert our fixed rate 2017 USD Notes to floating rate debt. As a result of these hedge programs, the carrying value of the $500 million 1.90% notes and $500 million 2.25% notes include adjustments of $0.2 million and $0.1 million, respectively, for fair value movements attributable to the benchmark interest rate as of March 31, 2017.
Prior to issuing the 2017 EUR Notes, we entered into foreign currency forward agreements to economically hedge the foreign currency exposure of a portion of the respective notes, which were subsequently settled on March 15, 2017, concurrent with the issuance of the 2017 EUR Notes. Additionally, upon issuance we designated the 2017 EUR Notes as a net investment hedge of our Europe business. See Note 14, "Derivative Instruments and Hedging Activities" for further details.
| |
(3) | During the first quarter of 2017, the net proceeds from the 2017 Notes were used to repay the remaining $800.0 million on our 3-year tranche term loan due 2019 and make principal payments of $700.0 million on our 5-year tranche term loan due 2021, and accordingly we accelerated the related amortization. For the three months ended March 31, 2017, and 2016, $4.0 million and $1.8 million, respectively, was recorded to interest expense related to amortization of issuance and other financing costs associated with the term loan, including the accelerated amortization during the first quarter of 2017 noted above of $3.7 million. |
| |
(4) | As of March 31, 2017,2018, the outstanding borrowings under our commercial paper program were $130.0 million athad a weighted-average effective interest rate and tenor of 1.26%2.45% and 21 days. There were no outstanding borrowings under our commercial paper program11 days, respectively, compared to a weighted-average effective interest rate and tenor of 1.84% and 45 days, respectively, as of December 31, 2016.2017. |
| |
(5)(3) | As of March 31, 2017,2018, we had $26.5$4.8 million in bank overdrafts and $38.2$29.3 million in bank cash related to our cross-border, cross-currency cash pool, for a net positive position of $11.7$24.5 million. As of December 31, 2016,2017, we had $2.6$1.2 million in bank overdrafts and $18.0$37.8 million in bank cash related to our cross-border, cross-currency cash pool for a net positive position of $15.4$36.6 million. |
| |
(6) | We had total outstanding borrowings of $8.6$5.2 million and $7.0$3.2 million under our two Japanese Yen ("JPY")JPY overdraft facilities as of March 31, 2017,2018, and December 31, 2016,2017, respectively. In addition, we have GBP and CAD lines of credit. As of March 31, 2018, we had $14.7 million of bank overdrafts related to our GBP line of credit and no borrowings under whichour CAD line of credit. As of December 31, 2017 we had no borrowings asunder either line of March 31, 2017, or December 31, 2016.credit. The remaining balance primarily relates to short-term borrowings. |
Debt Fair Value Measurements
We utilize market approaches to estimate the fair value of certain outstanding borrowings by discounting anticipated future cash flows derived from the contractual terms of the obligations and observable market interest and foreign exchange rates. As of March 31, 2017,2018, and December 31, 2016,2017, the fair value of our outstanding long-term debt (including the current
portion of long-term debt) was approximately $12.1$10.8 billion and $12.0$11.2 billion, respectively. All senior notes are valued based on significant observable inputs and classified as Level 2 in the fair value hierarchy. The carrying values of all other outstanding long-term borrowings and our short-term borrowings approximate their fair values and are also classified as Level 2 in the fair value hierarchy.
OtherRevolving Credit Facility
As of March 31, 2017,2018, we had $620.0 millionapproximately $1.4 billion available to draw under our $750 million$1.5 billion revolving multi-currency credit facility, as the borrowing capacity is reduced by borrowings under our commercial paper program, and we haveprogram. We had no other borrowings drawn on this revolving credit facility. As of December 31, 2016, we had $750 million available to draw under this facility as there were no outstanding borrowings on the revolving credit facility nor was there any outstanding commercial paper. As part of our anticipated financing for the Acquisition, we amended our $750 million revolving multi-currency credit facility during the fourth quarter of 2015, which became effective following the completion of the Acquisition on October 11, 2016, to increase theMarch 31, 2018. The maximum leverage ratio to 5.75xof this facility is 5.25x debt to earnings before EBITDA, with a decline to 3.75x4.00x debt to EBITDA in the fourth year following the closingas of the Acquisition. Subsequent tolast day of the fiscal quarter end, we repaid our $300 million 2.0% notes on May 1, 2017 and also repaid $50.0 million on our 5-year tranche term loan due 2021 utilizing borrowings under our commercial paper program, thereby further reducing our available borrowings under our $750 million revolving multi-credit facility.ending December 31, 2020.
Under the terms of each of our debt facilities, we must comply with certain restrictions. These include restrictions oncustomary events of default and specified representations and warranties and covenants, including, among other things, covenants that restrict our ability to incur certain additional priority indebtedness, (certain threshold percentages of secured consolidated net tangible assets), leverage thresholds,create or permit liens and restrictions on certain types of sale lease-back transactions and transfers of assets.assets, or engage in mergers or consolidations. As of March 31, 2017,2018, we were in compliance with all of these restrictions and have met all debt payment obligations. All of our outstanding senior notes as of March 31, 2017,2018, rank pari-passu.
12.10. Inventories
Inventories, net of reserves, consist of the following:
| | | | As of | As of |
| | March 31, 2017 | | December 31, 2016 | March 31, 2018 | | December 31, 2017 |
| | (In millions) | (In millions) |
| Finished goods | $ | 263.0 |
| | $ | 213.8 |
| $ | 274.0 |
| | $ | 222.3 |
|
| Work in process | 91.2 |
| | 81.6 |
| 95.4 |
| | 85.2 |
|
| Raw materials | 250.5 |
| | 238.5 |
| 226.4 |
| | 231.7 |
|
| Packaging materials | 58.8 |
| | 58.8 |
| 69.8 |
| | 52.3 |
|
| Inventories, net | $ | 663.5 |
| | $ | 592.7 |
| $ | 665.6 |
| | $ | 591.5 |
|
13.11. Accumulated Other Comprehensive Income (Loss) ("AOCI")
| | | | MCBC shareholders | MCBC shareholders |
| | Foreign currency translation adjustments | | Gain (loss) on derivative instruments | | Pension and postretirement benefit adjustments | | Equity method investments | | Accumulated other comprehensive income (loss) | Foreign currency translation adjustments | | Gain (loss) on derivative instruments | | Pension and postretirement benefit adjustments | | Equity method investments | | Accumulated other comprehensive income (loss) |
| | (In millions) | (In millions) |
| As of December 31, 2016 | $ | (994.1 | ) | | $ | 21.2 |
| | $ | (502.7 | ) | | $ | (69.9 | ) | | $ | (1,545.5 | ) | |
| As of December 31, 2017 | | $ | (314.6 | ) | | $ | (110.9 | ) | | $ | (375.0 | ) | | $ | (59.5 | ) | | $ | (860.0 | ) |
| Foreign currency translation adjustments | 75.2 |
| | — |
| | — |
| | — |
| | 75.2 |
| 83.1 |
| | — |
| | (1.1 | ) | | — |
| | 82.0 |
|
| Unrealized gain (loss) on derivative and non-derivative financial instruments | — |
| | (12.2 | ) | | — |
| | — |
| | (12.2 | ) | — |
| | (34.0 | ) | | — |
| | — |
| | (34.0 | ) |
| Reclassification of derivative (gain) loss to income | — |
| | — |
| | — |
| | — |
| | — |
| — |
| | 1.4 |
| | — |
| | — |
| | 1.4 |
|
| Amortization of net prior service (benefit) cost and net actuarial (gain) loss to income | — |
| | — |
| | 2.3 |
| | — |
| | 2.3 |
| — |
| | — |
| | 1.9 |
| | — |
| | 1.9 |
|
| Ownership share of unconsolidated subsidiaries' other comprehensive income (loss) | — |
| | — |
| | — |
| | 1.5 |
| | 1.5 |
| — |
| | — |
| | — |
| | (1.6 | ) | | (1.6 | ) |
| Tax benefit (expense) | 6.0 |
| | 3.6 |
| | (0.7 | ) | | (0.4 | ) | | 8.5 |
| (8.7 | ) | | 7.9 |
| | (0.2 | ) | | 0.4 |
| | (0.6 | ) |
| As of March 31, 2017 | $ | (912.9 | ) | | $ | 12.6 |
| | $ | (501.1 | ) | | $ | (68.8 | ) | | $ | (1,470.2 | ) | |
| As of March 31, 2018 | | $ | (240.2 | ) | | $ | (135.6 | ) | | $ | (374.4 | ) | | $ | (60.7 | ) | | $ | (810.9 | ) |
Reclassifications from AOCI to income:
| | | | | Three Months Ended | | Three Months Ended | |
| | | March 31, 2017 | | March 31, 2016 | | March 31, 2018 | | March 31, 2017 | |
| | | Reclassifications from AOCI | | Location of gain (loss) recognized in income | Reclassifications from AOCI | | Location of gain (loss) recognized in income |
| | | (In millions) | | (In millions) | |
| Gain/(loss) on cash flow hedges: | | | | | | | | | |
| Forward starting interest rate swaps | | $ | (1.0 | ) | | $ | (0.9 | ) | | Interest expense, net | $ | (0.8 | ) | | $ | (1.0 | ) | | Interest expense, net |
| Foreign currency forwards | | (0.9 | ) | | (1.9 | ) | | Other income (expense), net | — |
| | (0.9 | ) | | Other income (expense), net |
| Foreign currency forwards | | 1.9 |
| | 5.4 |
| | Cost of goods sold | (0.6 | ) | | 1.9 |
| | Cost of goods sold |
| Total income (loss) reclassified, before tax | | — |
| | 2.6 |
| | (1.4 | ) | | — |
| |
| Income tax benefit (expense) | | — |
| | (0.2 | ) | | 0.3 |
| | — |
| |
| Net income (loss) reclassified, net of tax | | $ | — |
| | $ | 2.4 |
| | $ | (1.1 | ) | | $ | — |
| |
| | | | | | | | | | |
| Amortization of defined benefit pension and other postretirement benefit plan items: | | | | | | | | | |
| Prior service benefit (cost) | | $ | (0.2 | ) | | $ | (0.2 | ) | | (1) | $ | (0.2 | ) | | $ | (0.2 | ) | | Other pension and postretirement benefits (costs), net |
| Net actuarial gain (loss) | | (2.1 | ) | | (7.7 | ) | | (1) | |
| Curtailment and net actuarial gain (loss) | | (1.7 | ) | | 1.8 |
| | Other pension and postretirement benefits (costs), net |
| Total income (loss) reclassified, before tax | | (2.3 | ) | | (7.9 | ) | | (1.9 | ) | | 1.6 |
| |
| Income tax benefit (expense) | | 0.7 |
| | 0.9 |
| | 0.2 |
| | (0.6 | ) | |
| Net income (loss) reclassified, net of tax | | $ | (1.6 | ) | | $ | (7.0 | ) | | $ | (1.7 | ) | | $ | 1.0 |
| |
| | | | | | | | | | |
| Total income (loss) reclassified, net of tax | | $ | (1.6 | ) | | $ | (4.6 | ) | | $ | (2.8 | ) | | $ | 1.0 |
| |
| |
(1) | These components of AOCI are included in the computation of net periodic pension and other postretirement benefit cost. See Note 15, "Pension and Other Postretirement Benefits" for additional details. |
14.12. Derivative Instruments and Hedging Activities
Our risk management and derivative accounting policies are presented in Notes 1 and 1617 of the Notes included in our Annual Report and did not significantly change during the first quarter of 2017.2018. As noted in Note 1617 of the Notes included in our Annual Report, due to the nature of our counterparty agreements, and the fact that we are not subject to master netting arrangements, we are not able to net positions with the same counterparty and, therefore, present our derivative positions on a gross basis in our unaudited condensed consolidated balance sheets. Except as noted below, our significant derivative positions have not changed considerably since year-end.
Interest Rate SwapsCross Currency Swap
In the first quarter of 2017,Effective April 18, 2018, we entered into interest rate swaps with an aggregatea cross currency swap agreement having a total notional amount of $1.0 billion to economically convert our fixed rate $1.0 billion 2017 USD Notes to floating rate debt. We will receive fixed interest payments semi-annually at a rate of 1.90% and 2.25% per annum on our $500approximately EUR 404 million senior notes due March 15, 2019, and $500($500.0 million senior notes due March 15, 2020, respectively, and pay a rate to our counterparties based on a credit spread plus the one month LIBOR rate, thereby effectively exchanging a fixed interest obligation for a floating interest obligation.
We entered into these interest rate swap agreements to minimize exposure to changes in the fair value of each of our $500 million notes that results from fluctuations in the benchmark interest rate, specifically LIBOR, and have designated these swaps as fair value hedges and determined that there is zero ineffectiveness. The changes in fair value of derivatives designated as fair value hedges and the offsetting changes in fair value of the hedged item are recognized in earnings. For the three months ended March 31, 2017, the total changes in fair value of the two $500 million interest rate swaps resulted in total unrealized losses of $0.3 million, which were recorded in interest expense in our unaudited condensed consolidated statement of operations and were fully offset by changes in fair value of the two $500 million notes attributable to the benchmark interest rate, also recorded to interest expense. See Note 11, "Debt" for additional details.
Net Investment Hedges
On March 15, 2017, we issued an aggregate of EUR 500 million (approximately $530 million at issuance), three-month EURIBOR floating rate senior notes due March 15, 2019. We simultaneously designated the principal of the 2017 EUR Notes as a net investment hedge of our investment in our Europe businessupon execution) in order to hedge a portion of the foreign currency translational impacts of our European investment. As a result of the swap, we economically converted our $500 million 2.25% senior notes due 2020 and associated interest to EUR denominated, which will result in a EUR interest rate to be received at 0.85%. We have designated this cross currency swap as a net investment hedge and accordingly, will record changes in the carryingfair value of the 2017 EUR Notes due to fluctuations in the spot rate to AOCI. See Note 11, "Debt" for further discussion.
Foreign Currency Forwards
Prior to issuing the 2017 EUR Notes on March 15, 2017, we entered into foreign currency forward agreements in the first quarter of 2017 with a total notional amount of EUR 499.0 million, representing a majority of the anticipated net proceeds from the issuance of the respective 2017 EUR Notes, to economically hedge the foreign currency exposure of the associated notes against the USD prior to issuance and to convert the proceeds to USD upon issuance through gross settlement. We settled these foreign currency forwards on March 15, 2017, resulting in a loss of $8.3 million. See Note 11, "Debt" for further details related to the issuance. These foreign currency forwards were not designated in hedge accounting relationships, and, accordingly, the mark-to-market fair value adjustments and resulting losses were recorded to other income (expense).
Derivative Fair Value Measurements
We utilize market approaches to estimate the fair value of our derivative instruments by discounting anticipated future cash flows derived from the derivative's contractual terms and observable market interest, foreign exchange and commodity rates. The fair values of our derivatives also include credit risk adjustments to account for our counterparties' credit risk, as well as our own non-performance risk, as appropriate. The table below summarizes our derivative assets and liabilities that were measured at fair value as of March 31, 20172018, and December 31, 20162017.
| | | | | | Fair value measurements as of March 31, 2017 | | | Fair value measurements as of March 31, 2018 |
| | Total at March 31, 2017 | | Quoted prices in active markets (Level 1) | | Significant other observable inputs (Level 2) | | Significant unobservable inputs (Level 3) | As of March 31, 2018 | | Quoted prices in active markets (Level 1) | | Significant other observable inputs (Level 2) | | Significant unobservable inputs (Level 3) |
| | (In millions) | (In millions) |
| Interest rate swaps | $ | (0.3 | ) | | $ | — |
| | $ | (0.3 | ) | | $ | — |
| |
| Foreign currency forwards | 7.8 |
| | — |
| | 7.8 |
| | — |
| $ | (2.5 | ) | | $ | — |
| | $ | (2.5 | ) | | $ | — |
|
| Commodity swaps | 49.6 |
| | — |
| | 49.6 |
| | — |
| |
| Commodity swaps and options | | 37.1 |
| | — |
| | 37.1 |
| | — |
|
| Total | $ | 57.1 |
| | $ | — |
| | $ | 57.1 |
| | $ | — |
| $ | 34.6 |
| | $ | — |
| | $ | 34.6 |
| | $ | — |
|
| | | | | | Fair value measurements as of December 31, 2016 | | | Fair value measurements as of December 31, 2017 |
| | Total at December 31, 2016 | | Quoted prices in active markets (Level 1) | | Significant other observable inputs (Level 2) | | Significant unobservable inputs (Level 3) | As of December 31, 2017 | | Quoted prices in active markets (Level 1) | | Significant other observable inputs (Level 2) | | Significant unobservable inputs (Level 3) |
| | (In millions) | (In millions) |
| Foreign currency forwards | $ | 14.4 |
| | $ | — |
| | $ | 14.4 |
| | $ | — |
| $ | (10.9 | ) | | $ | — |
| | $ | (10.9 | ) | | $ | — |
|
| Commodity swaps | (18.1 | ) | | — |
| | (18.1 | ) | | — |
| |
| Commodity swaps and options | | 122.8 |
| | — |
| | 122.8 |
| | — |
|
| Total | $ | (3.7 | ) | | $ | — |
| | $ | (3.7 | ) | | $ | — |
| $ | 111.9 |
| | $ | — |
| | $ | 111.9 |
| | $ | — |
|
As of March 31, 20172018, we had no significant transfers between Level 1 and Level 2. New derivative contracts transacted during the three months ended March 31, 20172018, were all included in Level 2.
Results of Period Derivative Activity
The tables below include the year-to-date results of our derivative activity in the unaudited condensed consolidated balance sheets as of March 31, 20172018, and December 31, 20162017, and the unaudited condensed consolidated statements of operations for the three months ended March 31, 20172018, and March 31, 20162017.
Fair Value of Derivative Instruments in the Unaudited Condensed Consolidated Balance SheetSheets (in millions):
| | | | March 31, 2017 | As of March 31, 2018 |
| | | | Asset derivatives | | Liability derivatives | | | Asset derivatives | | Liability derivatives |
| | Notional amount | | Balance sheet location | | Fair value | | Balance sheet location | | Fair value | Notional amount | | Balance sheet location | | Fair value | | Balance sheet location | | Fair value |
| Derivatives designated as hedging instruments: | Derivatives designated as hedging instruments: | | | | | | | Derivatives designated as hedging instruments: | | | | | | |
| Interest rate swaps | $ | 1,000.0 |
| | Other current assets | | $ | — |
| | Accounts payable and other current liabilities | | $ | — |
| |
| | | | Other non-current assets | | — |
| | Other liabilities | | (0.3 | ) | |
| Foreign currency forwards | $ | 332.0 |
| | Other current assets | | 8.3 |
| | Accounts payable and other current liabilities | | (0.8 | ) | $ | 377.3 |
| | Other current assets | | $ | 1.2 |
| | Accounts payable and other current liabilities | | $ | (2.9 | ) |
| | | | Other non-current assets | | 1.4 |
| | Other liabilities | | (1.1 | ) | | | Other non-current assets | | 1.4 |
| | Other liabilities | | (2.2 | ) |
| Total derivatives designated as hedging instruments | Total derivatives designated as hedging instruments | | $ | 9.7 |
| | | | $ | (2.2 | ) | Total derivatives designated as hedging instruments | | $ | 2.6 |
| | | | $ | (5.1 | ) |
| Derivatives not designated as hedging instruments: | Derivatives not designated as hedging instruments: | | | | | | | Derivatives not designated as hedging instruments: | | | | | | |
Commodity swaps(1) | $ | 729.1 |
| | Other current assets | | $ | 26.9 |
| | Accounts payable and other current liabilities | | $ | (8.7 | ) | $ | 858.3 |
| | Other current assets | | $ | 35.6 |
| | Accounts payable and other current liabilities | | $ | (15.2 | ) |
| | | Other non-current assets | | 38.1 |
| | Other liabilities | | (6.7 | ) | | | Other non-current assets | | 26.6 |
| | Other liabilities | | (9.9 | ) |
Commodity Options(1) | $ | 13.6 |
| | Other current assets | | 0.1 |
| | Accounts payable and other current liabilities | | (0.1 | ) | |
Commodity options(1) | | $ | 30.6 |
| | Other current assets | | 0.2 |
| | Accounts payable and other current liabilities | | (0.2 | ) |
| | | | Other non-current assets | | 0.1 |
| | Other liabilities | | (0.1 | ) | | | Other non-current assets | | — |
| | Other liabilities | | — |
|
| Total derivatives not designated as hedging instruments | Total derivatives not designated as hedging instruments | | $ | 65.2 |
| | | | $ | (15.6 | ) | Total derivatives not designated as hedging instruments | | $ | 62.4 |
| | | | $ | (25.3 | ) |
| | | | December 31, 2016 | As of December 31, 2017 |
| | | | Asset derivatives | | Liability derivatives | | | Asset derivatives | | Liability derivatives |
| | Notional amount | | Balance sheet location | | Fair value | | Balance sheet location | | Fair value | Notional amount | | Balance sheet location | | Fair value | | Balance sheet location | | Fair value |
| Derivatives designated as hedging instruments: | Derivatives designated as hedging instruments: | | | | | | | | | Derivatives designated as hedging instruments: | | | | | | | | |
| Foreign currency forwards | $ | 329.4 |
| | Other current assets | | $ | 12.0 |
| | Accounts payable and other current liabilities | | $ | (0.3 | ) | $ | 326.4 |
| | Other current assets | | $ | 0.4 |
| | Accounts payable and other current liabilities | | $ | (6.1 | ) |
| | | | Other non-current assets | | 3.3 |
| | Other liabilities | | (0.6 | ) | | | Other non-current assets | | 0.2 |
| | Other liabilities | | (5.4 | ) |
| Total derivatives designated as hedging instruments | Total derivatives designated as hedging instruments | | $ | 15.3 |
| | $ | (0.9 | ) | Total derivatives designated as hedging instruments | | $ | 0.6 |
| | $ | (11.5 | ) |
| Derivatives not designated as hedging instruments: | Derivatives not designated as hedging instruments: | | | | | Derivatives not designated as hedging instruments: | | | | |
Commodity swaps(1) | $ | 791.4 |
| | Other current assets | | $ | 11.8 |
| | Accounts payable and other current liabilities | | $ | (23.3 | ) | $ | 765.0 |
| | Other current assets | | $ | 70.8 |
| | Accounts payable and other current liabilities | | $ | (7.3 | ) |
| | | | Other non-current assets | | 12.6 |
| | Other liabilities | | (19.2 | ) | | | Other non-current assets | | 63.5 |
| | Other liabilities | | (4.2 | ) |
Commodity options(1) | $ | 13.6 |
| | Other current and non-current assets | | — |
| | Accounts payable and other current liabilities and other liabilities | | — |
| $ | 30.6 |
| | Other current and non-current assets | | 0.2 |
| | Accounts payable and other current liabilities and other liabilities | | (0.2 | ) |
| Total derivatives not designated as hedging instruments | Total derivatives not designated as hedging instruments | | $ | 24.4 |
| | $ | (42.5 | ) | Total derivatives not designated as hedging instruments | | $ | 134.5 |
| | $ | (11.7 | ) |
| |
| (1) | Notional includes offsetting buy and sell positions, shown in terms of absolute value. Buy and sell positions are shown gross in the asset and/or liability position, as appropriate. |
The Pretax Effect of Derivative Instruments on the Unaudited Condensed Consolidated StatementStatements of Operations (in millions):
| | | For the Three Months Ended March 31, 2017 | |
| Three Months Ended March 31, 2018 | | Three Months Ended March 31, 2018 |
| Derivatives in cash flow hedge relationships |
| Amount of gain
(loss) recognized
in OCI on
derivative
(effective
portion) |
| Location of gain (loss)
reclassified from AOCI into
income (effective portion) |
| Amount of gain
(loss) recognized
from AOCI on
derivative
(effective portion) |
| Location of gain (loss)
recognized in income on
derivative (ineffective portion
and amount excluded from
effectiveness testing) |
| Amount of gain (loss)
recognized in income
on derivative
(ineffective portion and
amount excluded from
effectiveness testing) |
| Amount of gain
(loss) recognized
in OCI on
derivative
(effective
portion) |
| Location of gain (loss)
reclassified from AOCI into
income (effective portion) |
| Amount of gain
(loss) recognized
from AOCI on
derivative
(effective portion) |
| Location of gain (loss)
recognized in income on
derivative (ineffective portion
and amount excluded from
effectiveness testing) |
| Amount of gain (loss)
recognized in income
on derivative
(ineffective portion and
amount excluded from
effectiveness testing) |
| Forward starting interest rate swaps |
| $ | — |
|
| Interest expense, net |
| $ | (1.0 | ) |
| Interest expense, net |
| $ | — |
|
| $ | — |
|
| Interest expense, net |
| $ | (0.8 | ) |
| Interest expense, net |
| $ | — |
|
| Foreign currency forwards |
| (5.5 | ) |
| Other income (expense), net |
| (0.9 | ) |
| Other income (expense), net |
| — |
|
| 7.5 |
|
| Cost of goods sold |
| (0.6 | ) |
| Cost of goods sold |
| — |
|
| |
|
| Cost of goods sold |
| 1.9 |
|
| Cost of goods sold |
| — |
| |
| Total |
| $ | (5.5 | ) |
| |
| $ | — |
|
| |
| $ | — |
|
| $ | 7.5 |
|
| |
| $ | (1.4 | ) |
| |
| $ | — |
|
| | | For the Three Months Ended March 31, 2017 | |
| Three Months Ended March 31, 2018 | | Three Months Ended March 31, 2018 |
| Non-derivative financial instruments in net investment hedge relationships |
| Amount of gain
(loss) recognized
in OCI on
derivative
(effective
portion) |
| Location of gain (loss)
reclassified from AOCI into
income (effective portion) |
| Amount of gain
(loss) recognized
from AOCI on
derivative
(effective portion) |
| Location of gain (loss)
recognized in income on
derivative (ineffective portion
and amount excluded from
effectiveness testing) |
| Amount of gain (loss)
recognized in income
on derivative
(ineffective portion and
amount excluded from
effectiveness testing) |
| Amount of gain
(loss) recognized
in OCI on
derivative
(effective
portion) |
| Location of gain (loss)
reclassified from AOCI into
income (effective portion) |
| Amount of gain
(loss) recognized
from AOCI on
derivative
(effective portion) |
| Location of gain (loss)
recognized in income on
derivative (ineffective portion
and amount excluded from
effectiveness testing) |
| Amount of gain (loss)
recognized in income
on derivative
(ineffective portion and
amount excluded from
effectiveness testing) |
| EUR 800 million notes due 2024 |
| $ | (10.8 | ) |
| Other income (expense), net |
| $ | — |
|
| Other income (expense), net |
| $ | — |
|
| $ | (25.5 | ) |
| Other income (expense), net |
| $ | — |
|
| Other income (expense), net |
| $ | — |
|
| EUR 500 million notes due 2019 | | 4.1 |
| | Other income (expense), net | | — |
| | Other income (expense), net | | — |
| | (16.0 | ) | | Other income (expense), net | | — |
| | Other income (expense), net | | — |
|
| Total |
| $ | (6.7 | ) |
| |
| $ | — |
|
| |
| $ | — |
|
| $ | (41.5 | ) |
| |
| $ | — |
|
| |
| $ | — |
|
|
| | | | | | |
| For the Three Months Ended March 31, 2017 |
| Derivatives in fair value hedge relationships | | Amount of gain (loss) recognized in income on derivative | | Location of gain (loss)recognized in income |
| Interest rate swaps | | $ | (0.3 | ) | | Interest expense, net |
| Total | | $ | (0.3 | ) | | |
| | | For the Three Months Ended March 31, 2016 | |
| Three Months Ended March 31, 2017 | | Three Months Ended March 31, 2017 |
| Derivatives in cash flow hedge relationships | | Amount of gain (loss) recognized in OCI on derivative (effective portion) | | Location of gain (loss) reclassified from AOCI into income (effective portion) | | Amount of gain (loss) recognized from AOCI on derivative (effective portion) | | Location of gain (loss) recognized in income on derivative (ineffective portion and amount excluded from effectiveness testing) | | Amount of gain (loss) recognized in income on derivative (ineffective portion and amount excluded from effectiveness testing) | | Amount of gain (loss) recognized in OCI on derivative (effective portion) | | Location of gain (loss) reclassified from AOCI into income (effective portion) | | Amount of gain (loss) recognized from AOCI on derivative (effective portion) | | Location of gain (loss) recognized in income on derivative (ineffective portion and amount excluded from effectiveness testing) | | Amount of gain (loss) recognized in income on derivative (ineffective portion and amount excluded from effectiveness testing) |
| Forward starting interest rate swaps | | $ | — |
| | Interest expense, net | | $ | (0.9 | ) | | Interest expense, net | | $ | — |
| | $ | — |
| | Interest expense, net | | $ | (1.0 | ) | | Interest expense, net | | $ | — |
|
| Foreign currency forwards | | (21.6 | ) | | Other income (expense), net | | (1.9 | ) | | Other income (expense), net | | — |
| | (5.5 | ) | | Other income (expense), net | | (0.9 | ) | | Other income (expense), net | | — |
|
| | | |
| | Cost of goods sold | | 5.4 |
| | Cost of goods sold | | — |
| | |
| | Cost of goods sold | | 1.9 |
| | Cost of goods sold | | — |
|
| Total | | $ | (21.6 | ) | | | | $ | 2.6 |
| | | | $ | — |
| | $ | (5.5 | ) | | | | $ | — |
| | | | $ | — |
|
We expect net gains of approximately $4 million (pretax) recorded in AOCI at March 31, 2017, will be reclassified into earnings within the next 12 months. For derivatives designated in cash flow hedge relationships, the maximum length of time over which forecasted transactions are hedged at March 31, 2017, is approximately three years.
|
| | | | | | | | | | | | | | | | |
| Three Months Ended March 31, 2017 |
| Non-derivative financial instruments in net investment hedge relationships |
| Amount of gain
(loss) recognized
in OCI on
derivative
(effective
portion) |
| Location of gain (loss)
reclassified from AOCI into
income (effective portion) |
| Amount of gain
(loss) recognized
from AOCI on
derivative
(effective portion) |
| Location of gain (loss)
recognized in income on
derivative (ineffective portion
and amount excluded from
effectiveness testing) |
| Amount of gain (loss)
recognized in income
on derivative
(ineffective portion and
amount excluded from
effectiveness testing) |
| EUR 800 million notes due 2024 |
| $ | (10.8 | ) |
| Other income (expense), net |
| $ | — |
|
| Other income (expense), net |
| $ | — |
|
| EUR 500 million notes due 2019 | | 4.1 |
| | Other income (expense), net | | — |
| | Other income (expense), net | | — |
|
| Total |
| $ | (6.7 | ) |
| |
| $ | — |
|
| |
| $ | — |
|
|
| | | | | | |
| Three Months Ended March 31, 2017 |
| Derivatives in fair value hedge relationships | | Amount of gain (loss) recognized in income on derivative | | Location of gain (loss) recognized in income |
| Interest rate swaps | | $ | (0.3 | ) | | Interest expense, net |
| Total | | $ | (0.3 | ) | | |
We expect net losses of approximately $5 million (pretax) recorded in AOCI as of March 31, 2018, related to cash flow hedges, will be reclassified into earnings within the next 12 months. For derivatives designated in cash flow hedge relationships, the maximum length of time over which forecasted transactions are hedged as of March 31, 2018, is approximately three years.
Other Derivatives (in millions):
|
| | | | | | |
| For the Three Months Ended March 31, 2017 |
| Derivatives not in hedging relationships | | Location of gain (loss) recognized in income on derivative | | Amount of gain (loss) recognized in income on derivative |
| Commodity swaps | | Cost of goods sold | | $ | 65.7 |
|
| Foreign currency forwards | | Other income (expense), net | | (8.3 | ) |
| Total | | | | $ | 57.4 |
|
In the first quarter of 2017, the total gain recognized in income related to commodity swaps was driven by higher commodity prices.
|
| | | | | | |
| Three Months Ended March 31, 2018 |
| Derivatives not in hedging relationships | | Location of gain (loss) recognized in income on derivative | | Amount of gain (loss) recognized in income on derivative |
| Commodity swaps | | Cost of goods sold | | $ | (74.4 | ) |
| Total | | | | $ | (74.4 | ) |
| | | For the Three Months Ended March 31, 2016 | |
| Three Months Ended March 31, 2017 | | Three Months Ended March 31, 2017 |
| Derivatives not in hedging relationships | | Location of gain (loss) recognized in income on derivative | | Amount of gain (loss) recognized in income on derivative | | Location of gain (loss) recognized in income on derivative | | Amount of gain (loss) recognized in income on derivative |
| Commodity swaps | | Cost of goods sold | | $ | (1.6 | ) | | Cost of goods sold | | $ | 65.7 |
|
| Foreign currency forwards | | Other income (expense), net | | (0.1 | ) | | Other income (expense), net | | (8.3 | ) |
| Swaptions | | Interest expense, net | | (21.1 | ) | |
| Total | | $ | (22.8 | ) | | $ | 57.4 |
|
Lower commodity prices, primarily aluminum, relative to year-end market prices drove the total loss recognized in income related to commodity swaps for the three months ended March 31, 2018, compared to the total gain driven by higher commodity prices in the first quarter of 2017.
15.13. Pension and Other Postretirement Benefits("OPEB")
| | | | For the Three Months Ended | Three Months Ended |
| | March 31, 2017 | | March 31, 2016 | March 31, 2018 | | March 31, 2017 |
| | Pension | | OPEB | | Consolidated | | Pension | | OPEB | | Consolidated | Pension | | OPEB | | Consolidated | | Pension | | OPEB | | Consolidated |
| | (In millions) | (In millions) |
| Net periodic pension and OPEB cost (benefit): | | | | | | | | | | | | |
| Service cost: | | Service cost: | | | | | | | | | | |
| Service cost | $ | 1.8 |
| | $ | 2.6 |
| | $ | 4.4 |
| | $ | 1.8 |
| | $ | 0.6 |
| | $ | 2.4 |
| $ | 1.4 |
| | $ | 2.3 |
| | $ | 3.7 |
| | $ | 1.8 |
| | $ | 2.6 |
| | $ | 4.4 |
|
| Other pension and postretirement costs (benefits), net: | | Other pension and postretirement costs (benefits), net: | | | | | | | | | | |
| Interest cost | 51.5 |
| | 7.6 |
| | 59.1 |
| | 31.9 |
| | 1.3 |
| | 33.2 |
| $ | 41.2 |
| | $ | 6.6 |
| | $ | 47.8 |
| | $ | 51.5 |
| | $ | 7.6 |
| | $ | 59.1 |
|
| Expected return on plan assets | (66.1 | ) | | 0.1 |
| | (66.0 | ) | | (39.5 | ) | | — |
| | (39.5 | ) | (59.7 | ) | | — |
| | (59.7 | ) | | (70.7 | ) | | 0.1 |
| | (70.6 | ) |
| Amortization of prior service cost (benefit) | 0.2 |
| | — |
| | 0.2 |
| | 0.2 |
| | — |
| | 0.2 |
| 0.2 |
| | — |
| | 0.2 |
| | 0.2 |
| | — |
| | 0.2 |
|
| Amortization of net actuarial loss | 5.0 |
| | — |
| | 5.0 |
| | 7.7 |
| | — |
| | 7.7 |
| |
| Curtailment (gain) | — |
| | (2.9 | ) | | (2.9 | ) | | — |
| | — |
| | — |
| |
| Amortization of net actuarial loss (gain) | | 1.9 |
| | (0.3 | ) | | 1.6 |
| | 1.1 |
| | — |
| | 1.1 |
|
| Curtailment and settlement loss (gain) | | 0.1 |
| | — |
| | 0.1 |
| | — |
| | (2.9 | ) | | (2.9 | ) |
| Less: expected participant contributions | (0.2 | ) | | — |
| | (0.2 | ) | | (0.1 | ) | | — |
| | (0.1 | ) | — |
| | — |
| | — |
| | (0.2 | ) | | — |
| | (0.2 | ) |
| Total other pension and postretirement cost (benefits), net | | $ | (16.3 | ) | | $ | 6.3 |
| | $ | (10.0 | ) | | $ | (18.1 | ) | | $ | 4.8 |
| | $ | (13.3 | ) |
| | | | | | | | | | | | | |
| Net periodic pension and OPEB cost (benefit) | $ | (7.8 | ) | | $ | 7.4 |
| | $ | (0.4 | ) | | $ | 2.0 |
| | $ | 1.9 |
| | $ | 3.9 |
| $ | (14.9 | ) | | $ | 8.6 |
| | $ | (6.3 | ) | | $ | (16.3 | ) | | $ | 7.4 |
| | $ | (8.9 | ) |
During the three months ended March 31, 2017,2018, employer contributions to the defined benefit pension plans were approximately $36$3 million. Total 20172018 employer contributions to the defined benefit plans are expected to be approximately $100 million to $120$10 million, based on foreign exchange rates as of March 31, 2017.
MillerCoors' pension and OPEB expenses are not included in the three months ended March 31, 2016, as prior to the completion of the Acquisition on October 11, 2016, MillerCoors' pension and OPEB expenses were reported as equity income in MillerCoors in the unaudited condensed consolidated statements of operations.2018. BRI and BDL contributions to their defined benefit pension plans are not included above, as they are not consolidated in our financial statements.
Additionally, we have adopted the FASB's new guidance related to defined benefit pension and other postretirement plans. Specifically, the new guidance requires us to report only the service cost component in the same line item as other compensation costs arising from services rendered by the pertinent employees during the period; while the other components of net benefit cost are now presented in the unaudited condensed consolidated statements of operations separately from the service cost component and outside of operating income. We have also determined that only service cost will be reported within each operating segment and all other components will be reported within the Corporate segment. See further discussion in Note 2, "New Accounting Pronouncements". 16.14. Commitments and Contingencies
Discontinued OperationsLitigation, Environmental and Other Contingencies
Kaiser
In 2006,Related to litigation, environmental issues and other contingencies we sold our entire equity interest in our Brazilian unit, Cervejarias Kaiser Brasil S.A. ("Kaiser") to FEMSA Cerveza S.A. de C.V. ("FEMSA"). The terms of the sale agreement require us to indemnify FEMSA for certain exposures related to tax, civil and labor contingencies arising prior to FEMSA's purchase of Kaiser. In addition, we provided an indemnity to FEMSA for losses Kaiser may incur with respect to tax claims associated with certain previously utilized purchased tax credits. The discontinued operations balances within the current and non-current liabilities of our unaudited condensed consolidated balance sheets consist entirely of our estimates of these liabilities. These liabilities are denominated in Brazilian Reais and are therefore subject to foreign exchange gains or losses, which are recognized in the discontinued operations section of the unaudited condensed consolidated statements of operations. There have been no changes in the underlying liabilities since December 31, 2016; therefore, all changes in the current and non-current liabilities of discontinued operations during the first quarter of 2017 are due to fluctuations in foreign exchange rates from December 31, 2016, to March 31, 2017. During the three months ended March 31, 2017, and March 31, 2016, we recognized unrealized foreign exchange losses of $0.6had $17.3 million and $0.5$17.8 million respectively, from discontinued operations associated with foreign exchange movements related to indemnities we provided to FEMSA. Our exposure related to the tax, civil and labor indemnity claims is capped at the amount
of the sales price of the 68% equity interest of Kaiser, which was $68.0 million. Separately, the maximum potential claims amount remaining for the purchased tax credits was $112.1 million, based on foreign exchange rates as of March 31, 2017.
Future settlement procedures and related negotiation activities associated with these contingencies are largely outside of our control. Due to the uncertainty involved with the ultimate outcome and timing of these contingencies, significant adjustments to the carrying values of the indemnity obligations have been recorded to date, and additional future adjustments may be required.
Guarantees
We guarantee indebtedness and other obligations to banks and other third parties for some of our equity method investments and consolidated subsidiaries. As of March 31, 2017, and December 31, 2016, accounts payable and other current liabilitiesaccrued, in the unaudited condensed consolidated balance sheets includes $48.8 million and $31.7 million, respectively, related to the guarantee of the indebtedness of our equity method investments. See Note 4, "Acquisition and Investments" for further detail. Additionally, related to our previous ownership in the Montréal Canadiens, we guarantee its obligations under a ground lease for the Bell Centre Arena (the "Ground Lease Guarantee"). Upon sale of our interest, the new owners agreed to indemnify us in connection with the liabilities we may incur under the Ground Lease Guarantee and provided us with a CAD 10 million letter of credit to guarantee such indemnity. This transaction did not materially affect our risk exposure related to the Ground Lease Guarantee, which continues to be recognized as a liability on our unaudited condensed consolidated balance sheets. Other liabilities in the unaudited condensed consolidated balance sheets include $4.5 millionaggregate, as of March 31, 2017,2018, and $4.4 million as of December 31, 2016, related to the Ground Lease Guarantee, both of which are classified as non-current.
Litigation, Other Disputes and Environmental
Related to litigation, other disputes and environmental issues, we have accrued an aggregate of $26.0 million as of March 31, 2017, and $27.7 million as of December 31, 2016.respectively. While we cannot predict the eventual aggregate cost for legal, environmental and relatedother matters in which we are currently involved, we believe adequate reserves have been provided for losses that are probable and estimable. Further, we believe that any payments, if required, for these matters would be made over a period of time in amounts that would not be material in any one year to our results from operations, cash flows or our financial or competitive position. Additionally, we believe that any reasonably possible losses in excess of the amounts accrued are immaterial to our unaudited condensed consolidated interim financial statements, except as noted below.statements. Our legal, environmental and other liabilities are discussed in further detail within Part II—Item 8 Financial Statements, Note 19, "Commitments and Contingencies" in our Annual Report and did not significantly change during the first quarter of 2018.
In addition to the specific cases discussed below, weWe are involved in other disputes and legal actions arising in the ordinary course of our business. While it is not feasible to predict or determine the outcome of these proceedings, in our opinion, based on a review with legal counsel, other than as discussed below,noted, none of these disputes or legal actions are expected to have a material impact on our business, consolidated financial position, results of operations or cash flows. However, litigation is subject to inherent uncertainties and an adverse result in these or other matters may arise from time to time that may harm our business.
Each year since 2014, we have received assessments fromAs a local country regulatory authorityresult of receiving a favorable ruling related to our historical indirect tax calculations in Europe, we released a previously recorded indirect tax provision related to our Europe operations. The aggregate amount of the assessments received throughoperations during the first quarter of 2017, is approximately $136 million based on foreign exchange rates at March 31, 2017. Based on the assessments received and related impacts, we estimate a current range of loss of up to approximately $142 million, based on foreign exchange rates at March 31, 2017, excluding consideration of interest and penalties.
Since their issuance, we have challenged the validity of these assessments and defended our position regarding our method of calculation, including by following the required regulatory procedures in order to proceed with an appeal of the assessments. During the fourth quarter of 2016, following discussions with the regulatory authority and consideration of existing facts and circumstances at that time, we concluded that a portion of this estimated range of loss was deemed probable. As a result, we recorded a charge of approximately $50 million, based on foreign exchange rates at December 31, 2016, within the excise taxes line item on the consolidated statement of operations for the year ended December 31, 2016. During the first quarter of 2017, a local jurisdictional court heard evidence in this matter and subsequently ruled in our favor in April 2017. Based on this favorable ruling, we released this provision in the first quarter of 2017 as we no longer deem this loss probable. This resultedresulting in a benefit of approximately $50 million, based on foreign exchange rates at March 31, 2017, recorded within the excise taxes line item on the unaudited condensed consolidated statement of operations forduring the quarter ended March, 31, 2017. While this determination to releaseDuring the contingency loss is based on the local court ruling in Aprilsecond quarter of 2017, the ultimate outcome of the assessments remains uncertain at this time as the ruling remains subject to appeal.
The indirect tax calculation methodology challenged in the assessments continues to be applied by us, and, as a result of the fact that the decision of the local court may be appealed, the related range of loss is expected to increase until ultimately resolved. If the assessments, as issued bywe received formal confirmation from the regulatory authority are ultimately upheld or ifthat they would not appeal the relevant statutory provisions or interpretations at issue are changed, it could havelocal jurisdictional court ruling, and the regulatory authority has since withdrawn its assessments. As a material adverse effect on our European results of operations andresult, we believe this dispute is fully resolved.
operating income. Such an adverse ultimate determination or change also could materially affect our results of operations, including excise taxes, net sales and resulting impacts to other financial statement line items.
Litigation and Other Disputes
On December 12, 2014, a notice of action captioned David Hughes and 631992 Ontario Inc. v. Liquor Control Board of Ontario ("LCBO"), Brewers Retail Inc., Labatt Breweries of Canada LP, Molson Coors Canada and Sleeman Breweries Ltd. No. CV-14-518059-00CP was filed in Ontario, Canada in the Ontario Superior Court of Justice. BRI and its owners, including Molson Coors Canada, as well as the LCBO are named as defendants in the action. The plaintiffs allege that The Beer Store (retail outlets owned and operated by BRI) and LCBO improperly entered into an agreement to fix prices and market allocation within the Ontario beer market to the detriment of licensees and consumers. The plaintiffs seek to have the claim certified as a class action on behalf of all Ontario beer consumers and licensees and, among other things, damages in the amount of approximately CAD 1.4 billion. We note that The Beer Store operates according to the rules established by the Government of Ontario for regulation, sale and distribution of beer in the province. Additionally, prices at The Beer Store are independently set by each brewer and are approved by the LCBO on a weekly basis. As such, we currently believe the claim has been made without merit, and we intend to vigorously assert and defend our rights in this lawsuit.
Environmental
Canada
Our Canada brewing operations are subject to provincial environmental regulations and local permit requirements. Our Montréal and Toronto breweries have water treatment facilities to pre-treat waste water before it goes to the respective local governmental facility for final treatment. We have environmental programs in Canada including organization, monitoring and verification, regulatory compliance, reporting, education and training, and corrective action.Guarantees
We sold a chemical specialties business in 1996. We are still responsibleguarantee indebtedness and other obligations to banks and other third parties for certain aspects of environmental remediation, undertaken or planned, at those chemical specialties business locations. We have established provisions for the costs of these remediation programs.
United States
We were previously notified that we are or may be a potentially responsible party ("PRP") under the Comprehensive Environmental Response, Compensation and Liability Act or similar state laws for the cleanup of sites where hazardous substances have allegedly been released into the environment. We cannot predict with certainty the total costs of cleanup, our share of the total cost, the extent to which contributions will be available from other parties, the amount of time necessary to complete the cleanups or insurance coverage.
Lowry
We are one of a number of entities named by the Environmental Protection Agency ("EPA") as a PRP at the Lowry Superfund site. This landfill is owned by the City and County of Denver ("Denver") and is managed by Waste Management of Colorado, Inc. ("Waste Management"). In 1990, we recorded a pretax charge of $30 million, a portion of which was put into a trust in 1993 as part of a settlement with Denver and Waste Management regarding the then-outstanding litigation. Our settlement was based on an assumed remediation cost of $120 million (in 1992 adjusted dollars). We are obligated to pay a portion of future costs, if any, in excess of that amount.
Waste Management provides us with updated annual cost estimates through 2032. We review these cost estimates in the assessment of our accrual related to this issue. We use certain assumptions that differ from Waste Management's estimates to assess our expected liability. Our expected liability (based on the $120 million threshold being met) is based on our best estimates available.
The assumptions used are as follows:
trust management costs are included in projections with regard to the $120 million threshold, but are expensed only as incurred;
income taxes, which we believe are not an included cost, are excluded from projections with regard to the $120 million threshold;
a 2.5% inflation rate for future costs; and
certain operations and maintenance costs were discounted using a 2.71% risk-free rate of return.
Based on these assumptions, the present value and gross amount of the costs at March 31, 2017, are approximately $3 million and $6 million, respectively. We did not assume any future recoveries from insurance companies in the estimate of our liability, and none are expected.
Considering the estimates extend through the year 2032 and the related uncertainties at the site, including what additional remedial actions may be required by the EPA, new technologies and what costs are included in the determination of when the $120 million is reached, the estimate of our liability may change as further facts develop. We cannot predict the amount of any such change, but additional accruals in the future are possible.
Other
In prior years, we were notified by the EPA and certain state environmental divisions that we are a PRP, along with other parties, at the Cooper Drum site in southern California, the East Rutherford and Berry's Creek sites in New Jersey and the Chamblee site in Georgia. Certain former non-beer business operations, which we discontinued use of and subsequently sold, were involved at these sites. Potential losses associated with these sites could increase as remediation planning progresses.
We are aware of groundwater contamination at some of our properties in Colorado resulting from historical, ongoing, or nearby activities. There may also be other contaminationequity method investments and consolidated subsidiaries. As of which we are currently unaware.
EuropeMarch 31, 2018, and MCI
We are subjectDecember 31, 2017, the unaudited condensed consolidated balance sheets include liabilities related to these guarantees of $56.8 million and $42.8 million, respectively, primarily related to the requirements of governmental and local environmental and occupational health and safety laws and regulations within eachguarantee of the countriesindebtedness of our equity method investments. See Note 4, "Investments" for further detail.
Separately, related to our Kaiser indemnities, we have accrued $17.3 million, in which we operate. Compliance with these lawsaggregate, as of March 31, 2018, and regulationsDecember 31, 2017. The maximum potential claims amount remaining for the Kaiser-related purchased tax credits was $105.9 million, based on foreign exchange rates as of March 31, 2018. Our Kaiser liabilities are discussed in further detail within Note 19 of the Notes included in our Annual Report and did not materially affect our capital expenditures, results of operations or our financial or competitive position forsignificantly change during the first quarter of 2017, and we do not anticipate that they will do so during the remainder of the year.2018.
17.15. Supplemental Guarantor Information
For purposes of this Note 17,15, including the tables, "Parent Issuer" shall mean MCBC. "Subsidiary Guarantors" shall mean certain Canadian and U.S. subsidiaries reflecting the substantial operations of each of our Canada and U.S. segments.
SEC Registered Securities
On May 3, 2012, MCBC issued $1.9$1.9 billion of senior notes, in a registered public offering, consisting of $300$300 million2.0% senior notes due 2017 $500(subsequently repaid in the second quarter of 2017), $500 million3.5% senior notes due 2022, and $1.1$1.1 billion5.0% senior notes due 2042. Additionally, on July 7, 2016, MCBC issued $500 million 1.45% senior notes due 2019, $1.0 billion 2.10% senior notes due 2021, $2.0 billion 3.0% senior notes due 2026, $1.8 billion 4.2% senior notes due 2046 and EUR $800.0 million 1.25% senior notes due 2024, in a registered public offering. In December 2017, MCBC completed an exchange offer in which it issued publicly registered senior notes in exchange for its $500 million 1.90% senior notes due 2019, $500 million 2.25% senior notes due 2020 and our EUR 500 million floating rate senior notes due 2019, which were issued in private placement transactions in March 2017. "Parent Issuer" in the below tables is specifically referring to MCBC in its capacity as the issuer of these 2012, 2016 and 20162017 issuances. These senior notes are guaranteed on a senior unsecured basis by the Subsidiary Guarantors. Each of the Subsidiary Guarantors is 100% owned by the Parent Issuer. The guarantees are full and unconditional and joint and several.
None of our other outstanding debt is registered with the SEC, and such other outstanding debt is guaranteed on a senior unsecured basis by the Parent and/or Subsidiary Guarantors. These guarantees are full and unconditional and joint and several. See Note 11,9, "Debt" for details of all debt issued and outstanding as of March 31, 2017.2018.
Presentation
Certain amounts have been revised to reflect the retrospective application of our change in accounting policy as discussed in Note 1, "Basis of Presentation and Summary of Significant Accounting Policies".
Effective January 1, 2018, MillerCoors USA LLC, a new entity with no historic activity, was added as a subsidiary guarantor. In addition, effective December 26, 2017, our historical subsidiary guarantor, Jacob Leinenkugel Brewing Co., LLC, was merged with and into the existing subsidiary guarantor, MillerCoors LLC, and, on January 1, 2018, our historical subsidiary guarantors MillerCoors Holdings LLC and MC Holding Company LLC were also merged with and into MillerCoors LLC, a subsidiary guarantor.
In conjunction with the debt issued July 7, 2016, and as disclosed within Exhibit 99.1first quarter of the Current Report on Form 8-K filed with the SEC on June 28, 2016, we released2018, MillerCoors LLC, a subsidiary guarantor, declared a distribution of approximately $1.7 billion to Molson Coors Brewing Company, (U.K.) Limited, our primary U.K. operating entity, Golden Acquisition andwhich was simultaneously non-cash settled via offset to an equal amount of payables that were owed by Molson Coors Holdings Limited as subsidiary guarantors of our existing and future debt obligations, as evidenced by the supplemental indentures dated May 13, 2016. Accordingly, the 2016 financial information included below has been recastBrewing Company to reflect the release of these entities as subsidiary guarantors.MillerCoors LLC.
The following information sets forth the unaudited condensed consolidating statements of operations for the three months ended March 31, 2017,2018, and March 31, 2016,2017, unaudited condensed consolidating balance sheets as of March 31, 2017,2018, and December 31, 2016,2017, and unaudited condensed consolidating statements of cash flows for the three months ended March 31, 2017,2018, and March 31, 2016.2017. Investments in subsidiaries are accounted for under the equity method; accordingly, entries necessary to consolidate the Parent Issuer and all of our guarantor and non-guarantor subsidiaries are reflected in the eliminations column. In the opinion of management, separate complete financial statements of MCBC and the Subsidiary Guarantors would not provide additional material information that would be useful in assessing their financial composition.
Certain amounts have been revised to reflect the retrospective application of our change in accounting policy and the new accounting pronouncements recently adopted as discussed in Note 1, "Basis of Presentation and Summary of Significant Accounting Policies" and Note 2, "New Accounting Pronouncements".
MOLSON COORS BREWING COMPANY AND SUBSIDIARIES
CONDENSED CONSOLIDATING STATEMENT OF OPERATIONS
FOR THE THREE MONTHS ENDED MARCH 31, 2017
(IN MILLIONS)
(UNAUDITED)
| | | | Three Months Ended |
| | | | | | | | | | | | March 31, 2018 |
| | Parent
Issuer | | Subsidiary Guarantors | | Subsidiary Non Guarantors | | Eliminations | | Consolidated | Parent
Issuer | | Subsidiary Guarantors | | Subsidiary Non Guarantors | | Eliminations | | Consolidated |
| Sales | $ | 7.0 |
| | $ | 2,376.6 |
| | $ | 650.0 |
| | $ | (119.8 | ) | | $ | 2,913.8 |
| $ | 4.9 |
| | $ | 2,234.6 |
| | $ | 742.6 |
| | $ | (114.1 | ) | | $ | 2,868.0 |
|
| Excise taxes | — |
| | (325.7 | ) | | (139.4 | ) | | — |
| | (465.1 | ) | — |
| | (301.4 | ) | | (235.1 | ) | | — |
| | (536.5 | ) |
| Net sales | 7.0 |
| | 2,050.9 |
| | 510.6 |
| | (119.8 | ) | | 2,448.7 |
| 4.9 |
| | 1,933.2 |
| | 507.5 |
| | (114.1 | ) | | 2,331.5 |
|
| Cost of goods sold | — |
| | (1,143.0 | ) | | (339.4 | ) | | 109.5 |
| | (1,372.9 | ) | (0.5 | ) | | (1,241.7 | ) | | (399.7 | ) | | 106.2 |
| | (1,535.7 | ) |
| Gross profit | 7.0 |
| | 907.9 |
| | 171.2 |
| | (10.3 | ) | | 1,075.8 |
| 4.4 |
| | 691.5 |
| | 107.8 |
| | (7.9 | ) | | 795.8 |
|
| Marketing, general and administrative expenses | (67.7 | ) | | (497.6 | ) | | (147.8 | ) | | 10.3 |
| | (702.8 | ) | (70.2 | ) | | (463.3 | ) | | (155.5 | ) | | 7.9 |
| | (681.1 | ) |
| Special items, net | (0.5 | ) | | (0.7 | ) | | (2.6 | ) | | — |
| | (3.8 | ) | — |
| | 321.4 |
| | (6.6 | ) | | — |
| | 314.8 |
|
| Equity income (loss) in subsidiaries | 338.8 |
| | (78.1 | ) | | 19.0 |
| | (279.7 | ) | | — |
| 635.5 |
| | (158.8 | ) | | 4.8 |
| | (481.5 | ) | | — |
|
| Operating income (loss) | 277.6 |
| | 331.5 |
| | 39.8 |
| | (279.7 | ) | | 369.2 |
| 569.7 |
| | 390.8 |
| | (49.5 | ) | | (481.5 | ) | | 429.5 |
|
| Interest income (expense), net | (81.1 | ) | | 58.9 |
| | (74.4 | ) | | — |
| | (96.6 | ) | (85.2 | ) | | 82.0 |
| | (80.0 | ) | | — |
| | (83.2 | ) |
| Other pension and postretirement benefits (costs), net | | — |
| | 1.4 |
| | 8.6 |
| | — |
| | 10.0 |
|
| Other income (expense), net | (8.2 | ) | | 16.7 |
| | (8.1 | ) | | — |
| | 0.4 |
| (0.2 | ) | | 40.2 |
| | (38.9 | ) | | — |
| | 1.1 |
|
| Income (loss) from continuing operations before income taxes | 188.3 |
| | 407.1 |
| | (42.7 | ) | | (279.7 | ) | | 273.0 |
| |
| Income (loss) before income taxes | | 484.3 |
| | 514.4 |
| | (159.8 | ) | | (481.5 | ) | | 357.4 |
|
| Income tax benefit (expense) | 13.0 |
| | (68.1 | ) | | (9.5 | ) | | — |
| | (64.6 | ) | (206.2 | ) | | 121.9 |
| | 9.4 |
| | — |
| | (74.9 | ) |
| Net income (loss) from continuing operations | 201.3 |
| | 339.0 |
| | (52.2 | ) | | (279.7 | ) | | 208.4 |
| |
| Income (loss) from discontinued operations, net of tax | — |
| | — |
| | (0.6 | ) | | — |
| | (0.6 | ) | |
| Net income (loss) including noncontrolling interests | 201.3 |
| | 339.0 |
| | (52.8 | ) | | (279.7 | ) | | 207.8 |
| |
| Net income (loss) | | 278.1 |
| | 636.3 |
| | (150.4 | ) | | (481.5 | ) | | 282.5 |
|
| Net (income) loss attributable to noncontrolling interests | — |
| | — |
| | (6.5 | ) | | — |
| | (6.5 | ) | — |
| | — |
| | (4.4 | ) | | — |
| | (4.4 | ) |
| Net income (loss) attributable to MCBC | $ | 201.3 |
| | $ | 339.0 |
| | $ | (59.3 | ) | | $ | (279.7 | ) | | $ | 201.3 |
| $ | 278.1 |
| | $ | 636.3 |
| | $ | (154.8 | ) | | $ | (481.5 | ) | | $ | 278.1 |
|
| Comprehensive income (loss) attributable to MCBC | $ | 276.6 |
| | $ | 412.9 |
| | $ | (13.8 | ) | | $ | (399.1 | ) | | $ | 276.6 |
| $ | 327.2 |
| | $ | 743.2 |
| | $ | (47.3 | ) | | $ | (695.9 | ) | | $ | 327.2 |
|
MOLSON COORS BREWING COMPANY AND SUBSIDIARIES
CONDENSED CONSOLIDATING STATEMENT OF OPERATIONS
FOR THE THREE MONTHS ENDED MARCH 31, 2016
(IN MILLIONS)
(UNAUDITED)
AS RECAST FOR CHANGE IN GUARANTORS
| | | | Three Months Ended |
| | | | | | | | | | | | March 31, 2017 |
| | Parent
Issuer | | Subsidiary Guarantors | | Subsidiary Non Guarantors | | Eliminations | | Consolidated | Parent
Issuer | | Subsidiary Guarantors | | Subsidiary Non Guarantors | | Eliminations | | Consolidated |
| Sales | $ | 6.6 |
| | $ | 375.9 |
| | $ | 595.3 |
| | $ | (27.0 | ) | | $ | 950.8 |
| $ | 7.0 |
| | $ | 2,376.6 |
| | $ | 650.0 |
| | $ | (119.8 | ) | | $ | 2,913.8 |
|
| Excise taxes | — |
| | (84.0 | ) | | (209.6 | ) | | — |
| | (293.6 | ) | — |
| | (325.7 | ) | | (139.4 | ) | | — |
| | (465.1 | ) |
| Net sales | 6.6 |
| | 291.9 |
| | 385.7 |
| | (27.0 | ) | | 657.2 |
| 7.0 |
| | 2,050.9 |
| | 510.6 |
| | (119.8 | ) | | 2,448.7 |
|
| Cost of goods sold | — |
| | (163.7 | ) | | (270.4 | ) | | 20.1 |
| | (414.0 | ) | — |
| | (1,140.4 | ) | | (341.4 | ) | | 109.5 |
| | (1,372.3 | ) |
| Gross profit | 6.6 |
| | 128.2 |
| | 115.3 |
| | (6.9 | ) | | 243.2 |
| 7.0 |
| | 910.5 |
| | 169.2 |
| | (10.3 | ) | | 1,076.4 |
|
| Marketing, general and administrative expenses | (47.0 | ) | | (79.8 | ) | | (131.0 | ) | | 6.9 |
| | (250.9 | ) | (67.7 | ) | | (498.5 | ) | | (149.4 | ) | | 10.3 |
| | (705.3 | ) |
| Special items, net | — |
| | 109.3 |
| | (0.7 | ) | | — |
| | 108.6 |
| (0.5 | ) | | (3.6 | ) | | (2.6 | ) | | — |
| | (6.7 | ) |
| Equity income (loss) in subsidiaries | 215.8 |
| | (113.4 | ) | | 149.3 |
| | (251.7 | ) | | — |
| 346.0 |
| | (71.7 | ) | | 19.8 |
| | (294.1 | ) | | — |
|
| Equity income in MillerCoors | — |
| | 142.4 |
| | — |
| | — |
| | 142.4 |
| |
| Operating income (loss) | 175.4 |
| | 186.7 |
| | 132.9 |
| | (251.7 | ) | | 243.3 |
| 284.8 |
| | 336.7 |
| | 37.0 |
| | (294.1 | ) | | 364.4 |
|
| Interest income (expense), net | (39.9 | ) | | 69.2 |
| | (76.6 | ) | | — |
| | (47.3 | ) | (81.1 | ) | | 58.9 |
| | (74.4 | ) | | — |
| | (96.6 | ) |
| Other pension and postretirement benefits (costs), net | | — |
| | 2.0 |
| | 11.3 |
| | — |
| | 13.3 |
|
| Other income (expense), net | (18.3 | ) | | 4.6 |
| | (1.6 | ) | | — |
| | (15.3 | ) | (8.2 | ) | | 16.7 |
| | (8.7 | ) | | — |
| | (0.2 | ) |
| Income (loss) from continuing operations before income taxes | 117.2 |
| | 260.5 |
| | 54.7 |
| | (251.7 | ) | | 180.7 |
| |
| Income (loss) before income taxes | | 195.5 |
| | 414.3 |
| | (34.8 | ) | | (294.1 | ) | | 280.9 |
|
| Income tax benefit (expense) | 45.5 |
| | (85.4 | ) | | 23.2 |
| | — |
| | (16.7 | ) | 13.0 |
| | (68.1 | ) | | (10.8 | ) | | — |
| | (65.9 | ) |
| Net income (loss) from continuing operations | 162.7 |
| | 175.1 |
| | 77.9 |
| | (251.7 | ) | | 164.0 |
| |
| Income (loss) from discontinued operations, net of tax | — |
| | — |
| | (0.5 | ) | | — |
| | (0.5 | ) | |
| Net income (loss) including noncontrolling interests | 162.7 |
| | 175.1 |
| | 77.4 |
| | (251.7 | ) | | 163.5 |
| |
| Net income (loss) | | 208.5 |
| | 346.2 |
| | (45.6 | ) | | (294.1 | ) | | 215.0 |
|
| Net (income) loss attributable to noncontrolling interests | — |
| | — |
| | (0.8 | ) | | — |
| | (0.8 | ) | — |
| | — |
| | (6.5 | ) | | — |
| | (6.5 | ) |
| Net income (loss) attributable to MCBC | $ | 162.7 |
| | $ | 175.1 |
| | $ | 76.6 |
| | $ | (251.7 | ) | | $ | 162.7 |
| $ | 208.5 |
| | $ | 346.2 |
| | $ | (52.1 | ) | | $ | (294.1 | ) | | $ | 208.5 |
|
| Comprehensive income (loss) attributable to MCBC | $ | 419.7 |
| | $ | 408.8 |
| | $ | 99.4 |
| | $ | (508.2 | ) | | $ | 419.7 |
| $ | 281.2 |
| | $ | 417.5 |
| | $ | (9.2 | ) | | $ | (408.3 | ) | | $ | 281.2 |
|
MOLSON COORS BREWING COMPANY AND SUBSIDIARIES
CONDENSED CONSOLIDATING BALANCE SHEET
AS OF MARCH 31, 2017
(IN MILLIONS)
| | | | As of |
| | | | | | | | | | | | March 31, 2018 |
| | Parent
Issuer | | Subsidiary Guarantors | | Subsidiary Non Guarantors | | Eliminations | | Consolidated | Parent
Issuer | | Subsidiary Guarantors | | Subsidiary Non Guarantors | | Eliminations | | Consolidated |
| Assets | | | | | | | | | | | | | | | | | | |
| Current assets: | | | | | | | | | | | | | | | | | | |
| Cash and cash equivalents | $ | 41.9 |
| | $ | 91.4 |
| | $ | 261.7 |
| | $ | — |
| | $ | 395.0 |
| $ | 10.0 |
| | $ | 26.5 |
| | $ | 161.4 |
| | $ | — |
| | $ | 197.9 |
|
| Accounts receivable, net | — |
| | 436.1 |
| | 320.4 |
| | — |
| | 756.5 |
| — |
| | 422.4 |
| | 356.9 |
| | — |
| | 779.3 |
|
| Other receivables, net | 44.5 |
| | 76.7 |
| | 45.3 |
| | — |
| | 166.5 |
| 90.7 |
| | 50.5 |
| | 26.8 |
| | — |
| | 168.0 |
|
| Inventories, net | — |
| | 517.5 |
| | 146.0 |
| | — |
| | 663.5 |
| — |
| | 500.9 |
| | 164.7 |
| | — |
| | 665.6 |
|
| Other current assets, net | 16.0 |
| | 207.3 |
| | 74.4 |
| | — |
| | 297.7 |
| 5.2 |
| | 228.5 |
| | 92.5 |
| | — |
| | 326.2 |
|
| Intercompany accounts receivable | — |
| | 1,219.0 |
| | 48.0 |
| | (1,267.0 | ) | | — |
| — |
| | 1,181.1 |
| | 57.0 |
| | (1,238.1 | ) | | — |
|
| Total current assets | 102.4 |
| | 2,548.0 |
| | 895.8 |
| | (1,267.0 | ) | | 2,279.2 |
| 105.9 |
| | 2,409.9 |
| | 859.3 |
| | (1,238.1 | ) | | 2,137.0 |
|
| Properties, net | 27.0 |
| | 3,456.4 |
| | 1,045.4 |
| | — |
| | 4,528.8 |
| 16.6 |
| | 3,459.5 |
| | 1,204.7 |
| | — |
| | 4,680.8 |
|
| Goodwill | — |
| | 6,649.7 |
| | 1,626.5 |
| | — |
| | 8,276.2 |
| — |
| | 6,473.5 |
| | 1,969.2 |
| | — |
| | 8,442.7 |
|
| Other intangibles, net | — |
| | 12,160.0 |
| | 1,872.6 |
| | — |
| | 14,032.6 |
| 7.5 |
| | 12,070.2 |
| | 2,159.9 |
| | — |
| | 14,237.6 |
|
| Net investment in and advances to subsidiaries | 22,933.3 |
| | 3,460.6 |
| | 4,436.1 |
| | (30,830.0 | ) | | — |
| 25,174.8 |
| | 4,235.0 |
| | 4,598.2 |
| | (34,008.0 | ) | | — |
|
| Other assets | 80.7 |
| | 178.1 |
| | 202.3 |
| | (35.0 | ) | | 426.1 |
| 96.0 |
| | 238.6 |
| | 414.7 |
| | (62.9 | ) | | 686.4 |
|
| Total assets | $ | 23,143.4 |
| | $ | 28,452.8 |
| | $ | 10,078.7 |
| | $ | (32,132.0 | ) | | $ | 29,542.9 |
| $ | 25,400.8 |
| | $ | 28,886.7 |
| | $ | 11,206.0 |
| | $ | (35,309.0 | ) | | $ | 30,184.5 |
|
| Liabilities and equity | | | | | | | | | | | | | | | | | | |
| Current liabilities: | | | | | | | | | | | | | | | | | | |
| Accounts payable and other current liabilities | $ | 129.9 |
| | $ | 1,379.8 |
| | $ | 690.8 |
| | $ | — |
| | $ | 2,200.5 |
| $ | 139.7 |
| | $ | 1,566.5 |
| | $ | 830.9 |
| | $ | — |
| | $ | 2,537.1 |
|
| Current portion of long-term debt and short-term borrowings | 430.0 |
| | 375.1 |
| | 37.9 |
| | — |
| | 843.0 |
| 1,241.5 |
| | 309.8 |
| | 40.0 |
| | — |
| | 1,591.3 |
|
| Discontinued operations | — |
| | — |
| | 5.2 |
| | — |
| | 5.2 |
| |
| Intercompany accounts payable | 951.9 |
| | 120.5 |
| | 194.6 |
| | (1,267.0 | ) | | — |
| 878.2 |
| | 117.2 |
| | 242.7 |
| | (1,238.1 | ) | | — |
|
| Total current liabilities | 1,511.8 |
| | 1,875.4 |
| | 928.5 |
| | (1,267.0 | ) | | 3,048.7 |
| 2,259.4 |
| | 1,993.5 |
| | 1,113.6 |
| | (1,238.1 | ) | | 4,128.4 |
|
| Long-term debt | 10,021.4 |
| | 1,421.6 |
| | 0.1 |
| | — |
| | 11,443.1 |
| 8,329.6 |
| | 1,159.1 |
| | 38.3 |
| | — |
| | 9,527.0 |
|
| Pension and postretirement benefits | 2.6 |
| | 1,141.9 |
| | 13.4 |
| | — |
| | 1,157.9 |
| 3.0 |
| | 821.0 |
| | 14.0 |
| | — |
| | 838.0 |
|
| Deferred tax liabilities | — |
| | 1,015.6 |
| | 782.0 |
| | (35.0 | ) | | 1,762.6 |
| — |
| | 885.1 |
| | 866.5 |
| | (62.9 | ) | | 1,688.7 |
|
| Other liabilities | 10.4 |
| | 206.5 |
| | 90.3 |
| | — |
| | 307.2 |
| 16.5 |
| | 200.4 |
| | 122.0 |
| | — |
| | 338.9 |
|
| Discontinued operations | — |
| | — |
| | 13.1 |
| | — |
| | 13.1 |
| |
| Intercompany notes payable | — |
| | 1,360.3 |
| | 5,952.7 |
| | (7,313.0 | ) | | — |
| 1,347.6 |
| | 88.2 |
| | 6,365.4 |
| | (7,801.2 | ) | | — |
|
| Total liabilities | 11,546.2 |
| | 7,021.3 |
| | 7,780.1 |
| | (8,615.0 | ) | | 17,732.6 |
| 11,956.1 |
| | 5,147.3 |
| | 8,519.8 |
| | (9,102.2 | ) | | 16,521.0 |
|
| MCBC stockholders' equity | 11,598.3 |
| | 27,383.0 |
| | 3,447.0 |
| | (30,830.0 | ) | | 11,598.3 |
| 13,445.9 |
| | 30,103.6 |
| | 3,904.4 |
| | (34,008.0 | ) | | 13,445.9 |
|
| Intercompany notes receivable | (1.1 | ) | | (5,951.5 | ) | | (1,360.4 | ) | | 7,313.0 |
| | — |
| (1.2 | ) | | (6,364.2 | ) | | (1,435.8 | ) | | 7,801.2 |
| | — |
|
| Total stockholders' equity | 11,597.2 |
| | 21,431.5 |
| | 2,086.6 |
| | (23,517.0 | ) | | 11,598.3 |
| 13,444.7 |
| | 23,739.4 |
| | 2,468.6 |
| | (26,206.8 | ) | | 13,445.9 |
|
| Noncontrolling interests | — |
| | — |
| | 212.0 |
| | — |
| | 212.0 |
| — |
| | — |
| | 217.6 |
| | — |
| | 217.6 |
|
| Total equity | 11,597.2 |
| | 21,431.5 |
| | 2,298.6 |
| | (23,517.0 | ) | | 11,810.3 |
| 13,444.7 |
| | 23,739.4 |
| | 2,686.2 |
| | (26,206.8 | ) | | 13,663.5 |
|
| Total liabilities and equity | $ | 23,143.4 |
| | $ | 28,452.8 |
| | $ | 10,078.7 |
| | $ | (32,132.0 | ) | | $ | 29,542.9 |
| $ | 25,400.8 |
| | $ | 28,886.7 |
| | $ | 11,206.0 |
| | $ | (35,309.0 | ) | | $ | 30,184.5 |
|
MOLSON COORS BREWING COMPANY AND SUBSIDIARIES
CONDENSED CONSOLIDATING BALANCE SHEET
AS OF DECEMBER 31, 2016
(IN MILLIONS)
(UNAUDITED)
| | | | As of |
| | | | | | | | | | | | December 31, 2017 |
| | Parent
Issuer | | Subsidiary Guarantors | | Subsidiary Non Guarantors | | Eliminations | | Consolidated | Parent
Issuer | | Subsidiary Guarantors | | Subsidiary Non Guarantors | | Eliminations | | Consolidated |
| Assets | | | | | | | | | | | | | | | | | | |
| Current assets: | | | | | | | | | | | | | | | | | | |
| Cash and cash equivalents | $ | 147.3 |
| | $ | 141.5 |
| | $ | 272.1 |
| | $ | — |
| | $ | 560.9 |
| $ | 6.6 |
| | $ | 140.9 |
| | $ | 271.1 |
| | $ | — |
| | $ | 418.6 |
|
| Accounts receivable, net | — |
| | 374.8 |
| | 294.7 |
| | — |
| | 669.5 |
| — |
| | 424.8 |
| | 309.0 |
| | — |
| | 733.8 |
|
| Other receivables, net | 43.6 |
| | 53.8 |
| | 38.4 |
| | — |
| | 135.8 |
| 90.4 |
| | 45.2 |
| | 32.6 |
| | — |
| | 168.2 |
|
| Inventories, net | — |
| | 466.6 |
| | 126.1 |
| | — |
| | 592.7 |
| — |
| | 457.7 |
| | 133.8 |
| | — |
| | 591.5 |
|
| Other current assets, net | 1.3 |
| | 139.3 |
| | 70.1 |
| | — |
| | 210.7 |
| 9.6 |
| | 184.8 |
| | 83.2 |
| | — |
| | 277.6 |
|
| Intercompany accounts receivable | — |
| | 1,098.5 |
| | 36.0 |
| | (1,134.5 | ) | | — |
| — |
| | 2,303.2 |
| | 65.6 |
| | (2,368.8 | ) | | — |
|
| Total current assets | 192.2 |
| | 2,274.5 |
| | 837.4 |
| | (1,134.5 | ) | | 2,169.6 |
| 106.6 |
| | 3,556.6 |
| | 895.3 |
| | (2,368.8 | ) | | 2,189.7 |
|
| Properties, net | 27.5 |
| | 3,459.9 |
| | 1,020.0 |
| | — |
| | 4,507.4 |
| 16.8 |
| | 3,509.8 |
| | 1,147.1 |
| | — |
| | 4,673.7 |
|
| Goodwill | — |
| | 6,647.5 |
| | 1,602.6 |
| | — |
| | 8,250.1 |
| — |
| | 6,487.8 |
| | 1,917.7 |
| | — |
| | 8,405.5 |
|
| Other intangibles, net | — |
| | 12,180.4 |
| | 1,851.5 |
| | — |
| | 14,031.9 |
| 8.0 |
| | 12,183.8 |
| | 2,104.7 |
| | — |
| | 14,296.5 |
|
| Net investment in and advances to subsidiaries | 22,506.3 |
| | 3,475.4 |
| | 4,400.9 |
| | (30,382.6 | ) | | — |
| 26,443.9 |
| | 4,297.4 |
| | 4,683.1 |
| | (35,424.4 | ) | | — |
|
| Other assets | 80.2 |
| | 161.7 |
| | 173.4 |
| | (32.8 | ) | | 382.5 |
| 101.7 |
| | 253.7 |
| | 387.2 |
| | (61.1 | ) | | 681.5 |
|
| Total assets | $ | 22,806.2 |
| | $ | 28,199.4 |
| | $ | 9,885.8 |
| | $ | (31,549.9 | ) | | $ | 29,341.5 |
| $ | 26,677.0 |
| | $ | 30,289.1 |
| | $ | 11,135.1 |
| | $ | (37,854.3 | ) | | $ | 30,246.9 |
|
| Liabilities and equity | | | | | | | | | | | | | | | | | | |
| Current liabilities: | | | | | | | | | | | | | | | | | | |
| Accounts payable and other current liabilities | $ | 203.6 |
| | $ | 1,493.5 |
| | $ | 770.6 |
| | $ | — |
| | $ | 2,467.7 |
| $ | 180.4 |
| | $ | 1,648.9 |
| | $ | 855.2 |
| | $ | — |
| | $ | 2,684.5 |
|
| Current portion of long-term debt and short-term borrowings | 299.9 |
| | 371.7 |
| | 13.2 |
| | — |
| | 684.8 |
| 379.0 |
| | 317.8 |
| | 18.0 |
| | — |
| | 714.8 |
|
| Discontinued operations | — |
| | — |
| | 5.0 |
| | — |
| | 5.0 |
| |
| Intercompany accounts payable | 893.5 |
| | 101.8 |
| | 139.2 |
| | (1,134.5 | ) | | — |
| 2,131.8 |
| | 102.8 |
| | 134.2 |
| | (2,368.8 | ) | | — |
|
| Total current liabilities | 1,397.0 |
| | 1,967.0 |
| | 928.0 |
| | (1,134.5 | ) | | 3,157.5 |
| 2,691.2 |
| | 2,069.5 |
| | 1,007.4 |
| | (2,368.8 | ) | | 3,399.3 |
|
| Long-term debt | 9,979.4 |
| | 1,408.2 |
| | 0.1 |
| | — |
| | 11,387.7 |
| 9,399.7 |
| | 1,189.5 |
| | 9.5 |
| | — |
| | 10,598.7 |
|
| Pension and postretirement benefits | 2.6 |
| | 1,181.2 |
| | 12.2 |
| | — |
| | 1,196.0 |
| 2.9 |
| | 832.1 |
| | 13.5 |
| | — |
| | 848.5 |
|
| Deferred tax liabilities | — |
| | 972.0 |
| | 759.8 |
| | (32.8 | ) | | 1,699.0 |
| — |
| | 864.7 |
| | 845.0 |
| | (61.1 | ) | | 1,648.6 |
|
| Other liabilities | 9.6 |
| | 229.2 |
| | 28.2 |
| | — |
| | 267.0 |
| 10.7 |
| | 200.1 |
| | 106.0 |
| | — |
| | 316.8 |
|
| Discontinued operations | — |
| | — |
| | 12.6 |
| | — |
| | 12.6 |
| |
| Intercompany notes payable | — |
| | 1,360.3 |
| | 5,868.4 |
| | (7,228.7 | ) | | — |
| 1,347.6 |
| | 227.0 |
| | 6,370.5 |
| | (7,945.1 | ) | | — |
|
| Total liabilities | 11,388.6 |
| | 7,117.9 |
| | 7,609.3 |
| | (8,396.0 | ) | | 17,719.8 |
| 13,452.1 |
| | 5,382.9 |
| | 8,351.9 |
| | (10,375.0 | ) | | 16,811.9 |
|
| MCBC stockholders' equity | 11,418.7 |
| | 26,948.9 |
| | 3,433.7 |
| | (30,382.6 | ) | | 11,418.7 |
| 13,226.1 |
| | 31,275.5 |
| | 4,148.9 |
| | (35,424.4 | ) | | 13,226.1 |
|
| Intercompany notes receivable | (1.1 | ) | | (5,867.4 | ) | | (1,360.2 | ) | | 7,228.7 |
| | — |
| (1.2 | ) | | (6,369.3 | ) | | (1,574.6 | ) | | 7,945.1 |
| | — |
|
| Total stockholders' equity | 11,417.6 |
| | 21,081.5 |
| | 2,073.5 |
| | (23,153.9 | ) | | 11,418.7 |
| 13,224.9 |
| | 24,906.2 |
| | 2,574.3 |
| | (27,479.3 | ) | | 13,226.1 |
|
| Noncontrolling interests | — |
| | — |
| | 203.0 |
| | — |
| | 203.0 |
| — |
| | — |
| | 208.9 |
| | — |
| | 208.9 |
|
| Total equity | 11,417.6 |
| | 21,081.5 |
| | 2,276.5 |
| | (23,153.9 | ) | | 11,621.7 |
| 13,224.9 |
| | 24,906.2 |
| | 2,783.2 |
| | (27,479.3 | ) | | 13,435.0 |
|
| Total liabilities and equity | $ | 22,806.2 |
| | $ | 28,199.4 |
| | $ | 9,885.8 |
| | $ | (31,549.9 | ) | | $ | 29,341.5 |
| $ | 26,677.0 |
| | $ | 30,289.1 |
| | $ | 11,135.1 |
| | $ | (37,854.3 | ) | | $ | 30,246.9 |
|
MOLSON COORS BREWING COMPANY AND SUBSIDIARIES
CONDENSED CONSOLIDATING STATEMENT OF CASH FLOWS
FOR THE THREE MONTHS ENDED MARCH 31, 2017
(IN MILLIONS)
(UNAUDITED)
| | | | Three Months Ended |
| | | | | | | | | | | | March 31, 2018 |
| | Parent
Issuer | | Subsidiary Guarantors | | Subsidiary Non Guarantors | | Eliminations | | Consolidated | Parent
Issuer | | Subsidiary Guarantors | | Subsidiary Non Guarantors | | Eliminations | | Consolidated |
| Net cash provided by (used in) operating activities | $ | (172.4 | ) | | $ | 141.5 |
| | $ | (87.4 | ) | | $ | — |
| | $ | (118.3 | ) | $ | 353.0 |
| | $ | 208.1 |
| | $ | (111.6 | ) | | $ | (134.3 | ) | | $ | 315.2 |
|
| CASH FLOWS FROM INVESTING ACTIVITIES: | | | | | | | | | | | | | | | | | | |
| Additions to properties | (3.8 | ) | | (142.1 | ) | | (34.1 | ) | | — |
| | (180.0 | ) | (1.2 | ) | | (161.6 | ) | | (45.5 | ) | | — |
| | (208.3 | ) |
| Proceeds from sales of properties and other assets | — |
| | 0.2 |
| | 41.8 |
| | — |
| | 42.0 |
| — |
| | 0.7 |
| | 0.9 |
| | — |
| | 1.6 |
|
| Other | — |
| | — |
| | 5.9 |
| | — |
| | 5.9 |
| — |
| | (1.1 | ) | | (44.3 | ) | | — |
| | (45.4 | ) |
| Net intercompany investing activity | — |
| | (42.6 | ) | | — |
| | 42.6 |
| | — |
| 12.7 |
| | (8.2 | ) | | 171.3 |
| | (175.8 | ) | | — |
|
| Net cash provided by (used in) investing activities | (3.8 | ) | | (184.5 | ) | | 13.6 |
| | 42.6 |
| | (132.1 | ) | 11.5 |
| | (170.2 | ) | | 82.4 |
| | (175.8 | ) | | (252.1 | ) |
| CASH FLOWS FROM FINANCING ACTIVITIES: | | | | | | | | | | | | | | | | | | |
| Exercise of stock options under equity compensation plans | 0.3 |
| | — |
| | — |
| | — |
| | 0.3 |
| 6.1 |
| | — |
| | — |
| | — |
| | 6.1 |
|
| Dividends paid | (80.8 | ) | | — |
| | (7.5 | ) | | — |
| | (88.3 | ) | (81.2 | ) | | — |
| | (141.6 | ) | | 134.3 |
| | (88.5 | ) |
| Debt issuance costs | (3.7 | ) | | — |
| | — |
| | — |
| | (3.7 | ) | |
| Payments on debt and borrowings | (1,500.0 | ) | | — |
| | (1.1 | ) | | — |
| | (1,501.1 | ) | — |
| | (0.5 | ) | | (0.3 | ) | | — |
| | (0.8 | ) |
| Proceeds on debt and borrowings | 1,536.0 |
| | — |
| | — |
| | — |
| | 1,536.0 |
| |
| Net proceeds from (payments on) revolving credit facilities and commercial paper | 129.9 |
| | — |
| | 1.1 |
| | — |
| | 131.0 |
| (250.5 | ) | | — |
| | 1.8 |
| | — |
| | (248.7 | ) |
| Change in overdraft balances and other | (10.9 | ) | | (7.7 | ) | | 24.7 |
| | — |
| | 6.1 |
| (2.9 | ) | | (6.1 | ) | | 51.0 |
| | — |
| | 42.0 |
|
| Net intercompany financing activity | — |
| | — |
| | 42.6 |
| | (42.6 | ) | | — |
| (32.6 | ) | | (145.4 | ) | | 2.2 |
| | 175.8 |
| | — |
|
| Net cash provided by (used in) financing activities | 70.8 |
| | (7.7 | ) | | 59.8 |
| | (42.6 | ) | | 80.3 |
| (361.1 | ) | | (152.0 | ) | | (86.9 | ) | | 310.1 |
| | (289.9 | ) |
| CASH AND CASH EQUIVALENTS: | | | | | | | | | | | | | | | | | | |
| Net increase (decrease) in cash and cash equivalents | (105.4 | ) | | (50.7 | ) | | (14.0 | ) | | — |
| | (170.1 | ) | 3.4 |
| | (114.1 | ) | | (116.1 | ) | | — |
| | (226.8 | ) |
| Effect of foreign exchange rate changes on cash and cash equivalents | — |
| | 0.6 |
| | 3.6 |
| | — |
| | 4.2 |
| — |
| | (0.3 | ) | | 6.4 |
| | — |
| | 6.1 |
|
| Balance at beginning of year | 147.3 |
| | 141.5 |
| | 272.1 |
| | — |
| | 560.9 |
| 6.6 |
| | 140.9 |
| | 271.1 |
| | — |
| | 418.6 |
|
| Balance at end of period | $ | 41.9 |
| | $ | 91.4 |
| | $ | 261.7 |
| | $ | — |
| | $ | 395.0 |
| $ | 10.0 |
| | $ | 26.5 |
| | $ | 161.4 |
| | $ | — |
| | $ | 197.9 |
|
MOLSON COORS BREWING COMPANY AND SUBSIDIARIES
CONDENSED CONSOLIDATING STATEMENT OF CASH FLOWS
FOR THE THREE MONTHS ENDED MARCH 31, 2016
(IN MILLIONS)
(UNAUDITED)
AS RECAST FOR CHANGE IN GUARANTORS
| | | | Three Months Ended |
| | | | | | | | | | | | March 31, 2017 |
| | Parent
Issuer | | Subsidiary Guarantors | | Subsidiary Non Guarantors | | Eliminations | | Consolidated | Parent
Issuer | | Subsidiary Guarantors | | Subsidiary Non Guarantors | | Eliminations | | Consolidated |
| Net cash provided by (used in) operating activities | $ | (157.1 | ) | | $ | 147.5 |
| | $ | (78.7 | ) | | $ | — |
| | $ | (88.3 | ) | $ | (172.4 | ) | | $ | 141.5 |
| | $ | (87.4 | ) | | $ | — |
| | $ | (118.3 | ) |
| CASH FLOWS FROM INVESTING ACTIVITIES: | | | | | | | | | | | | | | | | | | |
| Additions to properties | (7.2 | ) | | (21.5 | ) | | (42.4 | ) | | — |
| | (71.1 | ) | (3.8 | ) | | (142.1 | ) | | (34.1 | ) | | — |
| | (180.0 | ) |
| Proceeds from sales of properties and other assets | — |
| | 1.3 |
| | 1.1 |
| | — |
| | 2.4 |
| — |
| | 0.2 |
| | 41.8 |
| | — |
| | 42.0 |
|
| Investment in MillerCoors | — |
| | (413.7 | ) | | — |
| | — |
| | (413.7 | ) | |
| Return of capital from MillerCoors | — |
| | 283.4 |
| | — |
| | — |
| | 283.4 |
| |
| Other | — |
| | — |
| | (6.5 | ) | | — |
| | (6.5 | ) | — |
| | — |
| | 5.9 |
| | — |
| | 5.9 |
|
| Net intercompany investing activity | — |
| | (66.1 | ) | | — |
| | 66.1 |
| | — |
| — |
| | (42.6 | ) | | — |
| | 42.6 |
| | — |
|
| Net cash provided by (used in) investing activities | (7.2 | ) | | (216.6 | ) | | (47.8 | ) | | 66.1 |
| | (205.5 | ) | (3.8 | ) | | (184.5 | ) | | 13.6 |
| | 42.6 |
| | (132.1 | ) |
| CASH FLOWS FROM FINANCING ACTIVITIES: | |
| | |
| | |
| | |
| | |
| |
| | |
| | |
| | |
| | |
|
| Proceeds from issuance of common stock, net | 2,526.4 |
| | — |
| | — |
| | — |
| | 2,526.4 |
| |
| Exercise of stock options under equity compensation plans | 4.2 |
| | — |
| | — |
| | — |
| | 4.2 |
| 0.3 |
| | — |
| | — |
| | — |
| | 0.3 |
|
| Dividends paid | (80.5 | ) | | — |
| | (7.8 | ) | | — |
| | (88.3 | ) | (80.8 | ) | | — |
| | (7.5 | ) | | — |
| | (88.3 | ) |
| Debt issuance costs | (14.2 | ) | | — |
| | — |
| | — |
| | (14.2 | ) | (3.7 | ) | | — |
| | — |
| | — |
| | (3.7 | ) |
| Payments on debt and borrowings | — |
| | — |
| | (10.3 | ) | | — |
| | (10.3 | ) | (1,500.0 | ) | | — |
| | (1.1 | ) | | — |
| | (1,501.1 | ) |
| Proceeds on debt and borrowings | — |
| | — |
| | 20.9 |
| | — |
| | 20.9 |
| 1,536.0 |
| | — |
| | — |
| | — |
| | 1,536.0 |
|
| Net proceeds from (payments on) revolving credit facilities and commercial paper | — |
| | — |
| | 2.5 |
| | — |
| | 2.5 |
| 129.9 |
| | — |
| | 1.1 |
| | — |
| | 131.0 |
|
| Change in overdraft balances and other | (1.5 | ) | | — |
| | 18.8 |
| | — |
| | 17.3 |
| (10.9 | ) | | (7.7 | ) | | 24.7 |
| | — |
| | 6.1 |
|
| Net intercompany financing activity | — |
| | — |
| | 66.1 |
| | (66.1 | ) | | — |
| — |
| | — |
| | 42.6 |
| | (42.6 | ) | | — |
|
| Net cash provided by (used in) financing activities | 2,434.4 |
| | — |
| | 90.2 |
| | (66.1 | ) | | 2,458.5 |
| 70.8 |
| | (7.7 | ) | | 59.8 |
| | (42.6 | ) | | 80.3 |
|
| CASH AND CASH EQUIVALENTS: | | | | | | | | | | | | | | | | | | |
| Net increase (decrease) in cash and cash equivalents | 2,270.1 |
| | (69.1 | ) | | (36.3 | ) | | — |
| | 2,164.7 |
| (105.4 | ) | | (50.7 | ) | | (14.0 | ) | | — |
| | (170.1 | ) |
| Effect of foreign exchange rate changes on cash and cash equivalents | — |
| | 4.7 |
| | 2.6 |
| | — |
| | 7.3 |
| — |
| | 0.6 |
| | 3.6 |
| | — |
| | 4.2 |
|
| Balance at beginning of year | 146.4 |
| | 106.2 |
| | 178.3 |
| | — |
| | 430.9 |
| 147.3 |
| | 141.5 |
| | 272.1 |
| | — |
| | 560.9 |
|
| Balance at end of period | $ | 2,416.5 |
| | $ | 41.8 |
| | $ | 144.6 |
| | $ | — |
| | $ | 2,602.9 |
| $ | 41.9 |
| | $ | 91.4 |
| | $ | 261.7 |
| | $ | — |
| | $ | 395.0 |
|
ITEM 2. MANAGEMENT'S DISCUSSION AND ANALYSIS OF FINANCIAL CONDITION AND RESULTS OF OPERATIONS
Management's Discussion and Analysis of Financial Condition and Results of Operations ("MD&A") in this Form 10-Q is provided as a supplement to, and should be read in conjunction with, our audited consolidated financial statements, the accompanying notes and the MD&A included in our Annual Report on Form 10-K for the fiscal year ended December 31, 20162017 ("Annual Report"), as well as our unaudited condensed consolidated interim financial statements and the accompanying notes included in this Form 10-Q. Due to the seasonality of our operating results, quarterly financial results are not an appropriate basis from which to project annual results.
Unless otherwise noted in this report, any description of "we," "us" or "our" includes Molson Coors Brewing Company ("MCBC" or the "Company"), principally a holding company, and its operating and non-operating subsidiaries included within our reporting segments and Corporate. Our reporting segments include: MillerCoors LLC ("MillerCoors" or U.S. segment), operating in the United States ("U.S.");States; Molson Coors Canada ("MCC" or Canada segment), operating in Canada; Molson Coors Europe (Europe segment), operating in Bulgaria, Croatia, Czech Republic, Hungary, Montenegro, Republic of Ireland, Romania, Serbia, the United Kingdom ("U.K.") and various other European countries; and Molson Coors International ("MCI") or International segment), operating in various other countries.
For 2016, the unaudited condensed consolidated statement of operations includes MillerCoors' results of operations for the period from January 1, 2016, to October 10, 2016, on the equity method basis of accounting reflecting our 42% economic interest, and from October 11, 2016, to December 31, 2016, on a consolidated basis reflecting our 100% ownership. Additionally, our unaudited condensed consolidated balance sheets as of March 31, 2017, and December 31, 2016, includes our acquired assets and liabilities, which were recorded at their respective preliminary acquisition-date fair values upon completion of the Acquisition as defined below. Where indicated, we have reflected unaudited pro forma financial information for 2016 which gives effect to the Acquisition and the related financing as if they were completed on January 1, 2016, the first day of fiscal year 2016.
Unless otherwise indicated, information in this report is presented in U.S. dollars ("USD" or "$")USD and comparisons are to comparable prior periods. Our primary operating currencies, other than USD, include the Canadian Dollar ("CAD"),CAD, the British Pound ("GBP"),GBP, and our Central European operating currencies such as the Euro ("EUR"), Czech Koruna ("CZK"), Croatian Kuna ("HRK")EUR, CZK, HRK and Serbian Dinar ("RSD").RSD.
Operational Measures
We have certain operational measures, such as sales-to-wholesalers ("STWs")STWs and sales-to-retailers ("STRs"),STRs, which we believe are important metrics. STW is a metric that we use in our U.S. business to reflect the sales from our operations to our direct customers, generally wholesalers. We believe the STW metric is important because it gives an indication of the amount of beer and adjacent products that we have produced and shipped to customers. STR is a metric that we use in our Canada and U.S. businesses to refer to sales closer to the end consumer than STWs, which generally means sales from our wholesalers or our company to retailers, who in turn sell to consumers. We believe the STR metric is important because, unlike STWs, it provides the closest indication of the performance of our brands in relation to market and competitor sales trends.
Acquisition
On October 11, 2016, we completed the acquisition of SABMiller plc's ("SABMiller") 58% economic interest and 50% voting interest in MillerCoors and all trademarks, contracts and other assets primarily related to the "Miller International Business," as defined in the purchase agreement, outside of the U.S. and Puerto Rico (the "Acquisition") from Anheuser-Busch InBev SA/NV ("ABI"). The Acquisition was completed for $12.0 billion in cash, subject to a downward adjustment as described in the purchase agreement.
We have a downward purchase price adjustment, as described in the purchase agreement, if the unaudited U.S. GAAP earnings before interest, tax, depreciation and amortization ("EBITDA") for the Miller International Business for the twelve months prior to closing is below $70 million. The determination for the amount of the downward purchase price adjustment, if any, is ongoing pursuant to the terms of the purchase agreement.
Under the purchase agreement, we retained the rights to all of the brands currently in the MillerCoors portfolio for the U.S. and Puerto Rican markets, including import brands such as Peroni and Pilsner Urquell, as well as obtained full ownership of the Miller brand portfolio outside of the U.S. and Puerto Rico. Additionally, in consolidating control of MillerCoors, we expect we will further improve our scale and agility, benefit from significantly enhanced cash flows from operations, and capture substantial operational synergies. The purchase of the Miller brand trademarks outside of the U.S. and Puerto Rico provides a strategic opportunity to leverage the iconic Miller trademark globally alongside MCBC's trademarks for Coors and
Staropramen, and presents volume and profit growth opportunities for MCBC in both core markets, as well as emerging markets.
Executive Summary
We are one of the world's largest brewers and have a diverse portfolio of owned and partner brands, including coreglobal priority brands Blue Moon, Coors Banquet, Coors Light, Miller Genuine Draft, Miller Lite, and Staropramen, regional champion brands Carling, Coors LightMolson Canadian and other leading country-specific brands, Miller Lite, Molson Canadian and Staropramen, as well as craft and specialty beers such as Blue Moon, Creemore Springs, Cobra, Doom Bar, Henry's Hard Soda and Leinenkugel's. With centuries of brewing heritage, we have been crafting high-quality, innovative products with the purpose of delighting the world's beer drinkers and with the goalambition to be the first choice for our consumers and customers. Our success depends on our ability to make our products available to meet a wide range of consumer segments and occasions.
Adoption of Revenue Recognition Guidance
On January 1, 2018, we adopted the FASB's new accounting pronouncement related to revenue recognition. This guidance was adopted using the modified retrospective approach, and therefore, prior period results have not been restated. The following table highlights the impact of this new guidance on summarized components of our unaudited condensed consolidated statement of operations for the three months ended March 31, 2018, when comparing our current period results of operations under the new guidance, versus our results of operations if historical guidance had continued to be applied.
|
| | | | | | | | | | | | | | | | | | | |
| | Three Months Ended March 31, 2018 |
| | U.S. | | Canada | | Europe | | International | | Consolidated |
| | (In millions) |
| Impact to Unaudited Condensed Consolidated Statements of Operations - Favorable/(Unfavorable): | | |
| Net sales | $ | (4.7 | ) | | $ | (11.0 | ) | | $ | (0.6 | ) | | $ | 0.2 |
| | $ | (16.1 | ) |
| Cost of goods sold | $ | — |
| | $ | — |
| | $ | — |
| | $ | — |
| | $ | — |
|
| Gross profit | $ | (4.7 | ) | | $ | (11.0 | ) | | $ | (0.6 | ) | | $ | 0.2 |
| | $ | (16.1 | ) |
| Marketing, general and administrative expenses | $ | 0.7 |
| | $ | 11.6 |
| | $ | 0.8 |
| | $ | — |
| | $ | 13.1 |
|
| Operating income (loss) | $ | (4.0 | ) | | $ | 0.6 |
| | $ | 0.2 |
| | $ | 0.2 |
| | $ | (3.0 | ) |
| Interest income (expense), net | $ | — |
| | $ | — |
| | $ | (0.8 | ) | | $ | — |
| | $ | (0.8 | ) |
| Income (loss) before income taxes | $ | (4.0 | ) | | $ | 0.6 |
| | $ | (0.6 | ) | | $ | 0.2 |
| | $ | (3.8 | ) |
These impacts are primarily driven by the reclassification of certain cash payments to customers from marketing, general and administrative expenses to a reduction of revenue, as well as a change in the timing of recognition of certain promotional discounts and cash payments to customers. See Part I—Item 1. Financial Statements, Note 1, "Basis of Presentation and Summary of Significant Accounting Policies" and Note 2, "New Accounting Pronouncements" for further discussion on the adoption of this guidance.
Adoption of Pension and Other Postretirement Benefit Guidance
On January 1, 2018, we adopted the FASB's new accounting pronouncement related to the classification of pension and other postretirement benefit costs. Specifically, the new guidance requires us to report only the service cost component in the same line item as other compensation costs arising from services rendered by the pertinent employees during the period; while the other components of net benefit cost are now presented in the unaudited condensed consolidated statements of operations separately from the service cost component and outside of operating income. The amendments in this update also allow only the service cost component to be eligible for capitalization when applicable. We have also determined that only service cost will be reported within each operating segment and all other components will be reported within the Corporate segment. The guidance related to the income statement presentation of service costs and other pension and postretirement benefit costs is applied retrospectively, while the capitalization of service costs component is applied prospectively. This adjustment is classification only and had no impact to our consolidated net income. See Note 2, "New Accounting Pronouncements" for further details including updated historical financial information.
Summary of Consolidated Results of Operations:Operations
The following table highlights summarized components of our unaudited condensed consolidated statements of operations and unaudited pro forma financial information for the three months ended March 31, 2017,2018, and March 31, 2016.2017. See Part I-Item 1. Financial Statements for additional details of our U.S. GAAP results.
We have presented unaudited pro forma financial information to enhance comparability of financial information between periods. The unaudited pro forma financial information is based on the historical consolidated financial statements of MCBC and MillerCoors, both prepared in accordance with U.S. GAAP, and gives effect to the Acquisition and the completed financing as if they were completed on January 1, 2016. Pro forma adjustments are based on items that are factually supportable, are directly attributable to the Acquisition or the related completed financing, and are expected to have a continuing impact on MCBC's results of operations. Any nonrecurring items directly attributable to the Acquisition or the related completed financing are excluded in the unaudited pro forma statements of operations. The unaudited pro forma financial information does not include adjustments for costs related to integration activities following the completion of the Acquisition, cost savings or synergies that have been or may be achieved by the combined businesses. The unaudited pro forma financial information is presented for illustrative purposes only and does not necessarily reflect the results of operations of MCBC that actually would have resulted had the Acquisition occurred at the date indicated, or project the results of operations of MCBC for any future dates or periods. See "Unaudited Pro Forma Financial Information," below for details of pro forma adjustments.
|
| | | | | | | | | | | | | | |
| | Three Months Ended |
| | March 31, 2017 | | March 31, 2016 | | Pro Forma Change |
| | As Reported | | As Reported | | Pro Forma(1) | |
| | (In millions, except percentages and per share data) |
Volume in hectoliters(2) | 21.878 |
| | 6.330 |
| | 22.516 |
| | (2.8 | )% |
| Net sales | $ | 2,448.7 |
| | $ | 657.2 |
| | $ | 2,461.4 |
|
| (0.5 | )% |
| Net income (loss) attributable to MCBC from continuing operations | $ | 201.9 |
| | $ | 163.2 |
| | $ | 257.4 |
|
| (21.6 | )% |
| Net income (loss) attributable to MCBC per diluted share from continuing operations | $ | 0.93 |
| | $ | 0.80 |
| | $ | 1.19 |
| | (21.8 | )% |
|
| | | | | | | | | | |
| | Three Months Ended |
| | March 31, 2018 | | March 31, 2017 | | % change |
| | (In millions, except percentages and per share data) |
| Financial volume in hectoliters | 20.813 |
| | 21.878 |
| | (4.9 | )% |
| Net sales | $ | 2,331.5 |
| | $ | 2,448.7 |
| | (4.8 | )% |
| Net income (loss) attributable to MCBC | $ | 278.1 |
| | $ | 208.5 |
| | 33.4 | % |
| Net income (loss) attributable to MCBC per diluted share | $ | 1.28 |
| | $ | 0.96 |
| | 33.3 | % |
| |
(1) | Pro forma amounts give effect to the Acquisition and completed financing as if they had occurred at the beginning of fiscal year 2016. See "Unaudited Pro Forma Financial Information," below for details of pro forma adjustments. |
| |
(2) | Historical volumes have been recast to reflect the impacts of aligning policies on reporting financial volumes as a result of the Acquisition. See "Worldwide Brand Volume" below for further details. |
First Quarter 20172018 Financial Highlights:Highlights
On an as reported basis - During the first quarter of 2017,2018, we recognized net income from continuing operations attributable to MCBC of $201.9$278.1 million, or $0.93$1.28 per diluted share, representing an increase of $38.7$69.6 million versus the prior year. Net sales of approximately $2.3 billion in the first quarter of 2018 decreased from $2.4 billion in the prior year. The increase in net income attributable to MCBC was primarily driven by the $328.0 million gain related to settlement proceeds received during the first quarter of 2018 along with positive global pricing, cost savings and lower interest expense, partially offset by unrealized mark-to-market losses in the current quarter compared to unrealized mark-to-market gains in the prior year, lower volume, cycling the impact of the indirect tax provision of approximately $50 million that was released during the first quarter of 2017 and higher input cost inflation.
Regional financial highlights:
In the U.S. segment, income before income taxes of $261.7 million decreased compared to $316.6 million in the prior year primarily due to the Acquisition. The increase resulting from the Acquisitionimpact of lower shipment volumes, negative sales mix, volume deleverage, cost of goods sold inflation and our additional 58% share of the U.S. business results, ishigher depreciation expense partially offset by the $110.4higher net pricing, costs savings and lower marketing, general and administrative expenses.
In our Canada segment, income before income taxes decreased by 56.5% to $9.1 million gain recorded within special items, net in the first quarter of 2016 related2018, compared to the saleprior year, primarily due to brand volume declines, higher accelerated depreciation of our Vancouver brewery as well as $19.0brewing assets and the impact of cycling an $8.1 million of integration related costs, along with lower U.S. volume and mix shift toward higher-cost products during the first quarter of 2017. Net sales of approximately $2.4 billionpurchase price adjustment gain in the first quarter of 2017 related to the historical sale of Molson Inc.'s ownership interest in the Montreal Canadiens.
In our Europe segment, loss before income taxes was $29.9 million in the first quarter of 2018, compared to income of $27.0 million in the prior year, primarily due to cycling the impact of the indirect tax provision of approximately $50 million released during the first quarter of 2017, adopting recently revised industry guidelines for calculating excise-tax payments in one market, and increased from $657.2investment in our first choice agenda this year, partially offset by cycling a 2017 provision for an estimate of uncollectible receivables.
In our International segment, income before income taxes increased to $3.7 million in the first quarter of 2018, compared to income of $1.5 million in the prior year, primarily driven by the Acquisition.
On a pro forma basis - During the first quarter of 2017, net income from continuing operations attributable to MCBC decreased 21.6% compared to the prior year pro forma figures as a result of lower special items, net along with lower U.S. volume, mix shift toward higher-cost products, and higher marketing, general and administrative expenses, offset by net gains of $63.1 million related to unrealized mark-to-market gains on our commodity hedging programs.
During the first quarter of 2017, we continued to focus on building our brand strength and transforming our portfolio toward the above premium, flavored malt beverages, craft and cider segments. Further, we continued to focus on generating higher returns on our invested capital, managing our working capital and delivering a greater return on investment for our shareholders. Additionally, during the first quarter of 2017, we issued the 2017 Notes (as defined below) and repaid a large portion of our term loans as further discussed below which will generate future interest savings and will contribute to our deleveraging commitments.
Regional financial highlights:
In the U.S., MillerCoors income from continuing operations before income taxes was $315.6 million compared to $337.6 million (of which we reported our respective 42% economic interest prior to the Acquisition) on a reported basis in the prior year due to lower volume and higher cost of goods sold per hectoliter partially offset by lower special charges related to the Eden brewery closure. Income from continuing operations increased 3.4% compared to prior year pro forma figures primarily due to lower special charges related to the Eden brewery closure, lower marketing, general and administrative expenses, including $2.0 million of settlement proceeds received related to our Colombia business, and higher net pricing, growth, partially offset by lower volume and higher cost of goods sold per hectoliter.
In our Canada segment, income from continuing operations before income taxes decreased by 84.2% to $23.1 million in the first quarter of 2017 compared to the prior year, primarily due to the gain recognized on the sale of the Vancouver brewery during the first quarter of 2016.
In our Europe segment, income from continuing operations before income taxes of $30.6 million in the first quarter of 2017, increased from a loss of $1.2 million in the prior year, primarily driven by the reversal of an indirect tax provision charge as further discussed below, slightly offset by higher brand investments, special charges as well as unfavorable currency movements.
Our MCI segment reported income from continuing operations before income taxes of $1.5 million in the first quarter of 2017, compared to a loss from continuing operations before income taxes of $2.3 million in the prior year, primarily driven by the change in segment reporting of the Puerto Rico business from the U.S. segment and the addition of the MillerModelo global brands.contract in Japan.
See "Results of Operations" below for further analysis of our segment results.
Core brand highlights:
Global priority brand volume decreased 5.6% in 2018 versus 2017, due to declines across all segments.
Volume for Blue Moon Belgian WhiteCarling, the number one global brand volume decreased 1.5% in 2018 versus 2017, driven by declines in the U.K.U.S., partially offset by growth in International, Canada and the largest Europe.
Carling brand volume in our Europe segment, increaseddecreased by 0.6%2.4% during the first quarter of 2017,2018, versus the first quarter of 2016, despite the continued decline in the mainstream lager market and the late timing of the Easter holiday this year.2017 consistent with a declining market.
Coors Light global brand volume - Coors Light global brand volume decreased 6.5% during the first quarter of 2017 by 0.7%2018 versus the first quarter of 2016.2017. The overall volume decrease in the first quarter of 20172018 was driven bydue to lower brand volume in the U.S., Canada and Canada,International, slightly offset by strong growth in Europe and MCI.Europe. Volumes in the U.S. were lower than prior year in-lineconsistent with the overall U.S. industry.industry premium and premium light segment performance. The declines in Canada are the result of weak industry performance in the West and high inventory levels in Quebec at the start of the year, along with ongoing competitive pressures in Quebec as well asand Ontario and a continued shift in consumer preference to value brands in the West resulting from a weaker economy; however, our new packaging, advertisingWest. The declines in International were the result of reduced promotional activity, balancing volume with pricing, in Mexico. Coors Banquet global brand volume decreased 6.5% during the first quarter of 2018 versus the first quarter of 2017 driven by the U.S. and in-pack sales promotions are driving improved consumer purchase intent and other brand health scores.Canada.
Miller Lite U.S.global brand volume - Miller Lite global brand volumes decreased 1.1%; however, in3.6% during the first quarter of 2018 versus prior year, driven by the U.S., the brandCanada and International. However, Miller Lite gained share of the U.S. premium light segment for the tenthfourteenth consecutive quarter.Miller Genuine Draft global brand volumedecreased 10.5% during the first quarter of 2018 versus prior year, driven by the U.S., Europe and International, partially offset by growth in Canada.
Molson Canadian brand volume in Canada decreased by 4.4%6.3% during the first quarter of 20172018 versus the prior year, primarily driven by challenging economicweak industry conditions and competitive pressures in the West and Ontario.high inventory levels in Quebec at the start of the year.
Staropramen global brand volume, including royalty volume, increased 10.9%decreased 6.4% during the first quarter of 2017,2018, versus the first quarter of 2016, driven by higher2017, due to lower volumes both in the Czech Republic, as well as outside of the brand's primary market.
Worldwide Brand Volume
As a result of the Acquisition, we aligned our volume reporting policies resulting in adjustments to our historically reported volumes. Specifically, financial volume for all consolidated segments has been recast to include contract brewing and wholesaler non-owned brand volumes (including factored brands in Europe and non-owned brands distributed in the U.S.), as the corresponding sales are reported within our gross sales amounts. We have also modified our worldwide brand volume definition to include an adjustment from STWs to STRs for timing impacts.
Worldwide brand volume (or "brand volume" when discussed by segment) reflects only owned brands sold to unrelated external customers within our geographic markets, net of returns and allowances, royalty volume, an adjustment from STWs to STRs and our proportionate share of equity investment brand volume calculated consistently with MCBC owned volume. Contract brewing and wholesaler volume is removed from worldwide brand volume as this is non-owned volume for which we do not directly control performance. We believe this definition of worldwide brand volume more closely aligns with how we measure the performance of our owned brands within the markets in which they are sold. Financial volume represents owned brands sold to unrelated external customers within our geographical markets, net of returns and allowances as well as contract brewing, wholesale non-owned brand volume and company-owned distribution volume. Royalty volume consists of our brands produced and sold by third parties under various license and contract-brewing agreements and because this is owned volume, it is included in worldwide brand volume. The adjustment from STWs to STRs provides the closest indication of the performance of our owned brands in relation to market and competitor sales trends, as it reflects sales volume one step closer to the end consumer and generally means sales from our wholesalers or our company to retailers. Equity investment
Effective in the first quarter of 2018, we have revised our net sales per hectoliter performance discussions to include a brand volume basis as defined above with the net sales revenue component reflecting owned and actively managed brands as well as royalty revenue consistent with how management views the business. We continue to also discuss net sales per hectoliter performance on a reported basis.
|
| | | | | | | | |
| | Three Months Ended |
| | March 31, 2018 | | March 31, 2017 | | % change |
| | (In millions, except percentages) |
| Volume in hectoliters: | | | | | |
| Financial volume | 20.813 |
| | 21.878 |
| | (4.9 | )% |
| Less: Contract brewing, wholesaler and non-beer volume | (1.902 | ) | | (1.988 | ) | | (4.3 | )% |
| Add: Royalty volume | 0.716 |
| | 0.798 |
| | (10.3 | )% |
| Add: STW to STR adjustment | (0.526 | ) | | (0.982 | ) | | (46.4 | )% |
| Total worldwide brand volume | 19.101 |
| | 19.706 |
| | (3.1 | )% |
Our worldwide brand volume represents our ownership percentage share of volume in our subsidiaries accounted for under the equity method, consisting of MillerCoors prior to the completion of the Acquisition on October 11, 2016. See Part I—Item 1. Financial Statements, Note 4, "Acquisition and Investments" of the Notes to the Unaudited Condensed Consolidated Financial Statements ("Notes") for further discussion.
The following table highlights summarized components of our worldwide brand volume fordecreased 3.1% during the three months ended March 31, 2017,2018, respectively, compared to prior year due to declines in the U.S., Canada and International.
Net Sales Drivers
For the three months ended March 31, 2016.2018, versus March 31, 2017, by segment (in percentages):
|
| | | | | | | | |
| | Three Months Ended |
| | March 31, 2017 | | March 31, 2016 | | % change |
| | (In millions, except percentages) |
| Volume in hectoliters: | | | | | |
| Financial volume | 21.878 |
| | 6.330 |
| | 245.6 | % |
Less: Contract brewing and wholesaler volume(1) | (1.988 | ) | | (0.581 | ) | | N/M |
|
Add: Royalty volume(2) | 0.798 |
| | 0.337 |
| | 136.8 | % |
| Add: STW to STR adjustment | (0.982 | ) | | (0.002 | ) | | N/M |
|
| Owned volume | 19.706 |
| | 6.084 |
| | N/M |
|
| Add: Proportionate share of equity investment worldwide brand volume | — |
| | 5.550 |
| | (100.0 | )% |
| Total worldwide brand volume | 19.706 |
| | 11.634 |
| | 69.4 | % |
N/M = Not meaningful |
| | | | | | | | | | | | | | |
| | Volume | | Price, Product and Geography Mix(1) | | Currency | | Other(2) | | Total |
| Consolidated | (4.9 | )% | | (0.4 | )% | | 2.4 | % | | (1.9 | )% | | (4.8 | )% |
| U.S. | (6.7 | )% | | 0.9 | % | | — | % | | — | % | | (5.8 | )% |
| Canada | (4.8 | )% | | (2.0 | )% | | 4.2 | % | | 0.1 | % | | (2.5 | )% |
| Europe | 1.0 | % | | (1.9 | )% | | 11.9 | % | | (12.9 | )% | | (1.9 | )% |
| International | (1.5 | )% | | (5.9 | )% | | 0.4 | % | | — | % | | (7.0 | )% |
| |
| (1) | Contract brewingIncludes the impacts of the adoption of the new accounting pronouncement related to revenue recognition as discussed above. See Part I—Item 1. Financial Statements, Note 1, "Basis of Presentation and wholesaler volume is included within financial volume as noted above, but is removed from worldwide brand volume asSummary of Significant Accounting Policies" and Note 2, "New Accounting Pronouncements" for further discussion on the adoption of this is non-owned volume for which we do not directly control performance.revenue recognition guidance. |
| |
| (2) | 2016 includes MCI and Europe segment royalty volume that is primarily in Russia, Ukraine, Mexico and Republic of Ireland. Effective January 1, 2017, royalty volumes in Russia and Ukraine are reported within our Europe segment. |
Our worldwide brand volume increased 69.4% during the three months ended March 31, 2017, compared to prior year due to the Acquisition, partially offset by lower volumes in some of our existing markets.
Net Sales
The following table highlights the drivers of change in net sales on a reported basis for the three months ended March 31, 2017, versus March 31, 2016, by segment (in percentages):
|
| | | | | | | | | | | | | | |
| | Volume | | Price, Product and Geography Mix | | Currency | | Other(1) | | Total |
| Consolidated | 245.6 | % | | 32.5 | % | | (5.5 | )% | | — | % | | 272.6 | % |
| Canada | 1.1 | % | | 3.9 | % | | 3.5 | % | | 0.1 | % | | 8.6 | % |
| Europe | 2.3 | % | | 0.9 | % | | (12.7 | )% | | 15.9 | % | | 6.4 | % |
| MCI | 73.1 | % | | 26.6 | % | | (0.3 | )% | | — | % | | 99.4 | % |
(1) Europe "other""Other" column includes the release of an indirect tax provision
as further described below.
Intercompany Eliminations
Our segment results reflect gross inter-segment sales, purchases, and volumes, which are eliminated in consolidated totals. The following are inter-segment sales, purchases, and volumes for the three months ended March 31, 2017, and March 31, 2016:Income taxes
|
| | | | | | | | | | | | | | | | | | | | | | | |
| | For the three months ended March 31, 2017 |
| | U.S. | | Canada | | Europe | | MCI | | Corporate | | Total |
| | (In millions) |
| Volume in hectoliters | 0.528 |
| | 0.045 |
| | 0.001 |
| | — |
| | — |
| | 0.574 |
|
| Sales | $ | 33.4 |
| | $ | 2.6 |
| | $ | — |
| | $ | — |
| | $ | — |
| | $ | 36.0 |
|
| Cost of goods sold | $ | (6.3 | ) | | $ | (2.4 | ) | | $ | — |
| | $ | (27.3 | ) | | $ | — |
| | $ | (36.0 | ) |
|
| | | | | |
| | Three Months Ended |
| | March 31, 2018 | | March 31, 2017 |
| Effective tax rate | 21 | % | | 23 | % |
|
| | | | | | | | | | | | | | | | | | | | | | | |
| | For the three months ended March 31, 2016 |
| | U.S. | | Canada | | Europe | | MCI | | Corporate | | Total |
| | (In millions) |
| Volume in hectoliters | — |
| | — |
| | 0.010 |
| | — |
| | — |
| | 0.010 |
|
| Sales | $ | — |
| | $ | — |
| | $ | 0.9 |
| | $ | — |
| | $ | — |
| | $ | 0.9 |
|
| Cost of goods sold | $ | — |
| | $ | — |
| | $ | — |
| | $ | (0.9 | ) | | $ | — |
| | $ | (0.9 | ) |
Income taxes
Our effective tax rates for the first quarter of 2017 and 2016 were approximately 24% and 9%, respectively. Our effective tax rates were lower than the U.S. federal statutory rate of 35% primarily due to lower effective income tax rates applicable to our foreign businesses, driven by lower statutory income tax rates and tax planning impacts on statutory taxable income, as well as discrete items. The increasedecrease in the effective tax rate during the first quarter of 2018 versus 2017, versus 2016 iswas primarily driven by the inclusion of 100% of MillerCoors’ pretax income following the completionreduction of the Acquisition, which is taxed at thestatutory U.S. federal and statecorporate income tax rates,rate from 35% to 21% as well asa result of the favorable impacts of tax benefits recognized in the prior year from transaction-related costs resulting from the Acquisition2017 U.S. Tax Cuts and favorable tax treatment associated with the sale of our Vancouver brewery in 2016. These drivers wereJobs Act (the "2017 Tax Act"). This decrease was partially offset by higherthe impact of discrete items. Specifically, we recognized net discrete tax benefits in 2017, including an increaseexpense of excess tax benefits from share-based compensation in 2017. Specifically, our total net discrete tax benefit was $8.4$5.5 million in the first quarter of 2017,2018, versus a $5.7an $8.4 million net discrete tax benefit recognized in the first quarter of 2016.2017. This change was driven primarily by the recognition of excess benefits from share-based compensation in the first quarter of 2017, versus other discrete tax expenses recognized in the first quarter of 2018.
Our tax rate is volatile and may move up or down with changes in, among other things, the amount and source of income or loss, our ability to utilize foreign tax credits, excess tax benefits or deficiencies from share-based compensation, changes in tax laws, and the movement of liabilities established pursuant to accounting guidance for uncertain tax positions as statutes of limitations expire, positions are effectively settled, or when additional information becomes available. There are proposed or pending tax law changes in various jurisdictions and other changes to regulatory environments in countries in which we do business that, if enacted, may have an impact on our effective tax rate. Additionally, we continue to evaluate the impacts of the 2017 Tax Act. As we further understand its implications, as well as the related, and yet to be issued, regulator rules, regulations and interpretations, our effective tax rate could be impacted.
Discontinued operations
Discontinued operations are associated with the formerly-owned Cervejarias Kaiser Brasil S.A. ("Kaiser") business in Brazil. SeeRefer to Part I—I - Item 1. Financial Statements, Note 16, "Commitments and Contingencies"7, "Income Tax" for additional details regarding our effective tax rate as well as our ongoing evaluation of the Notes for discussions of the nature of amounts recognized in discontinued operations, which consist of amounts associated with indemnity obligations to FEMSA Cerveza S.A. de C.V. ("FEMSA")2017 Tax Act and its related to purchased tax credits and other tax, civil and labor issues.impacts.
Results of Operations
United States Segment
We have presented unaudited pro forma financial information of the U.S. segment for the three months ended March 31, 2016, to enhance comparability of financial information between periods. Results for the three months ended March 31, 2016, are actual results of MillerCoors utilized in preparing MCBC's share of MillerCoors earnings when we historically accounted for MillerCoors under the equity method of accounting, and, therefore, its results of operations were reported as equity income within MCBC's consolidated statements of operations.
|
| | | | | | | | | | | | | | | | | | |
| | Three Months Ended |
| | March 31, 2017 | | March 31, 2016 | | |
| | As Reported by MCBC | | As Reported by MillerCoors | | Pro Forma Adjustments(1) | | Pro Forma(1) | | Pro Forma Change |
| | (In millions, except percentages) |
Volumes in hectoliters(2)(3) | 15.772 |
| | 16.388 |
| | — |
| | 16.388 |
| | (3.8 | )% |
Sales(3) | $ | 1,991.4 |
| | $ | 2,069.3 |
| | $ | (5.9 | ) | | $ | 2,063.4 |
| | (3.5 | )% |
| Excise taxes | (241.5 | ) | | (253.2 | ) | | — |
| | (253.2 | ) | | (4.6 | )% |
Net sales(3) | 1,749.9 |
| | 1,816.1 |
| | (5.9 | ) | | 1,810.2 |
| | (3.3 | )% |
Cost of goods sold(3) | (1,026.9 | ) | | (1,033.0 | ) | | (15.7 | ) | | (1,048.7 | ) | | (2.1 | )% |
| Gross profit | 723.0 |
| | 783.1 |
| | (21.6 | ) | | 761.5 |
| | (5.1 | )% |
| Marketing, general and administrative expenses | (404.9 | ) | | (409.7 | ) | | (10.7 | ) | | (420.4 | ) | | (3.7 | )% |
Special items, net(4) | (2.5 | ) | | (36.9 | ) | | — |
| | (36.9 | ) | | (93.2 | )% |
| Operating income | 315.6 |
| | 336.5 |
| | (32.3 | ) | | 304.2 |
| | 3.7 | % |
| Interest income (expense), net | — |
| | (0.5 | ) | | — |
| | (0.5 | ) | | (100.0 | )% |
| Other income (expense), net | — |
| | 1.6 |
| | — |
| | 1.6 |
| | (100.0 | )% |
| Income (loss) from continuing operations before income taxes | $ | 315.6 |
| | $ | 337.6 |
| | $ | (32.3 | ) | | $ | 305.3 |
| | 3.4 | % |
|
| | | | | | | | | | |
| | Three Months Ended |
| | March 31, 2018 | | March 31, 2017 | | % change |
| | (In millions, except percentages) |
Financial volume in hectoliters(1) | 14.718 |
| | 15.772 |
| | (6.7 | )% |
Sales(1) | $ | 1,861.7 |
| | $ | 1,991.4 |
| | (6.5 | )% |
| Excise taxes | (213.9 | ) | | (241.5 | ) | | (11.4 | )% |
Net sales(1) | 1,647.8 |
| | 1,749.9 |
| | (5.8 | )% |
Cost of goods sold(1) | (990.1 | ) | | (1,025.1 | ) | | (3.4 | )% |
| Gross profit | 657.7 |
| | 724.8 |
| | (9.3 | )% |
| Marketing, general and administrative expenses | (393.1 | ) | | (405.7 | ) | | (3.1 | )% |
Special items, net(2) | (1.5 | ) | | (2.5 | ) | | (40.0 | )% |
| Operating income (loss) | 263.1 |
| | 316.6 |
| | (16.9 | )% |
| Interest income (expense), net | (1.2 | ) | | — |
| | N/M |
|
| Other income (expense), net | (0.2 | ) | | — |
| | N/M |
|
| Income (loss) before income taxes | $ | 261.7 |
| | $ | 316.6 |
| | (17.3 | )% |
N/M = Not meaningful
| |
| (1) | Pro forma amounts give effect to the Acquisition and completed financing as if they had occurred at the beginning of fiscal year 2016 and have been updated to reflect the change in segment reporting of the Puerto Rico business, which effective January 1, 2017, is reported in the MCI segment. See "Unaudited Pro Forma Financial Information," below for details of pro forma adjustments. |
| |
(2) | Historical volumes have been recast to reflect the impacts of aligning policies on reporting financial volumes as a result of the Acquisition. See "Worldwide Brand Volume" above for further details. |
| |
(3) | On a reported basis, reflectsIncludes gross inter-segment sales, purchases, and volumes, which are eliminated in the consolidated totals. |
| |
(4)(2) | See Part I—Item 1. Financial Statements, Note 6, "Special Items" of the Notes for detail of special items. |
Significant events
In order to increase overall operating efficiency, during the first quarter of 2018, the U.S. segment announced plans to close the Colfax, California cidery with the planned closure effective December 2018. Cider production will move to the 10th Street Brewery in Milwaukee, Wisconsin. Total special charges associated with the cidery closure are expected to be
The following represents our proportionate shareapproximately $6 million, consisting primarily of MillerCoors'accelerated depreciation in excess of normal depreciation and will be recorded through completion of the closure.
Volume and net income reported under the equity methodsales
Brand volume for the three months ended March 31, 2016,2018, declined 3.8% compared to prior year, driven by overall industry softness. STWs, excluding contract brewing volume, decreased 6.7% in the three months ended March 31, 2018, reflective of lower-than-planned distributor inventory levels which was compounded by the launch of our new ordering system at the Golden, Colorado brewery that took longer to the Acquisition:ramp up than anticipated.
|
| | | |
| | Three Months Ended |
| | March 31, 2016 |
| | (in millions, except percentages) |
| Income (loss) from continuing operations before income taxes | $ | 337.6 |
|
| Income tax expense | 0.5 |
|
| Net income (loss) attributable to noncontrolling interest | (2.8 | ) |
| Net income attributable to MillerCoors | $ | 335.3 |
|
| MCBC's economic interest | 42 | % |
| MCBC's proportionate share of MillerCoors' net income | $ | 140.8 |
|
Amortization of the difference between MCBC's contributed cost basis and proportionate share of the underlying equity in net assets of MillerCoors(1) | 1.1 |
|
Share-based compensation adjustment(1) | 0.5 |
|
| Equity income in MillerCoors | $ | 142.4 |
|
| |
(1) | See Part I—Item 1. Financial Statements, Note 4, "Acquisition and Investments" of the Notes for a detailed discussion of these equity method adjustments prior to the Acquisition. |
The discussion below highlights the MillerCoors results of operationsNet sales per hectoliter on a brand volume basis for the three months ended March 31, 2017, versus the three months ended March 31, 2016, on a reported and pro forma basis, where applicable.
Significant events
On October 11, 2016, we completed the Acquisition and as a result, MCBC now owns 100% of the outstanding equity and voting interests of MillerCoors. Therefore, beginning October 11, 2016, MillerCoors' results of operations have been prospectively consolidated into MCBC’s consolidated financial statements and included in the U.S. segment. See Part I—Item 1. Financial Statements, Note 4, "Acquisition and Investments" of the Notes for further details. Additionally, effective January 1, 2017, the results of the MillerCoors Puerto Rico business, which were previously included as part of the U.S. segment, are now reported within the MCI segment. Note, we have only presented unaudited pro forma financial information for the consolidated entity and the U.S. segment.
During the third quarter of 2015, MillerCoors announced plans to close its brewery in Eden, North Carolina, in an effort to optimize the brewery footprint and streamline operations for greater efficiencies. Products produced in Eden were transitioned to other breweries in the MillerCoors network and the Eden brewery is now closed. Total special charges associated with the Eden closure are expected to be up to approximately $180 million, of which $166.6 million have been incurred from the decision to close through March 31, 2017, consisting primarily of accelerated depreciation. However, this estimate is uncertain, and actual results could differ from these estimates due to uncertainty regarding the ultimate net cost associated with the disposition of assets, contract termination costs, and other costs associated with the closure.
Volume and net sales
Domestic STRs for the three months ended March 31, 2017, declined 2.0%,2018, increased 1.1% compared to prior year driven by lower volume in the premium light and below premium segments. Domestic STWs decreased 4.0% in the three months ended March 31, 2017.
Domestic net sales per hectoliter increased 0.3% compared to prior year reported net sales and 0.2% compared to prior year pro forma net sales for the three months ended March 31, 2017, due to favorable net pricing, partially offset by the impacts resulting from the adoption of the new accounting pronouncement related to revenue recognition and negative sales mix. Total netNet sales per hectoliter including non-owned brands, contract brewing and company-owned distributor sales,on a reported basis increased 0.1% compared to prior year reported figures and 0.4% compared to prior year pro forma figures for the three months ended March 31, 2017,0.9% compared to prior year.
Cost of goods sold
Cost of goods sold per hectoliter increased 3.3% compared to prior year reported figures and 1.7% compared to prior year pro forma figures for the three months ended March 31, 2017,2018, increased 3.5% compared to prior year driven by higher input costs and volume deleverage as well as aluminum inflation and higher freight and fuel costs, partially offset by supply chaincost savings. Additionally, for the three months ended March 31, 2018, and March 31, 2017, we recorded $1.1 million and $0.5 million, respectively, of integration costs savings.
related to the Acquisition within cost of goods sold.
Marketing, general and administrative expenses
Marketing, general and administrative expenses decreased 1.2% compared to prior year reported marketing, general and administrative expenses and decreased 3.7% compared to prior year pro forma marketing, general and administrative expenses, for the three months ended March 31, 2017,2018, decreased 3.1% compared to prior year due to lower brand investmentsspending optimization and lower employee-related expenses.efficiencies. Marketing, general and administrative expenses also include integration costs related to the Acquisition of $4.0 million for the three months ended March 31, 2017.
Canada Segment
| | | | Three Months Ended | Three Months Ended |
| | March 31, 2017 | | March 31, 2016 | | % change | March 31, 2018 | | March 31, 2017 | | % change |
| | (In millions, except percentages) | (In millions, except percentages) |
Volume in hectoliters(1)(2) | 1.793 |
| | 1.774 |
| | 1.1 | % | |
Financial volume in hectoliters(1) | | 1.707 |
| | 1.793 |
| | (4.8 | )% |
Sales(2)(1) | $ | 377.4 |
| | $ | 353.8 |
| | 6.7 | % | $ | 374.9 |
| | $ | 377.4 |
| | (0.7 | )% |
| Excise taxes | (86.3 | ) | | (85.8 | ) | | 0.6 | % | (91.1 | ) | | (86.3 | ) | | 5.6 | % |
Net sales(2)(1) | 291.1 |
| | 268.0 |
| | 8.6 | % | 283.8 |
| | 291.1 |
| | (2.5 | )% |
Cost of goods sold(2)(1) | (181.9 | ) | | (157.2 | ) | | 15.7 | % | (187.4 | ) | | (181.1 | ) | | 3.5 | % |
| Gross profit | 109.2 |
| | 110.8 |
| | (1.4 | )% | 96.4 |
| | 110.0 |
| | (12.4 | )% |
| Marketing, general and administrative expenses | (96.0 | ) | | (76.7 | ) | | 25.2 | % | (81.0 | ) | | (96.1 | ) | | (15.7 | )% |
Special items, net(3)(2) | 1.7 |
| | 109.3 |
| | (98.4 | )% | (5.6 | ) | | (1.2 | ) | | N/M |
|
| Operating income (loss) | 14.9 |
| | 143.4 |
| | (89.6 | )% | 9.8 |
| | 12.7 |
| | (22.8 | )% |
Other income (expense), net(4) | 8.2 |
| | 3.2 |
| | 156.3 | % | (0.7 | ) | | 8.2 |
| | (108.5 | )% |
| Income (loss) from continuing operations before income taxes | $ | 23.1 |
| | $ | 146.6 |
| | (84.2 | )% | |
| Income (loss) before income taxes | | $ | 9.1 |
| | $ | 20.9 |
| | (56.5 | )% |
N/M = Not meaningful
| |
| (1) | Historical volumes have been recast to reflect the impacts of aligning policies on reporting financial volumes as a result of the Acquisition. See "Worldwide Brand Volume" above for further details. |
| |
(2) | ReflectsIncludes gross inter-segment sales, purchases and volumes, which are eliminated in the consolidated totals. |
| |
(3)(2) | See Part I-Item 1. Financial Statements, Note 6, "Special Items" of the Notes for detail of special items. |
| |
(4) | See Part I-Item 1. Financial Statements, Note 7, "Other Income and Expense" of the Notes for detail of other income (expense), net. |
Significant events
As a result of the Acquisition, the Miller brands were added to our Canada segment's portfolio beginning October 11, 2016. Additionally, as part of our ongoing assessment of our Canadian supply chain network, we completed the sale of our Vancouver brewery on March 31, 2016. In conjunction with the sale of the brewery, we agreed to leaseback the existing property to continue operations on an uninterrupted basis while the new brewery is being constructed. We also expect to incur significant capital expenditures associated with the construction of the new brewery, most of which we expect to be funded with the proceeds from the sale of the Vancouver brewery. We expect to incur additional charges through final closure of the brewery, including estimated accelerated depreciation charges of approximately CAD 11 million. We also expect the ongoing costs of leasing the existing facility through the estimated closure date to be approximately CAD 5 million per annum, which are not included within special items.
We completed our required annual goodwill and indefinite-lived intangible impairment testing as of October 1, 2016, and recorded an aggregate impairment charge to the Molson core brand intangible asset within special items during the fourth quarter of 2016 and subsequently reclassified the brands from indefinite to definite-lived resulting in increased amortization expense of intangible assets for the three months ended March 31, 2017 compared to the prior year.
Foreign currency impact on results
During the three months ended March 31, 2017,2018, the CAD appreciated versus the USD on an average basis, resulting in an increasea decrease of $0.7$0.3 million to our USD earnings before income taxes. Included in these amounts are both translational and transactional impacts of changes in foreign exchange rates. The impact of transaction gains and losses is recorded within other income (expense) in our unaudited condensed consolidated statements of operations.
Volume and net sales
Our Canada brand volume increased 0.7% during the three months ended March 31, 2017, versus prior year, primarily due to the addition of the Miller brands as a result of the Acquisition, and growth in Coors Banquet.
Our net sales per hectoliter increased 3.9% in local currency during the three months ended March 31, 2017, compared to prior year, driven by positive pricing and brand mix, including growth in our import brands.
Cost of goods sold
Cost of goods sold per hectoliter in local currency increased 10.7% during the three months ended March 31, 2017, versus prior year, due to mix shifts to higher-cost import brands, higher input cost inflation, unfavorable foreign currency movements and cycling a temporary reduction in distribution costs in the prior year, partially offset by ongoing cost savings initiatives.
Marketing, general and administrative expenses
Our marketing, general and administrative expenses increased 21.2% in local currency for the three months ended March 31, 2017, compared to prior year, driven by higher brand amortization expense related to the reclassification of the Molson core brand asset to definite-lived intangible assets and commercial investments.
Europe Segment
|
| | | | | | | | | | |
| | Three Months Ended |
| | March 31, 2017 | | March 31, 2016 | | % change |
| | (In millions, except percentages) |
Volume in hectoliters(1)(2) | 4.359 |
| | 4.261 |
| | 2.3 | % |
Sales(1) | $ | 514.4 |
| | $ | 560.9 |
| | (8.3 | )% |
| Excise taxes | (132.8 | ) | | (202.2 | ) | | (34.3 | )% |
Net sales(3) | 381.6 |
| | 358.7 |
| | 6.4 | % |
| Cost of goods sold | (224.1 | ) | | (239.9 | ) | | (6.6 | )% |
| Gross profit | 157.5 |
| | 118.8 |
| | 32.6 | % |
| Marketing, general and administrative expenses | (125.2 | ) | | (119.3 | ) | | 4.9 | % |
Special items, net(4) | (2.6 | ) | | (0.7 | ) | | N/M |
|
| Operating income (loss) | 29.7 |
| | (1.2 | ) | | N/M |
|
Interest income(5) | 1.0 |
| | 0.8 |
| | 25.0 | % |
| Other income (expense), net | (0.1 | ) | | (0.8 | ) | | (87.5 | )% |
| Income (loss) from continuing operations before income taxes | $ | 30.6 |
| | $ | (1.2 | ) | | N/M |
|
N/M = Not meaningful
| |
(1) | Historical volumes have been recast to reflect the impacts of aligning policies on reporting financial volumes as a result of the Acquisition. See "Worldwide Brand Volume" above for further details. |
| |
(2) | Excludes royalty volume of 0.325 million hectoliters and 0.036 million hectoliters for the three months ended March 31, 2017, and March 31, 2016, respectively. |
| |
(3) | Reflects gross inter-segment sales and volumes which are eliminated in the consolidated totals. |
| |
(4) | See Part I-Item 1. Financial Statements, Note 6, "Special Items" of the Notes for detail of special items. |
| |
(5) | Interest income is earned on trade loans to on-premise customers exclusively in the U.K. and is typically driven by note receivable balances outstanding from period to period. |
Significant events
As a result of the Acquisition, the Miller brands were added to our Europe segment's portfolio beginning October 11, 2016, and effective January 1, 2017, European markets including Sweden, Spain, Germany, Ukraine and Russia, which were previously reported under our MCI segment, are reported within our Europe segment.
As part of our continued strategic review of our European supply chain network, during the fourth quarter of 2015, we announced the planned closure of the Burton South brewery in the U.K., in which we will consolidate production within our recently modernized Burton North brewery. The closure is expected to be completed by the end of 2017. We expect to incur additional future accelerated depreciation in excess of our normal depreciation of approximately GBP 3 million related to the Burton South brewery through the third quarter of 2017. We do not expect to incur future accelerated depreciation on the Alton and Plovdiv breweries. We may recognize other charges or benefits related to these brewery closures, which cannot currently be estimated and will be recorded within special items.
Each year since 2014, we have received assessments from a local country regulatory authority related to indirect tax calculations in our Europe operations. During the fourth quarter of 2016, following discussions with the regulatory authority and consideration of existing facts and circumstances at that time, we concluded that a portion of the estimated range of loss was deemed probable. As a result, we recorded a charge of approximately $50 million, based on foreign exchange rates at December 31, 2016, within the excise taxes line item on the consolidated statement of operations for the year ended December 31, 2016. During the first quarter of 2017, a local jurisdictional court heard evidence in this matter and subsequently ruled in our favor in April 2017. Based on this favorable ruling, we released this provision in the first quarter of 2017 as we no longer deem this loss probable. This resulted in a benefit of approximately $50 million, based on foreign exchange rates at March 31, 2017, recorded within the excise taxes line item on the unaudited consolidated statement of operations for the quarter ended March, 31, 2017. While this determination to release the contingency loss is based on the local court ruling in April 2017, the ultimate outcome of the assessments remains uncertain at this time as the ruling remains subject to appeal.
The indirect tax calculation methodology challenged in the assessments continues to be applied by us, and, as a result of the fact that the decision of the local court may be appealed, the related range of loss is expected to increase until ultimately resolved. If the assessments, as issued by the regulatory authority, are ultimately upheld or if the relevant statutory provisions or interpretations at issue are changed, it could have a material adverse effect on our European results of operations and operating income. Such an adverse ultimate determination or change also could materially affect our results of operations, including excise taxes, net sales and resulting impacts to other financial statement line items.
Recently, the largest food and retail company in Croatia, Agrokor, announced it is facing significant financial difficulties that have raised doubt about the collectibility of certain of our outstanding receivable with its direct subsidiaries. These subsidiaries are customers of ours within the Europe segment and, therefore, we are closely monitoring the situation. Specifically, Agrokor has entered into active discussions with local regulators, financial institutions and other creditors to stabilize its business and resume payments to suppliers and others as soon as possible. Our exposure related to Agrokor as of March 31, 2017, was approximately EUR 18 million. Based on the facts and circumstances known at this time, we have recorded a provision for an estimate of uncollectible receivables of approximately $11 million.
Foreign currency impact on results
Our Europe segment operates in numerous countries within Europe, and each country's operations utilize distinct currencies. Foreign currency movements unfavorably impacted our Europe USD income from continuing operations before income taxes by $8.8 million for the three months ended March 31, 2017. Included in these amounts are both translational and transactional impacts of changes in foreign exchange rates. The impact of transactional gains and losses is recorded within other income (expense) in our unaudited condensed consolidated statements of operations. See "Foreign Exchange" section below for details related to the volatility of the GBP following the U.K.'s vote to leave the EU.
Volume and net sales
Our Europe brand volume increased 9.6% for the three months ended March 31, 2017, compared to prior year, primarily due to the change in segment reporting of European markets, which were previously presented within our MCI segment, and are now reported in the Europe segment, the addition of the Miller brands and strong growth by Coors Light and Staropramen.
Net sales per hectoliter increased in local currency by 16.3% in the three months ended March 31, 2017, compared to prior year, primarily driven by the release of the approximate $50 million indirect tax provision discussed above. The increase was also driven by favorable mix, partially offset by unfavorable net pricing.
Cost of goods sold
Cost of goods sold per hectoliter increased 1.7% in local currency in the three months ended March 31, 2017, versus prior year, driven by mix shift to higher-cost brands and geographies partially offset by higher net pension benefits this year.
Marketing, general and administrative expenses
Marketing, general and administrative expenses increased 14.1% for the three months ended March 31, 2017, in local currency compared to prior year, driven by a provision recorded for an estimate of uncollectible receivables as noted above, as well as higher brand investments and the addition of the Miller brand portfolio.
Molson Coors International Segment
|
| | | | | | | | | | |
| | Three Months Ended |
| | March 31, 2017 | | March 31, 2016 | | % change |
| | (In millions, except percentages) |
Volume in hectoliters(1)(2) | 0.528 |
| | 0.305 |
| | 73.1 | % |
| Sales | $ | 66.3 |
| | $ | 36.6 |
| | 81.1 | % |
| Excise taxes | (4.5 | ) | | (5.6 | ) | | (19.6 | )% |
| Net sales | 61.8 |
| | 31.0 |
| | 99.4 | % |
Cost of goods sold(3) | (39.0 | ) | | (20.6 | ) | | 89.3 | % |
| Gross profit | 22.8 |
| | 10.4 |
| | 119.2 | % |
| Marketing, general and administrative expenses | (21.0 | ) | | (12.7 | ) | | 65.4 | % |
Special items, net(4) | (0.3 | ) | | — |
| | N/M |
|
| Operating income (loss) | 1.5 |
| | (2.3 | ) | | N/M |
|
| Other income (expense), net | — |
| | — |
| | — | % |
| Income (loss) from continuing operations before income taxes | $ | 1.5 |
| | $ | (2.3 | ) |
| N/M |
|
N/M = Not meaningful
| |
(1) | Historical volumes have been recast to reflect the impacts of aligning policies on reporting financial volumes as a result of the Acquisition. See "Worldwide Brand Volume" above for further details. |
| |
(2) | Excludes royalty volume of 0.473 million hectoliters and 0.301 million hectoliters for the three months ended March 31, 2017, and March 31, 2016, respectively. |
| |
(3) | Reflects gross inter-segment purchases which are eliminated in the consolidated totals. |
| |
(4) | See Part I-Item 1. Financial Statements, Note 6, "Special Items" of the Notes for detail of special items. |
Significant events
As a result of the Acquisition, the Miller brands were added to MCI's portfolio beginning October 11, 2016. Additionally, as a result of the Acquisition, effective January 1, 2017, European markets including Sweden, Spain, Germany, Ukraine and Russia, which were previously reported as part of our MCI segment, are reported within our Europe segment while the results of the MillerCoors Puerto Rico business, which were previously included as part of the U.S. segment, are reported within the MCI segment.
Our business in India is highly regulated resulting in frequent alcohol policy changes. As a result of total alcohol prohibition in Bihar, India, implemented during the second quarter of 2016, our Molson Coors Cobra India business is currently not operating and is idled pending any future change in law or regulation. This ban does not impact our Mount Shivalik business operating outside of Bihar, India. We continue to monitor legal proceedings impacting the regulatory environment as it relates to our ability to resume operations in the state.
Foreign currency impact on results
Our MCI segment operates in numerous countries around the world, and each country's operations utilize distinct currencies. Foreign currency movements favorably impacted MCI's USD loss before income taxes by $0.3 million for the three months ended March 31, 2017. Included in this amount are both translational and transactional impacts of changes in foreign exchange rates. The impact of transactional foreign currency gains and losses is recorded within other income (expense) in our unaudited condensed consolidated statements of operations.
Volume and net sales
Our MCICanada brand volume decreased 3.3% during the three months ended March 31, 2018, versus prior year, as a result of weak industry performance particularly in provinces in the West and high inventory levels in Quebec at the start of the year.
Our net sales per hectoliter on a brand volume basis decreased 2.9% in local currency during the three months ended March 31, 2018, compared to prior year, driven by the impacts resulting from the adoption of the new accounting pronouncement related to revenue recognition, which requires certain cash payments to customers to now be recognized as a reduction of revenue versus marketing, general and administrative expense. Net sales per hectoliter on a reported basis decreased 2.0% in local currency compared to prior year.
Cost of goods sold
Cost of goods sold per hectoliter in local currency increased 3.9% during the three months ended March 31, 2018, versus prior year, due to higher distribution costs, impacts of mix shift and volume deleverage, partially offset by a reduction in brewery costs.
Marketing, general and administrative expenses
Our marketing, general and administrative expenses decreased 19.1% in local currency for the three months ended March 31, 2018, compared to prior year, primarily driven by impacts resulting from the adoption of the new accounting pronouncement related to revenue recognition as further discussed above, lower brand investments and amortization expense.
Other income (expense), net
During the first quarter of 2017, we received payment and recorded a gain of CAD 10.6 million, or $8.1 million, resulting from a purchase price adjustment related to the historical sale of Molson Inc.’s ownership interest in the Montreal Canadiens, which is considered an affiliate of MCBC.
Europe Segment
|
| | | | | | | | | | |
| | Three Months Ended |
| | March 31, 2018 | | March 31, 2017 | | % change |
| | (In millions, except percentages) |
Financial volume in hectoliters(1)(2) | 4.404 |
| | 4.359 |
| | 1.0 | % |
Sales(2) | $ | 598.5 |
| | $ | 514.4 |
| | 16.3 | % |
| Excise taxes | (224.2 | ) | | (132.8 | ) | | 68.8 | % |
Net sales(2) | 374.3 |
| | 381.6 |
| | (1.9 | )% |
| Cost of goods sold | (267.7 | ) | | (226.1 | ) | | 18.4 | % |
| Gross profit | 106.6 |
| | 155.5 |
| | (31.4 | )% |
| Marketing, general and administrative expenses | (130.4 | ) | | (126.8 | ) | | 2.8 | % |
Special items, net(3) | (5.1 | ) | | (2.6 | ) | | 96.2 | % |
| Operating income (loss) | (28.9 | ) | | 26.1 |
| | N/M |
|
| Interest income (expense), net | (0.7 | ) | | 1.0 |
| | (170.0 | )% |
| Other income (expense), net | (0.3 | ) | | (0.1 | ) | | 200.0 | % |
| Income (loss) before income taxes | $ | (29.9 | ) | | $ | 27.0 |
| | N/M |
|
N/M = Not meaningful
| |
| (1) | Excludes royalty volume of 0.306 million hectoliters and 0.325 million hectoliters for the three months ended March 31, 2018, and March 31, 2017, respectively. |
| |
| (2) | Includes gross inter-segment sales and volumes, which are eliminated in the consolidated totals. |
| |
| (3) | See Part I-Item 1. Financial Statements, Note 6, "Special Items" for detail of special items. |
Significant events
In January of 2018, the Europe segment completed the acquisition of Aspall Cyder Limited, an established premium cider business in the U.K.
During the three months ended March 31, 2017, we recorded a provision for an estimate of uncollectible receivables of approximately $11 million related to Agrokor, a large customer in Croatia. The proceedings related to this matter have been formally extended to, and are currently expected to be resolved by, July 2018. During the first quarter of 2017, we released an indirect tax loss contingency which was initially recorded in the fourth quarter of 2016, for a benefit of approximately $50 million.
Foreign currency impact on results
Our Europe segment operates in numerous countries within Europe and each country's operations utilize distinct currencies. Foreign currency movements unfavorably impacted our Europe USD loss before income taxes by $4.6 million for the three months ended March 31, 2018. Included in this amount are both translational and transactional impacts of changes in foreign exchange rates. The impact of transactional foreign currency gains and losses is recorded within other income (expense) in our unaudited condensed consolidated statements of operations.
Volume and net sales
Our Europe brand volume increased slightly for the three months ended March 31, 2018, compared to prior year, primarily driven by 65.2%growth from our above premium brands.
Net sales per hectoliter on a brand volume basis decreased in local currency by 18.3% for the three months ended March 31, 2018, compared to prior year, due to cycling the release of the approximate $50 million indirect tax provision, adopting recently revised industry guidelines for calculating excise tax payments in one market and increased investment in our first choice for customer agenda, partially offset by positive sales mix. Net sales per hectoliter on a reported basis decreased 14.7% in local currency compared to prior year.
Cost of goods sold
Cost of goods sold per hectoliter increased 2.9% in local currency in the three months ended March 31, 2017, compared to2018, versus prior year, primarily driven by the change in segment reporting of the Puerto Rico business from the U.S. segment, the addition of the Miller mix shift to higher-cost brands and geographies, input inflation and logistics costs.
Marketing, general and administrative expenses
Coors Light growth primarilyMarketing, general and administrative expenses decreased 10.4% in Latin America, partially offset by the change in segment reporting of European markets previously reported in our MCI segment which are now reported in our Europe segment, all related to the Acquisition as noted above.
Net sales per hectoliter increased 15.2%local currency in the three months ended March 31, 2018, compared to prior year, due to cycling the provision for an estimate of uncollectible receivables recorded in the first quarter of 2017 and adoption of the new accounting pronouncement related to revenue recognition, partially offset by the addition of Aspall brand investments and related overhead costs this year.
International Segment
|
| | | | | | | | | | |
| | Three Months Ended |
| | March 31, 2018 | | March 31, 2017 | | % change |
| | (In millions, except percentages) |
Financial volume in hectoliters(1) | 0.520 |
| | 0.528 |
| | (1.5 | )% |
| Sales | $ | 64.8 |
| | $ | 66.3 |
| | (2.3 | )% |
| Excise taxes | (7.3 | ) | | (4.5 | ) | | 62.2 | % |
| Net sales | 57.5 |
| | 61.8 |
| | (7.0 | )% |
Cost of goods sold(2) | (37.8 | ) | | (39.0 | ) | | (3.1 | )% |
| Gross profit | 19.7 |
| | 22.8 |
| | (13.6 | )% |
| Marketing, general and administrative expenses | (15.1 | ) | | (21.0 | ) | | (28.1 | )% |
Special items, net(3) | (1.0 | ) | | (0.3 | ) | | N/M |
|
| Operating income (loss) | 3.6 |
| | 1.5 |
| | 140.0 | % |
| Other income (expense), net | 0.1 |
| | — |
| | N/M |
|
| Income (loss) before income taxes | $ | 3.7 |
| | $ | 1.5 |
|
| 146.7 | % |
N/M = Not meaningful
| |
| (1) | Excludes royalty volume of 0.410 million hectoliters and 0.473 million hectoliters for the three months ended March 31, 2018, and March 31, 2017, respectively. |
| |
| (2) | Includes gross inter-segment purchases, which are eliminated in the consolidated totals. |
| |
| (3) | See Part I-Item 1. Financial Statements, Note 6, "Special Items" for detail of special items. |
Foreign currency impact on results
Our International segment operates in numerous countries around the world and each country's operations utilize distinct currencies. Foreign currency movements did not impact our International USD income before income taxes for the three months ended March 31, 2018. Included in this amount are both translational and transactional impacts of changes in foreign exchange rates. The impact of transactional foreign currency gains and losses is recorded within other income (expense) in our unaudited condensed consolidated statements of operations.
Volume and net sales
Our International brand volume decreased by 7.1% in the three months ended March 31, 2018, compared to prior year, primarily driven by the loss of the Modelo contract in Japan in the second quarter of 2017, as well as lower volumes in Mexico due to higher net pricing, partially offset by organic volume growth in many of our focus markets.
Net sales per hectoliter on a brand volume basis remained flat in the three months ended March 31, 2018, compared to prior year, driven by unfavorable sales mix, changes and higheroffset by positive net pricing. Net sales per hectoliter on a reported basis decreased 5.5% compared to prior year for the three months ended March 31, 2018, driven by unfavorable sales mix, partially offset by positive net pricing.
Cost of goods sold
Cost of goods sold per hectoliter increased 9.4%decreased 1.6% in the three months ended March 31, 2017,2018, compared to prior year, primarily driven by sales mix changes.
Marketing, general and administrative expenses
Marketing, general and administrative expenses increased 65.4%decreased 28.1% in the three months ended March 31, 2017,2018, compared to prior year, primarily due to increased brandlower marketing investments along with overhead and integration costs$2.0 million of settlement proceeds related to the acquisition of the Miller global brands.our Colombia business.
Corporate
| | | | Three Months Ended | Three Months Ended |
| | March 31, 2017 | | March 31, 2016 | | % change | March 31, 2018 | | March 31, 2017 | | % change |
| | (In millions, except percentages) | (In millions, except percentages) |
| Volume in hectoliters | — |
| | — |
| | — | % | |
| Financial volume in hectoliters | | — |
| | — |
| | — | % |
| Sales | $ | 0.3 |
| | $ | 0.4 |
| | (25.0 | )% | $ | 0.2 |
| | $ | 0.3 |
| | (33.3 | )% |
| Excise taxes | — |
| | — |
| | — | % | — |
| | — |
| | — | % |
| Net sales | 0.3 |
| | 0.4 |
| | (25.0 | )% | 0.2 |
| | 0.3 |
| | (33.3 | )% |
| Cost of goods sold | 63.0 |
| | 2.8 |
| | N/M |
| (84.8 | ) | | 63.0 |
| | N/M |
|
| Gross profit | 63.3 |
| | 3.2 |
| | N/M |
| (84.6 | ) | | 63.3 |
| | N/M |
|
| Marketing, general and administrative expenses | (55.7 | ) | | (42.2 | ) | | 32.0 | % | (61.5 | ) | | (55.7 | ) | | 10.4 | % |
Special items, net(1) | (0.1 | ) | | — |
| | N/M |
| 328.0 |
| | (0.1 | ) | | N/M |
|
| Operating income (loss) | 7.5 |
| | (39.0 | ) | | N/M |
| 181.9 |
| | 7.5 |
| | N/M |
|
| Interest expense, net | (97.6 | ) | | (48.1 | ) | | 102.9 | % | (81.3 | ) | | (97.6 | ) | | (16.7 | )% |
| Other pension and postretirement benefits (costs), net | | 10.0 |
| | 13.3 |
| | (24.8 | )% |
| Other income (expense), net | (7.7 | ) | | (17.7 | ) | | (56.5 | )% | 2.2 |
| | (8.3 | ) | | (126.5 | )% |
| Income (loss) from continuing operations before income taxes | $ | (97.8 | ) | | $ | (104.8 | ) | | (6.7 | )% | |
| Income (loss) before income taxes | | $ | 112.8 |
| | $ | (85.1 | ) | | N/M |
|
N/M = Not meaningful
| |
| (1) | See Part I-Item 1. Financial Statements, Note 6, "Special Items" of the Notes for detail of special items. |
Significant events
In connection with the Acquisition, we have incurred, and will continue to incur, various transaction and integration costs as further discussed below. See Part I—Item 1. Financial Statements, Note 4, "Acquisition and Investments" of the Notes for further details.
Cost of goods sold
The unrealized changes in fair value on our commodity swaps, which are economic hedges, are recorded as cost of goods sold within our Corporate business activities. As the exposure we are managing is realized, we reclassify the gain or loss to the segment in which the underlying exposure resides, allowing our segments to realize the economic effects of the derivative
without the resulting unrealized mark-to-market volatility. Lower commodity market prices relative to our hedged positions on our commodity swaps drove the total unrealized mark-to-market loss of $84.7 million recognized in cost of goods sold for the three months ended March 31, 2018, as compared to the unrealized mark-to-market gain of $63.1 million recognized in cost of goods sold for the three months ended March 31, 2017.
Marketing, general and administrative expenses
Marketing, general and administrative expenses increased by 32.0%10.4% during the three months ended March 31, 2017,2018, compared to prior year, primarily due to incremental investment behind global business capabilities including information technology investments, partially offset by higher compensation expenses.
integration costs related to the Acquisition recognized in the prior year. Specifically, we recorded $8.8 million and $13.4 million within marketing, general and administrative expense related to the Acquisition for the three months ended March 31, 2018, and March 31, 2017, respectively.
Interest expense, net
Net interest expense increaseddecreased for the three months ended March 31, 2017,2018, compared to the prior year, primarily due to the incremental interest expense as well as other net interest costs associated with the Acquisition. Net interest expense for the three months ended March 31, 2016, includes an unrealized loss on our swaptions of $21.1 million and other net interest costs associated with the Acquisition.driven by debt repayments. See Part I—Item 1. Financial Statements, Note 14,12, "Derivative Instruments and Hedging Activities" and Note 11,9, "Debt" of the Notes for further details.
Other income (expense), net
The decrease in other income (expense), net for the three months ended March 31, 2017,2018, compared to prior year, is primarily driven by financing costs incurred on our bridge loan of approximately $18.4 million during the three months ended March 31, 2016. This decrease during the three months ended March 31, 2017, is partially offset by losses of $8.3 million on foreign currency forwards which were entered into and settled in the first quarter of 2017 in connection with the issuance of the 2017 EUR Notes as defined below. See Part I—Item 1. Financial Statements,in Note 7, "Other Income and Expense"12 of the Notes for further discussion of other income (expense) amounts.included in our Annual Report.
Liquidity and Capital Resources
Our primary sources of liquidity include cash provided by operating activities and access to external capital. We believe that cash flows from operations and cash provided by short-term and long-term borrowings, when necessary, will be more than adequate to meet our ongoing operating requirements, scheduled principal and interest payments on debt, anticipated dividend payments and capital expenditures for the twelve months subsequent to the date of the issuance of this quarterly report, and our long-term liquidity requirements.
A significant portion of our trade receivables are concentrated in Europe. While these receivables are not concentrated in any specific customer and our allowance on these receivables factors in collectibility, we may encounter difficulties in our ability to collect due to the impact to our customers of any further economic downturn within Europe. As recently announced, the largest food and retailWe continue to have exposure to Agrokor, a company in Croatia, Agrokor, is facing significant financial difficulties that have raised doubt about the collectibility of certain of our outstanding receivables with its direct subsidiaries. These subsidiaries are customers of ours within the Europe segment and, therefore, we are closely monitoring the situation. Specifically, Agrokor haswho entered into active discussions with local regulators, financial institutions and other creditors to stabilize its business and resume payments to suppliers and others as soon as possible. Our exposuredifficulty in 2017. The proceedings related to Agrokor as of March 31, 2017, was approximately EUR 18 million. Based on the factsthis matter have been formally extended to, and circumstances known at this time, we have recorded a provision for an estimate of uncollectible receivables of approximately $11 million.are currently expected to be resolved by, July 2018.
A significant portion of our cash flows from operating activities are generated outside the U.S. in currencies other than USD. As of March 31, 2017,2018, approximately 76%80% of our cash and cash equivalents were located outside the U.S., largely denominated in foreign currencies. Most of the amounts held outside of the U.S. could be repatriated to the U.S. but under current law would be subject to U.S. federal and state income taxes, less applicable foreign tax credits. We accrue for U.S. federal and state tax consequences on the earnings of our foreign subsidiaries upon repatriation. When the earnings are considered indefinitely reinvested outside of the U.S., we do not accrue for U.S. federal and statetaxes. However, we will continue to assess the impact of the 2017 Tax Act on the tax consequences.consequences of future repatriations. We utilize a variety of tax planning and financing strategies in an effort to ensure that our worldwide cash is available in the locations in which it is needed. We periodically review and evaluate these strategies, including external committed and non-committed credit agreements accessible by MCBC and each of our operating subsidiaries. These financing arrangements, along with the cash generated from the operations of our U.S. segment, are sufficient to fund our current cash needs in the U.S.
Net Working Capital
As of March 31, 2017, December 31, 2016, and March 31, 2016, we had debt-free net working capital of approximately $73.5 million, negative debt-free net working capital of $303.1 million and debt-free net working capital of approximately $2.6 billion, respectively. Short-term borrowings and the current portion of long-term debt are excluded from our definition of debt-free net working capital, as they are not reflective of the ongoing operational requirements of the business. The levels of working capital required to run our business fluctuate with the seasonality in our business. Our working capital is also sensitive to foreign exchange rates, as a significant portion of current assets and current liabilities are denominated in either CAD or our European operating currencies such as, but not limited to, GBP, Euro, Czech Koruna, Croatian Kuna, Serbian Dinar, New Romanian Leu, Bulgarian Lev and Hungarian Forint, while financial results are reported in USD. While we continue to work towards improving our working capital, we may be unable to maintain these working capital benefits in the long term. Below is a table outlining our current and historical net working capital levels:
|
| | | | | | | | | | | |
| | As of |
| | March 31, 2017 | | December 31, 2016 | | March 31, 2016 |
| | (In millions) |
| Current assets | $ | 2,279.2 |
| | $ | 2,169.6 |
| | $ | 3,762.8 |
|
| Less: Current liabilities | (3,048.7 | ) | | (3,157.5 | ) | | (1,221.9 | ) |
| Add: Current portion of long-term debt and short-term borrowings | 843.0 |
| | 684.8 |
| | 63.5 |
|
| Net working capital | $ | 73.5 |
| | $ | (303.1 | ) | | $ | 2,604.4 |
|
The increase in net working capital from December 31, 2016, to March 31, 2017, is primarily related to an overall increase in accounts receivables due to higher sales and increased inventory due to seasonality combined with an overall decrease in accounts payable and other current liabilities due to timing of purchases. The increase in net working capital from December 31, 2016, to March 31, 2017, was partially offset by a decrease in cash balances driven by interest payments on our long-term debt. The decrease in net working capital from March 31, 2016, to March 31, 2017, is primarily related to an overall increase in current assets and accounts payable and other liabilities due to the consolidation of MillerCoors' current assets and liabilities offset by a decrease in cash balances resulting from the funding of the Acquisition.
Cash Flows and Use of Cash
Our business generates positive operating cash flow each year, and our debt maturities are of a longer-term nature. However, our liquidity could be impacted significantly by the risk factors we described in Part I—Item 1A. "Risk Factors" in our Annual Report.
Cash Flows from Operating Activities
Net cash provided by operating activities was approximately $315.2 million for the three months ended March 31, 2018, compared to net cash used in operating activities wasof $118.3 million for the three months ended March 31, 2017, compared to $88.3 million for the three months ended March 31, 2016.2017. This increase in net cash usedprovided by operating activities of $30.0$433.5 million is primarily related to higher cash paid for interestnet income largely due to the proceeds received of $328.0 million related to the Adjustment Amount as defined and higherfurther discussed in Part I—Item 1. Financial Statements, Note 6, "Special Items", working capital improvements and lower pension contributions as a result of the Acquisition, partially offset by lower cash paid for taxes.and interest.
Cash Flows from Investing Activities
Net cash used in investing activities of $132.1$252.1 million for the three months ended March 31, 2017, decreased2018, increased by $73.4$120.0 million compared to the three months ended March 31, 2016,2017, driven primarily by lower proceeds related to asset disposals and higher capital expenditures resulting from the Acquisition more than offset by impacts of consolidated MillerCoors cash flows.expenditures.
Cash Flows from Financing Activities
Net cash used in financing activities was $289.9 million for the three months ended March 31, 2018, compared to net cash provided by financing activities wasof approximately $80.3 million for the three months ended March 31, 2017, compared to approximately $2.5 billion for the three months ended March 31, 2016.2017. This decrease was driven primarily by the approximate $2.5 billionrepayment of net proceeds received fromborrowings under our February 3, 2016, equity offeringcommercial paper program during the first quarter of 29.9 million shares of our Class B common stock,2018 compared to partially fund the Acquisition, slightly offset by an increase in borrowings under our commercial paper program during the first quarter of $130.0 million. See "Borrowings" below for more details on financing activity.
2017.
Capital Resources
Cash and Cash Equivalents
As of March 31, 2017,2018, we had total cash and cash equivalents of $395.0$197.9 million, compared to $560.9$418.6 million atas of December 31, 2016,2017, and approximately $2.6 billion at$395.0 million as of March 31, 2016.2017. The decrease in cash and cash equivalents atas of March 31, 2017,2018, from December 31, 2016,2017, was primarily driven by interest payments onthe repayment of borrowings under our long-term debt issuedcommercial paper program and higher capital expenditures, partially offset by the proceeds received of $328.0 million related to partially fund the Acquisition.Adjustment Amount as defined and further discussed in Part I—Item 1. Financial Statements, Note 6, "Special Items". The decrease in cash and cash equivalents at March 31, 2017, compared to March 31, 2016, is the result of the approximate $2.5 billion of net proceeds received from our February 3, 2016, equity offering of 29.9 million shares of our Class B common stock, to partially fund the Acquisition.
Borrowings
The majority of our outstanding borrowings at March 31, 2017, consisted of fixed-rate senior notes, with maturities ranging from 2017 to 2046. On March 15, 2017, MCBC issued approximately $1.5 billion of senior notes, consisting of $500 million 1.90% senior notes due March 15, 2019, and $500 million 2.25% senior notes due March 15, 2020 (collectively, the "2017 USD Notes") and EUR 500 million floating rate senior notes due March 15, 2019 ("2017 EUR Notes") (2017 USD Notes and 2017 EUR Notes collectively the "2017 Notes"). We bear quarterly interest on the 2017 EUR Notes at the rate of 0.35% + 3-month EURIBOR. These issuances resulted in total proceeds of approximately $1.5 billion, net of underwriting fees and discounts of $3.1 million and $0.7 million, respectively. Total estimated debt issuance costs capitalized in connection with these notes, including underwriting fees, discounts and other financing related costs, are $6.1 million and are being amortized over the respective terms of the 2017 notes. The 2017 Notes began accruing interest upon issuance, with quarterly payments due on the 2017 EUR Notes beginning June 15, 2017, and semi-annual payments due on the 2017 USD Notes beginning September 15, 2017.
In the first quarter of 2017, we entered into interest rate swaps to economically convert our fixed rate 2017 USD Notes to floating rate debt. As a result of these hedge programs, the carrying value of the $500 million 1.90% senior notes and $500 million 2.25% senior notes include adjustments of $0.2 million and $0.1 million, respectively, for fair value movements attributable to the benchmark interest rate as of March 31, 2017.
Prior to issuing 2018, from March 31, 2017, was primarily driven bythe 2017 EUR Notes, we entered into foreign currency forward agreements to economically hedge the foreign currency exposurerepayment of a portion of the respective notes, which were subsequently settled on March 15, 2017, concurrent with the issuance of the 2017 EUR Notes. Additionally, upon issuance we designated the EUR Notesborrowings as a net investment hedge of our Europe business.
During the first quarter of 2017, the netwell as higher capital expenditures, partially offset by proceeds from operating activities including the 2017 Notes were used to repay the remaining $800.0 million on our 3-year tranche term loan due 2019 and make principal payments of $700.0 million on our 5-year tranche term loan due 2021, and accordingly accelerated the related amortization. ForAdjustment Amount as previously discussed.
Borrowings
During the three months ended March 31, 2017, and 2016, $4.0 million and $1.8 million, respectively,2018, there was recorded to interest expense related to amortizationno significant borrowing or repayment activity. The following table summarizes the maturities of issuance and other financing costs associated withour long-term debt, excluding short-term borrowings. Notional amounts are presented in USD based on the term loan, including the accelerated amortization during the first quarterapplicable exchange rate as of 2017 noted above of $3.7 million.March 31, 2018.
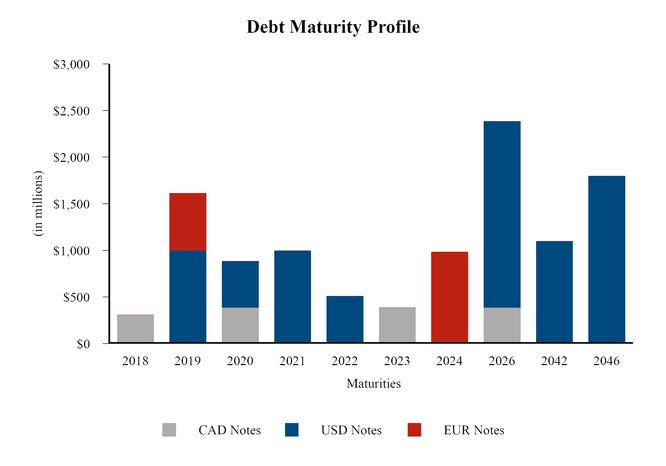
Based on the credit profile of our lenders that are party to our credit facilities, we are confident in our ability to draw on our $750 million revolving credit facility if the need arises. As of March 31, 2017,2018, we had $620.0 millionapproximately $1.4 billion available to draw under our $750 million$1.5 billion revolving multi-currency credit facility, as the borrowing capacity is reduced by borrowings under our commercial paper program, and we have no other borrowings drawn on this revolving credit facility. There were no outstanding borrowings under our $750 million revolving credit facility as of December 31, 2016. This facility will expire in 2019. In addition, we also currently utilize and will further utilize our cross-border, cross currency cash pool for liquidity needs. We also have Japanese Yen ("JPY")JPY overdraft facilities, CAD and GBP lines of credit with several banks should we need additional short-term liquidity. Subsequent to quarter end, we repaid our $300 million 2.0% notes on May 1, 2017, and also repaid $50.0 million on our 5-year tranche term loan due 2021 using commercial paper, thereby further reducing our available borrowings under our $750 million revolving credit facility.
Under the terms of each of our debt facilities, we must comply with certain restrictions. These include restrictions on priority indebtedness (certain threshold percentages of secured consolidated net tangible assets), leverage thresholds, liens, and restrictions on certain types of sale lease-back transactions and transfers of assets. The covenants specify that our leverage ratio cannot exceed 3.5x debt to earnings before interest expense, tax expense, depreciation and amortization ("EBITDA") as defined in our credit agreement. As of March 31, 2017,2018, we were in compliance with all of these restrictions and have met all debt payment obligations. All of our outstanding senior notes as of March 31, 2017,2018, rank pari-passu. As part of our anticipated financing for
Additionally, under the Acquisition, we amended our $750 million$1.5 billion revolving multi-currency credit facility, during the fourth quarter of 2015, which became effective following the completion of the Acquisition on October 11, 2016, to increase the maximum leverage ratio to 5.75xis 5.25x debt to EBITDA, with a decline to 3.75x4.00x debt to EBITDA in the fourth year following the closingas of the Acquisition.last day of the fiscal quarter ending December 31, 2020.
See Part I—Item 1. Financial Statements, Note 11,9, "Debt" to the unaudited condensed consolidated financial statements for a complete discussion and presentation of all borrowings and available sources of borrowing, including lines of credit.
Credit Rating
Our current long-term credit ratings are BBB-/Stable Outlook, Baa3/Stable Outlook and BBB(Low)/Stable Outlook with Standard and Poor's, Moody's Investor Services and DBRS, respectively. Our short-term credit ratings are A-3, Prime-3 and R-2(low), respectively. A securities rating is not a recommendation to buy, sell or hold securities, and it may be revised or withdrawn at any time by the applicable rating agency.
Foreign Exchange
Foreign exchange risk is inherent in our operations primarily due to the significant operating results that are denominated in currencies other than USD. Our approach is to reduce the volatility of cash flows and reported earnings which result from currency fluctuations rather than business related factors. Therefore, we closely monitor our operations in each country and seek to adopt appropriate strategies that are responsive to foreign currency fluctuations. Our financial risk management policy is intended to offset a portion of the potentially unfavorable impact of exchange rate changes on net income and earnings per share. See Part II—Item 8. Financial Statements and Supplementary Data, Note 16,17, "Derivative Instruments and Hedging Activities" of our Annual Report for additional information on our financial risk management strategies.
Our consolidated financial statements are presented in USD, which is our reporting currency. Assets and liabilities recorded in foreign currencies that are the functional currencies for the respective operations are translated at the prevailing exchange rate at the balance sheet date. Translation adjustments resulting from this process are reported as a separate component of other comprehensive income. Revenue and expenses are translated at the average exchange rates during the period. Gains and losses from foreign currency transactions are included in earnings for the period. The significant exchange rates to the USD used in the preparation of our consolidated financial results for the primary foreign currencies used in our foreign operations (functional currency) are as follows:
| | | | Three Months Ended | Three Months Ended |
| | March 31, 2017 | | March 31, 2016 | March 31, 2018 | | March 31, 2017 |
| Weighted-Average Exchange Rate (1 USD equals) | | | | | | |
| Canadian Dollar (CAD) | 1.34 |
|
| 1.34 |
| 1.29 |
|
| 1.34 |
|
| Euro (EUR) | 0.94 |
|
| 0.91 |
| 0.81 |
|
| 0.94 |
|
| British Pound (GBP) | 0.81 |
|
| 0.70 |
| 0.72 |
|
| 0.81 |
|
| Czech Koruna (CZK) | 25.37 |
|
| 24.40 |
| 20.67 |
|
| 25.37 |
|
| Croatian Kuna (HRK) | 7.05 |
|
| 6.86 |
| 6.04 |
|
| 7.05 |
|
| Serbian Dinar (RSD) | 115.96 |
|
| 111.73 |
| 96.21 |
|
| 115.96 |
|
| New Romanian Leu (RON) | 4.24 |
|
| 4.12 |
| |
| Romanian Leu (RON) | | 3.80 |
|
| 4.24 |
|
| Bulgarian Lev (BGN) | 1.84 |
|
| 1.78 |
| 1.59 |
|
| 1.84 |
|
| Hungarian Forint (HUF) | 290.06 |
|
| 284.51 |
| 252.93 |
|
| 290.06 |
|
| | | | As of | As of |
| | March 31, 2017 | | December 31, 2016 | March 31, 2018 | | December 31, 2017 |
| Closing Exchange Rate (1 USD equals) | | | | | | |
| Canadian Dollar (CAD) | 1.33 |
| | 1.34 |
| 1.29 |
| | 1.26 |
|
| Euro (EUR) | 0.94 |
| | 0.95 |
| 0.81 |
| | 0.83 |
|
| British Pound (GBP) | 0.80 |
| | 0.81 |
| 0.71 |
| | 0.74 |
|
| Czech Koruna (CZK) | 25.38 |
| | 25.69 |
| 20.56 |
| | 21.29 |
|
| Croatian Kuna (HRK) | 6.99 |
| | 7.18 |
| 6.03 |
| | 6.19 |
|
| Serbian Dinar (RSD) | 116.01 |
| | 117.23 |
| 95.88 |
| | 98.52 |
|
| New Romanian Leu (RON) | 4.27 |
| | 4.31 |
| |
| Romanian Leu (RON) | | 3.78 |
| | 3.89 |
|
| Bulgarian Lev (BGN) | 1.84 |
| | 1.86 |
| 1.59 |
| | 1.63 |
|
| Hungarian Forint (HUF) | 289.83 |
| | 294.36 |
| 253.55 |
| | 258.91 |
|
The weighted-average exchange rates forin the three months ended March 31, 2017, and March 31, 2016,above table have been calculated based on the average of the foreign exchange rates during the relevant period and have been weighted according to the foreign denominated earnings before interest and taxes of the USD equivalent.
Capital Expenditures
We incurred $132.7$118.2 million, and have paid $180.0$208.3 million, for capital improvement projects worldwide in the three months ended March 31, 2017,2018, excluding capital spending by equity method joint ventures, representing an increasea decrease of $98.3$14.5 million from the $34.4$132.7 million of capital expenditures incurred in the three months ended March 31, 2016.2017. This increasedecrease is primarily due to the Acquisition. Wetiming of projects as we currently expect to incur total capital expenditures for 2017 of approximately $750$670 million
million,for full year 2018, based on foreign exchange rates as of March 31, 2017, including2018. This expectation includes capital expenditures associated with the construction of our new construction intended to replace the Vancouver breweryBritish Columbia and excludingMontreal breweries and excludes capital spending by equity method joint ventures.
We have increased ourcontinue to focus on where and how we employ our planned capital expenditures, specifically strengthening our focus on required returns on invested capital as we determine how to best allocate cash within the business.
Contractual Obligations and Commercial Commitments
Contractual Obligations
A summary ofThere were no material changes to our consolidated contractual obligations as of Marchand commercial commitments since December 31, 2017,, and based on foreign exchange rates at March 31, 2017, is as follows:
|
| | | | | | | | | | | | | | | | | | | |
| | Payments due by period |
| | Total | | Less than 1 year | | 1 - 3 years | | 3 - 5 years | | More than 5 years |
| | (In millions) |
| Debt obligations | $ | 12,356.6 |
| | $ | 843.3 |
| | $ | 1,832.9 |
| | $ | 2,675.4 |
| | $ | 7,005.0 |
|
| Interest payments on debt obligations | 4,886.7 |
| | 354.0 |
| | 665.9 |
| | 573.6 |
| | 3,293.2 |
|
| Retirement plan expenditures | 603.2 |
| | 127.5 |
| | 104.9 |
| | 106.5 |
| | 264.3 |
|
| Operating leases | 215.4 |
| | 57.2 |
| | 77.4 |
| | 45.5 |
| | 35.3 |
|
| Other long-term obligations | 3,572.9 |
| | 1,093.2 |
| | 1,212.8 |
| | 675.5 |
| | 591.4 |
|
| Total obligations | $ | 21,634.8 |
| | $ | 2,475.2 |
| | $ | 3,893.9 |
| | $ | 4,076.5 |
| | $ | 11,189.2 |
|
Seereported in Part II - Item 7. Management's Discussion and Analysis, Contractual Obligations and Commercial Commitments in our Annual Report; Part I - Item 1. Financial Statements, Note 11, "Debt", Note 14, "Derivative Instruments and Hedging Activities", Note 15, "Pension and Other Postretirement Benefits" and Note 16, "Commitments and Contingencies" of the Notes for additional information.Report.
Guarantees
We guarantee indebtedness and other obligations to banks and other third parties for some of our equity method investments and consolidated subsidiaries. See Part I - Item 1. Financial Statements, Note 16,14, "Commitments and Contingencies" of the Notes for further discussion.
Other Commercial Commitments
Based on foreign exchange rates as of March 31, 2017, future commercial commitments are as follows:
|
| | | | | | | | | | | | | | | | | | | |
| | Amount of commitment expiration per period |
| | Total amounts committed | | Less than 1 year | | 1 - 3 years | | 3 - 5 years | | More than 5 years |
| | (In millions) |
| Standby letters of credit | $ | 61.2 |
| | $ | 59.9 |
| | $ | 1.3 |
| | $ | — |
| | $ | — |
|
Contingencies
We are party to various legal proceedings arising in the ordinary course of business, environmental litigationissues and indemnities associated with our sale of Kaiser to FEMSA. Additionally, each year since 2014, we have received assessments from a local country regulatory authority related to indirect tax calculations in our Europe operations. Since their issuance, we have challenged the validity of these assessments and defended our position regarding our method of calculation, including by following the required regulatory procedures in order to proceed with an appeal of the assessments. During the first quarter of 2017, a local jurisdictional court heard evidence in this matter and subsequently ruled in our favor in April 2017. The ultimate outcome of the assessments remains uncertain at this time as the ruling remains subject to appeal. If the assessments, as issued by the regulatory authority, are ultimately upheld or if the relevant statutory provisions or interpretations at issue are changed, it could have a material adverse effect on our European results of operations and operating income. Such an adverse ultimate determination or change also could materially affect our results of operations, including excise taxes, net sales and resulting impacts to other financial statement line items.contingencies. See Part I—Item 1. Financial Statements, Note 16,14, "Commitments and Contingencies" of the Notes for further discussion.
Off-Balance Sheet Arrangements
In accordance with generally accepted accounting principles in the U.S., GAAP, our operating leases are not reflected in our unaudited condensed consolidated balance sheets. Refer to Part II—Item 8 Financial Statements, Note 18,19, "Commitments and Contingencies" in our Annual Report for further discussion of these off-balance sheet arrangements. As of March 31, 2017,2018, we did not have any other material off-balance sheet arrangements (as defined in Item 303(a)(4)(ii) of Regulation S-K).
Outlook for 20172018
In 2017, we are continuing our relentless focus on delighting our consumers and our customers to ensure we are the first choice brewer in the geographies and segments in which we operate.
In the U.S., we plan to rebuild distributor inventories in the second half, as we are continuing to drive our goalportfolio strategy of flatbuilding distinctive brands across all segments to meet the needs of American beer drinkers. We plan to gain segment share in premium, grow volume in 2018above premium and growth in 2019 has not changed. We expect to continue to investstabilize our below premium brand volume and share. We gained share in our flagship brands withpremium lights led by Miller Lite. The brand plans to have bolder messaging to further assert its positioning as the original light beer that doesn't compromise on taste. The new creative and refreshed packaging for Coors Light have been rolled out and Miller Lite, plus Coors Banquet centralthe brand expects to our investment focus. Miller Lite has begun rolling outreinforce its role as the "World's Most Refreshing Beer" including the summer collaboration with YETI, a new creative that is an extension of the successful "Spelled Different, Brewed Different" campaign. With the tagline "Hold True," Miller Lite is defining how the beer has not compromised on taste and is emphasizing the product credentials that make it the original light beer. We are also investing inpremium outdoor brand. Within above premium, andwe are seeing strong demand for Redd'sBlue Moon Mango Wheat and Blue Moon variety packs, as well as the recently released 15 pack and 24 ounce cans of Blue Moon Belgian White recently introduced new aluminum pint packaging.. We also plan to build on last year's record-setting performance from Leinenkugel's Summary Shandy has introduced new packaging and its limited-edition lager, a collaborationcompete more assertively within the strongly growing hard seltzers segment with Germany's Hofbräu München to celebrate the company's 150-year anniversary,Henry's Hard Sparkling, which is expected to be in six packs in June. Finally, the much-anticipated return of Zima is planned to take place in time for the Fourth of July weekend.
Alsonow available in the U.S., in our first choice for customer agenda, our fact-based "Building with Beer" tool is driving value for our retail customers in the on-premise and convenience channels, andslim can package. Additionally, we plan to continue to expand its reach in grocerythe geographic footprint of our regional craft brands, and liquor this year. Tenthwe expect Terrapin, Hop Valley, Revolver and Blake, the craft and import division of MillerCoors, expectsSaint Archer, collectively, to continue to focusoutpace the craft segment. We continue to grow share of both segment and industry with our below premium brands, led by the Keystone family. Our 2018 U.S. innovation lineup is off to a strong start. In April, we relaunched the Sol brand with redesigned packaging supported by an integrated marketing campaign that will be prominently featured throughout the summer, especially during the FIFA World Cup. Arnold Palmer Spiked Half & Half distribution is ramping up and will be supported through an expansive media campaign and suite of retail tools. Lastly, retro favorite and 2017 success, Zima, will be available for a limited time starting on integratingMemorial Day. Despite the recent headwinds we have been facing, we believe we have the brands, plans and rapidly expanding the geographicpeople to drive increases in profit, free cash flow and ultimately reach our goal of our craft acquisitions. Saint Archer, which had the fastest growth rate among the top 20 craft brewers selling in California, is expected to expand to Arizona, Oregon, Hawaii, Alaska and Washington. Hop Valley expects to expand its footprint this year to Nevada, Arizona, Colorado and Alaska. Revolver, which has the No. 2 regional craft brand in North Texas, is planning to fill out its footprint in Texas in anticipation of neighboring state expansions in 2018. Finally, Terrapin Beer Company, the No. 3 regional craft brewery in share growth among the Southeast, recently expanded into Ohio, Kentucky and Mississippi, and we are considering additional opportunities for later this year.volume growth.
In Canada, we are seeing initial positive results from our first choice agendathe team continues to bring momentum back to the top line, including a relentless focus on executing our two largeststrategy to strengthen our business. Our consumer excellence teams continue to focus on evolving the shape of our brand portfolio, with the objective to stabilize our premium brands Coors Light performance, accelerate the growth of our above premium portfolio, and Molson Canadian. In the first quarter, we increased brand volume and market share nationally andsimplify our offerings in the West, partially due toeconomy segment. In below premium, we have seen the addition of the Miller brands. We look forward to the launch of a new Molson Canadian campaign celebrating Canada's 150th Anniversary this year, and to bringing the successful Coors Light creative platform "Climb On" campaign north. We expect to also drive for further growth in above premium with Coors Banquet, Miller Genuine Draft, Mad Jack, Belgian Moon and the Heineken brand family. We also plan to leverage Miller Lite andrecently launched Miller High Life to further strengthenbrand delivering strong early results, and perfectly complementing our Canada portfolio. Customer relationships are beginning to drive trend improvements,Pilsner andBlack Label brands, as all three brands experienced growth in the on-premise channel,first quarter. In the premium segment, as we approach the end of the hockey and our national key accounts volume and market share grew at mid-single-digit rates. We also increased distributionbasketball seasons, we have already transitioned to baseball, which sees Coors Light starting its first season as the beer sponsor of keyMajor League Baseball in Canada. As consumer preference for above premium brands and packages across Canada and improved in-store executioncontinues to increase, we plan to keep driving an acceleration of the growth of our key import brand, campaigns across all channels. The constructionHeineken, as well as our owned Miller Genuine Draft and Coors Banquet brands. Trou du Diable, our most recent addition to
our craft beer portfolio, is broadening our craft footprint in Quebec, and delivering strong early results. In terms of above premium innovations, we have launched Henry's Hard Soda and Leinenkugel's from the U.S. in March and plan to soon add Coors Edge, a new non-alcoholic product, that will complement our current Heineken 0.0 offering in this rapidly growing segment. Finally, as we look to ongoing productivity improvements, the build out of our new highly efficient brewery in British Columbia brewery is progressing well, withon track for brewing in the formal ground breaking taking place atnext year and planning for our new Chilliwack sitebrewery in April 2017.Montreal is advancing quickly.
In Europe, we will continue to use a balanced portfolio approach, disciplined retail execution and optimization of our brewery network and infrastructure. The impact of the recently revised industry guidelines for calculating excise tax payments in one market and the increased investment in strengthening our first choice agenda will continue throughout the balance of 2018, as we seek to grow top and bottom line sustainability. Going forward, changes in pension accounting implemented this year will move a substantial amount of Europe pension income to Corporate results. Our commercial team expects to build on our positive momentum by further strengthening our national champion brands, including Carling, our largest brand in Europe. As we approach peak beer and cider selling season, we are excited about the potential we see for the premium cider brand, Aspall, as we further premiumize our U.K. portfolio. Our balanced portfolio approach also relies on a continuing commitment to maintain and improve our customer relationships as we continue to drive our first choice consumer agenda withagenda.
In 2017, our existing portfolioInternational business made meaningful progress as we expanded our geographical footprint and the addition of theadded significant brand scale, and we expect additional progress in 2018. We intend to continue to utilize an asset-light model in select markets and our efforts will focus on Miller brands, as well as the royalty and export business in the region from MCI, which began January 1, 2017. We are also continuing to build our craft portfolio, including Sharp'sCoors Light, Franciscan Well, Miller Genuine Draftfurther expansion of Blue Moon in the region,, and the purchase of a controlling interest in the La Sagra craft brewery near Madrid during the first quarter of 2017. As part of its expansion, Blue Moon has opened a new pub in Valencia, Spain, as a forerunner of many more to come in the years ahead. In customer excellence, one of the largest wholesalers in the U.K., Nisa, named Molson Coors "Supplier of the Year" for this year, and also awarded us "Best Service & Availability" for the second year running.
MCI is leveraging opportunities to grow the Coors and Miller brands in high opportunity markets, especially in Latin America and select countries in Asia and Africa. We anticipate integrating the original white can packaging for Miller Lite to all of MCI's. Our growth strategy includes several high-potential markets globallyand success in the second half of the year. We plan to move away from most of the local transition salesthese markets will play a pivotal role in reaching our long-term top- and distribution agreements in the upcoming months and plan to utilize strong partnering, export and local license agreements to expand the reach of our brands. We anticipate that these new business structures will require up-front investments to grow our brands which we expect to impact MCI's profitbottom-line growth in the near to medium term. Additionally, we expect that the termination of the targets.Modelo contract in Japan at the end of June this year will hinder performance in this profitable market. We are exploring ways to mitigate the impact of the loss of this contract.
Pension Plans
We currently anticipate approximately $100 million to $120$10 million of cash contributions to our defined benefit pension plans in 2017 and a pension benefit of approximately $24 million,2018, based on foreign exchange rates as of March 31, 2017.2018. BRI and BDL pension expense and contributions to their respective defined benefit pension plans are excluded here, as they are not consolidated in our financial statements.
Interest
We anticipate 2017 consolidated2018 Corporate net interest expense of approximately $370$330 million, based on foreign exchange and interest rates atas of March 31, 2017.2018.
Tax
We expect to realize net benefits from the 2017 Tax Act, primarily driven by the lower federal corporate income tax rate of 21% and accelerated depreciation of qualified assets for tax purposes. As an additional result of the 2017 Tax Act, we expect a long-term consolidated effective tax rate in the range of 20% to 24%. However, we will continue to evaluate the impacts of the 2017 Tax Act as we further understand its implications, as well as the related, and yet to be issued, regulator rules, regulations and interpretations which could impact this outlook.
Dividends and Stock Repurchases
As a result of the Acquisition, we plan to maintain our current quarterly dividend of $0.41 per share, and have suspended our share repurchase program as we pay down debt, and wedebt. We will revisit our dividend policy and share repurchase program once deleveraging is well underway.
Critical Accounting Estimates
Our accounting policies and accounting estimates critical to our financial condition and results of operations are set forth in our Annual Report and did not change during the first quarter of 2017. Refer to2018. See Note 2, "New Accounting Pronouncements" for discussion of recently adopted accounting pronouncements. See also Part I—Item 1. Financial Statements, Note 10,8, "Goodwill and Intangible Assets" of the Notes for discussion of the results of the 20162017 annual impairment testing analysis and the related risks to our indefinite-lived intangible brand assets and goodwill amounts associated with our reporting units.
New Accounting Pronouncements Not Yet Adopted
Leases
In February 2016, the FASB issued authoritative guidance intended to increase transparency and comparability among organizations by recognizing lease assets and liabilities on the balance sheet and disclosing key information about leasing arrangements. Under the new guidance, lessees will be required to recognize a right-of-use asset and a lease liability, measured
on a discounted basis, at the commencement date for all leases with terms greater than twelve months. Additionally, this guidance will require disclosures to help investors and other financial statement users to better understand the amount, timing, and uncertainty of cash flows arising from leases, including qualitative and quantitative requirements. The guidance should be applied under a modified retrospective transition approach for leases existing at the beginning of the earliest comparative period presented in the adoption-period financial statements. Any leases that expire before the initial application date will not require any accounting adjustment.approach. This guidance is effective for annual reporting periods beginning after December 15, 2018, including interim periods within those annual periods, with early adoption permitted. We are currently evaluating the potential impact on our financial position and results of operations upon adoption of this guidance.
Revenue Recognition
In May 2014, the FASB issued authoritative This guidance related to new accounting requirementswill result in our existing operating leases, for the recognition of revenue from contracts with customers. The core principle of the guidance is that an entity should recognize revenue to depict the transfer of promised goods or services to customers in an amount that reflects the consideration to which the entity expectscertain real estate and equipment, to be entitled to in exchange for the goods or services. The guidance also includes enhanced disclosure requirements which are intended to help financial statement users better understand the nature, amount, timingrecognized on our balance sheet. We will further analyze our lease arrangements as we complete our assessment and uncertainty of revenue being recognized. Subsequent to the releaseimplementation of this guidance, the FASB has issued additional updates intended to provide interpretive clarifications and to reduce the cost and complexity of applying the new revenue recognition standard both at transition and on an ongoing basis. The new standard and related amendments are effective for annual reporting periods beginning after December 15, 2017, and interim periods within those annual periods. Upon adoption of the new standard, the use of either a full retrospective or cumulative effect transition method is permitted. We are currently in the process of evaluating the potential impact this new guidance will have on our financial statements. We have not completed this evaluation and therefore, cannot conclude whether the guidance will have a significant impact on our financial statements at this time. However, based on preliminary work completed, we are considering the implications that the new standard may have on our contract brewing arrangements, presentation of certain customer related trade spend, as well as the timing of recognition of certain promotional discounts, which are areas that could potentially be impacted by the adoption of the new guidance. We currently anticipate that we will utilize the cumulative effect transition method, however, this expectation may change following the completion of our evaluation of the impact of this guidance on our financial statements.
See Part I—Item 1. Financial Statements, Note 2, "New Accounting Pronouncements" of the Notes for a description of all new accounting pronouncements.
Unaudited Pro Forma Financial Information
The following unaudited pro forma financial information gives effect to the Acquisition and the completed financing as if they were completed on January 1, 2016, the first day of our 2016 fiscal year and the pro forma adjustments are based on items that are factually supportable, are directly attributable to the Acquisition and are expected to have a continuing impact on MCBC's results of operations. The unaudited pro forma financial information has been calculated after applying MCBC’s accounting policies and adjusting the results of MillerCoors to reflect the additional depreciation and amortization that would have been charged assuming the preliminary fair value adjustments to property, plant and equipment, and intangible assets had been applied from January 1, 2016, together with the consequential tax effects. Pro forma adjustments have been made to remove non-recurring transaction-related costs included in historical results as well as to reflect the incremental interest expense to be prospectively incurred on the debt and term loans issued to finance the Acquisition, in addition to other pro forma adjustments. See below table for significant non-recurring costs.
Additionally, the following unaudited pro forma financial information does not reflect the impact of the acquisition of the Miller global brand portfolio and other assets primarily related to the Miller International Business as we are not able to estimate the historical results of operations from this business and have concluded, based on the limited information available to MCBC, that it is insignificant to the overall Acquisition. The preliminary purchase price allocation reflects the estimated value allocated to the Miller global brand portfolio reported within identifiable intangible assets subject to amortization.Based on the limited information regarding such brands received to date, this estimated value allocated to these brands remains subject to change as additional information, reflective of the performance of the brands as of the Acquisition date, becomes available.
The unaudited pro forma financial information below does not reflect the realization of any expected ongoing synergies related to the integration of MillerCoors. Further, the unaudited pro forma financial information should not be considered indicative of the results that would have occurred if the Acquisition and related financing had been completed on January 1, 2016, nor are they indicative of future results.
MOLSON COORS BREWING COMPANY AND SUBSIDIARIES
UNAUDITED PRO FORMA CONDENSED COMBINED STATEMENT OF OPERATIONS
FOR THE THREE MONTHS ENDED MARCH 31, 2016
(IN MILLIONS, EXCEPT PER SHARE DATA)
|
| | | | | | | | | | | | | | | | | |
| | MCBC Historical | | MillerCoors Historical | | Pro Forma Adjustments | | Note | | Pro Forma Combined |
| Volume in hectoliters | 6.330 |
| | 16.388 |
| | (0.202 | ) | | (1) | | 22.516 |
|
| | | | | | | | | | |
| Sales | $ | 950.8 |
| | $ | 2,069.3 |
| | $ | (11.9 | ) | | (1) | | $ | 3,008.2 |
|
| Excise taxes | (293.6 | ) | | (253.2 | ) | | — |
| | | | (546.8 | ) |
| Net sales | 657.2 |
| | 1,816.1 |
| | (11.9 | ) | | | | 2,461.4 |
|
| Cost of goods sold | (414.0 | ) | | (1,033.0 | ) | | (3.8 | ) | | (2) | | (1,450.8 | ) |
| Gross profit | 243.2 |
| | 783.1 |
| | (15.7 | ) | | | | 1,010.6 |
|
| Marketing, general and administrative expenses | (250.9 | ) | | (409.7 | ) | | 1.2 |
| | (3) | | (659.4 | ) |
| Special items, net | 108.6 |
| | (36.9 | ) | | — |
| | | | 71.7 |
|
| Equity income in MillerCoors | 142.4 |
| | — |
| | (142.4 | ) | | | | — |
|
| Operating income (loss) | 243.3 |
| | 336.5 |
| | (156.9 | ) | | | | 422.9 |
|
| Interest income (expense), net | (47.3 | ) | | (0.5 | ) | | (43.1 | ) | | (4) | | (90.9 | ) |
| Other income (expense), net | (15.3 | ) | | 1.6 |
| | 18.4 |
| | (5) | | 4.7 |
|
| Income (loss) from continuing operations before income taxes | 180.7 |
| | 337.6 |
| | (181.6 | ) | | | | 336.7 |
|
| Income tax benefit (expense) | (16.7 | ) | | 0.5 |
| | (59.5 | ) | | (6) | | (75.7 | ) |
| Net income (loss) from continuing operations | 164.0 |
| | 338.1 |
| | (241.1 | ) | | | | 261.0 |
|
| Income (loss) from discontinued operations, net of tax | (0.5 | ) | | — |
| | — |
| | | | (0.5 | ) |
| Net income (loss) including noncontrolling interests | 163.5 |
| | 338.1 |
| | (241.1 | ) | | | | 260.5 |
|
| Net income (loss) attributable to noncontrolling interests | (0.8 | ) | | (2.8 | ) | | — |
| | | | (3.6 | ) |
| Net income (loss) attributable to MCBC | $ | 162.7 |
| | $ | 335.3 |
| | $ | (241.1 | ) | | | | $ | 256.9 |
|
| | | | | | | | | | |
| Net income (loss) per share attributable to MCBC from continuing operations: | | | | | | | | | |
| Net income (loss) attributable to MCBC from continuing operations | $ | 163.2 |
| | $ | 335.3 |
| | $ | (241.1 | ) | | | | $ | 257.4 |
|
| Basic | $ | 0.80 |
| | | | | | | | $ | 1.20 |
|
| Diluted | $ | 0.80 |
| | | | | | | | $ | 1.19 |
|
| Weighted-average shares—basic | 203.6 |
| | | | 10.8 |
| | (7) | | 214.4 |
|
| Weighted-average shares—diluted | 205.1 |
| | | | 10.8 |
| | (7) | | 215.9 |
|
The following pro forma adjustments eliminate beer sales between MCBC and MillerCoors for the three months ended March 31, 2016, that were previously recorded as affiliate sales and became intercompany transactions after the Acquisition was completed and thus eliminate in consolidation.
|
| | | |
| | Three Months Ended |
| | March 31, 2016 |
| | (In millions) |
| Hectoliters of beer and other beverages sold | (0.202 | ) |
| | |
| MCBC's beer sales to MillerCoors | $ | 2.0 |
|
| MillerCoors' beer sales to MCBC | 9.9 |
|
| Total pro forma adjustment to sales | $ | 11.9 |
|
The following pro forma adjustments (increase)/decrease cost of goods sold for the three months ended March 31, 2016:
|
| | | |
| | Three Months Ended |
| | March 31, 2016 |
| | (In millions) |
MillerCoors' beer purchases from MCBC(1) | $ | 2.0 |
|
MCBC's beer purchases from MillerCoors(1) | 9.9 |
|
Depreciation(2) | (16.1 | ) |
MillerCoors' royalties paid to SABMiller(3) | 3.7 |
|
Policy reclassification(4) | (5.5 | ) |
Historical charges recorded for pallets(5) | 2.2 |
|
| Total pro forma adjustment to cost of goods sold | $ | (3.8 | ) |
| |
(1)
| Reflects beer purchases between MCBC and MillerCoors that were previously recorded as affiliate purchases and became intercompany transactions after the Acquisition was completed and thus eliminate in consolidation. |
| |
(2)
| Reflects the pro forma adjustment to depreciation expense associated with the preliminary estimated fair value of MillerCoors' property, plant and equipment over the preliminary estimated remaining useful life. |
| |
(3)
| Reflects royalties paid by MillerCoors to SABMiller plc for sales of certain of its licensed brands in the U.S. Upon completion of the Acquisition, royalties are no longer paid related to these licensed brands. See the purchase agreement for additional details. |
| |
(4)
| Reflects the reclassification of certain MillerCoors overhead costs from marketing, general and administrative expenses to cost of goods sold to align to MCBC policy related to profit and loss classification of such costs. |
| |
(5)
| Reflects the amortization of MillerCoors' pallet costs which were historically recorded as a non-current asset and amortized into cost of goods sold, separate from depreciation expense. As part of our policy alignment, the pallets are now classified as depreciable fixed assets within Properties, net and the related depreciation is included as part of depreciation expense that is recognized in cost of goods sold. This adjustment reflects the removal of historical pallet amortization expense recorded within cost of goods sold and the depreciation pro forma adjustment above reflects the updated amount to be recorded as cost of goods sold depreciation going forward. |
| |
(3) | Marketing, General and Administrative Expenses |
Based on the estimated preliminary fair values of identifiable amortizable intangible assets and depreciable property, plant and equipment, and the preliminary estimated useful lives assigned, the following pro forma adjustments to amortization and depreciation expenses have been made to marketing, general and administrative expenses for the three months ended March 31, 2016. Additionally, a pro forma adjustment has been made to eliminate MillerCoors' service agreement income related to charges to SABMiller for the three months ended March 31, 2016, that were previously recorded as a reduction to MillerCoors' marketing, general and administrative expenses as this activity with SABMiller ceased upon completion of the Acquisition. We have also removed transaction-related costs included in the historical MCBC statements of operations as they will not have a continuing impact. The pro forma adjustments to increase/(decrease) marketing, general and administrative expenses are as follows:
|
| | | |
| | Three Months Ended |
| | March 31, 2016 |
| | (In millions) |
| Marketing, general and administrative expenses pro forma adjustment for depreciation and amortization | $ | 18.7 |
|
| MillerCoors' service agreement charges to SABMiller | 0.5 |
|
| Policy reclassification - See cost of goods sold note 4 above | (5.5 | ) |
| Historical transaction costs | (14.9 | ) |
| Total pro forma adjustment to marketing, general and administrative expenses | $ | (1.2 | ) |
| |
(4) | Interest Income (Expense) |
Represents the pro forma adjustments for the incremental interest expense, including the amortization of debt issuance costs, as if the Acquisition and related financing had occurred on January 1, 2016. The Acquisition was funded through cash on hand, including proceeds received from our February 3, 2016, equity issuance, the issuance of debt on July 7, 2016, as well as borrowings on our term loan, which occurred concurrent with the close of the Acquisition. We incurred costs related to the issuance of debt, committed financing we had in place prior to the completion of the Acquisition and earned interest income on the cash proceeds from the equity issuance and debt issuance prior to the completion of the Acquisition. We have therefore removed these amounts for pro forma purposes as they would not have been incurred or earned had the Acquisition and related financing been completed on January 1, 2016. Additionally, we incurred losses on the swaption derivative instruments that we entered into to economically hedge a portion of our long-term debt issuance with which we partially funded the Acquisition. These swaptions were not designated in hedge accounting relationships as the hedges were entered into in association with the Acquisition and, accordingly, all mark-to-market fair value adjustments were reflected within interest expense. As the losses on the swaptions are nonrecurring and do not have a continuing impact on the business, we have removed them from our pro forma financial information. The debt issued on July 7, 2016, consists of fixed rate notes and the term loan bears monthly interest at the rate of 1.50% + 1-month LIBOR.
|
| | | |
| | Three Months Ended |
| | March 31, 2016 |
| | (In millions) |
| Term loan interest expense adjustments | $ | 12.6 |
|
| Interest expense adjustments from debt issued July 7, 2016 | 50.9 |
|
| Historical net interest on other items discussed above | (20.4 | ) |
| Total pro forma adjustment to interest expense | $ | 43.1 |
|
| |
(5) | Other Income (Expense) |
Represents the elimination of historical financing costs that do not have a continuing impact related to the bridge loan, which have been included in the historical financial statements within other income (expense).
|
| | | |
| | Three Months Ended |
| | March 31, 2016 |
| | (In millions) |
| Historical financing costs on the bridge loan | $ | 18.4 |
|
| |
(6) | Income Tax Benefit (Expense) |
MillerCoors elected to be taxed as a partnership for U.S. federal and state income tax purposes. As a result, the related tax attributes of MillerCoors are passed through to its shareholders and income taxes are payable by its shareholders. Therefore, income tax expense within MCBC's historical results includes the tax effect of our 42% equity income from MillerCoors. The pro forma adjustment to income tax expense is inclusive of both the tax effect of the assumption of the incremental 58% of MillerCoors' pretax income, as well as the tax effect of the other pro forma adjustments impacting pretax income discussed above, based on the estimated blended U.S. federal and state statutory income tax rate and other pro forma tax considerations.
|
| | | |
| | Three Months Ended |
| | March 31, 2016 |
| | (In millions) |
| Total pro forma adjustment to income tax benefit (expense) | $ | (59.5 | ) |
| |
(7) | Weighted-Average Shares Outstanding |
Weighted-average shares outstanding have been calculated to include the impact of the shares that were issued in the first quarter of 2016 in conjunction with the February 3, 2016, equity offering, which was completed to fund a portion of the Acquisition. As such, the below adjustment assumes such shares were outstanding on January 1, 2016.
|
| | |
| Three Months Ended |
| March 31, 2016 |
| (In millions) |
Impact of shares issued in February 3, 2016, equity offering | |
Weighted-average shares—basic | 10.8 |
|
Weighted-average shares—diluted | 10.8 |
|
ITEM 3. QUANTITATIVE AND QUALITATIVE DISCLOSURES ABOUT MARKET RISK
In the normal course of business, we actively manage our exposure to various market risks by entering into various supplier-based and market-based hedging transactions, authorized under established risk management policies that place clear controls on these activities. Our objective in managing these exposures is to decrease the volatility of our earnings and cash flows due to changes in underlying rates and costs. The counterparties to our market-based transactions are generally highly rated institutions. We perform assessments of their credit risk regularly. Our market-based transactions include a variety of derivative financial instruments, none of which are used for trading or speculative purposes.
For details of our derivative instruments that are presented on the balance sheet, including their fair values as of period end, see Part I—Item 1. Financial Statements, Note 14,12, "Derivative Instruments and Hedging Activities" of the Notes.. On a rolling twelve-month basis, maturities of derivative financial instruments held on March 31, 20172018, based on foreign exchange rates as of March 31, 20172018, are as follows:
| | | Total | Total | | Less than 1 year | | 1 - 3 years | | 3 - 5 years | | More than 5 years | Total | | Less than 1 year | | 1 - 3 years | | 3 - 5 years | | More than 5 years |
(In millions) | | $ | 57.1 |
| | $ | 25.7 |
| | $ | 26.3 |
| | $ | 5.1 |
| | $ | — |
| 34.6 |
| | $ | 18.7 |
| | $ | 16.0 |
| | $ | (0.1 | ) | | $ | — |
|
Sensitivity Analysis
Our market risk sensitive derivative and other financial instruments, as defined by the SEC, are debt, foreign currency forward contracts, interest rate swaps,debt, commodity swaps and commodity options. We monitor foreign exchange risk, interest rate risk, commodity risk and related derivatives using a sensitivity analysis.
The following table presents the results of the sensitivity analysis, which reflects the impact of a hypothetical 10% adverse change in each of these risks to our derivative and debt portfolio:
| | | | As of | As of |
| | March 31, 2017 | | December 31, 2016 | March 31, 2018 | | December 31, 2017 |
| | (In millions) | (In millions) |
| Estimated fair value volatility | | | | | | |
| Foreign currency risk: | | | | | | |
| Forwards | $ | (30.9 | ) | | $ | (35.1 | ) | $ | (41.2 | ) | | $ | (36.5 | ) |
| Foreign currency denominated debt | $ | (286.5 | ) | | $ | (223.6 | ) | $ | (312.2 | ) | | $ | (310.0 | ) |
| Interest rate risk: | | | | | | |
| Debt | $ | (313.6 | ) | | $ | (319.3 | ) | $ | (305.8 | ) | | $ | (311.9 | ) |
| Interest rate swaps | $ | (21.1 | ) | | $ | — |
| |
| Commodity price risk: | | | | | | |
| Commodity swaps | $ | (35.3 | ) | | $ | (66.8 | ) | $ | (44.1 | ) | | $ | (43.5 | ) |
| Commodity options | $ | — |
| | $ | — |
| $ | — |
| | $ | — |
|
The volatility of the applicable rates and prices are dependent on many factors that cannot be forecast with reliable accuracy. Therefore, actual changes in fair values could differ significantly from the results presented in the table above.
ITEM 4. CONTROLS AND PROCEDURES
Evaluation of Disclosure Controls and Procedures
Under the supervision and with the participation of our management, including our Chief Executive Officer and Chief Financial Officer, we conducted an evaluation of our disclosure controls and procedures as such item is defined under Rule 13a-15(e) under the Exchange Act. Based on this evaluation, our Chief Executive Officer and Chief Financial Officer concluded that our disclosure controls and procedures were effective as of March 31, 20172018, to provide reasonable assurance that information required to be disclosed in our reports under the Exchange Act is recorded, processed, summarized and reported within the time periods specified in the SEC rules and forms and that such information is accumulated and communicated to our management, including our Chief Executive Officer and Chief Financial Officer, as appropriate, to allow timely decisions regarding required disclosure. Management necessarily applies its judgment in assessing the costs and benefits of such controls and procedures that, by their nature, can only provide reasonable assurance regarding management's control objectives. Also, we have investments in certain unconsolidated entities that we do not control or manage.
Changes in Internal Control over Financial Reporting
There were no changes in our internal control over financial reporting (as defined in Exchange Act Rule 13a-15(f)) during the three months ended March 31, 20172018, that have materially affected, or are reasonably likely to materially affect, our internal control over financial reporting.
PART II. OTHER INFORMATION
ITEM 1. LEGAL PROCEEDINGS
On December 12, 2014, a notice of action captioned David HughesFor information regarding litigation, other disputes and 631992 Ontario Inc. v. Liquor Control Board of Ontario, Brewers Retail Inc., Labatt Breweries of Canada LP, Molson Coors Canadaenvironmental and Sleeman Breweries Ltd. No. CV-14-518059-00CP was filed in Ontario, Canada in the Ontario Superior Court of Justice. Brewers Retail Inc. ("BRI") and its owners, including Molson Coors Canada, as well as the Liquor Control Board of Ontario ("LCBO") are named as defendants in the action. The plaintiffs allege that The Beer Store (retail outlets owned and operated by BRI) and LCBO improperly entered into an agreement to fix prices and market allocation within the Ontario beer market to the detriment of licensees and consumers. The plaintiffs seek to have the claim certified as a class action on behalf of all Ontario beer consumers and licensees and, among other things, damages in the amount of Canadian Dollar ("CAD") 1.4 billion. We note that The Beer Store operates according to the rules established by the Government of Ontario for regulation, sale and distribution of beer in the province. Additionally, prices at The Beer Store are independently set by each brewer and are approved by the LCBO on a weekly basis. Accordingly, we intend to vigorously assert and defend our rights in this lawsuit. Seeregulatory proceedings see Part I—Item 1. Financial Statements, Note 16,14, "Commitments and Contingencies" of the Notes for additional information.
We are also involved in other disputes and legal actions arising in the ordinary course of our business. While it is not feasible to predict or determine the outcome of these proceedings, in our opinion, based on a review with legal counsel, none of these disputes and legal actions are expected to have a material impact on our business, consolidated financial position, results of operations or cash flows. However, litigation is subject to inherent uncertainties and an adverse result in these or other matters may arise from time to time that may harm our business.
ITEM 1A. RISK FACTORS
In addition to the other information set forth in this report, you should carefully consider the factors discussed in Part I—Item 1A. "Risk Factors" in our Annual Report, which could materially affect our business, financial condition and/or future results. There have been no material changes to the risk factors contained in our Annual Report with the exception of the additional risk factor included below.Report. The risks described in our Annual Report are not the only risks facing us. Additional risks and uncertainties not currently known to us or that we currently deem to be immaterial may also materially adversely affect our business, financial condition, cash flows and/or future results.
ITEM 2. UNREGISTERED SALES OF EQUITY SECURITIES AND USE OF PROCEEDS
None.
ITEM 3. DEFAULTS UPON SENIOR SECURITIES
None.
ITEM 4. MINE SAFETY DISCLOSURES
Not applicable.
ITEM 5. OTHER INFORMATION
None.
ITEM 6. EXHIBITS
The following are filed or incorporated by reference as a part of this Quarterly Report on Form 10-Q:
|
| | | |
Exhibit Number | | Document Description |
| 4.1 | | Seventh Supplemental Indenture, dated as of January 11, 2018, to the Indenture, dated May 3, 2012, by and among Molson Coors Brewing Company, the guarantors named therein and Deutsche Bank Trust Company Americas, as trustee (incorporated by reference to Exhibit 4.1.8 of our Annual Report on Form 10-K, filed on February 14, 2018). |
| 4.2 | | Seventh Supplemental Indenture, dated as of January 11, 2018, to the Indenture, dated September 18, 2015, by and among Molson Coors International LP, the guarantors named therein and Computershare Trust Company of Canada, as trustee (incorporated by reference to Exhibit 4.5.8 of our Annual Report on Form 10-K, filed on February 14, 2018). |
| 4.3 | | Sixth Supplemental Indenture, dated as of January 11, 2018, to the Indenture, dated July 7, 2016, by and among Molson Coors Brewing Company, the guarantors named therein and Deutsche Bank Trust Company Americas, as trustee (incorporated by reference to Exhibit 4.8.7 of our Annual Report on Form 10-K, filed on February 14, 2018). |
| 4.4 | | Fifth Supplemental Indenture, dated as of January 11, 2018, to the Indenture, dated July 7, 2016, by and among Molson Coors International LP, the guarantors named therein and Computershare Trust Company of Canada, as trustee (incorporated by reference to Exhibit 4.14.6 of our Annual Report on Form 10-K, filed on February 14, 2018). |
| 4.5 | | First Supplemental Indenture, dated as of January 11, 2018, to the Indenture dated as of March 15, 2017, by and among Molson Coors Brewing Company, the guarantors party thereto and The Bank of New York Mellon Trust Company, N.A., as Trusteetrustee (incorporated by reference to Exhibit 4.14.17.2 of our CurrentAnnual Report on Form 8-K,10-K, filed March 15, 2017)on February 14, 2018). |
4.24.6 | | First Supplemental Indenture, dated as of January 11, 2018, to the Indenture, dated as of March 15, 2017, by and among Molson Coors Brewing Company, the guarantors party thereto and The Bank of New York Mellon Trust Company, N.A., as Trusteetrustee (incorporated by reference to Exhibit 4.44.18.2 of our CurrentAnnual Report on Form 8-K,10-K, filed March 15, 2017)on February 14, 2018). |
4.310.1 | | Registration Rights |
4.4 | | Form of 1.900% Senior Note due 2019 (incorporated by reference to Exhibit 4.210.1 of our Current Report on Form 8-K, filed on March 15, 2017)January 22, 2018). |
4.510.2 | | FormSupplement No. 1, dated as of 2.250% Senior Note due 2020January 11, 2018, to the Subsidiary Guarantee Agreement, dated as of July 7, 2017, by and among Molson Coors Brewing Company, the subsidiaries named on Schedule I thereto, and Citibank, N.A., as administrative agent (incorporated by reference to Exhibit 4.310.8.3 of our CurrentAnnual Report on Form 8-K,10-K, filed on March 15, 2017)February 14, 2018).
|
4.6 | | Form of Senior Floating Rate Note due 2019 (incorporated by reference to Exhibit 4.5 of our Current Report on Form 8-K, filed on March 15, 2017).
|
10.1+ | | Executive Employment Agreement, dated as of November 5, 2015, by and between MillerCoors, LLC and Gavin D.K. Hattersley.
|
| 31.1 | | |
| 31.2 | | |
| 32 | | |
| 101.INS | | XBRL Instance Document.* |
| 101.SCH | | XBRL Taxonomy Extension Schema Document.* |
| 101.CAL | | XBRL Taxonomy Extension Calculation Linkbase Document.* |
| 101.LAB | | XBRL Taxonomy Extension Label Linkbase Document.* |
| 101.PRE | | XBRL Taxonomy Extension Presentation Linkbase Document.* |
| 101.DEF | | XBRL Taxonomy Extension Definition Linkbase Document.* |
| | | | |
| * | | Attached as Exhibit 101 to this report are the following documents formatted in XBRL (Extensible Business Reporting Language): (i) the Unaudited Condensed Consolidated Statements of Operations, (ii) the Unaudited Condensed Consolidated Statements of Comprehensive Income (Loss), (iii) the Unaudited Condensed Consolidated Balance Sheets, (iv) the Unaudited Condensed Consolidated Statements of Cash Flows, (v) the Unaudited Condensed Consolidated Statements of Stockholders' Equity and Noncontrolling Interests, (vi) the Notes to Unaudited Condensed Consolidated Financial Statements, and (vii) document and entity information. |
+ | | Represents a management contract or compensatory plan or arrangement. |
SIGNATURE
Pursuant to the requirements of the Securities Exchange Act of 1934, the registrant has duly caused this report to be signed on its behalf by the undersigned thereunto duly authorized.
|
| | | |
| | | | |
| | MOLSON COORS BREWING COMPANY |
| | By: | | /s/ BRIAN C. TABOLT |
| | | | Brian C. Tabolt GlobalVice President and Controller
(Chief Accounting Officer) May 3, 20172, 2018 |