

| UNITED STATES SECURITIES AND EXCHANGE COMMISSION | ||
| Title of each class | Trading Symbol(s) | Name of each exchange on which registered | ||||||||||||
| Common stock, par value $0.0833 per share | TGT | New York Stock Exchange | ||||||||||||
Large accelerated filer | ☒ | Accelerated filer | ||||||||||||||||||||||||||||||
Non-accelerated filer | ☐ | Smaller reporting company | ☐ | |||||||||||||||||||||||||||||
| Emerging growth company | ☐ | |||||||||||||||||||||||||||||||
Financial Statements (unaudited) | ||||||||
| FINANCIAL STATEMENTS | ||||||||
| Consolidated Statements of Operations | |||||||||||||||||||||||
| Three Months Ended | Six Months Ended | ||||||||||||||||||||||
| (millions, except per share data) (unaudited) | July 30, 2022 | July 31, 2021 | July 30, 2022 | July 31, 2021 | |||||||||||||||||||
| Sales | $ | 25,653 | $ | 24,826 | $ | 50,483 | $ | 48,705 | |||||||||||||||
| Other revenue | 384 | 334 | 724 | 652 | |||||||||||||||||||
| Total revenue | 26,037 | 25,160 | 51,207 | 49,357 | |||||||||||||||||||
| Cost of sales | 20,142 | 17,280 | 38,603 | 33,996 | |||||||||||||||||||
| Selling, general and administrative expenses | 5,002 | 4,849 | 9,764 | 9,358 | |||||||||||||||||||
| Depreciation and amortization (exclusive of depreciation included in cost of sales) | 572 | 564 | 1,173 | 1,162 | |||||||||||||||||||
| Operating income | 321 | 2,467 | 1,667 | 4,841 | |||||||||||||||||||
| Net interest expense | 112 | 104 | 224 | 212 | |||||||||||||||||||
| Net other (income) / expense | (8) | (7) | (23) | (350) | |||||||||||||||||||
| Earnings before income taxes | 217 | 2,370 | 1,466 | 4,979 | |||||||||||||||||||
| Provision for income taxes | 34 | 553 | 274 | 1,065 | |||||||||||||||||||
| Net earnings | $ | 183 | $ | 1,817 | $ | 1,192 | $ | 3,914 | |||||||||||||||
| Basic earnings per share | $ | 0.40 | $ | 3.68 | $ | 2.57 | $ | 7.89 | |||||||||||||||
| Diluted earnings per share | $ | 0.39 | $ | 3.65 | $ | 2.55 | $ | 7.82 | |||||||||||||||
| Weighted average common shares outstanding | |||||||||||||||||||||||
| Basic | 461.5 | 493.1 | 463.8 | 495.8 | |||||||||||||||||||
| Diluted | 463.6 | 497.5 | 466.8 | 500.4 | |||||||||||||||||||
| Antidilutive shares | 1.3 | — | 1.0 | — | |||||||||||||||||||
| Consolidated Statements of Operations | |||||||||||||||
| Three Months Ended | Nine Months Ended | ||||||||||||||
| (millions, except per share data) (unaudited) | October 28, 2017 | October 29, 2016 | October 28, 2017 | October 29, 2016 | |||||||||||
| Sales | $ | 16,667 | $ | 16,441 | $ | 49,113 | $ | 48,805 | |||||||
Cost of sales (a) | 11,712 | 11,536 | 34,330 | 33,957 | |||||||||||
| Gross margin | 4,955 | 4,905 | 14,783 | 14,848 | |||||||||||
| Selling, general and administrative expenses | 3,512 | 3,339 | 10,027 | 9,741 | |||||||||||
Depreciation and amortization (exclusive of depreciation included in cost of sales) (a) | 574 | 505 | 1,596 | 1,486 | |||||||||||
| Earnings from continuing operations before interest expense and income taxes | 869 | 1,061 | 3,160 | 3,621 | |||||||||||
| Net interest expense | 254 | 142 | 532 | 864 | |||||||||||
| Earnings from continuing operations before income taxes | 615 | 919 | 2,628 | 2,757 | |||||||||||
| Provision for income taxes | 137 | 311 | 802 | 910 | |||||||||||
| Net earnings from continuing operations | 478 | 608 | 1,826 | 1,847 | |||||||||||
| Discontinued operations, net of tax | 2 | — | 7 | 73 | |||||||||||
| Net earnings | $ | 480 | $ | 608 | $ | 1,833 | $ | 1,920 | |||||||
| Basic earnings per share | |||||||||||||||
| Continuing operations | $ | 0.88 | $ | 1.07 | $ | 3.33 | $ | 3.16 | |||||||
| Discontinued operations | — | — | 0.01 | 0.12 | |||||||||||
| Net earnings per share | $ | 0.88 | $ | 1.07 | $ | 3.34 | $ | 3.29 | |||||||
| Diluted earnings per share | |||||||||||||||
| Continuing operations | $ | 0.87 | $ | 1.06 | $ | 3.31 | $ | 3.14 | |||||||
| Discontinued operations | — | — | 0.01 | 0.12 | |||||||||||
| Net earnings per share | $ | 0.88 | $ | 1.06 | $ | 3.32 | $ | 3.26 | |||||||
| Weighted average common shares outstanding | |||||||||||||||
| Basic | 544.5 | 570.1 | 548.7 | 583.5 | |||||||||||
| Dilutive impact of share-based awards | 3.4 | 4.7 | 3.1 | 5.0 | |||||||||||
| Diluted | 547.9 | 574.8 | 551.8 | 588.5 | |||||||||||
| Antidilutive shares | 4.5 | 0.2 | 4.1 | 0.1 | |||||||||||
| Dividends declared per share | $ | 0.62 | $ | 0.60 | $ | 1.84 | $ | 1.76 | |||||||
| TARGET CORPORATION |  | Q2 2022 Form 10-Q | 1 | ||||||||
| Consolidated Statements of Comprehensive Income | ||||||||||||||
| Three Months Ended | Nine Months Ended | |||||||||||||
| (millions) (unaudited) | October 28, 2017 | October 29, 2016 | October 28, 2017 | October 29, 2016 | ||||||||||
| Net earnings | $ | 480 | $ | 608 | $ | 1,833 | $ | 1,920 | ||||||
| Other comprehensive income | ||||||||||||||
| Pension and other benefit liabilities, net of taxes of $5, $3, $15 and $11 | 8 | 6 | 22 | 17 | ||||||||||
| Currency translation adjustment and cash flow hedges, net of taxes of $1, $1, $2, and $2 | (2 | ) | — | 6 | 5 | |||||||||
| Other comprehensive income | 6 | 6 | 28 | 22 | ||||||||||
| Comprehensive income | $ | 486 | $ | 614 | $ | 1,861 | $ | 1,942 | ||||||
| FINANCIAL STATEMENTS | ||||||||
| Consolidated Statements of Comprehensive Income | |||||||||||||||||||||||
| Three Months Ended | Six Months Ended | ||||||||||||||||||||||
| (millions) (unaudited) | July 30, 2022 | July 31, 2021 | July 30, 2022 | July 31, 2021 | |||||||||||||||||||
| Net earnings | $ | 183 | $ | 1,817 | $ | 1,192 | $ | 3,914 | |||||||||||||||
| Other comprehensive income, net of tax | |||||||||||||||||||||||
| Pension benefit liabilities | 11 | 20 | 22 | 42 | |||||||||||||||||||
| Cash flow hedges and currency translation adjustment | (28) | (8) | 162 | 1 | |||||||||||||||||||
| Other comprehensive income | (17) | 12 | 184 | 43 | |||||||||||||||||||
| Comprehensive income | $ | 166 | $ | 1,829 | $ | 1,376 | $ | 3,957 | |||||||||||||||
| TARGET CORPORATION | | Q2 2022 Form 10-Q | 2 | ||||||||
| Consolidated Statements of Financial Position | |||||||||||
| (millions) (unaudited) | October 28, 2017 | January 28, 2017 | October 29, 2016 | ||||||||
| Assets | |||||||||||
| Cash and cash equivalents | $ | 2,725 | $ | 2,512 | $ | 1,231 | |||||
| Inventory | 10,586 | 8,309 | 10,057 | ||||||||
| Assets of discontinued operations | 6 | 69 | 62 | ||||||||
| Other current assets | 1,392 | 1,100 | 1,492 | ||||||||
| Total current assets | 14,709 | 11,990 | 12,842 | ||||||||
| Property and equipment | |||||||||||
| Land | 6,087 | 6,106 | 6,106 | ||||||||
| Buildings and improvements | 28,310 | 27,611 | 27,518 | ||||||||
| Fixtures and equipment | 5,548 | 5,503 | 5,467 | ||||||||
| Computer hardware and software | 2,658 | 2,651 | 2,538 | ||||||||
| Construction-in-progress | 389 | 200 | 219 | ||||||||
| Accumulated depreciation | (17,880 | ) | (17,413 | ) | (16,946 | ) | |||||
| Property and equipment, net | 25,112 | 24,658 | 24,902 | ||||||||
| Noncurrent assets of discontinued operations | 9 | 12 | 17 | ||||||||
| Other noncurrent assets | 878 | 771 | 842 | ||||||||
| Total assets | $ | 40,708 | $ | 37,431 | $ | 38,603 | |||||
| Liabilities and shareholders’ investment | |||||||||||
| Accounts payable | $ | 9,986 | $ | 7,252 | $ | 8,250 | |||||
| Accrued and other current liabilities | 4,036 | 3,737 | 3,662 | ||||||||
| Current portion of long-term debt and other borrowings | 1,354 | 1,718 | 729 | ||||||||
| Total current liabilities | 15,376 | 12,707 | 12,641 | ||||||||
| Long-term debt and other borrowings | 11,277 | 11,031 | 12,097 | ||||||||
| Deferred income taxes | 944 | 861 | 920 | ||||||||
| Liabilities of discontinued operations | 11 | 19 | 19 | ||||||||
| Other noncurrent liabilities | 1,963 | 1,860 | 1,857 | ||||||||
| Total noncurrent liabilities | 14,195 | 13,771 | 14,893 | ||||||||
| Shareholders’ investment | |||||||||||
| Common stock | 45 | 46 | 47 | ||||||||
| Additional paid-in capital | 5,762 | 5,661 | 5,598 | ||||||||
| Retained earnings | 5,940 | 5,884 | 6,031 | ||||||||
| Accumulated other comprehensive loss | (610 | ) | (638 | ) | (607 | ) | |||||
| Total shareholders’ investment | 11,137 | 10,953 | 11,069 | ||||||||
| Total liabilities and shareholders’ investment | $ | 40,708 | $ | 37,431 | $ | 38,603 | |||||
| FINANCIAL STATEMENTS | ||||||||
| Consolidated Statements of Financial Position | |||||||||||||||||
| (millions, except footnotes) (unaudited) | July 30, 2022 | January 29, 2022 | July 31, 2021 | ||||||||||||||
| Assets | |||||||||||||||||
| Cash and cash equivalents | $ | 1,117 | $ | 5,911 | $ | 7,368 | |||||||||||
| Inventory | 15,320 | 13,902 | 11,259 | ||||||||||||||
| Other current assets | 2,016 | 1,760 | 1,604 | ||||||||||||||
| Total current assets | 18,453 | 21,573 | 20,231 | ||||||||||||||
| Property and equipment | |||||||||||||||||
| Land | 6,161 | 6,164 | 6,148 | ||||||||||||||
| Buildings and improvements | 33,694 | 32,985 | 32,133 | ||||||||||||||
| Fixtures and equipment | 6,744 | 6,407 | 5,892 | ||||||||||||||
| Computer hardware and software | 2,684 | 2,505 | 2,260 | ||||||||||||||
| Construction-in-progress | 2,245 | 1,257 | 944 | ||||||||||||||
| Accumulated depreciation | (21,708) | (21,137) | (20,133) | ||||||||||||||
| Property and equipment, net | 29,820 | 28,181 | 27,244 | ||||||||||||||
| Operating lease assets | 2,542 | 2,556 | 2,503 | ||||||||||||||
| Other noncurrent assets | 1,655 | 1,501 | 1,407 | ||||||||||||||
| Total assets | $ | 52,470 | $ | 53,811 | $ | 51,385 | |||||||||||
| Liabilities and shareholders’ investment | |||||||||||||||||
| Accounts payable | $ | 14,891 | $ | 15,478 | $ | 12,632 | |||||||||||
| Accrued and other current liabilities | 5,905 | 6,098 | 5,600 | ||||||||||||||
| Current portion of long-term debt and other borrowings | 1,649 | 171 | 1,190 | ||||||||||||||
| Total current liabilities | 22,445 | 21,747 | 19,422 | ||||||||||||||
| Long-term debt and other borrowings | 13,453 | 13,549 | 11,589 | ||||||||||||||
| Noncurrent operating lease liabilities | 2,543 | 2,493 | 2,462 | ||||||||||||||
| Deferred income taxes | 1,862 | 1,566 | 1,146 | ||||||||||||||
| Other noncurrent liabilities | 1,575 | 1,629 | 1,906 | ||||||||||||||
| Total noncurrent liabilities | 19,433 | 19,237 | 17,103 | ||||||||||||||
| Shareholders’ investment | |||||||||||||||||
| Common stock | 38 | 39 | 41 | ||||||||||||||
| Additional paid-in capital | 6,502 | 6,421 | 6,332 | ||||||||||||||
| Retained earnings | 4,421 | 6,920 | 9,200 | ||||||||||||||
| Accumulated other comprehensive loss | (369) | (553) | (713) | ||||||||||||||
| Total shareholders’ investment | 10,592 | 12,827 | 14,860 | ||||||||||||||
| Total liabilities and shareholders’ investment | $ | 52,470 | $ | 53,811 | $ | 51,385 | |||||||||||
| TARGET CORPORATION | | Q2 2022 Form 10-Q | 3 | ||||||||
| Consolidated Statements of Cash Flows | |||||||
| Nine Months Ended | |||||||
| (millions) (unaudited) | October 28, 2017 | October 29, 2016 | |||||
| Operating activities | |||||||
| Net earnings | $ | 1,833 | $ | 1,920 | |||
| Earnings from discontinued operations, net of tax | 7 | 73 | |||||
| Net earnings from continuing operations | 1,826 | 1,847 | |||||
| Adjustments to reconcile net earnings to cash provided by operations | |||||||
| Depreciation and amortization | 1,784 | 1,686 | |||||
| Share-based compensation expense | 81 | 85 | |||||
| Deferred income taxes | 37 | 83 | |||||
| Loss on debt extinguishment | 123 | 422 | |||||
Noncash losses / (gains) and other, net | 189 | (5 | ) | ||||
| Changes in operating accounts | |||||||
| Inventory | (2,277 | ) | (1,455 | ) | |||
| Other assets | (89 | ) | (14 | ) | |||
| Accounts payable | 2,738 | 832 | |||||
| Accrued and other liabilities | 2 | (711 | ) | ||||
| Cash provided by operating activities—continuing operations | 4,414 | 2,770 | |||||
Cash provided by operating activities—discontinued operations | 75 | 111 | |||||
| Cash provided by operations | 4,489 | 2,881 | |||||
| Investing activities | |||||||
| Expenditures for property and equipment | (2,049 | ) | (1,184 | ) | |||
| Proceeds from disposal of property and equipment | 27 | 23 | |||||
| Other investments | (62 | ) | 23 | ||||
| Cash required for investing activities | (2,084 | ) | (1,138 | ) | |||
| Financing activities | |||||||
| Change in commercial paper, net | — | 89 | |||||
| Additions to long-term debt | 739 | 1,977 | |||||
| Reductions of long-term debt | (1,087 | ) | (2,625 | ) | |||
| Dividends paid | (1,001 | ) | (1,011 | ) | |||
| Repurchase of stock | (757 | ) | (3,034 | ) | |||
| Prepayment of accelerated share repurchase | (111 | ) | (120 | ) | |||
| Stock option exercises | 25 | 166 | |||||
| Cash required for financing activities | (2,192 | ) | (4,558 | ) | |||
Net increase / (decrease) in cash and cash equivalents | 213 | (2,815 | ) | ||||
| Cash and cash equivalents at beginning of period | 2,512 | 4,046 | |||||
| Cash and cash equivalents at end of period | $ | 2,725 | $ | 1,231 | |||
| FINANCIAL STATEMENTS | ||||||||
| Consolidated Statements of Cash Flows | ||||||||||||||
| Six Months Ended | ||||||||||||||
| (millions) (unaudited) | July 30, 2022 | July 31, 2021 | ||||||||||||
| Operating activities | ||||||||||||||
| Net earnings | $ | 1,192 | $ | 3,914 | ||||||||||
| Adjustments to reconcile net earnings to cash (required for) provided by operating activities: | ||||||||||||||
| Depreciation and amortization | 1,329 | 1,300 | ||||||||||||
| Share-based compensation expense | 122 | 138 | ||||||||||||
| Deferred income taxes | 227 | 143 | ||||||||||||
| Gain on Dermstore sale | — | (335) | ||||||||||||
Noncash losses / (gains) and other, net | 108 | 7 | ||||||||||||
| Changes in operating accounts: | ||||||||||||||
| Inventory | (1,418) | (606) | ||||||||||||
| Other assets | (179) | 3 | ||||||||||||
| Accounts payable | (784) | (311) | ||||||||||||
| Accrued and other liabilities | (644) | (831) | ||||||||||||
| Cash (required for) provided by operating activities | (47) | 3,422 | ||||||||||||
| Investing activities | ||||||||||||||
| Expenditures for property and equipment | (2,523) | (1,338) | ||||||||||||
| Proceeds from disposal of property and equipment | 4 | 15 | ||||||||||||
| Proceeds from Dermstore sale | — | 356 | ||||||||||||
| Other investments | 1 | (5) | ||||||||||||
| Cash required for investing activities | (2,518) | (972) | ||||||||||||
| Financing activities | ||||||||||||||
| Change in commercial paper, net | 1,545 | — | ||||||||||||
| Reductions of long-term debt | (113) | (72) | ||||||||||||
| Dividends paid | (842) | (676) | ||||||||||||
| Repurchase of stock | (2,821) | (2,850) | ||||||||||||
| Stock option exercises | 2 | 5 | ||||||||||||
| Cash required for financing activities | (2,229) | (3,593) | ||||||||||||
| Net decrease in cash and cash equivalents | (4,794) | (1,143) | ||||||||||||
| Cash and cash equivalents at beginning of period | 5,911 | 8,511 | ||||||||||||
| Cash and cash equivalents at end of period | $ | 1,117 | $ | 7,368 | ||||||||||
| Supplemental information | ||||||||||||||
| Leased assets obtained in exchange for new finance lease liabilities | $ | 107 | $ | 182 | ||||||||||
| Leased assets obtained in exchange for new operating lease liabilities | 97 | 386 | ||||||||||||
| TARGET CORPORATION | | Q2 2022 Form 10-Q | 4 | ||||||||
| Consolidated Statements of Shareholders’ Investment | ||||||||||||||||||||||
| Common | Stock | Additional | Accumulated Other | |||||||||||||||||||
| Stock | Par | Paid-in | Retained | Comprehensive | ||||||||||||||||||
| (millions) (unaudited) | Shares | Value | Capital | Earnings | (Loss) / Income | Total | ||||||||||||||||
| January 30, 2016 | 602.2 | $ | 50 | $ | 5,348 | $ | 8,188 | $ | (629 | ) | $ | 12,957 | ||||||||||
| Net earnings | — | — | — | 2,737 | — | 2,737 | ||||||||||||||||
| Other comprehensive loss | — | — | — | — | (9 | ) | (9 | ) | ||||||||||||||
| Dividends declared | — | — | — | (1,359 | ) | — | (1,359 | ) | ||||||||||||||
| Repurchase of stock | (50.9 | ) | (4 | ) | — | (3,682 | ) | — | (3,686 | ) | ||||||||||||
| Stock options and awards | 4.9 | — | 313 | — | — | 313 | ||||||||||||||||
| January 28, 2017 | 556.2 | $ | 46 | $ | 5,661 | $ | 5,884 | $ | (638 | ) | $ | 10,953 | ||||||||||
| Net earnings | — | — | — | 1,833 | — | 1,833 | ||||||||||||||||
| Other comprehensive income | — | — | — | — | 28 | 28 | ||||||||||||||||
| Dividends declared | — | — | — | (1,016 | ) | — | (1,016 | ) | ||||||||||||||
| Repurchase of stock | (13.3 | ) | (1 | ) | — | (750 | ) | — | (751 | ) | ||||||||||||
| Stock to be received upon settlement of ASR | — | — | — | (11 | ) | — | (11 | ) | ||||||||||||||
| Stock options and awards | 1.0 | — | 101 | — | — | 101 | ||||||||||||||||
| October 28, 2017 | 543.9 | $ | 45 | $ | 5,762 | $ | 5,940 | $ | (610 | ) | $ | 11,137 | ||||||||||
| FINANCIAL STATEMENTS | ||||||||
| Consolidated Statements of Shareholders’ Investment | |||||||||||||||||||||||||||||||||||
| Common | Stock | Additional | Accumulated Other | ||||||||||||||||||||||||||||||||
| Stock | Par | Paid-in | Retained | Comprehensive | |||||||||||||||||||||||||||||||
| (millions) (unaudited) | Shares | Value | Capital | Earnings | (Loss) / Income | Total | |||||||||||||||||||||||||||||
| January 30, 2021 | 500.9 | $ | 42 | $ | 6,329 | $ | 8,825 | $ | (756) | $ | 14,440 | ||||||||||||||||||||||||
| Net earnings | — | — | — | 2,097 | — | 2,097 | |||||||||||||||||||||||||||||
| Other comprehensive income | — | — | — | — | 31 | 31 | |||||||||||||||||||||||||||||
| Dividends declared | — | — | — | (343) | — | (343) | |||||||||||||||||||||||||||||
| Repurchase of stock | (6.1) | (1) | — | (1,207) | — | (1,208) | |||||||||||||||||||||||||||||
| Stock options and awards | 1.3 | — | (58) | — | — | (58) | |||||||||||||||||||||||||||||
| May 1, 2021 | 496.1 | $ | 41 | $ | 6,271 | $ | 9,372 | $ | (725) | $ | 14,959 | ||||||||||||||||||||||||
| Net earnings | — | — | — | 1,817 | — | 1,817 | |||||||||||||||||||||||||||||
| Other comprehensive income | — | — | — | — | 12 | 12 | |||||||||||||||||||||||||||||
| Dividends declared | — | — | — | (445) | — | (445) | |||||||||||||||||||||||||||||
| Repurchase of stock | (6.6) | — | — | (1,544) | — | (1,544) | |||||||||||||||||||||||||||||
| Stock options and awards | 0.2 | — | 61 | — | — | 61 | |||||||||||||||||||||||||||||
| July 31, 2021 | 489.7 | $ | 41 | $ | 6,332 | $ | 9,200 | $ | (713) | $ | 14,860 | ||||||||||||||||||||||||
| Net earnings | — | — | — | 1,488 | — | 1,488 | |||||||||||||||||||||||||||||
| Other comprehensive income | — | — | — | — | 26 | 26 | |||||||||||||||||||||||||||||
| Dividends declared | — | — | — | (439) | — | (439) | |||||||||||||||||||||||||||||
| Repurchase of stock | (8.8) | (1) | — | (2,180) | — | (2,181) | |||||||||||||||||||||||||||||
| Stock options and awards | — | — | 49 | — | — | 49 | |||||||||||||||||||||||||||||
| October 30, 2021 | 480.9 | $ | 40 | $ | 6,381 | $ | 8,069 | $ | (687) | $ | 13,803 | ||||||||||||||||||||||||
| Net earnings | — | — | — | 1,544 | — | 1,544 | |||||||||||||||||||||||||||||
| Other comprehensive income | — | — | — | — | 134 | 134 | |||||||||||||||||||||||||||||
| Dividends declared | — | — | — | (428) | — | (428) | |||||||||||||||||||||||||||||
| Repurchase of stock | (9.8) | (1) | — | (2,265) | — | (2,266) | |||||||||||||||||||||||||||||
| Stock options and awards | 0.2 | — | 40 | — | — | 40 | |||||||||||||||||||||||||||||
| January 29, 2022 | 471.3 | $ | 39 | $ | 6,421 | $ | 6,920 | $ | (553) | $ | 12,827 | ||||||||||||||||||||||||
| TARGET CORPORATION | | Q2 2022 Form 10-Q | 5 | ||||||||
| FINANCIAL STATEMENTS | ||||||||
| Consolidated Statements of Shareholders’ Investment | |||||||||||||||||||||||||||||||||||
| Common | Stock | Additional | Accumulated Other | ||||||||||||||||||||||||||||||||
| Stock | Par | Paid-in | Retained | Comprehensive | |||||||||||||||||||||||||||||||
| (millions) (unaudited) | Shares | Value | Capital | Earnings | (Loss) / Income | Total | |||||||||||||||||||||||||||||
| January 29, 2022 | 471.3 | $ | 39 | $ | 6,421 | $ | 6,920 | $ | (553) | $ | 12,827 | ||||||||||||||||||||||||
| Net earnings | — | — | — | 1,009 | — | 1,009 | |||||||||||||||||||||||||||||
| Other comprehensive income | — | — | — | — | 201 | 201 | |||||||||||||||||||||||||||||
| Dividends declared | — | — | — | (426) | — | (426) | |||||||||||||||||||||||||||||
| Repurchase of stock | (0.1) | — | — | (10) | — | (10) | |||||||||||||||||||||||||||||
| Accelerated share repurchase pending final settlement | (8.9) | (1) | (751) | (1,998) | — | (2,750) | |||||||||||||||||||||||||||||
| Stock options and awards | 1.4 | 1 | (78) | — | — | (77) | |||||||||||||||||||||||||||||
| April 30, 2022 | 463.7 | $ | 39 | $ | 5,592 | $ | 5,495 | $ | (352) | $ | 10,774 | ||||||||||||||||||||||||
| Net earnings | — | — | — | 183 | — | 183 | |||||||||||||||||||||||||||||
| Other comprehensive income | — | — | — | — | (17) | (17) | |||||||||||||||||||||||||||||
| Dividends declared | — | — | — | (502) | — | (502) | |||||||||||||||||||||||||||||
| Repurchase of stock | (3.6) | (1) | 870 | (755) | — | 114 | |||||||||||||||||||||||||||||
| Stock options and awards | 0.1 | — | 40 | — | — | 40 | |||||||||||||||||||||||||||||
| July 31, 2022 | 460.2 | $ | 38 | $ | 6,502 | $ | 4,421 | $ | (369) | $ | 10,592 | ||||||||||||||||||||||||
| TARGET CORPORATION | | Q2 2022 Form 10-Q | 6 | ||||||||
| FINANCIAL STATEMENTS | ||||||||
| INDEX | ||||||||
| INDEX TO NOTES | |||||||||||
| TARGET CORPORATION | | Q2 2022 Form 10-Q | 7 | ||||||||
| FINANCIAL STATEMENTS | ||||||||
| NOTES | ||||||||
| TARGET CORPORATION | | Q2 2022 Form 10-Q | 8 | ||||||||
| FINANCIAL STATEMENTS | ||||||||
| NOTES | ||||||||
| Revenues | Three Months Ended | Six Months Ended | |||||||||||||||||||||
| (millions) | July 30, 2022 | July 31, 2021 | July 30, 2022 | July 31, 2021 | |||||||||||||||||||
Apparel and accessories (a) | $ | 4,617 | $ | 4,751 | $ | 8,856 | $ | 9,020 | |||||||||||||||
Beauty and household essentials (b) | 7,208 | 6,726 | 14,261 | 13,090 | |||||||||||||||||||
Food and beverage (c) | 5,268 | 4,687 | 10,773 | 9,543 | |||||||||||||||||||
Hardlines (d) | 3,866 | 3,867 | 7,579 | 7,813 | |||||||||||||||||||
Home furnishings and décor (e) | 4,647 | 4,748 | 8,918 | 9,158 | |||||||||||||||||||
| Other | 47 | 47 | 96 | 81 | |||||||||||||||||||
| Sales | 25,653 | 24,826 | 50,483 | 48,705 | |||||||||||||||||||
| Credit card profit sharing | 181 | 172 | 366 | 343 | |||||||||||||||||||
| Other | 203 | 162 | 358 | 309 | |||||||||||||||||||
| Other revenue | 384 | 334 | 724 | 652 | |||||||||||||||||||
| Total revenue | $ | 26,037 | $ | 25,160 | $ | 51,207 | $ | 49,357 | |||||||||||||||
| Gift Card Liability Activity | January 29, 2022 | Gift Cards Issued During Current Period But Not Redeemed (b) | Revenue Recognized From Beginning Liability | July 30, 2022 | |||||||||||||||||||
| (millions) | |||||||||||||||||||||||
Gift card liability (a) | $ | 1,202 | $ | 423 | $ | (660) | $ | 965 | |||||||||||||||
| TARGET CORPORATION | | Q2 2022 Form 10-Q | 9 | ||||||||
| FINANCIAL STATEMENTS | ||||||||
| Financial Instruments Measured On a Recurring Basis | Fair Value | ||||||||||||||||||||||
| (millions) | Classification | Measurement Level | July 30, 2022 | January 29, 2022 | July 31, 2021 | ||||||||||||||||||
| Assets | |||||||||||||||||||||||
| Short-term investments | Cash and Cash Equivalents | Level 1 | $ | 189 | $ | 4,985 | $ | 6,439 | |||||||||||||||
| Prepaid forward contracts | Other Current Assets | Level 1 | 26 | 35 | 44 | ||||||||||||||||||
| Interest rate swaps | Other Current Assets | Level 2 | 34 | 17 | — | ||||||||||||||||||
| Interest rate swaps | Other Noncurrent Assets | Level 2 | 290 | 135 | 160 | ||||||||||||||||||
| Liabilities | |||||||||||||||||||||||
| Interest rate swaps | Other Noncurrent Liabilities | Level 2 | 6 | — | — | ||||||||||||||||||
| Fair Value Measurements - Recurring Basis | Fair Value at | |||||||||||
| (millions) | Pricing Category | October 28, 2017 | January 28, 2017 | October 29, 2016 | ||||||||
| Assets | ||||||||||||
| Cash and cash equivalents | ||||||||||||
| Short-term investments held by U.S. entities | Level 1 | $ | 953 | $ | 1,110 | $ | — | |||||
Short-term investments held by entities located outside the U.S. (a) | Level 1 | 1,050 | 762 | 514 | ||||||||
| Other current assets | ||||||||||||
| Prepaid forward contracts | Level 1 | 30 | 26 | 28 | ||||||||
| Beneficial interest asset | Level 3 | 3 | 12 | 10 | ||||||||
Interest rate swaps (b) | Level 2 | — | 1 | — | ||||||||
| Other noncurrent assets | ||||||||||||
Interest rate swaps (b) | Level 2 | 1 | 4 | 19 | ||||||||
| Beneficial interest asset | Level 3 | — | — | 5 | ||||||||
Significant Financial Instruments Not Measured at Fair Value (a) (millions) | July 30, 2022 | January 29, 2022 | July 31, 2021 | |||||||||||||||||||||||
| Carrying Amount | Fair Value | Carrying Amount | Fair Value | Carrying Amount | Fair Value | |||||||||||||||||||||
Long-term debt, including current portion (b) | $ | 11,511 | $ | 11,529 | $ | 11,568 | $ | 12,808 | $ | 10,620 | $ | 12,594 | ||||||||||||||
Significant Financial Instruments not Measured at Fair Value (a) (millions) | October 28, 2017 | January 28, 2017 | October 29, 2016 | |||||||||||||||||
Carrying Amount | Fair Value | Carrying Amount | Fair Value | Carrying Amount | Fair Value | |||||||||||||||
Debt (b) | $ | 11,522 | $ | 12,403 | $ | 11,715 | $ | 12,545 | $ | 11,802 | $ | 13,171 | ||||||||
| (millions) | October 28, 2017 | January 28, 2017 | October 29, 2016 | ||||||
| Cash held by U.S. entities | $ | 242 | $ | 257 | $ | 247 | |||
Cash held by entities located outside the U.S. (a) | 34 | 17 | 35 | ||||||
| Short-term investments held by U.S. entities | 953 | 1,110 | — | ||||||
Short-term investments held by entities located outside the U.S. (a) | 1,050 | 762 | 514 | ||||||
| Receivables from third-party financial institutions for credit and debit card transactions | 446 | 366 | 435 | ||||||
| Cash and cash equivalents | $ | 2,725 | $ | 2,512 | $ | 1,231 | |||
| TARGET CORPORATION | | Q2 2022 Form 10-Q | 10 | ||||||||
| FINANCIAL STATEMENTS | ||||||||
| NOTES | ||||||||
Effect of Hedges on Debt (millions) | July 30, 2022 | January 29, 2022 | July 31, 2021 | |||||||||||||||||
| Long-term debt and other borrowings | ||||||||||||||||||||
| Carrying amount of hedged debt | $ | 2,263 | $ | 1,572 | $ | 1,649 | ||||||||||||||
| Cumulative hedging adjustments, included in carrying amount | 22 | 77 | 154 | |||||||||||||||||
| Effect of Hedges on Net Interest Expense | Three Months Ended | Six Months Ended | |||||||||||||||||||||
| (millions) | July 30, 2022 | July 31, 2021 | July 30, 2022 | July 31, 2021 | |||||||||||||||||||
| Gain (loss) on fair value hedges recognized in Net Interest Expense | |||||||||||||||||||||||
| Interest rate swap designated as fair value hedges | $ | 49 | $ | 22 | $ | (55) | $ | (29) | |||||||||||||||
| Hedged debt | (49) | (22) | 55 | 29 | |||||||||||||||||||
| Total | $ | — | $ | — | $ | — | $ | — | |||||||||||||||
| Three Months Ended | Nine Months Ended | ||||||||||||||
| (dollars in millions) | October 28, 2017 | October 29, 2016 | October 28, 2017 | October 29, 2016 | |||||||||||
| Income tax expense | $ | 137 | $ | 311 | $ | 802 | $ | 910 | |||||||
Effective tax rate (a) | 22.3 | % | 33.8 | % | 30.5 | % | 33.0 | % | |||||||
| Nine Months Ended | |||||||
| (millions, except per share data) | October 28, 2017 | October 29, 2016 | |||||
| Total number of shares purchased | 10.8 | 38.5 | |||||
| Average price paid per share | $ | 56.80 | $ | 72.87 | |||
| Total investment | $ | 611 | $ | 2,807 | |||
| Share Repurchase Activity | Three Months Ended | Six Months Ended | |||||||||||||||||||||
| (millions, except per share data) | July 31, 2022 (a) | July 31, 2021 | July 31, 2022 (a) | July 31, 2021 | |||||||||||||||||||
| Number of shares purchased | 12.5 | 6.6 | 12.5 | 12.7 | |||||||||||||||||||
| Average price paid per share | $ | 211.58 | $ | 233.81 | $ | 211.57 | $ | 213.06 | |||||||||||||||
| Total investment | $ | 2,636 | $ | 1,535 | $ | 2,646 | $ | 2,700 | |||||||||||||||
| TARGET CORPORATION | | Q2 2022 Form 10-Q | 11 | ||||||||
| FINANCIAL STATEMENTS | ||||||||
| NOTES | ||||||||
| Net Pension Benefits Expense | Three Months Ended | Nine Months Ended | |||||||||||||
| (millions) | October 28, 2017 | October 29, 2016 | October 28, 2017 | October 29, 2016 | |||||||||||
| Service cost | $ | 21 | $ | 20 | $ | 63 | $ | 61 | |||||||
| Interest cost | 34 | 34 | 103 | 103 | |||||||||||
| Expected return on assets | (61 | ) | (64 | ) | (184 | ) | (193 | ) | |||||||
| Amortization of losses | 15 | 12 | 45 | 37 | |||||||||||
| Amortization of prior service cost | (3 | ) | (2 | ) | (8 | ) | (8 | ) | |||||||
| Total | $ | 6 | $ | — | $ | 19 | $ | — | |||||||
| Net Pension Benefits Expense | Three Months Ended | Six Months Ended | ||||||||||||||||||||||||
| (millions) | Classification | July 30, 2022 | July 31, 2021 | July 30, 2022 | July 31, 2021 | |||||||||||||||||||||
| Service cost benefits earned | SG&A | $ | 23 | $ | 24 | $ | 46 | $ | 48 | |||||||||||||||||
| Interest cost on projected benefit obligation | Net Other (Income) / Expense | 30 | 24 | 59 | 48 | |||||||||||||||||||||
| Expected return on assets | Net Other (Income) / Expense | (58) | (59) | (117) | (118) | |||||||||||||||||||||
| Amortization of losses | Net Other (Income) / Expense | 15 | 28 | 30 | 57 | |||||||||||||||||||||
| Amortization of prior service cost | Net Other (Income) / Expense | 10 | (1) | 10 | (1) | |||||||||||||||||||||
| Total | $ | 20 | $ | 16 | $ | 28 | $ | 34 | ||||||||||||||||||
| Change in Accumulated Other Comprehensive Income (Loss) | Cash Flow Hedges | Currency Translation Adjustment | Pension | Total | |||||||||||||||||||
| (millions) | |||||||||||||||||||||||
| January 29, 2022 | $ | 49 | $ | (19) | $ | (583) | $ | (553) | |||||||||||||||
| Other comprehensive income (loss) before reclassifications, net of tax | 163 | (1) | — | 162 | |||||||||||||||||||
| Amounts reclassified from AOCI, net of tax | — | — | 22 | 22 | |||||||||||||||||||
| July 30, 2022 | $ | 212 | $ | (20) | $ | (561) | $ | (369) | |||||||||||||||
| TARGET CORPORATION | | Q2 2022 Form 10-Q | 12 | ||||||||
| (millions) | Cash Flow Hedges | Currency Translation Adjustment | Pension and Other Benefits | Total | |||||||||||
| January 28, 2017 | $ | (16 | ) | $ | (21 | ) | $ | (601 | ) | $ | (638 | ) | |||
| Other comprehensive income before reclassifications | — | 3 | 1 | 4 | |||||||||||
| Amounts reclassified from AOCI | 3 | (a) | — | 21 | (b) | 24 | |||||||||
| October 28, 2017 | $ | (13 | ) | $ | (18 | ) | $ | (579 | ) | $ | (610 | ) | |||
| MANAGEMENT'S DISCUSSION AND ANALYSIS | ||||||||
| FINANCIAL SUMMARY | ||||||||
| Business Segment Results | Three Months Ended | Nine Months Ended | |||||||||||||
| (millions) | October 28, 2017 | October 29, 2016 | October 28, 2017 | October 29, 2016 | |||||||||||
| Sales | $ | 16,667 | $ | 16,441 | $ | 49,113 | $ | 48,805 | |||||||
Cost of sales (a) | 11,712 | 11,536 | 34,330 | 33,957 | |||||||||||
| Gross margin | 4,955 | 4,905 | 14,783 | 14,848 | |||||||||||
Selling, general, and administrative expenses (c) | 3,512 | 3,343 | 10,027 | 9,741 | |||||||||||
Depreciation and amortization (exclusive of depreciation included in cost of sales) (a) | 574 | 505 | 1,596 | 1,486 | |||||||||||
| Segment earnings before interest expense and income taxes | 869 | 1,057 | 3,160 | 3,621 | |||||||||||
Pharmacy Transaction-related costs (b)(c) | — | 4 | — | — | |||||||||||
| Earnings from continuing operations before interest expense and income taxes | 869 | 1,061 | 3,160 | 3,621 | |||||||||||
| Net interest expense | 254 | 142 | 532 | 864 | |||||||||||
| Earnings from continuing operations before income taxes | $ | 615 | $ | 919 | $ | 2,628 | $ | 2,757 | |||||||
Reconciliation of Segment Assets to Total Assets (millions) | October 28, 2017 | January 28, 2017 | October 29, 2016 | ||||||||
| Segment assets | $ | 40,693 | $ | 37,350 | $ | 38,524 | |||||
| Assets of discontinued operations | 15 | 81 | 79 | ||||||||
| Total assets | $ | 40,708 | $ | 37,431 | $ | 38,603 | |||||
| Earnings Per Share | Three Months Ended | Six Months Ended | |||||||||||||||||||||||||||||||||
| July 30, 2022 | July 31, 2021 | Change | July 30, 2022 | July 31, 2021 | Change | ||||||||||||||||||||||||||||||
| GAAP diluted earnings per share | $ | 0.39 | $ | 3.65 | (89.2) | % | $ | 2.55 | $ | 7.82 | (67.4) | % | |||||||||||||||||||||||
| Adjustments | — | (0.01) | 0.03 | (0.48) | |||||||||||||||||||||||||||||||
| Adjusted diluted earnings per share | $ | 0.39 | $ | 3.64 | (89.2) | % | $ | 2.59 | $ | 7.34 | (64.8) | % | |||||||||||||||||||||||
| Earnings Per Share from Continuing Operations | Three Months Ended | Nine Months Ended | |||||||||||||||||||
| October 28, 2017 | October 29, 2016 | Change | October 28, 2017 | October 29, 2016 | Change | ||||||||||||||||
| GAAP diluted earnings per share | $ | 0.87 | $ | 1.06 | (17.7 | )% | $ | 3.31 | $ | 3.14 | 5.4 | % | |||||||||
| Adjustments | 0.04 | (0.01 | ) | 0.03 | 0.42 | ||||||||||||||||
| Adjusted diluted earnings per share | $ | 0.91 | $ | 1.04 | (13.1 | )% | $ | 3.34 | $ | 3.56 | (6.2 | )% | |||||||||
| TARGET CORPORATION | | Q2 2022 Form 10-Q | 13 | ||||||||
| MANAGEMENT'S DISCUSSION AND ANALYSIS | ||||||||
| ANALYSIS OF RESULTS OF OPERATIONS | ||||||||
| Summary of Operating Income | Three Months Ended | Six Months Ended | |||||||||||||||||||||||||||||||||
| (dollars in millions) | July 30, 2022 | July 31, 2021 | Change | July 30, 2022 | July 31, 2021 | Change | |||||||||||||||||||||||||||||
| Sales | $ | 25,653 | $ | 24,826 | 3.3 | % | $ | 50,483 | $ | 48,705 | 3.7 | % | |||||||||||||||||||||||
| Other revenue | 384 | 334 | 14.8 | 724 | 652 | 10.9 | |||||||||||||||||||||||||||||
| Total revenue | 26,037 | 25,160 | 3.5 | 51,207 | 49,357 | 3.7 | |||||||||||||||||||||||||||||
| Cost of sales | 20,142 | 17,280 | 16.6 | 38,603 | 33,996 | 13.6 | |||||||||||||||||||||||||||||
| Selling, general and administrative expenses | 5,002 | 4,849 | 3.1 | 9,764 | 9,358 | 4.3 | |||||||||||||||||||||||||||||
| Depreciation and amortization (exclusive of depreciation included in cost of sales) | 572 | 564 | 1.5 | 1,173 | 1,162 | 0.9 | |||||||||||||||||||||||||||||
| Operating income | $ | 321 | $ | 2,467 | (87.0) | % | $ | 1,667 | $ | 4,841 | (65.6) | % | |||||||||||||||||||||||
| Three Months Ended | Nine Months Ended | ||||||||||||||||||||
| (dollars in millions) | October 28, 2017 | October 29, 2016 | Change | October 28, 2017 | October 29, 2016 | Change | |||||||||||||||
| Sales | $ | 16,667 | $ | 16,441 | 1.4 | % | $ | 49,113 | $ | 48,805 | 0.6 | % | |||||||||
Cost of sales (a) | 11,712 | 11,536 | 1.5 | 34,330 | 33,957 | 1.1 | |||||||||||||||
| Gross margin | 4,955 | 4,905 | 1.0 | 14,783 | 14,848 | (0.4 | ) | ||||||||||||||
SG&A expenses (b) | 3,512 | 3,343 | 5.1 | 10,027 | 9,741 | 2.9 | |||||||||||||||
Depreciation and amortization (exclusive of depreciation included in cost of sales) (a) | 574 | 505 | 13.7 | 1,596 | 1,486 | 7.4 | |||||||||||||||
| EBIT | $ | 869 | $ | 1,057 | (17.8 | )% | $ | 3,160 | $ | 3,621 | (12.7 | )% | |||||||||
| Rate Analysis | Three Months Ended | Six Months Ended | |||||||||||||||||||||
| July 30, 2022 | July 31, 2021 | July 30, 2022 | July 31, 2021 | ||||||||||||||||||||
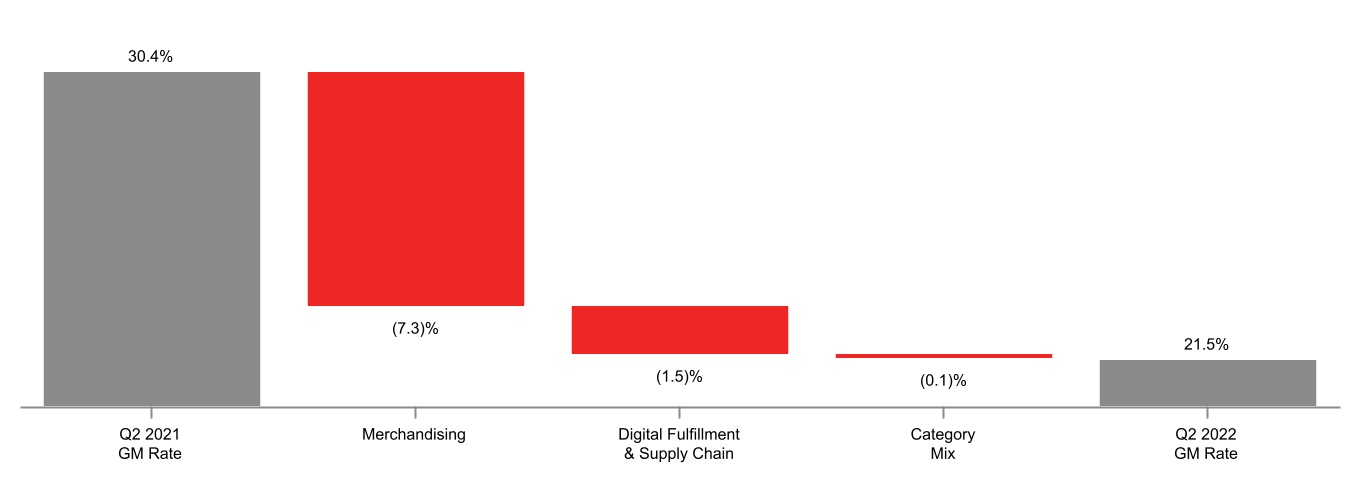
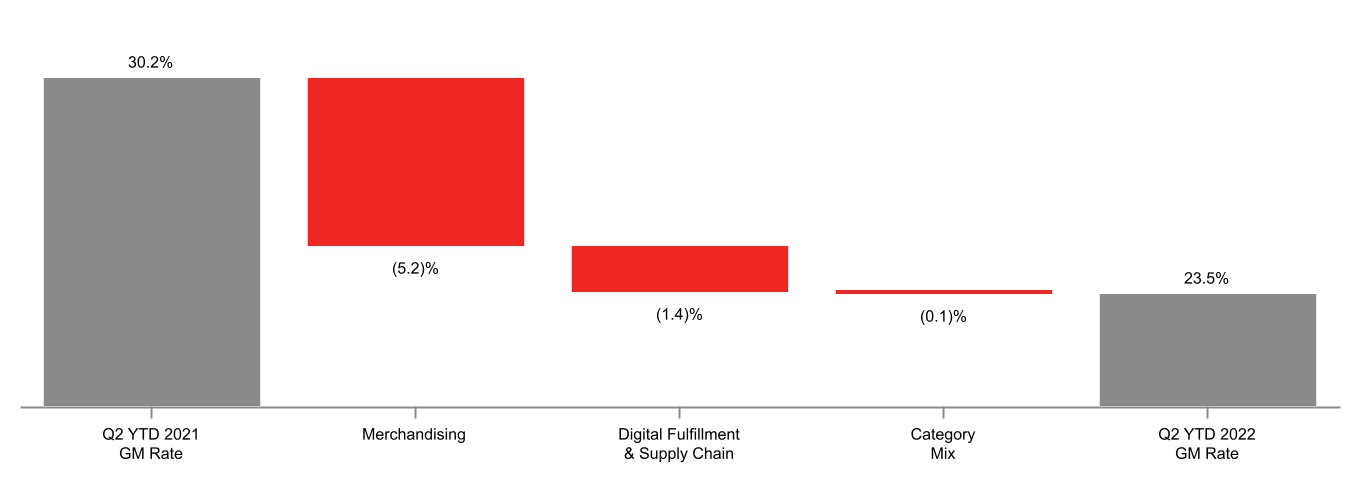
| Gross margin rate | 21.5 | % | 30.4 | % | 23.5 | % | 30.2 | % | |||||||||||||||
| SG&A expense rate | 19.2 | 19.3 | 19.1 | 19.0 | |||||||||||||||||||
| Depreciation and amortization expense rate (exclusive of depreciation included in cost of sales) | 2.2 | 2.2 | 2.3 | 2.4 | |||||||||||||||||||
| Operating income margin rate | 1.2 | 9.8 | 3.3 | 9.8 | |||||||||||||||||||
| Rate Analysis | Three Months Ended | Nine Months Ended | ||||||||
| October 28, 2017 | October 29, 2016 | October 28, 2017 | October 29, 2016 | |||||||
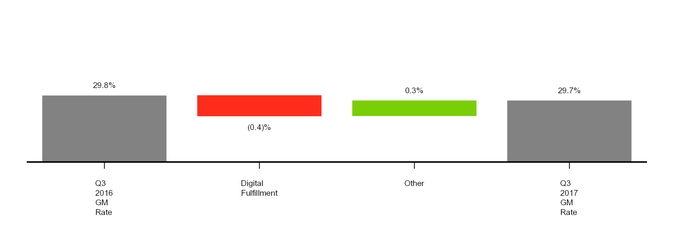
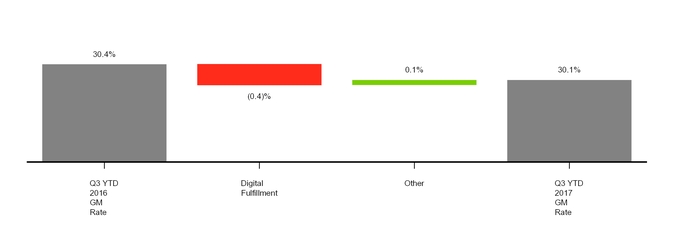
Gross margin rate (a) | 29.7 | % | 29.8 | % | 30.1 | % | 30.4 | % | ||
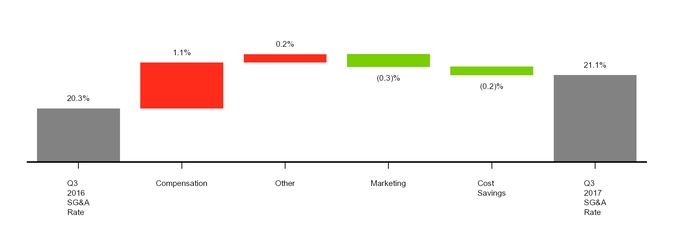
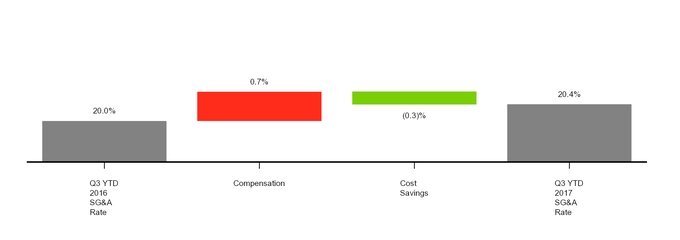
| SG&A expense rate | 21.1 | 20.3 | 20.4 | 20.0 | ||||||
Depreciation and amortization (exclusive of depreciation included in cost of sales) expense rate (a) | 3.4 | 3.1 | 3.2 | 3.0 | ||||||
| EBIT margin rate | 5.2 | 6.4 | 6.4 | 7.4 | ||||||
| Sales by Channel | Three Months Ended | Nine Months Ended | |||||||||
| October 28, 2017 | October 29, 2016 | October 28, 2017 | October 29, 2016 | ||||||||
| Stores | 95.7 | % | 96.5 | % | 95.7 | % | 96.5 | % | |||
| Digital | 4.3 | 3.5 | 4.3 | 3.5 | |||||||
| Total | 100 | % | 100 | % | 100 | % | 100 | % | |||
| Sales by Product Category | Three Months Ended | Nine Months Ended | |||||||||
| October 28, 2017 | October 29, 2016 | October 28, 2017 | October 29, 2016 | ||||||||
Household essentials (a) | 25 | % | 25 | % | 25 | % | 25 | % | |||
| Apparel and accessories | 21 | 21 | 21 | 21 | |||||||
Food and beverage (a) | 20 | 21 | 21 | 21 | |||||||
| Home furnishings and décor | 20 | 19 | 18 | 19 | |||||||
| Hardlines | 14 | 14 | 15 | 14 | |||||||
| Total | 100 | % | 100 | % | 100 | % | 100 | % | |||
| Comparable Sales | Three Months Ended | Six Months Ended | |||||||||||||||||||||
| July 30, 2022 | July 31, 2021 | July 30, 2022 | July 31, 2021 | ||||||||||||||||||||
| Comparable sales change | 2.6 | % | 8.9 | % | 3.0 | % | 15.3 | % | |||||||||||||||
| Drivers of change in comparable sales | |||||||||||||||||||||||
| Number of transactions (traffic) | 2.7 | 12.7 | 3.3 | 14.8 | |||||||||||||||||||
| Average transaction amount | 0.0 | (3.4) | (0.3) | 0.5 | |||||||||||||||||||
| TARGET CORPORATION | | Q2 2022 Form 10-Q | 14 | ||||||||
| Comparable Sales | Three Months Ended | Nine Months Ended | |||||||||
| October 28, 2017 | October 29, 2016 | October 28, 2017 | October 29, 2016 | ||||||||
| Comparable sales change | 0.9 | % | (0.2 | )% | 0.3 | % | — | % | |||
| Drivers of change in comparable sales | |||||||||||
| Number of transactions | 1.4 | (1.2 | ) | 0.9 | (1.0 | ) | |||||
| Average transaction amount | (0.5 | ) | 1.0 | (0.6 | ) | 1.0 | |||||
| MANAGEMENT'S DISCUSSION AND ANALYSIS | ||||||||
| ANALYSIS OF RESULTS OF OPERATIONS | ||||||||
| Comparable Sales by Channel | Three Months Ended | Six Months Ended | |||||||||||||||||||||
| July 30, 2022 | July 31, 2021 | July 30, 2022 | July 31, 2021 | ||||||||||||||||||||
| Stores originated comparable sales change | 1.3 | % | 8.7 | % | 2.3 | % | 13.0 | % | |||||||||||||||
| Digitally originated comparable sales change | 9.0 | 9.9 | 6.1 | 27.3 | |||||||||||||||||||
| Sales by Channel | Three Months Ended | Six Months Ended | |||||||||||||||||||||
| July 30, 2022 | July 31, 2021 | July 30, 2022 | July 31, 2021 | ||||||||||||||||||||
| Stores originated | 82.1 | % | 83.0 | % | 81.9 | % | 82.3 | % | |||||||||||||||
| Digitally originated | 17.9 | 17.0 | 18.1 | 17.7 | |||||||||||||||||||
| Total | 100 | % | 100 | % | 100 | % | 100 | % | |||||||||||||||
| Sales by Fulfillment Channel | Three Months Ended | Six Months Ended | |||||||||||||||||||||
| July 30, 2022 | July 31, 2021 | July 30, 2022 | July 31, 2021 | ||||||||||||||||||||
| Stores | 96.6 | % | 96.6 | % | 96.6 | % | 96.4 | % | |||||||||||||||
| Other | 3.4 | 3.4 | 3.4 | 3.6 | |||||||||||||||||||
| Total | 100 | % | 100 | % | 100 | % | 100 | % | |||||||||||||||
| Sales by Product Category | Three Months Ended | Six Months Ended | |||||||||||||||||||||
| July 30, 2022 | July 31, 2021 | July 30, 2022 | July 31, 2021 | ||||||||||||||||||||
| Apparel and accessories | 18 | % | 19 | % | 18 | % | 18 | % | |||||||||||||||
| Beauty and household essentials | 28 | 27 | 28 | 27 | |||||||||||||||||||
| Food and beverage | 21 | 19 | 21 | 20 | |||||||||||||||||||
| Hardlines | 15 | 16 | 15 | 16 | |||||||||||||||||||
| Home furnishings and décor | 18 | 19 | 18 | 19 | |||||||||||||||||||
| Total | 100 | % | 100 | % | 100 | % | 100 | % | |||||||||||||||
| Contribution to Comparable Sales Change | Three Months Ended | Nine Months Ended | |||||||||
| October 28, 2017 | October 29, 2016 | October 28, 2017 | October 29, 2016 | ||||||||
| Stores channel comparable sales change | — | % | (1.0 | )% | (0.6 | )% | (0.7 | )% | |||
| Digital channel contribution to comparable sales change | 0.8 | 0.7 | 0.9 | 0.6 | |||||||
| Total comparable sales change | 0.9 | % | (0.2 | )% | 0.3 | % | — | % | |||
| REDcard Penetration | Three Months Ended | Nine Months Ended | ||||||||||||||||||||||||||||||||
| RedCard Penetration | RedCard Penetration | Three Months Ended | Six Months Ended | |||||||||||||||||||||||||||||||
| October 28, 2017 | October 29, 2016 | October 28, 2017 | October 29, 2016 | July 30, 2022 | July 31, 2021 | July 30, 2022 | July 31, 2021 | |||||||||||||||||||||||||||
| Target Debit Card | 12.9 | % | 12.9 | % | 13.1 | % | 12.9 | % | Target Debit Card | 11.2 | % | 11.6 | % | 11.4 | % | 11.9 | % | |||||||||||||||||
| Target Credit Cards | 11.4 | 11.4 | 11.3 | 11.0 | Target Credit Cards | 8.9 | 8.7 | 8.8 | 8.6 | |||||||||||||||||||||||||
| Total REDcard Penetration | 24.2 | % | 24.3 | % | 24.4 | % | 23.9 | % | ||||||||||||||||||||||||||
| Total RedCard Penetration | Total RedCard Penetration | 20.1 | % | 20.3 | % | 20.2 | % | 20.4 | % | |||||||||||||||||||||||||
| TARGET CORPORATION | | Q2 2022 Form 10-Q | 15 | ||||||||
| MANAGEMENT'S DISCUSSION AND ANALYSIS | ||||||||
| ANALYSIS OF RESULTS OF OPERATIONS | ||||||||
| TARGET CORPORATION | | Q2 2022 Form 10-Q | 16 | ||||||||
| MANAGEMENT'S DISCUSSION AND ANALYSIS | ||||||||
| ANALYSIS OF RESULTS OF OPERATIONS | ||||||||
| Change in Number of Stores | Three Months Ended | Six Months Ended | |||||||||||||||||||||
| July 30, 2022 | July 31, 2021 | July 30, 2022 | July 31, 2021 | ||||||||||||||||||||
| Beginning store count | 1,933 | 1,909 | 1,926 | 1,897 | |||||||||||||||||||
| Opened | 5 | 2 | 12 | 14 | |||||||||||||||||||
| Closed | (1) | (2) | (1) | (2) | |||||||||||||||||||
| Ending store count | 1,937 | 1,909 | 1,937 | 1,909 | |||||||||||||||||||
| Change in Number of Stores | Three Months Ended | Nine Months Ended | |||||||||
| October 28, 2017 | October 29, 2016 | October 28, 2017 | October 29, 2016 | ||||||||
| Beginning store count | 1,816 | 1,797 | 1,802 | 1,792 | |||||||
| Opened | 12 | 5 | 26 | 11 | |||||||
| Closed | — | (2 | ) | — | (3 | ) | |||||
| Ending store count | 1,828 | 1,800 | 1,828 | 1,800 | |||||||
| Number of Stores and Retail Square Feet | Number of Stores | Retail Square Feet (a) | |||||||||||||||||||||
| July 30, 2022 | January 29, 2022 | July 31, 2021 | July 30, 2022 | January 29, 2022 | July 31, 2021 | ||||||||||||||||||
| 170,000 or more sq. ft. | 273 | 274 | 273 | 48,798 | 49,071 | 48,798 | |||||||||||||||||
| 50,000 to 169,999 sq. ft. | 1,521 | 1,516 | 1,510 | 190,734 | 190,205 | 189,624 | |||||||||||||||||
| 49,999 or less sq. ft. | 143 | 136 | 126 | 4,256 | 4,008 | 3,709 | |||||||||||||||||
| Total | 1,937 | 1,926 | 1,909 | 243,788 | 243,284 | 242,131 | |||||||||||||||||
| Number of Stores and Retail Square Feet | Number of Stores | Retail Square Feet (a) | |||||||||||
| October 28, 2017 | January 28, 2017 | October 29, 2016 | October 28, 2017 | January 28, 2017 | October 29, 2016 | ||||||||
| 170,000 or more sq. ft. | 276 | 276 | 278 | 49,326 | 49,328 | 49,685 | |||||||
| 50,000 to 169,999 sq. ft. | 1,508 | 1,504 | 1,503 | 190,038 | 189,620 | 189,496 | |||||||
| 49,999 or less sq. ft. | 44 | 22 | 19 | 1,268 | 554 | 464 | |||||||
| Total | 1,828 | 1,802 | 1,800 | 240,632 | 239,502 | 239,645 | |||||||
| TARGET CORPORATION | | Q2 2022 Form 10-Q | 17 | ||||||||
| MANAGEMENT'S DISCUSSION AND ANALYSIS | ||||||||
| RECONCILIATION OF NON-GAAP FINANCIAL MEASURES | ||||||||
| Reconciliation of Non-GAAP Adjusted EPS | Three Months Ended | |||||||||||||||||||||||||||||||||||||
| July 30, 2022 | July 31, 2021 | |||||||||||||||||||||||||||||||||||||
| (millions, except per share data) | Pretax | Net of Tax | Per Share | Pretax | Net of Tax | Per Share | ||||||||||||||||||||||||||||||||
| GAAP diluted earnings per share | $ | 0.39 | $ | 3.65 | ||||||||||||||||||||||||||||||||||
| Adjustments | ||||||||||||||||||||||||||||||||||||||
Other (a) | $ | — | $ | — | $ | — | $ | (5) | $ | (4) | $ | (0.01) | ||||||||||||||||||||||||||
| Adjusted diluted earnings per share | $ | 0.39 | $ | 3.64 | ||||||||||||||||||||||||||||||||||
| Three Months Ended | ||||||||||||||||||||||||
| October 28, 2017 | October 29, 2016 | |||||||||||||||||||||||
| (millions, except per share data) | Pretax | Net of Tax | Per Share Amounts | Pretax | Net of Tax | Per Share Amounts | ||||||||||||||||||
| GAAP diluted earnings per share from continuing operations | $ | 0.87 | $ | 1.06 | ||||||||||||||||||||
| Adjustments | ||||||||||||||||||||||||
| Loss on early retirement of debt | $ | 123 | $ | 75 | $ | 0.14 | $ | — | $ | — | $ | — | ||||||||||||
| Pharmacy Transaction-related costs | — | — | — | (4 | ) | (3 | ) | — | ||||||||||||||||
Income tax matters (a) | — | (55 | ) | (0.10 | ) | — | (5 | ) | (0.01 | ) | ||||||||||||||
| Adjusted diluted earnings per share from continuing operations | $ | 0.91 | $ | 1.04 | ||||||||||||||||||||
| Nine Months Ended | ||||||||||||||||||||||||
| October 28, 2017 | October 29, 2016 | |||||||||||||||||||||||
| (millions, except per share data) | Pretax | Net of Tax | Per Share Amounts | Pretax | Net of Tax | Per Share Amounts | ||||||||||||||||||
| GAAP diluted earnings per share from continuing operations | $ | 3.31 | $ | 3.14 | ||||||||||||||||||||
| Adjustments | ||||||||||||||||||||||||
| Loss on early retirement of debt | $ | 123 | $ | 75 | $ | 0.14 | $ | 422 | $ | 257 | $ | 0.44 | ||||||||||||
| Pharmacy Transaction-related costs | — | — | — | — | — | — | ||||||||||||||||||
Income tax matters (a) | — | (56 | ) | (0.10 | ) | — | (8 | ) | (0.01 | ) | ||||||||||||||
| Adjusted diluted earnings per share from continuing operations | $ | 3.34 | $ | 3.56 | ||||||||||||||||||||
| Reconciliation of Non-GAAP Adjusted EPS | Six Months Ended | |||||||||||||||||||||||||||||||||||||
| July 30, 2022 | July 31, 2021 | |||||||||||||||||||||||||||||||||||||
| (millions, except per share data) | Pretax | Net of Tax | Per Share | Pretax | Net of Tax | Per Share | ||||||||||||||||||||||||||||||||
| GAAP diluted earnings per share | $ | 2.55 | $ | 7.82 | ||||||||||||||||||||||||||||||||||
| Adjustments | ||||||||||||||||||||||||||||||||||||||
| Gain on Dermstore sale | $ | — | $ | — | $ | — | $ | (335) | $ | (269) | $ | (0.54) | ||||||||||||||||||||||||||
Other (a) | 20 | 15 | 0.03 | 36 | 27 | 0.05 | ||||||||||||||||||||||||||||||||
| Adjusted diluted earnings per share | $ | 2.59 | $ | 7.34 | ||||||||||||||||||||||||||||||||||
| EBIT and EBITDA | Three Months Ended | Nine Months Ended | EBIT and EBITDA | Three Months Ended | Six Months Ended | |||||||||||||||||||||||||||||||||||||||||||||||||||||||
(millions) (unaudited) | October 28, 2017 | October 29, 2016 | Change | October 28, 2017 | October 29, 2016 | Change | ||||||||||||||||||||||||||||||||||||||||||||||||||||||
| Net earnings from continuing operations | $ | 478 | $ | 608 | (21.5 | )% | $ | 1,826 | $ | 1,847 | (1.1 | )% | ||||||||||||||||||||||||||||||||||||||||||||||||
| (dollars in millions) | (dollars in millions) | July 30, 2022 | July 31, 2021 | Change | July 30, 2022 | July 31, 2021 | Change | |||||||||||||||||||||||||||||||||||||||||||||||||||||
| Net earnings | Net earnings | $ | 183 | $ | 1,817 | (89.9) | % | $ | 1,192 | $ | 3,914 | (69.6) | % | |||||||||||||||||||||||||||||||||||||||||||||||
| + Provision for income taxes | 137 | 311 | (55.8 | ) | 802 | 910 | (11.9 | ) | + Provision for income taxes | 34 | 553 | (93.8) | 274 | 1,065 | (74.3) | |||||||||||||||||||||||||||||||||||||||||||||
| + Net interest expense | 254 | 142 | 79.1 | 532 | 864 | (38.4 | ) | + Net interest expense | 112 | 104 | 8.0 | 224 | 212 | 5.8 | ||||||||||||||||||||||||||||||||||||||||||||||
| EBIT | 869 | 1,061 | (18.1 | ) | 3,160 | 3,621 | (12.7 | ) | EBIT | $ | 329 | $ | 2,474 | (86.7) | % | $ | 1,690 | $ | 5,191 | (67.4) | % | |||||||||||||||||||||||||||||||||||||||
+ Total depreciation and amortization (a) | 633 | 570 | 11.1 | 1,784 | 1,686 | 5.8 | + Total depreciation and amortization (a) | 650 | 633 | 2.8 | 1,329 | 1,300 | 2.3 | |||||||||||||||||||||||||||||||||||||||||||||||
| EBITDA | $ | 1,502 | $ | 1,631 | (7.9 | )% | $ | 4,944 | $ | 5,307 | (6.8 | )% | EBITDA | $ | 979 | $ | 3,107 | (68.5) | % | $ | 3,019 | $ | 6,491 | (53.5) | % | |||||||||||||||||||||||||||||||||||
| TARGET CORPORATION | | Q2 2022 Form 10-Q | 18 | ||||||||
| MANAGEMENT'S DISCUSSION AND ANALYSIS | ||||||||
| RECONCILIATION OF NON-GAAP FINANCIAL MEASURES | ||||||||
| After-Tax Return on Invested Capital | ||||||||||||||||||||||||||
| (dollars in millions) | ||||||||||||||||||||||||||
| Trailing Twelve Months | ||||||||||||||||||||||||||
| Numerator | July 30, 2022 | July 31, 2021 | ||||||||||||||||||||||||
| Operating income | $ | 5,773 | $ | 8,611 | ||||||||||||||||||||||
| + Net other income / (expense) | 54 | 346 | ||||||||||||||||||||||||
| EBIT | 5,827 | 8,957 | ||||||||||||||||||||||||
+ Operating lease interest (a) | 88 | 84 | ||||||||||||||||||||||||
- Income taxes (b) | 1,282 | 1,918 | ||||||||||||||||||||||||
| Net operating profit after taxes | $ | 4,633 | $ | 7,123 | ||||||||||||||||||||||
| After-Tax Return on Invested Capital | ||||||||||||
| Numerator | Trailing Twelve Months | |||||||||||
| (dollars in millions) | October 28, 2017 | October 29, 2016 | ||||||||||
| Earnings from continuing operations before interest expense and income taxes | $ | 4,508 | $ | 5,790 | ||||||||
+ Operating lease interest (a)(b) | 78 | 72 | ||||||||||
| Adjusted earnings from continuing operations before interest expense and income taxes | 4,586 | 5,862 | ||||||||||
- Income taxes (c) | 1,420 | 1,849 | ||||||||||
| Net operating profit after taxes | $ | 3,166 | $ | 4,013 | ||||||||
| Denominator | July 30, 2022 | July 31, 2021 | August 1, 2020 | |||||||||||||||||
| Current portion of long-term debt and other borrowings | $ | 1,649 | $ | 1,190 | $ | 109 | ||||||||||||||
| + Noncurrent portion of long-term debt | 13,453 | 11,589 | 14,188 | |||||||||||||||||
| + Shareholders' investment | 10,592 | 14,860 | 12,578 | |||||||||||||||||
+ Operating lease liabilities (c) | 2,823 | 2,695 | 2,448 | |||||||||||||||||
| - Cash and cash equivalents | 1,117 | 7,368 | 7,284 | |||||||||||||||||
| Invested capital | $ | 27,400 | $ | 22,966 | $ | 22,039 | ||||||||||||||
Average invested capital (d) | $ | 25,183 | $ | 22,502 | ||||||||||||||||
| After-tax return on invested capital | 18.4 | % | 31.7 | % | ||||||||||||||||
Denominator (dollars in millions) | October 28, 2017 | October 29, 2016 | October 31, 2015 | |||||||||
| Current portion of long-term debt and other borrowings | $ | 1,354 | $ | 729 | $ | 825 | ||||||
| + Noncurrent portion of long-term debt | 11,277 | 12,097 | 11,887 | |||||||||
| + Shareholders' equity | 11,137 | 11,069 | 13,256 | |||||||||
+ Capitalized operating lease obligations (b)(d) | 1,298 | 1,192 | 1,503 | |||||||||
| - Cash and cash equivalents | 2,725 | 1,231 | 1,977 | |||||||||
| - Net assets of discontinued operations | 4 | 60 | 197 | |||||||||
| Invested capital | $ | 22,337 | $ | 23,796 | $ | 25,298 | ||||||
Average invested capital (e) | $ | 23,067 | $ | 24,547 | ||||||||
After-tax return on invested capital (f) | 13.7 | % | 16.3 | % | ||||
| TARGET CORPORATION | | Q2 2022 Form 10-Q | 19 | ||||||||
| Reconciliation of Capitalized Operating Leases | Trailing Twelve Months | |||||||||||||
| (dollars in millions) | October 28, 2017 | October 29, 2016 | October 31, 2015 | |||||||||||
| Total rent expense | $ | 162 | $ | 149 | $ | 188 | ||||||||
| Capitalized operating lease obligations (total rent expense x 8) | 1,298 | 1,192 | 1,503 | |||||||||||
| Operating lease interest (capitalized operating lease obligations x 6%) | 78 | 72 | n/a | |||||||||||
| MANAGEMENT'S DISCUSSION AND ANALYSIS | ||||||||
| ANALYSIS OF FINANCIAL CONDITION | ||||||||
| TARGET CORPORATION | | Q2 2022 Form 10-Q | 20 | ||||||||
| MANAGEMENT'S DISCUSSION AND ANALYSIS | ||||||||
| ANALYSIS OF FINANCIAL CONDITION | ||||||||
| Credit Ratings | Moody’s | Standard and Poor’s | Fitch | ||||||||
| Long-term debt | A2 | A | |||||||||
| Commercial paper | P-1 | A-1 | |||||||||
| TARGET CORPORATION | | Q2 2022 Form 10-Q | 21 | ||||||||
| MANAGEMENT'S DISCUSSION AND ANALYSIS & SUPPLEMENTAL INFORMATION | ||||||||
| FORWARD LOOKING STATEMENTS & CONTROLS AND PROCEDURES | ||||||||
| TARGET CORPORATION | | Q2 2022 Form 10-Q | 22 | ||||||||
| SUPPLEMENTAL INFORMATION | ||||||||
| Share Repurchase Activity | Total Number of Shares Purchased | Average Price Paid per Share | Total Number of Shares Purchased as Part of Publicly Announced Programs | Dollar Value of Shares that May Yet Be Purchased Under Publicly Announced Programs | ||||||||||||||||||||||
| Period | ||||||||||||||||||||||||||
| May 1, 2022 through May 28, 2022 | ||||||||||||||||||||||||||
| Open market and privately negotiated purchases | — | $ | — | — | $ | 12,316,056,660 | ||||||||||||||||||||
| May 29, 2022 through July 2, 2022 | ||||||||||||||||||||||||||
| Open market and privately negotiated purchases | — | — | — | 12,316,056,660 | ||||||||||||||||||||||
March 2022 ASR (a) | 3,569,904 | 211.58 | 3,569,904 | 9,680,505,231 | ||||||||||||||||||||||
| July 3, 2022 through July 30, 2022 | ||||||||||||||||||||||||||
| Open market and privately negotiated purchases | — | — | — | 9,680,505,231 | ||||||||||||||||||||||
| Total | 3,569,904 | $ | 211.58 | 3,569,904 | $ | 9,680,505,231 | ||||||||||||||||||||
| Period | Total Number of Shares Purchased | Average Price Paid per Share | Total Number of Shares Purchased as Part of Publicly Announced Programs | Dollar Value of Shares that May Yet Be Purchased Under Publicly Announced Programs | ||||||||
| July 30, 2017 through August 26, 2017 | ||||||||||||
August 2017 ASR (a) | 2,500,000 | TBD | 2,500,000 | $ | 3,884,046,448 | |||||||
| August 27, 2017 through September 30, 2017 | ||||||||||||
| Open market and privately negotiated purchases | 169,233 | 58.74 | 169,233 | 3,874,106,311 | ||||||||
| October 1, 2017 through October 28, 2017 | ||||||||||||
| Open market and privately negotiated purchases | — | — | — | 3,874,106,311 | ||||||||
| Total | 2,669,233 | TBD | 2,669,233 | $ | 3,874,106,311 | |||||||
| TARGET CORPORATION | | Q2 2022 Form 10-Q | 23 | ||||||||
| SUPPLEMENTAL INFORMATION | ||||||||
| (3)A | ||||||||
| (3)B | ||||||||
| (10) | ||||||||
| (10)KK | ||||||||
| (31)A | ||||||||
| (31)B | ||||||||
| (32)A | ||||||||
| (32)B | ||||||||
| 101.INS | XBRL Instance Document | |||||||
| 101.SCH | Inline XBRL Taxonomy Extension Schema Document | |||||||
| 101.CAL | Inline XBRL Taxonomy Extension Calculation Linkbase Document | |||||||
| 101.DEF | Inline XBRL Taxonomy Extension Definition Linkbase Document | |||||||
| 101.LAB | Inline XBRL Taxonomy Extension Label Linkbase Document | |||||||
| 101.PRE | Inline XBRL Taxonomy Extension Presentation Linkbase Document | |||||||
| 104 | Cover Page Interactive Data File (formatted as Inline XBRL and contained in Exhibit 101) | |||||||
| TARGET CORPORATION | | Q2 2022 Form 10-Q | 24 | ||||||||
| SUPPLEMENTAL INFORMATION | ||||||||
| TARGET CORPORATION | |||||||||||
| Dated: August 26, 2022 | By: | /s/ Michael J. Fiddelke | |||||||||
| Michael J. Fiddelke | |||||||||||
| Executive Vice President and | |||||||||||
| Chief Financial Officer | |||||||||||
| (Duly Authorized Officer and | |||||||||||
| Principal Financial Officer) | |||||||||||
| /s/ Matthew A. Liegel | |||||||||||
| Matthew A. Liegel | |||||||||||
| Senior Vice President, Chief Accounting Officer | |||||||||||
| and Controller | |||||||||||
| TARGET CORPORATION | | Q2 2022 Form 10-Q | 25 | ||||||||