
March 31, 2024
__________to__________
EXXON MOBIL CORPORATION
| New Jersey | 13-5409005 | |||||||
(State or other jurisdiction of |
| |||||||
incorporation or organization) |
| |||||||
5959 LAS COLINAS BOULEVARD, IRVING, TEXAS 75039-2298
| Title of Each Class | Trading Symbol | Name of Each Exchange on Which Registered | ||||||||||||
| Common Stock, without par value | XOM | New York Stock Exchange | ||||||||||||
| 0.142% Notes due 2024 | XOM24B | New York Stock Exchange | ||||||||||||
| 0.524% Notes due 2028 | XOM28 | New York Stock Exchange | ||||||||||||
| 0.835% Notes due 2032 | XOM32 | New York Stock Exchange | ||||||||||||
| 1.408% Notes due 2039 | XOM39A | New York Stock Exchange | ||||||||||||
| Large accelerated filer | ☑ | Accelerated filer | ☐ | |||||||||
| Non-accelerated filer | ☐ | Smaller reporting company | ☐ | |||||||||
Emerging growth company | ☐ | |||||||||||
Outstanding as of Common stock, without par value MARCH 31, 2024 Item 1. Financial Statements Condensed Consolidated Statement of Income - Three - Three - As of Condensed Consolidated Statement of Cash Flows Condition and Results of Operations PART I. FINANCIAL INFORMATION Item 1. Financial Statements EXXON MOBIL CORPORATION CONDENSED CONSOLIDATED STATEMENT OF INCOME (millions of dollars) Three Months Ended Nine Months Ended September 30, September 30, 2017 2016 2017 2016 Revenues and other income Sales and other operating revenue (1) 64,415 56,767 186,330 160,232 Income from equity affiliates 1,472 1,103 4,707 3,478 Other income 278 807 1,291 1,368 Total revenues and other income 66,165 58,677 192,328 165,078 Costs and other deductions Crude oil and product purchases 31,432 28,035 91,985 75,872 Production and manufacturing expenses 8,334 7,709 24,586 23,346 Selling, general and administrative expenses 2,725 2,736 7,952 7,975 Depreciation and depletion 4,880 4,605 14,051 14,191 Exploration expenses, including dry holes 284 327 1,087 1,127 Interest expense 111 106 415 258 Sales-based taxes (1) 5,864 5,437 16,795 15,687 Other taxes and duties 6,952 6,496 19,800 19,270 Total costs and other deductions 60,582 55,451 176,671 157,726 Income before income taxes 5,583 3,226 15,657 7,352 Income taxes 1,498 337 4,218 1,001 Net income including noncontrolling interests 4,085 2,889 11,439 6,351 Net income attributable to noncontrolling interests 115 239 109 191 Net income attributable to ExxonMobil 3,970 2,650 11,330 6,160 Earnings per common share (dollars) 0.93 0.63 2.66 1.47 Earnings per common share - assuming dilution (dollars) 0.93 0.63 2.66 1.47 Dividends per common share (dollars) 0.77 0.75 2.29 2.23 (1) Sales-based taxes included in sales and other operating revenue 5,864 5,437 16,795 15,687 EXXON MOBIL CORPORATION CONDENSED CONSOLIDATED STATEMENT OF COMPREHENSIVE INCOME (millions of dollars) Three Months Ended Nine Months Ended September 30, September 30, 2017 2016 2017 2016 Net income including noncontrolling interests 4,085 2,889 11,439 6,351 Other comprehensive income (net of income taxes) Foreign exchange translation adjustment 2,342 (107) 5,424 2,506 Adjustment for foreign exchange translation (gain)/loss included in net income - - 234 - Postretirement benefits reserves adjustment (excluding amortization) (145) 34 (329) 25 Amortization and settlement of postretirement benefits reserves adjustment included in net periodic benefit costs 311 278 850 859 Total other comprehensive income 2,508 205 6,179 3,390 Comprehensive income including noncontrolling interests 6,593 3,094 17,618 9,741 Comprehensive income attributable to noncontrolling interests 372 166 700 536 Comprehensive income attributable to ExxonMobil 6,221 2,928 16,918 9,205 EXXON MOBIL CORPORATION CONDENSED CONSOLIDATED BALANCE SHEET (millions of dollars) Sept. 30, Dec. 31, 2017 2016 Assets Current assets Cash and cash equivalents 4,266 3,657 Notes and accounts receivable – net 23,263 21,394 Inventories Crude oil, products and merchandise 12,488 10,877 Materials and supplies 4,255 4,203 Other current assets 1,480 1,285 Total current assets 45,752 41,416 Investments, advances and long-term receivables 37,649 35,102 Property, plant and equipment – net 255,556 244,224 Other assets, including intangibles – net 10,470 9,572 Total assets 349,427 330,314 Liabilities Current liabilities Notes and loans payable 15,741 13,830 Accounts payable and accrued liabilities 34,698 31,193 Income taxes payable 3,338 2,615 Total current liabilities 53,777 47,638 Long-term debt 24,869 28,932 Postretirement benefits reserves 20,874 20,680 Deferred income tax liabilities 34,430 34,041 Long-term obligations to equity companies 5,003 5,124 Other long-term obligations 21,276 20,069 Total liabilities 160,229 156,484 Commitments and contingencies (Note 3) Equity Common stock without par value (9,000 million shares authorized, 8,019 million shares issued) 14,783 12,157 Earnings reinvested 409,449 407,831 Accumulated other comprehensive income (16,651) (22,239) Common stock held in treasury (3,782 million shares at September 30, 2017 and 3,871 million shares at December 31, 2016) (225,305) (230,424) ExxonMobil share of equity 182,276 167,325 Noncontrolling interests 6,922 6,505 Total equity 189,198 173,830 Total liabilities and equity 349,427 330,314 EXXON MOBIL CORPORATION CONDENSED CONSOLIDATED STATEMENT OF CASH FLOWS (millions of dollars) Nine Months Ended September 30, 2017 2016 Cash flows from operating activities Net income including noncontrolling interests 11,439 6,351 Depreciation and depletion 14,051 14,191 Changes in operational working capital, excluding cash and debt (547) (2,386) All other items – net (2,288) (3,470) Net cash provided by operating activities 22,655 14,686 Cash flows from investing activities Additions to property, plant and equipment (10,901) (12,276) Proceeds associated with sales of subsidiaries, property, plant and equipment, and sales and returns of investments 1,695 2,182 Additional investments and advances (1,950) (1,398) Other investing activities including collection of advances 1,962 761 Net cash used in investing activities (9,194) (10,731) Cash flows from financing activities Additions to long-term debt 60 11,964 Additions to short-term debt 1,735 - Reductions in short-term debt (4,971) (286) Additions/(reductions) in commercial paper, and debt with three months or less maturity (1) 339 (4,062) Cash dividends to ExxonMobil shareholders (9,712) (9,320) Cash dividends to noncontrolling interests (139) (122) Changes in noncontrolling interests (90) - Common stock acquired (515) (727) Common stock sold - 6 Net cash used in financing activities (13,293) (2,547) Effects of exchange rate changes on cash 441 (20) Increase/(decrease) in cash and cash equivalents 609 1,388 Cash and cash equivalents at beginning of period 3,657 3,705 Cash and cash equivalents at end of period 4,266 5,093 Supplemental Disclosures Income taxes paid 4,611 3,049 Cash interest paid 965 709 EXXON MOBIL CORPORATION CONDENSED CONSOLIDATED STATEMENT OF CHANGES IN EQUITY (millions of dollars) ExxonMobil Share of Equity Accumulated Other Common Compre- Stock ExxonMobil Non- Common Earnings hensive Held in Share of controlling Total Stock Reinvested Income Treasury Equity Interests Equity Balance as of December 31, 2015 11,612 412,444 (23,511) (229,734) 170,811 5,999 176,810 Amortization of stock-based awards 612 - - - 612 - 612 Tax benefits related to stock-based awards 11 - - - 11 - 11 Other (7) - - - (7) - (7) Net income for the period - 6,160 - - 6,160 191 6,351 Dividends – common shares - (9,320) - - (9,320) (122) (9,442) Other comprehensive income - - 3,045 - 3,045 345 3,390 Acquisitions, at cost - - - (727) (727) - (727) Dispositions - - - 12 12 - 12 Balance as of September 30, 2016 12,228 409,284 (20,466) (230,449) 170,597 6,413 177,010 Balance as of December 31, 2016 12,157 407,831 (22,239) (230,424) 167,325 6,505 173,830 Amortization of stock-based awards 635 - - - 635 - 635 Other (87) - - - (87) (54) (141) Net income for the period - 11,330 - - 11,330 109 11,439 Dividends – common shares - (9,712) - - (9,712) (139) (9,851) Other comprehensive income - - 5,588 - 5,588 591 6,179 Acquisitions, at cost - - - (596) (596) (90) (686) Issued for acquisitions 2,078 - - 5,711 7,789 - 7,789 Dispositions - - - 4 4 - 4 Balance as of September 30, 2017 14,783 409,449 (16,651) (225,305) 182,276 6,922 189,198 Nine Months Ended September 30, 2017 Nine Months Ended September 30, 2016 Held in Held in Common Stock Share Activity Issued Treasury Outstanding Issued Treasury Outstanding (millions of shares) (millions of shares) Balance as of December 31 8,019 (3,871) 4,148 8,019 (3,863) 4,156 Acquisitions - (7) (7) - (9) (9) Issued for acquisitions - 96 96 - - - Dispositions - - - - - - Balance as of September 30 8,019 (3,782) 4,237 8,019 (3,872) 4,147 As of September 30, 2017 Equity Other Company Third Party Obligations (1) Obligations Total (millions of dollars) Guarantees Debt-related 107 30 137 Other 2,754 4,267 7,021 Total 2,861 4,297 7,158 (1) ExxonMobil share Cumulative Post- Foreign retirement Exchange Benefits ExxonMobil Share of Accumulated Other Translation Reserves Comprehensive Income Adjustment Adjustment Total (millions of dollars) Balance as of December 31, 2015 (14,170) (9,341) (23,511) Current period change excluding amounts reclassified from accumulated other comprehensive income 2,189 23 2,212 Amounts reclassified from accumulated other comprehensive income - 833 833 Total change in accumulated other comprehensive income 2,189 856 3,045 Balance as of September 30, 2016 (11,981) (8,485) (20,466) Balance as of December 31, 2016 (14,501) (7,738) (22,239) Current period change excluding amounts reclassified from accumulated other comprehensive income 4,925 (300) 4,625 Amounts reclassified from accumulated other comprehensive income 140 823 963 Total change in accumulated other comprehensive income 5,065 523 5,588 Balance as of September 30, 2017 (9,436) (7,215) (16,651) Three Months Ended Nine Months Ended Amounts Reclassified Out of Accumulated Other September 30, September 30, Comprehensive Income - Before-tax Income/(Expense) 2017 2016 2017 2016 (millions of dollars) Foreign exchange translation gain/(loss) included in net income (Statement of Income line: Other income) - - (234) - Amortization and settlement of postretirement benefits reserves adjustment included in net periodic benefit costs (1) (450) (415) (1,215) (1,248) Three Months Ended Nine Months Ended Income Tax (Expense)/Credit For September 30, September 30, Components of Other Comprehensive Income 2017 2016 2017 2016 (millions of dollars) Foreign exchange translation adjustment 17 (9) (9) (6) Postretirement benefits reserves adjustment (excluding amortization) 74 (11) 154 20 Amortization and settlement of postretirement benefits reserves adjustment included in net periodic benefit costs (139) (137) (365) (389) Total (48) (157) (220) (375) Three Months Ended Nine Months Ended September 30, September 30, 2017 2016 2017 2016 Earnings per common share Net income attributable to ExxonMobil (millions of dollars) 3,970 2,650 11,330 6,160 Weighted average number of common shares outstanding (millions of shares) 4,271 4,178 4,252 4,178 Earnings per common share (dollars) (1) 0.93 0.63 2.66 1.47 Three Months Ended Nine Months Ended September 30, September 30, 2017 2016 2017 2016 (millions of dollars) Components of net benefit cost Pension Benefits - U.S. Service cost 200 200 583 606 Interest cost 199 198 598 594 Expected return on plan assets (194) (182) (582) (545) Amortization of actuarial loss/(gain) and prior service cost 110 124 332 373 Net pension enhancement and curtailment/settlement cost 187 111 450 333 Net benefit cost 502 451 1,381 1,361 Pension Benefits - Non-U.S. Service cost 155 131 445 430 Interest cost 198 206 574 636 Expected return on plan assets (260) (227) (743) (701) Amortization of actuarial loss/(gain) and prior service cost 135 151 388 452 Net pension enhancement and curtailment/settlement cost - - (5) - Net benefit cost 228 261 659 817 Other Postretirement Benefits Service cost 36 38 92 115 Interest cost 88 85 227 258 Expected return on plan assets (6) (6) (17) (18) Amortization of actuarial loss/(gain) and prior service cost 18 29 45 90 Net benefit cost 136 146 347 445 and Derivatives Three Months Ended Nine Months Ended September 30, September 30, 2017 2016 2017 2016 Earnings After Income Tax (millions of dollars) Upstream United States (238) (477) (439) (1,823) Non-U.S. 1,805 1,097 5,442 2,661 Downstream United States 391 225 1,030 824 Non-U.S. 1,141 1,004 3,003 2,136 Chemical United States 403 434 1,413 1,524 Non-U.S. 689 737 1,835 2,219 All other (221) (370) (954) (1,381) Corporate total 3,970 2,650 11,330 6,160 Sales and Other Operating Revenue (1) Upstream United States 2,282 2,152 6,955 5,373 Non-U.S. 3,736 3,177 10,865 9,371 Downstream United States 16,312 14,930 47,059 40,981 Non-U.S. 34,837 29,969 99,978 85,135 Chemical United States 2,589 2,474 8,119 7,377 Non-U.S. 4,646 4,049 13,313 11,970 All other 13 16 41 25 Corporate total 64,415 56,767 186,330 160,232 (1) Includes sales-based taxes Intersegment Revenue Upstream United States 1,365 875 3,937 2,598 Non-U.S. 5,734 4,401 16,356 12,843 Downstream United States 3,134 2,775 10,621 8,057 Non-U.S. 5,866 4,903 16,048 13,514 Chemical United States 1,675 1,615 5,290 4,805 Non-U.S. 1,482 1,043 3,776 3,073 All other 51 60 154 174 IOC Permian (billions of dollars) Current assets 0.6 - Property, plant and equipment 2.9 6.3 Other 0.6 - Total assets 4.1 6.3 Current liabilities 0.5 - Long-term liabilities 0.9 0.1 Total liabilities 1.4 0.1 Net assets acquired 2.7 6.2 FUNCTIONAL EARNINGS SUMMARY Third Quarter First Nine Months Earnings (U.S. GAAP) 2017 2016 2017 2016 (millions of dollars) Upstream United States (238) (477) (439) (1,823) Non-U.S. 1,805 1,097 5,442 2,661 Downstream United States 391 225 1,030 824 Non-U.S. 1,141 1,004 3,003 2,136 Chemical United States 403 434 1,413 1,524 Non-U.S. 689 737 1,835 2,219 Corporate and financing (221) (370) (954) (1,381) Net income attributable to ExxonMobil (U.S. GAAP) 3,970 2,650 11,330 6,160 Earnings per common share (dollars) 0.93 0.63 2.66 1.47 Earnings per common share - assuming dilution (dollars) 0.93 0.63 2.66 1.47 References in this discussion to compared with earnings of $11.4 billion a year earlier. The decrease in earnings was mainly driven by declining industry refining margins and lower natural gas prices. Capital and exploration expenditures were Third Quarter First Nine Months 2017 2016 2017 2016 (millions of dollars) Upstream earnings United States (238) (477) (439) (1,823) Non-U.S. 1,805 1,097 5,442 2,661 Total 1,567 620 5,003 838 Third Quarter First Nine Months Upstream additional information (thousands of barrels daily) Volumes reconciliation (Oil-equivalent production)(1) 2016 3,811 4,030 Entitlements - Net Interest (1) - Entitlements - Price / Spend / Other (14) (68) Quotas - - Divestments (5) (6) Growth / Other 87 27 2017 3,878 3,983 (1) Gas converted to oil-equivalent at 6 million cubic feet = 1 thousand barrels. Listed below are descriptions of ExxonMobil’s volumes reconciliation factors which are provided to facilitate understanding of the terms. governments. Third Quarter First Nine Months 2017 2016 2017 2016 (millions of dollars) Downstream earnings United States 391 225 1,030 824 Non-U.S. 1,141 1,004 3,003 2,136 Total 1,532 1,229 4,033 2,960 Third Quarter First Nine Months 2017 2016 2017 2016 (millions of dollars) Chemical earnings United States 403 434 1,413 1,524 Non-U.S. 689 737 1,835 2,219 Total 1,092 1,171 3,248 3,743 Third Quarter First Nine Months 2017 2016 2017 2016 (millions of dollars) Corporate and financing earnings (221) (370) (954) (1,381) Third Quarter First Nine Months 2017 2016 2017 2016 (millions of dollars) Net cash provided by/(used in) Operating activities 22,655 14,686 Investing activities (9,194) (10,731) Financing activities (13,293) (2,547) Effect of exchange rate changes 441 (20) Increase/(decrease) in cash and cash equivalents 609 1,388 Cash and cash equivalents (at end of period) 4,266 5,093 Cash flow from operations and asset sales Net cash provided by operating activities (U.S. GAAP) 7,535 5,355 22,655 14,686 Proceeds associated with sales of subsidiaries, property, plant & equipment, and sales and returns of investments 854 976 1,695 2,182 Cash flow from operations and asset sales 8,389 6,331 24,350 16,868 2023. Total debt at the end of the 2023. The net debt to capital ratio was 3.2 percent at the end of the first quarter, a decrease of 1.3 percentage points from year-end 2023. The Corporation's capital allocation priorities are investing in competitively advantaged, high-return projects; maintaining a strong balance sheet; and sharing our success with our shareholders through more consistent share repurchases and a growing dividend. The Corporation distributed a total of $3.8 billion to shareholders in the first three months of 2024 through dividends. of first quarter 2024. TAXES Third Quarter First Nine Months 2017 2016 2017 2016 (millions of dollars) Income taxes 1,498 337 4,218 1,001 Effective income tax rate 33 % 20 % 34 % 26 % Sales-based taxes 5,864 5,437 16,795 15,687 All other taxes and duties 7,488 7,054 21,561 21,076 Total 14,850 12,828 42,574 37,764 Third Quarter First Nine Months 2017 2016 2017 2016 (millions of dollars) Upstream (including exploration expenses) 3,175 3,072 9,080 10,970 Downstream 611 589 1,742 1,759 Chemical 2,183 503 3,215 1,677 Other 18 26 44 69 Total 5,987 4,190 14,081 14,475 policy and technology advancement and deployment for the world, or ExxonMobil, to meet net zero by 2050. As future policies and technology advancements emerge, they will be incorporated into the Outlook, and ExxonMobil’s business plans will be updated accordingly. References to projects or opportunities may not reflect investment decisions made by ExxonMobil or its affiliates. Individual projects or opportunities may advance based on a number of factors, including availability of supportive policy, permitting, technological advancement for cost-effective abatement, insights from the company planning process, and alignment with our partners and other stakeholders. Capital investment guidance in lower-emission investments is based on our corporate plan; however, actual investment levels will be subject to the availability of the opportunity set, public policy support, and focused on returns. QUANTITATIVE AND QUALITATIVE DISCLOSURES ABOUT MARKET RISK CONTROLS AND PROCEDURES proceedings. EXHIBITS Description Certification (pursuant to Securities Exchange Act Rule 13a-14(a)) by Chief Executive Officer. Certification (pursuant to Securities Exchange Act Rule 13a-14(a)) by Certification (pursuant to Securities Exchange Act Rule 13a-14(a)) by Principal Accounting Officer. Section 1350 Certification (pursuant to Sarbanes-Oxley Section 906) by Chief Executive Officer. Section 1350 Certification (pursuant to Sarbanes-Oxley Section 906) by Section 1350 Certification (pursuant to Sarbanes-Oxley Section 906) by Principal Accounting Officer. 101 Interactive Data Date: By: /s/ Vice President, Controller and Principal Accounting OfficerIf an emerging growth company, indicate by check mark if the registrant has elected not to use the extended transition period for complying with any new or revised financial accounting standards provided pursuant to Section 13(a) of the Exchange Act.☐Indicate by check mark whether the registrant is a shell company (as defined in Rule 12b-2 of the Exchange Act). Yes☐ No☑Indicate the number of shares outstanding of each of the issuer's classes of common stock, as of the latest practicable date.Class September 30, 2017 4,237,106,077 EXXON MOBIL CORPORATIONFORM 10-QFOR THE QUARTERLY PERIOD ENDED SEPTEMBER 30, 2017TABLE OF CONTENTSPART I. FINANCIAL INFORMATION and nine months ended September 30, 2017March 31, 2024 and 2016Condensed Consolidated Statement of Comprehensive Income and nine months ended September 30, 2017March 31, 2024 and 2016Condensed Consolidated Balance Sheet September 30, 2017March 31, 2024 and December 31, 2016 Nine - Three months ended September 30, 2017March 31, 2024 and 2016Condensed Consolidated Statement of Changes in Equity Nine - Three months ended September 30, 2017March 31, 2024 and 2016Notes to Condensed Consolidated Financial Statements Item 2. Management's Discussion and Analysis of Financial 15Item 3. Quantitative and Qualitative Disclosures About Market Risk 24Item 4. Controls and Procedures 24PART II. OTHER INFORMATION Item 1. Legal Proceedings 25Item 2. Unregistered Sales of Equity Securities and Use of Proceeds 26Item 5. Other Information Item 6. Exhibits 26Index to Exhibits 27Signature28Signature 2PART I. FINANCIAL INFORMATIONITEM 1. FINANCIAL STATEMENTS CONDENSED CONSOLIDATED STATEMENT OF INCOME 2(millions of dollars, unless noted) Three Months Ended
March 31,2024 2023 Revenues and other income Sales and other operating revenue 80,411 83,644 Income from equity affiliates 1,842 2,381 Other income 830 539 Total revenues and other income 83,083 86,564 Costs and other deductions Crude oil and product purchases 47,601 46,003 Production and manufacturing expenses 9,091 9,436 Selling, general and administrative expenses 2,495 2,390 Depreciation and depletion (includes impairments) 4,812 4,244 Exploration expenses, including dry holes 148 141 Non-service pension and postretirement benefit expense 23 167 Interest expense 221 159 Other taxes and duties 6,323 7,221 Total costs and other deductions 70,714 69,761 Income (loss) before income taxes 12,369 16,803 Income tax expense (benefit) 3,803 4,960 Net income (loss) including noncontrolling interests 8,566 11,843 Net income (loss) attributable to noncontrolling interests 346 413 Net income (loss) attributable to ExxonMobil 8,220 11,430 Earnings (loss) per common share (dollars)2.06 2.79 Earnings (loss) per common share - assuming dilution (dollars)2.06 2.79 The information in the Notes to Condensed Consolidated Financial Statements is an integral part of these statements. 3The information in the Notes to Condensed Consolidated Financial Statements is an integral part of these statements.3CONDENSED CONSOLIDATED STATEMENT OF COMPREHENSIVE INCOME (millions of dollars) Three Months Ended
March 31,2024 2023 Net income (loss) including noncontrolling interests 8,566 11,843 Other comprehensive income (net of income taxes) Foreign exchange translation adjustment (1,267) 173 Postretirement benefits reserves adjustment (excluding amortization) (42) 19 Amortization and settlement of postretirement benefits reserves adjustment included in net periodic benefit costs 9 6 Total other comprehensive income (loss) (1,300) 198 Comprehensive income (loss) including noncontrolling interests 7,266 12,041 Comprehensive income (loss) attributable to noncontrolling interests 226 436 Comprehensive income (loss) attributable to ExxonMobil 7,040 11,605 The information in the Notes to Condensed Consolidated Financial Statements is an integral part of these statements. The information in the Notes to Condensed Consolidated Financial Statements is an integral part of these statements.
4The information in the Notes to Condensed Consolidated Financial Statements is an integral part of these statements.5CONDENSED CONSOLIDATED BALANCE SHEET (millions of dollars, unless noted) March 31, 2024 December 31, 2023 ASSETS Current assets Cash and cash equivalents 33,320 31,539 Cash and cash equivalents – restricted 29 29 Notes and accounts receivable – net 40,366 38,015 Inventories Crude oil, products and merchandise 18,891 20,528 Materials and supplies 4,600 4,592 Other current assets 2,171 1,906 Total current assets 99,377 96,609 Investments, advances and long-term receivables 47,608 47,630 Property, plant and equipment – net 213,723 214,940 Other assets, including intangibles – net 17,210 17,138 Total Assets 377,918 376,317 LIABILITIES Current liabilities Notes and loans payable 8,227 4,090 Accounts payable and accrued liabilities 59,531 58,037 Income taxes payable 4,163 3,189 Total current liabilities 71,921 65,316 Long-term debt 32,213 37,483 Postretirement benefits reserves 10,475 10,496 Deferred income tax liabilities 24,106 24,452 Long-term obligations to equity companies 1,909 1,804 Other long-term obligations 24,242 24,228 Total Liabilities 164,866 163,779 Commitments and contingencies (Note 3) EQUITY Common stock without par value(9,000 million shares authorized, 8,019 million shares issued)17,971 17,781 Earnings reinvested 458,339 453,927 Accumulated other comprehensive income (13,169) (11,989) Common stock held in treasury(4,076 million shares at March 31, 2024 and4,048 million shares at December 31, 2023)(257,891) (254,917) ExxonMobil share of equity 205,250 204,802 Noncontrolling interests 7,802 7,736 Total Equity 213,052 212,538 Total Liabilities and Equity 377,918 376,317 The information in the Notes to Condensed Consolidated Financial Statements is an integral part of these statements. 52017 Non-Cash TransactionsIn the first nine months of 2017, the Corporation completed the acquisitions of InterOil Corporation and of companies that own certain oil and gas properties in the Permian Basin and other assets. These transactions included a significant non-cash component. Additional information is provided in CONDENSED CONSOLIDATED STATEMENT OF CASH FLOWS (millions of dollars) Three Months Ended
March 31,2024 2023 CASH FLOWS FROM OPERATING ACTIVITIES Net income (loss) including noncontrolling interests 8,566 11,843 Depreciation and depletion (includes impairments) 4,812 4,244 Changes in operational working capital, excluding cash and debt 2,008 (302) All other items – net (722) 556 Net cash provided by operating activities 14,664 16,341 CASH FLOWS FROM INVESTING ACTIVITIES Additions to property, plant and equipment (5,074) (5,412) Proceeds from asset sales and returns of investments 703 854 Additional investments and advances (421) (445) Other investing activities including collection of advances 215 78 Net cash used in investing activities (4,577) (4,925) CASH FLOWS FROM FINANCING ACTIVITIES Additions to long-term debt 108 20 Reductions in short-term debt(1,106) (126) Additions/(reductions) in debt with three months or less maturity (5) (192) Cash dividends to ExxonMobil shareholders (3,808) (3,738) Cash dividends to noncontrolling interests (166) (115) Changes in noncontrolling interests 6 (16) Common stock acquired (3,011) (4,340) Net cash used in financing activities (7,982) (8,507) Effects of exchange rate changes on cash (324) 102 Increase/(decrease) in cash and cash equivalents 1,781 3,011 Cash and cash equivalents at beginning of period 31,568 29,665 Cash and cash equivalents at end of period 33,349 32,676 SUPPLEMENTAL DISCLOSURES Income taxes paid 2,718 4,404 Cash interest paid Included in cash flows from operating activities 301 256 Capitalized, included in cash flows from investing activities 297 291 Total cash interest paid 598 547 Noncash right of use assets recorded in exchange for lease liabilities Operating leases 351 393 Finance leases — 438 The information in the Notes to Condensed Consolidated Financial Statements is an integral part of these statements. 6CONDENSED CONSOLIDATED STATEMENT OF CHANGE IN EQUITY ExxonMobil Share of Equity (millions of dollars, unless noted) Common Stock Earnings Reinvested Accumulated Other Comprehensive Income Common Stock Held
in TreasuryExxonMobil Share of Equity Non-controlling Interests Total
EquityBalance as of December 31, 2022 15,752 432,860 (13,270) (240,293) 195,049 7,424 202,473 Amortization of stock-based awards 158 — — — 158 — 158 Other (6) — — — (6) (16) (22) Net income (loss) for the period — 11,430 — — 11,430 413 11,843 Dividends - common shares — (3,738) — — (3,738) (115) (3,853) Other comprehensive income (loss) — — 175 — 175 23 198 Share repurchases, at cost — — — (4,385) (4,385) — (4,385) Dispositions — — — 2 2 — 2 Balance as of March 31, 2023 15,904 440,552 (13,095) (244,676) 198,685 7,729 206,414 Balance as of December 31, 2023 17,781 453,927 (11,989) (254,917) 204,802 7,736 212,538 Amortization of stock-based awards 197 — — — 197 — 197 Other (7) — — — (7) 6 (1) Net income (loss) for the period — 8,220 — — 8,220 346 8,566 Dividends - common shares — (3,808) — — (3,808) (166) (3,974) Other comprehensive income (loss) — — (1,180) — (1,180) (120) (1,300) Share repurchases, at cost — — — (2,978) (2,978) — (2,978) Dispositions — — — 4 4 — 4 Balance as of March 31, 2024 17,971 458,339 (13,169) (257,891) 205,250 7,802 213,052 Three Months Ended March 31, 2024 Three Months Ended March 31, 2023 Common Stock Share Activity(millions of shares)Issued Held in Treasury Outstanding Issued Held in Treasury Outstanding Balance as of December 31 8,019 (4,048) 3,971 8,019 (3,937) 4,082 Share repurchases, at cost — (28) (28) — (39) (39) Dispositions — — — — — — Balance as of March 31 8,019 (4,076) 3,943 8,019 (3,976) 4,043 The information in the Notes to Condensed Consolidated Financial Statements is an integral part of these statements. 7NOTES TO CONDENSED CONSOLIDATED FINANCIAL STATEMENTS Note 9. (1) Includes a net reduction of commercial paper with a maturity of over three months of $0.5 billion in 2017 and a net addition of $1.0 billion in 2016. The gross amount of commercial paper with a maturity of over three months issued was $2.7 billion in 2017 and $2.9 billion in 2016, while the gross amount repaid was $3.2 billion in 2017 and $1.9 billion in 2016.The information in the Notes to Condensed Consolidated Financial Statements is an integral part of these statements.6The information in the Notes to Condensed Consolidated Financial Statements is an integral part of these statements.7EXXON MOBIL CORPORATIONNOTES TO CONDENSED CONSOLIDATED FINANCIAL STATEMENTSThese unaudited condensed consolidated financial statements should be read in the context of the consolidated financial statements and notes thereto filed with the Securities and Exchange Commission in the Corporation's 20162023 Annual Report on Form 10-K. In the opinion of the Corporation, the information furnished herein reflects all known accruals and adjustments necessary for a fair statement of the results for the periods reported herein. All such adjustments are of a normal recurring nature. Prior data has been reclassified in certain cases to conform to the current presentation basis.The Corporation's exploration and production activities are accounted for under the "successful efforts" method.On October 11, 2023, the Financial Accounting Standards Board issuedCorporation entered into a new standard, Revenue from Contractsmerger agreement with Customers. The standard establishes a single revenue recognition modelPioneer Natural Resources Company (Pioneer), an independent oil and gas exploration and production company, in exchange for all contractsExxonMobil common stock. Based on the October 5 closing price for ExxonMobil shares, the fixed exchange rate of 2.3234 per Pioneer share, and Pioneer's outstanding net debt, the implied enterprise value of the transaction was approximately $65 billion. We expect that the number of shares issuable in connection with customers, eliminates industry specific requirements, and expands disclosure requirements. The standard is requiredthe transaction to be adopted beginning January 1, 2018. “Sales and Other Operating Revenue” on the Consolidated Statement of Income includes sales, excise and value-added taxes on sales transactions. When the Corporation adopts the standard, revenue will exclude sales-based taxes collected on behalf of third parties. This change in reporting will not impact earnings.approximately 545 million. The Corporation expects to adopt the standard using the Modified Retrospective method, under which prior years’ results are not restated, but supplemental information on the impact of the new standardtransaction is provided for 2018 results. The Corporation continues to evaluate other areas of the standard, which are not expected to have a material effect on the Corporation’s financial statements.In January 2016, the Financial Accounting Standards Board issued an updated standard, Financial Instruments—Overall (Subtopic 825-10): Recognition and Measurement of Financial Assets and Financial Liabilities. The standard requires investments in equity securities other than consolidated subsidiaries and equity method investments to be measured at fair value with changesclose in the fair value recognized throughsecond quarter of 2024, subject to regulatory approvals.Pioneer holds over 850,000 net income. Companies can elect a modified approach for equity securities that do not have a readily determinable fair value. ExxonMobil is evaluating the standard and its effect on the Corporation’s financial statements and plans to adopt it in 2018.In March 2017, the Financial Accounting Standards Board issued an Accounting Standards Update, Compensation – Retirement Benefits (Topic 715): Improving the Presentation of Net Periodic Pension Cost and Net Periodic Postretirement Benefit Cost. The update requires the service cost component of net benefit costs to be reportedacres in the same lineMidland Basin of West Texas, which consist of proved reserves totaling over 2.4 billion barrels of oil equivalent (as of December 31, 2023) and over 700 thousand oil-equivalent barrels per day of production for the income statement as other compensation costs and the other components of net benefit costs (non-service costs) to be presented separately from the service cost component. Additionally, only the service cost component of net benefit costs will be eligible for capitalization. The update is required to be adopted beginning January 1, 2018. The Corporation expects to add a new line “Non-service pension and postretirement benefit expense” to its Consolidated Statement of Income. This line would reflect the non-service costs that were previously included in “Production and manufacturing expenses” and “Selling, general and administrative expenses”. The update is not expected to have a material impact on the Corporation’s financial statements. Beginning January 1, 2018, the Corporation expects to include all of the non-service costs in its Corporate and financing segment.In February 2016, the Financial Accounting Standards Board issued a new standard, Leases. The standard requires all leases with an initial term greater than one year be recorded on the balance sheet as an asset and a lease liability. ExxonMobil is evaluating the standard and its effect on the Corporation’s financial statements and plans to adopt it in 2019. 8LitigationA variety of claims have been made against ExxonMobil and certain of its consolidated subsidiaries in a number of pending lawsuits. Management has regular litigation reviews, including updates from corporate and outside counsel, to assess the need for accounting recognition or disclosure of these contingencies. The Corporation accrues an undiscounted liability for those contingencies where the incurrence of a loss is probable and the amount can be reasonably estimated. If a range of amounts can be reasonably estimated and no amount within the range is a better estimate than any other amount, then the minimum of the range is accrued. The Corporation does not record liabilities when the likelihood that the liability has been incurred is probable but the amount cannot be reasonably estimated or when the liability is believed to be only reasonably possible or remote. For contingencies where an unfavorable outcome is reasonably possible and which are significant, the Corporation discloses the nature of the contingency and, where feasible, an estimate of the possible loss. For purposes of our contingency disclosures, “significant” includes material matters, as well as other matters which management believes should be disclosed.State and local governments and other entities in various jurisdictions across the United States and its territories have filed a number of legal proceedings against several oil and gas companies, including ExxonMobil, will continuerequesting unprecedented legal and equitable relief for various alleged injuries purportedly connected to defend itself vigorouslyclimate change. These lawsuits assert a variety of novel, untested claims under statutory and common law. Additional such lawsuits may be filed. We believe the legal and factual theories set forth in these matters. Based onproceedings are meritless and represent an inappropriate attempt to use the court system to usurp the proper role of policymakers in addressing the societal challenges of climate change.Local governments in Louisiana have filed unprecedented legal proceedings against a considerationnumber of all relevant factsoil and circumstances,gas companies, including ExxonMobil, requesting compensation for the Corporation does notrestoration of coastal marsh erosion in the state. We believe the ultimatefactual and legal theories set forth in these proceedings are meritless.While the outcome of any currently pending lawsuit against ExxonMobillitigation can be unpredictable, we believe the likelihood is remote that the ultimate outcomes of these lawsuits will have a material adverse effect uponon the Corporation'sCorporation’s operations, financial condition, or financial statements taken as a whole.Other ContingenciesThe Corporation and certain of its consolidated subsidiaries were contingently liable at September 30, 2017,March 31, 2024, for guarantees relating to notes, loans and performance under contracts. Where guarantees for environmental remediation and other similar matters do not include a stated cap, the amounts reflect management’s estimate of the maximum potential exposure. These guarantees areWhere it is not reasonably likelypossible to make a reasonable estimation of the maximum potential amount of future payments, future performance is expected to be either immaterial or have only a material effect on the Corporation’s financial condition, changes in financial condition, revenues or expenses, resultsremote chance of operations, liquidity, capital expenditures or capital resources.occurrence. March 31, 2024 (millions of dollars) Equity CompanyObligations (1)Other Third-Party Obligations Total Guarantees Debt-related 1,130 146 1,276 Other 681 5,820 6,501 Total 1,811 5,966 7,777 (1) ExxonMobil shareAdditionally, the Corporation and its affiliates have numerous long-term sales and purchase commitments in their various business activities, all of which are expected to be fulfilled with no adverse consequences material to the Corporation’s operations or financial condition.The operations and earnings of the Corporation and its affiliates throughout the world have been, and may in the future be, affected from time to time in varying degree by political developments and laws and regulations, such as forced divestiture of assets; restrictions on production, imports and exports; price controls; tax increases and retroactive tax claims; expropriation of property; cancellation of contract rights and environmental regulations. Both the likelihood of such occurrences and their overall effect upon the Corporation vary greatly from country to country and are not predictable.In accordance with a nationalization decree issued by Venezuela’s president in February 2007, by May 1, 2007, a subsidiary of the Venezuelan National Oil Company (PdVSA) assumed the operatorship of the Cerro Negro Heavy Oil Project. This Project had been operated and owned by ExxonMobil affiliates holding a 41.67 percent ownership interest in the Project. The decree also required conversion of the Cerro Negro Project into a “mixed enterprise” and an increase in PdVSA’s or one of its affiliate’s ownership interest in the Project, with the stipulation that if ExxonMobil refused to accept the terms for the formation of the mixed enterprise within a specified period of time, the government would “directly assume the activities” carried out by the joint venture. ExxonMobil refused to accede to the terms proffered by the government, and on June 27, 2007, the government expropriated ExxonMobil’s 41.67 percent interest in the Cerro Negro Project.9On September 6, 2007, affiliates of ExxonMobil filed a Request for Arbitration with the International Centre for Settlement of Investment Disputes (ICSID). The ICSID Tribunal issued a decision on June 10, 2010, finding that it had jurisdiction to proceed on the basis of the Netherlands-Venezuela Bilateral Investment Treaty. On October 9, 2014, the ICSID Tribunal issued its final award finding in favor of the ExxonMobil affiliates and awarding $1.6 billion as of the date of expropriation, June 27, 2007, and interest from that date at 3.25% compounded annually until the date of payment in full. The Tribunal also noted that one of the Cerro Negro Project agreements provides a mechanism to prevent double recovery between the ICSID award and all or part of an earlier award of $908 million to an ExxonMobil affiliate, Mobil Cerro Negro, Ltd., against PdVSA and a PdVSA affiliate, PdVSA CN, in an arbitration under the rules of the International Chamber of Commerce.On February 2, 2015, Venezuela filed a Request for Annulment of the ICSID award. On March 9, 2017, the ICSID Committee hearing the Request for Annulment issued a decision partially annulling the award of the Tribunal issued on October 9, 2014. The Committee affirmed the compensation due for the La Ceiba project and for export curtailments at the Cerro Negro project, but annulled the portion of the award relating to the Cerro Negro Project’s expropriation ($1.4 billion) based on its determination that the prior Tribunal failed to adequately explain why the cap on damages in the indemnity owed by PdVSA did not affect or limit the amount owed for the expropriation of the Cerro Negro project. As a result, ExxonMobil retains an award for $260 million (including accrued interest). ExxonMobil reached an agreement with Venezuela for full payment of the $260 million and Venezuela has begun performing on it. The agreement does not impact ExxonMobil’s ability to re-arbitrate the issue that was the basis for the annulment in a new ICSID arbitration proceeding.The United States District Court for the Southern District of New York entered judgment on the ICSID award on October 10, 2014. Motions filed by Venezuela to vacate that judgment on procedural grounds and to modify the judgment by reducing the rate of interest to be paid on the ICSID award from the entry of the court’s judgment, until the date of payment, were denied on February 13, 2015, and March 4, 2015, respectively. On March 9, 2015, Venezuela filed a notice of appeal of the court’s actions on the two motions. On July 11, 2017, the United States Court of Appeals for the Second Circuit rendered its opinion overturning the District Court’s decision and vacating the judgment on the grounds that a different procedure should have been used to reduce the award to judgment. The Corporation is evaluating next steps.A stay of the District Court’s judgment has continued pending the completion of the Second Circuit appeal. The net impact of these matters on the Corporation’s consolidated financial results cannot be reasonably estimated. Regardless, the Corporation does not expect the resolution to have a material effect upon the Corporation’s operations or financial condition.An affiliate of ExxonMobil is one of the Contractors under a Production Sharing Contract (PSC) with the Nigerian National Petroleum Corporation (NNPC) covering the Erha block located in the offshore waters of Nigeria. ExxonMobil's affiliate is the operator of the block and owns a 56.25 percent interest under the PSC. The Contractors are in dispute with NNPC regarding NNPC's lifting of crude oil in excess of its entitlement under the terms of the PSC. In accordance with the terms of the PSC, the Contractors initiated arbitration in Abuja, Nigeria, under the Nigerian Arbitration and Conciliation Act. On October 24, 2011, a three-member arbitral Tribunal issued an award upholding the Contractors' position in all material respects and awarding damages to the Contractors jointly in an amount of approximately $1.8 billion plus $234 million in accrued interest. The Contractors petitioned a Nigerian federal court for enforcement of the award, and NNPC petitioned the same court to have the award set aside. On May 22, 2012, the court set aside the award. The Contractors appealed that judgment to the Court of Appeal, Abuja Judicial Division. On July 22, 2016, the Court of Appeal upheld the decision of the lower court setting aside the award. On October 21, 2016, the Contractors appealed the decision to the Supreme Court of Nigeria. In June 2013, the Contractors filed a lawsuit against NNPC in the Nigerian federal high court in order to preserve their ability to seek enforcement of the PSC in the courts if necessary. Following dismissal by this court, the Contractors appealed to the Nigerian Court of Appeal in June 2016. In October 2014, the Contractors filed suit in the United States District Court for the Southern District of New York to enforce, if necessary, the arbitration award against NNPC assets residing within that jurisdiction. NNPC has moved to dismiss the lawsuit. The stay in the proceedings in the Southern District of New York has been lifted. At this time, the net impact of this matter on the Corporation's consolidated financial results cannot be reasonably estimated. However, regardless of the outcome of enforcement proceedings, the Corporation does not expect the proceedings to have a material effect upon the Corporation's operations or financial condition.10ExxonMobil Share of Accumulated OtherComprehensive Income(millions of dollars)Cumulative Foreign
Exchange
Translation
AdjustmentPostretirement
Benefits Reserves
AdjustmentTotal Balance as of December 31, 2022 (14,591) 1,321 (13,270) Current period change excluding amounts reclassified from accumulated other comprehensive income (1)157 14 171 Amounts reclassified from accumulated other comprehensive income — 4 4 Total change in accumulated other comprehensive income 157 18 175 Balance as of March 31, 2023 (14,434) 1,339 (13,095) Balance as of December 31, 2023 (13,056) 1,067 (11,989) Current period change excluding amounts reclassified from accumulated other comprehensive income (1)(1,138) (48) (1,186) Amounts reclassified from accumulated other comprehensive income — 6 6 Total change in accumulated other comprehensive income (1,138) (42) (1,180) Balance as of March 31, 2024 (14,194) 1,025 (13,169) (1) Cumulative Foreign Exchange Translation Adjustment includes net investment hedge gain/(loss) net of taxes of $84 million and $(74) million in 2024 and 2023, respectively.(1) These accumulated other comprehensive income components are included in the computation of net periodic pension cost. (See Amounts Reclassified Out of Accumulated OtherComprehensive Income - Before-tax Income/(Expense)(millions of dollars)Three Months Ended
March 31,2024 2023 Amortization and settlement of postretirement benefits reserves adjustment included in net periodic benefit costs (Statement of Income line: Non-service pension and postretirement benefit expense) (12) (8) Income Tax (Expense)/Credit ForComponents of Other Comprehensive Income(millions of dollars)Three Months Ended
March 31,2024 2023 Foreign exchange translation adjustment (75) 48 Postretirement benefits reserves adjustment (excluding amortization) 4 11 Amortization and settlement of postretirement benefits reserves adjustment included in net periodic benefit costs (3) (2) Total (74) 57 10Note 6 – Pension and Other Postretirement Benefits for additional details.)11Earnings per common share Three Months Ended
March 31,2024 2023 Net income (loss) attributable to ExxonMobil (millions of dollars)8,220 11,430 Weighted-average number of common shares outstanding (millions of shares) (1)3,998 4,102 Earnings (loss) per common share (dollars) (2)2.06 2.79 Dividends paid per common share (dollars)0.95 0.91 (1) Includes restricted shares not vested.(2) Earnings (loss) per common share and earnings (loss) per common share – assuming dilution are the same in each period shown.(1) The calculation of earnings per common share and earnings per common share – assuming dilution are the same in each period shown. (millions of dollars) Three Months Ended
March 31,2024 2023 Components of net benefit cost Pension Benefits - U.S. Service cost 113 120 Interest cost 168 166 Expected return on plan assets (181) (133) Amortization of actuarial loss/(gain) 21 21 Amortization of prior service cost (8) (7) Net pension enhancement and curtailment/settlement cost 3 8 Net benefit cost 116 175 Pension Benefits - Non-U.S. Service cost 83 82 Interest cost 227 234 Expected return on plan assets (261) (174) Amortization of actuarial loss/(gain) 25 14 Amortization of prior service cost 13 12 Net benefit cost 87 168 Other Postretirement Benefits Service cost 18 20 Interest cost 63 70 Expected return on plan assets (5) (4) Amortization of actuarial loss/(gain) (26) (30) Amortization of prior service cost (16) (10) Net benefit cost 34 46 1211Note 7. Financial InstrumentsThe estimated fair value of financial instruments and derivatives at March 31, 2024 and December 31, 2023, and the related hierarchy level for the fair value measurement was as follows: March 31, 2024 Fair Value (millions of dollars) Level 1 Level 2 Level 3 Total Gross Assets
& LiabilitiesEffect of
Counterparty NettingEffect of
Collateral
NettingDifference in Carrying Value and Fair Value Net
Carrying
ValueAssets Derivative assets (1)5,813 1,304 — 7,117 (6,492) (88) — 537 Advances to/receivables from equity companies (2)(6)— 2,458 4,657 7,115 — — 498 7,613 Other long-term financial assets (3)1,372 — 1,042 2,414 — — 174 2,588 Liabilities Derivative liabilities (4)5,944 1,376 — 7,320 (6,492) (218) — 610 Long-term debt (5)25,558 1,378 — 26,936 — — 3,494 30,430 Long-term obligations to equity companies (6)— — 2,039 2,039 — — (130) 1,909 Other long-term financial liabilities (7)— — 694 694 — — 48 742 December 31, 2023 Fair Value (millions of dollars) Level 1 Level 2 Level 3 Total Gross Assets
& LiabilitiesEffect of
Counterparty NettingEffect of
Collateral
NettingDifference in Carrying Value and Fair Value Net
Carrying
ValueAssets Derivative assets (1)4,544 1,731 — 6,275 (5,177) (528) — 570 Advances to/receivables from equity companies (2)(6)— 2,517 4,491 7,008 — — 519 7,527 Other long-term financial assets (3)1,389 — 944 2,333 — — 202 2,535 Liabilities Derivative liabilities (4)4,056 1,608 — 5,664 (5,177) (40) — 447 Long-term debt (5)30,556 2,004 — 32,560 — — 3,102 35,662 Long-term obligations to equity companies (6)— — 1,896 1,896 — — (92) 1,804 Other long-term financial liabilities (7)— — 697 697 — — 45 742 (1) Included in the Balance Sheet lines: Notes and accounts receivable - net and Other assets, including intangibles - net.(2) Included in the Balance Sheet line: Investments, advances and long-term receivables.(3) Included in the Balance Sheet lines: Investments, advances and long-term receivables and Other assets, including intangibles - net.(4) Included in the Balance Sheet lines: Accounts payable and accrued liabilities and Other long-term obligations.(5) Excluding finance lease obligations.(6) Advances to/receivables from equity companies and long-term obligations to equity companies are mainly designated as hierarchy level 3 inputs. The fair value is calculated by discounting the remaining obligations by a rate consistent with the credit quality and industry of the company.(7) Included in the Balance Sheet line: Other long-term obligations. Includes contingent consideration related to a prior year acquisition where fair value is based on expected drilling activities and discount rates.At March 31, 2024 and December 31, 2023, respectively, the Corporation had $736 million and $800 million of collateral under master netting arrangements not offset against the derivatives on the Condensed Consolidated Balance Sheet, primarily related to initial margin requirements.12The Corporation may use non-derivative financial instruments, such as its foreign currency-denominated debt, as hedges of its net investments in certain foreign subsidiaries. Under this method, the change in the carrying value of the financial instruments due to foreign exchange fluctuations is determined by referencereported in accumulated other comprehensive income. As of March 31, 2024, the Corporation has designated $4.9 billion of its Euro-denominated debt and related accrued interest as a net investment hedge of its European business. The net investment hedge is deemed to observable market databe perfectly effective.The Corporation had undrawn short-term committed lines of credit of $323 million and undrawn long-term committed lines of credit of $1,914 million as of first quarter 2024.Derivative InstrumentsThe Corporation’s size, strong capital structure, geographic diversity, and the complementary nature of its business segments reduce the Corporation’s enterprise-wide risk from changes in commodity prices, currency rates and interest rates. In addition, the Corporation uses commodity-based contracts, including derivatives, to manage commodity price risk and to generate returns from trading. Commodity contracts held for trading purposes are presented in the Condensed Consolidated Statement of Income on a net basis in the line “Sales and other valuation techniquesoperating revenue" and in the Consolidated Statement of Cash Flows in “Cash Flows from Operating Activities”. The Corporation’s commodity derivatives are not accounted for under hedge accounting. At times, the Corporation also enters into currency and interest rate derivatives, none of which are material to the Corporation’s financial position as appropriate. The only category of financial instruments where the difference between fair valueMarch 31, 2024 and recorded book value is notable is long-term debt. The estimated fair value of total long-term debt, excluding capitalized lease obligations, was $24,199 million at September 30, 2017, and $27,968 million at December 31, 2016, as compared to recorded book values2023, or results of $23,523 millionoperations for the periods ended March 31, 2024 and 2023.Credit risk associated with the Corporation’s derivative position is mitigated by several factors, including the use of derivative clearing exchanges and the quality of and financial limits placed on derivative counterparties. The Corporation maintains a system of controls that includes the authorization, reporting, and monitoring of derivative activity.The net notional long/(short) position of derivative instruments at September 30, 2017,March 31, 2024 and $27,707 million at December 31, 2016.The fair value2023, was as follows:(millions) March 31, 2024 December 31, 2023 Crude oil (barrels) 15 (7) Petroleum products (barrels) (39) (43) Natural gas (MMBTUs) (577) (560) Realized and unrealized gains/(losses) on derivative instruments that were recognized in the Condensed Consolidated Statement of long-term debt by hierarchy level at September 30, 2017, is: Level 1 $24,021 million; Level 2 $172 million; and Level 3 $6 million. Level 1 represents quoted pricesIncome are included in active markets. Level 2 includes debt whose fair value is based uponthe following lines on a publicly available index. Level 3 involves using internal data augmented by relevant market indicators if available.(millions of dollars) Three Months Ended
March 31,2024 2023 Sales and other operating revenue (792) 651 Crude oil and product purchases 3 (25) Total (789) 626 13(millions of dollars) Three Months Ended
March 31,2024 2023 Earnings (Loss) After Income Tax Upstream United States 1,054 1,632 Non-U.S. 4,606 4,825 Energy Products United States 836 1,910 Non-U.S. 540 2,273 Chemical Products United States 504 324 Non-U.S. 281 47 Specialty Products United States 404 451 Non-U.S. 357 323 Corporate and Financing (362) (355) Corporate total 8,220 11,430 Sales and Other Operating Revenue Upstream United States 2,190 2,770 Non-U.S. 3,526 5,387 Energy Products United States 24,803 24,924 Non-U.S. 39,409 39,976 Chemical Products United States 2,194 2,029 Non-U.S. 3,646 3,692 Specialty Products United States 1,469 1,568 Non-U.S. 3,150 3,289 Corporate and Financing 24 9 Corporate total 80,411 83,644 Intersegment Revenue Upstream United States 5,988 4,956 Non-U.S. 9,980 9,399 Energy Products United States 6,558 5,451 Non-U.S. 6,752 6,969 Chemical Products United States 1,865 1,788 Non-U.S. 1,025 777 Specialty Products United States 655 680 Non-U.S. 164 99 Corporate and Financing 79 64 1314Geographic Sales and Other Operating Revenue (millions of dollars) Three Months Ended
March 31,2024 2023 United States 30,656 31,291 Non-U.S. 49,755 52,353 Total 80,411 83,644 Significant Non-U.S. revenue sources include: (1)Canada 7,055 6,721 United Kingdom 5,160 7,011 Singapore 4,018 3,731 France 3,473 3,484 Australia 2,425 2,428 Belgium 2,407 2,649 Germany 2,347 2,293 (1) Revenue is determined by primary country of operations. Excludes certain sales and other operating revenues in non-U.S. operations where attribution to a specific country is not practicable.Revenue from Contracts with CustomersSales and other operating revenue include both revenue within the scope of ASC 606 and outside the scope of ASC 606. Trade receivables in Notes and accounts receivable – net reported on the Balance Sheet also includes both receivables within the scope of ASC 606 and those outside the scope of ASC 606. Revenue and receivables outside the scope of ASC 606 primarily relate to physically settled commodity contracts accounted for as derivatives. Contractual terms, credit quality, and type of customer are generally similar between those revenues and receivables within the scope of ASC 606 and those outside it.Sales and other operating revenue(millions of dollars)Three Months Ended
March 31,2024 2023 Revenue from contracts with customers 58,419 64,304 Revenue outside the scope of ASC 606 21,992 19,340 Total 80,411 83,644 15Note 9. InterOil Corporation and Permian Basin Properties AcquisitionsOn February 22, 2017,Divestment ActivitiesThrough March 31, 2024, the Corporation realized proceeds of approximately $0.7 billion from its divestment activities with negligible impact on net after-tax earnings. This included the sale of the Santa Ynez Unit and associated facilities in California, as well as other smaller divestments.In 2023, the Corporation realized proceeds of approximately $4.1 billion and recognized net after-tax earnings of approximately $0.6 billion from its divestment activities. This included the sale of the Aera Energy joint venture, Esso Thailand Ltd., the Billings Refinery, certain unconventional assets in the United States, as well as other smaller divestments.In February 2022, the Corporation signed an agreement with Seplat Energy Offshore Limited for the sale of Mobil Producing Nigeria Unlimited. The agreement is subject to certain conditions precedent and government approvals. In mid-2022, a Nigerian court issued an order to halt transition activities and enter into arbitration with the Nigerian National Petroleum Company. The closing date and any loss on sale will depend on resolution of these matters.16ITEM 2. MANAGEMENT'S DISCUSSION AND ANALYSIS OF FINANCIAL CONDITION AND RESULTS OF OPERATIONSOverviewIn the first quarter of 2024 the price of crude oil remained flat relative to fourth quarter 2023 and near the middle of the pre-COVID 10-year range (2010-2019), as markets remained balanced. More recently, the market for crude has tightened driven by ongoing concerns over conflict in the Middle East. Natural gas prices decreased, moving back toward the middle of the 10-year range, on high inventory levels and lower demand. Refining margins in the quarter rose to the top of the 10-year range, as demand grew while turnarounds and global disruptions weighed on supply. Chemical margins remained relatively flat at bottom-of-cycle conditions, as new capacity additions offset demand growth.Recent Mergers and AcquisitionsIn October 2023, ExxonMobil announced that it had entered into a definitive merger agreement with Pioneer Natural Resources. The transaction represents an opportunity to deliver leading capital efficiency and cost performance as well as increase production by combining Pioneer's large scale, contiguous, high-quality undeveloped Midland acreage with ExxonMobil's Permian resource development approach. In addition to increasing production, we plan to pull forward Pioneer's Net Zero ambition by 15 years, from 2050 to 2035. See "Note 2. Pioneer Natural Resources Merger" of the Condensed Consolidated Financial Statements for additional information.Selected Earnings Factor DefinitionsThe earnings factors have been updated to provide additional visibility into drivers of our business results starting this first quarter of 2024. The company evaluates these factors periodically to determine if any enhancements may provide helpful insights to the market. Listed below are descriptions of the earnings factors:Advantaged Volume Growth. Earnings impacts from change in volume/mix from advantaged assets, strategic projects, and high-value products.•Advantaged Assets (Advantaged growth projects). Includes Permian, Guyana, Brazil, and LNG.•Strategic Projects. Includes (i) the following completed projects: Rotterdam Hydrocracker, Corpus Christi Chemical Complex, Baton Rouge Polypropylene, Beaumont Crude Expansion, Baytown Chemical Expansion, Permian Crude Venture, and the acquisition2022 Baytown advanced recycling facility; and (ii) the following projects still to be completed: Fawley Hydrofiner, China Chemical Complex, Singapore Resid Upgrade, Strathcona Renewable Diesel, Proxxima VentureTM, USGC Reconfiguration, additional advanced recycling projects under evaluation worldwide, and additional projects in plan yet to be publicly announced.•High-Value Products. Includes performance products and lower-emission fuels. Performance products (performance chemicals, performance lubricants) refers to products that provide differentiated performance for multiple applications through enhanced properties versus commodity alternatives and bring significant additional value to customers and end-users. Lower-emission fuels refers to fuels with lower life cycle emissions than conventional transportation fuels for gasoline, diesel and jet transport.Base Volume. Includes all volume/mix factors not included in Advantaged Volume Growth defined above.Structural Cost Savings. After-tax earnings effect of InterOilStructural Cost Savings as defined on page 19, including cash operating expenses related to divestments that were previously in the "volume/mix" factor.Expenses. Includes all expenses otherwise not included in other earnings factors.Timing Effects. Timing effects are primarily related to unsettled derivatives (mark-to-market) and other earnings impacts driven by timing differences between the settlement of derivatives and their offsetting physical commodity realizations (due to LIFO inventory accounting).17Earnings (loss) excluding Identified ItemsEarnings (loss) excluding Identified Items (non-GAAP) are earnings (loss) excluding individually significant non-operational events with, typically, an absolute corporate total earnings impact of at least $250 million in a given quarter. The earnings (loss) impact of an Identified Item for an individual segment in a given quarter may be less than $250 million when the item impacts several periods or several segments. Earnings (loss) excluding identified items does include non-operational earnings events or impacts that are generally below the $250 million threshold utilized for Identified Items. Management uses these figures to improve comparability of the underlying business across multiple periods by isolating and removing significant non-operational events from business results. The Corporation (IOC) for $2.7 billion. The IOC acquisition was unproved properties in Papua New Guinea. Consideration included 28 million shares of Exxon Mobil Corporation common stock having a value on the acquisition date of $2.2 billion, a Contingent Resource Payment (CRP)believes this view provides investors increased transparency into business results and trends and provides investors with a fair value of $0.3 billion and cash of $0.2 billion. The CRP provides IOC shareholders $7.07 per share in cash for each incremental independently certified Trillion Cubic Feet Equivalent (TCFE) of resources above 6.2 TCFE, up to 11.0 TCFE. IOC’s assets include a contingent receivable related to the same resource base for volumes in excess of 3.5 TCFE at amounts ranging from $0.24 - $0.40 per thousand cubic feet equivalent. The fair valueview of the contingent receivable was $1.1 billion atbusiness as seen through the acquisition date. Fair valueseyes of contingent amounts were based on assumptions about the outcome of the resource certification, future business plans and appropriate discount rates.On September 6, 2017, the resource certification was finalized triggering both payment of the CRP to former IOC shareholders and receipt of the current portion of the contingent receivable. The earnings impact from settlement of the CRP and the related contingent receivable wasmanagement. Earnings (loss) excluding Identified Items is not material.Permian Basin PropertiesOn February 28, 2017, the Corporation completed the acquisition for $6.2 billion of a number of companies from the Bass family in Fort Worth, Texas, that indirectly own mostly unproved oil and gas properties in the Permian Basin and other assets. Consideration included 68 million shares of Exxon Mobil Corporation common stock having a value on the acquisition date of $5.5 billion, together with additional contingent cash payments tied to future drilling and completion activities (up to a maximum of $1.02 billion). The fair value of the contingent payment was $0.7 billion as of the acquisition date and is expectedmeant to be paid beginningviewed in 2020 and ending no later than 2032 commensurateisolation or as a substitute for net income (loss) attributable to ExxonMobil as prepared in accordance with the development of the resource. Fair value of the contingent payment was based on assumptions including drilling and completion activities, appropriate discount rates and tax rates.Below is a summary of the net assets acquired for each acquisition.Three Months Ended
March 31, 2024Upstream Energy Products Chemical Products Specialty Products Corporate and Financing Total (millions of dollars) U.S. Non-U.S. U.S. Non-U.S. U.S. Non-U.S. U.S. Non-U.S. Earnings (loss) (U.S. GAAP)1,054 4,606 836 540 504 281 404 357 (362) 8,220 Total Identified Items — — — — — — — — — — Earnings (loss) excluding Identified Items (Non-GAAP)1,054 4,606 836 540 504 281 404 357 (362) 8,220 Three Months Ended
March 31, 2023Upstream Energy Products Chemical Products Specialty Products Corporate and Financing Total (millions of dollars) U.S. Non-U.S. U.S. Non-U.S. U.S. Non-U.S. U.S. Non-U.S. Earnings (loss) (U.S. GAAP)1,632 4,825 1,910 2,273 324 47 451 323 (355) 11,430 Identified Items Tax-related items — (158) — (30) — — — — — (188) Earnings (loss) excluding Identified Items (Non-GAAP)1,632 4,983 1,910 2,303 324 47 451 323 (355) 11,618 10.Accounting for Suspended Exploratory Well CostsFor the category of exploratory well costs at year-end 2016 that were suspended more than one year, a total of $240 million was expensed in the first nine months of 2017.14Item 2. Management's Discussion and Analysis of Financial Condition and Results of OperationscorporateCorporate earnings (loss) mean net income (loss) attributable to ExxonMobil (U.S. GAAP) from the consolidated income statement.Condensed Consolidated Statement of Income. Unless otherwise indicated, references to earnings (loss); Upstream, Downstream,Energy Products, Chemical Products, Specialty Products, and Corporate and financing segmentFinancing earnings (loss); and earnings (loss) per share are ExxonMobil's share after excluding amounts attributable to noncontrolling interests.Due to rounding, numbers presented may not add up precisely to the totals indicated.18Structural Cost SavingsStructural Cost Savings describes decreases in cash opex excluding energy and production taxes as a result of operational efficiencies, workforce reductions, divestment-related reductions, and other cost-savings measures that are expected to be sustainable compared to 2019 levels. Relative to 2019, estimated cumulative Structural Cost Savings totaled $10.1 billion, which included an additional $0.4 billion in the first three months of 2024. The total change between periods in expenses below will reflect both Structural Cost Savings and other changes in spend, including market factors, such as inflation and foreign exchange impacts, as well as changes in activity levels and costs associated with new operations. Estimates of cumulative annual structural savings may be revised depending on whether cost reductions realized in prior periods are determined to be sustainable compared to 2019 levels. Structural Cost Savings are stewarded internally to support management's oversight of spending over time. This measure is useful for investors to understand the Corporation's efforts to optimize spending through disciplined expense management.Dollars in billions (unless otherwise noted) Twelve Months
Ended December 31,Three Months
Ended March 31,2019 2023 2023 2024 Components of Operating Costs From ExxonMobil’s Consolidated Statement of Income
(U.S. GAAP)Production and manufacturing expenses 36.8 36.9 9.4 9.1 Selling, general and administrative expenses 11.4 9.9 2.4 2.5 Depreciation and depletion (includes impairments) 19.0 20.6 4.2 4.8 Exploration expenses, including dry holes 1.3 0.8 0.1 0.1 Non-service pension and postretirement benefit expense 1.2 0.7 0.2 — Subtotal 69.7 68.9 16.4 16.5 ExxonMobil’s share of equity company expenses (non-GAAP) 9.1 10.5 2.7 2.4 Total Adjusted Operating Costs (non-GAAP) 78.8 79.4 19.1 18.9 Total Adjusted Operating Costs (non-GAAP) 78.8 79.4 19.1 18.9 Less: Depreciation and depletion (includes impairments) 19.0 20.6 4.2 4.8 Non-service pension and postretirement benefit expense 1.2 0.7 0.2 — Other adjustments (includes equity company depreciation
and depletion)3.6 3.7 0.8 0.9 Total Cash Operating Expenses (Cash Opex) (non-GAAP) 55.0 54.4 13.9 13.2 Energy and production taxes (non-GAAP) 11.0 14.9 4.3 3.4 Total Cash Operating Expenses (Cash Opex) excluding Energy and Production Taxes (non-GAAP) 44.0 39.5 9.6 9.8 Change
vs
2019Change
vs
2023Estimated Cumulative vs
2019Total Cash Operating Expenses (Cash Opex) excluding Energy and Production Taxes (non-GAAP) -4.5 +0.2 Market +3.6 +0.1 Activity/Other +1.6 +0.5 Structural Cost Savings -9.7 -0.4 -10.1 Due to rounding, numbers presented may not add up precisely to the totals indicated. 19REVIEW OF THIRDFIRST QUARTER 20172024 RESULTSExxonMobil’s third quarter 2017first-quarter 2024 earnings of $4were $8.2 billion, or $0.93 per diluted share, compared with $2.7 billion a year earlier, as commodity prices improved and performance in the Upstream and Downstream strengthened.Earnings of $11.3 billion for the first nine months of 2017 increased 84 percent from $6.2 billion in 2016.Earnings$2.06 per share assuming dilution, were $2.66.$14.1$5.8 billion, down 3 percent$0.5 billion from 2016.Oil‑equivalent production was 4first quarter 2023.UPSTREAMUpstream Financial Results (millions of dollars) Three Months Ended
March 31,2024 2023 Earnings (loss) (U.S. GAAP)United States 1,054 1,632 Non-U.S. 4,606 4,825 Total 5,660 6,457 Identified Items (1)United States — — Non-U.S. — (158) Total — (158) Earnings (loss) excluding Identified Items (1) (Non-GAAP)United States 1,054 1,632 Non-U.S. 4,606 4,983 Total 5,660 6,615 (1) Refer to page 18 for definition of Identified Items and earnings (loss) excluding Identified Items.20Upstream First Quarter Earnings Factor Analysis (millions of dollars) 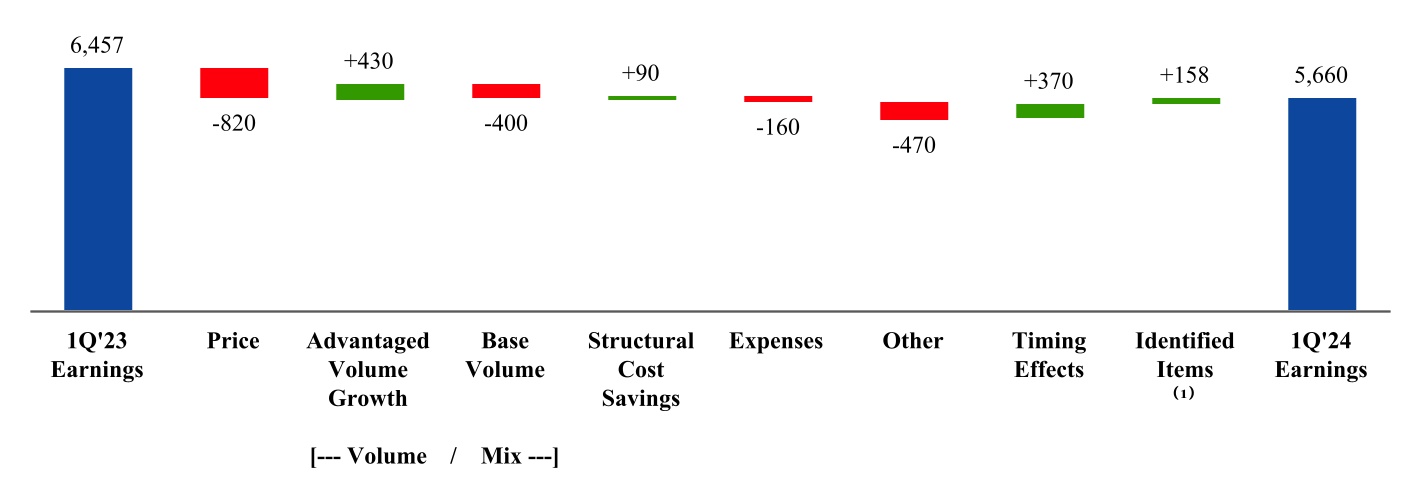 Price– Price impacts decreased earnings by $820 million,
 barrels per day, down 1 percentdriven by a 32% decrease in natural gas realizations, partially offset by a 4% increase in liquids realizations.Advantaged Volume Growth – Higher volumes from the prior year. Excluding entitlement effects and divestments, oil‑equivalent production was up 1 percent from the prior year.The Corporation distributed $9.7 billion in dividends to shareholders.15 Upstream earnings were $1,567 million in the third quarter of 2017, up $947 million from the third quarter of 2016. Higher liquids and gas realizationsadvantaged assets increased earnings by $860$430 million, mainly driven by Guyana liquids growth.Base Volume – Lower base volumes decreased earnings by $400 million, mainly driven by divestments, government-mandated curtailments, and unfavorable entitlement effects.Structural Cost Savings – Increased earnings by $90 million.Expenses – Higher volumeexpenses, primarily from depreciation, decreased earnings by $160 million.Other – Other items decreased earnings by $470 million, reflecting other primarily non-cash impacts from tax and mixinventory adjustments as well as divestments.Timing Effects – Less unfavorable timing effects from derivatives mark-to-market impacts increased earnings by $20$370 million. All other items increasedIdentified Items (1) –1Q2023 $(158) million loss driven by additional European taxes.(1) Refer to page 18 for definition of Identified Items and earnings by $70 million as lower expenses were partly offset by unfavorable foreign exchange effects.On an oil-equivalent basis, production increased 2 percent from the third quarter of 2016. Liquids production totaled 2.3 million barrels per day, up 69,000 barrels per day as lower downtime and higher project volumes were partly offset by field decline. Natural gas production was 9.6 billion cubic feet per day, down 16 million cubic feet per day from 2016 as field decline and lower demand were partly offset by project ramp‑up, primarily in Australia, and work programs.U.S. Upstream results were a loss of $238 million in the third quarter of 2017, compared to a loss of $477 million in the third quarter of 2016. Non‑U.S. Upstream earnings were $1,805 million, up $708 million from the prior year.21Upstream Operational Results Three Months Ended
March 31, 2024 2023 Net production of crude oil, natural gas liquids, bitumen and synthetic oil(thousands of barrels daily) United States 816 820 Canada/Other Americas 772 670 Europe 4 4 Africa 224 220 Asia 711 749 Australia/Oceania 30 32 Worldwide 2,557 2,495 Net natural gas production available for sale(millions of cubic feet daily)United States 2,241 2,367 Canada/Other Americas 94 94 Europe 377 548 Africa 150 134 Asia 3,274 3,597 Australia/Oceania 1,226 1,276 Worldwide 7,362 8,016 Oil-equivalent production (1)(thousands of oil-equivalent barrels daily)3,784 3,831 (1) Natural gas is converted to an oil-equivalent basis at six million cubic feet per one thousand barrels.22Upstream Additional Information (thousands of barrels daily) Three Months Ended
March 31Volumes reconciliation (Oil-equivalent production) (1) 2023 3,831 Entitlements - Net Interest — Entitlements - Price / Spend / Other (41) Government Mandates (17) Divestments (66) Growth / Other 77 2024 3,784 (1) Natural gas is converted to an oil-equivalent basis at six million cubic feet per one thousand barrels.1Q 2024versus1Q 20231Q 2024 production of 3.8 million oil-equivalent barrels per day decreased 47 thousand oil-equivalent barrels per day from 1Q 2023. Excluding the impacts from entitlements, divestments, and higher government-mandated curtailments, net production grew by 77 thousand oil-equivalent barrels per day, mainly driven by Guyana. Upstream earnings were $5,003 million in the first nine months of 2017, up $4,165 million from 2016. Higher realizations increased earnings by $4.1 billion. Unfavorable volume and mix effects decreased earnings by $300 million. All other items increased earnings by $380 million, primarily due to lower expenses partly offset by unfavorable tax items in the current year.On an oil‑equivalent basis, production of 4 million barrels per day was down 1 percent compared to 2016. Liquids production of 2.3 million barrels per day decreased 65,000 barrels per day as field decline and lower entitlements were partly offset by increased project volumes and work programs. Natural gas production of 10.1 billion cubic feet per day increased 106 million cubic feet per day from 2016 as project ramp‑up, primarily in Australia, was partly offset by field decline.U.S. Upstream results were a loss of $439 million in 2017, compared to a loss of $1,823 million in 2016. Non‑U.S. Upstream earnings were $5,442 million, up $2,781 million from the prior year.16 Entitlements - Net Interest are changes to ExxonMobil’s share of production volumes caused by non-operational changes to volume-determining factors. These factors consist of net interest changes specified in Production Sharing Contracts (PSCs), which typically occur when cumulative investment returns or production volumes achieve defined thresholds, changes in equity upon achieving pay-out in partner investment carry situations, equity redeterminations as specified in venture agreements, or as a result of the termination or expiry of a concession. Once a net interest change has occurred, it typically will not be reversed by subsequent events, such as lower crude oil prices.Entitlements - Price, Spend and Other are changes to ExxonMobil’s share of production volumes resulting from temporary changes to non-operational volume-determining factors. These factors include changes in oil and gas prices or spending levels from one period to another. According to the terms of contractual arrangements or government royalty regimes, price or spending variability can increase or decrease royalty burdens and/or volumes attributable to ExxonMobil. For example, at higher prices, fewer barrels are required for ExxonMobil to recover its costs. These effects generally vary from period to period with field spending patterns or market prices for oil and natural gas. Such factors can also include other temporary changes in net interest as dictated by specific provisions in production agreements.QuotasGovernment Mandates are changes in ExxonMobil’s allowableto ExxonMobil's sustainable production arising fromlevels as a result of production constraintslimits or sanctions imposed by countries which are members of the Organization of the Petroleum Exporting Countries (OPEC). Volumes reported in this category would have been readily producible in the absence of the quota.Divestments are reductions in ExxonMobil’s production arising from commercial arrangements to fully or partially reduce equity in a field or asset in exchange for financial or other economic consideration.Growth and Other factors comprise all other operational and non-operational factors not covered by the above definitions that may affect volumes attributable to ExxonMobil. Such factors include, but are not limited to, production enhancements from project and work program activities, acquisitions including additions from asset exchanges, downtime, market demand, natural field decline, and any fiscal or commercial terms that do not affect entitlements.1723 DownstreamEnergy Products Financial Results (millions of dollars) Three Months Ended
March 31,2024 2023 Earnings (loss) (U.S. GAAP)United States 836 1,910 Non-U.S. 540 2,273 Total 1,376 4,183 Identified Items (1)United States — — Non-U.S. — (30) Total — (30) Earnings (loss) excluding Identified Items (1) (Non-GAAP)United States 836 1,910 Non-U.S. 540 2,303 Total 1,376 4,213 Due to rounding, numbers presented may not add up precisely to the totals indicated. Energy Products First Quarter Earnings Factor Analysis (millions of dollars) 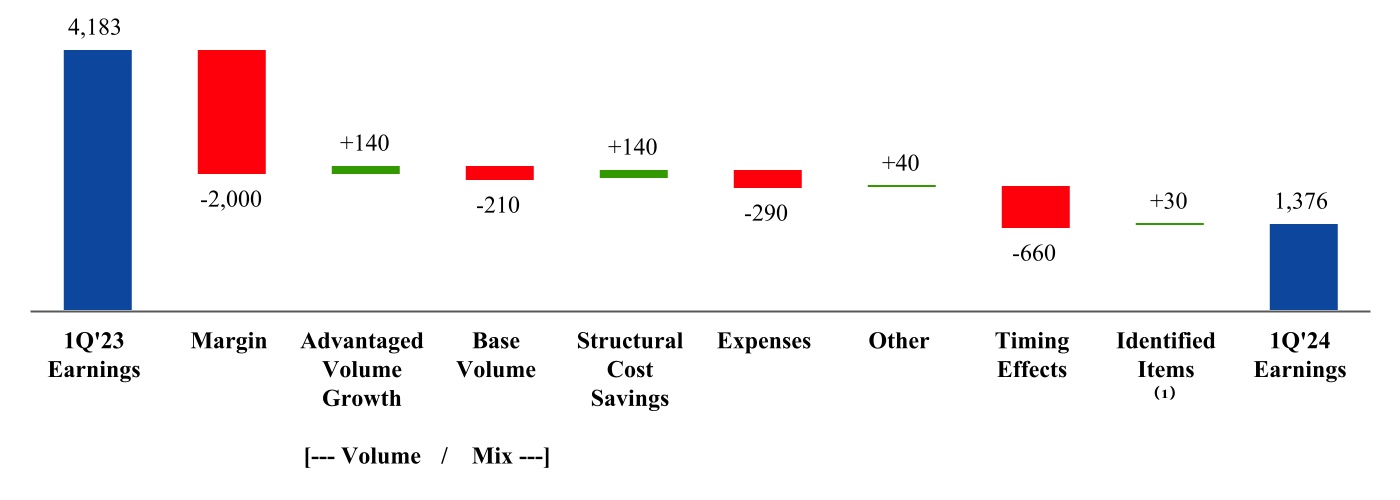 Margin – Margins decreased earnings
 were $1,532by $2,000 million up $303 milliondriven by weaker industry refining margins.Advantaged Volume Growth – Higher volumes from the third quarter of 2016. Higher refining marginsadvantaged assets increased earnings by $1 billion.$140 million, primarily driven by the Beaumont refinery expansion.Base Volume and mix effects– Lower base volumes decreased earnings by $210 million, on divestment of three refining assets (Billings, Sriracha, and Trecate).Structural Cost Savings– Increased earnings by $140 million.Expenses– Higher expenses decreased earningsby $290 million, on higher scheduled maintenance and turnaround activity.Other – All other items increased earnings by $40 million.Timing Effects – Unfavorable timing effects from derivatives mark-to-market impacts decreased earnings by $660 million.Identified Items (1) – 1Q 2023 $(30) million loss related to additional European taxes.(1)Refer to page 18 for definition of Identified Items and earnings (loss) excluding Identified Items.24Energy Products Operational Results (thousands of barrels daily) Three Months Ended
March 31,2024 2023 Refinery throughput United States 1,900 1,643 Canada 407 417 Europe 954 1,189 Asia Pacific 402 565 Other 180 184 Worldwide 3,843 3,998 Energy Products sales (1)United States 2,576 2,459 Non-U.S. 2,656 2,818 Worldwide 5,232 5,277 Gasoline, naphthas 2,178 2,177 Heating oils, kerosene, diesel 1,742 1,770 Aviation fuels 339 312 Heavy fuels 214 215 Other energy products 759 803 (1) Data reported net of purchases/sales contracts with the same counterparty.25CHEMICAL PRODUCTSChemical Products Financial Results (millions of dollars) Three Months Ended
March 31,2024 2023 Earnings (loss) (U.S. GAAP)United States 504 324 Non-U.S. 281 47 Total 785 371 Earnings (loss) excluding Identified Items (1) (Non-GAAP)United States 504 324 Non-U.S. 281 47 Total 785 371 (1) Refer to page 18 for definition of Identified Items and earnings (loss) excluding Identified Items.Chemical Products First Quarter Earnings Factor Analysis (millions of dollars) 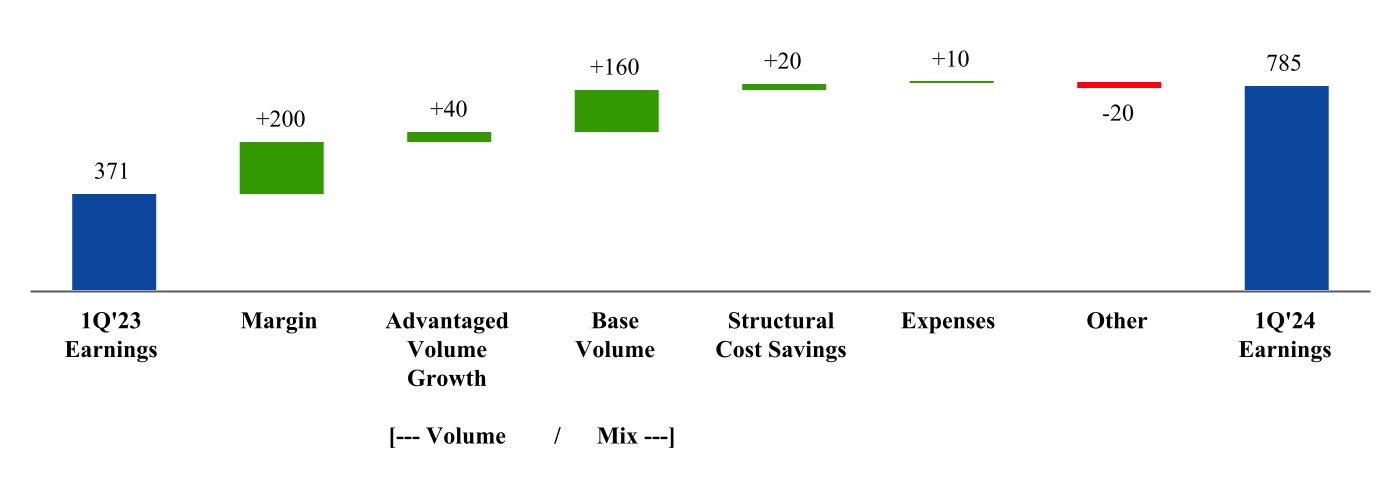 Margin– Increased North America feed advantage from lower natural gas prices and higher margins from performance chemicals realizations, more than offset industry margin decline, increasing earnings by $200 million.Advantaged Volume Growth – Additional high-value product volumes increased earnings by $40 million.Base Volume – Higher base volumes increased earnings by $160 million, primarily driven by strong reliability and absence of turnarounds.Structural Cost Savings– Increased earnings by $20 million.Expenses– Lower turnaround expenses increased earnings by$10 million.Other – All other items decreased earnings by
 $550 million, reflecting the absence of favorable asset management gains of $380 million in the prior year from the sale of Canadian retail assets and higher expenses related to Hurricane Harvey. Petroleum product sales of 5.5 million barrels per day were 43,000 barrels per day lower than last year’s third quarter.Earnings from the U.S. Downstream were $391 million, up $166 million from the third quarter of 2016. Non‑U.S. Downstream earnings of $1,141 million were $137 million higher than prior year.Chemical Products Operational Results (thousands of metric tons) Three Months Ended
March 31,2024 2023 Chemical Products sales (2)United States 1,847 1,561 Non-U.S. 3,207 3,088 Worldwide 5,054 4,649 (2) Data reported net of purchases/sales contracts with the same counterparty.26SPECIALTY PRODUCTSSpecialty Products Financial Results (millions of dollars) Three Months Ended
March 31,2024 2023 Earnings (loss) (U.S. GAAP)United States 404 451 Non-U.S. 357 323 Total 761 774 Earnings (loss) excluding Identified Items (1) (Non-GAAP)United States 404 451 Non-U.S. 357 323 Total 761 774 (1) Refer to page 18 for definition of Identified Items and earnings (loss) excluding Identified Items.Specialty Products First Quarter Earnings Factor Analysis (millions of dollars) Downstream earnings of $4,033 million in the first nine months of 2017 increased $1,073 million from 2016.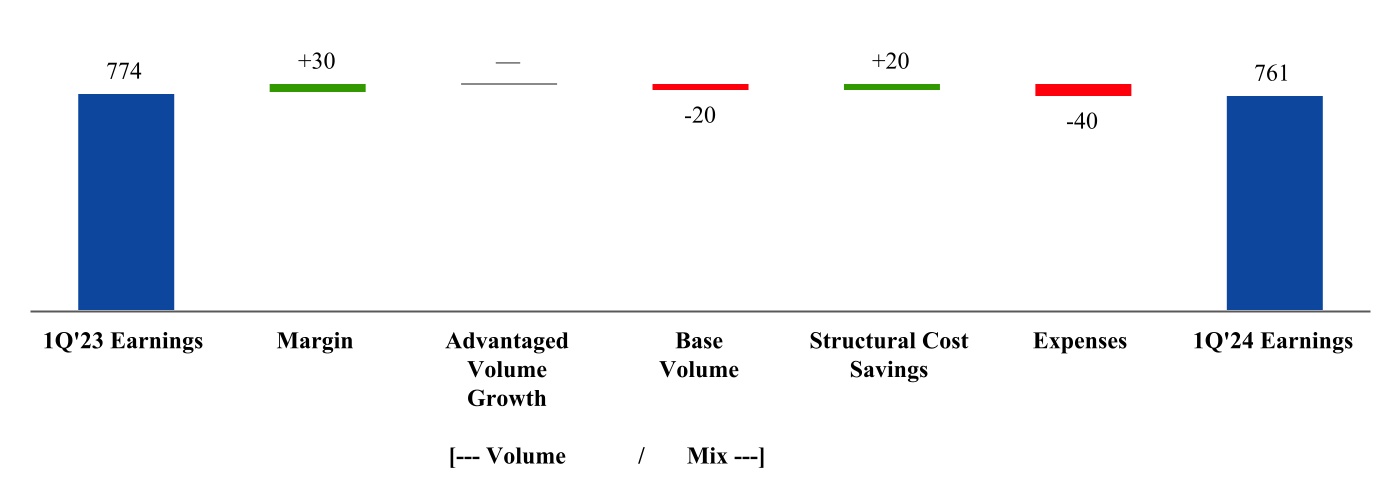 Margin– Stronger
 refining and marketingfinished lubes margins increaseddue to lower feed costs more than offset weaker basestock margins, increasing earnings by $1.3 billion, while volume and $30 million.Base Volume – Unfavorable volume/mix effects increased earnings by $110 million. All other items decreased earnings by $290 million, mainly reflecting the absence of the Canadian retail assets sale. Petroleum product sales of 5.5 million barrels per day were 26,000 barrels per day higher than 2016.U.S. Downstream$20 million.Structural Cost Savings– Increased earnings were $1,030 million, an increase of $206 million from 2016. Non‑U.S. Downstream earnings were $3,003 million, up $867 million from the prior year.Chemical earnings of $1,092 million were $79 million lower than the third quarter of 2016. Weaker marginsExpenses– Higher expenses decreased earnings by $200$40 million. VolumeSpecialty Products Operational Results (thousands of metric tons) Three Months Ended
March 31,2024 2023 Specialty Products sales (2)United States 495 476 Non-U.S. 1,464 1,464 Worldwide 1,959 1,940 (2) Data reported net of purchases/sales contracts with the same counterparty.27CORPORATE AND FINANCINGCorporate and Financing Financial Results (millions of dollars) Three Months Ended
March 31,2024 2023 Earnings (loss) (U.S. GAAP) (362) (355) Earnings (loss) excluding Identified Items (1) (Non-GAAP)(362) (355) (1) Refer to page 18 for definition of Identified Items and earnings (loss) excluding Identified Items.Corporate and mix effects increased earnings by $120 million. Third quarter prime product sales of 6.4 million metric tonsFinancing expenses were 313,000 metric tons or 5 percent higher than the prior year, despite Hurricane Harvey impacts.U.S. Chemical earnings of $403 million were $31 million lower than the third quarter of 2016. Non‑U.S. Chemical earnings of $689 million were $48 million lower than prior year.Chemical earnings of $3,248$362 million for the first nine monthsquarter of 2017 decreased $4952024, $7 million from 2016. Weaker margins decreased earnings by $320 million. Volume and mix effects increased earnings by $70 million. All other items decreased earnings by $250 million, primarily due to higher expenses from increased turnaround activity and new business growth. Prime product sales of 18.6 million metric tons were up 22,000 metric tons fromthan the first nine months of 2016.U.S. Chemical earnings were $1,413 million, down $111 million from 2016. Non‑U.S. Chemical earnings of $1,835 million were $384 million lower than prior year.18 Corporate and financing expenses were $221 million for the third quarter of 2017, down $149 million from the third quarter of 2016 mainly due to favorable impacts from the resolution of long‑standing tax items.Corporate and financing expenses were $954 million in the first nine months of 2017 compared to $1,381 million in 2016, with the decrease mainly due to favorable impacts from the resolution of long‑standing tax items.1928LIQUIDITY AND CAPITAL RESOURCES Because of the ongoing nature of our asset management and divestment program, we believe it is useful for investors to consider proceeds associated with asset sales together with cash provided by operating activities when evaluating cash available for investment in the business and financing activities, including shareholder distributions.(millions of dollars) Three Months Ended
March 31,2024 2023 Net cash provided by/(used in) Operating activities 14,664 16,341 Investing activities (4,577) (4,925) Financing activities (7,982) (8,507) Effect of exchange rate changes (324) 102 Increase/(decrease) in cash and cash equivalents 1,781 3,011 Cash and cash equivalents (at end of period) 33,349 32,676 Cash flow from operations and asset sales Net cash provided by operating activities (U.S. GAAP) 14,664 16,341 Proceeds associated with sales of subsidiaries, property, plant & equipment, and sales and returns of investments 703 854 Cash flow from operations and asset sales (Non-GAAP)15,367 17,195 Because of the ongoing nature of our asset management and divestment program, we believe it is useful for investors to consider proceeds associated with asset sales together with cash provided by operating activities when evaluating cash available for investment in the business and financing activities, including shareholder distributions. Cash flow from operations and asset sales in the thirdfirst quarter of 20172024 was $8.4$15.4 billion, including asset salesa decrease of $0.9 billion, an increase of $2.1$1.8 billion from the comparable 20162023 period primarily due to higher reflectinglowerearnings.Cash provided by operating activities totaled $22.7$14.7 billion for the first ninethree months of 2017, $8.02024, $1.7 billion higherlower than 2016. The major source of funds was net2023. Net income including noncontrolling interests was $8.6 billion, a decrease of $11.4 billion, an increase of $5.1$3.3 billion from the prior year period. The adjustment for the non-cashnoncash provision of $14.1$4.8 billion for depreciation and depletion decreased by $0.1 billion.was up $0.6 billion from 2023. Changes in operational working capital decreased cash flows by $0.5were a contribution of $2.0 billion in 2017 versus a reduction of $2.4 billion in 2016.during the period. All other items net decreased cash flows by $2.3$0.7 billion in 2017 compared to2024 versus a reductioncontribution of $3.5$0.6 billion in 2016.2023. See the Condensed Consolidated Statement of Cash Flows for additional details.Investing activities for the first ninethree months of 20172024 used net cash of $9.2$4.6 billion, a decrease of $1.5$0.3 billion compared to the prior year. Spending for additions to property, plant and equipment of $10.9$5.1 billion was $1.4$0.3 billion lower than 2016.2023. Proceeds from asset sales were $0.7 billion, a decrease of $1.7$0.2 billion decreased $0.5 billion. Additionalcompared to the prior year. Net investments and advances were $2.0 billion, an increase of $0.6 billion, and principally reflect the deposit into escrow of the maximum potential contingent consideration payable as a result of the acquisition of InterOil Corporation. Other investing activities including collection of advances increased cash flows by $2.0 billion, including the return of unused contingent consideration from the InterOil acquisition escrow, and were up $1.2decreased $0.2 billion from the previous year.Cash flow from operations and asset sales$0.4 billion in the first nine months of 2017 was $24.4 billion, including asset sales of $1.7 billion, an increase of $7.5 billion from the comparable 2016 period primarily due to higher earnings.Net cash used byin financing activities was $13.3$8.0 billion in the first ninethree months of 2017, an increase2024, including $3.0 billion for the purchase of $10.7 billion from 2016 mainly reflecting the absence27.5 million shares of ExxonMobil stock, as part of the Corporation’s issuancepreviously announced buyback program. This compares to net cash used in financing activities of $12.0$8.5 billion in long-term debt in the prior year.During the first nine months of 2017, Exxon Mobil Corporation purchased 6 million shares of its common stock for the treasury at a gross cost of $0.5 billion. These purchases were made to offset shares or units settled in shares issued in conjunction with the company’s benefit plans and programs. Shares outstanding increased from 4,148 million at year-end to 4,237 million at the end of the third quarter of 2017, mainly due to shares issued for the acquisitions of InterOil Corporation and of companies that hold acreage in the Permian Basin. Purchases may be made both in the open market and through negotiated transactions, and may be increased, decreased or discontinued at any time without prior notice.The Corporation distributed a total of $3.3 billion to shareholders in the third quarter of 2017 through dividends.20Total cash and cash equivalents of $4.3 billion at the end of the third quarter of 2017 compared to $5.1 billion at the end of the third quarter of 2016.thirdfirst quarter of 20172024 was $40.6$40.4 billion compared to $42.8$41.6 billion at year-end 2016.2023. The Corporation's debt to total capital ratio was 17.716.0 percent at the end of the thirdfirst quarter of 20172024 compared to 19.716.4 percent at year-end 2016.The Corporation has access to significant capacity of long-term and short-term liquidity. Internally generated funds are generally expected to cover the majority of financial requirements, supplemented by long-term and short-term debt. The Corporation had undrawn short-term committed lines of credit of $0.3 billion and undrawn long-term debtcommitted lines of credit of $1.9 billion as required.The Corporation, as part of its ongoing asset management program, continues to evaluate its mix of assets for potential upgrade. Because of the ongoing nature of this program, dispositions will continue to be made from time to time which will result in either gains or losses. Additionally, the Corporation continues to evaluate opportunities to enhance its business portfolio through acquisitions of assets or companies, and enters into such transactions from time to time. Key criteria for evaluating acquisitions include strategic fit, cost synergies, potential for future growth, low cost of supply, and attractive current valuations. Acquisitions may be made with cash, shares of the Corporation’s common stock, or both.Litigation and other contingencies are discussed in Note 3 to the unaudited condensed consolidated financial statements.29Income, sales-basedContractual ObligationsThe Corporation and its affiliates have numerous long-term sales and purchase commitments in their various business activities, all otherof which are expected to be fulfilled with no adverse consequences material to the Corporation’s operations or financial condition. Through the first quarter of 2024, the Corporation entered into two long-term purchase agreements with an estimated total obligation of approximately $3.0 billion.TAXES(millions of dollars) Three Months Ended
March 31,2024 2023 Income taxes 3,803 4,960 Effective income tax rate 36 % 34 % Total other taxes and duties (1)7,160 8,095 Total 10,963 13,055 (1) Includes “Other taxes and duties” plus taxes that are included in “Production and manufacturing expenses” and “Selling, general and administrative expenses”.Total taxes and duties totaled $14.8were $11.0 billion for the thirdfirst quarter of 2017, an increase2024, a decrease of $2.0$2.1 billion from 2016.2023. Income tax expense increased by $1.2was $3.8 billion compared to $1.5$5.0 billion reflecting higher pre-tax income.in the prior year. The effective income tax rate, was 33 percent compared to 20 percent in the prior year period reflecting the effect of one-time tax itemswhich is calculated based on consolidated company income taxes and a higherExxonmobil's share of earnings in high tax jurisdictions. Sales-basedequity company income taxes, and all other taxes and dutieswas 36 percent. This increased by $0.8 billion to $13.3 billion as a result of higher sales realizations.Income, sales-based and all other taxes and duties totaled $42.6 billion forfrom the first nine months of 2017, an increase of $4.8 billion from 2016. Income tax expense increased by $3.2 billion to $4.2 billion reflecting higher pre-tax income. The effective income tax rate was 34 percent compared to 26 percentrate in the prior year period due primarily to a higher sharechange in mix of earningsresults in highjurisdictions with varying tax jurisdictions. Sales-based taxes and allrates. Total other taxes and duties increaseddecreased by $1.6$0.9 billion to $38.4 billion as a result of higher sales realizations.In the United States, the Corporation has various ongoing U.S. federal income tax positions at issue with the Internal Revenue Service (IRS) for tax years beginning in 2006. The IRS has asserted penalties associated with several of those positions. The Corporation has not recognized the penalties as an expense because the Corporation does not expect the penalties to be sustained under applicable law. The Corporation has filed a refund suit for tax years 2006-2009 in a U.S. federal district court with respect to the positions at issue for those years. Unfavorable resolution of all positions at issue with the IRS would not have a materially adverse effect on the Corporation’s net income or liquidity.21$7.2 billion.CAPITAL AND EXPLORATION EXPENDITURES CAPITAL AND EXPLORATION EXPENDITURES(millions of dollars) Three Months Ended
March 31,2024 2023 Upstream (including exploration expenses) 4,582 4,581 Energy Products 527 685 Chemical Products 433 831 Specialty Products 76 91 Other 221 192 Total 5,839 6,380 Capital and exploration expenditures in the thirdfirst quarter of 20172024 were $6 billion, including the Jurong aromatics plant acquisition.Capital and exploration expenditures in the first nine months of 2017 were $14.1$5.8 billion, down 3 percent8% from the first nine monthsquarter of 2016 due primarily to lower upstream major project spending partially offset by the Jurong aromatics plant acquisition.2023. The Corporation anticipates an investment levelplans to invest in the range of $22$23 billion to $25 billion in 2017.2024. Actual spending could vary depending on the progress of individual projects and property acquisitions.In 2014, the European Union and United States imposed sanctions relating to the Russian energy sector. ExxonMobil continues to comply with all sanctions and regulatory licenses applicable to its affiliates’ investments in the Russian Federation. See Part II. Other Information, Item 1. Legal Proceedings in this report for information concerning a civil penalty assessment30FORWARD-LOOKING STATEMENTSStatements related to this matter which the Corporation is contesting.RECENTLY ISSUED ACCOUNTING STANDARDSIn May 2014, the Financial Accounting Standards Board issued a new standard, Revenue from Contracts with Customers. The standard establishes a single revenue recognition model for all contracts with customers, eliminates industry specific requirements,future events; projections; descriptions of strategic, operating, and expands disclosure requirements. The standard is required to be adopted beginning January 1, 2018. “Salesfinancial plans and Other Operating Revenue” on the Consolidated Statement of Income includes sales, excise and value-added taxes on sales transactions. When the Corporation adopts the standard, revenue will exclude sales-based taxes collected on behalf of third parties. This change in reporting will not impact earnings. The Corporation expects to adopt the standard using the Modified Retrospective method, under which prior years’ results are not restated, but supplemental information on the impact of the new standard is provided for 2018 results. The Corporation continues to evaluate other areas of the standard, which are not expected to have a material effect on the Corporation’s financial statements.In January 2016, the Financial Accounting Standards Board issued an updated standard, Financial Instruments—Overall (Subtopic 825-10): Recognition and Measurement of Financial Assets and Financial Liabilities. The standard requires investments in equity securities other than consolidated subsidiaries and equity method investments to be measured at fair value with changes in the fair value recognized through net income. Companies can elect a modified approach for equity securities that do not have a readily determinable fair value. ExxonMobil is evaluating the standard and its effect on the Corporation’s financialobjectives; statements and plans to adopt it in 2018.In March 2017, the Financial Accounting Standards Board issued an Accounting Standards Update, Compensation – Retirement Benefits (Topic 715): Improving the Presentation of Net Periodic Pension Cost and Net Periodic Postretirement Benefit Cost. The update requires the service cost component of net benefit costs to be reported in the same line of the income statement as other compensation costs and the other components of net benefit costs (non-service costs) to be presented separately from the service cost component. Additionally, only the service cost component of net benefit costs will be eligible for capitalization. The update is required to be adopted beginning January 1, 2018. The Corporation expects to add a new line “Non-service pension and postretirement benefit expense” to its Consolidated Statement of Income. This line would reflect the non-service costs that were previously included in “Production and manufacturing expenses” and “Selling, general and administrative expenses”. The update is not expected to have a material impact on the Corporation’s financial statements. Beginning January 1, 2018, the Corporation expects to include all of the non-service costs in its Corporate and financing segment.In February 2016, the Financial Accounting Standards Board issued a new standard, Leases. The standard requires all leases with an initial term greater than one year be recorded on the balance sheet as an asset and a lease liability. ExxonMobil is evaluating the standard and its effect on the Corporation’s financial statements and plans to adopt it in 2019. 22CRITICAL ACCOUNTING ESTIMATESAs part of its annual planning and budgeting cycle which is completed in the fourth quarter each year, the Corporation develops crude and natural gas price outlooks as well as estimates of future costsambitions and plans; and other factors necessary to complete its plan. Management’s price outlook and other factors, including factors such as operating costs, resource productivity, and capital efficiency, are re-assessed when facts and circumstances warrant but no less often than annually. To the extent any impairment testing may be required, management uses assumptions that are reasonable in relation to these factors in developing estimatesstatements of future cash flows. An asset group would be impaired if its estimated undiscounted cash flows were less than the asset’s carrying value, and impairment would be measured by the amount by which the carrying value exceeds fair value. Development of future undiscounted cash flow estimates requires significant management judgment, particularly in cases where an asset’s life is expected to extend decades into the future, and an important component of the estimate is management’s outlook on prices and other factors as noted above.The Corporation has identified emerging trends such as increasing estimates of available natural gas supplies and ongoing reductions in costs of supply for natural gas. In the fourth quarter of 2017, the Corporation will incorporate the impacts of these trends and the resulting lower price outlook in its annual planning and budgeting cycle. Once complete, the Corporation expects to perform an impairment assessment for its North American natural gas asset groups utilizing the information developed as part of the planning and budgeting process. It is not practicable at this time to estimate the impact these trends would have on the undiscounted cash flows for individual asset groups or any resulting impairment charges. However these trends are likely to place the Corporation’s North American natural gas asset groups at risk for potential impairment. The Corporation will complete its analysis of relevant factors as discussed above and perform any necessary impairment testing in connection with the preparation of the Corporation’s year-end financial statements for inclusion in its 2017 Form 10-K.FORWARD-LOOKING STATEMENTSStatements relating to future plans, projections, events or conditions, are forward-looking statements. FutureSimilarly, discussion of roadmaps or future plans related to carbon capture, transportation and storage, biofuel, hydrogen, direct air capture, and other future plans to reduce emissions and emission intensity of ExxonMobil, its affiliates, companies it is seeking to acquire and third parties are dependent on future market factors, such as continued technological progress, policy support and timely rule-making and permitting, and represent forward-looking statements.Actual future results, including financial and operating performance; potential earnings, cash flow, dividends or shareholder returns, including the timing and amounts of share repurchases; total capital expenditures and mix, including allocations of capital to low carbon investments; realization and maintenance of structural cost reductions and efficiency gains, including the ability to offset inflationary pressure; plans to reduce future emissions and emissions intensity, including ambitions to reach Scope 1 and Scope 2 net zero from operated assets by 2050, to reach Scope 1 and 2 net zero in Upstream Permian Basin unconventional operated assets by 2030 and in Pioneer assets by 2035, to eliminate routine flaring in-line with World Bank Zero Routine Flaring, and to reach near-zero methane emissions from operated assets and other methane initiatives; meeting ExxonMobil’s divestment and start-up plans, and associated project plans costs,as well as technology advances, including the timing and capacities; efficiency gains; capitaloutcome of projects to capture, transport and exploration expenditures;store CO2, produce hydrogen, produce biofuels, produce lithium, create new advanced carbon materials, and use plastic waste as a feedstock for advanced recycling; timely granting of governmental permits and certifications; future debt levels and credit ratings; business and project plans, timing, costs, capacities and profitability; resource recoveries and production rates; resource recoveries; the impact of new technologies; potential impairment charges; and share purchase levels,planned Denbury and Pioneer integrated benefits could differ materially due to factors including:a number of factors.These include global or regional changes in the supply and demand for oil, natural gas, or petrochemical prices orpetrochemicals, and feedstocks and other market orfactors, economic conditions, affectingand seasonal fluctuations that impact prices and differentials for our products; changes in law, regulations, taxes, trade sanctions, or policies, such as government policies supporting lower carbon and new market investment opportunities such as the U.S. Inflation Reduction Act and the ability for projects to qualify for the financial incentives available thereunder, the punitive European taxes on the oil and gas sector and unequal support for different technological methods of emissions reduction or petrochemical industries, including the scopeevolving, ambiguous and durationunharmonized standards imposed by various jurisdictions related to sustainability and GHG reporting; variable impacts of economic recessions;trading activities on our margins and results each quarter; actions of competitors and commercial counterparties; the outcome of explorationcommercial negotiations, including final agreed terms and development efforts; changes in lawconditions; the ability to access debt markets on favorable terms or government regulation,at all; the occurrence, pace, rate of recovery and effects of public health crises, including taxthe response from governments; reservoir performance, including variability and environmental requirements;timing factors applicable to unconventional resources; the impact of fiscal and commercial termslevel and outcome of commercial negotiations;exploration projects and decisions to invest in future reserves; timely completion of development and other construction projects; final management approval of future projects and any changes in the scope, terms, costs or assumptions of such projects as approved; the actions of government or other actors against our core business activities and acquisitions, divestitures or financing opportunities; war, civil unrest, attacks against the company or industry, and other geopolitical or security disturbances, including disruption of land or sea transportation routes; expropriations, seizure, or capacity, insurance, shipping or export limitations imposed by governments or laws; opportunities for potential acquisitions, investments or divestments and satisfaction of applicable conditions to closing, including timely regulatory approvals; the capture of efficiencies within and between business lines and the ability to maintain near-term cost reductions as ongoing efficiencies; unforeseen technical or operating difficulties and unplanned maintenance; the development and competitiveness of alternative energy and emission reduction technologies; the results of research programs; changes in technical or operating conditions; actions of competitors;programs and the ability to bring new technologies to commercial scale on a cost-competitive basis; and other factors discussed under "Item 1A. Risk Factors" of ExxonMobil’s 2023 Form 10-K.Forward-looking and other statements regarding environmental and other sustainability efforts and aspirations are not an indication that these statements are material to investors or require disclosure in our filing with the heading “Factors Affecting Future Results”SEC. In addition, historical, current, and forward-looking environmental and other sustainability-related statements may be based on standards for measuring progress that are still developing, internal controls and processes that continue to evolve, and assumptions that are subject to change in the “Investors” sectionfuture, including future rule-making.Energy demand models are forward-looking by nature and aim to replicate system dynamics of our website andthe global energy system, requiring simplifications. The reference to any scenario in Item 1Athis report, including any potential net-zero scenarios, does not imply ExxonMobil views any particular scenario as likely to occur. In addition, energy demand scenarios require assumptions on a variety of ExxonMobil's 2016 Form 10-K. We assume no duty to update these statements asparameters. As such, the outcome of any given scenario using an energy demand model comes with a high degree of uncertainty. Third-party scenarios discussed in this report reflect the modeling assumptions and outputs of their respective authors, not ExxonMobil, and their use by ExxonMobil is not an endorsement by ExxonMobil of their underlying assumptions, likelihood or probability. Investment decisions are made on the basis of ExxonMobil’s separate planning process. Any use of the modeling of a third-party organization within this report does not constitute or imply an endorsement by ExxonMobil of any or all of the positions or activities of such organization.31Actions needed to advance ExxonMobil’s 2030 greenhouse gas emission-reductions plans are incorporated into its medium-term business plans, which are updated annually. The reference case for planning beyond 2030 is based on ExxonMobil’s Global Outlook (Outlook) research and publication. The Outlook is reflective of the existing global policy environment and an assumption of increasing policy stringency and technology improvement to 2050. However, the Outlook does not attempt to project the degree of required future date.The term “project” as used in this report can refer to a variety of different activities and does not necessarily have the same meaning as in any government payment transparency reports.2332ItemITEM 3. Quantitative and Qualitative Disclosures About Market RiskInformation about market risks for the ninethree months ended September 30, 2017,March 31, 2024, does not differ materially from that discussed under Item 7A of the registrant's Annual Report on Form 10-K for 2016.Item2023.ITEM 4. Controls and ProceduresAs indicated in the certifications in Exhibit 31 of this report, the Corporation’s Chief Executive Officer, PrincipalChief Financial Officer and Principal Accounting Officer have evaluated the Corporation’s disclosure controls and procedures as of September 30, 2017.March 31, 2024. Based on that evaluation, these officers have concluded that the Corporation’s disclosure controls and procedures are effective in ensuring that information required to be disclosed by the Corporation in the reports that it files or submits under the Securities Exchange Act of 1934, as amended, is accumulated and communicated to them in a manner that allows for timely decisions regarding required disclosures and are effective in ensuring that such information is recorded, processed, summarized and reported within the time periods specified in the Securities and Exchange Commission’s rules and forms. There were no changes during the Corporation’s last fiscal quarter that materially affected, or are reasonably likely to materially affect, the Corporation’s internal control over financial reporting.2433PART II. OTHER INFORMATIONItemITEM 1. Legal ProceedingsAs last reported in the Corporation’s Form 10-QLEGAL PROCEEDINGSExxonMobil has elected to use a $1 million threshold for the second quarter of 2016, in a matter related to the discharge of crude oil from the Pegasus Pipeline in Mayflower, Faulkner County, Arkansas, the Pipeline and Hazardous Materials Safety Administration (PHMSA) on October 1, 2015, issued a Final Order arising from a November 2013 Notice of Probable Violation alleging that ExxonMobil Pipeline Company (EMPCo) violated multiple federal Pipeline Safety Regulations. The Final Order imposed a penalty of $2,630,400, which EMPCo paid on April 21, 2016. On June 27, 2016, EMPCo filed an appeal with the U.S. Court of Appeals for the Fifth Circuit, contesting PHMSA’s regulatory findings and compliance order directives and seeking a refund of the penalty paid. On August 14, 2017, the Fifth Circuit dismissed five of the six violations EMPCo challenged from PHMSA’s final administrative order, and vacated $1,634,100 in associated penalties, which PHMSA must now refund to EMPCo. The Fifth Circuit also remanded the remaining violation back to PHMSA for re-calculation of the civil penalty previously imposed. As reported in the Corporation’s Form 10-Q for the second quarter of 2017, the United States District Court for the Southern District of Texas entered a revised judgment on April 26, 2017, in a citizen suit captioned Environment Texas Citizen Lobby, Inc. et al. v. Exxon Mobil Corporation, awarding approximately $20 million in civil penalties, payable to the United States Treasury. In the suit filed in December 2010, Environment Texas Citizen Lobby, Inc. and the Sierra Club, Lone Star Chapter, filed a citizen suit seeking declaratory and injunctive relief, penalties, attorney fees and litigation costs associated with alleged violations of Title V of the Clean Air Act. Plaintiffs alleged that ExxonMobil repeatedly violated, and will continue to violate, its air operating permits, the Texas State Implementation Plan and the Clean Air Act by emitting air pollutants into the atmosphere from the Baytown complex in excess of applicable emission limitations or otherwise without authorization at the Baytown, Texas, refinery, chemical plant and olefins plant. ExxonMobil filed its appeal of the judgment in the U.S. Court of Appeals for the Fifth Circuit on August 25, 2017.As reported in the Corporation’s Form 10-Q for the first quarter of 2016, the company has been in discussions with the United States Department of Justice (DOJ) and the Environmental Protection Agency (EPA) to resolve claims of non-compliance with the Clean Air Act related to flaring at its eight U.S. chemical facilities with flares. The EPA has alleged the sites failed to properly operate and monitor flares. ExxonMobil Chemical Company has reached a settlement agreement with the DOJ, the EPA and the Louisiana Department of Environmental Quality to resolve these claims. The complaint and the consent decree are expected to be filed in the U.S. District Court for the Southern District of Texas. The company has agreed to pay a penalty of $2,500,000, and to pay $2,572,000 to fund supplementaldisclosing environmental projects. The company has also agreed to make investments in new equipment at the facilities.As reported in the Corporation’s Form 10-Q for the second quarter of 2017, on July 20, 2017, the United States Department of Treasury, Office of Foreign Assets Control (OFAC) assessed a civil penalty against Exxon Mobil Corporation, ExxonMobil Development Company and ExxonMobil Oil Corporation for violating the Ukraine-Related Sanctions Regulations, 31 C.F.R. part 589. The assessed civil penalty is in the amount of $2,000,000. ExxonMobil and its affiliates have been and continue to be in compliance with all sanctions and disagree that any violation has occurred. ExxonMobil and its affiliates have filed a complaint in the United States Federal District Court, Northern District of Texas seeking judicial review of, and to enjoin, the civil penalty under the Administrative Procedures Act and the United States Constitution, including on the basis that it represents an arbitrary and capricious action by OFAC and a violation of the Company’s due process rights.Refer to the relevant portions of Note 3 of this Quarterly Report on Form 10-Q for further information on legal proceedings.25
As reported in the Corporation’s Annual Report on Form 10-K for the year ended December 31, 2022, on August 4, 2022, XTO Energy, Inc. (“XTO”) received a letter from the Department of Justice (“DOJ”) notifying XTO of the United States Environmental Protection Agency’s (“EPA”) request to initiate a potential civil action against XTO regarding the Schnegg well in Powhatan Point, Ohio. The EPA alleged XTO breached its duty under the General Duty Clause of the Clean Air Act for the Schnegg well, and such breaches resulted in the 2018 well blowout. Neither a civil action has been filed nor a draft consent decree has been provided by the DOJ. In January 2024, the DOJ demanded $25 million to settle the alleged violations. XTO strongly disagrees with the DOJ’s position.Item 2. Unregistered Sales of Equity Securities and Use of ProceedsIssuer Purchase of Equity Securities for Quarter Ended September 30, 2017Total Number ofMaximum NumberShares Purchasedof Shares that MayTotal NumberAverageas Part of PubliclyYet Be Purchasedof SharesPrice PaidAnnounced PlansUnder the Plans orPeriodPurchasedper Shareor ProgramsProgramsJuly 2017--August 2017--September 2017--Total--(See Note 1)As reported in the Corporation’s Annual Report on Form 10-K for the year ended December 31, 2022, the State of Texas, acting by and through its Attorney General (“State”), filed a complaint against the Corporation (captioned State of Texas v. Exxon Mobil Corporation) in Travis County District Court, TX, Cause No. D-1-GN-22-006534, for alleged violations of the Texas Clean Air Act at the Baytown Olefins Plant located in Baytown, Texas seeking civil penalties in excess of $1 million, injunctive relief, and recovery of its fees and costs of litigation. In March 2024, the State of Texas and the Corporation agreed to settle the alleged violations upon payment of $2.2 million to the State of Texas (the “Proposed Settlement”). Once the Proposed Settlement is published in the Federal Register, it will be open to public comment for 30 days before the District Court may approve it.ITEM 2. UNREGISTERED SALES OF EQUITY SECURITIES AND USE OF PROCEEDSIssuer Purchases of Equity Securities for Quarter Ended March 31, 2024 Total Numberof SharesPurchased (1)AveragePrice Paidper Share (2)Total Number of Shares Purchased as Part of Publicly Announced Plans or Programs (3)Approximate Dollar Value of Shares that May Yet Be Purchased Under theProgram(Billions of dollars) (4)January 2024 2,729,980 $102.69 2,704,895 $17.2 February 2024 11,040,594 $103.55 11,040,594 $16.1 March 2024 13,797,147 $110.48 13,797,137 $14.6 Total 27,567,721 $106.94 27,542,626 (1) Includes shares withheld from participants in the company's incentive program for personal income taxes.(2) Excludes 1% U.S. excise tax on stock repurchases.(3) Purchases were made under terms intended to qualify for exemption under Rules 10b-18 and 10b5-1. As required by securities law restrictions, no repurchases take place during proxy solicitation and voting periods for transactions involving the issuance of ExxonMobil shares. For the Pioneer transaction, this period occurred during the first quarter of 2024.(4) In its 2022 Corporate Plan Update released December 8, 2022, the Corporation stated that the company expanded its share repurchase program to up to $50 billion through 2024, including $15 billion of repurchases in 2022 and $17.5 billion in 2023. In its 2023 Corporate Plan Update released December 6, 2023, the Corporation stated that after the Pioneer transaction closes, the go-forward share repurchase program pace is expected to increase to $20 billion annually through 2025, assuming reasonable market conditions.During the thirdfirst quarter, the Corporation did not purchaseissue or sell any sharesunregistered equity securities.ITEM 5. OTHER INFORMATIONDuring the three months ended March 31, 2024, none of its common stock for the treasury.Note 1 - On August 1, 2000, the Corporation announced its intention to resume purchasesCompany’s directors or officers adopted or terminated a “Rule 10b5-1 trading arrangement” or “non-Rule 10b5-1 trading arrangement,” as each term is defined in Item 408(a) of shares of its common stock for the treasury both to offset shares issued in conjunction with company benefit plans and programs and to gradually reduce the number of shares outstanding. The announcement did not specify an amount or expiration date. The Corporation has continued to purchase shares since this announcement and to report purchased volumes in its quarterly earnings releases. In its earnings release dated February 2, 2016, the Corporation stated it will continue to acquire shares to offset dilution in conjunction with benefit plans and programs, but had suspended making purchases to reduce shares outstanding effective beginning the first quarter of 2016.ItemRegulation S-K.ITEM 6. ExhibitsSee Index to Exhibits of this report.2634INDEX TO EXHIBITSExhibit By-Laws, as revised effective November 1, 2017 (incorporated by reference to Exhibit 3(ii) to the Registrant’s Report on Form 8-K of October 31, 2017).PrincipalChief Financial Officer.PrincipalChief Financial Officer.Files.104 Cover Page Interactive Data File (formatted as Inline XBRL and contained in Exhibit 101). 2735EXXON MOBIL CORPORATIONSIGNATUREPursuant to the requirements of the Securities Exchange Act of 1934, the Registrant has duly caused this report to be signed on its behalf by the undersigned, thereunto duly authorized.EXXON MOBIL CORPORATIONNovember 1, 2017 DAVID S. ROSENTHALDavid S. Rosenthal2836