UNITED STATES
SECURITIES AND EXCHANGE COMMISSION
Washington, DC 20549
FORM 10-Q
|
| |
| (Mark One) | |
| R | Quarterly report pursuant to Section 13 or 15(d) of the Securities Exchange Act of 1934 |
| | |
| | For the quarterly period ended March 31,September 30, 2016 |
| | |
| | or |
| | |
| o | Transition report pursuant to Section 13 or 15(d) of the Securities Exchange Act of 1934 |
| | |
| | For the transition period from __________ to __________ |
| | |
| | Commission file number 1-3950 |
Ford Motor Company
(Exact name of Registrant as specified in its charter)
|
| |
| Delaware | 38-0549190 |
| (State of incorporation) | (I.R.S. Employer Identification No.) |
| | |
| One American Road, Dearborn, Michigan | 48126 |
| (Address of principal executive offices) | (Zip Code) |
313-322-3000
(Registrant’s telephone number, including area code)
Indicate by check mark if the registrant (1) has filed all reports required to be filed by Section 13 or 15(d) of the Securities Exchange Act of 1934 during the preceding 12 months (or for such shorter period that the registrant was required to file such reports), and (2) has been subject to such filing requirements for the past 90 days. Yes R No o
Indicate by check mark whether the registrant has submitted electronically and posted on its corporate Web site, if any, every Interactive Data File required to be submitted and posted pursuant to Rule 405 of Regulation S-T (§232.405 of this chapter) during the preceding 12 months (or for such shorter period that the registrant was required to submit and post such files). Yes R No o
Indicate by check mark whether the registrant is a large accelerated filer, an accelerated filer, a non-accelerated filer, or a smaller reporting company. See definitions of “large accelerated filer,” “accelerated filer,” and “smaller reporting company” in Rule 12b-2 of the Exchange Act. Large accelerated filer R Accelerated filer o Non-accelerated filer o Smaller reporting company o
Indicate by check mark whether the registrant is a shell company (as defined in Rule 12b-2 of the Exchange Act). Yes o No R
As of April 21October 20, 2016, Ford had outstanding 3,901,983,0823,902,862,547 shares of Common Stock and 70,852,076 shares of Class B Stock.
Exhibit Index begins on page
FORD MOTOR COMPANY
QUARTERLY REPORT ON FORM 10-Q
For the Quarter Ended March 31,September 30, 2016
|
| | | |
| | Table of Contents | | Page |
| | Part I - Financial Information | | |
| Item 1 | Financial Statements | | |
| | Consolidated Income Statement | | |
| | Consolidated Statement of Comprehensive Income | | |
| | Sector Income Statement | | |
| Consolidated Balance Sheet | | |
| Sector Balance Sheet | | |
| | Condensed Consolidated Statement of Cash Flows | | |
| Condensed Sector Statement of Cash Flows | | |
| | Consolidated Statement of Equity | | |
| | Notes to the Financial Statements | | |
| | Report of Independent Registered Public Accounting Firm | | |
| Item 2 | Management’s Discussion and Analysis of Financial Condition and Results of Operations | | |
| Overview | | |
| | Results of Operations | | |
| | Automotive Sector | | |
| Financial Services Sector | | |
| Liquidity and Capital Resources | | |
| Credit Ratings | | |
| | Production Volumes | | |
| | Outlook | | |
| GAAP Reconciliations of Non-GAAP Financial Measures | | |
| Risk Factors | | |
| | Accounting Standards Issued But Not Yet Adopted | | |
| | Other Financial Information | | |
| Item 3 | Quantitative and Qualitative Disclosures About Market Risk | | |
| | Automotive Sector | | |
| | Financial Services Sector | | |
| Item 4 | Controls and Procedures | | |
| | | | |
| | Part II - Other Information | | |
Item 2 | Unregistered Sales of Equity Securities and Use of Proceeds | | |
Item 6 | Exhibits | | |
| | Signature | | |
| | Exhibit Index | | |
PART I. FINANCIAL INFORMATION
ITEM 1. Financial Statements.
FORD MOTOR COMPANY AND SUBSIDIARIES
CONSOLIDATED INCOME STATEMENT
(in millions, except per share amounts)
| | | | For the periods ended March 31, | For the periods ended September 30, |
| | 2016 | | 2015 | 2016 | | 2015 | | 2016 | | 2015 |
| | First Quarter | Third Quarter | | First Nine Months |
| | (unaudited) | (unaudited) |
| Revenues | | | | | | | | | | |
| Automotive | $ | 35,257 |
| | $ | 31,800 |
| $ | 33,331 |
| | $ | 35,818 |
| | $ | 105,520 |
| | $ | 102,723 |
|
| Financial Services | 2,461 |
| | 2,100 |
| 2,612 |
| | 2,326 |
| | 7,626 |
| | 6,584 |
|
| Total revenues | 37,718 |
| | 33,900 |
| 35,943 |
| | 38,144 |
| | 113,146 |
| | 109,307 |
|
| | | | | | | | | | | |
| Costs and expenses | |
| | |
| |
| | |
| | | | |
| Automotive cost of sales | 30,281 |
| | 28,472 |
| |
| Cost of sales | | 30,446 |
| | 31,213 |
| | 93,075 |
| | 90,011 |
|
| Selling, administrative, and other expenses | 3,823 |
| | 3,465 |
| 2,535 |
| | 2,386 |
| | 7,758 |
| | 7,402 |
|
| Financial Services interest expense | 658 |
| | 647 |
| |
| Financial Services provision for credit and insurance losses | 141 |
| | 73 |
| |
| Financial Services interest, operating, and other expenses | | 2,200 |
| | 1,905 |
| | 6,518 |
| | 5,363 |
|
| Total costs and expenses | 34,903 |
| | 32,657 |
| 35,181 |
| | 35,504 |
| | 107,351 |
| | 102,776 |
|
| | | | | | | | | | | |
| Automotive interest expense | 200 |
| | 165 |
| |
| Interest expense on Automotive debt | | 238 |
| | 206 |
| | 650 |
| | 561 |
|
| | | | | | | | | | | |
| Automotive interest income and other income/(loss), net (Note 12) | 404 |
| | 190 |
| |
| Financial Services other income/(loss), net (Note 12) | 91 |
| | 74 |
| |
Non-Financial Services interest income and other income/(loss), net (Note 13) | | 328 |
| | 446 |
| | 1,121 |
| | 908 |
|
| Financial Services other income/(loss), net (Note 13) | | 132 |
| | 97 |
| | 305 |
| | 241 |
|
| Equity in net income of affiliated companies | 541 |
| | 437 |
| 403 |
| | 314 |
| | 1,342 |
| | 1,237 |
|
| Income before income taxes | 3,651 |
| | 1,779 |
| 1,387 |
| | 3,291 |
|
| 7,913 |
|
| 8,356 |
|
| Provision for/(Benefit from) income taxes | 1,196 |
| | 625 |
| 426 |
| | 1,099 |
| | 2,525 |
| | 2,849 |
|
| Net income | 2,455 |
| | 1,154 |
| 961 |
| | 2,192 |
| | 5,388 |
| | 5,507 |
|
| Less: Income/(Loss) attributable to noncontrolling interests | 3 |
| | 1 |
| 4 |
| | — |
| | 9 |
| | 2 |
|
| Net income attributable to Ford Motor Company | $ | 2,452 |
| | $ | 1,153 |
| $ | 957 |
| | $ | 2,192 |
| | $ | 5,379 |
| | $ | 5,505 |
|
| | | | | | | | | | | |
| EARNINGS PER SHARE ATTRIBUTABLE TO FORD MOTOR COMPANY COMMON AND CLASS B STOCK (Note 14) | |
| EARNINGS PER SHARE ATTRIBUTABLE TO FORD MOTOR COMPANY COMMON AND CLASS B STOCK (Note 15) | | EARNINGS PER SHARE ATTRIBUTABLE TO FORD MOTOR COMPANY COMMON AND CLASS B STOCK (Note 15) |
| Basic income | $ | 0.62 |
| | $ | 0.29 |
| $ | 0.24 |
| | $ | 0.55 |
| | $ | 1.35 |
| | $ | 1.39 |
|
| Diluted income | 0.61 |
| | 0.29 |
| 0.24 |
| | 0.55 |
| | 1.35 |
| | 1.38 |
|
| | | | | | | | | | | |
| Cash dividends declared | 0.40 |
| | 0.15 |
| 0.15 |
| | 0.15 |
| | 0.70 |
| | 0.45 |
|
CONSOLIDATED STATEMENT OF COMPREHENSIVE INCOME
(in millions)
|
| | | | | | | |
| | For the periods ended March 31, |
| | 2016 | | 2015 |
| | First Quarter |
| | (unaudited) |
| Net income | $ | 2,455 |
| | $ | 1,154 |
|
| Other comprehensive income/(loss), net of tax (Note 11) | | | |
| Foreign currency translation | (64 | ) | | 103 |
|
| Marketable securities | 6 |
| | — |
|
| Derivative instruments | 246 |
| | (90 | ) |
| Pension and other postretirement benefits | 22 |
| | (148 | ) |
| Total other comprehensive income/(loss), net of tax | 210 |
| | (135 | ) |
| Comprehensive income | 2,665 |
| | 1,019 |
|
| Less: Comprehensive income/(loss) attributable to noncontrolling interests | 2 |
| | 1 |
|
| Comprehensive income attributable to Ford Motor Company | $ | 2,663 |
| | $ | 1,018 |
|
The accompanying notes are part of the financial statements.
Item 1. Financial Statements (Continued)
FORD MOTOR COMPANY AND SUBSIDIARIES
SECTOR INCOME STATEMENT
(in millions)
|
| | | | | | | |
| | For the periods ended March 31, |
| | 2016 | | 2015 |
| | First Quarter |
| | (unaudited) |
| AUTOMOTIVE | | | |
| Revenues | $ | 35,257 |
| | $ | 31,800 |
|
| Costs and expenses | | | |
| Cost of sales | 30,281 |
| | 28,472 |
|
| Selling, administrative, and other expenses | 2,562 |
| | 2,472 |
|
| Total costs and expenses | 32,843 |
| | 30,944 |
|
| | | | |
| Interest expense | 200 |
| | 165 |
|
| | | | |
| Interest income and other income/(loss), net (Note 12) | 404 |
| | 190 |
|
| Equity in net income of affiliated companies | 534 |
| | 429 |
|
| Income before income taxes — Automotive | 3,152 |
| | 1,310 |
|
| | | | |
| FINANCIAL SERVICES | |
| | |
|
| Revenues | 2,461 |
| | 2,100 |
|
| Costs and expenses | | | |
| Interest expense | 658 |
| | 647 |
|
| Depreciation on vehicles subject to operating leases | 1,014 |
| | 816 |
|
| Operating and other expenses | 247 |
| | 177 |
|
| Provision for credit and insurance losses | 141 |
| | 73 |
|
| Total costs and expenses | 2,060 |
| | 1,713 |
|
| | | | |
| Other income/(loss), net (Note 12) | 91 |
| | 74 |
|
| Equity in net income of affiliated companies | 7 |
| | 8 |
|
| Income before income taxes — Financial Services | 499 |
| | 469 |
|
| | | | |
| TOTAL COMPANY | | | |
| Income before income taxes | 3,651 |
| | 1,779 |
|
| Provision for/(Benefit from) income taxes | 1,196 |
| | 625 |
|
| Net income | 2,455 |
| | 1,154 |
|
| Less: Income/(Loss) attributable to noncontrolling interests | 3 |
| | 1 |
|
| Net income attributable to Ford Motor Company | $ | 2,452 |
| | $ | 1,153 |
|
|
| | | | | | | | | | | | | | | |
| | For the periods ended September 30, |
| | 2016 | | 2015 | | 2016 | | 2015 |
| | Third Quarter | | First Nine Months |
| | (unaudited) |
| Net income | $ | 961 |
| | $ | 2,192 |
| | $ | 5,388 |
| | $ | 5,507 |
|
| Other comprehensive income/(loss), net of tax (Note 12) | | | | | | | |
| Foreign currency translation | (184 | ) | | (882 | ) | | (306 | ) | | (816 | ) |
| Marketable securities | — |
| | — |
| | 6 |
| | — |
|
| Derivative instruments | 99 |
| | 374 |
| | 456 |
| | 208 |
|
| Pension and other postretirement benefits | 14 |
| | 133 |
| | 53 |
| | 1 |
|
| Total other comprehensive income/(loss), net of tax | (71 | ) | | (375 | ) | | 209 |
| | (607 | ) |
| Comprehensive income | 890 |
| | 1,817 |
| | 5,597 |
| | 4,900 |
|
| Less: Comprehensive income/(loss) attributable to noncontrolling interests | 3 |
| | 1 |
| | 7 |
| | 2 |
|
| Comprehensive income attributable to Ford Motor Company | $ | 887 |
| | $ | 1,816 |
| | $ | 5,590 |
| | $ | 4,898 |
|
The accompanying notes are part of the financial statements.
Item 1. Financial Statements (Continued)
FORD MOTOR COMPANY AND SUBSIDIARIES
CONSOLIDATED BALANCE SHEET
(in millions)
| | | | March 31,
2016 | | December 31,
2015 | September 30,
2016 | | December 31,
2015 |
| | (unaudited) | (unaudited) |
| ASSETS | | | | | | |
| Cash and cash equivalents (Note 3) | $ | 15,917 |
| | $ | 14,272 |
| |
| Marketable securities (Note 3) | 23,556 |
| | 20,904 |
| |
| Finance receivables, net (Note 4) | 94,280 |
| | 90,691 |
| |
| Other receivables, net | 11,252 |
| | 11,284 |
| |
| Cash and cash equivalents (Note 4) | | $ | 13,340 |
| | $ | 14,272 |
|
| Marketable securities (Note 4) | | 20,825 |
| | 20,904 |
|
| Financial Services finance receivables, net (Note 5) | | 45,550 |
| | 45,137 |
|
| Trade and other receivables, less allowances of $359 and $372 | | 10,029 |
| | 11,042 |
|
| Inventories (Note 7) | | 10,219 |
| | 8,319 |
|
| Other assets | | 3,552 |
| | 2,913 |
|
| Total current assets | | 103,515 |
| | 102,587 |
|
| | | | | |
| Financial Services finance receivables, net (Note 5) | | 49,614 |
| | 45,554 |
|
| Net investment in operating leases | 28,234 |
| | 27,093 |
| 29,196 |
| | 27,093 |
|
| Inventories (Note 6) | 9,770 |
| | 8,319 |
| |
| Net property | | 32,257 |
| | 30,163 |
|
| Equity in net assets of affiliated companies | 3,820 |
| | 3,224 |
| 3,795 |
| | 3,224 |
|
| Net property | 31,164 |
| | 30,163 |
| |
| Deferred income taxes | 10,579 |
| | 11,509 |
| 9,475 |
| | 11,509 |
|
| Other assets | 8,716 |
| | 7,466 |
| 7,111 |
| | 4,795 |
|
| Total assets | $ | 237,288 |
| | $ | 224,925 |
| $ | 234,963 |
| | $ | 224,925 |
|
| | | | | | | |
| LIABILITIES | |
| | |
| |
| | |
|
| Payables | $ | 22,072 |
| | $ | 20,272 |
| $ | 22,384 |
| | $ | 20,272 |
|
| Other liabilities and deferred revenue (Note 7) | 43,949 |
| | 42,546 |
| |
| Automotive debt (Note 9) | 13,022 |
| | 12,839 |
| |
| Financial Services debt (Note 9) | 127,973 |
| | 120,015 |
| |
| Other liabilities and deferred revenue (Note 8) | | 19,531 |
| | 19,089 |
|
| Automotive debt payable within one year (Note 10) | | 2,472 |
| | 1,779 |
|
| Financial Services debt payable within one year (Note 10) | | 44,801 |
| | 41,196 |
|
| Total current liabilities | | 89,188 |
| | 82,336 |
|
| | | | | |
| Other liabilities and deferred revenue (Note 8) | | 23,652 |
| | 23,457 |
|
| Automotive long-term debt (Note 10) | | 10,675 |
| | 11,060 |
|
| Financial Services long-term debt (Note 10) | | 79,276 |
| | 78,819 |
|
| Deferred income taxes | 556 |
| | 502 |
| 577 |
| | 502 |
|
| Total liabilities | 207,572 |
| | 196,174 |
| 203,368 |
| | 196,174 |
|
| | | | | | | |
| Redeemable noncontrolling interest | 95 |
| | 94 |
| 96 |
| | 94 |
|
| | | | | | | |
| EQUITY | |
| | |
| |
| | |
|
| Capital stock | |
| | |
| |
| Common Stock, par value $.01 per share (3,974 million shares issued of 6 billion authorized) | 40 |
| | 40 |
| |
| Common Stock, par value $.01 per share (3,976 million shares issued of 6 billion authorized) | | 40 |
| | 40 |
|
| Class B Stock, par value $.01 per share (71 million shares issued of 530 million authorized) | 1 |
| | 1 |
| 1 |
| | 1 |
|
| Capital in excess of par value of stock | 21,454 |
| | 21,421 |
| 21,598 |
| | 21,421 |
|
| Retained earnings | 15,278 |
| | 14,414 |
| 17,013 |
| | 14,414 |
|
| Accumulated other comprehensive income/(loss) (Note 11) | (6,046 | ) | | (6,257 | ) | |
| Accumulated other comprehensive income/(loss) (Note 12) | | (6,046 | ) | | (6,257 | ) |
| Treasury stock | (1,122 | ) | | (977 | ) | (1,122 | ) | | (977 | ) |
| Total equity attributable to Ford Motor Company | 29,605 |
| | 28,642 |
| 31,484 |
| | 28,642 |
|
| Equity attributable to noncontrolling interests | 16 |
| | 15 |
| 15 |
| | 15 |
|
| Total equity | 29,621 |
| | 28,657 |
| 31,499 |
| | 28,657 |
|
| Total liabilities and equity | $ | 237,288 |
| | $ | 224,925 |
| $ | 234,963 |
| | $ | 224,925 |
|
The following table includes assets to be used to settle liabilities of the consolidated variable interest entities (“VIEs”). These assets and liabilities are included in the consolidated balance sheet above.
|
| | | | | | | |
| | March 31,
2016 | | December 31,
2015 |
| | (unaudited) |
| ASSETS | | | |
| Cash and cash equivalents | $ | 2,602 |
| | $ | 3,949 |
|
| Finance receivables, net | 50,035 |
| | 45,902 |
|
| Net investment in operating leases | 13,273 |
| | 13,309 |
|
| Other assets | 51 |
| | 85 |
|
| LIABILITIES | | | |
| Other liabilities and deferred revenue | $ | 26 |
| | $ | 19 |
|
| Debt | 43,258 |
| | 43,086 |
|
The accompanying notes are part of the financial statements.
Item 1. Financial Statements (Continued)
FORD MOTOR COMPANY AND SUBSIDIARIES
SECTOR BALANCE SHEET (in millions)
|
| | | | | | | |
| | March 31,
2016 | | December 31,
2015 |
| ASSETS | (unaudited) |
| Automotive | | | |
| Cash and cash equivalents (Note 3) | $ | 5,567 |
| | $ | 5,386 |
|
| Marketable securities (Note 3) | 18,684 |
| | 18,181 |
|
| Total cash and marketable securities | 24,251 |
| | 23,567 |
|
| Receivables, less allowances of $366 and $372 | 5,423 |
| | 5,173 |
|
| Inventories (Note 6) | 9,770 |
| | 8,319 |
|
| Deferred income taxes | 2,443 |
| | 3,664 |
|
| Other current assets | 1,791 |
| | 1,851 |
|
| Total current assets | 43,678 |
| | 42,574 |
|
| Equity in net assets of affiliated companies | 3,682 |
| | 3,091 |
|
| Net property | 31,014 |
| | 30,021 |
|
| Net investment in operating leases | 2,346 |
| | 2,014 |
|
| Deferred income taxes | 11,409 |
| | 10,687 |
|
| Other assets | 4,134 |
| | 3,572 |
|
| Total Automotive assets | 96,263 |
| | 91,959 |
|
| Financial Services | |
| | |
|
| Cash and cash equivalents (Note 3) | 10,350 |
| | 8,886 |
|
| Marketable securities (Note 3) | 4,872 |
| | 2,723 |
|
| Finance receivables, net (Note 4) | 99,369 |
| | 96,063 |
|
| Net investment in operating leases | 25,888 |
| | 25,079 |
|
| Equity in net assets of affiliated companies | 138 |
| | 133 |
|
| Other assets | 3,823 |
| | 3,059 |
|
| Receivable from Automotive | 1,480 |
| | 1,083 |
|
| Total Financial Services assets | 145,920 |
| | 137,026 |
|
| Intersector elimination | (1,480 | ) | | (1,083 | ) |
| Total assets | $ | 240,703 |
| | $ | 227,902 |
|
| LIABILITIES | |
| | |
|
| Automotive | |
| | |
|
| Payables | $ | 20,887 |
| | $ | 19,168 |
|
| Other liabilities and deferred revenue (Note 7) | 19,307 |
| | 17,992 |
|
| Deferred income taxes | 130 |
| | 13 |
|
| Debt payable within one year (Note 9) | 1,941 |
| | 1,779 |
|
| Current payable to Financial Services | 874 |
| | 694 |
|
| Total current liabilities | 43,139 |
| | 39,646 |
|
| Long-term debt (Note 9) | 11,081 |
| | 11,060 |
|
| Other liabilities and deferred revenue (Note 7) | 22,841 |
| | 22,732 |
|
| Deferred income taxes | 302 |
| | 287 |
|
| Non-current payable to Financial Services | 606 |
| | 389 |
|
| Total Automotive liabilities | 77,969 |
| | 74,114 |
|
| Financial Services | |
| | |
|
| Payables | 1,185 |
| | 1,104 |
|
| Debt (Note 9) | 127,973 |
| | 120,015 |
|
| Deferred income taxes | 3,539 |
| | 3,179 |
|
| Other liabilities and deferred income (Note 7) | 1,801 |
| | 1,822 |
|
| Total Financial Services liabilities | 134,498 |
| | 126,120 |
|
| Intersector elimination | (1,480 | ) | | (1,083 | ) |
| Total liabilities | 210,987 |
| | 199,151 |
|
| | | | |
| Redeemable noncontrolling interest | 95 |
| | 94 |
|
| | | | |
| EQUITY | |
| | |
|
| Capital stock | |
| | |
|
| Common Stock, par value $.01 per share (3,974 million shares issued of 6 billion authorized) | 40 |
| | 40 |
|
| Class B Stock, par value $.01 per share (71 million shares issued of 530 million authorized) | 1 |
| | 1 |
|
| Capital in excess of par value of stock | 21,454 |
| | 21,421 |
|
| Retained earnings | 15,278 |
| | 14,414 |
|
| Accumulated other comprehensive income/(loss) (Note 11) | (6,046 | ) | | (6,257 | ) |
| Treasury stock | (1,122 | ) | | (977 | ) |
| Total equity attributable to Ford Motor Company | 29,605 |
| | 28,642 |
|
| Equity attributable to noncontrolling interests | 16 |
| | 15 |
|
| Total equity | 29,621 |
| | 28,657 |
|
| Total liabilities and equity | $ | 240,703 |
| | $ | 227,902 |
|
|
| | | | | | | |
| The following table includes assets to be used to settle liabilities of the consolidated variable interest entities (“VIEs”). These assets and liabilities are included in the consolidated balance sheet above. |
| | September 30,
2016 | | December 31,
2015 |
| | (unaudited) |
| ASSETS | | | |
| Cash and cash equivalents | $ | 2,318 |
| | $ | 3,949 |
|
| Financial Services finance receivables, net | 47,627 |
| | 45,902 |
|
| Net investment in operating leases | 9,951 |
| | 13,309 |
|
| Other assets | 7 |
| | 85 |
|
| LIABILITIES | | | |
| Other liabilities and deferred revenue | $ | 10 |
| | $ | 19 |
|
| Debt | 39,123 |
| | 43,086 |
|
The accompanying notes are part of the financial statements.
Item 1. Financial Statements (Continued)
FORD MOTOR COMPANY AND SUBSIDIARIES
CONDENSED CONSOLIDATED STATEMENT OF CASH FLOWS
(in millions)
| | | | For the periods ended March 31, | For the periods ended September 30, |
| | 2016 | | 2015 | 2016 | | 2015 |
| | First Quarter | First Nine Months |
| | (unaudited) | (unaudited) |
| Cash flows from operating activities | | | | | | |
| Net cash provided by/(used in) operating activities | $ | 4,092 |
| | $ | 2,413 |
| $ | 16,994 |
| | $ | 14,078 |
|
| | | | | | | |
| Cash flows from investing activities | | | | | | |
| Capital spending | (1,511 | ) | | (1,800 | ) | (4,912 | ) | | (5,358 | ) |
| Acquisitions of finance receivables and operating leases | (12,677 | ) | | (12,257 | ) | (43,746 | ) | | (43,762 | ) |
| Collections of finance receivables and operating leases | 9,674 |
| | 9,251 |
| 30,254 |
| | 28,632 |
|
| Purchases of marketable securities | (8,231 | ) | | (11,711 | ) | |
| Sales and maturities of marketable securities | 5,679 |
| | 11,327 |
| |
| Purchases of equity and debt securities | | (22,049 | ) | | (29,493 | ) |
| Sales and maturities of equity and debt securities | | 22,022 |
| | 32,874 |
|
| Settlements of derivatives | 104 |
| | 113 |
| 330 |
| | 26 |
|
| Other | (13 | ) | | 117 |
| 43 |
| | 417 |
|
| Net cash provided by/(used in) investing activities | (6,975 | ) | | (4,960 | ) | (18,058 | ) | | (16,664 | ) |
| | | | | | | |
| Cash flows from financing activities | |
| | |
| |
| | |
|
| Cash dividends | (1,588 | ) | | (593 | ) | (2,780 | ) | | (1,785 | ) |
| Purchases of Common Stock | (145 | ) | | — |
| (145 | ) | | (129 | ) |
| Net changes in short-term debt | (121 | ) | | 488 |
| 1,200 |
| | 844 |
|
| Proceeds from issuance of other debt | 15,623 |
| | 13,624 |
| 31,956 |
| | 35,876 |
|
| Principal payments on other debt | (9,431 | ) | | (8,686 | ) | (30,019 | ) | | (27,366 | ) |
| Other | (2 | ) | | (249 | ) | (44 | ) | | (303 | ) |
| Net cash provided by/(used in) financing activities | 4,336 |
| | 4,584 |
| 168 |
| | 7,137 |
|
| | | | | | | |
| Effect of exchange rate changes on cash and cash equivalents | 192 |
| | (426 | ) | (36 | ) | | (622 | ) |
| | | | | | | |
| Net increase/(decrease) in cash and cash equivalents | $ | 1,645 |
| | $ | 1,611 |
| $ | (932 | ) | | $ | 3,929 |
|
| | | | | | | |
| Cash and cash equivalents at January 1 | $ | 14,272 |
| | $ | 10,757 |
| $ | 14,272 |
| | $ | 10,757 |
|
| Net increase/(decrease) in cash and cash equivalents | 1,645 |
| | 1,611 |
| (932 | ) | | 3,929 |
|
| Cash and cash equivalents at March 31 | $ | 15,917 |
| | $ | 12,368 |
| |
| Cash and cash equivalents at September 30 | | $ | 13,340 |
| | $ | 14,686 |
|
The accompanying notes are part of the financial statements.
Item 1. Financial Statements (Continued)
FORD MOTOR COMPANY AND SUBSIDIARIES
CONDENSED SECTOR STATEMENT OF CASH FLOWS
(in millions)
|
| | | | | | | | | | | | | | | |
| | For the periods ended March 31, |
| | 2016 | | 2015 |
| | First Quarter |
| | Automotive | | Financial Services | | Automotive | | Financial Services |
| | (unaudited) |
| Cash flows from operating activities | | | | | | | |
| Net cash provided by/(used in) operating activities (a) | $ | 3,567 |
| | $ | 1,611 |
| | $ | 1,006 |
| | $ | 1,724 |
|
| | | | | | | | |
| Cash flows from investing activities | | | | | | | |
| Capital spending | (1,497 | ) | | (14 | ) | | (1,786 | ) | | (14 | ) |
| Acquisitions of finance receivables and operating leases (excluding wholesale and other) | — |
| | (12,677 | ) | | — |
| | (12,257 | ) |
| Collections of finance receivables and operating leases (excluding wholesale and other) | — |
| | 9,674 |
| | — |
| | 9,251 |
|
| Net change in wholesale and other receivables (b) | — |
| | (1,962 | ) | | — |
| | (973 | ) |
| Purchases of marketable securities | (5,649 | ) | | (2,582 | ) | | (7,161 | ) | | (4,550 | ) |
| Sales and maturities of marketable securities | 5,226 |
| | 453 |
| | 9,785 |
| | 1,542 |
|
| Settlements of derivatives | 117 |
| | (13 | ) | | 70 |
| | 43 |
|
| Other | 4 |
| | (17 | ) | | 44 |
| | 73 |
|
| Investing activity (to)/from Financial Services (c) | 124 |
| | — |
| | 39 |
| | — |
|
| Interest supplements and residual value support from Automotive (a) | — |
| | 876 |
| | — |
| | 656 |
|
| Net cash provided by/(used in) investing activities | (1,675 | ) |
| (6,262 | ) |
| 991 |
|
| (6,229 | ) |
| | | | | | | | |
| Cash flows from financing activities | | | | | | | |
| Cash dividends | (1,588 | ) | | — |
| | (593 | ) | | — |
|
| Purchases of Common Stock | (145 | ) | | — |
| | — |
| | — |
|
| Net changes in short-term debt | 113 |
| | (234 | ) | | 49 |
| | 439 |
|
| Proceeds from issuance of other debt | 13 |
| | 15,610 |
| | 172 |
| | 13,452 |
|
| Principal payments on other debt | (215 | ) | | (9,216 | ) | | (778 | ) | | (7,908 | ) |
| Other | 42 |
| | (44 | ) | | (213 | ) | | (36 | ) |
| Financing activity to/(from) Automotive (c) | — |
| | (124 | ) | | — |
| | (39 | ) |
| Net cash provided by/(used in) financing activities | (1,780 | ) | | 5,992 |
| | (1,363 | ) | | 5,908 |
|
| | | | | | | | |
| Effect of exchange rate changes on cash and cash equivalents | 69 |
| | 123 |
| | (127 | ) | | (299 | ) |
| | | | | | | | |
| Net increase/(decrease) in cash and cash equivalents | $ | 181 |
|
| $ | 1,464 |
|
| $ | 507 |
|
| $ | 1,104 |
|
| | | | | | | | |
| Cash and cash equivalents at January 1 | $ | 5,386 |
| | $ | 8,886 |
| | $ | 4,567 |
| | $ | 6,190 |
|
| Net increase/(decrease) in cash and cash equivalents | 181 |
| | 1,464 |
| | 507 |
| | 1,104 |
|
| Cash and cash equivalents at March 31 | $ | 5,567 |
|
| $ | 10,350 |
|
| $ | 5,074 |
|
| $ | 7,294 |
|
_________
| |
(a) | Operating activities include outflows of $876 million and $656 million for the periods ended March 31, 2016 and 2015, respectively, of interest supplements and residual value support to Financial Services. Interest supplements and residual value support from Automotive to Financial Servicesare eliminated in the condensed consolidated statement of cash flows.
|
| |
(b) | Reclassified to operating activities in the condensed consolidated statement of cash flows. |
| |
(c) | Eliminated in the condensed consolidated statement of cash flows. |
The accompanying notes are part of the financial statements.
Item 1. Financial Statements (Continued)
FORD MOTOR COMPANY AND SUBSIDIARIES
CONSOLIDATED STATEMENT OF EQUITY
(in millions, unaudited)
| | | | Equity Attributable to Ford Motor Company | | | | | Equity Attributable to Ford Motor Company | | | | |
| | Capital Stock | | Cap. in Excess of Par Value of Stock | | Retained Earnings | | Accumulated Other Comprehensive Income/(Loss) (Note 11) | | Treasury Stock | | Total | | Equity Attributable to Non-controlling Interests | | Total Equity | Capital Stock | | Cap. in Excess of Par Value of Stock | | Retained Earnings | | Accumulated Other Comprehensive Income/(Loss) (Note 12) | | Treasury Stock | | Total | | Equity Attributable to Non-controlling Interests | | Total Equity |
| Balance at December 31, 2015 | $ | 41 |
| | $ | 21,421 |
| | $ | 14,414 |
| | $ | (6,257 | ) | | $ | (977 | ) | | $ | 28,642 |
| | $ | 15 |
| | $ | 28,657 |
| $ | 41 |
| | $ | 21,421 |
| | $ | 14,414 |
| | $ | (6,257 | ) | | $ | (977 | ) | | $ | 28,642 |
| | $ | 15 |
| | $ | 28,657 |
|
| Net income | — |
| | — |
| | 2,452 |
| | — |
| | — |
| | 2,452 |
| | 3 |
| | 2,455 |
| — |
| | — |
| | 5,379 |
| | — |
| | — |
| | 5,379 |
| | 9 |
| | 5,388 |
|
| Other comprehensive income/(loss), net of tax | — |
| | — |
| | — |
| | 211 |
| | — |
| | 211 |
| | (1 | ) | | 210 |
| — |
| | — |
| | — |
| | 211 |
| | — |
| | 211 |
| | (2 | ) | | 209 |
|
| Common stock issued (including share-based compensation impacts) | — |
| | 33 |
| | — |
| | — |
| | — |
| | 33 |
| | — |
| | 33 |
| — |
| | 177 |
| | — |
| | — |
| | — |
| | 177 |
| | — |
| | 177 |
|
| Treasury stock/other | — |
| | — |
| | — |
| | — |
| | (145 | ) | | (145 | ) | | (1 | ) | | (146 | ) | — |
| | — |
| | — |
| | — |
| | (145 | ) | | (145 | ) | | (2 | ) | | (147 | ) |
| Cash dividends declared | — |
| | — |
| | (1,588 | ) | | — |
| | — |
| | (1,588 | ) | | — |
| | (1,588 | ) | — |
| | — |
| | (2,780 | ) | | — |
| | — |
| | (2,780 | ) | | (5 | ) | | (2,785 | ) |
| Balance at March 31, 2016 | $ | 41 |
| | $ | 21,454 |
| | $ | 15,278 |
| | $ | (6,046 | ) | | $ | (1,122 | ) | | $ | 29,605 |
| | $ | 16 |
| | $ | 29,621 |
| |
| Balance at September 30, 2016 | | $ | 41 |
| | $ | 21,598 |
| | $ | 17,013 |
| | $ | (6,046 | ) | | $ | (1,122 | ) | | $ | 31,484 |
| | $ | 15 |
| | $ | 31,499 |
|
| | | | | | | | | | | | | | | | | | | | | | | | | | | | | | | |
| Balance at December 31, 2014 | $ | 40 |
| | $ | 21,089 |
| | $ | 9,422 |
| | $ | (5,265 | ) | | $ | (848 | ) | | $ | 24,438 |
| | $ | 27 |
| | $ | 24,465 |
| $ | 40 |
| | $ | 21,089 |
| | $ | 9,422 |
| | $ | (5,265 | ) | | $ | (848 | ) | | $ | 24,438 |
| | $ | 27 |
| | $ | 24,465 |
|
| Net income | — |
| | — |
| | 1,153 |
| | — |
| | — |
| | 1,153 |
| | 1 |
| | 1,154 |
| — |
| | — |
| | 5,505 |
| | — |
| | — |
| | 5,505 |
| | 2 |
| | 5,507 |
|
| Other comprehensive income/(loss), net of tax | — |
| | — |
| | — |
| | (135 | ) | | — |
| | (135 | ) | | — |
| | (135 | ) | — |
| | — |
| | — |
| | (607 | ) | | — |
| | (607 | ) | | — |
| | (607 | ) |
| Common stock issued (including share-based compensation impacts) | 1 |
| | 184 |
| | — |
| | — |
| | — |
| | 185 |
| | — |
| | 185 |
| 1 |
| | 265 |
| | — |
| | — |
| | — |
| | 266 |
| | — |
| | 266 |
|
| Treasury stock/other | — |
| | — |
| | — |
| | — |
| | — |
| | — |
| | (1 | ) | | (1 | ) | — |
| | — |
| | — |
| | — |
| | (129 | ) | | (129 | ) | | (4 | ) | | (133 | ) |
| Cash dividends declared | — |
| | — |
| | (593 | ) | | — |
| | — |
| | (593 | ) | | — |
| | (593 | ) | — |
| | — |
| | (1,785 | ) | | — |
| | — |
| | (1,785 | ) | | (6 | ) | | (1,791 | ) |
| Balance at March 31, 2015 | $ | 41 |
| | $ | 21,273 |
| | $ | 9,982 |
| | $ | (5,400 | ) | | $ | (848 | ) | | $ | 25,048 |
| | $ | 27 |
| | $ | 25,075 |
| |
| Balance at September 30, 2015 | | $ | 41 |
| | $ | 21,354 |
| | $ | 13,142 |
| | $ | (5,872 | ) | | $ | (977 | ) | | $ | 27,688 |
| | $ | 19 |
| | $ | 27,707 |
|
The accompanying notes are part of the financial statements.
Item 1. Financial Statements (Continued)
FORD MOTOR COMPANY AND SUBSIDIARIES
NOTES TO THE FINANCIAL STATEMENTS
Table of Contents
|
| | |
| Footnote | | Page |
| Note 1 | Presentation | |
| Note 2 | New Accounting Standards | |
| Note 3 | Segment Information | |
| Note 4 | Cash, Cash Equivalents, and Marketable Securities | |
Note 45 | Financial Services Sector Finance Receivables | |
Note 56 | Financial Services Sector Allowance for Credit Losses | |
Note 67 | Inventories | |
Note 78 | Other Liabilities and Deferred Revenue | |
Note 89 | Retirement Benefits | |
Note 910 | Debt | |
Note 1011 | Derivative Financial Instruments and Hedging Activities | |
Note 1112 | Accumulated Other Comprehensive Income/(Loss) | |
Note 1213 | Other Income/(Loss) | |
Note 1314 | Income Taxes | |
Note 1415 | Capital Stock and Earnings Per Share | |
Note 15 | Segment Information | |
| Note 16 | Commitments and Contingencies | |
Item 1. Financial Statements (Continued)
FORD MOTOR COMPANY AND SUBSIDIARIES
NOTES TO THE FINANCIAL STATEMENTS
NOTE 1. PRESENTATION
For purposes of this report, “Ford,” the “Company,” “we,” “our,” “us” or similar references mean Ford Motor Company, our consolidated subsidiaries, and our consolidated VIEs of which we are the primary beneficiary, unless the context requires otherwise.
Our financial statements are presented in accordance with U.S. generally accepted accounting principles (“GAAP”) for interim financial information, and instructions to the Quarterly Report on Form 10-Q, and Rule 10-01 of Regulation S-X. We show certain of our financial statements on both a consolidated and a sector basis for our Automotive and Financial Services sectors. Intercompany items have been eliminated in both the consolidated and sector balance sheets. Where the presentation of these intercompany eliminations or consolidated adjustments differs between the consolidated and sector financial statements, reconciliations of certain line items are explained below in this Note or in the related financial statements and footnotes.
In the opinion of management, these unaudited financial statements reflect a fair statement of theour results of operations and financial condition of Ford Motor Company, its consolidated subsidiaries, and consolidated VIEs of which we are the primary beneficiary for the periods, and at the dates, presented. The results for interim periods are not necessarily indicative of results that may be expected for any other interim period or for the full year. Reference should be made to the financial statements contained in our Annual Report on Form 10-K for the year ended December 31, 2015 (“2015 Form 10-K Report”). For purposes
Change in presentation. Our core Automotive business includes the designing, manufacturing, marketing, and servicing of this report, “Ford,” the “Company,” “we,” “our,” “us” or similar references meana full line of Ford cars, trucks, SUVs, and electrified vehicles, as well as Lincoln luxury vehicles. We provide vehicle-related financing and leasing activities through Ford Motor Credit Company LLC (“Ford Credit”). At the same time, we are pursuing emerging opportunities in connectivity, mobility, autonomous vehicles, the customer experience, and data and analytics.
Prior to the second quarter of 2016, we presented our financial statements on both a consolidated basis and on a “sector” basis for our Automotive and Financial Services sectors. With our expansion into mobility services, including the formation in March 2016 of the Ford Smart Mobility LLC subsidiary, we reevaluated our disclosures and concluded we should eliminate our two-sector financial presentation and, reflecting the manner in which our Chief Operating Decision Maker manages our business, changed our segment presentation beginning with the second quarter of 2016 to be Automotive, Financial Services, and All Other. See Note 3 for a description of our segment presentation.
In addition, as a result of the elimination of our two-sector financial presentation, at June 30, 2016 we changed the presentation of our consolidated subsidiaries,balance sheet and certain notes to the consolidated financial statements to classify our consolidated VIEs of which we are the primary beneficiary, unless the context requires otherwise.
assets and liabilities as current or non-current. We reclassified certain prior year amounts in our consolidated financial statements to conform to the current year presentation.
Reconciliations between Consolidated and Sector Financial Statements
Sector to Consolidated Deferred Tax Assets and Liabilities. The difference between the total assets and total liabilities as presented on our sector balance sheet and consolidated balance sheet is the result of netting deferred income tax assets and liabilities. The reconciliation between the totals for the sector and consolidated balance sheets was as follows (in millions):
|
| | | | | | | |
| | March 31,
2016 | | December 31,
2015 |
| Sector balance sheet presentation of deferred income tax assets | | | |
| Automotive sector current deferred income tax assets | $ | 2,443 |
| | $ | 3,664 |
|
| Automotive sector non-current deferred income tax assets | 11,409 |
| | 10,687 |
|
| Financial Services sector deferred income tax assets (a) | 142 |
| | 135 |
|
| Total | 13,994 |
| | 14,486 |
|
| Reclassification for netting of deferred income taxes | (3,415 | ) | | (2,977 | ) |
| Consolidated balance sheet presentation of deferred income tax assets | $ | 10,579 |
| | $ | 11,509 |
|
| | | | |
| Sector balance sheet presentation of deferred income tax liabilities | |
| | |
|
| Automotive sector current deferred income tax liabilities | $ | 130 |
| | $ | 13 |
|
| Automotive sector non-current deferred income tax liabilities | 302 |
| | 287 |
|
| Financial Services sector deferred income tax liabilities | 3,539 |
| | 3,179 |
|
| Total | 3,971 |
| | 3,479 |
|
| Reclassification for netting of deferred income taxes | (3,415 | ) | | (2,977 | ) |
| Consolidated balance sheet presentation of deferred income tax liabilities | $ | 556 |
| | $ | 502 |
|
__________
| |
(a) | Included in Financial Services Other assets on our sector balance sheet.
|
Item 1. Financial Statements (Continued)
FORD MOTOR COMPANY AND SUBSIDIARIES
NOTES TO THE FINANCIAL STATEMENTS
NOTE 2. NEW ACCOUNTING STANDARDS
Adoption of New Accounting Standards
Accounting Standard Update (“ASU”) 2015-17, Income Taxes - Balance Sheet Classification of Deferred Taxes. On April 1, 2016, we retrospectively adopted the new accounting standard which requires deferred tax assets and liabilities to be classified as non-current in the consolidated balance sheet. The impact of the change resulted in the classification of all deferred taxes as non-current.
We also adopted the following standards during 2016, none of which have a material impact to our financial statements or financial statement disclosures:
|
| | | |
| Standard | | Effective Date |
| 2015-16 | Business Combinations - Simplifying the Accounting for Measurement-Period Adjustments | | January 1, 2016 |
| 2015-09 | Insurance - Disclosures about Short-Duration Contracts | | January 1, 2016 |
| 2015-05 | Internal-Use Software - Customer’s Accounting for Fees Paid in a Cloud Computing Arrangement | | January 1, 2016 |
| 2015-02 | Consolidation - Amendments to the Consolidation Analysis | | January 1, 2016 |
| 2015-01 | Extraordinary and Unusual Items - Simplifying Income Statement Presentation by Eliminating the Concept of Extraordinary Items | | January 1, 2016 |
| 2014-12 | Stock Compensation - Accounting for Share-Based Payments When the Terms of an Award Provide That a Performance Target Could Be Achieved after the Requisite Service Period | | January 1, 2016 |
Item 1. Financial Statements (Continued)
FORD MOTOR COMPANY AND SUBSIDIARIES
NOTES TO THE FINANCIAL STATEMENTS
NOTE 2. NEW ACCOUNTING STANDARDS (Continued)
Accounting Standards Issued But Not Yet Adopted
ASU 2016-13, Credit Losses - Measurement of Credit Losses on Financial Instruments. In June 2016, the Financial Accounting Standard UpdateStandards Board (“ASU”FASB”) issued a new accounting standard which replaces the current incurred loss impairment method with a method that reflects expected credit losses. The new standard is effective as of January 1, 2020, and early adoption is permitted as of January 1, 2019. We are assessing the potential impact to our financial statements and disclosures.
ASU 2016-09, Stock Compensation - Improvements to Employee Share-Based Payment Accounting. In March 2016, the Financial Accounting Standards Board (“FASB”)FASB issued a new accounting standard which simplifies accounting for share-based payment transactions, including income tax consequences and the classification of the tax impact on the statement of cash flows. The newWe will adopt the standard is effective as of January 1, 2017 by recognizing a one-time adjustment to retained earnings and early adoption is permitted.deferred tax assets related to cumulative excess tax benefits previously unrecognized. We are assessingwill also change classification of tax-related items on the potential impact to our financial statements and disclosures.consolidated statement of cash flows.
ASU 2016-02, Leases. In February 2016, the FASB issued a new accounting standard which provides guidance on the recognition, measurement, presentation, and disclosure of leases. The new standard supersedes present U.S. GAAP guidance on leases and requires substantially all leases to be reported on the balance sheet as right-of-use assets and lease liabilities, as well as additional disclosures. The new standard is effective as of January 1, 2019, and early adoption is permitted. We are assessing the potential impact to our financial statements and disclosures.
ASU 2014-09, Revenue - Revenue from Contracts with Customers. In May 2014, the FASB issued a new accounting standard that requires recognition of revenue to depict the transfer of promised goods or services to customers in an amount that reflects the consideration to which we expect to be entitled in exchange for those goods or services. The FASB has also issued several updates to ASU 2014-09. The new standard supersedes U.S. GAAP guidance on revenue recognition and requires the use of more estimates and judgments than the present standards, as well asstandards. It also requires additional disclosures. The FASB has issued several updatesWe plan to adopt the standard which i) defer the originalnew revenue guidance effective date from January 1, 2017 to January 1, 2018, while allowing for early adoption asby recognizing the cumulative effect of January 1, 2017 (ASU 2015-14); ii) clarifyinitially applying the application of the principal versus agent guidance (ASU 2016-08); and iii) clarify the guidance on inconsequential and perfunctory promises and licensing (ASU 2016-10). The new accounting standard will impact the timing of when certain arrangements are recognized as revenue as we move from a risk and rewards model to a control model. The new standard will also requireas an adjustment to the opening balance of equity. We do not expect a change in classification between revenue and costs relatingmaterial impact to certain performance obligations within our sales arrangements. We are reviewing the method of adoption.financial statements or disclosures.
Item 1. Financial Statements (Continued)
FORD MOTOR COMPANY AND SUBSIDIARIES
NOTES TO THE FINANCIAL STATEMENTS
NOTE 3. CASH, CASH EQUIVALENTS, AND MARKETABLE SECURITIESSEGMENT INFORMATION
In conjunction with our expanded business model to become an automotive, financial services, and mobility company, beginning with the second quarter of 2016, we changed our reportable segment disclosures. Reflecting the manner in which our Chief Operating Decision Maker manages our businesses, including resource allocation and performance assessment, we have four operating segments that represent the primary businesses reported in our consolidated financial statements. These operating segments are: Automotive, Financial Services, Ford Smart Mobility LLC, and Central Treasury Operations.
Automotive and Financial Services comprise separate reportable segments. Ford Smart Mobility LLC and Central Treasury Operations did not meet the quantitative thresholds in this reporting period to qualify as reportable segments; therefore, these operating segments are combined and disclosed below as All Other. Prior-period amounts were adjusted retrospectively to reflect the change to our reportable segments.
Below is a description of our reportable segments and the business activities included in All Other.
Automotive Segment
Our Automotive segment primarily includes the sale of Ford and Lincoln brand vehicles, service parts, and accessories worldwide, together with the associated costs to develop, manufacture, distribute, and service the vehicles, parts, and accessories. The segment includes 5 regional business units: North America, South America, Europe, Middle East & Africa, and Asia Pacific.
Financial Services Segment
The following tables categorizeFinancial Services segment primarily includes our vehicle-related financing and leasing activities at Ford Credit.
All Other
All Other is a combination of operating segments that did not meet the fair valuesquantitative thresholds in this reporting period to qualify as reportable segments. All Other consists of cash,our Central Treasury Operations (formerly Other Automotive) and Ford Smart Mobility LLC. The Central Treasury Operations segment is primarily engaged in decision making for investments, risk management activities, and providing financing for the Automotive segment. Interest income (excluding interest earned on our extended service contract portfolio that is included in our Automotive segment), interest expense, gains and losses on cash equivalents and marketable securities, measuredand foreign exchange derivatives associated with intercompany lending, are included in the results of Central Treasury Operations. The underlying assets and liabilities, primarily cash and cash equivalents, marketable securities, debt, and derivatives, remain with the Automotive segment.
Ford Smart Mobility LLC is a new subsidiary formed to design, build, grow, and invest in emerging mobility services. Designed to compete like a start-up company, Ford Smart Mobility LLC will design and build mobility services on its own, and collaborate with start-ups and tech companies.
Special Items
In addition, our results include Special Items that consist of (i) pension and other postretirement employee benefits (“OPEB”) remeasurement gains and losses, (ii) significant personnel and dealer-related costs stemming from our efforts to match production capacity and cost structure to market demand and changing model mix, and (iii) certain infrequent significant items that we generally do not consider to be indicative of our ongoing operating activities. Our management excludes these items from its review of the results of the operating segments for purposes of measuring segment profitability and allocating resources. Special items are presented as a separate reconciling item.
Item 1. Financial Statements (Continued)
FORD MOTOR COMPANY AND SUBSIDIARIES
NOTES TO THE FINANCIAL STATEMENTS
NOTE 3. SEGMENT INFORMATION (Continued)
Key operating data for our business segments for the periods ended or at fair value on a recurring basis on our balance sheetSeptember 30 were as follows (in millions):
|
| | | | | | | | | |
| | Fair Value Level | | March 31,
2016 | | December 31, 2015 |
| Automotive Sector | | | | | |
| Cash and cash equivalents | | | | | |
| U.S. government | 1 | | $ | — |
| | $ | 115 |
|
| U.S. government agencies | 2 | | 109 |
| | 22 |
|
| Non-U.S. government and agencies | 2 | | 77 |
| | 173 |
|
| Corporate debt | 2 | | 130 |
| | 20 |
|
| Total marketable securities classified as cash equivalents | | | 316 |
| | 330 |
|
| Cash, time deposits, and money market funds | | | 5,251 |
| | 5,056 |
|
| Total cash and cash equivalents | | | $ | 5,567 |
| | $ | 5,386 |
|
| | | | | | |
| Marketable securities | | | | | |
| U.S. government | 1 | | $ | 3,088 |
| | $ | 1,623 |
|
| U.S. government agencies | 2 | | 4,752 |
| | 5,240 |
|
| Non-U.S. government and agencies | 2 | | 6,917 |
| | 7,451 |
|
| Corporate debt | 2 | | 3,323 |
| | 3,279 |
|
| Equities | 1 | | 257 |
| | 240 |
|
| Other marketable securities | 2 | | 347 |
| | 348 |
|
| Total marketable securities | | | $ | 18,684 |
| | $ | 18,181 |
|
| | | | | | |
| Financial Services Sector | | | | | |
| Cash and cash equivalents | | | | | |
| U.S. government | 1 | | $ | 450 |
| | $ | — |
|
| U.S. government agencies | 2 | | 25 |
| | — |
|
| Non-U.S. government and agencies | 2 | | 500 |
| | 266 |
|
| Corporate debt | 2 | | 50 |
| | — |
|
| Total marketable securities classified as cash equivalents | | | 1,025 |
| | 266 |
|
| Cash, time deposits, and money market funds | | | 9,325 |
| | 8,620 |
|
| Total cash and cash equivalents | | | $ | 10,350 |
| | $ | 8,886 |
|
| | | | | | |
| Marketable securities | | | | | |
| U.S. government | 1 | | $ | 1,594 |
| | $ | 298 |
|
| U.S. government agencies | 2 | | 1,746 |
| | 1,169 |
|
| Non-U.S. government and agencies | 2 | | 1,194 |
| | 832 |
|
| Corporate debt | 2 | | 294 |
| | 384 |
|
| Other marketable securities | 2 | | 44 |
| | 40 |
|
| Total marketable securities | | | $ | 4,872 |
| | $ | 2,723 |
|
|
| | | | | | | | | | | | | | | | | | | | | | | |
| | Automotive | | Financial Services | | All Other | | Special Items | | Adjustments | | Total |
| Third Quarter 2016 | |
| | |
| | |
| | | | |
| | |
|
| Revenues | $ | 33,331 |
| | $ | 2,612 |
| | $ | — |
| | $ | — |
| | $ | — |
| | $ | 35,943 |
|
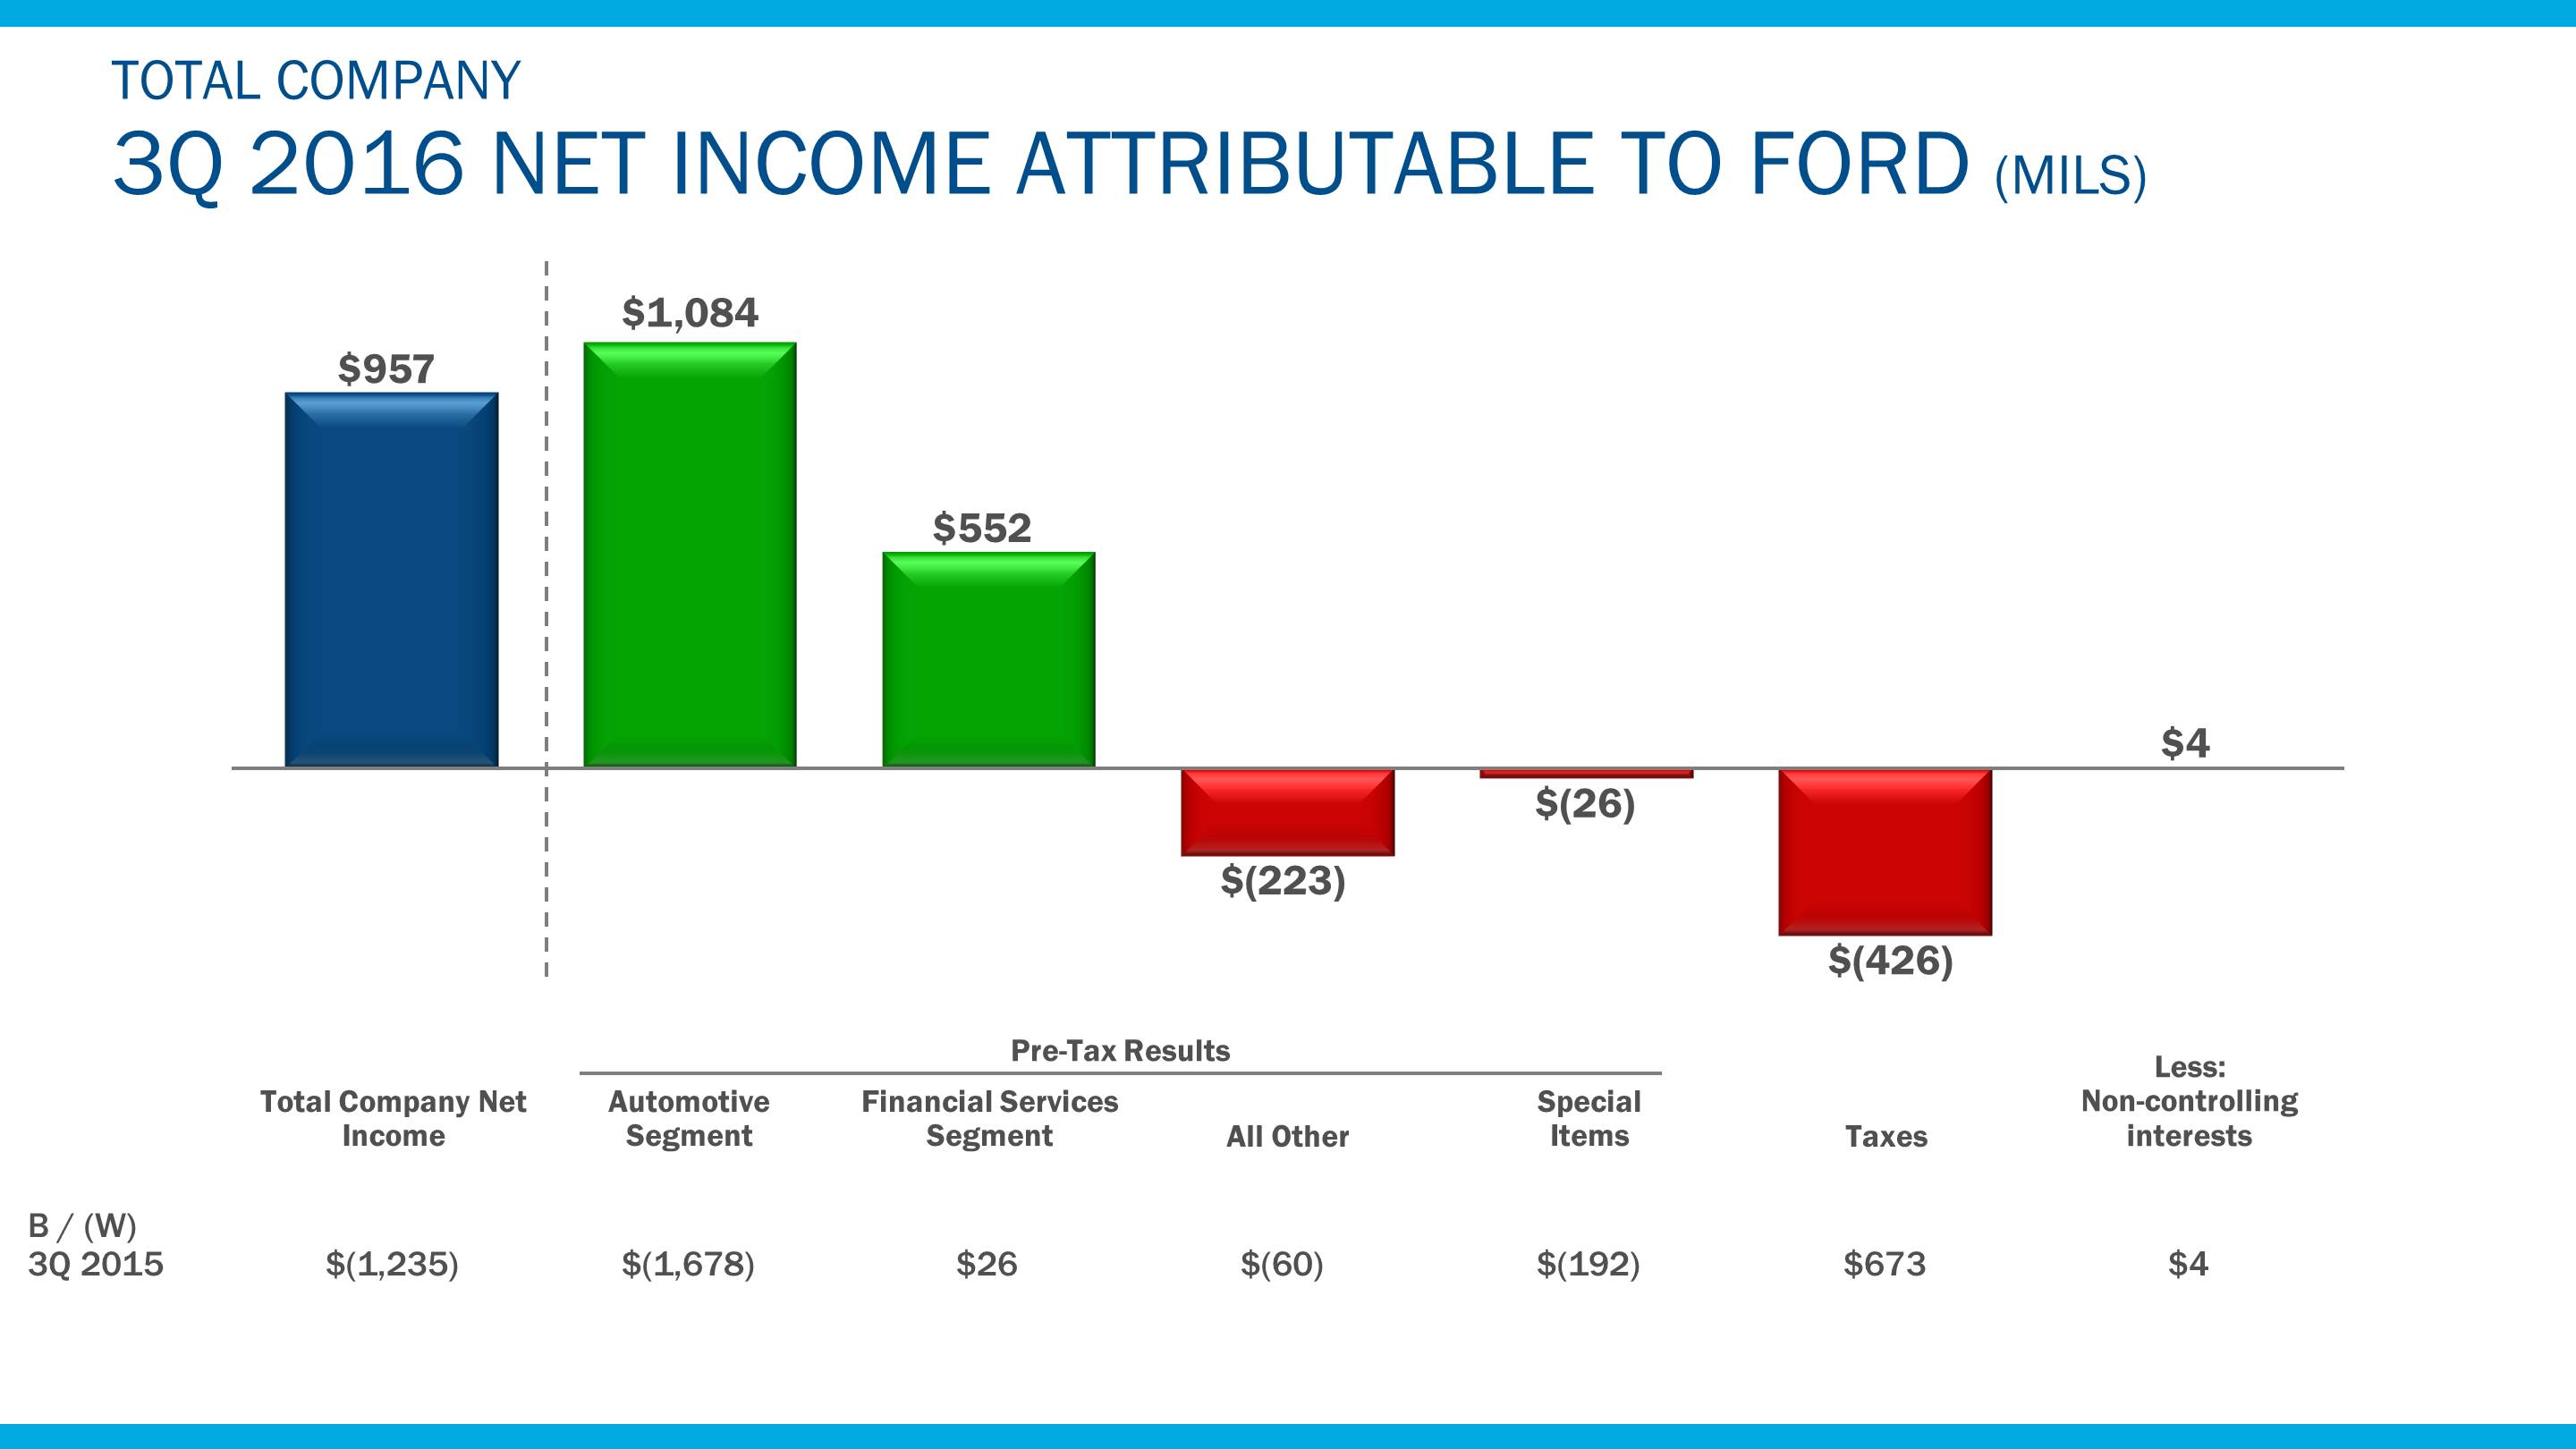
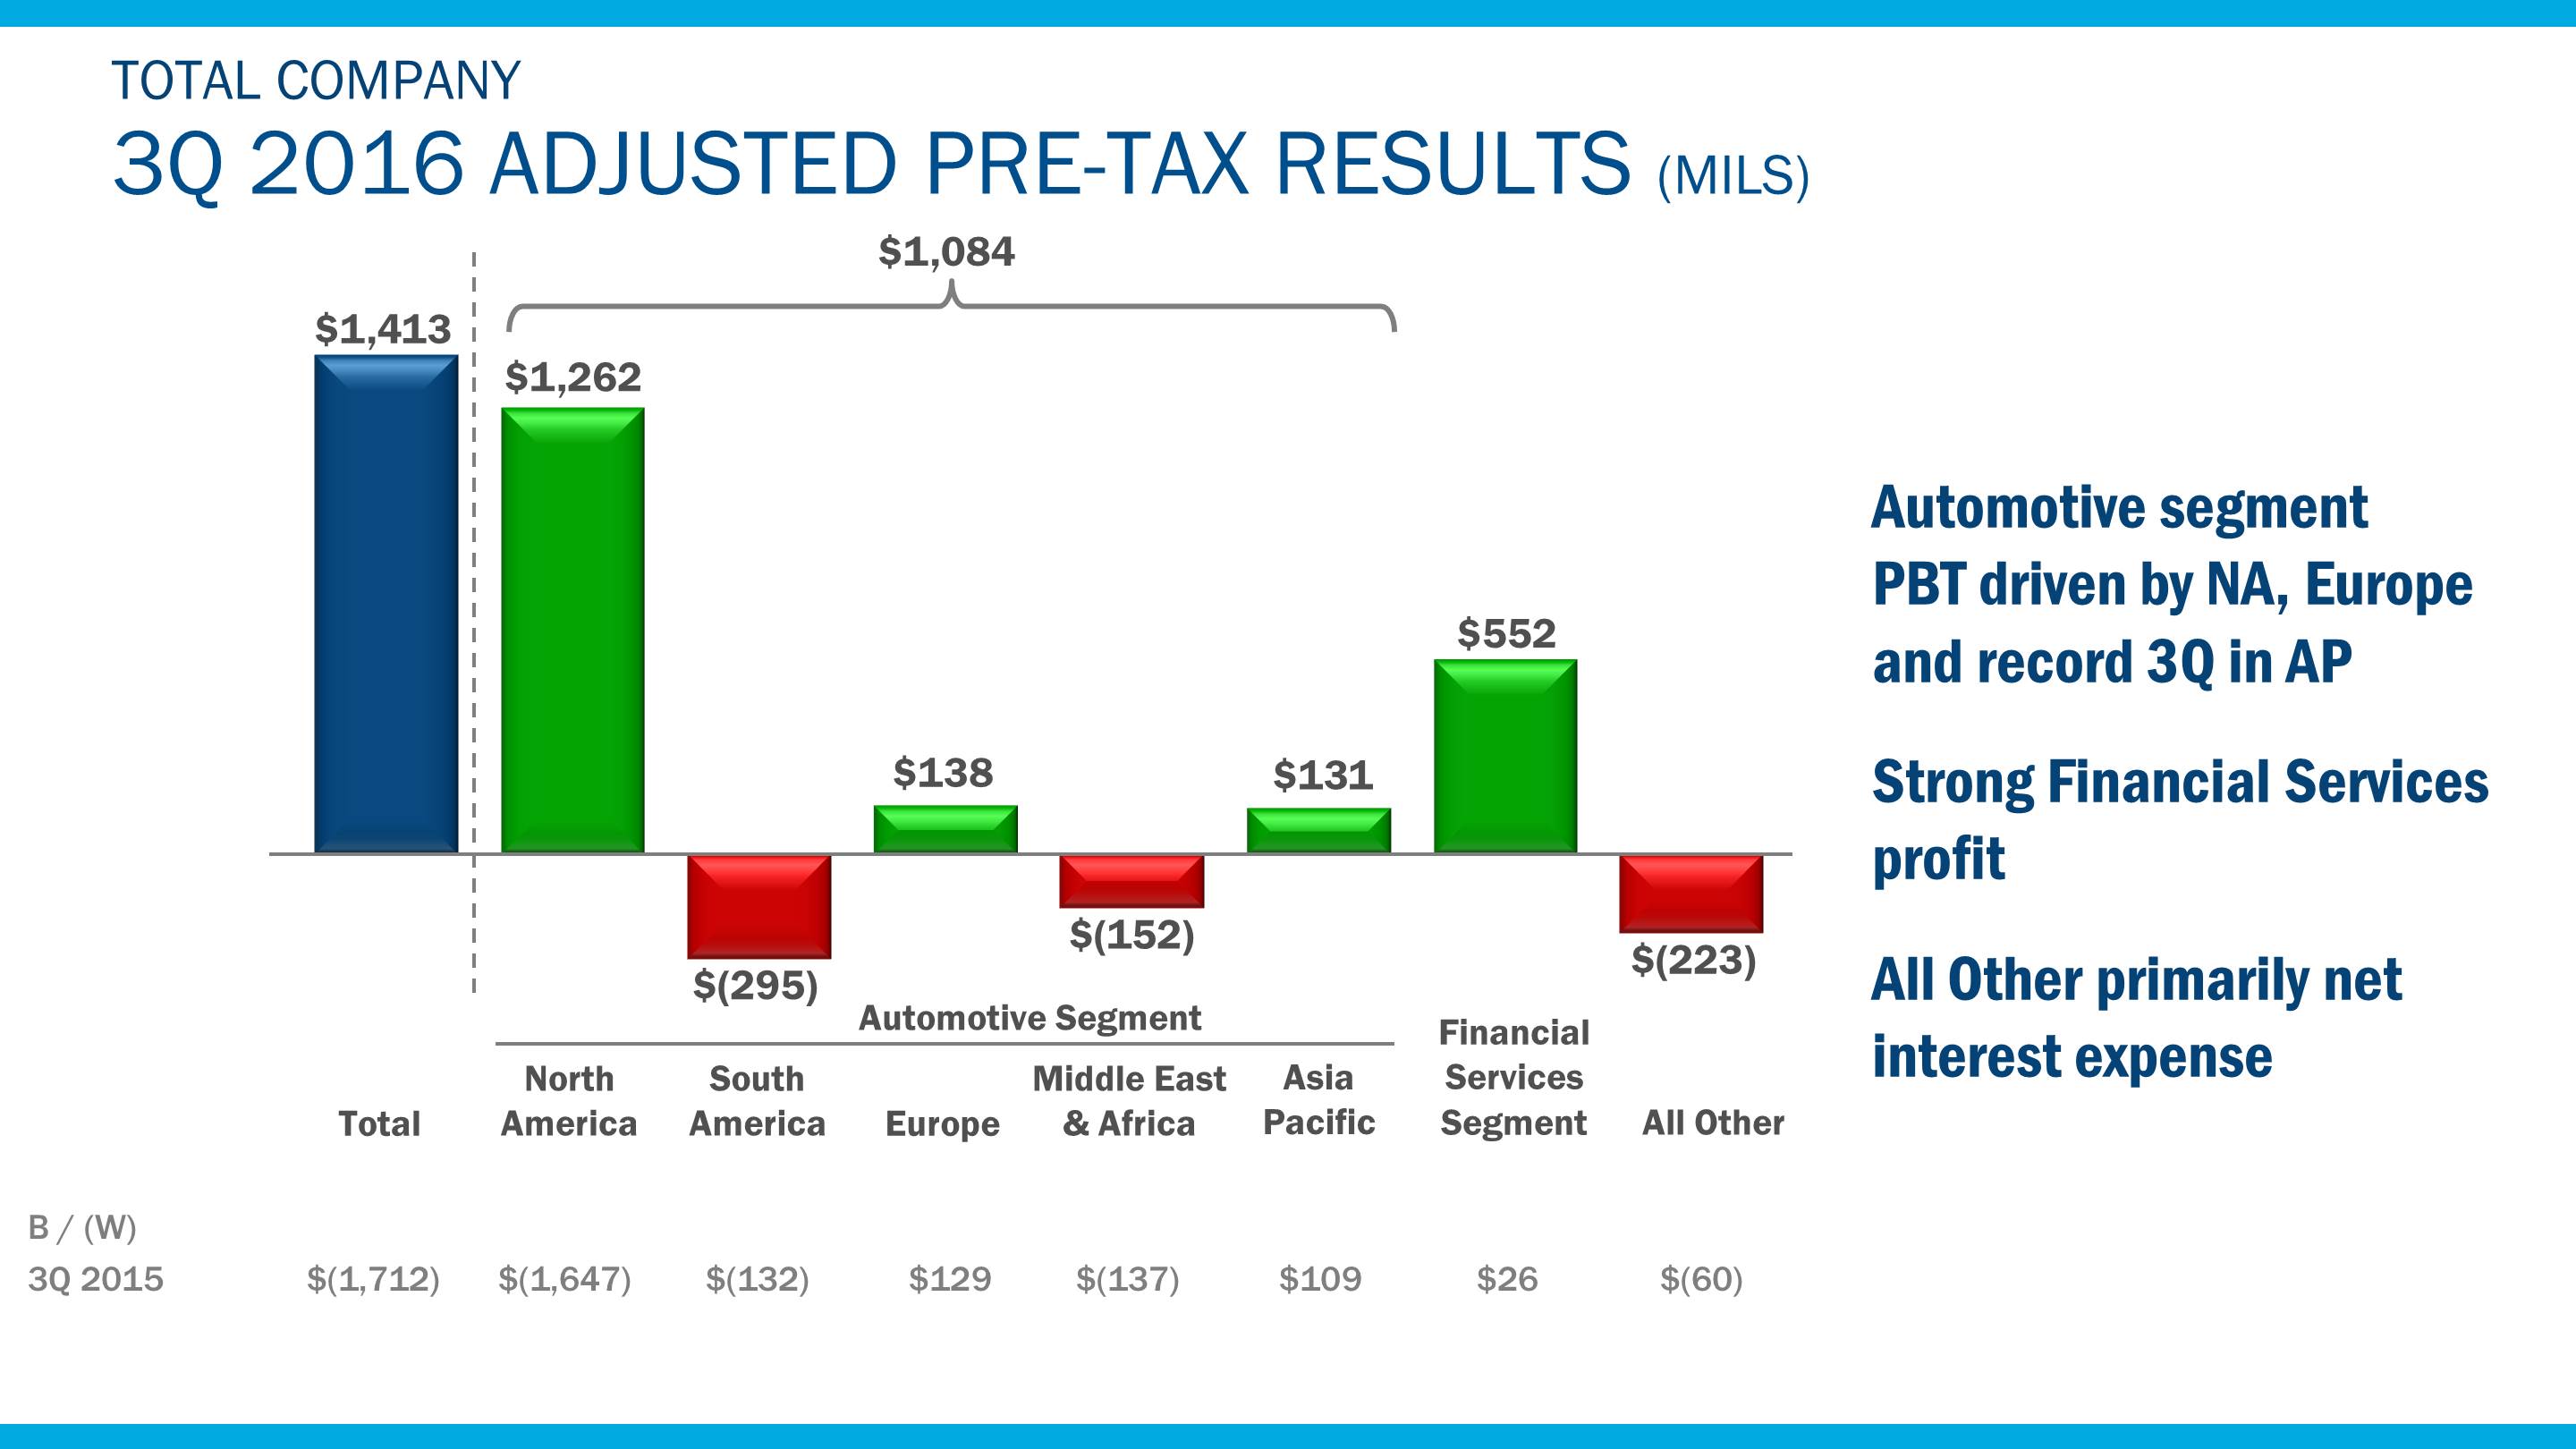
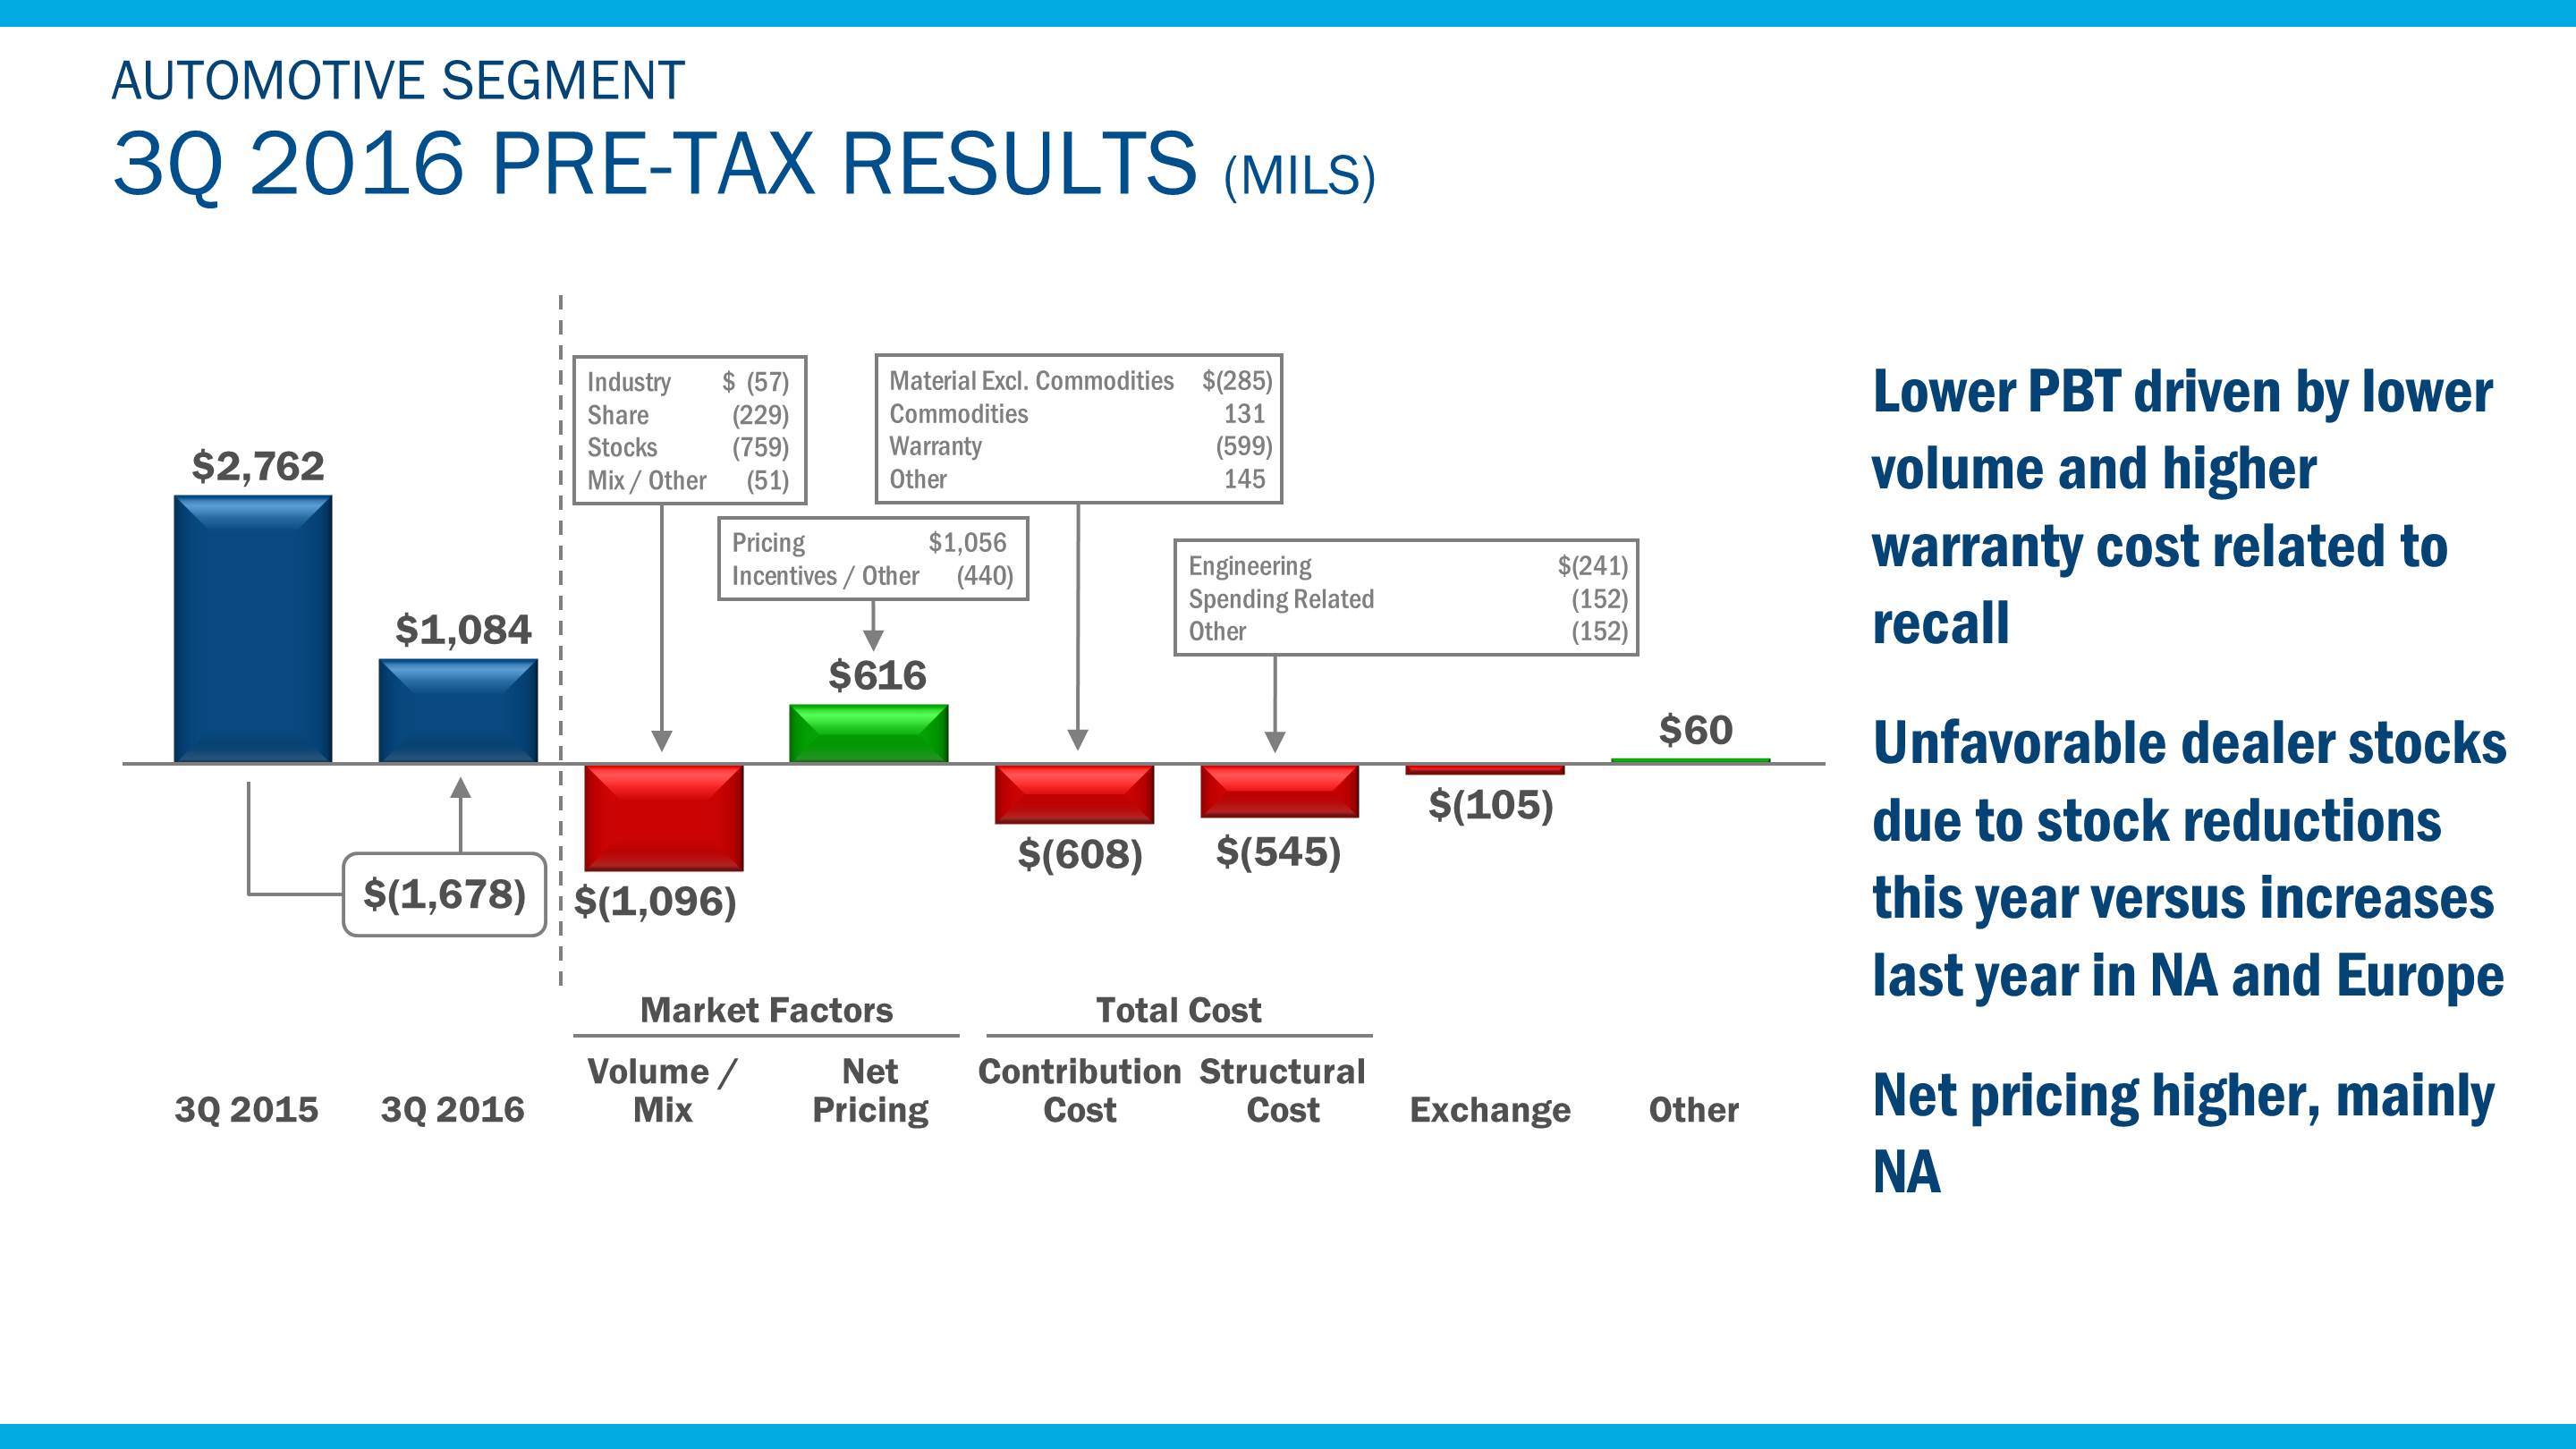
| Pre-tax results - income/(loss) | 1,084 |
| | 552 |
| | (223 | ) | | (26 | ) | | — |
| | 1,387 |
|
| Equity in net income/(loss) of affiliated companies | 395 |
| | 8 |
| | — |
| | — |
| | — |
| | 403 |
|
| Cash, cash equivalents, and marketable securities | 24,300 |
| | 9,855 |
| | 10 |
| | — |
| | — |
| | 34,165 |
|
| Total assets | 97,269 |
| | 142,979 |
| | 67 |
| | — |
| | (5,352 | ) | (a) | 234,963 |
|
| Debt | 13,147 |
| | 124,077 |
| | — |
| | — |
| | — |
| | 137,224 |
|
| Operating cash flows | (1,954 | ) | | 5,953 |
| | — |
| | — |
| | 1,161 |
| (b) | 5,160 |
|
| | | | | | | | | | | | |
| Third Quarter 2015 | |
| | |
| | |
| | | | |
| | |
|
| Revenues | $ | 35,818 |
| | $ | 2,326 |
| | $ | — |
| | $ | — |
| | $ | — |
| | $ | 38,144 |
|
| Pre-tax results - income/(loss) | 2,762 |
| | 526 |
| | (163 | ) | | 166 |
| | — |
| | 3,291 |
|
| Equity in net income/(loss) of affiliated companies | 306 |
| | 8 |
| | — |
| | — |
| | — |
| | 314 |
|
| Cash, cash equivalents, and marketable securities | 22,177 |
| | 9,670 |
| | — |
| | — |
| | — |
| | 31,847 |
|
| Total assets | 92,873 |
| | 130,626 |
| | — |
| | — |
| | (3,921 | ) | (a) | 219,578 |
|
| Debt | 12,798 |
| | 113,627 |
| | — |
| | — |
| | — |
| | 126,425 |
|
| Operating cash flows | 2,787 |
| | 2,167 |
| | — |
| | — |
| | 1,501 |
| (b) | 6,455 |
|
| | | | | | | | | | | | |
| | Automotive | | Financial Services | | All Other | | Special Items | | Adjustments | | Total |
| First Nine Months 2016 | |
| | |
| | |
| | | | |
| | |
|
| Revenues | $ | 105,520 |
| | $ | 7,626 |
| | $ | — |
| | $ | — |
| | $ | — |
| | $ | 113,146 |
|
| Pre-tax results - income/(loss) | 7,380 |
| | 1,436 |
| | (573 | ) | | (330 | ) | | — |
| | 7,913 |
|
| Equity in net income/(loss) of affiliated companies | 1,319 |
| | 23 |
| | — |
| | — |
| | — |
| | 1,342 |
|
| Operating cash flows | 4,917 |
| | 8,761 |
| | — |
| | — |
| | 3,316 |
| (b) | 16,994 |
|
| | | | | | | | | | | | |
| First Nine Months 2015 | |
| | |
| | |
| | | | |
| | |
|
| Revenues | $ | 102,723 |
| | $ | 6,584 |
| | $ | — |
| | $ | — |
| | $ | — |
| | $ | 109,307 |
|
| Pre-tax results - income/(loss) | 7,246 |
| | 1,486 |
| | (542 | ) | | 166 |
| | — |
| | 8,356 |
|
| Equity in net income/(loss) of affiliated companies | 1,213 |
| | 24 |
| | — |
| | — |
| | — |
| | 1,237 |
|
| Operating cash flows | 5,199 |
| | 5,329 |
| | — |
| | — |
| | 3,550 |
| (b) | 14,078 |
|
__________
| |
| (a) | Includes eliminations of intersegment transactions occurring in the ordinary course of business and deferred tax netting. |
| |
| (b) | We measure and evaluate our Automotive segment operating cash flow on a different basis than Net cash provided by/(used in) operating activities in our consolidated statement of cash flows. Automotive segment operating cash flow includes additional elements management considers to be related to our Automotive operating activities, primarily capital spending and non-designated derivatives, and excludes outflows for funded pension contributions, separation payments, and other items that are considered operating cash flows under U.S. GAAP. The table below quantifies these reconciling adjustments to Net cash provided by/(used in) operating activities for the periods ended September 30 (in millions): |
|
| | | | | | | | | | | | | | | | |
| | | Third Quarter | | First Nine Months |
| | | 2016 | | 2015 | | 2016 | | 2015 |
| | Automotive capital spending | $ | 1,696 |
| | $ | 1,819 |
| | $ | 4,879 |
| | $ | 5,324 |
|
| | Net cash flows from non-designated derivatives | (246 | ) | | 119 |
| | (322 | ) | | 90 |
|
| | Funded pension contributions | (246 | ) | | (89 | ) | | (835 | ) | | (942 | ) |
| | Separation payments | (40 | ) | | (90 | ) | | (198 | ) | | (600 | ) |
| | Other | (3 | ) | | (258 | ) | | (208 | ) | | (322 | ) |
| | Total operating cash flow adjustments | $ | 1,161 |
| | $ | 1,501 |
| | $ | 3,316 |
| | $ | 3,550 |
|
Item 1. Financial Statements (Continued)
FORD MOTOR COMPANY AND SUBSIDIARIES
NOTES TO THE FINANCIAL STATEMENTS
NOTE 4. FINANCIAL SERVICES SECTOR FINANCE RECEIVABLES
Our Financial Services sector, primarily Ford Credit, manages finance receivables as “consumer” and “non-consumer” portfolios. The receivables are generally secured by the vehicles, inventory, or other property being financed.
Finance receivables, net were as follows (in millions):
|
| | | | | | | |
| | March 31,
2016 | | December 31,
2015 |
| Consumer | | | |
| Retail financing, gross | $ | 63,185 |
| | $ | 62,068 |
|
| Unearned interest supplements | (2,231 | ) | | (2,119 | ) |
| Consumer finance receivables | 60,954 |
| | 59,949 |
|
| Non-Consumer | |
| | |
|
| Dealer financing | 37,791 |
| | 35,529 |
|
| Other financing | 1,034 |
| | 958 |
|
| Non-Consumer finance receivables | 38,825 |
| | 36,487 |
|
| Total recorded investment | $ | 99,779 |
| | $ | 96,436 |
|
| | | | |
| Recorded investment in finance receivables | $ | 99,779 |
| | $ | 96,436 |
|
| Allowance for credit losses | (410 | ) | | (373 | ) |
| Finance receivables, net (a) | $ | 99,369 |
| | $ | 96,063 |
|
| | | | |
| Net finance receivables subject to fair value (b) | $ | 97,379 |
| | $ | 94,248 |
|
| Fair value | 98,771 |
| | 95,420 |
|
__________
| |
(a) | On the consolidated balance sheet at March 31, 2016 and December 31, 2015, $5.1 billion and $5.4 billion, respectively, are reclassified to Other receivables, net, resulting in Finance receivables, net of $94.3 billion and $90.7 billion, respectively.
|
| |
(b) | At March 31, 2016 and December 31, 2015, excludes $2 billion and $1.8 billion, respectively, of certain receivables (primarily direct financing leases) that are not subject to fair value disclosure requirements. The fair value of finance receivables is categorized within Level 3 of the hierarchy.
|
Excluded from finance receivables at March 31, 2016 and December 31, 2015, was $219 million and $209 million, respectively, of accrued uncollected interest, which we report in Other assets on the balance sheet.
Included in the recorded investment in finance receivables at March 31, 2016 and December 31, 2015 were consumer receivables of $30.7 billion and $27.6 billion, respectively, and non-consumer receivables of $26.8 billion and $26.1 billion, respectively, that have been sold for legal purposes in securitization transactions but continue to be reported in our consolidated financial statements. The receivables are available only for payment of the debt issued by, and other obligations of, the securitization entities that are parties to those securitization transactions; they are not available to pay the other obligations or the claims of Ford Credit’s other creditors. Ford Credit holds the right to receive the excess cash flows not needed to pay the debt issued by, and other obligations of, the securitization entities that are parties to those securitization transactions.
Item 1. Financial Statements (Continued)
FORD MOTOR COMPANY AND SUBSIDIARIES
NOTES TO THE FINANCIAL STATEMENTS
NOTE 4. FINANCIAL SERVICES SECTOR FINANCE RECEIVABLES (Continued)
Aging
For all finance receivables, we define “past due” as any payment, including principal and interest, that is at least 31 days past the contractual due date. The recorded investment of consumer receivables greater than 90 days past due and still accruing interest was $16 million at March 31, 2016 and December 31, 2015. The recorded investment of non-consumer receivables greater than 90 days past due and still accruing interest was $1 million at March 31, 2016 and December 31, 2015.
The aging analysis of our finance receivables balances were as follows (in millions):
|
| | | | | | | |
| | March 31,
2016 | | December 31,
2015 |
| Consumer | | | |
| 31-60 days past due | $ | 611 |
| | $ | 708 |
|
| 61-90 days past due | 81 |
| | 108 |
|
| 91-120 days past due | 27 |
| | 27 |
|
| Greater than 120 days past due | 40 |
| | 38 |
|
| Total past due | 759 |
| | 881 |
|
| Current | 60,195 |
| | 59,068 |
|
| Consumer finance receivables | 60,954 |
| | 59,949 |
|
| | | | |
| Non-Consumer | | | |
| Total past due | 104 |
| | 117 |
|
| Current | 38,721 |
| | 36,370 |
|
| Non-Consumer finance receivables | 38,825 |
| | 36,487 |
|
| Total recorded investment | $ | 99,779 |
| | $ | 96,436 |
|
Credit Quality
Consumer Portfolio. Credit quality ratings for consumer receivables are based on aging. Refer to the aging table above.
Consumer receivables credit quality ratings are as follows:
Pass – current to 60 days past due
Special Mention – 61 to 120 days past due and in intensified collection status
Substandard – greater than 120 days past due and for which the uncollectible portion of the receivables has already been charged off, as measured using the fair value of collateral less costs to sell
Non-Consumer Portfolio. Dealers are assigned to one of four groups according to risk ratings as follows:
Group I – strong to superior financial metrics
Group II – fair to favorable financial metrics
Group III – marginal to weak financial metrics
Group IV – poor financial metrics, including dealers classified as uncollectible
Item 1. Financial Statements (Continued)
FORD MOTOR COMPANY AND SUBSIDIARIES
NOTES TO THE FINANCIAL STATEMENTS
NOTE 4. FINANCIAL SERVICES SECTOR FINANCE RECEIVABLES (Continued)
The credit quality analysis of our dealer financing receivables was as follows (in millions):
|
| | | | | | | |
| | March 31,
2016 | | December 31,
2015 |
| Dealer Financing | | | |
| Group I | $ | 28,606 |
| | $ | 26,560 |
|
| Group II | 7,204 |
| | 7,175 |
|
| Group III | 1,853 |
| | 1,683 |
|
| Group IV | 128 |
| | 111 |
|
| Total recorded investment | $ | 37,791 |
| | $ | 35,529 |
|
Impaired Receivables
Impaired consumer receivables include accounts that have been rewritten or modified in reorganization proceedings pursuant to the U.S. Bankruptcy Code that are considered to be troubled debt restructurings (“TDRs”), as well as all accounts greater than 120 days past due. Impaired non-consumer receivables represent accounts with dealers that have weak or poor financial metrics or dealer financing that has been modified in TDRs. The recorded investment of consumer receivables that were impaired at March 31, 2016 and December 31, 2015 was $373 million, or 0.6% of consumer receivables, and $375 million, or 0.6% of consumer receivables, respectively. The recorded investment of non-consumer receivables that were impaired at March 31, 2016 and December 31, 2015 was $149 million, or 0.4% of non-consumer receivables, and $134 million, or 0.4% of non-consumer receivables, respectively. Impaired finance receivables are evaluated both collectively and specifically.
Item 1. Financial Statements (Continued)
FORD MOTOR COMPANY AND SUBSIDIARIES
NOTES TO THE FINANCIAL STATEMENTS
NOTE 5. FINANCIAL SERVICES SECTOR ALLOWANCE FOR CREDIT LOSSES
An analysis of the allowance for credit losses related to finance receivables for the periods ended March 31 was as follows (in millions):
|
| | | | | | | | | | | |
| | First Quarter 2016 |
| | Consumer | | Non-Consumer | | Total |
| Allowance for credit losses | | | | | |
| Beginning balance | $ | 357 |
| | $ | 16 |
| | $ | 373 |
|
| Charge-offs | (102 | ) | | 1 |
| | (101 | ) |
| Recoveries | 29 |
| | 1 |
| | 30 |
|
| Provision for credit losses | 102 |
| | 1 |
| | 103 |
|
| Other (a) | 4 |
| | 1 |
| | 5 |
|
| Ending balance (b) | $ | 390 |
| | $ | 20 |
| | $ | 410 |
|
| | | | | | |
| Analysis of ending balance of allowance for credit losses |
| Collective impairment allowance | $ | 371 |
| | $ | 13 |
| | $ | 384 |
|
| Specific impairment allowance | 19 |
| | 7 |
| | 26 |
|
| Ending balance (b) | 390 |
| | 20 |
| | 410 |
|
| | | | | | |
| Analysis of ending balance of finance receivables | | | | | |
| Collectively evaluated for impairment | 60,581 |
| | 38,676 |
| | 99,257 |
|
| Specifically evaluated for impairment | 373 |
| | 149 |
| | 522 |
|
| Recorded investment | 60,954 |
| | 38,825 |
| | 99,779 |
|
| | | | | | |
| Ending balance, net of allowance for credit losses | $ | 60,564 |
| | $ | 38,805 |
| | $ | 99,369 |
|
__________
| |
(a) | Primarily represents amounts related to translation adjustments. |
| |
(b) | Total allowance, including reserves for operating leases, was $463 million. |
|
| | | | | | | | | | | |
| | First Quarter 2015 |
| | Consumer | | Non-Consumer | | Total |
| Allowance for credit losses | | | | | |
| Beginning balance | $ | 305 |
| | $ | 16 |
| | $ | 321 |
|
| Charge-offs | (80 | ) | | 1 |
| | (79 | ) |
| Recoveries | 30 |
| | 2 |
| | 32 |
|
| Provision for credit losses | 53 |
| | (4 | ) | | 49 |
|
| Other (a) | (7 | ) | | (2 | ) | | (9 | ) |
| Ending balance (b) | $ | 301 |
| | $ | 13 |
| | $ | 314 |
|
| | | | | | |
| Analysis of ending balance of allowance for credit losses |
| Collective impairment allowance | $ | 280 |
| | $ | 12 |
| | $ | 292 |
|
| Specific impairment allowance | 21 |
| | 1 |
| | 22 |
|
| Ending balance (b) | 301 |
| | 13 |
| | 314 |
|
| | | | | | |
| Analysis of ending balance of finance receivables | | | | | |
| Collectively evaluated for impairment | 53,135 |
| | 32,356 |
| | 85,491 |
|
| Specifically evaluated for impairment | 396 |
| | 126 |
| | 522 |
|
| Recorded investment | 53,531 |
| | 32,482 |
| | 86,013 |
|
| | | | | | |
| Ending balance, net of allowance for credit losses | $ | 53,230 |
| | $ | 32,469 |
| | $ | 85,699 |
|
__________
| |
(a) | Primarily represents amounts related to translation adjustments. |
| |
(b) | Total allowance, including reserves for operating leases, was $355 million. |
Item 1. Financial Statements (Continued)
FORD MOTOR COMPANY AND SUBSIDIARIES
NOTES TO THE FINANCIAL STATEMENTS
NOTE 6. INVENTORIES
All inventories are stated at the lower of cost and net realizable value. Cost for a substantial portion of U.S. inventories is determined on a last-in, first-out (“LIFO”) basis. LIFO was used for 31% and 27% of total inventories at March 31, 2016 and December 31, 2015, respectively. Cost of other inventories is determined by costing methods that approximate a first-in, first-out (“FIFO”) basis.
Inventories were as follows (in millions):
|
| | | | | | | |
| | March 31,
2016 | | December 31,
2015 |
| Raw materials, work-in-process, and supplies | $ | 4,356 |
| | $ | 4,005 |
|
| Finished products | 6,367 |
| | 5,254 |
|
| Total inventories under FIFO | 10,723 |
| | 9,259 |
|
| LIFO adjustment | (953 | ) | | (940 | ) |
| Total inventories | $ | 9,770 |
| | $ | 8,319 |
|
NOTE 4. CASH, CASH EQUIVALENTS, AND MARKETABLE SECURITIES
The following tables categorize the fair values of cash, cash equivalents, and marketable securities measured at fair value on a recurring basis on our balance sheet (in millions):
|
| | | | | | | | | | | | | | | | | |
| | | | September 30, 2016 |
| | Fair Value Level | | Automotive | | Financial Services | | All Other | | Consolidated |
| Cash and cash equivalents | | | | | | | | | |
| U.S. government | 1 | | $ | 599 |
| | $ | — |
| | $ | — |
| | $ | 599 |
|
| U.S. government agencies | 2 | | — |
| | 4 |
| | — |
| | 4 |
|
| Non-U.S. government and agencies | 2 | | 551 |
| | 280 |
| | — |
| | 831 |
|
| Corporate debt | 2 | | 60 |
| | 50 |
| | — |
| | 110 |
|
| Total marketable securities classified as cash equivalents | | | 1,210 |
| | 334 |
| | — |
| | 1,544 |
|
| Cash, time deposits, and money market funds | | | 6,445 |
| | 5,341 |
| | 10 |
| | 11,796 |
|
| Total cash and cash equivalents | | | $ | 7,655 |
| | $ | 5,675 |
| | $ | 10 |
| | $ | 13,340 |
|
| | | | | | | | | | |
| Marketable securities | | | | | | | | | |
| U.S. government | 1 | | $ | 3,982 |
| | $ | 1,724 |
| | $ | — |
| | $ | 5,706 |
|
| U.S. government agencies | 2 | | 3,284 |
| | 1,354 |
| | — |
| | 4,638 |
|
| Non-U.S. government and agencies | 2 | | 5,423 |
| | 520 |
| | — |
| | 5,943 |
|
| Corporate debt | 2 | | 3,709 |
| | 540 |
| | — |
| | 4,249 |
|
| Equities | 1 | | 198 |
| | — |
| | — |
| | 198 |
|
| Other marketable securities | 2 | | 49 |
| | 42 |
| | — |
| | 91 |
|
| Total marketable securities | | | $ | 16,645 |
| | $ | 4,180 |
| | $ | — |
| | $ | 20,825 |
|
| | | | | | | | | | |
| | | | December 31, 2015 |
| | Fair Value Level | | Automotive | | Financial Services | | All Other | | Consolidated |
| Cash and cash equivalents | | | | | | | | | |
| U.S. government | 1 | | $ | 115 |
| | $ | — |
| | $ | — |
| | $ | 115 |
|
| U.S. government agencies | 2 | | 22 |
| | — |
| | — |
| | 22 |
|
| Non-U.S. government and agencies | 2 | | 173 |
| | 266 |
| | — |
| | 439 |
|
| Corporate debt | 2 | | 20 |
| | — |
| | — |
| | 20 |
|
| Total marketable securities classified as cash equivalents | | | 330 |
| | 266 |
| | — |
| | 596 |
|
| Cash, time deposits, and money market funds | | | 5,056 |
| | 8,620 |
| | — |
| | 13,676 |
|
| Total cash and cash equivalents | | | $ | 5,386 |
| | $ | 8,886 |
| | $ | — |
| | $ | 14,272 |
|
| | | | | | | | | | |
| Marketable securities | | | | | | | | | |
| U.S. government | 1 | | $ | 1,623 |
| | $ | 298 |
| | $ | — |
| | $ | 1,921 |
|
| U.S. government agencies | 2 | | 5,240 |
| | 1,169 |
| | — |
| | 6,409 |
|
| Non-U.S. government and agencies | 2 | | 7,451 |
| | 832 |
| | — |
| | 8,283 |
|
| Corporate debt | 2 | | 3,279 |
| | 384 |
| | — |
| | 3,663 |
|
| Equities | 1 | | 240 |
| | — |
| | — |
| | 240 |
|
| Other marketable securities | 2 | | 348 |
| | 40 |
| | — |
| | 388 |
|
| Total marketable securities | | | $ | 18,181 |
| | $ | 2,723 |
| | $ | — |
| | $ | 20,904 |
|
Item 1. Financial Statements (Continued)
FORD MOTOR COMPANY AND SUBSIDIARIES
NOTES TO THE FINANCIAL STATEMENTS
NOTE 4. CASH, CASH EQUIVALENTS, AND MARKETABLE SECURITIES (Continued)
The following tables present cash equivalents and marketable securities accounted for as available-for-sale (“AFS”) securities on our balance sheet (in millions):
|
| | | | | | | | | | | | | | | | | | | | | | | |
| | September 30, 2016 |
| | | | | | | | | | Fair Value of Securities with Contractual Maturities: |
| | Amortized Cost | | Gross Unrealized Gains | | Gross Unrealized Losses | | Fair Value | | Less than 1 Year | | 1-5 Years |
| Automotive | | | | | | | | | | | |
| U.S. government | $ | 447 |
| | $ | — |
| | $ | — |
| | $ | 447 |
| | $ | — |
| | $ | 447 |
|
| U.S. government agencies | 100 |
| | — |
| | — |
| | 100 |
| | — |
| | 100 |
|
| Non-U.S. government and agencies | 77 |
| | — |
| | — |
| | 77 |
| | — |
| | 77 |
|
| Corporate debt | 337 |
| | — |
| | — |
| | 337 |
| | 247 |
| | 90 |
|
| Total | $ | 961 |
| | $ | — |
| | $ | — |
| | $ | 961 |
| | $ | 247 |
| | $ | 714 |
|
| | | | | | | | |
| | | | |
| | December 31, 2015 |
| | | | | | | | | | Fair Value of Securities with Contractual Maturities: |
| | Amortized Cost | | Gross Unrealized Gains | | Gross Unrealized Losses | | Fair Value | | Less than 1 Year | | 1-5 Years |
| Automotive | | | | | | | | | | | |
| U.S. government | $ | — |
| | $ | — |
| | $ | — |
| | $ | — |
| | $ | — |
| | $ | — |
|
| U.S. government agencies | — |
| | — |
| | — |
| | — |
| | — |
| | — |
|
| Non-U.S. government and agencies | 82 |
| | — |
| | (12 | ) | | 70 |
| | — |
| | 70 |
|
| Corporate debt | — |
| | — |
| | — |
| | — |
| | — |
| | — |
|
| Total | $ | 82 |
| | $ | — |
| | $ | (12 | ) | | $ | 70 |
| | $ | — |
| | $ | 70 |
|
Sales proceeds for investments classified as AFS and sold prior to maturity were $69 million and $0 for the nine months ended September 30, 2016 and 2015, respectively. Gross realized gains from the sale of AFS securities were $1 million and $0 for the nine months ended September 30, 2016 and 2015, respectively. There were no gross realized losses from the sale of AFS securities for the nine months ended September 30, 2016 and 2015.
We determine other-than-temporary impairments on cash equivalents and marketable securities using a specific identification method. During the nine months ended September 30, 2016 and 2015, we did not recognize any other-than-temporary impairment loss.
Item 1. Financial Statements (Continued)
FORD MOTOR COMPANY AND SUBSIDIARIES
NOTES TO THE FINANCIAL STATEMENTS
NOTE 5. FINANCIAL SERVICES FINANCE RECEIVABLES
Our Financial Services, primarily Ford Credit, manages finance receivables as “consumer” and “non-consumer” portfolios. The receivables are generally secured by the vehicles, inventory, or other property being financed.
Finance receivables, net were as follows (in millions):
|
| | | | | | | |
| | September 30,
2016 | | December 31,
2015 |
| Consumer | | | |
| Retail financing, gross | $ | 67,894 |
| | $ | 62,068 |
|
| Unearned interest supplements | (2,785 | ) | | (2,119 | ) |
| Consumer finance receivables | 65,109 |
| | 59,949 |
|
| Non-Consumer | |
| | |
|
| Dealer financing | 30,533 |
| | 31,115 |
|
| Non-Consumer finance receivables | 30,533 |
| | 31,115 |
|
| Total recorded investment | $ | 95,642 |
| | $ | 91,064 |
|
| | | | |
| Recorded investment in finance receivables | $ | 95,642 |
| | $ | 91,064 |
|
| Allowance for credit losses | (478 | ) | | (373 | ) |
| Finance receivables, net | $ | 95,164 |
| | $ | 90,691 |
|
| | | | |
| Current portion | $ | 45,550 |
| | $ | 45,137 |
|
| Non-current portion | 49,614 |
| | 45,554 |
|
| Finance receivables, net | $ | 95,164 |
| | $ | 90,691 |
|
| | | | |
| Net finance receivables subject to fair value (a) | $ | 93,033 |
| | $ | 88,876 |
|
| Fair value | 94,327 |
| | 90,048 |
|
__________
| |
| (a) | At September 30, 2016 and December 31, 2015, excludes $2.1 billion and $1.8 billion, respectively, of certain receivables (primarily direct financing leases) that are not subject to fair value disclosure requirements. The fair value of finance receivables is categorized within Level 3 of the fair value hierarchy. |
Excluded from finance receivables at September 30, 2016 and December 31, 2015, was $206 million and $209 million, respectively, of accrued uncollected interest, which are reported as Other assets in the current assets section of our consolidated balance sheet.
Included in the recorded investment in finance receivables at September 30, 2016 and December 31, 2015 were consumer receivables of $29.9 billion and $27.6 billion, respectively, and non-consumer receivables of $23.3 billion and $26.1 billion, respectively, that have been sold for legal purposes in securitization transactions but continue to be reported in our consolidated financial statements. The receivables are available only for payment of the debt issued by, and other obligations of, the securitization entities that are parties to those securitization transactions; they are not available to pay the other obligations or the claims of Ford Credit’s other creditors. Ford Credit holds the right to receive the excess cash flows not needed to pay the debt issued by, and other obligations of, the securitization entities that are parties to those securitization transactions.
Item 1. Financial Statements (Continued)
FORD MOTOR COMPANY AND SUBSIDIARIES
NOTES TO THE FINANCIAL STATEMENTS
NOTE 5. FINANCIAL SERVICES FINANCE RECEIVABLES (Continued)
Aging
For all finance receivables, we define “past due” as any payment, including principal and interest, that is at least 31 days past the contractual due date. The recorded investment of consumer receivables greater than 90 days past due and still accruing interest was $24 million and $16 million at September 30, 2016 and December 31, 2015, respectively. The recorded investment of non-consumer receivables greater than 90 days past due and still accruing interest was de minimis and $1 million at September 30, 2016 and December 31, 2015, respectively.
The aging analysis of our finance receivables balances were as follows (in millions):
|
| | | | | | | |
| | September 30,
2016 | | December 31,
2015 |
| Consumer | | | |
| 31-60 days past due | $ | 652 |
| | $ | 708 |
|
| 61-90 days past due | 112 |
| | 108 |
|
| 91-120 days past due | 36 |
| | 27 |
|
| Greater than 120 days past due | 39 |
| | 38 |
|
| Total past due | 839 |
| | 881 |
|
| Current | 64,270 |
| | 59,068 |
|
| Consumer finance receivables | 65,109 |
| | 59,949 |
|
| | | | |
| Non-Consumer | | | |
| Total past due | 71 |
| | 116 |
|
| Current | 30,462 |
| | 30,999 |
|
| Non-Consumer finance receivables | 30,533 |
| | 31,115 |
|
| Total recorded investment | $ | 95,642 |
| | $ | 91,064 |
|
Credit Quality
Consumer Portfolio. Credit quality ratings for consumer receivables are based on aging. Refer to the aging table above.
Consumer receivables credit quality ratings are as follows:
Pass – current to 60 days past due
Special Mention – 61 to 120 days past due and in intensified collection status
Substandard – greater than 120 days past due and for which the uncollectible portion of the receivables has already been charged off, as measured using the fair value of collateral less costs to sell
Non-Consumer Portfolio. Dealers are assigned to one of four groups according to risk ratings as follows:
Group I – strong to superior financial metrics
Group II – fair to favorable financial metrics
Group III – marginal to weak financial metrics
Group IV – poor financial metrics, including dealers classified as uncollectible
Item 1. Financial Statements (Continued)
FORD MOTOR COMPANY AND SUBSIDIARIES
NOTES TO THE FINANCIAL STATEMENTS
NOTE 5. FINANCIAL SERVICES FINANCE RECEIVABLES (Continued)
The credit quality analysis of our dealer financing receivables was as follows (in millions):
|
| | | | | | | |
| | September 30,
2016 | | December 31,
2015 |
| Dealer Financing | | | |
| Group I | $ | 23,162 |
| | $ | 22,146 |
|
| Group II | 5,847 |
| | 7,175 |
|
| Group III | 1,399 |
| | 1,683 |
|
| Group IV | 125 |
| | 111 |
|
| Total recorded investment | $ | 30,533 |
| | $ | 31,115 |
|
Impaired Receivables
Impaired consumer receivables include accounts that have been rewritten or modified in reorganization proceedings pursuant to the U.S. Bankruptcy Code that are considered to be troubled debt restructurings (“TDRs”), as well as all accounts greater than 120 days past due. Impaired non-consumer receivables represent accounts with dealers that have weak or poor financial metrics or dealer financing that has been modified in TDRs. The recorded investment of consumer receivables that were impaired at September 30, 2016 and December 31, 2015 was $366 million, or 0.6% of consumer receivables, and $375 million, or 0.6% of consumer receivables, respectively. The recorded investment of non-consumer receivables that were impaired at September 30, 2016 and December 31, 2015 was $140 million, or 0.5% of non-consumer receivables, and $134 million, or 0.4% of non-consumer receivables, respectively. Impaired finance receivables are evaluated both collectively and specifically.
Item 1. Financial Statements (Continued)
FORD MOTOR COMPANY AND SUBSIDIARIES
NOTES TO THE FINANCIAL STATEMENTS
NOTE 6. FINANCIAL SERVICES ALLOWANCE FOR CREDIT LOSSES
An analysis of the allowance for credit losses related to finance receivables for the periods ended September 30 was as follows (in millions):
|
| | | | | | | | | | | | | | | | | | | | | | | |
| | Third Quarter 2016 | | First Nine Months 2016 |
| | Consumer | | Non-Consumer | | Total | | Consumer | | Non-Consumer | | Total |
| Allowance for credit losses | | | | | | | | | | | |
| Beginning balance | $ | 432 |
| | $ | 17 |
| | $ | 449 |
| | $ | 357 |
| | $ | 16 |
| | $ | 373 |
|
| Charge-offs | (108 | ) | | (5 | ) | | (113 | ) | | (304 | ) | | (7 | ) | | (311 | ) |
| Recoveries | 29 |
| | 1 |
| | 30 |
| | 89 |
| | 4 |
| | 93 |
|
| Provision for credit losses | 112 |
| | 1 |
| | 113 |
| | 323 |
| | 1 |
| | 324 |
|
| Other (a) | (1 | ) | | — |
| | (1 | ) | | (1 | ) | | — |
| | (1 | ) |
| Ending balance (b) | $ | 464 |
| | $ | 14 |
| | $ | 478 |
| | $ | 464 |
| | $ | 14 |
| | $ | 478 |
|
| | | | | | | | | | | | |
| Analysis of ending balance of allowance for credit losses |
| Collective impairment allowance | | | | | | | $ | 445 |
| | $ | 12 |
| | $ | 457 |
|
| Specific impairment allowance | | | | | | | 19 |
| | 2 |
| | 21 |
|
| Ending balance (b) | | | | | | | 464 |
| | 14 |
| | 478 |
|
| | | | | | | | | | | | |
| Analysis of ending balance of finance receivables | | | | | | |
| Collectively evaluated for impairment | | | | | | | 64,743 |
| | 30,393 |
| | 95,136 |
|
| Specifically evaluated for impairment | | | | | | | 366 |
| | 140 |
| | 506 |
|
| Recorded investment | | | | | | | 65,109 |
| | 30,533 |
| | 95,642 |
|
| | | | | | | | | | | | |
| Ending balance, net of allowance for credit losses | | | | $ | 64,645 |
| | $ | 30,519 |
| | $ | 95,164 |
|
__________
| |
| (a) | Primarily represents amounts related to translation adjustments. |
| |
| (b) | Total allowance, including reserves for operating leases, was $541 million. |
|
| | | | | | | | | | | | | | | | | | | | | | | |
| | Third Quarter 2015 | | First Nine Months 2015 |
| | Consumer | | Non-Consumer | | Total | | Consumer | | Non-Consumer | | Total |
| Allowance for credit losses | | | | | | | | | | | |
| Beginning balance | $ | 322 |
| | $ | 13 |
| | $ | 335 |
| | $ | 305 |
| | $ | 16 |
| | $ | 321 |
|
| Charge-offs | (85 | ) | | (2 | ) | | (87 | ) | | (235 | ) | | (3 | ) | | (238 | ) |
| Recoveries | 29 |
| | 1 |
| | 30 |
| | 90 |
| | 4 |
| | 94 |
|
| Provision for credit losses | 80 |
| | 2 |
| | 82 |
| | 190 |
| | (2 | ) | | 188 |
|
| Other (a) | (4 | ) | | — |
| | (4 | ) | | (8 | ) | | (1 | ) | | (9 | ) |
| Ending balance (b) | $ | 342 |
| | $ | 14 |
| | $ | 356 |
| | $ | 342 |
| | $ | 14 |
| | $ | 356 |
|
| | | | | | | | | | | | |
| Analysis of ending balance of allowance for credit losses |
| Collective impairment allowance | | | | | | | $ | 323 |
| | $ | 12 |
| | $ | 335 |
|
| Specific impairment allowance | | | | | | | 19 |
| | 2 |
| | 21 |
|
| Ending balance (b) | | | | | | | 342 |
| | 14 |
| | 356 |
|
| | | | | | | | | | | | |
| Analysis of ending balance of finance receivables | | | | | | |
| Collectively evaluated for impairment | | | | | | | 58,749 |
| | 26,311 |
| | 85,060 |
|
| Specifically evaluated for impairment | | | | | | | 375 |
| | 129 |
| | 504 |
|
| Recorded investment | | | | | | | 59,124 |
| | 26,440 |
| | 85,564 |
|
| | | | | | | | | | | | |
| Ending balance, net of allowance for credit losses | | $ | 58,782 |
| | $ | 26,426 |
| | $ | 85,208 |
|
__________
| |
| (a) | Primarily represents amounts related to translation adjustments. |
| |
| (b) | Total allowance, including reserves for operating leases, was $403 million. |
Item 1. Financial Statements (Continued)
FORD MOTOR COMPANY AND SUBSIDIARIES
NOTES TO THE FINANCIAL STATEMENTS
NOTE 7. INVENTORIES
All inventories are stated at the lower of cost and net realizable value. Cost for a substantial portion of U.S. inventories is determined on a last-in, first-out (“LIFO”) basis. LIFO was used for 32% and 27% of total inventories at September 30, 2016 and December 31, 2015, respectively. Cost of other inventories is determined by costing methods that approximate a first-in, first-out (“FIFO”) basis.
Inventories were as follows (in millions):
|
| | | | | | | |
| | September 30,
2016 | | December 31,
2015 |
| Raw materials, work-in-process, and supplies | $ | 4,335 |
| | $ | 4,005 |
|
| Finished products | 6,823 |
| | 5,254 |
|
| Total inventories under FIFO | 11,158 |
| | 9,259 |
|
| LIFO adjustment | (939 | ) | | (940 | ) |
| Total inventories | $ | 10,219 |
| | $ | 8,319 |
|
NOTE 8. OTHER LIABILITIES AND DEFERRED REVENUE
Other liabilities and deferred revenue were as follows (in millions): | | | | March 31,
2016 | | December 31,
2015 | September 30,
2016 | | December 31,
2015 |
| Automotive Sector | | | | |
| Current | | | | | | |
| Dealer and dealers’ customer allowances and claims | $ | 9,013 |
| | $ | 8,122 |
| $ | 9,050 |
| | $ | 8,122 |
|
| Deferred revenue | 5,020 |
| | 4,559 |
| 4,715 |
| | 4,675 |
|
| Employee benefit plans | 1,526 |
| | 1,528 |
| 1,505 |
| | 1,562 |
|
| Accrued interest | 233 |
| | 255 |
| 761 |
| | 840 |
|
| Other postretirement employee benefits (“OPEB”) | 358 |
| | 354 |
| |
| OPEB | | 357 |
| | 354 |
|
| Pension (a) | 266 |
| | 248 |
| 268 |
| | 249 |
|
| Other | 2,891 |
| | 2,926 |
| 2,875 |
| | 3,287 |
|
| Total Automotive other liabilities and deferred revenue | 19,307 |
| | 17,992 |
| |
| Total current other liabilities and deferred revenue | | $ | 19,531 |
| | $ | 19,089 |
|
| Non-current | |
| | |
| |
| | |
|
| Pension (a) | 9,483 |
| | 9,541 |
| $ | 9,024 |
| | $ | 9,543 |
|
| OPEB | 5,411 |
| | 5,347 |
| 5,362 |
| | 5,347 |
|
| Dealer and dealers’ customer allowances and claims | 2,734 |
| | 2,731 |
| 3,146 |
| | 2,731 |
|
| Deferred revenue | 2,989 |
| | 2,833 |
| 3,639 |
| | 3,285 |
|
| Employee benefit plans | 1,043 |
| | 1,041 |
| 1,112 |
| | 1,041 |
|
| Other | 1,181 |
| | 1,239 |
| 1,369 |
| | 1,510 |
|
| Total Automotive other liabilities and deferred revenue | 22,841 |
| | 22,732 |
| |
| Total Automotive sector | 42,148 |
| | 40,724 |
| |
| Financial Services Sector | 1,801 |
| | 1,822 |
| |
| Total Company | $ | 43,949 |
| | $ | 42,546 |
| |
| Total non-current other liabilities and deferred revenue | | $ | 23,652 |
| | $ | 23,457 |
|
__________
| |
| (a) | Balances at March 31,September 30, 2016 reflect net pension liabilities at December 31, 2015, updated for service and interest cost, expected return on assets, separation expense, actual benefit payments, and cash contributions. The discount rate and rate of expected return assumptions are unchanged from year-end 2015. Included in Other assets are pension assets of $2.3 billion and $1.6 billion at September 30, 2016 and December 31, 2015, respectively. |
Item 1. Financial Statements (Continued)
FORD MOTOR COMPANY AND SUBSIDIARIES
NOTES TO THE FINANCIAL STATEMENTS
NOTE 8. RETIREMENT BENEFITS
Defined Benefit Plans - Expense
The pre-tax expense for our defined benefit pension and OPEB plans for the periods ended March 31 was as follows (in millions): |
| | | | | | | | | | | | | | | | | | | | | | | |
| | First Quarter |
| | Pension Benefits | | | | |
| | U.S. Plans | | Non-U.S. Plans | | Worldwide OPEB |
| | 2016 | | 2015 | | 2016 | | 2015 | | 2016 | | 2015 |
| Service cost | $ | 128 |
| | $ | 147 |
| | $ | 118 |
| | $ | 135 |
| | $ | 12 |
| | $ | 15 |
|
| Interest cost | 381 |
| | 454 |
| | 195 |
| | 239 |
| | 48 |
| | 60 |
|
| Expected return on assets | (673 | ) | | (732 | ) | | (339 | ) | | (375 | ) | | — |
| | — |
|
| Amortization of prior service costs/(credits) | 42 |
| | 39 |
| | 10 |
| | 12 |
| | (35 | ) | | (51 | ) |
| Net remeasurement (gain)/loss | — |
| | — |
| | — |
| | — |
| | — |
| | — |
|
| Separation programs/other | — |
| | 2 |
| | 7 |
| | 7 |
| | — |
| | — |
|
| Settlements and curtailments | — |
| | — |
| | — |
| | — |
| | — |
| | — |
|
| Net periodic benefit cost/(income) | $ | (122 | ) | | $ | (90 | ) | | $ | (9 | ) | | $ | 18 |
| | $ | 25 |
| | $ | 24 |
|
Beginning in 2016, we changed the method used to estimate the service and interest costs for pension and OPEB plans that utilize a yield curve approach. We now apply the specific spot rates along the yield curve to the relevant cash flows instead of using a single effective discount rate. Service and interest costs in the first quarter were about $145 million lower with the new method than they would have been under the prior method.
Pension Plan Contributions
During 2016, we expect to contribute about $1.5 billion from Automotive cash and cash equivalents to our worldwide funded pension plans (including discretionary contributions of about $400 million), and to make about $300 million of benefit payments to participants in unfunded plans, for a total of about $1.8 billion. In the first three months of 2016, we contributed about $400 million to our worldwide funded pension plans and made about $100 million of benefit payments to participants in unfunded plans.
Item 1. Financial Statements (Continued)
FORD MOTOR COMPANY AND SUBSIDIARIES
NOTES TO THE FINANCIAL STATEMENTS
NOTE 9. DEBT
The carrying value of Automotive sector and Financial Services sector debt was as follows (in millions):
|
| | | | | | | |
| Automotive Sector | March 31,
2016 | | December 31,
2015 |
| Debt payable within one year | | | |
| Short-term | $ | 977 |
| | $ | 818 |
|
| Long-term payable within one year | |
| | |
|
| U.S. Department of Energy (“DOE”) Advanced Technology Vehicles Manufacturing (“ATVM”) Incentive Program | 591 |
| | 591 |
|
| Other debt | 373 |
| | 370 |
|
| Total debt payable within one year | 1,941 |
| | 1,779 |
|
| Long-term debt payable after one year | |
| | |
|
| Public unsecured debt securities | 6,594 |
| | 6,594 |
|
| DOE ATVM Incentive Program | 3,095 |
| | 3,242 |
|
| Other debt | 1,868 |
| | 1,696 |
|
| Adjustments | | | |
| Unamortized (discount)/premium | (417 | ) | | (412 | ) |
| Unamortized issuance costs | (59 | ) | | (60 | ) |
| Total long-term debt payable after one year | 11,081 |
| | 11,060 |
|
| Total Automotive sector | $ | 13,022 |
| | $ | 12,839 |
|
| | | | |
| Fair value of Automotive sector debt (a) | $ | 14,669 |
| | $ | 14,199 |
|
| | | | |
| Financial Services Sector | |
| | |
|
| Short-term debt | |
| | |
|
| Unsecured debt | $ | 10,850 |
| | $ | 10,268 |
|
| Asset-backed debt | 1,064 |
| | 1,855 |
|
| Total short-term debt | 11,914 |
| | 12,123 |
|
| Long-term debt | |
| | |
|
| Unsecured debt | |
| | |
|
| Notes payable within one year | 13,655 |
| | 10,241 |
|
| Notes payable after one year | 52,756 |
| | 49,193 |
|
| Asset-backed debt | |
| | |
|
| Notes payable within one year | 20,231 |
| | 18,855 |
|
| Notes payable after one year | 28,638 |
| | 29,390 |
|
| Adjustments | | | |
| Unamortized (discount)/premium | (27 | ) | | (29 | ) |
| Unamortized issuance costs | (240 | ) | | (216 | ) |
| Fair value adjustments (b) | 1,046 |
| | 458 |
|
| Total long-term debt | 116,059 |
| | 107,892 |
|
| Total Financial Services sector | $ | 127,973 |
| | $ | 120,015 |
|
| | | | |
| Fair value of Financial Services sector debt (a) | $ | 129,429 |
| | $ | 121,170 |
|
__________
| |
(a) | The fair value of debt includes $676 million and $560 million of Automotive sector short-term debt and $10.8 billion and $10.3 billion of Financial Services sector short-term debt at March 31, 2016 and December 31, 2015, respectively, carried at cost, which approximates fair value. All other debt is categorized within Level 2 of the fair value hierarchy.
|
| |
(b) | Adjustments related to designated fair value hedges of unsecured debt. |
Item 1. Financial Statements (Continued)
FORD MOTOR COMPANY AND SUBSIDIARIES
NOTES TO THE FINANCIAL STATEMENTS
NOTE 9. RETIREMENT BENEFITS
Defined Benefit Plans - Expense
The pre-tax expense for our defined benefit pension and OPEB plans for the periods ended September 30 was as follows (in millions): |
| | | | | | | | | | | | | | | | | | | | | | | |
| | Third Quarter |
| | Pension Benefits | | | | |
| | U.S. Plans | | Non-U.S. Plans | | Worldwide OPEB |
| | 2016 | | 2015 | | 2016 | | 2015 | | 2016 | | 2015 |
| Service cost | $ | 128 |
| | $ | 147 |
| | $ | 116 |
| | $ | 133 |
| | $ | 13 |
| | $ | 15 |
|
| Interest cost | 381 |
| | 454 |
| | 190 |
| | 236 |
| | 49 |
| | 59 |
|
| Expected return on assets | (673 | ) | | (732 | ) | | (329 | ) | | (372 | ) | | — |
| | — |
|
| Amortization of prior service costs/(credits) | 43 |
| | 38 |
| | 9 |
| | 13 |
| | (35 | ) | | (51 | ) |
| Net remeasurement (gain)/loss | — |
| | — |
| | — |
| | — |
| | — |
| | — |
|
| Separation programs/other | 6 |
| | 4 |
| | 16 |
| | 11 |
| | (1 | ) | | — |
|
| Net periodic benefit cost/(income) | $ | (115 | ) | | $ | (89 | ) | | $ | 2 |
| | $ | 21 |
| | $ | 26 |
| | $ | 23 |
|
|
| | | | | | | | | | | | | | | | | | | | | | | |
| | First Nine Months |
| | Pension Benefits | | | | |
| | U.S. Plans | | Non-U.S. Plans | | Worldwide OPEB |
| | 2016 | | 2015 | | 2016 | | 2015 | | 2016 | | 2015 |
| Service cost | $ | 383 |
| | $ | 440 |
| | $ | 358 |
| | $ | 401 |
| | $ | 37 |
| | $ | 45 |
|
| Interest cost | 1,143 |
| | 1,363 |
| | 587 |
| | 707 |
| | 146 |
| | 178 |
|
| Expected return on assets | (2,020 | ) | | (2,196 | ) | | (1,018 | ) | | (1,116 | ) | | — |
| | — |
|
| Amortization of prior service costs/(credits) | 128 |
| | 116 |
| | 28 |
| | 36 |
| | (106 | ) | | (154 | ) |
| Net remeasurement (gain)/loss | — |
| | — |
| | 11 |
| | — |
| | — |
| | — |
|
| Separation programs/other | 9 |
| | 6 |
| | 88 |
| | 30 |
| | (1 | ) | | 1 |
|
| Net periodic benefit cost/(income) | $ | (357 | ) | | $ | (271 | ) | | $ | 54 |
| | $ | 58 |
| | $ | 76 |
| | $ | 70 |
|
Beginning in 2016, we changed the method used to estimate the service and interest costs for pension and OPEB plans that utilize a yield curve approach. We now apply the specific spot rates along the yield curve to the relevant cash flows instead of using a single effective discount rate. Service and interest costs in the third quarter and first nine months were about $145 million lower and about $435 million lower, respectively, with the new method than they would have been under the prior method.
Pension Plan Contributions
During 2016, we expect to contribute about $1.2 billion from cash and cash equivalents to our worldwide funded pension plans (including discretionary contributions of about $100 million), down about $300 million from our previous plan due to recalendarization of contributions into 2017, and to make about $300 million of benefit payments to participants in unfunded plans, for a total of about $1.5 billion. In the first nine months of 2016, we contributed about $800 million to our worldwide funded pension plans and made about $200 million of benefit payments to participants in unfunded plans.
Item 1. Financial Statements (Continued)
FORD MOTOR COMPANY AND SUBSIDIARIES
NOTES TO THE FINANCIAL STATEMENTS
NOTE 10. DEBT
The carrying value of Automotive and Financial Services debt was as follows (in millions):
|
| | | | | | | |
| Automotive | September 30,
2016 | | December 31,
2015 |
| Debt payable within one year | | | |
| Short-term | $ | 1,169 |
| | $ | 818 |
|
| Long-term payable within one year | |
| | |
|
| U.S. Department of Energy (“DOE”) Advanced Technology Vehicles Manufacturing (“ATVM”) Incentive Program | 591 |
| | 591 |
|
| Other debt | 765 |
| | 370 |
|
| Unamortized (discount)/premium | (53 | ) | | — |
|
| Total debt payable within one year | 2,472 |
| | 1,779 |
|
| Long-term debt payable after one year | |
| | |
|
| Public unsecured debt securities | 6,594 |
| | 6,594 |
|
| DOE ATVM Incentive Program | 2,799 |
| | 3,242 |
|
| Other debt | 1,678 |
| | 1,696 |
|
| Adjustments | | | |
| Unamortized (discount)/premium | (338 | ) | | (412 | ) |
| Unamortized issuance costs | (58 | ) | | (60 | ) |
| Total long-term debt payable after one year | 10,675 |
| | 11,060 |
|
| Total Automotive | $ | 13,147 |
| | $ | 12,839 |
|
| | | | |
| Fair value of Automotive debt (a) | $ | 15,158 |
| | $ | 14,199 |
|
| | | | |
| Financial Services | |
| | |
|
| Debt payable within one year | |
| | |
|
| Short-term | $ | 12,953 |
| | $ | 12,123 |
|
| Long-term payable within one year | |
| | |
|
| Unsecured debt | 12,586 |
| | 10,241 |
|
| Asset-backed debt | 19,263 |
| | 18,855 |
|
| Adjustments | | | |
| Unamortized (discount)/premium | (4 | ) | | (5 | ) |
| Unamortized issuance costs | (20 | ) | | (18 | ) |
| Fair value adjustments (b) | 23 |
| | — |
|
| Total debt payable within one year | 44,801 |
| | 41,196 |
|
| Long-term debt payable after one year | | | |
| Unsecured debt | 53,985 |
| | 49,193 |
|
| Asset-backed debt | 24,477 |
| | 29,390 |
|
| Adjustments | | | |
| Unamortized (discount)/premium | (5 | ) | | (24 | ) |
| Unamortized issuance costs | (213 | ) | | (198 | ) |
| Fair value adjustments (b) | 1,032 |
| | 458 |
|
| Total long-term debt payable after one year | 79,276 |
| | 78,819 |
|
| Total Financial Services | $ | 124,077 |
| | $ | 120,015 |
|
| | | | |
| Fair value of Financial Services debt (a) | $ | 126,175 |
| | $ | 121,170 |
|
__________
| |
| (a) | The fair value of debt includes $941 million and $560 million of Automotive short-term debt and $12.5 billion and $10.3 billion of Financial Services short-term debt at September 30, 2016 and December 31, 2015, respectively, carried at cost, which approximates fair value. All other debt is categorized within Level 2 of the fair value hierarchy. |
| |
| (b) | Adjustments related to designated fair value hedges of unsecured debt. |
Item 1. Financial Statements (Continued)
FORD MOTOR COMPANY AND SUBSIDIARIES
NOTES TO THE FINANCIAL STATEMENTS
NOTE 11. DERIVATIVE FINANCIAL INSTRUMENTS AND HEDGING ACTIVITIES
In the normal course of business, our operations are exposed to global market risks, including the effect of changes in foreign currency exchange rates, certain commodity prices, and interest rates. To manage these risks, we enter into highly effective derivative contracts. We have elected to apply hedge accounting to certain derivatives. Derivatives that are designated in hedging relationships are evaluated for effectiveness using regression analysis at the time they are designated and throughout the hedge period. Some derivatives do not qualify for hedge accounting; for others, we elect not to apply hedge accounting.
Income Effect of Derivative Financial Instruments
The gains/(losses), by hedge designation, recorded in income for the periods ended March 31September 30 were as follows (in millions):
| | | | First Quarter | Third Quarter | | First Nine Months |
| | 2016 | | 2015 | 2016 | | 2015 | | 2016 | | 2015 |
| Automotive Sector | | | | |
| Cash flow hedges (a) | | | | | | | | | | |
| Reclassified from AOCI to net income | $ | 87 |
| | $ | (46 | ) | $ | 202 |
| | $ | (60 | ) | | $ | 335 |
| | $ | (196 | ) |
| Derivatives not designated as hedging instruments | | | | |
| Foreign currency exchange contracts | (172 | ) | | 261 |
| |
| Commodity contracts | (5 | ) | | (10 | ) | |
| Total | $ | (90 | ) | | $ | 205 |
| |
| | | | | |
| Financial Services Sector | | | | |
| Fair value hedges | | | | | | | | | | |
| Interest rate contracts | | | | | | | | | | |
| Net interest settlements and accruals excluded from the assessment of hedge effectiveness | $ | 99 |
| | $ | 88 |
| 95 |
| | 94 |
| | 292 |
| | 271 |
|
| Ineffectiveness (b) | 17 |
| | 6 |
| (1 | ) | | 10 |
| | 21 |
| | 6 |
|
| Derivatives not designated as hedging instruments | | | | | | | | | | |
| Interest rate contracts | (48 | ) | | (43 | ) | |
| Foreign currency exchange contracts | 33 |
| | 65 |
| 29 |
| | 65 |
| | 61 |
| | 210 |
|
| Cross-currency interest rate swap contracts | 195 |
| | 89 |
| 128 |
| | 63 |
| | 463 |
| | 75 |
|
| Interest rate contracts | | 21 |
| | (22 | ) | | (70 | ) | | (83 | ) |
| Commodity contracts | | 3 |
| | (22 | ) | | 7 |
| | (47 | ) |
| Total | $ | 296 |
| | $ | 205 |
| $ | 477 |
| | $ | 128 |
| | $ | 1,109 |
| | $ | 236 |
|
__________
| |
| (a) | For the third quarter and first quarternine months of 2016 and 2015,, a $363$340 million gain and a $150$887 million loss,gain, respectively, were recorded in Other comprehensive income. For the third quarter and first nine months of 2015, a $453 million gain and a $86 million gain, respectively, were recorded in Other comprehensive income. |
| |
| (b) | For the third quarter and first quarternine months of 2016, and 2015, hedge ineffectiveness reflects the net change in fair value on derivatives of $610228 million gainloss and $221$655 million gain, respectively, and a change in value on hedged debt attributable to the change in benchmark interest rates of $593$227 million gain and $634 million loss, respectively. For the third quarter and first nine months of 2015, hedge ineffectiveness reflects the net change in fair value on derivatives of $373 million gain and $345 million gain, respectively, and a change in value on hedged debt attributable to the change in benchmark interest rates of $363 million loss and $215$339 million loss, respectively. |
Item 1. Financial Statements (Continued)
FORD MOTOR COMPANY AND SUBSIDIARIES
NOTES TO THE FINANCIAL STATEMENTS
NOTE 10.11. DERIVATIVE FINANCIAL INSTRUMENTS AND HEDGING ACTIVITIES (Continued)
Balance Sheet Effect of Derivative Financial Instruments
Derivative assets and liabilities are recorded on the balance sheet at fair value and are presented on a gross basis. The notional amounts of the derivative instruments do not necessarily represent amounts exchanged by the parties and are not a direct measure of our financial exposure. We also enter into master agreements with counterparties that may allow for netting of exposures in the event of default or breach of the counterparty agreement.
The fair value of our derivative instruments and the associated notional amounts, presented gross, were as follows (in millions):
| | | | March 31, 2016 | | December 31, 2015 | September 30, 2016 | | December 31, 2015 |
| | Notional | | Fair Value of Assets | | Fair Value of Liabilities | | Notional | | Fair Value of Assets | | Fair Value of Liabilities | Notional | | Fair Value of Assets | | Fair Value of Liabilities | | Notional | | Fair Value of Assets | | Fair Value of Liabilities |
| Automotive Sector | | | | | | | | | | | | |
| Cash flow hedges | | | | | | | | | | | | | | | | | | | | | | |
| Foreign currency exchange and commodity contracts | $ | 16,076 |
| | $ | 666 |
| | $ | 235 |
| | $ | 12,593 |
| | $ | 522 |
| | $ | 366 |
| $ | 16,775 |
| | $ | 818 |
| | $ | 136 |
| | $ | 12,593 |
| | $ | 522 |
| | $ | 366 |
|
| | | | | | | | | | | | | |
| Fair value hedges | | |
| | |
| | |
| | | | | | |
| Interest rate contracts | | 36,215 |
| | 1,217 |
| | — |
| | 28,964 |
| | 670 |
| | 16 |
|
| Derivatives not designated as hedging instruments | Derivatives not designated as hedging instruments | | | | | | | | | | | Derivatives not designated as hedging instruments | | | | | | | | | | |
| Foreign currency exchange contracts | 18,152 |
| | 280 |
| | 331 |
| | 19,395 |
| | 404 |
| | 238 |
| 17,267 |
| | 352 |
| | 129 |
| | 21,108 |
| | 426 |
| | 242 |
|
| Cross-currency interest rate swap contracts | | 3,765 |
| | 383 |
| | — |
| | 3,137 |
| | 73 |
| | 111 |
|
| Interest rate contracts | | 61,650 |
| | 142 |
| | 122 |
| | 62,638 |
| | 159 |
| | 112 |
|
| Commodity contracts | 643 |
| | 4 |
| | 17 |
| | 643 |
| | 2 |
| | 26 |
| 525 |
| | 10 |
| | 4 |
| | 643 |
| | 2 |
| | 26 |
|
| Total derivative financial instruments, gross (a) | $ | 34,871 |
| | 950 |
| | 583 |
| | $ | 32,631 |
| | 928 |
| | 630 |
| |
| Counterparty netting and collateral (b) |
|
| | (552 | ) | | (552 | ) | |
|
| | (567 | ) | | (567 | ) | |
| Total derivative financial instruments, net | | $ | 398 |
| | $ | 31 |
| |
|
| | $ | 361 |
| | $ | 63 |
| |
| Total derivative financial instruments, gross (a) (b) | | $ | 136,197 |
| | $ | 2,922 |
| | $ | 391 |
| | $ | 129,083 |
| | $ | 1,852 |
| | $ | 873 |
|
| | | | | | | | | | | | | | | | | | | | | | | |
| Financial Services Sector | |
| | |
| | |
| | | | | | | |
| Fair value hedges | |
| | |
| | |
| | | | | | | |
| Interest rate contracts | $ | 32,843 |
| | $ | 1,184 |
| | $ | — |
| | $ | 28,964 |
| | $ | 670 |
| | $ | 16 |
| |
| | | | | | | | | | | | | |
| Derivatives not designated as hedging instruments | | | | | | | | | | | |
| Interest rate contracts | 65,538 |
| | 182 |
| | 159 |
| | 62,638 |
| | 159 |
| | 112 |
| |
| Foreign currency exchange contracts | 2,138 |
| | 49 |
| | 8 |
| | 1,713 |
| | 22 |
| | 4 |
| |
| Cross-currency interest rate swap contracts | 3,701 |
| | 195 |
| | 37 |
| | 3,137 |
| | 73 |
| | 111 |
| |
| Total derivative financial instruments, gross (a) | $ | 104,220 |
| | 1,610 |
| | 204 |
| | $ | 96,452 |
| | 924 |
| | 243 |
| |
| Counterparty netting and collateral (b) | | | (155 | ) | | (155 | ) | | | | (166 | ) | | (166 | ) | |
| Total derivative financial instruments, net | | $ | 1,455 |
| | $ | 49 |
|
|
|
| | $ | 758 |
| | $ | 77 |
| |
| Current portion | | | | $ | 1,395 |
| | $ | 297 |
| | | | $ | 1,209 |
| | $ | 692 |
|
| Non-current portion | | | | 1,527 |
| | 94 |
| | | | 643 |
| | 181 |
|
| Total derivative financial instruments, gross | | | | $ | 2,922 |
| | $ | 391 |
| | | | $ | 1,852 |
| | $ | 873 |
|
__________
| |
| (a) | At September 30, 2016 and December 31, 2015, the net obligation to return cash collateral was $13 million and $0, respectively. |
| |
| (b) | At September 30, 2016 and December 31, 2015, the fair value of assets and liabilities available for counterparty netting was $347 million and $733 million, respectively. All derivatives are categorized within Level 2 of the fair value hierarchy. |
| |
(b) | At March 31, 2016 and December 31, 2015, we did not receive or pledge any cash collateral. |
Item 1. Financial Statements (Continued)
FORD MOTOR COMPANY AND SUBSIDIARIES
NOTES TO THE FINANCIAL STATEMENTS
NOTE 11.12. ACCUMULATED OTHER COMPREHENSIVE INCOME/(LOSS)
The changes in the balances for each component of accumulated other comprehensive income/(loss) attributable to Ford Motor Company for the periods ended March 31September 30 were as follows (in millions):
| | | | First Quarter | Third Quarter | | First Nine Months |
| | 2016 | | 2015 | 2016 | | 2015 | | 2016 | | 2015 |
| Foreign currency translation | | | | | | | | | | |
| Beginning balance | $ | (3,570 | ) | | $ | (2,438 | ) | $ | (3,691 | ) | | $ | (2,371 | ) | | $ | (3,570 | ) | | $ | (2,438 | ) |
| Gains/(Losses) on foreign currency translation | (30 | ) | | 103 |
| (183 | ) | | (883 | ) | | (271 | ) | | (816 | ) |
| Less: Tax/(Tax benefit) | — |
| | — |
| — |
| | — |
| | — |
| | — |
|
| Net gains/(losses) on foreign currency translation | (30 | ) | | 103 |
| (183 | ) | | (883 | ) | | (271 | ) | | (816 | ) |
| (Gains)/Losses reclassified from AOCI to net income (a) | (33 | ) | | — |
| — |
| | — |
| | (33 | ) | | — |
|
| Other comprehensive income/(loss), net of tax | (63 | ) | | 103 |
| (183 | ) | | (883 | ) | | (304 | ) | | (816 | ) |
| Ending balance | $ | (3,633 | ) | | $ | (2,335 | ) | $ | (3,874 | ) | | $ | (3,254 | ) | | $ | (3,874 | ) | | $ | (3,254 | ) |
| | | | | | | | | | | |
| Marketable securities | | | | | | | | | | |
| Beginning balance | $ | (6 | ) | | $ | — |
| $ | — |
| | $ | — |
| | $ | (6 | ) | | $ | — |
|
| Gains/(Losses) on available for sale securities | 11 |
| | — |
| — |
| | — |
| | 11 |
| | — |
|
| Less: Tax/(Tax benefit) | — |
| | — |
| — |
| | — |
| | — |
| | — |
|
| Net gains/(losses) on available for sale securities | 11 |
| | — |
| — |
| | — |
| | 11 |
| | — |
|
| (Gains)/Losses reclassified from AOCI to net income | (1 | ) | | — |
| — |
| | — |
| | (1 | ) | | — |
|
| Less: Tax/(Tax benefit) | 4 |
| | — |
| — |
| | — |
| | 4 |
| | — |
|
| Net (gains)/losses reclassified from AOCI to net income | (5 | ) | | — |
| — |
| | — |
| | (5 | ) | | — |
|
| Other comprehensive income/(loss), net of tax | 6 |
| | — |
| — |
| | — |
| | 6 |
| | — |
|
| Ending balance | $ | — |
| | $ | — |
| $ | — |
| | $ | — |
| | $ | — |
| | $ | — |
|
| | | | | | | | | | | |
| Derivative instruments | | | | | | | | | | |
| Beginning balance | $ | 64 |
| | $ | (163 | ) | $ | 421 |
| | $ | (329 | ) | | $ | 64 |
| | $ | (163 | ) |
| Gains/(Losses) on derivative instruments | 363 |
| | (150 | ) | 340 |
| | 453 |
| | 887 |
| | 86 |
|
| Less: Tax/(Tax benefit) | 59 |
| | (32 | ) | 87 |
| | 196 |
| | 181 |
| | 86 |
|
| Net gains/(losses) on derivative instruments | 304 |
| | (118 | ) | 253 |
| | 257 |
| | 706 |
| | — |
|
| (Gains)/Losses reclassified from AOCI to net income | (87 | ) | | 46 |
| (202 | ) | | 60 |
| | (335 | ) | | 196 |
|
| Less: Tax/(Tax benefit) | (29 | ) | | 18 |
| (48 | ) | | (57 | ) | | (85 | ) | | (12 | ) |
| Net (gains)/losses reclassified from AOCI to net income (b) | (58 | ) | | 28 |
| (154 | ) | | 117 |
| | (250 | ) | | 208 |
|
| Other comprehensive income/(loss), net of tax | 246 |
| | (90 | ) | 99 |
| | 374 |
| | 456 |
| | 208 |
|
| Ending balance | $ | 310 |
| | $ | (253 | ) | $ | 520 |
| | $ | 45 |
| | $ | 520 |
| | $ | 45 |
|
| | | | | | | | | | | |
| Pension and other postretirement benefits | | | | | | | | | | |
| Beginning balance | $ | (2,745 | ) | | $ | (2,664 | ) | $ | (2,706 | ) | | $ | (2,796 | ) | | $ | (2,745 | ) | | $ | (2,664 | ) |
| Amortization and recognition of prior service costs/(credits) (c) | 17 |
| | — |
| 17 |
| | — |
| | 50 |
| | (2 | ) |
| Less: Tax/(Tax benefit) | 3 |
| | 79 |
| 7 |
| | (86 | ) | | 17 |
| | (9 | ) |
| Net prior service costs/(credits) reclassified from AOCI to net income | 14 |
| | (79 | ) | 10 |
| | 86 |
| | 33 |
| | 7 |
|
| Translation impact on non-U.S. plans | 8 |
| | (69 | ) | 4 |
| | 47 |
| | 20 |
| | (6 | ) |
| Other comprehensive income/(loss), net of tax | 22 |
| | (148 | ) | 14 |
| | 133 |
| | 53 |
| | 1 |
|
| Ending balance | $ | (2,723 | ) | | $ | (2,812 | ) | $ | (2,692 | ) | | $ | (2,663 | ) | | $ | (2,692 | ) | | $ | (2,663 | ) |
| | | | | | | | | | | |
| Total AOCI ending balance at March 31 | $ | (6,046 | ) | | $ | (5,400 | ) | |
| Total AOCI ending balance at September 30 | | $ | (6,046 | ) | | $ | (5,872 | ) | | $ | (6,046 | ) | | $ | (5,872 | ) |
__________
| |
| (a) | Reclassified to AutomotiveNon-Financial Services interest income and other income/(loss), net. |
| |
| (b) | Reclassified to Automotive costCost of sales. During the next twelve months we expect to reclassify existing net gains on cash flow hedges of $363548 million. See Note 1011 for additional information. |
| |
| (c) | Amortization and recognition of prior service costs/(credits) is included in the computation of net periodic pension cost. See Note 89 for additional information. |
Item 1. Financial Statements (Continued)
FORD MOTOR COMPANY AND SUBSIDIARIES
NOTES TO THE FINANCIAL STATEMENTS
NOTE 12.13. OTHER INCOME/(LOSS)
Automotive SectorNon-Financial Services
The amounts included in AutomotiveNon-Financial Services interest income and other income/(loss), net for the periods ended March 31September 30 were as follows (in millions):
| | | | First Quarter | Third Quarter | | First Nine Months |
| | 2016 | | 2015 | 2016 | | 2015 | | 2016 | | 2015 |
| Investment-related interest income | $ | 61 |
| | $ | 45 |
| $ | 50 |
| | $ | 60 |
| | $ | 163 |
| | $ | 161 |
|
| Interest income/(expense) on income taxes | (2 | ) | | (9 | ) | 9 |
| | — |
| | 8 |
| | 1 |
|
| Realized and unrealized gains/(losses) on cash equivalents and marketable securities | 72 |
| | (27 | ) | (13 | ) | | 189 |
| | 52 |
| | 146 |
|
| Gains/(Losses) on changes in investments in affiliates | | (1 | ) | | — |
| | 180 |
| | 18 |
|
| Royalty income | 183 |
| | 142 |
| 174 |
| | 149 |
| | 494 |
| | 448 |
|
| Other | 90 |
| | 39 |
| 109 |
| | 48 |
| | 224 |
| | 134 |
|
| Total | $ | 404 |
| | $ | 190 |
| $ | 328 |
| | $ | 446 |
| | $ | 1,121 |
| | $ | 908 |
|
Financial Services Sector
The amounts included in Financial Services other income/(loss), net for the periods ended March 31September 30 were as follows (in millions):
| | | | First Quarter | Third Quarter | | First Nine Months |
| | 2016 | | 2015 | 2016 | | 2015 | | 2016 | | 2015 |
| Investment-related interest income | $ | 19 |
| | $ | 19 |
| $ | 18 |
| | $ | 19 |
| | $ | 57 |
| | $ | 58 |
|
| Interest income/(expense) on income taxes | (2 | ) | | (3 | ) | (2 | ) | | (3 | ) | | 11 |
| | (9 | ) |
| Insurance premiums earned | 39 |
| | 31 |
| 38 |
| | 32 |
| | 118 |
| | 97 |
|
| Other | 35 |
| | 27 |
| 78 |
| | 49 |
| | 119 |
| | 95 |
|
| Total | $ | 91 |
| | $ | 74 |
| $ | 132 |
| | $ | 97 |
| | $ | 305 |
| | $ | 241 |
|
NOTE 13.14. INCOME TAXES
For interim tax reporting, we estimate one single effective tax rate for tax jurisdictions not subject to a valuation allowance, which is applied to the year-to-date ordinary income/(loss). Tax effects of significant unusual or infrequently occurring items are excluded from the estimated annual effective tax rate calculation and recognized in the interim period in which they occur.
NOTE 14. CAPITAL STOCK AND EARNINGS PER SHARE
Earnings Per Share Attributable to Ford Motor Company Common and Class B Stock
Basic and diluted income per share were calculated using the following (in millions):
|
| | | | | | | |
| | First Quarter |
| | 2016 | | 2015 |
| Basic and Diluted Income Attributable to Ford Motor Company | | | |
| Basic income | $ | 2,452 |
| | $ | 1,153 |
|
| Diluted income | 2,452 |
| | 1,153 |
|
| | | | |
| Basic and Diluted Shares | |
| | |
|
| Basic shares (average shares outstanding) | 3,970 |
| | 3,963 |
|
| Net dilutive options and unvested restricted stock units | 26 |
| | 38 |
|
| Diluted shares | 3,996 |
| | 4,001 |
|
Item 1. Financial Statements (Continued)
FORD MOTOR COMPANY AND SUBSIDIARIES
NOTES TO THE FINANCIAL STATEMENTS
NOTE 15. SEGMENT INFORMATIONCAPITAL STOCK AND EARNINGS PER SHARE
Our operating activity consists of two operating sectors, AutomotiveEarnings Per Share Attributable to Ford Motor Company Common and Financial Services. Our Automotive sector includes the sale of Ford and Lincoln brand vehicles and related service parts and accessories. The Financial Services sector primarily includes our vehicle-related financing and leasing activities at Ford Credit.Class B Stock
Key operating data for our business segments forBasic and diluted income per share were calculated using the periods ended or at March 31 were as followsfollowing (in millions):
|
| | | | | | | | | | | | | | | | | | | | | | | | | | | | | | | |
| | Automotive Sector |
| | Operating Segments | Reconciling Items | | |
|
| | North America | | South America | |
Europe | | Middle East & Africa | | Asia Pacific | | Other Automotive | | Special Items | | Total |
| First Quarter 2016 | |
| | |
| | |
| | | | |
| | |
| | |
| | |
|
| Revenues | $ | 23,888 |
| | $ | 841 |
| | $ | 6,888 |
| | $ | 961 |
| | $ | 2,679 |
| | $ | — |
| | $ | — |
| | $ | 35,257 |
|
| Income/(Loss) before income taxes | 3,080 |
| | (256 | ) | | 434 |
| | (14 | ) | | 220 |
| | (126 | ) | | (186 | ) | | 3,152 |
|
| Total assets at March 31 | 64,960 |
| | 4,703 |
| | 15,906 |
| | 1,389 |
| | 9,305 |
| | — |
| | — |
| | 96,263 |
|
| | | | | | | | | | | | | | | | |
| First Quarter 2015 | |
| | |
| | |
| | | | |
| | |
| | |
| | |
|
| Revenues | $ | 20,040 |
| | $ | 1,513 |
| | $ | 6,918 |
| | $ | 1,057 |
| | $ | 2,272 |
| | $ | — |
| | $ | — |
| | $ | 31,800 |
|
| Income/(Loss) before income taxes | 1,569 |
| | (189 | ) | | (42 | ) | | 79 |
| | 105 |
| | (212 | ) | | — |
| | 1,310 |
|
| Total assets at March 31 | 59,842 |
| | 4,922 |
| | 14,961 |
| | 1,209 |
| | 9,119 |
| | — |
| | — |
| | 90,053 |
|
|
| | | | | | | | | | | | | | | |
| | Third Quarter | | First Nine Months |
| | 2016 | | 2015 | | 2016 | | 2015 |
| Basic and Diluted Income Attributable to Ford Motor Company | | | | | | | |
| Basic income | $ | 957 |
| | $ | 2,192 |
| | $ | 5,379 |
| | $ | 5,505 |
|
| Diluted income | 957 |
| | 2,192 |
| | 5,379 |
| | 5,505 |
|
| | | | | | | | |
| Basic and Diluted Shares | |
| | |
| | | | |
| Basic shares (average shares outstanding) | 3,974 |
| | 3,969 |
| | 3,972 |
| | 3,968 |
|
| Net dilutive options and unvested restricted stock units | 26 |
| | 30 |
| | 25 |
| | 34 |
|
| Diluted shares | 4,000 |
| | 3,999 |
| | 3,997 |
| | 4,002 |
|
Item 1. Financial Statements (Continued)
FORD MOTOR COMPANY AND SUBSIDIARIES
NOTES TO THE FINANCIAL STATEMENTS
|
| | | | | | | | | | | | | | | | | | | | | | | |
| | Financial Services Sector | | Total Company |
| | Operating Segment | | Reconciling Items | | | | | | |
| | Ford Credit | | Other | | Elims | | Total | | Elims (a) | | Total |
| First Quarter 2016 | | | | | | | | | | | |
|
| Revenues | $ | 2,506 |
| | $ | — |
| | $ | (45 | ) | | $ | 2,461 |
| | $ | — |
| | $ | 37,718 |
|
| Income/(Loss) before income taxes | 514 |
| | (14 | ) | | (1 | ) | | 499 |
| | — |
| | 3,651 |
|
| Total assets at March 31 | 146,174 |
| | — |
| | (254 | ) | | 145,920 |
| | (4,895 | ) | | 237,288 |
|
| | | | | | | | | | | | |
| First Quarter 2015 | |
| | |
| | |
| | |
| | |
| | |
|
| Revenues | $ | 2,197 |
| | $ | — |
| | $ | (97 | ) | | $ | 2,100 |
| | $ | — |
| | $ | 33,900 |
|
| Income/(Loss) before income taxes | 483 |
| | (14 | ) | | — |
| | 469 |
| | — |
| | 1,779 |
|
| Total assets at March 31 | 126,375 |
| | 2 |
| | (1,195 | ) | | 125,182 |
| | (2,786 | ) | | 212,449 |
|
__________
| |
(a) | Includes intersector transactions occurring in the ordinary course of business and deferred tax netting. |
NOTE 16. COMMITMENTS AND CONTINGENCIES
Commitments and contingencies primarily consist of guarantees and indemnifications, litigation and claims, and warranty.
Guarantees and Indemnifications
Guarantees and indemnifications are recorded at fair value at their inception. We regularly review our performance risk under these arrangements, and in the event it becomes probable we will be required to perform under guarantee or indemnity, the amount of probable payment is recorded.
We guarantee debt and lease obligations of certain joint ventures, as well as certain financial obligations of outside third parties, including suppliers, to support our business and economic growth. Expiration dates vary through 2033, and guarantees will terminate on payment and/or cancellation of the underlying obligation. A payment by us would be triggered by failure of the joint venture or other third party to fulfill its obligation covered by the guarantee. In some circumstances, we are entitled to recover from a third party amounts paid by us under the guarantee. However, our ability to enforce these rights is sometimes stayed until the guaranteed party is paid in full, and may be limited in the event of insolvency of the third party or other circumstances.
Item 1. Financial Statements (Continued)
FORD MOTOR COMPANY AND SUBSIDIARIES
NOTES TO THE FINANCIAL STATEMENTS
NOTE 16. COMMITMENTS AND CONTINGENCIES (Continued)
In the ordinary course of business, we execute contracts involving indemnifications standard in the industry and indemnifications specific to a transaction, such as the sale of a business. These indemnifications might include and are not limited to claims relating to any of the following: environmental, tax, and shareholder matters; intellectual property rights; power generation contracts; governmental regulations and employment-related matters; dealer, supplier, and other commercial contractual relationships; and financial matters, such as securitizations. Performance under these indemnities generally would be triggered by a breach of terms of the contract or by a third-party claim. While some of these indemnifications are limited in nature, many of them do not limit potential payment. Therefore, we are unable to estimate a maximum amount of future payments that could result from claims made under these unlimited indemnities.
The maximum potential payments and the carrying value of recorded liabilities related to guarantees and limited indemnities were as follows (in millions):
| | | | March 31,
2016 | | December 31,
2015 | September 30,
2016 | | December 31,
2015 |
| Maximum potential payments | $ | 240 |
| | $ | 284 |
| $ | 227 |
| | $ | 284 |
|
| Carrying value of recorded liabilities related to guarantees and limited indemnities | 23 |
| | 23 |
| 23 |
| | 23 |
|
Litigation and Claims
Various legal actions, proceedings, and claims (generally, “matters”) are pending or may be instituted or asserted against us. These include but are not limited to matters arising out of alleged defects in our products; product warranties; governmental regulations relating to safety, emissions, and fuel economy or other matters; government incentives; tax matters; alleged illegal acts resulting in fines or penalties; financial services; employment-related matters; dealer, supplier, and other contractual relationships; intellectual property rights; environmental matters; shareholder or investor matters; and financial reporting matters. Certain of the pending legal actions are, or purport to be, class actions. Some of the matters involve or may involve claims for compensatory, punitive, or antitrust or other treble damages in very large amounts, or demands for field service actions, environmental remediation programs, sanctions, loss of government incentives, assessments, or other relief, which, if granted, would require very large expenditures.
The extent of our financial exposure to these matters is difficult to estimate. Many matters do not specify a dollar amount for damages, and many others specify only a jurisdictional minimum. To the extent an amount is asserted, our historical experience suggests that in most instances the amount asserted is not a reliable indicator of the ultimate outcome.
We accrue for matters when losses are deemed probable and reasonably estimable. In evaluating matters for accrual and disclosure purposes, we take into consideration factors such as our historical experience with matters of a similar nature, the specific facts and circumstances asserted, the likelihood that we will prevail, and the severity of any potential loss. We reevaluate and update our accruals as matters progress over time.
Item 1. Financial Statements (Continued)
FORD MOTOR COMPANY AND SUBSIDIARIES
NOTES TO THE FINANCIAL STATEMENTS
NOTE 16. COMMITMENTS AND CONTINGENCIES (Continued)
For the majority of matters, which generally arise out of alleged defects in our products, we establish an accrual based on our extensive historical experience with similar matters. We do not believe there is a reasonably possible outcome materially in excess of our accrual for these matters.
For the remaining matters, where our historical experience with similar matters is of more limited value (i.e., “non-pattern matters”), we evaluate the matters primarily based on the individual facts and circumstances. For non-pattern matters, we evaluate whether there is a reasonable possibility of a material loss in excess of any accrual that can be estimated. Our estimate of reasonably possible loss in excess of our accruals for all material matters currently reflects indirect tax and customs matters, for which we estimate the aggregate risk to be a range of up to about $2.42.8 billion.
As noted, the litigation process is subject to many uncertainties, and the outcome of individual matters is not predictable with assurance. Our assessments are based on our knowledge and experience, but the ultimate outcome of any matter could require payment substantially in excess of the amount that we have accrued and/or disclosed.
Item 1. Financial Statements (Continued)
FORD MOTOR COMPANY AND SUBSIDIARIES
NOTES TO THE FINANCIAL STATEMENTS
NOTE 16. COMMITMENTS AND CONTINGENCIES (Continued)
Warranty and Field Service Actions
We accrue obligations for warranty costs and field service actions (i.e., safety recalls, emission recalls, and other product campaigns) at the time of sale using a patterned estimation model that includes historical information regarding the nature, frequency, and average cost of claims for each vehicle line by model year. Warranty and field service action obligations are reported in Other liabilities and deferred revenue. We reevaluate the adequacy of our accruals on a regular basis.
We recognize the benefit from a recovery of the costs associated with our warranty and field service actions when specifics of the recovery have been agreed with our supplier and the amount of the recovery is virtually certain. Recoveries are reported in ReceivablesTrade and other receivables and Other assets.
The estimate of our future warranty and field service action costs, net of supplier recoveries, for the periods ended March 31September 30 were as follows (in millions):
| | | | First Quarter | First Nine Months |
| | 2016 | | 2015 | 2016 | | 2015 |
| Beginning balance | $ | 4,558 |
| | $ | 4,785 |
| $ | 4,558 |
| | $ | 4,785 |
|
| Payments made during the period | (797 | ) | | (576 | ) | (2,464 | ) | | (2,036 | ) |
| Changes in accrual related to warranties issued during the period | 612 |
| | 463 |
| 1,704 |
| | 1,523 |
|
| Changes in accrual related to pre-existing warranties | 59 |
| | 173 |
| 1,088 |
| | 495 |
|
| Foreign currency translation and other | 52 |
| | (145 | ) | 42 |
| | (192 | ) |
| Ending balance | $ | 4,484 |
| | $ | 4,700 |
| $ | 4,928 |
| | $ | 4,575 |
|
Revisions to our estimated costs are reported as Changes in accrual related to pre-existing warranties in the table above.
Report of Independent Registered Public Accounting Firm
To the Board of Directors and Stockholders of
Ford Motor Company:
We have reviewed the accompanying consolidated balance sheet of Ford Motor Company and its subsidiaries as of March 31,September 30, 2016, and the related consolidated statements of income and comprehensive income for the three-month and nine-month periods ended March 31,September 30, 2016 and 2015 and the condensed consolidated statement of cash flows and the consolidated statement of equity for the three-monthnine-month periods ended March 31,September 30, 2016 and 2015. These interim financial statements are the responsibility of the Company’s management.
The accompanying sector balance sheets and the related sector statements of income and of cash flows are presented for purposes of additional analysis and are not a required part of the basic financial statements. Such information has been subjected to the review procedures applied in the review of the basic financial statements.
We conducted our review in accordance with the standards of the Public Company Accounting Oversight Board (United States). A review of interim financial information consists principally of applying analytical procedures and making inquiries of persons responsible for financial and accounting matters. It is substantially less in scope than an audit conducted in accordance with the standards of the Public Company Accounting Oversight Board (United States), the objective of which is the expression of an opinion regarding the financial statements taken as a whole. Accordingly, we do not express such an opinion.
Based on our review, we are not aware of any material modifications that should be made to the accompanying consolidated interim financial statements for them to be in conformity with accounting principles generally accepted in the United States of America.
We previously audited, in accordance with the standards of the Public Company Accounting Oversight Board (United States), the consolidated balance sheet as of December 31, 2015, and the related consolidated statements of income, comprehensive income, equity, and cash flows for the year then ended (not presented herein), and in our report dated February 11, 2016 (which included an explanatory paragraph with respect to the Company’s change in the manner in which it accounts for defined benefit pension and other postretirement employee benefit plans), we expressed an unqualified opinion on those consolidated financial statements. In our opinion, the information set forthAs discussed in Note 1 to the accompanying consolidated balance sheet asinterim financial statements, the Company changed its presentation of December 31, 2015, is fairly stated in all material respects in relation to the consolidated balance sheet from which it has been derived.to classify assets and liabilities as current or non-current. The accompanying December 31, 2015 consolidated balance sheet reflects this change.
/s/ PricewaterhouseCoopers LLP
PricewaterhouseCoopers LLP
Detroit, Michigan
April 28,October 27, 2016
ITEM 2. Management’s Discussion and Analysis of Financial Condition and Results of Operations.
RESULTS OF OPERATIONSOVERVIEW
Our first quarter 2016 pre-tax resultscore business includes designing, manufacturing, marketing, and net income wereservicing a full line of Ford cars, trucks, and SUVs, as follows:
|
| | | | | | | | | | | |
| | First Quarter | | |
| | 2016 | | Better/(Worse) 2015 | | Memo: Full Year 2015 |
| | (Mils.) | | (Mils.) | | (Mils.) |
| Pre-tax results | | | | | |
| Automotive sector pre-tax results (excl. special items) | $ | 3,338 |
| | $ | 2,028 |
| | $ | 8,772 |
|
| Financial Services sector pre-tax results | 499 |
| | 30 |
| | 2,028 |
|
| Total Company pre-tax results (excl. special items) | 3,837 |
| | 2,058 |
| | 10,800 |
|
| Special items - Automotive sector | (186 | ) | | (186 | ) | | (548 | ) |
| Total Company pre-tax results (incl. special items) | 3,651 |
| | 1,872 |
| | 10,252 |
|
| (Provision for)/Benefit from income taxes | (1,196 | ) | | (571 | ) | | (2,881 | ) |
| Net income | 2,455 |
|
| 1,301 |
| | 7,371 |
|
| Less: Income/(Loss) attributable to noncontrolling interests | 3 |
| | 2 |
| | (2 | ) |
| Net income attributable to Ford | $ | 2,452 |
| | $ | 1,299 |
| | $ | 7,373 |
|
Discussion of Automotive sector, Financial Services sector,well as Lincoln luxury vehicles. To expand our business model, we are aggressively pursuing emerging opportunities with investments in electrification, autonomy, and Company results of operations below is on a pre-tax basis and excludes special items unless otherwise specifically noted.
mobility. We provide financial services through Ford Credit.
In conjunction with our expanded business model to become an automotive, financial services, and mobility company, beginning with the firstsecond quarter of 2016, we changed our reportable segments. Prior-period amounts have been adjusted retrospectively to reflect the Company’s pre-tax profit of $3.8 billion was a record for any quarter.
As detailed inreportable segment change. See Note 153 of the Notes to the Financial Statements we allocate special items to a separate reconciling item, as opposed to allocating them among the Automotive sector operating segments and Other Automotive, reflecting the fact that management excludes these items from its review of operating segment results for purposes of measuring segment profitability and allocating resources among the segments.additional information.
Non-GAAP Financial Measures That Supplement GAAP Measures
We groupuse both generally accepted accounting principles (“GAAP”) and non-GAAP financial measures for operational and financial decision making, and to assess Company and segment business performance. The non-GAAP measures listed below are intended to be considered by users as supplemental information to their equivalent GAAP measures, to aid investors in better understanding our financial results. We believe that these non-GAAP measures provide useful perspective on underlying business results and trends, and a means to assess our period-over-period results. These non-GAAP measures should not be considered as a substitute for, or superior to measures of financial performance prepared in accordance with GAAP. These non-GAAP measures may not be the same as similarly titled measures used by other companies due to possible differences in method and in items or events being adjusted.
Total Company Adjusted Pre-tax Profit (Most Comparable GAAP Measure: Net Income Attributable to Ford) – The non-GAAP measure is useful to management and investors because it allows users to evaluate our pre-tax results excluding pre-tax special items. Pre-tax special items into three categories to provide useful information to investors about the natureconsist of the special items: “Pension and OPEB Remeasurements,” “Personnel and Dealer-Related Items,” and “Other Items.” The first category includes(i) pension and OPEBother postretirement employee benefits (“OPEB”) remeasurement gains and losses. These gains and losses generally recognized in the fourth quarter,that are not reflective of our underlying Automotive business results. The second category includes itemsresults, (ii) significant restructuring actions related to our efforts to match production capacity and cost structure to market demand and changing model mix, and therefore helps investors track amounts related to those activities. The third category includes(iii) other items that we do not generallynecessarily consider to be indicative of ourearnings from ongoing operating activities, and therefore allows investors analyzing our pre-tax results to identify certain infrequent significant items that they may wish to exclude when considering the trend of ongoing operating results.activities.
Item 2. Management’s Discussion and AnalysisAdjusted Earnings Per Share (Most Comparable GAAP Measure: Earnings Per Share) – Measure of Financial Condition and Results of Operations (Continued)
The following table details Automotive sector pre-tax special items in each categoryCompany’s diluted net earnings per share adjusted for the first quarter of 2016 and full year 2015:
|
| | | | | | | |
| | First quarter | | Memo: Full Year 2015 |
| | 2016 | |
| | (Mils.) | | (Mils.) |
| Pension and OPEB Remeasurements | $ | — |
| | $ | (698 | ) |
| Personnel and Dealer-Related Items | | | |
| Separation-related actions | (174 | ) | | — |
|
| Other Items | |
| | |
| Japan and Indonesia Market Closure | (12 | ) | | — |
|
| Nemak IPO | — |
| | 150 |
|
| Total Other Items | (12 | ) | | 150 |
|
| Total Special Items | $ | (186 | ) | | $ | (548 | ) |
| | | | |
| Tax Special Items | $ | (66 | ) | | $ | 205 |
|
We had no special items for the first quarter 2015.
The tax special items above consist of the tax effectsimpact of pre-tax special items (described above), and tax special items. The measure provides investors with useful information to evaluate performance of our business excluding items not indicative of the underlying run rate of our business.
Adjusted Effective Tax Rate (Most Comparable GAAP Measure: Effective Tax Rate) – Measure of Company’s tax rate excluding pre-tax special items (described above) and tax special items. The measure provides an ongoing effective rate which investors find useful for historical comparisons and for forecasting.
Ford Credit Managed Receivables (Most Comparable GAAP Measure: Net Finance Receivables plus Net Investment in Operating Leases) – Measure of Ford Credit’s total net receivables, excluding unearned interest supplements and residual support, allowance for credit losses, and other (primarily accumulated supplemental depreciation). The measure is useful to management and investors as it closely approximates the customer’s outstanding balance on the receivables, which is the basis for earning revenue.
Ford Credit Managed Leverage (Most Comparable GAAP Measure: Financial Statement Leverage) – Ford Credit’s debt-to-equity ratio adjusted (i) to exclude cash, cash equivalents, and marketable securities (other than amounts related to insurance activities), and (ii) for derivative accounting. The measure is useful to investors because it reflects the way Ford Credit manages its business. Cash, cash equivalents, and marketable securities are deducted because they generally correspond to excess debt beyond the amount required to support operations and on-balance sheet securitization transactions. Derivative accounting adjustments are made to asset, debt, and equity positions to reflect the impact of restructuring on deferred tax balances.
The following table details our earnings per share on a diluted basis:
|
| | | | | | | | | | | | | | | |
| | First Quarter 2016 | | Memo: Full Year 2015 |
| | Net Income Attributable to Ford | | After-Tax Operating Results Excluding Special Items | | Net Income Attributable to Ford | | After-Tax Operating Results Excluding Special Items |
| | | | |
| After-Tax Results (Mils.) | | | | | | | |
| Diluted after-tax results | $ | 2,452 |
| | $ | 2,704 |
| | $ | 7,373 |
| | $ | 7,716 |
|
| Basic and Diluted Shares (Mils.) | | | | | | | |
| Basic shares (averages shares outstanding) | 3,970 |
| | 3,970 |
| | 3,969 |
| | 3,969 |
|
| Net dilutive options and contingently issuable shares | 26 |
| | 26 |
| | 33 |
| | 33 |
|
| Diluted shares | 3,996 |
| | 3,996 |
| | 4,002 |
| | 4,002 |
|
| | | | | | | | |
| Diluted Earnings Per Share | $ | 0.61 |
| | $ | 0.68 |
| | $ | 1.84 |
| | $ | 1.93 |
|
References to Automotive records for operating-related cash flow, operating margin,interest rate instruments used with Ford Credit’s term-debt issuances and business unitssecuritization transactions. Ford Credit generally repays its debt obligations as they mature, so the interim effects of changes in market interest rates are since at least 2000.
Item 2. Management’s Discussion and Analysisexcluded in the calculation of Financial Condition and Results of Operations (Continued)managed leverage.
Results by Segment. The chart below shows our first quarter 2016 Company pre-tax results by Automotive business unit, along with Other Automotive which is mainly net interest expense, and ourSee “GAAP Reconciliations to Non-GAAP Financial Services sector.
Automotive results were driven by North America’s quarterly record of $3.1 billionMeasures” section in pre-tax profit, as well as Europe’s best quarterly profit since 2008, and continued strong performance in Asia Pacific. In total, our automotive operations outside of North America delivered a profit of almost $400 million, which was more than $400 million higher than a year ago.
Financial Services pre-tax profit of $499 million reflects continued strong performance at Ford Credit.
Compared with the first quarter of 2015, the Company’s pre-tax profit in the first quarter of 2016 improved by 116%, driven by sharply higher automotive results.this Item 2.
Item 2. Management’s Discussion and Analysis of Financial Condition and Results of Operations (Continued)
RESULTS OF OPERATIONS
Total Company
Net income attributable to Ford. The chart below shows our third quarter 2016 net income attributable to Ford.
Net income attributable to Ford in the third quarter of 2016 was $957 million or $0.24 earnings per share of Common and Class B Stock, a decrease of $1.2 billion or $0.31 per share from the third quarter of 2015. Third quarter 2016 pre-tax results of our Automotive segment, Financial Services segment, All Other, Special Items, and Taxes are discussed in the following sections in “Results of Operations.”
Revenue. Company revenue in the third quarter of 2016 was $35.9 billion, $2.2 billion lower than a year ago.
Equity. At September 30, 2016, total equity attributable to Ford was $31.5 billion, an increase of $2.9 billion compared with December 31, 2015. The detail for this change is shown below (in billions):
|
| | | |
| | Higher/(Lower) |
| Net income | $ | 5.4 |
|
| Dividends | (2.8 | ) |
| Other comprehensive income | 0.2 |
|
| Compensation-related equity issuances | 0.2 |
|
| Treasury stock share repurchases | (0.1 | ) |
| Total | $ | 2.9 |
|
Item 2. Management’s Discussion and Analysis of Financial Condition and Results of Operations (Continued)
The chart below shows our third quarter 2016 total Company adjusted pre-tax results and pre-tax results of our Automotive segment by regional business unit, our Financial Services segment, and All Other, which is mainly net interest expense.
Our total Company adjusted pre-tax profit was $1.4 billion in the third quarter of 2016, higher than our guidance of about $1 billion. This reflects favorable calendarization of marketing accruals in the United States and cost performance, all of which will be offset in the fourth quarter of 2016. Automotive results were driven by North America, Europe, and a record third quarter pre-tax profit in Asia Pacific.
Financial Services pre-tax profit of $552 million included strong performance at Ford Credit, which earned a pre-tax profit of $567 million.
As shown below the chart, our Automotive segment results were $1.7 billion lower than a year ago while our Financial Services segment improved slightly compared to 2015.
Item 2. Management’s Discussion and Analysis of Financial Condition and Results of Operations (Continued)
AUTOMOTIVE SECTOR
Definitions and calculations used in this report include:
Wholesales and Revenue – wholesale unit volumes include all Ford and Lincoln badged units (whether produced by Ford or by an unconsolidated affiliate) that are sold to dealerships, units manufactured by Ford that are sold to other manufacturers, units distributed by Ford for other manufacturers, and local brand units produced by our China joint venture, Jiangling Motors Corporation, Ltd. (“JMC”), that are sold to dealerships. Vehicles sold to daily rental car companies that are subject to a guaranteed repurchase option (i.e., rental repurchase), as well as other sales of finished vehicles for which the recognition of revenue is deferred (e.g., consignments), also are included in wholesale unit volumes. Revenue from certain vehicles in wholesale unit volumes (specifically, Ford badged vehicles produced and distributed by our unconsolidated affiliates, as well as JMC brand vehicles) are not included in our revenue
Automotive Operating Margin – defined as Automotive pre-tax results, excluding special items and Other Automotive, divided by Automotive revenue
Industry Volume and Market Share – based, in part, on estimated vehicle registrations; includes medium and heavy duty trucks
SAAR – seasonally adjusted annual rate
Automotive Cash – includes cash, cash equivalents, and marketable securities
SEGMENT
In general, we measure year-over-year change in Automotive segment pre-tax operating profit for our total Automotive sector and reportable segmentsresults using the causal factors listed below, with net pricing and cost variances calculated at present-year volume and mix and exchange:
| |
◦ | Volume and Mix – primarily measures profit variance from changes in wholesale volumes (at prior-year average contribution margin per unit) driven by changes in industry volume, market share, and dealer stocks, as well as the profit variance resulting from changes in product mix, including mix among vehicle lines and mix of trim levels and options within a vehicle line |
| |
◦ | Net Pricing -– primarily measures profit variance driven by changes in wholesale prices to dealers and marketing incentive programs such as rebate programs, low-rate financing offers, and special lease offers, and stock adjustments on dealer inventory |
Contribution Costs – primarily measures profit variance driven by per-unit changes in cost categories that typically vary with volume, such as material costs (including commodity and component costs), warranty expense, and freight and duty costs
Structural Costs – primarily measures profit variance driven by absolute change in cost categories that typically do not have a directly proportionate relationship to production volume. Structural costs include the following cost categories:
| |
| ◦ | Manufacturing, Including Volume Related – consists primarily of costs for hourly and salaried manufacturing personnel, plant overhead (such as utilities and taxes), and new product launch expense. These costs could be affected by volume for operating pattern actions such as overtime, line-speed, and shift schedules |
| |
| ◦ | Engineering – consists primarily of costs for engineering personnel, prototype materials, testing, and outside engineering services |
| |
| ◦ | Spending-Related – consists primarily of depreciation and amortization of our manufacturing and engineering assets, but also includes asset retirements and operating leases |
| |
| ◦ | Advertising and Sales Promotions – includes costs for advertising, marketing programs, brand promotions, customer mailings and promotional events, and auto shows |
| |
| ◦ | Administrative and Selling – includes primarily costs for salaried personnel and purchased services related to our staff activities and selling functions, as well as associated information technology costs |
| |
| ◦ | Pension and OPEB – consists primarily of past service pension costs and other postretirement employee benefit costs |
Item 2. Management’s Discussion and Analysis of Financial Condition and Results of Operations (Continued)
Exchange – primarily measures profit variance driven by one or more of the following: (i) transactions denominated in currencies other than the functional currencies of the relevant entities, (ii) effects of converting functional currency income to U.S. dollars, (iii) effects of remeasuring monetary assets and liabilities of the relevant entities in currencies other than their functional currency, or (iv) results of our foreign currency hedging
Net InterestOther –includes a variety of items, such as parts and Otherservices profits, royalties, government incentives and compensation-related changes
| |
◦
In addition, definitions and calculations used in this report include:
Wholesales and Revenue – wholesale unit volumes include all Ford and Lincoln badged units (whether produced by Ford or by an unconsolidated affiliate) that are sold to dealerships, units manufactured by Ford that are sold to other manufacturers, units distributed by Ford for other manufacturers, and local brand units produced by our China joint venture, Jiangling Motors Corporation, Ltd. (“JMC”), that are sold to dealerships. Vehicles sold to daily rental car companies that are subject to a guaranteed repurchase option (i.e., rental repurchase), as well as other sales of finished vehicles for which the recognition of revenue is deferred (e.g., consignments), also are included in wholesale unit volumes. Revenue from certain vehicles in wholesale unit volumes (specifically, Ford badged vehicles produced and distributed by our unconsolidated affiliates, as well as JMC brand vehicles) are not included in our revenue
Automotive Segment Operating Margin – defined as Automotive segment pre-tax profit divided by Automotive segment revenue
Industry Volume and Market Share – based, in part, on estimated vehicle registrations; includes medium and heavy duty trucks Item 2. Management’s Discussion and Analysis of Financial Condition and Results of Operations (Continued)
SAAR – seasonally adjusted annual rate
Automotive Cash – includes cash, cash equivalents, and marketable securities | Net Interest – primarily measures profit variance driven by changes in our Automotive sector’s centrally-managed net interest, which consists of interest expense, interest income, fair market value adjustments on our cash equivalents and marketable securities portfolio (excluding strategic equity investments held in marketable securities), and other adjustments
|
| |
◦
| Other – items not included in the causal factors defined above
|
The charts on the following pages detail firstthird quarter 2016 key metrics and the change in firstthird quarter 2016 pre-tax results compared with the firstthird quarter of 2015 by causal factor for our Automotive sector and its segments.segment by business unit.

The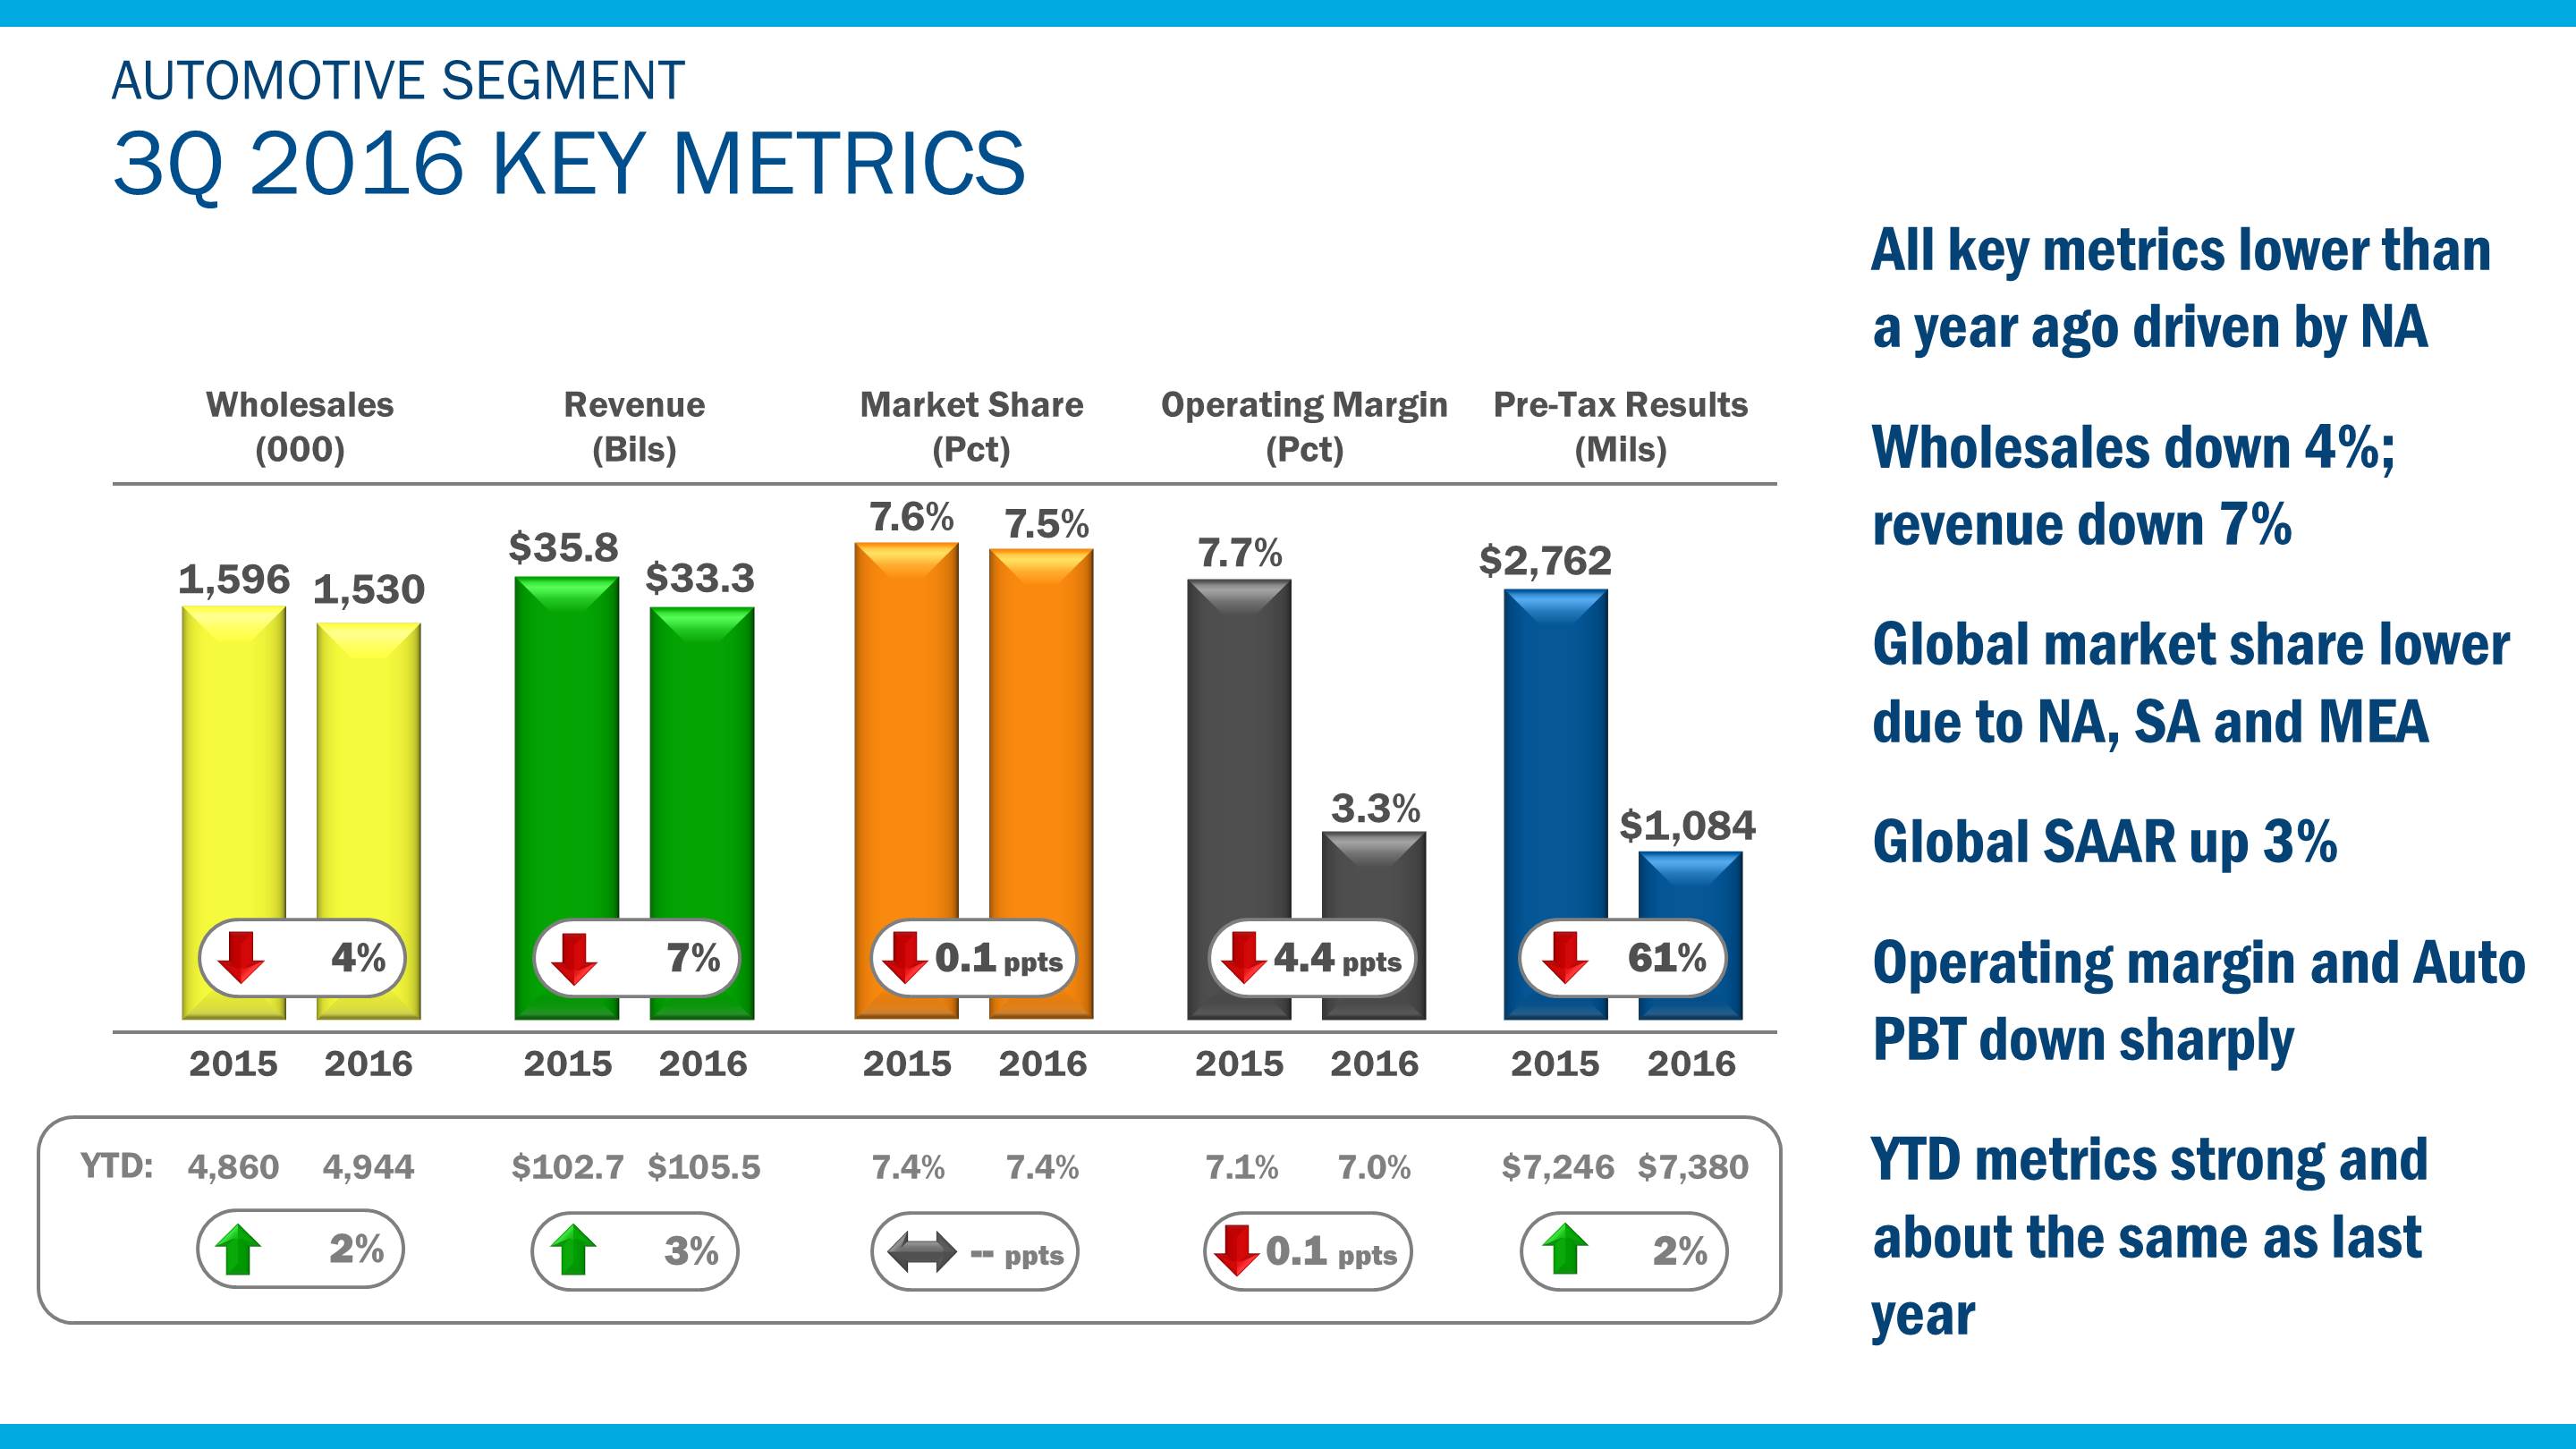
Shown above are the key market factors and financial metrics for our Automotive businesssegment in the firstthird quarter of 2016, are shown above. All metricswhich all declined from a year ago, consistent with expectations. The changes were strongdriven by North America. Wholesale volumes were down 4%, more than explained by reductions in dealer stocks this year in North America and improved compared withEurope versus increases a year ago. Automotive revenue was down 7% due to the first quarter of 2015. We grew the top line, with wholesale volumes up 10% and automotive revenue up 11%, or 15% at constant exchange.lower volume.
Our global market share, at 7.1% improved two-tenths7.5%, was down one-tenth of a percentage point compared to a year ago driven by gainslower market shares in North America, South America, and Middle East & Africa. Market share was flat in Europe and higher in Asia Pacific.
Global industry SAAR in the quarter was estimated atto be 90.1 million units, was up 2.6an increase of 2.9 million units or 3% compared with a year ago; the first quarter of 2015.increase was driven by Asia Pacific and Europe.
Our Automotive operating margin and pre-tax profit, at 9.8%3.3% and $3.3$1.1 billion, respectively, were both recordssignificantly lower than a year ago.
As shown below the chart, the Automotive key metrics in the first nine months of 2016 were strong, about the same as last year.
Item 2. Management’s Discussion and Analysis of Financial Condition and Results of Operations (Continued)
Shown above are the factors that contributed to the $1.7 billion decline in third quarter Automotive segment pre-tax profit. The lower profit is explained by lower volume, mainly the unfavorable changes in dealer stocks in North America and Europe, as well as higher warranty costs related to a recall. Net pricing was favorable, mainly in North America.
Cost of sales and Selling, administrative, and other expenses for the third quarter of 2016 and 2015 was $33 billion and $33.6 billion, respectively, a decrease of $600 million. Cost of sales and Selling, administrative, and other expenses for the first nine months of 2016 and 2015 was $100.8 billion and $97.4 billion, respectively, an increase of $3.4 billion. The detail for the third quarter and first nine months of 2016 change is shown below (in billions):
|
| | | | | | | |
| | 2016 Lower/(Higher) 2015 |
| | Third Quarter | | First Nine Months |
| Volume and mix, exchange, and other | $ | 1.8 |
| | $ | (2.5 | ) |
| Contribution costs | | | |
|
| Material excluding commodities | (0.3 | ) | | 0.2 |
|
| Commodities | 0.1 |
| | 1.0 |
|
| Warranty | (0.6 | ) | | (0.8 | ) |
| Other | 0.1 |
| | 0.3 |
|
| Structural costs | (0.5 | ) | | (1.3 | ) |
| Special items | — |
| | (0.3 | ) |
| Total | $ | 0.6 |
| | $ | (3.4 | ) |
Item 2. Management’s Discussion and Analysis of Financial Condition and Results of Operations (Continued)
Shown above are the third quarter 2016 key metrics for the North America business unit, which were lower in the quarter compared to a year ago.
The top line declined with wholesale volume down 11% and revenue down 8% from a year ago. Lower wholesales were driven by dealer stock reductions this year compared to an increase last year for F-150 following the Kansas City Assembly Plant launch, the launch effect of the all-new Super Duty, and aligning car production with demand.
Our North America market share was down five-tenths of a percentage point, with our U.S. share down by seven-tenths of a percentage point to 14%. The decrease was driven by lower retail sales of cars and utilities, as well as lower fleet sales, mainly rental. F-Series retail share was flat from a year ago. North America SAAR, at 21.8 million units, was down 200,000 units; U.S. SAAR, at 17.8 million units, was down 500,000 units.
Operating margin was 5.8%, down sharply from last year, and pre-tax profit was $1.3 billion, down $1.6 billion.
As shown below the chart, North America’s key metrics in the first nine months of 2016 were strong, though mixed from a year ago.
Item 2. Management’s Discussion and Analysis of Financial Condition and Results of Operations (Continued)
As shown above, our third quarter 2016 pre-tax profit was $1.6 billion lower than a year ago, driven by the launch impact of our all-new Super Duty, the dealer stock reduction of F-150 versus the increase a year ago and normalization of series mix for F-150, and the previously announced door latch recall.
Net pricing was favorable for the first time in 2016. Average U.S. retail transaction prices were $1,300 per vehicle higher compared to a year ago, almost double the industry average increase.
Item 2. Management’s Discussion and Analysis of Financial Condition and Results of Operations (Continued)
In South America, our results were negatively impacted by the difficult external conditions, including high inflation and unfavorable exchange in Argentina, and lower industry volume in Brazil.
The top line was lower with wholesales down 13% and revenue down 15%, reflecting lower industry and market share, and weaker local currencies.
Our market share for the region, at 9.4%, was down eight-tenths of a percentage point due to Fiesta in Brazil. Industry SAAR for the region, at 3.6 million units, was 400,000 units lower than a year ago, due to Brazil.
Operating margin and pre-tax results for the region were both lower than a year ago.
As shown below the chart, each of South America’s key metrics in the first nine months of 2016 was lower than a year ago.
Item 2. Management’s Discussion and Analysis of Financial Condition and Results of Operations (Continued)
As shown above, the higher loss in South America in the third quarter of 2016 was more than doubleexplained by the unfavorable effects of high local inflation and weaker local currencies exceeding higher net pricing. This was offset partially by continued progress in reducing costs, including further workforce reductions as we optimized our manufacturing plant operating patterns.
Our team is continuing its work to further improve the cost structure of the business and identify revenue opportunities. Importantly, we are now seeing some key economic indicators beginning to improve, although still in negative territory, suggesting we may have passed the trough of the current economic cycle.
Item 2. Management’s Discussion and Analysis of Financial Condition and Results of Operations (Continued)
Shown above are the third quarter 2016 key metrics for Europe, where we delivered our best third quarter pre-tax profit since 2007, with pre-tax profit and operating margin up sharply from a year ago. The top-line declined from a year ago with wholesale volume down 15% and revenue down 10%, driven by lower volume.
Our market share, at 7.9%, was flat from a year ago. Ford remained Europe’s best selling commercial vehicle brand in the third quarter of 2016 with improved share from a year ago. Europe SAAR, at 20.1 million units, was 4% higher than in the third quarter of 2015.
Our operating margin, at 2.2%, was up 2.1 percentage points from a year ago, and pre-tax profit was $138 million, up $129 million.
As shown below the chart, each of Europe’s key metrics in the first nine months of 2016 improved except market share which was flat, with pre-tax profit exceeding $1 billion and operating margin at 4.9%.
Item 2. Management’s Discussion and Analysis of Financial Condition and Results of Operations (Continued)
As shown above, we delivered our sixth consecutive profitable quarter, with pre-tax profit $129 million higher in the third quarter of 2016 compared to a year ago, driven by improved cost performance, strong mix, and favorable balance sheet exchange.
We delivered our fourth consecutive quarter of year-over-year cost performance improvement, reflecting our continued focus on material cost reductions. Mix remains strong, driven by the strength of our products, including Ranger, Mustang, and Kuga, and increasing demand for our higher trim series across all major vehicle lines. Lower volume was a partial offset, reflecting a reduction in dealer stocks compared to an increase a year ago as we took actions to align production to expected demand following Brexit.
Although not shown above, our operations in Russia contributed meaningfully to Europe’s improved results in the third quarter of 2016.
Item 2. Management’s Discussion and Analysis of Financial Condition and Results of Operations (Continued)
Shown above are key metrics for the Middle East & Africa region for the third quarter of 2016, where our key metrics were down compared to a year ago, reflecting lower industry and market performance in the Middle East.
The top line in the third quarter of 2016 was down 14% from a year ago, driven primarily by lower wholesale volume. The decline in volume largely reflects stock adjustments in Saudi Arabia for lower industry and market performance. We are working with our distributor to improve our performance.
SAAR for the region, at 3.7 million units, was down 500,000 units from the third quarter of 2015. Within this, the markets where we participate declined 500,000 units. The markets where we do not participate, with Iran being the largest, were about the same as a year ago. Our market share for the region was 4.1%, down three-tenths of a percentage point due to unfavorable market mix. In markets where we participate, our market share was flat.
Middle East & Africa operating margin was negative 19%, down sharply from a year ago, reflecting lower volume and unfavorable exchange, primarily the South African rand.
As shown below the chart, each of the key metrics in the first nine months of 2016 was lower compared with a year ago, reflecting the impact of adverse external conditions.
Item 2. Management’s Discussion and Analysis of Financial Condition and Results of Operations (Continued)
In Asia Pacific, we delivered a record third quarter pre-tax profit with all key metrics improved compared to a year ago. Wholesale volume increased 30% and revenue from consolidated operations improved 16%, reflecting higher industry volume and strong performance from new products.
Asia Pacific SAAR was 40.9 million units, up 3.2 million units from the third quarter of 2015, levels.mostly explained by a 2.8 million unit increase in China SAAR, estimated at 24.9 million units. This was driven by the government purchase tax incentive for vehicles with engine displacements of 1.6 liters or smaller. Asia Pacific market share was 4.0%, up five-tenths of a percentage point, with China share increasing five-tenths of a percentage point to 5.1%. The improvement in share was driven by strong C-car sales and new product introductions, including Taurus, the locally built Edge, Lincoln MKX, and Lincoln MKZ.
Asia Pacific operating margin was 4.3%, up 3.5 percentage points from a year ago, and pre-tax profit was $131 million, up $109 million. Our China joint ventures contributed $320 million to pre-tax profit, reflecting our equity share of the joint ventures’ after-tax earnings; this was $67 million higher than a year ago. The joint ventures’ net income margin was 13.4%, up seven-tenths of a percentage point.
As shown below the chart, all of our key metrics in the first nine months of 2016 improved compared with a year ago, except for operating margin.
Item 2. Management’s Discussion and Analysis of Financial Condition and Results of Operations (Continued)
As shown above, our third quarter record profit in Asia Pacific was up sharply compared with 2015. Volume and mix was up reflecting higher market share, favorable industry and the non-repeat of dealer stock reductions in China a year ago.
Lower net pricing compared to a year ago reflects continued negative pricing trends in China. In the quarter, the rate of negative pricing in China continued to slow since the fourth quarter of 2015. We continue to expect full year negative pricing for the industry.
Unfavorable cost performance was driven by cost increases to support higher volumes and continued investment for future product and regulatory actions; it includes the impact of plant launches during the second half of 2015. The investments in structural cost were offset partially by our continued focus on material cost efficiencies.
Unfavorable exchange reflects mainly the impact of the weaker Chinese yuan; the Company has a substantial net revenue exposure to this currency.
Item 2. Management’s Discussion and Analysis of Financial Condition and Results of Operations (Continued)
As shown above, the $2 billion improvement in Automotive pre-tax profit in the first quarter of 2016 was driven by higher volume, favorable mix, and lower costs. Volume and mix was favorable in all regions, except South America, reflecting the strength of our portfolio and the success of new product introductions. Stock changes are more than explained by North America, primarily reflecting the non-repeat of our F-150 launch in Kansas City in first quarter of 2015. Lower net pricing was a partial offset. This mainly reflected a one-time stock accrual effect in North America.
Total costs and expenses. In the first quarter of 2016 and 2015, total costs and expenses, including special items, for our Automotive sector were $32.8 billion and $30.9 billion, respectively, a difference of $1.9 billion. The detail for the change is shown below (in billions):
|
| | | |
| | First Quarter |
| Explanation of change: | 2016 Lower/(Higher) 2015 |
| Volume and mix, exchange, and other | $ | (2.3 | ) |
| Contribution costs | |
| Material excluding commodities | 0.4 |
|
| Commodities | 0.5 |
|
| Warranty, freight, and other | 0.1 |
|
| Structural costs | (0.4 | ) |
| Special items | (0.2 | ) |
| Total | $ | (1.9 | ) |
Item 2. Management’s Discussion and Analysis of Financial Condition and Results of Operations (Continued)
Shown above are the first quarter 2016 key metrics for the North America region, where we expect to have another outstanding year. A major factor in the quarter was the full deployment of our F-150 strategy, which is delivering great results for our business. In the first quarter of 2016, wholesale volume and revenue both increased sharply.
Our North America market share improved, with U.S. share increasing by eight-tenths of a percentage point to 15.5%. The improvement was driven by strong fleet performance, mainly SUVs, Transit, which now has a leadership position in the commercial van segment, and F-Series.
North America’s SAAR, at 21.3 million units, was up 700,000 units compared with the first quarter of 2015. U.S. SAAR, at 17.5 million units, was up 400,000 units compared with the first quarter of 2015.
Our operating margin at 12.9% and pre-tax profits of $3.1 billion were both records.
Item 2. Management’s Discussion and Analysis of Financial Condition and Results of Operations (Continued)
The $1.5 billion improvement in North America’s first quarter 2016 pre-tax profit was driven by favorable volume and mix and lower contribution costs. Lower net pricing and structural cost increases, to support a continued strong product line-up and future growth, were partial offsets.
The favorable change in stocks and about 40% of the increase in incentives was caused by normalization of the volume of F-150, which was being launched in Kansas City a year ago.
Although net pricing was lower in the first quarter of 2016, average U.S. retail transaction prices increased compared to year-ago levels, reflecting improved mix.
Item 2. Management’s Discussion and Analysis of Financial Condition and Results of Operations (Continued)
In South America, results were impacted negatively by the very difficult external conditions, particularly in Brazil where the economy continues to contract and industry volumes in the first quarter of 2016 declined by more than a quarter compared to prior year. In Argentina, our business was negatively impacted by the devaluation of the Peso, however, we are encouraged by actions taken by the new government which have the potential to improve future market conditions.
All of our key metrics deteriorated in the first quarter of 2016 compared with the first quarter of 2015. The top line was down sharply with wholesales lower by 38% and revenue lower by 44%.
Our market share for the region, at 8.4%, was down by 1.2 percentage points, as we focused on profitable share amid high industry discounting.
Industry SAAR for the region, at 3.7 million units, was 900,000 units lower than in the first quarter of 2015.
In the first quarter of 2016, operating margin and pre-tax results for the region were both lower than prior year.
Item 2. Management’s Discussion and Analysis of Financial Condition and Results of Operations (Continued)
As shown above, the higher loss in South America in the first quarter of 2016 was more than explained by lower industry volumes – primarily the result of the 29% reduction in Brazil. This was offset partially by our continued drive to reduce costs as we realized the benefits of actions taken in 2015, including a 10% reduction in our salaried personnel and overhead and a 20% reduction in labor costs. We also eliminated the third crew at our Camacari plant in the first quarter of 2016.
Item 2. Management’s Discussion and Analysis of Financial Condition and Results of Operations (Continued)
Shown above are the key metrics for Europe, where our Transformation Strategy is building momentum. All metrics improved in the first quarter of 2016. We grew the top line with wholesale volume and revenue at constant exchange, both growing by 6%.
Our market share in Europe improved three-tenths of a percentage point to 8.0%, reflecting the strong performance of commercial and SUV vehicles, including Ranger, Transit, Kuga, and EcoSport. Ford remained Europe’s best-selling commercial vehicle brand in the first quarter of 2016.
Europe SAAR, at 20.1 million units, was 5% higher in the first quarter of 2016 compared with the first quarter of 2015.
Our operating margin at 6.3% and pre-tax profit of $434 million both improved significantly from last year’s loss.
Item 2. Management’s Discussion and Analysis of Financial Condition and Results of Operations (Continued)
As shown above, every aspect of the business contributed to the nearly half-billion dollar improvement in Europe’s pre-tax results in the first quarter of 2016. Favorable market factors were driven by improved product and series mix with strong consumer acceptance of our new products and increasing demand for higher series vehicles. Higher industry volumes also contributed. Contribution and structural costs were both lower in the first quarter of 2016 compared with the first quarter of 2015.
Item 2. Management’s Discussion and Analysis of Financial Condition and Results of Operations (Continued)
Shown above are key metrics for the Middle East & Africa region, where the business was adversely impacted by weak local currencies, low oil prices, and political strife. Wholesale volume and revenue both declined in the first quarter of 2016.
Our market share for the region was unchanged at 4.3%. SAAR for the region, at 4.0 million units, was down 300,000 units compared with the first quarter of 2015.
Our financial results, which deteriorated to a loss of $14 million in the first quarter of 2016, reflect exchange impacts, primarily the South African Rand, and higher cost.
Item 2. Management’s Discussion and Analysis of Financial Condition and Results of Operations (Continued)
In Asia Pacific region, we had another strong quarter, driven by our great new products. All key metrics improved in the first quarter of 2016. Wholesale volumes increased by 9% and revenue from consolidated operations improved by 18%, or 25% at constant exchange.
Asia Pacific’s market share was 3.6% in the first quarter of 2016, up three-tenths of a percentage point and a record for the first quarter. China’s market share was 4.5%, up two-tenths of a percentage point compared with the first quarter of 2015 driven by SUVs. Sales in the region and China were a record for the first quarter.
Asia Pacific’s first quarter 2016 SAAR was 40.9 million units, up 2 million units from the first quarter of 2015, more than explained by a 2.4 million unit increase in China industry SAAR which is estimated at 26.2 million units for the first quarter.
Asia Pacific’s operating margin was 8.2%, up 3.6 percentage points from 2015, and pre-tax results of $220 million more than doubled compared with the first quarter of 2015. Our China joint ventures contributed $443 million to pre-tax profit in the first quarter of 2016, reflecting our equity share of their after-tax earnings which was $83 million higher compared with the first quarter of 2015. The net income margin at our China joint ventures was 16.4%.
Item 2. Management’s Discussion and Analysis of Financial Condition and Results of Operations (Continued)
Shown above are the factors driving our higher first quarter 2016 pre-tax results in Asia Pacific. Favorable volume was driven by a strong industry in China, where we continue to leverage the government incentive program with our strong line-up of vehicles with 1.6L or smaller engines. Higher market share and favorable mix reflect the strength of our new products, including the Edge, Ranger, and Lincoln.
Higher structural costs to support future growth and lower net pricing in China were partial offsets. In the first quarter of 2016, the rate of decline in pricing in China slowed compared with the fourth quarter of 2015. We continue to expect full-year negative pricing in China in the 5-6 percent range.
Item 2. Management’s Discussion and Analysis of Financial Condition and Results of Operations (Continued)
FINANCIAL SERVICES SECTORSEGMENT
Ford Credit has two operations, North America and International. In general, we measure year-over-year changes in Ford Credit’s pre-tax results using the causal factors listed below:
Volume and Mix:
| |
| ◦ | Volume primarily measures changes in net financing margin driven by changes in average financemanaged receivables and net investment in operating leases at prior period financing margin yield (defined below in financing margin) at prior period exchange rates. Volume changes are primarily driven by the volume of new and used vehicle sales and leases, the extent to which Ford Credit purchases retail installment sale and lease contracts, the extent to which Ford Credit provides wholesale financing, the sales price of the vehicles financed, the level of dealer inventories, Ford-sponsored special financing programs available exclusively through Ford Credit, and the availability of cost-effective funding for the purchase of retail installment sale and lease contracts and to provide wholesale financing |
| |
| ◦ | Mix primarily measures changes in net financing margin driven by period over period changes in the composition of Ford Credit’s average managed receivables by product and by country or region |
◦•Financing Margin:
| |
| ◦ | Financing margin variance is the period-to-period change in financing margin yield multiplied by the present period average managed receivables at prior period exchange rates. This calculation is performed at the product and country level and then aggregated. Financing margin yield equals revenue, less interest expense and scheduled depreciation for the period, divided by average managed receivables for the same period |
| |
| ◦ | Financing margin changes are driven by changes in revenue and interest expense. Changes in revenue are primarily driven by the level of market interest rates, cost assumptions in pricing, mix of business, and competitive environment. Changes in interest expense are primarily driven by the level of market interest rates, borrowing spreads, and asset-liability management |
| |
| ◦ | Credit loss is the change in the provision for credit losses at prior period exchange rates. For analysis purposes, management splits the provision for credit losses primarily into net charge-offs and the change in the allowance for credit losses |
| |
| ◦ | Net charge-off changes are primarily driven by the number of repossessions, severity per repossession, and recoveries. Changes in the allowance for credit losses are primarily driven by changes in historical trends in credit losses and recoveries, changes in the composition and size of Ford Credit’s present portfolio, changes in trends in historical used vehicle values, and changes in economic conditions. For additional information on the allowance for credit losses, refer to the “Critical Accounting Estimates - Allowance for Credit Losses” section of Item 7 of Part II of our 2015 Form 10-K Report |
| |
| ◦ | Lease residual measures changes to residual performance at prior period exchange rates. For analysis purposes, management splits residual performance primarily into residual gains and losses, and the change in accumulated supplemental depreciation |
| |
| ◦ | Residual gain and loss changes are primarily driven by the number of vehicles returned to Ford Credit and sold, and the difference between the auction value and the depreciated value (which includes both base and accumulated supplemental depreciation) of the vehicles sold. Changes in accumulated supplemental depreciation are primarily driven by changes in Ford Credit’s estimate of the expected auction value at the end of the lease term, and changes in the estimate of the number of vehicles that will be returned to it and sold, and changes in the estimate of the expected auction value at the end of the lease term.sold. For additional information on accumulated supplemental depreciation, refer to the “Critical Accounting Estimates - Accumulated Depreciation on Vehicles Subject to Operating Leases” section of Item 7 of Part II of our 2015 Form 10-K Report |
Exchange:
| |
| ◦ | Reflects changes in pre-tax results driven by the effects of converting functional currency income to U.S. dollars |
| |
| ◦ | Primarily includes operating expenses, other revenue, and insurance expenses at prior period exchange rates |
| |
| ◦ | Changes in operating expenses are primarily driven by salaried personnel costs, facilities costs, and costs associated with the origination and servicing of customer contracts |
| |
| ◦ | In general, other revenue changes are primarily driven by changes in earnings related to market valuation adjustments to derivatives (primarily related to movements in interest rates), and other miscellaneous items |
Item 2. Management’s Discussion and Analysis of Financial Condition and Results of Operations (Continued)
Ford Credit. The chart below details the key metrics for Ford Credit for firstthird quarter of 2016.
In the firstthird quarter of 2016, Ford Credit continued to grow, while remaining strongly profitable. Contract volumes were largely unchanged with lower volume inCredit’s pre-tax profit was strong – the United Statesbest quarterly profit since 2011 – and growth in all other markets.
Managed receivables were $132 billion at March 31, 2016, up 17% from the first quarter of 2015, as the portfolio continues to growhigher than a year ago, in line with Ford’s growth. Managed receivables equal net finance receivables of $100.3 billion and $86.5 billion and net investment in operating leases of $25.9 billion and $22.0 billion reported on Ford Credit’s balance sheet at March 31, 2016 and March 31, 2015, respectively, excluding unearned interest supplements and residual support of $4.6 billion and $3.8 billion, allowance for credit losses of $500 million and $400 million, and other (primarily accumulated supplemental depreciation) of $500 million and $200 million at March 31, 2016 and March 31, 2015, respectively.
expectations. Portfolio performance remainsremained robust. FICO scores remained consistent. The over-60-day delinquency ratio at 14of 16 basis points in the firstthird quarter of 2016 remainscontinued at the low end of Ford Credit’s historical experience. The loss-to-receivables ratio in the first quarter of 2016 was 4445 basis points was up 11 basis points, also below, but approaching, Ford Credit’s historical experience. Originations, servicing, and collections practices remained disciplined and consistent.
As shown below the chart, Ford Credit’s year-to-date key metrics were unfavorable compared with the first quarter of 2015. U.S. retail and lease credit losses have been better than Ford Credit’s expectations for an extended time period. Credit losses have been trending higher for the last few quarters, as they continue to normalize toward Ford Credit’s expectations.a year ago.
Item 2. Management’s Discussion and Analysis of Financial Condition and Results of Operations (Continued)
TheAs shown above, Ford Credit's profit improvement of $31$26 million in pre-tax profit in the firstthird quarter of 2016 compared with the first quarter of 2015 is more than explained primarily by favorable volume, mix, and market valuation adjustments to derivatives. Partial offsets include unfavorable lease residual performance and higher credit losses. The favorable volume and mix was driven by increasesgrowth in consumer and non-consumer finance receivables globally, as well as an increase in operating leases in North America.all products globally.
Credit losses were $65 millionLease residual performance reflects higher as Ford Credit increased the reserve and had higher charge-offsdepreciation in North America primarily reflecting higher severity.
Unfavorable lease residual performance of $61 million in the first quarter of 2016 primarily reflects higher depreciation on Ford Credit’s North America lease portfolio, as Ford Credit expectsrelated to expected lower auction values in the future.lease portfolio.
Credit loss performance primarily reflects higher charge-offs as a result of higher defaults and severities in North America. Credit losses have been at historically low levels for quite some time, and we continued to see credit losses increase toward more normal levels.
Item 2. Management’s Discussion and Analysis of Financial Condition and Results of Operations (Continued)
Industry leasing continues to grow. Ford’sLeasing is a great trade cycle management product, but lease share of retail sales was 26% in the first quarter of 2016 but remains below the industry. Ford Credit and Ford work together under a One Ford Lease Strategy thatmust be managed carefully to protect residuals. Our leasing strategy considers many factors including share, term, model mix, and geography to optimize sales, share, profits, and other factors. Full yearresiduals.
Over the last several years, we have seen industry lease share grow with rising industry volumes. As a result, the supply of off-lease vehicles is expectedhigher and will continue to begrow for the next several years. The increased supply of used vehicles, along with higher new vehicle incentives, is resulting in lower thanauction values, particularly in smaller, more fuel efficient vehicles given low fuel prices. We expect this trend to continue, and we are planning for lower auction values going forward.
Given significant industry growth in leasing and higher new vehicle incentives, we lowered our projection on residual values which makes the firstrelative cost of leasing higher. As a result, Ford Credit’s lease share and lease placement volume in the third quarter of 2016 reflecting the parameters of our strategy.were lower compared to a year ago.
Ford Credit’s usedoff-lease vehicle auction pricesvalues in the firstthird quarter of 2016 were lower than a year ago but up fromand slightly lower than the fourthprior quarter, of 2015, although not as high as expected.with 36-month off-lease auction values about $600 lower year-over-year. Ford Credit’s auction performance has been consistent with the industry when comparing similar vehicle age and segment.
On longer-term financing, Ford Credit’s average retail term has remainedremains largely consistentunchanged from last year, and lower than the industry. Retailretail contracts of 73 months and longer remaincontinued to be a relatively small part of Ford Credit’s business.
TheFinally, the average placement FICO score in the first quarter of 2016 reflected the mix of customers attracted by Ford’s marketing programs. These levels areremained consistent with the second quarter and the same period last year, reflecting Ford Credit’s experience over the last five years and reflect normal quarterly variances. Ford Credit uses proprietary credit scoring models, and itsCredit's consistent underwriting practices have been consistent for years. Ford Credit’s higher risk business, as classified at contract inception, consistently represents 5%-6% of its portfolio and has been stable for over 10 years.practices.
Item 2. Management’s Discussion and Analysis of Financial Condition and Results of Operations (Continued)
ALLOTHER
All Other is a combination of operating segments that did not meet the quantitative thresholds in this reporting period to qualify as reportable segments. All Other consists of our Central Treasury Operations (formerly Other Automotive) and Ford Smart Mobility LLC.
The Central Treasury Operations segment is primarily engaged in decision making for investments, risk management activities, and providing financing for the Automotive segment. Interest income (excluding interest earned on our extended service contract portfolio that is included in our Automotive segment), interest expense, gains and losses on cash equivalents and marketable securities, and foreign exchange derivatives associated with intercompany lending are included in the results of Central Treasury Operations. The underlying assets and liabilities, primarily cash and cash equivalents, marketable securities, debt, and derivatives, remain with the Automotive segment.
Ford Smart Mobility LLC is a new subsidiary formed to design, build, grow, and invest in emerging mobility services. Designed to compete like a start-up company, Ford Smart Mobility LLC will design and build mobility services on its own, and collaborate with start-ups and tech companies.
Our third quarter 2016 All Other pre-tax results were a loss of $223 million, a $60 million greater loss compared with a year ago. This increase is more than explained by higher net interest expense and net losses on cash equivalents and marketable securities.
SPECIAL ITEMS
As detailed in Note 3 of the Notes to the Financial Statements, special items are reflected as a separate reconciling item, as opposed to allocating them among the Automotive segment, Financial Services segment, and All Other. This reflects the fact that management excludes these items from its review of operating segment results for purposes of measuring segment profitability and allocating resources.
Our pre-tax and tax special items were as follows:
Item 2. Management’s Discussion and Analysis of Financial Condition and Results of Operations (Continued)
TAXES
Our tax provision in the third quarter and first nine months of 2016 was $426 million and $2.5 billion, respectively, resulting in an effective tax rate of 30.7% and 31.9%, respectively.
Our third quarter and first nine months 2016 adjusted effective tax rate, which excludes special items, was 25.9% and 29.1%, respectively, 7.4 and 5 percentage points lower than a year ago. The lower adjusted effective tax rates through the first nine months of 2016 reflect tax benefits from legislation enacted December 18, 2015 making permanent the U.S. research and development tax credit.
Item 2. Management’s Discussion and Analysis of Financial Condition and Results of Operations (Continued)
LIQUIDITY AND CAPITAL RESOURCES
Automotive Sector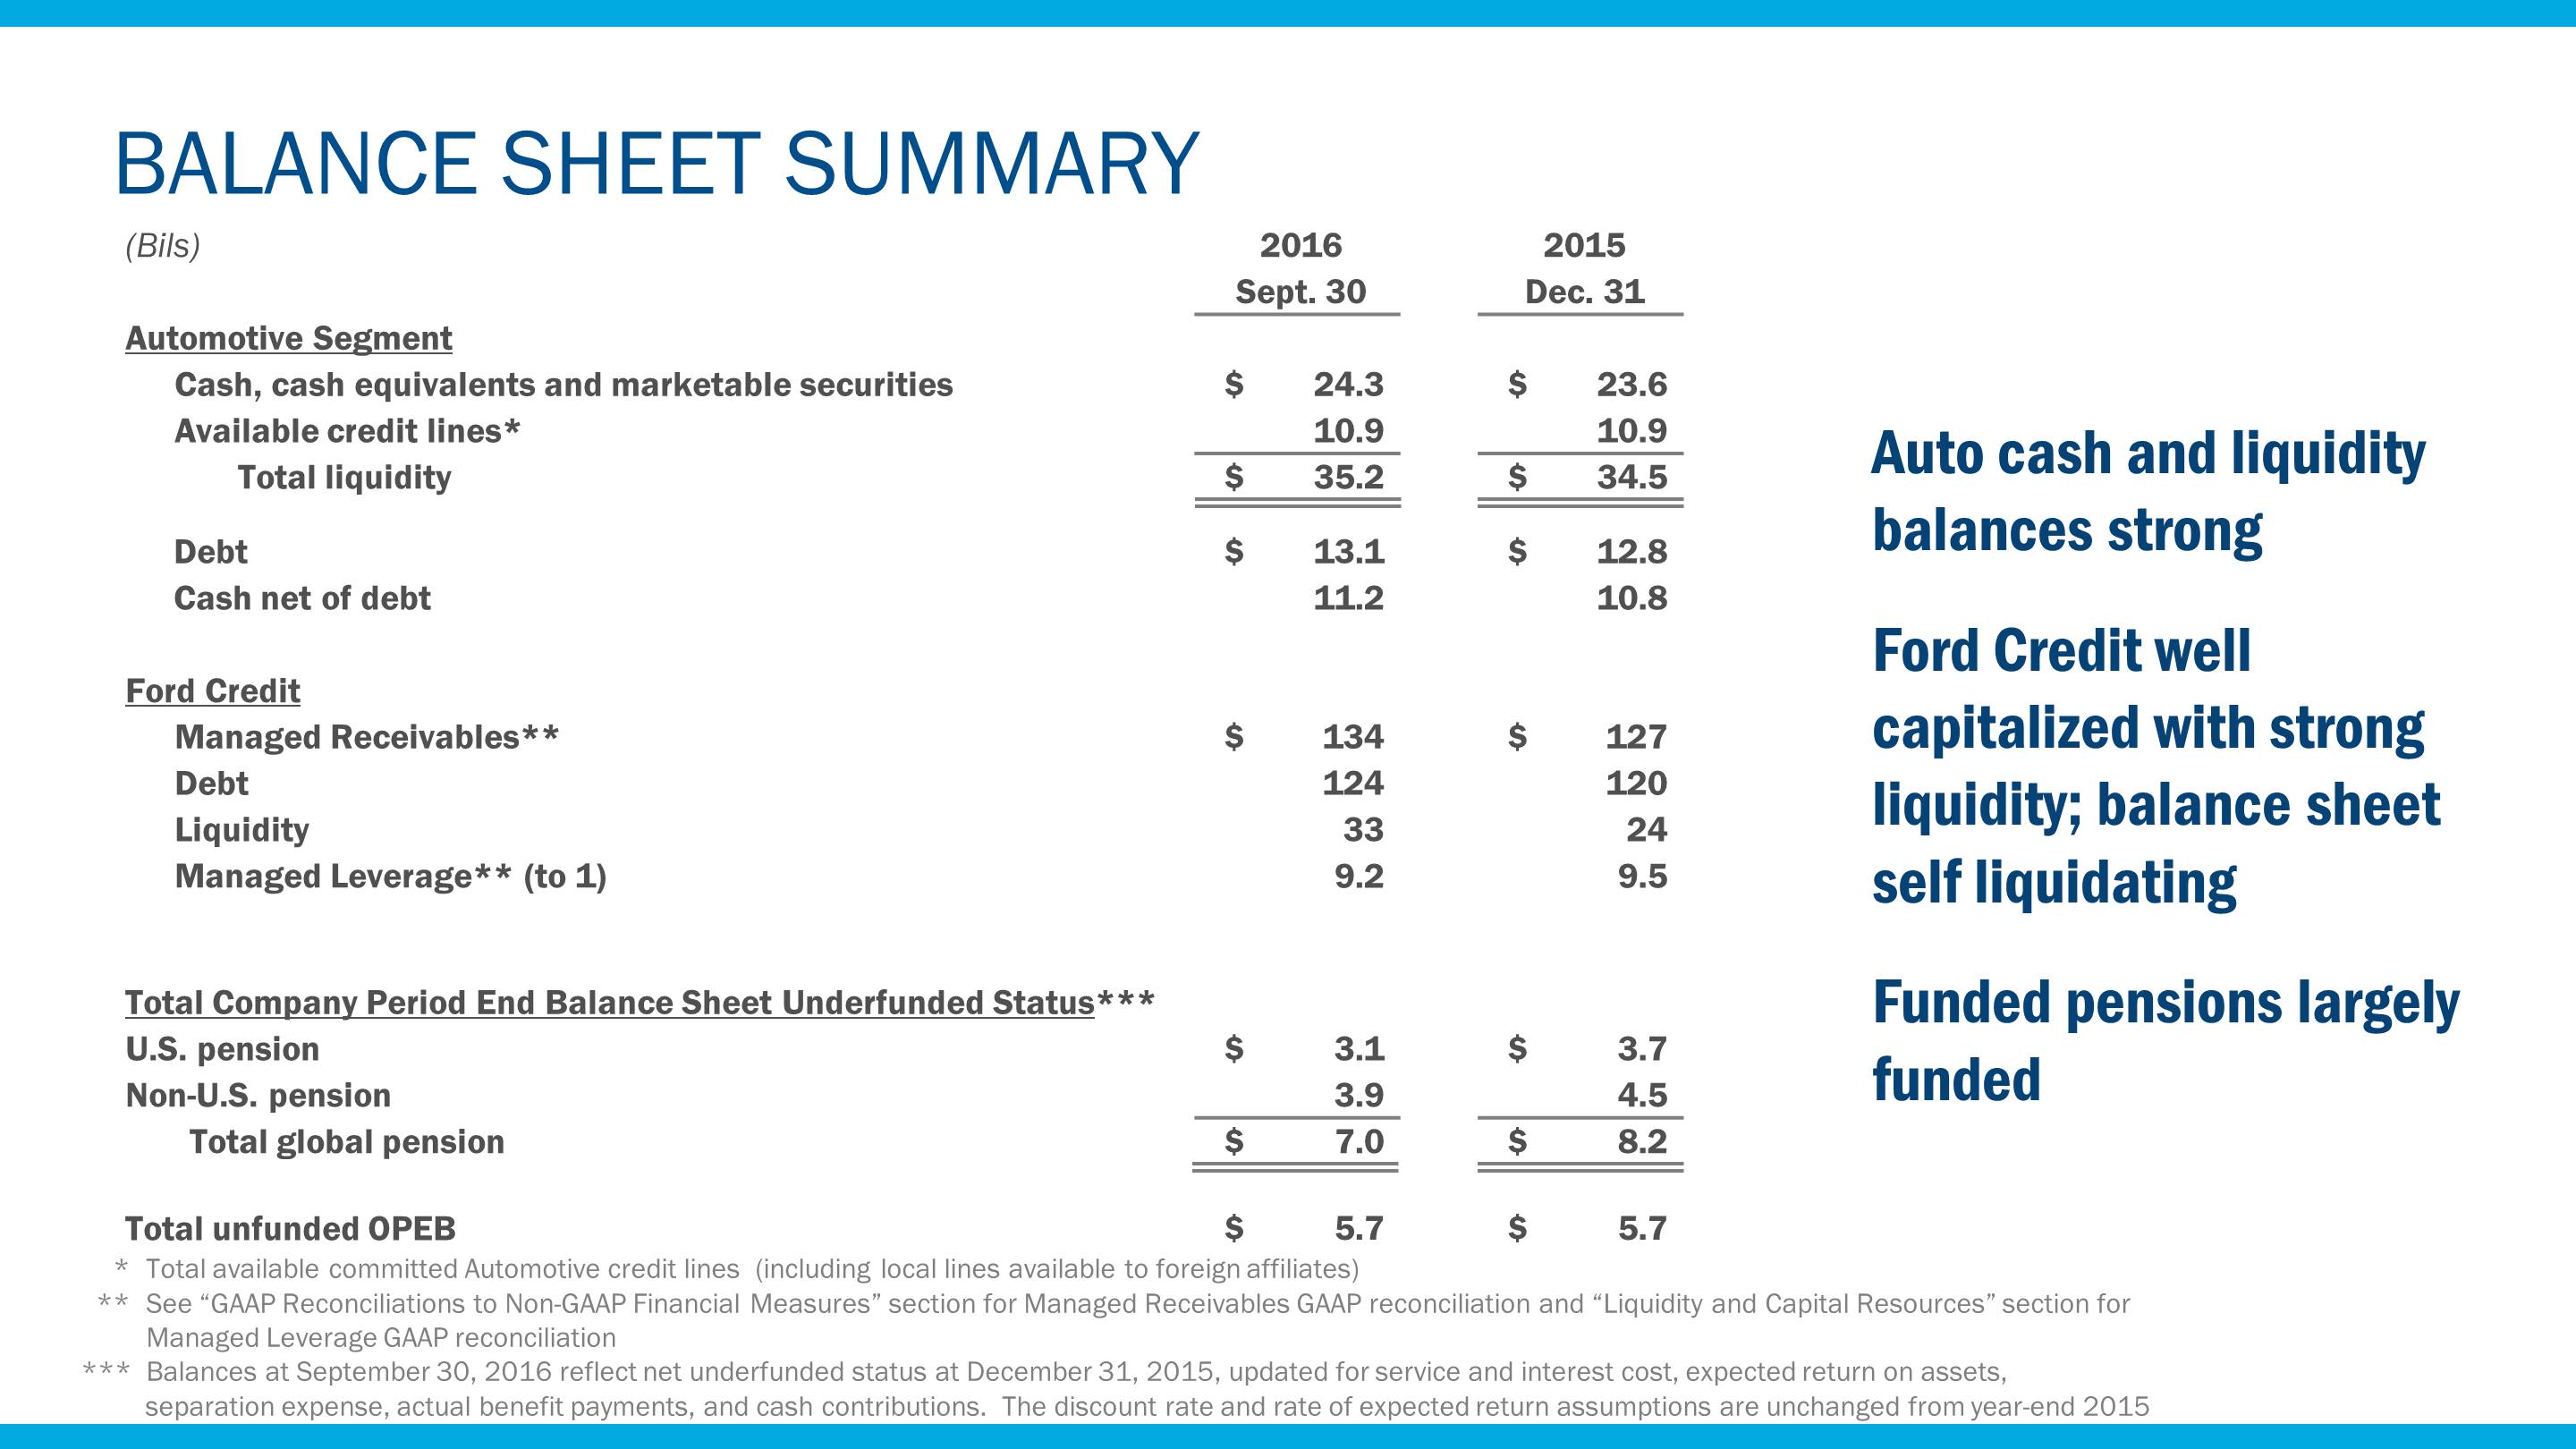
Our Automotive liquidity strategy includes ensuringSegment
Liquidity. One of our key priorities is to finance our plan and maintain a strong balance sheet, while at the same time having resources available to grow our core business and invest in emerging opportunities. Based on our planning assumptions, we believe that we have sufficient liquidity and capital resources to continue to invest in new products and services that customers want and value, transform and grow our business, pay our debts and obligations as and when they come due, pay a sustainable dividend, and provide protection within an uncertain global economic environment.
Our key balance sheet metrics include cash, cash equivalents, and marketable securities (collectively, “Automotive cash”), Automotive liquidity, which includes Automotive cash and total available with a high degreecommitted credit lines, and cash net of certainty throughoutdebt.
At September 30, 2016, we had $24.3 billion of Automotive cash, of which 85% was held by consolidated entities domiciled in the business cycle by generating cash from operations and maintaining access to other sources of funding.United States. We target to have an average ongoing Automotive cash balance of about $20 billion. We expect to have periods when we will be above or below this amount due to (i) future cash flow expectations, such as for pension contributions, debt maturities, capital investments, or restructuring requirements, (ii) short-term timing differences, and (iii) changes in the global economic environment. In addition, we also target to maintain a revolving credit facility for our Automotive business of about $10 billion to protect against exogenous shocks. Our revolving credit facility is discussed below.
We assess the appropriate long-term target for total Automotive liquidity, comprised of Automotive cash and the revolving credit facility, to be about $30 billion, which is an amount we believe is sufficient to support our business priorities and to protect our business. Our Automotive cash and Automotive liquidity targets could be reduced over time based on improved operating performance and changes in our risk profile.
For a discussion of risks to our liquidity, see “Item 1A. Risk Factors,” in our 2015 Form 10-K Report, as well as Note 16 of the Notes to the Financial Statements, regarding commitments and contingencies that could impact our liquidity.
Our key liquidity metrics are Automotive cash Automotive liquidity, and operating-related cash flow (which best represents the ability of our Automotive operations to generate cash).
Automotive cash is detailed below as of the dates shown (in billions):
|
| | | | | | | | | | | |
| | March 31,
2016 | | December 31, 2015 | | March 31, 2015 |
| Cash and cash equivalents | $ | 5.6 |
| | $ | 5.4 |
| | $ | 5.1 |
|
| Marketable securities | 18.7 |
| | 18.2 |
| | 14.4 |
|
| Automotive cash | $ | 24.3 |
| | $ | 23.6 |
| | $ | 19.5 |
|
Our cash, cash equivalents, and marketable securities are held primarily in highly liquid investments which provide for anticipated and unanticipated cash needs. Our cash, cash equivalents, and marketable securities primarily include U.S. Department of Treasury obligations, federal agency securities, bank time deposits with investment-grade institutions, corporate investment-grade securities, commercial paper rated A-1/P-1 or higher, and debt obligations of a select group of non-U.S. governments, non-U.S. governmental agencies, and supranational institutions. The average maturity of these investments ranges from about 90 days to up to about one year, and is adjusted based on market conditions and liquidity needs. We monitor our Automotive cash levels and average maturity on a daily basis. At March 31, 2016, consolidated entities domiciled in the United States held 85% of our total Automotive cash.
Automotive cash and liquidity as of the dates shown were as follows (in billions):
|
| | | | | | | | | | | |
| | March 31,
2016 | | December 31, 2015 | | March 31, 2015 |
| Automotive cash | $ | 24.3 |
| | $ | 23.6 |
| | $ | 19.5 |
|
| Available credit lines | | | |
| | |
|
| Revolving credit facility, unutilized portion | 10.3 |
| | 10.3 |
| | 10.1 |
|
| Local lines available to foreign affiliates, unutilized portion | 0.6 |
| | 0.6 |
| | 0.6 |
|
| Automotive liquidity | $ | 35.2 |
| | $ | 34.5 |
| | $ | 30.2 |
|
In managing our business, we classify changes in Automotive cash into operating-related and other items (which includes the impact of certain special items, contributions to funded pension plans, certain tax-related transactions, acquisitions and divestitures, capital transactions with the Financial Services sector, dividends paid to shareholders, and other—primarily financing-related).
Item 2. Management’s Discussion and Analysis of Financial Condition and Results of Operations (Continued)
In addition to our target Automotive cash balance, we also target to maintain a corporate credit facility for our Automotive business of about $10 billion to protect against exogenous shocks. Our corporate credit facility is discussed below. We believeassess the appropriate long-term target for total Automotive liquidity, comprised of Automotive cash flow analysis reflected inand the table below is useful to investors because it includes in operating-related cash flow elements that we considercorporate credit facility, to be relatedabout $30 billion, which is an amount we believe is sufficient to support our business priorities and to protect our business. At September 30, 2016, we had $35.2 billion of Automotive liquidity. Our Automotive cash and Automotive liquidity targets could be reduced over time based on improved operating activities (e.g., capital spending)performance and excludes cash flow elements that we do not consider to be related to the ability ofchanges in our operations to generate cash. This differs from a cash flow statement preparedrisk profile.
Changes in accordance with GAAP and differs from Automotive Cash.Netcash provided by/(used in) operating activities, the most directly comparable GAAP financial measure.
Changes in Automotive cash are summarized below (in billions):
In managing our Automotive business, we classify changes in Automotive cash into operating, and other items. Operating items include: Automotive segment pre-tax profits, capital spending, which we report as an operating cash flow as it is a key contributor to our Automotive segment financial results, depreciation and tooling amortization, changes in working capital, and All Other and timing differences. Other items include: separation payments, transactions with other segments, acquisitions and divestitures, changes in Automotive debt, contributions to funded pension plans, and dividends paid to shareholders.
Third quarter 2016 Automotive operating cash flow was $2 billion negative, primarily reflecting the impact of lower production and dealer stocks on working capital and timing differences. First nine months 2016 Automotive operating cash flow was a strong $4.9 billion positive, more than explained by Automotive segment pre-tax profit.
Third quarter 2016 capital spending was $1.7 billion, and first nine months 2016 capital spending was $4.9 billion. Full year 2016 capital spending is expected to be about $7 billion. Based on expected cash flows and the identification of additional opportunities for profitable growth, the ongoing amount of capital spending to support product development, growth, restructuring, and infrastructure is expected to increase to about $9 billion annually by 2020.
Item 2. Management’s Discussion and Analysis of Financial Condition and Results of Operations (Continued)
|
| | | | | | | |
| | First Quarter |
| | 2016 | | 2015 |
| Automotive cash at end of period | $ | 24.3 |
| | $ | 19.5 |
|
| Automotive cash at beginning of period | 23.6 |
| | 21.7 |
|
| Change in Automotive cash | $ | 0.7 |
| | $ | (2.2 | ) |
| | | | |
| Automotive pre-tax profits (excluding special items) | $ | 3.3 |
| | $ | 0.9 |
|
| Capital spending | (1.5 | ) | | (1.8 | ) |
| Depreciation and tooling amortization | 1.1 |
| | 1.1 |
|
| Changes in working capital (a) | — |
| | 0.8 |
|
| Other/Timing differences (b) | (0.2 | ) | | (0.5 | ) |
| Automotive operating-related cash flows | 2.7 |
| | 0.5 |
|
| | | | |
| Separation payments | — |
| | (0.4 | ) |
| Net receipts from Financial Services sector (c) | — |
| | — |
|
| Other | 0.2 |
| | (0.3 | ) |
| Cash flow before other actions | 2.9 |
| | (0.2 | ) |
| | | | |
| Changes in debt | (0.1 | ) | | (0.6 | ) |
| Funded pension contributions | (0.4 | ) | | (0.8 | ) |
| Dividends/Other items | (1.7 | ) | | (0.6 | ) |
| Change in Automotive cash | $ | 0.7 |
| | $ | (2.2 | ) |
_________
| |
(a) | Working capital is comprised of changes in receivables, inventory, and trade payables. |
| |
(b) | Primarily expense and payment timing differences for items such as pension and OPEB, compensation, marketing, warranty, and timing differences between unconsolidated affiliate profits and dividends received. Also includes other factors, such as the impact of tax payments and vehicle financing activities between Automotive and Financial Services sectors. |
| |
(c) | Primarily distributions from Ford Holdings (Ford Credit’s parent) and tax payments received from Ford Credit. |
With respect to “Changes in working capital,” in general we carry relatively low Automotive sectorsegment trade receivables compared with our trade payables because the majority of our Automotive wholesales are financed (primarily by Ford Credit) immediately upon sale of vehicles to dealers, which generally occurs at the time the vehicles are gate-released shortly after being produced. In addition, our inventories are lean because we build to order, not for inventory. In contrast, our Automotive trade payables are based primarily on industry-standard production supplier payment terms generally ranging between 30 days to 45 days. As a result, our cash flow tends to improve as wholesale volumes increase, but can deteriorate significantly when wholesale volumes drop sharply. These working capital balances generally are subject to seasonal changes that can impact cash flow. For example, we typically experience cash flow timing differences associated with inventories and payables due to our annual summer and December shutdown periods, when production, and therefore inventories and wholesale volumes, are usually at their lowest levels, while payables continue to come due and be paid. The net impact of this typically results in cash outflows from changes in our working capital balances during these shutdown periods.
Item 2. Management’s DiscussionAvailable Credit Lines. Total committed Automotive credit lines at September 30, 2016 were $11.9 billion, consisting of $10.4 billion of our corporate credit facility and Analysis$1.5 billion of Financial Condition and Resultslocal credit facilities available to non-U.S. Automotive affiliates. At September 30, 2016, the utilized portion of Operations (Continued)
the corporate credit facility was about $40 million, representing amounts utilized for letters of credit. At September 30, 2016, the utilized portion of local credit facilities was about $1 billion.
Shown below is a reconciliation between financial statement Net cash provided by/(used in) operating activities and operating-related cash flows (calculated as shown in the table above), as of the dates shown (in billions):
|
| | | | | | | | | | | |
| | | | | | Memo: Full Year 2015 |
| | First Quarter | |
| | 2016 | | 2015 | |
| Net cash provided by/(used in) operating activities | $ | 3.6 |
| | $ | 1.0 |
| | $ | 12.3 |
|
| Items included in operating-related cash flows | |
| | |
| | |
|
| Capital spending | (1.5 | ) | | (1.8 | ) | | (7.1 | ) |
| Proceeds from the exercise of stock options | — |
| | 0.1 |
| | 0.2 |
|
| Net cash flows from non-designated derivatives | 0.1 |
| | 0.1 |
| | (0.1 | ) |
| Items not included in operating-related cash flows | | | |
| | |
|
| Separation payments | — |
| | 0.4 |
| | 0.6 |
|
| Funded pension contributions | 0.4 |
| | 0.8 |
| | 1.1 |
|
| Tax refunds, tax payments, and tax receipts from affiliates | — |
| | — |
| | — |
|
| Other | 0.1 |
| | (0.1 | ) | | 0.3 |
|
| Operating-related cash flows | $ | 2.7 |
| | $ | 0.5 |
| | $ | 7.3 |
|
Credit Agreement. Lenders under our Third Amended and Restated Credit Agreement dated as of April 30, 2015 and as further amended (the “revolvingcorporate credit facility”)facility have commitments to us totaling $13.4 billion, with 75% of the commitments maturing on April 30, 20202021 and 25% of the commitments maturing on April 30, 2018.2019. We have allocated$3allocated $3 billion of commitments to Ford Credit on an irrevocable and exclusive basis to support its growth and liquidity. Any borrowings by Ford Credit under the revolvingcorporate credit facility would be guaranteed by us.
The revolvingcorporate credit facility is unsecured and free of material adverse change conditions to borrowing, restrictive financial covenants (for example, interest or fixed charge coverage ratio, debt-to-equity ratio, and minimum net worth requirements), and credit rating triggers that could limit our ability to obtain funding. The revolvingcorporate credit facility contains a liquidity covenant that requires us to maintain a minimum of $4 billion in aggregate of domestic cash, cash equivalents, and loaned and marketable securities and/or availability under the revolving credit facility. If our senior, unsecured, long-term debt does not maintain at least two investment grade ratings from Fitch, Moody’s, and S&P (each as defined under “Total Company”“Credit Ratings” below), the guarantees of certain subsidiaries will be required.
At March 31, 2016, the utilized portion of the revolving credit facility was $45 million, representing amounts utilized for letters of credit.
Although not yet complete, we are in the process of amending our revolving credit facility. When complete, we expect to maintain total commitments of $13.4 billion, extend the respective maturity dates by one year, and maintain the $3 billion allocation to Ford Credit. The closing will occur during the second quarter of 2016.
Other Automotive Credit Facilities.Debt. At March 31, 2016, we had about $1.4 billion of local credit facilities available to non-U.S. Automotive affiliates, of which $807 million had been utilized.
Net Cash. Our Automotive sector net cash calculation as of the dates shown was as follows (in billions):
|
| | | | | | | |
| | March 31, 2016 | | December 31, 2015 |
| Automotive cash | $ | 24.3 |
| | $ | 23.6 |
|
| Less: | |
| | |
|
| Long-term debt | 11.1 |
| | 11.0 |
|
| Debt payable within one year | 1.9 |
| | 1.8 |
|
| Total debt | 13.0 |
| | 12.8 |
|
| Net cash | $ | 11.3 |
| | $ | 10.8 |
|
Item 2. Management’s Discussion and Analysis of Financial Condition and Results of Operations (Continued)
Total Automotive debt at March 31,September 30, 2016 was $13.1 billion, which is about $200$300 million higher than it was at December 31, 2015. The increase primarily reflects local funding in international markets and foreign currency exchange, offset partially by debt repayments.
Leverage. We manage Automotive debt levels with a leverage framework to maintain strong, investment grade credit ratings through a normal business cycle. The leverage framework includes a ratio of Automotive debt, underfunded pension liabilities, operating leases, and other adjustments, divided by Automotive income before income tax, adjusted for depreciation, amortization, interest expense on Automotive interest,debt, and other adjustments. Ford Credit’s leverage is calculated as a separate business as described in the Liquidity - Financial Services section of Item 2. Ford Credit is self-funding and its debt, which is used to fund its operations, is separate from our Automotive debt.
Liquidity Sufficiency. One of our key priorities is to finance our plan and maintain a strong balance sheet, while at the same time having resources available to grow our business. Based on our planning assumptions, we believe that we have sufficient liquidity and capital resources to continue to invest in new products and services that customers want and value, transform and grow our business, pay our debts and obligations as and when they come due, pay a sustainable dividend, and provide protection within an uncertain global economic environment.
Based on expected cash flows and the identification of additional opportunities for profitable growth, the ongoing amount of capital spending to support product development, growth, restructuring, and infrastructure is expected to increase to about $9 billion annually by 2020. Our capital spending was $7.1 billion and $7.4 billion in 2015 and 2014, respectively, and is expected to be about $7.7 billion in 2016.
Item 2. Management’s Discussion and Analysis of Financial Condition and Results of Operations (Continued)
Financial Services SectorSegment
Ford Credit
Funding Overview. Ford Credit’s primary funding and liquidity objective is to maintain a strong investment grade balance sheet with ample liquidity to support its financing activities and growth under a variety of market conditions, including short-term and long-term market disruptions. Ford Credit’s funding strategy remains focused on diversification, and it plans to continue accessing a variety of markets, channels, and investors.
Ford Credit’s liquidity profile continues to be diverse, robust, and focused on maintaining liquidity levels that meet its business and funding requirements. Ford Credit regularly stress tests its balance sheet and liquidity to ensure that it continues to meet its financial obligations through economic cycles.
The following chart below shows the trends in funding for Ford Credit’s managed receivables:
Ford Credit’s higher cash balancemanaged receivables of $134 billion at the end of the firstthird quarter of 2016 reflects pre-funding of near-termwere funded primarily with term debt maturities.
Ford Credit projects year-end 2016 managed receivables to be in the range of $134 billion to $139 billion and securitizedterm asset-backed securities. Securitized funding as a percent of managed receivables to be between 36% and 39%was 33%.
Ford Credit expects the percentagemix of securitizationsecuritized funding to trend lower over time. The calendarization of the funding plan may result in quarterly fluctuations of the securitizationsecuritized funding percentage. Ford Credit expects this mix to be higher in the fourth quarter.
Item 2. Management’s Discussion and Analysis of Financial Condition and Results of Operations (Continued)
Public Term Funding Plan. The following tablechart shows Ford Credit’s issuances for full-year 2014 and 2015, planned issuances for full-year 2016, and its global public term funding issuances through April 27,October 26, 2016, full-year 2015, and full-year 2014 (in billions), excluding short-term funding programs:
|
| | | | | | | | | | | | | |
| | Public Term Funding Plan |
| | 2016 | | | | |
| | Full-Year Forecast | | Through April 27 | | Full-Year 2015 | | Full-Year 2014 |
| Unsecured | $ 14-19 | | $ | 7 |
| | $ | 17 |
| | $ | 13 |
|
| Securitizations (a) | 12-15 | | 7 |
| | 13 |
| | 15 |
|
| Total | $ 26-34 | | $ | 14 |
| | $ | 30 |
| | $ | 28 |
|
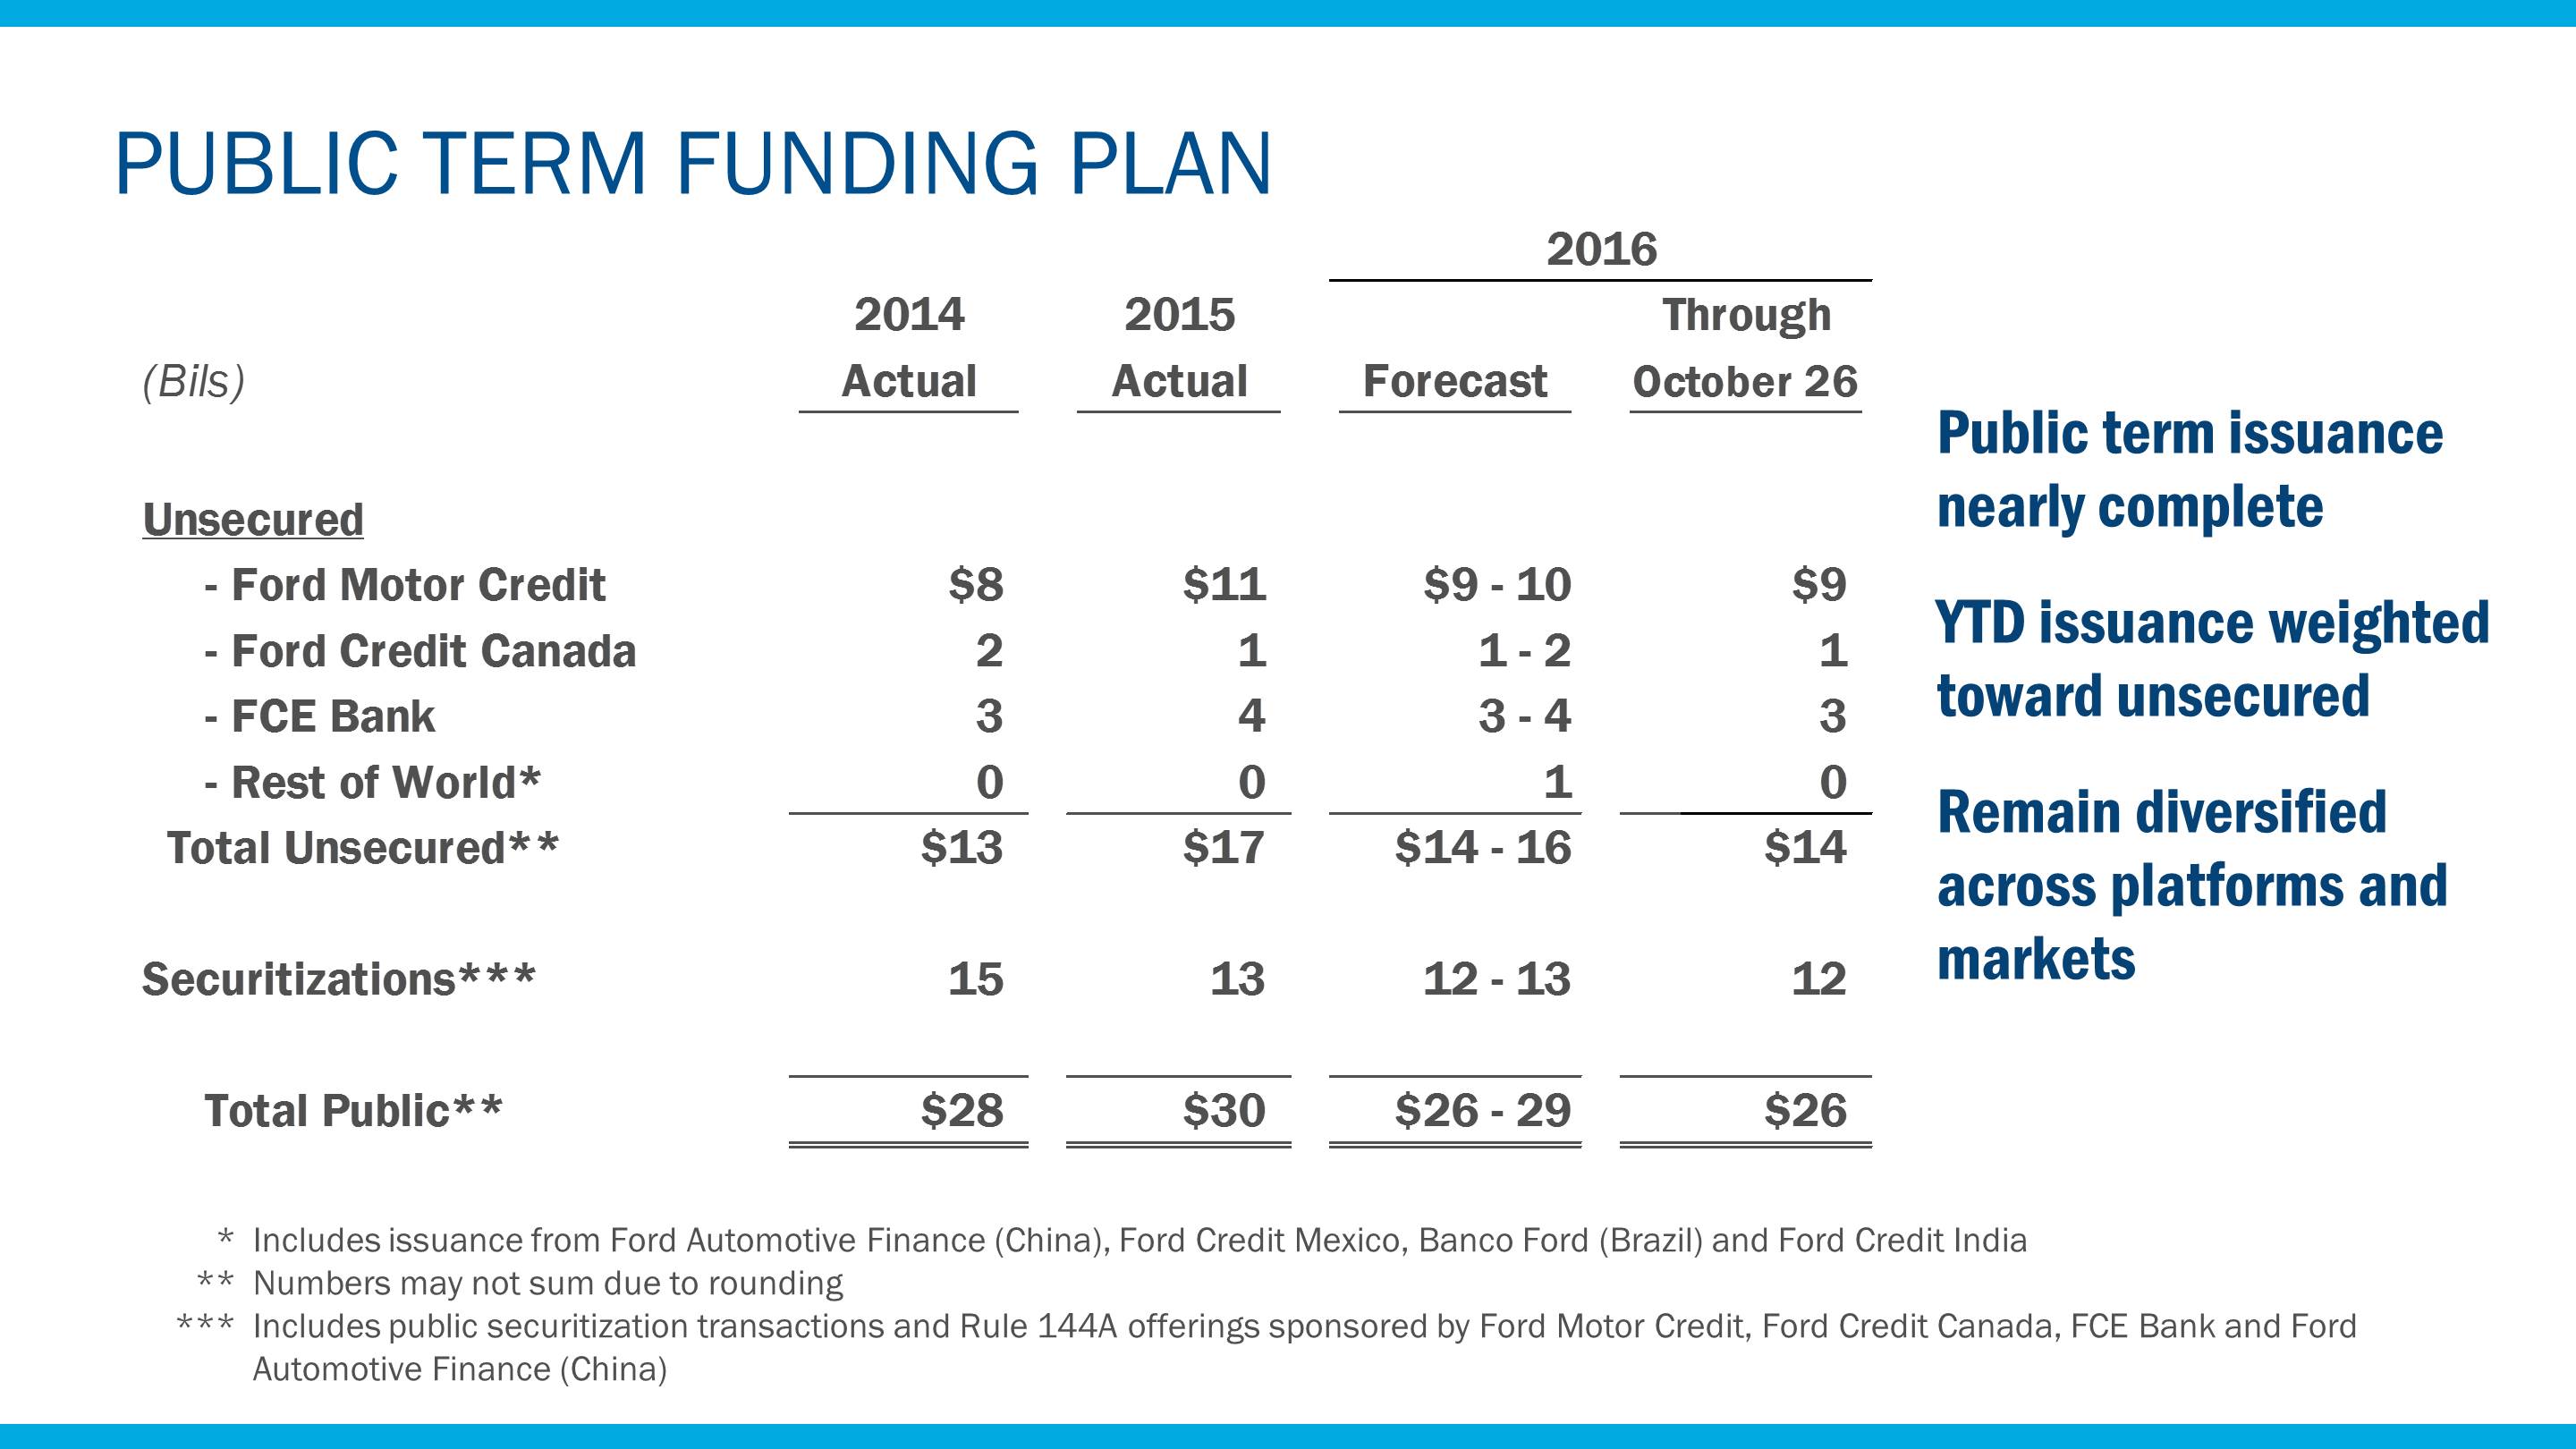
__________ | |
(a) | Includes Rule 144A offerings. |
For 2016, Ford Credit now projects full-year public term funding in the range of $26 billion to $34$29 billion. Both the amount and composition of their full-year funding plan are consistent with their issuance in 2015. Through April 27,October 26, 2016, Ford Credit has completed $14$26 billion of public term issuance, representing about halfissuance.
Item 2. Management’s Discussion and Analysis of their full-year public term funding plan.Financial Condition and Results of Operations (Continued)
Liquidity. The following chart shows Ford Credit’s liquidity sources and utilization:
Item 2. Management’s Discussion and Analysis of Financial Condition and Results of Operations (Continued)
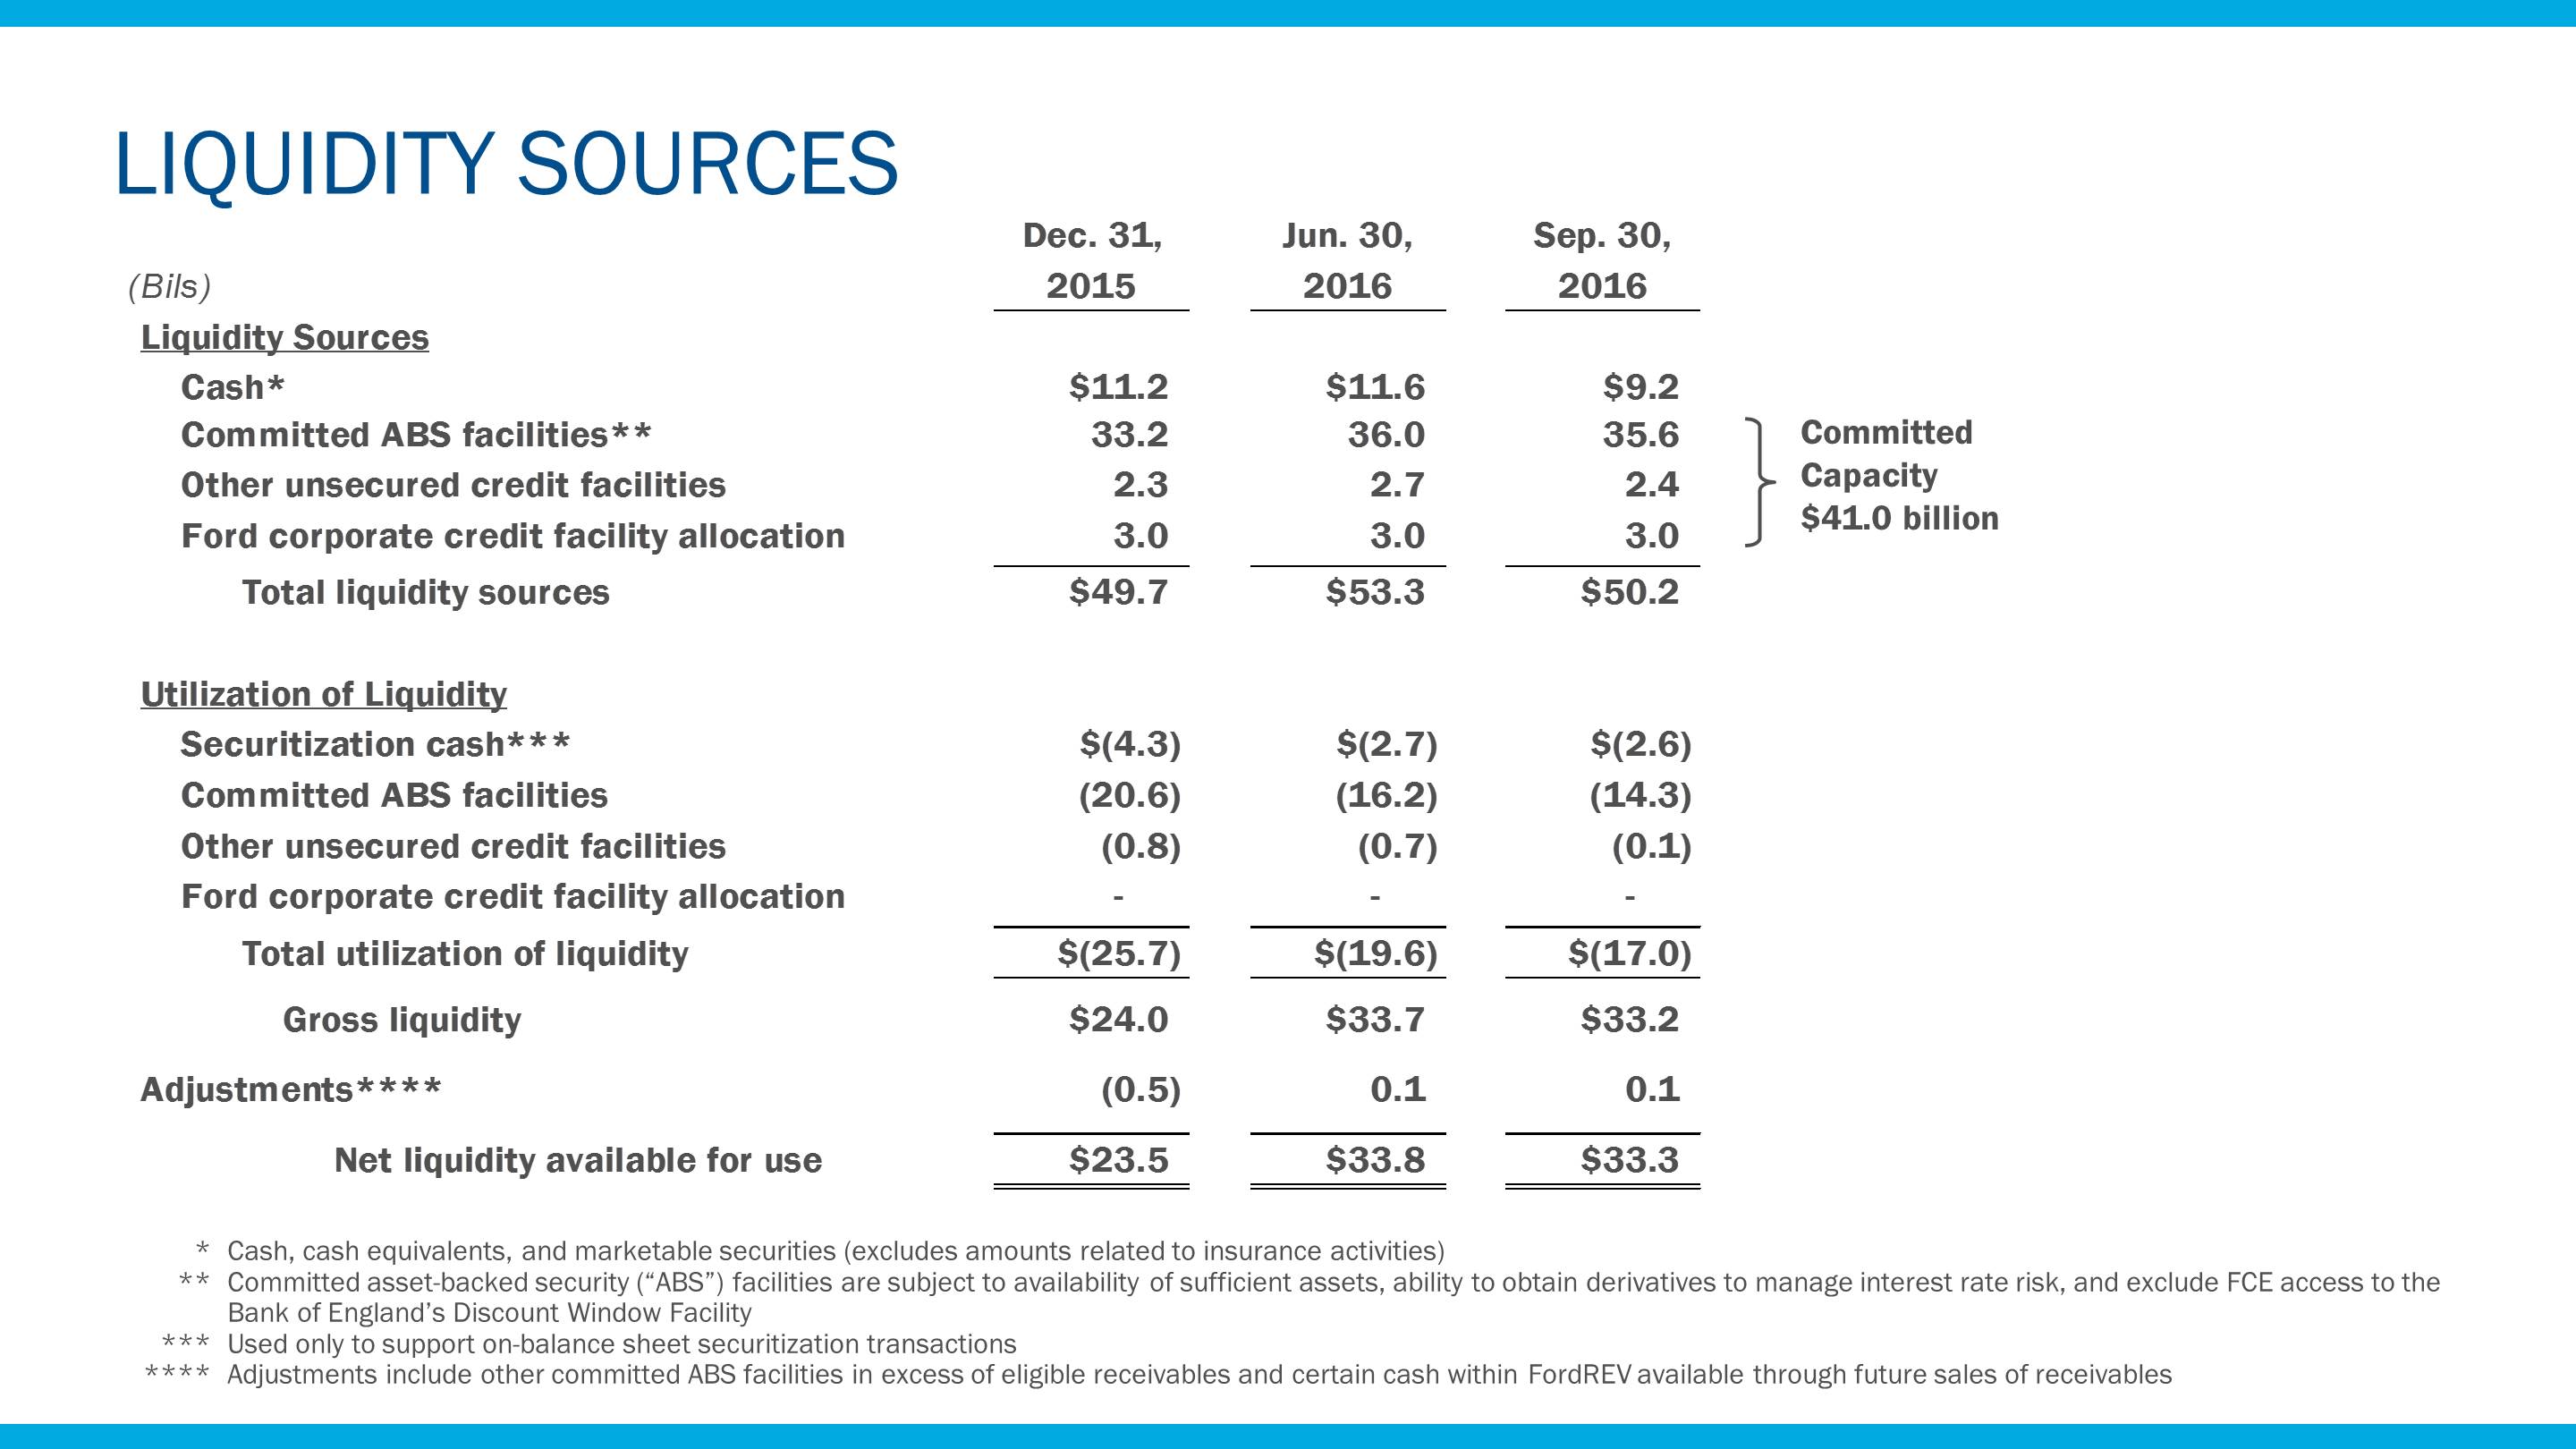
Ford Credit’s liquidity available for use will fluctuate quarterly based on factors including near-term debt maturities, receivable growth, and timing of funding transactions. Ford Credit targets liquidityhas a target of at least $25 billion. As of March 31,September 30, 2016, Ford Credit’s liquidity available for use was up $11.6$9.8 billion from year-end 2015 reflecting new committed ABS facilities and higher cash balances to meet their near-term maturities.down $500 million from second quarter 2016.
As of March 31,September 30, 2016, Ford Credit’s liquidity remained strong at $35.1$33.3 billion. Its sources of liquidity include cash, committed asset-backed facilities, unsecured credit facilities, and the corporate revolvercredit facility allocation. As of March 31,September 30, 2016, Ford Credit’s liquidity sources including cash totaled $56.8$50.2 billion, up $7.1 billion$500 million from year-end.
Item 2. Management’s Discussion and Analysis of Financial Condition and Results of Operations (Continued)
Leverage. Ford Credit uses leverage, or the debt-to-equity ratio, to make various business decisions, including evaluating and establishing pricing for finance receivable and operating lease financing, and assessing its capital structure.
The following chart shows the calculation of Ford Credit’s financial statement leverage and managed leverage (in billions, except for ratios):
Ford Credit plans its managed leverage by considering prevailing market conditions and the risk characteristics of its business. Ford Credit targetsAt September 30, 2016, financial statement leverage was 9.7:1, and managed leverage inwas 9.2:1. Managed leverage is above the targeted range of 8:1 to 9:1. Managed leverage1, but continues to trend toward the target range.
Total Company
Pension Plans - Underfunded Balances. As of September 30, 2016, our total Company pension underfunded status reported on our balance sheet was $7 billion and reflects the net underfunded status at MarchDecember 31, 2016 was above the targeted range, reflecting growth in managed receivables2015 updated for service and interest cost, expected return on assets, separation expense, actual benefit payments, and cash contributions. The discount rate and rate of expected return assumptions are unchanged from year-end 2015, and the reported number does not reflect the impact from the decline in interest rates throughout 2016.
As a result of our pension de-risking strategy, the sensitivity of our funded status to changes in interest rates has been significantly reduced, especially in the United States. In Europe, however, where our de-risking is less advanced, lower Eurozone and U.K. bond yields will negatively impact our funded status. Based on our planning assumptions for asset returns, discount rates, and contributions, we expect a strong U.S. dollar.modest deterioration in our funded status at year-end 2016 compared to year-end 2015.
Item 2. Management’s Discussion and Analysis of Financial Condition and Results of Operations (Continued)
Supplemental Financial Information
The tables below provide supplemental consolidating financial information. The data is presented by our reportable segments, Automotive and Financial Services. All Other and Adjustments include our operating segments that did not meet the quantitative threshold to qualify as a reportable segment, eliminations of intersegment transactions, deferred tax netting, and special items (if applicable). See Note 3 of the Notes to the Financial Statements for information regarding our segments.
Selected Balance Sheet Information. The following tables provide supplemental balance sheet information, by segment, at September 30, 2016 (in millions):
|
| | | | | | | | | | | | | | | | |
| Assets | | Automotive | | Financial Services | | All Other and Adjustments | | Consolidated |
| Cash and cash equivalents | | $ | 7,655 |
| | $ | 5,675 |
| | $ | 10 |
| | $ | 13,340 |
|
| Marketable securities | | 16,645 |
| | 4,180 |
| | — |
| | 20,825 |
|
| Financial Services finance receivables, net | | — |
| | 45,550 |
| | — |
| | 45,550 |
|
| Trade and other receivables, less allowances | | 4,481 |
| | 5,548 |
| | — |
| | 10,029 |
|
| Inventories | | 10,219 |
| | — |
| | — |
| | 10,219 |
|
| Other assets | | 2,372 |
| | 1,180 |
| | — |
| | 3,552 |
|
| Receivable from other segments | | 4 |
| | 589 |
| | (593 | ) | | — |
|
| Total current assets | | 41,376 |
| | 62,722 |
| | (583 | ) | | 103,515 |
|
| | | | | | | | | |
| Financial Services finance receivables, net | | — |
| | 49,614 |
| | — |
| | 49,614 |
|
| Net investment in operating leases | | 2,235 |
| | 26,961 |
| | — |
| | 29,196 |
|
| Net property | | 32,106 |
| | 151 |
| | — |
| | 32,257 |
|
| Equity in net assets of affiliated companies | | 3,633 |
| | 151 |
| | 11 |
| | 3,795 |
|
| Deferred income taxes | | 13,125 |
| | 141 |
| | (3,791 | ) | | 9,475 |
|
| Other assets | | 4,794 |
| | 2,271 |
| | 46 |
| | 7,111 |
|
| Receivable from other segments | | — |
| | 968 |
| | (968 | ) | | — |
|
| Total assets | | $ | 97,269 |
| | $ | 142,979 |
| | $ | (5,285 | ) | | $ | 234,963 |
|
|
| | | | | | | | | | | | | | | | |
| Liabilities | | Automotive | | Financial Services | | All Other and Adjustments | | Consolidated |
| Payables | | $ | 21,184 |
| | $ | 1,200 |
| | $ | — |
| | $ | 22,384 |
|
| Other liabilities and deferred revenue | | 18,550 |
| | 974 |
| | 7 |
| | 19,531 |
|
| Automotive debt payable within one year | | 2,472 |
| | — |
| | — |
| | 2,472 |
|
| Financial Services debt payable within one year | | — |
| | 44,801 |
| | — |
| | 44,801 |
|
| Payable to other segments | | 589 |
| | — |
| | (589 | ) | | — |
|
| Total current liabilities | | 42,795 |
| | 46,975 |
| | (582 | ) | | 89,188 |
|
| | | | | | | | | |
| Other liabilities and deferred revenue | | 22,913 |
| | 739 |
| | — |
| | 23,652 |
|
| Automotive long-term debt | | 10,675 |
| | — |
| | — |
| | 10,675 |
|
| Financial Services long-term debt | | — |
| | 79,276 |
| | — |
| | 79,276 |
|
| Deferred income taxes | | 239 |
| | 4,129 |
| | (3,791 | ) | | 577 |
|
| Payable to other segments | | 968 |
| | — |
| | (968 | ) | | — |
|
| Total liabilities | | $ | 77,590 |
| | $ | 131,119 |
| | $ | (5,341 | ) | | $ | 203,368 |
|
Item 2. Management’s Discussion and Analysis of Financial Condition and Results of Operations (Continued)
Selected Cash Flow Information. The following tables provide supplemental cash flow information, by segment, for the nine months ended September 30, 2016 (in millions):
|
| | | | | | | | | | | | | | | | |
| Cash flows from operating activities | | Automotive | | Financial Services | | All Other and Adjustments | | Consolidated |
| Net cash provided by /(used in) operating activities | | $ | 8,233 |
| | $ | 8,761 |
| | $ | — |
| | $ | 16,994 |
|
| | | | | | | | |
|
|
| Reconciling Adjustments to Automotive Segment Operating Cash Flows* | | | | | | |
|
|
| Automotive capital spending | | (4,879 | ) | | | | | |
|
|
| Net cash flows from non-designated derivatives | | 322 |
| | | | | | |
| Funded pension contributions | | 835 |
| | | | | |
|
|
| Separation payments | | 198 |
| | | | | | |
| Other | | 208 |
| | | | | |
|
|
| Automotive Segment Operating Cash Flows | | $ | 4,917 |
| | | | | |
|
|
_________
| |
| * | We measure and evaluate our Automotive segment operating cash flow on a different basis than Net cash provided by/(used in) operating activities in our consolidated statement of cash flows. Automotive segment operating cash flow includes additional elements management considers to be related to our Automotive operating activities, primarily capital spending and non-designated derivatives, and excludes outflows for funded pension contributions, separation payments, and other items that are considered operating cash flows under U.S. GAAP. The table above quantifies the reconciling adjustments to Net cash provided by/(used in) operating activities for the period ended September 30, 2016. |
|
| | | | | | | | | | | | | | | | |
| Cash flows from investing activities | | Automotive | | Financial Services | | All Other and Adjustments | | Consolidated |
| Capital spending | | $ | (4,879 | ) | | $ | (33 | ) | | $ | — |
| | $ | (4,912 | ) |
| Acquisitions of finance receivables and operating leases | | — |
| | (43,746 | ) | | — |
| | (43,746 | ) |
| Collections of finance receivables and operating leases | | — |
| | 30,254 |
| | — |
| | 30,254 |
|
| Purchases of equity and debt securities | | (16,249 | ) | | (5,794 | ) | | (6 | ) | | (22,049 | ) |
| Sales and maturities of equity and debt securities | | 17,654 |
| | 4,368 |
| | — |
| | 22,022 |
|
| Settlements of derivatives | | 322 |
| | 8 |
| | — |
| | 330 |
|
| Other | | 148 |
| | (61 | ) | | (44 | ) | | 43 |
|
| Investing activity (to)/from other segments | | 63 |
| | — |
| | (63 | ) | | — |
|
| Net cash provided by/(used in) investing activities | | $ | (2,941 | ) | | $ | (15,004 | ) | | $ | (113 | ) | | $ | (18,058 | ) |
|
| | | | | | | | | | | | | | | | |
| Cash flows from financing activities | | Automotive | | Financial Services | | All Other and Adjustments | | Consolidated |
| Cash dividends | | $ | (2,780 | ) | | $ | — |
| | $ | — |
| | $ | (2,780 | ) |
| Purchases of Common Stock | | (145 | ) | | — |
| | — |
| | (145 | ) |
| Net changes in short-term debt | | 252 |
| | 948 |
| | — |
| | 1,200 |
|
| Proceeds from issuance of other debt | | 330 |
| | 31,626 |
| | — |
| | 31,956 |
|
| Principal payments on other debt | | (764 | ) | | (29,255 | ) | | — |
| | (30,019 | ) |
| Other | | 46 |
| | (90 | ) | | — |
| | (44 | ) |
| Financing activity to/(from) other segments | | — |
| | (123 | ) | | 123 |
| | — |
|
| Net cash provided by/(used in) financing activities | | $ | (3,061 | ) | | $ | 3,106 |
| | $ | 123 |
| | $ | 168 |
|
| | | | | | | | | |
| Effect of exchange rate changes on cash and cash equivalents | $ | 38 |
| | $ | (74 | ) | | $ | — |
| | $ | (36 | ) |
Item 2. Management’s Discussion and Analysis of Financial Condition and Results of Operations (Continued)
Total CompanyCREDIT RATINGS
Equity. At March 31, 2016, Total equity attributable to Ford Motor Company was $29.6 billion, an increase of $963 million compared with December 31, 2015. The increase primarily reflects favorable changes in Retained earnings of $864 million related to Net income attributable to Ford Motor Company of $2.5 billion in the first three months of 2016, net of cash dividends declared of $1.6 billion; favorable changes in Accumulated other comprehensive income/(loss) of $211 million; offset partially by increases in Treasury Stock of $145 million related to stock repurchases.
Credit Ratings. Our short-term and long-term debt is rated by four credit rating agencies designated as nationally recognized statistical rating organizations (“NRSROs”) by the U.S. Securities and Exchange Commission:
DBRS Limited (“DBRS”);
Fitch, Inc. (“Fitch”);
Moody’s Investors Service, Inc. (“Moody’s”); and
Standard & Poor’s Ratings Services, a division of McGraw Hill Financial (“S&P”).
In several markets, locally-recognized rating agencies also rate us. A credit rating reflects an assessment by the rating agency of the credit risk associated with a corporate entity or particular securities issued by that entity. Rating agencies’ ratings of us are based on information provided by us and other sources. Credit ratings assigned to us from all of the NRSROs are closely associated with their opinions on Ford. Credit ratings are not recommendations to buy, sell, or hold securities, and are subject to revision or withdrawal at any time by the assigning rating agency. Each rating agency may have different criteria for evaluating company risk and, therefore, ratings should be evaluated independently for each rating agency.
The followingThere have been no rating actions have been taken by these NRSROs since the filing of our 2015Quarterly Report on Form 10-K Report:
On February 16, 2016, Moody’s upgraded Ford and Ford Credit’s long-term ratings to Baa2 from Baa3 with a stable outlook.
On February 17, 2016, DBRS upgraded Ford and Ford Credit’s long-term ratings to BBB from BBB (low) with a stable trend.
On March 11, 2016, S&P upgraded Ford and Ford Credit’s long-term ratings to BBB from BBB- with a stable outlook.10-Q for the quarter ended June 30, 2016.
The following chart summarizes certain of the credit ratings and outlook presently assigned by these four NRSROs:
|
| | | | | | | | | | | | | |
| | NRSRO RATINGS |
| | Ford | | Ford Credit | | NRSROs |
| | Issuer Default / Corporate / Issuer Rating | | Long-Term Senior Unsecured | | Outlook / Trend | | Long-Term Senior Unsecured | | Short-Term Unsecured | | Outlook / Trend | | Minimum Long-Term Investment Grade Rating |
| DBRS | BBB | | BBB | | Stable | | BBB | | R-2M | | Stable | | BBB (low) |
| Fitch | BBB-BBB | | BBB-BBB | | PositiveStable | | BBB-BBB | | F3F2 | | PositiveStable | | BBB- |
| Moody’s | N/A | | Baa2 | | Stable | | Baa2 | | P-2 | | Stable | | Baa3 |
| S&P | BBB | | BBB | | Stable | | BBB | | A-2 | | Stable | | BBB- |
Item 2. Management’s Discussion and Analysis of Financial Condition and Results of Operations (Continued)
PRODUCTION VOLUMES
The third quarter 2016 actual and fourth quarter 2016 forecast production volumes for our Automotive business units are as follows:
Production volumes above include Ford brand and JMC brand vehicles produced by our unconsolidated affiliates.
Item 2. Management’s Discussion and Analysis of Financial Condition and Results of Operations (Continued)
PRODUCTION VOLUMES (a)
Our first quarter 2016 production volumes and second quarter 2016 projected production volumes are as follows (in thousands):
|
| | | | | | | | | | | | |
| | | 2016 |
| | | First Quarter Actual | | Second Quarter Forecast |
| | | Units | | O/(U) 2015 | | Units | | O/(U) 2015 |
| North America | | 854 |
| | 131 |
| | 850 |
| | 35 |
|
| South America | | 65 |
| | (37 | ) | | 75 |
| | (19 | ) |
| Europe | | 425 |
| | (11 | ) | | 440 |
| | 37 |
|
| Middle East & Africa | | 21 |
| | — |
| | 24 |
| | 1 |
|
| Asia Pacific | | 424 |
| | 51 |
| | 345 |
| | (17 | ) |
| Total | | 1,789 |
| | 134 |
| | 1,734 |
| | 37 |
|
_________
| |
(a) | Includes Ford brand and JMC brand vehicles produced by our unconsolidated affiliates. |
Item 2. Management’s Discussion and Analysis of Financial Condition and Results of Operations (Continued)
OUTLOOK
Business Environment
We continue to expect the external environment this year to be one of growth globally with GDP expanding in the 3.1% to 3.5% range. This will be driven by the United States, a continued modest recovery in the Euro Area, growth in the United Kingdom despite increased volatility aheadOur view of the June 2016 Brexit referendum, and continued growth in China, although at a slower pace than in recent years.global business environment is as follows:
| |
| ▪ | Global growth outlook for 2016 remains modest at just under 3% |
The U.S. dollar is expected to remain strong against most major currencies, and commodity prices, including oil, are expected to remain at low levels. We expect conditions in Brazil and Russia to remain difficult through 2016.
| |
| ▪ | Full year GDP outlook reduced for United States on weak first half data; consumer spending remains solid with vehicle sales at high plateau |
| |
| ▪ | Europe growth steady; U.K. data improving after initial Brexit shock but tone heading into formal exit negotiations is driving a weaker sterling |
| |
| ▪ | China growth still supported by consumer and services sector strength, with vehicle purchase tax reduction in place through year end |
| |
| ▪ | Russia and Brazil economies show signs of bottoming out |
2016 Planning Assumptions and Key Metrics
Based on the current economic environment, our industry and GDP planning assumptions for 2016 include the following:
All in all, we see conditionssome risks to global GDP growth as being supportivepolicy uncertainty, including Brexit negotiations, adds to existing weakness in global trade flows and business investment spending. This is offset partially by a steady consumer sector in most major markets. We are updating our global GDP guidance to 2.9%, the low end of growthour prior range. For industry volumes, we are providing upward adjustments for China and Europe, with a small downward adjustment for Brazil.
Item 2. Management’s Discussion and Analysis of Financial Condition and Results of Operations (Continued)
2016 Business Unit and Total Company Guidance
We continue to expect healthy returns from North America in automotive industry sales globally and2016, with an operating margin in the 9% to 9.5% range. Excluding the door latch recall, the margin would exceed 9.5%, consistent with our original guidance for the major markets shown above.2016. We continue to expect full-year industry sales by marketSouth America’s loss to be unchanged fromgreater in 2016 than in 2015. In Europe, we continue to expect a significantly higher profit in 2016 compared to last year. In Middle East & Africa, we continue to expect a loss in 2016 compared to the small profit we earned last year. In Asia Pacific, we continue to expect a lower profit in 2016 than last year, driven by adverse China industry pricing and unfavorable exchange. For the full year, we continue to expect Ford Credit’s pre-tax profit to be about $1.8 billion.
Item 2. Management’s Discussion and Analysis of Financial Condition and Results of Operations (Continued)
Shown above is our 2016 Company Guidance, including guidance for total Company adjusted pre-tax results, which is a non-GAAP financial measure. We do not provide guidance on our net income, the comparable GAAP financial measure. Full-year net income will include potentially significant special items that have not yet occurred and are difficult to predict with reasonable certainty prior guidance.to year end, specifically pension and OPEB remeasurement gains and losses.
We have had a strong first nine months of the year, and we continue to expect 2016 full year total Company adjusted pre-tax profit to be about $10.2 billion – an outcome that would be our second best since 2000.
Item 2. Management’s Discussion and Analysis of Financial Condition and Results of Operations (Continued)
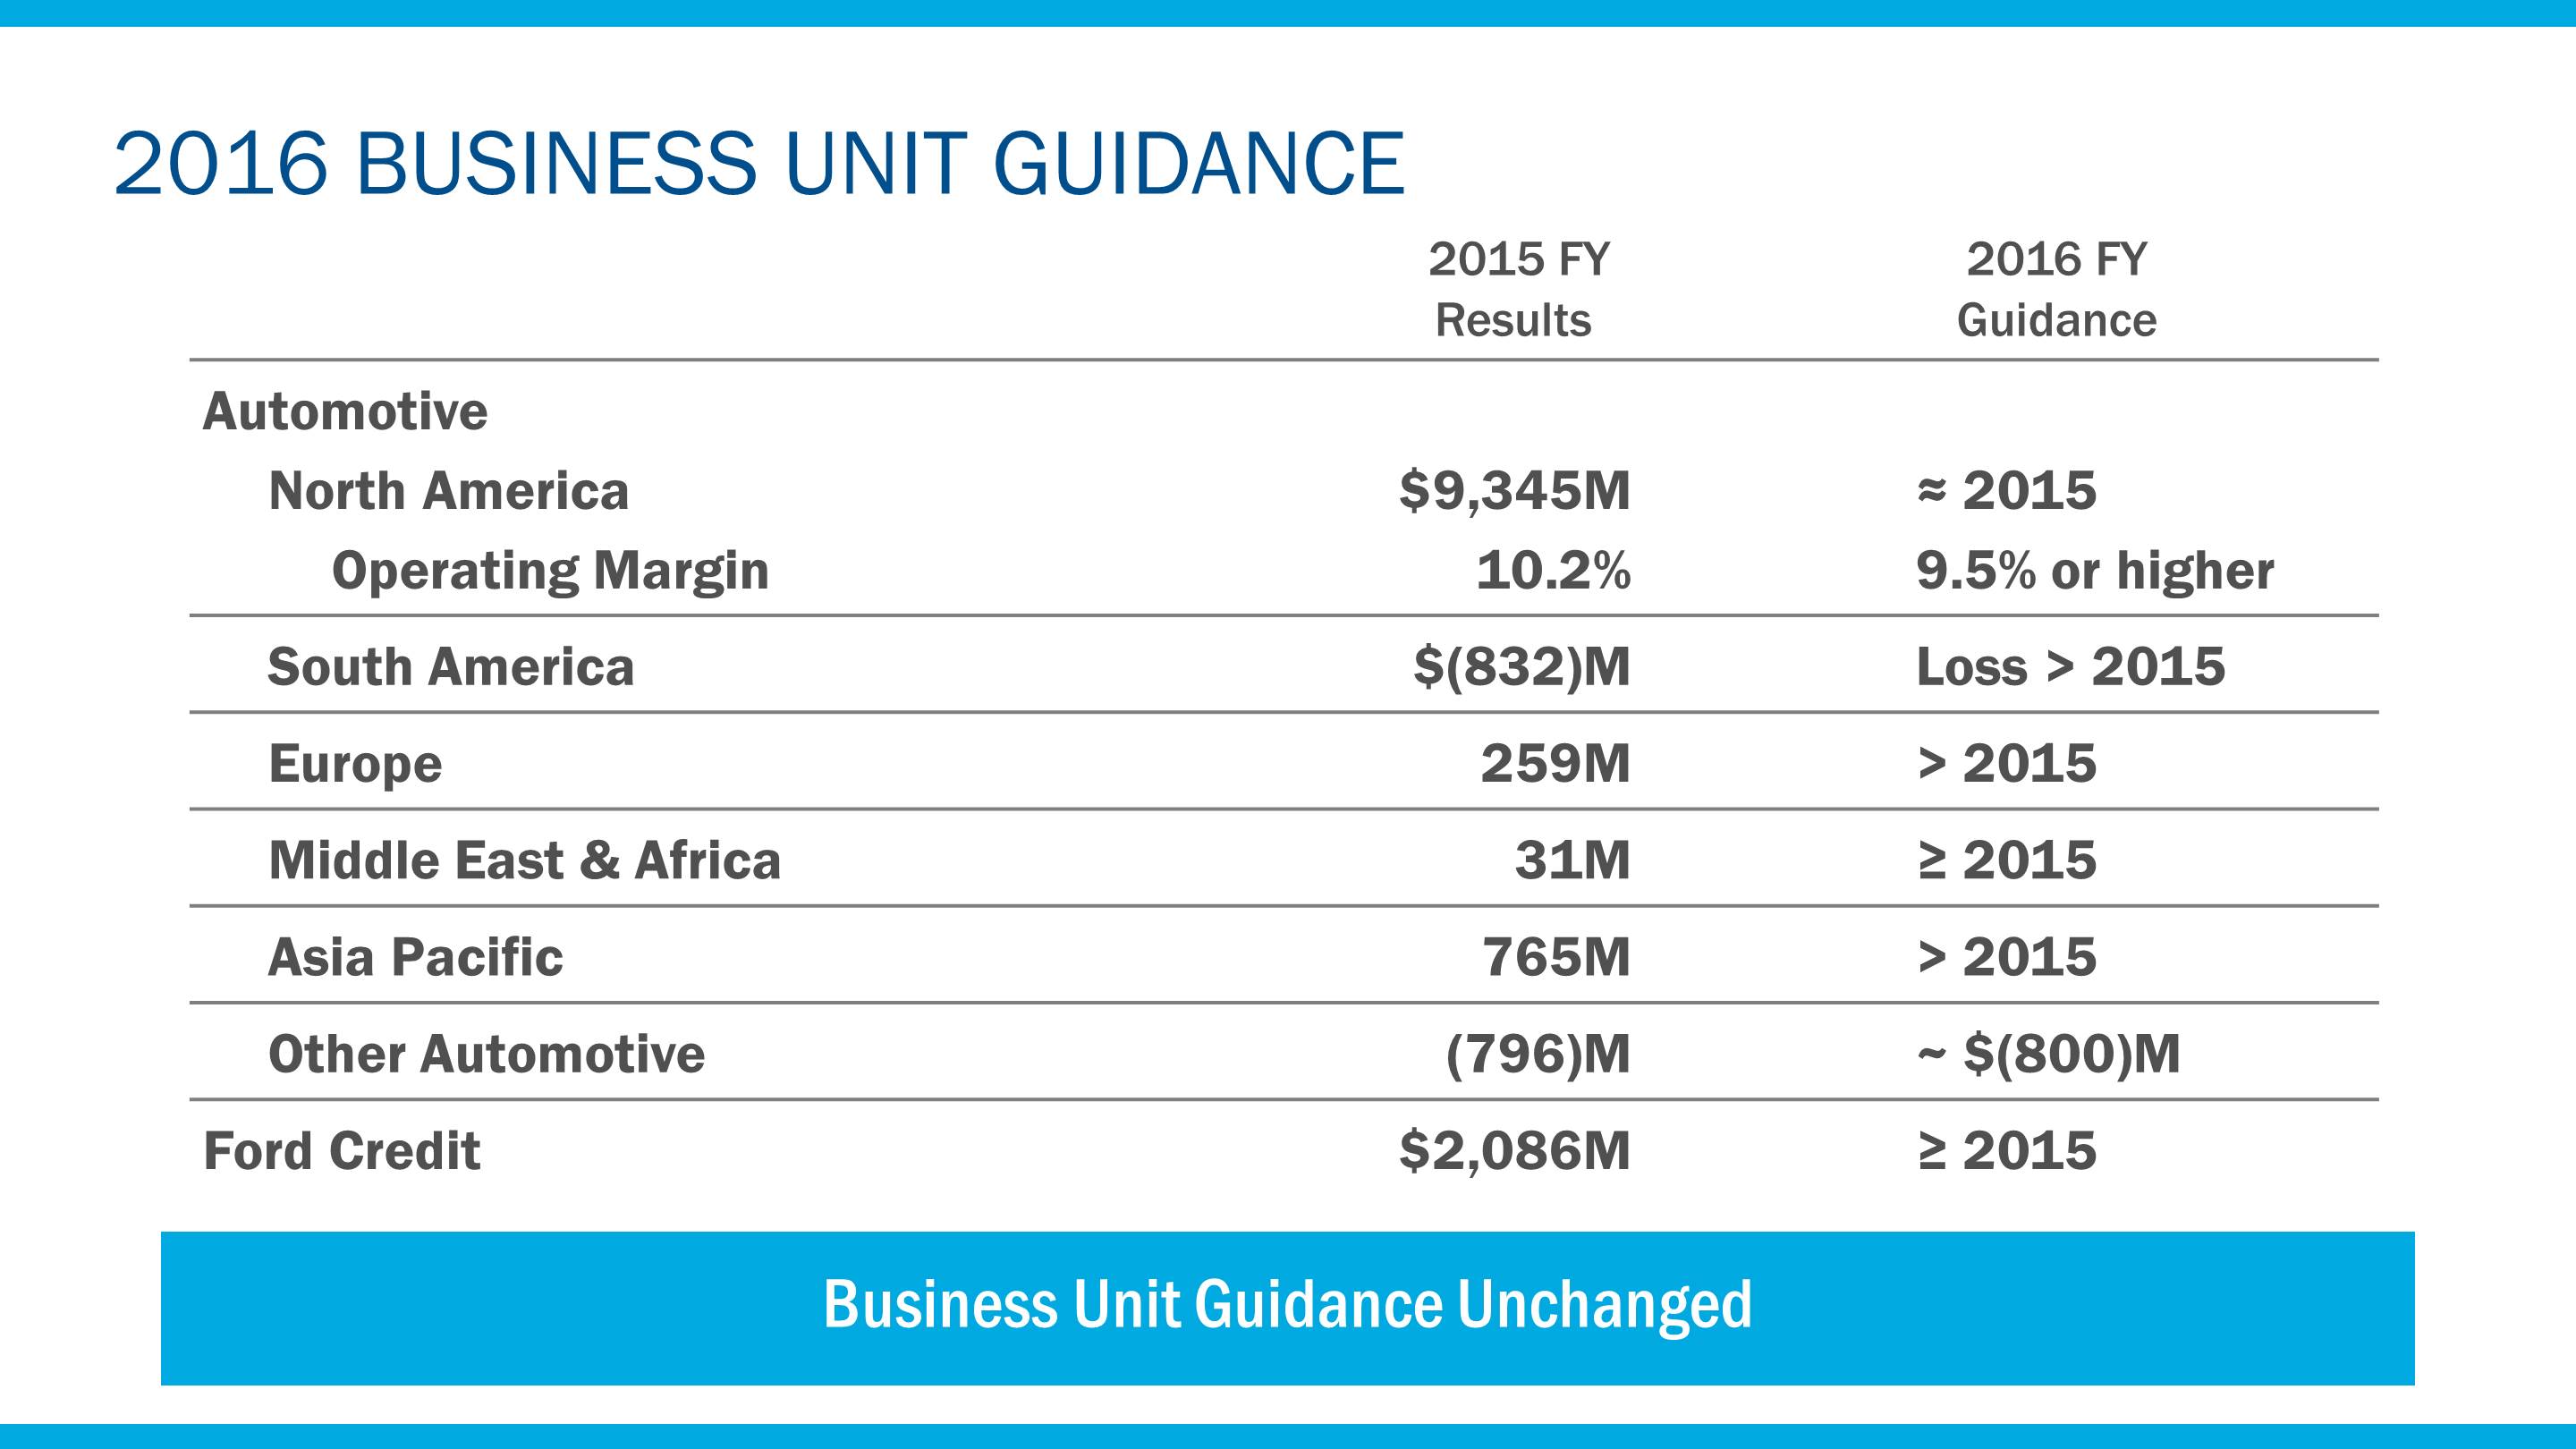
Our 2016 guidance for eachThe following charts show GAAP reconciliations of our business units is unchanged.Non-GAAP financial measures for: Adjusted Pre-Tax Profit, Adjusted Earnings Per Share, Adjusted Effective Tax Rate, and Ford Credit Managed Receivables. The GAAP reconciliation for Ford Credit Managed Leverage can be found in the Financial Services Segment section of “Liquidity and Capital Resources.”
Item 2. Management’s Discussion and Analysis of Financial Condition and Results of Operations (Continued)
Item 2. Management’s Discussion and Analysis of Financial Condition and Results of Operations (Continued)
Our 2016 Company guidance is unchanged.
Item 2. Management’s Discussion and Analysis of Financial Condition and Results of Operations (Continued)
Risk Factors
Statements included or incorporated by reference herein may constitute “forward-looking statements” within the meaning of the Private Securities Litigation Reform Act of 1995. Forward-looking statements are based on expectations, forecasts, and assumptions by our management and involve a number of risks, uncertainties, and other factors that could cause actual results to differ materially from those stated, including, without limitation:
Decline in industry sales volume, particularly in the United States, Europe, or China, due to financial crisis, recession, geopolitical events, or other factors;
Decline in Ford’s market share or failure to achieve growth;
Lower-than-anticipated market acceptance of Ford’s new or existing products or services;
Market shift away from sales of larger, more profitable vehicles beyond Ford’s current planning assumption, particularly in the United States;
An increase in or continued volatility of fuel prices, or reduced availability of fuel;
Continued or increased price competition resulting from industry excess capacity, currency fluctuations, or other factors;
Fluctuations in foreign currency exchange rates, commodity prices, and interest rates;
Adverse effects resulting from economic, geopolitical, or other events;
Economic distress of suppliers that may require Ford to provide substantial financial support or take other measures to ensure supplies of components or materials and could increase costs, affect liquidity, or cause production constraints or disruptions;
Work stoppages at Ford or supplier facilities or other limitations on production (whether as a result of labor disputes, natural or man-made disasters, tight credit markets or other financial distress, production constraints or difficulties, or other factors);
Single-source supply of components or materials;
Labor or other constraints on Ford’s ability to maintain competitive cost structure;
Substantial pension and postretirement health care and life insurance liabilities impairing liquidity or financial condition;
Worse-than-assumed economic and demographic experience for postretirement benefit plans (e.g., discount rates or investment returns);
Restriction on use of tax attributes from tax law “ownership change;”
The discovery of defects in vehicles resulting in delays in new model launches, recall campaigns, or increased warranty costs;
Increased safety, emissions, fuel economy, or other regulations resulting in higher costs, cash expenditures, and/or sales restrictions;
Unusual or significant litigation, governmental investigations, or adverse publicity arising out of alleged defects in products, perceived environmental impacts, or otherwise;
A change in requirements under long-term supply arrangements committing Ford to purchase minimum or fixed quantities of certain parts, or to pay a minimum amount to the seller (“take-or-pay” contracts);
Adverse effects on results from a decrease in or cessation or clawback of government incentives related to investments;
Inherent limitations of internal controls impacting financial statements and safeguarding of assets;
Cybersecurity risks to operational systems, security systems, or infrastructure owned by Ford, Ford Credit, or a third-party vendor or supplier;
Failure of financial institutions to fulfill commitments under committed credit and liquidity facilities;
Inability of Ford Credit to access debt, securitization, or derivative markets around the world at competitive rates or in sufficient amounts, due to credit rating downgrades, market volatility, market disruption, regulatory requirements, or other factors;
Higher-than-expected credit losses, lower-than-anticipated residual values, or higher-than-expected return volumes for leased vehicles;
Increased competition from banks, financial institutions, or other third parties seeking to increase their share of financing Ford vehicles; and
New or increased credit regulations, consumer or data protection regulations, or other regulations resulting in higher costs and/or additional financing restrictions.
We cannot be certain that any expectation, forecast, or assumption made in preparing forward-looking statements will prove accurate, or that any projection will be realized. It is to be expected that there may be differences between projected and actual results. Our forward-looking statements speak only as of the date of their initial issuance, and we do not undertake any obligation to update or revise publicly any forward-looking statement, whether as a result of new information, future events, or otherwise. For additional discussion, see “Item 1A. Risk Factors” in our 2015 Form 10-K Report, as updated by our subsequent Quarterly Reports on Form 10-Q and Current Reports on Form 8-K.
Item 2. Management’s Discussion and Analysis of Financial Condition and Results of Operations (Continued)
ACCOUNTING STANDARDS ISSUED BUT NOT YET ADOPTED
The Financial Accounting Standards Board (“FASB”) has issued the following standards, which are not expected to have a material impact (with the exception of standards 2014-09, 2016-02, 2016-09, and 2016-09)2016-13) to our financial statements or financial statement disclosures:
|
| | | |
| Standard | | Effective Date (a) |
| 2014-15 | Going Concern - Disclosure of Uncertainties about an Entity’s Ability to Continue as a Going Concern | | December 31, 2016 |
| 2016-09 | Stock Compensation - Improvements to Employee Share-Based Payment Accounting | | January 1, 2017 (b) |
| 2016-07 | Equity Method and Joint Ventures - Simplifying the Transition to the Equity Method of Accounting | | January 1, 2017 |
| 2016-06 | Derivatives and Hedging - Contingent Put and Call Options in Debt Instruments | | January 1, 2017 |
| 2016-05 | Derivatives and Hedging - Effect of Derivative Contract Novations on Existing Hedge Accounting Relationships | | January 1, 2017 |
2015-172016-16 | Income Taxes - Balance Sheet ClassificationIntra-Entity Transfers of Deferred TaxesAssets Other Than Inventory | | January 1, 20172018 |
| 2016-15 | Statement of Cash Flows - Classification of Certain Cash Receipts and Cash Payments | | January 1, 2018 |
| 2016-04 | Extinguishments of Liabilities - Recognition of Breakage for Certain Prepaid Stored-Value Products | | January 1, 2018 |
| 2016-01 | Financial Instruments - Recognition and Measurement of Financial Assets and Financial Liabilities | | January 1, 2018 |
| 2014-09 | Revenue - Revenue from Contracts with Customers | | January 1, 2018 (b) (c) |
| 2016-02 | Leases | | January 1, 2019 (b) |
| 2016-13 | Credit Losses - Measurement of Credit Losses on Financial Instruments | | January 1, 2020 (b) |
__________
(a)Early adoption for each of the standards, except standard 2016-01, is permitted.
(b)For additional information, see Note 2 of the Notes to the Financial Statements.
| |
| (c) | The FASB has issued the following updates to the Revenue from Contracts with Customers standard: Accounting Standard Update (“ASU”) 2015-14 (Deferral of the Effective Date), ASU 2016-08 (Principal versus Agent Considerations (Reporting Revenue Gross versus Net)), ASU 2016-10 (Identifying Performance Obligations and Licensing), and ASU 2016-12 (Narrow-Scope Improvements and Practical Expedients). We plan to adopt the new revenue guidance effective January 1, 2017. |
OTHER FINANCIAL INFORMATION
The interim financial information included in this Quarterly Report on Form 10-Q for the periods ended
March 31,September 30, 2016 and 2015 has not been audited by PricewaterhouseCoopers LLP (“PwC”). In reviewing such information, PwC has applied limited procedures in accordance with professional standards for reviews of interim financial information. Readers should restrict reliance on PwC’s reports on such information accordingly. PwC is not subject to the liability provisions of Section 11 of the Securities Act of 1933 for its reports on interim financial information, because such reports do not constitute “reports” or “parts” of registration statements prepared or certified by PwC within the meaning of Sections 7 and 11 of the Securities Act of 1933.
ITEM 3. Quantitative and Qualitative Disclosures About Market Risk.
Automotive Sector
Foreign Currency Risk. The net fair value of foreign exchange forward contracts (including adjustments for credit risk), as of March 31,September 30, 2016, was an asset of $380$791 million compared with an asset of $322 million as of December 31, 2015. The potential decrease in fair value from a 10% adverse change in the underlying exchange rates, in U.S. dollar terms, would be $2.5$2.7 billion at March 31,September 30, 2016, compared with $2.2 billion at December 31, 2015.
Commodity Price Risk. The net fair value of commodity forward contracts (including adjustments for credit risk) as of March 31,September 30, 2016 was a liabilityan asset of $13$6 million, compared with a liability of $24 million as of December 31, 2015. The potential decrease in fair value from a 10% adverse change in the underlying commodity prices, in U.S. dollar terms, would be $63$53 million at March 31,September 30, 2016, compared with $62 million at December 31, 2015.
Financial Services Sector
Interest Rate Risk. To provide a quantitative measure of the sensitivity of its pre-tax cash flow to changes in interest rates, Ford Credit uses interest rate scenarios that assume a hypothetical, instantaneous increase or decrease of one percentage point in all interest rates across all maturities (a “parallel shift”), as well as a base case that assumes that all interest rates remain constant at existing levels. The differences in pre-tax cash flow between these scenarios and the base case over a 12-month period represent an estimate of the sensitivity of Ford Credit’s pre-tax cash flow. Under this model, Ford Credit estimates that at March 31,September 30, 2016, all else constant, such an increase in interest rates would decreaseincrease its pre-tax cash flow by $7$5 million over the next 12 months, compared with an increase of $7 million at December 31, 2015. In reality, interest rate changes are rarely instantaneous or parallel and rates could move more or less than the one percentage point assumed in Ford Credit’s analysis. As a result, the actual impact to pre-tax cash flow could be higher or lower than the results detailed above.
ITEM 4. Controls and Procedures.
Evaluation of Disclosure Controls and Procedures. Mark Fields, our Chief Executive Officer (“CEO”), and Bob Shanks, our Chief Financial Officer (“CFO”), have performed an evaluation of the Company’s disclosure controls and procedures, as that term is defined in Rule 13a-15(e) of the Securities Exchange Act of 1934, as amended (“Exchange Act”), as of March 31,September 30, 2016, and each has concluded that such disclosure controls and procedures are effective to ensure that information required to be disclosed in our periodic reports filed under the Exchange Act is recorded, processed, summarized, and reported within the time periods specified by SEC rules and forms, and that such information is accumulated and communicated to the CEO and CFO to allow timely decisions regarding required disclosures.
Changes in Internal Control Over Financial Reporting. There were no changes in internal control over financial reporting during the quarter ended March 31,September 30, 2016 that have materially affected, or are reasonably likely to materially affect, our internal control over financial reporting.
PART II. OTHER INFORMATION
ITEM 2. Unregistered Sales of Equity Securities and Use of Proceeds.
In the first quarter of 2016, we repurchased shares of Ford Common Stock from our employees or directors related to certain exercises of stock options, in accordance with our various compensation plans. We also completed a modest anti-dilutive share repurchase program to offset the dilutive effect of share-based compensation granted during 2016. The plan authorized repurchases of up to 10.7 million shares of Ford Common Stock. |
| | | | | | | | | | | | | |
| Period | | Total Number of Shares Purchased | | Average Price Paid per Share | | Total Number of Shares Purchased as Part of Publicly- Announced Plans or Programs | | Maximum Number (or Approximate Dollar Value) of Shares that May Yet Be Purchased Under the Plans or Programs |
| January 1, 2016 through January 31, 2016 | | 1,323 |
| | $ | 13.11 |
| | — |
| | — |
|
| February 1, 2016 through February 29, 2016 | | 4,361 |
| | 12.56 |
| | — |
| | — |
|
| March 1, 2016 through March 31, 2016 | | 10,700,000 |
| | 13.50 |
| | — |
| | — |
|
| Total/Average | | 10,705,684 |
| | $ | 13.50 |
| |
|
| | |
ITEM 6. Exhibits.
Please see exhibit index below.
SIGNATURE
Pursuant to the requirements of the Securities Exchange Act of 1934, the registrant has duly caused this report to be signed on its behalf by the undersigned thereunto duly authorized.
FORD MOTOR COMPANY
|
| |
| By: | /s/ Stuart RowleyJohn Lawler |
| | Stuart Rowley,John Lawler, Vice President and Controller |
| | (principal accounting officer) |
| | |
| Date: | April 28,October 27, 2016 |
EXHIBIT INDEX
|
| | | | |
| Designation | | Description | | Method of Filing |
| Exhibit 12 | | Calculation of Ratio of Earnings to Fixed Charges. | | Filed with this Report. |
| Exhibit 15 | | Letter of PricewaterhouseCoopers LLP, dated April 28,October 27, 2016, relating to financial information. | | Filed with this Report. |
| Exhibit 31.1 | | Rule 15d-14(a) Certification of CEO. | | Filed with this Report. |
| Exhibit 31.2 | | Rule 15d-14(a) Certification of CFO. | | Filed with this Report. |
| Exhibit 32.1 | | Section 1350 Certification of CEO. | | Furnished with this Report. |
| Exhibit 32.2 | | Section 1350 Certification of CFO. | | Furnished with this Report. |
| Exhibit 101.INS | | XBRL Instance Document. | | * |
| Exhibit 101.SCH | | XBRL Taxonomy Extension Schema Document. | | * |
| Exhibit 101.CAL | | XBRL Taxonomy Extension Calculation Linkbase Document. | | * |
| Exhibit 101.LAB | | XBRL Taxonomy Extension Label Linkbase Document. | | * |
| Exhibit 101.PRE | | XBRL Taxonomy Extension Presentation Linkbase Document. | | * |
| Exhibit 101.DEF | | XBRL Taxonomy Extension Definition Linkbase Document. | | * |
__________
* Submitted electronically with this Report in accordance with the provisions of Regulation S-T.