ITEM 2. Management’s Discussion and Analysis of Financial Condition and Results of Operations.
In general, we measure period-to-periodyear-over-year changes in pre-tax resultsEBT using the causal factors listed below:
| • | Volume and Mix – Volume and Mix are primarily reflected within Net financing margin on the income statement. |
| ◦ | Volume primarily measures changes in net financing margin driven by changes in average managed receivables at prior period financing margin yield (defined below in financing margin) at prior period exchange rates. Volume changes are primarily driven by the volume of new and used |
| ◦ | Mix primarily measures changes in net financing margin driven by |
Financing Margin – Financing Margin is reflected within Net financing margin on the income statement. |
| ◦ | Financing margin variance is the period-to-period change in financing margin yield multiplied by the present period average managed receivables at prior period exchange rates. This calculation is performed at the product and country level and then aggregated. Financing margin yield equals revenue, less interest expense and scheduled depreciation for the period, divided by average managed receivables for the same period. |
| ◦ | Financing margin changes are driven by changes in revenue and interest expense. Changes in revenue are primarily driven by the level of market interest rates, cost assumptions in pricing, mix of business, and competitive environment. Changes in interest expense are primarily driven by the level of market interest rates, borrowing spreads, and asset-liability management. |
| • | Credit Loss – Credit Loss is reflected within the Provision for credit losses on the income statement. |
| ◦ | Credit loss is the change in the provision for credit losses at prior period exchange rates. For analysis purposes, management splits the provision for credit losses into net charge-offs and the change in the allowance for credit losses. |
| ◦ | Net charge-off changes are primarily driven by the number of repossessions, severity per repossession, and recoveries. Changes in the allowance for credit losses are primarily driven by changes in historical trends in credit losses and recoveries, changes in the composition and size of our present portfolio, changes in trends in historical used vehicle values, and changes in economic conditions. |
| ◦ | As of January 1, 2019, we changed our accounting method for reporting early termination losses related to customer defaults on operating leases. Prior to the first quarter of 2019, we presented the early termination loss reserve on operating leases due to customer default events as part of the allowance for credit losses which reduces Net investment in operating leases on the balance sheet. On the income statement, the incurred losses were included in Provision for credit losses. We now consider the effects of operating lease early terminations when determining depreciation estimates, which are included as part of accumulated depreciation within Net investment in operating leases on the balance sheet, and Depreciation on vehicles subject to operating leases on the income statement. We believe this change in accounting method is preferable as the characterization of these changes is better reflected as depreciation. We have reclassified prior period amounts to reflect these changes. For additional information, refer to the “Critical Accounting Estimates |
Item 2. Management’s Discussion and Analysis of Financial Condition and Results of Operations (Continued)
| • | Lease Residual – Lease Residual is primarily reflected within Depreciation on vehicles subject to operating leases on the income statement. |
| ◦ | Lease residual measures changes to residual performance at prior period exchange rates. For analysis purposes, management splits residual performance primarily into residual gains and losses, and the change in accumulated supplemental depreciation. |
| ◦ | Residual gain and loss changes are primarily driven by the number of vehicles returned to us and sold, and the difference between the auction value and the depreciated value (which includes both base and accumulated supplemental depreciation) of the vehicles sold. Changes in accumulated supplemental depreciation are primarily driven by changes in our estimate of the expected auction value at the end of the lease term, and changes in our estimate of the number of vehicles that will be returned to us and sold. With the change in accounting method discussed above, Depreciation on vehicles subject to operating leases now reflects early termination losses on operating leases due to customer default events for all periods presented. For additional information, refer to the “Critical Accounting Estimates” section of Item 7 of |
| • | Exchange – Reflects changes in EBT driven by the effects of converting functional currency income to U.S. dollars. |
| • | Other– Primarily includes Operating expenses, Other revenue, Insurance expenses, and Other income, net on the income statement at prior period exchange rates. |
| ◦ | Changes in operating expenses are primarily driven by salaried personnel costs, facilities costs, and costs associated with the origination and servicing of customer contracts. |
| ◦ | In general, |
In addition, the following definitions and calculations apply to the chartstables contained in Item 2 of this report:
| • | Cash (as shown in the Funding Structure, Liquidity, and Leverage tables) – Cash and cash equivalents and Marketable securities reported on Ford Credit’s balance sheet, excluding amounts related to insurance activities |
| • | Debt (as shown in the Key Metrics and Leverage tables) – Debt on Ford Credit’s balance sheet. Includes debt issued in securitizations and payable only out of collections on the underlying securitized assets and related enhancements. Ford Credit holds the right to receive the excess cash flows not needed to pay the debt issued by, and other obligations of, the securitization entities that are parties to those securitization transactions |
| • | Earnings Before Taxes (EBT) – Reflects Income before income taxes as reported on Ford Credit’s income statement |
| • | Return on Equity (ROE) (as shown in the Key Metrics table) – Reflects return on equity calculated by annualizing net income for the period and dividing by monthly average equity for the period |
| • | Securitizations (as shown in the Public Term Funding Plan table) – Public securitization transactions, Rule 144A offerings sponsored by Ford Credit, and widely distributed offerings by Ford Credit Canada |
| • | Securitization Cash (as shown in the Liquidity table) – Cash held for the benefit of the securitization investors (for example, a reserve fund) |
| • | Term Asset-Backed Securities (as shown in the Funding Structure table) – Obligations issued in securitization transactions that are payable only out of collections on the underlying securitized assets and related enhancements |
Item 2. Management’s Discussion and Analysis of Financial Condition and Results of Operations (Continued)
| • | Total Net Receivables (as shown in the Key Metrics and Financial Condition tables) – Includes finance receivables (retail financing and wholesale) sold for legal purposes and net investment in operating leases included in securitization transactions that do not satisfy the requirements for accounting sale treatment. These receivables and operating leases are reported on Ford Credit’s balance sheet and are available only for payment of the debt issued by, and other obligations of, the securitization entities that are parties to those securitization transactions; they are not available to pay the other obligations of Ford Credit or the claims of Ford Credit’s other creditors |
| • | Unallocated Other (as shown in the Segment Results table) – Items excluded in assessing segment performance because they are managed at the corporate level, including market valuation adjustments to derivatives and exchange-rate fluctuations on foreign currency-denominated transactions |
Key Metrics
| Third Quarter | First Nine Months | ||||||||||||||||||||||
| GAAP Financial Measures | 2018 | 2019 | H / (L) | 2018 | 2019 | H / (L) | |||||||||||||||||
| Net Receivables (billions) | $ | 144 | $ | 140 | (3 | )% | $ | 144 | $ | 140 | (3 | )% | |||||||||||
| Loss-to-Receivables (bps) (a) | 51 | 51 | — | 50 | 48 | (2 | ) | ||||||||||||||||
| Auction Values (b) | $ | 19,190 | $ | 18,865 | (2 | )% | $ | 18,415 | $ | 18,160 | (1 | )% | |||||||||||
| EBT (millions) | $ | 678 | $ | 736 | $ | 58 | $ | 1,964 | $ | 2,368 | $ | 404 | |||||||||||
| ROE (%) | 13 | % | 15 | % | 2 ppts | 14 | % | 16 | % | 2 ppts | |||||||||||||
| Other Balance Sheet Metrics | |||||||||||||||||||||||
| Debt (billions) | $ | 138 | $ | 139 | 1 | % | |||||||||||||||||
| Net Liquidity (billions) | $ | 29 | $ | 35 | 22 | % | |||||||||||||||||
| Financial Statement Leverage (to 1) | 9.1 | 9.8 | 0.7 | ||||||||||||||||||||
| (a) | U.S. Retail financing only, previously included both retail financing and operating leases |
| (b) | U.S. 36-month off-lease third quarter auction values at 3Q 2019 mix and YTD amounts at 2019 YTD mix |
| Non-GAAP Financial Measures | September 30, 2018 | September 30, 2019 | H / (L) | |||||||||||||
| Managed Receivables (billions) (a) | $ | 152 | $ | 149 | (2 | )% | ||||||||||
| Managed Leverage (to 1) (b) | 8.4 | 8.8 | 0.4 | |||||||||||||
__________
| (a) | See “Financial Condition” section for reconciliation to GAAP |
| (b) | See “Leverage” section for reconciliation to GAAP |
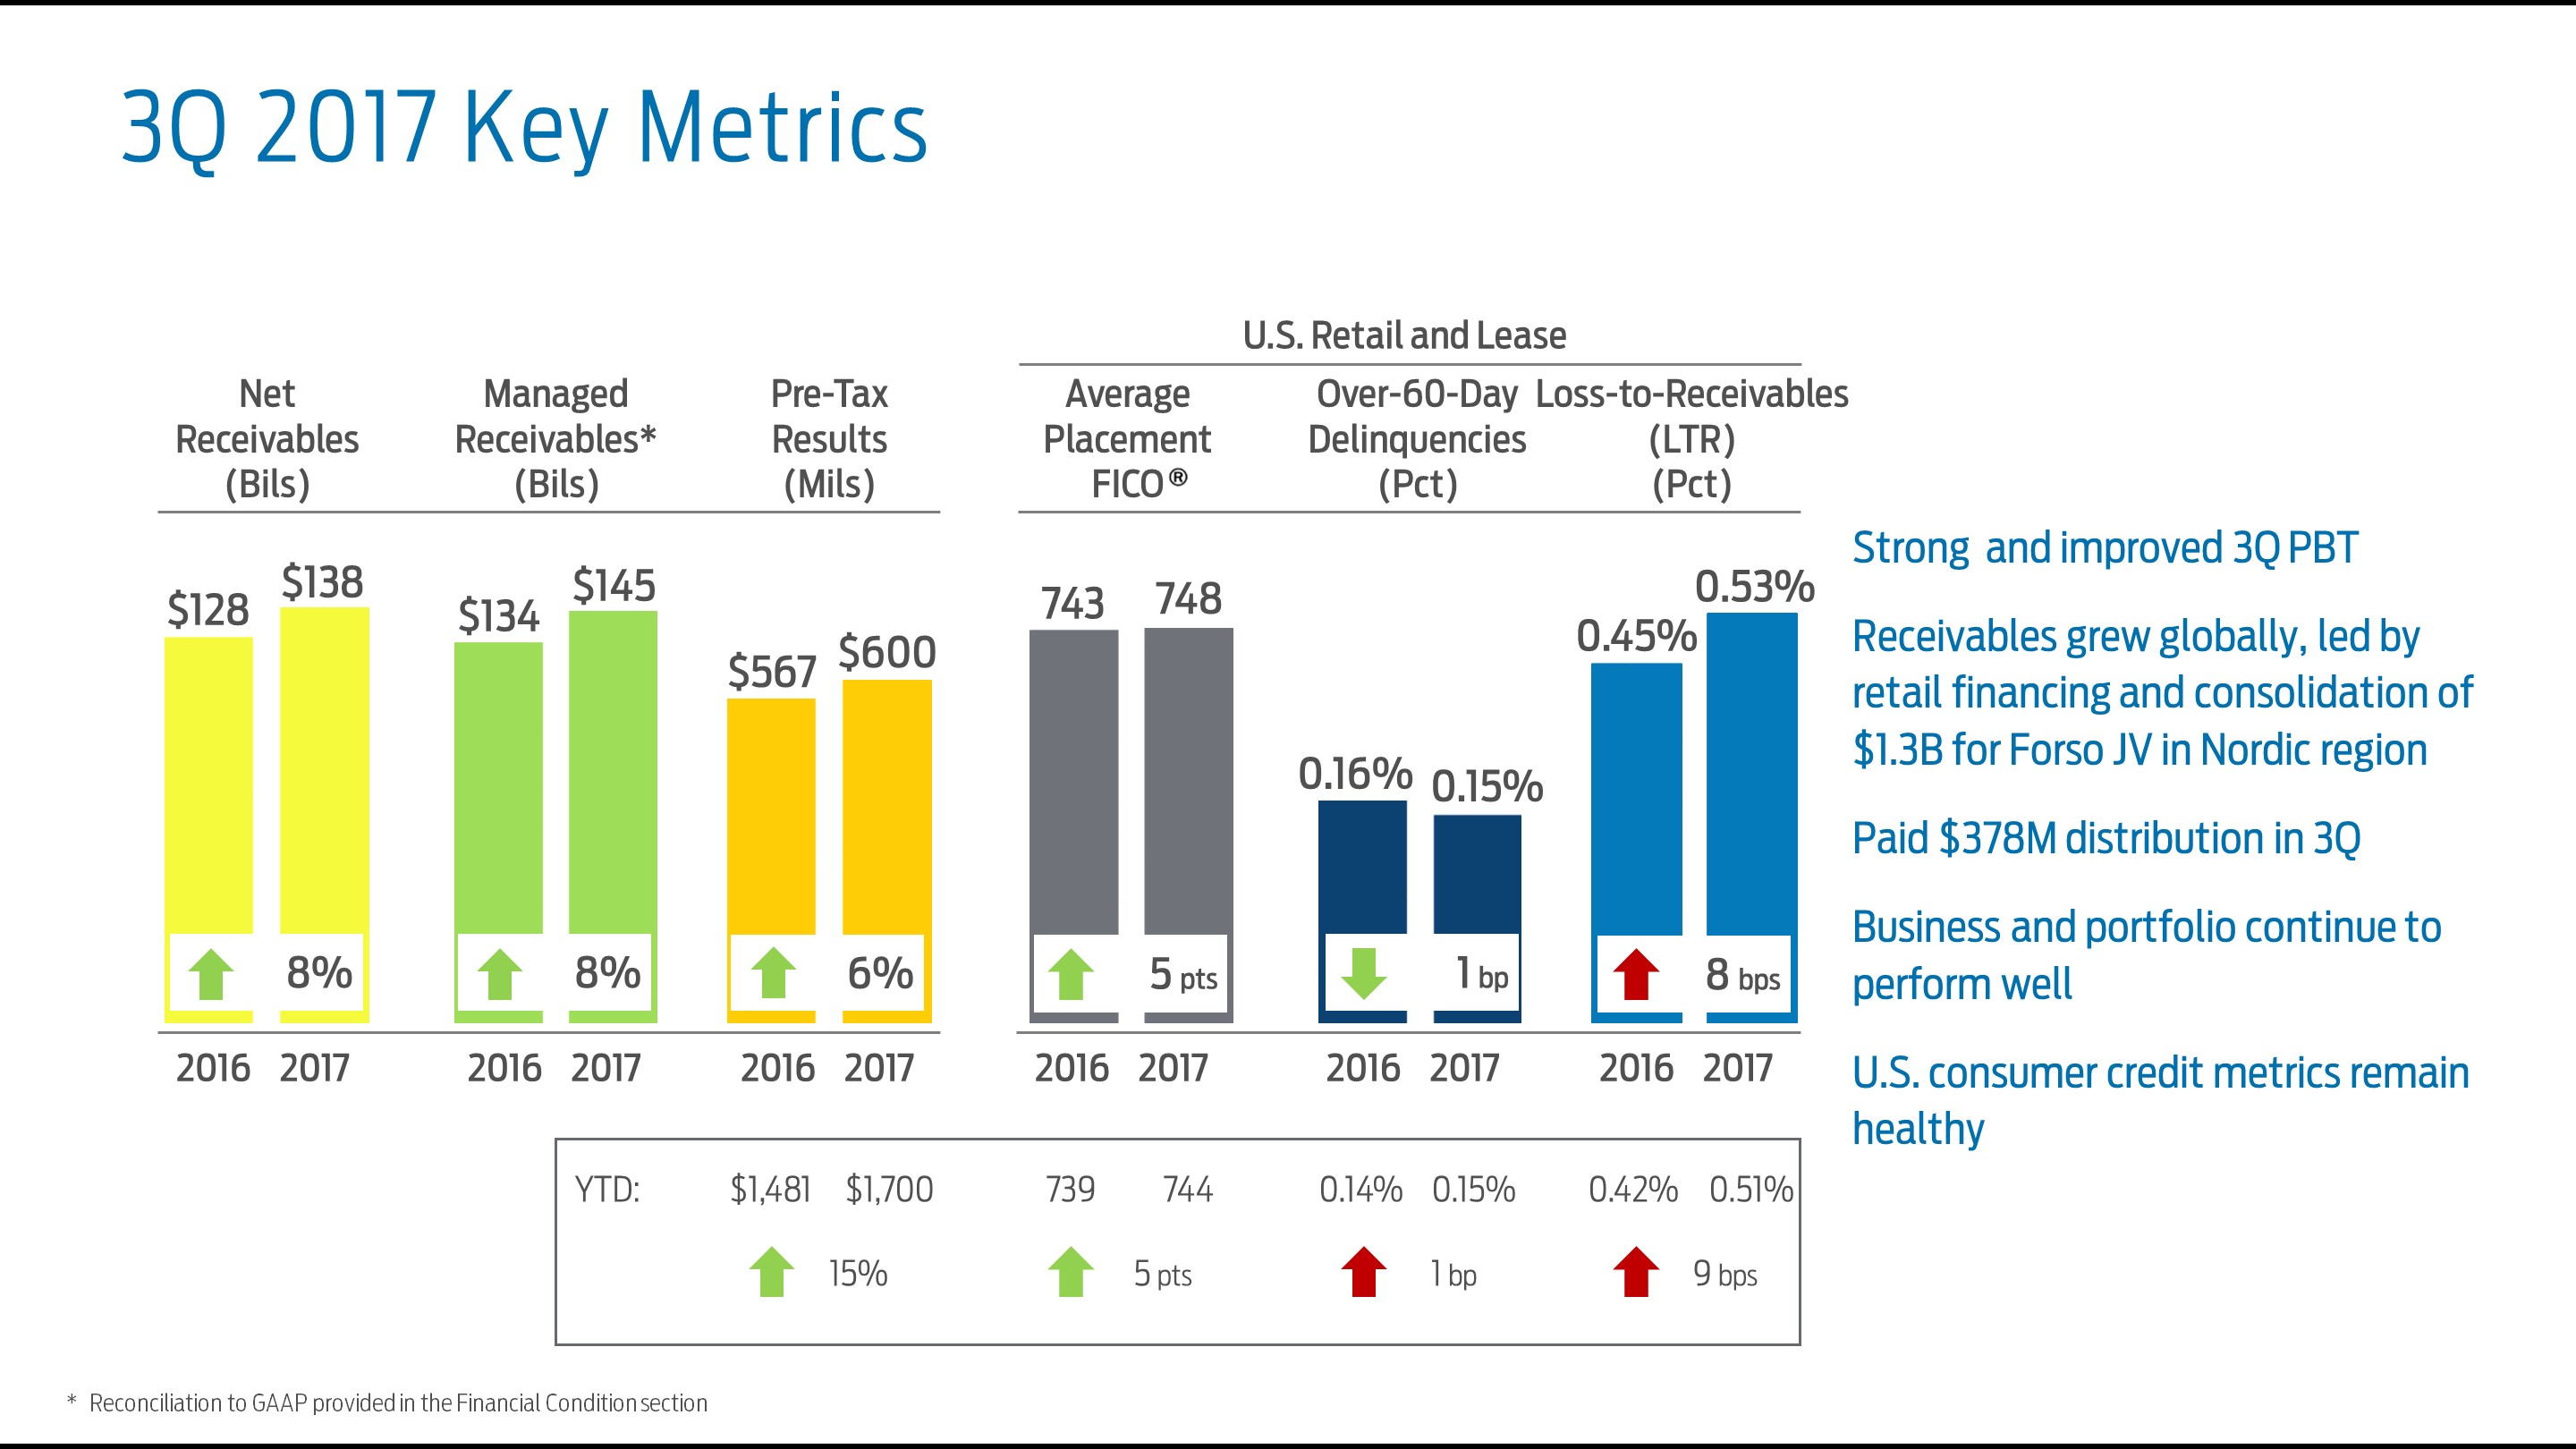
In the third quarter of 2017, pre-tax profit of $6002019, EBT was $736 million, improved from last year.$58 million higher than a year ago. Receivables were higher with growth globally led by retail receivables and the consolidation of $1.3 billion in receivables for the Forso joint venturelower than a year ago. Consumer credit metrics were healthy in the Nordic region (“Forso”). For additional information, see Note 1 of our Notes toUnited States, with the Financial Statements.
27
Item 2. Management’s Discussion and Analysis of Financial Condition and Results of Operations (Continued)
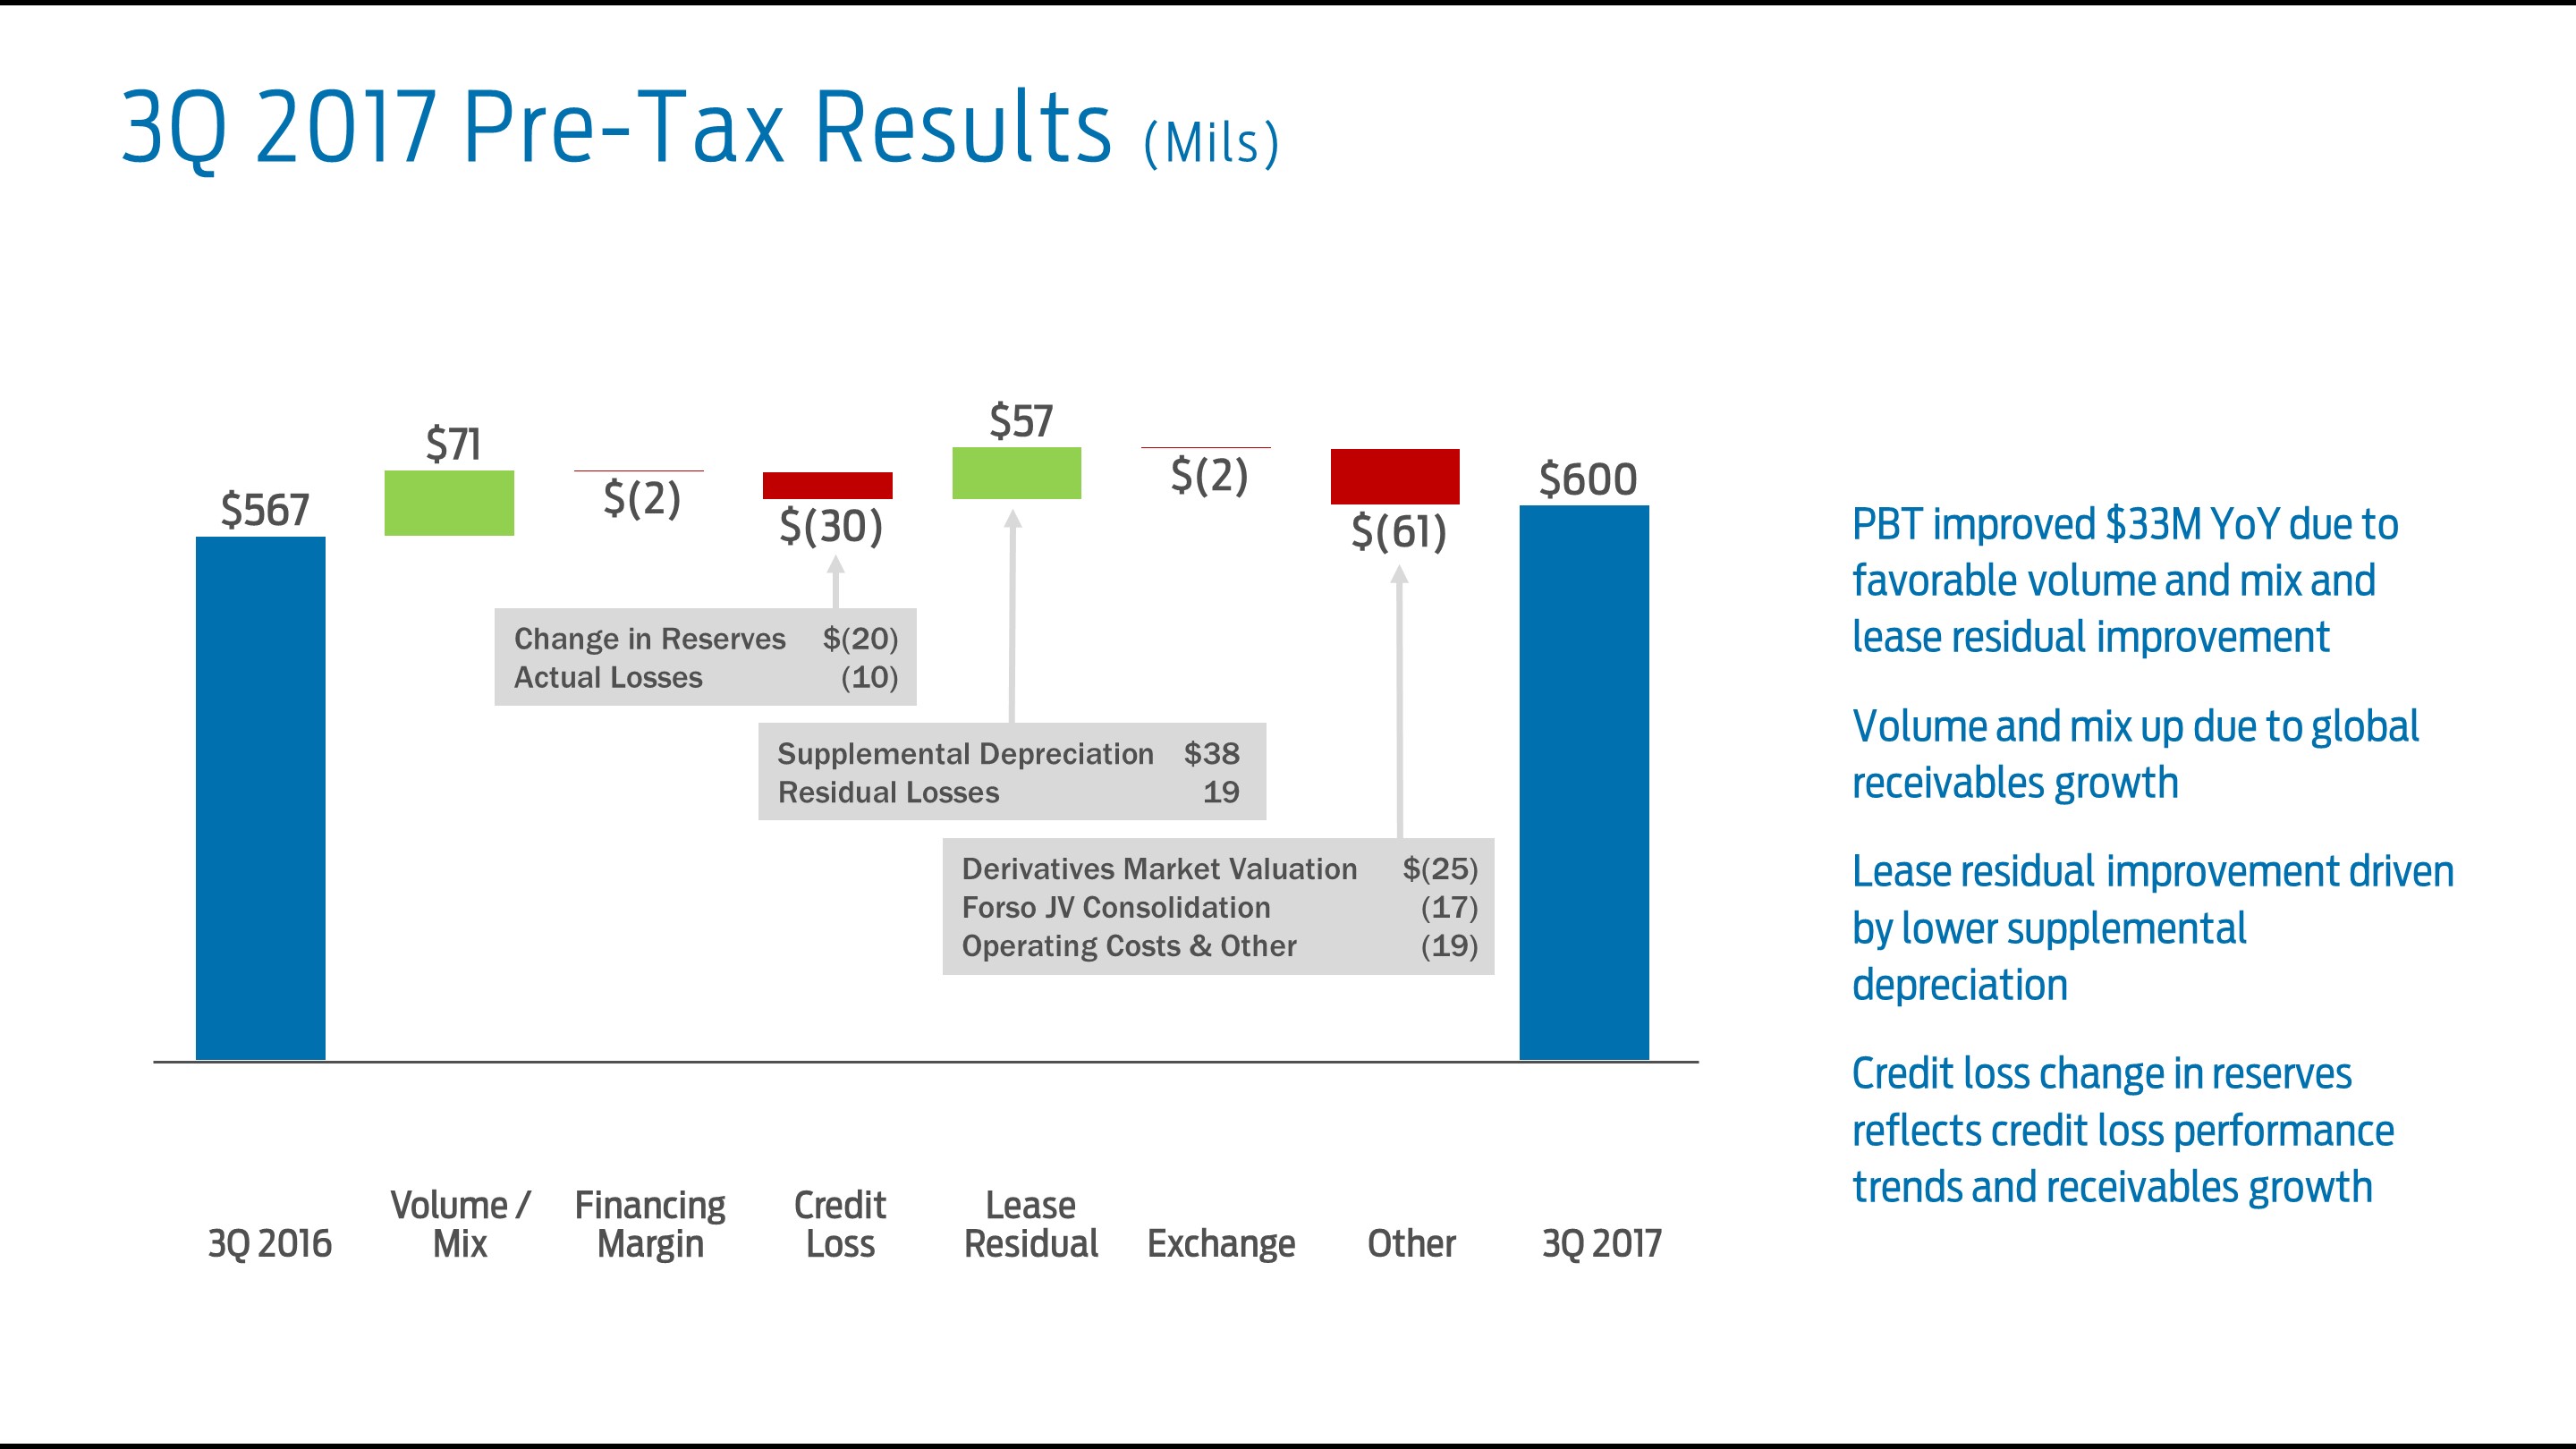
The following charttable shows the factors that contributed to the strong third quarter pre-tax profit:EBT (in millions):
| Change in EBT by Causal Factor | ||||||||||||
| Third Quarter 2018 EBT | $ | 678 | ||||||||||
| Volume / Mix | (19 | ) | ||||||||||
| Financing Margin | 5 | |||||||||||
| Credit Loss | 34 | |||||||||||
| Lease Residual | 6 | |||||||||||
| Exchange | (8 | ) | ||||||||||
| Other | 40 | |||||||||||
| Third Quarter 2019 EBT | $ | 736 | ||||||||||
28
Item 2. Management’s Discussion and Analysis of Financial Condition and Results of Operations (Continued)
Segment Results
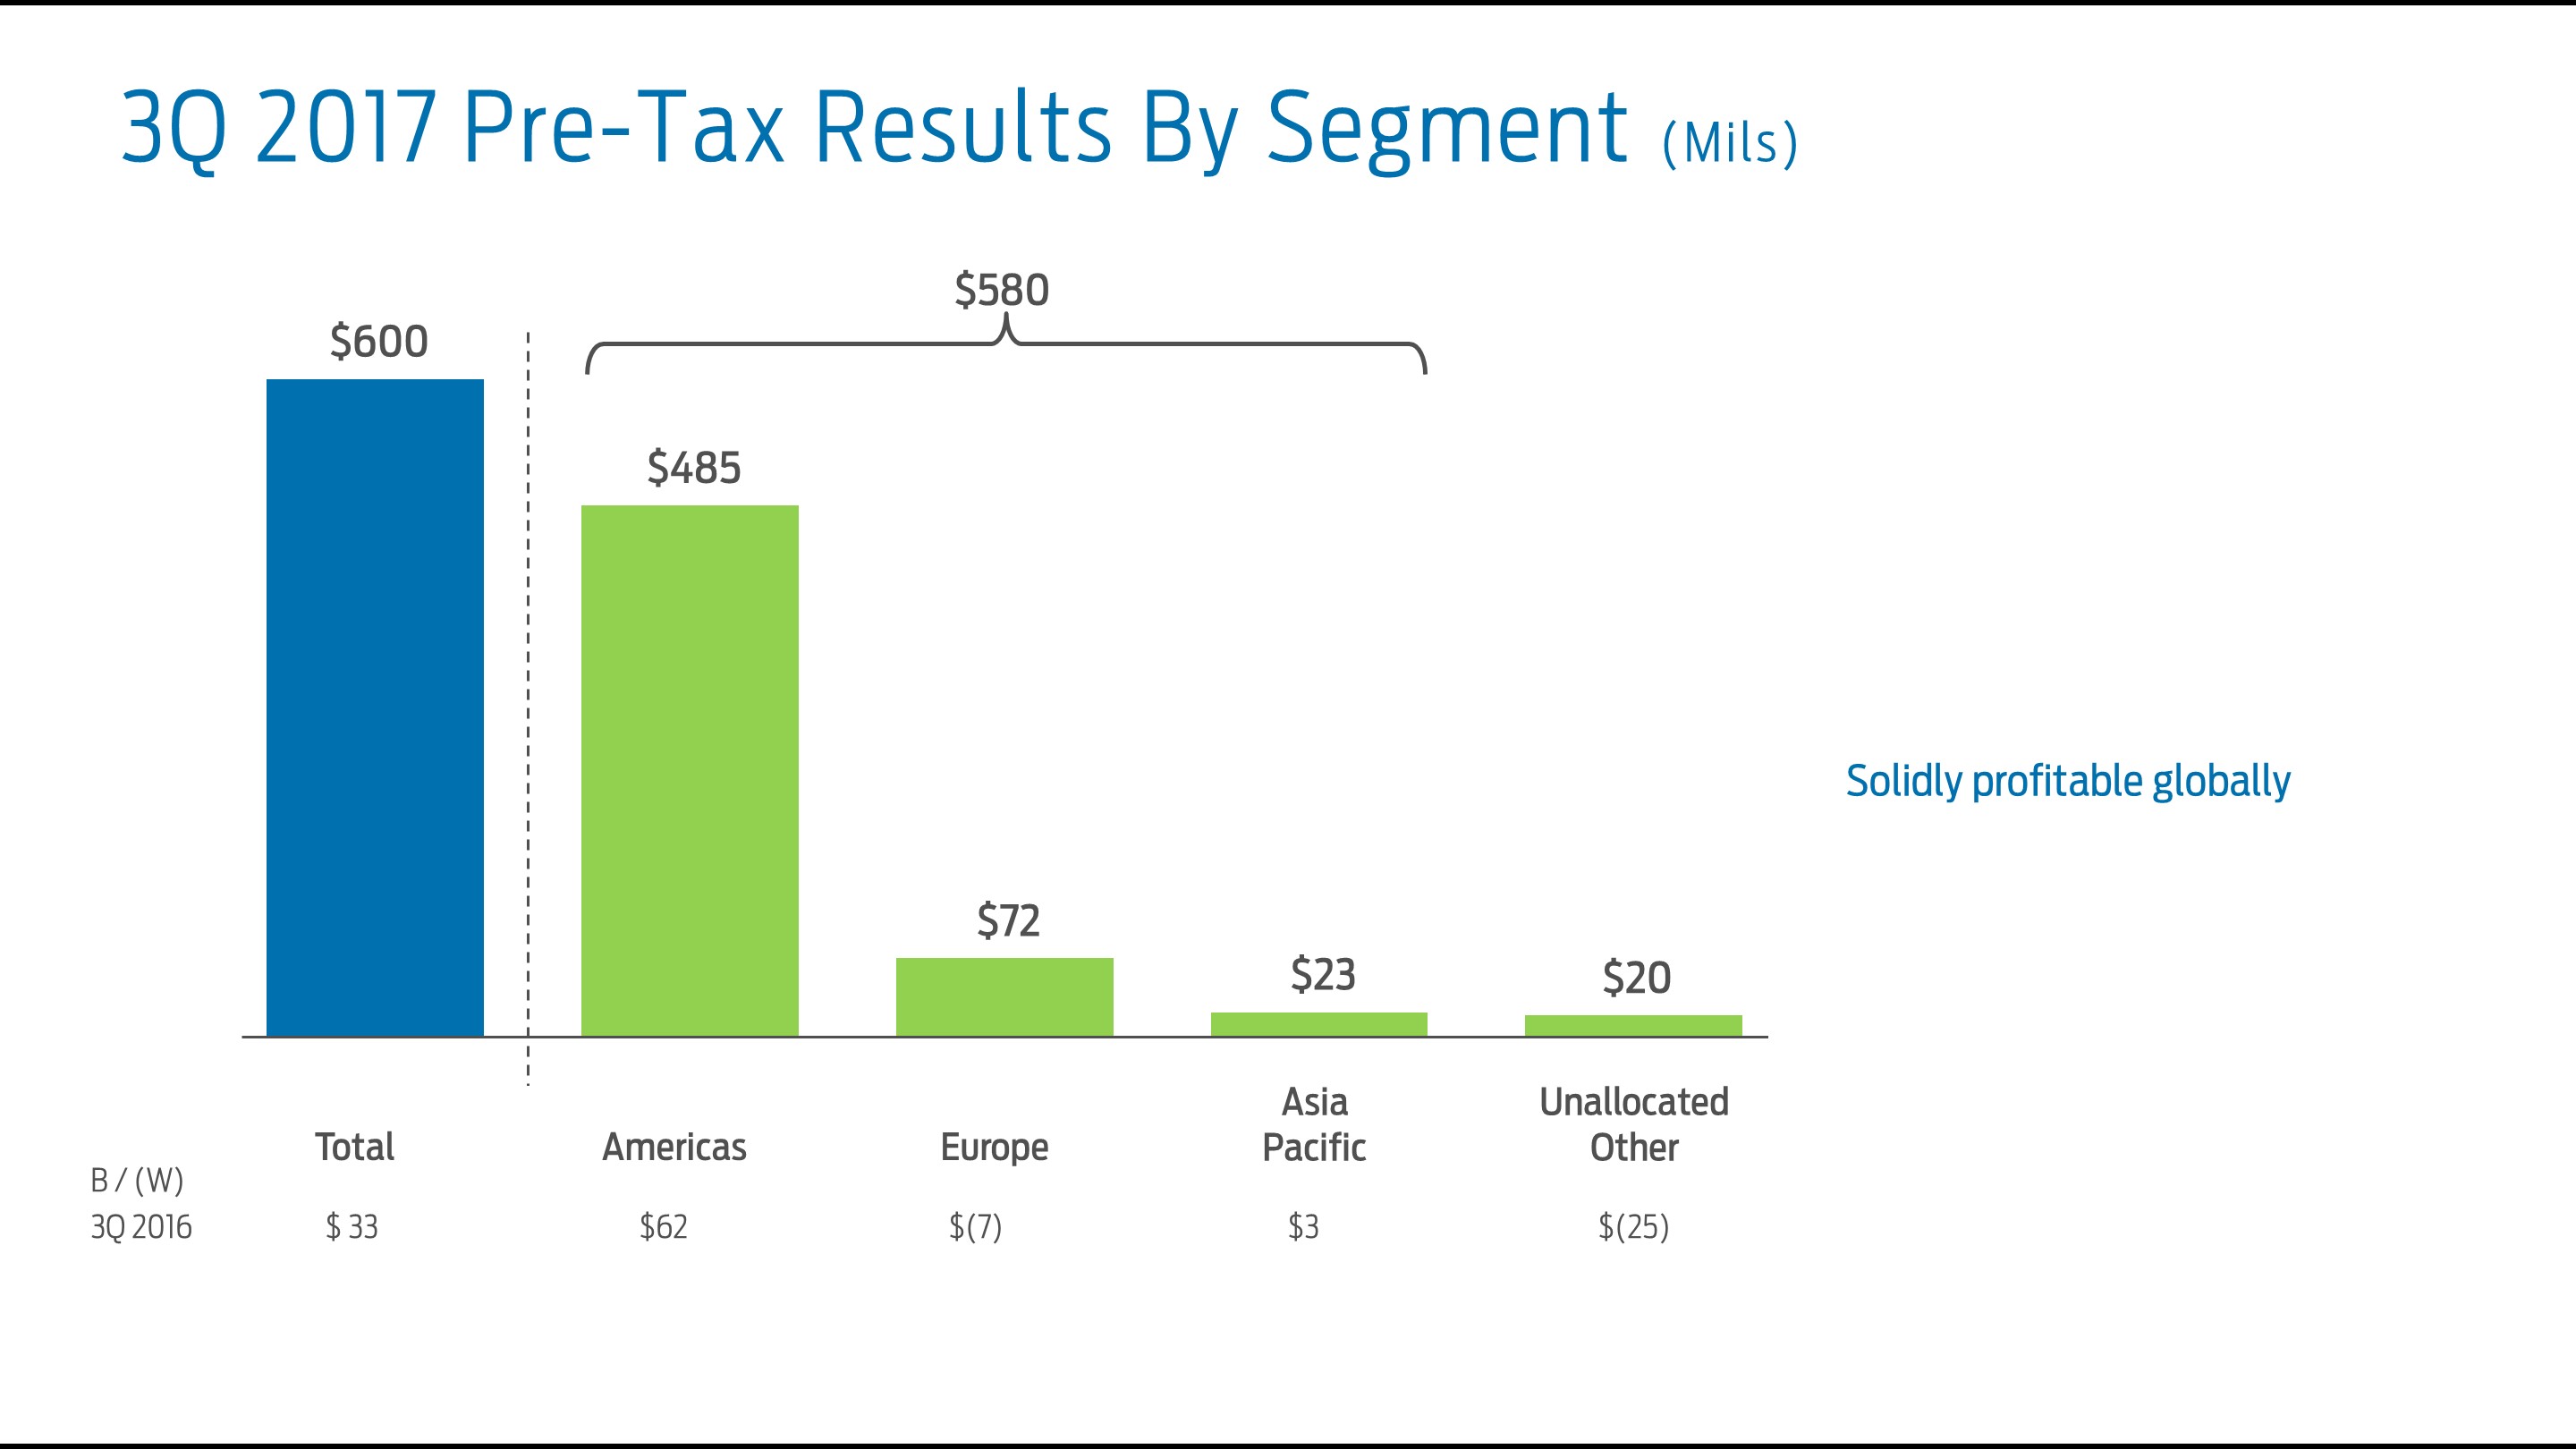
We have three reportable segments in our consolidated financial statements that align with our management reporting structure and reflect the manner in which our Chief Operating Decision Maker manages our business, including resource allocation and performance assessment. These segments are: the Americas, Europe, and Asia Pacific. Items excluded in assessing segment performance, because they are managed at the corporate level, are reflected in Unallocated Other. Results of operations by segment and Unallocated Other for the periodperiods ended September 30 are shown below (in millions). :
| Third Quarter | First Nine Months | ||||||||||||||||||||||
| 2018 | 2019 | H / (L) | 2018 | 2019 | H / (L) | ||||||||||||||||||
| Results | |||||||||||||||||||||||
| Americas segment | $ | 556 | $ | 584 | $ | 28 | $ | 1,619 | $ | 1,836 | $ | 217 | |||||||||||
| Europe segment | 89 | 82 | (7 | ) | 303 | 314 | 11 | ||||||||||||||||
| Asia Pacific segment | 13 | 15 | 2 | 86 | 64 | (22 | ) | ||||||||||||||||
| Total segments | $ | 658 | $ | 681 | $ | 23 | $ | 2,008 | $ | 2,214 | $ | 206 | |||||||||||
| Unallocated other | 20 | 55 | 35 | (44 | ) | 154 | 198 | ||||||||||||||||
| Earnings before taxes | $ | 678 | $ | 736 | $ | 58 | $ | 1,964 | $ | 2,368 | $ | 404 | |||||||||||
| (Provision for) / Benefit from income taxes | (160 | ) | (165 | ) | (5 | ) | (266 | ) | (581 | ) | (315 | ) | |||||||||||
| Net Income | $ | 518 | $ | 571 | $ | 53 | $ | 1,698 | $ | 1,787 | $ | 89 | |||||||||||
For additional information, see Note 14 of our Notes to the Financial Statements.
Americas Segmentsegment
The Americas Segmentsegment third quarter pre-tax profit is2019 EBT of $584 million was $28 million higher compared with 2016,third quarter 2018, explained primarily by favorable credit loss performance, driven by the non-recurrence of a non-consumer loss recognized in the third quarter of 2018, and favorable operating lease residual performance, drivenpartially offset by lower supplemental depreciation on the lease portfolio.
Europe Segmentsegment
The Europe Segment segment third quarter pre-tax profit is2019 EBT of $82 million was $7 million lower compared with 2016,third quarter 2018, explained primarily by a pre-taxunfavorable changes in lease residual value reserves and credit loss of $17 million upon consolidation of our Forso joint venture in the Nordic region,performance, partially offset by favorable volume and mix.
Asia Pacific segment
The Asia Pacific Segment pre-tax profitsegment third quarter 2019 EBT of $69$15 million was $2 million higher compared with third quarter 2018, explained primarily by favorable credit loss and financing margin performance, partially offset by unfavorable volume and mix. Asia Pacific segment EBT of $64 million for the first nine months of 2017 is $232019 was $22 million higherlower compared with 2016,a year ago, explained primarily by favorableunfavorable volume and mix, partially offset by lowerfavorable credit loss and financing margin driven by higher borrowing cost.performance.
Unallocated Other
Unallocated Other was a $55 million gain for third quarter 2019, a $35 million improvement from third quarter 2018, reflecting favorable performance in market valuation adjustments to derivatives. Unallocated Other was a $154 million gain for the first nine months of 2019, a $198 million improvement compared with a year ago, reflecting favorable performance in market valuation adjustments to derivatives.
29
Item 2. Management’s Discussion and Analysis of Financial Condition and Results of Operations (Continued)
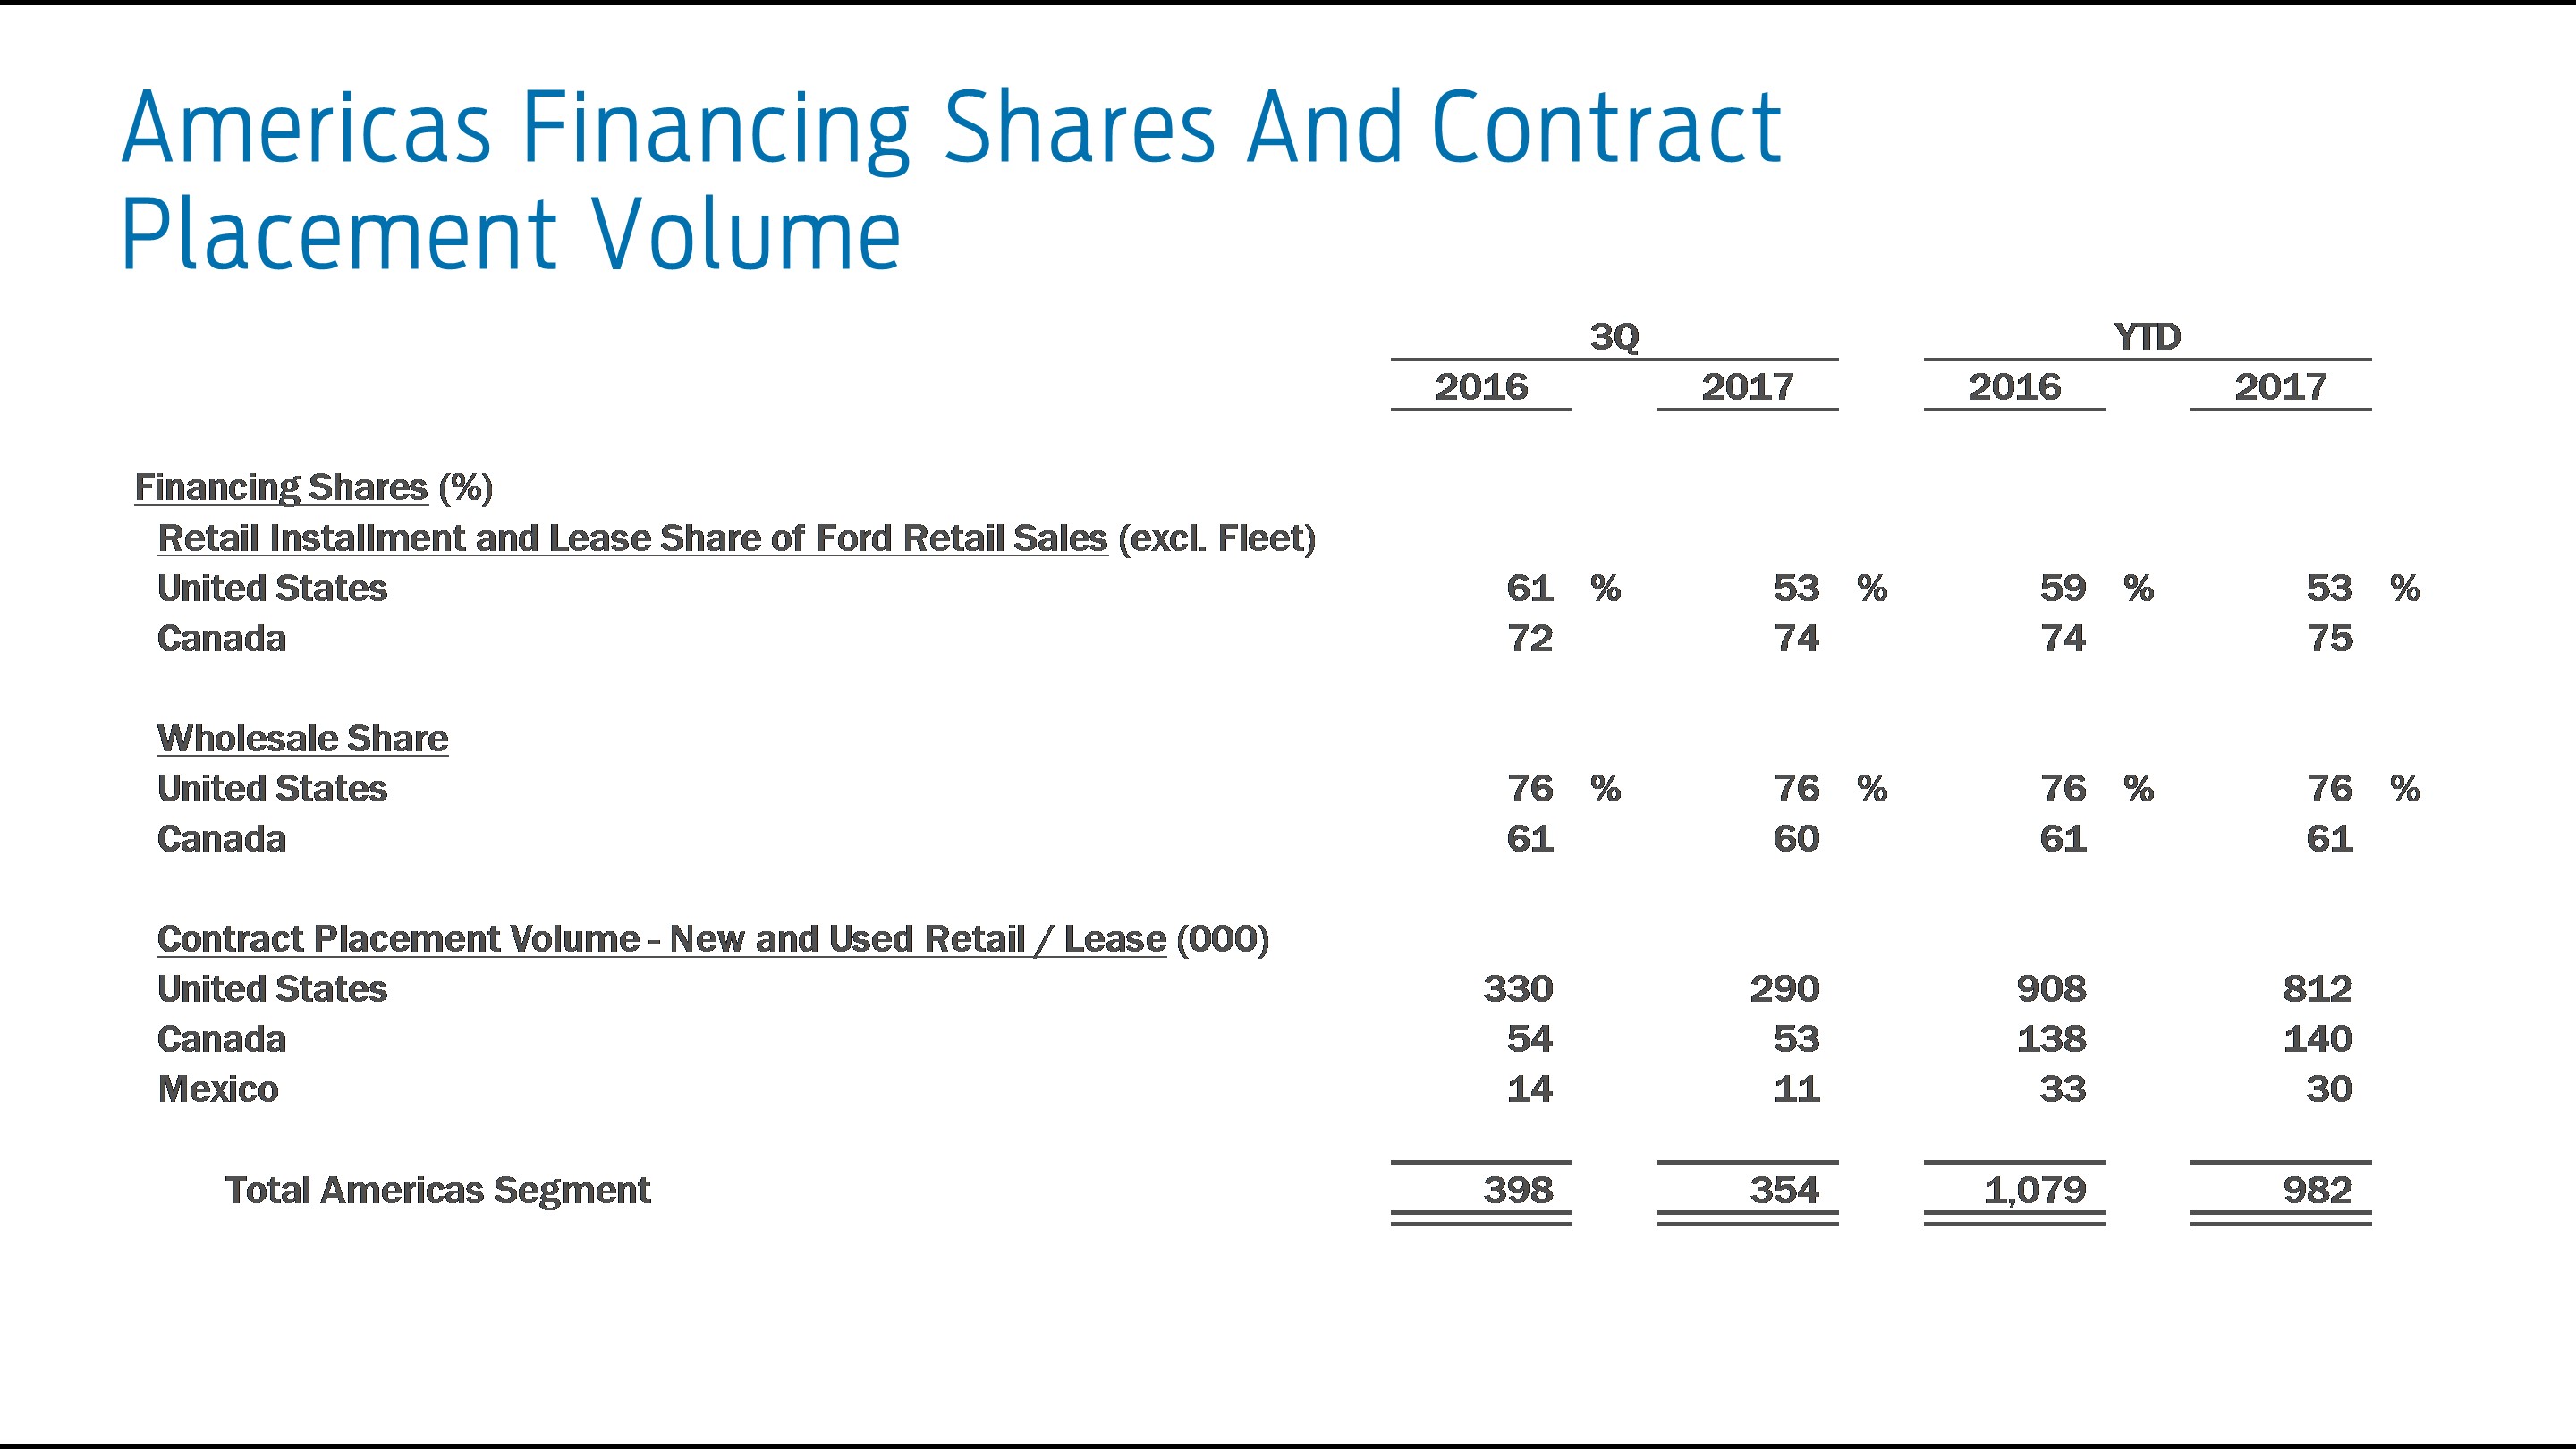
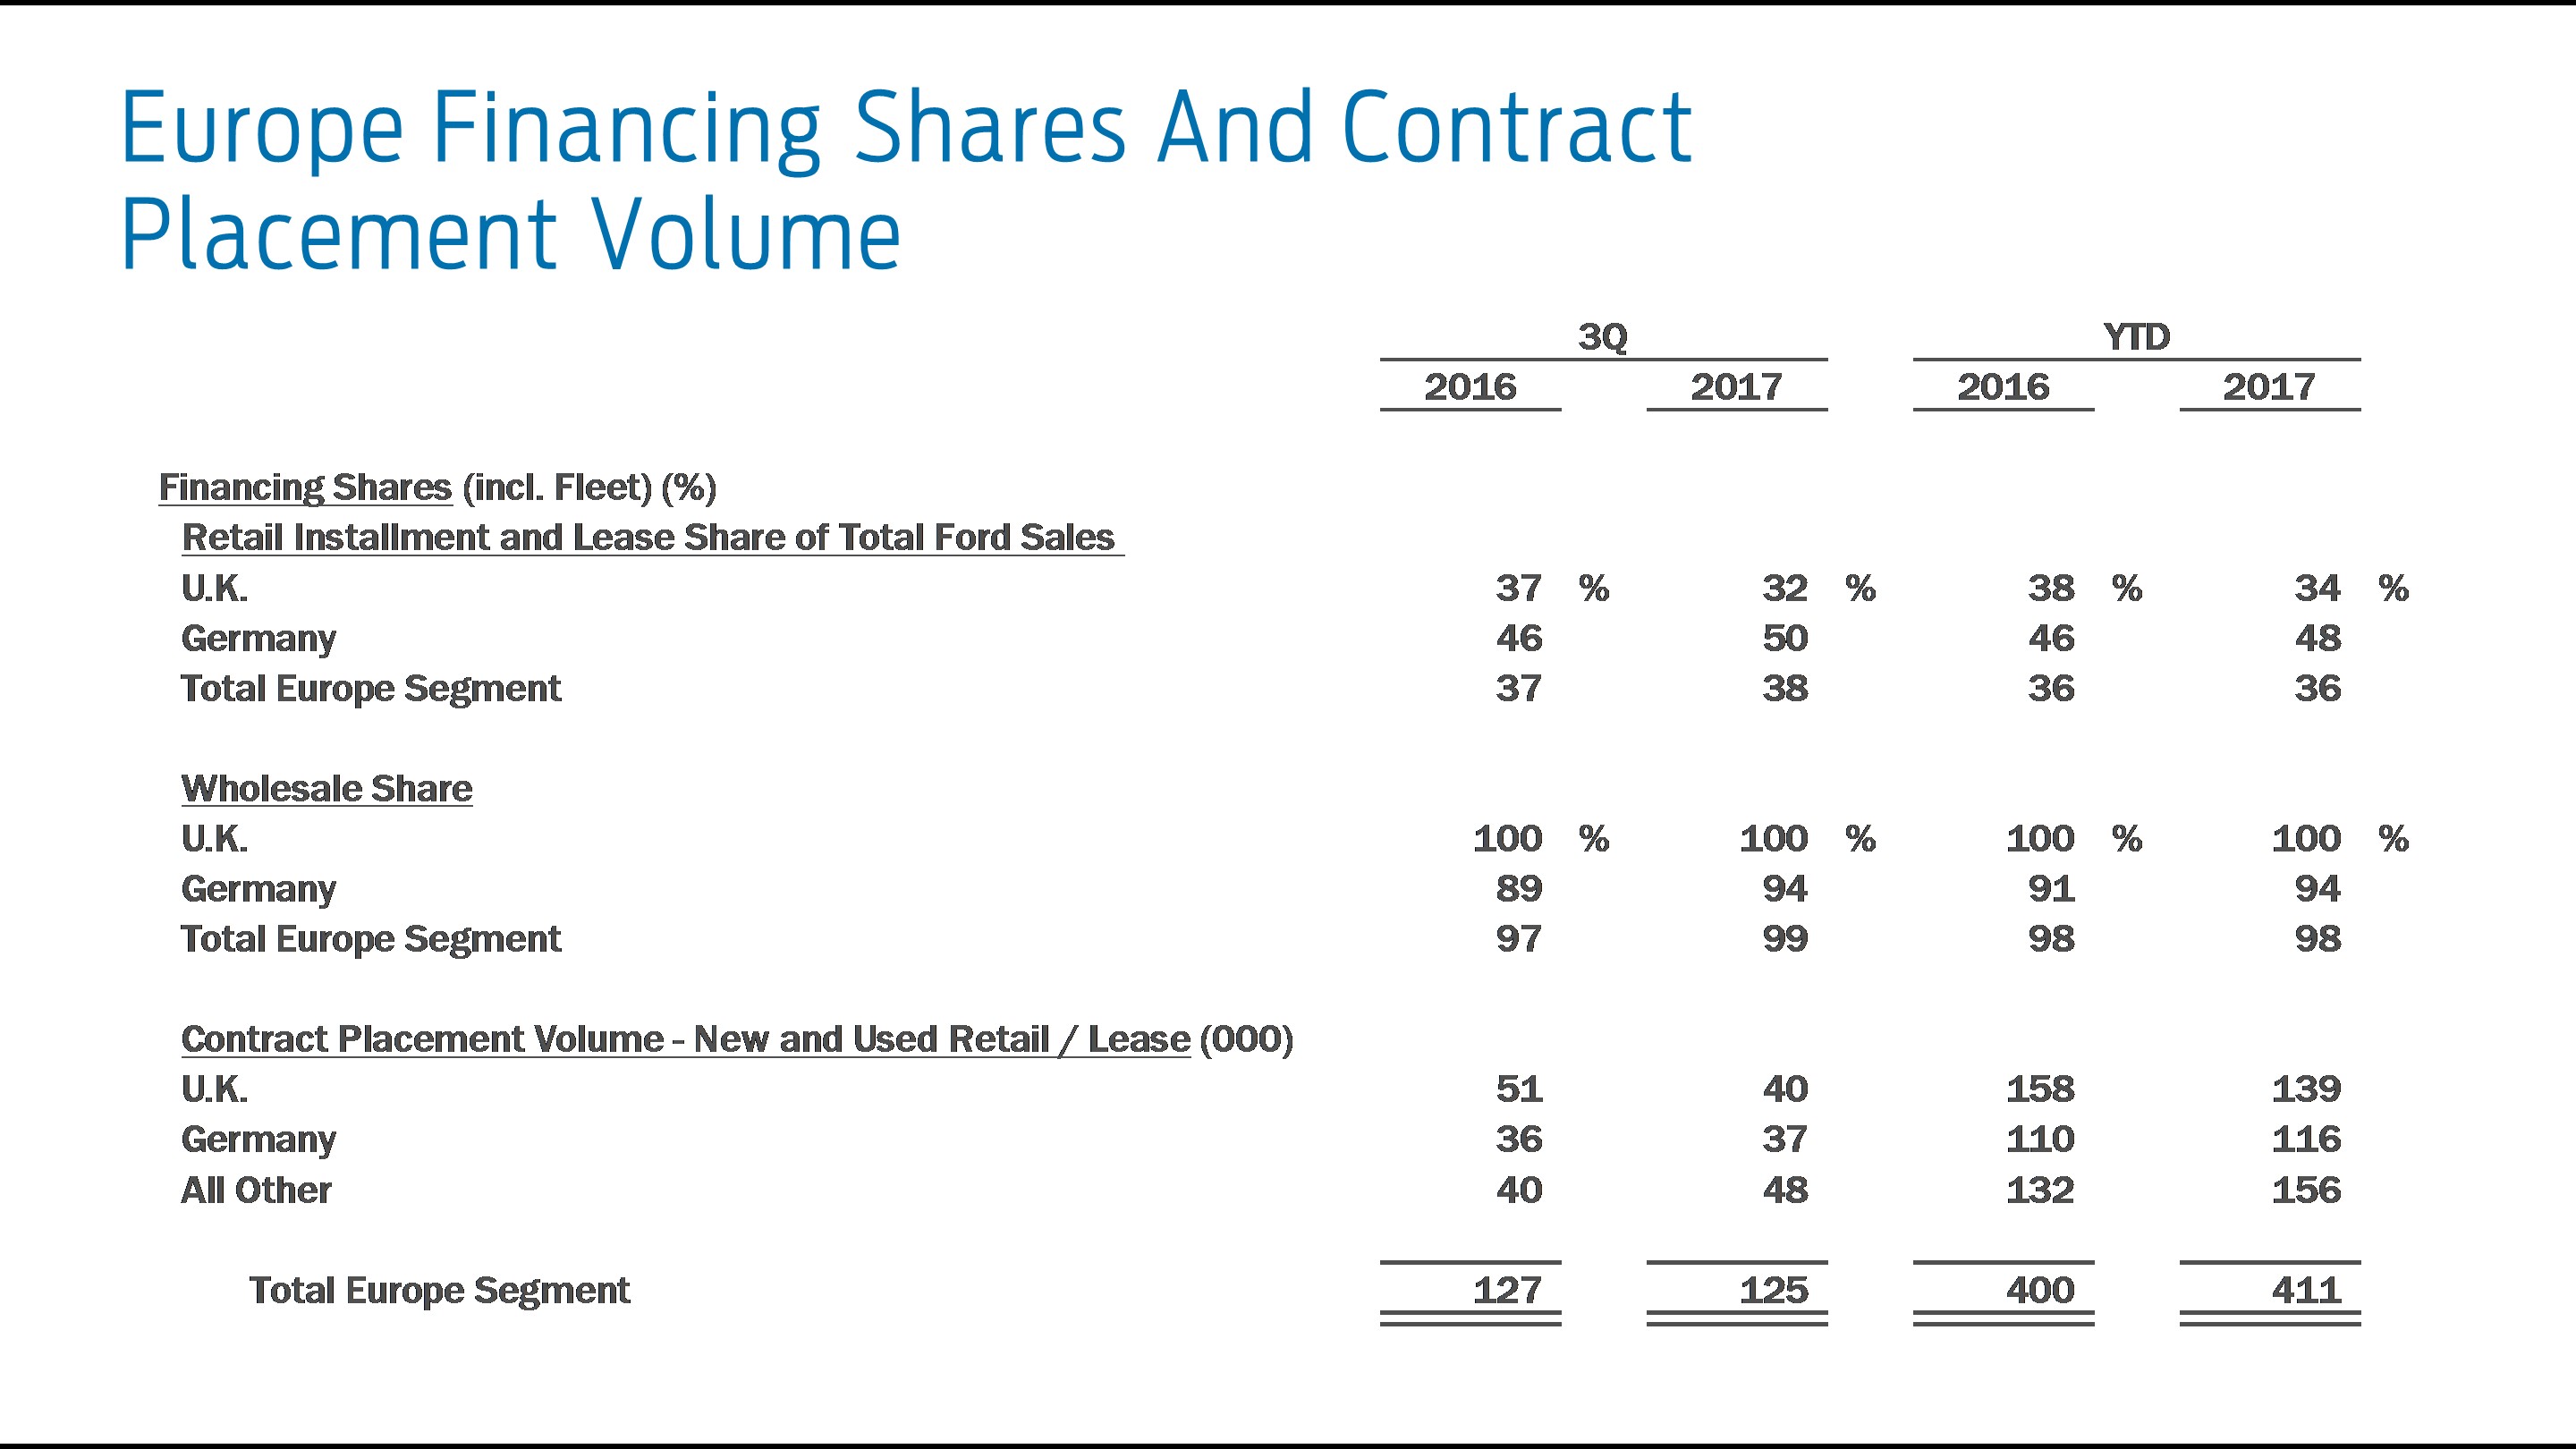
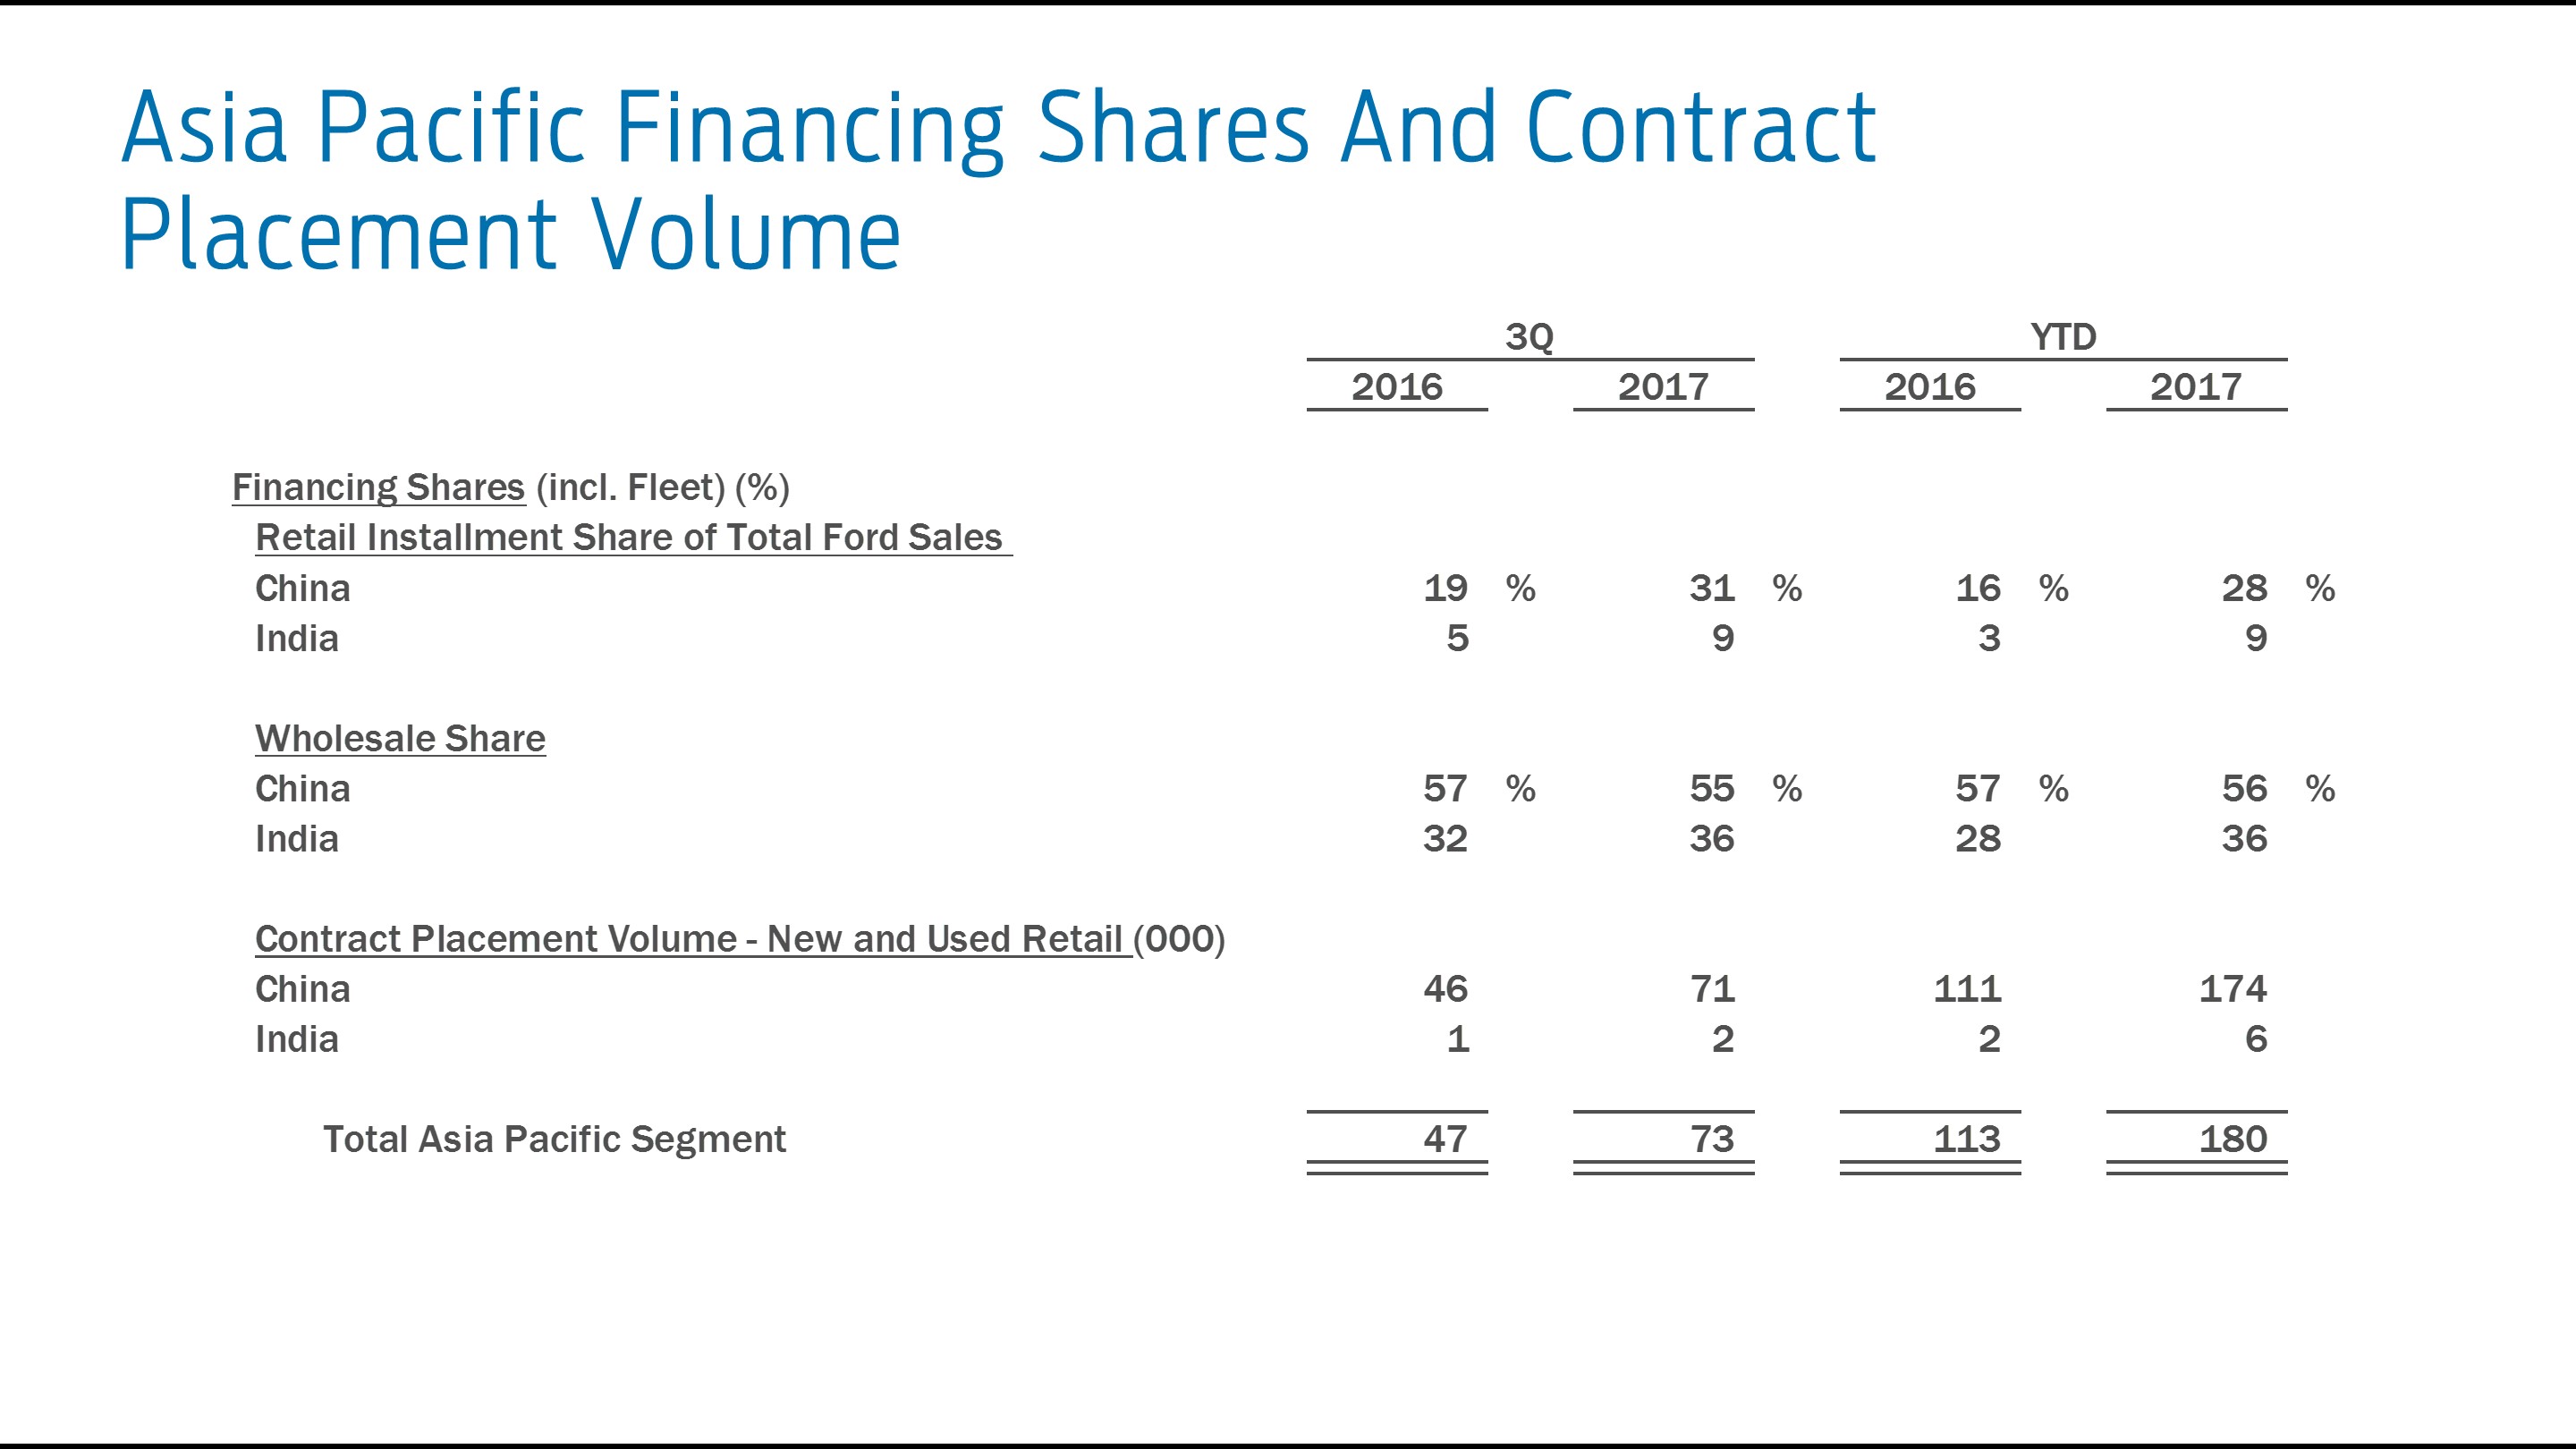
Financing Shares and Contract Placement Volume
Our focus is on supporting Ford and Lincoln dealers and customers. This includes going to market with Ford and our dealers to support vehicle sales with financing products and marketing programs. Ford’s marketing programs may encourage or require Ford Credit financing and influence the financing choices customers make. As a result, our financing share, volume, and contract characteristics vary from quarterperiod to quarterperiod as Ford’s marketing programs change.change.
The following charttable shows our United Statesretail financing and Canada retail installment andoperating lease share of new Ford-Ford and Lincoln-brand vehicle retailLincoln brand sales, and wholesale financing share of new Ford-Ford and Lincoln-brandLincoln brand vehicles acquired by dealers. Also shown is Americas’ consumer financingdealers (in percent), and contract placement volume for new and used vehicles. All data is for the periods ended September 30:vehicles (in thousands):
| Third Quarter | First Nine Months | |||||||||||
| 2018 | 2019 | 2018 | 2019 | |||||||||
| Share of Ford and Lincoln Sales (a) | ||||||||||||
| United States | 59 | % | 57 | % | 59 | % | 52 | % | ||||
| Canada | 69 | 57 | 73 | 63 | ||||||||
| U.K. | 36 | 40 | 37 | 39 | ||||||||
| Germany | 47 | 44 | 50 | 47 | ||||||||
| Total Europe segment | 38 | 37 | 37 | 37 | ||||||||
| China | 37 | 35 | 34 | 34 | ||||||||
| Wholesale Share | ||||||||||||
| United States | 76 | % | 76 | % | 76 | % | 76 | % | ||||
| Canada | 57 | 57 | 59 | 57 | ||||||||
| U.K. | 100 | 100 | 100 | 100 | ||||||||
| Germany | 94 | 93 | 93 | 93 | ||||||||
| Total Europe segment | 99 | 98 | 98 | 98 | ||||||||
| China | 64 | 59 | 61 | 61 | ||||||||
| Contract Placement Volume - New and Used (000) | ||||||||||||
| Americas segment | 356 | 318 | 1,028 | 821 | ||||||||
| Europe segment | 124 | 121 | 419 | 393 | ||||||||
| Asia Pacific segment | 47 | 27 | 139 | 86 | ||||||||
| Total | 527 | 466 | 1,586 | 1,300 | ||||||||
__________
| (a) | United States and Canada exclude Fleet sales, other markets include Fleet |
In the third quarter of 2017, U.S. retail2019, Americas segment and lease share and totalEurope segment contract placement volume were down compared towith a year ago, primarily reflecting lower financing share. In the priorthird quarter of 2019, Asia Pacific segment contract placement volume was down compared with a year reflecting changesago, more than explained by lower Ford sales in Ford’s marketing programs.China.
30
Item 2. Management’s Discussion and Analysis of Financial Condition and Results of Operations (Continued)
Financial Condition
Our receivables, including finance receivables and operating leases, were as follows (in billions):
| September 30, 2018 | December 31, 2018 | September 30, 2019 | |||||||||
| Net Receivables | |||||||||||
| Americas Segment | |||||||||||
| Consumer financing | $ | 56.7 | $ | 56.5 | $ | 55.2 | |||||
| Non-Consumer financing | 28.9 | 32.1 | 29.6 | ||||||||
| Net investment in operating leases | 27.1 | 27.0 | 27.0 | ||||||||
| Total Americas Segment | $ | 112.7 | $ | 115.6 | $ | 111.8 | |||||
| Europe Segment | |||||||||||
| Consumer financing | $ | 15.5 | $ | 15.5 | $ | 15.4 | |||||
| Non-Consumer financing | 9.4 | 9.6 | 9.0 | ||||||||
| Net investment in operating leases | 0.5 | 0.4 | 0.5 | ||||||||
| Total Europe Segment | $ | 25.4 | $ | 25.5 | $ | 24.9 | |||||
| Asia Pacific Segment | |||||||||||
| Consumer financing | $ | 4.0 | $ | 3.8 | $ | 2.8 | |||||
| Non-Consumer financing | 1.5 | 1.4 | 0.8 | ||||||||
| Net investment in operating leases | — | — | — | ||||||||
| Total Asia Pacific Segment | $ | 5.5 | $ | 5.2 | $ | 3.6 | |||||
| Total net receivables | $ | 143.6 | $ | 146.3 | $ | 140.3 | |||||
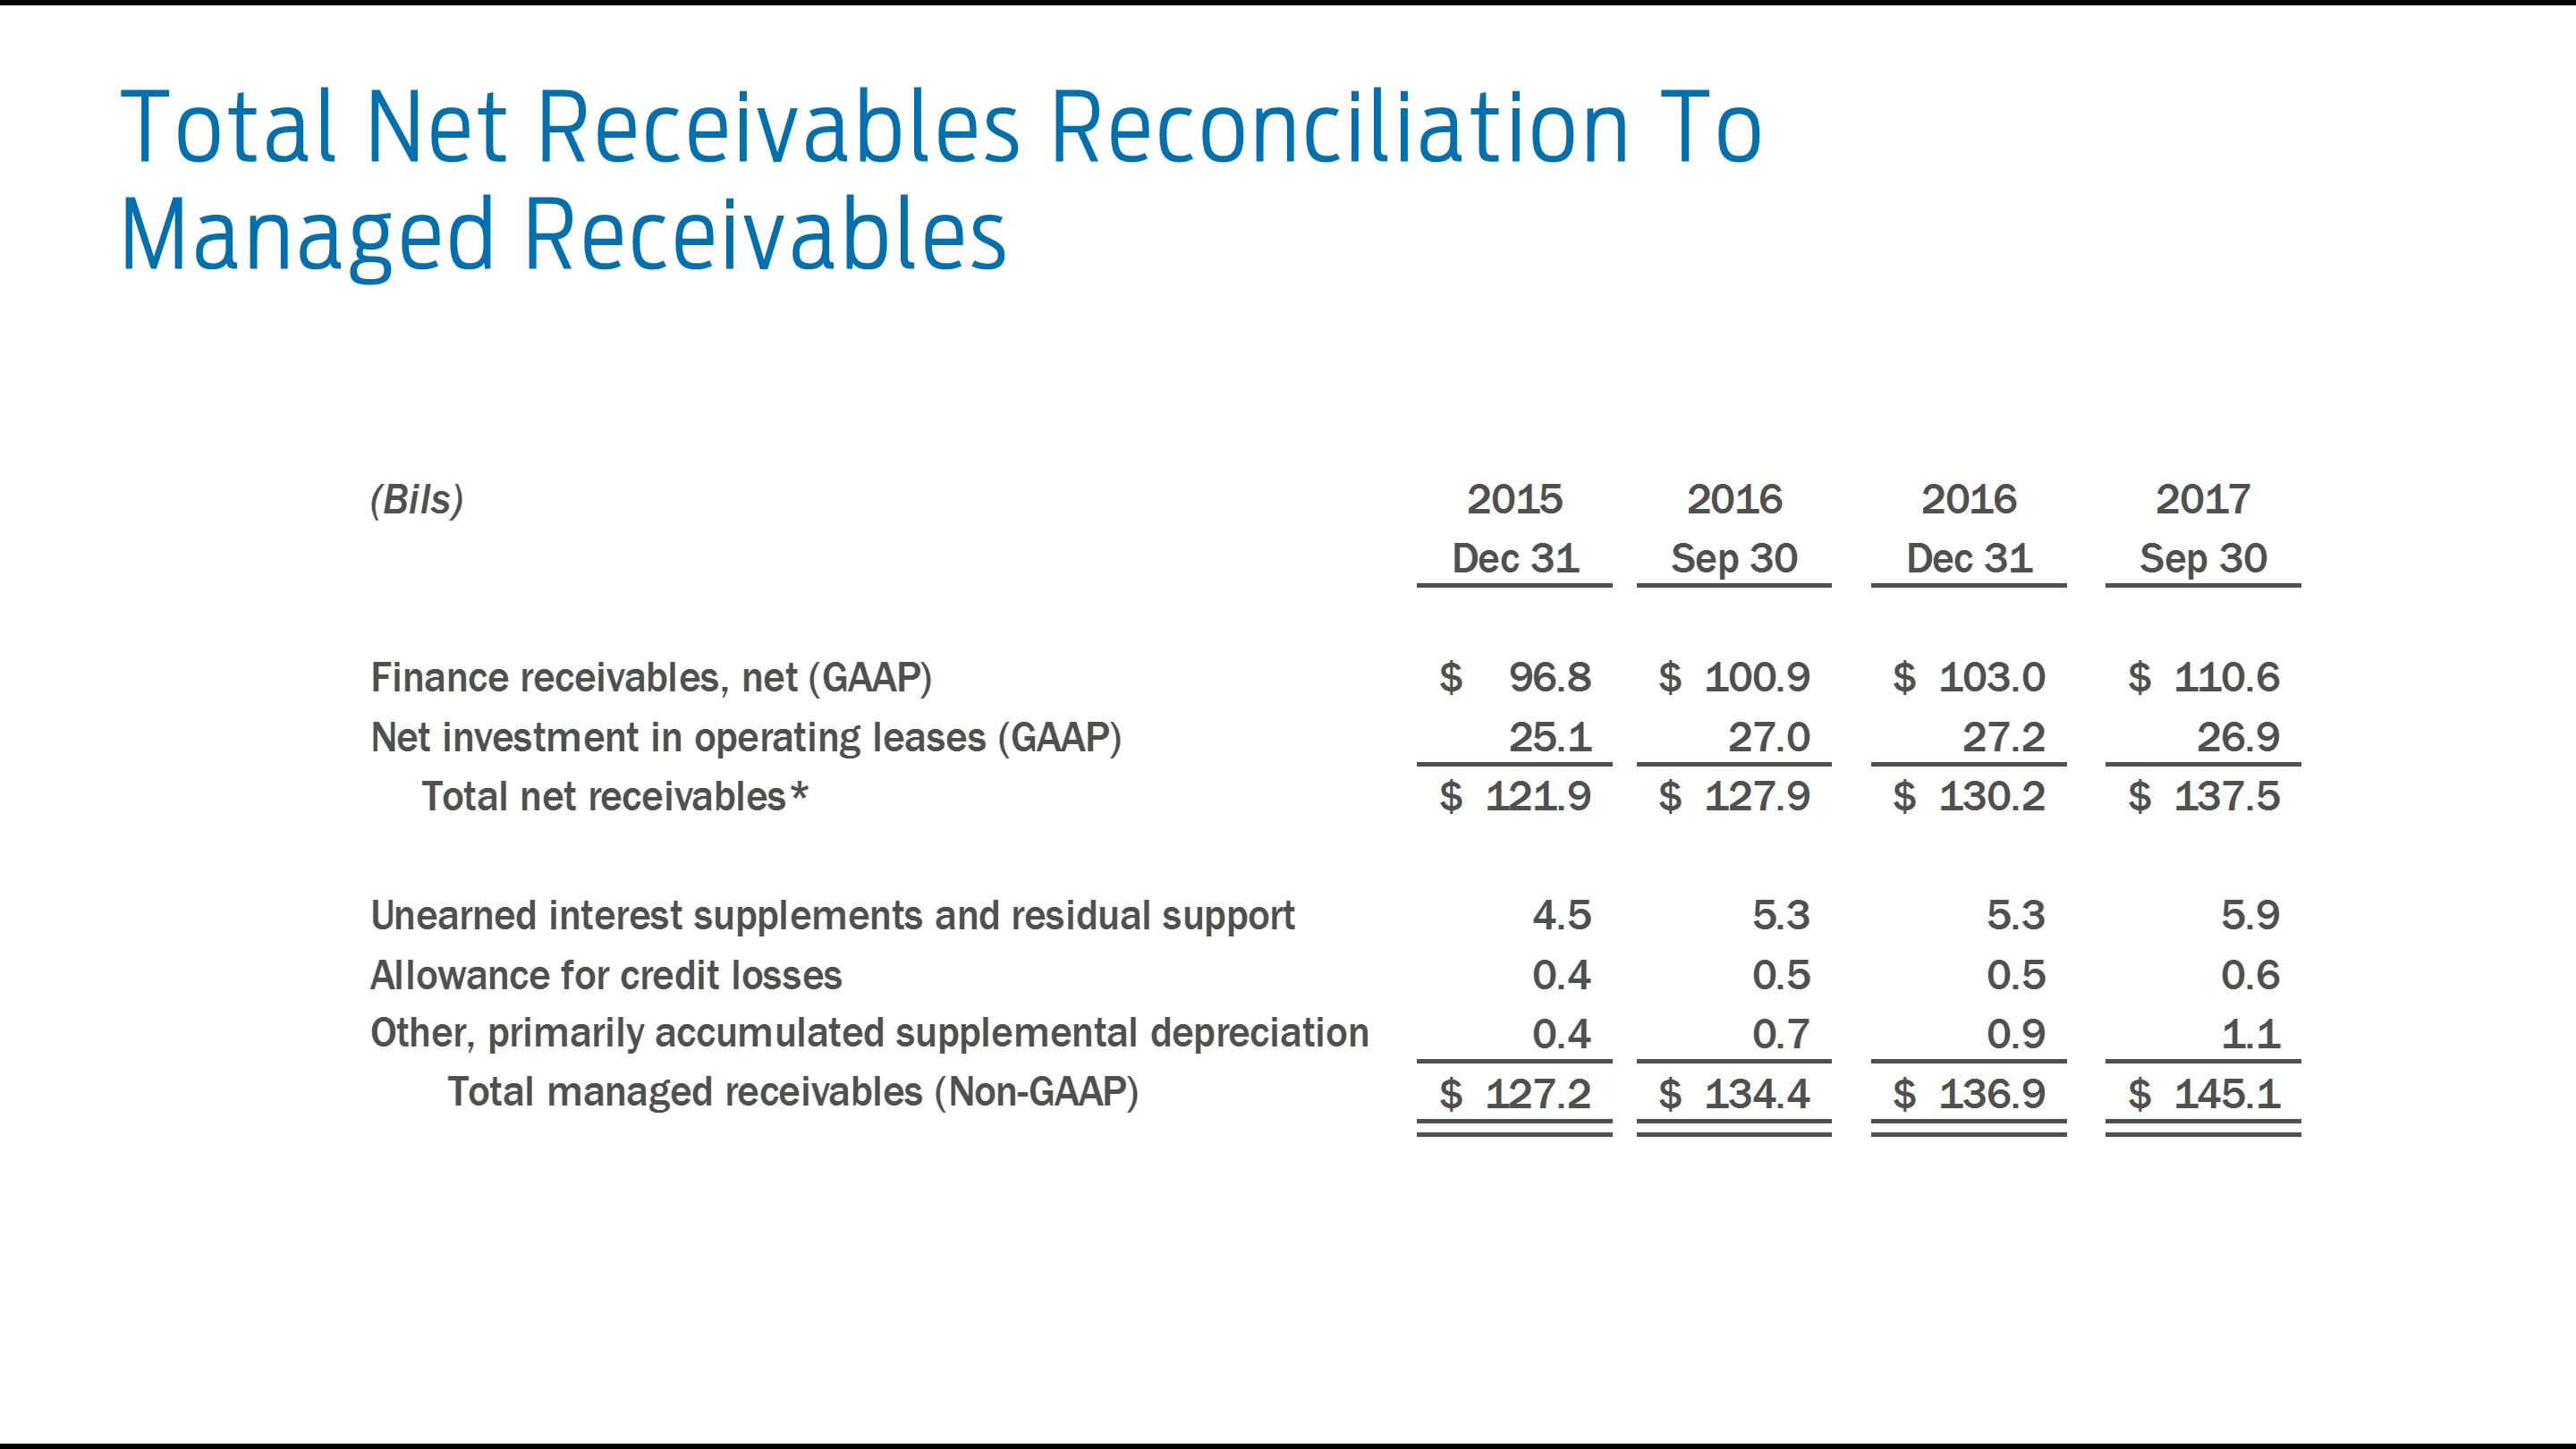
| Managed Receivables | |||||||||||
| Total net receivables (GAAP) | $ | 143.6 | $ | 146.3 | $ | 140.3 | |||||
| Unearned interest supplements and residual support | 6.7 | 6.8 | 6.8 | ||||||||
| Allowance for credit losses | 0.6 | 0.6 | 0.5 | ||||||||
| Other, primarily accumulated supplemental depreciation | 1.2 | 1.2 | 1.1 | ||||||||
| Total managed receivables (Non-GAAP) | $ | 152.1 | $ | 154.9 | $ | 148.7 | |||||
| Americas Segment Lease Mix | |||||||||||
| SUV / CUV | 55 | % | 56 | % | 57 | % | |||||
| Truck | 27 | 27 | 30 | ||||||||
| Car | 18 | 17 | 13 | ||||||||
At September 30, 2018, December 31, 2018, and September 30, 2019, total net receivables includes consumer receivables before allowance for credit losses of $38.8 billion, $40.7 billion, and $37.8 billion, respectively, and non-consumer receivables before allowance for credit losses of $23.3 billion, $25.7 billion, and $24.0 billion, respectively, that have been sold for legal purposes in securitization transactions but continue to be reported in our consolidated financial statements. In addition, at September 30, 2018, December 31, 2018, and September 30, 2019, total net receivables includes net investment in operating leases of $12.4 billion, $16.3 billion, and $12.7 billion, respectively, that have been included in securitization transactions but continue to be reported in our consolidated financial statements. The following chart shows Europe’s retail installmentreceivables and lease sharenet investment in operating leases are available only for payment of new Ford-brand vehicles soldthe debt issued by, and wholesale financing shareother obligations of, new Ford-brand vehicles acquiredthe securitization entities that are parties to those securitization transactions; they are not available to pay the other obligations or the claims of Ford Credit’s other creditors. Ford Credit holds the right to receive the excess cash flows not needed to pay the debt issued by, dealers. Also shown is Europe’s consumer financing contract placement volume for new and used vehicles. All data isother obligations of, the securitization entities that are parties to those securitization transactions. For additional information on our securitization transactions, refer to the “Securitization Transactions” and “On-Balance Sheet Arrangements” sections of Item 7 of Part II of our 2018 Form 10-K Report and Note 7 of our Notes to the Financial Statements for the periodsperiod ended September 30:30, 2019.
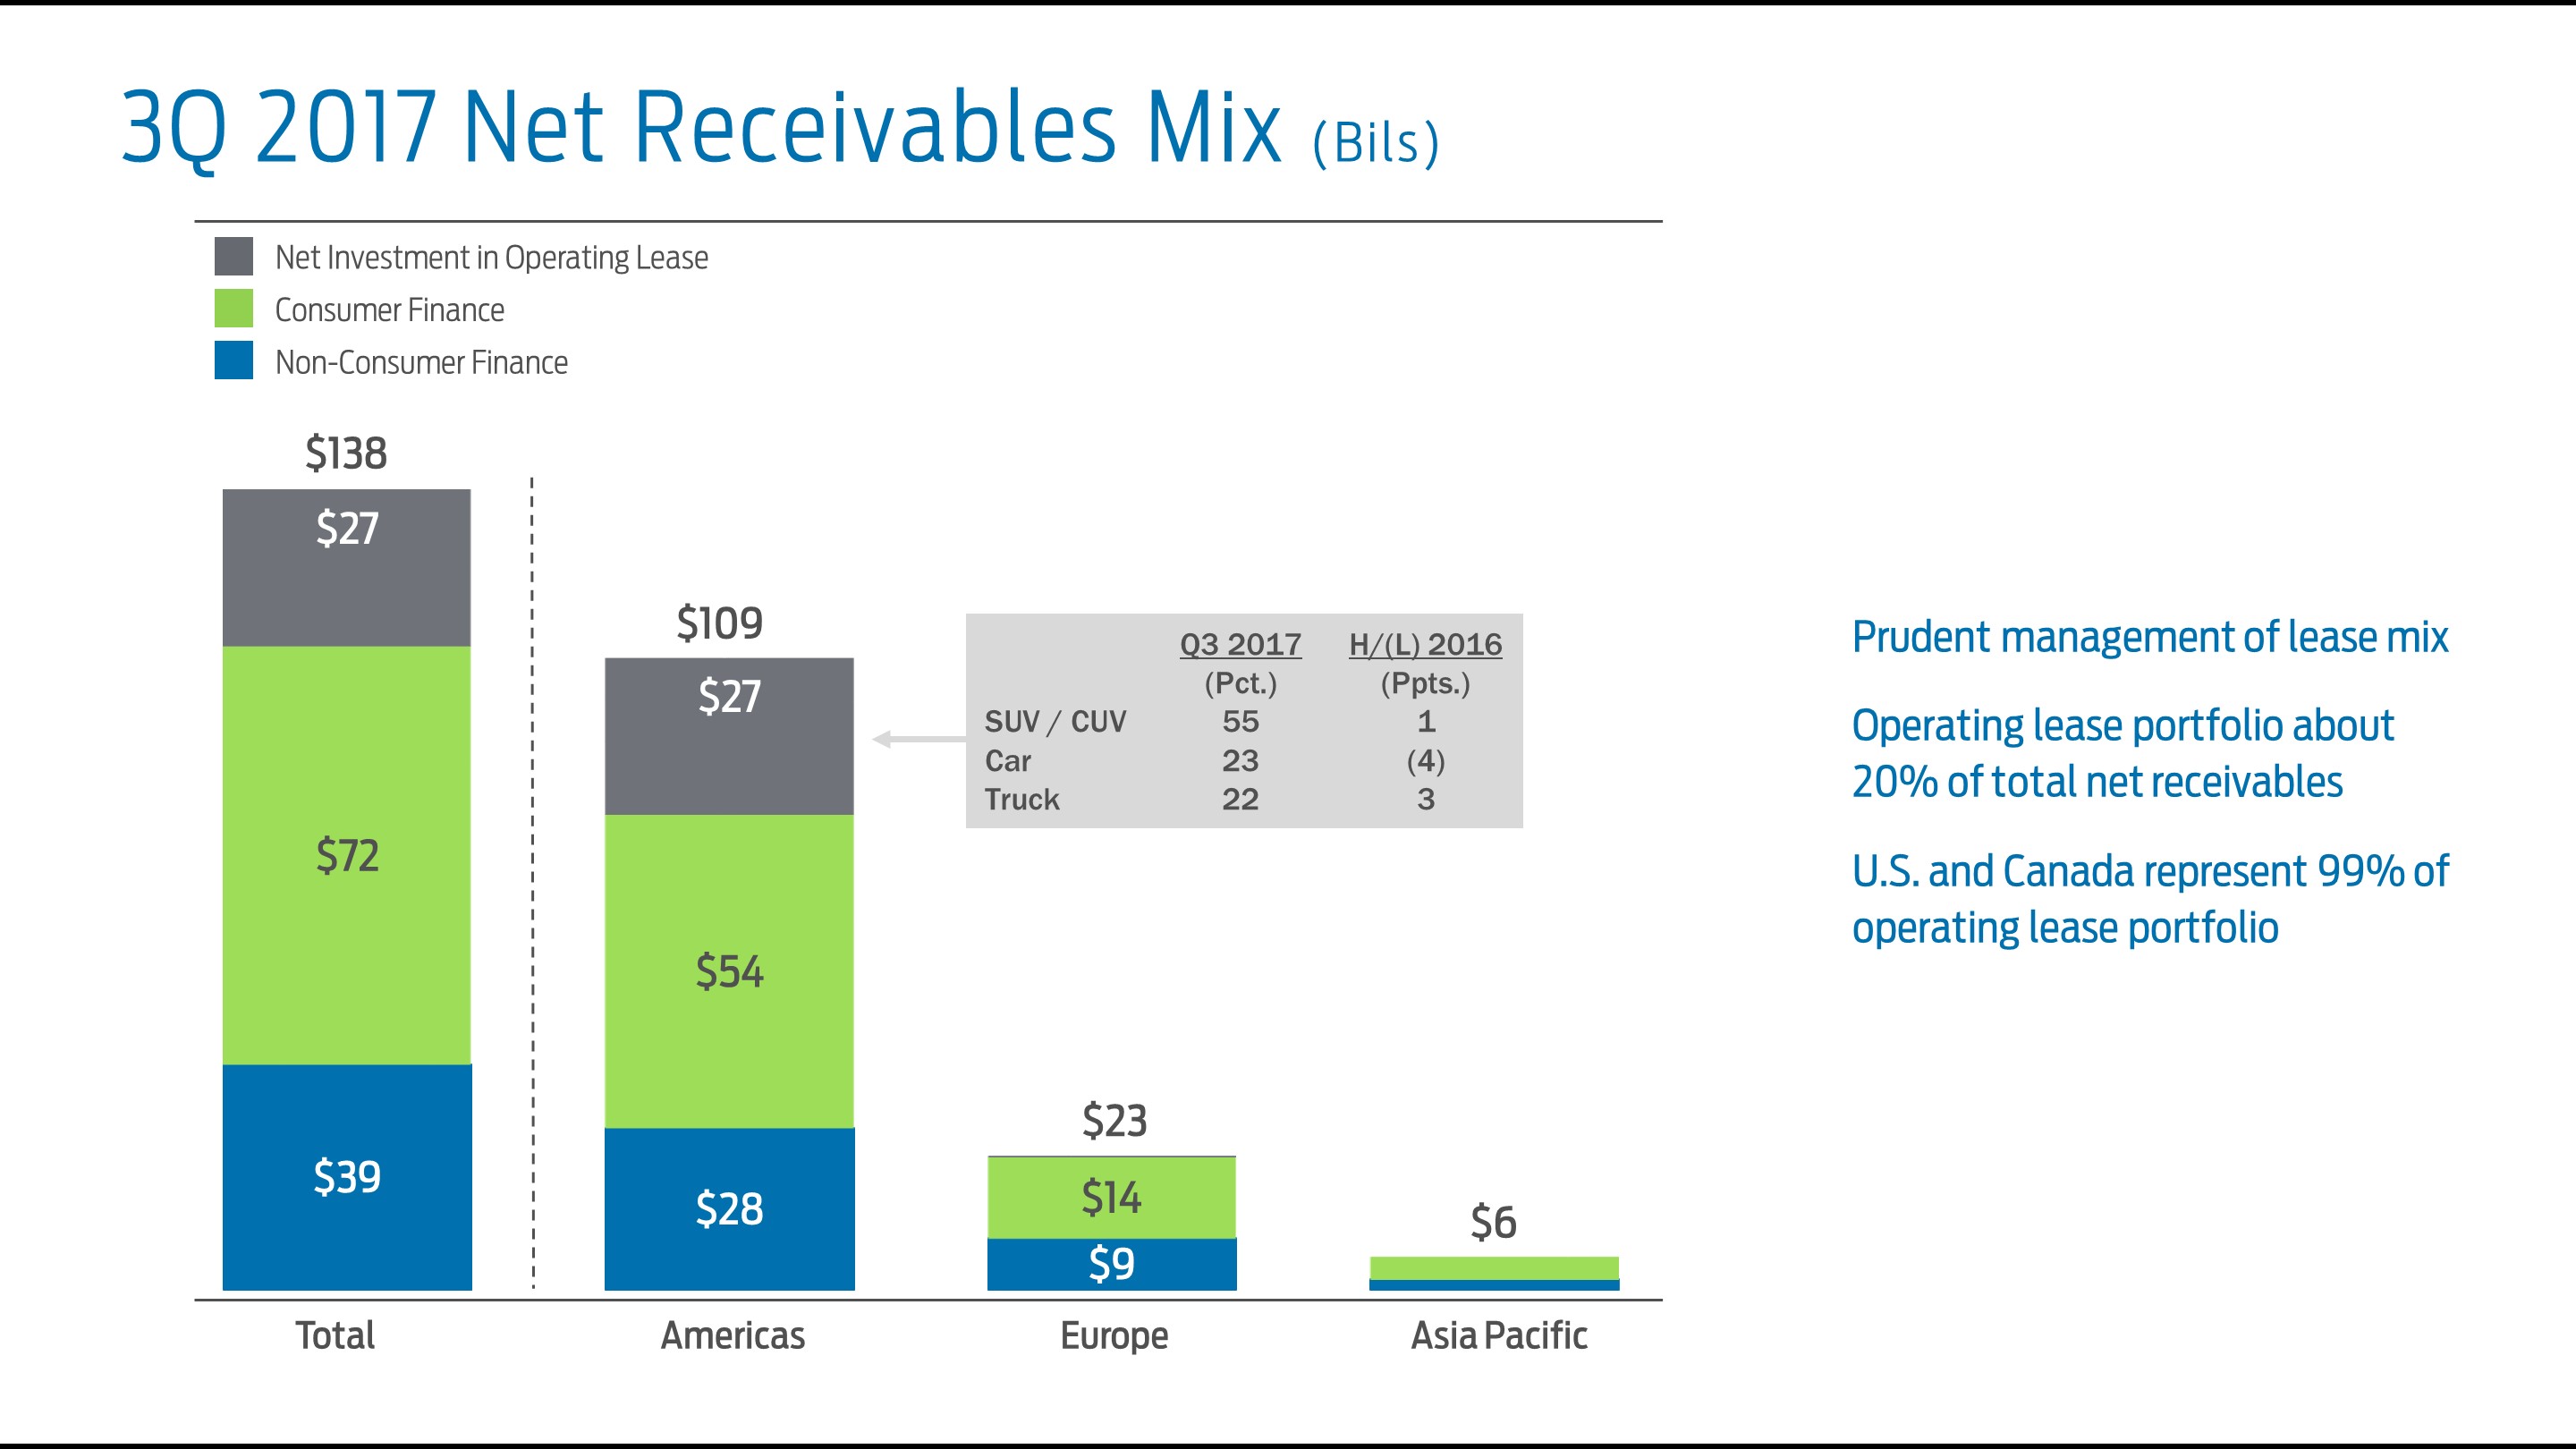
Our operating lease portfolio is managed and was 20% of total net receivables at September 30, 2019. Leasing is an important product, and our leasing strategy balances sales, share, residuals, and long-term profitability. Operating leases in the United States and Canada represent 98% of our total operating lease portfolio.
31
Item 2. Management’s Discussion and Analysis of Financial Condition and Results of Operations (Continued)
Credit Risk
Credit risk is the possibility of loss from a customer’s or dealer’s failure to make payments according to contract terms. Credit losses are a normal part of a financinglending business, and credit risk has a significant impact on our business. We actively manage the credit risk of our consumer (retail financing and operating lease)financing) and non-consumer (dealer financing) receivables to balance our level of risk and return using our consistent underwriting standards, effective proprietary scoring system (discussed below), and world-class servicing. The allowance for credit losses (also referred to as the credit loss reserve) represents our estimate of the probable credit losses inherent in our finance receivables and operating leases as of the balance sheet date. The allowance for credit losses is estimated using a combination of models and management judgment, and is based on such factors as historical loss performance, portfolio quality, and receivable levels. The adequacy of our allowance for credit losses is assessed quarterly and the assumptions and models used in establishing the allowance are evaluated regularly. A description of our allowance setting process is provided in the “Critical Accounting Estimates - Allowance for Credit Losses” section of Item 7 of Exhibit 99Part II to our April 27, 20172018 Form 8-K10-K Report.
Most of our charge-offs are related to retail finance and operating lease contracts.financing. Charge-offs are affected by the number of vehicle repossessions, the unpaid balance outstanding at the time of repossession, the auction price of repossessed vehicles, and other charge-offs. We also incur credit losses on our dealer financing, but default rates for these receivables historically have been substantially lower than those for retail finance and operating lease contracts.financing. For additional information on severity, refer to the “Critical Accounting Estimates - Allowance for Credit Losses” section of Item 7 of Exhibit 99Part II to our April 27, 20172018 Form 8-K10-K Report.
In purchasing retail finance and operating leasefinancing contracts, we use a proprietary scoring system that measures credit quality using information in the credit application, proposed contract terms, credit bureau data, and other information we obtain.information. After a proprietary risk score is generated, we decide whether to purchase a contract using a decision process based on a judgmental evaluation of the applicant, the credit application, the proposed contract terms, credit bureau information (e.g., FICO score), proprietary risk score, and other information. Our evaluation emphasizes the applicant’s ability to pay and creditworthiness focusing on payment, affordability, applicant credit history, and stability as key considerations. While FICO is a part of our scoring system, our models enable us to more effectively determine the probability that a customer will pay than using credit scores alone. When we originate business, our models project expected losses and we price accordingly. We ensure the business fits our risk appetite. For additional information on the quality of our receivables, see Note 4 of our Notes to the Financial Statements.
32
Item 2. Management’s Discussion and Analysis of Financial Condition and Results of Operations (Continued)
U.S. Origination Metrics
The following table shows U.S. retail financing and operating lease average placement FICO and higher risk portfolio mix metrics. Also shown are extended term mix and U.S. retail financing average placement terms.
| Third Quarter | First Nine Months | |||||||||||
| 2018 | 2019 | 2018 | 2019 | |||||||||
| Origination Metrics | ||||||||||||
| Average placement FICO | 747 | 750 | 745 | 746 | ||||||||
| Higher risk portfolio mix | 6 | % | 6 | % | 6 | % | 6 | % | ||||
| Greater than or equal to 84 months placement mix | 4 | % | 3 | % | 4 | % | 4 | % | ||||
| Average placement term (months) | 66 | 66 | 65 | 65 | ||||||||
Our third quarter 2019 average placement FICO score remained strong. We support customers across the credit spectrum. Our higher risk business, as classified at contract inception, consistently represents 5%-6%6% of our portfolio and has been stable for over 10 years.
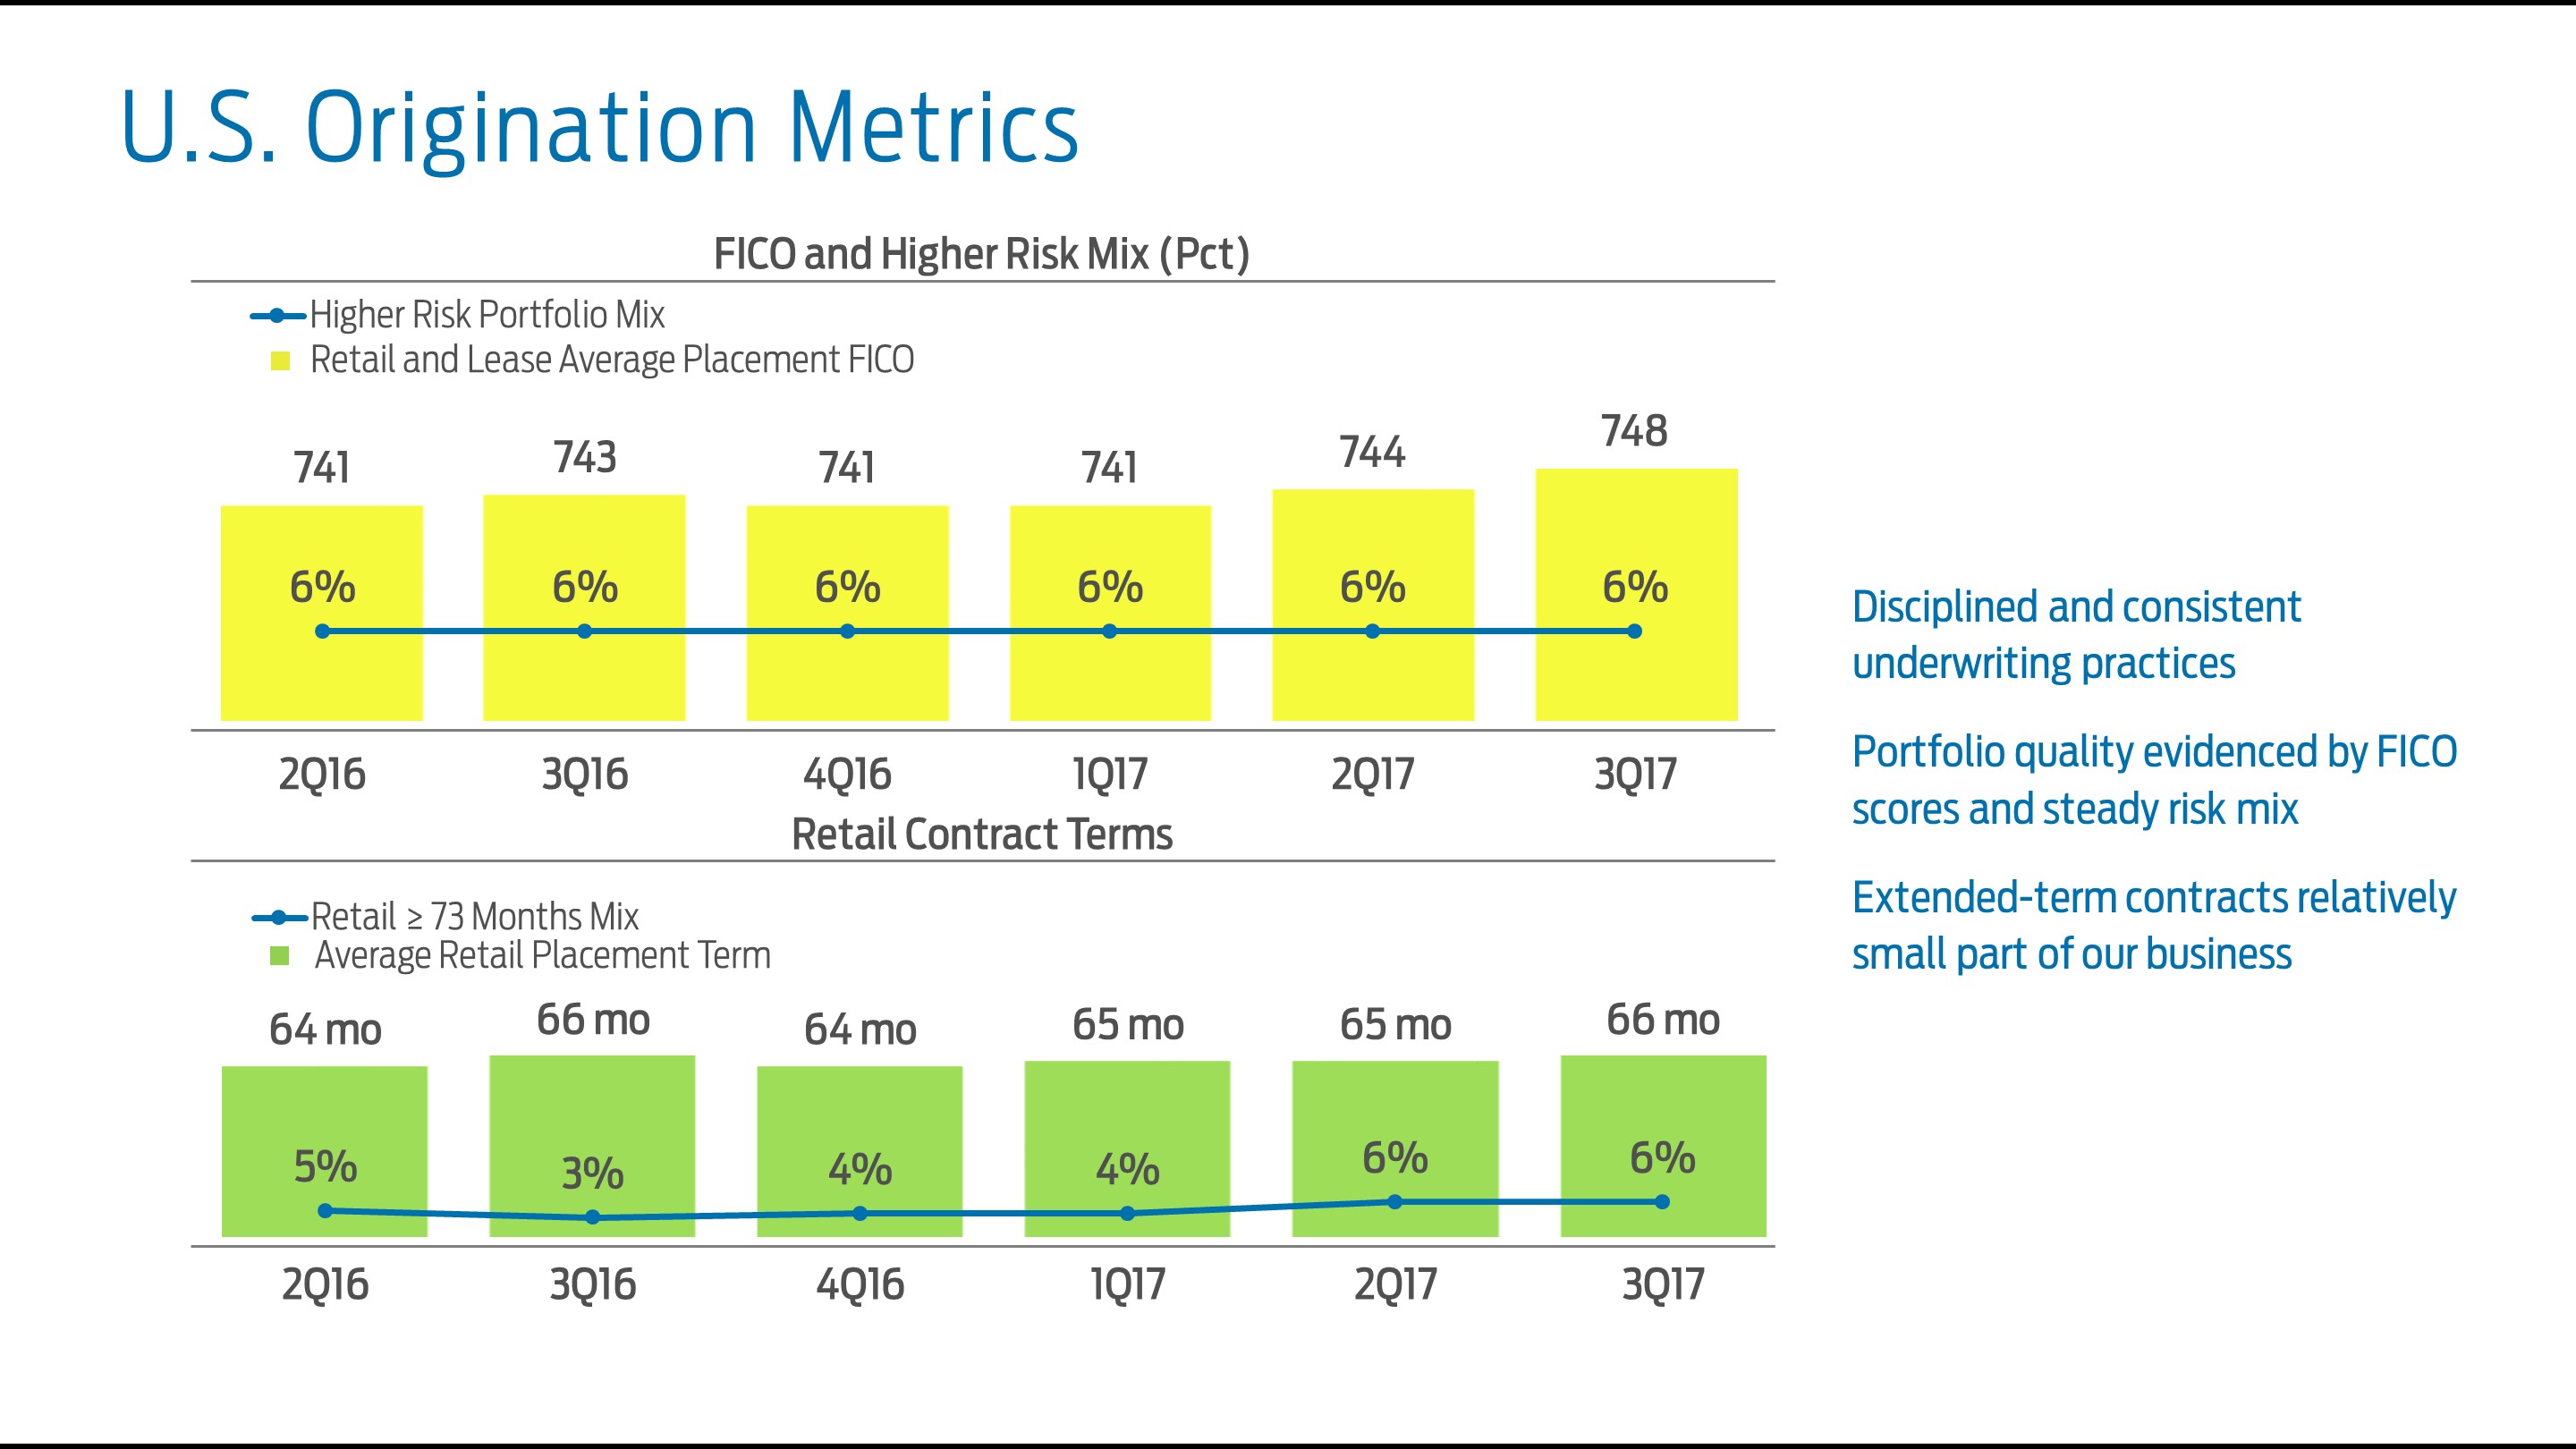
Our average retail financing placement term iswas unchanged from the priora year ago, and retail financing contracts of 7384 months and longer continued to be a relatively small part of our business. Ford Credit remains focused on managing the trade cycle –- building customer relationships and loyalty while offering financing products and terms customers want.
Ford Credit’sCredit origination and risk management processes deliver robust portfolio performance.
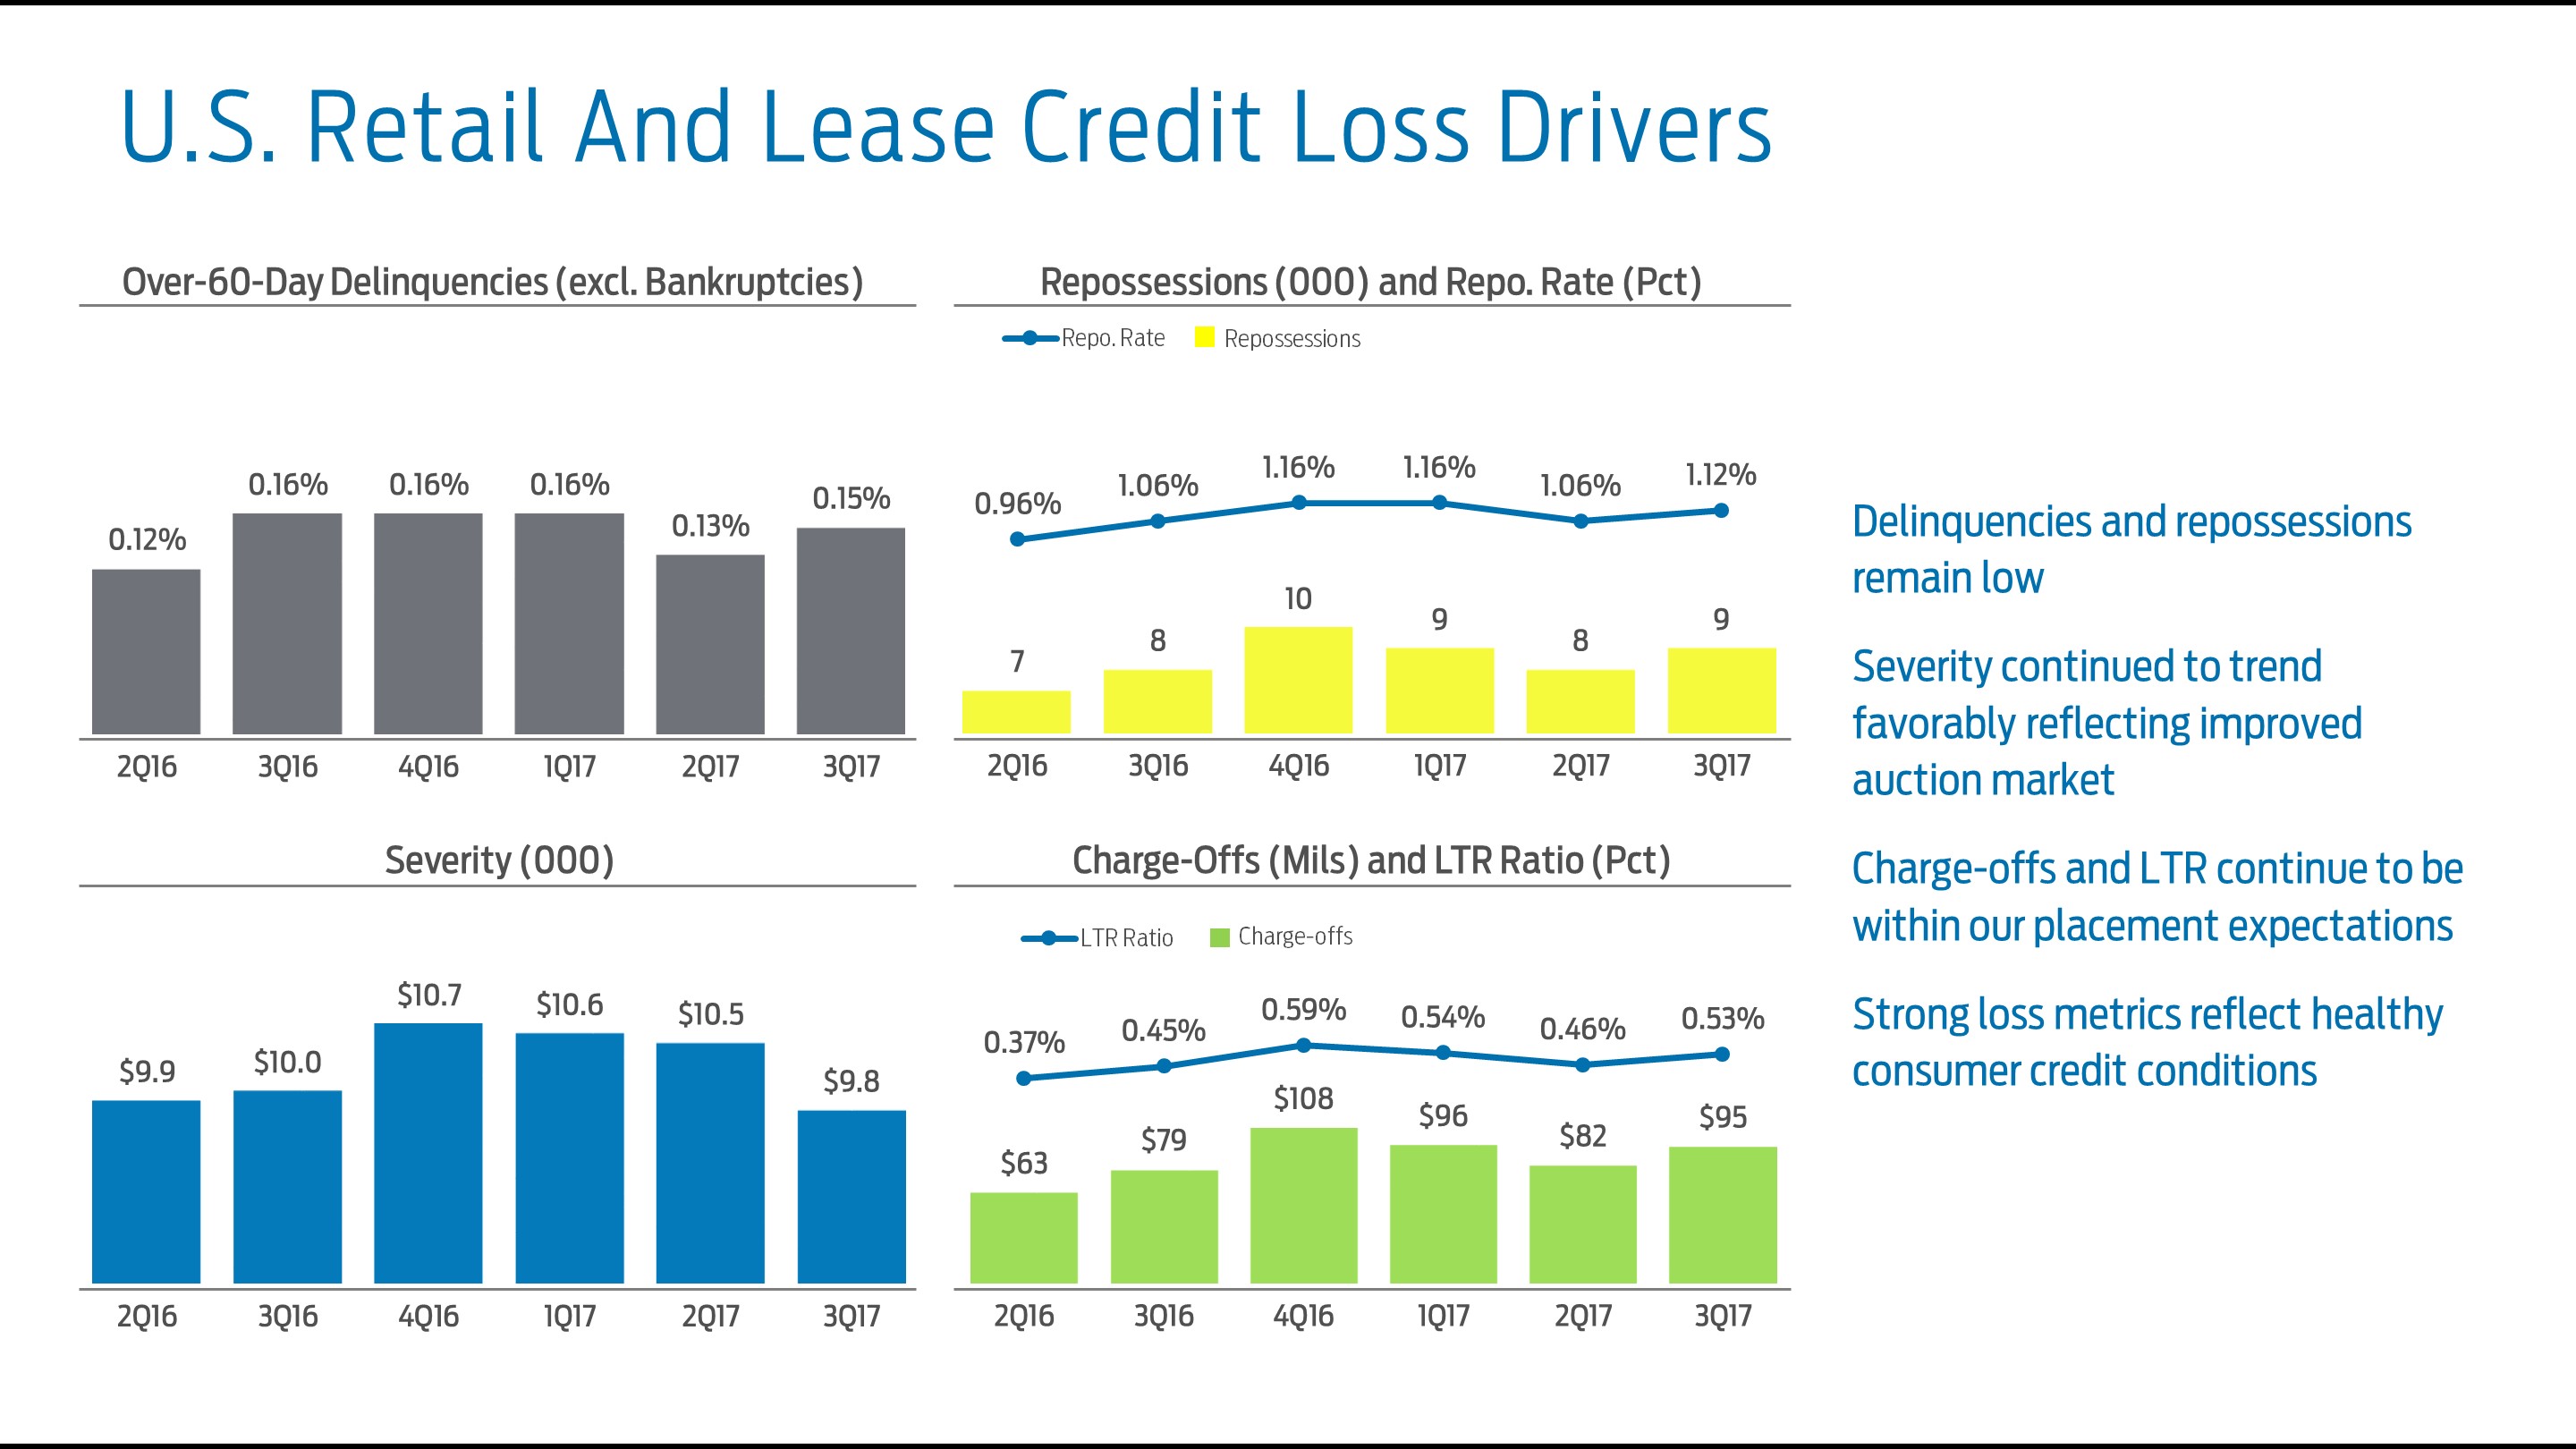
U.S. Retail Financing Credit Losses
The following table shows the primary drivers of credit losses in the U.S. retail financing business, which comprised 62% of our worldwide consumer finance receivables at September 30, 2019.
| Third Quarter | First Nine Months | |||||||||||||||
| 2018 | 2019 | 2018 | 2019 | |||||||||||||
| Credit Loss Drivers | ||||||||||||||||
| Over-60-Day delinquencies (excl. bankruptcies) | 0.14 | % | 0.14 | % | 0.13 | % | 0.12 | % | ||||||||
| Reposessions (000) | 7 | 7 | 21 | 20 | ||||||||||||
| Reposession ratio | 1.26 | % | 1.32 | % | 1.28 | % | 1.23 | % | ||||||||
| Loss severity (000) (a) | $ | 9.8 | $ | 10.3 | $ | 10.3 | $ | 10.5 | ||||||||
| Charge-offs (millions) | $ | 61 | $ | 61 | $ | 178 | $ | 171 | ||||||||
| LTR ratio (b) | 0.51 | % | 0.51 | % | 0.50 | % | 0.48 | % | ||||||||
| (a) | The expected difference between the amount a customer owes when the finance contract is charged off and the amount received, net of expenses, from selling the repossessed vehicle |
(b) Loss-to-Receivables (“LTR”) ratios are charge-offs divided by average finance receivables
Compared with a year ago, third quarter delinquencies were flat, while the repossession rate and severity were slightly higher. Our third quarter 2019 charge-offs and LTR ratio were flat compared with a year ago. Credit loss metrics remained strong, reflecting a healthy business environment and consumer credit conditions.
33
Item 2. Management’s Discussion and Analysis of Financial Condition and Results of Operations (Continued)
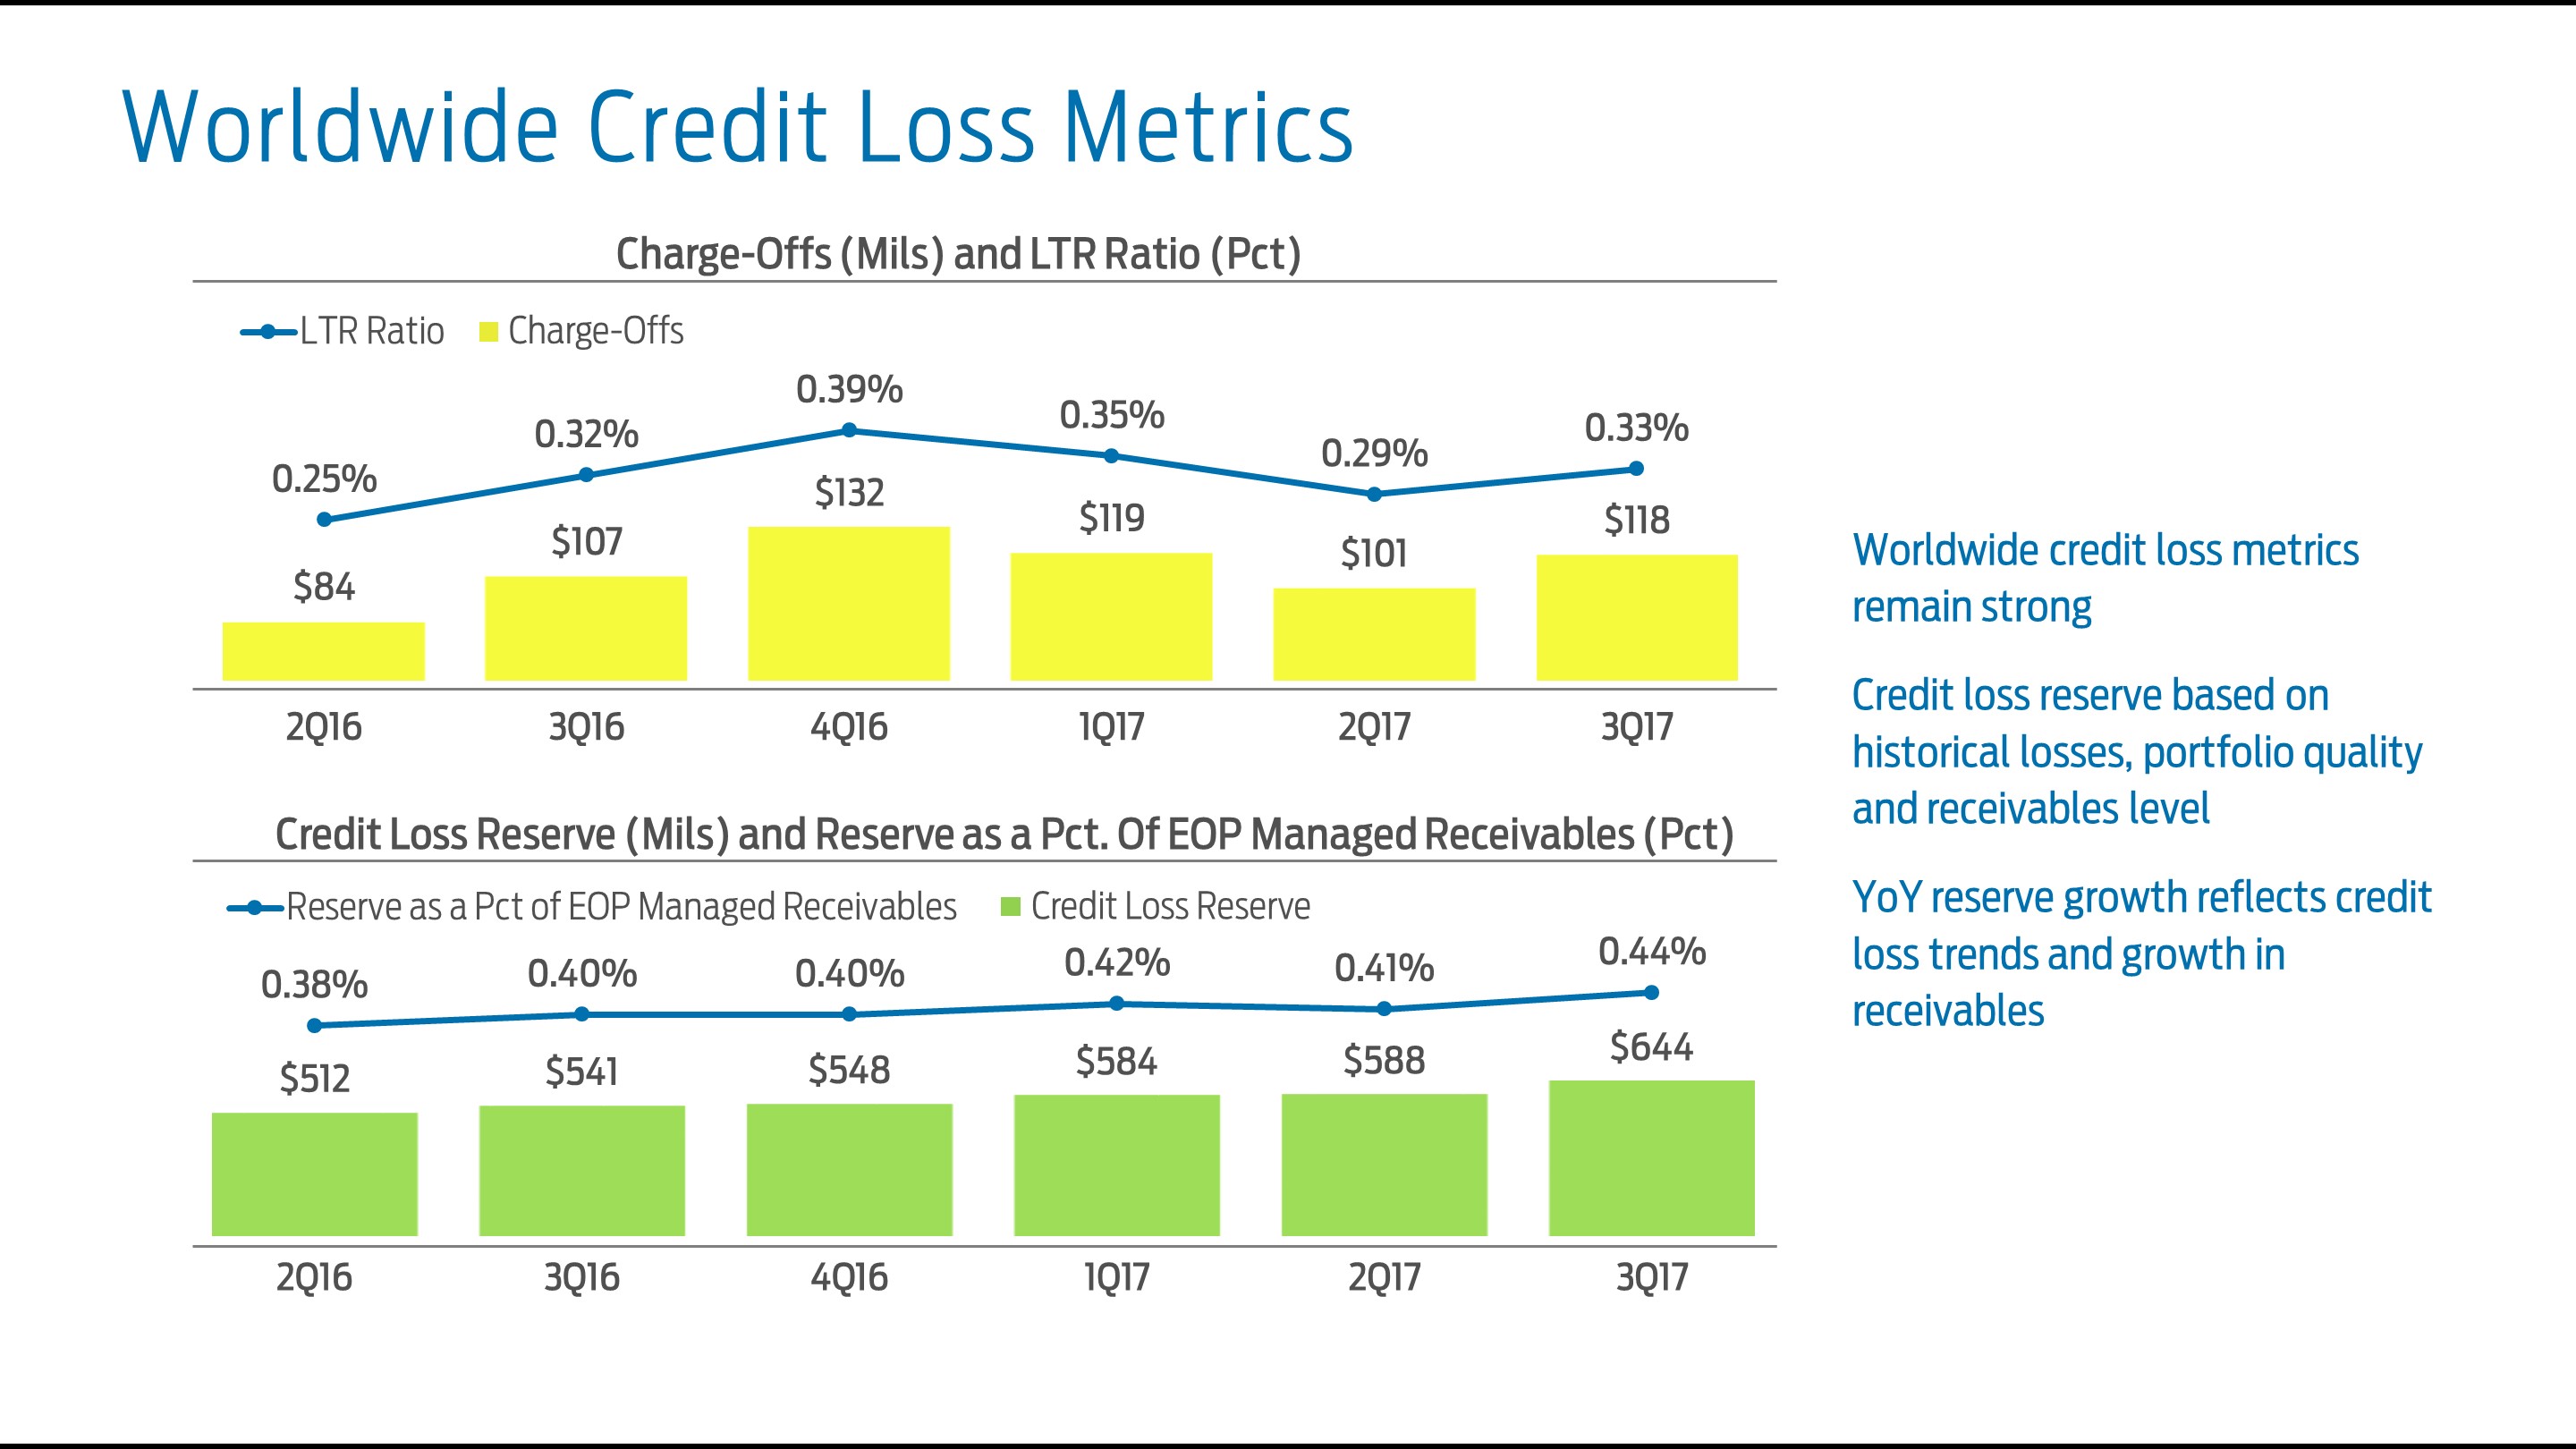
Worldwide Credit Losses
The following table shows key metrics related to worldwide credit losses:
| Third Quarter | First Nine Months | |||||||||||||||
| 2018 | 2019 | 2018 | 2019 | |||||||||||||
| Charge-offs (millions) | $ | 127 | $ | 89 | $ | 296 | $ | 264 | ||||||||
| LTR ratio | 0.43 | % | 0.30 | % | 0.33 | % | 0.29 | % | ||||||||
| Credit loss reserve (millions) | $ | 586 | $ | 513 | $ | 586 | $ | 513 | ||||||||
| Reserve as percent of EOP Managed Receivables | 0.49 | % | 0.44 | % | 0.49 | % | 0.44 | % | ||||||||
Our worldwide charge-offs and LTR ratio were both lower than a year ago. The improvement primarily reflects the non-recurrence of a non-consumer loss recognized in the third quarter of 2018. Our credit loss reserve is based on such factors as historical loss performance, portfolio quality, and receivables level. The credit loss reserve and the reserve as a percent of managed receivables were both lower than a year ago.
34
Item 2. Management’s Discussion and Analysis of Financial Condition and Results of Operations (Continued)
Residual Risk
Leasing is an important product that many customers want and value. Leasevalue, and operating lease customers also are more likely to buy or lease another Ford or Lincoln vehicle. Ford and Ford CreditWe manage our lease share with an enterprise view to support sales, protect residual values, and manage the trade cycle. OurFord Credit and Ford work together under a leasing strategy that considers share, term, model mix, geography, and other factors.
We are exposed to residual risk on operating leases and similar balloon payment products where the customer may return the financed vehicle to us. Residual risk is the possibility that the amount we obtain from returned vehicles will be less than our estimate of the expected residual value for the vehicle. We estimate the expected residual value by evaluating recent auction values, return volumes for our leased vehicles, industry-wideindustry wide used vehicle prices, marketing incentive plans, and vehicle quality data. For operating leases, changes in expected residual values impact the depreciation expense, which is recognized on a straight-line basis over the life of the lease.
For additional information on our residual risk on operating leases, refer to the “Critical Accounting Estimates -– Accumulated Depreciation on Vehicles Subject to Operating Leases” section of Item 7 of Exhibit 99 toPart II of our April 27, 20172018 Form 8-K10-K Report.
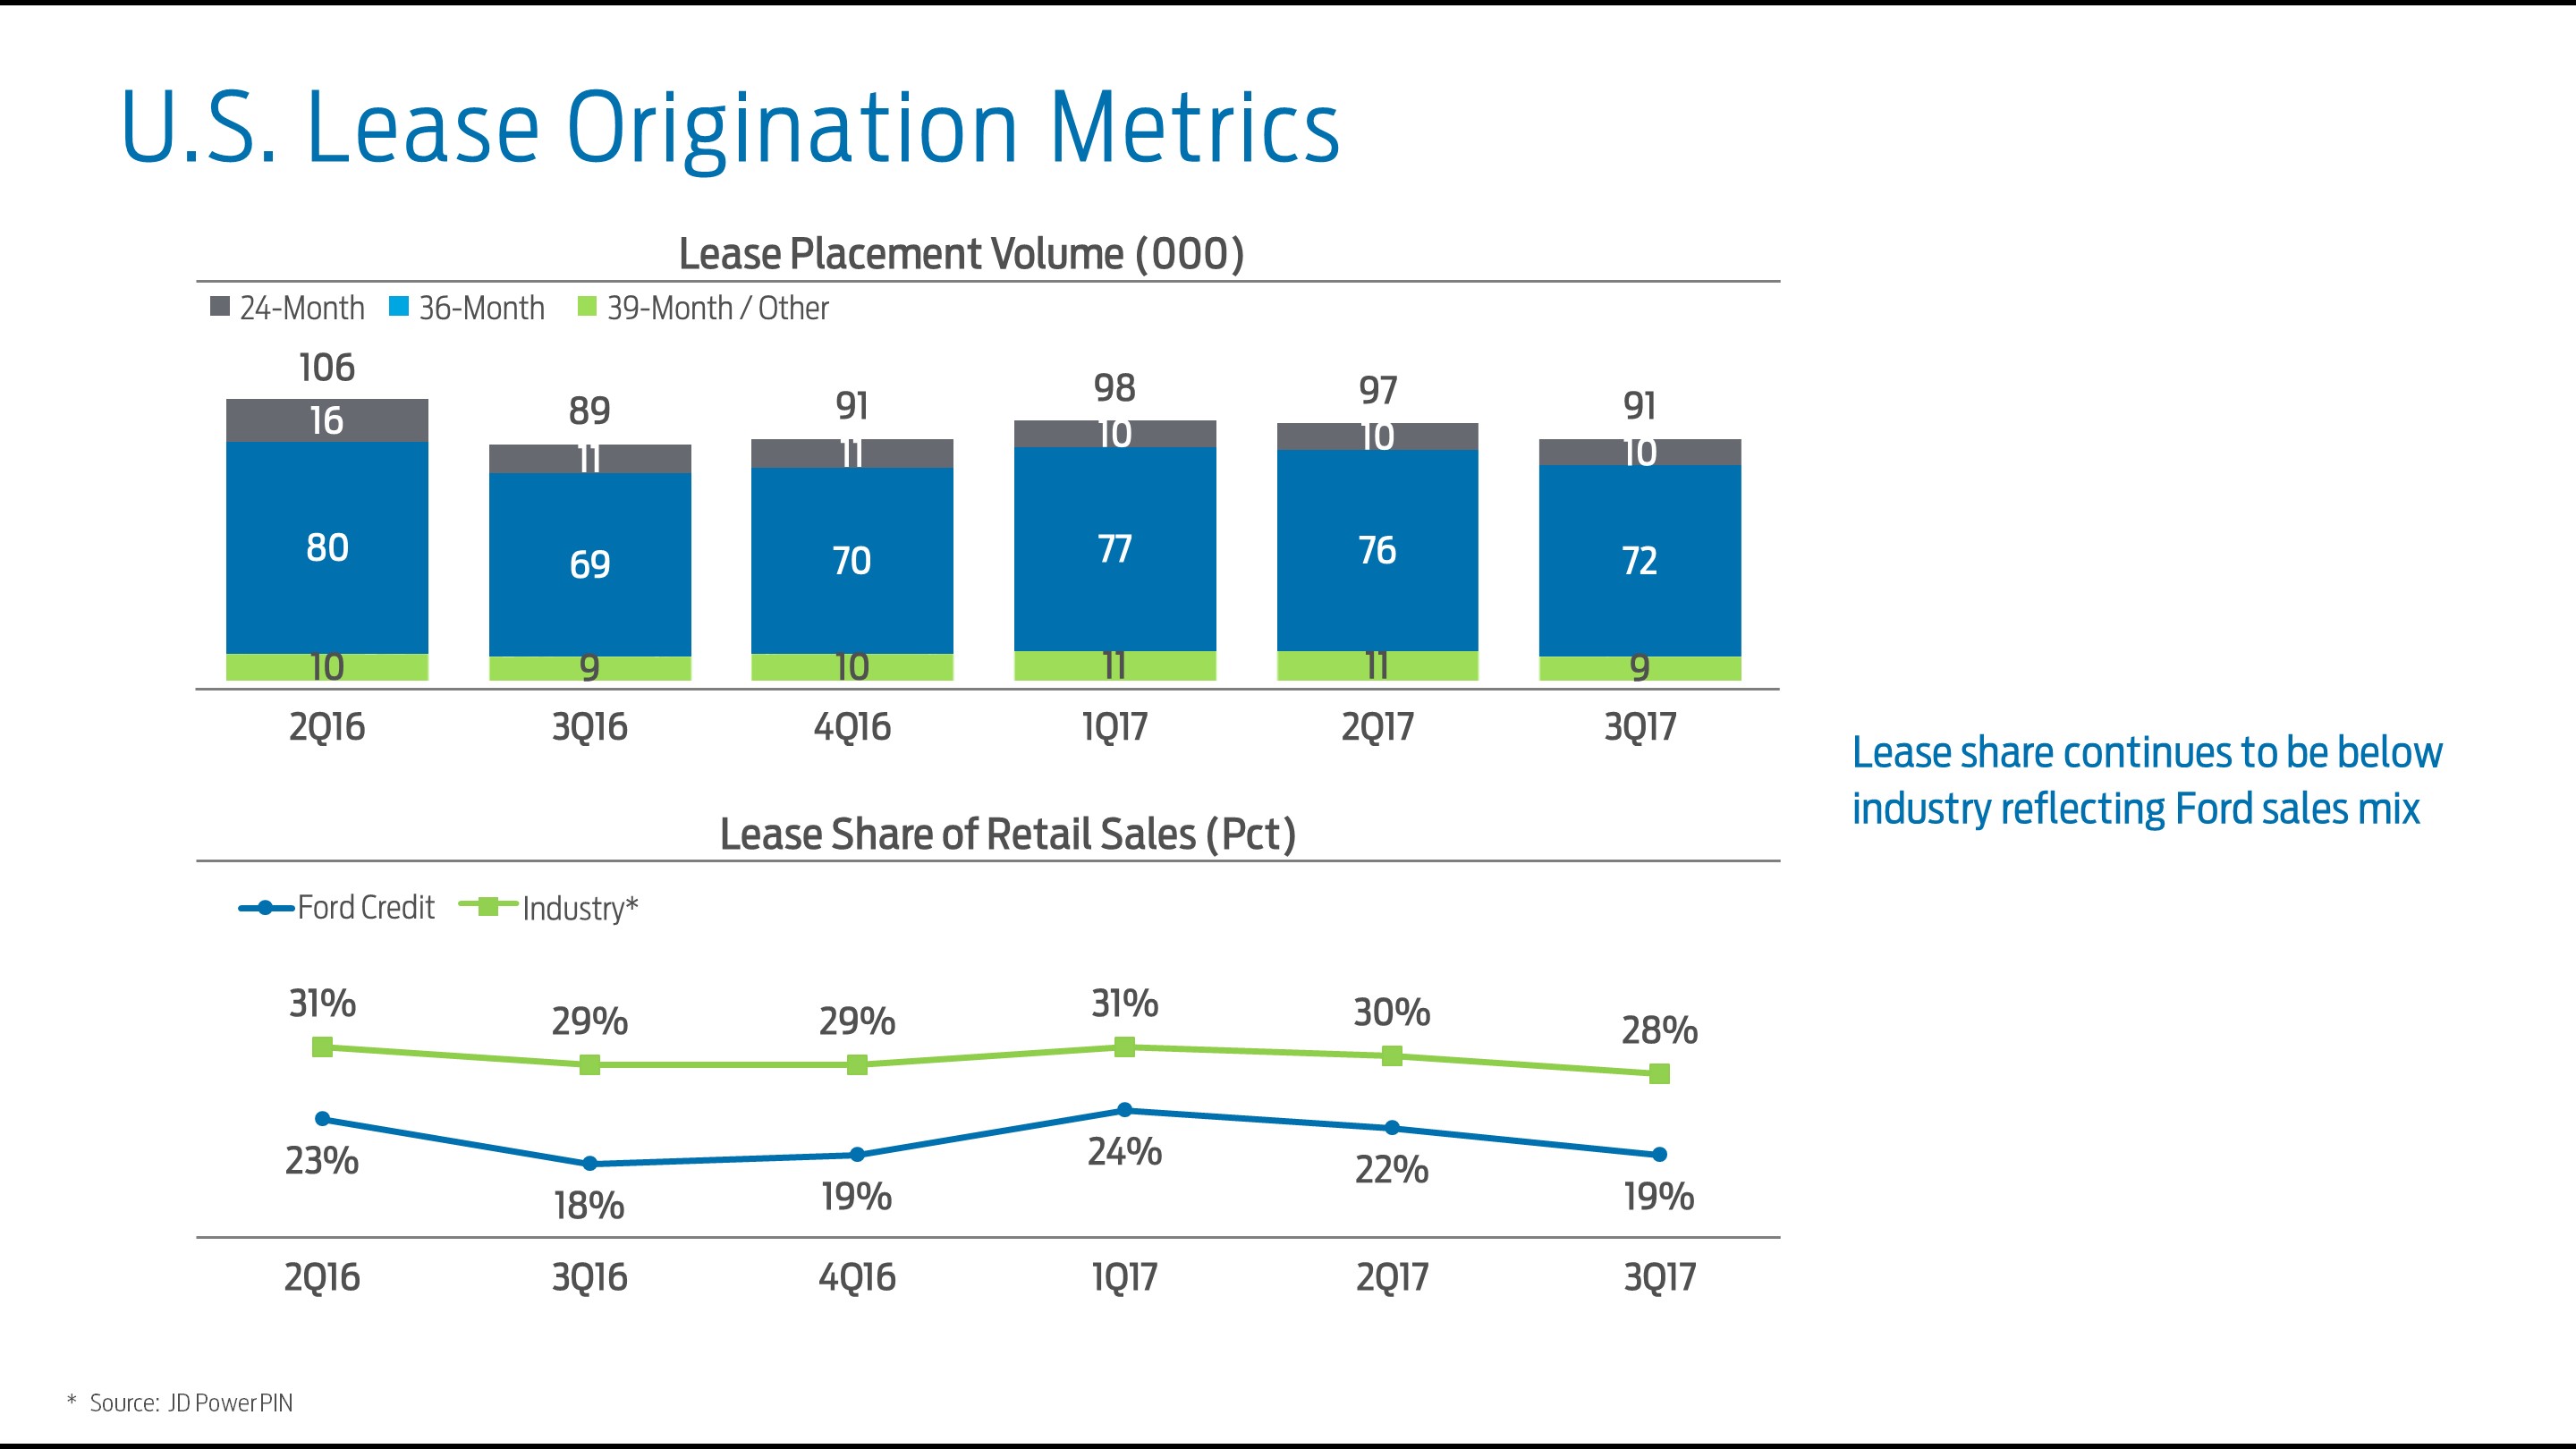
U.S.Ford- Ford and Lincoln-BrandLincoln Brand Operating Lease ExperienceLeases
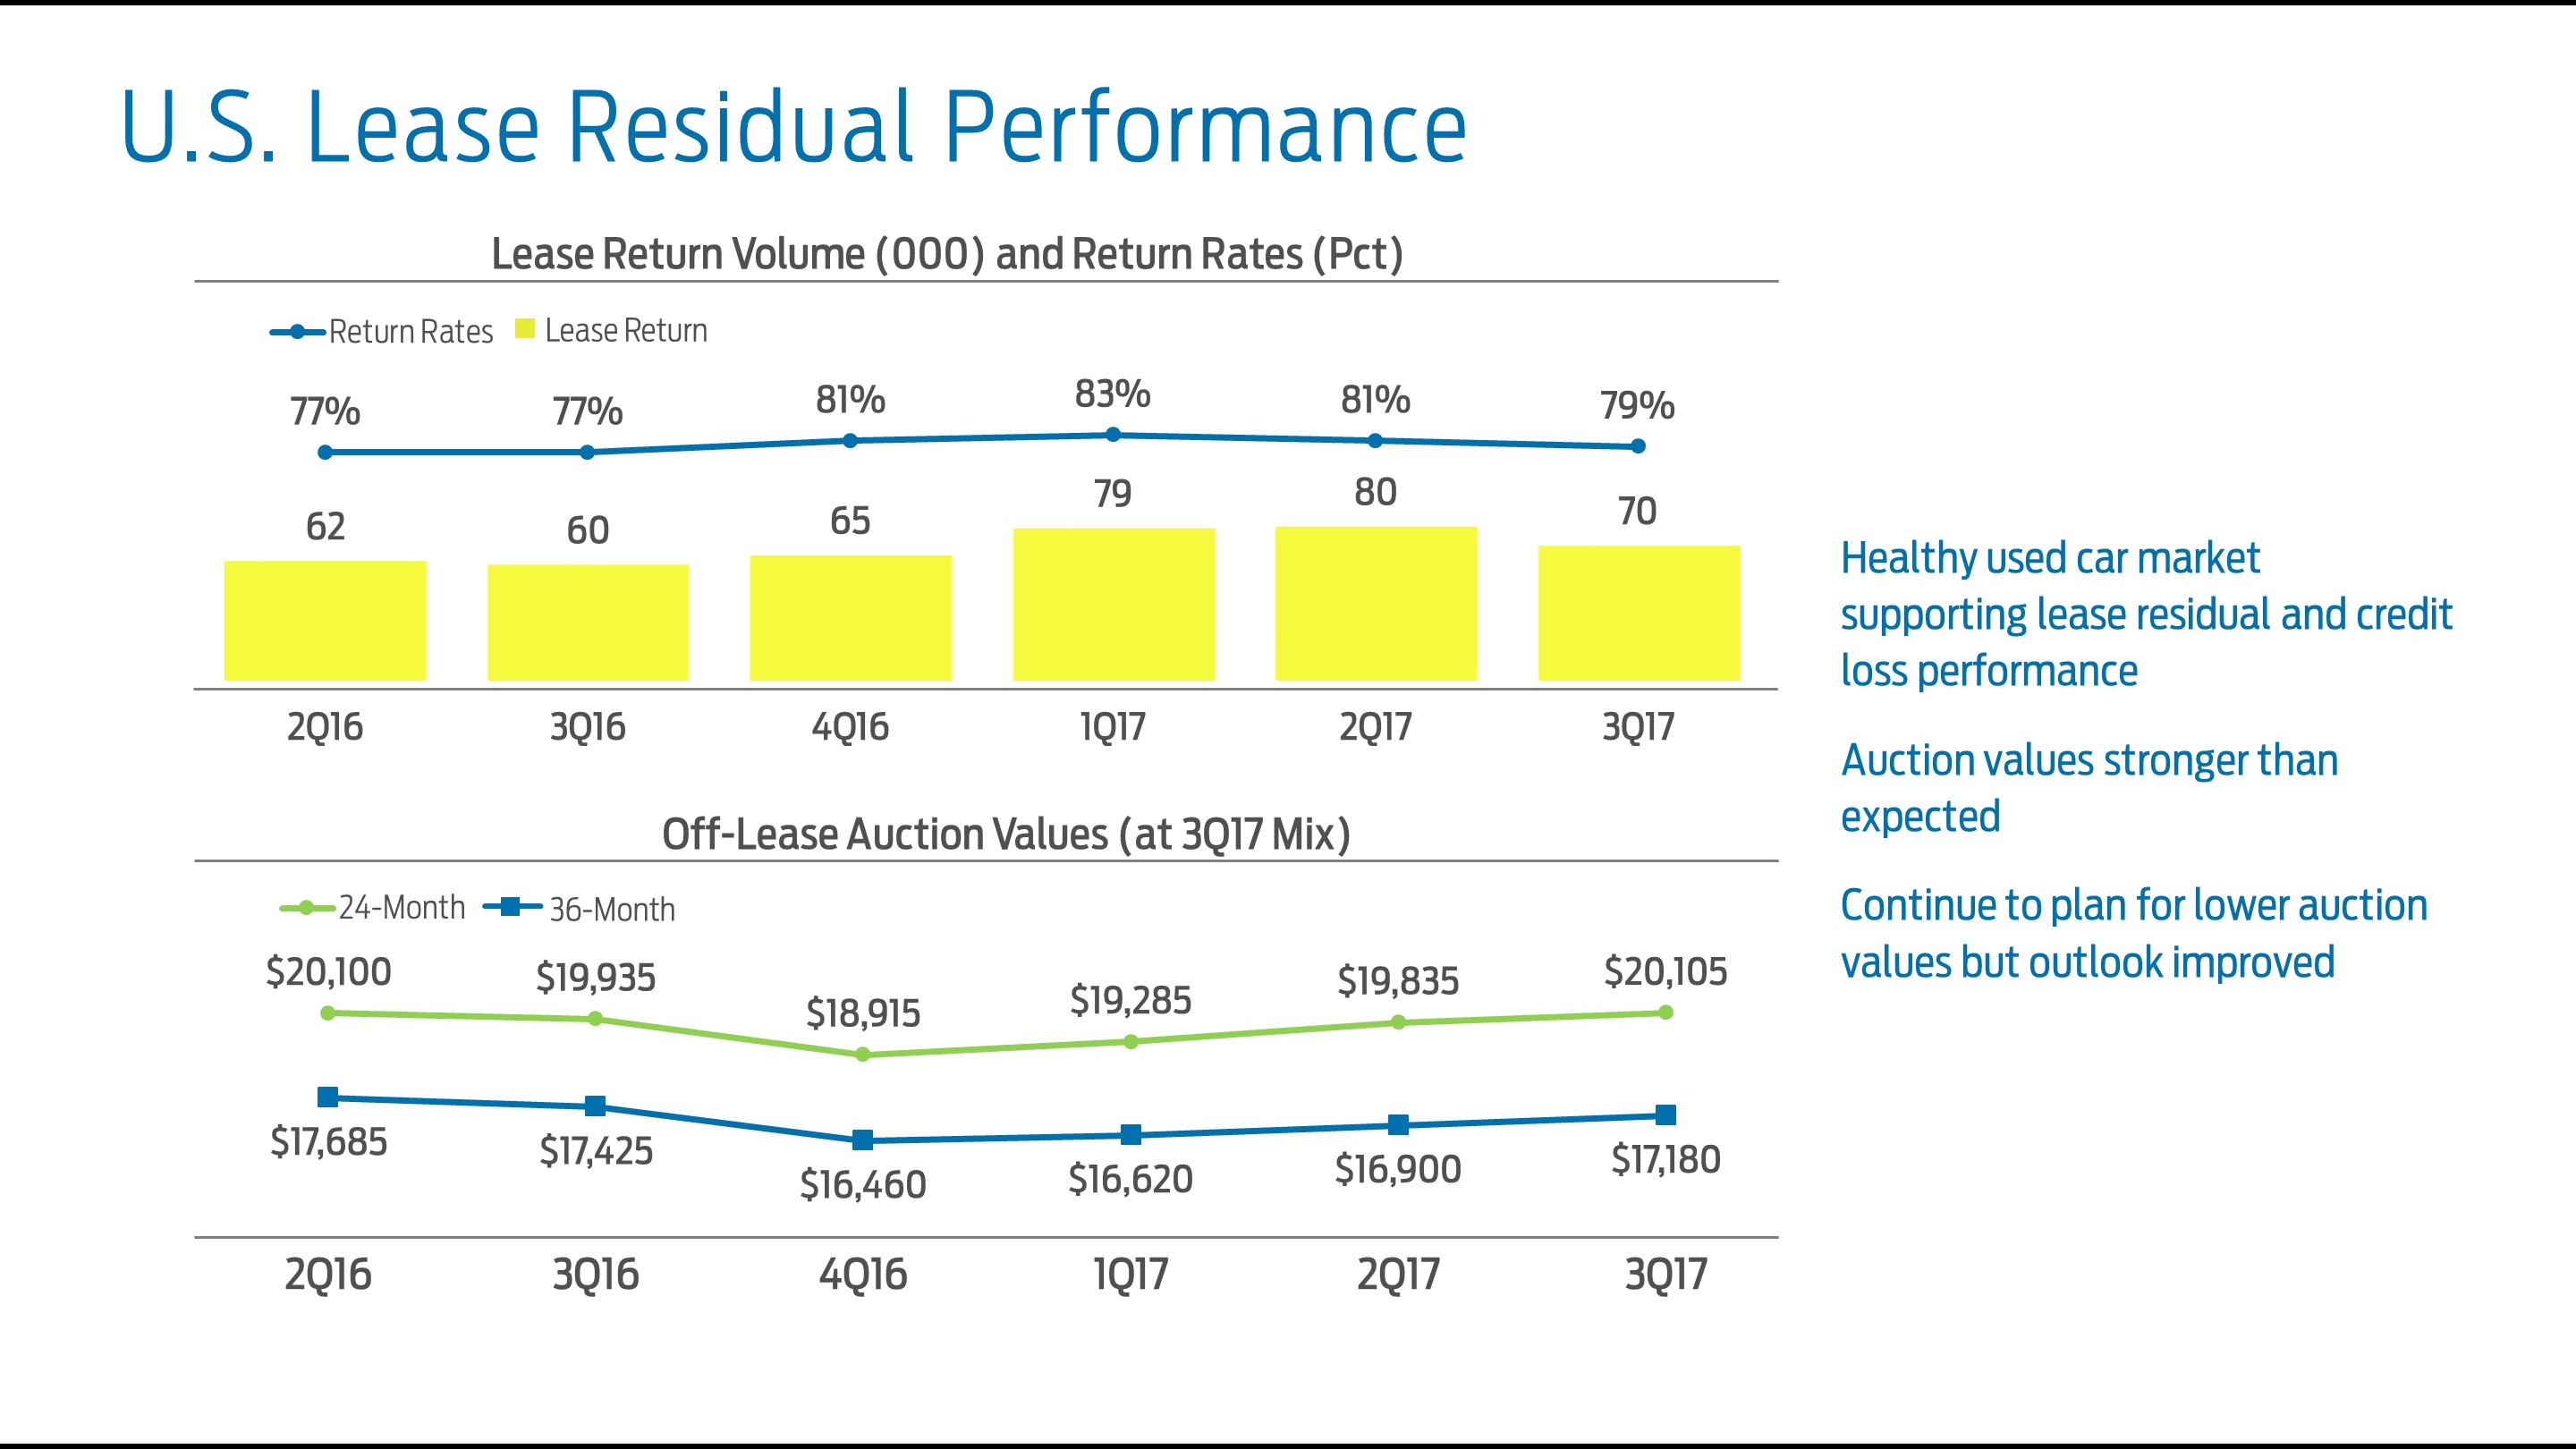
The following charts showtable shows share of Ford and Lincoln brand retail financing and operating lease sales, placement volume, and lease share of Ford- and Lincoln-brand retail salesresidual performance metrics for vehicles in the respective periods. Theour U.S. operating lease portfolio, accounted forwhich represents 86% of our total net investment in operating leases at September 30, 2017.2019.
| Third Quarter | First Nine Months | |||||||||||||||
| 2018 | 2019 | 2018 | 2019 | |||||||||||||
| Lease Share of Retail Sales | ||||||||||||||||
| Ford Credit | 21 | % | 19 | % | 22 | % | 20 | % | ||||||||
| Industry (a) | 29 | % | 29 | % | 30 | % | 30 | % | ||||||||
| Placement Volume (000) | ||||||||||||||||
| 24-Month | 10 | 11 | 34 | 29 | ||||||||||||
| 36-Month | 80 | 68 | 213 | 172 | ||||||||||||
| 39-Month / Other | 5 | 4 | 45 | 46 | ||||||||||||
| Total | 95 | 83 | 292 | 247 | ||||||||||||
| Residual Performance | ||||||||||||||||
| Return rates | 77 | % | 76 | % | 78 | % | 78 | % | ||||||||
| Return volume (000) | 71 | 70 | 210 | 220 | ||||||||||||
| Off-lease auction values (b) | $ | 19,190 | $ | 18,865 | $ | 18,415 | $ | 18,160 | ||||||||
__________
| (a) | Source: J.D. Power PIN |
| (b) | 36-month off-lease auction values; quarterly amounts at 3Q 2019 mix and YTD amounts at 2019 YTD mix |
Lease return volume and return rate in the third quarter of 2019 were down from a year ago. Our third quarter 2019 36-month off-lease auction values were also down compared with a year ago.
We now expect full-year 2019 off-lease 36-month auction values to be around 2% lower compared with 2018 at constant mix.
35
Item 2. Management’s Discussion and Analysis of Financial Condition and Results of Operations (Continued)
Credit Ratings
Our short-term and long-term debt is rated by four credit rating agencies designated as nationally recognized statistical rating organizations (“NRSROs”) by the U.S. Securities and Exchange Commission: DBRS, Fitch, Moody’s, and S&P.
In several markets, locally recognized rating agencies also rate us. A credit rating reflects an assessment by the rating agency of the credit risk associated with a corporate entity or particular securities issued by that entity. Rating agencies’ ratings of us are based on information provided by us and other sources. Credit ratings assigned to us from all of the NRSROs are closely associated with their opinions on Ford. Credit ratings are not recommendations to buy, sell, or hold securities and are subject to revision or withdrawal at any time by the assigning rating agency. Each rating agency may have different criteria for evaluating company risk and, therefore, ratings should be evaluated independently for each rating agency.
On September 9, 2019, Moody’s downgraded the credit rating for Ford Credit to non-investment grade (Ba1 from Baa3) and revised the outlook to stable from negative.
The following charttable summarizes certain of the credit ratings and outlook presently assigned by these four NRSROs:
| NRSRO RATINGS | |||||||||||||||
| Ford Credit | NRSROs | ||||||||||||||
| Long-Term Senior Unsecured | Short -Term Unsecured | Minimum Long-Term Investment Grade Rating | |||||||||||||
| DBRS | BBB | R-2M | BBB (low) | ||||||||||||
| Fitch | BBB | F2 | BBB- | ||||||||||||
| Moody’s | Stable | Baa3 | |||||||||||||
| S&P | BBB | A-2 | BBB- | ||||||||||||
36
Item 2. Management’s Discussion and Analysis of Financial Condition and Results of Operations (Continued)
Funding and Liquidity
Our primary funding and liquidity objective is to be well capitalized with a strong investment grade balance sheet and ample liquidity to support our financing activities and growth under a variety of market conditions, including short-term and long-term market disruptions.
Our funding strategy remains focused on diversification, and we plan to continue accessing a variety of markets, channels, and investors.
Our liquidity profile continues to be diverse, robust, and focused on maintaining liquidity levels that meet our business and funding requirements. We annually stress test our balance sheet and liquidity to ensure that we continue to meet our financial obligations through economic cycles.
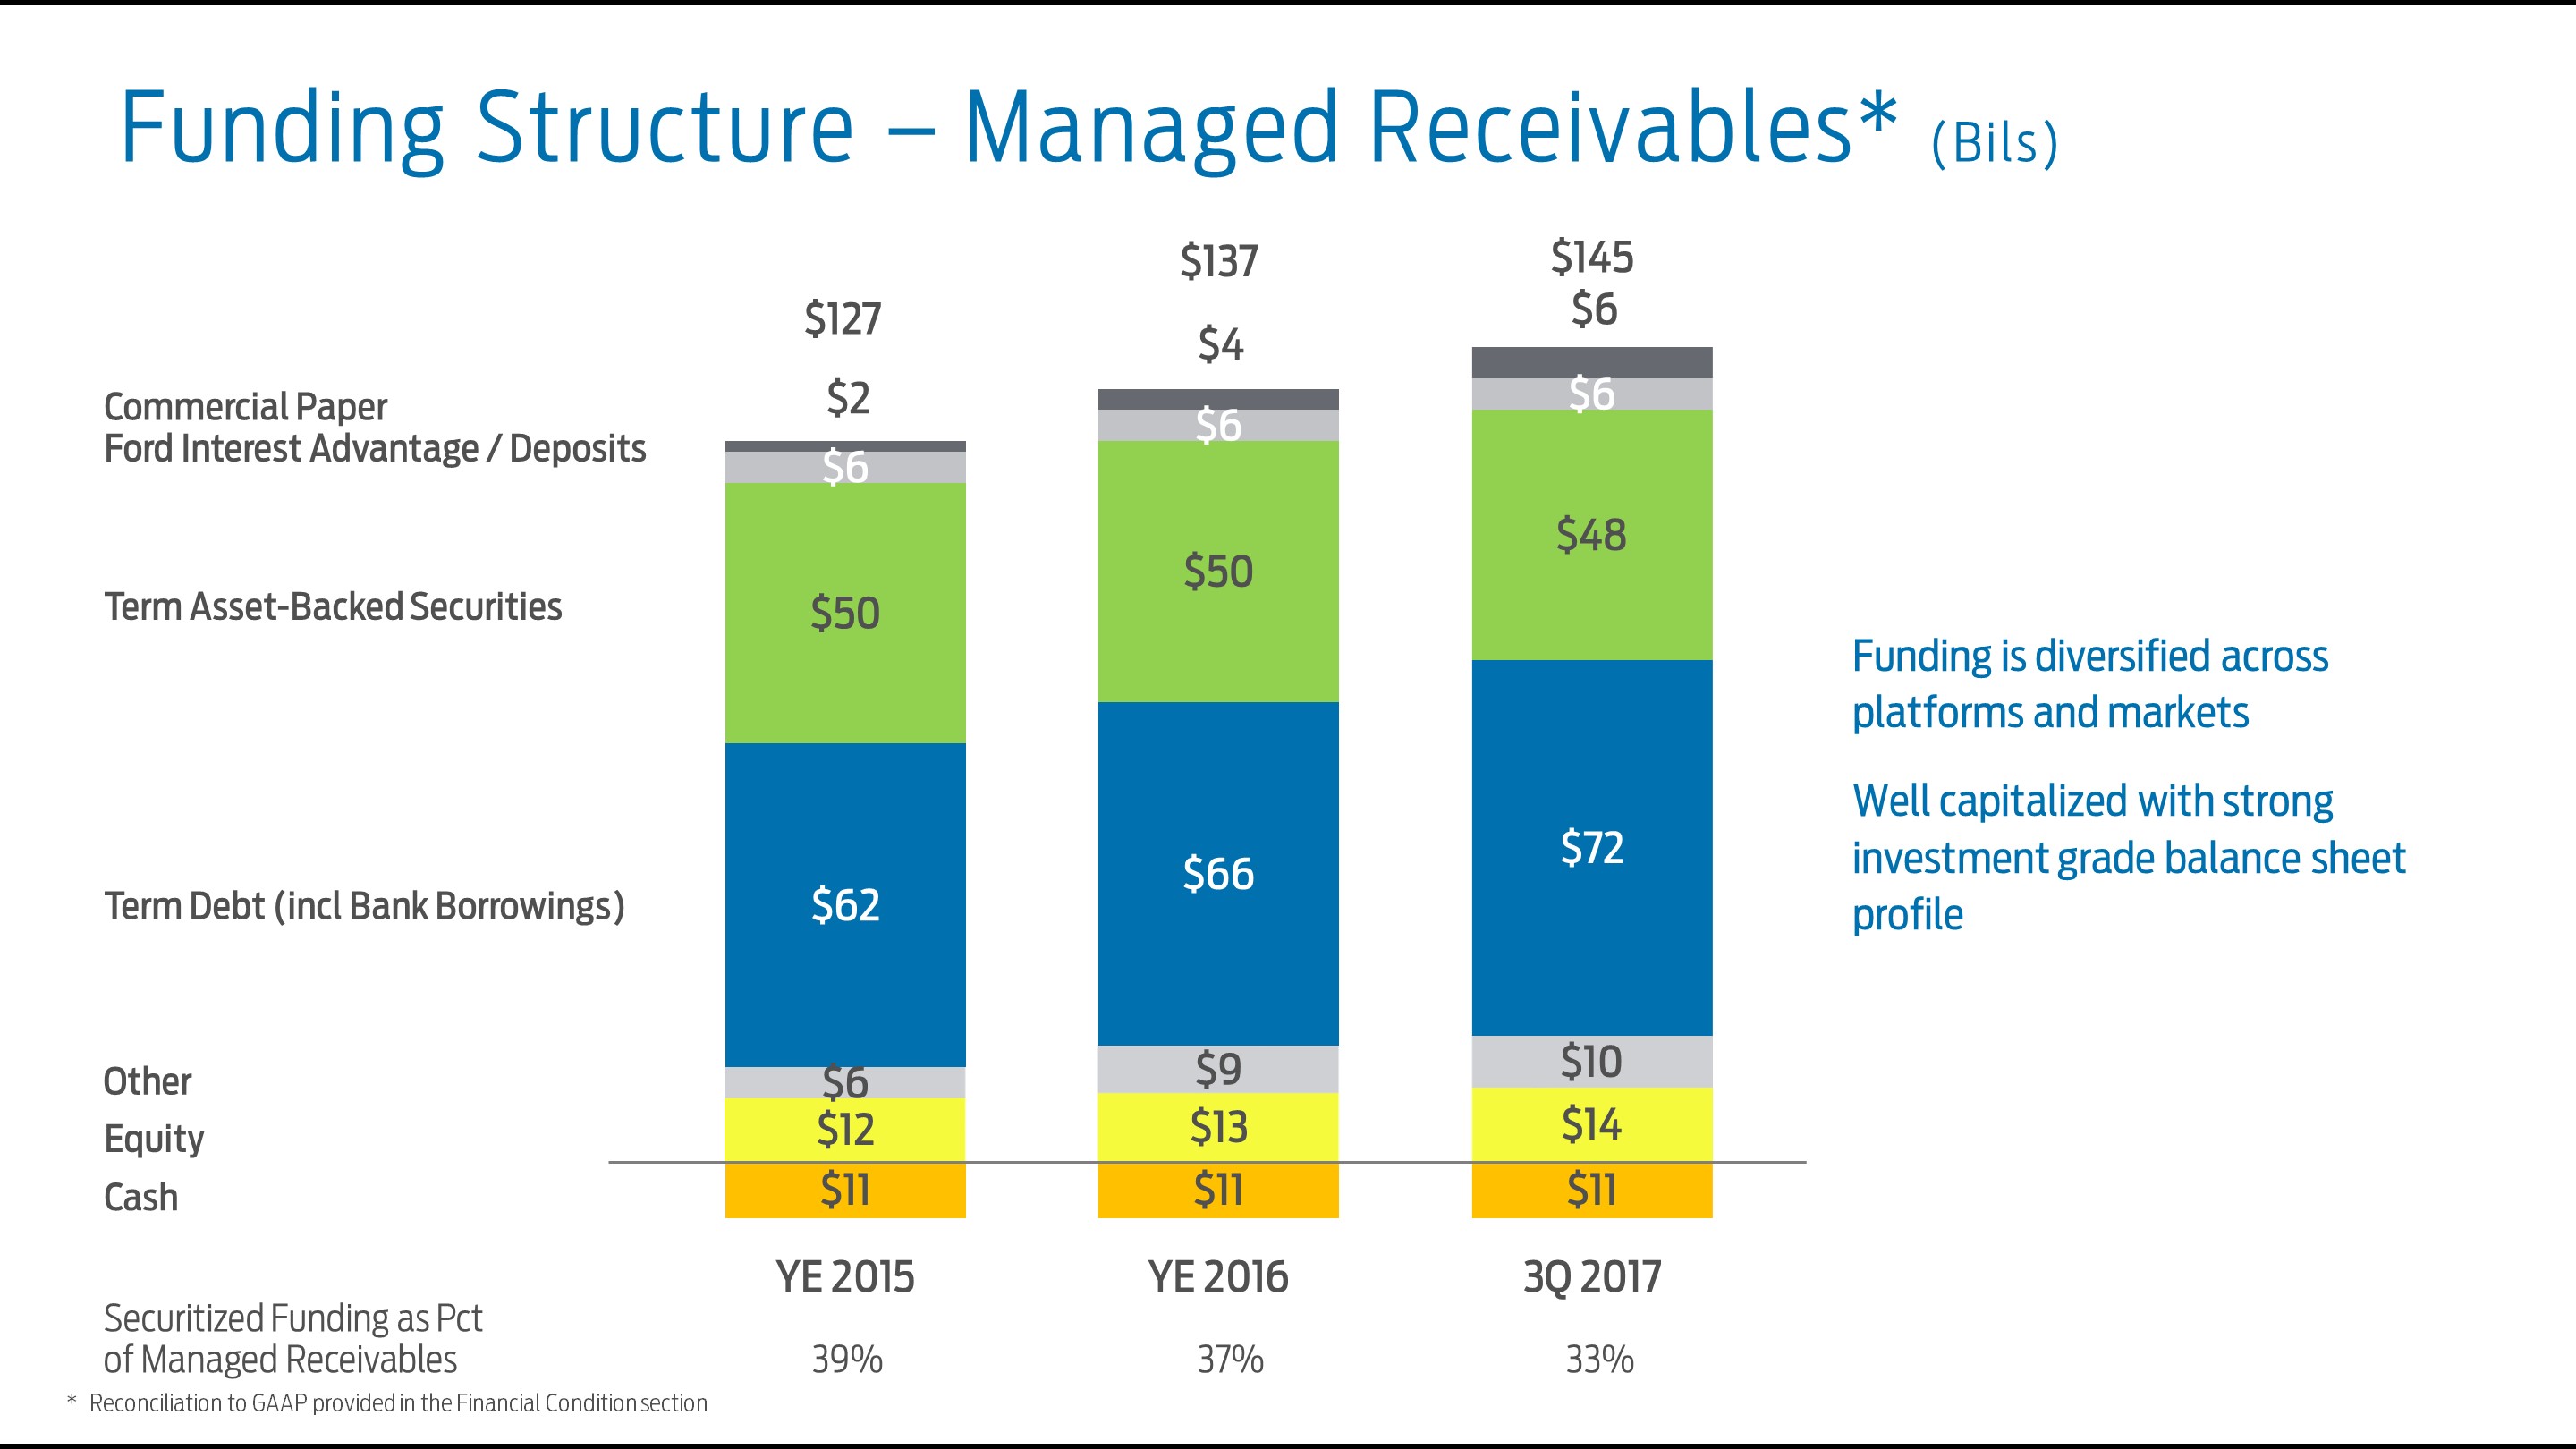
The following charttable shows the trends in funding for our managed receivables:receivables (in billions):
| Funding Structure | September 30, 2018 | December 31, 2018 | September 30, 2019 | ||||||||
| Term Debt (incl. Bank Borrowings) | $ | 73 | $ | 70 | $ | 74 | |||||
| Term Asset-Backed Securities | 55 | 60 | 55 | ||||||||
| Commercial Paper | 4 | 4 | 4 | ||||||||
| Ford Interest Advantage / Deposits | 6 | 6 | 7 | ||||||||
| Other | 11 | 10 | 9 | ||||||||
| Equity | 15 | 15 | 14 | ||||||||
| Adjustments for Cash | (12 | ) | (10 | ) | (14 | ) | |||||
| Total Managed Receivables (a) | $ | 152 | $ | 155 | $ | 149 | |||||
| Securitized Funding as a percent of Managed Receivables | 36 | % | 39 | % | 37 | % | |||||
__________
| (a) | Reconciliation to GAAP provided in the Financial Condition section |
Managed receivables of $145$149 billion as of September 30, 2017,2019, were funded primarily with term debt and term asset-backed securities. Securitized funding as a percent of managed receivables was 33%37%.
We expect thetarget a mix of securitized funding to remain aroundbetween 35% and 40%. The calendarization of the funding plan will result in quarterly fluctuations of the securitized funding percentage.
Public Term Funding Plan
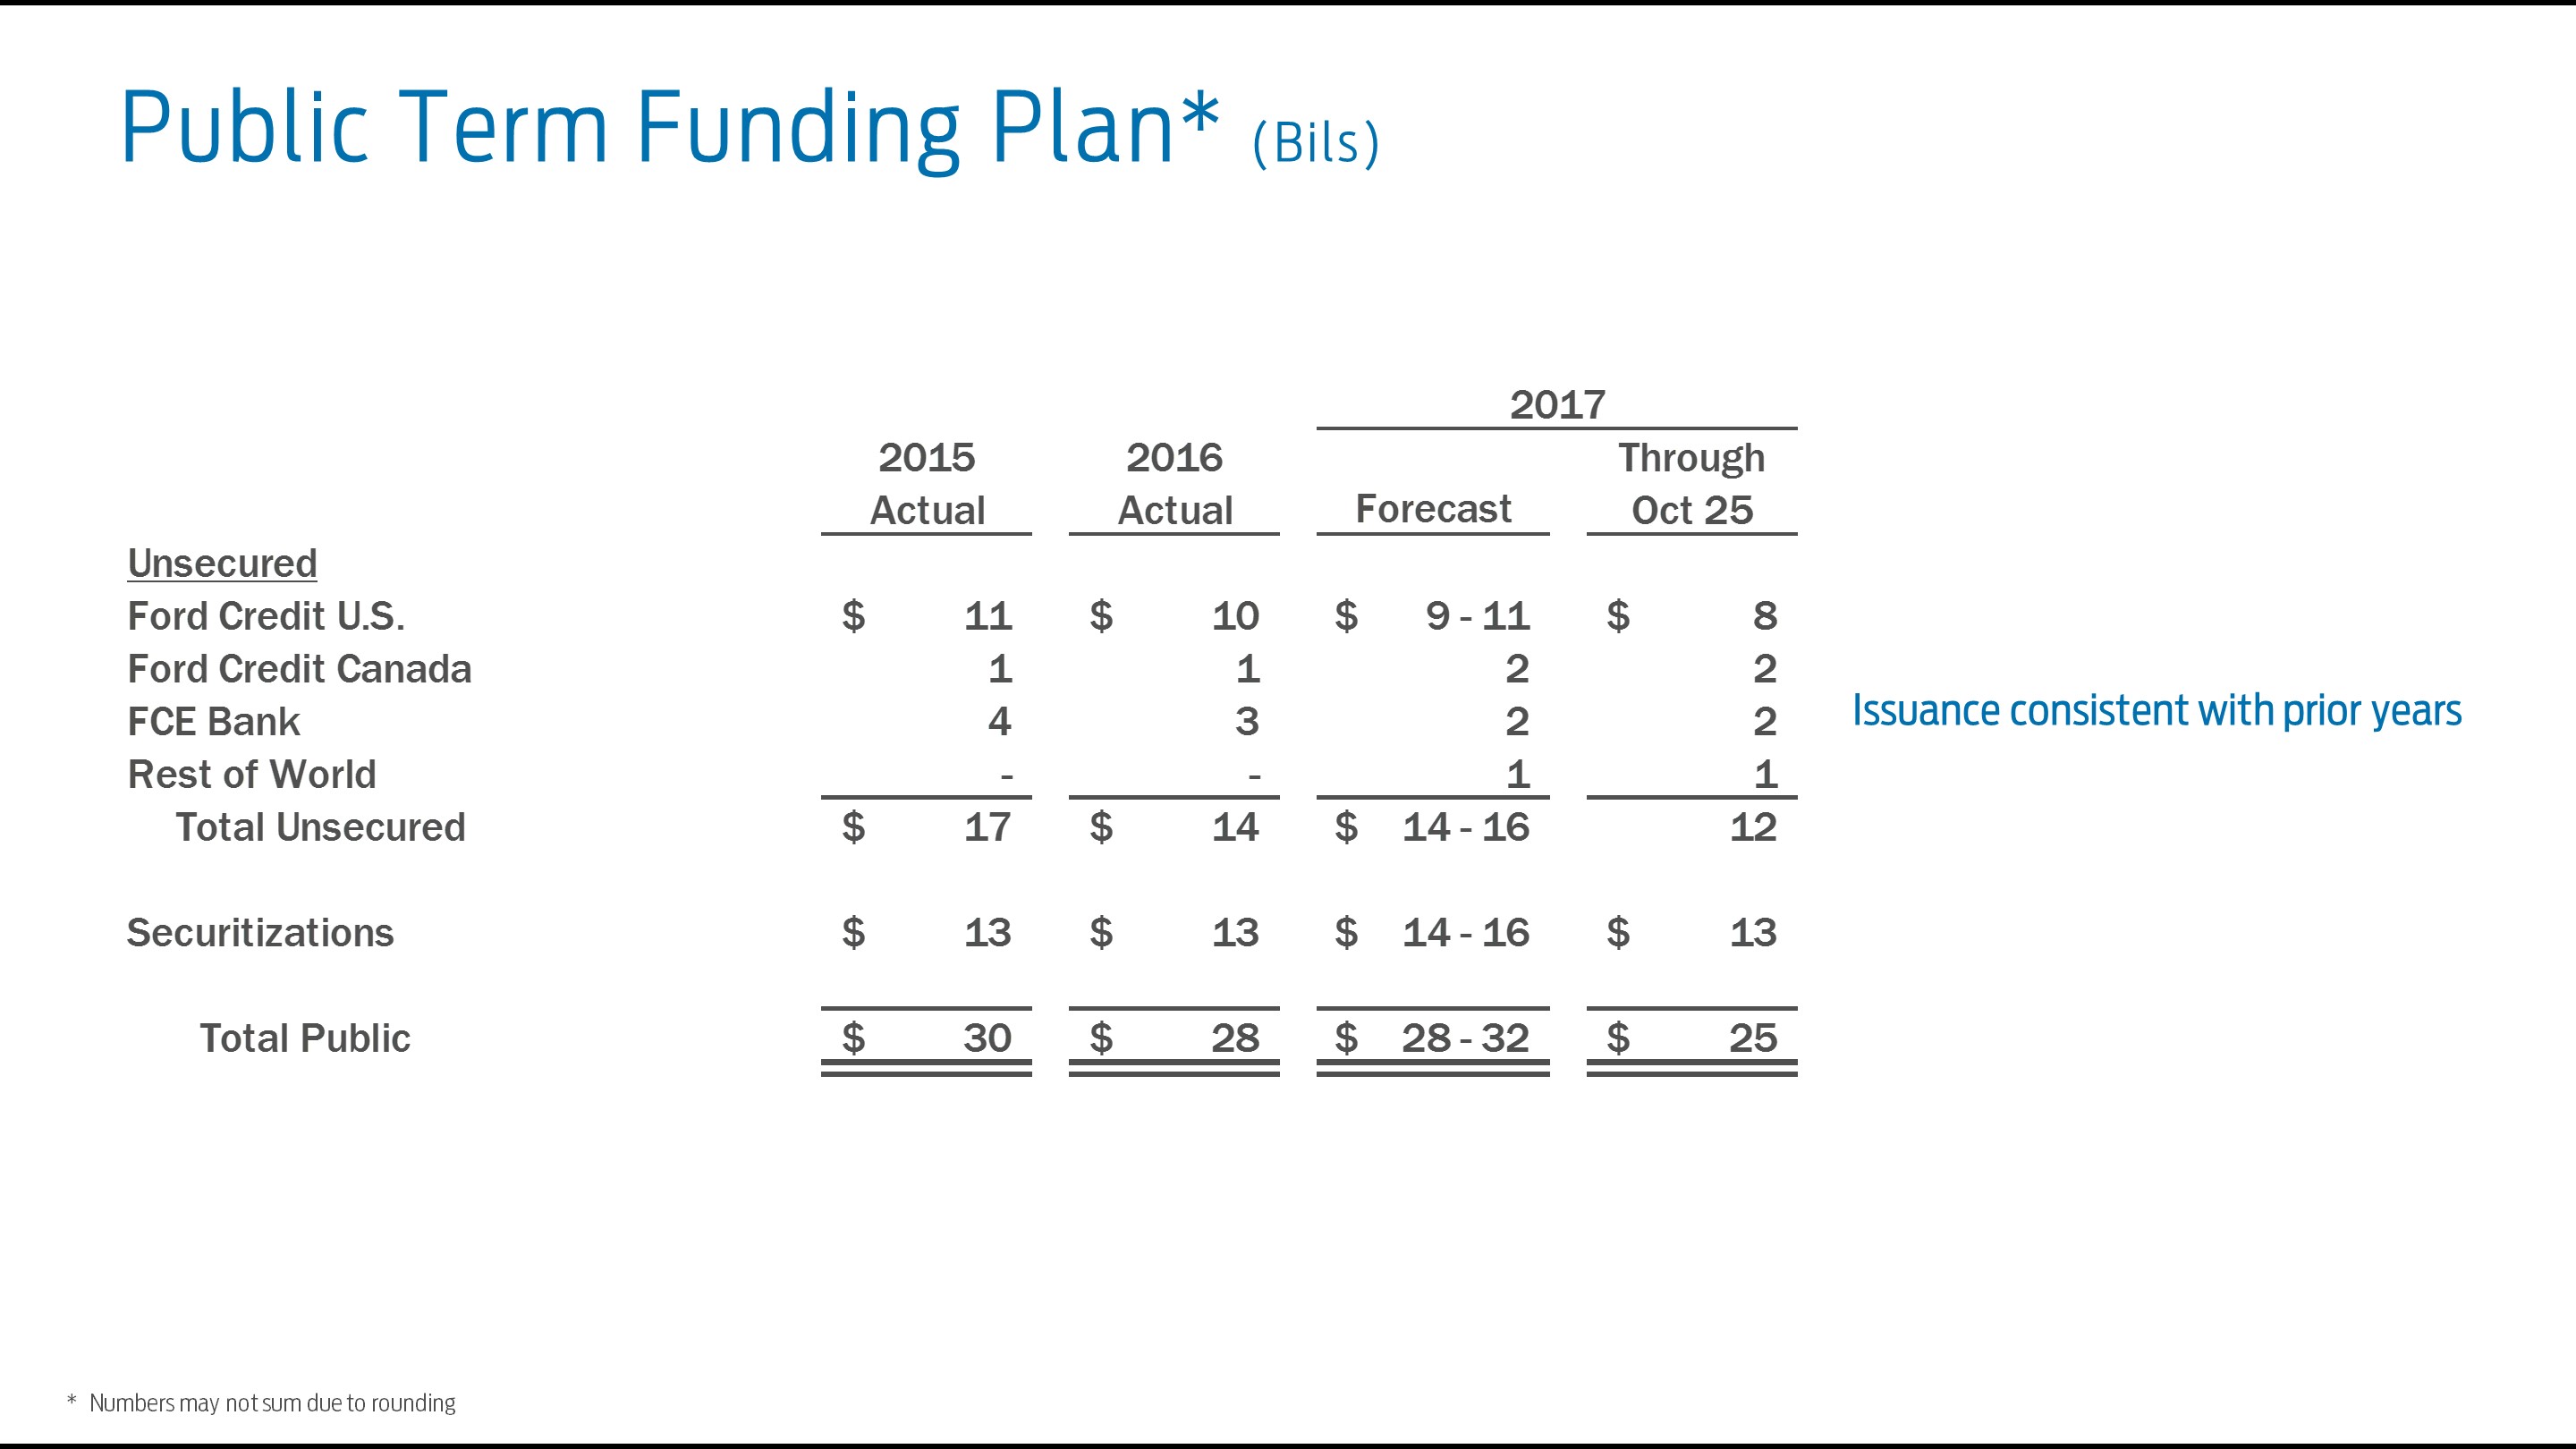
The following table shows our issuances for full-year 2017 and 2018, planned issuances for full-year 2019, and our global public term funding issuances through October 22, 2019, excluding short-term funding programs (in billions):
| 2017 Actual | 2018 Actual | 2019 Forecast | Through Oct 22 | |||||||||||
| Unsecured - Currency of Issuance (USD Equivalent) | ||||||||||||||
| USD | $ | 10 | $ | 6 | $ 9 - 10 | $ | 9 | |||||||
| CAD | 2 | 1 | 1 | 1 | ||||||||||
| EUR / GBP | 3 | 4 | 4 - 5 | 4 | ||||||||||
| Other | 1 | 1 | 1 | 1 | ||||||||||
| Total unsecured | $ | 16 | $ | 13 | $ 15 - 17 | $ | 14 | |||||||
| Securitizations | 15 | 14 | 13 - 14 | 12 | ||||||||||
| Total public | $ | 32 | $ | 27 | $ 28 - 31 | $ | 26 | |||||||
Note: Numbers may not sum due to rounding
Our total unsecured public term funding plan is categorized by currency of issuance. We plan to continue issuing our eurocurrency-denominated (e.g., euro and sterling) public unsecured debt from the United States. For 2019, we now project full-year public term funding in the range of $28 billion to $31 billion.
Through October 22, 2019, we have completed $26 billion of public term issuances.
37
Item 2. Management’s Discussion and Analysis of Financial Condition and Results of Operations (Continued)
Liquidity Sources
We define gross liquidity as cash, cash equivalents, and marketable securities (excluding amounts related to insurance activities) and committed capacity (which includes our credit and asset-backed facilities and bank lines), less utilization of liquidity. Utilization of liquidity is the amount funded under our liquidity sources and also includes the cash and cash equivalents required to support securitization transactions. Securitization cash is cash held for the benefit of the securitization investors (for example, a reserve fund). Net liquidity available for use is defined as gross liquidity less certain adjustments for asset-backed capacity in excess of eligible receivables and cash related to the Ford Credit Revolving Extended Variable-utilization program (“FordREV”), which can be accessed through future sales of receivables. While not included in available liquidity, these adjustments represent additional funding sources for future originations.
The following charttable shows our liquidity sources and utilization:utilization (in billions):
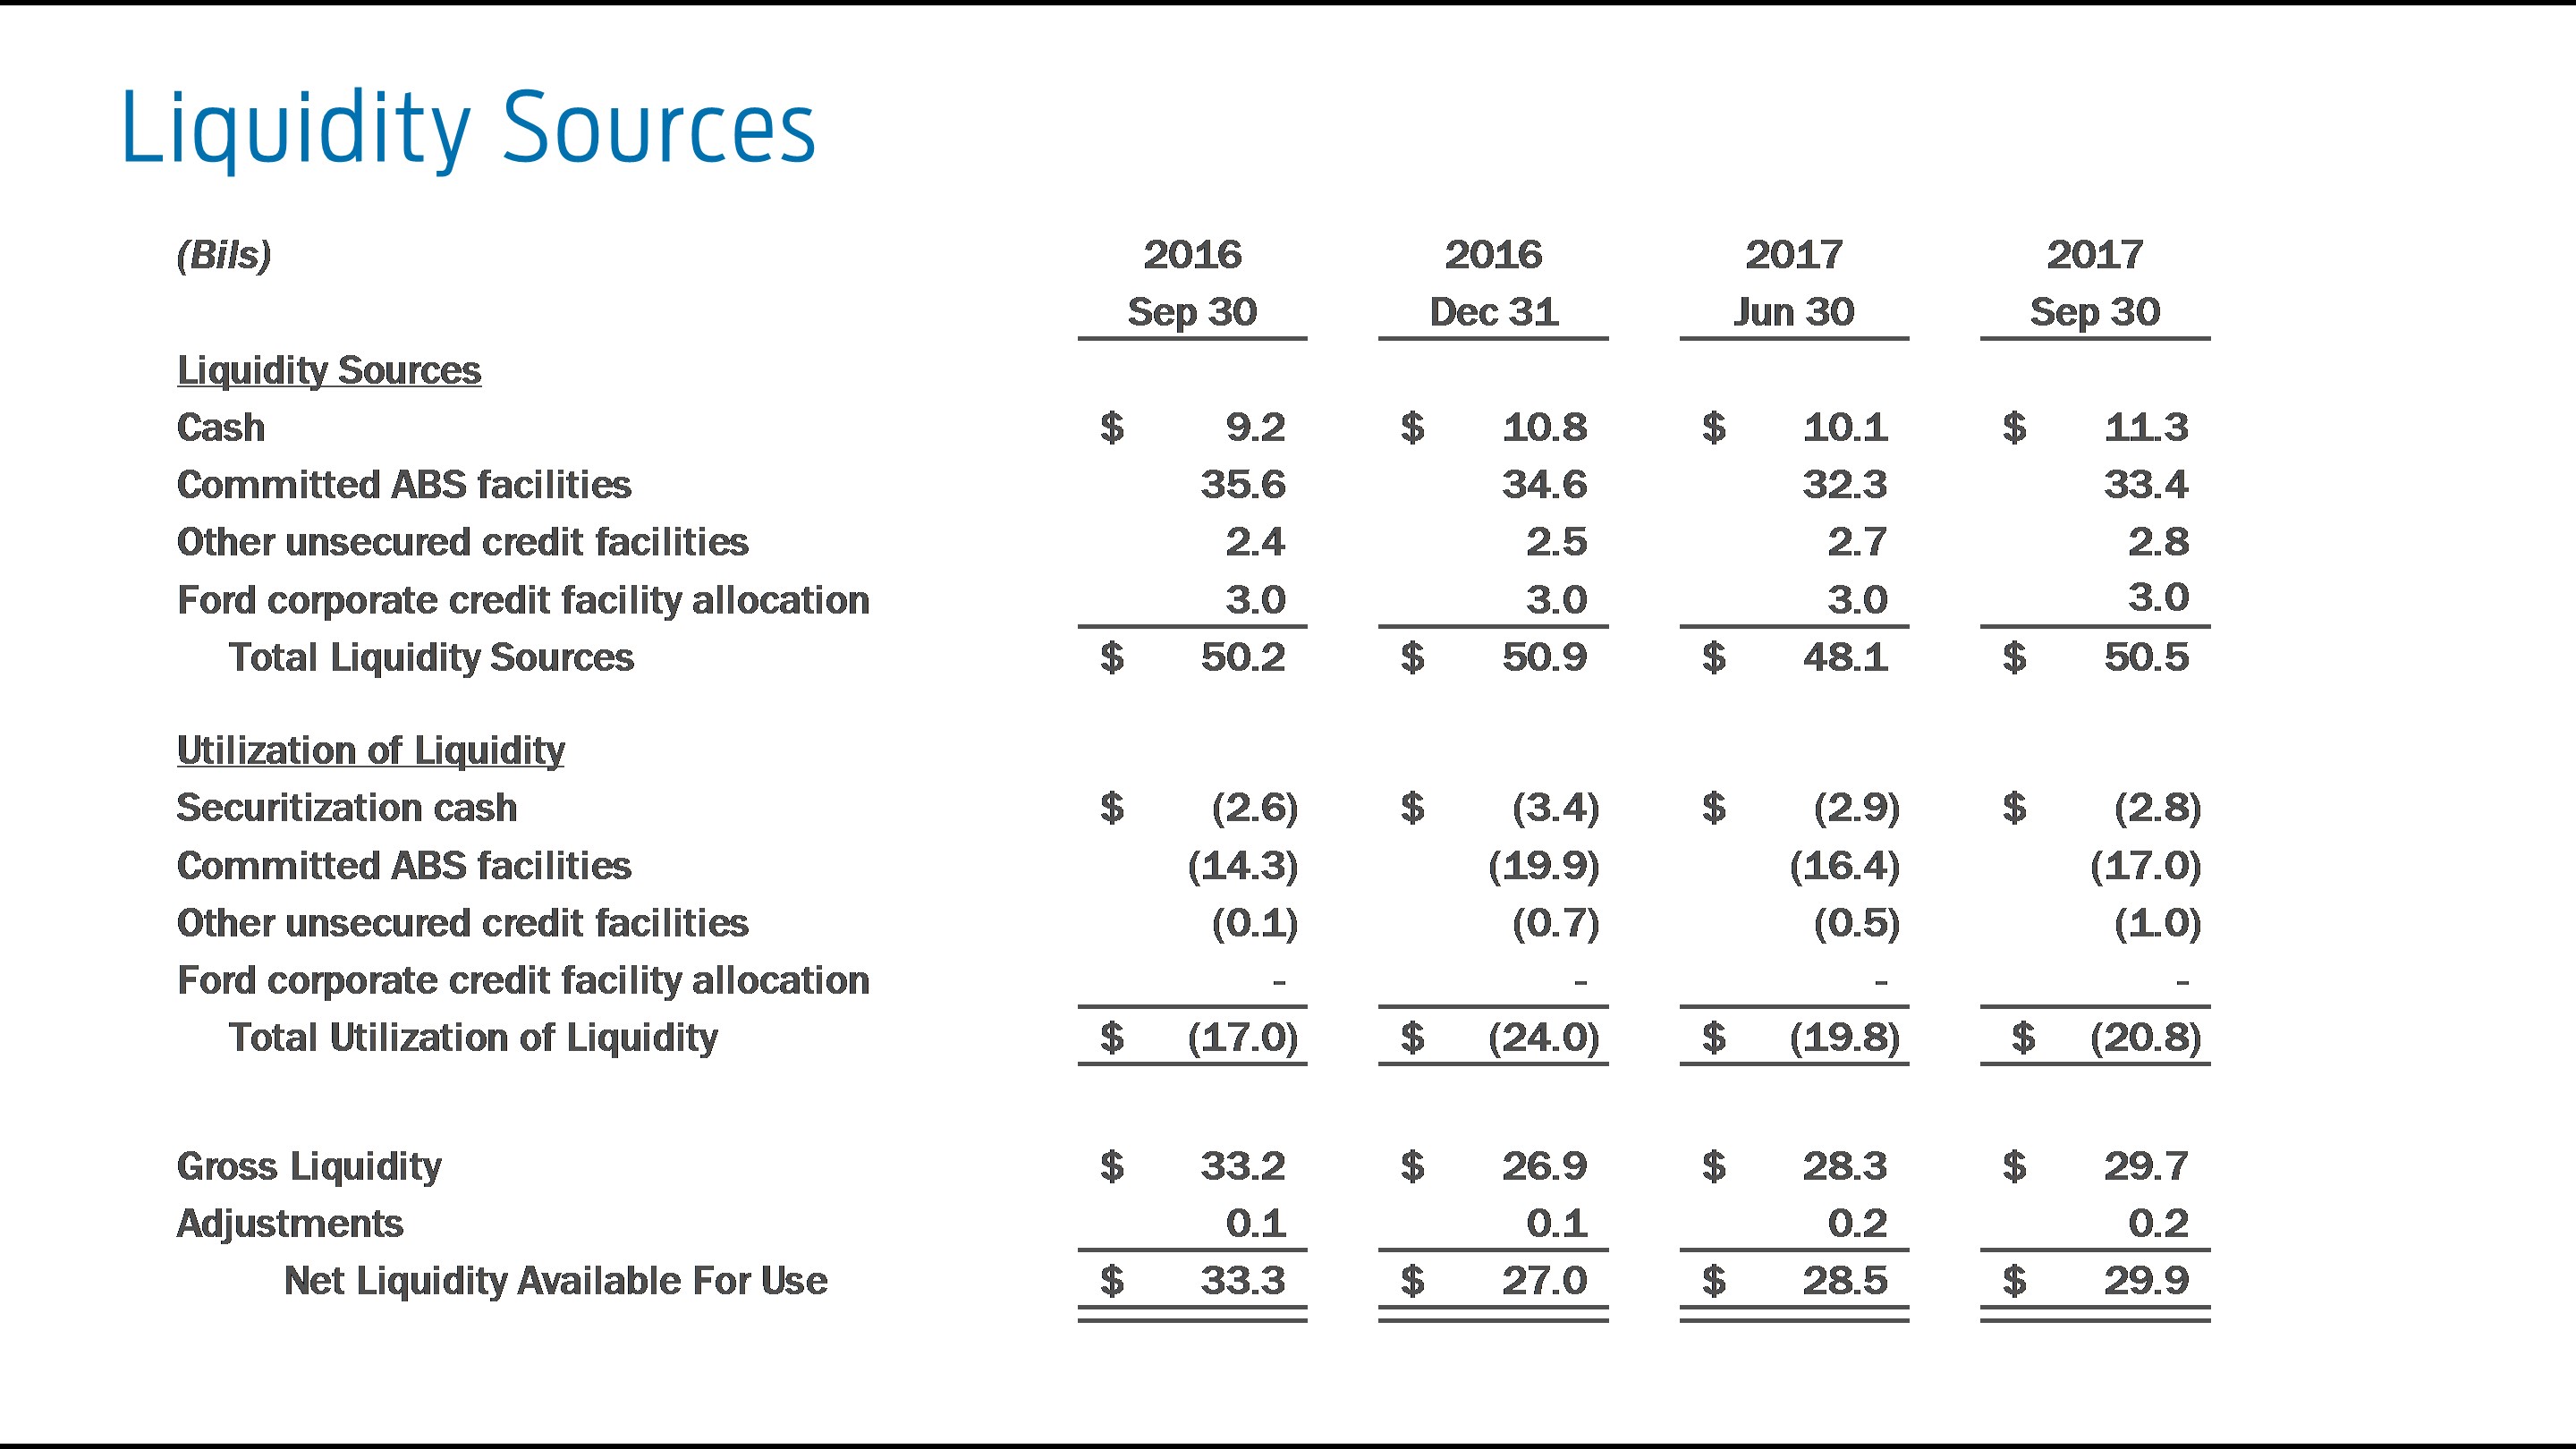
| September 30, 2018 | December 31, 2018 | September 30, 2019 | |||||||||
| Liquidity Sources | |||||||||||
| Cash | $ | 12.1 | $ | 10.2 | $ | 14.3 | |||||
| Committed asset-backed facilities | 32.0 | 35.4 | 35.2 | ||||||||
| Other unsecured credit facilities | 3.0 | 3.0 | 2.6 | ||||||||
| Ford corporate credit facility allocation | 3.0 | 3.0 | 3.0 | ||||||||
| Total liquidity sources | $ | 50.1 | $ | 51.6 | $ | 55.1 | |||||
| Utilization of Liquidity | |||||||||||
| Securitization cash | $ | (3.0 | ) | $ | (3.0 | ) | $ | (2.9 | ) | ||
| Committed asset-backed facilities | (17.7 | ) | (20.7 | ) | (14.4 | ) | |||||
| Other unsecured credit facilities | (0.7 | ) | (0.7 | ) | (0.5 | ) | |||||
| Ford corporate credit facility allocation | — | — | — | ||||||||
| Total utilization of liquidity | $ | (21.4 | ) | $ | (24.4 | ) | $ | (17.8 | ) | ||
| Gross liquidity | $ | 28.7 | $ | 27.2 | $ | 37.3 | |||||
| Adjustments | 0.3 | 0.1 | (1.9 | ) | |||||||
| Net liquidity available for use | $ | 29.0 | $ | 27.3 | $ | 35.4 | |||||
Our net liquidity available for use will fluctuate quarterly based on factors including near-term debt maturities, receivable growth, and timing of funding transactions. We target liquidity of at leastabout $25 billion.
At September 30, 2017, Ford Credit’s2019, our net liquidity available for use was $2.9$35.4 billion, $8.1 billion higher than at year-end 2016 and $1.4 billion higher than at June 30, 2017.
Cash, Cash Equivalents, and Marketable Securities. At September 30, 2017,2019, our cash, cash equivalents, and marketable securities (excluding amounts related to insurance activities) totaled $11.3$14.3 billion, compared with $10.8$10.2 billion at year-end 2016.2018. In the normal course of our funding activities, we may generate more proceeds than are required for our immediate funding needs. These excess amounts are held primarily in highly liquid investments, which provide liquidity for our anticipated and unanticipated cash needs and give us flexibility in the use of our other funding programs. Our cash, cash equivalents, and marketable securities (excluding amounts related to insurance activities) primarily include U.S. Department of Treasury obligations, federal agency securities, bank time deposits with investment-grade institutions, investment-grade commercial paper, rated A-1/P-1 or higher, debt obligations of a select group of non-U.S. governments, non-U.S. governmental agencies, supranational institutions, non-U.S. central banks, and money market funds that carry the highest possible ratings. ratings.
The average maturity of these investments ranges from approximately three to six months and is adjusted based on market conditions and liquidity needs. We monitor our cash levels and average maturity on a daily basis. Cash, cash equivalents, and marketable securities included amounts to be used only to support our securitization transactions of $2.8$3.0 billion and $3.4$2.9 billion at December 31, 2018 and September 30, 20172019, respectively.
38
Item 2. Management’s Discussion and December 31, 2016, respectively.Analysis of Financial Condition and Results of Operations (Continued)
Committed Capacity. At September 30, 2017,2019, our committed capacity totaled $39.2$40.8 billion, down $0.9compared with $41.4 billion fromat December 31, 2016.2018. Our committed capacity is primarily comprised of committed asset-backed security (“ABS”)ABS facilities from bank-sponsored commercial paper conduits and other financial institutions, unsecured credit facilities with financial institutions, and allocated commitments under the Ford corporate credit facility.
Committed Asset-Backed Facilities. We and our subsidiaries have entered into agreements with a number of bank-sponsored asset-backed commercial paper conduits and other financial institutions. Such counterparties are contractually committed, at our option, to purchase from us eligible retail financing receivables or to purchase or make advances under asset-backed securities backed by retail financing or wholesale finance receivables or operating leases for proceeds of up to $33.4$35.2 billion ($16.218.0 billion of retail financing, $6.3$5.7 billion of wholesale financing, and $10.9$11.5 billion of operating leases) at September 30, 2017.2019. In the United States, we are able to obtain funding within two days of our unutilized capacity in some of our committed asset-backed facilities. These committed facilities have varying maturity dates, with $14.1$17.0 billion having maturities within the next twelve months and the remaining balance having maturities through 2019.2022. We plan capacity renewals to protect our global funding needs, optimize capacity utilization, and maintain sufficient liquidity.
Our ability to obtain funding under these facilities is subject to having a sufficient amount of eligible assets as well as our ability to obtain interest rate hedging arrangements for certain facilities. At September 30, 2017, $17.02019, $14.4 billion of these commitments were in use. These programs are free of material adverse change clauses, restrictive financial covenants (for example, debt-to-equity limitations and minimum net worth requirements), and generally, credit rating triggers that could limit our ability to obtain funding. However, the unused portion of these commitments may be terminated if the performance of the underlying assets deteriorates beyond specified levels. Based on our experience and knowledge as servicer of the related assets, we do not expect any of these programs to be terminated due to such events.
FCE Bank plc (“FCE”) has pre-positioned retail receivables with the Bank of England which supports access to the Discount Window Facility. Pre-positioned assets are neither pledged to nor held as collateral by the Bank of England unless the Discount Window Facility is accessed. FCE’s eligibility to access the Discount Window Facility is not reflected in the Liquidity Sources table above.
Unsecured Credit Facilities. At September 30, 2017,2019, we and our majority-owned subsidiaries had $5.8$5.6 billion of contractually committed unsecured credit facilities with financial institutions, including the FCE Credit Agreement, (as defined below)the Ford Bank Agreement, and the allocation under Ford’s corporate credit facility. At September 30, 2017, $4.82019, $5.1 billion was available for use.
FCE’s £945£745 million (equivalent to $1.3 billion$917 million at September 30, 2017)2019) syndicated credit facility (the “FCE Credit Agreement”) maturesand Ford Bank GmbH’s €240 million (equivalent to $262 million at September 30, 2019) syndicated credit facility (the “Ford Bank Credit Agreement”) both mature in 2020.2022. At September 30, 2017, £5452019, all £745 million (equivalent to $730 million) wasunder the FCE Credit Agreement and all €240 million under the Ford Bank Credit Agreement were available for use. The
Both the FCE Credit Agreement containsand Ford Bank Credit Agreement contain certain covenants, including an obligation for FCE and Ford Bank to maintain itstheir ratio of regulatory capital to risk-weighted assets at no less than the applicable regulatory minimum, and forminimum. The FCE Credit Agreement requires the support agreement between FCE and Ford Credit to remain in full force and effect (and enforced by FCE to ensure that its net worth is maintained at no less than $500 million). The Ford Bank Credit Agreement requires our guarantee of Ford Bank’s obligations under the agreement to remain in effect.
Lenders under the Ford corporate credit facility have commitments totaling $13.4 billion, with 75%25% of the commitments maturing on April 30, 2022 and 25%75% of the commitments maturing on April 30, 2020.2024. Ford has allocated $3.0 billion of commitments, including commitments under a Chinese renminbi sub-facility, to us on an irrevocable and exclusive basis to support our growth and liquidity. At September 30, 2017,2019, all $3.0 billion was available for use.
Funding and Liquidity Risks
Refer to the “Funding and Liquidity”Liquidity Risks” section of Item 7 of Exhibit 99 toPart II of our April 27, 20172018 Form 8-K10-K Report for a list of factors that could affect our liquidity and information on our stress testing.
39
Item 2. Management’s Discussion and Analysis of Financial Condition and Results of Operations (Continued)
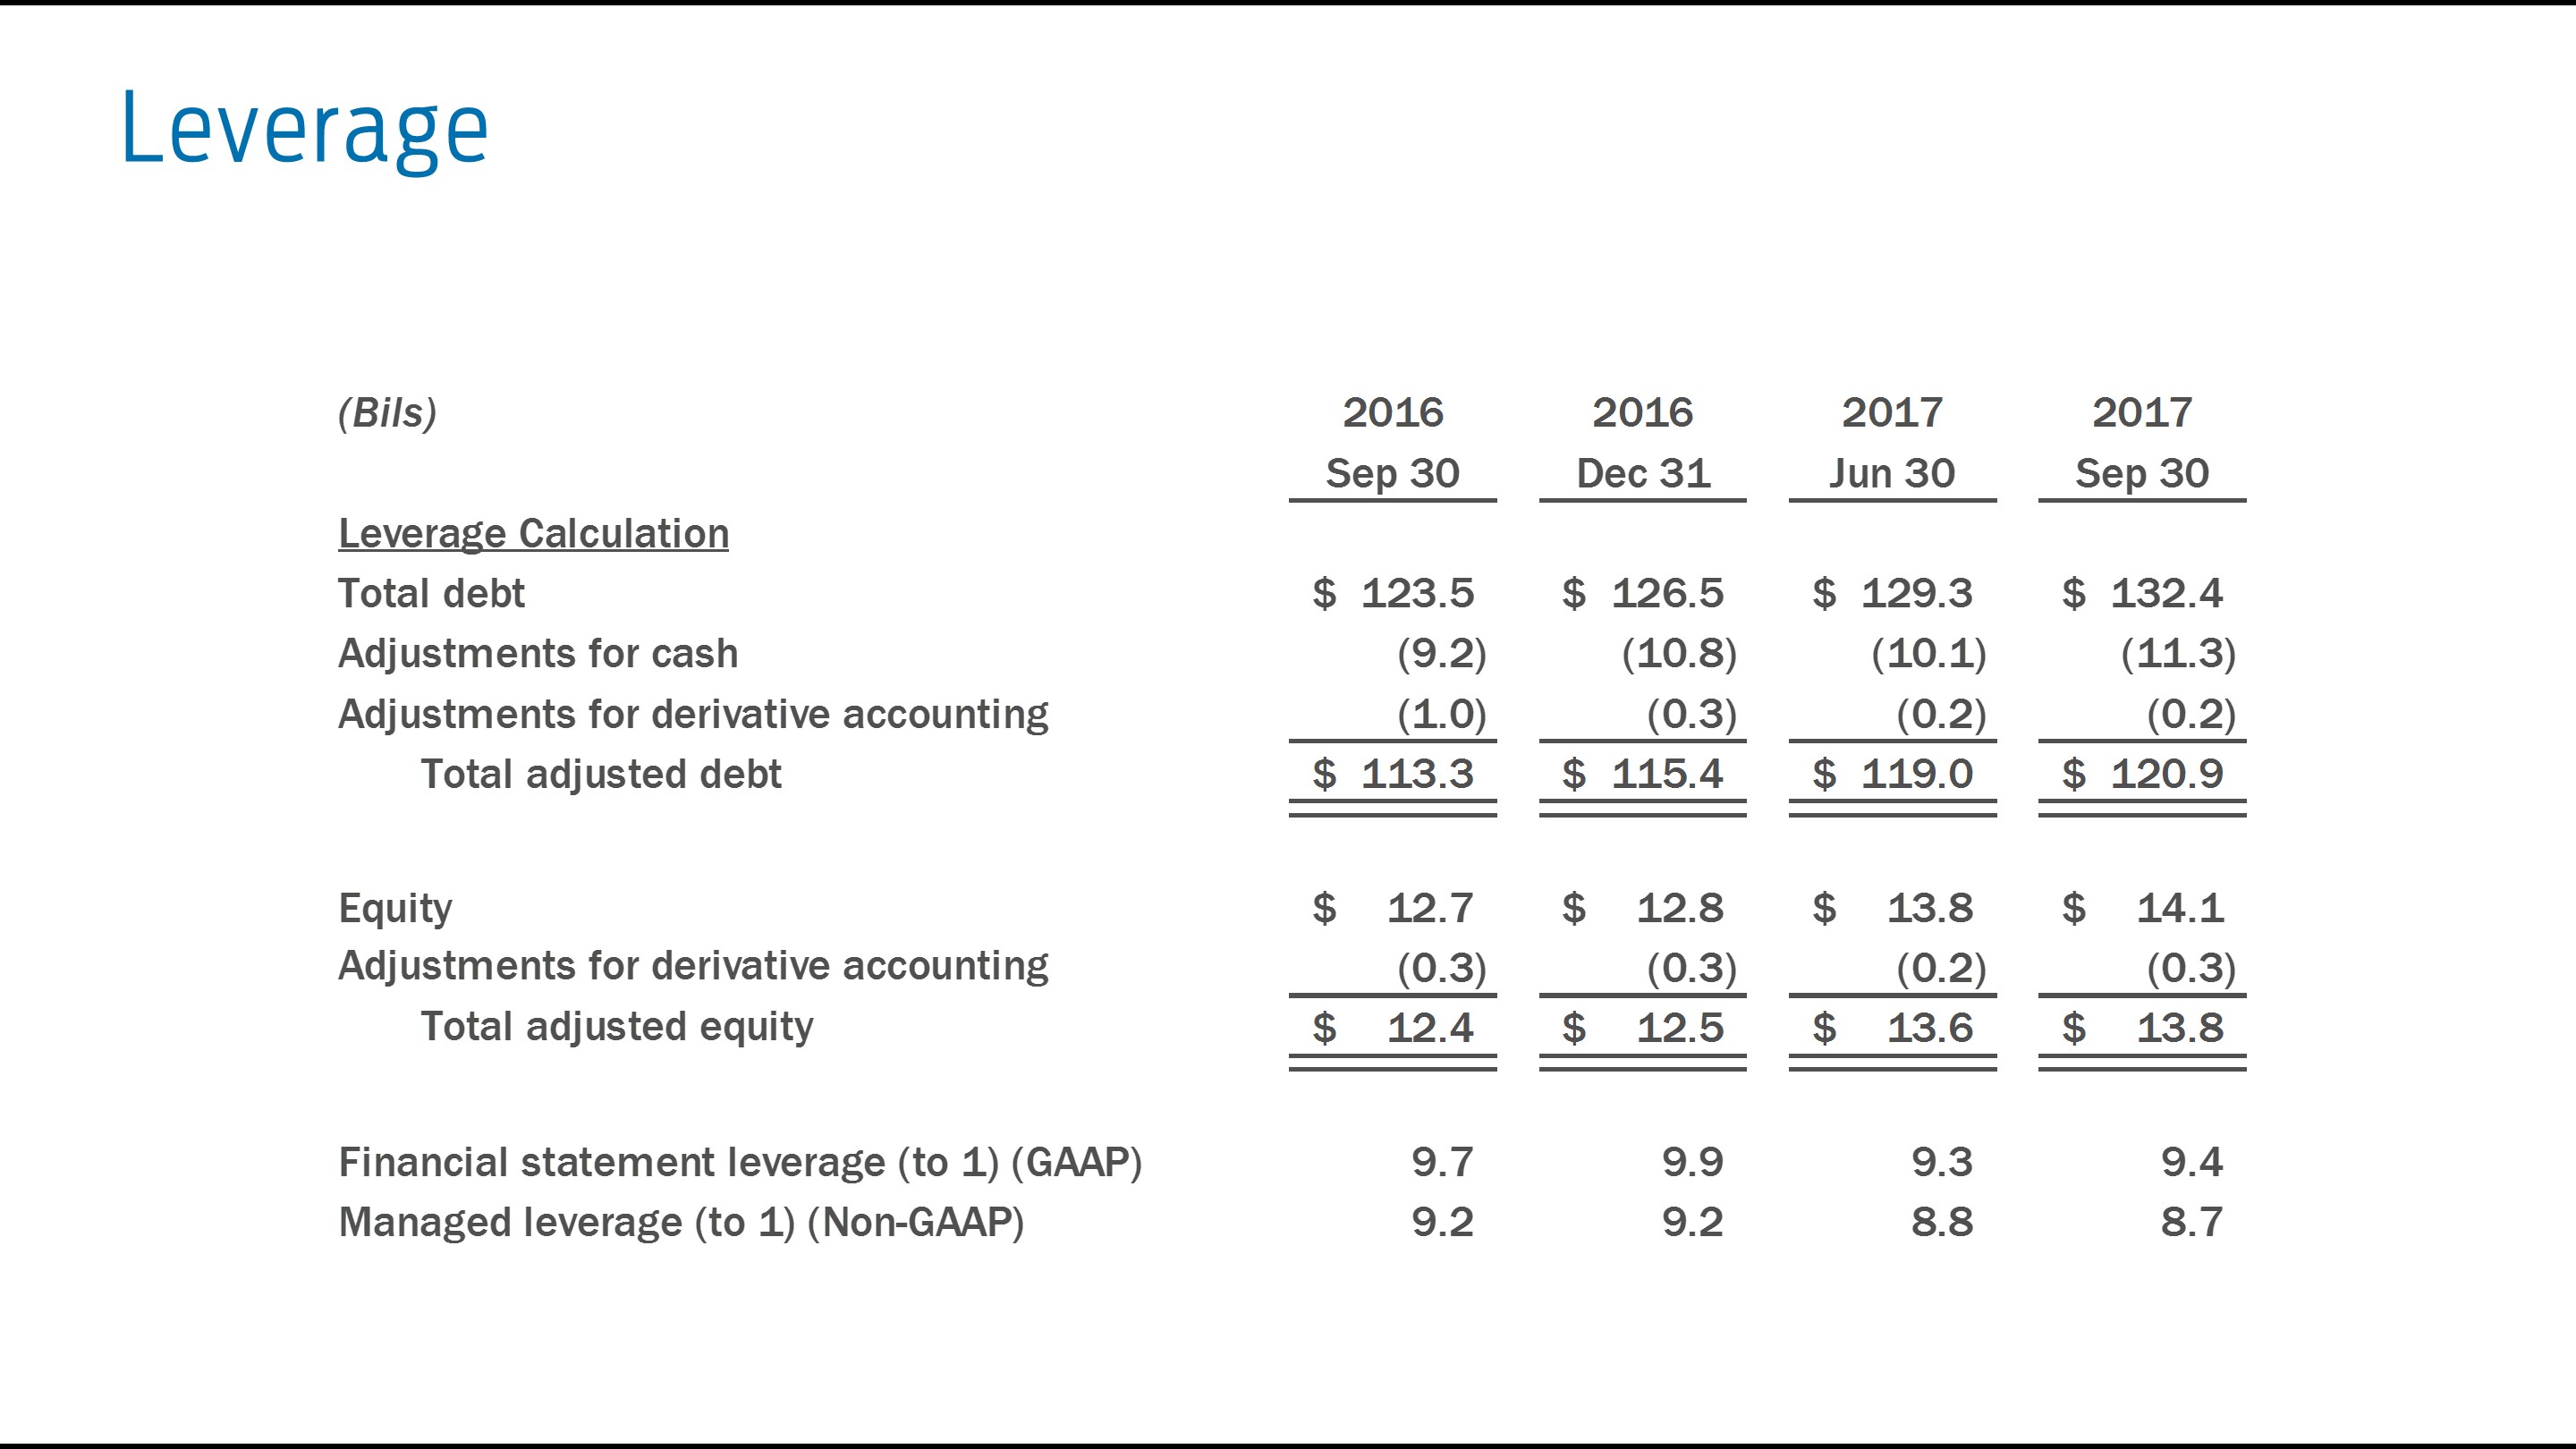
Leverage
We use leverage, or the debt-to-equity ratio, to make various business decisions, including evaluating and establishing pricing for finance receivable and operating lease financing, and assessing our capital structure. We refer to our shareholder’s interest as equity.
The following charttable shows the calculation of our financial statement leverage and managed leverage (in billions, except for ratios)billions):
| September 30, 2018 | December 31, 2018 | September 30, 2019 | |||||||||
| Leverage Calculation | |||||||||||
| Debt | $ | 138.2 | $ | 140.1 | $ | 139.3 | |||||
| Adjustments for cash | (12.1 | ) | (10.2 | ) | (14.3 | ) | |||||
| Adjustments for derivative accounting | 0.6 | 0.2 | (0.8 | ) | |||||||
| Total adjusted debt | $ | 126.7 | $ | 130.1 | $ | 124.2 | |||||
| Equity | $ | 15.2 | $ | 15.0 | $ | 14.2 | |||||
| Adjustments for derivative accounting | (0.1 | ) | (0.2 | ) | — | ||||||
| Total adjusted equity | $ | 15.1 | $ | 14.8 | $ | 14.2 | |||||
| Financial statement leverage (to 1) (GAAP) | 9.1 | 9.4 | 9.8 | ||||||||
| Managed leverage (to 1) (Non-GAAP) | 8.4 | 8.8 | 8.8 | ||||||||
We plan our managed leverage by considering prevailing market conditions and the risk characteristics of our business. At September 30, 2017,2019, our financial statement leverage was 9.4:9.8:1, and managed leverage was 8.7:8.8:1. We target managed leverage in the range of 8:1 to 9:1. For information on our planned distributions, refer to the “Outlook” section.
40
Item 2. Management’s Discussion and Analysis of Financial Condition and Results of Operations (Continued)
Statements included or incorporated by reference herein may constitute “forward-looking statements” within the meaning of the Private Securities Litigation Reform Act of 1995. Forward-looking statements are based on expectations, forecasts, and assumptions by our management and involve a number of risks, uncertainties, and other factors that could cause actual results to differ materially from those stated, including without limitation:
Industry sales volume, particularly in the United States, Europe, or China, due tocan be volatile and could decline if there is a financial crisis, recession, or significant geopolitical events, or other factors; event;
Fluctuations in commodity prices, foreign currency exchange rates, commodity prices, and interest rates;rates can have a significant effect on results;
Ford and Ford Credit, or a third-party vendor or supplier;
We cannot be certain that any expectation, forecast, or assumption made in preparing forward-looking statements will prove accurate, or that any projection will be realized. It is to be expected that there may be differences between projected and actual results. Our forward-looking statements speak only as of the date of their initial issuance, and we do not undertake any obligation to update or revise publicly any forward-looking statement, whether as a result of new information, future events, or otherwise. For additional discussion, see “Item 1A. Risk Factors” in our Annual Report on2018 Form 10-K for the year ended December 31, 2016 (“2016 Form 10-K Report”),Report, as updated by our subsequent Quarterly Reports on Form 10-Q and Current Reports on Form 8-K.
41
Item 2. Management’s Discussion and Analysis of Financial Condition and Results of Operations (Continued)
Accounting Standards Issued But Not Yet Adopted
The Financial Accounting Standards Board (“FASB”) has issued the following standards,Accounting Standards Updates (“ASU”), which are not expected to have a material impact (with the exception of standards 2016-02 and 2016-13) to our financial statements or financial statement disclosures:
disclosures. ASU 2016-13 is expected to result in a significant change in practice to Ford Credit. For additional information, see Note 2 of our Notes to the Financial Statements.
| Effective Date (a) | |||
| January 1, | |||
| January 1, | |||
| January 1, | |||
| 2016-13 | Credit Losses - Measurement of Credit Losses on Financial Instruments | January 1, 2020 (b) | |
__________
| (a) | Early adoption for each of the standards |
| (b) |
ITEM 3. Quantitative and Qualitative Disclosures About Market Risk.
In our 20162018 Form 10-K Report, we discuss in greater detail our market risk, counterparty risk, credit risk, residual risk, liquidity risk, and operating risk.
To provide a quantitative measure of the sensitivity of our pre-tax cash flow to changes in interest rates, we use interest rate scenarios that assume a hypothetical, instantaneous increase or decrease of one percentage point in all interest rates across all maturities (a “parallel shift”), as well as a base case that assumes that all interest rates remain constant at existing levels. The differences in pre-tax cash flow between these scenarios and the base case over a twelve-month period represent an estimate of the sensitivity of our pre-tax cash flow. Under this model, we estimate that at September 30, 2017,2019, all else constant, such an increase in interest rates would decreaseincrease our pre-tax cash flow by $2 million over the next 12 months, compared with an increase of $21$51 million at December 31, 2016.2018. In reality, interest rate changes are rarely instantaneous or parallel and rates could move more or less than the one percentage point assumed in our analysis. As a result, the actual impact to pre-tax cash flow could be higher or lower than the results detailed above.
ITEM 4. Controls and Procedures.
Evaluation of Disclosure Controls and Procedures. N. Joy Falotico,David W. McClelland, our Chairman of the Board and Chief Executive Officer (“CEO”), and Marion B. Harris,Brian E. Schaaf, our Chief Financial Officer (“CFO”) and Treasurer, have performed an evaluation of the Company’s disclosure controls and procedures, as that term is defined in Rule 13a-15(e) of the Securities Exchange Act of 1934, as amended (“Exchange Act”), as of September 30, 20172019, and each has concluded that such disclosure controls and procedures are effective to ensure that information required to be disclosed in our periodic reports filed under the Exchange Act is recorded, processed, summarized, and reported within the time periods specified by SEC rules and forms, and that such information is accumulated and communicated to the CEO and CFO to allow timely decisions regarding required disclosures.
Changes in Internal Control Over Financial Reporting. There were no changes in internal control over financial reporting during the quarter ended September 30, 20172019 that have materially affected, or are reasonably likely to materially affect, our internal control over financial reporting.
42
PART II. OTHER INFORMATION
ITEM 1A. Risk Factors.
The risk factor “Ford Credit’s access to debt, securitization, or derivative markets around the world at competitive rates or in sufficient amounts could be affected by credit rating downgrades, market volatility, market disruption, regulatory requirements, or other factors” included in Item 1A of our 2018 Form 10-K Report is revised as follows:
Ford and Ford Credit’s access to debt, securitization, or derivative markets around the world at competitive rates or in sufficient amounts could be affected by credit rating downgrades, market volatility, market disruption, regulatory requirements, or other factors. Ford and Ford Credit’s ability to obtain unsecured funding at a reasonable cost is dependent on their credit ratings or their perceived creditworthiness. Further, Ford Credit’s ability to obtain securitized funding under its committed asset-backed liquidity programs and certain other asset-backed securitization transactions is subject to having a sufficient amount of assets eligible for these programs, as well as Ford Credit’s ability to obtain appropriate credit ratings and, for certain committed programs, derivatives to manage the interest rate risk. Over time, and particularly in the event of credit rating downgrades, market volatility, market disruption, or other factors, Ford Credit may reduce the amount of receivables it purchases or originates because of funding constraints. The potential phase out of LIBOR is one such risk that could cause market volatility or disruption. In July 2017 the chief executive of the United Kingdom Financial Conduct Authority (the “FCA”), which regulates LIBOR, announced that the FCA intends to stop compelling banks to submit rates for the calculation of LIBOR after 2021. It is unknown whether any banks will continue to voluntarily submit rates for the calculation of LIBOR after 2021 or whether LIBOR will continue to be published by its administrator based on these submissions or on any other basis. It is not possible to predict the effect of these changes, other reforms, or the establishment of alternative reference rates, but the potential phase out of LIBOR could adversely affect Ford Credit’s access to the capital markets and cost of funding. In addition, Ford Credit may be limited in the amount of receivables it purchases or originates in certain countries or regions if the local capital markets, particularly in developing countries, do not exist or are not adequately developed. Similarly, Ford Credit may reduce the amount of receivables it purchases or originates if there is a significant decline in the demand for the types of securities it offers or Ford Credit is unable to obtain derivatives to manage the interest rate risk associated with its securitization transactions. A significant reduction in the amount of receivables Ford Credit purchases or originates would significantly reduce its ongoing profits and could adversely affect its ability to support the sale of Ford vehicles.
ITEM 5. Other Information.
None.
ITEM 6. Exhibits.
| Designation | Description | Method of Filing | ||
| Rule 15d-14(a) Certification of CEO. | Filed with this Report. | |||
| Rule 15d-14(a) Certification of CFO. | Filed with this Report. | |||
| Section 1350 Certification of CEO. | Furnished with this Report. | |||
| Section 1350 Certification of CFO. | Furnished with this Report. | |||
| Exhibit 101.INS | * | |||
| Exhibit 101.SCH | XBRL Taxonomy Extension Schema Document. | * | ||
| Exhibit 101.CAL | XBRL Taxonomy Extension Calculation Linkbase Document. | * | ||
| Exhibit 101.LAB | XBRL Taxonomy Extension Label Linkbase Document. | * | ||
| Exhibit 101.PRE | XBRL Taxonomy Extension Presentation Linkbase Document. | * | ||
| Exhibit 101.DEF | XBRL Taxonomy Extension Definition Linkbase Document. | * | ||
| Exhibit 104 | Cover Page Interactive Data File (formatted in Inline XBRL and contained in Exhibit 101). | * | ||
__________
| * | Submitted electronically with this Report in accordance with the provisions of Regulation S-T. |
Instruments defining the rights of holders of certain issues of long-term debt of Ford Credit have not been filed as exhibits to this Report because the authorized principal amount of any one of such issues does not exceed 10% of the total assets of Ford Credit. Ford Credit will furnish a copy of each such instrument to the SEC upon request.
43
SIGNATURE
Pursuant to the requirements of the Securities Exchange Act of 1934, Ford Motor Credit Company LLC has duly caused this Report to be signed on its behalf by the undersigned, thereunto duly authorized.
FORD MOTOR CREDIT COMPANY LLC
| By: | /s/ |
| Chief Financial Officer and Treasurer | |
| Date: | October |