UNITED STATES
SECURITIES AND EXCHANGE COMMISSION
Washington, D.C. 20549
FORM 10-Q
(Mark One)
|
| | |
| ☑ | Quarterly report pursuant to Section 13 or 15(d) of the Securities Exchange Act of 1934 | |
For the quarterly period ended JuneSeptember 30, 2019
or
|
| | |
| ☐ | Transition report pursuant to Section 13 or 15(d) of the Securities Exchange Act of 1934 | |
| | For the transition period from ____________________ to ____________________ | |
Commission file number 1-6368
Ford Motor Credit Company LLC
(Exact name of registrant as specified in its charter)
|
| | | | | | |
| Delaware | | | 38-1612444 |
(State of organization) | | | (I.R.S. employer identification no.) |
| | | | | | | |
| One American Road | | | |
| Dearborn, | Michigan | | | 48126 |
| (Address of principal executive offices) | | | (Zip Code) |
(313) 322-3000
(Registrant’s telephone number, including area code)
Securities registered pursuant to Section 12(b) of the Act:
|
| | | | |
| Title of each class | | Trading Symbol(s) | | Name of each exchange on which registered |
| 3.588% Notes due June 2, 2020 | | F/20S | | New York Stock Exchange |
| 0.623% Notes due June 28, 2023* | | F/23E | | New York Stock Exchange |
| 1.355% Notes due February 7, 2025* | | F/25I | | New York Stock Exchange |
| 4.125% Notes due on June 20, 2024 | | F/24O | | New York Stock Exchange |
| 3.021% Notes due March 6, 2024 | | F/24M | | New York Stock Exchange |
| 4.535% Notes due March 6, 2025* | | F/25K | | New York Stock Exchange |
| 3.350% Notes due Nine Months or More from the Date of Issue due August 20, 2026 | | F/26N | | New York Stock Exchange |
| 1.514% Notes due February 17, 2023 | | F/23G | | New York Stock Exchange |
| 2.386% Notes due February 17, 2026 | | F/26AB | | New York Stock Exchange |
| Floating Rate Notes due December 12, 2019* | | F/19A | | New York Stock Exchange |
| Floating Rate Notes due December 16, 2019* | | F/19C | | New York Stock Exchange |
| Floating Rate Notes due May 14, 2021* | | F/21C | | New York Stock Exchange |
| Floating Rate Notes due December 1, 2021* | | F/21AQ | | New York Stock Exchange |
| Floating Rate Notes due December 7, 2022* | | F/22T | | New York Stock Exchange |
| Floating Rate Notes due November 15, 2023* | | F/23D | | New York Stock Exchange |
| Floating Rate Notes due December 1, 2024* | | F/24L | | New York Stock Exchange |
| *Issued under Euro Medium Term Notes due Nine Months or More from The Date of Issue Program |
Indicate by check mark whether the registrant (1) has filed all reports required to be filed by Section 13 or 15(d) of the Securities Exchange Act of 1934 during the preceding 12 months (or for such shorter period that the registrant was required to file such reports), and (2) has been subject to such filing requirements for the past 90 days. þ Yes o No
Indicate by check mark whether the registrant has submitted electronically every Interactive Data File required to be submitted pursuant to Rule 405 of Regulation S-T (§ 232.405 of this chapter) during the preceding 12 months (or for such shorter period that the registrant was required to submit such files). þ Yes o No
Indicate by check mark whether the registrant is a large accelerated filer, an accelerated filer, a non-accelerated filer, smaller reporting company, or an emerging growth company. See the definitions of “large accelerated filer,” “accelerated filer,” “smaller reporting company,” and “emerging growth company” in Rule 12b-2 of the Exchange Act.
Large accelerated filer o Accelerated filer o Non-accelerated filer þ Smaller reporting company o
Emerging growth company o
If an emerging growth company, indicate by check mark if the registrant has elected not to use the extended transition period for complying with any new or revised financial accounting standards provided pursuant to Section 13(a) of the Exchange Act. o☐ |
| | | | | |
| Indicate by check mark whether the registrant is a shell company (as defined in Rule 12b-2 of the Exchange Act). |
| ☐ | Yes | ☑ | No | | |
All of the limited liability company interests in the registrant (“Shares”) are held by an affiliate of the registrant. None of the Shares are publicly traded.
REDUCED DISCLOSURE FORMAT
The registrant meets the conditions set forth in General Instruction H(1)(a) and (b) of Form 10-Q and is therefore filing this Form with the reduced disclosure format.
FORD MOTOR CREDIT COMPANY LLC
QUARTERLY REPORT ON FORM 10-Q
For the Quarter Ended JuneSeptember 30, 2019
|
| | | |
| | | | |
| | Table of Contents | | Page |
| | | | |
| | Part I. Financial Information | | |
| | | |
| | | | |
| | | | |
| | | | |
| | | | |
| | | | |
| | | | |
| | | |
| | | | |
| | | |
| | | | |
| | | | |
| | | | |
| | | | |
| | | | |
| | | | |
| | | | |
| | | | |
| | | | |
| | | |
| | | |
| | Part II. Other Information | | |
| | | |
| | | |
| | | |
| | | | |
PART I. FINANCIAL INFORMATION
ITEM 1. Financial Statements
FORD MOTOR CREDIT COMPANY LLC AND SUBSIDIARIES
CONSOLIDATED INCOME STATEMENT
(in millions)
| | | | For the periods ended June 30, | For the periods ended September 30, |
| | 2018 | | 2019 | | 2018 | | 2019 | 2018 | | 2019 | | 2018 | | 2019 |
| | Second Quarter | | First Half | Third Quarter | | First Nine Months |
| | (unaudited) | (unaudited) |
| Financing revenue | | | | | | | | | | | | | | |
| Operating leases | $ | 1,443 |
| | $ | 1,472 |
| | $ | 2,858 |
| | $ | 2,949 |
| $ | 1,463 |
| | $ | 1,480 |
| | $ | 4,321 |
| | $ | 4,429 |
|
| Retail financing | 959 |
| | 987 |
| | 1,907 |
| | 1,971 |
| 983 |
| | 987 |
| | 2,890 |
| | 2,958 |
|
| Dealer financing | 569 |
| | 596 |
| | 1,105 |
| | 1,204 |
| 519 |
| | 534 |
| | 1,624 |
| | 1,738 |
|
| Other financing | 20 |
| | 26 |
| | 42 |
| | 50 |
| 20 |
| | 23 |
| | 62 |
| | 73 |
|
| Total financing revenue | 2,991 |
| | 3,081 |
| | 5,912 |
| | 6,174 |
| 2,985 |
| | 3,024 |
| | 8,897 |
| | 9,198 |
|
| Depreciation on vehicles subject to operating leases | (986 | ) | | (894 | ) | | (2,039 | ) | | (1,818 | ) | (936 | ) | | (894 | ) | | (2,975 | ) | | (2,712 | ) |
| Interest expense | (997 | ) | | (1,114 | ) | | (1,909 | ) | | (2,235 | ) | (989 | ) | | (1,081 | ) | | (2,898 | ) | | (3,316 | ) |
| Net financing margin | 1,008 |
| | 1,073 |
| | 1,964 |
| | 2,121 |
| 1,060 |
| | 1,049 |
| | 3,024 |
| | 3,170 |
|
| Other revenue | |
| | | | | | | |
| | | | | | |
| Insurance premiums earned | 43 |
| | 46 |
| | 84 |
| | 93 |
| 39 |
| | 43 |
| | 123 |
| | 136 |
|
| Fee based revenue and other | 65 |
| | 61 |
| | 123 |
| | 115 |
| 57 |
| | 60 |
| | 180 |
| | 175 |
|
| Total financing margin and other revenue | 1,116 |
| | 1,180 |
| | 2,171 |
| | 2,329 |
| 1,156 |
| | 1,152 |
| | 3,327 |
| | 3,481 |
|
| Expenses | |
| | | | | | | |
| | | | | | |
| Operating expenses | 357 |
| | 350 |
| | 702 |
| | 714 |
| 368 |
| | 350 |
| | 1,070 |
| | 1,064 |
|
| Provision for credit losses (Note 6) | 69 |
| | 63 |
| | 163 |
| | 96 |
| 127 |
| | 93 |
| | 290 |
| | 189 |
|
| Insurance expenses | 46 |
| | 60 |
| | 58 |
| | 70 |
| 19 |
| | 33 |
| | 77 |
| | 103 |
|
| Total expenses | 472 |
| | 473 |
| | 923 |
| | 880 |
| 514 |
| | 476 |
| | 1,437 |
| | 1,356 |
|
| | | | | | | | | | | | | | | |
| Other income, net (Note 13) | 1 |
| | 124 |
| | 38 |
| | 183 |
| 36 |
| | 60 |
| | 74 |
| | 243 |
|
| | | |
|
| | | | | | |
|
| | | | |
| Income before income taxes | 645 |
| | 831 |
| | 1,286 |
| | 1,632 |
| 678 |
| | 736 |
| | 1,964 |
| | 2,368 |
|
| Provision for / (Benefit from) income taxes | 166 |
| | 218 |
| | 106 |
| | 416 |
| 160 |
| | 165 |
| | 266 |
| | 581 |
|
| Net income | $ | 479 |
| | $ | 613 |
| | $ | 1,180 |
| | $ | 1,216 |
| $ | 518 |
| | $ | 571 |
| | $ | 1,698 |
| | $ | 1,787 |
|
CONSOLIDATED STATEMENT OF COMPREHENSIVE INCOME
(in millions)
| | | | For the periods ended June 30, | For the periods ended September 30, |
| | 2018 | | 2019 | | 2018 | | 2019 | 2018 | | 2019 | | 2018 | | 2019 |
| | Second Quarter | | First Half | Third Quarter | | First Nine Months |
| | (unaudited) | (unaudited) |
| Net income | $ | 479 |
| | $ | 613 |
| | $ | 1,180 |
| | $ | 1,216 |
| $ | 518 |
| | $ | 571 |
| | $ | 1,698 |
| | $ | 1,787 |
|
| Other comprehensive income / (loss), net of tax (Note 12) | | | | | | | | | | | | | | |
| Foreign currency translation | (364 | ) | | 8 |
| | (251 | ) | | 28 |
| (49 | ) | | (210 | ) | | (300 | ) | | (182 | ) |
| Comprehensive income / (loss) | $ | 115 |
| | $ | 621 |
| | $ | 929 |
| | $ | 1,244 |
| $ | 469 |
| | $ | 361 |
| | $ | 1,398 |
| | $ | 1,605 |
|
The accompanying notes are part of the financial statements.
Item 1. Financial Statements (Continued)
FORD MOTOR CREDIT COMPANY LLC AND SUBSIDIARIES
CONSOLIDATED BALANCE SHEET
(in millions)
| | | | December 31,
2018 | | June 30,
2019 | December 31,
2018 | | September 30,
2019 |
| | (unaudited) | (unaudited) |
| ASSETS | | | | | | |
| Cash and cash equivalents (Note 3) | $ | 9,607 |
| | $ | 12,618 |
| $ | 9,607 |
| | $ | 11,579 |
|
| Marketable securities (Note 3) | 1,308 |
| | 2,247 |
| 1,308 |
| | 3,454 |
|
| Finance receivables, net | | | | | | |
| Retail installment contracts, dealer financing, and other financing | 110,388 |
| | 107,119 |
| 110,388 |
| | 104,302 |
|
| Finance leases | 8,426 |
| | 8,622 |
| 8,426 |
| | 8,469 |
|
| Total finance receivables, net (Note 4) | 118,814 |
| | 115,741 |
| 118,814 |
| | 112,771 |
|
| Net investment in operating leases (Note 5) | 27,449 |
| | 27,738 |
| 27,449 |
| | 27,530 |
|
| Notes and accounts receivable from affiliated companies | 905 |
| | 935 |
| 905 |
| | 794 |
|
| Derivative financial instruments (Note 9) | 670 |
| | 1,186 |
| 670 |
| | 1,295 |
|
| Other assets (Note 10) | 3,456 |
| | 3,553 |
| 3,456 |
| | 3,460 |
|
| Total assets | $ | 162,209 |
| | $ | 164,018 |
| $ | 162,209 |
| | $ | 160,883 |
|
| | | | | | | |
| LIABILITIES | | | | | | |
| Accounts payable | | | | | | |
| Customer deposits, dealer reserves, and other | $ | 1,097 |
| | $ | 1,067 |
| $ | 1,097 |
| | $ | 1,081 |
|
| Affiliated companies | 426 |
| | 885 |
| 426 |
| | 549 |
|
| Total accounts payable | 1,523 |
| | 1,952 |
| 1,523 |
| | 1,630 |
|
| Debt (Note 11) | 140,146 |
| | 141,470 |
| 140,146 |
| | 139,274 |
|
| Deferred income taxes | 2,595 |
| | 2,669 |
| 2,595 |
| | 2,712 |
|
| Derivative financial instruments (Note 9) | 663 |
| | 477 |
| 663 |
| | 637 |
|
| Other liabilities and deferred revenue (Note 10) | 2,307 |
| | 2,556 |
| 2,307 |
| | 2,475 |
|
| Total liabilities | 147,234 |
| | 149,124 |
| 147,234 |
| | 146,728 |
|
| | | | | | | |
| SHAREHOLDER’S INTEREST | | | | | | |
| Shareholder’s interest | 5,227 |
| | 5,227 |
| 5,227 |
| | 5,227 |
|
| Accumulated other comprehensive income / (loss) (Note 12) | (829 | ) | | (801 | ) | (829 | ) | | (1,011 | ) |
| Retained earnings | 10,577 |
| | 10,468 |
| 10,577 |
| | 9,939 |
|
| Total shareholder’s interest | 14,975 |
| | 14,894 |
| 14,975 |
| | 14,155 |
|
| Total liabilities and shareholder’s interest | $ | 162,209 |
| | $ | 164,018 |
| $ | 162,209 |
| | $ | 160,883 |
|
The following table includes assets to be used to settle the liabilities of the consolidated variable interest entities (“VIEs”). These assets and liabilities are included in the consolidated balance sheet above. See Notes 7 and 8 for additional information on our VIEs.
| | | | December 31,
2018 | | June 30,
2019 | December 31,
2018 | | September 30,
2019 |
| | (unaudited) | (unaudited) |
| ASSETS | | | | | | |
| Cash and cash equivalents | $ | 2,728 |
| | $ | 3,719 |
| $ | 2,728 |
| | $ | 2,660 |
|
| Finance receivables, net | 58,662 |
| | 58,118 |
| 58,662 |
| | 56,546 |
|
| Net investment in operating leases | 16,332 |
| | 13,986 |
| 16,332 |
| | 12,671 |
|
| Derivative financial instruments | 27 |
| | 8 |
| 27 |
| | 6 |
|
| | | | | | | |
| LIABILITIES | | | | | | |
| Debt | $ | 53,269 |
| | $ | 51,791 |
| $ | 53,269 |
| | $ | 50,981 |
|
| Derivative financial instruments | 24 |
| | 62 |
| 24 |
| | 49 |
|
The accompanying notes are part of the financial statements.
Item 1. Financial Statements (Continued)
FORD MOTOR CREDIT COMPANY LLC AND SUBSIDIARIES
CONSOLIDATED STATEMENT OF SHAREHOLDER’S INTEREST
(in millions, unaudited)
| | | | | Shareholder’s Interest | | Accumulated Other Comprehensive Income / (Loss) (Note 12) | | Retained Earnings | | Total Shareholder’s Interest | | Shareholder’s Interest | | Accumulated Other Comprehensive Income / (Loss) (Note 12) | | Retained Earnings | | Total Shareholder’s Interest |
| Balance at December 31, 2017 | | $ | 5,227 |
| | $ | (419 | ) | | $ | 11,076 |
| | $ | 15,884 |
| | $ | 5,227 |
| | $ | (419 | ) | | $ | 11,076 |
| | $ | 15,884 |
|
| Net income | | — |
| | — |
| | 701 |
| | 701 |
| | — |
| | — |
| | 701 |
| | 701 |
|
| Other comprehensive income / (loss), net of tax | | — |
| | 113 |
| | — |
| | 113 |
| | — |
| | 113 |
| | — |
| | 113 |
|
| Distributions declared | | — |
| | — |
| | (1,013 | ) | | (1,013 | ) | | — |
| | — |
| | (1,013 | ) | | (1,013 | ) |
| Balance at March 31, 2018 | | $ | 5,227 |
| | $ | (306 | ) | | $ | 10,764 |
| | $ | 15,685 |
| | $ | 5,227 |
| | $ | (306 | ) | | $ | 10,764 |
| | $ | 15,685 |
|
| | | | | | | | | | | | | | | | | |
| Net income | | — |
| | — |
| | 479 |
| | 479 |
| | — |
| | — |
| | 479 |
| | 479 |
|
| Other comprehensive income / (loss), net of tax | | — |
| | (364 | ) | | — |
| | (364 | ) | | — |
| | (364 | ) | | — |
| | (364 | ) |
| Distributions declared | | — |
| | — |
| | (450 | ) | | (450 | ) | | — |
| | — |
| | (450 | ) | | (450 | ) |
| Balance at June 30, 2018 | | $ | 5,227 |
| | $ | (670 | ) | | $ | 10,793 |
| | $ | 15,350 |
| | $ | 5,227 |
| | $ | (670 | ) | | $ | 10,793 |
| | $ | 15,350 |
|
| | | | | | | | | | | | | | | | | |
| Net income | | | — |
| | — |
| | 518 |
| | 518 |
|
| Other comprehensive income / (loss), net of tax | | | — |
| | (49 | ) | | — |
| | (49 | ) |
| Distributions declared | | | — |
| | — |
| | (600 | ) | | (600 | ) |
| Balance at September 30, 2018 | | | $ | 5,227 |
| | $ | (719 | ) | | $ | 10,711 |
| | $ | 15,219 |
|
| | | | | | | | | | |
| Balance at December 31, 2018 | | $ | 5,227 |
| | $ | (829 | ) | | $ | 10,577 |
| | $ | 14,975 |
| | $ | 5,227 |
| | $ | (829 | ) | | $ | 10,577 |
| | $ | 14,975 |
|
| Net income | | — |
| | — |
| | 603 |
| | 603 |
| | — |
| | — |
| | 603 |
| | 603 |
|
| Other comprehensive income / (loss), net of tax | | — |
| | 20 |
| | — |
| | 20 |
| | — |
| | 20 |
| | — |
| | 20 |
|
| Distributions declared | | — |
| | — |
| | (675 | ) | | (675 | ) | | — |
| | — |
| | (675 | ) | | (675 | ) |
| Balance at March 31, 2019 | | $ | 5,227 |
| | $ | (809 | ) | | $ | 10,505 |
| | $ | 14,923 |
| | $ | 5,227 |
| | $ | (809 | ) | | $ | 10,505 |
| | $ | 14,923 |
|
| | | | | | | | | | | | | | | | | |
| Net income | | — |
| | — |
| | 613 |
| | 613 |
| | — |
| | — |
| | 613 |
| | 613 |
|
| Other comprehensive income / (loss), net of tax | | — |
| | 8 |
| | — |
| | 8 |
| | — |
| | 8 |
| | — |
| | 8 |
|
| Distributions declared | | — |
| | — |
| | (650 | ) | | (650 | ) | | — |
| | — |
| | (650 | ) | | (650 | ) |
| Balance at June 30, 2019 | | $ | 5,227 |
| | $ | (801 | ) | | $ | 10,468 |
| | $ | 14,894 |
| | $ | 5,227 |
| | $ | (801 | ) | | $ | 10,468 |
| | $ | 14,894 |
|
| | | | | | | | | | |
| Net income | | | — |
| | — |
| | 571 |
| | 571 |
|
| Other comprehensive income / (loss), net of tax | | | — |
| | (210 | ) | | — |
| | (210 | ) |
| Distributions declared | | | — |
| | — |
| | (1,100 | ) | | (1,100 | ) |
| Balance at September 30, 2019 | | | $ | 5,227 |
| | $ | (1,011 | ) | | $ | 9,939 |
| | $ | 14,155 |
|
The accompanying notes are part of the financial statements.
Item 1. Financial Statements (Continued)
FORD MOTOR CREDIT COMPANY LLC AND SUBSIDIARIES
CONDENSED CONSOLIDATED STATEMENT OF CASH FLOWS
(in millions)
| | | | For the periods ended June 30, | For the periods ended September 30, |
| | 2018 | | 2019 | 2018 | | 2019 |
| | First Half | First Nine Months |
| | (unaudited) | (unaudited) |
| Cash flows from operating activities | | | | | | |
| Net Income | | $ | 1,698 |
| | $ | 1,787 |
|
| Adjustments to reconcile net income to net cash provided in operations | | | | |
| Provision for credit losses | | 290 |
| | 189 |
|
| Depreciation and amortization | | 3,626 |
| | 3,306 |
|
| Amortization of upfront interest supplements | | (1,513 | ) | | (1,605 | ) |
| Net change in deferred income taxes | | 142 |
| | 137 |
|
| Net change in other assets | | (329 | ) | | 58 |
|
| Net change in other liabilities | | 470 |
| | 228 |
|
| All other operating activities | | 210 |
| | 109 |
|
| Net cash provided by / (used in) operating activities | $ | 2,986 |
| | $ | 2,909 |
| $ | 4,594 |
| | $ | 4,209 |
|
| | | | | | | |
| Cash flows from investing activities | | | | | | |
| Purchases of finance receivables | (22,494 | ) | | (17,770 | ) | (33,751 | ) | | (28,449 | ) |
| Principal collections of finance receivables | 21,659 |
| | 20,888 |
| 31,993 |
| | 31,628 |
|
| Purchases of operating lease vehicles | (7,537 | ) | | (6,500 | ) | (11,015 | ) | | (9,728 | ) |
| Proceeds from termination of operating lease vehicles | 4,816 |
| | 4,734 |
| 7,086 |
| | 7,135 |
|
| Net change in wholesale receivables and other short-duration receivables | (130 | ) | | 896 |
| 686 |
| | 2,822 |
|
| Purchases of marketable securities | (2,821 | ) | | (2,099 | ) | (3,401 | ) | | (4,438 | ) |
| Proceeds from sales and maturities of marketable securities | 3,368 |
| | 1,183 |
| 4,504 |
| | 2,322 |
|
| Settlements of derivatives | 156 |
| | 23 |
| 228 |
| | 87 |
|
| All other investing activities | 131 |
| | (24 | ) | 117 |
| | (41 | ) |
| Net cash provided by / (used in) investing activities | (2,852 | ) | | 1,331 |
| (3,553 | ) | | 1,338 |
|
| | | | | | | |
| Cash flows from financing activities | | | | | | |
| Proceeds from issuances of long-term debt | 27,959 |
| | 24,983 |
| 37,035 |
| | 33,423 |
|
| Principal payments on long-term debt | (24,792 | ) | | (24,298 | ) | (32,588 | ) | | (33,216 | ) |
| Change in short-term debt, net | (2,093 | ) | | (565 | ) | (1,677 | ) | | (1,190 | ) |
| Cash distributions to parent | (1,463 | ) | | (1,325 | ) | (2,063 | ) | | (2,425 | ) |
| All other financing activities | (50 | ) | | (64 | ) | (141 | ) | | (87 | ) |
| Net cash provided by / (used in) financing activities | (439 | ) | | (1,269 | ) | 566 |
| | (3,495 | ) |
| | | | | | | |
| Effect of exchange rate changes on cash, cash equivalents and restricted cash | (152 | ) | | 24 |
| (145 | ) | | (93 | ) |
| | | | | | | |
| Net increase / (decrease) in cash, cash equivalents and restricted cash | $ | (457 | ) | | $ | 2,995 |
| $ | 1,462 |
| | $ | 1,959 |
|
| | | | | | | |
| Cash, cash equivalents and restricted cash at beginning of period (Note 3) | $ | 9,682 |
| | $ | 9,747 |
| $ | 9,682 |
| | $ | 9,747 |
|
| Net increase / (decrease) in cash, cash equivalents and restricted cash | (457 | ) | | 2,995 |
| 1,462 |
| | 1,959 |
|
| Cash, cash equivalents and restricted cash at end of period (Note 3) | $ | 9,225 |
| | $ | 12,742 |
| $ | 11,144 |
| | $ | 11,706 |
|
The accompanying notes are part of the financial statements.
Item 1. Financial Statements (Continued)
FORD MOTOR CREDIT COMPANY LLC AND SUBSIDIARIES
NOTES TO THE FINANCIAL STATEMENTS
Table of Contents
|
| | |
| Footnote | | Page |
| Presentation | |
| Accounting Policies | |
| Cash, Cash Equivalents, and Marketable Securities | |
| Finance Receivables | |
| Net Investment in Operating Leases | |
| Allowance for Credit Losses | |
| Transfers of Receivables | |
| Variable Interest Entities | |
| Derivative Financial Instruments and Hedging Activities | |
| Other Assets and Other Liabilities and Deferred Revenue | |
| Debt | |
| Accumulated Other Comprehensive Income / (Loss) | |
| Other Income, Net | |
| Segment Information | |
| Commitments and Contingencies | |
Item 1. Financial Statements (Continued)
FORD MOTOR CREDIT COMPANY LLC AND SUBSIDIARIES
NOTES TO THE FINANCIAL STATEMENTS
NOTE 1. PRESENTATION
Principles of Consolidation
The consolidated financial statements have been prepared in conformity with generally accepted accounting principles in the United States of America (“GAAP”) for interim financial information, and instructions to the Quarterly Report on Form 10-Q and Rule 10-01 of Regulation S-X. In the opinion of management, these unaudited financial statements include all adjustments considered necessary for a fair statement of the results of operations and financial condition for interim periods for Ford Motor Credit Company LLC, its consolidated subsidiaries and consolidated VIEs in which Ford Motor Credit Company LLC is the primary beneficiary (collectively referred to herein as “Ford Credit,” “we,” “our,” or “us”). Results for interim periods should not be considered indicative of results for any other interim period or for the full year. Reference should be made to the financial statements contained in our Annual Report on Form 10-K for the year ended December 31, 2018 (“2018 Form 10-K Report”). We are an indirect, wholly owned subsidiary of Ford Motor Company (“Ford”). We reclassify certain prior period amounts in our consolidated financial statements to conform to current year presentation.
Restructuring and Other Actions
During the first sixnine months of 2019, we continued to execute separation and restructuring actions associated with our plans to transform the operational fitness of our business.
NOTE 2. ACCOUNTING POLICIES
Provision for Income Taxes
For interim tax reporting we estimate one single effective tax rate, which is applied to the year-to-date ordinary income / (loss). Tax effects of significant unusual or infrequently occurring items are excluded from the estimated annual effective tax rate calculation and recognized in the interim period in which they occur.
Adoption of New Accounting Standards
Accounting Standards Update (“ASU”) 2016-02, Leases. On January 1, 2019, we adopted the Accounting Standards Codification 842, Leases, and all the related amendments (“new lease standard”) to contracts using the modified retrospective method. The comparative information has not been restated and continues to be reported under the lease accounting standard in effect for those periods. Adoption of the standard as a lessor did not significantly impact our financial statements. As a lessee, it added about $100 million of right-of-use assets and lease obligations to our consolidated balance sheet as of January 1, 2019, and did not significantly impact our income statement. We do not expect the adoption of the new lease standard to have a significant impact to our net income on an ongoing basis. We elected the practical expedients permitted under the transition guidance of the new standard that retained the lease classification and initial direct costs for any leases that existed prior to adoption of the standard. We did not reassess whether any contracts entered into prior to adoption are leases or contain leases.
We also adopted the following ASUs during 2019, none of which had a material impact to our financial statements or financial statement disclosures:
|
| | | |
| ASU | | | Effective Date |
| 2018-16 | Inclusion of the Secured Overnight Financing Rate (SOFR) Overnight Index Swap (OIS) Rate as a Benchmark Interest Rate for Hedge Accounting Purposes | | January 1, 2019 |
| 2018-08 | Clarifying the Scope and the Accounting Guidance for Contributions Received and Contributions Made | | January 1, 2019 |
Item 1. Financial Statements (Continued)
FORD MOTOR CREDIT COMPANY LLC AND SUBSIDIARIES
NOTES TO THE FINANCIAL STATEMENTS
NOTE 2. ACCOUNTING POLICIES (Continued)
Accounting Standards Issued But Not Yet Adopted
The following standard is expected to result in a significant change in practice to Ford Credit.
ASU 2016-13, Credit Losses - Measurement of Credit Losses on Financial Instruments. In June 2016, the Financial Accounting Standards Board (“FASB”) issued a new accounting standard which replaces the current incurred loss impairment method with a method that reflects expected credit losses. We plan towill adopt the new standard and the related amendments on the effective date of January 1, 20202020. Based on our current loan portfolio and forecasts of future macroeconomic conditions, we estimate that the allowance for credit losses reported in Total finance receivables, net on our balance sheet will increase by recognizingabout $200 million at adoption. We will record the cumulative effect of initially applying the new standard as an adjustment to the opening balance of Retained earnings. We anticipate adoptionThe increase is primarily for our consumer loan portfolio as it will increase the amount ofcover expected credit losses reported in Finance receivables, net on our consolidated balance sheet and do not expect a material impact to our income statement.over the full remaining expected life of the loans.
Change in Accounting Method
As of January 1, 2019, we changed our accounting method for reporting early termination losses related to customer defaults on operating leases. See Note 5 for additional information.
NOTE 3. CASH, CASH EQUIVALENTS, AND MARKETABLE SECURITIES
The following table categorizes the fair values of cash, cash equivalents, and marketable securities measured at fair value on a recurring basis (in millions):
| | | | Fair Value Level | | December 31, 2018 | | June 30, 2019 | Fair Value Level | | December 31, 2018 | | September 30, 2019 |
| Cash and cash equivalents | | | | | | | | |
| U.S. government | 1 | | $ | 139 |
| | $ | 575 |
| 1 | | $ | 139 |
| | $ | 447 |
|
| U.S. government and agencies | 2 | | 25 |
| | 849 |
| 2 | | 25 |
| | 571 |
|
| Non-U.S. government and agencies | 2 | | 114 |
| | 875 |
| 2 | | 114 |
| | 1,405 |
|
| Corporate debt | 2 | | 884 |
| | 907 |
| 2 | | 884 |
| | 872 |
|
| Total marketable securities classified as cash equivalents | | 1,162 |
| | 3,206 |
| | 1,162 |
| | 3,295 |
|
| Cash, time deposits and money market funds | | 8,445 |
| | 9,412 |
| | 8,445 |
| | 8,284 |
|
| Total cash and cash equivalents | | $ | 9,607 |
| | $ | 12,618 |
| | $ | 9,607 |
| | $ | 11,579 |
|
| | | | | | | | | |
| Marketable securities | | | | | | | | |
| U.S. government | 1 | | $ | 289 |
| | $ | 338 |
| 1 | | $ | 289 |
| | $ | 710 |
|
| U.S. government and agencies | 2 | | 65 |
| | 135 |
| 2 | | 65 |
| | 340 |
|
| Non-U.S. government and agencies | 2 | | 610 |
| | 1,349 |
| 2 | | 610 |
| | 1,927 |
|
| Corporate debt | 2 | | 198 |
| | 200 |
| 2 | | 198 |
| | 193 |
|
| Other marketable securities | 2 | | 146 |
| | 225 |
| 2 | | 146 |
| | 284 |
|
| Total marketable securities | | $ | 1,308 |
| | $ | 2,247 |
| | $ | 1,308 |
| | $ | 3,454 |
|
Cash, Cash Equivalents, and Restricted Cash
Cash, cash equivalents, and restricted cash as reported in the statement of cash flows are presented separately on our consolidated balance sheet as follows (in millions):
| | | | December 31, 2018 | | June 30, 2019 | December 31, 2018 | | September 30, 2019 |
| Cash and cash equivalents | $ | 9,607 |
| | $ | 12,618 |
| $ | 9,607 |
| | $ | 11,579 |
|
| Restricted cash included in other assets (a) | 140 |
| | 124 |
| 140 |
| | 127 |
|
| Total cash, cash equivalents, and restricted cash | $ | 9,747 |
| | $ | 12,742 |
| $ | 9,747 |
| | $ | 11,706 |
|
__________
| |
| (a) | Restricted cash primarily includes cash held to meet certain local governmental and regulatory reserve requirements and cash held under the terms of certain contractual agreements. Restricted cash does not include required minimum balances or cash securing debt issued through securitization transactions. |
Item 1. Financial Statements (Continued)
FORD MOTOR CREDIT COMPANY LLC AND SUBSIDIARIES
NOTES TO THE FINANCIAL STATEMENTS
NOTE 4. FINANCE RECEIVABLES
We manage finance receivables as “consumer” and “non-consumer” portfolios. The receivables are generally secured by the vehicles, inventory, or other property being financed.
FinanceTotal finance receivables, net were as follows (in millions):
| | | | December 31, 2018 | | June 30, 2019 | December 31, 2018 | | September 30, 2019 |
| Consumer | | | | | | |
| Retail installment contracts, gross | $ | 70,999 |
| | $ | 68,846 |
| $ | 70,999 |
| | $ | 68,660 |
|
| Finance leases, gross | 8,748 |
| | 8,984 |
| 8,748 |
| | 8,833 |
|
| Retail financing, gross | 79,747 |
| | 77,830 |
| 79,747 |
| | 77,493 |
|
| Unearned interest supplements from Ford and affiliated companies | (3,508 | ) | | (3,512 | ) | (3,508 | ) | | (3,595 | ) |
| Consumer finance receivables | 76,239 |
| | 74,318 |
| 76,239 |
| | 73,898 |
|
| | | | | | | |
| Non-Consumer | | | | | | |
| Dealer financing | 40,996 |
| | 40,144 |
| 40,996 |
| | 37,622 |
|
| Other financing | 2,168 |
| | 1,792 |
| 2,168 |
| | 1,764 |
|
| Non-Consumer finance receivables | 43,164 |
| | 41,936 |
| 43,164 |
| | 39,386 |
|
| Total recorded investment | $ | 119,403 |
| | $ | 116,254 |
| $ | 119,403 |
| | $ | 113,284 |
|
| | | | | | | |
| Recorded investment in finance receivables | $ | 119,403 |
| | $ | 116,254 |
| $ | 119,403 |
| | $ | 113,284 |
|
| Allowance for credit losses | (589 | ) | | (513 | ) | (589 | ) | | (513 | ) |
| Finance receivables, net | $ | 118,814 |
| | $ | 115,741 |
| |
| Total finance receivables, net | | $ | 118,814 |
| | $ | 112,771 |
|
| | | | | | | |
| Net finance receivables subject to fair value (a) | $ | 110,388 |
| | $ | 107,119 |
| $ | 110,388 |
| | $ | 104,302 |
|
| Fair value (b) | 109,794 |
| | 107,251 |
| 109,794 |
| | 104,557 |
|
__________
| |
| (a) | Net finance receivables subject to fair value exclude finance leases. Previously, certain consumer financing products in Europe were classified as retail installment contracts. We now classify these products as finance leases. Comparative information has been revised to reflect this change. |
| |
| (b) | The fair value of finance receivables is categorized within Level 3 of the fair value hierarchy. |
At December 31, 2018 and JuneSeptember 30, 2019, accrued uncollected interest was $264 million and $263$241 million, respectively, which we report in Other assets on our balance sheet.
Included in recorded investment in finance receivables at December 31, 2018 and JuneSeptember 30, 2019 were consumer receivables of $40.7 billion and $39.3$37.8 billion, respectively, and non-consumer receivables of $25.7 billion and $25.1$24.0 billion, respectively, that have been sold for legal purposes in securitization transactions but continue to be reported in our consolidated financial statements. The receivables are available only for payment of the debt issued by, and other obligations of, the securitization entities that are parties to those securitization transactions; they are not available to pay the other obligations or the claims of Ford Credit’s other creditors. Ford Credit holds the right to receive the excess cash flows not needed to pay the debt issued by, and other obligations of, the securitization entities that are parties to those securitization transactions (see Note 7 for additional information).
Finance Leases
Finance leases are comprisedcomposed of sales-type and direct financing leases. We offer finance leases to individuals, leasing companies, government entities, daily rental companies, and fleet customers. These financings include primarily lease plans for terms of 24 to 60 months. In limited cases, a customer may extend the lease term. Early terminations of leases may also occur at the customer’s request subject to our approval. We offer financing products in which the customer may be required to pay any shortfall, or may receive as payment any excess amount between the fair market value and the contractual vehicle value at the end of the term, which are classified as finance leases. In some markets, we finance a vehicle with a series of monthly payments followed by a single balloon payment or the option for the customer to return the vehicle to Ford Credit; these arrangements containing a purchase option are classified as finance leases.
Item 1. Financial Statements (Continued)
FORD MOTOR CREDIT COMPANY LLC AND SUBSIDIARIES
NOTES TO THE FINANCIAL STATEMENTS
NOTE 4. FINANCE RECEIVABLES (Continued)
The amounts contractually due on finance lease receivables were as follows (in millions):
| | | | June 30,
2019 | September 30,
2019 |
| Within one year | $ | 2,075 |
| $ | 2,032 |
|
| After one year and within two years | 2,006 |
| 1,980 |
|
| After two years and within three years | 1,599 |
| 1,534 |
|
| After three years and within four years | 708 |
| 709 |
|
| After four years and within five years | 120 |
| 114 |
|
| After five years | 2 |
| 2 |
|
| Total future cash payments | 6,510 |
| 6,371 |
|
| Less: Present value discount | (313 | ) | (316 | ) |
| Finance lease receivables | $ | 6,197 |
| $ | 6,055 |
|
The reconciliation from finance lease receivables to finance leases, gross and finance leases, net is as follows (in millions):
| | | | June 30,
2019 | September 30,
2019 |
| Finance lease receivables | $ | 6,197 |
| $ | 6,055 |
|
| Unguaranteed residual assets | 2,661 |
| 2,653 |
|
| Initial direct costs | 126 |
| 125 |
|
| Finance leases, gross | 8,984 |
| 8,833 |
|
| Unearned interest supplements from Ford and affiliated companies | (345 | ) | (347 | ) |
| Allowance for credit losses | (17 | ) | (17 | ) |
| Finance leases, net | $ | 8,622 |
| $ | 8,469 |
|
Financing revenue from finance leases for the secondthird quarter of 2018 and 2019 was $95$91 million and $97$90 million, respectively, and for the first halfnine months of 2018 and 2019 was $190$281 million and $189$279 million, respectively. Financing revenue from finance leases is included in Retail financing on the income statement. Revenue is recognized using the interest method and includes the accretion of certain direct origination costs that are deferred and interest supplements received from Ford and affiliated companies.
Item 1. Financial Statements (Continued)
FORD MOTOR CREDIT COMPANY LLC AND SUBSIDIARIES
NOTES TO THE FINANCIAL STATEMENTS
NOTE 4. FINANCE RECEIVABLES (Continued)
Aging
For all finance receivables, we define “past due” as any payment, including principal and interest, that is at least 31 days past the contractual due date. The recorded investment of consumer receivables greater than 90 days past due and still accruing interest was $20 million at December 31, 2018. At JuneSeptember 30, 2019, there were no balances greater than 90 days past due for which we are still accruing interest.
The aging analysis of our finance receivables balances was as follows (in millions):
| | | | December 31, 2018 | | June 30,
2019 | December 31, 2018 | | September 30,
2019 |
| Consumer | | | | | | |
| 31-60 days past due | $ | 859 |
| | $ | 662 |
| $ | 859 |
| | $ | 741 |
|
| 61-90 days past due | 123 |
| | 103 |
| 123 |
| | 110 |
|
| 91-120 days past due | 39 |
| | 31 |
| 39 |
| | 39 |
|
| Greater than 120 days past due | 39 |
| | 39 |
| 39 |
| | 38 |
|
| Total past due | 1,060 |
| | 835 |
| 1,060 |
| | 928 |
|
| Current | 75,179 |
| | 73,483 |
| 75,179 |
| | 72,970 |
|
| Consumer finance receivables | 76,239 |
| | 74,318 |
| 76,239 |
| | 73,898 |
|
| | | | | | | |
| Non-Consumer | | | | | | |
| Total past due | 76 |
| | 70 |
| 76 |
| | 70 |
|
| Current | 43,088 |
| | 41,866 |
| 43,088 |
| | 39,316 |
|
| Non-Consumer finance receivables | 43,164 |
| | 41,936 |
| 43,164 |
| | 39,386 |
|
| Total recorded investment | $ | 119,403 |
| | $ | 116,254 |
| $ | 119,403 |
| | $ | 113,284 |
|
Credit Quality
Consumer Portfolio. Credit quality ratings for consumer receivables are based on our aging analysis. Consumer receivables credit quality ratings are as follows:
| |
| • | Pass – current to 60 days past due; |
| |
| • | Special Mention – 61 to 120 days past due and in intensified collection status; and |
| |
| • | Substandard – greater than 120 days past due and for which the uncollectible portion of the receivables has already been charged off, as measured using the fair value of collateral less costs to sell. |
Non-Consumer Portfolio. Dealers are assigned to one of four groups according to risk ratings as follows:
| |
| • | Group I – strong to superior financial metrics; |
| |
| • | Group II – fair to favorable financial metrics; |
| |
| • | Group III – marginal to weak financial metrics; and |
| |
| • | Group IV – poor financial metrics, including dealers classified as uncollectible. |
The credit quality analysis of dealer financing receivables was as follows (in millions):
| | | | December 31, 2018 | | June 30,
2019 | December 31, 2018 | | September 30,
2019 |
| Dealer financing | | | | | | |
| Group I | $ | 33,656 |
| | $ | 32,541 |
| $ | 33,656 |
| | $ | 30,786 |
|
| Group II | 5,635 |
| | 6,020 |
| 5,635 |
| | 4,733 |
|
| Group III | 1,576 |
| | 1,468 |
| 1,576 |
| | 2,012 |
|
| Group IV | 129 |
| | 115 |
| 129 |
| | 91 |
|
| Total recorded investment | $ | 40,996 |
| | $ | 40,144 |
| $ | 40,996 |
| | $ | 37,622 |
|
Item 1. Financial Statements (Continued)
FORD MOTOR CREDIT COMPANY LLC AND SUBSIDIARIES
NOTES TO THE FINANCIAL STATEMENTS
NOTE 4. FINANCE RECEIVABLES (Continued)
Impaired Receivables
Impaired consumer receivables include accounts that have been rewritten or modified in reorganization proceedings pursuant to the U.S. Bankruptcy Code that are considered to be Troubled Debt Restructurings (“TDRs”), as well as all accounts greater than 120 days past due. Impaired non-consumer receivables represent accounts with dealers that have weak or poor financial metrics or dealer financing that has been modified in TDRs. The recorded investment of consumer receivables that were impaired at December 31, 2018 and JuneSeptember 30, 2019 was $370 million and $337334 million, or 0.5% and 0.5% of consumer receivables, respectively. The recorded investment of non-consumer receivables that were impaired at December 31, 2018 and JuneSeptember 30, 2019 was $129 million and $11591 million, or 0.3% and 0.3%0.2% of non-consumer receivables, respectively. Impaired finance receivables are evaluated both collectively and specifically.
The accrual of revenue is discontinued at the time a receivable is determined to be uncollectible. Accounts may be restored to accrual status only when a customer settles all past-due deficiency balances and future payments are reasonably assured. For receivables in non-accrual status, subsequent financing revenue is recognized only to the extent a payment is received. Payments are generally applied first to outstanding interest and then to the unpaid principal balance.
A restructuring of debt constitutes a TDR if we grant a concession to a debtor for economic or legal reasons related to the debtor’s financial difficulties that we otherwise would not consider. Consumer and non-consumer receivables that have a modified interest rate below market rate or that were modified in reorganization proceedings pursuant to the U.S. Bankruptcy Code, except non-consumer receivables that are current with minimal risk of loss, are considered to be TDRs. We do not grant concessions on the principal balance of our receivables. If a receivable is modified in a reorganization proceeding, all payment requirements of the reorganization plan need to be met before remaining balances are forgiven. Finance receivables involved in TDRs are specifically assessed for impairment.
Item 1. Financial Statements (Continued)
FORD MOTOR CREDIT COMPANY LLC AND SUBSIDIARIES
NOTES TO THE FINANCIAL STATEMENTS
NOTE 5. NET INVESTMENT IN OPERATING LEASES
Net investment in operating leases consists primarily of lease contracts for vehicles with individuals, daily rental companies, and fleet customers with terms of 60 months or less. Payment extensions may be requested by the customer and are generally limited to a maximum of six months over the term of the lease. Term extensions may also be requested by the customer. Term and payment extensions in total generally do not exceed twelve months. A lease can be terminated at any time by satisfying the obligations under the lease agreement. Early termination programs may be occasionally offered to eligible lessees. At the end of the lease, the customer returns the vehicle to the dealer or may have the option to buy the leased vehicle. In the case of a contract default and repossession, the customer typically remains liable for any deficiency between net auction proceeds and the defaulted contract obligations, including any repossession-related expenses.
Accumulated depreciation reduces the value of the vehicles from their initial acquisition value to their expected residual value at the end of the lease, with the associated depreciation expense recognized on a straight-line basis over the term of the lease. At the time of purchase, we establish the expected residual value for the vehicle based on recent auction values, return volumes for our leased vehicles, industry-wide used vehicle prices, marketing incentive plans, and vehicle quality data. We monitor residual values each month and review the accuracy of our accumulated depreciation on a quarterly basis.
Change in Accounting Method. As of January 1, 2019, we changed our accounting method for reporting early termination losses related to customer defaults on operating leases. Prior to the first quarter of 2019, we presented the early termination loss reserve on operating leases due to customer default events as part of the allowance for credit losses, which reduces Net investment in operating leases on the balance sheet. On the income statement, the incurred losses were included in Provision for credit losses. We now consider the effects of operating lease early terminations when determining depreciation estimates, which are included as part of accumulated depreciation within Net investment in operating leases on the balance sheet, and Depreciation on vehicles subject to operating leases on the income statement.
In conjunction with the January 1, 2019 adoption of ASU 2016-02, Leases (described in Note 2), we reviewed our leasing-related accounting policies and updated our depreciation policy for operating leases so that the useful life of the vehicles incorporates our historical experience on early terminations due to customer defaults. We believe this change in accounting method is preferable as the characterization of these changes is better reflected as depreciation. At December 31, 2018, this reclassification increased accumulated depreciation and decreased allowance for credit losses by $78 million, respectively, and had no impact on Net Investment in operating leases. On the income statement, this reclassification increased Depreciation on vehicles subject to operating leases and decreased Provision for credit losses by $2329 million and $48$77 million, for the secondthird quarter of 2018 and first halfnine months of 2018, respectively.
These changes had no impact on Income before income taxes, Net investment in operating leases, Retained earnings, or to the Net cash provided by / (used in) operating activities. We have reclassified prior period amounts to reflect the above changes.
Net investment in operating leases werewas as follows (in millions): | | | | December 31,
2018 | | June 30,
2019 | December 31,
2018 | | September 30,
2019 |
| Vehicles, at cost (a) | $ | 33,593 |
| | $ | 33,632 |
| $ | 33,593 |
| | $ | 33,339 |
|
| Accumulated depreciation | (6,144 | ) | | (5,894 | ) | (6,144 | ) | | (5,809 | ) |
| Net investment in operating leases | $ | 27,449 |
| | $ | 27,738 |
| $ | 27,449 |
| | $ | 27,530 |
|
__________
| |
| (a) | Includes interest supplements and residual support payments we receive on certain leasing transactions under agreements with Ford and affiliated companies, and other vehicle acquisition costs. We recognize these upfront collections from Ford and other vehicle acquisition costs as part of Net investment in operating leases, which are amortized to Depreciation on vehicles subject to operating leases over the term of the lease contract. |
Item 1. Financial Statements (Continued)
FORD MOTOR CREDIT COMPANY LLC AND SUBSIDIARIES
NOTES TO THE FINANCIAL STATEMENTS
NOTE 5. NET INVESTMENT IN OPERATING LEASES (Continued)
At December 31, 2018 and JuneSeptember 30, 2019, Net investment in operating leases includes $16.3 billion and $14.0$12.7 billion, respectively, that have been included in securitization transactions but continue to be reported in our consolidated financial statements. These net investments in operating leases are available only for payment of the debt issued by, and other obligations of, the securitization entities that are parties to those securitization transactions; they are not available to pay our other obligations or the claims of our other creditors. We hold the right to receive the excess cash flows not needed to pay the debt issued by, and other obligations of, the securitization entities that are parties to those securitization transactions (see Note 7 for additional information).
The amounts contractually due for minimum rentals on operating leases at December 31, 2018 were as follows (in millions): |
| | | | | | | | | | | | | | | | | | | | | | | |
| | 2019 | | 2020 | | 2021 | | 2022 | | 2023 | | Total |
| Minimum rentals on operating leases | $ | 4,708 |
| | $ | 2,929 |
| | $ | 1,083 |
| | $ | 83 |
| | $ | 6 |
| | $ | 8,809 |
|
The amounts contractually due on our operating leases at JuneSeptember 30, 2019 were as follows (in millions): |
| | | | | | | | | | | | | | | | | | | | | | | |
| | Within 1 year | | After 1 year and within 2 years | | After 2 years and within 3 years | | After 3 years and within 4 years | | After 4 years and within 5 years | | Total |
| Operating lease payments | $ | 4,746 |
| | $ | 2,940 |
| | $ | 1,029 |
| | $ | 73 |
| | $ | 5 |
| | $ | 8,793 |
|
|
| | | | | | | | | | | | | | | | | | | | | | | |
| | Within 1 year | | After 1 year and within 2 years | | After 2 years and within 3 years | | After 3 years and within 4 years | | After 4 years and within 5 years | | Total |
| Operating lease payments | $ | 4,703 |
| | $ | 2,917 |
| | $ | 1,014 |
| | $ | 72 |
| | $ | 5 |
| | $ | 8,711 |
|
Operating leases are generally pre-payable without penalty and may cause actual paid amounts to differ from amounts contractually due.
Item 1. Financial Statements (Continued)
FORD MOTOR CREDIT COMPANY LLC AND SUBSIDIARIES
NOTES TO THE FINANCIAL STATEMENTS
NOTE 6. ALLOWANCE FOR CREDIT LOSSES
An analysis of the allowance for credit losses related to finance receivables for the periods ended JuneSeptember 30 was as follows (in millions):
|
| | | | | | | | | | | |
| | Second Quarter 2018 |
| | Consumer | | Non-Consumer | | Total Allowance |
| Allowance for credit losses | | | | | |
| Beginning balance | $ | 584 |
| | $ | 16 |
| | $ | 600 |
|
| Charge-offs | (123 | ) | | (1 | ) | | (124 | ) |
| Recoveries | 47 |
| | 1 |
| | 48 |
|
| Provision for credit losses | 72 |
| | (2 | ) | | 70 |
|
| Other | (7 | ) | | — |
| | (7 | ) |
| Ending balance | $ | 573 |
| | $ | 14 |
| | $ | 587 |
|
| | | | | | |
| | First Half 2018 |
| | Consumer | | Non-Consumer | | Total Allowance |
| Allowance for credit losses | | | | | |
| Beginning balance | $ | 582 |
| | $ | 15 |
| | $ | 597 |
|
| Charge-offs | (254 | ) | | (3 | ) | | (257 | ) |
| Recoveries | 86 |
| | 2 |
| | 88 |
|
| Provision for credit losses | 164 |
| | — |
| | 164 |
|
| Other | (5 | ) | | — |
| | (5 | ) |
| Ending balance | $ | 573 |
| | $ | 14 |
| | $ | 587 |
|
| | | | | | |
| Analysis of ending balance of allowance for credit losses | | | | | |
| Collective impairment allowance | $ | 552 |
| | $ | 13 |
| | $ | 565 |
|
| Specific impairment allowance | 21 |
| | 1 |
| | 22 |
|
| Ending balance | 573 |
| | 14 |
| | 587 |
|
| | | | | | |
| Analysis of ending balance of finance receivables | | | | | |
| Collectively evaluated for impairment | $ | 75,338 |
| | $ | 40,668 |
| | $ | 116,006 |
|
| Specifically evaluated for impairment | 378 |
| | 96 |
| | 474 |
|
| Recorded investment | 75,716 |
|
| 40,764 |
| | 116,480 |
|
| | | | | | |
| Ending balance, net of allowance for credit losses | $ | 75,143 |
| | $ | 40,750 |
| | $ | 115,893 |
|
|
| | | | | | | | | | | | | | | | | | | | | | | |
| | Third Quarter 2018 | | First Nine Months 2018 |
| | Consumer | | Non-Consumer | | Total | | Consumer | | Non-Consumer | | Total |
| Allowance for credit losses | | | | | | | | | | | |
| Beginning balance | $ | 573 |
| | $ | 14 |
| | $ | 587 |
| | $ | 582 |
| | $ | 15 |
| | $ | 597 |
|
| Charge-offs | (128 | ) | | (43 | ) | | (171 | ) | | (382 | ) | | (46 | ) | | (428 | ) |
| Recoveries | 40 |
| | 4 |
| | 44 |
| | 126 |
| | 6 |
| | 132 |
|
| Provision for credit losses | 73 |
| | 52 |
| | 125 |
| | 237 |
| | 52 |
| | 289 |
|
| Other | 1 |
| | — |
| | 1 |
| | (4 | ) | | — |
| | (4 | ) |
| Ending balance | $ | 559 |
| | $ | 27 |
| | $ | 586 |
| | $ | 559 |
| | $ | 27 |
| | $ | 586 |
|
| | | | | | | | | | | | |
| Analysis of ending balance of allowance for credit losses | | | | | | | | | | | |
| Collective impairment allowance | | | | | | | $ | 538 |
| | $ | 14 |
| | $ | 552 |
|
| Specific impairment allowance | | | | | | | 21 |
| | 13 |
| | 34 |
|
| Ending balance | | | | | | | $ | 559 |
| | $ | 27 |
| | $ | 586 |
|
| | | | | | | | | | | | |
| Analysis of ending balance of finance receivables | | | | | | | | | | | |
| Collectively evaluated for impairment | | | | | | | $ | 76,448 |
| | $ | 39,638 |
| | $ | 116,086 |
|
| Specifically evaluated for impairment | | | | | | | 379 |
| | 165 |
| | 544 |
|
| Recorded investment | | | | | | | 76,827 |
|
| 39,803 |
| | 116,630 |
|
| | | | | | | | | | | | |
| Ending balance, net of allowance for credit losses | | | | | | | $ | 76,268 |
| | $ | 39,776 |
| | $ | 116,044 |
|
Item 1. Financial Statements (Continued) |
| | | | | | | | | | | | | | | | | | | | | | | |
| | Third Quarter 2019 | | First Nine Months 2019 |
| | Consumer | | Non-Consumer | | Total | | Consumer | | Non-Consumer | | Total |
| Allowance for credit losses | | | | | | | | | | | |
| Beginning balance | $ | 496 |
| | $ | 17 |
| | $ | 513 |
| | $ | 566 |
| | $ | 23 |
| | $ | 589 |
|
| Charge-offs | (129 | ) | | (1 | ) | | (130 | ) | | (383 | ) | | (18 | ) | | (401 | ) |
| Recoveries | 41 |
| | — |
| | 41 |
| | 129 |
| | 8 |
| | 137 |
|
| Provision for credit losses | 93 |
| | — |
| | 93 |
| | 187 |
| | 2 |
| | 189 |
|
| Other | (3 | ) | | (1 | ) | | (4 | ) | | (1 | ) | | — |
| | (1 | ) |
| Ending balance | $ | 498 |
| | $ | 15 |
| | $ | 513 |
| | $ | 498 |
| | $ | 15 |
| | $ | 513 |
|
| | | | | | | | | | | | |
| Analysis of ending balance of allowance for credit losses | | | | | | | | | | | |
| Collective impairment allowance | | | | | | | $ | 479 |
| | $ | 13 |
| | $ | 492 |
|
| Specific impairment allowance | | | | | | | 19 |
| | 2 |
| | 21 |
|
| Ending balance | | | | | | | 498 |
| | 15 |
| | 513 |
|
| | | | | | | | | | | | |
| Analysis of ending balance of finance receivables | | | | | | | | | | | |
| Collectively evaluated for impairment | | | | | | | $ | 73,564 |
| | $ | 39,295 |
| | $ | 112,859 |
|
| Specifically evaluated for impairment | | | | | | | 334 |
| | 91 |
| | 425 |
|
| Recorded investment | | | | | | | 73,898 |
| | 39,386 |
| | 113,284 |
|
| | | | | | | | | | | | |
| Ending balance, net of allowance for credit losses | | | | | | | $ | 73,400 |
| | $ | 39,371 |
| | $ | 112,771 |
|
FORD MOTOR CREDIT COMPANY LLC AND SUBSIDIARIES
NOTES TO THE FINANCIAL STATEMENTS14
NOTE 6. ALLOWANCE FOR CREDIT LOSSES (Continued)
|
| | | | | | | | | | | |
| | Second Quarter 2019 |
| | Consumer | | Non-Consumer | | Total Allowance |
| Allowance for credit losses | | | | | |
| Beginning balance | $ | 496 |
| | $ | 17 |
| | $ | 513 |
|
| Charge-offs | (117 | ) | | — |
| | (117 | ) |
| Recoveries | 45 |
| | 6 |
| | 51 |
|
| Provision for credit losses | 70 |
| | (7 | ) | | 63 |
|
| Other | 2 |
| | 1 |
| | 3 |
|
| Ending balance | $ | 496 |
| | $ | 17 |
| | $ | 513 |
|
| | | | | | |
| | First Half 2019 |
| | Consumer | | Non-Consumer | | Total Allowance |
| Allowance for credit losses | | | | | |
| Beginning balance | $ | 566 |
| | $ | 23 |
| | $ | 589 |
|
| Charge-offs | (254 | ) | | (17 | ) | | (271 | ) |
| Recoveries | 88 |
| | 8 |
| | 96 |
|
| Provision for credit losses | 94 |
| | 2 |
| | 96 |
|
| Other | 2 |
| | 1 |
| | 3 |
|
| Ending balance | $ | 496 |
| | $ | 17 |
| | $ | 513 |
|
| | | | | | |
| Analysis of ending balance of allowance for credit losses | | | | | |
| Collective impairment allowance | $ | 477 |
| | $ | 16 |
| | $ | 493 |
|
| Specific impairment allowance | 19 |
| | 1 |
| | 20 |
|
| Ending balance | 496 |
| | 17 |
| | 513 |
|
| | | | | | |
| Analysis of ending balance of finance receivables | | | | | |
| Collectively evaluated for impairment | $ | 73,981 |
| | $ | 41,821 |
| | $ | 115,802 |
|
| Specifically evaluated for impairment | 337 |
| | 115 |
| | 452 |
|
| Recorded investment | 74,318 |
| | 41,936 |
| | 116,254 |
|
| | | | | | |
| Ending balance, net of allowance for credit losses | $ | 73,822 |
| | $ | 41,919 |
| | $ | 115,741 |
|
Item 1. Financial Statements (Continued)
FORD MOTOR CREDIT COMPANY LLC AND SUBSIDIARIES
NOTES TO THE FINANCIAL STATEMENTS
NOTE 7. TRANSFERS OF RECEIVABLES
We securitize finance receivables and net investment in operating leases through a variety of programs using amortizing, variable funding, and revolving structures. We also sell finance receivables in structured financing transactions. Due to the similarities between securitization and structured financing, we refer to structured financings as securitization transactions. Our securitization programs are targeted to institutional investors in both public and private transactions in capital markets primarily in the United States, Canada, the United Kingdom, Germany, and China.
We engage in securitization transactions to fund operations and to maintain liquidity. Our securitization transactions are recorded as asset-backed debt, and the associated assets are not derecognized and continue to be included in our financial statements.
The finance receivables sold for legal purposes and net investment in operating leases included in securitization transactions are available only for payment of the debt issued by, and other obligations of, the securitization entities that are parties to those securitization transactions. They are not available to pay our other obligations or the claims of our other creditors. We hold the right to receive the excess cash flows not needed to pay the debt issued by, and other obligations of, the securitization entities that are parties to those securitization transactions. The debt is the obligation of our consolidated securitization entities and not the obligation of Ford Credit or our other subsidiaries.
Most of these securitization transactions utilize VIEs. See Note 8 for additional information concerning VIEs. The following tables show the assets and debt related to our securitization transactions that were included in our financial statements (in billions):
|
| | | | | | | | | | | | | | | | | | | |
| | December 31, 2018 |
| | Cash and Cash Equivalents | | Finance Receivables and Net Investment in Operating Leases (a) | | Related Debt (c) |
| | Before Allowance
for Credit Losses | | Allowance for
Credit Losses | | After Allowance
for Credit Losses | |
| VIE (b) | | | | | | | | | |
| Retail financing | $ | 1.9 |
| | $ | 34.0 |
| | $ | 0.2 |
| | $ | 33.8 |
| | $ | 29.2 |
|
| Wholesale financing | 0.3 |
| | 24.9 |
| | — |
| | 24.9 |
| | 13.9 |
|
| Finance receivables | 2.2 |
| | 58.9 |
| | 0.2 |
| | 58.7 |
| | 43.1 |
|
| Net investment in operating leases | 0.5 |
| | 16.3 |
| | — |
| | 16.3 |
| | 10.2 |
|
| Total VIE | $ | 2.7 |
| | $ | 75.2 |
| | $ | 0.2 |
| | $ | 75.0 |
| | $ | 53.3 |
|
| | | | | | | | | | |
| Non-VIE | | | | | | | | | |
| Retail financing | $ | 0.3 |
| | $ | 6.7 |
| | $ | — |
| | $ | 6.7 |
| | $ | 5.9 |
|
| Wholesale financing | — |
| | 0.8 |
| | — |
| | 0.8 |
| | 0.6 |
|
| Finance receivables | 0.3 |
| | 7.5 |
| | — |
| | 7.5 |
| | 6.5 |
|
| Net investment in operating leases | — |
| | — |
| | — |
| | — |
| | — |
|
| Total Non-VIE | $ | 0.3 |
| | $ | 7.5 |
| | $ | — |
| | $ | 7.5 |
| | $ | 6.5 |
|
| | | | | | | | | | |
| Total securitization transactions | | | | | | | | | |
| Retail financing | $ | 2.2 |
| | $ | 40.7 |
| | $ | 0.2 |
| | $ | 40.5 |
| | $ | 35.1 |
|
| Wholesale financing | 0.3 |
| | 25.7 |
| | — |
| | 25.7 |
| | 14.5 |
|
| Finance receivables | 2.5 |
| | 66.4 |
| | 0.2 |
| | 66.2 |
| | 49.6 |
|
| Net investment in operating leases | 0.5 |
| | 16.3 |
| | — |
| | 16.3 |
| | 10.2 |
|
| Total securitization transactions | $ | 3.0 |
| | $ | 82.7 |
| | $ | 0.2 |
| | $ | 82.5 |
| | $ | 59.8 |
|
__________
| |
| (a) | Unearned interest supplements and residual support are excluded from securitization transactions. |
| |
| (b) | Includes assets to be used to settle the liabilities of the consolidated VIEs. |
| |
| (c) | Includes unamortized discount and debt issuance costs. |
Item 1. Financial Statements (Continued)
FORD MOTOR CREDIT COMPANY LLC AND SUBSIDIARIES
NOTES TO THE FINANCIAL STATEMENTS
NOTE 7. TRANSFERS OF RECEIVABLES (Continued)
| | | | June 30, 2019 | September 30, 2019 |
| | Cash and Cash Equivalents | | Finance Receivables and Net Investment in Operating Leases (a) | | Related Debt (c) | Cash and Cash Equivalents | | Finance Receivables and Net Investment in Operating Leases (a) | | Related Debt (c) |
| | Before Allowance for Credit Losses | | Allowance for Credit Losses | | After Allowance for Credit Losses | | Before Allowance for Credit Losses | | Allowance for Credit Losses | | After Allowance for Credit Losses | |
| VIE (b) | | | | | | | | | | | | | | | | | | |
| Retail financing | $ | 1.9 |
| | $ | 34.1 |
| | $ | 0.2 |
| | $ | 33.9 |
| | $ | 29.5 |
| $ | 1.8 |
| | $ | 33.3 |
| | $ | 0.2 |
| | $ | 33.1 |
| | $ | 28.8 |
|
| Wholesale financing | 1.2 |
| | 24.2 |
| | — |
| | 24.2 |
| | 13.6 |
| 0.3 |
| | 23.4 |
| | — |
| | 23.4 |
| | 14.2 |
|
| Finance receivables | 3.1 |
| | 58.3 |
| | 0.2 |
| | 58.1 |
| | 43.1 |
| 2.1 |
| | 56.7 |
| | 0.2 |
| | 56.5 |
| | 43.0 |
|
| Net investment in operating leases | 0.6 |
| | 14.0 |
| | — |
| | 14.0 |
| | 8.7 |
| 0.6 |
| | 12.7 |
| | — |
| | 12.7 |
| | 8.0 |
|
| Total VIE | $ | 3.7 |
| | $ | 72.3 |
| | $ | 0.2 |
| | $ | 72.1 |
| | $ | 51.8 |
| $ | 2.7 |
| | $ | 69.4 |
| | $ | 0.2 |
| | $ | 69.2 |
| | $ | 51.0 |
|
| | | | | | | | | | | | | | | | | | | |
| Non-VIE | | | | | | | | | | | | | | | | | | |
| Retail financing | $ | 0.3 |
| | $ | 5.2 |
| | $ | — |
| | $ | 5.2 |
| | $ | 4.6 |
| $ | 0.2 |
| | $ | 4.5 |
| | $ | — |
| | $ | 4.5 |
| | $ | 4.0 |
|
| Wholesale financing | — |
| | 0.9 |
| | — |
| | 0.9 |
| | 0.6 |
| — |
| | 0.6 |
| | — |
| | 0.6 |
| | 0.5 |
|
| Finance receivables | 0.3 |
| | 6.1 |
| | — |
| | 6.1 |
| | 5.2 |
| 0.2 |
| | 5.1 |
| | — |
| | 5.1 |
| | 4.5 |
|
| Net investment in operating leases | — |
| | — |
| | — |
| | — |
| | — |
| — |
| | — |
| | — |
| | — |
| | — |
|
| Total Non-VIE | $ | 0.3 |
| | $ | 6.1 |
| | $ | — |
| | $ | 6.1 |
| | $ | 5.2 |
| $ | 0.2 |
| | $ | 5.1 |
| | $ | — |
| | $ | 5.1 |
| | $ | 4.5 |
|
| | | | | | | | | | | | | | | | | | | |
| Total securitization transactions | | | | | | | | | | | | | | | | | | |
| Retail financing | $ | 2.2 |
| | $ | 39.3 |
| | $ | 0.2 |
| | $ | 39.1 |
| | $ | 34.1 |
| $ | 2.0 |
| | $ | 37.8 |
| | $ | 0.2 |
| | $ | 37.6 |
| | $ | 32.8 |
|
| Wholesale financing | 1.2 |
| | 25.1 |
| | — |
| | 25.1 |
| | 14.2 |
| 0.3 |
| | 24.0 |
| | — |
| | 24.0 |
| | 14.7 |
|
| Finance receivables | 3.4 |
| | 64.4 |
| | 0.2 |
| | 64.2 |
| | 48.3 |
| 2.3 |
| | 61.8 |
| | 0.2 |
| | 61.6 |
| | 47.5 |
|
| Net investment in operating leases | 0.6 |
| | 14.0 |
| | — |
| | 14.0 |
| | 8.7 |
| 0.6 |
| | 12.7 |
| | — |
| | 12.7 |
| | 8.0 |
|
| Total securitization transactions | $ | 4.0 |
| | $ | 78.4 |
| | $ | 0.2 |
| | $ | 78.2 |
| | $ | 57.0 |
| $ | 2.9 |
| | $ | 74.5 |
| | $ | 0.2 |
| | $ | 74.3 |
| | $ | 55.5 |
|
__________
| |
| (a) | Unearned interest supplements and residual support are excluded from securitization transactions. |
| |
| (b) | Includes assets to be used to settle the liabilities of the consolidated VIEs. |
| |
| (c) | Includes unamortized discount and debt issuance cost. |
Item 1. Financial Statements (Continued)
FORD MOTOR CREDIT COMPANY LLC AND SUBSIDIARIES
NOTES TO THE FINANCIAL STATEMENTS
NOTE 8. VARIABLE INTEREST ENTITIES
We use special purpose entities to issue asset-backed securities in transactions to public and private investors. We have deemed most of these special purpose entities to be VIEs of which we are the primary beneficiary. The asset-backed securities are backed by finance receivables and interests in net investments in operating leases. The assets continue to be consolidated by us. We retain interests in our securitization VIEs, including subordinated securities issued by the VIEs, rights to cash held for the benefit of the securitization investors, and rights to receive the excess cash flows not needed to pay the debt issued by, and other obligations of, the securitization entities that are parties to those securitization transactions.
We have no obligation to repurchase or replace any securitized asset that subsequently becomes delinquent in payment or otherwise is in default, except when representations and warranties about the eligibility of the securitized assets are breached, or when certain changes are made to the underlying asset contracts. Securitization investors have no recourse to us or our other assets and have no right to require us to repurchase the investments. We generally have no obligation to provide liquidity or contribute cash or additional assets to the VIEs and do not guarantee any asset-backed securities. We may be required to support the performance of certain securitization transactions, however, by increasing cash reserves.
See Note 7 for additional information on the financial position and financial performance of our VIEs and Note 9 for additional information regarding derivatives.
NOTE 9. DERIVATIVE FINANCIAL INSTRUMENTS AND HEDGING ACTIVITIES
In the normal course of business, our operations are exposed to global market risks, including the effect of changes in interest rates and foreign currency exchange rates. To manage these risks, we enter into highly effective derivative contracts. We have elected to apply hedge accounting to certain derivatives. Derivatives that are designated in hedging relationships are evaluated for effectiveness using regression analysis at the time they are designated and throughout the hedge period. Some derivatives do not qualify for hedge accounting; for others, we elect not to apply hedge accounting.
Income Effect of Derivative Financial Instruments
The gains / (losses), by hedge designation, reported in income for the periods ended JuneSeptember 30 were as follows (in millions):
| | | | Second Quarter | | First Half | Third Quarter | | First Nine Months |
| | 2018 | | 2019 | | 2018 | | 2019 | 2018 | | 2019 | | 2018 | | 2019 |
| Fair value hedges | | | | | | | | | | | | | | |
| Interest rate contracts | | | | | | | | | | | | | | |
| Net interest settlements and accruals on hedging instruments | $ | (2 | ) | | $ | (12 | ) | | $ | 24 |
| | $ | (32 | ) | $ | (5 | ) | | $ | — |
| | $ | 19 |
| | $ | (32 | ) |
| Fair value changes on hedging instruments | (90 | ) | | 474 |
| | (429 | ) | | 724 |
| (102 | ) | | 203 |
| | (531 | ) | | 927 |
|
| Fair value changes on hedged debt | 82 |
| | (463 | ) | | 411 |
| | (716 | ) | 110 |
| | (194 | ) | | 521 |
| | (910 | ) |
| Derivatives not designated as hedging instruments | | | | | | | | | | | | | | |
| Interest rate contracts | (20 | ) | | (3 | ) | | (37 | ) | | (30 | ) | 9 |
| | 18 |
| | (28 | ) | | (12 | ) |
| Foreign currency exchange contracts (a) | 110 |
| | 40 |
| | 98 |
| | 34 |
| 6 |
| | 154 |
| | 104 |
| | 188 |
|
| Cross-currency interest rate swap contracts | (125 | ) | | 141 |
| | (183 | ) | | (4 | ) | (75 | ) | | (257 | ) | | (258 | ) | | (261 | ) |
| Total | $ | (45 | ) | | $ | 177 |
| | $ | (116 | ) | | $ | (24 | ) | $ | (57 | ) | | $ | (76 | ) | | $ | (173 | ) | | $ | (100 | ) |
__________
| |
| (a) | Reflects forward contracts between Ford Credit and an affiliated company. |
Item 1. Financial Statements (Continued)
FORD MOTOR CREDIT COMPANY LLC AND SUBSIDIARIES
NOTES TO THE FINANCIAL STATEMENTS
NOTE 9. DERIVATIVE FINANCIAL INSTRUMENTS AND HEDGING ACTIVITIES (Continued)
Balance Sheet Effect of Derivative Financial Instruments
Derivative assets and liabilities are reported on the balance sheet at fair value and are presented on a gross basis. The notional amounts of the derivative instruments do not necessarily represent amounts exchanged by the parties and are not a direct measure of our financial exposure. We also enter into master agreements with counterparties that may allow for netting of exposures in the event of default or breach of the counterparty agreement. Collateral represents cash received or paid under reciprocal arrangements that we have entered into with our derivative counterparties which we do not use to offset our derivative assets and liabilities.
The fair value of our derivative instruments and the associated notional amounts, presented gross, were as follows (in millions): | | | | December 31, 2018 | | June 30, 2019 | December 31, 2018 | | September 30, 2019 |
| | Notional | | Fair Value of Assets | | Fair Value of Liabilities | | Notional | | Fair Value of Assets | | Fair Value of Liabilities | Notional | | Fair Value of Assets | | Fair Value of Liabilities | | Notional | | Fair Value of Assets | | Fair Value of Liabilities |
| Fair value hedges | | | | | | | | | | | | | | | | | | | | | | |
| Interest rate contracts | $ | 22,989 |
| | $ | 158 |
| | $ | 208 |
| | $ | 25,308 |
| | $ | 687 |
| | $ | 13 |
| $ | 22,989 |
| | $ | 158 |
| | $ | 208 |
| | $ | 25,235 |
| | $ | 789 |
| | $ | 10 |
|
| Derivatives not designated as hedging instruments | | | | | | | | | | | | | | | | | | | | | | |
| Interest rate contracts | 76,904 |
| | 235 |
| | 274 |
| | 63,877 |
| | 255 |
| | 270 |
| 76,904 |
| | 235 |
| | 274 |
| | 64,523 |
| | 271 |
| | 290 |
|
| Foreign currency exchange contracts | 4,318 |
| | 45 |
| | 24 |
| | 4,371 |
| | 16 |
| | 31 |
| 4,318 |
| | 45 |
| | 24 |
| | 5,567 |
| | 108 |
| | 18 |
|
| Cross-currency interest rate swap contracts | 5,235 |
| | 232 |
| | 157 |
| | 7,879 |
| | 228 |
| | 163 |
| 5,235 |
| | 232 |
| | 157 |
| | 7,203 |
| | 127 |
| | 319 |
|
| Total derivative financial instruments, gross (a) (b) | $ | 109,446 |
| | $ | 670 |
| | $ | 663 |
| | $ | 101,435 |
| | $ | 1,186 |
| | $ | 477 |
| $ | 109,446 |
| | $ | 670 |
| | $ | 663 |
| | $ | 102,528 |
| | $ | 1,295 |
| | $ | 637 |
|
__________
| |
| (a) | At December 31, 2018 and JuneSeptember 30, 2019, we held collateral of $19 million and $24 million, respectively, and we posted collateral of $59 million and $85$100 million, respectively. |
| |
| (b) | At December 31, 2018 and JuneSeptember 30, 2019, the fair value of assets and liabilities available for counterparty netting was $233 million and $190$282 million, respectively. All derivatives are categorized within Level 2 of the fair value hierarchy. |
Item 1. Financial Statements (Continued)
FORD MOTOR CREDIT COMPANY LLC AND SUBSIDIARIES
NOTES TO THE FINANCIAL STATEMENTS
NOTE 10. OTHER ASSETS AND OTHER LIABILITIES AND DEFERRED REVENUE
Other assets and other liabilities and deferred revenue consist of various balance sheet items that are combined for financial statement presentation due to their respective materiality compared with other individual asset and liability items.
Other assets were as follows (in millions):
| | | | December 31,
2018 | | June 30,
2019 | December 31,
2018 | | September 30,
2019 |
| Accrued interest and other non-finance receivables | $ | 1,080 |
| | $ | 1,155 |
| $ | 1,080 |
| | $ | 997 |
|
| Collateral held for resale, at net realizable value, and other inventory | 877 |
| | 742 |
| 877 |
| | 807 |
|
| Prepaid reinsurance premiums and other reinsurance recoverables | 658 |
| | 675 |
| 658 |
| | 683 |
|
| Property and equipment, net of accumulated depreciation (a) | 192 |
| | 200 |
| 192 |
| | 209 |
|
| Deferred charges - income taxes | 216 |
| | 193 |
| 216 |
| | 182 |
|
| Deferred charges | 96 |
| | 133 |
| |
| Investment in non-consolidated affiliates | 123 |
| | 130 |
| 123 |
| | 129 |
|
| Restricted cash | 140 |
| | 124 |
| 140 |
| | 127 |
|
| Deferred charges | | 96 |
| | 125 |
|
| Operating lease assets | — |
| | 93 |
| — |
| | 88 |
|
| Other | 74 |
| | 108 |
| 74 |
| | 113 |
|
| Total other assets | $ | 3,456 |
| | $ | 3,553 |
| $ | 3,456 |
| | $ | 3,460 |
|
__________
| |
| (a) | Accumulated depreciation was $367 million and $380$383 million at December 31, 2018 and JuneSeptember 30, 2019, respectively. |
Other liabilities and deferred revenue were as follows (in millions):
| | | | December 31,
2018 | | June 30,
2019 | December 31,
2018 | | September 30,
2019 |
| Unearned insurance premiums and fees | | $ | 775 |
| | $ | 803 |
|
| Interest payable | $ | 752 |
| | $ | 796 |
| 752 |
| | 652 |
|
| Unearned insurance premiums and fees | 775 |
| | 794 |
| |
| Income tax and related interest (a) | 369 |
| | 491 |
| 369 |
| | 551 |
|
| Deferred revenue | 113 |
| | 130 |
| 113 |
| | 111 |
|
| Operating lease liabilities | — |
| | 95 |
| — |
| | 90 |
|
| Payroll and employee benefits | 70 |
| | 52 |
| 70 |
| | 60 |
|
| Other | 228 |
| | 198 |
| 228 |
| | 208 |
|
| Total other liabilities and deferred revenue | $ | 2,307 |
| | $ | 2,556 |
| $ | 2,307 |
| | $ | 2,475 |
|
__________
| |
| (a) | Includes tax and interest payable to affiliated companies of $193 million and $331$407 million at December 31, 2018 and JuneSeptember 30, 2019, respectively. |
We have investments in entities for which we do not have the ability to exercise significant influence and fair values are not readily available. We have elected to record these investments at cost (less impairment, if any), adjusted for changes resulting from observable price changes in orderly transactions for the identical or a similar investment of the same issuer. We report the carrying value of these investments in Other assets in our consolidated balance sheet. These investments were $9 million and $8 million at December 31, 2018 and JuneSeptember 30, 2019, respectively. There were no material adjustments to the fair values of these investments during the period ending Juneended September 30, 2019.
Deferred revenue balances presented above include amounts from contracts with customers primarily related to admission fee revenue on group financing products available in Argentina and were $87 million and $81$64 million at December 31, 2018 and JuneSeptember 30, 2019, respectively. Admission fee revenue on group financing products is generally recognized evenly over the term of the agreement, which is up to 84 months. Increases in the admission fee deferred revenue balance are the result of payments due during the current period in advance of satisfying our performance under the contract and decreases are a result of revenue recognized during the current period that was previously deferred.
Item 1. Financial Statements (Continued)
FORD MOTOR CREDIT COMPANY LLC AND SUBSIDIARIES
NOTES TO THE FINANCIAL STATEMENTS
NOTE 11. DEBT
Debt outstanding and interest rates were as follows (in millions):
| | | | | | | | Interest Rates | | | | | Interest Rates |
| | Debt | | Average Contractual | | Average Effective | Debt | | Average Contractual | | Average Effective |
| | December 31,
2018 | | June 30,
2019 | | 2018 | | 2019 | | 2018 | | 2019 | December 31,
2018 | | September 30,
2019 | | 2018 | | 2019 | | 2018 | | 2019 |
| Short-term debt | | | | | | | | | | | | | | | | | | | | | | |
| Unsecured debt | | | | | | | | | | | | | | | | | | | | | | |
| Floating rate demand notes | $ | 5,880 |
| | $ | 6,146 |
| | | | | | | | | $ | 5,880 |
| | $ | 6,558 |
| | | | | | | | |
| Commercial paper | 3,749 |
| | 3,832 |
| | | | | | | | | 3,749 |
| | 3,645 |
| | | | | | | | |
| Other short-term debt | 4,213 |
| | 3,338 |
| | | | | | | | | 4,213 |
| | 2,515 |
| | | | | | | | |
| Asset-backed debt | 943 |
| | 985 |
| | | | | | | | | 943 |
| | 823 |
| | | | | | | | |
| Total short-term debt | 14,785 |
| | 14,301 |
| | 3.5 | % | | 3.1 | % | | 3.5 | % | | 3.1 | % | 14,785 |
| | 13,541 |
| | 3.5 | % | | 3.0 | % | | 3.5 | % | | 3.0 | % |
| Long-term debt | | | | | | | | | | | | | | | | | | | | | | |
| Unsecured debt | | | | | | | | | | | | | | | | | | | | | | |
| Notes payable within one year | 14,373 |
| | 13,387 |
| | | | | | | | | 14,373 |
| | 14,854 |
| | | | | | | | |
| Notes payable after one year | 52,409 |
| | 57,379 |
| | | | | | | | | 52,409 |
| | 55,651 |
| | | | | | | | |
| Asset-backed debt (a) | | | | | | | | | | | | | | | | | | | | | | |
| Notes payable within one year | 22,130 |
| | 22,836 |
| | | | | | | | | 22,130 |
| | 24,496 |
| | | | | | | | |
| Notes payable after one year | 36,844 |
| | 33,248 |
| | | | | | | | | 36,844 |
| | 30,209 |
| | | | | | | | |
| Unamortized discount | 2 |
| | — |
| | | | | | | | | 2 |
| | (2 | ) | | | | | | | | |
| Unamortized issuance costs | (211 | ) | | (224 | ) | | | | | | | | | (211 | ) | | (219 | ) | | | | | | | | |
| Fair value adjustments (b) | (186 | ) | | 543 |
| | | | | | | | | (186 | ) | | 744 |
| | | | | | | | |
| Total long-term debt | 125,361 |
| | 127,169 |
| | 2.8 | % | | 3.0 | % | | 2.8 | % | | 3.0 | % | 125,361 |
| | 125,733 |
| | 2.8 | % | | 3.0 | % | | 2.8 | % | | 3.0 | % |
| Total debt | $ | 140,146 |
| | $ | 141,470 |
| | 2.8 | % | | 3.0 | % | | 2.9 | % | | 3.1 | % | $ | 140,146 |
| | $ | 139,274 |
| | 2.8 | % | | 3.0 | % | | 2.9 | % | | 3.0 | % |
| | | | | | | | | | | | | | | | | | | | | | | |
| Fair value of debt (c) | $ | 138,888 |
| | $ | 142,775 |
| | | | | | | | | $ | 138,888 |
| | $ | 140,110 |
| | | | | | | | |
__________
| |
| (a) | Asset-backed debt issued in securitizations is the obligation of the consolidated securitization entity that issued the debt and is payable only out of collections on the underlying securitized assets and related enhancements. This asset-backed debt is not the obligation of Ford Credit or our other subsidiaries. |
| |
| (b) | These adjustments relate to designated fair value hedges. The carrying value of hedged debt was $38.0 billion and $39.4$39.3 billion at December 31, 2018 and JuneSeptember 30, 2019, respectively. |
| |
| (c) | The fair value of debt includes $13.8 billion and $13.3$12.7 billion of short-term debt at December 31, 2018 and JuneSeptember 30, 2019, respectively, carried at cost, which approximates fair value. All other debt is categorized within Level 2 of the fair value hierarchy. |
NOTE 12. ACCUMULATED OTHER COMPREHENSIVE INCOME / (LOSS)
The changes in the balance of Accumulated Other Comprehensive Income / (Loss) (“AOCI”) attributable to Ford Credit for the periods ended JuneSeptember 30 were as follows (in millions):
| | | | Second Quarter | | First Half | Third Quarter | | First Nine Months |
| | 2018 | | 2019 | | 2018 | | 2019 | 2018 | | 2019 | | 2018 | | 2019 |
| Beginning AOCI balance | $ | (306 | ) | | $ | (809 | ) | | $ | (419 | ) | | $ | (829 | ) | $ | (670 | ) | | $ | (801 | ) | | $ | (419 | ) | | $ | (829 | ) |
| Net gain / (loss) on foreign currency translation | (364 | ) | | 8 |
| | (251 | ) | | 28 |
| (49 | ) | | (210 | ) | | (300 | ) | | (182 | ) |
| Ending AOCI balance | $ | (670 | ) | | $ | (801 | ) | | $ | (670 | ) | | $ | (801 | ) | $ | (719 | ) | | $ | (1,011 | ) | | $ | (719 | ) | | $ | (1,011 | ) |
Item 1. Financial Statements (Continued)
FORD MOTOR CREDIT COMPANY LLC AND SUBSIDIARIES
NOTES TO THE FINANCIAL STATEMENTS
NOTE 13. OTHER INCOME, NET
Other income consists of various line items that are combined on the income statement due to their respective materiality compared with other individual income and expense items.
The amounts included in Other income, net for the periods ended JuneSeptember 30 were as follows (in millions):
| | | | Second Quarter | | First Half | Third Quarter | | First Nine Months |
| | 2018 | | 2019 | | 2018 | | 2019 | 2018 | | 2019 | | 2018 | | 2019 |
| Gains / (Losses) on derivatives | $ | (35 | ) | | $ | 178 |
| | $ | (122 | ) | | $ | — |
| $ | (60 | ) | | $ | (85 | ) | | $ | (182 | ) | | $ | (85 | ) |
| Currency revaluation gains / (losses) | (18 | ) | | (147 | ) | | 44 |
| | (16 | ) | 36 |
| | 52 |
| | 80 |
| | 36 |
|
| Interest and investment income | 49 |
| | 83 |
| | $ | 91 |
| | $ | 162 |
| 49 |
| | 88 |
| | $ | 140 |
| | $ | 250 |
|
| Other | 5 |
| | 10 |
| | 25 |
| | 37 |
| 11 |
| | 5 |
| | 36 |
| | 42 |
|
| Total other income, net | $ | 1 |
| | $ | 124 |
| | $ | 38 |
| | $ | 183 |
| $ | 36 |
| | $ | 60 |
| | $ | 74 |
| | $ | 243 |
|
NOTE 14. SEGMENT INFORMATION
We conduct our financing operations directly and indirectly through our subsidiaries and affiliates. We offer substantially similar products and services throughout many different regions, subject to local legal restrictions and market conditions. We segment our business based on geographic regions: the Americas, Europe, and Asia Pacific. Items excluded in assessing segment performance because they are managed at the corporate level, including market valuation adjustments to derivatives and exchange-rate fluctuations on foreign currency-denominated transactions, are reflected in Unallocated Other. The following is a brief description of our segments:
Americas segment – United States, Canada, Mexico, Brazil, and Argentina
Europe segment – European region and South Africa
Asia Pacific segment – China and India
Item 1. Financial Statements (Continued)
FORD MOTOR CREDIT COMPANY LLC AND SUBSIDIARIES
NOTES TO THE FINANCIAL STATEMENTS
NOTE 14. SEGMENT INFORMATION (Continued)
Key financial information for our business segments for the periods ended or at JuneSeptember 30 werewas as follows (in millions):
| | | | Americas | | Europe | | Asia Pacific | | Total Segments | | Unallocated Other (a) | | Total | Americas | | Europe | | Asia Pacific | | Total Segments | | Unallocated Other (a) | | Total |
| Second Quarter 2018 | | | | | | | | | | | | |
| Third Quarter 2018 | | | | | | | | | | | | |
| Total revenue | $ | 2,661 |
| | $ | 298 |
| | $ | 140 |
| | $ | 3,099 |
| | $ | — |
| | $ | 3,099 |
| $ | 2,677 |
| | $ | 284 |
| | $ | 120 |
| | $ | 3,081 |
| | $ | — |
| | $ | 3,081 |
|
| Income before income taxes | 548 |
| | 103 |
| | 27 |
| | 678 |
| | (33 | ) | | 645 |
| 556 |
| | 89 |
| | 13 |
| | 658 |
| | 20 |
| | 678 |
|
| Other disclosures: | | | | | | | | | | | | | | | | | | | | | | |
| Depreciation on vehicles subject to operating leases | 983 |
| | 3 |
| | — |
| | 986 |
| | — |
| | 986 |
| 924 |
| | 12 |
| | — |
| | 936 |
| | — |
| | 936 |
|
| Interest expense | 830 |
| | 76 |
| | 90 |
| | 996 |
| | 1 |
| | 997 |
| 848 |
| | 68 |
| | 75 |
| | 991 |
| | (2 | ) | | 989 |
|
| Provision for credit losses | 61 |
| | 8 |
| | — |
| | 69 |
| | — |
| | 69 |
| 116 |
| | 1 |
| | 10 |
| | 127 |
| | — |
| | 127 |
|
| | | | | | | | | | | | | | | | | | | | | | | |
| Second Quarter 2019 | | | | | | | | | | | | |
| Third Quarter 2019 | | | | | | | | | | | | |
| Total revenue | $ | 2,792 |
| | $ | 307 |
| | $ | 89 |
| | $ | 3,188 |
| | $ | — |
| | $ | 3,188 |
| $ | 2,764 |
| | $ | 286 |
| | $ | 77 |
| | $ | 3,127 |
| | $ | — |
| | $ | 3,127 |
|
| Income before income taxes | 608 |
| | 116 |
| | 15 |
| | 739 |
| | 92 |
| | 831 |
| 584 |
| | 82 |
| | 15 |
| | 681 |
| | 55 |
| | 736 |
|
| Other disclosures: | | | | | | | | | | | | | | | | | | | | | | |
| Depreciation on vehicles subject to operating leases | 885 |
| | 9 |
| | — |
| | 894 |
| | — |
| | 894 |
| 884 |
| | 10 |
| | — |
| | 894 |
| | — |
| | 894 |
|
| Interest expense | 979 |
| | 86 |
| | 51 |
| | 1,116 |
| | (2 | ) | | 1,114 |
| 951 |
| | 86 |
| | 43 |
| | 1,080 |
| | 1 |
| | 1,081 |
|
| Provision for credit losses | 54 |
| | 7 |
| | 2 |
| | 63 |
| | — |
| | 63 |
| 86 |
| | 6 |
| | 1 |
| | 93 |
| | — |
| | 93 |
|
| | | | | | | | | | | | | | | | | | | | | | | |
| First Half 2018 | | | | | | | | | | | | |
| First Nine Months 2018 | | | | | | | | | | | | |
| Total revenue | $ | 5,241 |
| | $ | 594 |
| | $ | 284 |
| | $ | 6,119 |
| | $ | — |
| | $ | 6,119 |
| $ | 7,918 |
| | $ | 878 |
| | $ | 404 |
| | $ | 9,200 |
| | $ | — |
| | $ | 9,200 |
|
| Income before income taxes | 1,063 |
| | 214 |
| | 73 |
| | 1,350 |
| | (64 | ) | | 1,286 |
| 1,619 |
| | 303 |
| | 86 |
| | 2,008 |
| | (44 | ) | | 1,964 |
|
| Other disclosures: | | | | | | | | | | | | | | | | | | | | | | |
| Depreciation on vehicles subject to operating leases | 2,031 |
| | 8 |
| | — |
| | 2,039 |
| | — |
| | 2,039 |
| 2,955 |
| | 20 |
| | — |
| | 2,975 |
| | — |
| | 2,975 |
|
| Interest expense | 1,582 |
| | 148 |
| | 181 |
| | 1,911 |
| | (2 | ) | | 1,909 |
| 2,430 |
| | 216 |
| | 256 |
| | 2,902 |
| | (4 | ) | | 2,898 |
|
| Provision for credit losses | 147 |
| | 13 |
| | 3 |
| | 163 |
| | — |
| | 163 |
| 263 |
| | 14 |
| | 13 |
| | 290 |
| | — |
| | 290 |
|
| Net finance receivables and net investment in operating leases | 119,611 |
| | 25,437 |
| | 6,405 |
| | 151,453 |
| | (8,246 | ) | | 143,207 |
| 120,425 |
| | 25,995 |
| | 5,720 |
| | 152,140 |
| | (8,526 | ) | | 143,614 |
|
| Total assets | 125,436 |
| | 27,391 |
| | 6,784 |
| | 159,611 |
| | — |
| | 159,611 |
| 128,103 |
| | 27,120 |
| | 6,023 |
| | 161,246 |
| | — |
| | 161,246 |
|
| | | | | | | | | | | | | | | | | | | | | | | |
| First Half 2019 | | | | | | | | | | | | |
| First Nine Months 2019 | | | | | | | | | | | | |
| Total revenue | $ | 5,585 |
| | $ | 610 |
| | $ | 187 |
| | $ | 6,382 |
| | $ | — |
| | $ | 6,382 |
| $ | 8,349 |
| | $ | 896 |
| | $ | 264 |
| | $ | 9,509 |
| | $ | — |
| | $ | 9,509 |
|
| Income before income taxes | 1,252 |
| | 232 |
| | 49 |
| | 1,533 |
| | 99 |
| | 1,632 |
| 1,836 |
| | 314 |
| | 64 |
| | 2,214 |
| | 154 |
| | 2,368 |
|
| Other disclosures: | | | | | | | | | | | | | | | | | | | | | | |
| Depreciation on vehicles subject to operating leases | 1,797 |
| | 21 |
| | — |
| | 1,818 |
| | — |
| | 1,818 |
| 2,681 |
| | 31 |
| | — |
| | 2,712 |
| | — |
| | 2,712 |
|
| Interest expense | 1,951 |
| | 166 |
| | 112 |
| | 2,229 |
| | 6 |
| | 2,235 |
| 2,902 |
| | 252 |
| | 155 |
| | 3,309 |
| | 7 |
| | 3,316 |
|
| Provision for credit losses | 92 |
| | 12 |
| | (8 | ) | | 96 |
| | — |
| | 96 |
| 178 |
| | 18 |
| | (7 | ) | | 189 |
| | — |
| | 189 |
|
| Net finance receivables and net investment in operating leases | 120,486 |
| | 27,224 |
| | 4,212 |
| | 151,922 |
| | (8,443 | ) | | 143,479 |
| 119,463 |
| | 25,518 |
| | 3,737 |
| | 148,718 |
| | (8,417 | ) | | 140,301 |
|
| Total assets | 130,735 |
| | 28,745 |
| | 4,538 |
| | 164,018 |
| | — |
| | 164,018 |
| 128,603 |
| | 28,185 |
| | 4,095 |
| | 160,883 |
| | — |
| | 160,883 |
|
__________
| |
| (a) | Net finance receivables and Net investment in operating leases include unearned interest supplements and residual support, allowance for credit losses, and other (primarily accumulated supplemental depreciation). |
Item 1. Financial Statements (Continued)
FORD MOTOR CREDIT COMPANY LLC AND SUBSIDIARIES
NOTES TO THE FINANCIAL STATEMENTS
NOTE 15. COMMITMENTS AND CONTINGENCIES
Commitments and contingencies primarily consist of lease commitments, guarantees and indemnifications, and litigation and claims.
Lease Commitments
We lease various land, buildings, and equipment under agreements that expire over various contractual periods ranging from less than one year to 11 years. Many of our leases contain one or more options to extend. We include options that we are reasonably certain to exercise in our evaluation of the lease term after considering all relevant economic and financial factors. The leased (“right-of-use”) assets in operating lease arrangements are presented in Other assets on our consolidated balance sheet.
We do not separate the non-lease components (e.g., maintenance and operating services) from the lease components to which they relate. Instead, non-lease components are included in the measurement of the lease liabilities. We calculate the initial lease liability as the present value of fixed payments not yet paid using the discount rate implicit in the lease. If the discount rate is not readily determinable, we use our incremental borrowing rate. Operating lease liabilities are reported in Other liabilities and deferred revenue. Variable payments are included in the lease liability if they are based on a market rate or an index (e.g., CPI). Variable payments that do not meet this criterion are expensed as incurred.
We have rental commitments for certain land, buildings, and equipment that expire over various contractual periods. Minimum non-cancelable operating lease commitments at December 31, 2018 were as follows (in millions):
|
| | | | | | | | | | | | | | | | | | | | | | | | | | | |
| | 2019 | | 2020 | | 2021 | | 2022 | | 2023 | | Thereafter | | Total |
| Minimum rentals on operating leases | $ | 19 |
| | $ | 14 |
| | $ | 11 |
| | $ | 10 |
| | $ | 9 |
| | $ | 34 |
| | $ | 97 |
|
The amounts contractually due on our operating lease liabilities at JuneSeptember 30, 2019 were as follows (in millions):
| | | | Within 1 year | | After 1 year and within 2 years | | After 2 years and within 3 years | | After 3 years and within 4 years | | After 4 years and within 5 years | | After 5 years | | Total | Within 1 year | | After 1 year and within 2 years | | After 2 years and within 3 years | | After 3 years and within 4 years | | After 4 years and within 5 years | | After 5 years | | Total |
| Operating lease | $ | 20 |
| | $ | 16 |
| | $ | 13 |
| | $ | 13 |
| | $ | 13 |
| | $ | 32 |
| | $ | 107 |
| $ | 19 |
| | $ | 15 |
| | $ | 13 |
| | $ | 13 |
| | $ | 12 |
| | $ | 29 |
| | $ | 101 |
|
| Less: Present value discount | | | | | | | | | | | | | (12 | ) | | | | | | | | | | | | | (11 | ) |
| Total operating lease liabilities | | | | | | | | | | |
| | $ | 95 |
| | | | | | | | | | |
| | $ | 90 |
|
Operating and variable lease expense for the secondthird quarter and first halfnine months of 2019 was $5 million and $11$16 million, respectively. The right-of-use assets obtained in exchange for operating lease liabilities for the secondthird quarter and first halfnine months of 2019 was $60 million and $17 million, respectively.
As of JuneSeptember 30, 2019, the weighted average remaining lease term for operating leases was seven years and the weighted average remaining discount rate for operating leases was 3.4%3.3%.
Guarantees and Indemnifications
Guarantees and indemnifications are recorded at fair value at their inception. We regularly review our performance risk under these arrangements, and in the event it becomes probable we will be required to perform under a guarantee or indemnity, the amount of probable payment is recorded.
The maximum potential payments under these guarantees and limited indemnities totaled $34 million and $54 million at both December 31, 2018 and JuneSeptember 30, 2019.2019, respectively. Of these values, $29 million and $49 million at both December 31, 2018 and JuneSeptember 30, 2019, respectively, were counter-guaranteed by Ford to us. There were no recorded liabilities related to guarantees and limited indemnities at December 31, 2018 or JuneSeptember 30, 2019.
Item 1. Financial Statements (Continued)
FORD MOTOR CREDIT COMPANY LLC AND SUBSIDIARIES
NOTES TO THE FINANCIAL STATEMENTS
NOTE 15. COMMITMENTS AND CONTINGENCIES (Continued)
In some cases, we have guaranteed debt and other financial obligations of outside third parties and unconsolidated affiliates, including Ford. Expiration dates vary, and guarantees will terminate on payment and/or cancellation of the underlying obligation. A payment by us would be triggered by failure of the guaranteed party to fulfill its obligation covered by the guarantee. In some circumstances, we are entitled to recover from a third party amounts paid by us under the guarantee. However, our ability to enforce these rights is sometimes stayed until the guaranteed party is paid in full, and may be limited in the event of insolvency of the third party or other circumstances.
In the ordinary course of business, we execute contracts involving indemnifications standard in the industry and indemnifications specific to a transaction. These indemnifications might include and are not limited to claims relating to any of the following: environmental, tax, and shareholder matters; intellectual property rights; governmental regulations and employment-related matters; dealer and other commercial contractual relationships; and financial matters, such as securitizations. Performance under these indemnities generally would be triggered by a breach of terms of the contract or by a third-party claim. While some of these indemnifications are limited in nature, many of them do not limit potential payment. Therefore, we are unable to estimate a maximum amount of future payments that could result from claims made under these unlimited indemnities.
Litigation and Claims
Various legal actions, proceedings, and claims (generally, “matters”) are pending or may be instituted or asserted against us. These include but are not limited to matters arising out of governmental regulations; tax matters; alleged illegal acts resulting in fines or penalties; financial services; employment-related matters; dealer and other contractual relationships; personal injury matters; investor matters; and financial reporting matters. Certain of the pending legal actions are, or purport to be, class actions. Some of the matters involve or may involve claims for compensatory, punitive, or antitrust or other treble damages in very large amounts, sanctions, assessments, or other relief, which, if granted, would require very large expenditures.
The extent of our financial exposure to these matters is difficult to estimate. Many matters do not specify a dollar amount for damages, and many others specify only a jurisdictional minimum. To the extent an amount is asserted, our historical experience suggests that in most instances the amount asserted is not a reliable indicator of the ultimate outcome.
We accrue for matters when losses are deemed probable and reasonably estimable. In evaluating matters for accrual and disclosure purposes, we take into consideration factors such as our historical experience with matters of a similar nature, the specific facts and circumstances asserted, the likelihood that we will prevail, and the severity of any potential loss. We reevaluate and update our accruals as matters progress over time.
For nearly all of our matters where our historical experience with similar matters is of limited value (i.e., “non-pattern matters”), we evaluate the matters primarily based on the individual facts and circumstances. For non-pattern matters, we evaluate whether there is a reasonable possibility of a material loss in excess of any accrual that can be estimated. It is reasonably possible that some of the matters for which accruals have not been established could be decided unfavorably and could require us to pay damages or make other expenditures. On January 9, 2019, FCE Bank plc (“FCE”) received a decision from the Italian Competition Authority, which included an assessment of a fine against FCE in the amount of about $50 million.€42 million (equivalent to $45 million at September 30, 2019). On March 8, 2019, FCE appealed the decision and the fine with the ultimate resolution of the matter
potentially taking several years. While we have determined that an adverse outcome is not probable, the reasonably possible loss could be up to the fine amount.
As noted, the litigation process is subject to many uncertainties, and the outcome of individual matters is not predictable with assurance. Our assessments are based on our knowledge and experience, but the ultimate outcome of any matter could require payment substantially in excess of the amount that we have accrued and/or disclosed.
ITEM 2. Management’s Discussion and Analysis of Financial Condition and Results of Operations.
Results of Operations
OverviewDefinitions and Information Regarding Causal Factors
In general, we measure year-over-year changes in EBT using the causal factors listed below:
| |
| • | Volume and Mix – Volume and Mix are primarily reflected within Net financing margin on the income statement. |
| |
| ◦ | Volume primarily measures changes in net financing margin driven by changes in average managed receivables at prior period financing margin yield (defined below in financing margin) at prior period exchange rates. Volume changes are primarily driven by the volume of new and used vehicle salesvehicles sold and leases,leased, the extent to which we purchase retail installment sale and finance lease contracts (retail financing) and operating lease contracts, the extent to which we provide wholesale financing, the sales price of the vehicles financed, the level of dealer inventories, Ford-sponsored special financing programs available exclusively through us, and the availability of cost-effective funding. |
| |
| ◦ | Mix primarily measures changes in net financing margin driven by period-over-period changes in the composition of our average managed receivables by product within each region. |
| |
| • | Financing Margin – Financing Margin is reflected within Net financing margin on the income statement. |
| |
| ◦ | Financing margin variance is the period-to-period change in financing margin yield multiplied by the present period average managed receivables at prior period exchange rates. This calculation is performed at the product and country level and then aggregated. Financing margin yield equals revenue, less interest expense and scheduled depreciation for the period, divided by average managed receivables for the same period. |
| |
| ◦ | Financing margin changes are driven by changes in revenue and interest expense. Changes in revenue are primarily driven by the level of market interest rates, cost assumptions in pricing, mix of business, and competitive environment. Changes in interest expense are primarily driven by the level of market interest rates, borrowing spreads, and asset-liability management. |
| |
| • | Credit Loss – Credit Loss is reflected within the Provision for credit losses on the income statement. |
| |
| ◦ | Credit loss is the change in the provision for credit losses at prior period exchange rates. For analysis purposes, management splits the provision for credit losses into net charge-offs and the change in the allowance for credit losses. |
| |
| ◦ | Net charge-off changes are primarily driven by the number of repossessions, severity per repossession, and recoveries. Changes in the allowance for credit losses are primarily driven by changes in historical trends in credit losses and recoveries, changes in the composition and size of our present portfolio, changes in trends in historical used vehicle values, and changes in economic conditions. |
| |
| ◦ | As of January 1, 2019, we changed our accounting method for reporting early termination losses related to customer defaults on operating leases. Prior to the first quarter of 2019, we presented the early termination loss reserve on operating leases due to customer default events as part of the allowance for credit losses which reduces Net investment in operating leases on the balance sheet. On the income statement, the incurred losses were included in Provision for credit losses. We now consider the effects of operating lease early terminations when determining depreciation estimates, which are included as part of accumulated depreciation within Net investment in operating leases on the balance sheet, and Depreciation on vehicles subject to operating leases on the income statement. We believe this change in accounting method is preferable as the characterization of these changes is better reflected as depreciation. We have reclassified prior period amounts to reflect these changes. For additional information, refer to the “Critical Accounting Estimates - Allowance for Credit Losses” section of Item 7 of Part II of our 2018 Form 10-K Report. |
Item 2. Management’s Discussion and Analysis of Financial Condition and Results of Operations (Continued)
| |
| • | Lease Residual – Lease Residual is primarily reflected within Depreciation on vehicles subject to operating leases on the income statement. |
| |
| ◦ | Lease residual measures changes to residual performance at prior period exchange rates. For analysis purposes, management splits residual performance primarily into residual gains and losses, and the change in accumulated supplemental depreciation. |
| |
| ◦ | Residual gain and loss changes are primarily driven by the number of vehicles returned to us and sold, and the difference between the auction value and the depreciated value (which includes both base and accumulated supplemental depreciation) of the vehicles sold. Changes in accumulated supplemental depreciation are primarily driven by changes in our estimate of the expected auction value at the end of the lease term, and changes in our estimate of the number of vehicles that will be returned to us and sold. With the change in accounting method discussed above, Depreciation on vehicles subject to operating leases now reflects early termination losses on operating leases due to customer default events for all periods presented. For additional information, refer to the “Critical Accounting Estimates” section of Item 7 of Part II of our 2018 Form 10-K Report. |
| |
| • | Exchange – Reflects changes in EBT driven by the effects of converting functional currency income to U.S. dollars. |
| |
| • | Other – Primarily includes Operating expenses, Other revenue, Insurance expenses, and Other income, net on the income statement at prior period exchange rates. |
| |
| ◦ | Changes in operating expenses are primarily driven by salaried personnel costs, facilities costs, and costs associated with the origination and servicing of customer contracts. |
| |
| ◦ | In general, other income changes are primarily driven by changes in earnings related to market valuation adjustments to derivatives (primarily related to movements in interest rates), which are included in unallocated risk management, and other miscellaneous items. |
In addition, the following definitions and calculations apply to the chartstables contained in Item 2 of this report:
| |
| • | Cash (as shown onin the Funding Structure, Liquidity, Sources, and Leverage charts)tables) – Cash and cash equivalents and Marketable securities reported on Ford Credit’s balance sheet, excluding amounts related to insurance activities |
| |
| • | Earnings Before Taxes (EBT) – Reflects Income before income taxes as reported on Ford Credit’s income statement
|
| |
• | Return on Equity (ROE) (as shown on the Key Metrics chart) – Reflects return on equity calculated by annualizing net income for the period and dividing by monthly average equity for the period
|
| |
• | Securitizations (as shown on the Public Term Funding Plan chart) – Public securitization transactions, Rule 144A offerings sponsored by Ford Credit, and widely distributed offerings by Ford Credit Canada
|
| |
• | Securitization Cash (as shown on the Liquidity Sources chart) – Cash held for the benefit of the securitization investors (for example, a reserve fund)
|
| |
• | Term Asset-Backed Securities (as shown on the Funding Structure chart) – Obligations issued in securitization transactions that are payable only out of collections on the underlying securitized assets and related enhancements
|
| |
• | Total Debt (as shown onin the Key Metrics and Leverage chart)tables) – Debt on Ford Credit’s balance sheet. Includes debt issued in securitizations and payable only out of collections on the underlying securitized assets and related enhancements. Ford Credit holds the right to receive the excess cash flows not needed to pay the debt issued by, and other obligations of, the securitization entities that are parties to those securitization transactions
|
| |
| • | Earnings Before Taxes (EBT) – Reflects Income before income taxes as reported on Ford Credit’s income statement |
| |
| • | Return on Equity (ROE) (as shown in the Key Metrics table) – Reflects return on equity calculated by annualizing net income for the period and dividing by monthly average equity for the period |
| |
| • | Securitizations (as shown in the Public Term Funding Plan table) – Public securitization transactions, Rule 144A offerings sponsored by Ford Credit, and widely distributed offerings by Ford Credit Canada |
| |
| • | Securitization Cash (as shown in the Liquidity table) – Cash held for the benefit of the securitization investors (for example, a reserve fund) |
| |
| • | Term Asset-Backed Securities (as shown in the Funding Structure table) – Obligations issued in securitization transactions that are payable only out of collections on the underlying securitized assets and related enhancements |
Item 2. Management’s Discussion and Analysis of Financial Condition and Results of Operations (Continued)
| |
| • | Total Net Receivables (as shown onin the Total Net Receivables Reconciliation To Managed Receivables chart)Key Metrics and Financial Condition tables) – Includes finance receivables (retail financing and wholesale) sold for legal purposes and net investment in operating leases included in securitization transactions that do not satisfy the requirements for accounting sale treatment. These receivables and operating leases are reported on Ford Credit’s balance sheet and are available only for payment of the debt issued by, and other obligations of, the securitization entities that are parties to those securitization transactions; they are not available to pay the other obligations of Ford Credit or the claims of Ford Credit’s other creditors |
| |
| • | Unallocated Other (as shown onin the EBT by Segment chart)Results table) – Items excluded in assessing segment performance because they are managed at the corporate level, including market valuation adjustments to derivatives and exchange-rate fluctuations on foreign currency-denominated transactions |
Item 2. Management’s Discussion and Analysis of Financial Condition and Results of Operations (Continued)
Key Metrics
|
| | | | | | | | | | | | | | | | | | | | | | | |
| | Third Quarter | | First Nine Months |
| GAAP Financial Measures | 2018 | | 2019 | | H / (L) | | 2018 | | 2019 | | H / (L) |
| Net Receivables (billions) | $ | 144 |
| | $ | 140 |
| | (3 | )% | | $ | 144 |
| | $ | 140 |
| | (3 | )% |
| Loss-to-Receivables (bps) (a) | 51 |
| | 51 |
| | — |
| | 50 |
| | 48 |
| | (2 | ) |
| Auction Values (b) | $ | 19,190 |
| | $ | 18,865 |
| | (2 | )% | | $ | 18,415 |
| | $ | 18,160 |
| | (1 | )% |
| EBT (millions) | $ | 678 |
| | $ | 736 |
| | $ | 58 |
| | $ | 1,964 |
| | $ | 2,368 |
| | $ | 404 |
|
| ROE (%) | 13 | % | | 15 | % | | 2 ppts |
| | 14 | % | | 16 | % | | 2 ppts |
|
| | | | | | | | | | | | |
| Other Balance Sheet Metrics | | | | | | | | | | | |
| Debt (billions) | | | | | | | $ | 138 |
| | $ | 139 |
| | 1 | % |
| Net Liquidity (billions) | | | | | | | $ | 29 |
| | $ | 35 |
| | 22 | % |
| Financial Statement Leverage (to 1) | | | | | | 9.1 |
| | 9.8 |
| | 0.7 |
|
__________
| |
| (a) | U.S. Retail financing only, previously included both retail financing and operating leases |
| |
| (b) | U.S. 36-month off-lease third quarter auction values at 3Q 2019 mix and YTD amounts at 2019 YTD mix |
Second Quarter 2019 Compared with Second Quarter 2018
|
| | | | | | | | | | | | | | | | |
| Non-GAAP Financial Measures | | | | | | | September 30, 2018 | | September 30, 2019 | | H / (L) |
| Managed Receivables (billions) (a) | | | | | | | $ | 152 |
| | $ | 149 |
| | (2 | )% |
| Managed Leverage (to 1) (b) | | | | | | | 8.4 |
| | 8.8 |
| | 0.4 |
|
The following chart shows our key metrics:__________
| |
| (a) | See “Financial Condition” section for reconciliation to GAAP |
| |
| (b) | See “Leverage” section for reconciliation to GAAP |
In the secondthird quarter of 2019, EBT was $831$736 million, $186$58 million higher compared withthan a year ago, and receivablesago. Receivables were about flat compared withlower than a year ago. Consumer credit metrics were healthy in the United States, with the loss-to-receivables ratio at 0.39%0.51%, which improved one basis point fromwas flat compared with a year ago. U.S. auction values were about flat compared with2% lower than a year ago, andslightly better than our expectations.
ROE was 16%15%, fourtwo percentage points higher compared with a year ago, primarily reflecting higher EBT. Our balance sheet remains strong with managed leverage within our target range of 8:1 to 9:1.
Item 2. Management’s Discussion and Analysis of Financial Condition and Results of Operations (Continued)
Third Quarter 2019 Compared with Third Quarter 2018
The following charttable shows the factors that contributed to the strong secondthird quarter EBT:EBT (in millions):
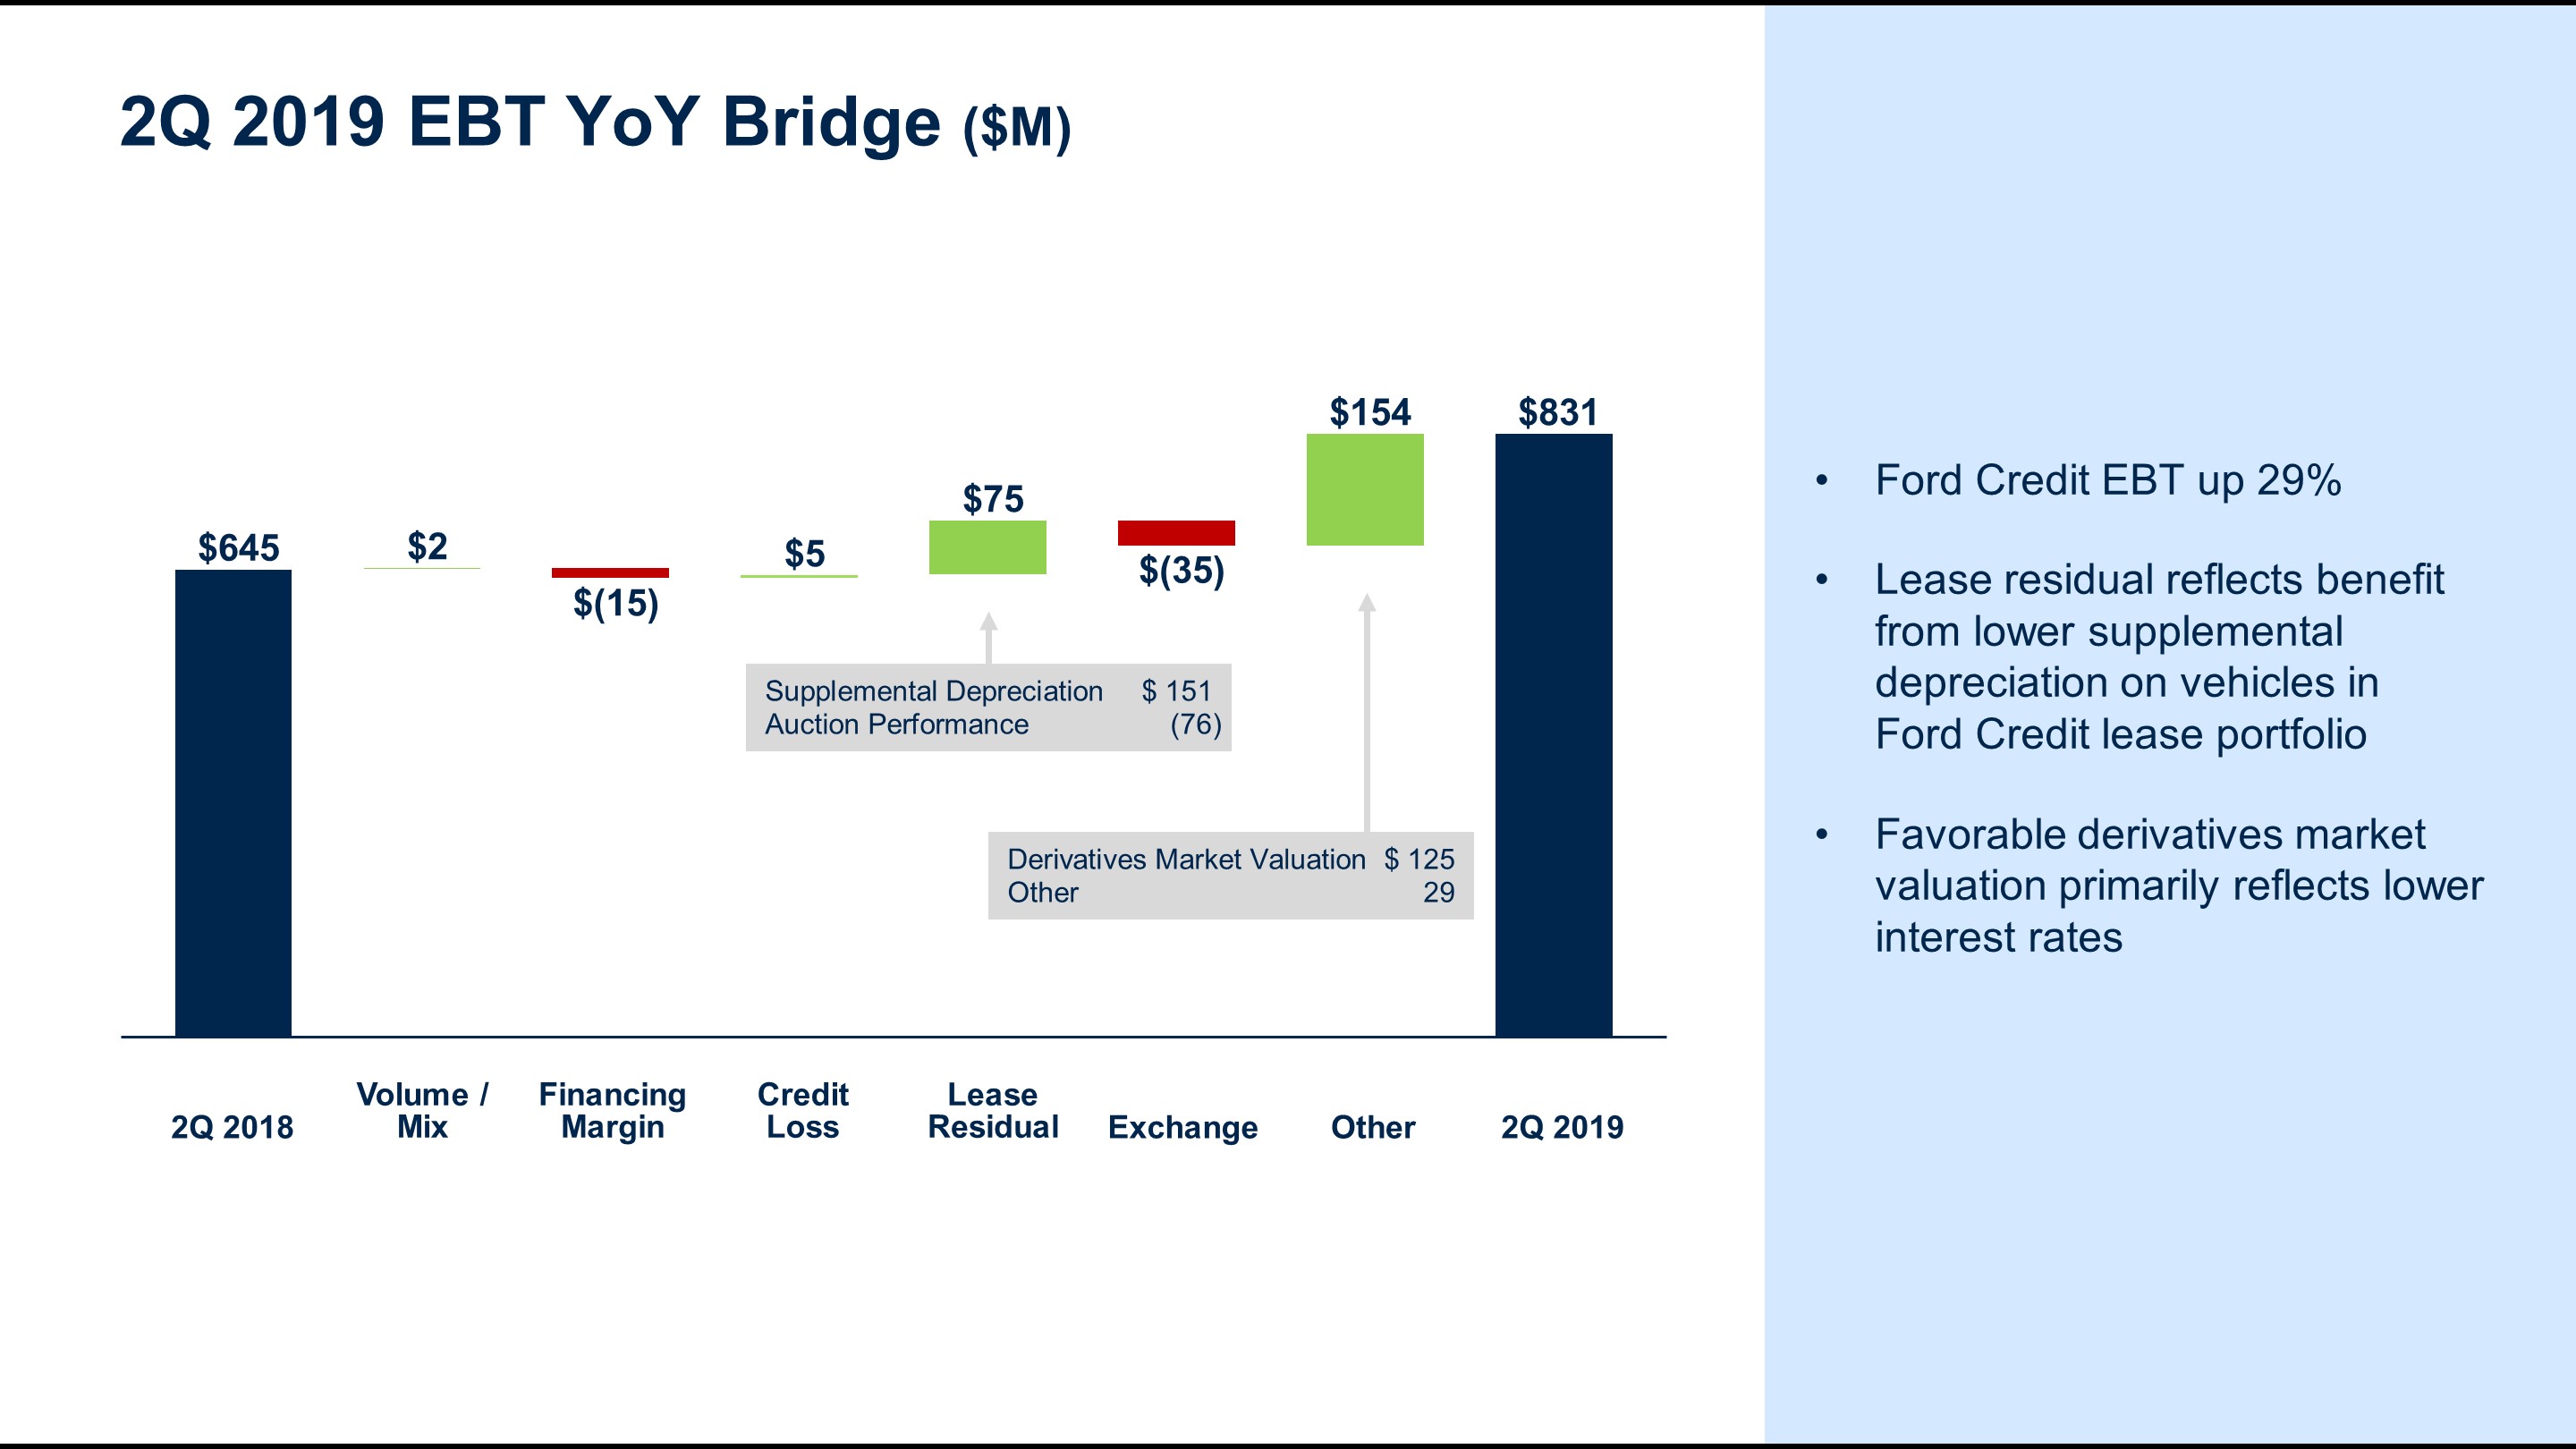
|
| | | | | | | | | | | | |
| Change in EBT by Causal Factor | | | | | | | | | |
| Third Quarter 2018 EBT | | | | | | | | | | $ | 678 |
|
| Volume / Mix | | | | | | | | | | (19 | ) |
| Financing Margin | | | | | | | | | | 5 |
|
| Credit Loss | | | | | | | | | | 34 |
|
| Lease Residual | | | | | | | | | | 6 |
|
| Exchange | | | | | | | | | | (8 | ) |
| Other | | | | | | | | | | 40 |
|
| Third Quarter 2019 EBT | | | | | | | | | | $ | 736 |
|
Our secondthird quarter 2019 EBT was $186$736 million, $58 million higher than a year ago, led by favorable derivatives market valuation and lease residualimproved operating costs, which are both reflected in other. Favorable credit loss performance partially offsetprimarily reflects the non-recurrence of a non-consumer loss recognized in the third quarter of 2018. Unfavorable volume and mix, which was driven by unfavorable exchange.lower receivables, was a partial offset.
Item 2. Management’s Discussion and Analysis of Financial Condition and Results of Operations (Continued)
Segment Results
We have three reportable segments in our consolidated financial statements that align with our management reporting structure and reflect the manner in which our Chief Operating Decision Maker manages our business, including resource allocation and performance assessment. These segments are: the Americas, Europe, and Asia Pacific. Items excluded in assessing segment performance, because they are managed at the corporate level, are reflected in Unallocated Other. Results of operations by segment and Unallocated Other for the periodperiods ended JuneSeptember 30 are shown below (in millions). :
|
| | | | | | | | | | | | | | | | | | | | | | | |
| | Third Quarter | | First Nine Months |
| | 2018 | | 2019 | | H / (L) | | 2018 | | 2019 | | H / (L) |
| Results | | | | | | | | | | | |
| Americas segment | $ | 556 |
| | $ | 584 |
| | $ | 28 |
| | $ | 1,619 |
| | $ | 1,836 |
| | $ | 217 |
|
| Europe segment | 89 |
| | 82 |
| | (7 | ) | | 303 |
| | 314 |
| | 11 |
|
| Asia Pacific segment | 13 |
| | 15 |
| | 2 |
| | 86 |
| | 64 |
| | (22 | ) |
| Total segments | $ | 658 |
| | $ | 681 |
| | $ | 23 |
| | $ | 2,008 |
| | $ | 2,214 |
| | $ | 206 |
|
| Unallocated other | 20 |
| | 55 |
| | 35 |
| | (44 | ) | | 154 |
| | 198 |
|
| Earnings before taxes | $ | 678 |
| | $ | 736 |
| | $ | 58 |
| | $ | 1,964 |
| | $ | 2,368 |
| | $ | 404 |
|
| (Provision for) / Benefit from income taxes | (160 | ) | | (165 | ) | | (5 | ) | | (266 | ) | | (581 | ) | | (315 | ) |
| Net Income | $ | 518 |
| | $ | 571 |
| | $ | 53 |
| | $ | 1,698 |
| | $ | 1,787 |
| | $ | 89 |
|
For additional information, see Note 14 of our Notes to the Financial Statements.
Our second quarter 2019 net income was $613 million, an increase of $134 million compared with a year ago, primarily reflecting higher EBT.
Americas segment
The Americas segment secondthird quarter 2019 EBT of $608$584 million was $60$28 million higher compared with secondthird quarter 2018, more than explained primarily by favorable credit loss performance, driven by the non-recurrence of a non-consumer loss recognized in the third quarter of 2018, and favorable operating lease residual performance.performance, partially offset by unfavorable volume and mix. Americas Segment first halfsegment EBT of $1.3$1.8 billion for the first nine months of 2019 was $189$217 million higher compared with a year ago, explained primarily by favorable operating lease residual and credit loss performance, partially offset by unfavorable financing margin.
Europe segment
The Europe segment secondthird quarter 2019 EBT of $116$82 million was $13$7 million higherlower compared with secondthird quarter 2018, explained primarily by unfavorable changes in lease residual value reserves and credit loss performance, partially offset by favorable volume and mix and lower operating costs, partially offset by unfavorable exchange.mix. Europe segment first half EBT of $232$314 million for the first nine months of 2019was $18$11 million higher compared with a year ago, explained primarily by favorable volume and mix, partially offset by unfavorable exchange.
Asia Pacific segment
The Asia Pacific segment secondthird quarter 2019 EBT of $15 million was $12$2 million lowerhigher compared with secondthird quarter 2018, more than explained primarily by favorable credit loss and financing margin performance, partially offset by unfavorable volume and mix. Asia Pacific segment first half EBT of $49$64 million for the first nine months of 2019 was $24$22 million lower compared with a year ago, more than explained primarily by unfavorable volume and mix.mix, partially offset by favorable credit loss and financing margin performance.
Unallocated Other
Unallocated Other was a $55 million gain for third quarter 2019, a $35 million improvement from third quarter 2018, reflecting favorable performance in market valuation adjustments to derivatives. Unallocated Other was a $154 million gain for the first nine months of 2019, a $198 million improvement compared with a year ago, reflecting favorable performance in market valuation adjustments to derivatives.
Item 2. Management’s Discussion and Analysis of Financial Condition and Results of Operations (Continued)
Unallocated Other
Unallocated Other was a $92 million gain for second quarter 2019, a $125 million improvement from second quarter 2018, reflecting favorable performance in market valuation adjustments to derivatives. Unallocated other was a $99 million gain for first half 2019, a $163 million improvement compared with a year ago, reflecting favorable performance in market valuation adjustments to derivatives.
Financing Shares and Contract Placement Volume
Our focus is on supporting Ford and Lincoln dealers and customers. This includes going to market with Ford and our dealers to support vehicle sales with financing products and marketing programs. Ford’s marketing programs may encourage or require Ford Credit financing and influence the financing choices customers make. As a result, our financing share, volume, and contract characteristics vary from period to period as Ford’s marketing programs change.
The following charttable shows our share in the United Statesretail financing and Canadaoperating lease share of new Ford and Lincoln brand vehicle retail installment, lease, andsales, wholesale financing share of new Ford and Lincoln brand vehicles acquired by dealers. Also shown is the Americas segment financingdealers (in percent), and contract placement volume for new and used vehicles. All data is for the periods ended June 30:vehicles (in thousands):
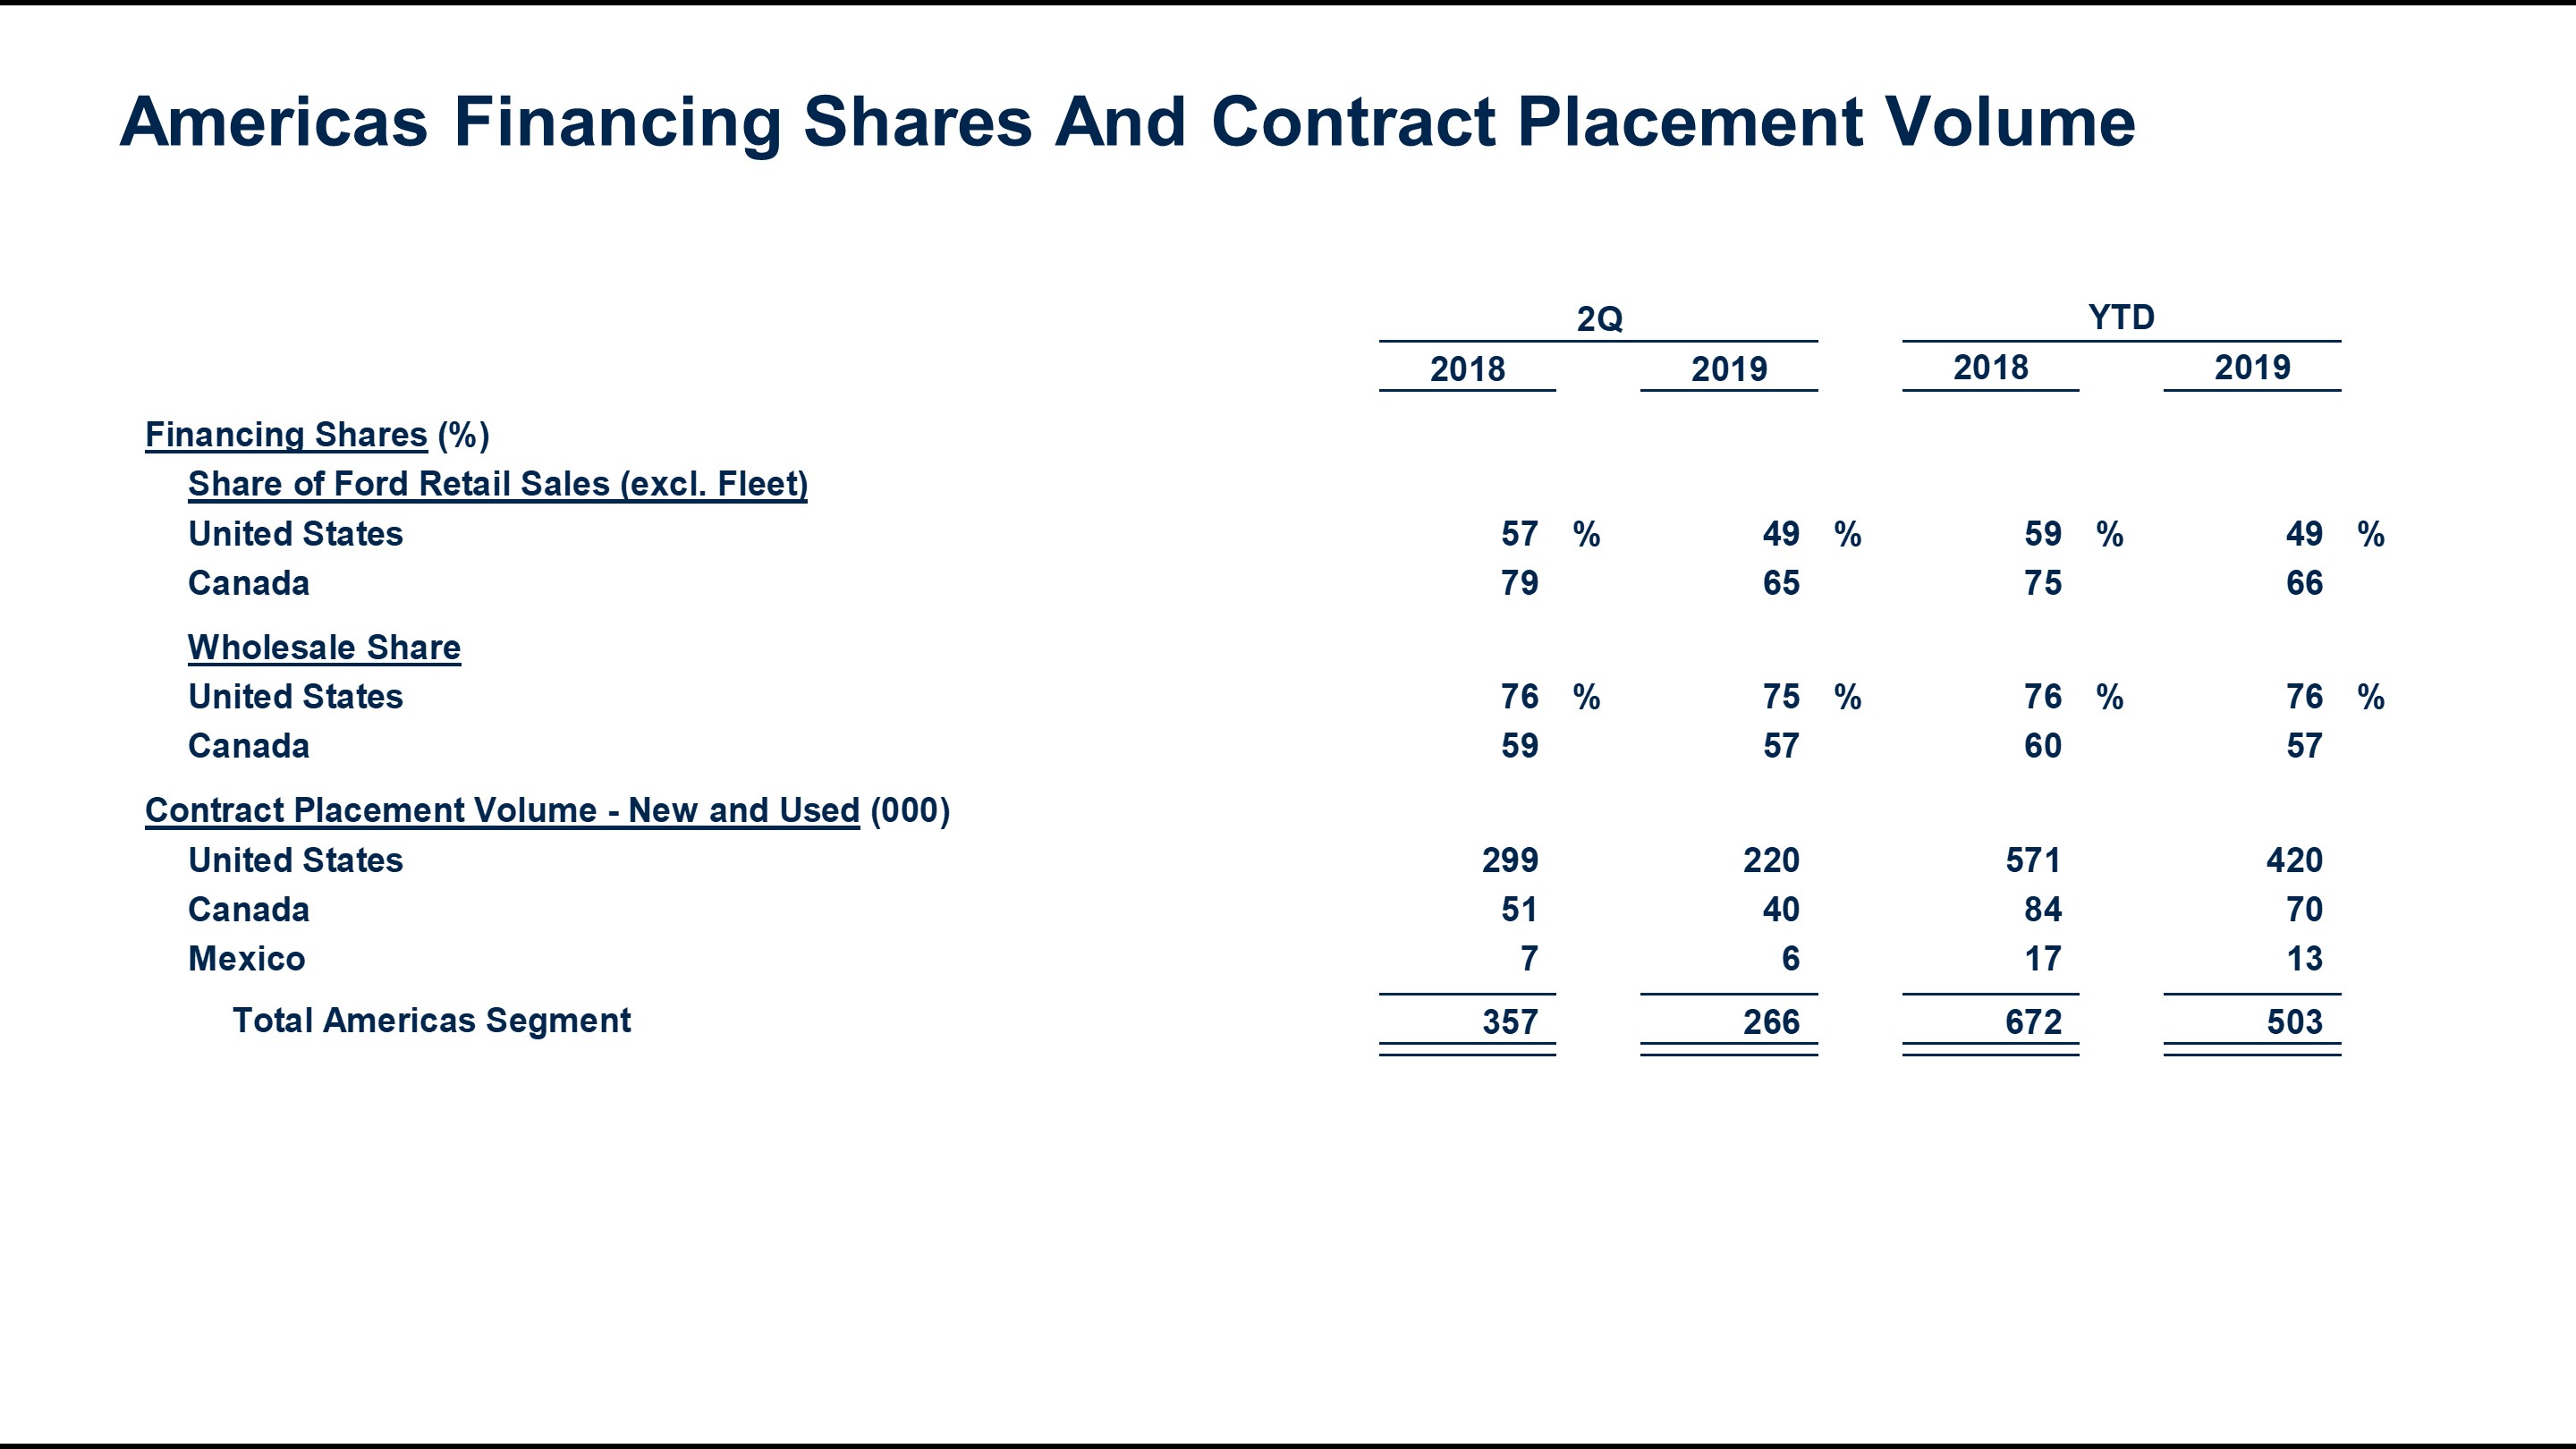
|
| | | | | | | | | | | | |
| | | Third Quarter | | First Nine Months |
| | | 2018 | | 2019 | | 2018 | | 2019 |
| Share of Ford and Lincoln Sales (a) | | | | | | | | |
| United States | | 59 | % | | 57 | % | | 59 | % | | 52 | % |
| Canada | | 69 |
| | 57 |
| | 73 |
| | 63 |
|
| U.K. | | 36 |
| | 40 |
| | 37 |
| | 39 |
|
| Germany | | 47 |
| | 44 |
| | 50 |
| | 47 |
|
| Total Europe segment | | 38 |
| | 37 |
| | 37 |
| | 37 |
|
| China | | 37 |
| | 35 |
| | 34 |
| | 34 |
|
| | | | | | | | | |
| Wholesale Share | | | | | | | | |
| United States | | 76 | % | | 76 | % | | 76 | % | | 76 | % |
| Canada | | 57 |
| | 57 |
| | 59 |
| | 57 |
|
| U.K. | | 100 |
| | 100 |
| | 100 |
| | 100 |
|
| Germany | | 94 |
| | 93 |
| | 93 |
| | 93 |
|
| Total Europe segment | | 99 |
| | 98 |
| | 98 |
| | 98 |
|
| China | | 64 |
| | 59 |
| | 61 |
| | 61 |
|
| | | | | | | | | |
| Contract Placement Volume - New and Used (000) | | | | | | |
| Americas segment | | 356 |
| | 318 |
| | 1,028 |
| | 821 |
|
| Europe segment | | 124 |
| | 121 |
| | 419 |
| | 393 |
|
| Asia Pacific segment | | 47 |
| | 27 |
| | 139 |
| | 86 |
|
| Total | | 527 |
| | 466 |
| | 1,586 |
| | 1,300 |
|
__________
| |
| (a) | United States and Canada exclude Fleet sales, other markets include Fleet |
In the secondthird quarter of 2019, Americas segment and Europe segment contract placement volume waswere down compared with a year ago, primarily reflecting lower financing share.
Item 2. Management’s Discussion and Analysis of Financial Condition and Results of Operations (Continued)
The following chart shows Europe’s share of new Ford brand vehicles sold and wholesale financing share of new Ford brand vehicles acquired by dealers. Also shown is Europe’s financing contract placement volume for new and used vehicles. All data is for the periods ended June 30:
In the second quarter of 2019, Europe segment contract placement volume was down compared with a year ago, primarily reflecting lower financing share.
Item 2. Management’s Discussion and Analysis of Financial Condition and Results of Operations (Continued)
The following chart shows Asia Pacific’s share of new Ford and Lincoln brand vehicles sold by dealers and wholesale financing share of new Ford and Lincoln brand vehicles acquired by dealers. Also shown is Asia Pacific’s financing contract placement volume for new and used vehicles. All data is for the periods ended June 30:
In the secondthird quarter of 2019, Asia Pacific segment contract placement volume was down compared with a year ago, more than explained by lower Ford sales in China.
Item 2. Management’s Discussion and Analysis of Financial Condition and Results of Operations (Continued)
Financial Condition
Finance Receivables and Operating Leases
Our receivables, including finance receivables and operating leases, were as follows:
Our operating lease portfolio is prudently managed and was 19% of total net receivables at June 30, 2019. Leasing is an important product, and our leasing strategy balances sales, share, residuals, and long-term profitability. Operating leases in the United States and Canada represent 98% of our total operating lease portfolio.
Item 2. Management’s Discussion and Analysis of Financial Condition and Results of Operations (Continued)
The following chart shows our reconciliation for our non-GAAP financial measure, managed receivables:
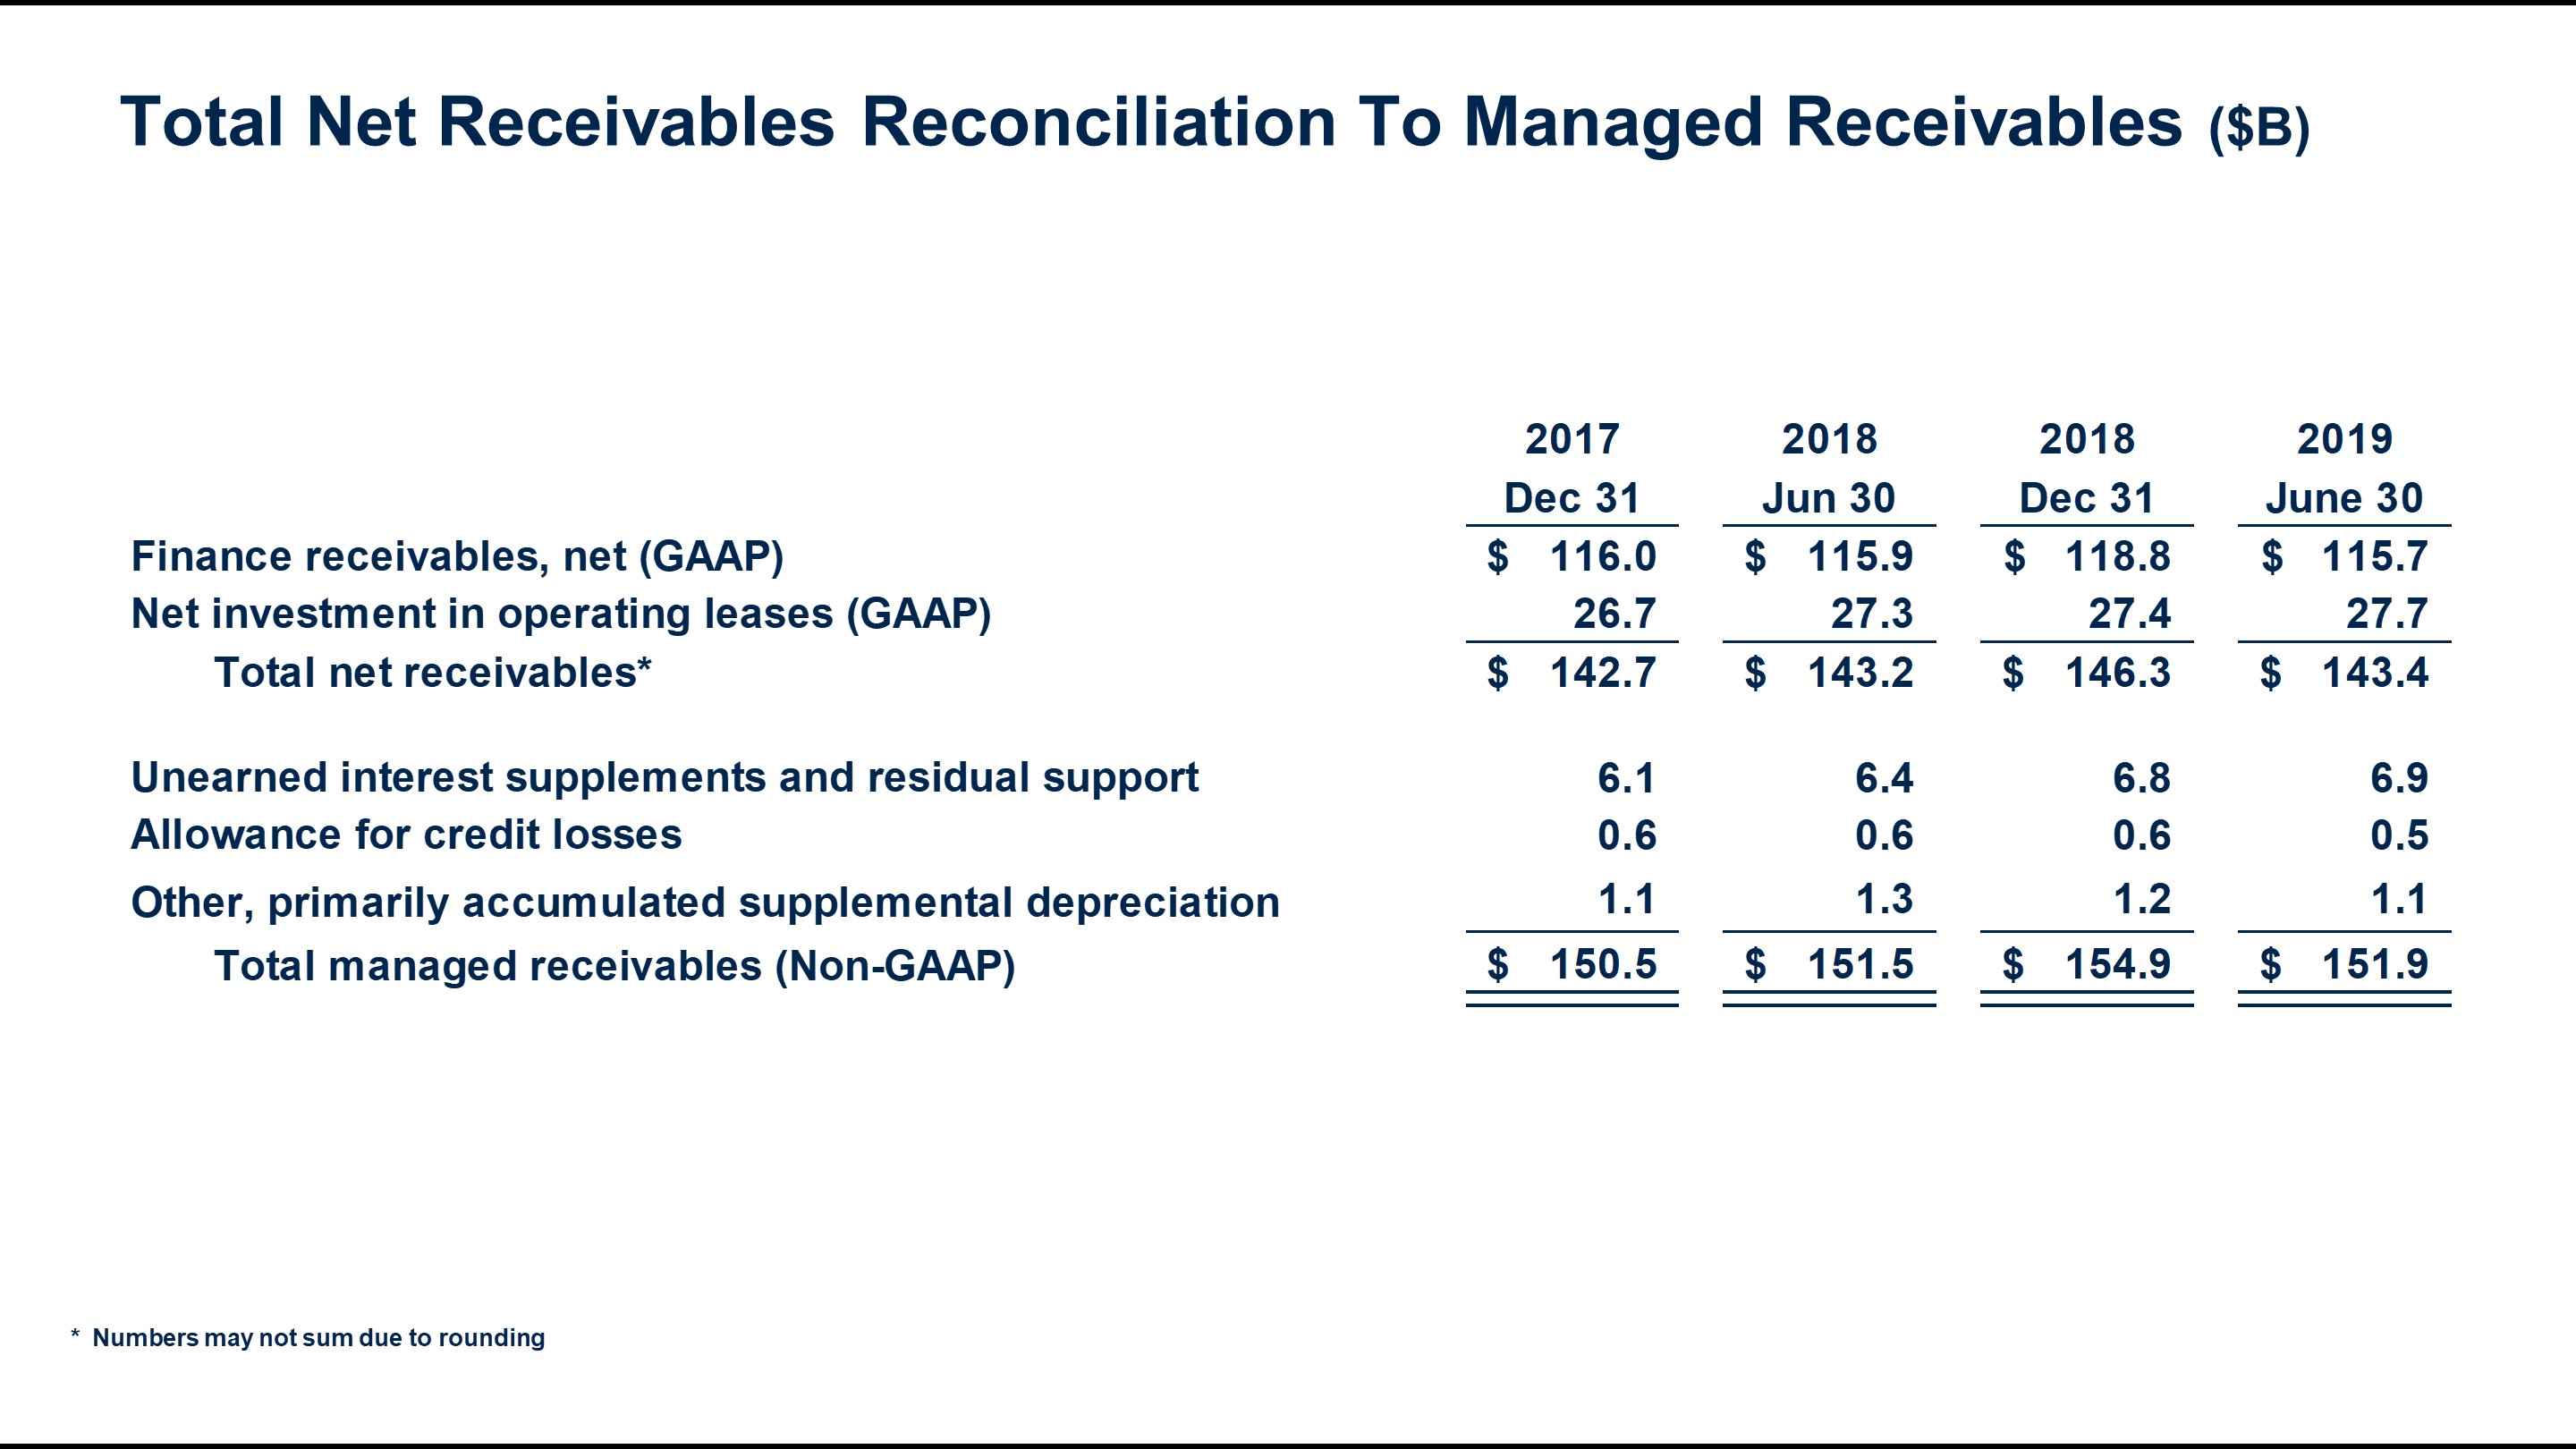
|
| | | | | | | | | | | |
| | September 30, 2018 | | December 31, 2018 | | September 30, 2019 |
| Net Receivables | | | | | |
| Americas Segment | | | | | |
| Consumer financing | $ | 56.7 |
| | $ | 56.5 |
| | $ | 55.2 |
|
| Non-Consumer financing | 28.9 |
| | 32.1 |
| | 29.6 |
|
| Net investment in operating leases | 27.1 |
| | 27.0 |
| | 27.0 |
|
| Total Americas Segment | $ | 112.7 |
| | $ | 115.6 |
| | $ | 111.8 |
|
| | | | | | |
| Europe Segment | | | | | |
| Consumer financing | $ | 15.5 |
| | $ | 15.5 |
| | $ | 15.4 |
|
| Non-Consumer financing | 9.4 |
| | 9.6 |
| | 9.0 |
|
| Net investment in operating leases | 0.5 |
| | 0.4 |
| | 0.5 |
|
| Total Europe Segment | $ | 25.4 |
| | $ | 25.5 |
| | $ | 24.9 |
|
| | | | | | |
| Asia Pacific Segment | | | | | |
| Consumer financing | $ | 4.0 |
| | $ | 3.8 |
| | $ | 2.8 |
|
| Non-Consumer financing | 1.5 |
| | 1.4 |
| | 0.8 |
|
| Net investment in operating leases | — |
| | — |
| | — |
|
| Total Asia Pacific Segment | $ | 5.5 |
| | $ | 5.2 |
| | $ | 3.6 |
|
| | | | | | |
| Total net receivables | $ | 143.6 |
| | $ | 146.3 |
| | $ | 140.3 |
|
| | | | | | |
| Managed Receivables | | | | | |
| Total net receivables (GAAP) | $ | 143.6 |
| | $ | 146.3 |
| | $ | 140.3 |
|
| Unearned interest supplements and residual support | 6.7 |
| | 6.8 |
| | 6.8 |
|
| Allowance for credit losses | 0.6 |
| | 0.6 |
| | 0.5 |
|
| Other, primarily accumulated supplemental depreciation | 1.2 |
| | 1.2 |
| | 1.1 |
|
| Total managed receivables (Non-GAAP) | $ | 152.1 |
| | $ | 154.9 |
| | $ | 148.7 |
|
| | | | | | |
| Americas Segment Lease Mix | | | | | |
| SUV / CUV | 55 | % | | 56 | % | | 57 | % |
| Truck | 27 |
| | 27 |
| | 30 |
|
| Car | 18 |
| | 17 |
| | 13 |
|
At December 31, 2017, JuneSeptember 30, 2018, December 31, 2018, and JuneSeptember 30, 2019, total net receivables includes consumer receivables before allowance for credit losses of $38.9 billion, $39.3$38.8 billion, $40.7 billion, and $39.3$37.8 billion, respectively, and non-consumer receivables before allowance for credit losses of $24.5 billion, $22.3$23.3 billion, $25.7 billion, and $25.1$24.0 billion, respectively, that have been sold for legal purposes in securitization transactions but continue to be reported in our consolidated financial statements. In addition, at December 31, 2017, JuneSeptember 30, 2018, December 31, 2018, and JuneSeptember 30, 2019, total net receivables includes net investment in operating leases of $11.5 billion, $12.2$12.4 billion, $16.3 billion, and $14.0$12.7 billion, respectively, that have been included in securitization transactions but continue to be reported in our consolidated financial statements. The receivables and net investment in operating leases are available only for payment of the debt issued by, and other obligations of, the securitization entities that are parties to those securitization transactions; they are not available to pay the other obligations or the claims of Ford Credit’s other creditors. Ford Credit holds the right to receive the excess cash flows not needed to pay the debt issued by, and other obligations of, the securitization entities that are parties to those securitization transactions. For additional information on our securitization transactions, refer to the “Securitization Transactions” and “On-Balance Sheet Arrangements” sections of Item 7 of Part II of our 2018 Form 10-K Report and Note 7 of our Notes to the Financial Statements for the period ended JuneSeptember 30, 2019.
Our operating lease portfolio is managed and was 20% of total net receivables at September 30, 2019. Leasing is an important product, and our leasing strategy balances sales, share, residuals, and long-term profitability. Operating leases in the United States and Canada represent 98% of our total operating lease portfolio.
Item 2. Management’s Discussion and Analysis of Financial Condition and Results of Operations (Continued)
Credit Risk
Credit risk is the possibility of loss from a customer’s or dealer’s failure to make payments according to contract terms. Credit losses are a normal part of a lending business, and credit risk has a significant impact on our business. We actively manage the credit risk of our consumer (retail financing) and non-consumer (dealer financing) receivables to balance our level of risk and return using our consistent underwriting standards, effective proprietary scoring system (discussed below), and world-class servicing. The allowance for credit losses (also referred to as the credit loss reserve) represents our estimate of the probable credit losses inherent in our finance receivables as of the balance sheet date. The allowance for credit losses is estimated using a combination of models and management judgment, and is based on such factors as historical loss performance, portfolio quality, and receivable levels. The adequacy of our allowance for credit losses is assessed quarterly and the assumptions and models used in establishing the allowance are evaluated regularly. A description of our allowance setting process is provided in the “Critical Accounting Estimates - Allowance for Credit Losses” section of Item 7 of Part II to our 2018 Form 10-K Report.
Most of our charge-offs are related to retail financing. Charge-offs are affected by the number of vehicle repossessions, the unpaid balance outstanding at the time of repossession, the auction price of repossessed vehicles, and other charge-offs. We also incur credit losses on our dealer financing, but default rates for these receivables historically have been substantially lower than those for retail financing. For additional information on severity, refer to the “Critical Accounting Estimates - Allowance for Credit Losses” section of Item 7 of Part II to our 2018 Form 10-K Report.
In purchasing retail installment and finance leasefinancing contracts, we use a proprietary scoring system that measures credit quality using information in the credit application, proposed contract terms, credit bureau data, and other information. After a proprietary risk score is generated, we decide whether to purchase a contract using a decision process based on a judgmental evaluation of the applicant, the credit application, the proposed contract terms, credit bureau information (e.g., FICO score), proprietary risk score, and other information. Our evaluation emphasizes the applicant’s ability to pay and creditworthiness focusing on payment, affordability, applicant credit history, and stability as key considerations. While FICO is a part of our scoring system, our models enable us to more effectively determine the probability that a customer will pay than using credit scores alone. When we originate business, our models project expected losses and we price accordingly. We ensure the business fits our risk appetite. For additional information on the quality of our receivables, see Note 4 of our Notes to the Financial Statements.
Item 2. Management’s Discussion and Analysis of Financial Condition and Results of Operations (Continued)
U.S. Origination Metrics
The following table shows U.S. retail financing and operating lease average placement FICO and higher risk portfolio mix metrics. Also shown are extended term mix and U.S. retail financing average placement terms.
|
| | | | | | | | | | | | |
| | | Third Quarter | | First Nine Months |
| | | 2018 | | 2019 | | 2018 | | 2019 |
| Origination Metrics | | | | | | | | |
| Average placement FICO | | 747 |
| | 750 |
| | 745 |
| | 746 |
|
| Higher risk portfolio mix | | 6 | % | | 6 | % | | 6 | % | | 6 | % |
| Greater than or equal to 84 months placement mix | | 4 | % | | 3 | % | | 4 | % | | 4 | % |
| Average placement term (months) | | 66 |
| | 66 |
| | 65 |
| | 65 |
|
Our third quarter 2019 average placement FICO score remained strong. We support customers across the credit spectrum. Our higher risk business, as classified at contract inception, consistently represents 6% of our portfolio and has been stable for over 10 years.
The following charts show quarterly trends for FICO, higher risk mix, and retail installment contract terms:
Our second quarter 2019 average placement FICO score remained strong.
Our average retail financing placement term was unchanged from a year ago, and retail financing contracts of 84 months and longer continued to be a relatively small part of our business. Ford Credit remains focused on managing the trade cycle –- building customer relationships and loyalty while offering financing products and terms customers want. Ford Credit origination and risk management processes deliver robust portfolio performance.
Item 2. Management’s Discussion and Analysis of Financial Condition and Results of Operations (Continued)
U.S. Retail Financing Credit Losses
The following charts showtable shows the primary drivers of credit losses in the U.S. retail financing business, which comprised 61%62% of our worldwide consumer finance receivables at JuneSeptember 30, 2019.
|
| | | | | | | | | | | | | | | | |
| | | Third Quarter | | First Nine Months |
| | | 2018 | | 2019 | | 2018 | | 2019 |
| Credit Loss Drivers | | | | | | | | |
| Over-60-Day delinquencies (excl. bankruptcies) | | 0.14 | % | | 0.14 | % | | 0.13 | % | | 0.12 | % |
| Reposessions (000) | | 7 |
| | 7 |
| | 21 |
| | 20 |
|
| Reposession ratio | | 1.26 | % | | 1.32 | % | | 1.28 | % | | 1.23 | % |
| Loss severity (000) (a) | | $ | 9.8 |
| | $ | 10.3 |
| | $ | 10.3 |
| | $ | 10.5 |
|
| Charge-offs (millions) | | $ | 61 |
| | $ | 61 |
| | $ | 178 |
| | $ | 171 |
|
| LTR ratio (b) | | 0.51 | % | | 0.51 | % | | 0.50 | % | | 0.48 | % |
| |
| (a) | The expected difference between the amount a customer owes when the finance contract is charged off and the amount received, net of expenses, from selling the repossessed vehicle |
(b) Loss-to-Receivables (“LTR”) ratios are charge-offs divided by average finance receivables.
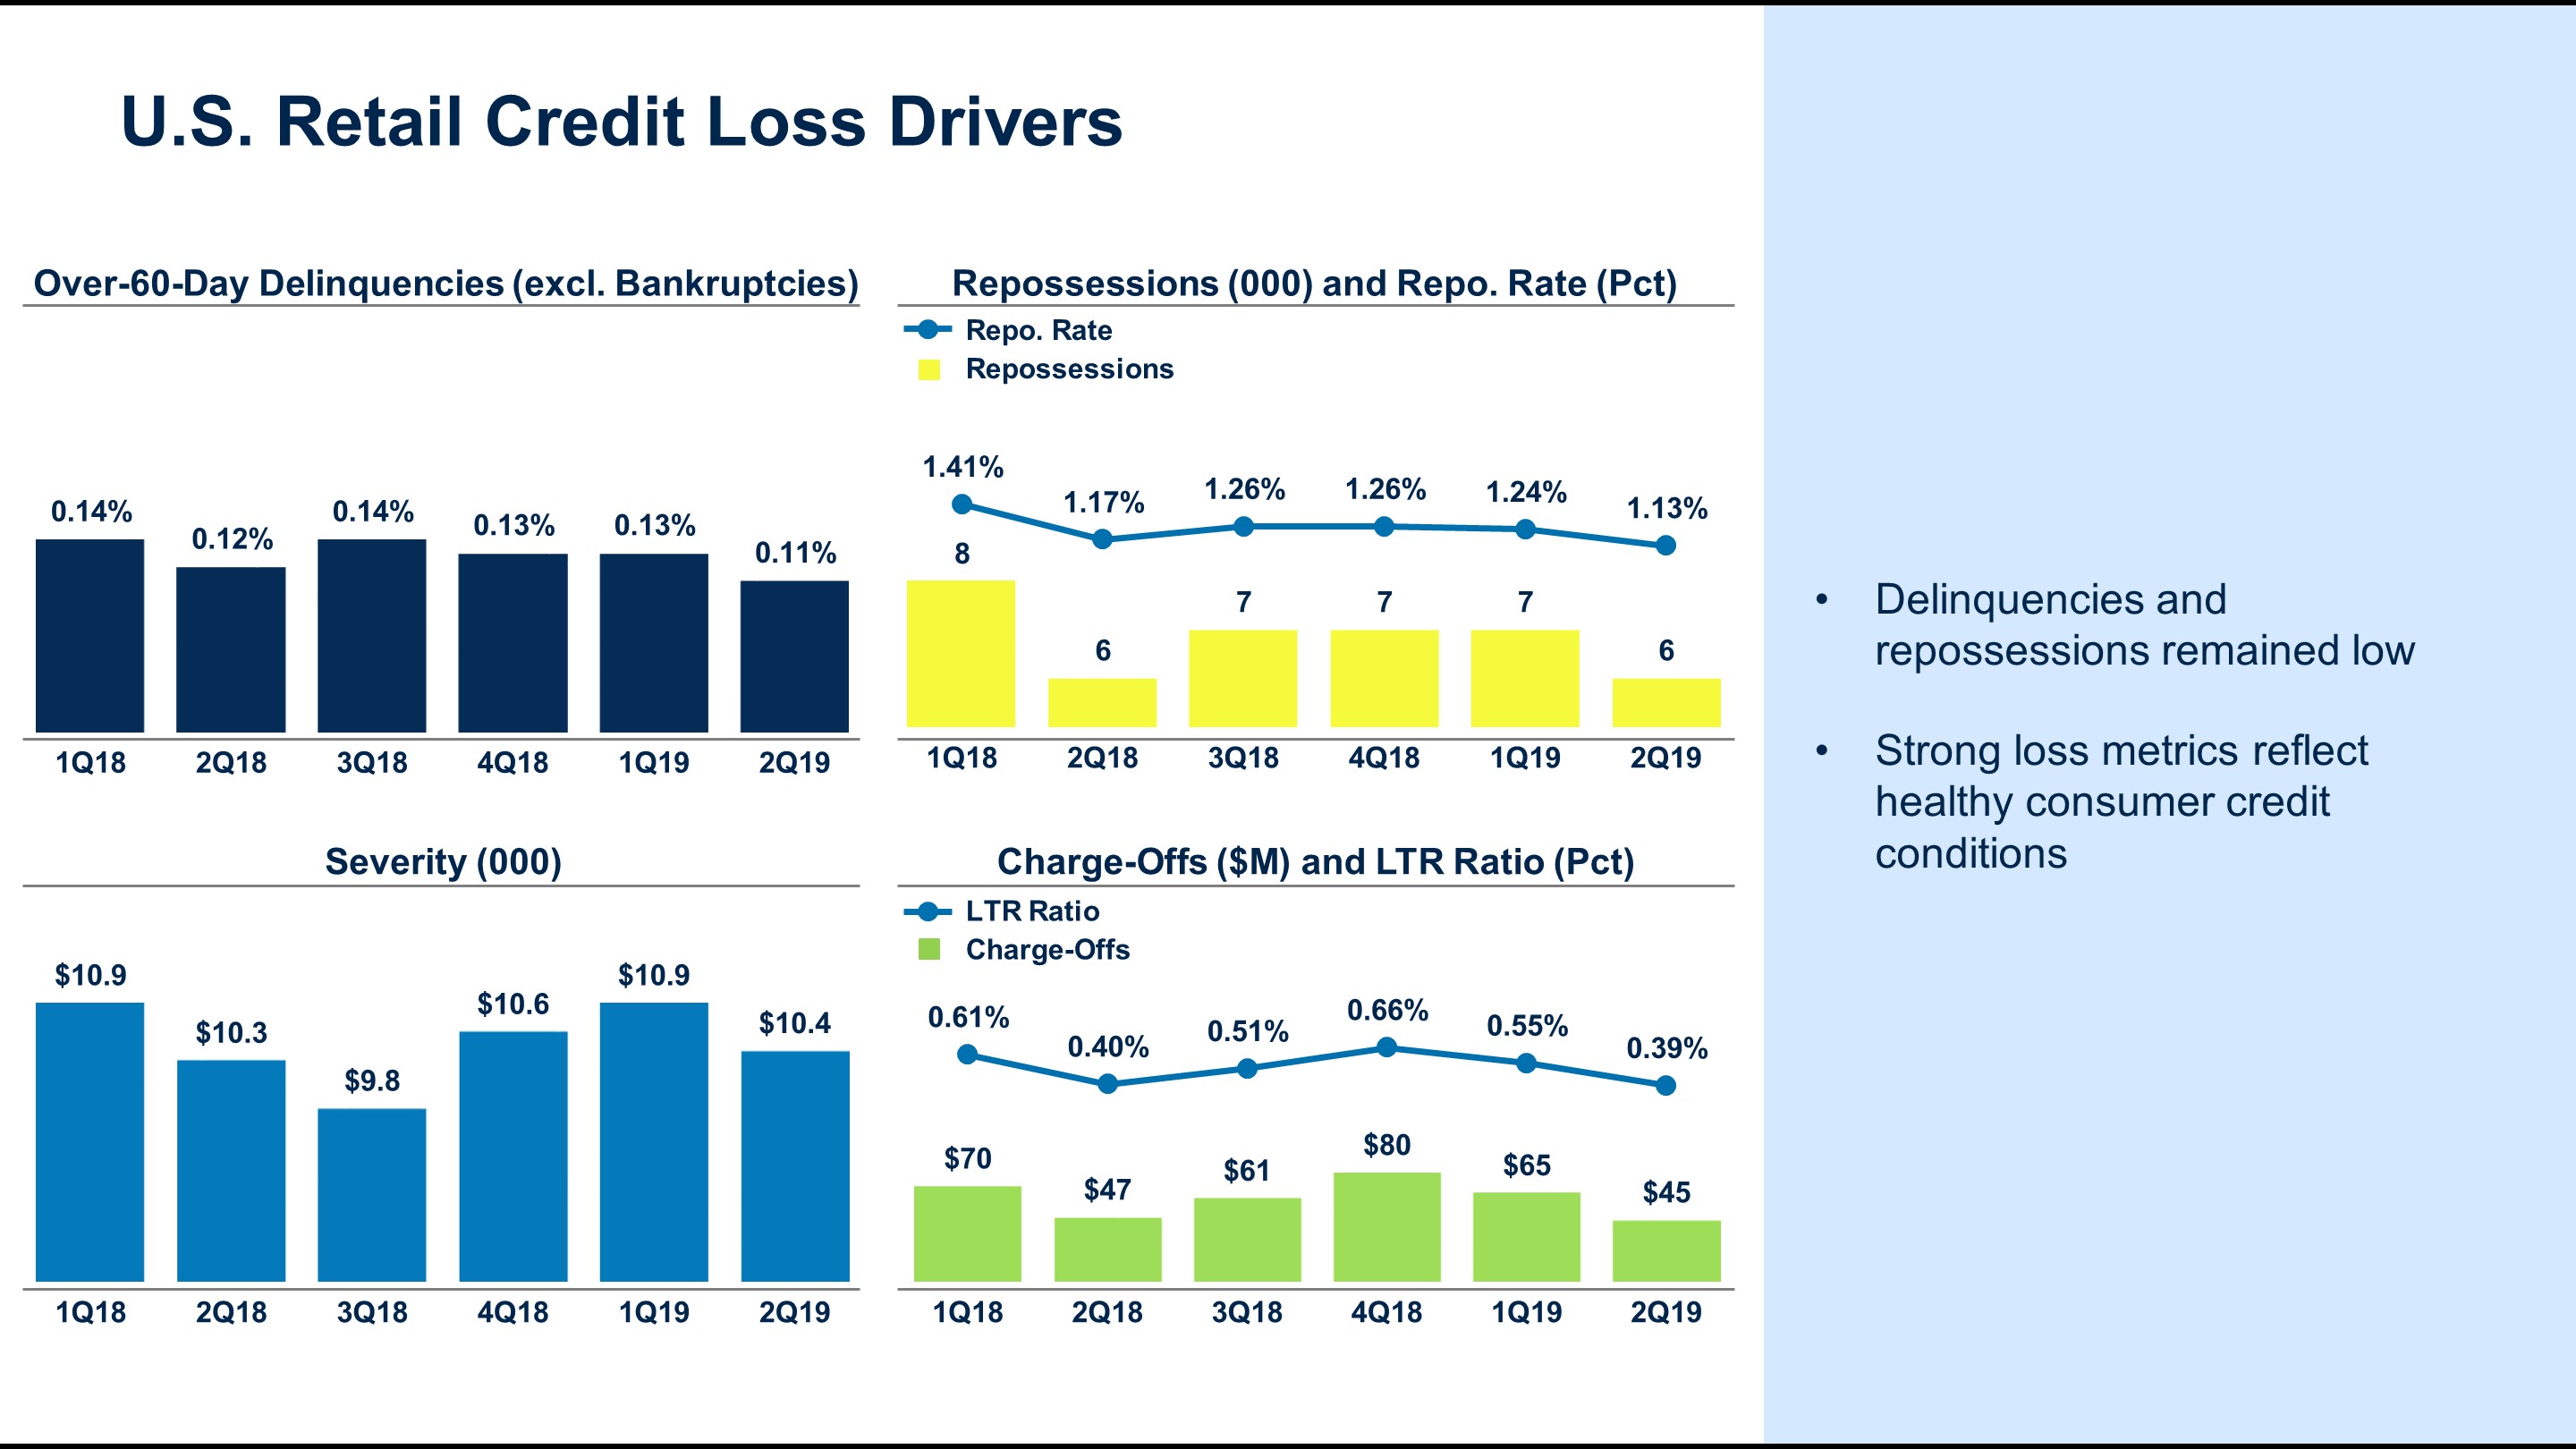
Compared with a year ago, third quarter delinquencies andwere flat, while the repossession rate have improved, whileand severity waswere slightly higher.
Our secondthird quarter 2019 charge-offs and LTR ratio improved fromwere flat compared with a year ago.
Credit loss metrics remained strong, reflecting a healthy business environment and consumer credit conditions.
Item 2. Management’s Discussion and Analysis of Financial Condition and Results of Operations (Continued)
Worldwide Credit Losses
The following charts show annual trends of charge-offs (credit losses, net of recoveries), LTR ratio,table shows key metrics related to worldwide credit loss reserve, and our credit loss reserve as a percentage of end-of-period (“EOP”) managed receivables:losses:
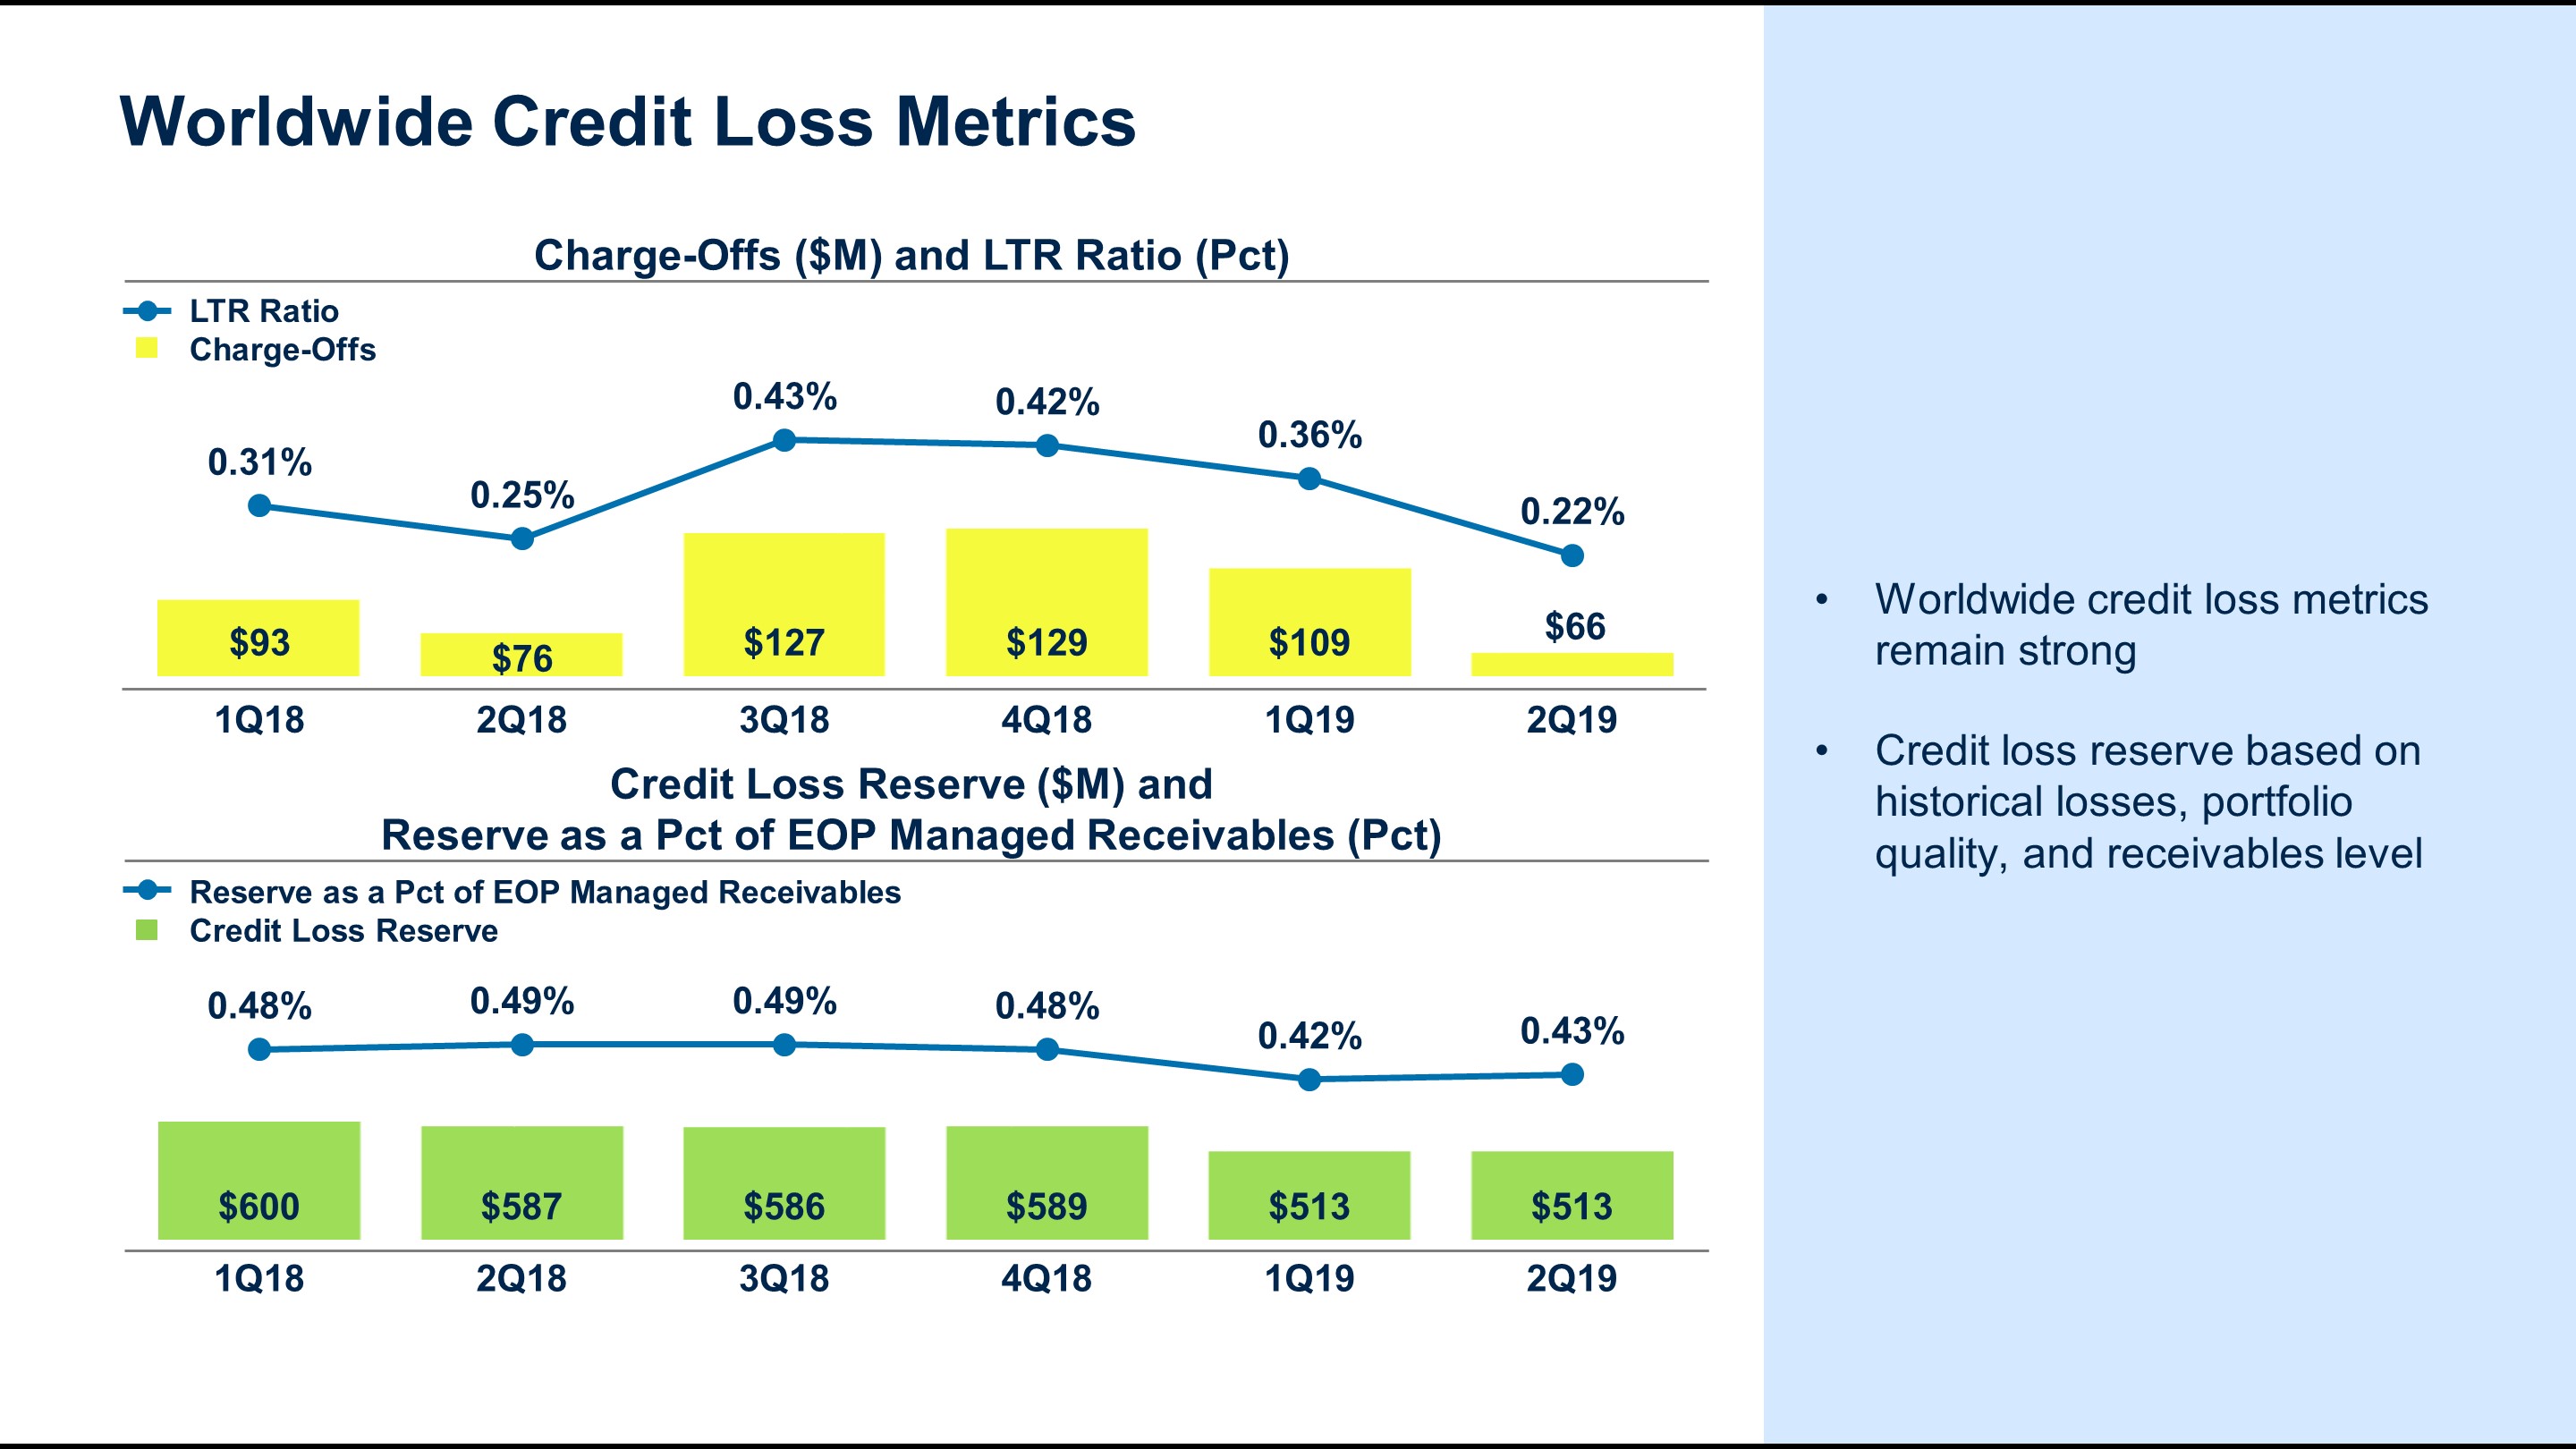
|
| | | | | | | | | | | | | | | | |
| | | Third Quarter | | First Nine Months |
| | | 2018 | | 2019 | | 2018 | | 2019 |
| Charge-offs (millions) | | $ | 127 |
| | $ | 89 |
| | $ | 296 |
| | $ | 264 |
|
| LTR ratio | | 0.43 | % | | 0.30 | % | | 0.33 | % | | 0.29 | % |
| Credit loss reserve (millions) | | $ | 586 |
| | $ | 513 |
| | $ | 586 |
| | $ | 513 |
|
| Reserve as percent of EOP Managed Receivables | | 0.49 | % | | 0.44 | % | | 0.49 | % | | 0.44 | % |
Our worldwide charge-offs and LTR ratio were both lower than a year ago.
The improvement primarily reflects the non-recurrence of a non-consumer loss recognized in the third quarter of 2018. Our credit loss reserve is based on such factors as historical loss performance, portfolio quality, and receivables level.
The credit loss reserve and the reserve as a percent of managed receivables were both lower than a year ago.
Item 2. Management’s Discussion and Analysis of Financial Condition and Results of Operations (Continued)
Residual Risk
Leasing is an important product that many customers want and value, and operating lease customers also are more likely to buy or lease another Ford or Lincoln vehicle. We manage our lease share with an enterprise view to support sales, protect residual values, and manage the trade cycle. Ford Credit and Ford work together under a leasing strategy that considers share, term, model mix, geography, and other factors.
We are exposed to residual risk on operating leases and similar balloon payment products where the customer may return the financed vehicle to us. Residual risk is the possibility that the amount we obtain from returned vehicles will be less than our estimate of the expected residual value for the vehicle. We estimate the expected residual value by evaluating recent auction values, return volumes for our leased vehicles, industrywideindustry wide used vehicle prices, marketing incentive plans, and vehicle quality data. For operating leases, changes in expected residual values impact depreciation expense, which is recognized on a straight-line basis over the life of the lease.
For additional information on our residual risk on operating leases, refer to the “Critical Accounting Estimates – Accumulated Depreciation on Vehicles Subject to Operating Leases” section of Item 7 of Part II of our 2018 Form 10-K Report.
U.S.Ford and Lincoln Brand Operating Lease ExperienceLeases
The following charts show lease placement volume and leasetable shows share of Ford and Lincoln brand retail financing and operating lease sales, placement volume, and residual performance metrics for vehicles in the respective periods. Theour U.S. operating lease portfolio, accounted forwhich represents 86% of our total net investment in operating leases at JuneSeptember 30, 2019.
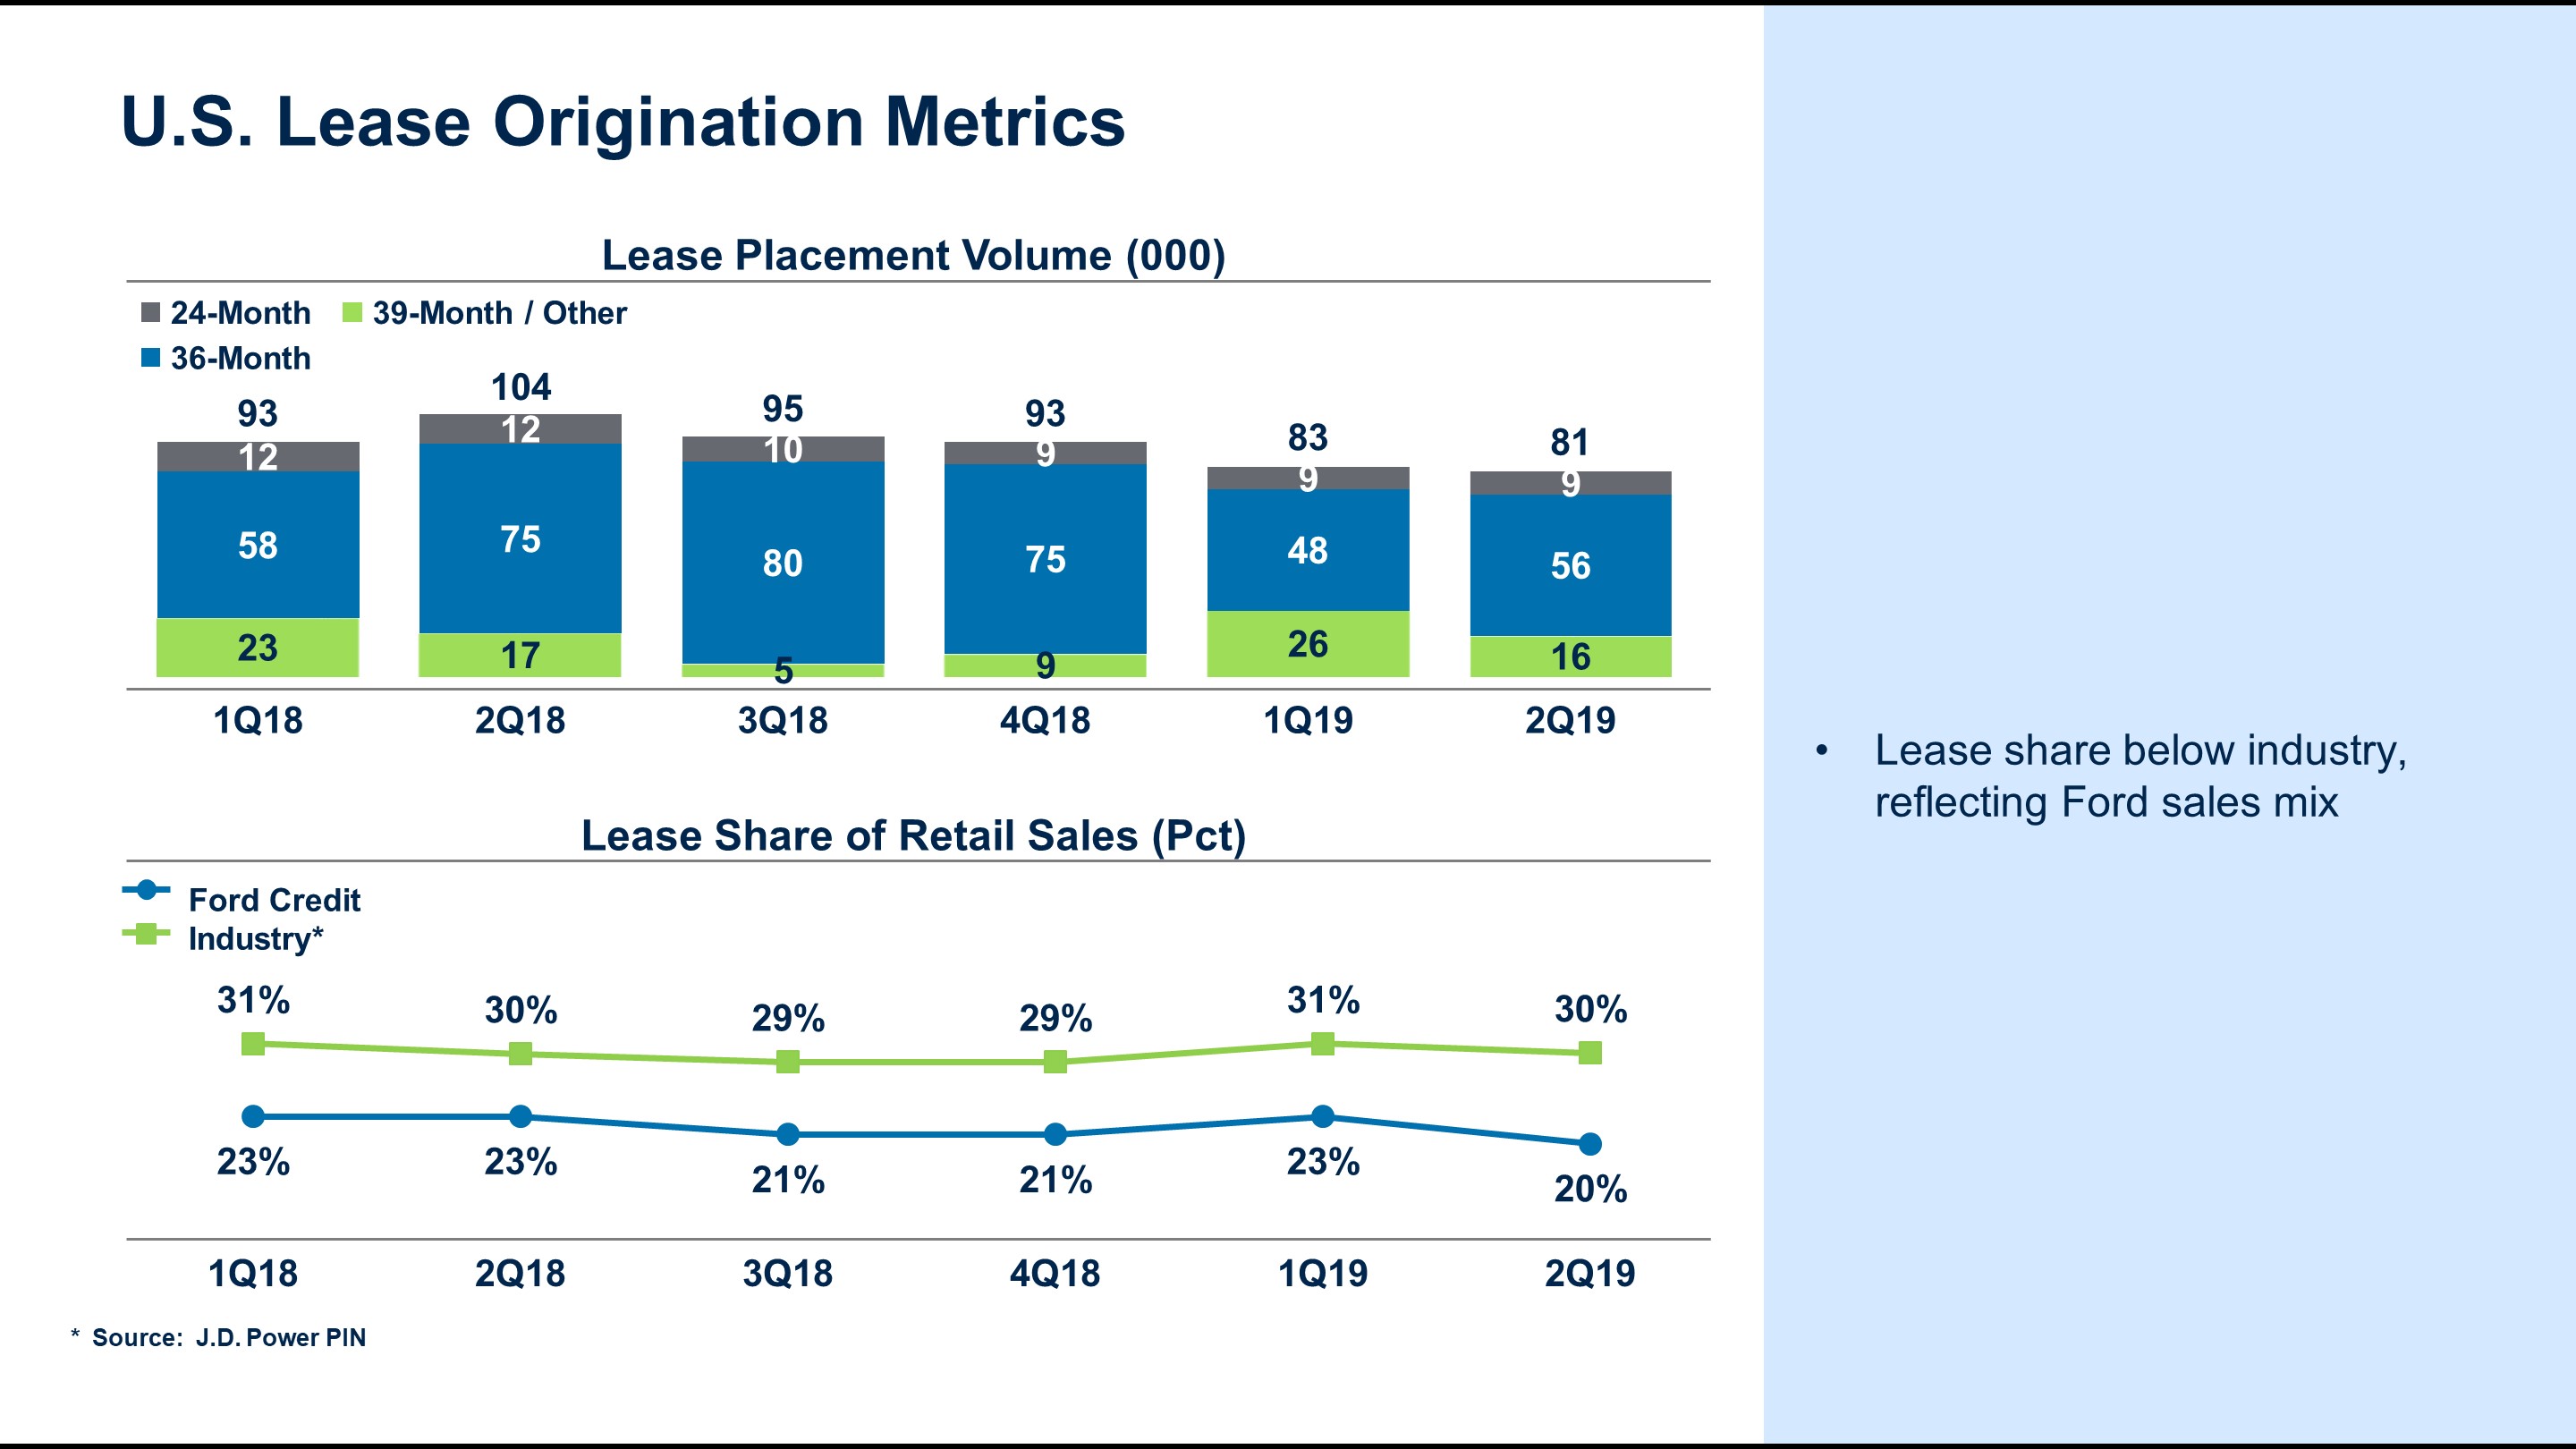
|
| | | | | | | | | | | | | | | | |
| | | Third Quarter | | First Nine Months |
| | | 2018 | | 2019 | | 2018 | | 2019 |
| Lease Share of Retail Sales | | | | | | | | |
| Ford Credit | | 21 | % | | 19 | % | | 22 | % | | 20 | % |
| Industry (a) | | 29 | % | | 29 | % | | 30 | % | | 30 | % |
| | | | | | | | | |
| Placement Volume (000) | | | | | | | | |
| 24-Month | | 10 |
| | 11 |
| | 34 |
| | 29 |
|
| 36-Month | | 80 |
| | 68 |
| | 213 |
| | 172 |
|
| 39-Month / Other | | 5 |
| | 4 |
| | 45 |
| | 46 |
|
| Total | | 95 |
| | 83 |
| | 292 |
| | 247 |
|
| | | | | | | | | |
| Residual Performance | | | | | | | | |
| Return rates | | 77 | % | | 76 | % | | 78 | % | | 78 | % |
| Return volume (000) | | 71 |
| | 70 |
| | 210 |
| | 220 |
|
| Off-lease auction values (b) | | $ | 19,190 |
| | $ | 18,865 |
| | $ | 18,415 |
| | $ | 18,160 |
|
__________
| |
| (a) | Source: J.D. Power PIN |
| |
| (b) | 36-month off-lease auction values; quarterly amounts at 3Q 2019 mix and YTD amounts at 2019 YTD mix |
Our second quarter 2019 lease placement volume was down compared with a year ago. Ford Credit’s U.S. operating lease share of retail sales in the secondthird quarter of 2019 was lower compared with a year ago and remains below the industry, reflecting the Ford sales mix.
Item 2. Management’s Discussion and Analysis of Financial Condition and Results of Operations (Continued)
The following charts show lease return volumes, return rates, and off-lease auction values at constant second Our third quarter 2019 vehicle mix in the respective periods:
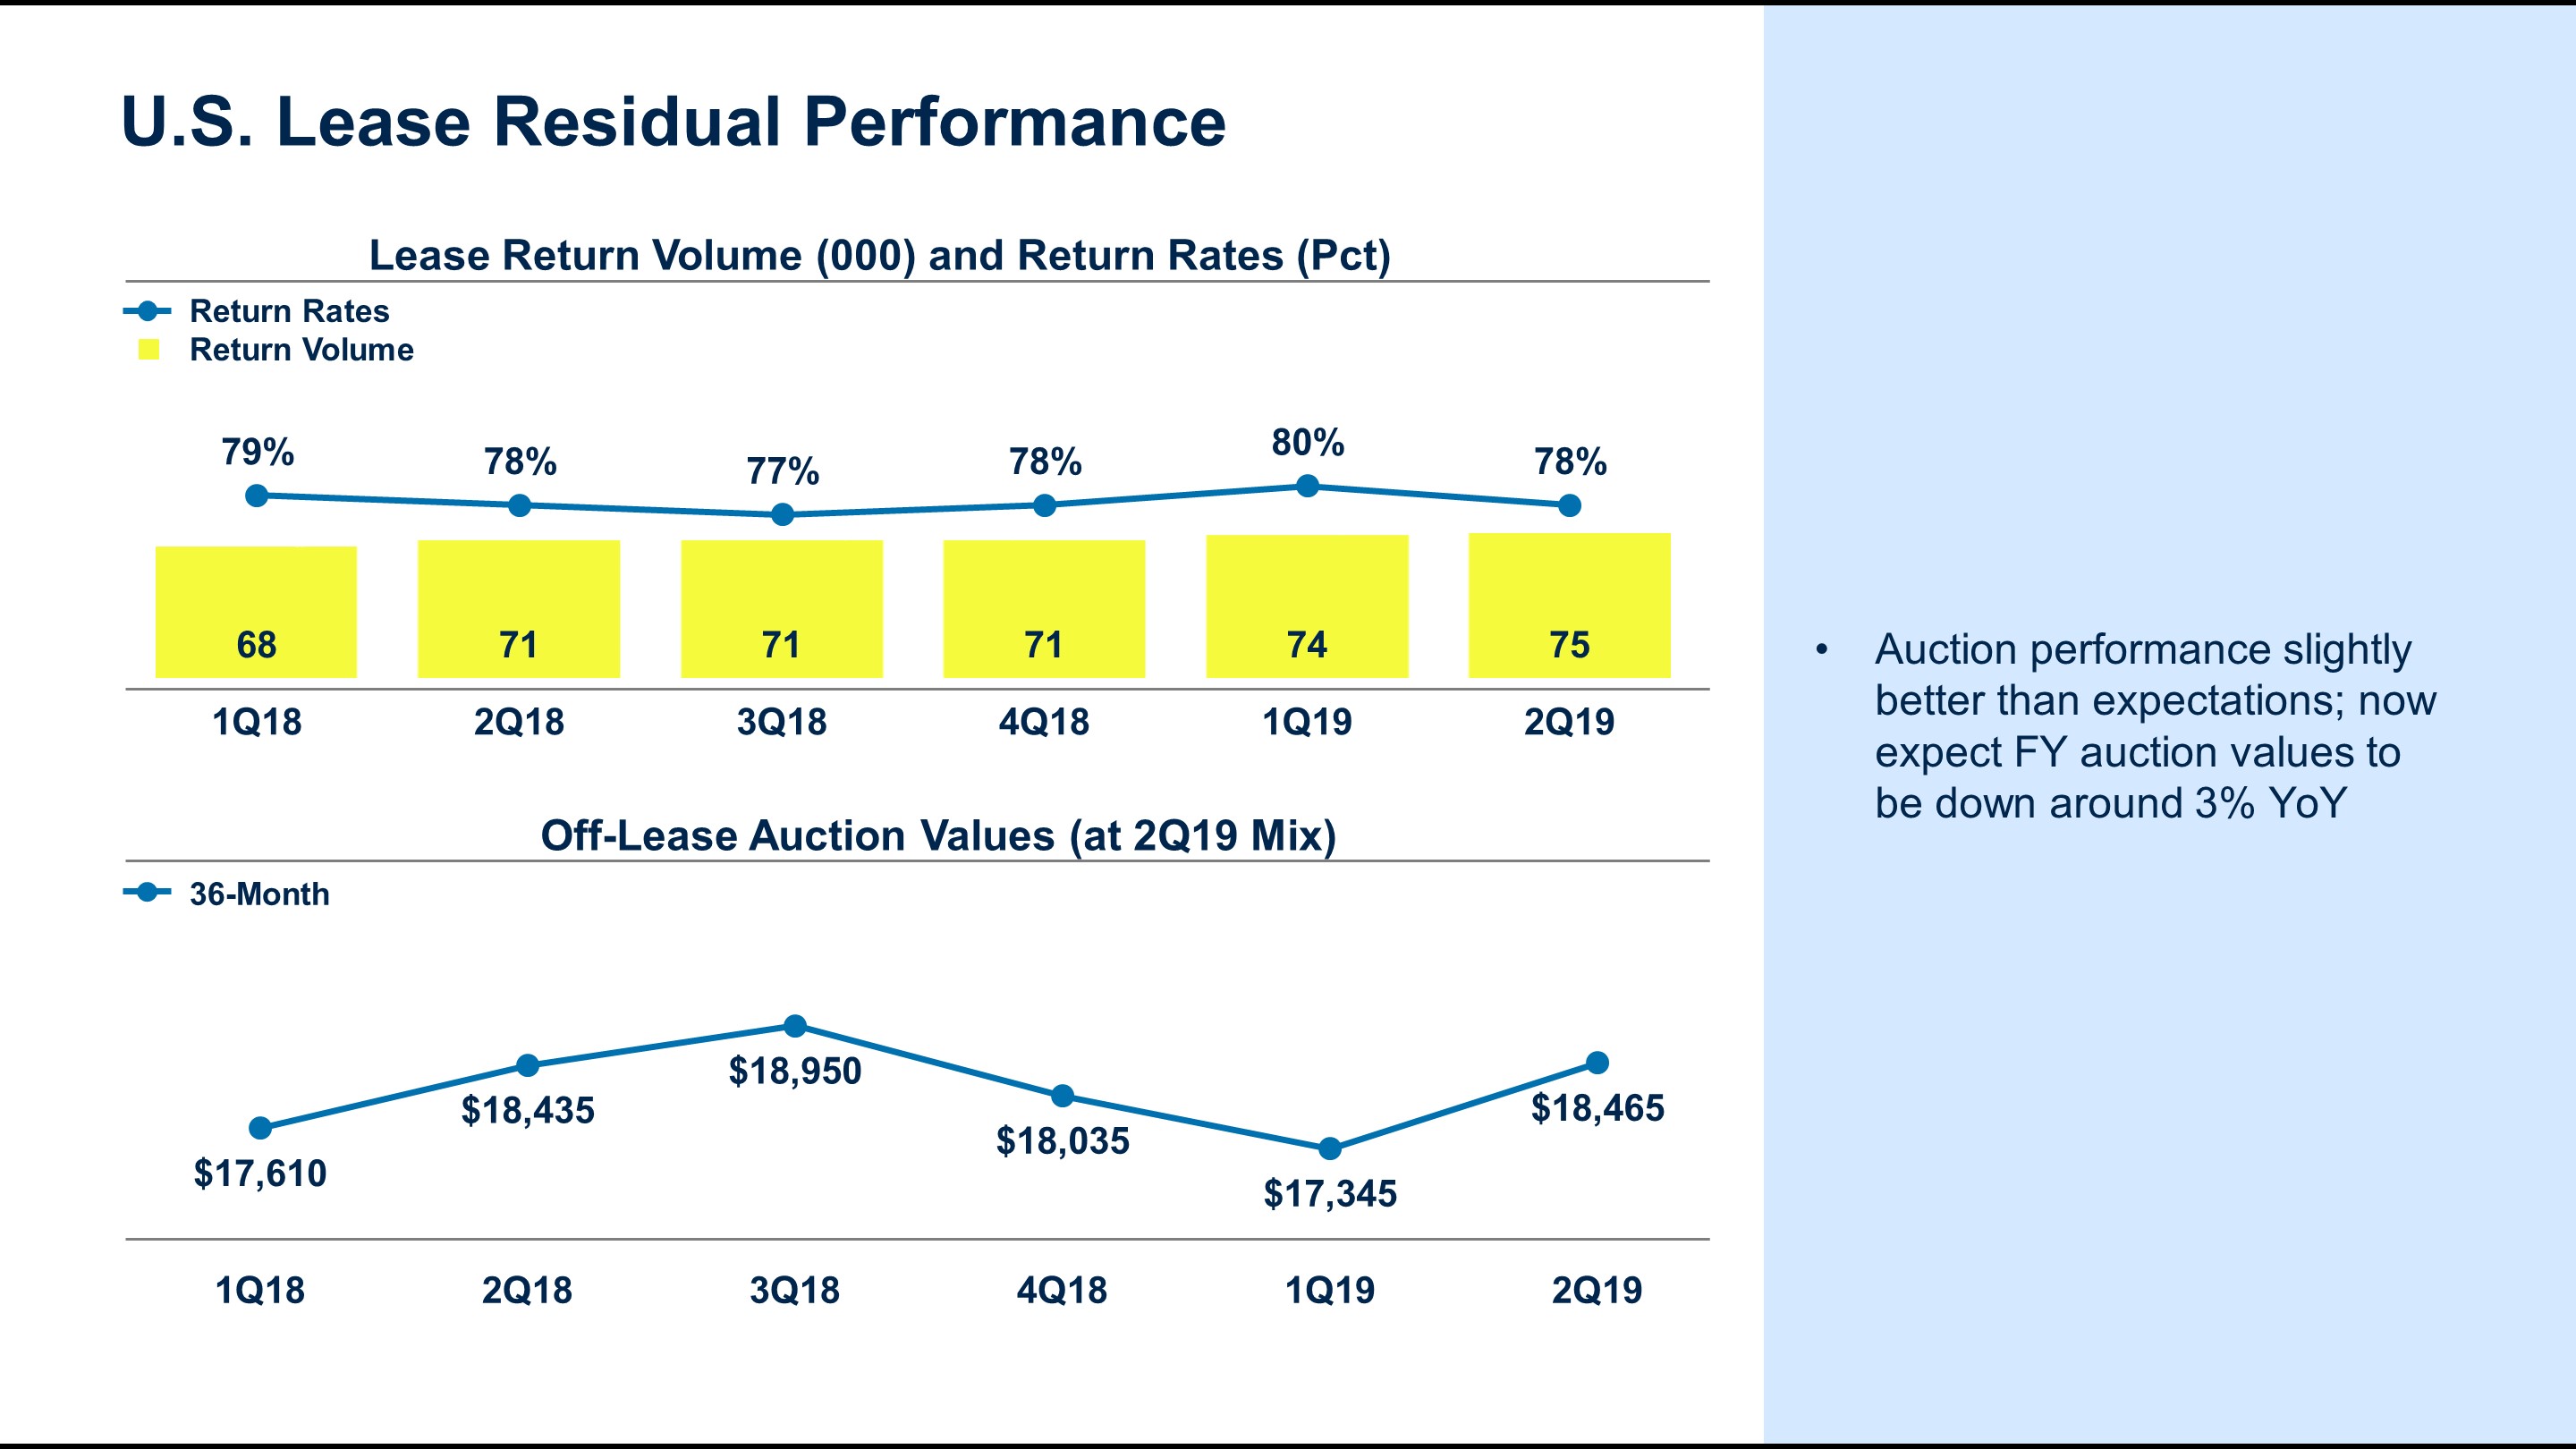
Lease return volume and return rate in the secondthird quarter of 2019 was upwere down from a year ago, while the return rate remained flat.ago. Our secondthird quarter 2019 36-month off-lease auction values were about flatalso down compared with a year ago.
We now expect full-year 2019 off-lease 36-month auction values to be around 3%2% lower compared with 2018 at constant mix.
Item 2. Management’s Discussion and Analysis of Financial Condition and Results of Operations (Continued)
Credit Ratings
Our short-term and long-term debt is rated by four credit rating agencies designated as nationally recognized statistical rating organizations (“NRSROs”) by the U.S. Securities and Exchange Commission: DBRS, Fitch, Moody’s, and S&P.
In several markets, locally recognized rating agencies also rate us. A credit rating reflects an assessment by the rating agency of the credit risk associated with a corporate entity or particular securities issued by that entity. Rating agencies’ ratings of us are based on information provided by us and other sources. Credit ratings assigned to us from all of the NRSROs are closely associated with their opinions on Ford. Credit ratings are not recommendations to buy, sell, or hold securities and are subject to revision or withdrawal at any time by the assigning rating agency. Each rating agency may have different criteria for evaluating company risk and, therefore, ratings should be evaluated independently for each rating agency.
The following rating actions were taken by these NRSROs since the filing of our Quarterly Report on Form 10-Q for the quarter ended March 31,June 30, 2019.
•On May 17,September 9, 2019, FitchMoody’s downgraded the credit rating for Ford Credit to non-investment grade (Ba1 from Baa3) and revised the outlook to negativestable from stable for Ford Credit and affirmed its ratings.negative.
The following charttable summarizes certain of the credit ratings and outlook presently assigned by these four NRSROs:
|
| | | | | | | | | | | | | | | |
| | | NRSRO RATINGS | |
| | | Ford Credit | | | NRSROs | |
| | Long-Term Senior Unsecured | | Short -Term Unsecured | | Outlook/Trend | | Minimum Long-Term Investment Grade Rating |
| DBRS | | BBB | | | | R-2M | | | | Negative | | | | BBB (low) | |
| Fitch | | BBB | | | | F2 | | | | Negative | | | | BBB- | |
| Moody’s | | Baa3Ba1 | | | | P-3NP | | | | NegativeStable | | | | Baa3 | |
| S&P | | BBB | | | | A-2 | | | | Negative | | | | BBB- | |
Item 2. Management’s Discussion and Analysis of Financial Condition and Results of Operations (Continued)
Funding and Liquidity
Our primary funding objective is to be well capitalized with a strong balance sheet and ample liquidity to support our financing activities and growth under a variety of market conditions, including short-term and long-term market disruptions.
Our funding strategy remains focused on diversification, and we plan to continue accessing a variety of markets, channels, and investors.
Our liquidity profile continues to be diverse, robust, and focused on maintaining liquidity levels that meet our business and funding requirements. We annually stress test our balance sheet and liquidity to ensure that we continue to meet our financial obligations through economic cycles.
Funding Portfolio
The following charttable shows the trends in funding for our managed receivables:receivables (in billions):
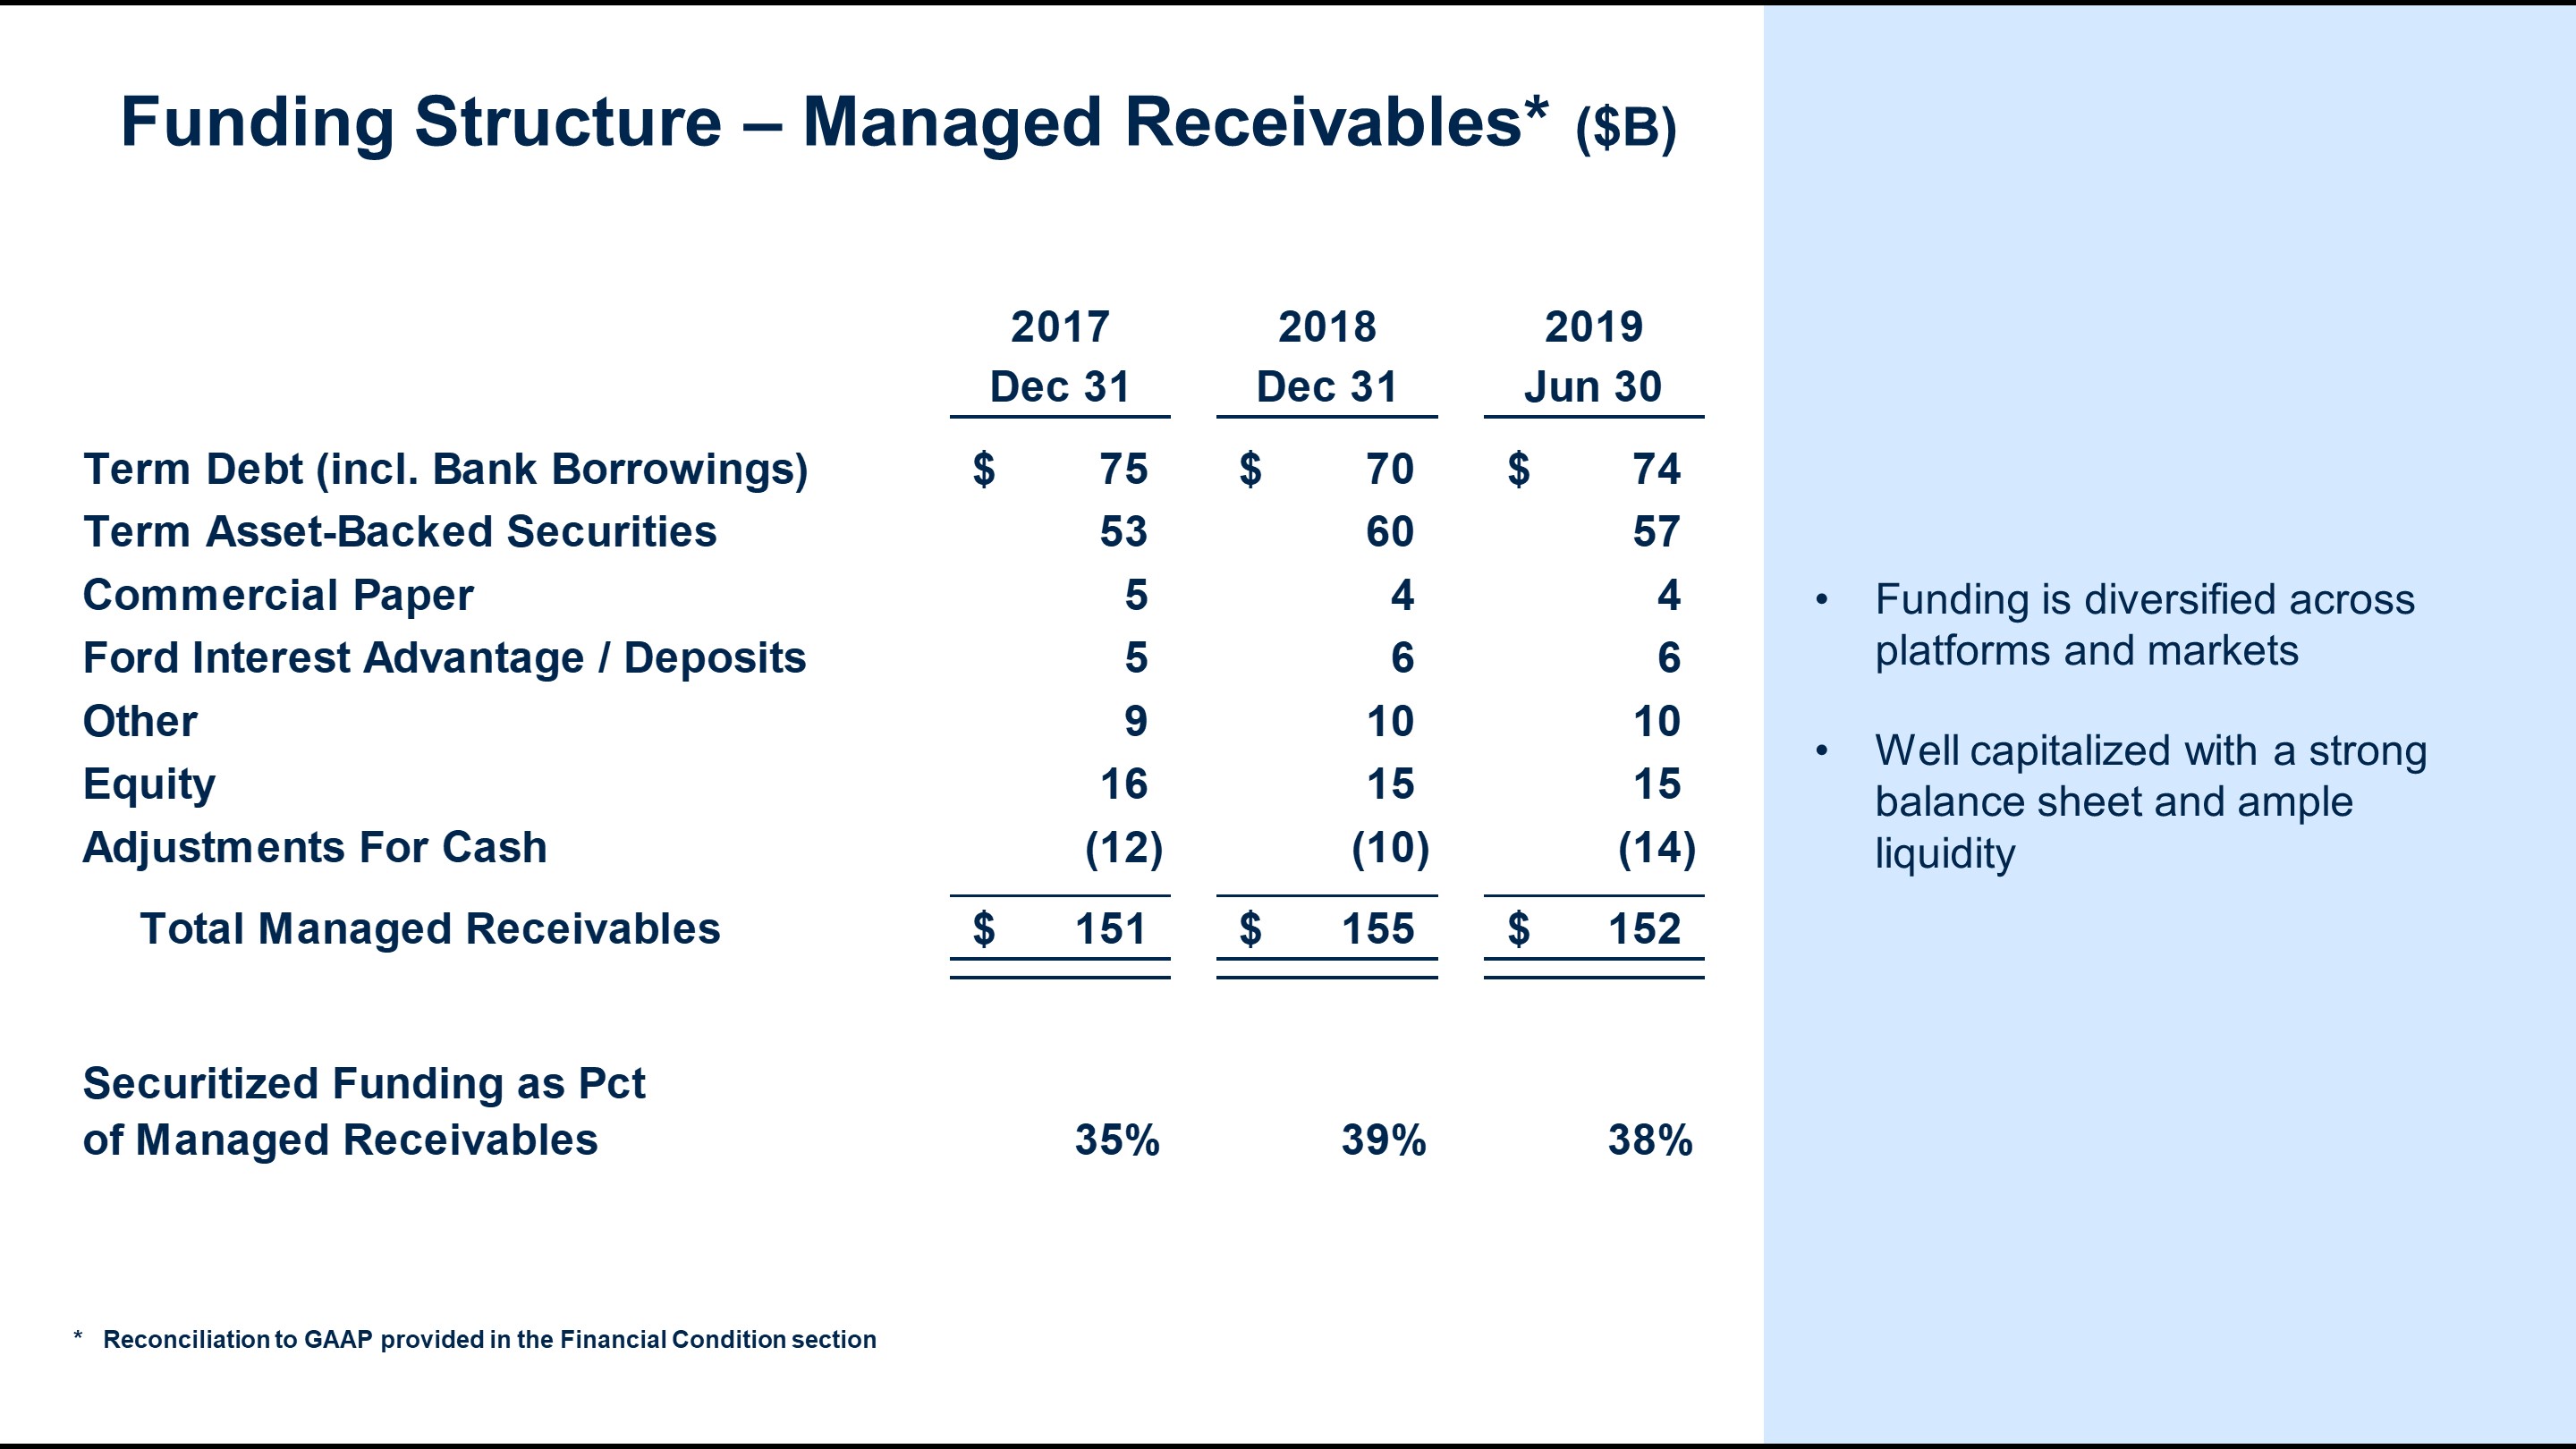
|
| | | | | | | | | | | |
| Funding Structure | September 30, 2018 | | December 31, 2018 | | September 30, 2019 |
| Term Debt (incl. Bank Borrowings) | $ | 73 |
| | $ | 70 |
| | $ | 74 |
|
| Term Asset-Backed Securities | 55 |
| | 60 |
| | 55 |
|
| Commercial Paper | 4 |
| | 4 |
| | 4 |
|
| Ford Interest Advantage / Deposits | 6 |
| | 6 |
| | 7 |
|
| Other | 11 |
| | 10 |
| | 9 |
|
| Equity | 15 |
| | 15 |
| | 14 |
|
| Adjustments for Cash | (12 | ) | | (10 | ) | | (14 | ) |
| Total Managed Receivables (a) | $ | 152 |
| | $ | 155 |
| | $ | 149 |
|
| | | | | | |
| Securitized Funding as a percent of Managed Receivables | 36 | % | | 39 | % | | 37 | % |
__________
| |
| (a) | Reconciliation to GAAP provided in the Financial Condition section |
Managed receivables of $152$149 billion as of JuneSeptember 30, 2019, were funded primarily with term debt and term asset-backed securities. Securitized funding as a percent of managed receivables was 38%37%.
We target a mix of securitized funding between 35% and 40%. The calendarization of the funding plan will result in quarterly fluctuations of the securitized funding percentage.
Item 2. Management’s Discussion and Analysis of Financial Condition and Results of Operations (Continued)
Public Term Funding Plan
The following charttable shows our issuances for full-year 2017 and 2018, planned issuances for full-year 2019, and our global public term funding issuances through July 23,October 22, 2019, excluding short-term funding programs:programs (in billions):
|
| | | | | | | | | | | | | | |
| | 2017 Actual | | 2018 Actual | | 2019 Forecast | | Through Oct 22 |
| Unsecured - Currency of Issuance (USD Equivalent) | | | | | | | |
| USD | $ | 10 |
| | $ | 6 |
| | $ 9 - 10 | | $ | 9 |
|
| CAD | 2 |
| | 1 |
| | 1 |
| | 1 |
|
| EUR / GBP | 3 |
| | 4 |
| | 4 - 5 |
| | 4 |
|
| Other | 1 |
| | 1 |
| | 1 |
| | 1 |
|
| Total unsecured | $ | 16 |
| | $ | 13 |
| | $ 15 - 17 |
| | $ | 14 |
|
| Securitizations | 15 |
| | 14 |
| | 13 - 14 |
| | 12 |
|
| Total public | $ | 32 |
| | $ | 27 |
| | $ 28 - 31 | | $ | 26 |
|
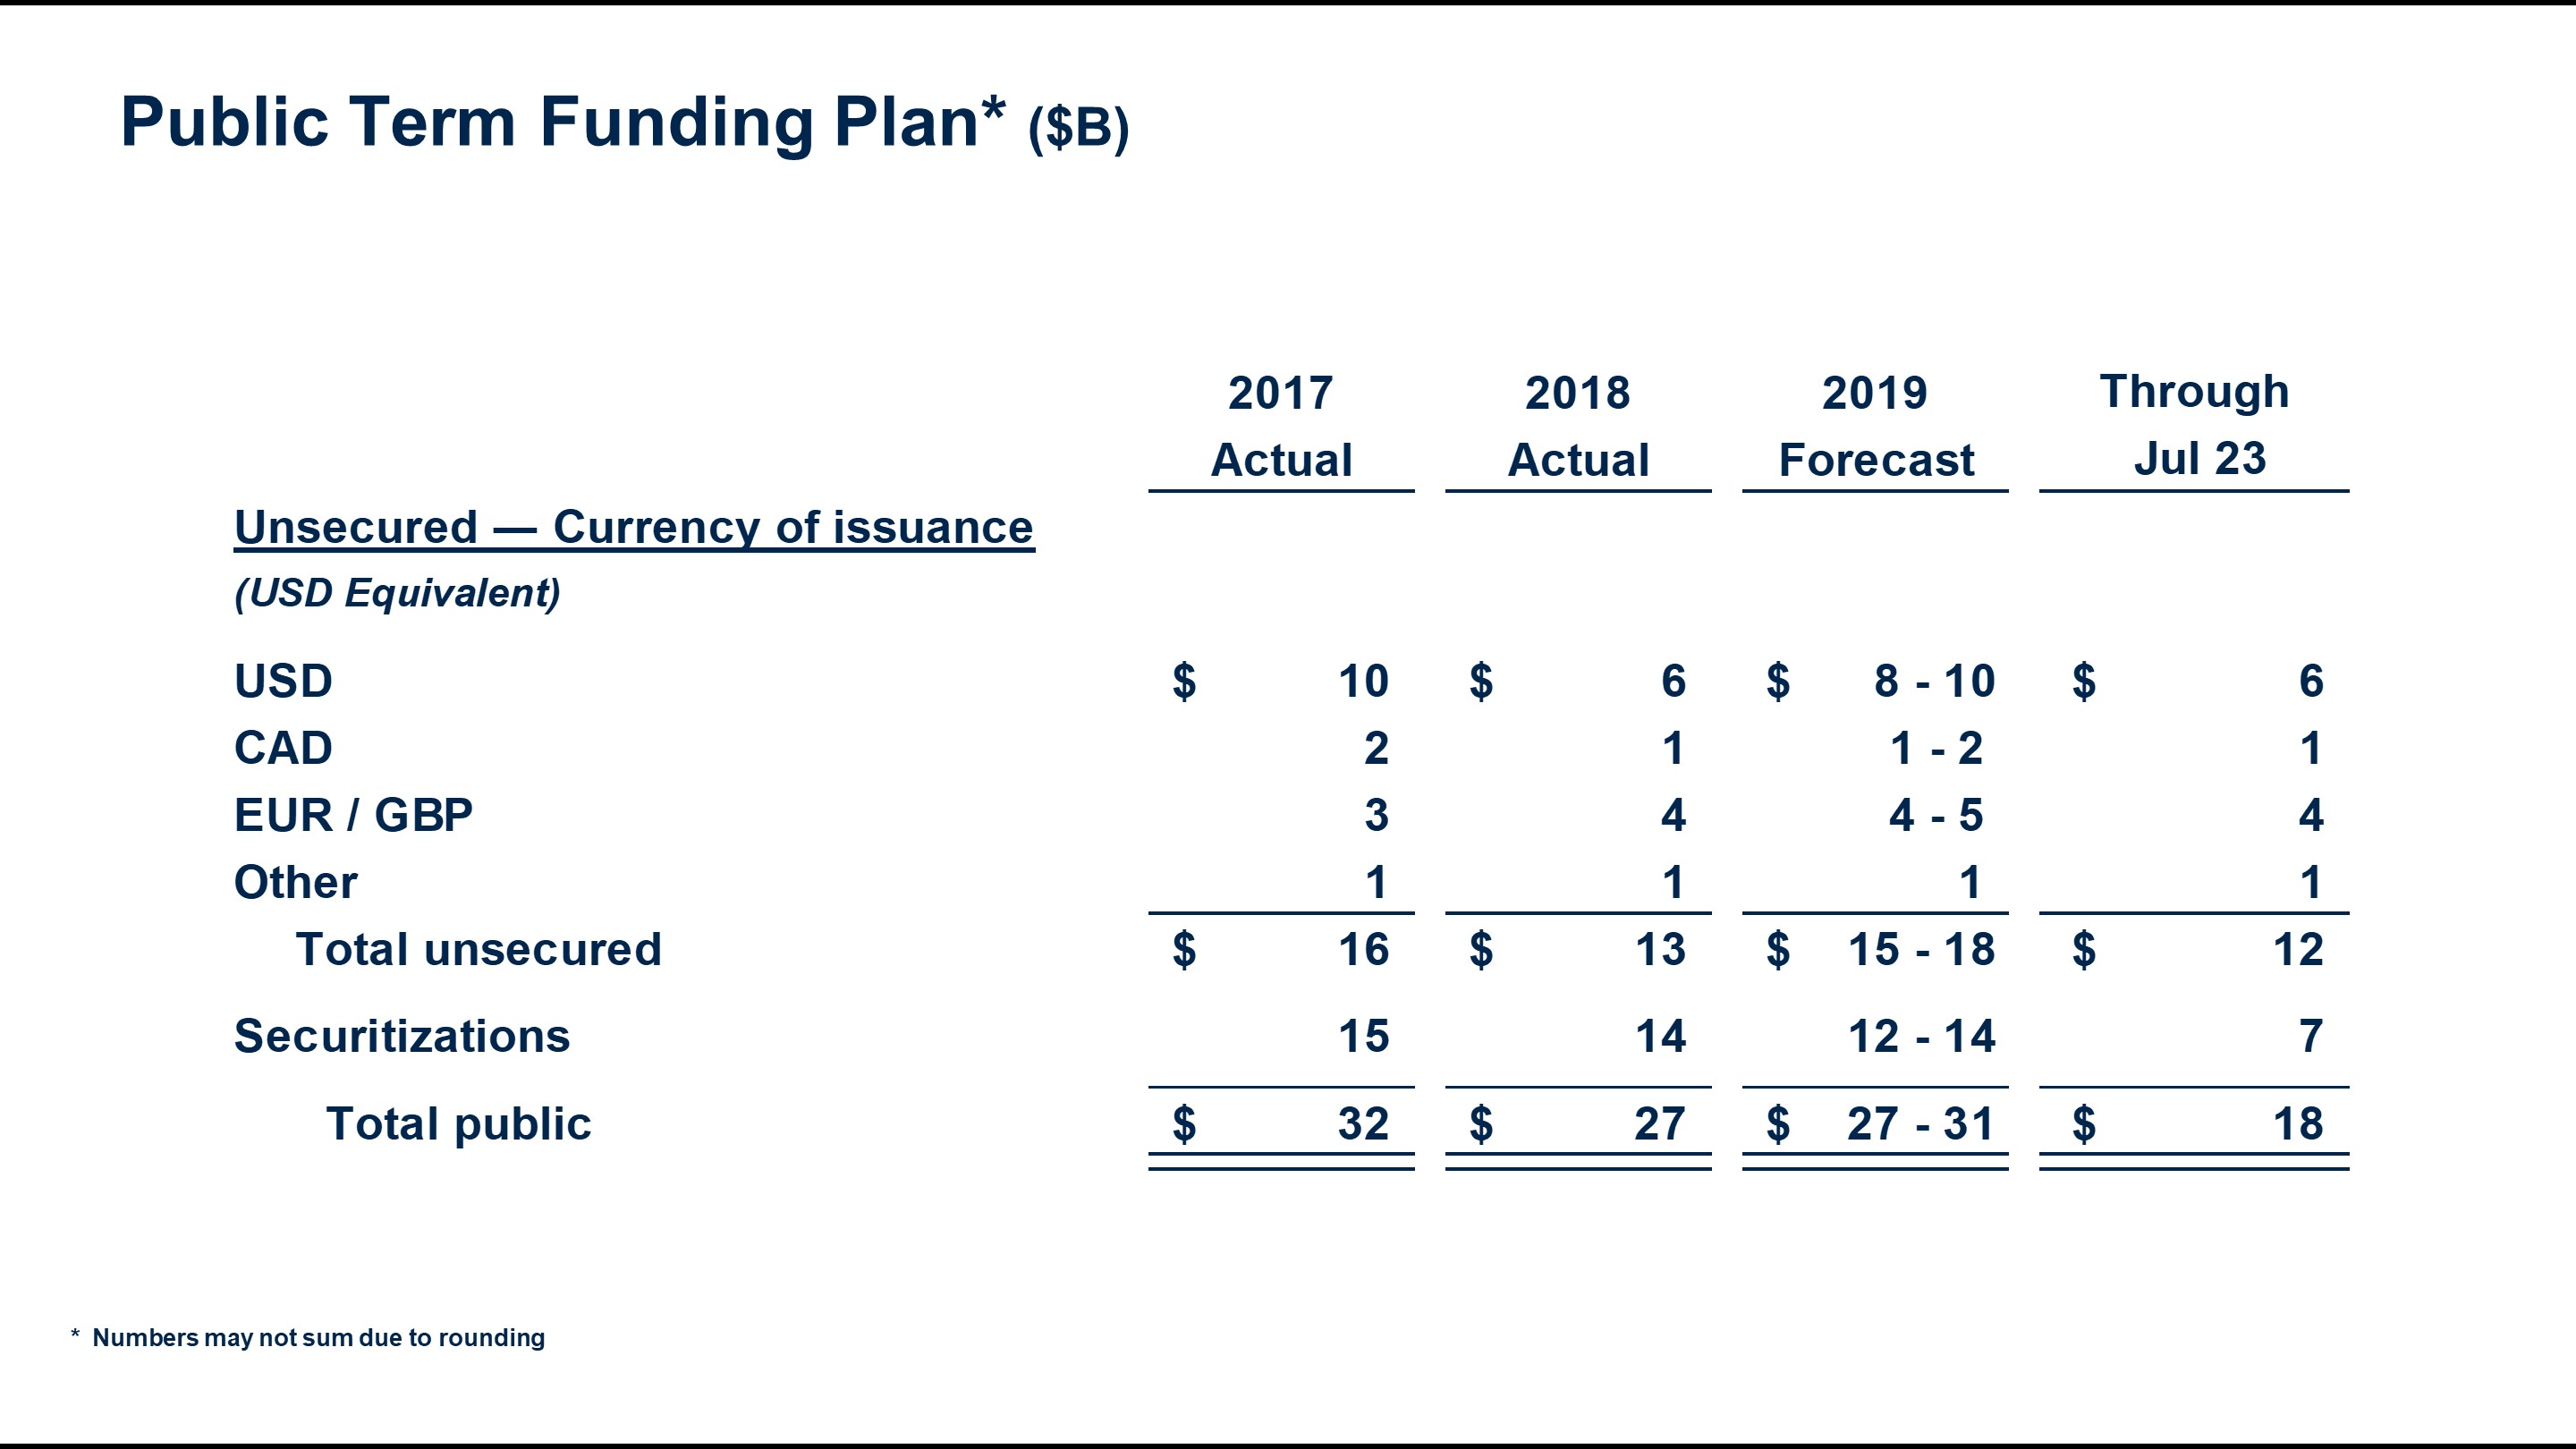
Our total unsecured public term funding plan is categorized by currency of issuance. We plan to continue issuing our eurocurrency-denominated (e.g., euro and sterling) public unsecured debt from the United States. For 2019, we now project full-year public term funding in the range of $27$28 billion to $31 billion.
Through July 23,October 22, 2019, we have completed $18$26 billion of public term issuances.
Item 2. Management’s Discussion and Analysis of Financial Condition and Results of Operations (Continued)
Liquidity Sources
We define gross liquidity as cash, cash equivalents, and marketable securities (excluding amounts related to insurance activities) and committed capacity (which includes our credit and asset-backed facilities and bank lines), less utilization of liquidity. Utilization of liquidity is the amount funded under our liquidity sources and also includes the cash and cash equivalents required to support securitization transactions. Net liquidity available for use is defined as gross liquidity less certain adjustments for asset-backed capacity in excess of eligible receivables and cash related to the Ford Credit Revolving Extended Variable-utilization program (“FordREV”), which can be accessed through future sales of receivables. While not included in available liquidity, these adjustments represent additional funding sources for future originations.
The following charttable shows our liquidity sources and utilization:utilization (in billions):

|
| | | | | | | | | | | |
| | September 30, 2018 | | December 31, 2018 | | September 30, 2019 |
| Liquidity Sources | | | | | |
| Cash | $ | 12.1 |
| | $ | 10.2 |
| | $ | 14.3 |
|
| Committed asset-backed facilities | 32.0 |
| | 35.4 |
| | 35.2 |
|
| Other unsecured credit facilities | 3.0 |
| | 3.0 |
| | 2.6 |
|
| Ford corporate credit facility allocation | 3.0 |
| | 3.0 |
| | 3.0 |
|
| Total liquidity sources | $ | 50.1 |
| | $ | 51.6 |
| | $ | 55.1 |
|
| | | | | | |
| Utilization of Liquidity | | | | | |
| Securitization cash | $ | (3.0 | ) | | $ | (3.0 | ) | | $ | (2.9 | ) |
| Committed asset-backed facilities | (17.7 | ) | | (20.7 | ) | | (14.4 | ) |
| Other unsecured credit facilities | (0.7 | ) | | (0.7 | ) | | (0.5 | ) |
| Ford corporate credit facility allocation | — |
| | — |
| | — |
|
| Total utilization of liquidity | $ | (21.4 | ) | | $ | (24.4 | ) | | $ | (17.8 | ) |
| | | | | | |
| Gross liquidity | $ | 28.7 |
| | $ | 27.2 |
| | $ | 37.3 |
|
| Adjustments | 0.3 |
| | 0.1 |
| | (1.9 | ) |
| Net liquidity available for use | $ | 29.0 |
| | $ | 27.3 |
| | $ | 35.4 |
|
Our net liquidity available for use will fluctuate quarterly based on factors including near-term debt maturities, receivable growth, and timing of funding transactions. We target liquidity of about $25 billion.
At JuneSeptember 30, 2019, our net liquidity available for use was $33.6$35.4 billion,, $6.3 $8.1 billion higher than year-end 2018. Our sources of liquidity include cash, committed asset-backed facilities, unsecured credit facilities, and the Ford corporate credit facility allocation. At JuneSeptember 30, 2019, our liquidity sources including cash totaled $$55.755.1 billion, up $4.1$3.5 billion from year-end 2018.
Cash, Cash Equivalents, and Marketable Securities. At JuneSeptember 30, 2019, our cash, cash equivalents, and marketable securities (excluding amounts related to insurance activities) totaled $14.1$14.3 billion, compared with $10.2 billion at year-end 2018. In the normal course of our funding activities, we may generate more proceeds than are required for our immediate funding needs. These excess amounts are held primarily in highly liquid investments, which provide liquidity for our anticipated and unanticipated cash needs and give us flexibility in the use of our other funding programs. Our cash, cash equivalents, and marketable securities (excluding amounts related to insurance activities) primarily include U.S. Department of Treasury obligations, federal agency securities, bank time deposits with investment-grade institutions, investment-grade commercial paper, debt obligations of a select group of non-U.S. governments, non-U.S. governmental agencies, supranational institutions, non-U.S. central banks, and money market funds that carry the highest possible ratings.
Item 2. Management’s Discussion and Analysis of Financial Condition and Results of Operations (Continued)
The average maturity of these investments ranges from approximately three to six months and is adjusted based on market conditions and liquidity needs. We monitor our cash levels and average maturity on a daily basis. Cash, cash equivalents, and marketable securities included amounts to be used only to support our securitization transactions of $3.0 billion and $4.0$2.9 billion at December 31, 2018 and JuneSeptember 30, 2019, respectively.
Item 2. Management’s Discussion and Analysis of Financial Condition and Results of Operations (Continued)
Committed Capacity. At JuneSeptember 30, 2019, our committed capacity totaled $41.6$40.8 billion, compared with $41.4 billion at December 31, 2018. Our committed capacity is primarily comprised of committed ABS facilities from bank-sponsored commercial paper conduits and other financial institutions, unsecured credit facilities with financial institutions, and allocated commitments under the Ford corporate credit facility.
Committed Asset-Backed Facilities. We and our subsidiaries have entered into agreements with a number of bank-sponsored asset-backed commercial paper conduits and other financial institutions. Such counterparties are contractually committed, at our option, to purchase from us eligible retail financing receivables or to purchase or make advances under asset-backed securities backed by retail financing or wholesale finance receivables or operating leases for proceeds of up to $35.7$35.2 billion ($18.618.0 billion of retail financing, $5.6$5.7 billion of wholesale financing, and $11.5 billion of operating leases) at JuneSeptember 30, 2019. In the United States, we are able to obtain funding within two days of our unutilized capacity in some of our committed asset-backed facilities. These committed facilities have varying maturity dates, with $20.2$17.0 billion having maturities within the next twelve months and the remaining balance having maturities through 2022. We plan capacity renewals to protect our global funding needs, optimize capacity utilization, and maintain sufficient liquidity.
Our ability to obtain funding under these facilities is subject to having a sufficient amount of eligible assets as well as our ability to obtain interest rate hedging arrangements for certain facilities. At JuneSeptember 30, 2019, $17.5$14.4 billion of these commitments were in use. These programs are free of material adverse change clauses, restrictive financial covenants (for example, debt-to-equity limitations and minimum net worth requirements), and generally, credit rating triggers that could limit our ability to obtain funding. However, the unused portion of these commitments may be terminated if the performance of the underlying assets deteriorates beyond specified levels. Based on our experience and knowledge as servicer of the related assets, we do not expect any of these programs to be terminated due to such events.
FCE Bank plc (“FCE”) has pre-positioned retail receivables with the Bank of England which supports access to the Discount Window Facility. Pre-positioned assets are neither pledged to nor held as collateral by the Bank of England unless the Discount Window Facility is accessed. FCE’s eligibility to access the Discount Window Facility is not reflected in the Liquidity Sources table above.
Unsecured Credit Facilities. At JuneSeptember 30, 2019, we and our majority-owned subsidiaries had $5.9$5.6 billion of contractually committed unsecured credit facilities with financial institutions, including the FCE Credit Agreement, the Ford Bank Agreement, and the allocation under Ford’s corporate credit facility. At JuneSeptember 30, 2019, $5.0$5.1 billion was available for use.
At June 30, 2019, £505 million (equivalent to $641 million at June 30, 2019) was available for use under FCE’s £745 million (equivalent to $945 million)$917 million at September 30, 2019) syndicated credit facility (the “FCE Credit Agreement”). At June 30, 2019, €160 million (equivalent to $182 million at June 30, 2019) was available for use under and Ford Bank GmbH’s €240 million (equivalent to $273 million)$262 million at September 30, 2019) syndicated credit facility (the “Ford Bank Credit Agreement”). Effective July 19, both mature in 2022. At September 30, 2019, FCE and Ford Bank extended the maturity dates ofall £745 million under the FCE Credit Agreement and all €240 million under the Ford Bank Credit Agreement respectively, from October 22, 2021 to October 21, 2022 with total commitments under each agreement unchanged.were available for use.
Both the FCE Credit Agreement and Ford Bank Credit Agreement contain certain covenants, including an obligation for FCE and Ford Bank to maintain their ratio of regulatory capital to risk-weighted assets at no less than the applicable regulatory minimum. The FCE Credit Agreement requires the support agreement between FCE and Ford Credit to remain in effect (and enforced by FCE to ensure that its net worth is maintained at no less than $500 million). The Ford Bank Credit Agreement requires our guarantee of Ford Bank’s obligations under the agreement to remain in effect.
Lenders under the Ford corporate credit facility have commitments totaling $13.4 billion, with 25% of the commitments maturing on April 30, 2022 and 75% of the commitments maturing on April 30, 2024. Ford has allocated $3.0 billion of commitments, including commitments under a Chinese renminbi sub-facility, to us on an irrevocable and exclusive basis to support our liquidity. At JuneSeptember 30, 2019, all $3.0 billion was available for use.
Item 2. Management’s Discussion and Analysis of Financial Condition and Results of Operations (Continued)
Funding and Liquidity Risks
Refer to the “Funding and Liquidity Risks” section of Item 7 of Part II of our 2018 Form 10-K Report for a list of factors that could affect our liquidity and information on our stress testing.
Item 2. Management’s Discussion and Analysis of Financial Condition and Results of Operations (Continued)
Leverage
We use leverage, or the debt-to-equity ratio, to make various business decisions, including evaluating and establishing pricing for finance receivable and operating lease financing, and assessing our capital structure. We refer to our shareholder’s interest as equity.
The following charttable shows the calculation of our financial statement leverage and managed leverage:leverage (in billions):
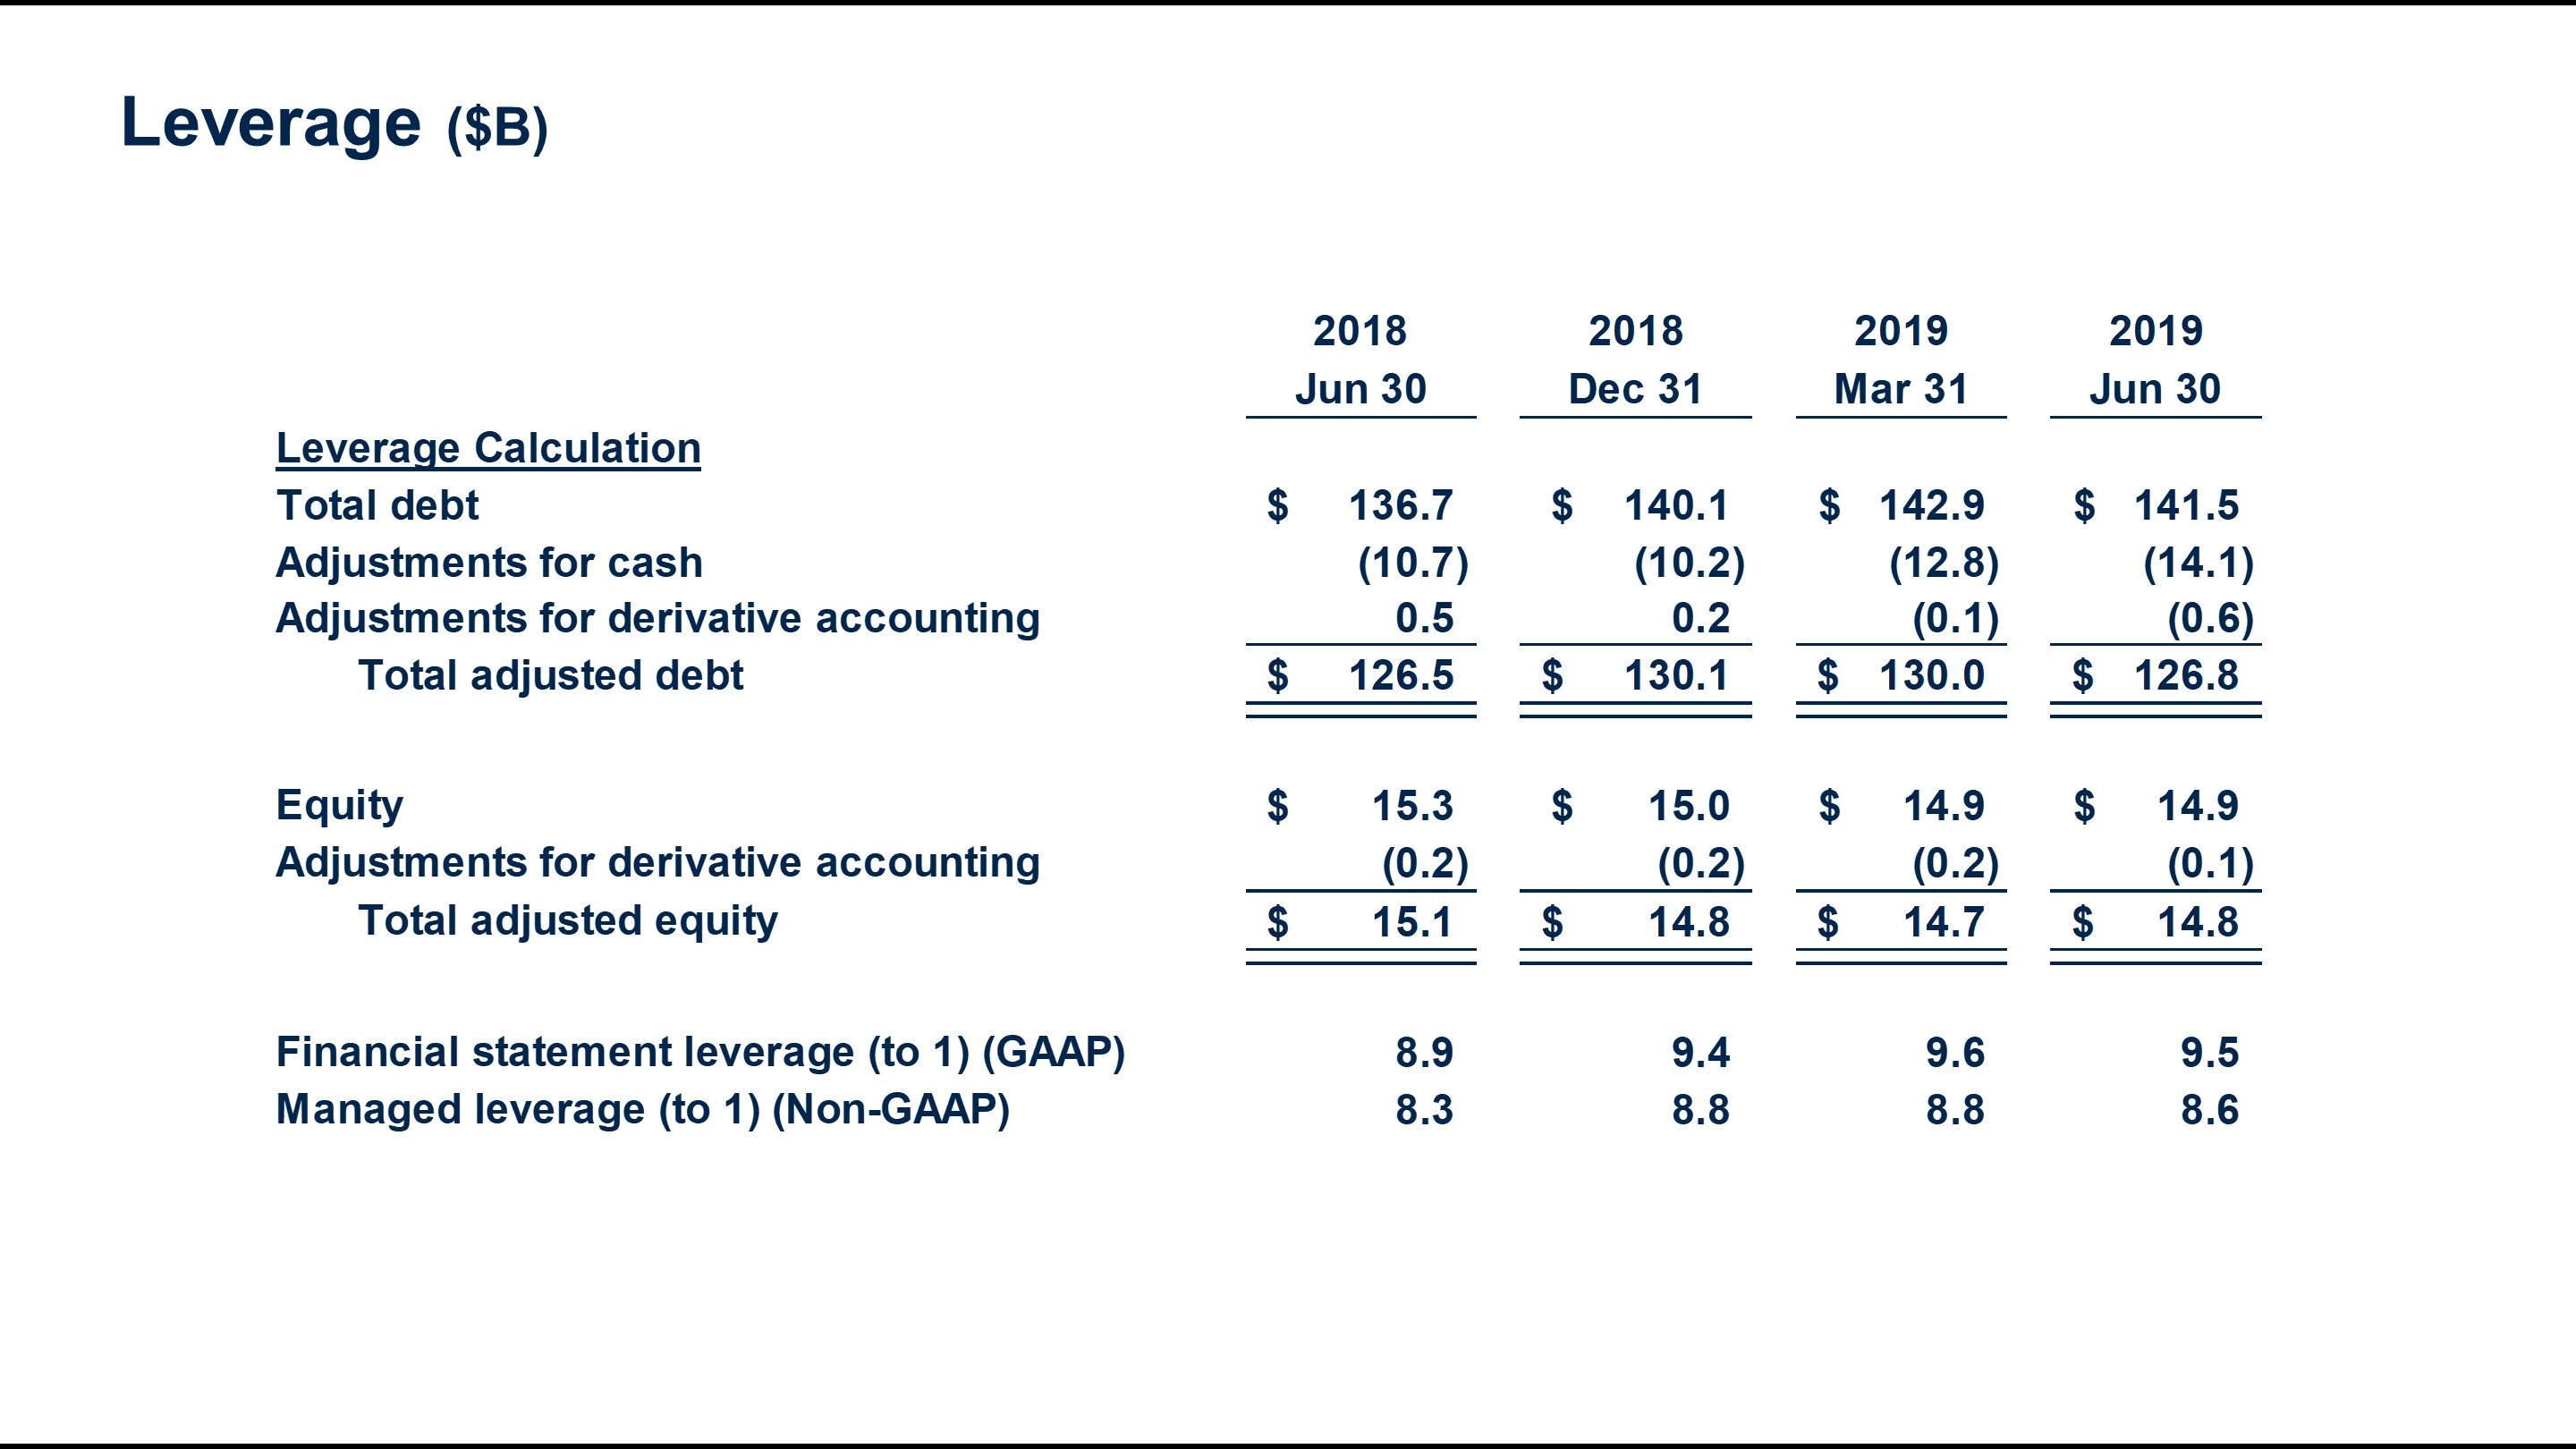
|
| | | | | | | | | | | |
| | September 30, 2018 | | December 31, 2018 | | September 30, 2019 |
| Leverage Calculation | | | | | |
| Debt | $ | 138.2 |
| | $ | 140.1 |
| | $ | 139.3 |
|
| Adjustments for cash | (12.1 | ) | | (10.2 | ) | | (14.3 | ) |
| Adjustments for derivative accounting | 0.6 |
| | 0.2 |
| | (0.8 | ) |
| Total adjusted debt | $ | 126.7 |
| | $ | 130.1 |
| | $ | 124.2 |
|
| | | | | | |
| Equity | $ | 15.2 |
| | $ | 15.0 |
| | $ | 14.2 |
|
| Adjustments for derivative accounting | (0.1 | ) | | (0.2 | ) | | — |
|
| Total adjusted equity | $ | 15.1 |
| | $ | 14.8 |
| | $ | 14.2 |
|
| | | | | | |
| Financial statement leverage (to 1) (GAAP) | 9.1 |
| | 9.4 |
| | 9.8 |
|
| Managed leverage (to 1) (Non-GAAP) | 8.4 |
| | 8.8 |
| | 8.8 |
|
We plan our managed leverage by considering prevailing market conditions and the risk characteristics of our business. At JuneSeptember 30, 2019, our financial statement leverage was 9.5:9.8:1, and managed leverage was 8.6:8.8:1. We target managed leverage in the range of 8:1 to 9:1.
Item 2. Management’s Discussion and Analysis of Financial Condition and Results of Operations (Continued)
Cautionary Note on Forward-Looking Statements
Statements included or incorporated by reference herein may constitute “forward-looking statements” within the meaning of the Private Securities Litigation Reform Act of 1995. Forward-looking statements are based on expectations, forecasts, and assumptions by our management and involve a number of risks, uncertainties, and other factors that could cause actual results to differ materially from those stated, including without limitation:
Ford’s long-term competitiveness depends on the successful execution of fitness actions;
Industry sales volume, particularly in the United States, Europe, or China, can be volatile and could decline if there is a financial crisis, recession, or significant geopolitical event;
Ford’s new and existing products and mobility services are subject to market acceptance;
Ford’s results are dependent on sales of larger, more profitable vehicles, particularly in the United States;
Ford may face increased price competition resulting from industry excess capacity, currency fluctuations, or other factors;
Fluctuations in commodity prices, foreign currency exchange rates, and interest rates can have a significant effect on results;
With a global footprint, Ford’s results could be adversely affected by economic, geopolitical, protectionist trade policies, or other events, including Brexit;
Ford’s production, as well as Ford’s suppliers’ production, could be disrupted by labor disputes, natural or man-made disasters, financial distress, production difficulties, or other factors;
Ford’s ability to maintain a competitive cost structure could be affected by labor or other constraints;
Pension and other postretirement liabilities could adversely affect Ford’s liquidity and financial condition;
Economic and demographic experience for pension and other postretirement benefit plans (e.g., discount rates or investment returns) could be worse than Ford has assumed;
Ford’s vehicles could be affected by defects that result in delays in new model launches, recall campaigns, or increased warranty costs;
Ford may need to substantially modify its product plans to comply with safety, emissions, fuel economy, and other regulations that may change in the future;
Ford could experience unusual or significant litigation, governmental investigations, or adverse publicity arising out of alleged defects in products, perceived environmental impacts, or otherwise;
Ford’s receipt of government incentives could be subject to reduction, termination, or clawback;
Operational systems, security systems, and vehicles could be affected by cyber incidents;
Ford and Ford Credit’s access to debt, securitization, or derivative markets around the world at competitive rates or in sufficient amounts could be affected by credit rating downgrades, market volatility, market disruption, regulatory requirements, or other factors;
Ford Credit could experience higher-than-expectedhigher than expected credit losses, lower-than-anticipated residual values, or higher-than-expected return volumes for operating leased vehicles;
Ford Credit could face increased competition from banks, financial institutions, or other third parties seeking to increase their share of financing Ford vehicles; and
Ford Credit could be subject to new or increased credit regulations, consumer or data protection regulations, or other regulations.
We cannot be certain that any expectation, forecast, or assumption made in preparing forward-looking statements will prove accurate, or that any projection will be realized. It is to be expected that there may be differences between projected and actual results. Our forward-looking statements speak only as of the date of their initial issuance, and we do not undertake any obligation to update or revise publicly any forward-looking statement, whether as a result of new information, future events, or otherwise. For additional discussion, see “Item 1A. Risk Factors” in our 2018 Form 10-K Report, as updated by our subsequent Quarterly Reports on Form 10-Q and Current Reports on Form 8-K.
Item 2. Management’s Discussion and Analysis of Financial Condition and Results of Operations (Continued)
Accounting Standards Issued But Not Yet Adopted
The Financial Accounting Standards Board (“FASB”) has issued the following Accounting Standards Updates (“ASU”)., which are not expected to have a material impact to our financial statements or financial statement disclosures. ASU 2016-13 is expected to result in a significant change in practice to Ford Credit. For additional information, see Note 2 of theour Notes to the Financial Statements.
|
| | | |
| ASU | | | Effective Date (a) |
| 2018-18 | Clarifying the interactionInteraction between Collaborative Arrangements and Revenue Fromfrom Contracts Withwith Customers | | January 1, 2020 |
| 2018-17 | Targeting Improvements to Related Party Guidance for Variable Interest Entities | | January 1, 2020 |
| 2018-15 | Customer’s Accounting for Implementation Costs Incurred in a Cloud Computing Arrangement that is a Service Contract | | January 1, 2020 |
| 2016-13 | Credit Losses - Measurement of Credit Losses on Financial Instruments | | January 1, 2020 (b) |
__________
| |
| (a) | Early adoption for each of the standards is permitted. |
| |
| (b) | The FASB has issued the following update to the Credit Losses standard: ASU 2019-05 (Targeted Transition Relief) which we will adopt with the new Credit Losses standard effective January 1, 2020. |
ITEM 3. Quantitative and Qualitative Disclosures About Market Risk.
In our 2018 Form 10-K Report, we discuss in greater detail our market risk, counterparty risk, credit risk, residual risk, liquidity risk, and operating risk.
To provide a quantitative measure of the sensitivity of our pre-tax cash flow to changes in interest rates, we use interest rate scenarios that assume a hypothetical, instantaneous increase or decrease of one percentage point in all interest rates across all maturities (a “parallel shift”), as well as a base case that assumes that all interest rates remain constant at existing levels. The differences in pre-tax cash flow between these scenarios and the base case over a twelve-month period represent an estimate of the sensitivity of our pre-tax cash flow. Under this model, we estimate that at JuneSeptember 30, 2019, all else constant, such an increase in interest rates would increase our pre-tax cash flow by $21$2 million over the next 12 months, compared with an increase of $51 million at December 31, 2018. In reality, interest rate changes are rarely instantaneous or parallel and rates could move more or less than the one percentage point assumed in our analysis. As a result, the actual impact to pre-tax cash flow could be higher or lower than the results detailed above.
ITEM 4. Controls and Procedures.
Evaluation of Disclosure Controls and Procedures. David W. McClelland, our Chairman of the Board and Chief Executive Officer (“CEO”), and Brian E. Schaaf, our Chief Financial Officer (“CFO”) and Treasurer, have performed an evaluation of the Company’s disclosure controls and procedures, as that term is defined in Rule 13a-15(e) of the Securities Exchange Act of 1934, as amended (“Exchange Act”), as of JuneSeptember 30, 2019, and each has concluded that such disclosure controls and procedures are effective to ensure that information required to be disclosed in our periodic reports filed under the Exchange Act is recorded, processed, summarized, and reported within the time periods specified by SEC rules and forms, and that such information is accumulated and communicated to the CEO and CFO to allow timely decisions regarding required disclosures.
Changes in Internal Control Over Financial Reporting. There were no changes in internal control over financial reporting during the quarter ended JuneSeptember 30, 2019 that have materially affected, or are reasonably likely to materially affect, our internal control over financial reporting.
PART II. OTHER INFORMATION
ITEM 1A. Risk Factors.
The risk factor “Ford Credit’s access to debt, securitization, or derivative markets around the world at competitive rates or in sufficient amounts could be affected by credit rating downgrades, market volatility, market disruption, regulatory requirements, or other factors” included in Item 1A of our 2018 Form 10-K Report is revised as follows:
Ford and Ford Credit’s access to debt, securitization, or derivative markets around the world at competitive rates or in sufficient amounts could be affected by credit rating downgrades, market volatility, market disruption, regulatory requirements, or other factors. Ford and Ford Credit’s ability to obtain unsecured funding at a reasonable cost is dependent on their credit ratings or their perceived creditworthiness. Further, Ford Credit’s ability to obtain securitized funding under its committed asset-backed liquidity programs and certain other asset-backed securitization transactions is subject to having a sufficient amount of assets eligible for these programs, as well as Ford Credit’s ability to obtain appropriate credit ratings and, for certain committed programs, derivatives to manage the interest rate risk. Over time, and particularly in the event of credit rating downgrades, market volatility, market disruption, or other factors, Ford Credit may reduce the amount of receivables it purchases or originates because of funding constraints. The potential phase out of LIBOR is one such risk that could cause market volatility or disruption. In July 2017 the chief executive of the United Kingdom Financial Conduct Authority (the “FCA”), which regulates LIBOR, announced that the FCA intends to stop compelling banks to submit rates for the calculation of LIBOR after 2021. It is unknown whether any banks will continue to voluntarily submit rates for the calculation of LIBOR after 2021 or whether LIBOR will continue to be published by its administrator based on these submissions or on any other basis. It is not possible to predict the effect of these changes, other reforms, or the establishment of alternative reference rates, but the potential phase out of LIBOR could adversely affect Ford Credit’s access to the capital markets and cost of funding. In addition, Ford Credit may be limited in the amount of receivables it purchases or originates in certain countries or regions if the local capital markets, particularly in developing countries, do not exist or are not adequately developed. Similarly, Ford Credit may reduce the amount of receivables it purchases or originates if there is a significant decline in the demand for the types of securities it offers or Ford Credit is unable to obtain derivatives to manage the interest rate risk associated with its securitization transactions. A significant reduction in the amount of receivables Ford Credit purchases or originates would significantly reduce its ongoing profits and could adversely affect its ability to support the sale of Ford vehicles.
ITEM 5. Other Information.
None.
|
| | | | |
| Designation | | Description | | Method of Filing |
| | | | | |
| | Rule 15d-14(a) Certification of CEO. | | Filed with this Report. |
| | | | |
| | Rule 15d-14(a) Certification of CFO. | | Filed with this Report. |
| | | | |
| | Section 1350 Certification of CEO. | | Furnished with this Report. |
| | | | |
| | Section 1350 Certification of CFO. | | Furnished with this Report. |
| | | | |
| Exhibit 101.INS | | XBRL Instance Document - The instance document does not appear in the Interactive Data File because its XBRL tags are embedded within theFiles pursuant to Rule 405 of Regulation S-T formatted in Inline XBRL documentExtensible Business Reporting Language (“Inline XBRL”). | | * |
| | | | |
| Exhibit 101.SCH | | XBRL Taxonomy Extension Schema Document. | | * |
| | | | |
| Exhibit 101.CAL | | XBRL Taxonomy Extension Calculation Linkbase Document. | | * |
| | | | |
| Exhibit 101.LAB | | XBRL Taxonomy Extension Label Linkbase Document. | | * |
| | | | |
| Exhibit 101.PRE | | XBRL Taxonomy Extension Presentation Linkbase Document. | | * |
| | | | |
| Exhibit 101.DEF | | XBRL Taxonomy Extension Definition Linkbase Document. | | * |
| Exhibit 104 | | Cover Page Interactive Data File (formatted in Inline XBRL and contained in Exhibit 101). | | * |
__________
| |
| * | Submitted electronically with this Report in accordance with the provisions of Regulation S-T. |
Instruments defining the rights of holders of certain issues of long-term debt of Ford Credit have not been filed as exhibits to this Report because the authorized principal amount of any one of such issues does not exceed 10% of the total assets of Ford Credit. Ford Credit will furnish a copy of each such instrument to the SEC upon request.
SIGNATURE
Pursuant to the requirements of the Securities Exchange Act of 1934, Ford Motor Credit Company LLC has duly caused this Report to be signed on its behalf by the undersigned, thereunto duly authorized.
FORD MOTOR CREDIT COMPANY LLC
|
| |
| By: | /s/ Brian E. Schaaf |
| | Brian E. Schaaf |
| | Chief Financial Officer and Treasurer |
| | |
| Date: | July 24,October 23, 2019 |