UNITED STATES
SECURITIES AND EXCHANGE COMMISSION
Washington, D.C. 20549
__________________________________________
FORM 10-Q
__________________________________________
|
| |
| x | QUARTERLY REPORT PURSUANT TO SECTION 13 OR 15(d) OF THE SECURITIES EXCHANGE ACT OF 1934 |
For the quarterly period ended March 31, 20162017
or
|
| |
| ¨ | TRANSITION REPORT PURSUANT TO SECTION 13 OR 15(d) OF THE SECURITIES EXCHANGE ACT OF 1934 |
Commission File Number: 1-2328
GATX Corporation
(Exact name of registrant as specified in its charter)
|
| |
| New York | 36-1124040 |
| (State of incorporation) | (I.R.S. Employer Identification No.) |
| 222 West Adams Street |
| Chicago, Illinois 60606-5314 |
| (Address of principal executive offices, including zip code) |
| (312) 621-6200 |
| (Registrant's telephone number, including area code) |
Indicate by check mark whether the registrant (1) has filed all reports required to be filed by Section 13 or 15(d) of the Securities Exchange Act of 1934 during the preceding 12 months (or for such shorter period that the registrant was required to file such reports), and (2) has been subject to such filing requirements for the past 90 days. Yes x No ¨
Indicate by check mark whether the registrant has submitted electronically and posted on its corporate Web site, if any, every Interactive Data File required to be submitted and posted pursuant to Rule 405 of Regulation S-T (§232.405 of this chapter) during the preceding 12 months (or for such shorter period that the registrant was required to submit and post such files). Yes x No ¨
Indicate by check mark whether the registrant is a large accelerated filer, an accelerated filer, a non-accelerated filer, or a smaller reporting company (as defined in Rule 12b-2 of the Exchange Act).
|
| | | | | |
| | x | Large accelerated filer | | ¨ | Accelerated filer |
| | ¨ | Non-accelerated filer | | ¨ | Smaller reporting company |
Indicate by check mark whether the registrant is a shell company (as defined in Rule 12b-2 of the Exchange Act).
Yes ¨ No x
As ofCommon shares outstanding were 39.1 million at March 31, 2016, 40.9 million common shares were outstanding.2017.
GATX CORPORATION
FORM 10-Q
QUARTERLY REPORT FOR THE PERIOD ENDED MARCH 31, 20162017
INDEX
|
| | |
| Item No. | | Page No. |
|
| | |
| | Forward-Looking Statements | |
| Item 1. | | |
| | | |
| | | |
| | | |
| | | |
| | |
| Item 2. | | |
| | | |
| | | |
| Segment Operations | |
| | | |
| | |
| | | |
| | | |
| | |
| Item 3. | | |
| | |
| Item 4. | | |
|
|
| | |
| Item 1. | | |
| | |
| Item 1A. | | |
| | |
| Item 2. | Unregistered Sales of Equity Securities and Use of Proceeds | |
| | |
| Item 6. | | |
| |
| |
| |
| |
FORWARD-LOOKING STATEMENTS
Forward looking statementsStatements in this report that are not based on historical facts are "forward-looking statements"“forward-looking statements” within the meaning of the Private Securities Litigation Reform Act of 1995.1995 and, accordingly, involve known and unknown risks and uncertainties that are difficult to predict and could cause our actual results, performance, or achievements to differ materially from those discussed. These statements include statements that reflectas to our current views with respect to, among other things, future expectations, beliefs, plans, strategies, objectives, events, conditions, financial performance, and market conditions.prospects, or future events. In some cases, youforward-looking statements can identify forward-looking statementsbe identified by the use of words such as “may,” “could,” “expect,” “intend,” “plan,” “seek,” “anticipate,” “believe,” “estimate,” “predict,” “potential,” “continue,” “likely,” “will,” “would” and variations of these terms“would”, and similar expressions,words and phrases. Forward-looking statements are necessarily based on estimates and assumptions that, while considered reasonable by us and our management, are inherently uncertain. Accordingly, you should not place undue reliance on forward-looking statements, which speak only as of the date they are made, and are not guarantees of future performance. We do not undertake any obligation to publicly update or the negative ofrevise these terms or similar expressions.forward-looking statements.
A detailed discussion of the known material risks and uncertainties that could cause actual results and events to differ materially from such forward-looking statements is included in our Annual Report on Form 10-K for the year ended December 31, 2015,2016, and in our other filings with the Securities and Exchange Commission ("SEC"). Specific risks and uncertainties include, but are not limitedThe following factors, in addition to (1) inability to maintain our assets on lease at satisfactory rates, (2) weak economic conditions, financial market volatility, and other factors that may decrease demand for our assets and services, (3) decreased demand for portions of our railcar fleet due to adverse changes in commodity prices, including, but not limited to, sustained low crude oil prices, (4) events having an adverse impact on assets, customers, or regions where we have a large investment, (5) operational disruption and increased costs associated with increased railcar assignments following non-renewal of leases, compliance maintenance programs, and other maintenance initiatives, (6) financial and operational risks associated with long-term railcar purchase commitments, (7) reduced opportunities to generate asset remarketing income, (8) changes in railroad efficiency that could decrease demand for railcars, (9) operational and financial risks related to our affiliate investments, including the RRPF affiliates, (10) fluctuations in foreign exchange rates, (11) failure to successfully negotiate collective bargaining agreements with the unions representing a substantial portion of our employees, (12) the impact of new regulatory requirements for tank cars carrying crude, ethanol, and other flammable liquids, (13) deterioration of conditions in the capital markets, reductionsthose discussed under "Risk Factors", in our credit ratings, or increases in our financing costs, (14) asset impairment charges we may be required to recognize, (15) competitive factors in our primary markets, (16) risks related to international operations and expansion into new geographic markets, (17) exposure to damages, fines, and civil and criminal penalties arising from a negative outcome in our pending or threatened litigation, (18) changes in, or failure to comply with, laws, rules, and regulations (19) inability to obtain cost-effective insurance, (20) environmental remediation costs, (21) inadequate allowances to cover credit losses in our portfolio, and (22) other risks discussed in our filings with the SEC, including our formAnnual Report on Form 10-K for the year ended December 31, 2015, all of which are available on the SEC's website (www.sec.gov).2016, could cause actual results to differ materially from our current expectations expressed in forward looking statements:
Investors should not place undue reliance on forward-looking statements, which speak only as of the date they are made, and are not guarantees of future performance. The Company undertakes no obligation to publicly update or revise these forward-looking statements. |
| | |
• exposure to damages, fines, criminal and civil penalties, and reputational harm arising from a negative outcome in litigation, including claims arising from an accident involving our railcars• inability to maintain our assets on lease at satisfactory rates due to oversupply of railcars in the market or other changes in supply and demand• weak economic conditions and other factors that may decrease demand for our assets and services• decreased demand for portions of our railcar fleet due to adverse changes in the price of, or demand for, commodities that are shipped in our railcars• higher costs associated with increased railcar assignments following non-renewal of leases, customer defaults, and compliance maintenance programs or other maintenance initiatives• events having an adverse impact on assets, customers, or regions where we have a concentrated investment exposure• financial and operational risks associated with long-term railcar purchase commitments• reduced opportunities to generate asset remarketing income• operational and financial risks related to our affiliate investments, including the Rolls-Royce & Partners Finance joint ventures (collectively the “RRPF affiliates”)• fluctuations in foreign exchange rates | | • failure to successfully negotiate collective bargaining agreements with the unions representing a substantial portion of our employees• changes in railroad operations that could decrease demand for railcars, either due to increased railroad efficiency or decreased attractiveness of rail service relative to other modes• the impact of regulatory requirements applicable to tank cars carrying crude, ethanol, and other flammable liquids• asset impairment charges we may be required to recognize• deterioration of conditions in the capital markets, reductions in our credit ratings, or increases in our financing costs• competitive factors in our primary markets, including competitors with a significantly lower cost of capital than GATX• risks related to international operations and expansion into new geographic markets• changes in, or failure to comply with, laws, rules, and regulations• inability to obtain cost-effective insurance• environmental remediation costs• inadequate allowances to cover credit losses in our portfolio• inability to maintain and secure our information technology infrastructure from cybersecurity threats and related disruption of our business |
PART I - FINANCIAL INFORMATION
Item 1.Financial Statements
GATX CORPORATION AND SUBSIDIARIES
CONSOLIDATED BALANCE SHEETS
(In millions, except share data)
| | | | March 31 | | December 31 | March 31 | | December 31 |
| | 2016 | | 2015 | 2017 | | 2016 |
| | (Unaudited) | | | (Unaudited) | | |
| Assets | | | | | | |
| Cash and Cash Equivalents | $ | 216.2 |
| | $ | 202.4 |
| $ | 155.2 |
| | $ | 307.5 |
|
| Restricted Cash | 17.3 |
| | 17.3 |
| 3.8 |
| | 3.6 |
|
| Receivables | | | | | | |
| Rent and other receivables | 71.0 |
| | 69.4 |
| 67.0 |
| | 85.9 |
|
| Loans | 7.7 |
| | 8.8 |
| |
| Finance leases | 166.2 |
| | 167.6 |
| 144.5 |
| | 147.7 |
|
| Less: allowance for losses | (10.3 | ) | | (10.3 | ) | (5.7 | ) | | (6.1 | ) |
| | 234.6 |
| | 235.5 |
| 205.8 |
| | 227.5 |
|
| | | | | | | |
Operating Assets and Facilities ($122.6 and $122.9 related to a consolidated VIE) | 8,440.4 |
| | 8,204.0 |
| |
| Less: allowance for depreciation ($40.8 and $39.7 related to a consolidated VIE) | (2,563.9 | ) | | (2,505.6 | ) | |
| Operating Assets and Facilities | | 8,631.1 |
| | 8,446.4 |
|
| Less: allowance for depreciation | | (2,666.1 | ) | | (2,641.7 | ) |
| | 5,876.5 |
| | 5,698.4 |
| 5,965.0 |
| | 5,804.7 |
|
Investments in Affiliated Companies | 356.3 |
| | 348.5 |
| 396.9 |
| | 387.0 |
|
Goodwill | 82.4 |
| | 79.7 |
| 78.7 |
| | 78.0 |
|
| Other Assets | 278.7 |
| | 312.4 |
| 291.5 |
| | 297.1 |
|
Total Assets | $ | 7,062.0 |
| | $ | 6,894.2 |
| $ | 7,096.9 |
| | $ | 7,105.4 |
|
| | | | | | | |
| Liabilities and Shareholders’ Equity | | | | | | |
Accounts Payable and Accrued Expenses | $ | 144.3 |
| | $ | 170.9 |
| $ | 143.3 |
| | $ | 174.8 |
|
| Debt | | | | | | |
| Commercial paper and borrowings under bank credit facilities | 17.9 |
| | 7.4 |
| 3.0 |
| | 3.8 |
|
| Recourse | 4,304.3 |
| | 4,171.5 |
| 4,250.9 |
| | 4,253.2 |
|
| Nonrecourse ($4.7 and $6.9 related to a consolidated VIE) | 4.7 |
| | 6.9 |
| |
| Capital lease obligations | 16.9 |
| | 18.4 |
| 13.5 |
| | 14.9 |
|
| | 4,343.8 |
| | 4,204.2 |
| 4,267.4 |
| | 4,271.9 |
|
Deferred Income Taxes | 1,049.2 |
| | 1,018.3 |
| 1,110.4 |
| | 1,089.4 |
|
Other Liabilities | 219.4 |
| | 220.6 |
| 190.6 |
| | 222.1 |
|
Total Liabilities | 5,756.7 |
| | 5,614.0 |
| 5,711.7 |
| | 5,758.2 |
|
| | | | | |
| Shareholders’ Equity | | | | | | |
Common stock, $0.625 par value: Authorized shares — 120,000,000 Issued shares — 66,886,672 and 66,776,290 Outstanding shares — 40,881,743 and 41,970,098 | 41.5 |
| | 41.5 |
| |
Common stock, $0.625 par value: Authorized shares — 120,000,000 Issued shares — 67,029,641 and 66,953,606 Outstanding shares — 39,093,265 and 39,442,893 | | 41.6 |
| | 41.5 |
|
| Additional paid in capital | 676.8 |
| | 677.4 |
| 690.7 |
| | 687.8 |
|
| Retained earnings | 1,689.9 |
| | 1,639.0 |
| 1,868.0 |
| | 1,828.0 |
|
| Accumulated other comprehensive loss | (173.9 | ) | | (198.8 | ) | (191.1 | ) | | (211.1 | ) |
| Treasury stock at cost (26,004,929 and 24,806,192 shares) | (929.0 | ) | | (878.9 | ) | |
| Treasury stock at cost (27,936,376 and 27,510,713 shares) | | (1,024.0 | ) | | (999.0 | ) |
Total Shareholders’ Equity | 1,305.3 |
| | 1,280.2 |
| 1,385.2 |
| | 1,347.2 |
|
| Total Liabilities and Shareholders’ Equity | $ | 7,062.0 |
| | $ | 6,894.2 |
| $ | 7,096.9 |
| | $ | 7,105.4 |
|
See accompanying notes to consolidated financial statements.
GATX CORPORATION AND SUBSIDIARIES
CONSOLIDATED STATEMENTS OF COMPREHENSIVE INCOME (Unaudited)
(In millions, except per share data)
| | | | Three Months Ended
March 31 | Three Months Ended March 31 |
| | 2016 | | 2015 | 2017 | | 2016 |
| Revenues | | | | | | |
| Lease revenue | $ | 284.5 |
| | $ | 278.3 |
| $ | 272.7 |
| | $ | 284.5 |
|
| Marine operating revenue | 20.3 |
| | 24.2 |
| 17.0 |
| | 20.3 |
|
| Other revenue | 29.6 |
| | 17.2 |
| 26.4 |
| | 29.6 |
|
| Total Revenues | 334.4 |
| | 319.7 |
| 316.1 |
| | 334.4 |
|
| Expenses | | | | | | |
| Maintenance expense | 78.5 |
| | 78.3 |
| 77.9 |
| | 78.5 |
|
| Marine operating expense | 12.3 |
| | 18.9 |
| 12.9 |
| | 12.3 |
|
| Depreciation expense | 69.3 |
| | 68.5 |
| 72.0 |
| | 69.3 |
|
| Operating lease expense | 16.8 |
| | 20.7 |
| 15.8 |
| | 16.8 |
|
| Other operating expense | 8.8 |
| | 7.3 |
| 9.6 |
| | 8.8 |
|
| Selling, general and administrative expense | 38.8 |
| | 45.7 |
| 42.9 |
| | 38.8 |
|
| Total Expenses | 224.5 |
| | 239.4 |
| 231.1 |
| | 224.5 |
|
| Other Income (Expense) | | | | | | |
| Net gain on asset dispositions | 23.2 |
| | 45.3 |
| 24.9 |
| | 23.2 |
|
| Interest expense, net | (37.2 | ) | | (40.9 | ) | (39.2 | ) | | (37.2 | ) |
| Other expense | (3.3 | ) | | (4.0 | ) | (1.3 | ) | | (3.3 | ) |
Income before Income Taxes and Share of Affiliates’ Earnings | 92.6 |
| | 80.7 |
| 69.4 |
| | 92.6 |
|
| Income Taxes | (30.8 | ) | | (27.0 | ) | |
| Share of Affiliates’ Earnings, Net of Taxes | 7.5 |
| | 8.5 |
| |
| Income taxes | | (20.6 | ) | | (30.8 | ) |
| Share of affiliates’ earnings, net of taxes | | 8.7 |
| | 7.5 |
|
Net Income | $ | 69.3 |
| | $ | 62.2 |
| $ | 57.5 |
| | $ | 69.3 |
|
| Other Comprehensive Income, Net of Taxes | | | | | | |
| Foreign currency translation adjustments | 25.9 |
| | (48.0 | ) | 17.9 |
| | 25.9 |
|
| Unrealized gain on securities | 0.1 |
| | — |
| — |
| | 0.1 |
|
| Unrealized loss on derivative instruments | (2.5 | ) | | (2.6 | ) | |
| Unrealized gain (loss) on derivative instruments | | 0.8 |
| | (2.5 | ) |
| Post-retirement benefit plans | 1.4 |
| | 2.1 |
| 1.3 |
| | 1.4 |
|
| Other comprehensive income (loss) | 24.9 |
| | (48.5 | ) | |
| Other comprehensive income | | 20.0 |
| | 24.9 |
|
Comprehensive Income | $ | 94.2 |
| | $ | 13.7 |
| $ | 77.5 |
| | $ | 94.2 |
|
| | | | | | | |
| Share Data | | | | | | |
| Basic earnings per share | $ | 1.67 |
| | $ | 1.41 |
| $ | 1.46 |
| | $ | 1.67 |
|
| Average number of common shares | 41.4 |
| | 44.1 |
| 39.4 |
| | 41.4 |
|
| | | | | | | |
| Diluted earnings per share | $ | 1.66 |
| | $ | 1.39 |
| $ | 1.44 |
| | $ | 1.66 |
|
| Average number of common shares and common share equivalents | 41.8 |
| | 44.8 |
| 39.9 |
| | 41.8 |
|
| | | | | | | |
| Dividends declared per common share | $ | 0.40 |
| | $ | 0.38 |
| $ | 0.42 |
| | $ | 0.40 |
|
See accompanying notes to consolidated financial statements.
GATX CORPORATION AND SUBSIDIARIES
CONSOLIDATED STATEMENTS OF CASH FLOWS (Unaudited)
(In millions)
| | | | Three Months Ended
March 31 | Three Months Ended March 31 |
| | 2016 | | 2015 | 2017 | | 2016 |
| Operating Activities | | | | | | |
| Net income | $ | 69.3 |
| | $ | 62.2 |
| $ | 57.5 |
| | $ | 69.3 |
|
| Adjustments to reconcile net income to net cash provided by operating activities: | | | | | | |
| Depreciation expense | 72.5 |
| | 71.7 |
| 75.2 |
| | 72.5 |
|
| Change in accrued operating lease expense | (21.1 | ) | | (47.4 | ) | (26.9 | ) | | (21.1 | ) |
| Net gains on sales of assets | (21.4 | ) | | (43.7 | ) | (24.5 | ) | | (21.4 | ) |
| Deferred income taxes | 25.8 |
| | 24.0 |
| 16.5 |
| | 25.8 |
|
| Change in income taxes payable | (9.0 | ) | | (0.7 | ) | (6.2 | ) | | (9.0 | ) |
| Share of affiliates’ earnings, net of dividends | (7.4 | ) | | (8.5 | ) | (8.7 | ) | | (7.4 | ) |
| Other | (31.2 | ) | | (1.8 | ) | (30.9 | ) | | (28.8 | ) |
| Net cash provided by operating activities | 77.5 |
| | 55.8 |
| 52.0 |
| | 79.9 |
|
| Investing Activities | | | | | | |
| Portfolio investments and capital additions | (140.2 | ) | | (180.9 | ) | (129.0 | ) | | (140.2 | ) |
| Purchases of leased-in assets | (92.8 | ) | | (99.5 | ) | (79.3 | ) | | (92.8 | ) |
| Portfolio proceeds | 98.4 |
| | 176.8 |
| 44.0 |
| | 98.4 |
|
| Proceeds from sales of other assets | 9.4 |
| | 8.6 |
| 7.6 |
| | 9.4 |
|
| Net increase in restricted cash | — |
| | (1.1 | ) | |
| Other | — |
| | 9.7 |
| |
| Net cash used in investing activities | (125.2 | ) | | (86.4 | ) | (156.7 | ) | | (125.2 | ) |
| Financing Activities | | | | | | |
| Net proceeds from issuances of debt (original maturities longer than 90 days) | 322.7 |
| | 667.7 |
| 297.9 |
| | 322.7 |
|
| Repayments of debt (original maturities longer than 90 days) | (202.3 | ) | | (381.1 | ) | (300.1 | ) | | (202.3 | ) |
| Net increase (decrease) in debt with original maturities of 90 days or less | 9.8 |
| | (69.1 | ) | |
| Net (decrease) increase in debt with original maturities of 90 days or less | | (0.8 | ) | | 9.8 |
|
| Stock repurchases | (50.0 | ) | | (25.3 | ) | (25.0 | ) | | (50.0 | ) |
| Dividends | (18.1 | ) | | (18.0 | ) | (18.4 | ) | | (18.1 | ) |
| Other | (1.6 | ) | | 2.9 |
| (2.3 | ) | | (4.0 | ) |
| Net cash provided by financing activities | 60.5 |
| | 177.1 |
| |
| Net cash (used in) provided by financing activities | | (48.7 | ) | | 58.1 |
|
| Effect of Exchange Rate Changes on Cash and Cash Equivalents | 1.0 |
| | (5.0 | ) | 1.3 |
| | 1.0 |
|
| Net increase in Cash and Cash Equivalents | 13.8 |
| | 141.5 |
| |
| Cash and Cash Equivalents, beginning of period | 202.4 |
| | 209.9 |
| |
| Cash and Cash Equivalents, end of period | $ | 216.2 |
| | $ | 351.4 |
| |
Net (decrease) increase in Cash, Cash Equivalents, and Restricted Cash during the period | | (152.1 | ) | | 13.8 |
|
| Cash, Cash Equivalents, and Restricted Cash at beginning of period | | 311.1 |
| | 219.7 |
|
| Cash, Cash Equivalents, and Restricted Cash at end of period | | $ | 159.0 |
| | $ | 233.5 |
|
See accompanying notes to consolidated financial statements.
GATX CORPORATION AND SUBSIDIARIES
NOTES TO CONSOLIDATED FINANCIAL STATEMENTS (UNAUDITED)
NOTE 1. Description of Business
As used herein, "GATX," "we," "us," "our," and similar terms refer to GATX Corporation and its subsidiaries, unless indicated otherwise.
We lease, operate, manage, and remarket long-lived, widely-used assets, primarily in the rail market. We also invest in joint ventures that complement our existing business activities. We report our financial results through four primary business segments: Rail North America, Rail International, American Steamship Company (“ASC”), and Portfolio Management.
NOTE 2. Basis of Presentation
We prepared the accompanying unaudited consolidated financial statements in accordance with US Generally Accepted Accounting Principles ("GAAP") for interim financial information and the instructions to Form 10-Q and Article 10 of Regulation S-X. Accordingly, our unaudited consolidated financial statements do not include all of the information and footnotes required for complete financial statements. We have included all of the normal recurring adjustments that we deemed necessary for a fair presentation.
Operating results for the three months ended March 31, 2016,2017, are not necessarily indicative of the results we may achieve for the entire year ending December 31, 2016.2017. In particular, ASC's fleet is inactive for a significant portion of the first quarter of each year due to winter conditions on the Great Lakes. In addition, asset remarketing income does not occur evenly throughout the year. For more information, refer to the consolidated financial statements and footnotes in our Annual Report on Form 10-K for the year ended December 31, 2015.2016.
Accounting Changes
Change in Accounting Estimate
At the end of 2015, we changed the approach used to measure service and interest costs for pension and other postretirement benefits. In prior years, the Company measured service and interest costs utilizing a single weighted-average discount rate derived from the yield curve used to measure the plan obligations. For 2016, we measured service and interest costs by applying the specific spot rates along that yield curve to the plans’ liability cash flows. The Company believes this approach provides a more precise measurement of service and interest costs by aligning the timing of the plans’ liability cash flows to the corresponding spot rates on the yield curve. This change does not affect the measurement of our plan obligations. The Company has accounted for this change as a change in accounting estimate and, accordingly, has accounted for it on a prospective basis. The Company's adoption of the full yield curve approach will reduce 2016 service and interest cost by approximately $4.5 million ($2.8 million after-tax) as compared to the previous method.
New Accounting Pronouncements Adopted
ConsolidationEquity Method and Joint Ventures
In February 2015,March 2016, the Financial Accounting Standards Board ("FASB") issued Accounting Standards Update ("ASU") 2015-02,2016-07, ConsolidationInvestments - Equity Method and Joint Ventures (Topic 810) Amendments323): Simplifying the Transition to the Consolidation AnalysisEquity Method of Accounting, which amendseliminates the analysis requiredrequirement to determine whether to consolidate certain types of legal entities such as limited partnerships, limited liability corporations, and certain securitization structures.retrospectively apply equity method accounting when an entity increases ownership or influence in a previously held investment. The new guidance was effective for us beginning in the first quarter of 2016.2017. Application of the new guidance did not impact our financial statements or related disclosures.
Stock Compensation
In March 2016, the FASB issued ASU 2016-09, Compensation - Stock Compensation (Topic 718): Improvements to Employee Share-Based Payment Accounting, which simplifies and clarifies certain aspects of share-based payment accounting and presentation. The update requires recognition of excess tax benefits and tax deficiencies, which arise due to differences between the measure of compensation expense and the amount deductible for tax purposes, to be recorded directly through earnings as a component of income tax expense. Previously, these differences were generally recorded in additional paid-in capital and thus had no impact on net income. The change in treatment of excess tax benefits and tax deficiencies also impacts the computation of diluted earnings per share, and the cash flows associated with those items are classified as operating activities on the consolidated statements of cash flows. The guidance also clarifies that all cash payments made to taxing authorities on the employees' behalf for withheld shares should be classified as financing activities on the consolidated statements of cash flows. Additionally, the guidance permits entities to make an accounting policy election for the impact of forfeitures on the recognition of expense for share-based payment awards. Forfeitures can be estimated, as allowed under the previous guidance, or recognized when they occur. We changed our accounting policy to recognize forfeitures when they occur as part of this adoption. These amendments became effective in the first quarter of 2017, and we adopted this guidance as of January 1, 2017. Adoption of this new standard did not have a material impact on our financial statements or related disclosures.
Statement of Cash Flows
In November 2016, the FASB issued ASU 2016-18, Statement of Cash Flows (Topic 230): Restricted Cash, which clarifies the classification and presentation of changes in restricted cash on the statement of cash flows. We elected to early adopt the new guidance as of January 1, 2017, using the retrospective method. Application of the new guidance requires presentation of restricted cash together with cash and cash equivalents on the consolidated statements of cash flows and eliminates the disclosure of the related changes in restricted cash within investing activities.
GATX CORPORATION AND SUBSIDIARIES
NOTES TO CONSOLIDATED FINANCIAL STATEMENTS (UNAUDITED) (Continued)
Business Combinations
In September 2015, the FASB issued ASU 2015-16, Business Combinations (Topic 805), Simplifying the Accounting for Measurement-Period Adjustments, which requires the acquirer in a business combination to recognize measurement-period adjustments in the period in which it determines the amount of the adjustment. The new guidance was effective for us in the first quarter of 2016. Application of the new guidance did not impact our financial statements or related disclosures.
New Accounting Pronouncements Not Yet Adopted
Revenue from Contracts with Customers
In May 2014, the FASB issued ASU 2014-09, Revenue from Contracts with Customers (Topic 606), which supersedes most current revenue recognition guidance, including industry-specific guidance. Subsequently, the FASB has issued updates which provide additional implementation guidance. The new guidance requires companies to recognize revenue to depict the transfer of promised goods or services to customers in an amount that reflects the consideration it expects to be entitled to in exchange for those goods or services. The FASB delayed the effective date of this guidance to the first quarter of 2018, with early adoption permitted as of the original effective date of the first quarter of 2017. We can adopt the new guidance using either the retrospective method or the cumulative effect transition method. We are evaluating the effect that the new guidance will have on our consolidated financial statements and related disclosures and when we will electplan to adopt this standard.guidance as of January 1, 2018 using the modified retrospective approach. Our primary source of revenue is lease revenue, which will continue to be within the scope of existing lease accounting guidance upon adoption of Topic 606. With respect to our other revenue elements, marine operating revenue is our biggest component. The new standard may modify the recognition timing of certain in-transit cargo revenue, but we do not expect such changes to have a material impact on our financial statements.
Leases
In February 2016, the FASB issued ASU 2016-02, Leases (Topic 842), which supersedes most current lease guidance. The new guidance requires companies to recognize most leases on the balance sheet and modifies accounting, presentation, and disclosure for both lessors and lessees. The new guidance is effective for us in the first quarter of 2019 with early adoption permitted, using a modified retrospective transition method. We plan to adopt this guidance on January 1, 2019, using a modified retrospective transition method. We are evaluating the effect that the new guidance will have on our consolidated financial statements and related disclosures and when we will elect to adopt this standard.disclosures.
Financial Instruments
In January 2016, the FASB issued ASU 2016-01, Financial Instruments - Overall:Overall (Topic 825): Recognition and Measurement of Financial Assets and Financial Liabilities, which modifies the accounting and reporting requirements for certain equity securities and financial liabilities. The new guidance is effective for us beginning in the first quarter of 2018 with certain provisions eligible for early adoption. We do not expect the new guidance to have a significant impact on our financial statements or related disclosures.
Equity Method and Joint VenturesCredit Losses
In MarchJune 2016, the FASB issued ASU 2016-07,2016-13, Investments - Equity Method and Joint VenturesCredit Losses (Topic 323)326): Simplifying the Transition to the Equity MethodMeasurement of AccountingCredit Losses on Financial Instruments, , which eliminates the requirement to retrospectively apply equity method accounting when an entity increases ownership or influence in a previously held investment.modifies how entities will measure credit losses. The new guidance is effective for us in the first quarter of 2017 with early adoption permitted. We do not expect the new guidance to impact our financial statements or related disclosures.
Stock Compensation
In March 2016, the FASB issued ASU 2016-09, Compensation - Stock Compensation (Topic 718): Improvements to Employee Share-Based Payment Accounting, which simplifies and clarifies certain aspects of share-based payment accounting and presentation. The new guidance is effective for us in the first quarter of 20172020 with early adoption permitted. We are evaluating the effect that the new guidance will have on our financial statements and related disclosures.
Statement of Cash Flows
In August 2016, the FASB issued ASU 2016-15, Statement of Cash Flows (Topic 230): Classification of Certain Cash Receipts and Cash Payments, which clarifies the classification of certain cash receipts and payments in the statement of cash flows. The new guidance is effective for us in the first quarter of 2018 with early adoption permitted. We do not expect the new guidance to have a significant impact on our financial statements or related disclosures.
Income Taxes
In October 2016, the FASB issued ASU 2016-16, Income Taxes (Topic 740): Intra-Entity Transfers of Assets Other Than Inventory, which modifies how an entity will recognize the income tax consequences of an intra-entity transfer of an asset when the transfer occurs. The new guidance is effective for us in the first quarter of 2018 with early adoption permitted. We are evaluating the effect that the new guidance will have on our financial statements and related disclosures.
GATX CORPORATION AND SUBSIDIARIES
NOTES TO CONSOLIDATED FINANCIAL STATEMENTS (UNAUDITED) (Continued)
Compensation
NOTE 3. Variable Interest EntitiesIn March 2017, the FASB issued ASU 2017-07, Compensation - Retirement Benefits (Topic 715): Improving the Presentation of Net Periodic Pension Cost and Net Periodic Postretirement Benefit Cost which modifies how an entity must present service costs and other components of net benefit cost. The new guidance is effective for us in the first quarter of 2018 with early adoption permitted. We are evaluating the effect the new guidance will have on our financial statements and related disclosures.
We are the primary beneficiary of one of our variable interest entities, a structured lease financing of a portfolio of railcars, because we have the power to direct its significant activities. As a result, we consolidate this variable interest entity. The risks associated with it are similar to those of our wholly owned railcar leasing activities.
The following table shows the carrying amounts of assets and liabilities of the consolidated variable interest entity (in millions):
|
| | | | | | | |
| | March 31 2016 | | December 31 2015 |
| Operating assets, net of accumulated depreciation (1) | $ | 81.8 |
| | $ | 83.2 |
|
| Nonrecourse debt | 4.7 |
| | 6.9 |
|
_________
| |
(1) | All operating assets are pledged as collateral on the nonrecourse debt. |
We determined that we are not the primary beneficiary of our other variable interest entities, which are primarily investments in aircraft spare engine leasing affiliates that were financed through a variety of equity investments and third-party lending arrangements. We are not the primary beneficiary of these variable interest entities because we do not have the power to direct the activities that most significantly impact the entities’ economic performance. Rather, that power was shared by the affiliate partners based on the terms of the relevant joint venture agreements, which require approval of all partners for significant decisions regarding the variable interest entity.
The following table shows the carrying amounts and maximum exposure to loss for our unconsolidated variable interest entities (in millions):
|
| | | | | | | | | | | | | | | |
| | March 31, 2016 | | December 31, 2015 |
| | Net Carrying Amount | | Maximum Exposure to Loss | | Net Carrying Amount | | Maximum Exposure to Loss |
| Investments in affiliates | $ | 167.2 |
| | $ | 167.2 |
| | $ | 161.2 |
| | $ | 161.2 |
|
| Other investment | 0.2 |
| | 0.2 |
| | 0.2 |
| | 0.2 |
|
| Total | $ | 167.4 |
| | $ | 167.4 |
| | $ | 161.4 |
| | $ | 161.4 |
|
NOTES TO CONSOLIDATED FINANCIAL STATEMENTS (UNAUDITED) (Continued)
NOTE 4.3. Fair Value Disclosure
The following tables show our assets and liabilities that are measured at fair value on a recurring basis (in millions):
| | | Assets | March 31 2016 | | Quoted Prices in Active Markets for Identical Assets (Level 1) | | Significant Observable Inputs (Level 2) | | Significant Unobservable Inputs (Level 3) | Total March 31 2017 | | Quoted Prices in Active Markets for Identical Assets (Level 1) | | Significant Observable Inputs (Level 2) | | Significant Unobservable Inputs (Level 3) |
| Interest rate derivatives (1) | $ | 6.3 |
| | $ | — |
| | $ | 6.3 |
| | $ | — |
| $ | 0.2 |
| | $ | — |
| | $ | 0.2 |
| | $ | — |
|
| Foreign exchange rate derivatives (1) | 6.2 |
| | — |
| | 6.2 |
| | — |
| 10.2 |
| | — |
| | 10.2 |
| | — |
|
| Foreign exchange rate derivatives (2) | 0.3 |
| | — |
| | 0.3 |
| | — |
| 0.3 |
| | — |
| | 0.3 |
| | — |
|
| Available-for-sale equity securities | 3.5 |
| | 3.5 |
| | — |
| | — |
| |
| Liabilities |
|
| | | | | | |
|
| | | | | | |
| Interest rate derivatives (1) | 9.4 |
| | — |
| | 9.4 |
| | — |
| 1.7 |
| | — |
| | 1.7 |
| | — |
|
| Foreign exchange rate derivatives (1) | 12.5 |
| | — |
| | 12.5 |
| | — |
| 0.3 |
| | — |
| | 0.3 |
| | — |
|
| Foreign exchange rate derivatives (2) | 3.5 |
| | — |
| | 3.5 |
| | — |
| 3.5 |
| | — |
| | 3.5 |
| | — |
|
| | | Assets | December 31 2015 | | Quoted Prices in Active Markets for Identical Assets (Level 1) | | Significant Observable Inputs (Level 2) | | Significant
Unobservable
Inputs
(Level 3) | Total December 31 2016 | | Quoted
Prices in
Active Markets for
Identical Assets
(Level 1) | | Significant Observable Inputs
(Level 2) | | Significant Unobservable
Inputs
(Level 3) |
| Interest rate derivatives (1) | $ | 1.8 |
| | $ | — |
| | $ | 1.8 |
| | $ | — |
| $ | 2.9 |
| | $ | — |
| | $ | 2.9 |
| | $ | — |
|
| Foreign exchange rate derivatives (1) | 10.2 |
| | — |
| | 10.2 |
| | — |
| 12.2 |
| | — |
| | 12.2 |
| | — |
|
| Foreign exchange rate derivatives (2) | 0.8 |
| | — |
| | 0.8 |
| | — |
| 1.3 |
| | — |
| | 1.3 |
| | — |
|
| Available-for-sale equity securities | 3.3 |
| | 3.3 |
| | — |
| | — |
| |
| | | | | | | | | |
| Liabilities | | | | | | | | | | | | | | |
| Interest rate derivatives (1) | 1.2 |
| | — |
| | 1.2 |
| | — |
| 0.1 |
| | — |
| | 0.1 |
| | — |
|
| Foreign exchange rate derivatives (1) | 0.2 |
| | — |
| | 0.2 |
| | — |
| |
| Foreign exchange rate derivatives (2) | 2.4 |
| | — |
| | 2.4 |
| | — |
| |
_________
(1) Designated as hedges.
(2) Not designated as hedges.
| |
| (2) | Not designated as hedges. |
We base our valuations of available-for-sale equity securities on their quoted prices on an active exchange. We value derivatives using a pricing model with inputs (such as yield curves and foreign currency rates) that are observable in the market or that can be derived principally from observable market data.
Derivative instruments
Fair Value Hedges
We use interest rate swaps to manage the fixed-to-floating rate mix of our debt obligations by converting the fixed rate debt to floating rate debt. For fair value hedges, we recognize changes in fair value of both the derivative and the hedged item as interest expense. WeAs of March 31, 2017, we had eight instruments outstanding with an aggregate notional amount of $450.0 million and maturities ranging from
GATX CORPORATION AND SUBSIDIARIES
NOTES TO CONSOLIDATED FINANCIAL STATEMENTS (UNAUDITED) (Continued)
2018 to 2022, compared to eight instruments outstanding, with an aggregate notional amount of $550.0 million as of March 31, 2016 and December 31, 2015 that maturematurities ranging from 2017 to 2020.
NOTES TO CONSOLIDATED FINANCIAL STATEMENTS (UNAUDITED) (Continued)
2020, as of December 31, 2016.
Cash Flow Hedges
We use interest rate swaps to convert floating rate debt to fixed rate debt. We use Treasury rate locks to hedge our exposure to interest rate risk on anticipated transactions. We also use currency swaps to hedge our exposure to fluctuations in the exchange rates of the foreign currencies in which we conduct business. We had fifteen instruments outstanding with an aggregate notional amount of $592.9$317.6 million as of March 31, 20162017 that mature from 20162017 to 2022 and tennine instruments outstanding with an aggregate notional amount of $442.9$412.1 million as of December 31, 2015.2016 with maturities ranging from 2017 to 2022. Within the next 12 months, we expect to reclassify $5.8$5.7 million ($3.63.5 million after-tax) of net losses on previously terminated derivatives from accumulated other comprehensive income (loss) to interest expense or operating lease expense, as applicable. We reclassify these amounts when interest and operating lease expense on the related hedged transactions affect earnings.
Non-designated Derivatives
We do not hold derivative financial instruments for purposes other than hedging, although certain of our derivatives are not designated as accounting hedges. We recognize changes in the fair value of these derivatives in other (income) expense immediately.
Some of our derivative instruments contain credit risk provisions that could require us to make immediate payment on net liability positions in the event that we default on certain outstanding debt obligations. The aggregate fair value of our derivative instruments with credit risk related contingent features that are in a liability position as of March 31, 2016,2017, was $21.9 million.$2.0 million. We are not required to post any collateral on our derivative instruments and do not expect the credit risk provisions to be triggered.
In the event that a counterparty fails to meet the terms of an interest rate swap agreement or a foreign exchange contract, our exposure is limited to the fair value of the swap, if in our favor. We manage the credit risk of counterparties by transacting with institutions that we consider financially sound and by avoiding concentrations of risk with a single counterparty. We believe that the risk of non-performance by any of our counterparties is remote.
The following table shows the impacts of our derivative instruments on our statementsstatement of comprehensive income (in millions):
| | | | | Three Months Ended March 31 | | | | Three Months Ended March 31 |
| Derivative Designation | | Location of Loss (Gain) Recognized | | 2016 | | 2015 | | Location of Loss (Gain) Recognized | | 2017 | | 2016 |
| Fair value hedges (1) | | Interest expense | | $ | (4.8 | ) | | $ | (2.3 | ) | | Interest expense | | $ | 2.1 |
| | $ | (4.8 | ) |
| Cash flow hedges | | Other comprehensive (income) loss (effective portion) | | (23.2 | ) | | (8.4 | ) | | Other comprehensive (income) loss (effective portion) | | (5.1 | ) | | (23.2 | ) |
| Cash flow hedges | | Interest expense (effective portion reclassified from accumulated other comprehensive loss) | | 1.7 |
| | 1.3 |
| | Interest expense (effective portion reclassified from accumulated other comprehensive loss) | | 1.7 |
| | 1.7 |
|
| Cash flow hedges | | Operating lease expense (effective portion reclassified from accumulated other comprehensive loss) | | 0.3 |
| | 0.1 |
| | Operating lease expense (effective portion reclassified from accumulated other comprehensive loss) | | — |
| | 0.3 |
|
| Cash flow hedges (2) | | Other (income) expense (effective portion reclassified from accumulated other comprehensive loss) | | 17.0 |
| | (8.4 | ) | | Other (income) expense (effective portion reclassified from accumulated other comprehensive loss) | | 4.1 |
| | 17.0 |
|
Non-designated (3) | | Other (income) expense | | 1.3 |
| | (4.2 | ) | | Other (income) expense | | 4.8 |
| | 1.3 |
|
_________
(1) The fair value adjustments related to the underlying debt equally offset amounts recognized in interest expense.
(2) For 2016, includes $17.0 million of losses on foreign currency derivatives which are substantially offset by gains from foreign currency remeasurement adjustments, also recognized in Other (income) expense. For 2015, includes $9.9 million of gain on foreign currency derivatives which are substantially offset by losses from foreign currency remeasurement adjustments, also recognized in Other (income) expense.
(3) For 2015, includes $5.1 million of gains on foreign currency derivatives which are substantially offset by losses from foreign currency remeasurement adjustments on the outstanding AAE loan, also recognized in Other (income) expense.
| |
| (1) | The fair value adjustments related to the underlying debt equally offset the amounts recognized in interest expense. |
| |
| (2) | Includes $4.1 million of losses in 2017 and $17.0 million of losses in 2016 on foreign currency derivatives which are substantially offset by gains from foreign currency remeasurement adjustments, also recognized in Other (income) expense. |
GATX CORPORATION AND SUBSIDIARIES
NOTES TO CONSOLIDATED FINANCIAL STATEMENTS (UNAUDITED) (Continued)
Other Financial Instruments
The carrying amounts of cash and cash equivalents, restricted cash, rent and other receivables, accounts payable, and commercial paper and bank credit facilities approximate fair value due to the short maturity of those instruments. We base the fair values of investment funds, which are accounted for under the cost method, on the best information available, which may include quoted investment fund values. We estimate the fair values of loans and fixed and floating rate debt using discounted cash flow analyses that are based on interest rates currently offered for loans with similar terms to borrowers of similar credit quality. The estimated fairinputs we use to estimate each of these values for these investments are classified in Level 2 of the fair value hierarchy because they are based on directly or indirectly observable inputs.
The following table shows the carrying amounts and fair values of our other financial instruments as of (in millions):
| | | | March 31, 2016 | | December 31, 2015 | March 31, 2017 | | December 31, 2016 |
| Carrying Amount | | Fair Value | | Carrying Amount | | Fair Value | Carrying Amount | | Fair Value | | Carrying Amount | | Fair Value |
| Assets | | | | | | | | | | | | | | |
| Investment funds | $ | 0.6 |
| | $ | 1.4 |
| | $ | 0.6 |
| | $ | 1.2 |
| $ | 0.6 |
| | $ | 1.1 |
| | $ | 0.6 |
| | $ | 1.2 |
|
| Loans | 7.7 |
| | 7.7 |
| | 8.8 |
| | 8.7 |
| 5.7 |
| | 5.7 |
| | 6.2 |
| | 6.2 |
|
| Liabilities | | | | | | | | | | | | | | |
| Recourse fixed rate debt | $ | 3,723.7 |
| | $ | 3,702.7 |
| | $ | 3,915.0 |
| | $ | 3,882.6 |
| $ | 3,857.0 |
| | $ | 3,902.9 |
| | $ | 3,858.5 |
| | $ | 3,852.6 |
|
| Recourse floating rate debt | 600.5 |
| | 567.3 |
| | 275.2 |
| | 264.6 |
| 418.6 |
| | 417.6 |
| | 417.8 |
| | 412.2 |
|
| Nonrecourse debt | 4.7 |
| | 4.7 |
| | 6.9 |
| | 7.1 |
| |
NOTE 5.4. Assets Held Forfor Sale
During the third quarter of 2015,As previously disclosed, we have made the decision to exit the majoritysell certain of our assets, including marine investments withinin the Portfolio Management segment including six chemical parcel tankers (the "Nordic Vessels"), most of the inland marine vessels, and our 50% interestrailcars in the Cardinal Marine joint venture. At that time,Rail North America segment. The following table summarizes the Nordic Vessels and the inland marine vessels were classified ascomponents of assets held for sale and adjusted to the lower of their respective carrying amounts or fair value less costs to dispose. Subsequently, certain of these marine investments were sold during the fourth quarter of 2015.(in millions):
|
| | | | | | | |
| | March 31 | | December 31 |
| | 2017 | | 2016 |
| Rail North America | $ | 27.2 |
| | $ | 43.9 |
|
| Portfolio Management | 45.6 |
| | 45.6 |
|
| | $ | 72.8 |
| | $ | 89.5 |
|
In the first quarter of 2016, we sold additional marine investments, including three of the Nordic Vessels and other inland marine vessels. Proceeds from sales completed in the first quarter of 2016 were $37.6 million, resulting in a gain of $2.4 million. As of March 31, 2016 and December 31, 2015, GATX had $70.6 million and $106.0 million ofAll assets classified as held for sale on the balance sheet, including $69.6 million and $103.4 million of marine assets heldare expected to be sold in the Portfolio Management segment.2017.
GATX CORPORATION AND SUBSIDIARIES
NOTES TO CONSOLIDATED FINANCIAL STATEMENTS (UNAUDITED) (Continued)
NOTE 6.5. Pension and Other Post-Retirement Benefits
The following table shows components of our pension and other post-retirement benefits expense for the three months ended March 31, 20162017 and 20152016 (in millions):
| | | | 2016 Pension
Benefits | | 2015 Pension
Benefits | | 2016 Retiree
Health
and Life | | 2015 Retiree
Health
and Life | 2017 Pension
Benefits | | 2016 Pension
Benefits | | 2017 Retiree
Health
and Life | | 2016 Retiree
Health
and Life |
| Service cost | $ | 1.6 |
| | $ | 1.7 |
| | $ | — |
| | $ | — |
| $ | 1.6 |
| | $ | 1.6 |
| | $ | — |
| | $ | — |
|
| Interest cost | 3.9 |
| | 4.9 |
| | 0.3 |
| | 0.4 |
| 3.8 |
| | 3.9 |
| | 0.2 |
| | 0.3 |
|
| Expected return on plan assets | (6.5 | ) | | (6.5 | ) | | — |
| | — |
| (6.0 | ) | | (6.5 | ) | | — |
| | — |
|
| Amortization of (1): | | | | | | | | | | | | | | |
| Unrecognized prior service credit | (0.2 | ) | | (0.2 | ) | | (0.1 | ) | | — |
| — |
| | (0.2 | ) | | — |
| | (0.1 | ) |
| Unrecognized net actuarial loss | 2.6 |
| | 3.5 |
| | — |
| | — |
| |
| Unrecognized net actuarial loss (gain) | | 2.3 |
| | 2.6 |
| | (0.1 | ) | | — |
|
| Net expense | $ | 1.4 |
| | $ | 3.4 |
| | $ | 0.2 |
| | $ | 0.4 |
| $ | 1.7 |
| | $ | 1.4 |
| | $ | 0.1 |
| | $ | 0.2 |
|
_________________
(1) Amounts reclassified from accumulated other comprehensive loss.
NOTES TO CONSOLIDATED FINANCIAL STATEMENTS (UNAUDITED) (Continued)
The decrease in pension expense was primarily due to a prospective change in accounting estimate. See "Note 2. Basis of Presentation" for further details about this change in accounting estimate.
NOTE 7.6. Share-Based Compensation
During the first quarter of 2016,three months ended March 31, 2017, we granted 466,900354,400 non-qualified employee stock options, 77,40049,840 restricted stock units, 95,10063,710 performance shares, and 7,7996,121 phantom stock units. For the three months ended March 31, 2017, total share-based compensation expense was $3.2 million and the related tax benefits were $1.2 million. For the three months ended March 31, 2016, total share-based compensation expense was $3.0 million and the related tax benefits were $1.1 million. For the three months ended March 31, 2015, total share-based compensation expense was $2.9 million and the related tax benefits were $1.1 million.
The estimated fair value of our 20162017 stock option awards and related underlying assumptions are shown in the table below.
| | | | 2016 | 2017 |
| Estimated fair value | $ | 13.86 |
| |
| Estimated fair value, including present value of dividends | | $ | 19.40 |
|
| Quarterly dividend rate | $ | 0.40 |
| $ | 0.42 |
|
| Expected term of stock appreciation rights, in years | 4.7 |
| |
| Expected term of stock option awards, in years | | 4.7 |
|
| Risk-free interest rate | 1.4 | % | 1.9 | % |
| Dividend yield | 4.1 | % | 2.8 | % |
| Expected stock price volatility | 29.4 | % | 27.7 | % |
| Present value of dividends | $ | 7.27 |
| $ | 7.50 |
|
NOTE 8.7. Income Taxes
Our effective tax rate was 33%30% for each of the three months ended March 31, 2016 and2017, compared to 33% for three months ended March 31, 2015.2016. The difference in the effective rates for each period,the current year compared to the statutory rate of 35%,prior year is primarily attributable to the mix of pretax income in each year among domestic and foreign jurisdictions which are taxed at different rates. In addition, the effective tax rate reflects incremental benefits associated with equity awards in accordance with new accounting rules, as well as the impact on deferred taxes of reductions in the statutory tax rates in Quebec, Canada and India.
As of March 31, 2016,2017, our gross liability for unrecognized tax benefits was $4.3 million. If fully recognized, these tax benefits would decrease our income tax expense by $4.3 million ($2.8 million, net of federal tax). DuringBased upon the three months ended March 31, 2016,status of current state income tax audits and our expectation of the ultimate resolution, we reduced our unrecognizedbelieve that it is reasonably possible that we will recognize a tax benefit by $1.4of $4.3 million based on a final determination ruling for a disputed state tax filing position. None($2.8 million, net of this amount was recognized in net income. We do not anticipate the recognition of tax benefits that were previously unrecognizedfederal tax) within the next 12 months.
GATX CORPORATION AND SUBSIDIARIES
NOTES TO CONSOLIDATED FINANCIAL STATEMENTS (UNAUDITED) (Continued)
NOTE 9.8. Commercial Commitments
We have entered into various commercial commitments, such as guarantees, standby letters of credit, and performance bonds, related to certain transactions. These commercial commitments require us to fulfill specific obligations in the event of third-party demands. Similar to our balance sheet investments, these commitments expose us to credit, market, and equipment risk. Accordingly, we evaluate these commitments and other contingent obligations using techniques similar to those we use to evaluate funded transactions.
The following table shows our commercial commitments (in millions):
| | | | | | | March 31 | | December 31 |
| | March 31
2016 | | December 31
2015 | 2017 | | 2016 |
| Lease payment guarantees | $ | 19.5 |
| | $ | 22.1 |
| $ | 11.7 |
| | $ | 15.0 |
|
| Standby letters of credit and performance bonds | 8.9 |
| | 8.9 |
| 8.9 |
| | 8.9 |
|
| Total commercial commitments (1) | $ | 28.4 |
| | $ | 31.0 |
| $ | 20.6 |
| | $ | 23.9 |
|
________________
(1) The carrying value of liabilities on the balance sheet for commercial commitments was $3.9 million at March 31, 2016 and $4.1 million at December 31, 2015. | |
| (1) | The carrying value of liabilities on the balance sheet for commercial commitments was $2.8 million at March 31, 2017 and $3.0 million at December 31, 2016. The expirations of these commitments range from 2017 to 2023. We are not aware of any event that would require us to satisfy any of our commitments. |
Lease payment guarantees are commitments to financial institutions to make lease payments for a third-partythird party in the event they default. We reduce any liability that may result from these guarantees by the value of the underlying asset or group of assets.
We are also parties to standby letters of credit and performance bonds, which primarily relate to contractual obligations and general liability insurance coverages. No material claims have been made against these obligations, and no material losses are anticipated.
NOTE 10.9. Earnings per Share
We compute basic earnings per share by dividing net income available to our common shareholders by the weighted average number of shares of our common stock outstanding. We appropriately weighted shares issued or reacquired during the period for the portion of the period that they were outstanding. Our diluted earnings per share reflect the impacts of our potentially dilutive securities, which include our equity compensation awards.
In 2015, we completed our $250 million share repurchase authorization approved in 2014. On January 29, 2016, our board of directors authorized a new $300 million stock repurchase program. As of March 31, 2016, 1.2 million shares had been repurchased for $50.0 million.
NOTES TO CONSOLIDATED FINANCIAL STATEMENTS (UNAUDITED) (Continued)
The following table shows the computation of our basic and diluted net income per common share (in millions, except per share amounts):
| | | | Three Months Ended
March 31 | Three Months Ended March 31 |
| | 2016 | | 2015 | 2017 | | 2016 |
| Numerator: | | | | | | |
| Net income | $ | 69.3 |
| | $ | 62.2 |
| $ | 57.5 |
| | $ | 69.3 |
|
| | | | | |
| Denominator: | | | | | | |
| Weighted average shares outstanding - basic | 41.4 |
| | 44.1 |
| 39.4 |
| | 41.4 |
|
| Effect of dilutive securities: | | | | | | |
| Equity compensation plans | 0.4 |
| | 0.7 |
| 0.5 |
| | 0.4 |
|
| Weighted average shares outstanding - diluted | 41.8 |
| | 44.8 |
| 39.9 |
| | 41.8 |
|
| Basic earnings per share | $ | 1.67 |
| | $ | 1.41 |
| $ | 1.46 |
| | $ | 1.67 |
|
| Diluted earnings per share | $ | 1.66 |
| | $ | 1.39 |
| $ | 1.44 |
| | $ | 1.66 |
|
GATX CORPORATION AND SUBSIDIARIES
NOTES TO CONSOLIDATED FINANCIAL STATEMENTS (UNAUDITED) (Continued)
NOTE 11.10. Accumulated Other Comprehensive Income (Loss)
The following table shows the change in components for accumulated other comprehensive loss (in millions):
|
| | | | | | | | | | | | | | | | | | | |
| Foreign Currency Translation Gain (Loss) | | Unrealized Gain (Loss) on Securities | | Unrealized Gain (Loss) on Derivative Instruments | | Post-Retirement Benefit Plans | | Total |
| Balance at December 31, 2015 | $ | (77.7 | ) | | $ | (0.3 | ) | | $ | (20.9 | ) | | $ | (99.9 | ) | | $ | (198.8 | ) |
| Change in component | 25.9 |
| | 0.1 |
| | (23.2 | ) | | — |
| | 2.8 |
|
| Reclassification adjustments into earnings | — |
| | — |
| | 19.0 |
| | 2.3 |
| | 21.3 |
|
| Income tax effect | — |
| | — |
| | 1.7 |
| | (0.9 | ) | | 0.8 |
|
| Balance at March 31, 2016 | $ | (51.8 | ) | | $ | (0.2 | ) | | $ | (23.4 | ) | | $ | (98.5 | ) | | $ | (173.9 | ) |
________ |
| | | | | | | | | | | | | | | | | | | |
| Foreign Currency Translation Gain (Loss) | | Unrealized Gain (Loss) on Securities | | Unrealized Gain (Loss) on Derivative Instruments | | Post-Retirement Benefit Plans | | Total |
| Balance at December 31, 2016 | (103.7 | ) | | — |
| | (20.3 | ) | | (87.1 | ) | | (211.1 | ) |
| Change in component | 17.9 |
| | — |
| | (5.1 | ) | | — |
| | 12.8 |
|
| Reclassification adjustments into earnings | — |
| | — |
| | 5.8 |
| | 2.2 |
| | 8.0 |
|
| Income tax effect | — |
| | — |
| | 0.1 |
| | (0.9 | ) | | (0.8 | ) |
| Balance at March 31, 2017 | $ | (85.8 | ) | | $ | — |
| | $ | (19.5 | ) | | $ | (85.8 | ) | | $ | (191.1 | ) |
________
See "Note 4. 3. Fair Value Disclosure"Disclosure" and "Note 6. 5. Pension and Other Post-Retirement Benefits"Benefits" for impacts of the reclassification adjustments on the statement of comprehensive income.
NOTE 12.11. Legal Proceedings and Other Contingencies
Various legal actions, claims, assessments and other contingencies arising in the ordinary course of business are pending against GATX and certain of our subsidiaries. These matters are subject to many uncertainties, and it is possible that some of these matters could ultimately be decided, resolved or settled adversely. For a full discussion of our pending legal matters, please refer to "Note 24.22. Legal Proceedings and Other Contingencies" of our consolidated financial statements in our Annual Report on Form 10-K for the year ended December 31, 2015.2016.
Viareggio Derailment
In June 2009, a train consisting of fourteen liquefied petroleum gas (“LPG”) tank cars owned by GATX Rail Austria GmbH (an indirect subsidiary of the Company, "GATX Rail Austria") and its subsidiaries derailed while passing through the City of Viareggio, in the province of Lucca, Italy. Five tank cars overturned and one of the overturned cars was punctured by a peg or obstacle along the side of the track, resulting in a release of LPG, which subsequently ignited. Thirty-two people died and others were injured in the fire, which also resulted in property damage. The LPG tank cars were leased to FS Logistica S.p.A., a subsidiary of the Italian state-owned railway, Ferrovie dello Stato S.p.A (the “Italian Railway”).
NOTES TO CONSOLIDATED FINANCIAL STATEMENTS (UNAUDITED) (Continued)
On December 14, 2012, the Public Prosecutors of Lucca ("Public Prosecutors") formally charged GATX Rail Austria and two of its subsidiaries (collectively, "GRA"), as well as ten maintenance and supervisory employees (the "Employees"), with various negligence-based crimes related to the accident, all of which are punishable under Italian law by incarceration, damages, and fines. Similar charges were brought against four Italian Railway companies and eighteen of their employees, among others. The Public Prosecutors assert that the axle on a tank car broke, causing the derailment and resulting in a tank rupture and release of LPG, after the car hit an obstacle placed on the side of the track by the Italian Railway. The Public Prosecutors further allege that a crack in the axle was detectable at the time of final inspection but was overlooked by the Employees at the Jungenthal Waggon GmbH workshop (a subsidiary of GATX Rail Austria). The trial in the Court of Lucca (the “Lucca Trial”) commenced on November 13, 2013.
With respect to civil claims, GRA’s insurers continue to work cooperatively with the insurer for the Italian Railway to adjust and settle personal injury and property damage claims. These joint settlement efforts have so far settled most of the significant civil claims related to the accident; however, approximately 80 civil claimants did not settle and are currently parties to the Lucca Trial. The Court of Lucca will determine both the civil and criminal liability of the defendants in the one proceeding. GRA expects that its insurers will cover any civil damages if awarded to the claimants in the Lucca trial. The Public Prosecutors and civil claimants have finished presenting their cases in the Lucca Trial. GRA, the Italian Railway, and the other defendants in the Lucca Trial began presenting the defense of their cases on September 16, 2015, which presentations are currently underway.
Since May 2012, one of the excess insurers providing coverage, Liberty Mutual Insurance Europe Limited (“Liberty”), settled civil claims but refused to reimburse GRA for its ongoing legal defense fees and costs, taking a position contrary to our other insurers in the prior underlying layers that had provided coverage for such expenses. As of March 31, 2016, GRA had incurred approximately $14.7 million in unreimbursed defense fees and costs, and GRA continues to incur costs in connection with the Lucca Trial. Consequently, in October 2013, GRA filed an arbitration proceeding against Liberty seeking to recoup its unreimbursed defense fees and costs (the “Liberty Arbitration”), which was heard in November 2015. GRA received a partial arbitration award in its favor and anticipates reimbursement of a portion its defense costs in relation to the Lucca Trial. GRA is currently negotiating issues of reimbursement for outstanding defense costs with the insurers in the current coverage layer, which also includes a 25% share held by Liberty.
While GRA believes that it and its Employees acted diligently and properly, we cannot predict the outcome of the Lucca Trial, the negotiations with our insurers, or what other legal proceedings or claims, if any, may be initiated against GRA or its personnel, and, therefore, cannot reasonably estimate the possible amount or range of loss that may ultimately be incurred in connection with this accident.
GATX CORPORATION AND SUBSIDIARIES
NOTES TO CONSOLIDATED FINANCIAL STATEMENTS (UNAUDITED) (Continued)
NOTE 1312. Financial Data of Business Segments
The financial data presented below depicts the profitability, financial position, and capital expenditures of each of our business segments.
We lease, operate, manage, and remarket long-lived, widely-used assets, primarily in the rail market. We also invest in joint ventures that complement our existing business activities. We report our financial results through four primary business segments: Rail North America, Rail International, ASC,American Steamship Company (“ASC”), and Portfolio Management.
Rail North America is composed of our wholly owned operations in the United States, Canada, and Mexico, as well as an affiliate investment. Rail North America primarily provides railcars pursuant to full-service leases under which it maintains the railcars, pays ad valorem taxes and insurance, and provides other ancillary services.
Rail International is composed of our wholly owned European operations ("GATX Rail Europe" or "GRE"), and a wholly owned railcar leasing business in India ("Rail India"), as well as one development stage affiliateand our operations in China.Russia. GRE leases railcars to customers throughout Europe pursuant to full-service leases under which it maintains the railcars and provides value-adding services according to customer requirements.
ASC operates the largest fleet of US-flagged vessels on the Great Lakes, providing waterborne transportation of dry bulk commodities such as iron ore, coal, limestone aggregates, and metallurgical limestone.
Portfolio Management generatesis composed primarily of our ownership in a group of joint ventures with Rolls-Royce plc that lease aircraft spare engines, as well as five liquefied gas carrying vessels and assorted other marine assets. In prior years, Portfolio Management generated leasing, marine operating, asset remarketing, and management fee income through a collection of diversified wholly owned assets and joint venture investments. We are in the process of disposing of the majority of the marine investments and managed assets.in this segment.
Segment profit is an internal performance measure used by the Chief Executive Officer to assess the performance of each segment in a given period. Segment profit includes all revenues, pretax earnings from affiliates, and net gains on asset dispositions that are attributable to the segments, as well as expenses that management believes are directly associated with the financing, maintenance, and operation of the revenue earning assets. Segment profit excludes selling, general and administrative expenses, income taxes, and certain other amounts not allocated to the segments. These amounts are included in Other.
We allocate debt balances and related interest expense to each segment based upon predetermined debt to equity leverage ratios. Due to changes in the composition of our segments, we have modified segment leverage levels for 2016. The leverage levels for 2016 are 5:1 for Rail North America, 3:1 for Rail International, 1.5:1 for ASC, and 1:1 for Portfolio Management. The leverage levels for 2015 were 5:1 for Rail North America, 2:1 for Rail International, 1.5:1 for ASC, and 3:1 for Portfolio Management. We believe that by using this leverage and interest expense allocation methodology, each operating segment’s financial performance reflects appropriate risk-adjusted borrowing costs.costs.
GATX CORPORATION AND SUBSIDIARIES
NOTES TO CONSOLIDATED FINANCIAL STATEMENTS (UNAUDITED) (Continued)
The following tables show certain segment data for each of our business segments (in millions):
|
| | | | | | | | | | | | | | | | | | | | | | | |
|
Rail North America | |
Rail International | |
ASC | |
Portfolio Management | | Other | | GATX Consolidated |
| Three Months Ended March 31, 2016 | | | | | | | | | | |
| Profitability | | | | | | | | | | | |
| Revenues | | | | | | | | | | | |
| Lease revenue | $ | 236.6 |
| | $ | 44.9 |
| | $ | 1.0 |
| | $ | 2.0 |
| | $ | — |
| | $ | 284.5 |
|
| Marine operating revenue | — |
| | — |
| | 4.1 |
| | 16.2 |
| | — |
| | 20.3 |
|
| Other revenue | 27.8 |
| | 1.6 |
| | — |
| | 0.2 |
| | — |
| | 29.6 |
|
Total Revenues | 264.4 |
| | 46.5 |
| | 5.1 |
| | 18.4 |
| | — |
| | 334.4 |
|
| Expenses | | | | | | | | | | | |
| Maintenance expense | 65.8 |
| | 12.5 |
| | 0.2 |
| | — |
| | — |
| | 78.5 |
|
| Marine operating expense | — |
| | — |
| | 2.9 |
| | 9.4 |
| | — |
| | 12.3 |
|
| Depreciation expense | 56.5 |
| | 11.1 |
| | — |
| | 1.7 |
| | — |
| | 69.3 |
|
| Operating lease expense | 16.8 |
| | — |
| | — |
| | — |
| | — |
| | 16.8 |
|
| Other operating expense | 6.9 |
| | 1.4 |
| | — |
| | 0.5 |
| | — |
| | 8.8 |
|
| Total Expenses | 146.0 |
| | 25.0 |
| | 3.1 |
| | 11.6 |
| | — |
| | 185.7 |
|
| Other Income (Expense) | | | | | | | | | | | |
| Net gain on asset dispositions | 18.6 |
| | 0.7 |
| | — |
| | 3.9 |
| | — |
| | 23.2 |
|
| Interest (expense) income, net | (27.2 | ) | | (7.3 | ) | | (1.1 | ) | | (2.2 | ) | | 0.6 |
| | (37.2 | ) |
| Other (expense) income | (1.3 | ) | | (2.2 | ) | | — |
| | — |
| | 0.2 |
| | (3.3 | ) |
| Share of affiliates' earnings (pretax) | 0.2 |
| | (0.1 | ) | | — |
| | 10.1 |
| | — |
| | 10.2 |
|
| Segment Profit | $ | 108.7 |
| | $ | 12.6 |
| | $ | 0.9 |
| | $ | 18.6 |
| | $ | 0.8 |
| | 141.6 |
|
| Selling, general and administrative expense | 38.8 |
|
| Income taxes (including $2.7 related to affiliates' earnings) | 33.5 |
|
| Net Income | $ | 69.3 |
|
| | | | | | | | | | | | |
| Net Gain on Asset Dispositions | | | | | | | | | | | |
| Asset Remarketing Income: | | | | | | | | | | | |
| Disposition gains on owned assets | $ | 17.6 |
| | $ | — |
| | $ | — |
| | $ | 2.4 |
| | $ | — |
| | $ | 20.0 |
|
| Residual sharing income | 0.3 |
| | — |
| | — |
| | 1.5 |
| | — |
| | 1.8 |
|
| Non-remarketing disposition gains (1) | 0.7 |
| | 0.7 |
| | — |
| | — |
| | — |
| | 1.4 |
|
| Asset impairment | — |
| | — |
| | — |
| | — |
| | — |
| | — |
|
| | $ | 18.6 |
| | $ | 0.7 |
| | $ | — |
| | $ | 3.9 |
| | $ | — |
| | $ | 23.2 |
|
| Capital Expenditures | | | | | | | | | | | |
| Portfolio investments and capital additions | $ | 112.9 |
| | $ | 22.0 |
| | $ | 4.7 |
| | $ | — |
| | $ | 0.6 |
| | $ | 140.2 |
|
| | | | | | | | | | | | |
| Selected Balance Sheet Data at March 31, 2016 | | | | | | | | |
| Investments in affiliated companies | $ | 10.9 |
| | $ | 1.4 |
| | $ | — |
| | $ | 344.0 |
| | $ | — |
| | $ | 356.3 |
|
| Identifiable assets | $ | 4,756.5 |
| | $ | 1,194.2 |
| | $ | 278.6 |
| | $ | 605.8 |
| | $ | 226.9 |
| | $ | 7,062.0 |
|
_____ |
| | | | | | | | | | | | | | | | | | | | | | | |
|
Rail North America | |
Rail International | |
ASC | |
Portfolio Management | | Other | | GATX Consolidated |
| Three Months Ended March 31, 2017 | | | | | | | | | | | |
| Profitability | | | | | | | | | | | |
| Revenues | | | | | | | | | | | |
| Lease revenue | $ | 227.2 |
| | $ | 43.3 |
| | $ | 1.0 |
| | $ | 1.2 |
| | $ | — |
| | $ | 272.7 |
|
| Marine operating revenue | — |
| | — |
| | 6.4 |
| | 10.6 |
| | — |
| | 17.0 |
|
| Other revenue | 24.8 |
| | 1.1 |
| | — |
| | 0.5 |
| | — |
| | 26.4 |
|
Total Revenues | 252.0 |
| | 44.4 |
| | 7.4 |
| | 12.3 |
| | — |
| | 316.1 |
|
| Expenses | | | | | | | | | | | |
| Maintenance expense | 67.7 |
| | 10.0 |
| | 0.2 |
| | — |
| | — |
| | 77.9 |
|
| Marine operating expense | — |
| | — |
| | 5.3 |
| | 7.6 |
| | — |
| | 12.9 |
|
| Depreciation expense | 59.0 |
| | 11.2 |
| | 0.1 |
| | 1.7 |
| | — |
| | 72.0 |
|
| Operating lease expense | 15.0 |
| | — |
| | 0.8 |
| | — |
| | — |
| | 15.8 |
|
| Other operating expense | 8.1 |
| | 1.2 |
| | — |
| | 0.3 |
| | — |
| | 9.6 |
|
| Total Expenses | 149.8 |
| | 22.4 |
| | 6.4 |
| | 9.6 |
| | — |
| | 188.2 |
|
| Other Income (Expense) | | | | | | | | | | | |
| Net gain on asset dispositions | 23.8 |
| | 0.8 |
| | — |
| | 0.3 |
| | — |
| | 24.9 |
|
| Interest (expense) income, net | (31.1 | ) | | (7.9 | ) | | (1.2 | ) | | (2.2 | ) | | 3.2 |
| | (39.2 | ) |
| Other (expense) income | (2.0 | ) | | (1.5 | ) | | — |
| | 2.3 |
| | (0.1 | ) | | (1.3 | ) |
| Share of affiliates' pretax income | 0.1 |
| | — |
| | — |
| | 11.6 |
| | — |
| | 11.7 |
|
| Segment profit (loss) | $ | 93.0 |
| | $ | 13.4 |
| | $ | (0.2 | ) | | $ | 14.7 |
| | $ | 3.1 |
| | 124.0 |
|
| Selling, general and administrative expense | 42.9 |
|
| Income taxes (includes $3.0 related to affiliates' earnings) | 23.6 |
|
| Net income | $ | 57.5 |
|
| | | | | | | | | | | | |
| Net Gain on Asset Dispositions | | | | | | | | | | | |
| Asset Remarketing Income: | | | | | | | | | | | |
| Disposition gains on owned assets | $ | 21.1 |
| | $ | — |
| | $ | — |
| | $ | — |
| | $ | — |
| | $ | 21.1 |
|
| Residual sharing income | 0.1 |
| | — |
| | — |
| | 0.3 |
| | — |
| | 0.4 |
|
| Non-remarketing disposition gains (1) | 2.6 |
| | 0.8 |
| | — |
| | — |
| | — |
| | 3.4 |
|
| Asset impairments | — |
| | — |
| | — |
| | — |
| | — |
| | — |
|
| | $ | 23.8 |
| | $ | 0.8 |
| | $ | — |
| | $ | 0.3 |
| | $ | — |
| | $ | 24.9 |
|
| | | | | | | | | | | | |
| Capital Expenditures | | | | | | | | | | | |
| Portfolio investments and capital additions | $ | 102.8 |
| | $ | 18.7 |
| | $ | 7.3 |
| | $ | — |
| | $ | 0.2 |
| | $ | 129.0 |
|
| | | | | | | | | | | | |
| Selected Balance Sheet Data at March 31, 2017 | | | | | | | | | | |
| Investments in affiliated companies | $ | 10.5 |
| | $ | 1.2 |
| | $ | — |
| | $ | 385.2 |
| | $ | — |
| | $ | 396.9 |
|
| Identifiable assets | $ | 4,862.5 |
| | $ | 1,169.7 |
| | $ | 306.9 |
| | $ | 600.0 |
| | $ | 157.8 |
| | $ | 7,096.9 |
|
__________
(1) Includes scrapping gains.
GATX CORPORATION AND SUBSIDIARIES
NOTES TO CONSOLIDATED FINANCIAL STATEMENTS (UNAUDITED) (Continued)
|
| | | | | | | | | | | | | | | | | | | | | | | |
|
Rail North America | |
Rail International | |
ASC | |
Portfolio Management | | Other | | GATX Consolidated |
| Three Months Ended March 31, 2015 | | | | | | | | | | |
| Profitability | | | | | | | | | | | |
| Revenues | | | | | | | | | | | |
| Lease revenue | $ | 228.5 |
| | $ | 42.1 |
| | $ | 1.0 |
| | $ | 6.7 |
| | $ | — |
| | $ | 278.3 |
|
| Marine operating revenue | — |
| | — |
| | 7.0 |
| | 17.2 |
| | — |
| | 24.2 |
|
| Other revenue | 14.7 |
| | 1.9 |
| | — |
| | 0.6 |
| | — |
| | 17.2 |
|
Total Revenues | 243.2 |
| | 44.0 |
| | 8.0 |
| | 24.5 |
| | — |
| | 319.7 |
|
| Expenses | | | | | | | | | | | |
| Maintenance expense | 69.2 |
| | 8.9 |
| | 0.2 |
| | — |
| | — |
| | 78.3 |
|
| Marine operating expense | — |
| | — |
| | 6.9 |
| | 12.0 |
| | — |
| | 18.9 |
|
| Depreciation expense | 52.3 |
| | 10.7 |
| | — |
| | 5.5 |
| | — |
| | 68.5 |
|
| Operating lease expense | 20.7 |
| | — |
| | — |
| | — |
| | — |
| | 20.7 |
|
| Other operating expense | 5.5 |
| | 0.9 |
| | — |
| | 0.9 |
| | — |
| | 7.3 |
|
| Total Expenses | 147.7 |
| | 20.5 |
| | 7.1 |
| | 18.4 |
| | — |
| | 193.7 |
|
| Other Income (Expense) | | | | | | | | | | | |
| Net gain (loss) on asset dispositions | 36.8 |
| | 4.9 |
| | — |
| | 3.6 |
| | — |
| | 45.3 |
|
| Interest expense, net | (24.5 | ) | | (6.5 | ) | | (1.3 | ) | | (5.2 | ) | | (3.4 | ) | | (40.9 | ) |
| Other expense | (2.2 | ) | | — |
| | — |
| | — |
| | (1.8 | ) | | (4.0 | ) |
| Share of affiliates' earnings (pretax) | 0.2 |
| | (0.1 | ) | | — |
| | 11.4 |
| | — |
| | 11.5 |
|
| Segment Profit (Loss) | $ | 105.8 |
| | $ | 21.8 |
| | $ | (0.4 | ) | | $ | 15.9 |
| | $ | (5.2 | ) | | 137.9 |
|
| Selling, general and administrative expense | 45.7 |
|
| Income taxes (including $3.0 related to affiliates' earnings) | 30.0 |
|
| Net Income | $ | 62.2 |
|
| | | | | | | | | | | | |
| Net Gain (Loss) on Asset Dispositions | | | | | | | | |
| Asset Remarketing Income: | | | | | | | | | | | |
| Disposition gains on owned assets | $ | 35.9 |
| | $ | — |
| | $ | — |
| | $ | 2.0 |
| | $ | — |
| | $ | 37.9 |
|
| Residual sharing income | 0.2 |
| | — |
| | — |
| | 1.6 |
| | — |
| | 1.8 |
|
| Non-remarketing disposition gains (1) | 0.7 |
| | 5.0 |
| | — |
| | — |
| | — |
| | 5.7 |
|
| Asset impairment | — |
| | (0.1 | ) | | — |
| | — |
| | — |
| | (0.1 | ) |
| | $ | 36.8 |
| | $ | 4.9 |
| | $ | — |
| | $ | 3.6 |
| | $ | — |
| | $ | 45.3 |
|
| Capital Expenditures | | | | | | | | | | | |
| Portfolio investments and capital additions | $ | 129.8 |
| | $ | 41.4 |
| | $ | 9.3 |
| | $ | — |
| | $ | 0.4 |
| | $ | 180.9 |
|
| | | | | | | | | | | | |
| Selected Balance Sheet Data at December 31, 2015 | | | | | | | | |
| Investments in affiliated companies | $ | 12.0 |
| | $ | 1.4 |
| | $ | — |
| | $ | 335.1 |
| | $ | — |
| | $ | 348.5 |
|
| Identifiable assets | $ | 4,629.1 |
| | $ | 1,117.6 |
| | $ | 284.7 |
| | $ | 636.5 |
| | $ | 226.3 |
| | $ | 6,894.2 |
|
|
| | | | | | | | | | | | | | | | | | | | | | | |
|
Rail North America | |
Rail International | |
ASC | |
Portfolio Management | | Other | | GATX Consolidated |
| Three Months Ended March 31, 2016 | | | | | | | | | | | |
| Profitability | | | | | | | | | | | |
| Revenues | | | | | | | | | | | |
| Lease revenue | $ | 236.6 |
| | $ | 44.9 |
| | $ | 1.0 |
| | $ | 2.0 |
| | $ | — |
| | $ | 284.5 |
|
| Marine operating revenue | — |
| | — |
| | 4.1 |
| | 16.2 |
| | — |
| | 20.3 |
|
| Other revenue | 27.8 |
| | 1.6 |
| | — |
| | 0.2 |
| | — |
| | 29.6 |
|
Total Revenues | 264.4 |
| | 46.5 |
| | 5.1 |
| | 18.4 |
| | — |
| | 334.4 |
|
| Expenses | | | | | | | | | | | |
| Maintenance expense | 65.8 |
| | 12.5 |
| | 0.2 |
| | — |
| | — |
| | 78.5 |
|
| Marine operating expense | — |
| | — |
| | 2.9 |
| | 9.4 |
| | — |
| | 12.3 |
|
| Depreciation expense | 56.5 |
| | 11.1 |
| | — |
| | 1.7 |
| | — |
| | 69.3 |
|
| Operating lease expense | 16.8 |
| | — |
| | — |
| | — |
| | — |
| | 16.8 |
|
| Other operating expense | 6.9 |
| | 1.4 |
| | — |
| | 0.5 |
| | — |
| | 8.8 |
|
| Total Expenses | 146.0 |
| | 25.0 |
| | 3.1 |
| | 11.6 |
| | — |
| | 185.7 |
|
| Other Income (Expense) | | | | | | | | | | | |
| Net gain on asset dispositions | 18.6 |
| | 0.7 |
| | — |
| | 3.9 |
| | — |
| | 23.2 |
|
| Interest (expense) income, net | (27.2 | ) | | (7.3 | ) | | (1.1 | ) | | (2.2 | ) | | 0.6 |
| | (37.2 | ) |
| Other (expense) income | (1.3 | ) | | (2.2 | ) | | — |
| | — |
| | 0.2 |
| | (3.3 | ) |
| Share of affiliates' pretax income (loss) | 0.2 |
| | (0.1 | ) | | — |
| | 10.1 |
| | — |
| | 10.2 |
|
| Segment profit | $ | 108.7 |
| | $ | 12.6 |
| | $ | 0.9 |
| | $ | 18.6 |
| | $ | 0.8 |
| | 141.6 |
|
| Selling, general and administrative expense | 38.8 |
|
| Income taxes (includes $2.7 related to affiliates' earnings) | 33.5 |
|
| Net income | $ | 69.3 |
|
| | | | | | | | | | | | |
| Net Gain on Asset Dispositions | | | | | | | | | | | |
| Asset Remarketing Income: | | | | | | | | | | | |
| Disposition gains on owned assets | $ | 17.6 |
| | $ | — |
| | $ | — |
| | $ | 2.4 |
| | $ | — |
| | $ | 20.0 |
|
| Residual sharing income | 0.3 |
| | — |
| | — |
| | 1.5 |
| | — |
| | 1.8 |
|
| Non-remarketing disposition gains (1) | 0.7 |
| | 0.7 |
| | — |
| | — |
| | — |
| | 1.4 |
|
| Asset impairments | — |
| | — |
| | — |
| | — |
| | — |
| | — |
|
| | $ | 18.6 |
| | $ | 0.7 |
| | $ | — |
| | $ | 3.9 |
| | $ | — |
| | $ | 23.2 |
|
| | | | | | | | | | | | |
| Capital Expenditures | | | | | | | | | | | |
| Portfolio investments and capital additions | $ | 112.9 |
| | $ | 22.0 |
| | $ | 4.7 |
| | $ | — |
| | $ | 0.6 |
| | $ | 140.2 |
|
| | | | | | | | | | | | |
| Selected Balance Sheet Data at December 31, 2016 | | | | | | | |
| Investments in affiliated companies | $ | 10.5 |
| | $ | 1.2 |
| | $ | — |
| | $ | 375.3 |
| | $ | — |
| | $ | 387.0 |
|
| Identifiable assets | $ | 4,775.6 |
| | $ | 1,128.7 |
| | $ | 278.8 |
| | $ | 593.5 |
| | $ | 328.8 |
| | $ | 7,105.4 |
|
__________
(1) Includes scrapping gains.
Item 2. Management’s Discussion and Analysis of Financial Condition and Results of Operations
BUSINESS OVERVIEW
We lease, operate, manage, and remarket long-lived, widely-used assets, primarily in the rail market. We also invest in joint ventures that complement our existing business activities. We report our financial results through four primary business segments: Rail North America, Rail International, American Steamship Company (“ASC”), and Portfolio Management.
The following discussion and analysis should be read in conjunction with the MD&A in our Annual Report on Form 10-K for the year ended December 31, 2015.2016. We based the discussion and analysis that follows on financial data we derived from the financial statements prepared in accordance with GAAPUS Generally Accepted Accounting Standards ("GAAP") and on certain other financial data that we prepared using non-GAAP components. For a reconciliation of these non-GAAP components to the most comparable GAAP components, see “Non-GAAP Financial Measures” at the end of this item.
Operating results for the three months ended March 31, 20162017 are not necessarily indicative of the results we may achieve for the entire year ending December 31, 2016. 2017. In particular, ASC's fleet is inactive for a significant portion of the first quarter of each year due to winter conditions on the Great Lakes. In addition, asset remarketing income does not occur evenly throughout the year. For more information about our business, refer to ourAnnual Report on Form 10-K for the year ended December 31, 2015.2016.
DISCUSSION OF OPERATING RESULTS
The following table shows a summary of our reporting segments and consolidated financial results for the three months ended March 31 (in millions, except per share data and percentages)data):
| | | | Three Months Ended
March 31 | Three Months Ended March 31 |
| | 2016 | | 2015 | 2017 | | 2016 |
| Segment Revenues | | | | | | |
| Rail North America | $ | 264.4 |
| | $ | 243.2 |
| $ | 252.0 |
| | $ | 264.4 |
|
| Rail International | 46.5 |
| | 44.0 |
| 44.4 |
| | 46.5 |
|
| ASC | 5.1 |
| | 8.0 |
| 7.4 |
| | 5.1 |
|
| Portfolio Management | 18.4 |
| | 24.5 |
| 12.3 |
| | 18.4 |
|
| | $ | 334.4 |
| | $ | 319.7 |
| $ | 316.1 |
| | $ | 334.4 |
|
| Segment Profit | | | | | | |
| Rail North America | $ | 108.7 |
| | $ | 105.8 |
| $ | 93.0 |
| | $ | 108.7 |
|
| Rail International | 12.6 |
| | 21.8 |
| 13.4 |
| | 12.6 |
|
| ASC | 0.9 |
| | (0.4 | ) | (0.2 | ) | | 0.9 |
|
| Portfolio Management | 18.6 |
| | 15.9 |
| 14.7 |
| | 18.6 |
|
| | 140.8 |
| | 143.1 |
| 120.9 |
| | 140.8 |
|
| Less: | | | | | | |
| Selling, general and administrative expense | 38.8 |
| | 45.7 |
| 42.9 |
| | 38.8 |
|
| Unallocated interest expense, net | (0.6 | ) | | 3.4 |
| (3.2 | ) | | (0.6 | ) |
| Other, including eliminations | (0.2 | ) | | 1.8 |
| 0.1 |
| | (0.2 | ) |
| Income taxes ($2.7 and $3.0 related to affiliates' earnings) | 33.5 |
| | 30.0 |
| |
| Income taxes ($3.0 and $2.7 related to affiliates' earnings) | | 23.6 |
| | 33.5 |
|
Net Income | $ | 69.3 |
| | $ | 62.2 |
| $ | 57.5 |
| | $ | 69.3 |
|
| | | | | | | |
| Net income, excluding other items | $ | 67.8 |
| | $ | 62.2 |
| |
| Diluted earnings per share | $ | 1.66 |
| | $ | 1.39 |
| |
| Diluted earnings per share, excluding other items | $ | 1.62 |
| | $ | 1.39 |
| |
| Net income, excluding tax adjustments and other items (non-GAAP) | | $ | 57.5 |
| | $ | 67.8 |
|
| Diluted earnings per share (GAAP) | | $ | 1.44 |
| | $ | 1.66 |
|
| Diluted earnings per share, excluding tax adjustments and other items (non-GAAP) | | $ | 1.44 |
| | $ | 1.62 |
|
| | | | | |
| Investment Volume | $ | 140.2 |
| | $ | 180.9 |
| $ | 129.0 |
| | $ | 140.2 |
|
The following table shows our return on equity ("ROE") for the trailing twelve months ended March 31:
|
| | | | | |
| | 2016 | | 2015 |
| ROE | 16.4 | % | | 16.6 | % |
| ROE, excluding other items | 18.6 | % | | 16.6 | % |
|
| | | | | |
| | 2017 | | 2016 |
| ROE (GAAP) | 18.2 | % | | 16.4 | % |
| ROE, excluding tax adjustments and other items (non-GAAP) | 16.8 | % | | 18.6 | % |
Net income was $57.5 million, or $1.44 per diluted share, for the first quarter 2017 compared to $69.3 million, or $1.66 per diluted share, for the first quarter of 2016 compared to $62.2 million, or $1.39 per diluted share, in 2015.2016. Results in the first quarter of 2016 included a gain of approximately $1.5 million, net of tax, associated with the planned exit of the majority of Portfolio Management's marine investments (see "Non-GAAP Financial Measures" at the end of this item for further details). Excluding the impact of the gain, net income increased $5.6decreased $10.3 million compared to the prior year, driven by higherthe result of lower lease revenue, higher fees,lower marine operating results, and lowerhigher selling, general, and administrative expenses, partially offset by lowerhigher disposition gains.
Segment Operations
Segment profit is an internal performance measure used by the Chief Executive Officer to assess the performance of each segment in a given period. Segment profit includes all revenues, pretax earnings from affiliates, and net gains on asset dispositions that are attributable to the segments, as well as expenses that management believes are directly associated with the financing, maintenance, and operation of the revenue earning assets. Segment profit excludes selling, general and administrative expenses, income taxes, and certain other amounts not allocated to the segments. These amounts are included in Other.
We allocate debt balances and related interest expense to each segment based upon predetermined debt to equity leverage ratios. Due to changes in the composition of our segments, we have modified segment leverage levels for 2016. The leverage levels for 2016 are 5:1 for Rail North America, 3:1 for Rail International, 1.5:1 for ASC, and 1:1 for Portfolio Management. The leverage levels for 2015 were 5:1 for Rail North America, 2:1 for Rail International, 1.5:1 for ASC, and 3:1 for Portfolio Management. We believe that by using this leverage and interest expense allocation methodology, each operating segment’s financial performance reflects appropriate risk-adjusted borrowing costs.costs.
RAIL NORTH AMERICA
Segment Summary
RailContinued railcar oversupply, a large manufacturing backlog, and low fleet utilization within the North America is facing an increasingly challenging market across many car types. The growing oversupply of many railcar types, excess new railcar manufacturing capacity, declining carloadings of certain commodities, and increases in railroad velocity have createdall combined to maintain pressure on lease rates renewal success rate, and new car placements. However,across the strategic stepsfleet in the first quarter. Rail North America has takenAmerica's strategy to compete aggressively on lease rates and lease terms in recent years in anticipationthis difficult environment, coupled with attractive long-term leases it entered into during stronger market conditions, have combined to allow it to maintain high utilization of this environment has GATX well positioned to manage through these conditions.its railcars.
At March 31, 2016,2017, Rail North America's wholly owned fleet, excluding boxcars, consisted of approximately 105,400103,700 cars. Fleet utilization, excluding boxcars, was 98.9%99.1% at the end of the first quarter of 2016March 31, 2017, compared to 99.1%98.9% at the end of prior quarter, and 99.3%98.9% at March 31, 2015.2016. Fleet utilization for approximately 18,30017,400 boxcars was 97.1%92.9% at the end of the first quarter of 2016,March 31, 2017 compared to 97.7%93.8% at the end of the prior quarter and 92.8%97.1% at March 31, 2015.2016.
During the first quarter of 2016,2017, the Lease Price Index on renewals (the “LPI”"LPI", see definition below) increased 6.4%decreased 32.6%, compared to an increasea decrease of 20.5%36.2% in the prior quarter and 43.2%an increase of 6.4% in the first quarter of 2015.2016. Lease terms on renewals for cars in the LPI averaged 3429 months in the current quarter, compared to 4329 months in the prior quarter, and 5934 months in the first quarter of 2015.2016. Additionally, the renewal success rate was 67.5%72.4% in the current quarter, compared to 81.8%64.7% in the prior quarter and 84.8%67.5% in the first quarter of 2015.2016. As current marketthe challenging lease rates decline,rate environment persists, we will continue to experience pressure on the LPI. For the first quarter of 2016,2017, an average of approximately 104,500103,000 railcars, excluding boxcars, were on lease, compared to 105,300103,700 in the prior quarter and 106,500104,500 in the first quarter of 2015.2016. The decrease in railcars on lease in the current year is largely due to railcars that were sold or scrapped in an effort to optimize the composition of our fleet.
As of March 31, 2016,2017, leases for approximately 10,30012,500 railcars in our term lease fleet and approximately 3,8004,550 boxcars are scheduled to expire over the remainder of 2016.2017. These amounts exclude railcars on leases that wereare scheduled to expire later in 20162017 but have already been renewed or assigned to a new lessee.
The following table shows Rail North America's segment results (in millions):
| | | | Three Months Ended
March 31 | Three Months Ended March 31 |
| 2016 |
| 2015 | 2017 | | 2016 |
| Revenues |
|
|
|
|
|
|
|
|
|
|
| Lease revenue | $ | 236.6 |
|
| $ | 228.5 |
| $ | 227.2 |
|
| $ | 236.6 |
|
| Other revenue | 27.8 |
|
| 14.7 |
| 24.8 |
|
| 27.8 |
|
| Total Revenues | 264.4 |
|
| 243.2 |
| 252.0 |
|
| 264.4 |
|
| | | | | |
| Expenses | |
|
|
|
|
|
|
|
|
| Maintenance expense | 65.8 |
| | 69.2 |
| 67.7 |
| | 65.8 |
|
| Depreciation expense | 56.5 |
|
| 52.3 |
| 59.0 |
|
| 56.5 |
|
| Operating lease expense | 16.8 |
|
| 20.7 |
| 15.0 |
|
| 16.8 |
|
| Other operating expense | 6.9 |
|
| 5.5 |
| 8.1 |
|
| 6.9 |
|
| Total Expenses | 146.0 |
|
| 147.7 |
| 149.8 |
|
| 146.0 |
|
| | | | | |
| Other Income (Expense) | |
|
|
|
|
|
|
|
|
| Net gain on asset dispositions | 18.6 |
| | 36.8 |
| 23.8 |
| | 18.6 |
|
| Interest expense, net | (27.2 | ) |
| (24.5 | ) | (31.1 | ) |
| (27.2 | ) |
| Other expense | (1.3 | ) | | (2.2 | ) | (2.0 | ) | | (1.3 | ) |
| Share of affiliates' earnings (pretax) | 0.2 |
|
| 0.2 |
| |
| Share of affiliate's pretax income | | 0.1 |
|
| 0.2 |
|
Segment Profit | $ | 108.7 |
|
| $ | 105.8 |
| $ | 93.0 |
|
| $ | 108.7 |
|
| | | | | | | |
| Investment Volume | $ | 112.9 |
|
| $ | 129.8 |
| $ | 102.8 |
|
| $ | 112.9 |
|
The following table shows the components of Rail North America's lease revenue (in millions):
| | | | Three Months Ended
March 31 | Three Months Ended
March 31 |
| | 2016 | | 2015 | 2017 | | 2016 |
| Railcars (excluding boxcars) | $ | 206.1 |
| | $ | 198.4 |
| |
| Railcars | | $ | 198.8 |
| | $ | 206.1 |
|
| Boxcars | 20.8 |
| | 21.1 |
| 18.7 |
| | 20.8 |
|
| Locomotives | 9.7 |
| | 9.0 |
| 9.7 |
| | 9.7 |
|
| | $ | 236.6 |
| | $ | 228.5 |
| $ | 227.2 |
| | $ | 236.6 |
|
Lease Price Index
Our LPI is an internally-generated business indicator that measures lease rate pricing on renewals for our North American railcar fleet, excluding boxcars. We calculate the index using the weighted average lease rate for a group of railcar types that we believe best represents our overall North American fleet, excluding boxcars. The average renewal lease rate change is reported as the percentage change between the average renewal lease rate and the average expiring lease rate, weighted by fleet composition. The average renewal lease term is reported in months and reflects the average renewal lease term of railcar types in the LPI, weighted by fleet composition.
Rail North America Fleet Data
The following table shows fleet activity for Rail North America'sAmerica railcars, excluding boxcars:boxcars for the quarter ended:
| | | | March 31
2015 | | June 30
2015 | | September 30
2015 | | December 31
2015 | | March 31 2016 | March 31
2016 | | June 30
2016 | | September 30
2016 | | December 31
2016 | | March 31 2017 |
| Beginning balance | 107,343 |
| | 106,949 |
| | 106,984 |
| | 106,392 |
| | 106,146 |
| 106,146 |
| | 105,422 |
| | 105,368 |
| | 104,874 |
| | 104,522 |
|
| Cars added | 1,013 |
| | 823 |
| | 620 |
| | 1,306 |
| | 811 |
| 811 |
| | 857 |
| | 764 |
| | 1,087 |
| | 795 |
|
| Cars scrapped | (261 | ) | | (347 | ) | | (396 | ) | | (441 | ) | | (743 | ) | (743 | ) | | (567 | ) | | (590 | ) | | (579 | ) | | (806 | ) |
| Cars sold | (1,146 | ) | | (441 | ) | | (816 | ) | | (1,111 | ) | | (792 | ) | (792 | ) | | (344 | ) | | (668 | ) | | (860 | ) | | (839 | ) |
| Ending balance | 106,949 |
| | 106,984 |
| | 106,392 |
| | 106,146 |
| | 105,422 |
| 105,422 |
| | 105,368 |
| | 104,874 |
| | 104,522 |
| | 103,672 |
|
| Utilization rate at quarter end | 99.3 | % | | 99.3 | % | | 99.2 | % | | 99.1 | % | | 98.9 | % | 98.9 | % | | 98.1 | % | | 99.0 | % | | 98.9 | % | | 99.1 | % |
| Average active railcars | 106,541 |
| | 106,211 |
| | 105,896 |
| | 105,294 |
| | 104,505 |
| 104,505 |
| | 103,824 |
| | 103,479 |
| | 103,702 |
| | 102,976 |
|
The following table shows fleet statistics for Rail North America'sAmerica boxcars:
| | | | March 31
2015 | | June 30
2015 | | September 30
2015 | | December 31
2015 | | March 31
2016 | March 31
2016 | | June 30
2016 | | September 30
2016 | | December 31 2016 | | March 31
2017 |
| Ending balance | 18,912 |
| | 18,651 |
| | 18,567 |
| | 18,429 |
| | 18,338 |
| 18,338 |
| | 18,209 |
| | 18,089 |
| | 17,706 |
| | 17,415 |
|
| Utilization | 92.8 | % | | 97.3 | % | | 96.6 | % | | 97.7 | % | | 97.1 | % | 97.1 | % | | 97.1 | % | | 94.7 | % | | 93.8 | % | | 92.9 | % |
Comparison of the First Three Months of 20162017 to the First Three Months of 20152016
Segment Profit
Segment profit was $108.7$93.0 million in the first quarter of 2016,2017, compared to $105.8$108.7 million in the prior year. The increasedecrease was driven by higherlower lease revenue higher fees, and lowerhigher maintenance expense, partially offset by lowerhigher asset disposition gains.
Revenues
Lease revenue increased $8.1decreased $9.4 million in the first quarter of 2016,2017, primarily due to higherlower lease rates and higher non-boxcar utilization revenue, partially offset by fewer cars on billing.lease. Other revenue increased $13.1decreased $3.0 million primarily due to higher feesdue to lower repair revenue and repair revenue. This increase includeslower lease termination fees. Fees in 2016 included approximately $10.0 million for a penalty fee imposed by GATX for allowing a customer to return 200 crude oil carsrailcars prior to the contractual end of an existing lease. The majoritycurrent year included $7.8 million for the reimbursement of damage on returned cars. The expenses to repair these cars were subsequently placed with other GATX customers. On occasion, customerswill be recognized over the course of the year as incurred. In some cases, we may request relief from their lease commitments, particularly when underlying commodity markets turn down. However, our lease agreementsscrap the railcar rather than incur these expenses if is not economical to do not include provisions for payment relief and any such arrangement would be dependent on achieving an optimal economic outcome for GATX.so.
Expenses
Maintenance expense decreased $3.4increased $1.9 million in the first quarter of 2016, largely2017, primarily due to loweran increase in transition costs for the base fleet, drivenassociated with cars assigned to new lessees, partially offset by lower volume and lower cost per car, as well as lower railroad repair costs from fewerexpenses for repairs performed by the railroads on the boxcar repairs.fleet. Depreciation expense increased $4.2$2.5 million, largely due to new railcar investments. Operating lease expense decreased $3.9$1.8 million, resulting from the purchase of railcars previously on operating leases.leases in both years. Other operating expense increased $1.4$1.2 million, primarily due to higher switching storage, and freight costs.costs from the movement of assigned railcars.
Other Income (Expense)
Net gain on asset dispositions decreased $18.2increased $5.2 million in the first quarter of 2016, as fewer2017, primarily due to higher disposition gains on railcars were sold in the current year. The timing of remarketing income is dependent on a number of factorsyear, as well as higher scrapping gains resulting from more railcars scrapped and will vary from quarter to quarter.higher scrap proceeds. Net interest expense increased $2.7$3.9 million, primarily due to a higher average interest rates and higher average debt balance.balances. Other expense decreased $0.9 million, largely duewas comparable to lower costs associated with the early buy-out of railcars on operating leases, which occurred in eachprior year.
Investment Volume
During the first quarter of 2016,2017, investment volume was $112.9$102.8 million compared to $129.8$112.9 million in the first quarter of 2015.2016. We acquired 689778 newly built railcars and purchased 2022 railcars in the secondary market in the first quarter of 2016,2017, compared to 796689 newly built railcars and 14320 railcars purchased in the secondary market in the first quarter of 2015.2016.
North American Rail Regulatory Matters
On May 1, 2015, the Pipeline and Hazardous Materials Safety Administration of the US Department of Transportation (“PHMSA”) issued final rules that established new design standards for tank cars in flammable liquids service (the “PHMSA Rules”). The PHMSA Rules became effective on July 7, 2015, and all newly built tank cars for use in certain flammable liquids service were required to comply with the new design standards commencing on October 1, 2015. The PHMSA Rules also established standards for modifications to existing tank cars in certain flammable liquids service and deadlines for modifying or removing those cars from service. The US Congress subsequently adopted the Fixing America’s Surface Transportation Act (“FAST Act”), which changed certain requirements of the PHMSA Rules. Key changes included revisions to the design standards for modified cars, amendments to the modification deadlines, and expansion of the applicability of the new tank car design standards to all cars used in flammable liquids service. Under the FAST Act, the deadlines for modifying or removing existing tank cars from flammables service range from January 2018 to May 2029, depending on the type of car and the type of commodity carried. While several legal challenges to the PHMSA Rules are pending in the US Circuit Court for the District of Columbia, the tank car design standards and the deadlines for modifying or removing cars from service were enacted into law by the FAST Act, and therefore, are unlikely to be affected by the outcome of these legal challenges.
On May 1, 2015, Transport Canada (“TC”) issued final rules establishing new design standards for tank cars carrying flammable liquids in Canada (the “Canadian Rules”). The Canadian Rules became effective on May 20, 2015, and all newly built tank cars for use in flammable liquids service were required to comply with the new standards effective October 1, 2015. The Canadian Rules also established standards for modifications to existing tank cars in flammable liquids service and deadlines for modifying or removing cars from service ranging from May 2017 to May 2025, depending on the type of car and the type of commodity carried.
We have a fleet of approximately 124,000 railcars in North America, including approximately 13,500 tank cars currently used to transport flammable liquids that are affected by the new rules, of which approximately 4,100 are moving crude oil and ethanol. Over 90% of our affected tank cars have a compliance deadline of 2023 or later. We expect to modify some of the most modern of our affected tank cars to comply with the new standards. However, for the majority of the affected cars, we currently anticipate retiring, redeploying, or selling them rather than performing retrofits.
RAIL INTERNATIONAL
Segment Summary
Rail International, particularlycomposed primarily of GATX Rail Europe ("GATX Rail Europe" or "GRE"GRE"), continuescontinued to achievemaintain high utilization of its railcars and produced solid operating results with utilization remaining above 95% and market lease rates relatively consistent with expiring rates.in 2017. Railcar utilization for GRE was 95.1%95.0% at the end of the first quarter of 20162017, compared to 95.8%95.6% at the end of the prior quarter and 95.9%95.1% at March 31, 2015.2016.
GRE's results in the first quarter of 2016 were impacted by higher wheelset costs, primarily due to a refurbishment program enacted to address anti-corrosioncorrosion paint issues on certain existing wheelsets. GRE is addressing this issue with the wheelset supplier and pursuing warranty remedies.
The following table shows Rail International's segment results (in millions):
| | | | Three Months Ended
March 31 | Three Months Ended
March 31 |
| | 2016 | | 2015 | 2017 | | 2016 |
| Revenues | | | | | | |
| Lease revenue | $ | 44.9 |
| | $ | 42.1 |
| $ | 43.3 |
| | $ | 44.9 |
|
| Other revenue | 1.6 |
| | 1.9 |
| 1.1 |
| | 1.6 |
|
| Total Revenues | 46.5 |
| | 44.0 |
| 44.4 |
| | 46.5 |
|
| | | | | |
| Expenses | | | | | | |
| Maintenance expense | 12.5 |
| | 8.9 |
| 10.0 |
| | 12.5 |
|
| Depreciation expense | 11.1 |
| | 10.7 |
| 11.2 |
| | 11.1 |
|
| Other operating expense | 1.4 |
| | 0.9 |
| 1.2 |
| | 1.4 |
|
| Total Expenses | 25.0 |
| | 20.5 |
| 22.4 |
| | 25.0 |
|
| | | | | |
| Other Income (Expense) | | | | | | |
| Net gain on asset dispositions | 0.7 |
| | 4.9 |
| 0.8 |
| | 0.7 |
|
| Interest expense, net | (7.3 | ) | | (6.5 | ) | (7.9 | ) | | (7.3 | ) |
| Other expense | (2.2 | ) | | — |
| (1.5 | ) | | (2.2 | ) |
| Share of affiliates' earnings (pretax) | (0.1 | ) | | (0.1 | ) | |
| Share of affiliate's pretax loss | | — |
| | (0.1 | ) |
Segment Profit | $ | 12.6 |
| | $ | 21.8 |
| $ | 13.4 |
| | $ | 12.6 |
|
| | | | | | | |
| Investment Volume | $ | 22.0 |
| | $ | 41.4 |
| $ | 18.7 |
| | $ | 22.0 |
|
The following table shows fleet activity for GRE railcars:railcars for the quarter ended:
| | | | March 31
2015 | | June 30
2015 | | September 30
2015 | | December 31
2015 | | March 31
2016 | March 31
2016 | | June 30
2016 | | September 30
2016 | | December 31
2016 | | March 31
2017 |
| Beginning balance | 22,451 |
| | 22,497 |
| | 22,483 |
| | 22,745 |
| | 22,923 |
| 22,923 |
| | 22,859 |
| | 23,088 |
| | 22,966 |
| | 23,122 |
|
| Cars added | 249 |
| | 301 |
| | 412 |
| | 459 |
| | 191 |
| 191 |
| | 323 |
| | 78 |
| | 287 |
| | 207 |
|
| Cars scrapped or sold | (203 | ) | | (315 | ) | | (150 | ) | | (281 | ) | | (255 | ) | (255 | ) | | (94 | ) | | (200 | ) | | (131 | ) | | (198 | ) |
| Ending balance | 22,497 |
| | 22,483 |
| | 22,745 |
| | 22,923 |
| | 22,859 |
| 22,859 |
| | 23,088 |
| | 22,966 |
| | 23,122 |
| | 23,131 |
|
| Utilization rate at quarter end | 95.9 | % | | 95.5 | % | | 95.7 | % | | 95.8 | % | | 95.1 | % | 95.1 | % | | 94.8 | % | | 95.0 | % | | 95.6 | % | | 95.0 | % |
| Average active railcars | 21,479 |
| | 21,427 |
| | 21,630 |
| | 21,861 |
| | 21,854 |
| 21,854 |
| | 21,747 |
| | 21,830 |
| | 22,002 |
| | 22,012 |
|
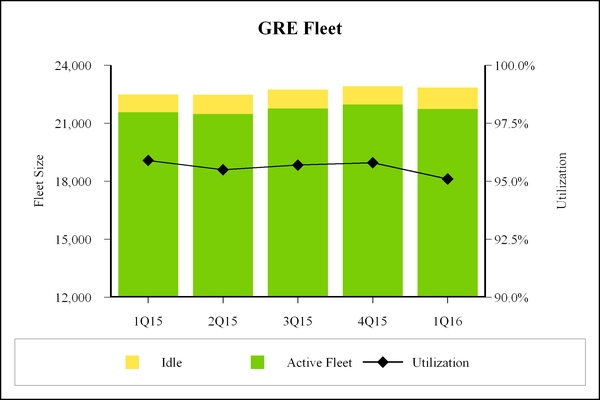
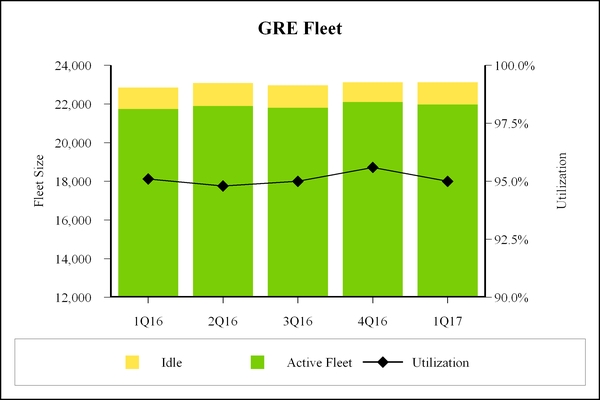 \
\
Comparison of the First Three Months of 20162017 to the First Three Months of 20152016
Foreign Currency
Rail International's reported results of operations are impacted by fluctuations in the exchange rates of the foreign currencies in which it conducts business, primarily the euro. In the first three months of 2016,2017, a weaker euro negatively impacted lease revenue by approximately $1.1$1.5 million and segment profit, excluding other income (expense), by approximately $0.6$0.7 million compared to the first three months of 2015.2016.
Segment Profit
Segment profit was $12.6$13.4 million in the first quarter of 2016,2017, compared to $21.8$12.6 million in the prior year. The decreaseincrease was largely due to lower maintenance expense, primarily as a result of lower wheelset costs, and lower legal defense costs, partially offset by lower lease revenue.
Revenues
Lease revenue decreased $1.6 million in the first quarter of 2017, primarily due to the effects of a weaker euro, as noted above. Other revenue decreased $0.5 million, primarily due to lower compensation for damaged railcars and lower repair revenue.
Expenses
Maintenance expense decreased $2.5 million in the first quarter of 2017, primarily due to lower wheelset costs, as well as fewer railcar revisions and lower refurbishment costs. Depreciation expense and other operating expense were comparable to prior year.
Other Income (Expense)
Net gain on the sale of a workshop in theasset dispositions was comparable to prior year,year. Net interest expense increased $0.6 million, largely due to higher maintenanceaverage interest rates and higher average debt balances. Other expense anddecreased $0.7 million, largely due to lower legal costs, partially offset by the unfavorable impact of changes in foreign exchange rates on non-functional currency items partially offset by higher lease revenue.
Revenues
Lease revenue increased $2.8 million in the first quarter of 2016, primarily due to more cars on lease at higher rates in the current year, partially offset by the effects of a weaker euro, as noted above. Other revenue decreased $0.3 million, primarily due to the absence of interest income on a loan that was repaid in the first quarter of 2015.
Expenses
Maintenance expense increased $3.6 million in the first quarter of 2016, primarily due to higher costs of wheelset replacements, as discussed above, and the higher cost of railcar revisions. Depreciation expense increased $0.4 million, driven by the impact of new cars added to the fleet, partially offset by the effects of a weaker euro. Other operating expense increased $0.5 million, largely due to higher switching and freight costs.
Other Income (Expense)
Net gain on asset dispositions decreased $4.2 million in the first quarter of 2016, primarily due to a gain on the sale of a workshop in the prior year. Net interest expense increased $0.8 million, largely due to a higher average debt balance, partially offset by lower average interest rates. Other expense increased $2.2 million largely due to the unfavorable impact of changes in foreign exchange rates on non-functional currency items. In addition, expenses associated with the Viareggio matter were incurred in both years.derivatives.
Investment Volume
During the first quarter of 2016,2017, investment volume was $22.0$18.7 million compared to $41.4$22.0 million in the first quarter of 2015.2016. We acquired approximately 207 railcars in the first quarter of 2017 compared to 191 railcars in the first quarter of 2016 compared to 485 railcars in the first quarter of 2015.2016.
ASC
Segment Summary
OurASC's fleet is largely inactive for the first three months of each year due to winter conditions on the Great Lakes. TheFreight volume in the first quarter freight volume is largely attributable to prior year commitments completed in January of each period. Our 2017 sailing season began in late March. Because of the mild winter weather, there was less ice coverage on the Great Lakes, which will benefit early season operations. During the first quarter of 2016,2017, we carried 0.61.0 million net tons of freight compared to 0.80.6 million net tons during the first quarter of 2015. Consistent with 2015, we expect that lower iron ore demand and shipments will continue throughout 2016, negatively impacting operating results.2016.
The following table shows ASC’s segment results (in millions):
| | | | Three Months Ended
March 31 | Three Months Ended
March 31 |
| | 2016 | | 2015 | 2017 | | 2016 |
| Revenues | | | | | | |
| Lease revenue | $ | 1.0 |
| | $ | 1.0 |
| $ | 1.0 |
| | $ | 1.0 |
|
| Marine operating revenue | 4.1 |
| | 7.0 |
| 6.4 |
| | 4.1 |
|
| Total Revenues | 5.1 |
| | 8.0 |
| 7.4 |
| | 5.1 |
|
| | | | | |
| Expenses | | | | | | |
| Maintenance expense | 0.2 |
| | 0.2 |
| 0.2 |
| | 0.2 |
|
| Marine operating expense | 2.9 |
| | 6.9 |
| 5.3 |
| | 2.9 |
|
| Depreciation expense | | 0.1 |
| | — |
|
| Operating lease expense | | 0.8 |
| | — |
|
| Total Expenses | 3.1 |
| | 7.1 |
| 6.4 |
| | 3.1 |
|
| | | | | |
| Other Income (Expense) | | | | | | |
| Interest expense, net | (1.1 | ) | | (1.3 | ) | (1.2 | ) | | (1.1 | ) |
| Segment Profit (Loss) | $ | 0.9 |
| | $ | (0.4 | ) | |
Segment (Loss) Profit | | $ | (0.2 | ) | | $ | 0.9 |
|
| | | | | | | |
| Investment Volume | $ | 4.7 |
| | $ | 9.3 |
| $ | 7.3 |
| | $ | 4.7 |
|
| Total Net Tons Carried (000's) | 625 | | 784 | 1,034 |
| | 625 |
|
Comparison of the First Three Months of 20162017 to the First Three Months of 20152016
Segment (Loss) Profit
Segment profitloss was $0.9$0.2 million in the first quarter of 2016,2017, compared to a losssegment profit of $0.4$0.9 million in the prior year. The current yeardecrease was positively impacted by fewer weather-related delays, leadingprimarily due to reduced operating expenses, which was partially offset by lower volume.
costs related to the return of a leased vessel in 2017.
Revenues
Marine operating revenue decreased $2.9increased $2.3 million in the first quarter of 2016,2017, primarily due to lowerhigher volume. In addition, lowerhigher fuel revenue, which is offset in marine operating expense, contributed to the variance. The terms of ASC's contracts provide that a substantial portion of fuel costs is passed on to customers.
Expenses
Marine operating expense decreased $4.0increased $2.4 million in the first quarter of 2016,2017, largely driven by higher fuel costs and the impact of more efficient operations resulting from less ice coverage onoperating days. Operating lease expense increased $0.8 million, attributable to costs related to the Great Lakesreturn of a leased vessel in the current year.2017.
Investment Volume
ASC's investments in each period consisted of structural and mechanical upgrades to our vessels.
PORTFOLIO MANAGEMENT
Segment Summary
InA significant portion of Portfolio Management's segment profit is generated by the thirdRolls-Royce & Partners Finance companies (collectively the "RRPF affiliates"). The RRPF affiliates are a group of fifteen 50% owned domestic and foreign joint ventures with Rolls-Royce plc (or affiliates thereof, collectively “Rolls-Royce”), a leading manufacturer of commercial aircraft jet engines. Segment profit included earnings from the RRPF affiliates of $11.2 million for the first quarter of 2015, GATX management2017, compared to $10.1 million in 2016.
As we have disclosed previously, we made the decision to exit the majority of our marine investments, within the Portfolio Management segment, including six chemical parcel tankers (the "Nordic Vessels"), most of theour inland marine vessels, and our 50% interest in the Cardinal Marine joint venture. As a result,To date, we sold certaincompleted the sales of our marine investments during 2015, includingall six of the Nordic Vessels, our 50% interest in the Cardinal Marine joint venture. Inventure, and the first quartermajority of 2016, we sold additional marine investments, including three of the Nordic Vessels and otherour inland marine vessels. Proceeds fromassets. No sales were completed in the first quarter of 2016 were $37.62017; in the prior year quarter, we sold marine assets for net proceeds of $36.7 million, resulting in a net gain of $2.4 million. We expect to sell the remaining targeted inland marine investmentsassets in 2016.2017. Upon completion of these sales, Portfolio Management will continue to own and operate other marine investments, consisting primarily of five liquefied gas carrying vessels (the "Norgas Vessels").
The Rolls-Royce & Partners Finance companies (collectively the "RRPF affiliates") reported solid results, which reflect continued strong demand for aircraft spare engines. The RRPF affiliates contributed $10.1 million to segment profit for the first quarter of 2016, compared to $11.6 million in 2015.
Portfolio Management's total asset base was $600.0 million at March 31, 2017, compared to $593.5 million at December 31, 2016, and $605.8 million at March 31, 2016, compared to $636.5 million at December 31, 2015, and $794.4 million at March 31, 2015.2016. Assets held for sale were $45.6 million at March 31, 2017 and December 31, 2016, and $69.6 million at March 31, 2016 and $103.4 million at December 31, 2015.2016.
The following table shows Portfolio Management'sManagement’s segment results (in millions):
| | | | Three Months Ended
March 31 | Three Months Ended
March 31 |
| | 2016 | | 2015 | 2017 | | 2016 |
| Revenues | | | | | | |
| Lease revenue | $ | 2.0 |
| | $ | 6.7 |
| $ | 1.2 |
| | $ | 2.0 |
|
| Marine operating revenue | 16.2 |
| | 17.2 |
| 10.6 |
| | 16.2 |
|
| Other revenue | 0.2 |
| | 0.6 |
| 0.5 |
| | 0.2 |
|
| Total Revenues | 18.4 |
| | 24.5 |
| 12.3 |
| | 18.4 |
|
| | | | | |
| Expenses | | | | | | |
| Marine operating expense | 9.4 |
| | 12.0 |
| 7.6 |
| | 9.4 |
|
| Depreciation expense | 1.7 |
| | 5.5 |
| 1.7 |
| | 1.7 |
|
| Other operating expense | 0.5 |
| | 0.9 |
| 0.3 |
| | 0.5 |
|
| Total Expenses | 11.6 |
| | 18.4 |
| 9.6 |
| | 11.6 |
|
| | | | | |
| Other Income (Expense) | | | | | | |
| Net gain on asset dispositions | 3.9 |
| | 3.6 |
| 0.3 |
| | 3.9 |
|
| Interest expense, net | (2.2 | ) | | (5.2 | ) | (2.2 | ) | | (2.2 | ) |
| Share of affiliates' earnings (pretax) | 10.1 |
| | 11.4 |
| |
| Other income | | 2.3 |
| | — |
|
| Share of affiliates' pretax income | | 11.6 |
| | 10.1 |
|
Segment Profit | $ | 18.6 |
| | $ | 15.9 |
| $ | 14.7 |
| | $ | 18.6 |
|
The following table shows the approximate net book values of Portfolio Management's assets (in millions):
| | | | March 31
2015 | | June 30
2015 | | September 30
2015 | | December 31
2015 | | March 31
2016 | March 31
2016 | | June 30
2016 | | September 30
2016 | | December 31
2016 | | March 31
2017 |
| Net book value of owned assets | $ | 450.2 |
| | $ | 442.8 |
| | $ | 387.4 |
| | $ | 301.4 |
| | $ | 261.8 |
| $ | 261.8 |
| | $ | 268.1 |
| | $ | 241.2 |
| | $ | 218.2 |
| | $ | 214.8 |
|
| Affiliate investments | 344.2 |
| | 353.7 |
| | 350.3 |
| | 335.1 |
| | 344.0 |
| 344.0 |
| | 348.9 |
| | 365.0 |
| | 375.3 |
| | 385.2 |
|
| Net book value of managed assets | 107.8 |
| | 88.1 |
| | 70.4 |
| | 114.5 |
| | 123.3 |
| 123.3 |
| | 57.7 |
| | 55.9 |
| | 51.8 |
| | 50.0 |
|
Comparison of the First Three Months of 20162017 to the First Three Months of 20152016
Comparisons of reported results for the current year and the prior year are impacted by the salesales of marine investments.
Segment Profit
Segment profit was $18.6$14.7 million for the first quarter of 2016,2017, compared to $15.9$18.6 million for the prior year. The current yearSegment profit for 2016 included a net gain of approximately $2.4 million associated with the sale of certain marine investments. Excluding this gain, results withinfor the Portfolio Management segment were consistent with prior year.$1.5 million lower for the first quarter of 2017, primarily due to lower residual sharing gains from the managed portfolio and lower aggregate marine operating results, offset by higher earnings from affiliates and other income.
Revenues
Lease revenue decreased $4.7$0.8 million in the first quarter of 2016,2017, primarily due to the impact of the sales of leased assets in both years.2016. Marine operating revenue decreased $1.0$5.6 million, largely due to lower revenue from the Norgas vessels, as well as the absence of revenue from the Nordic vessels that were sold marine investments, partially offset by higher revenue from the Norgas Vessels. Other revenue decreased $0.4 million primarily due to lower investment fund distributions in the current year.during 2016.
Expenses
Marine operating expense decreased $2.6$1.8 million in the first quarter of 2016,2017, primarily due to the impact fromabsence of the Nordic vessels that were sold.sold in 2016, as well as lower expenses for the Norgas vessels, partially offset by higher inland marine expenses. Depreciation expense decreased $3.8 million, driven by the sale of assets in 2015 and 2016.other operating expense were comparable to prior year.
Other Income (Expense)
Net gain on asset dispositions increased $0.3decreased $3.6 million in the first quarter of 2016.2017. The currentprior year included a pre-tax gain of $2.4 million associated with the saleplanned exit of certain marine investments. Excluding this gain, net gain on asset dispositions decreased $2.1$1.2 million, primarily due to lower sales activity and lower residual sharing gains onfees from the managed portfolio sales in the currentfirst quarter of 2017.
Other income in 2017 reflects conditional proceeds that we received related to the sale of certain aircraft assets completed in a prior year. Net interest expense decreased $3.0 million as a result of a lower average debt balance and lower average interest rates.
Share of affiliates' earnings decreased $1.3pretax income increased $1.5 million in the first quarter of 20162017, primarily due to lowerhigher operating income, partially offset by higher gains on engine salesresults at the RRPF affiliates, as well as additional proceeds received in the current year.first quarter of 2017 attributable to the prior Cardinal Marine affiliate sale.
OTHER
Other comprises selling, general and administrative expenseexpenses (“SG&A”), unallocated interest expense, and miscellaneous income and expense not directly associated with the reporting segments and eliminations.
The following table shows components of Otherother (in millions):
| | | | Three Months Ended
March 31 | Three Months Ended
March 31 |
| | 2016 | | 2015 | 2017 | | 2016 |
| Selling, general and administrative expense | $ | 38.8 |
| | $ | 45.7 |
| $ | 42.9 |
| | $ | 38.8 |
|
| Unallocated interest (income) expense, net | (0.6 | ) | | 3.4 |
| (3.2 | ) | | (0.6 | ) |
| Other expense (income) (including eliminations) | (0.2 | ) | | 1.8 |
| |
| Other expense (income), including eliminations | | 0.1 |
| | (0.2 | ) |
SG&A, Unallocated Interest and Other
SG&A was $6.9increased $4.1 million lower forin the first three monthsquarter of 2016 compared to the prior year,2017. The increase was primarily due to lowerhigher compensation and pension expense. The decrease in compensation expense was driven by fewer employees, resulting from the closure of the San Francisco office in the prior year and the impact of an early retirement program taking effect in the current year.costs.
Unallocated interest expense (the difference between external interest expense and interest expense allocated to the reporting segments in accordance with assigned leverage targets) in any periodyear is affected by our consolidated leverage position, the timing of debt issuances and investing activities, and intercompany allocations.
Other (income) expense, andincluding eliminations, decreased $2.0 million duewas comparable to higher costs incurred in the prior year related to the prepayment of debt.year.
Consolidated Income Taxes
See "Note 8.7. Income Taxes"Taxes" in Part I, Item 1 of this Form 10-Q.
CASH FLOW AND LIQUIDITY
We generate a significant amount of cash from operating activities and from our investment portfolio.portfolio proceeds. We also access domestic and international capital markets by issuing unsecured or secured debt and commercial paper. We use these sources of cash, along with our available cash balances, to fulfill our debt, lease, and dividend obligations, to support our share repurchase program, and to fund portfolio investments and capital additions. We primarily use cash from operations and commercial paper issuances to fund daily operations.
The timing of asset dispositions and changes in working capital impacts cash flows from operationsportfolio proceeds and portfolio proceeds.operations. As a result, these cash flow components may vary materially from quarter to quarter and year to year. As of March 31, 2016,2017, we had an unrestricted cash balance of $216.2$155.2 million.
The following table shows our principal sources and uses of cash for the three months ended March 31, 2017 (in millions):
| | | | 2016 | | 2015 | 2017 | | 2016 |
| Principal sources of cash | | | | | | |
| Net cash provided by operating activities | $ | 77.5 |
| | $ | 55.8 |
| $ | 52.0 |
| | $ | 79.9 |
|
| Portfolio proceeds | 98.4 |
| | 176.8 |
| 44.0 |
| | 98.4 |
|
| Other asset sales | 9.4 |
| | 8.6 |
| 7.6 |
| | 9.4 |
|
| Proceeds from issuance of debt, commercial paper, and credit facilities | 332.5 |
| | 667.7 |
| 297.9 |
| | 332.5 |
|
| | $ | 517.8 |
| | $ | 908.9 |
| $ | 401.5 |
| | $ | 520.2 |
|
| Principal uses of cash | | | | | | |
| Portfolio investments and capital additions | $ | (140.2 | ) | | $ | (180.9 | ) | $ | (129.0 | ) | | $ | (140.2 | ) |
| Repayments of debt, commercial paper, and credit facilities | (202.3 | ) | | (450.2 | ) | (300.9 | ) | | (202.3 | ) |
| Purchases of leased-in assets | (92.8 | ) | | (99.5 | ) | (79.3 | ) | | (92.8 | ) |
| Payments on capital lease obligations | (1.6 | ) | | (1.3 | ) | (1.4 | ) | | (1.6 | ) |
| Stock repurchases | (50.0 | ) | | (25.3 | ) | (25.0 | ) | | (50.0 | ) |
| Cash dividends | (18.1 | ) | | (18.0 | ) | |
| Dividends | | (18.4 | ) | | (18.1 | ) |
| | $ | (505.0 | ) | | $ | (775.2 | ) | $ | (554.0 | ) | | $ | (505.0 | ) |
Net cash provided by operating activities of $77.5$52.0 million increased $21.7decreased $27.9 million compared to 2015.2016. The increasedecrease was driven by higherprimarily due to lower lease revenue and fee income,lower contributions from our marine operations at Portfolio Management and lowerhigher operating lease payments, partially offset by higherlower interest payments and lower income tax payments, as well aspayments. In addition, the net impact of changes in the balances of certain working capital items.items negatively impacted cash provided from operating activities.
Portfolio proceeds for the first three monthsprimarily consist of loan and finance lease receipts, proceeds from sales of operating assets, proceeds from sales of securities, and capital distributions from affiliates. In 2016, portfolio proceeds included net proceeds of $98.4$36.7 million decreased by $78.4 million compared to 2015, primarily due to proceeds received in the prior year from the repaymentsales of a loan. In January 2015, AAE Cargo AG repaid its outstanding loan inmarine investments as part of our decision to exit the amountmajority of €67.5 million ($76.4 million).the marine assets at our Portfolio Management segment.
Proceeds from the issuance of debt for the first three months of 20162017 were $332.5$297.9 million (net of hedges and debt issuance costs). In 2016,2017, a $200 million 5-year$300-million, 10-year unsecured financing was completed. Additionally, $125we extended the maturity on $180 million was drawn onof a new $250 million railcar facility.$200-million term loan by one year to May 2022. Debt repayments of $202.3$300.9 million for the first three months of 20162017 were $247.9$98.6 million lowerhigher than prior year. Each year includedconsisted of scheduled maturities. In addition, the prior year included early retirement of higher cost debt and a $129.0 million repayment in Europe.maturity payments.
Portfolio investments and capital additions primarily consist of purchases of operating assets, investments in affiliates, and capitalized asset improvements. See individual segment discussions for further information on investment volume.Portfolio investments and capital additions of $129.0 million decreased $11.2 million compared to 2016, largely due to lower railcar purchases at Rail North America.
Purchases of leased-in assets of $79.3 million decreased $13.5 million compared to 2016. The decrease was a result of fewer leased railcars purchased at Rail North America, partially offset by the purchase of a previously leased vessel at ASC.
In the first quarter of 2016, our board of directors authorized a $300 million share repurchase program. During the three months ended March 31, 2017, we acquired 0.4 million shares of stock for $25.0 million, compared to 1.2 million shares for $50.0 million during the same period in 2016. As of March 31, 2017, $155.0 million remained available under the repurchase authorization.
Contractual and Other Commercial Commitments
The following table shows our contractual commitments, including debt principal and related interest payments, lease payments, and purchase commitments at March 31, 2017 (in millions):
|
| | | | | | | | | | | | | | | | | | | | | | | | | | | |
| | Payments Due by Period |
| | Total | | 2017 (1) | | 2018 | | 2019 | | 2020 | | 2021 | | Thereafter |
| Recourse debt | $ | 4,287.9 |
| | $ | 2.7 |
| | $ | 516.6 |
| | $ | 550.0 |
| | $ | 350.0 |
| | $ | 378.6 |
| | $ | 2,490.0 |
|
| Interest on recourse debt (2) | 1,767.6 |
| | 97.7 |
| | 150.1 |
| | 133.1 |
| | 118.5 |
| | 102.6 |
| | 1,165.6 |
|
| Commercial paper and credit facilities | 3.0 |
| | 3.0 |
| | — |
| | — |
| | — |
| | — |
| | — |
|
| Capital lease obligations, including interest | 14.5 |
| | 1.4 |
| | 1.6 |
| | 11.5 |
| | — |
| | — |
| | — |
|
| Recourse operating leases | 565.9 |
| | 36.9 |
| | 76.5 |
| | 79.5 |
| | 73.2 |
| | 60.6 |
| | 239.2 |
|
| Purchase commitments (3) | 1,075.5 |
| | 402.6 |
| | 350.2 |
| | 322.7 |
| | — |
| | — |
| | — |
|
| | $ | 7,714.4 |
| | $ | 544.3 |
| | $ | 1,095.0 |
| | $ | 1,096.8 |
| | $ | 541.7 |
| | $ | 541.8 |
| | $ | 3,894.8 |
|
__________
| |
| (1) | For the remainder of the year. |
| |
| (2) | For floating rate debt, future interest payments are based on the applicable interest rate as of March 31, 2017. |
| |
| (3) | Primarily railcar purchase commitments. The amounts shown for all years are based on management's estimates of the timing, anticipated car types, and related costs of railcars to be purchased under its agreements. |
In 2014, we entered into a long-term supply agreement with Trinity Rail Group, LLC ("Trinity"), a subsidiary of Trinity Industries that took effect in mid-2016. Under the terms of that agreement, we may order up to 8,950 newly built railcars over a four-year period from March, 2016 1.2 million shares had been acquiredthrough March, 2020. We may order either tank or freight cars; however, we expect that the majority of the order will be for $50.0 million.tank cars. Pursuant to the terms of the agreement, the parties conducted a review of the contract pricing in January 2017 as it no longer reflected market rates. Based on this review, the parties agreed to reduce contract pricing for future orders pursuant to the terms of the agreement.
Short-Term Borrowings
The following table provides additional information regarding our short-term borrowings for the three months ended March 31, 2016:2017: | | | | North America (1) | | Europe (2) | Europe (1) |
| Balance as of March 31 (in millions) | $ | — |
| | $ | 17.9 |
| $ | 3.0 |
|
| Weighted average interest rate | — | % | | 0.6 | % | 1.0 | % |
| Euro/Dollar exchange rate | n/a |
| | 1.14 |
| 1.07 |
|
| | | | | |
| Average daily amount outstanding during the quarter (in millions) | $ | 0.4 |
| | $ | 14.0 |
| $ | 3.4 |
|
| Weighted average interest rate | 0.7 | % | | 0.7 | % | 1.0 | % |
| Average Euro/Dollar exchange rate | n/a |
| | 1.10 |
| 1.07 |
|
| | | | | |
| Maximum daily amount outstanding (in millions) | $ | 20.0 |
| | $ | 20.0 |
| $ | 8.5 |
|
| Euro/Dollar exchange rate | n/a |
| | 1.12 |
| 1.06 |
|
_________(1) Short-term borrowings in North America are comprised of commercial paper issued in the US.
(2) Short-term borrowings in Europe are comprisedcomposed of borrowings under bank credit facilities.
Revolving Credit FacilityLines and Facilities
As of March 31, 2016, we hadWe have a $575$600 million, 5-year unsecured credit facility in the US that matures on April 30, 2020.in May 2021. As of March 31, 2016,2017, the full $575$600 million was available under the facility. Additionally, we have a $250 million 5-year secured railcar facility with a 3-year revolving period in the US that matures in February 2021. As of March 31, 2017, the full $250 million was available under this facility.
Restrictive Covenants
Our $575$600 million revolving credit facility contains various restrictive covenants, including requirements to maintain a fixed charge coverage ratio and an asset coverage test. Certain of our other financings have the same financial covenants as the facility.
The indentures for our public debt also contain various restrictive covenants, including limitationlimitations on liens provisions that limit the amount of additional secured indebtedness that we may incur. Additionally, certain exceptions to the covenants permit us to incur an unlimited amount of purchase money and nonrecourse indebtedness.
The loan agreements for certain of our European rail subsidiaries ("GATX Rail Europe" or "GRE") also contain restrictive covenants, including leverage and cash flow covenants specific to those subsidiaries, restrictions on making loans, and limitations on the ability of those subsidiaries to repay loans or to distribute capital to certain related parties (including GATX, the US parent company). These covenants effectively limit GRE's ability to transfer funds to us.
We do not anticipate any covenant violations nor do we anticipate that any of these covenants will restrict our operations or our ability to obtain additional financing. At March 31, 2016,2017, we were in compliance with all covenants and conditions of all of our credit agreements.
Credit Ratings
The global capital market environment and outlook may affect our funding options and our financial performance. Our access to capital markets at competitive rates depends on our credit rating and ratings outlook, as determined by rating agencies. As of March 31, 2016,2017, our long-term unsecured debt was rated BBB by Standard & Poor's and Baa2 by Moody’s Investors Service and our short-term unsecured debt was rated A-2 by Standard & Poor's and P-2 by Moody’s Investors Service. Our rating outlook from both agencies was stable.
Contractual Commitments
The following table shows our contractual commitments, including debt principal amounts, lease payments, and portfolio investments at March 31, 2016, (in millions):
|
| | | | | | | | | | | | | | | | | | | | | | | | | | | |
| | Payments Due by Period |
| | Total | | 2016 (1) | | 2017 | | 2018 | | 2019 | | 2020 | | Thereafter |
| Recourse debt | $ | 4,327.2 |
| | $ | 358.3 |
| | $ | 412.8 |
| | $ | 521.1 |
| | $ | 550.0 |
| | $ | 350.0 |
| | $ | 2,135.0 |
|
| Nonrecourse debt | 4.7 |
| | 4.7 |
| | — |
| | — |
| | — |
| | — |
| | — |
|
| Commercial paper and credit facilities | 17.9 |
| | 17.9 |
| | — |
| | — |
| | — |
| | — |
| | — |
|
| Capital lease obligations | 18.5 |
| | 2.5 |
| | 2.8 |
| | 1.6 |
| | 11.6 |
| | — |
| | — |
|
| Operating leases — recourse | 605.3 |
| | 38.1 |
| | 89.9 |
| | 81.4 |
| | 79.7 |
| | 72.7 |
| | 243.5 |
|
| Portfolio investments (2) | 1,561.0 |
| | 400.2 |
| | 378.9 |
| | 319.6 |
| | 341.0 |
| | 121.3 |
| | — |
|
| | $ | 6,534.6 |
| | $ | 821.7 |
| | $ | 884.4 |
| | $ | 923.7 |
| | $ | 982.3 |
| | $ | 544.0 |
| | $ | 2,378.5 |
|
_________
(1) For remainder of the year.
(2) Primarily railcar purchase commitments. The amounts shown for all years are based on management's estimates of the timing, anticipated car types and related costs of railcars to be purchased under its agreements. The amount shown for 2017 includes $24.0 million related to an option we exercised to purchase a vessel that is currently on lease.
In 2014, we entered into a long-term supply agreement with Trinity Rail Group, LLC, a subsidiary of Trinity Industries, Inc., to take effect in 2016. Under terms of the agreement, we will purchase up to 8,950 newly built railcars over a four-year period from March, 2016 through March, 2020. We may order either tank or freight cars; however, we expect that the majority of the order will be for tank cars. Except to the extent the parties otherwise agree, railcar pricing will be on an agreed upon or cost-plus basis subject to certain specified adjustments and surcharges throughout the term of the agreement. In addition, in January, 2017, either party may initiate a review of the cost-plus basis pricing if it is not reflective of then-current market prices. If the parties cannot agree on revised cost-plus pricing (or otherwise agree that no changes are necessary), either party may, at its election, deliver to the other party a notice of its intent to terminate, and in such case, the agreement will automatically terminate 30 days thereafter, unless the non-terminating party agrees to a specified revised margin as set forth in the agreement.
CRITICAL ACCOUNTING POLICIES AND ESTIMATES
There have been no changes to our critical accounting policies during the three months ended March 31, 2016.2017. Refer to our Annual Report on Form 10-K for the year ended December 31, 2015,2016, for a summary of our policies.
NON-GAAP FINANCIAL MEASURES
WeIn addition to financial results reported in accordance with GAAP, we compute certain financial measures using non-GAAP components, as defined by the SEC. These measures are not in accordance with, or a substitute for, GAAP and our financial measures may be different from non-GAAP financial measures used by other companies.
We have provided a reconciliation of our non-GAAP components to the most directly comparable GAAP components. We include these non-GAAP financial measures to provide additional information and insight into our operating results and financial position. We use these measures in analyzing our financial performance from period to period and when making compensation decisions.
Glossary of Key Terms
Non-GAAP financial measures — Numerical or percentage-based measures of a company’s historical performance, financial position, or liquidity calculated using a component different from that presented in the financial statements as prepared in accordance with GAAP.
Net income, excluding other items — Net income, excluding certain items that we believe are not necessarily related to our ongoing business activities.
Off-balance sheet assets — Assets, primarily railcars, that are financed with operating leases and therefore not recorded on the balance sheet. We estimate the off-balance-sheet asset amount by calculating the present value of committed future operating lease payments using the interest rate implicit in each lease.
On-balance sheet assets — Total assets reported on the balance sheet.
Return on equity — Net income divided by average shareholders’ equity.
Return on equity, excluding other items — Net income, excluding certain items, divided by average shareholders’ equity.
Reconciliation of Non-GAAP Components usedUsed in the Computation of Certain Financial Measures
Balance Sheet Measures
We discloseinclude total on- and off-balance sheet assets because a portion of our North AmericaAmerican railcar fleet has been financed through sale-leasebacks that are accounted for as operating leases and the assets are not recorded on the balance sheet. Additionally,Similarly, ASC utilizes a tug and barge unit and a vesselvessels that are accounted for as operating leases and the assets are not recorded on the balance sheet. We include these leased-in assets in our calculation of total assets (as adjusted) because we believe this information providesit gives investors with a bettermore comprehensive representation of the magnitude of the assets deployedwe operate and that drive our financial performance. In addition, this calculation of total assets (as adjusted) provides consistency with other non-financial information we disclose about our fleet, including the number of railcars in the fleet, average number of cars on lease, and utilization. We also provide information regarding our businesses.leverage ratios, which are expressed as a ratio of debt (including off-balance sheet debt) to equity. The off-balance sheet debt amount in this calculation is the equivalent of the off-balance sheet asset amount. We believe reporting this corresponding off-balance sheet debt amount provides investors and other users of our financial statements with a more comprehensive representation of our debt obligations, leverage, and capital structure.
The following table shows total on- and off-balancebalance sheet assets (in millions):
| | | | March 31
2015 | | June 30
2015 | | September 30
2015 | | December 31
2015 | | March 31
2016 | March 31 2016 | | June 30 2016 | | September 30 2016 | | December 31 2016 | | March 31 2017 |
| Consolidated on-balance sheet assets | $ | 7,034.4 |
| | $ | 6,839.5 |
| | $ | 6,884.9 |
| | $ | 6,894.2 |
| | $ | 7,062.0 |
| |
| Total assets (GAAP) | | $ | 7,062.0 |
| | $ | 7,090.6 |
| | $ | 7,089.3 |
| | $ | 7,105.4 |
| | $ | 7,096.9 |
|
| Off-balance sheet assets: | | | | | | | | | | | | | | | | | | |
| Rail North America | 566.1 |
| | 557.2 |
| | 530.9 |
| | 488.7 |
| | 447.3 |
| 447.3 |
| | 443.3 |
| | 478.9 |
| | 456.5 |
| | 423.9 |
|
| ASC | 10.5 |
| | 9.3 |
| | 8.0 |
| | 6.8 |
| | 7.1 |
| 7.1 |
| | 5.7 |
| | 4.2 |
| | 2.6 |
| | 0.7 |
|
| Total On- and Off-Balance Sheet Assets | $ | 7,611.0 |
| | $ | 7,406.0 |
| | $ | 7,423.8 |
| | $ | 7,389.7 |
| | $ | 7,516.4 |
| |
| Total off-balance sheet assets | | $ | 454.4 |
| | $ | 449.0 |
| | $ | 483.1 |
| | $ | 459.1 |
| | $ | 424.6 |
|
| | | | | | | | | | | |
| Total assets, as adjusted (non-GAAP) | | $ | 7,516.4 |
| | $ | 7,539.6 |
| | $ | 7,572.4 |
| | $ | 7,564.5 |
| | $ | 7,521.5 |
|
| | | | | | | | | | | |
| Shareholders’ Equity | $ | 1,282.5 |
| | $ | 1,285.4 |
| | $ | 1,269.0 |
| | $ | 1,280.2 |
| | $ | 1,305.3 |
| $ | 1,305.3 |
| | $ | 1,308.5 |
| | $ | 1,371.5 |
| | $ | 1,347.2 |
| | $ | 1,385.2 |
|
The following table shows the components of recourse leverage (in millions, except recourse leverage ratio):
|
| | | | | | | | | | | | | | | | | | | |
| | March 31
2016 | | June 30
2016 | | September 30
2016 | | December 31
2016 | | March 31 2017 |
| Debt, net of unrestricted cash: | | | | | | | | | |
| Unrestricted cash | $ | (216.2 | ) | | $ | (177.6 | ) | | $ | (211.5 | ) | | $ | (307.5 | ) | | $ | (155.2 | ) |
| Commercial paper and bank credit facilities | 17.9 |
| | 28.5 |
| | 5.1 |
| | 3.8 |
| | 3.0 |
|
| Recourse debt | 4,304.3 |
| | 4,298.8 |
| | 4,204.4 |
| | 4,253.2 |
| | 4,250.9 |
|
| Nonrecourse debt | 4.7 |
| | 2.3 |
| | — |
| | — |
| | — |
|
| Capital lease obligations | 16.9 |
| | 16.6 |
| | 15.1 |
| | 14.9 |
| | 13.5 |
|
| Total debt, net of unrestricted cash (GAAP) | 4,127.6 |
| | 4,168.6 |
| | 4,013.1 |
| | 3,964.4 |
| | 4,112.2 |
|
| Off-balance sheet recourse debt | 454.4 |
| | 449.0 |
| | 483.1 |
| | 459.1 |
| | 424.6 |
|
| Total debt, net of unrestricted cash, as adjusted (non-GAAP) | $ | 4,582.0 |
| | $ | 4,617.6 |
| | $ | 4,496.2 |
| | $ | 4,423.5 |
| | $ | 4,536.8 |
|
| | | | | | | | | | |
| Total recourse debt (1) | $ | 4,577.3 |
| | $ | 4,615.3 |
| | $ | 4,496.2 |
| | $ | 4,423.5 |
| | $ | 4,536.8 |
|
| Shareholders' Equity | $ | 1,305.3 |
| | $ | 1,308.5 |
| | $ | 1,371.5 |
| | $ | 1,347.2 |
| | $ | 1,385.2 |
|
| Recourse Leverage (2) | 3.5 |
| | 3.5 |
| | 3.3 |
| | 3.3 |
| | 3.3 |
|
________
| |
| (1) | Includes on- and off-balance sheet recourse debt, capital lease obligations, and commercial paper and bank credit facilities, net of unrestricted cash. |
| |
| (2) | Calculated as total recourse debt / shareholder's equity. |
Net Income Measures
We exclude the effects of certain tax adjustments and other items when we presentfor purposes of presenting net income, diluted earnings per share, and return on equity, because we believe these items are not attributable to our business operations. Management utilizes net income, excluding tax adjustments and diluted earnings per share. We exclude theseother items, to provide a more meaningful comparison ofwhen analyzing financial performance between yearsbecause such amounts reflect the underlying operating results that are within management’s ability to influence. Accordingly, we believe presenting this information provides investors and to provide transparency inother users of our operating results. financial statements with meaningful supplemental information for purposes of analyzing year-to-year financial performance on a comparable basis and assessing trends.
The following tables show our net income and diluted earnings per share, excluding tax adjustments and other items (in millions, except per share data):
Impact of Tax Adjustments and Other Items on Net Income:
|
| | | | | | | |
| | Three Months Ended
March 31 |
| | 2016 | | 2015 |
| Net income | $ | 69.3 |
| | $ | 62.2 |
|
| Adjustments attributable to consolidated income: | | | |
| Gain on wholly owned Portfolio Management marine investments, net of tax (1) | (1.5 | ) | | — |
|
| Net income, excluding other items | $ | 67.8 |
| | $ | 62.2 |
|
|
| | | | | | | |
| | Three Months Ended
March 31 |
| | 2017 | | 2016 |
| Net income (GAAP) | $ | 57.5 |
| | $ | 69.3 |
|
| | | | |
| Adjustments attributable to consolidated income, pretax: | | | |
| Net gain on wholly owned Portfolio Management marine investments (1) | — |
| | (2.4 | ) |
| Total adjustments attributable to consolidated income, pretax | $ | — |
| | $ | (2.4 | ) |
| Income taxes thereon, based on applicable effective tax rate | — |
| | 0.9 |
|
| Net income, excluding tax adjustments and other items (non-GAAP) | $ | 57.5 |
| | $ | 67.8 |
|
Impact of Tax Adjustments and Other Items on Diluted Earnings per Share:
|
| | | | | | | |
| | Three Months Ended
March 31 |
| | 2016 | | 2015 |
| Diluted earnings per share | $ | 1.66 |
| | $ | 1.39 |
|
| Adjustments attributable to consolidated income: | | | |
| Gain on wholly owned Portfolio Management marine investments, net of tax (1) | (0.04 | ) | | — |
|
| Diluted earnings per share, excluding other items | $ | 1.62 |
| | $ | 1.39 |
|
|
| | | | | | | |
| | Three Months Ended
March 31 |
| | 2017 | | 2016 |
| Diluted earnings per share (GAAP) | $ | 1.44 |
| | $ | 1.66 |
|
| Adjustments attributable to consolidated income, net of taxes: | | | |
| Net gain on wholly owned Portfolio Management marine investments (1) | — |
| | (0.04 | ) |
| Diluted earnings per share, excluding tax adjustments and other items (non-GAAP) | $ | 1.44 |
| | $ | 1.62 |
|
The following table shows our net income and return on equity, excluding tax adjustments and other items, for the trailing twelve months ended March 31 (in millions):
|
| | | | | | | |
| | 2016 | | 2015 |
| Net income | $ | 212.4 |
| | $ | 225.1 |
|
| Adjustments attributable to consolidated income: | | | |
| Net loss on wholly owned Portfolio Management marine investments, net of tax (1) | 4.2 |
| | — |
|
| Early retirement program, net of tax (2) | 5.6 |
| | — |
|
| Income tax rate changes (3) | 14.1 |
| | — |
|
| Adjustments attributable to affiliates' earnings: | | | |
| Impairment loss on Portfolio Management affiliate (1) | 11.9 |
| | — |
|
| Income tax rate changes (4) | (7.7 | ) | | — |
|
| Net income, excluding other items | $ | 240.5 |
| | $ | 225.1 |
|
|
| | | | | | | |
| | 2017 | | 2016 |
| Net income (GAAP) | $ | 245.3 |
| | $ | 212.4 |
|
| Adjustments attributable to consolidated income, pretax: | | | |
| Net loss on wholly owned Portfolio Management marine investments (1) | 4.9 |
| | 6.8 |
|
| Railcar impairment at Rail North America (2) | 29.8 |
| | — |
|
| Residual sharing settlement at Portfolio Management (3) | (49.1 | ) | | — |
|
| Early retirement program (4) | — |
| | 9.0 |
|
| Total adjustments attributable to consolidated income, pretax | $ | (14.4 | ) | | $ | 15.8 |
|
| Income taxes thereon, based on applicable effective tax rate | $ | 6.3 |
| | $ | (6.0 | ) |
| | | | |
| Other income tax adjustments attributable to consolidated income: | | | |
| Foreign tax credit utilization (5) | (7.1 | ) | | — |
|
| Income tax rate changes (6) | — |
| | 14.1 |
|
| Total other income tax adjustments attributable to consolidated income | $ | (7.1 | ) | | $ | 14.1 |
|
| | | | |
| Adjustments attributable to affiliates' earnings, net of taxes: | | | |
| Net (gain) loss on Portfolio Management marine affiliate (1) | (0.6 | ) | | 11.9 |
|
| Income tax rate changes (7) | (3.9 | ) | | (7.7 | ) |
| Total adjustments attributable to affiliates' earnings, net of taxes | $ | (4.5 | ) | | $ | 4.2 |
|
| | | | |
| Net income, excluding tax adjustments and other items (non-GAAP) | $ | 225.6 |
| | $ | 240.5 |
|
| Return on Equity (GAAP) | 18.2 | % | | 16.4 | % |
| Return on Equity, excluding tax adjustments and other items (non-GAAP) | 16.8 | % | | 18.6 | % |
_______________
| |
| (1) | In 2015, we made the decision to exit the majority of our non-core, marine investments within our Portfolio Management segment. As a result, we recorded losses and gains associated with the impairments and sales of certain investments. |
| |
| (2) | In 2016, we recorded impairment losses related specifically to certain railcars in flammable service that we believe have been permanently and negatively impacted by regulatory changes. |
| |
| (3) | Proceeds were recorded as a result of the settlement of a residual sharing agreement related to a residual guarantee we provided on certain rail assets. |
| |
| (4) | Expenses associated with an early retirement program offered to certain eligible employees. |
| |
(3)(5) | Benefits attributable to the utilization of foreign tax credit carryforwards. |
| |
| (6) | Deferred income tax adjustmentadjustments attributable to an increase of our effective state income tax rate in 2015. |
| |
(4)(7) | Deferred income tax adjustmentadjustments due to an enacted statutory rate decreasedecreases in the United Kingdom in 2015.for each of 2017 and 2016. |
Item 3.Quantitative and Qualitative Disclosures aboutAbout Market Risk
Since December 31, 2015,2016, there have been no material changes in our interest rate and foreign currency exposures or types of derivative instruments used to hedge these exposures. For a discussion of our exposure to market risk, refer to "Item 7A. Quantitative and Qualitative Disclosure about Market Risk" of our Annual Report on Form 10-K for the year ended December 31, 2015.2016.
Item 4. Controls and Procedures
We haveOur management, with the participation of our Chief Executive Officer and Chief Financial Officer, has conducted an evaluation of our disclosure controls and procedures (as defined in Rules 13a-15(e) and 15d-15(e) of the Securities Exchange Act of 1934 (the “Exchange Act”)), with the participation of our Chief Executive Officer and Chief Financial Officer.. Based on such evaluation, our Chief Executive Officer and Chief Financial Officer have concluded that, as of the end of the period covered by this quarterly report, our disclosure controls and procedures were effective.
No change in our internal control over financial reporting (as defined in Exchange Act Rules 13a-15(f) and 15d-15(f)) occurred during the quarter ended March 31, 2016,2017, that materially affected, or is reasonably likely to materially affect, our internal control over financial reporting.
PART II - OTHER INFORMATION
Item 1. Legal Proceedings
Information concerning litigation and other contingencies is described in "Note 12. 11. Legal Proceedings and Other Contingencies"Contingencies" in Part I, Item 1 of this Form 10-Q and is incorporated herein by reference.
Item 1A. Risk Factors
Since December 31, 2015,2016, there have been no material changes in our risk factors. For a discussion of our risk factors, refer to "Item 1A. Risk Factors" of our Annual Report on Form 10-K for the year ended December 31, 2015.2016.
Item 2.Unregistered Sales of Equity Securities and Use of Proceeds
(c) On January 29, 2016, our board of directors authorized a $300 million share repurchase program. As of March 31, 2017, $155.0 million remained available under the repurchase authorization.
The following is a summary of common stock repurchases completed by month forduring the first quarter ended March 31, 2016. As of March 31, 2016, $250.0 million remains available under the repurchase authorization.2017:
|
| | | | | | | | | | |
| Issuer Purchases of Equity Securities |
| | | (a) | | (b) | | (c) | | (d) |
| Total | | Total Number of Shares Purchased | | Average Price Paid per Share | | Total Number of Shares Purchased as Part of Publicly Announced Plans or Programs | | Maximum Number (or Approximate Dollar Value) of Shares that May Yet Be Purchased Under the Plans or Programs (1) |
| February 1, 2016 - February 29, 2016 | | 1,198,737 |
| | $41.71 | | 49,999,975 |
| | $250.0 million |
| Total | | 1,198,737 |
| | $41.71 | | 49,999,975 |
| | |
_________
(1) Does not include commissions paid to repurchase shares. |
| | | | | | | | | | | | | | |
| Issuer Purchases of Equity Securities |
| | | (a) | | (b) | | (c) | | (d) |
| Total | | Total Number of Shares Purchased | | Average Price Paid per Share | | Total Number of Shares Purchased as Part of Publicly Announced Plans or Programs | | Maximum Number (or Approximate Dollar Value) of Shares that May Yet Be Purchased Under the Plans or Programs (in millions) |
| February 1, 2017 - February 28, 2017 | | 78,622 |
| | $ | 58.85 |
| | 78,622 |
| | $ | 175.4 |
|
| March 1, 2017 - March 31, 2017 | | 347,041 |
| | $ | 58.71 |
| | 347,041 |
| | $ | 155.0 |
|
| Total | | 425,663 |
| | $ | 58.73 |
| | 425,663 |
| | |
|
Item 6. Exhibits
Exhibits:
Reference is made to the exhibit index which is included herewith and is incorporated by reference hereto.
SIGNATURE
Pursuant to the requirements of the Securities Exchange Act of 1934, the registrant has duly caused this report to be signed on its behalf by the undersigned thereunto duly authorized.
|
|
GATX CORPORATION (Registrant) |
| |
| /s/ Robert C. Lyons |
| Robert C. Lyons |
| Executive Vice President and Chief Financial Officer |
| (Duly Authorized Officer) |
Date: April 25, 2016May 5, 2017
EXHIBIT INDEX
|
| | |
Exhibit Number | | Exhibit Description |
| | | |
| | | Filed with this Report: |
| | | |
| 31A. | | Certification Pursuant to Exchange Act Rule 13a-14(a) and Rule 15d-14(a) (CEO Certification). |
| | | |
| 31B. | | Certification Pursuant to Exchange Act Rule 13a-14(a) and Rule 15d-14(a) (CFO Certification). |
| | | |
| 32. | | Certification Pursuant to 18 U.S.C. Section 1350 (CEO and CFO Certification). |
| | | |
| 101. | | The following materials from GATX Corporation’s Quarterly Report on Form 10-Q for the quarter ended March 31, 2016,2017, formatted in XBRL (eXtensible Business Reporting Language): (i) Consolidated Balance Sheets at March 31, 20162017 and December 31, 2015,2016, (ii) Consolidated Statements of Comprehensive Income for the three months ended March 31, 20162017 and 2015,2016, (iii) Consolidated Statements of Cash Flows for the three months ended March 31, 20162017 and 2015,2016, and (iv) Notes to the Consolidated Financial Statements. |