UNITED STATES
SECURITIES AND EXCHANGE COMMISSION
Washington, D.C. 20549
__________________________________________
FORM 10-Q
__________________________________________
|
| |
| x | QUARTERLY REPORT PURSUANT TO SECTION 13 OR 15(d) OF THE SECURITIES EXCHANGE ACT OF 1934 |
For the quarterly period ended September 30, 20162017
or
|
| |
| ¨ | TRANSITION REPORT PURSUANT TO SECTION 13 OR 15(d) OF THE SECURITIES EXCHANGE ACT OF 1934 |
Commission File Number: 1-2328
GATX Corporation
(Exact name of registrant as specified in its charter)
|
| |
| New York | 36-1124040 |
| (State of incorporation) | (I.R.S. Employer Identification No.) |
| 222 West Adams Street |
| Chicago, Illinois 60606-5314 |
| (Address of principal executive offices, including zip code) |
| (312) 621-6200 |
| (Registrant's telephone number, including area code) |
Indicate by check mark whether the registrant (1) has filed all reports required to be filed by Section 13 or 15(d) of the Securities Exchange Act of 1934 during the preceding 12 months (or for such shorter period that the registrant was required to file such reports), and (2) has been subject to such filing requirements for the past 90 days. Yes x No ¨
Indicate by check mark whether the registrant has submitted electronically and posted on its corporate Web site, if any, every Interactive Data File required to be submitted and posted pursuant to Rule 405 of Regulation S-T (§232.405 of this chapter) during the preceding 12 months (or for such shorter period that the registrant was required to submit and post such files). Yes x No ¨
Indicate by check mark whether the registrant is a large accelerated filer, an accelerated filer, a non-accelerated filer, or a smaller reporting company, or an emerging growth company (as defined in Rule 12b-2 of the Exchange Act).
|
| | | | | |
| | x | Large accelerated filer | | ¨ | Accelerated filer |
| | ¨ | Non-accelerated filer | | ¨ | Smaller reporting company |
| | | | ¨ | Emerging growth company |
If an emerging growth company, indicate by check mark if the registrant has elected not to use the extended transition period for complying with any new or revised financial accounting standards provided pursuant to Section 13(a) of the Exchange Act. ¨
Indicate by check mark whether the registrant is a shell company (as defined in Rule 12b-2 of the Exchange Act).
Yes ¨ No x
As ofCommon shares outstanding were 38.3 million at September 30, 2016, 39.9 million common shares were outstanding.2017.
GATX CORPORATION
FORM 10-Q
QUARTERLY REPORT FOR THE PERIOD ENDED SEPTEMBER 30, 20162017
INDEX
|
| | |
| Item No. | | Page No. |
|
| | | |
| | |
| Item 1. | | |
| | | |
| | | |
| | | |
| | | |
| | |
| Item 2. | | |
| | | |
| | | |
| | | |
| | | |
| | | |
| | | |
| | |
| Item 3. | | |
| | |
| Item 4. | | |
|
|
| | |
| Item 1. | | |
| | |
| Item 1A. | | |
| | |
| Item 2. | | |
| | |
| Item 6. | | |
| |
| |
| | |
| |
FORWARD-LOOKING STATEMENTS
Forward looking statementsStatements in this report that are not based on historical facts are "forward-looking statements"“forward-looking statements” within the meaning of the Private Securities Litigation Reform Act of 1995.1995 and, accordingly, involve known and unknown risks and uncertainties that are difficult to predict and could cause our actual results, performance, or achievements to differ materially from those discussed. These statements include statements that reflectas to our current views with respect to, among other things, future expectations, beliefs, plans, strategies, objectives, events, conditions, financial performance, and market conditions.prospects, or future events. In some cases, youforward-looking statements can identify forward-looking statementsbe identified by the use of words such as “may,” “could,” “expect,” “intend,” “plan,” “seek,” “anticipate,” “believe,” “estimate,” “predict,” “potential,” “continue,” “likely,” “will,” “would” and variations of these terms“would”, and similar expressions,words and phrases. Forward-looking statements are necessarily based on estimates and assumptions that, while considered reasonable by us and our management, are inherently uncertain. Accordingly, you should not place undue reliance on forward-looking statements, which speak only as of the date they are made, and are not guarantees of future performance. We do not undertake any obligation to publicly update or the negative ofrevise these terms or similar expressions.forward-looking statements.
A detailed discussion of the known material risks and uncertainties that could cause actual results and events to differ materially from such forward-looking statements is included in our Annual Report on Form 10-K for the year ended December 31, 2015,2016, and in our other filings with the Securities and Exchange Commission ("SEC"). Specific risks and uncertainties include, but are not limitedThe following factors, in addition to (1) inability to maintain our assets on lease at satisfactory rates, (2) weak economic conditions, financial market volatility, and other factors that may decrease demand for our assets and services, (3) decreased demand for portions of our railcar fleet due to adverse changes in commodity prices, including, but not limited to, sustained low crude oil prices, (4) events having an adverse impact on assets, customers, or regions where we have a large investment, (5) operational disruption and increased costs associated with increased railcar assignments following non-renewal of leases, compliance maintenance programs, and other maintenance initiatives, (6) financial and operational risks associated with long-term railcar purchase commitments, (7) reduced opportunities to generate asset remarketing income, (8) changes in railroad efficiency that could decrease demand for railcars, (9) operational and financial risks related to our affiliate investments, including the RRPF affiliates, (10) fluctuations in foreign exchange rates, (11) failure to successfully negotiate collective bargaining agreements with the unions representing a substantial portion of our employees, (12) the impact of new regulatory requirements for tank cars carrying crude, ethanol, and other flammable liquids, (13) deterioration of conditions in the capital markets, reductionsthose discussed under "Risk Factors", in our credit ratings, or increases in our financing costs, (14) asset impairment charges we may be required to recognize, (15) competitive factors in our primary markets, (16) risks related to international operations and expansion into new geographic markets, (17) exposure to damages, fines, and civil and criminal penalties arising from a negative outcome in our pending or threatened litigation, (18) changes in, or failure to comply with, laws, rules, and regulations (19) inability to obtain cost-effective insurance, (20) environmental remediation costs, (21) inadequate allowances to cover credit losses in our portfolio, and (22) other risks discussed in our filings with the SEC, including our formAnnual Report on Form 10-K for the year ended December 31, 2015, all of which are available on the SEC's website (www.sec.gov).2016, could cause actual results to differ materially from our current expectations expressed in forward looking statements:
Investors should not place undue reliance on forward-looking statements, which speak only as of the date they are made, and are not guarantees of future performance. The Company undertakes no obligation to publicly update or revise these forward-looking statements. |
| | |
• exposure to damages, fines, criminal and civil penalties, and reputational harm arising from a negative outcome in litigation, including claims arising from an accident involving our railcars• inability to maintain our assets on lease at satisfactory rates due to oversupply of railcars in the market or other changes in supply and demand• weak economic conditions and other factors that may decrease demand for our assets and services• decreased demand for portions of our railcar fleet due to adverse changes in the price of, or demand for, commodities that are shipped in our railcars• higher costs associated with increased railcar assignments following non-renewal of leases, customer defaults, and compliance maintenance programs or other maintenance initiatives• events having an adverse impact on assets, customers, or regions where we have a concentrated investment exposure• financial and operational risks associated with long-term railcar purchase commitments• reduced opportunities to generate asset remarketing income• operational and financial risks related to our affiliate investments, including the Rolls-Royce & Partners Finance joint ventures (collectively the “RRPF affiliates”)• fluctuations in foreign exchange rates | | • failure to successfully negotiate collective bargaining agreements with the unions representing a substantial portion of our employees• changes in railroad operations that could decrease demand for railcars, either due to increased railroad efficiency or decreased attractiveness of rail service relative to other modes• the impact of regulatory requirements applicable to tank cars carrying crude, ethanol, and other flammable liquids• asset impairment charges we may be required to recognize• deterioration of conditions in the capital markets, reductions in our credit ratings, or increases in our financing costs• competitive factors in our primary markets, including competitors with a significantly lower cost of capital than GATX• risks related to international operations and expansion into new geographic markets• changes in, or failure to comply with, laws, rules, and regulations• inability to obtain cost-effective insurance• environmental remediation costs• inadequate allowances to cover credit losses in our portfolio• inability to maintain and secure our information technology infrastructure from cybersecurity threats and related disruption of our business |
PART I - FINANCIAL INFORMATION
Item 1.Financial Statements
GATX CORPORATION AND SUBSIDIARIES
CONSOLIDATED BALANCE SHEETS
(In millions, except share data)
| | | | September 30 | | December 31 | September 30 | | December 31 |
| | 2016 | | 2015 | 2017 | | 2016 |
| | (Unaudited) | | | (Unaudited) | | |
| Assets | | | | | | |
| Cash and Cash Equivalents | $ | 211.5 |
| | $ | 202.4 |
| $ | 199.2 |
| | $ | 307.5 |
|
| Restricted Cash | 4.4 |
| | 17.3 |
| 3.7 |
| | 3.6 |
|
| Receivables | | | | | | |
| Rent and other receivables | 85.8 |
| | 69.4 |
| 83.2 |
| | 85.9 |
|
| Loans | 6.7 |
| | 8.8 |
| |
| Finance leases | 158.7 |
| | 167.6 |
| 139.1 |
| | 147.7 |
|
| Less: allowance for losses | (14.2 | ) | | (10.3 | ) | (6.5 | ) | | (6.1 | ) |
| | 237.0 |
| | 235.5 |
| 215.8 |
| | 227.5 |
|
| | | | | | | |
Operating Assets and Facilities ($0 and $122.9 related to a consolidated VIE) | 8,545.4 |
| | 8,204.0 |
| |
| Less: allowance for depreciation ($0 and $39.7 related to a consolidated VIE) | (2,633.4 | ) | | (2,505.6 | ) | |
| Operating Assets and Facilities | | 8,915.9 |
| | 8,446.4 |
|
| Less: allowance for depreciation | | (2,814.6 | ) | | (2,641.7 | ) |
| | 5,912.0 |
| | 5,698.4 |
| 6,101.3 |
| | 5,804.7 |
|
Investments in Affiliated Companies | 376.8 |
| | 348.5 |
| 449.3 |
| | 387.0 |
|
Goodwill | 81.7 |
| | 79.7 |
| 84.6 |
| | 78.0 |
|
| Other Assets | 265.9 |
| | 312.4 |
| 208.0 |
| | 297.1 |
|
Total Assets | $ | 7,089.3 |
| | $ | 6,894.2 |
| $ | 7,261.9 |
| | $ | 7,105.4 |
|
| | | | | | | |
| Liabilities and Shareholders’ Equity | | | | | | |
Accounts Payable and Accrued Expenses | $ | 146.4 |
| | $ | 170.9 |
| $ | 133.8 |
| | $ | 174.8 |
|
| Debt | | | | | | |
| Commercial paper and borrowings under bank credit facilities | 5.1 |
| | 7.4 |
| 15.7 |
| | 3.8 |
|
| Recourse | 4,204.4 |
| | 4,171.5 |
| 4,266.7 |
| | 4,253.2 |
|
| Nonrecourse ($0 and $6.9 related to a consolidated VIE) | — |
| | 6.9 |
| |
| Capital lease obligations | 15.1 |
| | 18.4 |
| 12.8 |
| | 14.9 |
|
| | 4,224.6 |
| | 4,204.2 |
| 4,295.2 |
| | 4,271.9 |
|
Deferred Income Taxes | 1,104.0 |
| | 1,018.3 |
| 1,157.7 |
| | 1,089.4 |
|
Other Liabilities | 242.8 |
| | 220.6 |
| 205.0 |
| | 222.1 |
|
Total Liabilities | 5,717.8 |
| | 5,614.0 |
| 5,791.7 |
| | 5,758.2 |
|
| | | | | |
| Shareholders’ Equity | | | | | | |
Common stock, $0.625 par value: Authorized shares — 120,000,000 Issued shares — 66,891,983 and 66,776,290 Outstanding shares — 39,880,034 and 41,970,098 | 41.5 |
| | 41.5 |
| |
Common stock, $0.625 par value: Authorized shares — 120,000,000 Issued shares — 67,071,263 and 66,953,606 Outstanding shares — 38,311,330 and 39,442,893 | | 41.6 |
| | 41.5 |
|
| Additional paid in capital | 681.5 |
| | 677.4 |
| 695.8 |
| | 687.8 |
|
| Retained earnings | 1,813.6 |
| | 1,639.0 |
| 1,936.2 |
| | 1,828.0 |
|
| Accumulated other comprehensive loss | (191.1 | ) | | (198.8 | ) | (129.4 | ) | | (211.1 | ) |
| Treasury stock at cost (27,011,949 and 24,806,192 shares) | (974.0 | ) | | (878.9 | ) | |
| Treasury stock at cost (28,759,933 and 27,510,713 shares) | | (1,074.0 | ) | | (999.0 | ) |
Total Shareholders’ Equity | 1,371.5 |
| | 1,280.2 |
| 1,470.2 |
| | 1,347.2 |
|
| Total Liabilities and Shareholders’ Equity | $ | 7,089.3 |
| | $ | 6,894.2 |
| $ | 7,261.9 |
| | $ | 7,105.4 |
|
See accompanying notes to consolidated financial statements.
GATX CORPORATION AND SUBSIDIARIES
CONSOLIDATED STATEMENTS OF COMPREHENSIVE INCOME (Unaudited)
(In millions, except per share data)
| | | | Three Months Ended
September 30 | | Nine Months Ended September 30 | Three Months Ended
September 30 | | Nine Months Ended
September 30 |
| | 2016 | | 2015 | | 2016 | | 2015 | 2017 | | 2016 | | 2017 | | 2016 |
| Revenues | | | | | | | | | | | | | | |
| Lease revenue | $ | 281.8 |
| | $ | 286.2 |
| | $ | 847.5 |
| | $ | 845.1 |
| $ | 276.6 |
| | $ | 281.8 |
| | $ | 823.4 |
| | $ | 847.5 |
|
| Marine operating revenue | 62.1 |
| | 77.6 |
| | 139.7 |
| | 167.8 |
| 62.9 |
| | 62.1 |
| | 135.0 |
| | 139.7 |
|
| Other revenue | 19.0 |
| | 22.4 |
| | 69.0 |
| | 58.3 |
| 20.1 |
| | 19.0 |
| | 65.7 |
| | 69.0 |
|
| Total Revenues | 362.9 |
| | 386.2 |
| | 1,056.2 |
| | 1,071.2 |
| 359.6 |
| | 362.9 |
| | 1,024.1 |
| | 1,056.2 |
|
| Expenses | | | | | | | | | | | | | | |
| Maintenance expense | 79.6 |
| | 83.9 |
| | 244.6 |
| | 242.4 |
| 84.9 |
| | 79.6 |
| | 247.7 |
| | 244.6 |
|
| Marine operating expense | 39.2 |
| | 48.5 |
| | 88.9 |
| | 114.7 |
| 38.9 |
| | 39.2 |
| | 89.8 |
| | 88.9 |
|
| Depreciation expense | 75.9 |
| | 75.0 |
| | 221.0 |
| | 217.9 |
| 78.6 |
| | 75.9 |
| | 227.9 |
| | 221.0 |
|
| Operating lease expense | 19.2 |
| | 22.3 |
| | 54.5 |
| | 65.4 |
| 15.8 |
| | 19.2 |
| | 46.8 |
| | 54.5 |
|
| Other operating expense | 10.1 |
| | 8.3 |
| | 33.7 |
| | 23.4 |
| 8.5 |
| | 10.1 |
| | 25.9 |
| | 33.7 |
|
| Selling, general and administrative expense | 48.1 |
| | 44.4 |
| | 127.8 |
| | 134.7 |
| 42.8 |
| | 48.1 |
| | 128.8 |
| | 127.8 |
|
| Total Expenses | 272.1 |
| | 282.4 |
| | 770.5 |
| | 798.5 |
| 269.5 |
| | 272.1 |
| | 766.9 |
| | 770.5 |
|
| Other Income (Expense) | | | | | | | | | | | | | | |
| Net gain (loss) on asset dispositions | 62.7 |
| | (4.5 | ) | | 122.8 |
| | 49.5 |
| |
| Net gain on asset dispositions | | 9.4 |
| | 62.7 |
| | 56.3 |
| | 122.8 |
|
| Interest expense, net | (36.2 | ) | | (37.7 | ) | | (109.9 | ) | | (117.1 | ) | (40.2 | ) | | (36.2 | ) | | (119.4 | ) | | (109.9 | ) |
| Other income (expense) | 4.3 |
| | (3.1 | ) | | (2.9 | ) | | (8.7 | ) | |
| Other (expense) income | | (2.1 | ) | | 4.3 |
| | (4.5 | ) | | (2.9 | ) |
Income before Income Taxes and Share of Affiliates’ Earnings | 121.6 |
| | 58.5 |
| | 295.7 |
| | 196.4 |
| 57.2 |
| | 121.6 |
| | 189.6 |
| | 295.7 |
|
| Income Taxes | (41.1 | ) | | (20.3 | ) | | (98.6 | ) | | (68.1 | ) | |
| Share of Affiliates’ Earnings, Net of Taxes | 15.2 |
| | 1.3 |
| | 29.1 |
| | 18.8 |
| |
| Income taxes | | (20.4 | ) | | (41.1 | ) | | (60.3 | ) | | (98.6 | ) |
| Share of affiliates’ earnings, net of taxes | | 12.2 |
| | 15.2 |
| | 30.6 |
| | 29.1 |
|
Net Income | $ | 95.7 |
| | $ | 39.5 |
| | $ | 226.2 |
| | $ | 147.1 |
| $ | 49.0 |
| | $ | 95.7 |
| | $ | 159.9 |
| | $ | 226.2 |
|
| Other Comprehensive Income, Net of Taxes | | | | | | | | | | | | | | |
| Foreign currency translation adjustments | 11.0 |
| | (2.9 | ) | | 16.2 |
| | (39.4 | ) | 15.4 |
| | 11.0 |
| | 74.0 |
| | 16.2 |
|
| Unrealized gain (loss) on securities | 1.3 |
| | (0.3 | ) | | 1.6 |
| | (0.4 | ) | |
| Unrealized gain on securities | | — |
| | 1.3 |
| | — |
| | 1.6 |
|
| Unrealized gain (loss) on derivative instruments | 0.5 |
| | 2.5 |
| | (6.8 | ) | | — |
| 0.7 |
| | 0.5 |
| | 3.6 |
| | (6.8 | ) |
| Post-retirement benefit plans | (6.0 | ) | | 2.1 |
| | (3.3 | ) | | 6.3 |
| 1.4 |
| | (6.0 | ) | | 4.1 |
| | (3.3 | ) |
| Other comprehensive income (loss) | 6.8 |
| | 1.4 |
| | 7.7 |
| | (33.5 | ) | |
| Other comprehensive income | | 17.5 |
| | 6.8 |
| | 81.7 |
| | 7.7 |
|
Comprehensive Income | $ | 102.5 |
| | $ | 40.9 |
| | $ | 233.9 |
| | $ | 113.6 |
| $ | 66.5 |
| | $ | 102.5 |
| | $ | 241.6 |
| | $ | 233.9 |
|
| | | | | | | | | | | | | | | |
| Share Data | | | | | | | | | | | | | | |
| Basic earnings per share | $ | 2.39 |
| | $ | 0.92 |
| | $ | 5.55 |
| | $ | 3.38 |
| $ | 1.27 |
| | $ | 2.39 |
| | $ | 4.10 |
| | $ | 5.55 |
|
| Average number of common shares | 40.1 |
| | 42.8 |
| | 40.7 |
| | 43.5 |
| 38.6 |
| | 40.1 |
| | 39.0 |
| | 40.7 |
|
| | | | | | | | | | | | | | | |
| Diluted earnings per share | $ | 2.36 |
| | $ | 0.91 |
| | $ | 5.49 |
| | $ | 3.33 |
| $ | 1.25 |
| | $ | 2.36 |
| | $ | 4.04 |
| | $ | 5.49 |
|
| Average number of common shares and common share equivalents | 40.6 |
| | 43.4 |
| | 41.2 |
| | 44.1 |
| 39.2 |
| | 40.6 |
| | 39.6 |
| | 41.2 |
|
| | | | | | | | | | | | | | | |
| Dividends declared per common share | $ | 0.40 |
| | $ | 0.38 |
| | $ | 1.20 |
| | $ | 1.14 |
| $ | 0.42 |
| | $ | 0.40 |
| | $ | 1.26 |
| | $ | 1.20 |
|
See accompanying notes to consolidated financial statements.
GATX CORPORATION AND SUBSIDIARIES
CONSOLIDATED STATEMENTS OF CASH FLOWS (Unaudited)
(In millions)
| | | | Nine Months Ended September 30 | Nine Months Ended September 30 |
| | 2016 | | 2015 | 2017 | | 2016 |
| Operating Activities | | | | | | |
| Net income | $ | 226.2 |
| | $ | 147.1 |
| $ | 159.9 |
| | $ | 226.2 |
|
| Adjustments to reconcile net income to net cash provided by operating activities: | | | | | | |
| Depreciation expense | 230.6 |
| | 227.4 |
| 238.5 |
| | 230.6 |
|
| Change in accrued operating lease expense | (11.0 | ) | | (38.0 | ) | (21.2 | ) | | (11.0 | ) |
| Net gains on sales of assets | (41.3 | ) | | (69.7 | ) | (48.4 | ) | | (41.3 | ) |
| Asset impairments | 1.8 |
| | 31.2 |
| |
| Deferred income taxes | 83.6 |
| | 55.8 |
| 44.8 |
| | 83.6 |
|
| Change in income taxes payable | | (4.9 | ) | | (8.1 | ) |
| Share of affiliates’ earnings, net of dividends | (29.0 | ) | | (18.6 | ) | (22.0 | ) | | (29.0 | ) |
| Other | (27.9 | ) | | (23.2 | ) | (29.2 | ) | | (15.5 | ) |
| Net cash provided by operating activities | 433.0 |
| | 312.0 |
| 317.5 |
| | 435.5 |
|
| Investing Activities | | | | | | |
| Additions to operating assets and facilities | | (422.4 | ) | | (442.6 | ) |
| Investments in affiliates | | (36.6 | ) | | — |
|
| Portfolio investments and capital additions | (442.6 | ) | | (498.3 | ) | (459.0 | ) | | (442.6 | ) |
| Purchases of leased-in assets | (116.5 | ) | | (118.4 | ) | |
| Purchases of previously leased-in assets | | (93.2 | ) | | (116.5 | ) |
| Portfolio proceeds | 170.6 |
| | 298.2 |
| 131.0 |
| | 170.6 |
|
| Proceeds from sales of other assets | 18.6 |
| | 16.2 |
| 24.3 |
| | 18.6 |
|
| Proceeds from sale-leasebacks | 82.5 |
| | — |
| 90.6 |
| | 82.5 |
|
| Net decrease (increase) in restricted cash | 12.9 |
| | (1.0 | ) | |
| Other | — |
| | 9.7 |
| |
| Net cash used in investing activities | (274.5 | ) | | (293.6 | ) | (306.3 | ) | | (287.4 | ) |
| Financing Activities | | | | | | |
| Net proceeds from issuances of debt (original maturities longer than 90 days) | 801.8 |
| | 748.8 |
| 297.5 |
| | 801.8 |
|
| Repayments of debt (original maturities longer than 90 days) | (798.7 | ) | | (649.4 | ) | (301.5 | ) | | (798.7 | ) |
| Net decrease in debt with original maturities of 90 days or less | (2.5 | ) | | (54.0 | ) | |
| Net increase (decrease) in debt with original maturities of 90 days or less | | 11.1 |
| | (2.5 | ) |
| Stock repurchases | (95.1 | ) | | (105.0 | ) | (75.0 | ) | | (95.1 | ) |
| Dividends | (51.2 | ) | | (51.9 | ) | (51.8 | ) | | (51.2 | ) |
| Other | (3.5 | ) | | 3.7 |
| (2.8 | ) | | (6.0 | ) |
| Net cash used in financing activities | (149.2 | ) | | (107.8 | ) | |
| Net cash used in by financing activities | | (122.5 | ) | | (151.7 | ) |
| Effect of Exchange Rate Changes on Cash and Cash Equivalents | (0.2 | ) | | (4.5 | ) | 3.1 |
| | (0.2 | ) |
| Net increase (decrease) in Cash and Cash Equivalents | 9.1 |
| | (93.9 | ) | |
| Cash and Cash Equivalents, beginning of period | 202.4 |
| | 209.9 |
| |
| Cash and Cash Equivalents, end of period | $ | 211.5 |
| | $ | 116.0 |
| |
Net decrease in Cash, Cash Equivalents, and Restricted Cash during the period | | (108.2 | ) | | (3.8 | ) |
| Cash, Cash Equivalents, and Restricted Cash at beginning of period | | 311.1 |
| | 219.7 |
|
| Cash, Cash Equivalents, and Restricted Cash at end of period | | $ | 202.9 |
| | $ | 215.9 |
|
See accompanying notes to consolidated financial statements.
GATX CORPORATION AND SUBSIDIARIES
NOTES TO CONSOLIDATED FINANCIAL STATEMENTS (UNAUDITED)
NOTE 1. Description of Business
As used herein, "GATX," "we," "us," "our," and similar terms refer to GATX Corporation and its subsidiaries, unless indicated otherwise.
We lease, operate, manage, and remarket long-lived, widely-used assets, primarily in the rail market. We also invest in joint ventures that complement our existing business activities. We report our financial results through four primary business segments: Rail North America, Rail International, American Steamship Company (“ASC”), and Portfolio Management.
NOTE 2. Basis of Presentation
We prepared the accompanying unaudited consolidated financial statements in accordance with US Generally Accepted Accounting Principles ("GAAP") for interim financial information and the instructions to Form 10-Q and Article 10 of Regulation S-X. Accordingly, our unaudited consolidated financial statements do not include all of the information and footnotes required for complete financial statements. We have included all of the normal recurring adjustments that we deemed necessary for a fair presentation.
Operating results for the nine months ended September 30, 2016,2017, are not necessarily indicative of the results we may achieve for the entire year ending December 31, 2016.2017. In particular, ASC's fleet is inactive for a significant portion of the first quarter of each year due to winter conditions on the Great Lakes. In addition, asset remarketing income does not occur evenly throughout the year. For more information, refer to the consolidated financial statements and footnotes in our Annual Report on Form 10-K for the year ended December 31, 2015.2016.
Accounting Changes
Change in Accounting Estimate
At the end of 2015, we changed the approach used to measure service and interest costs for pension and other postretirement benefits. In prior years, we measured service and interest costs utilizing a single weighted-average discount rate derived from the yield curve used to measure the plan obligations. For 2016, we measured service and interest costs by applying the specific spot rates along that yield curve to the plans’ liability cash flows. We believe this approach provides a more precise measurement of service and interest costs by aligning the timing of the plans’ liability cash flows to the corresponding spot rates on the yield curve. This change does not affect the measurement of our plan obligations. We have accounted for this change as a change in accounting estimate and, accordingly, have applied it on a prospective basis. Our adoption of the full yield curve approach will reduce 2016 service and interest cost by approximately $4.5 million ($2.8 million after-tax) as compared to the previous method.
New Accounting Pronouncements Adopted
ConsolidationEquity Method and Joint Ventures
In February 2015,March 2016, the Financial Accounting Standards Board ("FASB") issued Accounting Standards Update ("ASU") 2015-02,2016-07, ConsolidationInvestments - Equity Method and Joint Ventures (Topic 810) Amendments323): Simplifying the Transition to the Consolidation AnalysisEquity Method of Accounting, which amendseliminates the analysis requiredrequirement to determine whether to consolidate certain types of legal entities such as limited partnerships, limited liability corporations, and certain securitization structures.retrospectively apply equity method accounting when an entity increases ownership or influence in a previously held investment. The new guidance was effective for us beginning in the first quarter of 2016.2017. Application of the new guidance did not impact our financial statements or related disclosures.
Business CombinationsStock Compensation
In September 2015,March 2016, the FASB issued ASU 2015-16,2016-09, Business CombinationsCompensation - Stock Compensation (Topic 805), Simplifying the718): Improvements to Employee Share-Based Payment Accounting, for Measurement-Period Adjustments, which simplifies and clarifies certain aspects of share-based payments accounting and presentation. The update requires recognition of excess tax benefits and tax deficiencies, which arise due to differences between the acquirermeasure of compensation expense and the amount deductible for tax purposes, to be recorded directly through earnings as a component of income tax expense. Previously, these differences were generally recorded in a business combinationadditional paid-in capital and thus had no impact on net income. The change in treatment of excess tax benefits and tax deficiencies also impacts the computation of diluted earnings per share, and the cash flows associated with those items are classified as operating activities on the consolidated statements of cash flows. The guidance also clarifies that all cash payments made to taxing authorities on the employees' behalf for withheld shares should be classified as financing activities on the consolidated statements of cash flows. Additionally, the guidance permits entities to make an accounting policy election for the impact of forfeitures on the recognition of expense for share-based payment awards. Forfeitures can be estimated as of the initial valuation date, as allowed under the previous guidance, or recognized when they occur. We changed our accounting policy to recognize measurement-period adjustments in the period in which it determines the amountforfeitures when they occur as part of the adjustment. The new guidance wasthis adoption. These amendments became effective for us in the first quarter of 2016. Application2017, and we adopted this guidance as of theJanuary 1, 2017. Adoption of this new guidancestandard did not have a material impact on our financial statements or related disclosures.
GATX CORPORATION AND SUBSIDIARIES
NOTES TO CONSOLIDATED FINANCIAL STATEMENTS (UNAUDITED) (Continued)
Statement of Cash Flows
In November 2016, the FASB issued ASU 2016-18, Statement of Cash Flows (Topic 230): Restricted Cash, which clarifies the classification and presentation of changes in restricted cash on the statement of cash flows. We elected to early adopt the new guidance as of January 1, 2017, using the retrospective method. Application of the new guidance requires presentation of restricted cash together with cash and cash equivalents on the consolidated statements of cash flows and eliminates the disclosure of the related changes in restricted cash within investing activities.
New Accounting Pronouncements Not Yet Adopted
Revenue from Contracts with Customers
In May 2014, the FASB issued ASU 2014-09, Revenue from Contracts with Customers (Topic 606), which supersedes most current revenue recognition guidance, including industry-specific guidance. Subsequently, the FASB has issued updates which provide additional implementation guidance. The new guidance requires companies to recognize revenue to depict the transfer of promised goods or services to customers in an amount that reflects the consideration it expects to be entitled to in exchange for those goods or services. The FASB delayed the effective date of this guidance to the first quarter of 2018, with early adoption permitted as of the original effective date of the first quarter of 2017. We canplan to adopt this guidance as of January 1, 2018, using the modified retrospective approach. Our primary source of revenue is lease revenue, which will continue to be within the scope of existing lease accounting guidance upon adoption of Topic 606. We have substantially completed our review of all other revenue sources in scope for the new guidance using either the retrospective method or the cumulative effect transition method. We are evaluating the effect thatstandard and have concluded the new guidance will not have a material impact on our consolidated financial statements and related disclosures and when we will elect to adopt this standard.statements.
Leases
In February 2016, the FASB issued ASU 2016-02, Leases (Topic 842), which supersedes most current lease guidance. The new guidance requires companies to recognize most leases on the balance sheet and modifies accounting, presentation, and disclosure for both lessors and lessees. The new guidance is effective for us in the first quarter of 2019, with early adoption permitted,permitted. We plan to adopt this guidance on January 1, 2019, using a modified retrospective transition method.method, and we expect to utilize the package of three optional practical expedients as provided in the standard. We are evaluatingcontinue to assess the effect that the new guidance will have on our consolidated financial statements and related disclosures and when we will elect to adopt this standard.disclosures.
Financial Instruments
In January 2016, the FASB issued ASU 2016-01, Financial Instruments - Overall:Overall (Topic 825): Recognition and Measurement of Financial Assets and Financial Liabilities, which modifies the accounting and reporting requirements for certain equity securities and financial liabilities. The new guidance is effective for us beginning in the first quarter of 2018, with certain provisions eligible for early adoption. We do not expect the new guidance to have a significant impact on our financial statements or related disclosures.
Equity Method and Joint Ventures
In March 2016, the FASB issued ASU 2016-07, Investments - Equity Method and Joint Ventures (Topic 323): Simplifying the Transition to the Equity Method of Accounting, which eliminates the requirement to retrospectively apply equity method accounting when an entity increases ownership or influence in a previously held investment. The new guidance is effective for us in the first quarter of 2017 with early adoption permitted. We do not expect the new guidance to impact our financial statements or related disclosures.
Stock Compensation
In March 2016, the FASB issued ASU 2016-09, Compensation - Stock Compensation (Topic 718): Improvements to Employee Share-Based Payment Accounting, which simplifies and clarifies certain aspects of share-based payment accounting and presentation. The new guidance is effective for us in the first quarter of 2017 with early adoption permitted. We do not expect the guidance to impact our financial statements or related disclosures.
Credit Losses
In June 2016, the FASB issued ASU 2016-13, Credit Losses (Topic 326): Measurement of Credit Losses on Financial Instruments, which modifies how entities will measure credit losses. The new guidance is effective for us in the first quarter of 2020, with early adoption permitted. We are evaluating the effect that the new guidance will have on our financial statements and related disclosures.
Statement of Cash Flows Classification
In August 2016, the FASB issued ASU 2016-15, Statement of Cash Flows (Topic 230): Classification of Certain Cash Receipts and Cash Payments, which clarifies the classification of certain cash receipts and payments in the statement of cash flows. The new guidance is effective for us in the first quarter of 2018, with early adoption permitted. We do not expect the new guidance to have a significant impact on our financial statements or related disclosures.
GATX CORPORATION AND SUBSIDIARIES
NOTES TO CONSOLIDATED FINANCIAL STATEMENTS (UNAUDITED) (Continued)
NOTE 3. Variable Interest EntitiesIn October 2016, the FASB issued ASU 2016-16, Income Taxes (Topic 740): Intra-Entity Transfers of Assets Other Than Inventory, which modifies how an entity will recognize the income tax consequences of an intra-entity transfer of an asset when the transfer occurs. The new guidance is effective for us in the first quarter of 2018, with early adoption permitted. We plan to adopt this guidance on January 1, 2018, applying the retrospective method. We do not expect the new guidance to have a material impact on our financial statements and related disclosures.
Compensation
In prior periods, we wereMarch 2017, the primary beneficiaryFASB issued ASU 2017-07, Compensation - Retirement Benefits (Topic 715): Improving the Presentation of oneNet Periodic Pension Cost and Net Periodic Postretirement Benefit Cost, which modifies how an entity must present service costs and other components of our variable interest entities, a structured lease financing of a portfolio of railcars, because we hadnet benefit cost. The new guidance is effective for us in the power to direct its significant activities. As a result, we consolidated this variable interest entity. During the thirdfirst quarter of 2016,2018, with early adoption permitted. We plan to adopt this guidance on January 1, 2018, applying the Company took full ownership of all assets, repaidretrospective method. We do not expect the associated debt,new guidance to have a significant impact on our financial statements and dissolved this entity.related disclosures.
The following table showsDerivatives and Hedging
In August 2017, the carrying amounts of assetsFASB issued ASU 2017-12, Derivatives and liabilitiesHedging (Topic 815): Targeted Improvements to Accounting for Hedging Activities, which expands and refines hedge accounting for both financial and non-financial risk components, aligns the recognition and presentation of the consolidated variable interest entity (in millions):
|
| | | | | | | |
| | September 30 2016 | | December 31 2015 |
| Operating assets, net of accumulated depreciation (1) | $ | — |
| | $ | 83.2 |
|
| Nonrecourse debt | — |
| | 6.9 |
|
_________
| |
(1) | All operating assets were pledged as collateral on the nonrecourse debt. |
We determined that we are noteffects of hedging instruments and hedge items in the primary beneficiaryfinancial statements, and includes certain targeted improvements to ease the application of our other variable interest entities, which are primarily investmentscurrent guidance related to the assessment of hedge effectiveness. The update to the standard is effective for us beginning in aircraft spare engine leasing affiliates that were financed through a varietythe first quarter of equity investments and third-party lending arrangements.2019, with early adoption permitted in any interim period. We are not the primary beneficiary of these variable interest entities because we do not expect the new guidance to have the power to direct the activities that most significantlya significant impact the entities’ economic performance. Rather, that power was shared by the affiliate partners based on the terms of the relevant joint venture agreements, which require approval of all partners for significant decisions regarding the variable interest entity.
The following table shows the carrying amounts and maximum exposure to loss for our unconsolidated variable interest entities (in millions):
|
| | | | | | | | | | | | | | | |
| | September 30, 2016 | | December 31, 2015 |
| | Net Carrying Amount | | Maximum Exposure to Loss | | Net Carrying Amount | | Maximum Exposure to Loss |
| Investments in affiliates | $ | 176.4 |
| | $ | 176.4 |
| | $ | 161.2 |
| | $ | 161.2 |
|
| Other investment | 0.1 |
| | 0.1 |
| | 0.2 |
| | 0.2 |
|
| Total | $ | 176.5 |
| | $ | 176.5 |
| | $ | 161.4 |
| | $ | 161.4 |
|
GATX CORPORATION AND SUBSIDIARIES
NOTES TO CONSOLIDATED FINANCIAL STATEMENTS (UNAUDITED) (Continued)
NOTE 4.3. Fair Value Disclosure
The following tables show our assets and liabilities that are measured at fair value on a recurring basis (in millions):
| | | Assets | September 30 2016 | | Quoted Prices in Active Markets for Identical Assets (Level 1) | | Significant Observable Inputs (Level 2) | | Significant Unobservable Inputs (Level 3) | Total September 30 2017 | | Quoted Prices in Active Markets for Identical Assets (Level 1) | | Significant Observable Inputs (Level 2) | | Significant Unobservable Inputs (Level 3) |
| Interest rate derivatives (1) | $ | 4.8 |
| | $ | — |
| | $ | 4.8 |
| | $ | — |
| $ | 0.1 |
| | $ | — |
| | $ | 0.1 |
| | $ | — |
|
| Foreign exchange rate derivatives (1) | 6.7 |
| | — |
| | 6.7 |
| | — |
| 2.6 |
| | — |
| | 2.6 |
| | — |
|
| Available-for-sale equity securities | 6.0 |
| | 6.0 |
| | — |
| | — |
| |
| Foreign exchange rate derivatives (2) | | 0.3 |
| | — |
| | 0.3 |
| | — |
|
| Liabilities |
|
| | | | | | |
|
| | | | | | |
| Interest rate derivatives (1) | 5.0 |
| | — |
| | 5.0 |
| | — |
| 0.9 |
| | — |
| | 0.9 |
| | — |
|
| Foreign exchange rate derivatives (1) | 9.4 |
| | — |
| | 9.4 |
| | — |
| 22.8 |
| | — |
| | 22.8 |
| | — |
|
| Foreign exchange rate derivatives (2) | 1.5 |
| | — |
| | 1.5 |
| | — |
| 2.9 |
| | — |
| | 2.9 |
| | — |
|
| | | Assets | December 31 2015 | | Quoted Prices in Active Markets for Identical Assets (Level 1) | | Significant Observable Inputs (Level 2) | | Significant
Unobservable
Inputs
(Level 3) | Total December 31 2016 | | Quoted
Prices in
Active Markets for
Identical Assets
(Level 1) | | Significant Observable Inputs
(Level 2) | | Significant Unobservable
Inputs
(Level 3) |
| Interest rate derivatives (1) | $ | 1.8 |
| | $ | — |
| | $ | 1.8 |
| | $ | — |
| $ | 2.9 |
| | $ | — |
| | $ | 2.9 |
| | $ | — |
|
| Foreign exchange rate derivatives (1) | 10.2 |
| | — |
| | 10.2 |
| | — |
| 12.2 |
| | — |
| | 12.2 |
| | — |
|
| Foreign exchange rate derivatives (2) | 0.8 |
| | — |
| | 0.8 |
| | — |
| 1.3 |
| | — |
| | 1.3 |
| | — |
|
| Available-for-sale equity securities | 3.3 |
| | 3.3 |
| | — |
| | — |
| |
| | | | | | | | | |
| Liabilities | | | | | | | | | | | | | | |
| Interest rate derivatives (1) | 1.2 |
| | — |
| | 1.2 |
| | — |
| 0.1 |
| | — |
| | 0.1 |
| | — |
|
| Foreign exchange rate derivatives (1) | 0.2 |
| | — |
| | 0.2 |
| | — |
| |
| Foreign exchange rate derivatives (2) | 2.4 |
| | — |
| | 2.4 |
| | — |
| |
_________
(1) Designated as hedges.
(2) Not designated as hedges.
| |
| (2) | Not designated as hedges. |
We base our valuations of available-for-sale equity securities on their quoted prices on an active exchange. We value derivatives using a pricing model with inputs (such as yield curves and foreign currency rates) that are observable in the market or that can be derived principally from observable market data.
Derivative instruments
Fair Value Hedges
We use interest rate swaps to manage the fixed-to-floating rate mix of our debt obligations by converting the fixed rate debt to floating rate debt. For fair value hedges, we recognize changes in fair value of both the derivative and the hedged item as interest expense. We had eight instruments outstanding with an aggregate notional amount of $550.0$450.0 million as of September 30, 20162017 that mature from 2018 to 2022 and eight instruments outstanding with an aggregate notional amount of $550.0 million as of December 31, 2015 that mature2016 with maturities ranging from 2017 to 2020.
GATX CORPORATION AND SUBSIDIARIES
NOTES TO CONSOLIDATED FINANCIAL STATEMENTS (UNAUDITED) (Continued)
Cash Flow Hedges
We use interest rate swaps to convert floating rate debt to fixed rate debt,debt. We use Treasury rate locks and we use Treasuryswap rate locks to hedge our exposure to interest rate risk on anticipated transactions. We also use currency swaps to hedge our exposure to fluctuations in the exchange rates of the foreign currencies in which we conduct business. We had sixteeneleven instruments outstanding with an aggregate notional amount of $471.6$290.2 million as of September 30, 20162017 that mature from 20162017 to 2022 and tennine instruments outstanding with an aggregate notional amount of $442.9$412.1 million as of December 31, 2015.2016 with maturities ranging from 2017 to 2022. Within the next 12 months, we expect to reclassify $5.6$5.2 million ($3.53.3 million after-tax) of net losses on previously terminated derivatives from accumulated other comprehensive income (loss) to interest expense or operating lease expense, as applicable. We reclassify these amounts when interest expense and operating lease expense on the related hedged transactions affect earnings.
Non-designated Derivatives
We do not hold derivative financial instruments for purposes other than hedging, although certain of our derivatives are not designated as accounting hedges. We recognize changes in the fair value of these derivatives in other (income) expense immediately.
Some of our derivative instruments contain credit risk provisions that could require us to make immediate payment on net liability positions in the event that we default on certain outstanding debt obligations. The aggregate fair value of our derivative instruments with credit risk related contingent features that are in a liability position as of September 30, 2016,2017, was $14.4 million.$23.7 million. We are not required to post any collateral on our derivative instruments and do not expect the credit risk provisions to be triggered.
In the event that a counterparty fails to meet the terms of an interest rate swap agreement or a foreign exchange contract, our exposure is limited to the fair value of the swap, if in our favor. We manage the credit risk of counterparties by transacting with institutions that we consider financially sound and by avoiding concentrations of risk with a single counterparty. We believe that the risk of non-performance by any of our counterparties is remote.
The following table shows the impacts of our derivative instruments on our statementsstatement of comprehensive income (in millions):
| | | | | Three Months Ended
September 30 | | Nine Months Ended September 30 | | | | Three Months Ended
September 30 | | Nine Months Ended
September 30 |
| Derivative Designation | | Location of Loss (Gain) Recognized | | 2016 | | 2015 | | 2016 | | 2015 | | Location of Loss (Gain) Recognized | | 2017 | | 2016 | | 2017 | | 2016 |
| Fair value hedges (1) | | Interest expense | | $ | 2.6 |
| | $ | (4.4 | ) | | $ | (3.3 | ) | | $ | (5.3 | ) | | Interest expense | | $ | 0.6 |
| | $ | 2.6 |
| | $ | 1.5 |
| | $ | (3.3 | ) |
| Cash flow hedges | | Other comprehensive (income) loss (effective portion) | | (2.8 | ) | | (0.5 | ) | | (26.8 | ) | | 2.0 |
| | Other comprehensive (income) loss (effective portion) | | (11.1 | ) | | (2.8 | ) | | (34.8 | ) | | (26.8 | ) |
| Cash flow hedges | | Interest expense (effective portion reclassified from accumulated other comprehensive loss) | | 1.7 |
| | 1.4 |
| | 5.1 |
| | 4.1 |
| | Interest expense (effective portion reclassified from accumulated other comprehensive loss) | | 1.7 |
| | 1.7 |
| | 5.1 |
| | 5.1 |
|
| Cash flow hedges | | Operating lease expense (effective portion reclassified from accumulated other comprehensive loss) | | 0.7 |
| | 0.1 |
| | 1.1 |
| | 0.3 |
| | Operating lease expense (effective portion reclassified from accumulated other comprehensive loss) | | — |
| | 0.7 |
| | — |
| | 1.1 |
|
| Cash flow hedges (2) | | Other (income) expense (effective portion reclassified from accumulated other comprehensive loss) | | 3.3 |
| | 0.8 |
| | 13.6 |
| | 5.0 |
| | Other (income) expense (effective portion reclassified from accumulated other comprehensive loss) | | 10.1 |
| | 3.3 |
| | 33.8 |
| | 13.6 |
|
Non-designated (3) | | Other (income) expense | | 2.2 |
| | (0.6 | ) | | (0.1 | ) | | (6.4 | ) | | Other (income) expense | | (2.0 | ) | | 2.2 |
| | 4.1 |
| | (0.1 | ) |
_________
(1) The fair value adjustments related to the underlying debt equally offset amounts recognized in interest expense.
(2) Includes $4.2 million and $11.0 million of losses for the three and nine months ended September 30, 2016, and $0.8 million and $3.5 million of losses for the three and nine months ended September 30, 2015, on foreign currency derivatives which are substantially offset by gains from foreign currency remeasurement adjustments, also recognized in Other (income) expense.
(3) For the nine months ended September 30, 2015, includes $5.1 million of gains on foreign currency derivatives which are substantially offset by losses from foreign currency remeasurement adjustments on the outstanding AAE loan, also recognized in Other (income) expense.
| |
| (1) | The fair value adjustments related to the underlying debt equally offset the amounts recognized in interest expense. |
| |
| (2) | Includes (income) expense on foreign currency derivatives that are substantially offset by foreign currency remeasurement adjustments on related hedged instruments, also recognized in Other (income) expense. |
GATX CORPORATION AND SUBSIDIARIES
NOTES TO CONSOLIDATED FINANCIAL STATEMENTS (UNAUDITED) (Continued)
Other Financial Instruments
The carrying amounts of cash and cash equivalents, restricted cash, rent and other receivables, accounts payable, and commercial paper and bank credit facilities approximate fair value due to the short maturity of those instruments. We base the fair values of investment funds, which are accounted for under the cost method, on the best information available, which may include quoted investment fund values. We estimate the fair values of loans and fixed and floating rate debt using discounted cash flow analyses that are based on interest rates currently offered for loans with similar terms to borrowers of similar credit quality. The estimated fairinputs we use to estimate each of these values for these investments are classified in Level 2 of the fair value hierarchy because they are based on directly or indirectly observable inputs.
The following table shows the carrying amounts and fair values of our other financial instruments (in millions):
|
| | | | | | | | | | | | | | | |
| | September 30, 2016 | | December 31, 2015 |
| Carrying Amount | | Fair Value | | Carrying Amount | | Fair Value |
| Assets | | | | | | | |
| Investment funds | $ | 0.6 |
| | $ | 1.3 |
| | $ | 0.6 |
| | $ | 1.2 |
|
| Loans | 6.7 |
| | 6.7 |
| | 8.8 |
| | 8.7 |
|
| Liabilities | | | | | | | |
| Recourse fixed rate debt (1) | $ | 3,868.2 |
| | $ | 3,996.4 |
| | $ | 3,915.0 |
| | $ | 3,882.6 |
|
| Recourse floating rate debt (1) | 360.0 |
| | 352.0 |
| | 275.2 |
| | 264.6 |
|
| Nonrecourse debt | — |
| | — |
| | 6.9 |
| | 7.1 |
|
_________
(1) Excludes related deferred financing costs. |
| | | | | | | | | | | | | | | |
| | September 30, 2017 | | December 31, 2016 |
| Carrying Amount | | Fair Value | | Carrying Amount | | Fair Value |
| Assets | | | | | | | |
| Investment funds | $ | 0.6 |
| | $ | 1.2 |
| | $ | 0.6 |
| | $ | 1.2 |
|
| Loans | 0.2 |
| | 0.2 |
| | 6.2 |
| | 6.2 |
|
| Liabilities | | | | | | | |
| Recourse fixed rate debt | $ | 3,864.6 |
| | $ | 3,977.6 |
| | $ | 3,858.5 |
| | $ | 3,852.6 |
|
| Recourse floating rate debt | 425.0 |
| | 429.4 |
| | 417.8 |
| | 412.2 |
|
NOTE 5.4. Assets Held Forfor Sale
During the third quarter of 2015, we made the decision to exit the majority ofThe following table summarizes our marine investments within the Portfolio Management segment, including six chemical parcel tankers (the "Nordic Vessels"), most of the inland marine vessels, and our 50% interest in the Cardinal Marine joint venture. At that time, the Nordic Vessels and the inland marine vessels wereassets held for sale (in millions):
|
| | | | | | | |
| | September 30 | | December 31 |
| | 2017 | | 2016 |
| Rail North America | $ | 4.4 |
| | $ | 43.9 |
|
| Portfolio Management | 19.2 |
| | 45.6 |
|
| | $ | 23.6 |
| | $ | 89.5 |
|
For assets classified as held for sale, and adjusted to the lower of their respective carrying amounts or fair value less costs to dispose. Subsequently, certain of these marine investments were sold during the fourth quarter of 2015, including one of the Nordic Vessels.
In the first nine months of 2016, we sold additional marine assets, including three of the Nordic Vessels. Proceeds from the sales of Portfolio Management marine assets completed in the first nine months of 2016, including those designated as held2017, we sold inland marine assets in the Portfolio Management segment with a carrying value of $26.4 million for sale, were $49.4proceeds of $28.2 million, resulting in a net gain of $4.2$1.8 million. We also recognizedAt Rail North America, we sold certain railcars with a carrying value of $21.8 million for proceeds of $49.9 million, resulting in a net gain of $1.0$28.1 million. In addition, other railcars that were not sold with a carrying value of $19.7 million resulting from additional proceeds received from the salewere reclassified out of the Cardinal Marine joint venture and recorded additional impairment losses of $1.8 million for certain of the remaining marine assets held for sale. We basedsale and written down to their estimated fair value, resulting in the fair valuesrecognition of these assets on our estimate of the expected proceeds less costs to sell.
As of September 30, 2016 and December 31, 2015, we had $62.1a $1.9 million and $106.0 million ofimpairment loss. All assets classified as held for sale on the balance sheet, including $60.5 million and $103.4 million of marine assets heldat September 30 are expected to be sold in the Portfolio Management segment.2017.
GATX CORPORATION AND SUBSIDIARIES
NOTES TO CONSOLIDATED FINANCIAL STATEMENTS (UNAUDITED) (Continued)
NOTE 6.5. Pension and Other Post-Retirement Benefits
The following table shows components of our pension and other post-retirement benefits expense for the three months ended September 30, 20162017 and 20152016 (in millions):
| | | | 2016 Pension
Benefits | | 2015 Pension
Benefits | | 2016 Retiree
Health
and Life | | 2015 Retiree
Health
and Life | 2017 Pension
Benefits | | 2016 Pension
Benefits | | 2017 Retiree
Health
and Life | | 2016 Retiree
Health
and Life |
| Service cost | $ | 1.5 |
| | $ | 1.9 |
| | $ | 0.1 |
| | $ | 0.1 |
| $ | 1.6 |
| | $ | 1.5 |
| | $ | — |
| | $ | 0.1 |
|
| Interest cost | 3.9 |
| | 4.9 |
| | 0.2 |
| | 0.3 |
| 3.8 |
| | 3.9 |
| | 0.2 |
| | 0.2 |
|
| Expected return on plan assets | (6.5 | ) | | (6.4 | ) | | — |
| | — |
| (5.9 | ) | | (6.5 | ) | | — |
| | — |
|
| Settlement accounting adjustment | 5.7 |
| | — |
| | — |
| | — |
| |
| Settlement expense | | — |
| | 5.7 |
| | — |
| | — |
|
| Amortization of (1): | | | | | | | | | | | | | | |
| Unrecognized prior service credit | (0.2 | ) | | (0.3 | ) | | (0.1 | ) | | (0.1 | ) | — |
| | (0.2 | ) | | — |
| | (0.1 | ) |
| Unrecognized net actuarial loss | 2.6 |
| | 3.7 |
| | — |
| | — |
| 2.2 |
| | 2.6 |
| | — |
| | — |
|
| Net expense | $ | 7.0 |
| | $ | 3.8 |
| | $ | 0.2 |
| | $ | 0.3 |
| $ | 1.7 |
| | $ | 7.0 |
| | $ | 0.2 |
| | $ | 0.2 |
|
The following table shows components of our pension and other post-retirement benefits expense for the nine months ended September 30, 20162017 and 20152016 (in millions):
| | | | 2016 Pension
Benefits | | 2015 Pension
Benefits | | 2016 Retiree
Health
and Life | | 2015 Retiree
Health
and Life | 2017 Pension
Benefits | | 2016 Pension
Benefits | | 2017 Retiree
Health
and Life | | 2016 Retiree
Health
and Life |
| Service cost | $ | 4.5 |
| | $ | 5.6 |
| | $ | 0.2 |
| | $ | 0.2 |
| $ | 4.9 |
| | $ | 4.5 |
| | $ | 0.1 |
| | $ | 0.2 |
|
| Interest cost | 11.8 |
| | 14.8 |
| | 0.7 |
| | 1.0 |
| 11.5 |
| | 11.8 |
| | 0.7 |
| | 0.7 |
|
| Expected return on plan assets | (19.5 | ) | | (19.3 | ) | | — |
| | — |
| (17.9 | ) | | (19.5 | ) | | — |
| | — |
|
| Settlement accounting adjustment | 5.7 |
| | — |
| | — |
| | — |
| |
| Settlement expense | | 0.1 |
| | 5.7 |
| | — |
| | — |
|
| Amortization of (1): | | | | | | | | | | | | | | |
| Unrecognized prior service credit | (0.7 | ) | | (0.8 | ) | | (0.2 | ) | | (0.2 | ) | — |
| | (0.7 | ) | | (0.1 | ) | | (0.2 | ) |
| Unrecognized net actuarial loss (gain) | 7.7 |
| | 11.1 |
| | (0.2 | ) | | — |
| 6.9 |
| | 7.7 |
| | (0.2 | ) | | (0.2 | ) |
| Net expense | $ | 9.5 |
| | $ | 11.4 |
| | $ | 0.5 |
| | $ | 1.0 |
| $ | 5.5 |
| | $ | 9.5 |
| | $ | 0.5 |
| | $ | 0.5 |
|
________
(1) Amounts reclassified from accumulated other comprehensive loss.
Pension expense in 2016 was positively impacted by a prospective change in accounting estimate. See "Note 2. Basis of Presentation" for further details about this change in accounting estimate. In addition, duringDuring the third quarter of 2016, we recorded a settlement accounting adjustment of $5.7 million attributable to lump sum payments elected by eligible retirees as part of a voluntary early retirement program offered in 2015.
NOTE 7. 6. Share-Based Compensation
During the nine months ended September 30, 2016,2017, we granted 466,900eligible incentive plan participants the aggregate of 354,400 non-qualified employee stock options, 83,10049,840 restricted stock units, 95,10063,710 performance shares, and 22,05218,080 phantom stock units. For the three months and nine months ended September 30, 2017, total share-based compensation expense was $3.4 million and $10.6 million and the related tax benefits were $1.3 million and $4.1 million. For the three months and nine months ended September 30, 2016, total share-based compensation expense was $3.2 million and $9.1 million and the related tax benefits were $1.3 million and $3.5 million. For the three and nine months ended September 30, 2015, total share-based compensation expense was $2.8 million and $8.9 million and the related tax benefits were $1.1 million and $3.4 million.
GATX CORPORATION AND SUBSIDIARIES
NOTES TO CONSOLIDATED FINANCIAL STATEMENTS (UNAUDITED) (Continued)
The estimated fair value of our 20162017 stock option awards and related underlying assumptions are shown in the table below.
| | | | 2016 | 2017 |
| Estimated fair value | $ | 13.86 |
| |
| Estimated fair value, including present value of dividends | | $ | 19.40 |
|
| Quarterly dividend rate | $ | 0.40 |
| $ | 0.42 |
|
| Expected term of stock option awards, in years | 4.7 |
| 4.7 |
|
| Risk-free interest rate | 1.4 | % | 1.9 | % |
| Dividend yield | 4.1 | % | 2.8 | % |
| Expected stock price volatility | 29.4 | % | 27.7 | % |
| Present value of dividends | $ | 7.27 |
| $ | 7.50 |
|
NOTE 8.7. Income Taxes
Our effective tax rate was 32% for the nine months ended September 30, 2017, compared to 33% for the nine months ended September 30, 2016, compared to 35% for the nine months ended September 30, 2015.2016. The difference in the effective rates for the current year compared to prior year is primarily attributable to the mix of pretaxpre-tax income among domestic and foreign jurisdictions which are taxed at different rates.
As Additionally, during the quarter, based upon the status of September 30, 2016, our grosscurrent state income tax audits and our expectations of the ultimate resolution, we released the remaining balance of our liability for unrecognized tax benefits was $4.3 million. If fullyand recognized these tax benefits would decrease ouran income tax expense bybenefit of $4.3 million ($2.8 million, net of federal tax). DuringAlso, our consolidated state income tax rate increased, effective July 1, 2017, due to legislation enacted in the nine months ended September 30, 2016,state of Illinois. Accordingly, we reduced our unrecognizedrecorded a deferred state income tax benefitadjustment of $3.1 million in the quarter. Finally, the 2017 effective tax rate reflects incremental benefits associated with equity awards in accordance with the adoption of new accounting rules and the impact of reductions in the statutory tax rates in Quebec and Saskatchewan, Canada and India, partially offset by $1.4 million based on a final determination ruling for a disputed statean increase to the effective tax filing position. None of this amount was recognizedrate in net income. We do not anticipate the recognition of tax benefits that were previously unrecognized within the next 12 months.Germany.
NOTE 9.8. Commercial Commitments
We have entered into various commercial commitments, such as guarantees, standby letters of credit, and performance bonds, related to certain transactions. These commercial commitments require us to fulfill specific obligations in the event of third-party demands. Similar to our balance sheet investments, these commitments expose us to credit, market, and equipment risk. Accordingly, we evaluate these commitments and other contingent obligations using techniques similar to those we use to evaluate funded transactions.
The following table shows our commercial commitments (in millions):
| | | | | | | September 30 | | December 31 |
| | September 30
2016 | | December 31
2015 | 2017 | | 2016 |
| Lease payment guarantees | $ | 16.3 |
| | $ | 22.1 |
| $ | 7.6 |
| | $ | 15.0 |
|
| Standby letters of credit and performance bonds | 8.9 |
| | 8.9 |
| 8.8 |
| | 8.9 |
|
| Total commercial commitments (1) | $ | 25.2 |
| | $ | 31.0 |
| $ | 16.4 |
| | $ | 23.9 |
|
________________
(1) The carrying value of liabilities on the balance sheet for commercial commitments was $3.3 million at September 30, 2016 and $4.1 million at December 31, 2015. | |
| (1) | The carrying value of liabilities on the balance sheet for commercial commitments was $2.3 million at September 30, 2017 and $3.0 million at December 31, 2016. The expirations of these commitments range from 2017 to 2023. We are not aware of any event that would require us to satisfy any of our commitments. |
Lease payment guarantees are commitments to financial institutions to make lease payments for a third-partythird party in the event they default. We reduce any liability that may result from these guarantees by the value of the underlying asset or group of assets.
We are also parties to standby letters of credit and performance bonds, which primarily relate to contractual obligations and general liability insurance coverages. No material claims have been made against these obligations, and no material losses are anticipated.
GATX CORPORATION AND SUBSIDIARIES
NOTES TO CONSOLIDATED FINANCIAL STATEMENTS (UNAUDITED) (Continued)
NOTE 10.9. Earnings per Share
We compute basic earnings per share by dividing net income available to our common shareholders by the weighted average number of shares of our common stock outstanding. We appropriately weighted shares issued or reacquired during the period for the portion of the period that they were outstanding. Our diluted earnings per share reflect the impacts of our potentially dilutive securities, which include our equity compensation awards.
On January 29, 2016, our board of directors authorized a $300 million stock repurchase program. As of September 30, 2016, 2.2 million shares had been repurchased for $95.0 million. In 2015, we completed our prior $250 million share repurchase authorization approved in 2014.
The following table shows the computation of our basic and diluted net income per common share (in millions, except per share amounts):
|
| | | | | | | | | | | | | | | |
| | Three Months Ended
September 30 | | Nine Months Ended
September 30 |
| | 2016 | | 2015 | | 2016 | | 2015 |
| Numerator: | | | | | | | |
| Net income | $ | 95.7 |
| | $ | 39.5 |
| | $ | 226.2 |
| | $ | 147.1 |
|
| Denominator: | | | | | | | |
| Weighted average shares outstanding - basic | 40.1 |
| | 42.8 |
| | 40.7 |
| | 43.5 |
|
| Effect of dilutive securities: | | | | | | | |
| Equity compensation plans | 0.5 |
| | 0.6 |
| | 0.5 |
| | 0.6 |
|
| Weighted average shares outstanding - diluted | 40.6 |
| | 43.4 |
| | 41.2 |
| | 44.1 |
|
| Basic earnings per share | $ | 2.39 |
| | $ | 0.92 |
| | $ | 5.55 |
| | $ | 3.38 |
|
| Diluted earnings per share | $ | 2.36 |
| | $ | 0.91 |
| | $ | 5.49 |
| | $ | 3.33 |
|
NOTES TO CONSOLIDATED FINANCIAL STATEMENTS (UNAUDITED)
|
| | | | | | | | | | | | | | | |
| | Three Months Ended
September 30 | | Nine Months Ended
September 30 |
| | 2017 | | 2016 | | 2017 | | 2016 |
| Numerator: | | | | | | | |
| Net income | $ | 49.0 |
| | $ | 95.7 |
| | $ | 159.9 |
| | $ | 226.2 |
|
| | | | | | | | |
| Denominator: | | | | | | | |
| Weighted average shares outstanding - basic | 38.6 |
| | 40.1 |
| | 39.0 |
| | 40.7 |
|
| Effect of dilutive securities: | | | | | | | |
| Equity compensation plans | 0.6 |
| | 0.5 |
| | 0.6 |
| | 0.5 |
|
| Weighted average shares outstanding - diluted | 39.2 |
| | 40.6 |
| | 39.6 |
| | 41.2 |
|
| Basic earnings per share | $ | 1.27 |
| | $ | 2.39 |
| | $ | 4.10 |
| | $ | 5.55 |
|
| Diluted earnings per share | $ | 1.25 |
| | $ | 2.36 |
| | $ | 4.04 |
| | $ | 5.49 |
|
NOTE 11.10. Accumulated Other Comprehensive Income (Loss)
The following table shows the change in components for accumulated other comprehensive loss (in millions):
|
| | | | | | | | | | | | | | | | | | | |
| Foreign Currency Translation Gain (Loss) | | Unrealized Gain (Loss) on Securities | | Unrealized Gain (Loss) on Derivative Instruments | | Post-Retirement Benefit Plans | | Total |
| Balance at December 31, 2015 | $ | (77.7 | ) | | $ | (0.3 | ) | | $ | (20.9 | ) | | $ | (99.9 | ) | | $ | (198.8 | ) |
| Change in component | 25.9 |
| | 0.1 |
| | (23.2 | ) | | — |
| | 2.8 |
|
| Reclassification adjustments into earnings | — |
| | — |
| | 19.0 |
| | 2.3 |
| | 21.3 |
|
| Income tax effect | — |
| | — |
| | 1.7 |
| | (0.9 | ) | | 0.8 |
|
| Balance at March 31, 2016 | $ | (51.8 | ) | | $ | (0.2 | ) | | $ | (23.4 | ) | | $ | (98.5 | ) | | $ | (173.9 | ) |
| Change in component | (20.7 | ) | | 0.4 |
| | (2.0 | ) | | — |
| | (22.3 | ) |
| Reclassification adjustments into earnings | — |
| | — |
| | (4.9 | ) | | 2.0 |
| | (2.9 | ) |
| Income tax effect | — |
| | (0.2 | ) | | 2.1 |
| | (0.7 | ) | | 1.2 |
|
| Balance at June 30, 2016 | $ | (72.5 | ) | | $ | — |
| | $ | (28.2 | ) | | $ | (97.2 | ) | | $ | (197.9 | ) |
| Change in component | 11.0 |
| | 2.0 |
| | (3.4 | ) | | (11.9 | ) | | (2.3 | ) |
| Reclassification adjustments into earnings | — |
| | — |
| | 5.7 |
| | 2.3 |
| | 8.0 |
|
| Income tax effect | — |
| | (0.7 | ) | | (1.8 | ) | | 3.6 |
| | 1.1 |
|
| Balance at September 30, 2016 | $ | (61.5 | ) | | $ | 1.3 |
| | $ | (27.7 | ) | | $ | (103.2 | ) | | $ | (191.1 | ) |
________ |
| | | | | | | | | | | | | | | |
| Foreign Currency Translation Gain (Loss) | | Unrealized Gain (Loss) on Derivative Instruments | | Post-Retirement Benefit Plans | | Total |
| Balance at December 31, 2016 | (103.7 | ) | | (20.3 | ) | | (87.1 | ) | | (211.1 | ) |
| Change in component | 17.9 |
| | (5.1 | ) | | — |
| | 12.8 |
|
| Reclassification adjustments into earnings | — |
| | 5.8 |
| | 2.2 |
| | 8.0 |
|
| Income tax effect | — |
| | 0.1 |
| | (0.9 | ) | | (0.8 | ) |
| Balance at March 31, 2017 | $ | (85.8 | ) | | $ | (19.5 | ) | | $ | (85.8 | ) | | $ | (191.1 | ) |
| Change in component | 40.7 |
| | (18.4 | ) | | — |
| | 22.3 |
|
| Reclassification adjustments into earnings | — |
| | 21.3 |
| | 2.2 |
| | 23.5 |
|
| Income tax effect | — |
| | (0.8 | ) | | (0.8 | ) | | (1.6 | ) |
| Balance at June 30, 2017 | $ | (45.1 | ) | | $ | (17.4 | ) | | $ | (84.4 | ) | | $ | (146.9 | ) |
| Change in component | 15.4 |
| | (10.5 | ) | | — |
| | 4.9 |
|
| Reclassification adjustments into earnings | — |
| | 11.8 |
| | 2.2 |
| | 14.0 |
|
| Income tax effect | — |
| | (0.6 | ) | | (0.8 | ) | | (1.4 | ) |
| Balance at September 30, 2017 | (29.7 | ) | | (16.7 | ) | | (83.0 | ) | | (129.4 | ) |
________
See "Note 4. 3. Fair Value Disclosure"Disclosure" and "Note 6. 5. Pension and Other Post-Retirement Benefits"Benefits" for impacts of the reclassification adjustments on the statement of comprehensive income.
GATX CORPORATION AND SUBSIDIARIES
NOTES TO CONSOLIDATED FINANCIAL STATEMENTS (UNAUDITED) (Continued)
NOTE 12.11. Legal Proceedings and Other Contingencies
Various legal actions, claims, assessments and other contingencies arising in the ordinary course of business are pending against GATX and certain of our subsidiaries. These matters are subject to many uncertainties, and it is possible that some of these matters could ultimately be decided, resolved or settled adversely. For a full discussion of our pending legal matters, please refer to "Note 24.22. Legal Proceedings and Other Contingencies" of our consolidated financial statements in our Annual Report on Form 10-K for the year ended December 31, 2015.2016.
Viareggio Derailment
In June 2009, a train consisting of fourteen liquefied petroleum gas (“LPG”) tank cars owned by GATX Rail Austria GmbH (an indirect subsidiary of the Company, "GATX Rail Austria") and its subsidiaries (collectively, “GRA”) derailed while passing through the City of Viareggio, in the province of Lucca, Italy. Five tank cars overturned and one of the overturned cars was punctured by a peg or obstacle along the side of the track, resulting in a release of LPG, which subsequently ignited. Thirty-two people died and others were injured in the fire, which alsoThe accident resulted in multiple deaths, personal injuries and property damage. The LPG tank cars were leased to FS Logistica S.p.A., a subsidiary of the Italian state-owned railway, Ferrovie dello Stato S.p.A (the “Italian Railway”).
On December 14, 2012, the Public Prosecutorsprosecutors for Lucca charged the Italian Railway, GRA, and a number of Lucca ("Public Prosecutors") formally charged GATX Rail Austriatheir maintenance, operations, and two of its subsidiaries (collectively, "GRA"), as well as ten maintenance and supervisorymanagerial employees (the "Employees"), with various negligence-based crimes related to the accident, allaccident. A trial was held in the court of which are punishable under Italian law by incarceration, damages,Lucca and, fines. Similar charges were broughton January 31, 2017, the court announced guilty verdicts against fourvarious Italian Railway companies, GRA, and eighteencertain of their employees, among others.employees. The Public Prosecutors assertcourt imposed a fine of 1.4 million Euros against GRA and prison sentences against the employees. GRA disagrees with the trial court’s ruling and believes that the axle on a tank car broke, causing the derailmentevidence shows it and resultingits employees acted diligently and in a tank ruptureaccordance with all applicable laws and release of LPG, after the car hit an obstacle placed on the sideregulations at all times. On October 14, 2017, GRA filed its appeal of the track by the Italian Railway. The Public Prosecutors further allege that a crack in the axle was detectable at the time of final inspection but was overlooked by the Employees at the Jungenthal Waggon GmbH workshop (a subsidiary of GATX Rail Austria).
The trial incourt’s ruling with the Court of Lucca (the “Lucca Trial”) commenced on November 13, 2013. In July 2016, all parties finished presenting their evidentiary cases,Appeal in Florence (Corte d’Appello di Firenze) and, closing arguments began in September, 2016. The Public Prosecutors are seeking acquittals for two ofpending the
NOTES TO CONSOLIDATED FINANCIAL STATEMENTS (UNAUDITED) (Continued)
Employees, incarceration of six to ten years for the other eight Employees, and fines of 1.0 million euros against each of GATX Rail Austria and its two defendant subsidiaries. GRA believes that it and its Employees acted diligently and properly, but we cannot predict the outcome final disposition of the Lucca Trialappeal, these fines and therefore, cannot reasonably estimate the possible range of loss, fines or penalties that may ultimately be incurred in connection with this matter. While we anticipate that the Lucca Trial will conclude in 2016, we also expect that further appeals will be filed.are not enforceable.
With respect to civil claims, GRA’sthe insurers continue to work cooperatively with the insurer for the Italian Railway to adjust and settle personal injuryGRA have fully settled and property damage claims. These joint settlement efforts have so far settledresolved most of the significant civil claims relatedarising out of the accident. With respect to unsettled claims, the Lucca court ordered all convicted defendants (including various Italian Railway entities and GRA) to pay final damages or advances to the accident; however, approximately 55 civil claimants did not settleremaining 56 claimants. The amount of these awards is immaterial and are currently parties to the Lucca Trial. The Court of Lucca will determine both the civil and criminal liability of the defendants in the one proceeding. Final civil damage awards for each claimant will be determined at subsequent civil damage hearings. GRA expects that its insurers will continue to cover virtually allmost of these damages to claimants except for a small number of civil damages, if awardedclaims. GRA will continue to incur legal expenses for the claimants incriminal appeals although they are not expected to be material. We cannot predict the Lucca Trial or at subsequent civil damage hearings, as well as defense costs for such damage hearings. However, in the event that the Court of Lucca awards any reputational damages claimed by certain labor unions and associations, GRA’s insurers will not cover those damages, which could range from €0.5 million to €2.0 million ($0.6 million to $2.2 million).
Since May 2012, oneoutcome of the excess insurers providing coverage, Liberty Mutual Insurance Europe Limited (“Liberty”), has settled civil claims but refused to reimburse GRA for its ongoing legal defense feesappeals process and thus cannot reasonably estimate the possible amount or range of costs taking a position contrary to our other insurers in the prior underlying layers that had provided coverage for such expenses. For the period from May 2012 to September 30, 2016, GRAmay be ultimately incurred approximately $19.4 million in defense fees and costs, and GRA continues to incur costs in connection with the Lucca Trial. In October 2013, GRA filed an arbitration proceeding against Liberty seeking to recoup its unreimbursed defense fees and costs (the “Liberty Arbitration”), which was heard in November 2015. GRA received a partial arbitration award in its favor and subsequently settled with Liberty and all other insurers in the current coverage layer. Pursuant to this settlement and subject to certain terms and conditions therein, the insurers will provide reimbursement of approximately 40% of defense costs incurred to date and through the end of the Lucca Trial. As of October 31, 2016, insurance reimbursements for the Lucca Trial totaled approximately $6.4 million.litigation.
NOTES TO CONSOLIDATED FINANCIAL STATEMENTS (UNAUDITED) (Continued)
NOTE 1312. Financial Data of Business Segments
The financial data presented below depicts the profitability, financial position, and capital expenditures of each of our business segments.
We lease, operate, manage, and remarket long-lived, widely-used assets, primarily in the rail market. We also invest in joint ventures that complement our existing business activities. We report our financial results through four primary business segments: Rail North America, Rail International, ASC,American Steamship Company (“ASC”), and Portfolio Management.
Rail North America is composed of our wholly owned operations in the United States, Canada, and Mexico, as well as an affiliate investment. Rail North America primarily provides railcars pursuant to full-service leases under which it maintains the railcars, pays ad valorem taxes and insurance, and provides other ancillary services.
Rail International is composed of our wholly owned European operations ("GATX Rail Europe" or "GRE"), and aour wholly owned railcar leasing business in India ("Rail India"), as well as one development stage affiliateand our wholly owned operations in China.Russia. GRE leases railcars to customers throughout Europe pursuant to full-service leases under which it maintains the railcars and provides value-adding services according to customer requirements.
ASC operates the largest fleet of US-flagged vessels on the Great Lakes, providing waterborne transportation of dry bulk commodities such as iron ore, coal, limestone aggregates, and metallurgical limestone.
Portfolio Management generatesis composed primarily of our ownership in a group of joint ventures with Rolls-Royce plc that lease aircraft spare engines, as well as five liquefied gas carrying vessels and assorted other marine assets. In prior years, Portfolio Management
GATX CORPORATION AND SUBSIDIARIES
NOTES TO CONSOLIDATED FINANCIAL STATEMENTS (UNAUDITED) (Continued)
generated leasing, marine operating, asset remarketing, and management fee income through a collection of diversified wholly owned assets and joint venture investments. We are in the process of disposing of the majority of the marine investments and managed assets.in this segment.
Segment profit is an internal performance measure used by the Chief Executive Officer to assess the performance of each segment in a given period. Segment profit includes all revenues, pretaxpre-tax earnings from affiliates, and net gains on asset dispositions that are attributable to the segments, as well as expenses that management believes are directly associated with the financing, maintenance, and operation of the revenue earning assets. Segment profit excludes selling, general and administrative expenses, income taxes, and certain other amounts not allocated to the segments. These amounts are included in Other.
We allocate debt balances and related interest expense to each segment based upon predetermined debt to equity leverage ratios. Due to changes in the composition of our segments, we have modified segment leverage levels for 2016. The leverage levels for 2016 are 5:1 for Rail North America, 3:1 for Rail International, 1.5:1 for ASC, and 1:1 for Portfolio Management. The leverage levels for 2015 were 5:1 for Rail North America, 2:1 for Rail International, 1.5:1 for ASC, and 3:1 for Portfolio Management. We believe that by using this leverage and interest expense allocation methodology, each operating segment’s financial performance reflects appropriate risk-adjusted borrowing costs.costs.
GATX CORPORATION AND SUBSIDIARIES
NOTES TO CONSOLIDATED FINANCIAL STATEMENTS (UNAUDITED) (Continued)
The following tables show certain segment data for each of our business segments (in millions):
|
| | | | | | | | | | | | | | | | | | | | | | | |
|
Rail North America | |
Rail International | |
ASC | |
Portfolio Management | | Other | | GATX Consolidated |
| Three Months Ended September 30, 2016 | | | | | | | | | | |
| Profitability | | | | | | | | | | | |
| Revenues | | | | | | | | | | | |
| Lease revenue | $ | 233.0 |
| | $ | 46.6 |
| | $ | 1.0 |
| | $ | 1.2 |
| | $ | — |
| | $ | 281.8 |
|
| Marine operating revenue | — |
| | — |
| | 51.8 |
| | 10.3 |
| | — |
| | 62.1 |
|
| Other revenue | 17.3 |
| | 1.6 |
| | — |
| | 0.1 |
| | — |
| | 19.0 |
|
Total Revenues | 250.3 |
| | 48.2 |
| | 52.8 |
| | 11.6 |
| | — |
| | 362.9 |
|
| Expenses | | | | | | | | | | | |
| Maintenance expense | 62.8 |
| | 10.7 |
| | 6.1 |
| | — |
| | — |
| | 79.6 |
|
| Marine operating expense | — |
| | — |
| | 31.5 |
| | 7.7 |
| | — |
| | 39.2 |
|
| Depreciation expense | 58.4 |
| | 11.6 |
| | 4.2 |
| | 1.7 |
| | — |
| | 75.9 |
|
| Operating lease expense | 17.2 |
| | — |
| | 2.0 |
| | — |
| | — |
| | 19.2 |
|
| Other operating expense | 8.6 |
| | 1.2 |
| | — |
| | 0.3 |
| | — |
| | 10.1 |
|
| Total Expenses | 147.0 |
| | 23.5 |
| | 43.8 |
| | 9.7 |
| | — |
| | 224.0 |
|
| Other Income (Expense) | | | | | | | | | | | |
| Net gain on asset dispositions | 13.1 |
| | 0.5 |
| | — |
| | 49.1 |
| | — |
| | 62.7 |
|
| Interest (expense) income, net | (27.1 | ) | | (7.3 | ) | | (1.1 | ) | | (2.1 | ) | | 1.4 |
| | (36.2 | ) |
| Other (expense) income | (1.4 | ) | | 5.5 |
| | (0.1 | ) | | — |
| | 0.3 |
| | 4.3 |
|
| Share of affiliates' earnings (pretax) | — |
| | (0.1 | ) | | — |
| | 15.2 |
| | — |
| | 15.1 |
|
| Segment Profit | $ | 87.9 |
| | $ | 23.3 |
| | $ | 7.8 |
| | $ | 64.1 |
| | $ | 1.7 |
| | 184.8 |
|
| Selling, general and administrative expense | 48.1 |
|
| Income taxes (including $0.1 tax benefit related to affiliates' earnings) | 41.0 |
|
| Net Income | $ | 95.7 |
|
| | | | | | | | | | | | |
| Net Gain on Asset Dispositions | | | | | | | | | | | |
| Asset Remarketing Income: | | | | | | | | | | | |
| Disposition gains on owned assets | $ | 11.9 |
| | $ | — |
| | $ | — |
| | $ | (0.3 | ) | | $ | — |
| | $ | 11.6 |
|
| Residual sharing income | 0.3 |
| | — |
| | — |
| | 49.4 |
| | — |
| | 49.7 |
|
| Non-remarketing disposition gains (1) | 0.9 |
| | 0.5 |
| | — |
| | — |
| | — |
| | 1.4 |
|
| | $ | 13.1 |
| | $ | 0.5 |
| | $ | — |
| | $ | 49.1 |
| | $ | — |
| | $ | 62.7 |
|
| Capital Expenditures | | | | | | | | | | | |
| Portfolio investments and capital additions | $ | 108.4 |
| | $ | 10.8 |
| | $ | — |
| | $ | — |
| | $ | 1.2 |
| | $ | 120.4 |
|
| | | | | | | | | | | | |
| Selected Balance Sheet Data at September 30, 2016 | | | | | | | | |
| Investments in affiliated companies | $ | 10.5 |
| | $ | 1.3 |
| | $ | — |
| | $ | 365.0 |
| | $ | — |
| | $ | 376.8 |
|
| Identifiable assets | $ | 4,792.7 |
| | $ | 1,183.9 |
| | $ | 285.6 |
| | $ | 606.2 |
| | $ | 220.9 |
| | $ | 7,089.3 |
|
_____ |
| | | | | | | | | | | | | | | | | | | | | | | |
|
Rail North America | |
Rail International | |
ASC | |
Portfolio Management | | Other | | GATX Consolidated |
| Three Months Ended September 30, 2017 | | | | | | | | | | |
| Profitability | | | | | | | | | | | |
| Revenues | | | | | | | | | | | |
| Lease revenue | $ | 224.5 |
| | $ | 50.3 |
| | $ | 1.1 |
| | $ | 0.7 |
| | $ | — |
| | $ | 276.6 |
|
| Marine operating revenue | — |
| | — |
| | 59.1 |
| | 3.8 |
| | — |
| | 62.9 |
|
| Other revenue | 17.9 |
| | 2.0 |
| | — |
| | 0.2 |
| | — |
| | 20.1 |
|
Total Revenues | 242.4 |
| | 52.3 |
| | 60.2 |
| | 4.7 |
| | — |
| | 359.6 |
|
| Expenses | | | | | | | | | | | |
| Maintenance expense | 66.1 |
| | 11.1 |
| | 7.7 |
| | — |
| | — |
| | 84.9 |
|
| Marine operating expense | — |
| | — |
| | 34.7 |
| | 4.2 |
| | — |
| | 38.9 |
|
| Depreciation expense | 60.1 |
| | 12.8 |
| | 4.0 |
| | 1.7 |
| | — |
| | 78.6 |
|
| Operating lease expense | 15.5 |
| | — |
| | 0.3 |
| | — |
| | — |
| | 15.8 |
|
| Other operating expense | 7.3 |
| | 1.1 |
| | — |
| | 0.1 |
| | — |
| | 8.5 |
|
| Total Expenses | 149.0 |
| | 25.0 |
| | 46.7 |
| | 6.0 |
| | — |
| | 226.7 |
|
| Other Income (Expense) | | | | | | | | | | | |
| Net gain on asset dispositions | 8.1 |
| | 1.0 |
| | — |
| | 0.3 |
| | — |
| | 9.4 |
|
| Interest (expense) income, net | (30.5 | ) | | (8.5 | ) | | (1.4 | ) | | (2.2 | ) | | 2.4 |
| | (40.2 | ) |
| Other (expense) income | (0.9 | ) | | 0.3 |
| | — |
| | — |
| | (1.5 | ) | | (2.1 | ) |
| Share of affiliates' pre-tax income | 0.1 |
| | — |
| | — |
| | 16.0 |
| | — |
| | 16.1 |
|
| Segment profit | $ | 70.2 |
| | $ | 20.1 |
| | $ | 12.1 |
| | $ | 12.8 |
| | $ | 0.9 |
| | 116.1 |
|
| Selling, general and administrative expense | 42.8 |
|
| Income taxes (includes $3.9 related to affiliates' earnings) | 24.3 |
|
| Net income | $ | 49.0 |
|
| | | | | | | | | | | | |
| Net Gain on Asset Dispositions | | | | | | | | | | | |
| Asset Remarketing Income: | | | | | | | | | | | |
| Disposition gains on owned assets | $ | 7.5 |
| | $ | 0.1 |
| | $ | — |
| | $ | — |
| | $ | — |
| | $ | 7.6 |
|
| Residual sharing income | 0.2 |
| | — |
| | — |
| | 0.3 |
| | — |
| | 0.5 |
|
| Non-remarketing disposition gains (1) | 0.4 |
| | 0.9 |
| | — |
| | — |
| | — |
| | 1.3 |
|
| | $ | 8.1 |
| | $ | 1.0 |
| | $ | — |
| | $ | 0.3 |
| | $ | — |
| | $ | 9.4 |
|
| | | | | | | | | | | | |
| Capital Expenditures | | | | | | | | | | | |
| Portfolio investments and capital additions | $ | 103.3 |
| | $ | 22.9 |
| | $ | 0.8 |
| | $ | 36.6 |
| | $ | 0.1 |
| | $ | 163.7 |
|
| | | | | | | | | | | | |
| Selected Balance Sheet Data at September 30, 2017 | | | | | | | | | | |
| Investments in affiliated companies | $ | 9.8 |
| | $ | — |
| | $ | — |
| | $ | 439.5 |
| | $ | — |
| | $ | 449.3 |
|
| Identifiable assets | $ | 4,841.2 |
| | $ | 1,290.0 |
| | $ | 310.1 |
| | $ | 616.8 |
| | $ | 203.8 |
| | $ | 7,261.9 |
|
__________
(1) Includes scrapping gains.
GATX CORPORATION AND SUBSIDIARIES
NOTES TO CONSOLIDATED FINANCIAL STATEMENTS (UNAUDITED) (Continued)
| |
|
Rail North America | |
Rail International | |
ASC | |
Portfolio Management | | Other | | GATX Consolidated |
Rail North America | |
Rail International | |
ASC | |
Portfolio Management | | Other | | GATX Consolidated |
| Three Months Ended September 30, 2015 | | | | | | | | | | | |
| Three Months Ended September 30, 2016 | | Three Months Ended September 30, 2016 | | | | | | | | | | |
| Profitability | | | | | | | | | | | | | | | | | | | | | | |
| Revenues | | | | | | | | | | | | | | | | | | | | | | |
| Lease revenue | $ | 234.9 |
| | $ | 44.1 |
| | $ | 1.1 |
| | $ | 6.1 |
| | $ | — |
| | $ | 286.2 |
| $ | 233.0 |
| | $ | 46.6 |
| | $ | 1.0 |
| | $ | 1.2 |
| | $ | — |
| | $ | 281.8 |
|
| Marine operating revenue | — |
| | — |
| | 61.7 |
| | 15.9 |
| | — |
| | 77.6 |
| — |
| | — |
| | 51.8 |
| | 10.3 |
| | — |
| | 62.1 |
|
| Other revenue | 20.3 |
| | 1.7 |
| | — |
| | 0.4 |
| | — |
| | 22.4 |
| 17.3 |
| | 1.6 |
| | — |
| | 0.1 |
| | — |
| | 19.0 |
|
Total Revenues | 255.2 |
| | 45.8 |
| | 62.8 |
| | 22.4 |
| | — |
| | 386.2 |
| 250.3 |
| | 48.2 |
| | 52.8 |
| | 11.6 |
| | — |
| | 362.9 |
|
| Expenses | | | | | | | | | | | | | | | | | | | | | | |
| Maintenance expense | 66.7 |
| | 9.9 |
| | 7.3 |
| | — |
| | — |
| | 83.9 |
| 62.8 |
| | 10.7 |
| | 6.1 |
| | — |
| | — |
| | 79.6 |
|
| Marine operating expense | — |
| | — |
| | 36.7 |
| | 11.8 |
| | — |
| | 48.5 |
| — |
| | — |
| | 31.5 |
| | 7.7 |
| | — |
| | 39.2 |
|
| Depreciation expense | 54.5 |
| | 11.1 |
| | 4.7 |
| | 4.7 |
| | — |
| | 75.0 |
| 58.4 |
| | 11.6 |
| | 4.2 |
| | 1.7 |
| | — |
| | 75.9 |
|
| Operating lease expense | 20.6 |
| | (0.1 | ) | | 1.8 |
| | — |
| | — |
| | 22.3 |
| 17.2 |
| | — |
| | 2.0 |
| | — |
| | — |
| | 19.2 |
|
| Other operating expense | 6.8 |
| | 1.1 |
| | — |
| | 0.4 |
| | — |
| | 8.3 |
| 8.6 |
| | 1.2 |
| | — |
| | 0.3 |
| | — |
| | 10.1 |
|
| Total Expenses | 148.6 |
| | 22.0 |
| | 50.5 |
| | 16.9 |
| | — |
| | 238.0 |
| 147.0 |
| | 23.5 |
| | 43.8 |
| | 9.7 |
| | — |
| | 224.0 |
|
| Other Income (Expense) | | | | | | | | | | | | | | | | | | | | | | |
| Net gain (loss) on asset dispositions | 11.5 |
| | 0.5 |
| | — |
| | (16.5 | ) | | — |
| | (4.5 | ) | |
| Net gain on asset dispositions | | 13.1 |
| | 0.5 |
| | — |
| | 49.1 |
| | — |
| | 62.7 |
|
| Interest (expense) income, net | (27.0 | ) | | (7.0 | ) | | (1.4 | ) | | (4.7 | ) | | 2.4 |
| | (37.7 | ) | (27.1 | ) | | (7.3 | ) | | (1.1 | ) | | (2.1 | ) | | 1.4 |
| | (36.2 | ) |
| Other expense | (1.2 | ) | | (1.8 | ) | | — |
| | — |
| | (0.1 | ) | | (3.1 | ) | |
| Share of affiliates' earnings (pretax) (1) | 0.1 |
| | — |
| | — |
| | (1.6 | ) | | — |
| | (1.5 | ) | |
| Segment Profit (Loss) | $ | 90.0 |
| | $ | 15.5 |
| | $ | 10.9 |
| | $ | (17.3 | ) | | $ | 2.3 |
| | 101.4 |
| |
| Other (expense) income | | (1.4 | ) | | 5.5 |
| | (0.1 | ) | | — |
| | 0.3 |
| | 4.3 |
|
| Share of affiliates' pre-tax (loss) income | | — |
| | (0.1 | ) | | — |
| | 15.2 |
| | — |
| | 15.1 |
|
| Segment profit | | $ | 87.9 |
| | $ | 23.3 |
| | $ | 7.8 |
| | $ | 64.1 |
| | $ | 1.7 |
| | 184.8 |
|
| Selling, general and administrative expense | Selling, general and administrative expense | 44.4 |
| Selling, general and administrative expense | 48.1 |
|
| Income taxes (including $2.8 tax benefit related to affiliates' earnings) | 17.5 |
| |
| Net Income | $ | 39.5 |
| |
| Income taxes (includes $0.1 tax benefit related to affiliates' earnings) | | Income taxes (includes $0.1 tax benefit related to affiliates' earnings) | 41.0 |
|
| Net income | | Net income | $ | 95.7 |
|
| | | | | | | | | | | | | | | | | | | | | | | |
| Net Gain (Loss) on Asset Dispositions | | | | | | | | | |
| Net Gain on Asset Dispositions | | | | | | | | | | | | |
| Asset Remarketing Income: | | | | | | | | | | | | | | | | | | | | | | |
| Disposition gains on owned assets | $ | 10.2 |
| | $ | — |
| | $ | — |
| | $ | 7.2 |
| | $ | — |
| | $ | 17.4 |
| $ | 11.9 |
| | $ | — |
| | $ | — |
| | $ | (0.3 | ) | | $ | — |
| | $ | 11.6 |
|
| Residual sharing income | 0.3 |
| | — |
| | — |
| | 7.3 |
| | — |
| | 7.6 |
| 0.3 |
| | — |
| | — |
| | 49.4 |
| | — |
| | 49.7 |
|
Non-remarketing disposition gains (2)(1) | 1.0 |
| | 0.6 |
| | — |
| | — |
| | — |
| | 1.6 |
| 0.9 |
| | 0.5 |
| | — |
| | — |
| | — |
| | 1.4 |
|
| Asset impairment | — |
| | (0.1 | ) | | — |
| | (31.0 | ) | | — |
| | (31.1 | ) | |
| | | $ | 13.1 |
| | $ | 0.5 |
| | $ | — |
| | $ | 49.1 |
| | $ | — |
| | $ | 62.7 |
|
| | $ | 11.5 |
| | $ | 0.5 |
| | $ | — |
| | $ | (16.5 | ) | | $ | — |
| | $ | (4.5 | ) | | | | | | | | | | | |
| Capital Expenditures | | | | | | | | | | | | | | | | | | | | | | |
| Portfolio investments and capital additions | $ | 97.8 |
| | $ | 40.9 |
| | $ | 0.8 |
| | $ | 1.9 |
| | $ | 0.7 |
| | $ | 142.1 |
| $ | 108.4 |
| | $ | 10.8 |
| | $ | — |
| | $ | — |
| | $ | 1.2 |
| | $ | 120.4 |
|
| | | | | | | | | | | | | | | | | | | | | | | |
| Selected Balance Sheet Data at December 31, 2015 | | | | | | | | | |
| Selected Balance Sheet Data at December 31, 2016 | | Selected Balance Sheet Data at December 31, 2016 | | | | | | | |
| Investments in affiliated companies | $ | 12.0 |
| | $ | 1.4 |
| | $ | — |
| | $ | 335.1 |
| | $ | — |
| | $ | 348.5 |
| $ | 10.5 |
| | $ | 1.2 |
| | $ | — |
| | $ | 375.3 |
| | $ | — |
| | $ | 387.0 |
|
| Identifiable assets | $ | 4,629.1 |
| | $ | 1,117.6 |
| | $ | 284.7 |
| | $ | 636.5 |
| | $ | 226.3 |
| | $ | 6,894.2 |
| $ | 4,775.6 |
| | $ | 1,128.7 |
| | $ | 278.8 |
| | $ | 593.5 |
| | $ | 328.8 |
| | $ | 7,105.4 |
|
_______________
(1) Includes a $19.0 million impairment loss in the Portfolio Management segment.scrapping gains.
(2)GATX CORPORATION AND SUBSIDIARIES
NOTES TO CONSOLIDATED FINANCIAL STATEMENTS (UNAUDITED) (Continued)
|
| | | | | | | | | | | | | | | | | | | | | | | |
|
Rail North America | |
Rail International | |
ASC | |
Portfolio Management | | Other | | GATX Consolidated |
| Nine Months Ended September 30, 2017 | | | | | | | | | | |
| Profitability | | | | | | | | | | | |
| Revenues | | | | | | | | | | | |
| Lease revenue | $ | 677.4 |
| | $ | 139.8 |
| | $ | 3.1 |
| | $ | 3.1 |
| | $ | — |
| | $ | 823.4 |
|
| Marine operating revenue | — |
| | — |
| | 113.2 |
| | 21.8 |
| | — |
| | 135.0 |
|
| Other revenue | 60.0 |
| | 4.7 |
| | — |
| | 1.0 |
| | — |
| | 65.7 |
|
Total Revenues | 737.4 |
| | 144.5 |
| | 116.3 |
| | 25.9 |
| | — |
| | 1,024.1 |
|
| Expenses | | | | | | | | | | | |
| Maintenance expense | 202.3 |
| | 30.8 |
| | 14.6 |
| | — |
| | — |
| | 247.7 |
|
| Marine operating expense | — |
| | — |
| | 70.6 |
| | 19.2 |
| | — |
| | 89.8 |
|
| Depreciation expense | 178.8 |
| | 35.8 |
| | 8.1 |
| | 5.2 |
| | — |
| | 227.9 |
|
| Operating lease expense | 45.3 |
| | — |
| | 1.5 |
| | — |
| | — |
| | 46.8 |
|
| Other operating expense | 21.7 |
| | 3.5 |
| | — |
| | 0.7 |
| | — |
| | 25.9 |
|
| Total Expenses | 448.1 |
| | 70.1 |
| | 94.8 |
| | 25.1 |
| | — |
| | 638.1 |
|
| Other Income (Expense) | | | | | | | | | | | |
| Net gain on asset dispositions | 42.6 |
| | 2.6 |
| | — |
| | 11.1 |
| | — |
| | 56.3 |
|
| Interest (expense) income, net | (90.1 | ) | | (24.5 | ) | | (3.9 | ) | | (6.8 | ) | | 5.9 |
| | (119.4 | ) |
| Other (expense) income | (4.1 | ) | | (2.3 | ) | | 0.8 |
| | 2.3 |
| | (1.2 | ) | | (4.5 | ) |
| Share of affiliates' pre-tax income (loss) | 0.4 |
| | (0.1 | ) | | — |
| | 39.9 |
| | — |
| | 40.2 |
|
| Segment profit | $ | 238.1 |
| | $ | 50.1 |
| | $ | 18.4 |
| | $ | 47.3 |
| | $ | 4.7 |
| | 358.6 |
|
| Selling, general and administrative expense | 128.8 |
|
| Income taxes (includes $9.6 related to affiliates' earnings) | 69.9 |
|
| Net income | $ | 159.9 |
|
| | | | | | | | | | | | |
| Net Gain on Asset Dispositions | | | | | | | | | | | |
| Asset Remarketing Income: | | | | | | | | | | | |
| Disposition gains on owned assets | $ | 39.5 |
| | $ | 0.1 |
| | $ | — |
| | $ | 1.8 |
| | $ | — |
| | $ | 41.4 |
|
| Residual sharing income | 0.5 |
| | — |
| | — |
| | 9.3 |
| | — |
| | 9.8 |
|
| Non-remarketing disposition gains (1) | 4.5 |
| | 2.5 |
| | — |
| | — |
| | — |
| | 7.0 |
|
| Asset impairments | (1.9 | ) | | — |
| | — |
| | — |
| | — |
| | (1.9 | ) |
| | $ | 42.6 |
| | $ | 2.6 |
| | $ | — |
| | $ | 11.1 |
| | $ | — |
| | $ | 56.3 |
|
| | | | | | | | | | | | |
| Capital Expenditures | | | | | | | | | | | |
| Portfolio investments and capital additions | $ | 333.7 |
| | $ | 74.7 |
| | $ | 13.6 |
| | $ | 36.6 |
| | $ | 0.4 |
| | $ | 459.0 |
|
__________
(1) Includes scrapping gains.
GATX CORPORATION AND SUBSIDIARIES
NOTES TO CONSOLIDATED FINANCIAL STATEMENTS (UNAUDITED) (Continued)
|
| | | | | | | | | | | | | | | | | | | | | | | |
|
Rail North America | |
Rail International | |
ASC | |
Portfolio Management | | Other | | GATX Consolidated |
| Nine Months Ended September 30, 2016 | | | | | | | | | | |
| Profitability | | | | | | | | | | | |
| Revenues | | | | | | | | | | | |
| Lease revenue | $ | 703.0 |
| | $ | 136.8 |
| | $ | 3.1 |
| | $ | 4.6 |
| | $ | — |
| | $ | 847.5 |
|
| Marine operating revenue | — |
| | — |
| | 102.3 |
| | 37.4 |
| | — |
| | 139.7 |
|
| Other revenue | 63.5 |
| | 4.8 |
| | — |
| | 0.7 |
| | — |
| | 69.0 |
|
| Total Revenues | 766.5 |
| | 141.6 |
| | 105.4 |
| | 42.7 |
| | — |
| | 1,056.2 |
|
| Expenses | | | | | | | | | | | |
| Maintenance expense | 196.2 |
| | 36.1 |
| | 12.3 |
| | — |
| | — |
| | 244.6 |
|
| Marine operating expense | — |
| | — |
| | 64.0 |
| | 24.9 |
| | — |
| | 88.9 |
|
| Depreciation expense | 173.0 |
| | 34.2 |
| | 8.6 |
| | 5.2 |
| | — |
| | 221.0 |
|
| Operating lease expense | 50.6 |
| | — |
| | 4.0 |
| | — |
| | (0.1 | ) | | 54.5 |
|
| Other operating expense | 25.0 |
| | 3.8 |
| | — |
| | 4.9 |
| | — |
| | 33.7 |
|
| Total Expenses | 444.8 |
| | 74.1 |
| | 88.9 |
| | 35.0 |
| | (0.1 | ) | | 642.7 |
|
| Other Income (Expense) | | | | | | | | | | | |
| Net gain on asset dispositions | 36.4 |
| | 1.5 |
| | — |
| | 84.9 |
| | — |
| | 122.8 |
|
| Interest (expense) income, net | (81.2 | ) | | (21.9 | ) | | (3.3 | ) | | (6.4 | ) | | 2.9 |
| | (109.9 | ) |
| Other (expense) income | (3.8 | ) | | 2.0 |
| | (0.3 | ) | | — |
| | (0.8 | ) | | (2.9 | ) |
| Share of affiliates' earnings (pretax) | 0.3 |
| | (0.2 | ) | | — |
| | 33.0 |
| | — |
| | 33.1 |
|
| Segment Profit | $ | 273.4 |
| | $ | 48.9 |
| | $ | 12.9 |
| | $ | 119.2 |
| | $ | 2.2 |
| | 456.6 |
|
| Selling, general and administrative expense | 127.8 |
|
| Income taxes (including $4.0 related to affiliates' earnings) | 102.6 |
|
| Net Income | $ | 226.2 |
|
| | | | | | | | | | | | |
| Net Gain on Asset Dispositions | | | | | | | | | | | |
| Asset Remarketing Income: | | | | | | | | | | | |
| Disposition gains on owned assets | $ | 32.5 |
| | $ | — |
| | $ | — |
| | $ | 4.2 |
| | $ | — |
| | $ | 36.7 |
|
| Residual sharing income | 0.7 |
| | — |
| | — |
| | 82.5 |
| | — |
| | 83.2 |
|
| Non-remarketing disposition gains (1) | 3.2 |
| | 1.5 |
| | — |
| | — |
| | — |
| | 4.7 |
|
| Asset impairment | — |
| | — |
| | — |
| | (1.8 | ) | | — |
| | (1.8 | ) |
| | $ | 36.4 |
| | $ | 1.5 |
| | $ | — |
| | $ | 84.9 |
| | $ | — |
| | $ | 122.8 |
|
| Capital Expenditures | | | | | | | | | | | |
| Portfolio investments and capital additions | $ | 366.7 |
| | $ | 63.2 |
| | $ | 9.1 |
| | $ | — |
| | $ | 3.6 |
| | $ | 442.6 |
|
_____ |
| | | | | | | | | | | | | | | | | | | | | | | |
|
Rail North America | |
Rail International | |
ASC | |
Portfolio Management | | Other | | GATX Consolidated |
| Nine Months Ended September 30, 2016 | | | | | | | | | | |
| Profitability | | | | | | | | | | | |
| Revenues | | | | | | | | | | | |
| Lease revenue | $ | 703.0 |
| | $ | 136.8 |
| | $ | 3.1 |
| | $ | 4.6 |
| | $ | — |
| | $ | 847.5 |
|
| Marine operating revenue | — |
| | — |
| | 102.3 |
| | 37.4 |
| | — |
| | 139.7 |
|
| Other revenue | 63.5 |
| | 4.8 |
| | — |
| | 0.7 |
| | — |
| | 69.0 |
|
Total Revenues | 766.5 |
| | 141.6 |
| | 105.4 |
| | 42.7 |
| | — |
| | 1,056.2 |
|
| Expenses | | | | | | | | | | | |
| Maintenance expense | 196.2 |
| | 36.1 |
| | 12.3 |
| | — |
| | — |
| | 244.6 |
|
| Marine operating expense | — |
| | — |
| | 64.0 |
| | 24.9 |
| | — |
| | 88.9 |
|
| Depreciation expense | 173.0 |
| | 34.2 |
| | 8.6 |
| | 5.2 |
| | — |
| | 221.0 |
|
| Operating lease expense | 50.6 |
| | — |
| | 4.0 |
| | — |
| | (0.1 | ) | | 54.5 |
|
| Other operating expense | 25.0 |
| | 3.8 |
| | — |
| | 4.9 |
| | — |
| | 33.7 |
|
| Total Expenses | 444.8 |
| | 74.1 |
| | 88.9 |
| | 35.0 |
| | (0.1 | ) | | 642.7 |
|
| Other Income (Expense) | | | | | | | | | | | |
| Net gain on asset dispositions | 36.4 |
| | 1.5 |
| | — |
| | 84.9 |
| | — |
| | 122.8 |
|
| Interest (expense) income, net | (81.2 | ) | | (21.9 | ) | | (3.3 | ) | | (6.4 | ) | | 2.9 |
| | (109.9 | ) |
| Other (expense) income | (3.8 | ) | | 2.0 |
| | (0.3 | ) | | — |
| | (0.8 | ) | | (2.9 | ) |
| Share of affiliates' pre-tax income (loss) | 0.3 |
| | (0.2 | ) | | — |
| | 33.0 |
| | — |
| | 33.1 |
|
| Segment profit | $ | 273.4 |
| | $ | 48.9 |
| | $ | 12.9 |
| | $ | 119.2 |
| | $ | 2.2 |
| | 456.6 |
|
| Selling, general and administrative expense | 127.8 |
|
| Income taxes (includes $4.0 related to affiliates' earnings) | 102.6 |
|
| Net income | $ | 226.2 |
|
| | | | | | | | | | | | |
| Net Gain on Asset Dispositions | | | | | | | | | | | |
| Asset Remarketing Income: | | | | | | | | | | | |
| Disposition gains on owned assets | $ | 32.5 |
| | $ | — |
| | $ | — |
| | $ | 4.2 |
| | $ | — |
| | $ | 36.7 |
|
| Residual sharing income | 0.7 |
| | — |
| | — |
| | 82.5 |
| | — |
| | 83.2 |
|
| Non-remarketing disposition gains (1) | 3.2 |
| | 1.5 |
| | — |
| | — |
| | — |
| | 4.7 |
|
| Asset impairments | — |
| | — |
| | — |
| | (1.8 | ) | | — |
| | (1.8 | ) |
| | $ | 36.4 |
| | $ | 1.5 |
| | $ | — |
| | $ | 84.9 |
| | $ | — |
| | $ | 122.8 |
|
| | | | | | | | | | | | |
| Capital Expenditures | | | | | | | | | | | |
| Portfolio investments and capital additions | $ | 366.7 |
| | $ | 63.2 |
| | $ | 9.1 |
| | $ | — |
| | $ | 3.6 |
| | $ | 442.6 |
|
__________
(1) Includes scrapping gains.
NOTES TO CONSOLIDATED FINANCIAL STATEMENTS (UNAUDITED) (Continued)
|
| | | | | | | | | | | | | | | | | | | | | | | |
|
Rail North America | |
Rail International | |
ASC | |
Portfolio Management | | Other | | GATX Consolidated |
| Nine Months Ended September 30, 2015 | | | | | | | | | | |
| Profitability | | | | | | | | | | | |
| Revenues | | | | | | | | | | | |
| Lease revenue | $ | 694.3 |
| | $ | 128.6 |
| | $ | 3.1 |
| | $ | 19.1 |
| | $ | — |
| | $ | 845.1 |
|
| Marine operating revenue | — |
| | — |
| | 119.7 |
| | 48.1 |
| | — |
| | 167.8 |
|
| Other revenue | 51.8 |
| | 5.3 |
| | — |
| | 1.2 |
| | — |
| | 58.3 |
|
Total Revenues | 746.1 |
| | 133.9 |
| | 122.8 |
| | 68.4 |
| | — |
| | 1,071.2 |
|
| Expenses | | | | | | | | | | | |
| Maintenance expense | 199.7 |
| | 28.2 |
| | 14.5 |
| | — |
| | — |
| | 242.4 |
|
| Marine operating expense | — |
| | — |
| | 77.7 |
| | 37.0 |
| | — |
| | 114.7 |
|
| Depreciation expense | 160.1 |
| | 32.6 |
| | 9.6 |
| | 15.6 |
| | — |
| | 217.9 |
|
| Operating lease expense | 62.0 |
| | — |
| | 3.5 |
| | — |
| | (0.1 | ) | | 65.4 |
|
| Other operating expense | 18.1 |
| | 3.5 |
| | — |
| | 1.8 |
| | — |
| | 23.4 |
|
| Total Expenses | 439.9 |
| | 64.3 |
| | 105.3 |
| | 54.4 |
| | (0.1 | ) | | 663.8 |
|
| Other Income (Expense) | | | | | | | | | | | |
| Net gain (loss) on asset dispositions | 54.4 |
| | 6.5 |
| | — |
| | (11.4 | ) | | — |
| | 49.5 |
|
| Interest expense, net | (76.1 | ) | | (16.5 | ) | | (4.0 | ) | | (15.5 | ) | | (5.0 | ) | | (117.1 | ) |
| Other expense | (4.2 | ) | | (3.0 | ) | | (0.1 | ) | | — |
| | (1.4 | ) | | (8.7 | ) |
| Share of affiliates' earnings (pretax) (1) | 0.4 |
| | (0.2 | ) | | — |
| | 21.8 |
| | — |
| | 22.0 |
|
| Segment Profit (Loss) | $ | 280.7 |
| | $ | 56.4 |
| | $ | 13.4 |
| | $ | 8.9 |
| | $ | (6.3 | ) | | 353.1 |
|
| Selling, general and administrative expense | 134.7 |
|
| Income taxes (including $3.2 related to affiliates' earnings) | 71.3 |
|
| Net Income | $ | 147.1 |
|
| | | | | | | | | | | | |
| Net Gain (Loss) on Asset Dispositions | | | | | | | | |
| Asset Remarketing Income: | | | | | | | | | | | |
| Disposition gains on owned assets | $ | 51.1 |
| | $ | — |
| | $ | — |
| | $ | 9.3 |
| | $ | — |
| | $ | 60.4 |
|
| Residual sharing income | 0.7 |
| | — |
| | — |
| | 10.3 |
| | — |
| | 11.0 |
|
| Non-remarketing disposition gains (2) | 2.6 |
| | 6.7 |
| | — |
| | — |
| | — |
| | 9.3 |
|
| Asset impairment | — |
| | (0.2 | ) | | — |
| | (31.0 | ) | | — |
| | (31.2 | ) |
| | $ | 54.4 |
| | $ | 6.5 |
| | $ | — |
| | $ | (11.4 | ) | | $ | — |
| | $ | 49.5 |
|
| Capital Expenditures | | | | | | | | | | | |
| Portfolio investments and capital additions | $ | 362.8 |
| | $ | 110.1 |
| | $ | 20.3 |
| | $ | 2.2 |
| | $ | 2.9 |
| | $ | 498.3 |
|
_____
(1) Includes a $19.0 million impairment loss in the Portfolio Management segment.
(2) Includes scrapping gains.
Item 2. Management’s Discussion and Analysis of Financial Condition and Results of Operations
BUSINESS OVERVIEW
We lease, operate, manage, and remarket long-lived, widely-used assets, primarily in the rail market. We also invest in joint ventures that complement our existing business activities. We report our financial results through four primary business segments: Rail North America, Rail International, American Steamship Company (“ASC”), and Portfolio Management.
The following discussion and analysis should be read in conjunction with the MD&A in our Annual Report on Form 10-K for the year ended December 31, 2015.2016. We based the discussion and analysis that follows on financial data we derived from the financial statements prepared in accordance with GAAPUS Generally Accepted Accounting Standards ("GAAP") and on certain other financial data that we prepared using non-GAAP components. For a reconciliation of these non-GAAP components to the most comparable GAAP components, see “Non-GAAP Financial Measures” at the end of this item.
Operating results for the three and nine months ended September 30, 20162017 are not necessarily indicative of the results we may achieve for the entire year ending December 31, 2016. 2017. In particular, ASC's fleet is inactive for a significant portion of the first quarter of each year due to winter conditions on the Great Lakes. In addition, asset remarketing income does not occur evenly throughout the year. For more information about our business, refer to ourAnnual Report on Form 10-K for the year ended December 31, 2015.2016.
DISCUSSION OF OPERATING RESULTS
The following table shows a summary of our reporting segments and consolidated financial results for the three and nine months ended September 30 (in millions, except per share data):
| | | | Three Months Ended
September 30 | | Nine Months Ended
September 30 | Three Months Ended
September 30 | | Nine Months Ended
September 30 |
| | 2016 | | 2015 | | 2016 | | 2015 | 2017 | | 2016 | | 2017 | | 2016 |
| Segment Revenues | | | | | | | | | | | | | | |
| Rail North America | $ | 250.3 |
| | $ | 255.2 |
| | $ | 766.5 |
| | $ | 746.1 |
| $ | 242.4 |
| | $ | 250.3 |
| | $ | 737.4 |
| | $ | 766.5 |
|
| Rail International | 48.2 |
| | 45.8 |
| | 141.6 |
| | 133.9 |
| 52.3 |
| | 48.2 |
| | 144.5 |
| | 141.6 |
|
| ASC | 52.8 |
| | 62.8 |
| | 105.4 |
| | 122.8 |
| 60.2 |
| | 52.8 |
| | 116.3 |
| | 105.4 |
|
| Portfolio Management | 11.6 |
| | 22.4 |
| | 42.7 |
| | 68.4 |
| 4.7 |
| | 11.6 |
| | 25.9 |
| | 42.7 |
|
| | $ | 362.9 |
| | $ | 386.2 |
| | $ | 1,056.2 |
| | $ | 1,071.2 |
| $ | 359.6 |
| | $ | 362.9 |
| | $ | 1,024.1 |
| | $ | 1,056.2 |
|
| Segment Profit | | | | | | | | | | | | | | |
| Rail North America | $ | 87.9 |
| | $ | 90.0 |
| | $ | 273.4 |
| | $ | 280.7 |
| $ | 70.2 |
| | $ | 87.9 |
| | $ | 238.1 |
| | $ | 273.4 |
|
| Rail International | 23.3 |
| | 15.5 |
| | 48.9 |
| | 56.4 |
| 20.1 |
| | 23.3 |
| | 50.1 |
| | 48.9 |
|
| ASC | 7.8 |
| | 10.9 |
| | 12.9 |
| | 13.4 |
| 12.1 |
| | 7.8 |
| | 18.4 |
| | 12.9 |
|
| Portfolio Management | 64.1 |
| | (17.3 | ) | | 119.2 |
| | 8.9 |
| 12.8 |
| | 64.1 |
| | 47.3 |
| | 119.2 |
|
| | 183.1 |
| | 99.1 |
| | 454.4 |
| | 359.4 |
| 115.2 |
| | 183.1 |
| | 353.9 |
| | 454.4 |
|
| Less: | | | | | | | | | | | | | | |
| Selling, general and administrative expense | 48.1 |
| | 44.4 |
| | 127.8 |
| | 134.7 |
| 42.8 |
| | 48.1 |
| | 128.8 |
| | 127.8 |
|
| Unallocated interest (income) expense, net | (1.4 | ) | | (2.4 | ) | | (2.9 | ) | | 5.0 |
| |
| Unallocated interest expense, net | | (2.4 | ) | | (1.4 | ) | | (5.9 | ) | | (2.9 | ) |
| Other, including eliminations | (0.3 | ) | | 0.1 |
| | 0.7 |
| | 1.3 |
| 1.5 |
| | (0.3 | ) | | 1.2 |
| | 0.7 |
|
| Income taxes ($(0.1) and $(2.8) QTR and $4.0 and $3.2 YTD related to affiliates' earnings) | 41.0 |
| | 17.5 |
| | 102.6 |
| | 71.3 |
| |
| Income taxes ($3.9 and $(0.1) QTR and $9.6 and $4.0 YTD related to affiliates' earnings) | | 24.3 |
| | 41.0 |
| | 69.9 |
| | 102.6 |
|
Net Income | $ | 95.7 |
| | $ | 39.5 |
| | $ | 226.2 |
| | $ | 147.1 |
| $ | 49.0 |
| | $ | 95.7 |
| | $ | 159.9 |
| | $ | 226.2 |
|
| | | | | | | | | | | | | | | |
| Net income, excluding tax adjustments and other items (non-GAAP) | $ | 91.4 |
| | $ | 66.1 |
| | $ | 220.2 |
| | $ | 173.7 |
| $ | 49.0 |
| | $ | 61.1 |
| | $ | 158.8 |
| | $ | 189.9 |
|
| Diluted earnings per share (GAAP) | $ | 2.36 |
| | $ | 0.91 |
| | $ | 5.49 |
| | $ | 3.33 |
| $ | 1.25 |
| | $ | 2.36 |
| | $ | 4.04 |
| | $ | 5.49 |
|
| Diluted earnings per share, excluding tax adjustments and other items (non-GAAP) | $ | 2.25 |
| | $ | 1.52 |
| | $ | 5.35 |
| | $ | 3.94 |
| $ | 1.25 |
| | $ | 1.50 |
| | $ | 4.01 |
| | $ | 4.61 |
|
| | | | | | | | | |
| Investment Volume | $ | 120.4 |
| | $ | 142.1 |
| | $ | 442.6 |
| | $ | 498.3 |
| $ | 163.7 |
| | $ | 120.4 |
| | $ | 459.0 |
| | $ | 442.6 |
|
The following table shows our return on equity ("ROE") for the trailing twelve months ended September 30:
| | | | 2016 | | 2015 | 2017 | | 2016 |
| ROE (GAAP) | 21.5 | % | | 15.8 | % | 13.4 | % | | 21.5 | % |
| ROE, excluding tax adjustments and other items (non-GAAP) | 21.3 | % | | 17.9 | % | 14.4 | % | | 19.0 | % |
Net income was $226.2$159.9 million, or $5.49$4.04 per diluted share, for the first nine months of 20162017 compared to $147.1$226.2 million, or $3.33$5.49 per diluted share, in 2015.2016. Results for the nine months ended September 30, 2017, and 2016, and 2015 included a net gaingains of $6.0approximately $1.1 million and $2.1 million, respectively, associated with the planned exit of the majority of Portfolio Management's marine investments. In addition, during the nine months ended September 30, 2016, net proceeds of $30.3 million were recorded as a result of the settlement of a residual sharing agreement, and a $3.9 million benefit from deferred income tax adjustments was recorded due to enacted statutory rate decreases in the United Kingdom. See "Non-GAAP Financial Measures" at the end of this item for further details. Excluding the impact of these items, net lossincome decreased $31.1 million compared to the prior year.
Net income was $49.0 million, or $1.25 per diluted share, for the third quarter of $26.62017 compared to $95.7 million, or $2.36 per diluted share, in 2016. Results for the third quarter of 2016 included net gains of approximately $0.4 million associated with the planned exit of the majority of Portfolio Management's marine investments,investments. In addition, during the third quarter of 2016, net proceeds of $30.3 million were recorded as well as certaina result of the settlement of a residual sharing agreement, and a $3.9 million benefit from deferred income tax adjustments (seewas recorded due to enacted statutory rate decreases in the United Kingdom. See "Non-GAAP Financial Measures" at the end of this item for further details).details. Excluding the impact of these items, net income increased $46.5decreased $12.1 million for the nine months ended September 30, 2016 compared to the prior year,year.
The decreases in both the quarter and year-to-date net income for 2017 were primarily driven largely by higher residual sharing income, partially offset by lower disposition gains and lower affiliate earnings.
Net income was $95.7 million, or $2.36 per diluted share, for the third quarter of 2016 compared to $39.5 million, or $0.91 per diluted share, in 2015. Results for the third quarter 2016lease revenue at Rail North America, resulting from lower lease rates and 2015 included a net gain of $4.3 million and a net loss of $26.6 million associated with the planned exit of the majority of Portfolio Management's marine investments, as well as certain tax adjustments (see "Non-GAAP Financial Measures" at the end of this item for further details). Excluding the impact of these items, net income increased $25.3 million for the third quarter 2016 compared tofewer railcars on lease. In the prior year, driven by higherdisposition gains for both the quarter and year-to-date included sizeable residual sharing income, partially offset by lower disposition gains.
fees from the managed portfolio at our Portfolio Management segment.
Segment OperationsSEGMENT OPERATIONS
Segment profit is an internal performance measure used by the Chief Executive Officer to assess the performance of each segment in a given period. Segment profit includes all revenues, pretaxpre-tax earnings from affiliates, and net gains on asset dispositions that are attributable to the segments, as well as expenses that management believes are directly associated with the financing, maintenance, and operation of the revenue earning assets. Segment profit excludes selling, general and administrative expenses, income taxes, and certain other amounts not allocated to the segments. These amounts are included in Other.
We allocate debt balances and related interest expense to each segment based upon predetermined debt to equity leverage ratios. Due to changes in the composition of our segments, we have modified segment leverage levels for 2016. The leverage levels for 2016 are 5:1 for Rail North America, 3:1 for Rail International, 1.5:1 for ASC, and 1:1 for Portfolio Management. The leverage levels for 2015 were 5:1 for Rail North America, 2:1 for Rail International, 1.5:1 for ASC, and 3:1 for Portfolio Management. We believe that by using this leverage and interest expense allocation methodology, each operating segment’s financial performance reflects appropriate risk-adjusted borrowing costs.costs.
RAIL NORTH AMERICA
Segment Summary
Challenging conditions continue in the North American railcar leasing market due to the oversupply of existing railcars and a large railcar manufacturing backlog. Despite this difficult environment, Rail North America continues to face challenging conditionshas been successful in the railcar leasing market. The oversupplymaintaining high utilization of its railcars weakness in railcar loadings,across all tank and relatively high railroad velocity continue to place pressure on lease rates, renewal success rate, and new car placements. Rail North America's strategy in this difficult environment is to compete aggressively on lease rates to protect utilization and to reduce the length of lease term as rates decline.freight types.
At September 30, 2016,2017, Rail North America's wholly owned fleet, excluding boxcars, consisted of approximately 104,900103,700 cars. Fleet utilization, excluding boxcars, was 99.0%98.5% at the end of the third quarter of 2016September 30, 2017, compared to 98.1%98.8% at the end of prior quarter, and 99.2%99.0% at September 30, 2015.2016. Fleet utilization for approximately 18,10016,600 boxcars was 94.7%92.4% at the end of the third quarter of 2016,September 30, 2017, compared to 97.1%90.2% at the end of the prior quarter and 96.6%94.7% at September 30, 2015.2016.
During the third quarter of 2016,2017, the Lease Price Index on renewals (the “LPI”"LPI", see definition below) decreased 21.4%27.0%, compared to a decreasedecreases of 25.4%21.4% in the prior quarter and an increase of 25.6%21.4% in the third quarter of 2015. The impact of high expiring lease rates in combination with declining renewal rates will further pressure the LPI for the remainder of 2016, based on scheduled lease expirations.2016. Lease terms on renewals for cars in the LPI averaged 2935 months in the current quarter, compared to 3432 months in the prior quarter, and
60 29 months in the third quarter of 2015.2016. Additionally, the renewal success rate was 74.1%74.9% in the current quarter, compared to 62.6%75.1% in the prior quarter and 68.1%74.1% in the third quarter of 2015.2016. As the challenging lease rate environment persists, we will continue to experience pressure on the LPI. For the third quarter of 2016,2017, an average of approximately 103,500102,600 railcars, excluding boxcars, were on lease, compared to 103,800102,800 in the prior quarter and 105,900103,500 in the third quarter of 2015.2016.
As of September 30, 2016,2017, leases for approximately 4,6505,290 railcars in our term lease fleet and approximately 2,6201,920 boxcars are scheduled to expire over the remainder of 2016.2017. These amounts exclude railcars onwith leases expiring over the remainder of 2017 that were scheduled to expire later in 2016 but have already been renewed or assigned to a new lessee.
The following table shows Rail North America's segment results (in millions):
| | | | Three Months Ended
September 30 | | Nine Months Ended
September 30 | Three Months Ended
September 30 | | Nine Months Ended
September 30 |
| 2016 |
| 2015 | | 2016 | | 2015 | 2017 | | 2016 | | 2017 | | 2016 |
| Revenues |
|
|
|
|
| | | | | |
|
| |
| | |
| | |
|
| Lease revenue | $ | 233.0 |
|
| $ | 234.9 |
| | $ | 703.0 |
| | $ | 694.3 |
| $ | 224.5 |
|
| $ | 233.0 |
| | $ | 677.4 |
| | $ | 703.0 |
|
| Other revenue | 17.3 |
|
| 20.3 |
| | 63.5 |
| | 51.8 |
| 17.9 |
|
| 17.3 |
| | 60.0 |
| | 63.5 |
|
| Total Revenues | 250.3 |
|
| 255.2 |
| | 766.5 |
| | 746.1 |
| 242.4 |
|
| 250.3 |
| | 737.4 |
| | 766.5 |
|
| | | | | | | | | |
| Expenses | |
|
|
| | | | |
|
|
|
|
| |
|
| | |
| Maintenance expense | 62.8 |
| | 66.7 |
| | 196.2 |
| | 199.7 |
| 66.1 |
| | 62.8 |
| | 202.3 |
| | 196.2 |
|
| Depreciation expense | 58.4 |
|
| 54.5 |
| | 173.0 |
| | 160.1 |
| 60.1 |
|
| 58.4 |
| | 178.8 |
| | 173.0 |
|
| Operating lease expense | 17.2 |
|
| 20.6 |
| | 50.6 |
| | 62.0 |
| 15.5 |
|
| 17.2 |
| | 45.3 |
| | 50.6 |
|
| Other operating expense | 8.6 |
|
| 6.8 |
| | 25.0 |
| | 18.1 |
| 7.3 |
|
| 8.6 |
| | 21.7 |
| | 25.0 |
|
| Total Expenses | 147.0 |
|
| 148.6 |
| | 444.8 |
| | 439.9 |
| 149.0 |
|
| 147.0 |
| | 448.1 |
| | 444.8 |
|
| | | | | | | | | |
| Other Income (Expense) | |
|
|
| | | | |
|
|
|
|
| |
|
| | |
| Net gain on asset dispositions | 13.1 |
| | 11.5 |
| | 36.4 |
| | 54.4 |
| 8.1 |
| | 13.1 |
| | 42.6 |
| | 36.4 |
|
| Interest expense, net | (27.1 | ) |
| (27.0 | ) | | (81.2 | ) | | (76.1 | ) | (30.5 | ) |
| (27.1 | ) | | (90.1 | ) | | (81.2 | ) |
| Other expense | (1.4 | ) | | (1.2 | ) | | (3.8 | ) | | (4.2 | ) | (0.9 | ) | | (1.4 | ) | | (4.1 | ) | | (3.8 | ) |
| Share of affiliates' earnings (pretax) | — |
|
| 0.1 |
| | 0.3 |
| | 0.4 |
| |
| Share of affiliate's pre-tax income | | 0.1 |
|
| — |
| | 0.4 |
| | 0.3 |
|
Segment Profit | $ | 87.9 |
|
| $ | 90.0 |
| | $ | 273.4 |
| | $ | 280.7 |
| $ | 70.2 |
|
| $ | 87.9 |
| | $ | 238.1 |
| | $ | 273.4 |
|
| | | | | | | | | | | | | | | |
| Investment Volume | $ | 108.4 |
|
| $ | 97.8 |
| | $ | 366.7 |
| | $ | 362.8 |
| $ | 103.3 |
|
| $ | 108.4 |
| | $ | 333.7 |
| | $ | 366.7 |
|
The following table shows the components of Rail North America's lease revenue (in millions):
| | | | Three Months Ended
September 30 | | Nine Months Ended
September 30 | Three Months Ended
September 30 | | Nine Months Ended
September 30 |
| | 2016 | | 2015 | | 2016 | | 2015 | 2017 | | 2016 | | 2017 | | 2016 |
| Railcars (excluding boxcars) | $ | 202.7 |
| | $ | 204.7 |
| | $ | 613.6 |
| | $ | 604.1 |
| |
| Railcars | | $ | 195.9 |
| | $ | 201.4 |
| | $ | 591.8 |
| | $ | 611.0 |
|
| Boxcars | 20.4 |
| | 20.4 |
| | 59.9 |
| | 62.1 |
| 18.9 |
| | 21.7 |
| | 56.3 |
| | 62.5 |
|
| Locomotives | 9.9 |
| | 9.8 |
| | 29.5 |
| | 28.1 |
| 9.7 |
| | 9.9 |
| | 29.3 |
| | 29.5 |
|
| | $ | 233.0 |
| | $ | 234.9 |
| | $ | 703.0 |
| | $ | 694.3 |
| $ | 224.5 |
| | $ | 233.0 |
| | $ | 677.4 |
| | $ | 703.0 |
|
Lease Price Index
Our LPI is an internally-generated business indicator that measures lease rate pricing on renewals for our North American railcar fleet, excluding boxcars. We calculate the index using the weighted average lease rate for a group of railcar types that we believe best represents our overall North American fleet, excluding boxcars. The average renewal lease rate change is reported as the percentage change between the average renewal lease rate and the average expiring lease rate, weighted by fleet composition. The average renewal lease term is reported in months and reflects the average renewal lease term of railcar types in the LPI, weighted by fleet composition.
Rail North America Fleet Data
The following table shows fleet activity for Rail North America'sAmerica railcars, excluding boxcars:boxcars for the quarter ended:
| | | | September 30
2015 | | December 31
2015 | | March 31
2016 | | June 30
2016 | | September 30 2016 | September 30
2016 | | December 31
2016 | | March 31
2017 | | June 30
2017 | | September 30
2017 |
| Beginning balance | 106,984 |
| | 106,392 |
| | 106,146 |
| | 105,422 |
| | 105,368 |
| 105,368 |
| | 104,874 |
| | 104,522 |
| | 103,672 |
| | 104,007 |
|
| Cars added | 620 |
| | 1,306 |
| | 811 |
| | 857 |
| | 764 |
| 764 |
| | 1,087 |
| | 795 |
| | 1,224 |
| | 637 |
|
| Cars scrapped | (396 | ) | | (441 | ) | | (743 | ) | | (567 | ) | | (590 | ) | (590 | ) | | (579 | ) | | (806 | ) | | (640 | ) | | (854 | ) |
| Cars sold | (816 | ) | | (1,111 | ) | | (792 | ) | | (344 | ) | | (668 | ) | (668 | ) | | (860 | ) | | (839 | ) | | (249 | ) | | (98 | ) |
| Ending balance | 106,392 |
| | 106,146 |
| | 105,422 |
| | 105,368 |
| | 104,874 |
| 104,874 |
| | 104,522 |
| | 103,672 |
| | 104,007 |
| | 103,692 |
|
| Utilization rate at quarter end | 99.2 | % | | 99.1 | % | | 98.9 | % | | 98.1 | % | | 99.0 | % | 99.0 | % | | 98.9 | % | | 99.1 | % | | 98.8 | % | | 98.5 | % |
| Average active railcars | 105,896 |
| | 105,294 |
| | 104,505 |
| | 103,824 |
| | 103,479 |
| 103,479 |
| | 103,702 |
| | 102,976 |
| | 102,760 |
| | 102,555 |
|
The following table shows fleet statistics for Rail North America'sAmerica boxcars:
| | | | September 30
2015 | | December 31
2015 | | March 31
2016 | | June 30
2016 | | September 30
2016 | September 30
2016 | | December 31
2016 | | March 31
2017 | | June 30
2017 | | September 30
2017 |
| Ending balance | 18,567 |
| | 18,429 |
| | 18,338 |
| | 18,209 |
| | 18,089 |
| 18,089 |
| | 17,706 |
| | 17,415 |
| | 17,138 |
| | 16,555 |
|
| Utilization | 96.6 | % | | 97.7 | % | | 97.1 | % | | 97.1 | % | | 94.7 | % | 94.7 | % | | 93.8 | % | | 92.9 | % | | 90.2 | % | | 92.4 | % |
Comparison of the First Nine Months of 20162017 to the First Nine Months of 20152016
Segment Profit
Segment profit was $238.1 million in the first nine months of 2017 compared to $273.4 million compared to $280.7 millionin the same period in the prior year. The decrease was driven by lower asset disposition gainslease revenue and higher switching, freight and storagemaintenance expense, partially offset by higher lease revenue and fee income.asset disposition gains.
Revenues
Lease revenue increased $8.7decreased $25.6 million in 2016,the first nine months of 2017, primarily due to higher averagelower lease rates and higher utilization revenue, partially offset by the impact of fewer carsrailcars on lease. Other revenue increased $11.7decreased $3.5 million primarilyin the first nine months of 2017 due to higher feeslower repair revenue and repair revenue. Feeslower lease termination fees. Other revenue in 2016 included a lease termination fee of approximately $10.0 million for a penalty imposed by GATX for allowing a customer to return 200 crude oil carsrailcars prior to the contractual end of an existing lease. Other revenue in the current year included $7.8 million for compensation of damages to returned cars. The majority ofexpenses to repair these cars were subsequently placed with other GATX customers. On occasion, customerswill be recognized as incurred. In some cases, it may request relief from their lease commitments, particularly when underlying commodity markets turn down. However, our lease agreements do not include provisions for payment relief and any such arrangement would be negotiated and dependent on achieving an optimal economic outcome for GATX.more economical to scrap the railcar rather than incur these expenses.
Expenses
Maintenance expense decreased $3.5increased $6.1 million in 2016,the first nine months of 2017, primarily as a result ofdue to an increase in costs associated with cars assigned to new lessees, partially offset by lower repair costsexpenses for the baseboxcar fleet and lower railroad repairs partially offsetperformed by the impact of a higher number of boxcars undergoing maintenance.railroads. Depreciation expense increased $12.9$5.8 million in the first nine months of 2017, largely due to new railcar investments, including the purchase of railcars previously on operating leases.investments. Operating lease expense decreased $11.4$5.3 million in the first nine months of 2017, resulting from the purchase of railcars previously on operating leases.leases in both years. Other operating expense increased $6.9decreased $3.3 million in the first nine months of 2017, primarily due to higherlower switching storage, and freight costs.
Other Income (Expense)
Net gain on asset dispositions increased $6.2 million in the first nine months of 2017, in part due to higher average net gains on railcar and locomotive sales. In addition, higher scrapping gains, resulting from more railcars scrapped and higher scrap prices, were partially offset by an impairment loss recorded in the current year on certain railcars. Net interest expense increased $8.9 million in the first nine months of 2017, due to a higher average interest rate and a higher average debt balance. Other expense in the first nine months of 2017 was comparable to the same period in the prior year.
Investment Volume
During the first nine months of 2017, investment volume was $333.7 million compared to $366.7 million in the same period in 2016. We acquired 2,532 newly built railcars and purchased 212 railcars in the secondary market in the first nine months of 2017, compared to 2,361 newly built railcars and 25 railcars purchased in the secondary market in the same period in 2016.
Comparison of the Third Quarter of 2017 to the Third Quarter of 2016
Segment Profit
Segment profit was $70.2 million in the third quarter of 2017, compared to $87.9 million in the same period in the prior year. The decrease was driven by lower lease revenue and lower asset disposition gains.
Revenues
Lease revenue decreased $8.5 million in the third quarter of 2017, primarily due to lower lease rates and fewer cars on lease. Other revenue in the third quarter of 2017 was comparable to the same period in the prior year.
Expenses
Maintenance expense increased $3.3 million in the third quarter of 2017, primarily due to an increase in costs as a resultassociated with cars assigned to new lessees, partially offset by lower expenses for the boxcar fleet and lower repairs performed by the railroads. Depreciation expense increased $1.7 million in the period, largely due to new investments. Operating lease expense decreased $1.7 million in the third quarter of more cars being moved2017, resulting from the purchase of railcars previously on operating leases in both years. Other operating expense decreased $1.3 million in the period, primarily due to storage.lower switching and freight costs.
Other Income (Expense)
Net gain on asset dispositions decreased $18.0 million in 2016, as fewer railcars were sold in the current year. The timing of remarketing income is dependent on a number of factors and will vary from quarter to quarter. Net interest expense increased $5.1 million, due to a higher average debt balance.
Investment Volume
During 2016, investment volume was $366.7 million compared to $362.8 million in 2015. We acquired 2,361 newly built railcars and purchased 25 railcars in the secondary market in the first nine months of 2016, compared to 2,224 newly built railcars and 293 railcars purchased in the secondary market in 2015.
Comparison of the Third Quarter of 2016 to the Third Quarter of 2015
Segment Profit
Segment profit was $87.9$5.0 million in the third quarter of 2016, compared2017, primarily due to $90.0 millionfewer railcars sold in the prior year. Decreases in equalization revenue and lease revenue were substantially offset bycurrent year, as well as lower maintenance expense.
Revenues
Lease revenue decreased $1.9scrapping gains. Net interest expense increased $3.4 million in the third quarter of 2016, primarily2017, due to the impact of fewer cars on lease, partially offset bya higher average lease rates.interest rate and a higher average debt balance. Other revenue decreased $3.0 million, primarily due to lower equalization revenue and lower fees.
Expenses
Maintenance expense decreased $3.9 million in the third quarter of 2016, primarily due2017 was comparable to lower railroad repairs. Depreciation expense increased $3.9 million, largely due to new railcar investments. Operating lease expense decreased $3.4 million, resulting from the purchase of railcars previously on operating leases. Other operating expense increased $1.8 million, primarily due to higher switching and freight costs as a result of more cars being moved to storage.
Other Income (Expense)
Net gain on asset dispositions increased $1.6 millionsame period in the third quarter of 2016, as fewer railcars were sold in the current year but for a larger gain. Net interest expense increased $0.1 million, as the impact of a higher average debt balance was substantially offset by lower average interest rates.prior year.
North American Rail Regulatory Matters
On May 1, 2015, the Pipeline and Hazardous Materials Safety Administration of the US Department of Transportation (“PHMSA”) issued final rules that established new design standards for tank cars in flammable liquids service (the “PHMSA Rules”). The PHMSA Rules became effective on July 7, 2015, and all newly built tank cars for use in certain flammable liquids service were required to comply with the new design standards commencing on October 1, 2015. The PHMSA Rules also established standards for modifications to existing tank cars in certain flammable liquids service and deadlines for modifying or removing those cars from service. The US Congress subsequently adopted the Fixing America’s Surface Transportation Act (“FAST Act”), which changed certain requirements of the PHMSA Rules. Key changes included revisions to the design standards for modified cars, amendments to the modification deadlines, and expansion
of the applicability of the new tank car design standards to all cars used in flammable liquids service. Under the FAST Act, the deadlines for modifying or removing existing tank cars from flammables service range from January 2018 to May 2029, depending on the type of car and the type of commodity carried.
On May 1, 2015, Transport Canada (“TC”) issued final rules establishing new design standards for tank cars carrying flammable liquids in Canada (the “Canadian Rules”). The Canadian Rules became effective on May 20, 2015, and all newly built tank cars for use in flammable liquids service were required to comply with the new standards effective October 1, 2015. The Canadian Rules also established standards for modifications to existing tank cars in flammable liquids service and deadlines for modifying or removing cars from service ranging from May 2017 to May 2025, depending on the type of car and the type of commodity carried. On July 25, 2016, Transport Canada announced that certain older tank cars, commonly referred to as "DOT 111" tank cars, must be removed from crude oil service effective October 31, 2016.
We have a fleet of approximately 123,000 railcars in North America, including approximately 13,300 tank cars currently used to transport flammable liquids that are affected by the new rules, of which approximately 4,000 are moving crude oil and ethanol. Over 90% of our affected tank cars have a compliance deadline of 2023 or later, and fewer than 25 tank cars in our fleet will be affected by Transport Canada's October 31, 2016 deadline for removal from crude oil service. We expect to modify some of the most modern of our affected tank cars to comply with the new standards. However, for the majority of the affected cars, we currently anticipate retiring, redeploying, or selling them rather than performing retrofits.
RAIL INTERNATIONAL
Segment Summary
Rail International, particularlycomposed primarily of GATX Rail Europe ("GATX Rail Europe" or "GRE"GRE"), continues to experienceproduced solid operating results in 2017. Despite pressure on lease rates, GRE benefited from stable demand, for its railcars.leading to success in maintaining high fleet utilization. Railcar utilization for GRE was 95.0%95.6% at the end of the third quarter of 20162017, compared to 94.8%95.7% at the end of the prior quarter and 95.7%95.0% at September 30, 2015.2016.
GRE's results in the third quarter of 2016 continued to bewere impacted by higher wheelset costs, primarily dueattributable to a refurbishment program enacted to address anti-corrosion paint issues on certain existing wheelsets. GRE is addressing this issue with the wheelset supplier and the potential pursuit of warranty remedies.
The following table shows Rail International's segment results (in millions):
| | | | Three Months Ended
September 30 | | Nine Months Ended
September 30 | Three Months Ended
September 30 | | Nine Months Ended
September 30 |
| | 2016 | | 2015 | | 2016 | | 2015 | 2017 | | 2016 | | 2017 | | 2016 |
| Revenues | | | | | | | | |
| | |
| | |
| | |
|
| Lease revenue | $ | 46.6 |
| | $ | 44.1 |
| | $ | 136.8 |
| | $ | 128.6 |
| $ | 50.3 |
| | $ | 46.6 |
| | $ | 139.8 |
| | $ | 136.8 |
|
| Other revenue | 1.6 |
| | 1.7 |
| | 4.8 |
| | 5.3 |
| 2.0 |
| | 1.6 |
| | 4.7 |
| | 4.8 |
|
| Total Revenues | 48.2 |
| | 45.8 |
| | 141.6 |
| | 133.9 |
| 52.3 |
| | 48.2 |
| | 144.5 |
| | 141.6 |
|
| | | | | | | | | |
| Expenses | | | | | | | | | | | | | | |
| Maintenance expense | 10.7 |
| | 9.9 |
| | 36.1 |
| | 28.2 |
| 11.1 |
| | 10.7 |
| | 30.8 |
| | 36.1 |
|
| Depreciation expense | 11.6 |
| | 11.1 |
| | 34.2 |
| | 32.6 |
| 12.8 |
| | 11.6 |
| | 35.8 |
| | 34.2 |
|
| Operating lease expense | — |
| | (0.1 | ) | | — |
| | — |
| |
| Other operating expense | 1.2 |
| | 1.1 |
| | 3.8 |
| | 3.5 |
| 1.1 |
| | 1.2 |
| | 3.5 |
| | 3.8 |
|
| Total Expenses | 23.5 |
| | 22.0 |
| | 74.1 |
| | 64.3 |
| 25.0 |
| | 23.5 |
| | 70.1 |
| | 74.1 |
|
| | | | | | | | | |
| Other Income (Expense) | | | | | | | | | | | | | | |
| Net gain on asset dispositions | 0.5 |
| | 0.5 |
| | 1.5 |
| | 6.5 |
| 1.0 |
| | 0.5 |
| | 2.6 |
| | 1.5 |
|
| Interest expense, net | (7.3 | ) | | (7.0 | ) | | (21.9 | ) | | (16.5 | ) | (8.5 | ) | | (7.3 | ) | | (24.5 | ) | | (21.9 | ) |
| Other income (expense) | 5.5 |
| | (1.8 | ) | | 2.0 |
| | (3.0 | ) | 0.3 |
| | 5.5 |
| | (2.3 | ) | | 2.0 |
|
| Share of affiliates' earnings (pretax) | (0.1 | ) | | — |
| | (0.2 | ) | | (0.2 | ) | |
| Share of affiliate's pre-tax loss | | — |
| | (0.1 | ) | | (0.1 | ) | | (0.2 | ) |
Segment Profit | $ | 23.3 |
| | $ | 15.5 |
| | $ | 48.9 |
| | $ | 56.4 |
| $ | 20.1 |
| | $ | 23.3 |
| | $ | 50.1 |
| | $ | 48.9 |
|
| | | | | | | | | | | | | | | |
| Investment Volume | $ | 10.8 |
| | $ | 40.9 |
| | $ | 63.2 |
| | $ | 110.1 |
| $ | 22.9 |
| | $ | 10.8 |
| | $ | 74.7 |
| | $ | 63.2 |
|
The following table shows fleet activity for GRE railcars:railcars for the quarter ended:
| | | | September 30
2015 | | December 31
2015 | | March 31
2016 | | June 30
2016 | | September 30
2016 | September 30
2016 | | December 31
2016 | | March 31
2017 | | June 30
2017 | | September 30
2017 |
| Beginning balance | 22,483 |
| | 22,745 |
| | 22,923 |
| | 22,859 |
| | 23,088 |
| 23,088 |
| | 22,966 |
| | 23,122 |
| | 23,131 |
| | 23,180 |
|
| Cars added | 412 |
| | 459 |
| | 191 |
| | 323 |
| | 78 |
| 78 |
| | 287 |
| | 207 |
| | 288 |
| | 179 |
|
| Cars scrapped or sold | (150 | ) | | (281 | ) | | (255 | ) | | (94 | ) | | (200 | ) | (200 | ) | | (131 | ) | | (198 | ) | | (239 | ) | | (132 | ) |
| Ending balance | 22,745 |
| | 22,923 |
| | 22,859 |
| | 23,088 |
| | 22,966 |
| 22,966 |
| | 23,122 |
| | 23,131 |
| | 23,180 |
| | 23,227 |
|
| Utilization rate at quarter end | 95.7 | % | | 95.8 | % | | 95.1 | % | | 94.8 | % | | 95.0 | % | 95.0 | % | | 95.6 | % | | 95.0 | % | | 95.7 | % | | 95.6 | % |
| Average active railcars | 21,630 |
| | 21,861 |
| | 21,854 |
| | 21,747 |
| | 21,830 |
| 21,830 |
| | 22,002 |
| | 22,012 |
| | 22,024 |
| | 22,215 |
|
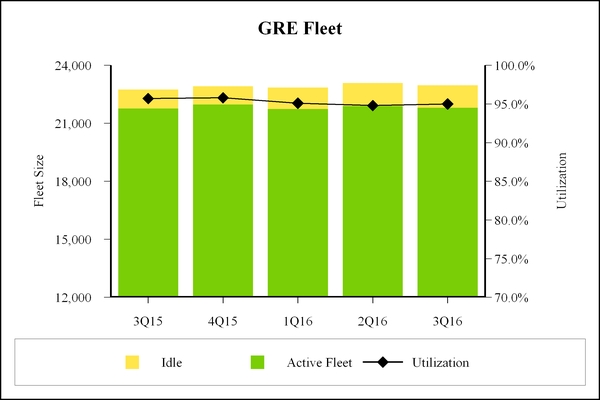
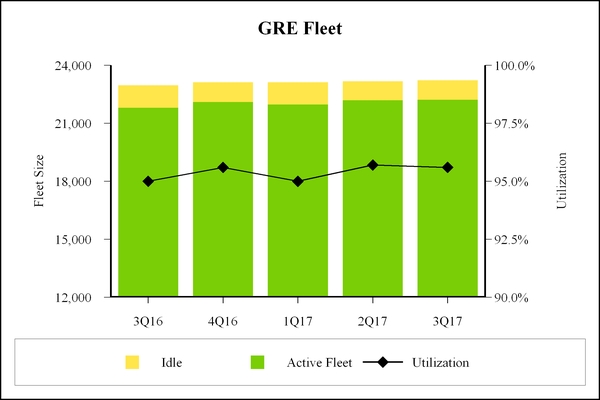 \
\
Comparison of the First Nine Months of 20162017 to the First Nine Months of 20152016
Foreign Currency
Rail International's reported results of operations are impacted by fluctuations in the exchange rates of the foreign currencies in which it conducts business, primarily the euro. InDuring the first nine months of 2016,2017, the value of the euro has fluctuated; however, in aggregate, the changes did not have a meaningful impact on reported revenue andor reported segment profit compared to the first nine months of 2015.2016.
Segment Profit
Segment profit was $50.1 million in the first nine months of 2017, compared to $48.9 million in 2016, compared to $56.4 millionthe same period in the prior year. HigherThe increase was largely due to lower maintenance expense and higher net interest expense in the current year, and a gain on the sale of a workshop in the prior year, werelease revenue, partially offset by higher lease revenue and the receiptabsence of insurance proceeds recognized in the currentprior year for previously expensed legal defense costs.
Revenues
Lease revenue increased $8.2$3.0 million in 2016, primarilythe first nine months of 2017 due to more cars on lease at higher rateslease. Other revenue in the currentfirst nine months of 2017 was comparable to same period in the prior year. Other revenue decreased $0.5 million, primarily due to the absence of interest income on a loan that was repaid in 2015.
Expenses
Maintenance expense increased $7.9decreased $5.3 million in 2016,the first nine months of 2017, primarily due to thelower wheelset costs of wheelset replacements, as discussed above, and the higher costimpact of railcar revisions.fewer railcars undergoing regulatory compliance maintenance. Depreciation expense increased $1.6 million in the first nine months of 2017, driven by the impact of new cars added to the fleet. Other operating expense increased $0.3 million, largely duein the first nine months of 2017 was comparable to higher switching and freight costs.
the same period in the prior year.
Other Income (Expense)
Net gain on asset dispositions decreased $5.0increased $1.1 million in 2016,the first nine months of 2017, primarily due to a gain on the sale of a workshop in the prior year and lower railcarhigher scrapping gains as a result of fewerresulting from more railcars scrapped in the current year.scrapped. Net interest expense increased $5.4$2.6 million largelyin the first nine months of 2017, due to a higher average interest rate and a higher average debt balance, partially offset by lower average interest rates.balance. Other expense decreased $5.0increased $4.3 million due toin the first nine months of 2017, driven by the absence of insurance proceeds receivedrecognized in the currentprior year for previously expensed legal defense costs.costs, partially offset by the unfavorable impact of changes in foreign exchange rates on non-functional currency items and derivatives.
Investment Volume
During 2016, investment volume was $63.2 million compared to $110.1 million in 2015. We acquired 592 railcars in GRE and 20 railcars in Russia in the first nine months of 20162017, investment volume was $74.7 million compared to 962$63.2 million in the same period in 2016. GRE acquired 674 railcars and Rail India acquired 229 railcars in 2017 compared to 592 railcars at GRE 50and 20 railcars at Rail Russia in Russia, and 369 railcars in India, in 2015.2016.
Comparison of the Third Quarter of 20162017 to the Third Quarter of 20152016
Foreign Currency
In the third quarter of 2016, the value of the2017, a stronger euro has fluctuated; however, in aggregate, the changes did not have a meaningful impact onpositively impacted reported lease revenue by approximately $2.6 million and reported segment profit, excluding other income (expense), by approximately $1.6 million compared to the third quarter of 2015.2016.
Segment Profit
Segment profit was $23.3$20.1 million in the third quarter of 2016,2017, compared to $15.5$23.3 million in the same period in the prior year. The increasedecrease was primarilylargely due to the absence of insurance proceeds receivedrecognized in the currentprior year for previously expensed legal defense costs, andpartially offset by higher lease revenue.
Revenues
Lease revenue increased $2.5$3.7 million in the third quarter of 2016,2017, primarily due to more cars on lease, inas well as the current year.effects of a stronger euro.
Expenses
Maintenance expense increased $0.8$0.4 million in the third quarter of 2016,2017, primarily due to the effects of a stronger euro and higher workshop costs, partially offset by the impact of fewer railcars undergoing regulatory compliance maintenance and lower wheelset replacements, as discussed above.costs. Depreciation expense increased $0.5$1.2 million in the third quarter of 2017, driven by the impact of new cars added to the fleet. Other operating expense in the third quarter of 2017 was comparable to the same period in the prior year.
Other Income (Expense)
Net gain on asset dispositions increased $0.5 million in the third quarter of 2017, driven by higher gains on scrapped railcars and parts. Net interest expense increased $0.3$1.2 million largelyin the third quarter of 2017, due to a higher average interest rate and a higher average debt balance. Other expenseincome decreased $7.3$5.2 million during the period, largely due to the absence of insurance proceeds receivedrecognized in the currentprior year for previously expensed legal defense costs.costs, partially offset by the favorable impact of changes in foreign exchange rates on non-functional currency items and derivatives.
ASC
Segment Summary
ASC's operations have benefited from strong demand and opportunities for spot business, as well as favorable sailing conditions in 2017. During the first nine monthsthird quarter of 2016, we carried 18.22017, twelve vessels were in operation, compared to eleven vessels in the prior year. ASC transported 19.3 million net tons of freight compared to 19.5 million net tons during the first nine months of 2015. Despite favorable operating conditions, lower demand across all commodities, as well as fewer higher-margin, long-haul shipments, negatively impacted operating results. Eleven vessels were in operation,2017, compared to thirteen vessels18.2 million net tons in the prior year.
The following table shows ASC’s segment results (in millions):
| | | | Three Months Ended
September 30 | | Nine Months Ended
September 30 | Three Months Ended
September 30 | | Nine Months Ended
September 30 |
| | 2016 | | 2015 | | 2016 | | 2015 | 2017 | | 2016 | | 2017 | | 2016 |
| Revenues | | | | | | | | |
| | |
| | |
| | |
|
| Lease revenue | $ | 1.0 |
| | $ | 1.1 |
| | $ | 3.1 |
| | $ | 3.1 |
| $ | 1.1 |
| | $ | 1.0 |
| | $ | 3.1 |
| | $ | 3.1 |
|
| Marine operating revenue | 51.8 |
| | 61.7 |
| | 102.3 |
| | 119.7 |
| 59.1 |
| | 51.8 |
| | 113.2 |
| | 102.3 |
|
| Total Revenues | 52.8 |
| | 62.8 |
| | 105.4 |
| | 122.8 |
| 60.2 |
| | 52.8 |
| | 116.3 |
| | 105.4 |
|
| | | | | | | | | |
| Expenses | | | | | | | | | | | | | | |
| Maintenance expense | 6.1 |
| | 7.3 |
| | 12.3 |
| | 14.5 |
| 7.7 |
| | 6.1 |
| | 14.6 |
| | 12.3 |
|
| Marine operating expense | 31.5 |
| | 36.7 |
| | 64.0 |
| | 77.7 |
| 34.7 |
| | 31.5 |
| | 70.6 |
| | 64.0 |
|
| Depreciation expense | 4.2 |
| | 4.7 |
| | 8.6 |
| | 9.6 |
| 4.0 |
| | 4.2 |
| | 8.1 |
| | 8.6 |
|
| Operating lease expense | 2.0 |
| | 1.8 |
| | 4.0 |
| | 3.5 |
| 0.3 |
| | 2.0 |
| | 1.5 |
| | 4.0 |
|
| Total Expenses | 43.8 |
| | 50.5 |
| | 88.9 |
| | 105.3 |
| 46.7 |
| | 43.8 |
| | 94.8 |
| | 88.9 |
|
| | | | | | | | | |
| Other Income (Expense) | | | | | | | | | | | | | | |
| Interest expense, net | (1.1 | ) | | (1.4 | ) | | (3.3 | ) | | (4.0 | ) | (1.4 | ) | | (1.1 | ) | | (3.9 | ) | | (3.3 | ) |
| Other expense | (0.1 | ) | | — |
| | (0.3 | ) | | (0.1 | ) | |
| Other (expense) income | | — |
| | (0.1 | ) | | 0.8 |
| | (0.3 | ) |
| Segment Profit | $ | 7.8 |
| | $ | 10.9 |
| | $ | 12.9 |
| | $ | 13.4 |
| $ | 12.1 |
| | $ | 7.8 |
| | $ | 18.4 |
| | $ | 12.9 |
|
| | | | | | | | | | | | | | | |
| Investment Volume | $ | — |
| | $ | 0.8 |
| | $ | 9.1 |
| | $ | 20.3 |
| $ | 0.8 |
| | $ | — |
| | $ | 13.6 |
| | $ | 9.1 |
|
| Total Net Tons Carried (000's) | 8,680 | | 10,232 | | 18,193 | | 19,463 | 9,811 |
| | 8,680 |
| | 19,348 |
| | 18,193 |
|
Comparison of the First Nine Months of 20162017 to the First Nine Months of 20152016
Segment Profit
Segment profit was $18.4 million in the first nine months of 2017, compared to segment profit of $12.9 million in 2016, compared to $13.4 millionthe same period in the prior year. The decreaseincrease was driven by lowerprimarily due to higher volume and a reductionfavorable commodity mix, as well as lower operating lease expense resulting from the return of a leased vessel in higher-margin, long-haul shipmentsthe first quarter of various commodities, partially offset by the impact of fewer vessels deployed.2017.
Revenues
Marine operating revenue decreased $17.4increased $10.9 million in 2016,the first nine months of 2017, primarily due to lowerhigher volume, ashigher freight rates and a resultfavorable mix of decreased demand, as well as fewer long-haul shipments of various commodities. In addition, lowercommodities shipped. Higher fuel revenue, which is offset in marine operating expense, also contributed to the variance. The terms of our contracts provide that a substantial portion of fuel costs are passed on to customers.
Expenses
Maintenance expense increased $2.3 million in the first nine months of 2017, due to more winter work and higher operating repairs. Marine operating expense decreased $13.7increased $6.6 million in 2016the first nine months of 2017, largely driven by higher fuel costs and reflects the impact of lower fuel costs,an additional vessel in operation and more efficient operations, and two fewer vessels deployedoverall operating days. Operating lease expense decreased $2.5 million in the current year.
first nine months of 2017, attributable to the return of the leased vessel noted above.
Investment Volume
ASC's investmentsInvestments in each period consisted of structural and mechanical upgrades to our vessels.
Comparison of the Third Quarter of 20162017 to the Third Quarter of 20152016
Segment Profit
Segment profit was $7.8$12.1 million in the third quarter of 2016,2017, compared to $10.9$7.8 million in the same period in the prior year. The decreaseincrease was primarily driven by lowerdue to higher volume and a favorable commodity mix, as a result of decreased demand for commodities, partially offset bywell as lower operating costs aslease expense resulting from the return of a result of two fewer vessels deployedleased vessel in the current year.first quarter of 2017.
Revenues
Marine operating revenue decreased $9.9increased $7.3 million in the third quarter of 2016,2017, primarily due to reducedhigher volume of various commodities. In addition, lowerand a favorable commodity mix. Higher fuel revenue, which is offset in marine operating expense, also contributed to the variance.
Expenses
Marine operatingMaintenance expense decreased $5.2increased $1.6 million in the third quarter of 20162017 due to more winter work and reflectshigher operating repairs. Marine operating expense increased $3.2 million in the third quarter of 2017, largely driven by higher fuel costs and the impact of lower fuel costs,an additional vessel in operation and more efficient operations, and two fewer vessels deployedoverall operating days. Operating lease expense decreased $1.7 million in the current year.third quarter of 2017, attributable to the return of the leased vessel noted above.
PORTFOLIO MANAGEMENT
Segment Summary
InPortfolio Management's segment profit includes income from our investment in the Rolls-Royce & Partners Finance companies (collectively the "RRPF affiliates"). The RRPF affiliates are a group of sixteen 50% owned domestic and foreign joint ventures with Rolls-Royce plc (or affiliates thereof, collectively “Rolls-Royce”), a leading manufacturer of commercial aircraft jet engines. Segment profit included earnings from the RRPF affiliates of $38.8 million and $15.3 million for the first nine months and third quarter of 2015, GATX management2017, compared to $32.0 million and $14.2 million in 2016. As of September 30, 2017, the RRPF affiliates owned 409 aircraft spare engines, compared to 410 at September 30, 2016.
Portfolio Management's results also include the operations of five liquefied gas carrying vessels (the "Norgas Vessels"). During the first nine months of 2017, the Norgas Vessels experienced lower rates, due in part to the impact of new competing vessels that entered the market during the current year, as well as lower utilization of our vessels resulting from supply disruptions caused by unplanned outages at certain customers' petrochemical plants.
As we have disclosed previously, we made the decision to exit the majority of our marine investments, within the Portfolio Management segment, including six chemical parcel tankers (the "Nordic Vessels"), most of theour inland marine vessels, and our 50% interest in the Cardinal Marine joint venture. As a result,To date, we sold certainhave completed the sales of the Nordic Vessels, our marine investments during 2015, including our 50% interest in the Cardinal Marine joint venture, and onethe majority of our inland marine assets. In the Nordic Vessels.first nine months of 2017, we sold marine assets for total proceeds of $28.2 million, resulting in a net gain of $1.8 million. In the first nine months of 2016, we sold additional marine assets including threefor total proceeds of the Nordic Vessels. Proceeds from sales completed in the first nine months of 2016 were $49.4$48.4 million, resulting in a net gain of $4.2 million. We also recognized a gain of $1.0 million resulting from additional proceeds received from the sale of the Cardinal Marine joint venture and recorded additional impairment losses of $1.8 million for certain of the remaining Portfolio Management marine assets held for sale. We
expect to sell the remaining targeted inland marine investmentsassets in 2016.2017. Upon completion of these sales, Portfolio Management will continue to own and operate othersome marine investments, consisting primarily of five liquefied gas carrying vessels (the "Norgas Vessels").
The Rolls-Royce & Partners Finance companies (collectively the "RRPF affiliates") continue to perform well operationally, which reflects continued strong demand for aircraft spare engines. The RRPF affiliates contributed $32.0 million and $14.2 million to segment profit for the first nine months and third quarter of 2016, compared to $41.6 million and $17.6 million in 2015.
For the nine months ended September 30, 2016, we realized residual sharing income of $82.5 million. Proceeds of $49.1 million were recorded as a result of the settlement of a residual sharing agreement. This agreement was originally entered into in 2001 and related to a residual guarantee we provided on certain rail assets. Receipt of the settlement fee concludes our participation in this transaction. Additionally, a customer sold its interest in two leased nuclear power plant facilities and, as manager of the leases, we received a portion of the sales proceeds.Norgas Vessels.
Portfolio Management's total asset base was $616.8 million at September 30, 2017, compared to $593.5 million at December 31, 2016, and $606.2 million at September 30, 2016, compared to $636.5 million at December 31, 2015, and $737.7 million at September 30, 2015.2016. Assets held for sale were $19.2 million at September 30, 2017, $45.6 million at December 31, 2016, and $60.5 million at September 30, 2016, and $103.4 million at December 31, 2015.2016.
The following table shows Portfolio Management'sManagement’s segment results (in millions):
| | | | Three Months Ended
September 30 | | Nine Months Ended
September 30 | Three Months Ended
September 30 | | Nine Months Ended
September 30 |
| | 2016 | | 2015 | | 2016 | | 2015 | 2017 | | 2016 | | 2017 | | 2016 |
| Revenues | | | | | | | | |
| | |
| | |
| | |
|
| Lease revenue | $ | 1.2 |
| | $ | 6.1 |
| | $ | 4.6 |
| | $ | 19.1 |
| $ | 0.7 |
| | $ | 1.2 |
| | $ | 3.1 |
| | $ | 4.6 |
|
| Marine operating revenue | 10.3 |
| | 15.9 |
| | 37.4 |
| | 48.1 |
| 3.8 |
| | 10.3 |
| | 21.8 |
| | 37.4 |
|
| Other revenue | 0.1 |
| | 0.4 |
| | 0.7 |
| | 1.2 |
| 0.2 |
| | 0.1 |
| | 1.0 |
| | 0.7 |
|
| Total Revenues | 11.6 |
| | 22.4 |
| | 42.7 |
| | 68.4 |
| 4.7 |
| | 11.6 |
| | 25.9 |
| | 42.7 |
|
| | | | | | | | | |
| Expenses | | | | | | | | | | | | | | |
| Marine operating expense | 7.7 |
| | 11.8 |
| | 24.9 |
| | 37.0 |
| 4.2 |
| | 7.7 |
| | 19.2 |
| | 24.9 |
|
| Depreciation expense | 1.7 |
| | 4.7 |
| | 5.2 |
| | 15.6 |
| 1.7 |
| | 1.7 |
| | 5.2 |
| | 5.2 |
|
| Other operating expense | 0.3 |
| | 0.4 |
| | 4.9 |
| | 1.8 |
| 0.1 |
| | 0.3 |
| | 0.7 |
| | 4.9 |
|
| Total Expenses | 9.7 |
| | 16.9 |
| | 35.0 |
| | 54.4 |
| 6.0 |
| | 9.7 |
| | 25.1 |
| | 35.0 |
|
| | | | | | | | | |
| Other Income (Expense) | | | | | | | | | | | | | | |
| Net gain (loss) on asset dispositions | 49.1 |
| | (16.5 | ) | | 84.9 |
| | (11.4 | ) | |
| Net gain on asset dispositions | | 0.3 |
| | 49.1 |
| | 11.1 |
| | 84.9 |
|
| Interest expense, net | (2.1 | ) | | (4.7 | ) | | (6.4 | ) | | (15.5 | ) | (2.2 | ) | | (2.1 | ) | | (6.8 | ) | | (6.4 | ) |
| Share of affiliates' earnings (pretax) | 15.2 |
| | (1.6 | ) | | 33.0 |
| | 21.8 |
| |
| Segment Profit (Loss) | $ | 64.1 |
| | $ | (17.3 | ) | | $ | 119.2 |
| | $ | 8.9 |
| |
| Other income | | — |
| | — |
| | 2.3 |
| | — |
|
| Share of affiliates' pre-tax income | | 16.0 |
| | 15.2 |
| | 39.9 |
| | 33.0 |
|
Segment Profit | | $ | 12.8 |
| | $ | 64.1 |
| | $ | 47.3 |
| | $ | 119.2 |
|
| | | | | | | | | | | | | | | |
Investment Volume | $ | — |
| | $ | 1.9 |
| | $ | — |
| | $ | 2.2 |
| $ | 36.6 |
| | — |
| | $ | 36.6 |
| | — |
|
The following table shows the approximate net book values of Portfolio Management's assets (in millions):
| | | | September 30
2015 | | December 31
2015 | | March 31
2016 | | June 30
2016 | | September 30
2016 | September 30
2016 | | December 31
2016 | | March 31
2017 | | June 30
2017 | | September 30
2017 |
| Net book value of owned assets | $ | 387.4 |
| | $ | 301.4 |
| | $ | 261.8 |
| | $ | 268.1 |
| | $ | 241.2 |
| $ | 241.2 |
| | $ | 218.2 |
| | $ | 214.8 |
| | $ | 199.4 |
| | $ | 177.3 |
|
| Affiliate investments | 350.3 |
| | 335.1 |
| | 344.0 |
| | 348.9 |
| | 365.0 |
| 365.0 |
| | 375.3 |
| | 385.2 |
| | 396.1 |
| | 439.5 |
|
| Net book value of managed assets | 70.4 |
| | 114.5 |
| | 123.3 |
| | 57.7 |
| | 55.9 |
| 55.9 |
| | 51.8 |
| | 50.0 |
| | 45.8 |
| | 43.9 |
|
RRPF Affiliates Engine Portfolio Data
The following table shows portfolio activity for the RRPF affiliates' aircraft spare engines for the quarter ended:
|
| | | | | | | | | | | | | | |
| | September 30
2016 | | December 31
2016 | | March 31
2017 | | June 30
2017 | | September 30
2017 |
| Beginning balance | 435 |
| | 410 |
| | 407 |
| | 404 |
| | 405 |
|
| Engine acquisitions | 2 |
| | 15 |
| | — |
| | 3 |
| | 5 |
|
| Engine dispositions | (27 | ) | | (18 | ) | | (3 | ) | | (2 | ) | | (1 | ) |
| Ending balance | 410 |
| | 407 |
| | 404 |
| | 405 |
| | 409 |
|
| Utilization rate at quarter end | 93.9 | % | | 94.6 | % | | 94.6 | % | | 94.8 | % | | 96.1 | % |
Comparison of the First Nine Months of 20162017 to the First Nine Months of 20152016
Comparisons of reported results for the current year and the prior year are impacted by the salesales of marine investments and residual sharing income.investments.
Segment Profit
Segment profit was $119.2$47.3 million in 2016,the first nine months of 2017, compared to $8.9$119.2 million for the same period in the prior year. The current yearSegment profit included a net pre-tax gaingains of approximately $1.8 million and $3.4 million in the first nine months of 2017 and 2016 associated with the planned exit of marine investments. The net gains in 2017 were from the majoritysale of marine investments. The net gains in 2016 consisted of $4.2 million from the sale of marine investments comparedand $1.0 million resulting from additional proceeds received from the sale of the Cardinal Marine joint venture, partially offset by $1.8 million of impairment losses related to a net pre-tax losscertain of approximately $42.5 millionthe remaining assets held for sale. In addition, segment profit in the prior year.first nine months of 2016 included $49.1 million of income from the settlement of a residual sharing agreement. Excluding these items, results for the impactsPortfolio Management segment were $21.2 million lower in the first nine months of the net gain and loss, segment profit was $64.4 million higher than the prior year2017, primarily due to higherlower residual sharing income and higher net operating incomegains from the Norgas Vessels,managed portfolio and lower aggregate marine operating results, partially offset by the absence of contributionshigher earnings from sold assets and lower RRPF affiliate income.affiliates.
Revenues
Lease revenue decreased $14.5$1.5 million in 2016,the first nine months of 2017, primarily due to the impact of the sales of leased assets in both years.2016. Marine operating revenue decreased $10.7$15.6 million in the first nine months of 2017, largely due to lower revenue from the Norgas Vessels resulting from substantially lower rates, as well as the absence of revenue from the sold marine investmentsNordic Vessels and lowerother inland marine revenue,
partially offset by higher revenue from the Norgas Vessels. Other revenue decreased $0.5 million primarily due to lower interest incomeassets that were sold in 2016 and lower investment fund distributions in the current year.2017.
Expenses
Marine operating expense decreased $12.1$5.7 million in 2016,the first nine months of 2017, primarily due to the impact fromabsence of the vesselsNordic Vessels and other inland marine assets that were sold in 2016 and lower expense2017, partially offset by higher expenses for the inland marine vessels and the Norgas Vessels. Depreciation expense decreased $10.4 million, driven byin the salefirst nine months of assets2017 was comparable to the same period in 2015 and 2016.the prior year. Other operating expense increased $3.1decreased $4.2 million largelyin the first nine months of 2017, due to an additionala loss reserve recorded in 2016 in connection with one investment.
Other Income (Expense)
Net gain on asset dispositions increased $96.3decreased $73.8 million in 2016. The current year included a net pre-tax gainthe first nine months of 2017. Net gains of approximately $1.8 million and $2.4 million were recorded in the first nine months of 2017 and 2016 associated with the planned exit of marine investments. In addition, income of $49.1 million was recorded in the first nine months of 2016 from the settlement of a residual sharing agreement. Excluding these items, net gain on asset dispositions decreased $24.1 million, primarily due to lower residual sharing fees from the managed portfolio in in the first nine months of 2017.
Other income in the first nine months of 2017 reflects conditional proceeds that we received in the first quarter related to the sale of certain aircraft assets completed in a prior year.
Share of affiliates' pre-tax income increased $6.9 million in the first nine months of 2017, primarily due to higher income from the RRPF affiliates due to the absence of asset impairments that were recorded in the first nine months of 2016 and higher operating results, partially offset by lower net asset disposition gains in the current year. The higher operating results were driven by the positive impact of newer engines added to the portfolio in 2016 and 2017.
Investment Volume
During the first nine months of 2017, investment volume of $36.6 million was to fund the purchase of additional aircraft spare engines in the RRPF affiliates.
Comparison of the Third Quarter of 2017 to the Third Quarter of 2016
Segment Profit
Segment profit was $12.8 million for the third quarter of 2017, compared to $64.1 million for the same period in the prior year. Segment profit in the third quarter of 2016 included net gains of approximately $0.7 million associated with the planned exit of marine investments compared to a net pre-tax lossand $49.1 million of approximately $23.5 million in the prior year. Excluding these net gains and losses, net gain on asset dispositions increased $70.4 million primarily due to proceedsincome from the settlement of a residual sharing agreement and feesagreement. Excluding these items, results for our share of managed portfolio sales in 2016. Net interest expense decreased $9.1the Portfolio Management segment were $1.5 million as a result of a lower average debt balance and lower average interest rates.
Share of affiliates' earnings increased $11.2 million in 2016, primarily due to an impairment charge of $19.0 million associated with the planned sale of our interest in the Cardinal Marine affiliate in 2015. Excluding the prior year charge, the share of affiliates' earnings decreased $7.8 million, primarily due to lower net disposition gains and lower operating results at the RRPF affiliates, partially offset by an additional gain in 2016 related to the sale of the Cardinal Marine joint venture.
Comparison of the Third Quarter of 2016 to the Third Quarter of 2015
Segment Profit
Segment profit was $64.1 million for the third quarter of 2016, compared to a loss of $17.3 million for the prior year. The current year included a net pre-tax gain of approximately $0.7 million associated with the sale of marine investments compared to a net pre-tax loss of approximately $42.5 million in the prior year. Excluding the impacts of the net gain and loss, segment profit was $38.2 million higher than prior year2017, primarily due to higher residual sharing gains,lower aggregate marine operating results, partially offset by lower aggregate net operating incomehigher earnings from our marine operations and lower RRPF affiliate income.affiliates.
Revenues
Lease revenue in the third quarter of 2017 was comparable to the same period in the prior year. Marine operating revenue decreased $4.9$6.5 million in the third quarter of 2016, primarily2017, largely due to lower revenue from the impact of the sales of leased assets in both years. Marine operating revenue decreased $5.6 million, largely due toNorgas Vessels resulting from substantially lower rates, as well as the absence of revenue from the Nordic Vessels and other inland marine assets that were sold marine investments.in 2016 and 2017.
Expenses
Marine operating expense decreased $4.1$3.5 million in the third quarter of 2016,2017, primarily due to the impact fromabsence of the vesselsNordic Vessels and other inland marine assets that were sold in 2016 and lower expense2017, partially offset by higher expenses for the Norgas Vessels. Depreciation expense decreased $3.0 million, driven byand Other operating expense in the salethird quarter of assets2017 was comparable to the same period in 2015 and 2016.the prior year.
Other Income (Expense)
Net gain on asset dispositions increased $65.6decreased $48.8 million in the third quarter of 2016. The current year included2017. Income of $49.1 million was recorded in the third quarter of 2016 from the settlement of a net pre-tax lossresidual sharing agreement. Net losses of approximately $0.3 million were also recorded in the third quarter of 2016 associated with the saleplanned exit of marine investments compared to a net pre-tax loss of approximately $23.5 million in the prior year.investments. Excluding these items, net gain on asset dispositions increased $42.4 million primarily dueis comparable to proceeds from the settlementthird quarter of a residual sharing agreement in the current year. Net interest expense decreased $2.6 million as a result of a lower average debt balance and lower average interest rates.2016
Share of affiliates' earningspre-tax income increased $16.8$0.8 million in the third quarter of 2016,2017, primarily due to an impairment charge of $19.0 million associated with the planned sale of our interest in the Cardinal Marine affiliate in 2015. Excluding the prior year charge, the share of
affiliates' earnings decreased $2.2 million, primarily due to lower net disposition gains and lower operating results athigher income from the RRPF affiliates as a result of higher operating results, partially offset by an additional gainlower net asset disposition gains in the current year. The higher operating results were driven by the positive impact of newer engines added to the portfolio in 2016 related to the sale of the Cardinal Marine joint venture.and 2017.
OTHER
Other is comprised ofcomprises selling, general and administrative expenseexpenses (“SG&A”), unallocated interest expense, and miscellaneous income and expense not directly associated with the reporting segments and eliminations.
The following table shows components of Otherother (in millions):
| | | | | | | | | | | Three Months Ended
September 30 | | Nine Months Ended
September 30 |
| | Three Months Ended
September 30 | | Nine Months Ended
September 30 | 2017 | | 2016 | | 2017 | | 2016 |
| | 2016 | | 2015 | | 2016 | | 2015 | |
| | |
| | |
| | |
|
| Selling, general and administrative expense | $ | 48.1 |
| | $ | 44.4 |
| | $ | 127.8 |
| | $ | 134.7 |
| $ | 42.8 |
| | $ | 48.1 |
| | $ | 128.8 |
| | $ | 127.8 |
|
| Unallocated interest (income) expense, net | (1.4 | ) | | (2.4 | ) | | (2.9 | ) | | 5.0 |
| (2.4 | ) | | (1.4 | ) | | (5.9 | ) | | (2.9 | ) |
| Other expense (income) (including eliminations) | (0.3 | ) | | 0.1 |
| | 0.7 |
| | 1.3 |
| |
| Other expense (income), including eliminations | | 1.5 |
| | (0.3 | ) | | 1.2 |
| | 0.7 |
|
SG&A, Unallocated Interest and Other
During the quarter, GATX early terminated the office lease at its corporate headquarters. As a result, accelerated depreciation on leasehold improvements and certain associated costs were recorded in SG&A was $6.9and Other expense (income), respectively.
SG&A increased $1.0 million lower forin the first nine months of 2016 compared to the prior year, primarily2017, due to lower pension,a combination of higher compensation and employee benefits costs, accelerated depreciation expense for leasehold improvements, and higher information technology expenses. The decrease in pension expense, was drivensubstantially offset by the change in accounting estimate discussed in "Note 2. Basisimpact of Presentation" in Part I, Item 1 of this Form 10-Q. This was partially offset by a settlement accounting adjustment recorded in the currentprior year attributable to lump sum payments elected by eligible retirees as part of a voluntarythe early retirement program offered to eligible employees. SG&A decreased $5.3 million in 2015. The decrease in compensation expense wasthe third quarter of 2017, driven by fewer employees, resulting from the closure of the San Francisco office in the prior year and the impact of the early retirement program taking effect in the current year. IT costs were lower due to timing of purchases. SG&A was $3.7 million higher for the third quarter of 2016 compared to the prior year, largely due to the pension settlement accounting adjustment noted above.above, partially offset by accelerated depreciation for leasehold improvements and higher information technology expense.
Unallocated interest expense (the difference between external interest expense and interest expense allocated to the reporting segments in accordance with assigned leverage targets) in any periodyear is affected by our consolidated leverage position, the timing of debt issuances and investing activities, and intercompany allocations.
Other expense and(income), including eliminations, was $0.6$0.5 million lower forhigher in the first nine months of 2016 and $0.42017, attributable to the early lease termination costs, partially offset by costs incurred in the prior year related to the prepayment of debt. Other expense (income), including eliminations, was $1.8 million lower forhigher in the third quarter of 2016 compared to2017, largely a result of the prior year, both largely due to the impacts of foreign exchange on a foreign pension plan.early lease termination costs.
Consolidated Income Taxes
See "Note 8.7. Income Taxes"Taxes" in Part I, Item 1 of this Form 10-Q.
CASH FLOW AND LIQUIDITY
We generate a significant amount of cash from operating activities and from our investment portfolio proceeds. We also access domestic and international capital markets by issuing unsecured or secured debt and commercial paper. We use these sources of cash,resources, along with our available cash balances, to fulfill our debt, lease, and dividend obligations, to support our share repurchase program, and to fund portfolio investments and capital additions. We primarily use cash from operations and commercial paper issuances to fund daily operations.
The timing of asset dispositions and changes in working capital impacts cash flows from portfolio proceeds and operations. As a result, these cash flow components may vary materially from quarter to quarter and year to year. As of September 30, 2016,2017, we had an unrestricted cash balance of $211.5$199.2 million.
The following table shows our principal sources and uses of cash for the nine months ended September 30 (in millions):
| | | | 2016 | | 2015 | 2017 | | 2016 |
| Principal sources of cash | | | | | | |
| Net cash provided by operating activities | $ | 433.0 |
| | $ | 312.0 |
| $ | 317.5 |
| | $ | 435.5 |
|
| Portfolio proceeds | 170.6 |
| | 298.2 |
| 131.0 |
| | 170.6 |
|
| Other asset sales | 18.6 |
| | 16.2 |
| 24.3 |
| | 18.6 |
|
| Proceeds from sale-leasebacks | 82.5 |
| | — |
| 90.6 |
| | 82.5 |
|
| Proceeds from issuance of debt, commercial paper, and credit facilities | 801.8 |
| | 748.8 |
| 308.6 |
| | 801.8 |
|
| | $ | 1,506.5 |
| | $ | 1,375.2 |
| $ | 872.0 |
| | $ | 1,509.0 |
|
| Principal uses of cash | | | | | | |
| Portfolio investments and capital additions | $ | (442.6 | ) | | $ | (498.3 | ) | $ | (459.0 | ) | | $ | (442.6 | ) |
| Repayments of debt, commercial paper, and credit facilities | (801.2 | ) | | (703.4 | ) | (301.5 | ) | | (801.2 | ) |
| Purchases of leased-in assets | (116.5 | ) | | (118.4 | ) | |
| Purchases of previously leased-in assets | | (93.2 | ) | | (116.5 | ) |
| Payments on capital lease obligations | (3.4 | ) | | (2.7 | ) | (2.1 | ) | | (3.4 | ) |
| Stock repurchases | (95.1 | ) | | (105.0 | ) | (75.0 | ) | | (95.1 | ) |
| Dividends | (51.2 | ) | | (51.9 | ) | (51.8 | ) | | (51.2 | ) |
| | $ | (1,510.0 | ) | | $ | (1,479.7 | ) | $ | (982.6 | ) | | $ | (1,510.0 | ) |
Net cash provided by operating activities of $433.0$317.5 million increased $121.0decreased $118.0 million compared to 2015.2016. The increasedecrease was driven by higherlower fee income, primarilywhich included $9.8 million of residual sharing income in 2017 compared to $83.2 million in 2016, lower contributions from our marine operations at Portfolio Management, and lower lease revenue. In addition, the net impact of changes in the balances of certain working capital items negatively impacted cash provided from operating lease payments.activities.
Portfolio proceeds primarily consist of loan and finance lease receipts, proceeds from sales of operating assets, proceeds from sales of securities, and capital distributions from affiliates. Portfolio proceeds included net proceeds of $28.2 million in 2017 and $48.4 million in 2016 from the sales of marine investments as part of our decision to exit the majority of the marine assets at our Portfolio Management segment.
Rail North America completed sale-leaseback financings for 699 railcars in the first nine months of 2016 of $170.6 million decreased by $127.6 million compared to 2015, primarily due to proceeds received in the prior year from the repayment of a loan. In January 2015, AAE Cargo AG repaid its outstanding loan in the amount of €67.5 million ($76.4 million). In addition, portfolio proceeds were lower as a result of fewer railcars sold.
Rail North America completed a sale-leaseback financing for2017 and 574 railcars in the first nine months of 2016.
Proceeds from the issuance of debt for the first nine months of 20162017 were $801.8$308.6 million (net of discount, hedges and debt issuance costs)., primarily attributable to a $300 million, 10-year unsecured financing that was completed. In the first nine months of 2016, $700proceeds, net of hedges and debt issuance costs, of $801.8 million of unsecured debt was issued, includingincluded a $350 million 10-year unsecured offering, a $200 million 5-year unsecured financing, and a $150 million 50-year unsecured offering. Additionally,offering, as well as $125 million was drawn and subsequently repaid on a new $250 millionsecured railcar funding facility. Debt repayments of $801.2$301.5 million for the first nine months of 20162017 were $97.8$499.7 million higherlower than prior year. Each year consisted of scheduled maturity payments. Debt repayments in 2016 also included scheduledearly retirements. Additionally, we extended the maturities of certain of our credit facilities and early retirementsloans in the second quarter of debt. In 2015, repayments included $292.7 million in Europe.2017.
Portfolio investments and capital additions primarily consist of purchases of operating assets, investments in affiliates, and capitalized asset improvements. See individual segment discussionsPortfolio investments and capital additions of $459.0 million increased $16.4 million compared to 2016, primarily due to investments at the RRPF affiliates at Portfolio Management, partially offset by lower investments at Rail North America resulting from the mix and related cost of railcars purchased as part of our long-term supply agreement.
Purchases of leased-in assets of $93.2 million decreased $23.3 million compared to 2016. A decrease of $47.3 million at Rail North America due to fewer railcars purchased was partially offset by a $24.0 million increase at ASC for further informationthe purchase of a vessel that was previously on investment volume.lease.
In the first quarter of 2016, our board of directors authorized a $300 million share repurchase program. During the nine months ended September 30, 2017, we acquired 1.2 million shares of common stock for $75.0 million, compared to 2.2 million shares for $95.0 million during the same period in 2016. As of September 30, 2017, $105.0 million remained available under the repurchase authorization.
Contractual and Other Commercial Commitments
The following table shows our contractual commitments, including debt principal and related interest payments, lease payments, and purchase commitments at September 30, 2017 (in millions):
|
| | | | | | | | | | | | | | | | | | | | | | | | | | | |
| | Payments Due by Period |
| | Total | | 2017 (1) | | 2018 | | 2019 | | 2020 | | 2021 | | Thereafter |
| Recourse debt | $ | 4,300.3 |
| | $ | 1.5 |
| | $ | 523.8 |
| | $ | 550.0 |
| | $ | 350.0 |
| | $ | 365.0 |
| | $ | 2,510.0 |
|
| Interest on recourse debt (2) | 1,711.4 |
| | 18.6 |
| | 151.2 |
| | 134.2 |
| | 119.7 |
| | 107.3 |
| | 1,180.4 |
|
| Commercial paper and credit facilities | 15.7 |
| | 15.7 |
| | — |
| | — |
| | — |
| | — |
| | — |
|
| Capital lease obligations, including interest | 13.6 |
| | 0.4 |
| | 1.6 |
| | 11.6 |
| | — |
| | — |
| | — |
|
| Recourse operating leases | 646.8 |
| | 10.3 |
| | 88.8 |
| | 80.8 |
| | 76.3 |
| | 65.3 |
| | 325.3 |
|
| Purchase commitments (3) | 898.5 |
| | 157.7 |
| | 398.0 |
| | 323.0 |
| | 19.8 |
| | — |
| | — |
|
| | $ | 7,586.3 |
| | $ | 204.2 |
| | $ | 1,163.4 |
| | $ | 1,099.6 |
| | $ | 565.8 |
| | $ | 537.6 |
| | $ | 4,015.7 |
|
__________
| |
| (1) | For the remainder of the year. |
| |
| (2) | For floating rate debt, future interest payments are based on the applicable interest rate as of September 30, 2017. |
| |
| (3) | Primarily railcar purchase commitments. The amounts shown for all years are based on management's estimates of the timing, anticipated car types, and related costs of railcars to be purchased under its agreements. |
In 2014, we entered into a long-term supply agreement with Trinity Rail Group, LLC ("Trinity"), a subsidiary of Trinity Industries Inc. that took effect in mid-2016. Under the terms of that agreement, we may order up to 8,950 newly built railcars over a four-year period from March, 2016 2.2 million shares had been acquiredthrough March, 2020. We may order either tank or freight cars; however, we expect that the majority of the order will be for $95.0 million, excluding commissions paid.tank cars. Pursuant to the terms of the agreement, the parties conducted a review of the contract pricing in January 2017 as it no longer reflected market rates. Based on this review, the parties agreed to reduce contract pricing for future orders pursuant to the terms of the agreement.
Short-Term Borrowings
The following table provides additional information regarding our short-term borrowings for the nine months ended September 30, 2016:2017: | | | | North America (1) | | Europe (2) | Europe (1) |
| Balance as of September 30 (in millions) | $ | — |
| | $ | 5.1 |
| $ | 15.7 |
|
| Weighted average interest rate | n/a |
| | 0.9 | % | 0.6 | % |
| Euro/dollar exchange rate | n/a |
| | 1.12 |
| |
| Euro/Dollar exchange rate | | 1.18 |
|
| | | | | |
| Average daily amount outstanding year to date (in millions) | $ | 0.7 |
| | $ | 15.5 |
| $ | 8.2 |
|
| Weighted average interest rate | 0.7 | % | | 0.6 | % | 0.7 | % |
| Average euro/dollar exchange rate | n/a |
| | 1.12 |
| |
| Average Euro/Dollar exchange rate | | $ | 1.11 |
|
| | | | | |
| Average daily amount outstanding during 3rd quarter (in millions) | $ | 0.7 |
| | $ | 12.5 |
| $ | 13.8 |
|
| Weighted average interest rate | 0.8 | % | | 0.6 | % | 0.6 | % |
| Average euro/dollar exchange rate | n/a |
| | 1.12 |
| |
| Average Euro/Dollar exchange rate | | 1.18 |
|
| | | | | |
| Maximum daily amount outstanding year to date (in millions) | $ | 20.0 |
| | $ | 31.2 |
| $ | 23.2 |
|
| Applicable euro/dollar exchange rate | n/a |
| | 1.11 |
| |
| Euro/Dollar exchange rate | | 1.18 |
|
_________(1) Short-term borrowings in North America are comprised of commercial paper issued in the US.
(2) Short-term borrowings in Europe are comprisedcomposed of borrowings under bank credit facilities.
Revolving Credit FacilityLines and Facilities
In the second quarter of 2016, we entered intoWe have a new $600 million, 5-year unsecured revolving credit facility with terms and conditions similar toin the prior $575 million facility, which was terminated.US that matures in May 2022. As of September 30, 2016,2017, the full $600 million was available under the facility. Additionally, we have a $250 million 5-year secured railcar funding facility in the US with a 3-year revolving period that matures in May 2022. As of September 30, 2017, the full $250 million was available under this facility.
Restrictive Covenants
Our $600 million revolving credit facility contains various restrictive covenants, including requirements to maintain a fixed charge coverage ratio and an asset coverage test. Certain of our other financings have the same financial covenants as the facility.
The indentures for our public debt also contain various restrictive covenants, including limitationlimitations on liens provisions that limit the amount of additional secured indebtedness that we may incur. Additionally, certain exceptions to the covenants permit us to incur an unlimited amount of purchase money and nonrecourse indebtedness.
The loan agreements for certain of our European rail subsidiaries ("GATX Rail Europe" or "GRE") also contain restrictive covenants, including leverage and cash flow covenants specific to those subsidiaries, restrictions on making loans, and limitations on the ability of those subsidiaries to repay loans or to distribute capital to certain related parties (including GATX, the US parent company). These covenants effectively limit GRE's ability to transfer funds to us.GATX.
We do not anticipate any covenant violations nor do we anticipate that any of these covenants will restrict our operations or our ability to obtain additional financing. At September 30, 2016,2017, we were in compliance with all covenants and conditions of all of our credit agreements.
Credit Ratings
The global capital market environment and outlook may affect our funding options and our financial performance. Our access to capital markets at competitive rates depends on our credit rating and ratings outlook, as determined by rating agencies. As of September 30, 2016,2017, our long-term unsecured debt was rated BBB by Standard & Poor's and Baa2 by Moody’s Investors Service and our short-term unsecured debt was rated A-2 by Standard & Poor's and P-2 by Moody’s Investors Service. Our rating outlook from both agencies was stable.
Contractual Commitments
The following table shows our contractual commitments, including debt principal amounts, lease payments, and portfolio investments at September 30, 2016 (in millions):
|
| | | | | | | | | | | | | | | | | | | | | | | | | | | |
| | Payments Due by Period |
| | Total | | 2016 (1) | | 2017 | | 2018 | | 2019 | | 2020 | | Thereafter |
| Recourse debt | $ | 4,234.4 |
| | $ | 1.4 |
| | $ | 302.8 |
| | $ | 520.2 |
| | $ | 550.0 |
| | $ | 350.0 |
| | $ | 2,510.0 |
|
| Commercial paper and credit facilities | 5.1 |
| | 5.1 |
| | — |
| | — |
| | — |
| | — |
| | — |
|
| Capital lease obligations | 16.4 |
| | 0.4 |
| | 2.8 |
| | 1.6 |
| | 11.6 |
| | — |
| | — |
|
| Operating leases | 633.1 |
| | 7.0 |
| | 90.4 |
| | 82.8 |
| | 79.7 |
| | 74.3 |
| | 298.9 |
|
| Portfolio investments (2) | 1,322.1 |
| | 148.5 |
| | 506.7 |
| | 344.8 |
| | 322.1 |
| | — |
| | — |
|
| | $ | 6,211.1 |
| | $ | 162.4 |
| | $ | 902.7 |
| | $ | 949.4 |
| | $ | 963.4 |
| | $ | 424.3 |
| | $ | 2,808.9 |
|
_________
(1) For remainder of the year.
(2) Primarily railcar purchase commitments. The amounts shown for all years are based on management's estimates of the timing, anticipated car types, and related costs of railcars to be purchased under its agreements. The amount shown for 2017 includes $14.8 million related to an option we exercised to purchase 556 railcars that are currently on lease and $24.0 million related to an option we exercised to purchase a vessel that is currently on lease.
In 2014, we entered into a long-term supply agreement with Trinity Rail Group, LLC, a subsidiary of Trinity Industries, Inc., to take effect in 2016. Under terms of the agreement, we will purchase up to 8,950 newly built railcars over a four-year period from March, 2016 through March, 2020. We may order either tank or freight cars; however, we expect that the majority of the order will be for tank cars. Except to the extent the parties otherwise agree, railcar pricing will be on an agreed upon or cost-plus basis subject to certain specified adjustments and surcharges throughout the term of the agreement. In addition, in January, 2017, either party may initiate a review of the cost-plus basis pricing if it is not reflective of then-current market prices. If the parties cannot agree on revised cost-plus pricing (or otherwise agree that no changes are necessary), either party may, at its election, deliver to the other party a notice of its intent to terminate, and in such case, the agreement will automatically terminate 30 days thereafter, unless the non-terminating party agrees to a specified revised margin as set forth in the agreement.
CRITICAL ACCOUNTING POLICIES AND ESTIMATES
There have been no changes to our critical accounting policies during the nine months ended September 30, 2016.2017. Refer to our Annual Report on Form 10-K for the year ended December 31, 2015,2016, for a summary of our policies.
NON-GAAP FINANCIAL MEASURES
In addition to financial results reported in accordance with GAAP, we compute certain financial measures using non-GAAP components, as defined by the SEC. These measures are not in accordance with, or a substitute for, GAAP and our financial measures may be different from non-GAAP financial measures used by other companies. We have provided a reconciliation of our non-GAAP components to the most directly comparable GAAP components.
Reconciliation of Non-GAAP Components usedUsed in the Computation of Certain Financial Measures
Balance Sheet Measures
We include total on- and off-balance sheet assets because a portion of our North American railcar fleet has been financed through sale-leasebacks that are accounted for as operating leases and are not recorded on the balance sheet. Similarly, ASC utilizes vessels that are accounted for as operating leases and are not recorded on the balance sheet. We include these leased-in assets in our calculation of total assets (as adjusted) because we believe it gives investors a more comprehensive representation of the magnitude of the assets we operate and that drive our financial performance. In addition, this calculation of total assets (as adjusted) provides consistency with other non-financial information we disclose about our fleet, including the number of railcars in the fleet, average number of cars on lease, and utilization. We also provide information regarding our leverage ratios, which are expressed as a ratio of debt (including off-balance sheet debt) to equity. The off-balance sheet debt amount in this calculation is the equivalent of the off-balance sheet asset amount. ReportingWe believe reporting this corresponding off-balance sheet debt amount provides investors and other users of our financial statements with a more comprehensive representation of our debt obligations, leverage, and capital structure.
The following table shows total balance sheet assets (in millions):
| | | | September 30
2015 | | December 31
2015 | | March 31
2016 | | June 30
2016 | | September 30
2016 | September 30
2016 | | December 31
2016 | | March 31
2017 | | June 30
2017 | | September 30
2017 |
| Total assets (GAAP) | $ | 6,884.9 |
| | $ | 6,894.2 |
| | $ | 7,062.0 |
| | $ | 7,090.6 |
| | $ | 7,089.3 |
| $ | 7,089.3 |
| | $ | 7,105.4 |
| | $ | 7,096.9 |
| | $ | 7,272.1 |
| | $ | 7,261.9 |
|
| Off-balance sheet assets: | | | | | | | | | | | | | | | | | | |
| Rail North America | 530.9 |
| | 488.7 |
| | 447.3 |
| | 443.3 |
| | 478.9 |
| 478.9 |
| | 456.5 |
| | 423.9 |
| | 488.1 |
| | 471.3 |
|
| ASC | 8.0 |
| | 6.8 |
| | 7.1 |
| | 5.7 |
| | 4.2 |
| 4.2 |
| | 2.6 |
| | 0.7 |
| | 0.5 |
| | 0.2 |
|
| Total off-balance sheet assets | $ | 538.9 |
| | $ | 495.5 |
| | $ | 454.4 |
| | $ | 449.0 |
| | $ | 483.1 |
| $ | 483.1 |
| | $ | 459.1 |
| | $ | 424.6 |
| | $ | 488.6 |
| | $ | 471.5 |
|
| | | | | | | | | | | | | | | | | | | |
| Total assets, as adjusted (non-GAAP) | $ | 7,423.8 |
| | $ | 7,389.7 |
| | $ | 7,516.4 |
| | $ | 7,539.6 |
| | $ | 7,572.4 |
| $ | 7,572.4 |
| | $ | 7,564.5 |
| | $ | 7,521.5 |
| | $ | 7,760.7 |
| | $ | 7,733.4 |
|
| | | | | | | | | | | | | | | | | | | |
| Shareholders’ Equity | $ | 1,269.0 |
| | $ | 1,280.2 |
| | $ | 1,305.3 |
| | $ | 1,308.5 |
| | $ | 1,371.5 |
| $ | 1,371.5 |
| | $ | 1,347.2 |
| | $ | 1,385.2 |
| | $ | 1,443.0 |
| | $ | 1,470.2 |
|
The following table shows the components of recourse leverage (in millions, except recourse leverage ratio):
| | | | September 30
2015 | | December 31
2015 | | March 31
2016 | | June 30
2016 | | September 30
2016 | September 30
2016 | | December 31
2016 | | March 31
2017 | | June 30
2017 | | September 30
2017 |
| Debt, net of unrestricted cash: | | | | | | | | | | | | | | | | | | |
| Unrestricted cash | $ | (116.0 | ) | | $ | (202.4 | ) | | $ | (216.2 | ) | | $ | (177.6 | ) | | $ | (211.5 | ) | $ | (211.5 | ) | | $ | (307.5 | ) | | $ | (155.2 | ) | | $ | (284.3 | ) | | $ | (199.2 | ) |
| Commercial paper and bank credit facilities | 18.1 |
| | 7.4 |
| | 17.9 |
| | 28.5 |
| | 5.1 |
| 5.1 |
| | 3.8 |
| | 3.0 |
| | 15.7 |
| | 15.7 |
|
| Recourse debt | 4,251.4 |
| | 4,171.5 |
| | 4,304.3 |
| | 4,298.8 |
| | 4,204.4 |
| 4,204.4 |
| | 4,253.2 |
| | 4,250.9 |
| | 4,261.2 |
| | 4,266.7 |
|
| Nonrecourse debt | 9.2 |
| | 6.9 |
| | 4.7 |
| | 2.3 |
| | — |
| |
| Capital lease obligations | 3.6 |
| | 18.4 |
| | 16.9 |
| | 16.6 |
| | 15.1 |
| 15.1 |
| | 14.9 |
| | 13.5 |
| | 13.1 |
| | 12.8 |
|
| Total debt, net of unrestricted cash (GAAP) | 4,166.3 |
| | 4,001.8 |
| | 4,127.6 |
| | 4,168.6 |
| | 4,013.1 |
| 4,013.1 |
| | 3,964.4 |
| | 4,112.2 |
| | 4,005.7 |
| | 4,096.0 |
|
| Off-balance sheet recourse debt | 493.5 |
| | 495.5 |
| | 454.4 |
| | 449.0 |
| | 483.1 |
| 483.1 |
| | 459.1 |
| | 424.6 |
| | 488.6 |
| | 471.5 |
|
| Off-balance sheet nonrecourse debt | 45.4 |
| | — |
| | — |
| | — |
| | — |
| |
| Total debt, net of unrestricted cash, as adjusted (non-GAAP) | $ | 4,705.2 |
| | $ | 4,497.3 |
| | $ | 4,582.0 |
| | $ | 4,617.6 |
| | $ | 4,496.2 |
| $ | 4,496.2 |
| | $ | 4,423.5 |
| | $ | 4,536.8 |
| | $ | 4,494.3 |
| | $ | 4,567.5 |
|
| | �� | | | | | | | | | | | | | | | | | |
| Total recourse debt (1) | $ | 4,650.6 |
| | $ | 4,490.4 |
| | $ | 4,577.3 |
| | $ | 4,615.3 |
| | $ | 4,496.2 |
| $ | 4,496.2 |
| | $ | 4,423.5 |
| | $ | 4,536.8 |
| | $ | 4,494.3 |
| | $ | 4,567.5 |
|
| Shareholders' Equity | $ | 1,269.0 |
| | $ | 1,280.2 |
| | $ | 1,305.3 |
| | $ | 1,308.5 |
| | $ | 1,371.5 |
| $ | 1,371.5 |
| | $ | 1,347.2 |
| | $ | 1,385.2 |
| | $ | 1,443.0 |
| | $ | 1,470.2 |
|
| Recourse Leverage (2) | 3.7 |
| | 3.5 |
| | 3.5 |
| | 3.5 |
| | 3.3 |
| 3.3 |
| | 3.3 |
| | 3.3 |
| | 3.1 |
| | 3.1 |
|
________
| |
| (1) | Includes on- and off-balance sheet recourse debt, capital lease obligations, and commercial paper and bank credit facilities, net of restrictedunrestricted cash. |
| |
| (2) | Calculated as total recourse debt / shareholder's equity. |
Net Income Measures
We exclude the effects of certain tax adjustments and other items for purposes of presenting net income, diluted earnings per share, and return on equity, because we believe these items are not attributable to our business operations. Management utilizes this informationnet income, excluding tax adjustments and other items, when analyzing financial performance because such amounts reflect the underlying operating results that are within management’s ability to influence. Accordingly, we believe presenting this information provides investors and other users of our financial statements with meaningful supplemental information for purposes of analyzing year-to-year financial performance on a comparable basis and assessing trends.
The following tables show our net income and diluted earnings per share, and return on equity, excluding tax adjustments and other items (in millions, except per share data):
Impact of Tax Adjustments and Other Items on Net Income:
| | | | Three Months Ended
September 30 | | Nine Months Ended
September 30 | Three Months Ended
September 30 | | Nine Months Ended
September 30 |
| | 2016 | | 2015 | | 2016 | | 2015 | 2017 | | 2016 | | 2017 | | 2016 |
| Net income (GAAP) | $ | 95.7 |
| | $ | 39.5 |
| | $ | 226.2 |
| | $ | 147.1 |
| $ | 49.0 |
| | $ | 95.7 |
| | $ | 159.9 |
| | $ | 226.2 |
|
| | | | | | | | | | | | | | | |
| Adjustments attributable to consolidated income, pretax: | | | | | | | | |
| Adjustments attributable to consolidated pre-tax income: | | | | | | | | |
| Net loss (gain) on wholly owned Portfolio Management marine investments (1) | 0.3 |
| | 23.5 |
| | (2.4 | ) | | 23.5 |
| — |
| | 0.3 |
| | (1.8 | ) | | (2.4 | ) |
| Total adjustments attributable to consolidated income, pretax | $ | 0.3 |
| | $ | 23.5 |
| | $ | (2.4 | ) | | $ | 23.5 |
| |
| Income taxes, thereon based on applicable effective tax rate | $ | (0.1 | ) | | $ | (8.8 | ) | | $ | 0.9 |
| | $ | (8.8 | ) | |
| Residual sharing settlement at Portfolio Management (3) | | — |
| | (49.1 | ) | | — |
| | (49.1 | ) |
| Total adjustments attributable to consolidated pre-tax income | | $ | — |
| | $ | (48.8 | ) | | $ | (1.8 | ) | | $ | (51.5 | ) |
| Income taxes thereon, based on applicable effective tax rate | | $ | — |
| | $ | 18.7 |
| | $ | 0.7 |
| | $ | 19.7 |
|
| | | | | | | | | | | | | | | |
| Adjustments attributable to affiliates' earnings, net of taxes: | | | | | | | | | | | | | | |
| Net (gain) loss on Portfolio Management marine affiliate (1) | (0.6 | ) | | 11.9 |
| | (0.6 | ) | | 11.9 |
| |
| Income tax rate change (2) | (3.9 | ) | | — |
| | (3.9 | ) | | — |
| |
| Net gain on Portfolio Management marine affiliate (1) | | — |
| | (0.6 | ) | | — |
| | (0.6 | ) |
| Income tax rate change (6) | | — |
| | (3.9 | ) | | — |
| | (3.9 | ) |
| Total adjustments attributable to affiliates' earnings, net of taxes | $ | (4.5 | ) | | $ | 11.9 |
| | $ | (4.5 | ) | | $ | 11.9 |
| $ | — |
| | $ | (4.5 | ) | | $ | — |
| | $ | (4.5 | ) |
| | | | | | | | | | | | | | | |
| Net income, excluding tax adjustments and other items (non-GAAP) | $ | 91.4 |
| | $ | 66.1 |
| | $ | 220.2 |
| | $ | 173.7 |
| $ | 49.0 |
| | $ | 61.1 |
| | $ | 158.8 |
| | $ | 189.9 |
|
________
Impact of Tax Adjustments and Other Items on Diluted Earnings per Share:
|
| | | | | | | | | | | | | | | |
| | Three Months Ended
September 30 | | Nine Months Ended
September 30 |
| | 2017 | | 2016 | | 2017 | | 2016 |
| Diluted earnings per share (GAAP) | $ | 1.25 |
| | $ | 2.36 |
| | $ | 4.04 |
| | $ | 5.49 |
|
| Adjustments attributable to consolidated income, net of taxes: | | | | | | | |
| Net gain on wholly owned Portfolio Management marine investments (1) | — |
| | — |
| | (0.03 | ) | | (0.04 | ) |
| Residual sharing settlement at Portfolio Management (3) | — |
| | (0.75 | ) | | — |
| | (0.74 | ) |
| Adjustments attributable to affiliates' earnings, net of taxes: | | | | | | | |
| Net gain on Portfolio Management marine affiliate | — |
| | (0.02 | ) | | — |
| | (0.01 | ) |
| Income tax rate change | — |
| | (0.10 | ) | | — |
| | (0.10 | ) |
| Diluted earnings per share, excluding tax adjustments and other items (non-GAAP)* | $ | 1.25 |
| | $ | 1.50 |
| | $ | 4.01 |
| | $ | 4.61 |
|
_______
(*) Sum of individual components may not be additive due to rounding.
The following table shows our net income and return on equity, excluding tax adjustments and other items, for the trailing twelve months ended September 30 (in millions):
|
| | | | | | | |
| | 2017 | | 2016 |
| Net income (GAAP) | $ | 190.8 |
| | $ | 284.4 |
|
| Adjustments attributable to consolidated pre-tax income: | | | |
| Net loss (gain) on wholly owned Portfolio Management marine investments (1) | 3.1 |
| | (16.7 | ) |
| Railcar impairment at Rail North America (2) | 29.8 |
| | — |
|
| Residual sharing settlement at Portfolio Management (3) | — |
| | (49.1 | ) |
| Early retirement program (4) | — |
| | 9.0 |
|
| Total adjustments attributable to consolidated pre-tax income | $ | 32.9 |
| | $ | (56.8 | ) |
| Income taxes thereon, based on applicable effective tax rate | $ | (11.8 | ) | | $ | 21.6 |
|
| | | | |
| Other income tax adjustments attributable to consolidated income: | | | |
| Foreign tax credit utilization (5) | (7.1 | ) | | — |
|
| Income tax rate changes (6) | — |
| | 14.1 |
|
| Total other income tax adjustments attributable to consolidated income | $ | (7.1 | ) | | $ | 14.1 |
|
| | | | |
| Adjustments attributable to affiliates' earnings, net of taxes: | | | |
| Net gain on Portfolio Management marine affiliate (1) | — |
| | (0.6 | ) |
| Income tax rate changes (7) | — |
| | (11.6 | ) |
| Total adjustments attributable to affiliates' earnings, net of taxes | $ | — |
| | $ | (12.2 | ) |
| Net income, excluding tax adjustments and other items (non-GAAP) | $ | 204.8 |
| | $ | 251.1 |
|
| Return on Equity (GAAP) | 13.4 | % | | 21.5 | % |
| Return on Equity, excluding tax adjustments and other items (non-GAAP) | 14.4 | % | | 19.0 | % |
_______
| |
| (1) | In 2015, we made the decision to exit the majority of our non-core, marine investments within our Portfolio Management segment. As a result, we recorded losses and gains associated with the impairments and sales of certain investments. |
| |
| (2) | Deferred income tax adjustment due to an enacted statutory rate decreaseImpairment losses in the United Kingdom in the thirdfourth quarter of 2016. |
Impact of Tax Adjustments and Other Items on Diluted Earnings per Share:
|
| | | | | | | | | | | | | | | |
| | Three Months Ended
September 30 | | Nine Months Ended
September 30 |
| | 2016 | | 2015 | | 2016 | | 2015 |
| Diluted earnings per share (GAAP) | $ | 2.36 |
| | $ | 0.91 |
| | $ | 5.49 |
| | $ | 3.33 |
|
| Adjustments attributable to consolidated income, net of taxes: | | | | | | | |
| Net loss (gain) on wholly owned Portfolio Management marine investments | — |
| | 0.34 |
| | (0.04 | ) | | 0.34 |
|
| Adjustments attributable to affiliates' earnings, net of taxes: | | | | | | | |
| Net (gain) loss on Portfolio Management marine affiliate | (0.02 | ) | | 0.27 |
| | (0.01 | ) | | 0.27 |
|
| Income tax rate change | (0.10 | ) | | — |
| | (0.10 | ) | | — |
|
| Diluted earnings per share, excluding tax adjustments and other items (non-GAAP)* | $ | 2.25 |
| | $ | 1.52 |
| | $ | 5.35 |
| | $ | 3.94 |
|
________
(*) Sum of individual components may not be additive due to rounding.
Impact of Tax Adjustments and Other Items on Return on Equity:
|
| | | | | | | | | | | |
| | Three Months Ended
September 30 | | Nine Months Ended
September 30 |
| | 2016 | | 2015 | | 2016 | | 2015 |
| Return on Equity (GAAP) | 7.1 | % | | 3.1 | % | | 17.1 | % | | 11.4 | % |
| Return on Equity, excluding tax adjustments and other items (non-GAAP) | 6.8 | % | | 5.2 | % | | 16.6 | % | | 13.4 | % |
The following table show our net income and return on equity, excluding tax adjustments and other items for the trailing twelve months ended September 30 (in millions):
|
| | | | | | | |
| | 2016 | | 2015 |
| Net income (GAAP) | $ | 284.4 |
| | $ | 205.6 |
|
| Adjustments attributable to consolidated income, pretax: | | | |
| Net (gain) loss on wholly owned Portfolio Management marine investments (1) | (16.7 | ) | | 23.5 |
|
| Early retirement program (2) | 9.0 |
| | — |
|
| Total adjustments attributable to consolidated income, pretax | $ | (7.7 | ) | | $ | 23.5 |
|
| Income taxes, thereon based on applicable effective tax rate | $ | 2.8 |
| | $ | (8.8 | ) |
| | | | |
| Other income tax adjustments attributable to consolidated income: | | | |
| Income tax rate changes (3) | 14.1 |
| | — |
|
| Total other income tax adjustments attributable to consolidated income | $ | 14.1 |
| | $ | — |
|
| | | | |
| Adjustments attributable to affiliates' earnings, net of taxes: | | | |
| Net (gain) loss on Portfolio Management marine affiliate (1)(4) | (0.6 | ) | | 11.9 |
|
| Income tax rate changes (5) | (11.6 | ) | | — |
|
| Total adjustments attributable to affiliates' earnings, net of taxes | $ | (12.2 | ) | | $ | 11.9 |
|
| | | | |
| Net income, excluding tax adjustments and other items (non-GAAP) | $ | 281.4 |
| | $ | 232.2 |
|
________
| |
(1) | In 2015,2016 related specifically to certain railcars in flammable service that we made the decision to exit the majority of our non-core, marine investments within our Portfolio Management segment. As a result, we recorded lossesbelieve were permanently and gains associated with the impairments and sales of certain investments.negatively impacted by regulatory changes. |
| |
(2)(3) | Income in the third quarter of 2016 as a result of the settlement of a residual sharing agreement. |
| |
| (4) | Expenses in the fourth quarter of 2015 associated with an early retirement program offered to certain eligible employees. |
| |
(3)(5) | Tax benefits in the fourth quarter of 2016 attributable to the utilization of foreign tax credit carryforwards. |
| |
| (6) | Deferred income tax adjustmentadjustments in the fourth quarter of 2015 attributable to an increase of our effective state income tax rate. |
| |
(4) | Pre-tax loss of $19.0 million, net of a tax benefit of $7.1 million, based on the affiliate's effective tax rate in 2015. |
| |
(5)(7) | Deferred income tax adjustments in the third quarter of 2016 and the fourth quarter of 2015 due to enacted statutory rate decreases in the United Kingdom. |
|
| | | | | |
| | 2016 | | 2015 |
| Return on Equity (GAAP) | 21.5 | % | | 15.8 | % |
| Return on Equity, excluding tax adjustments and other items (non-GAAP) | 21.3 | % | | 17.9 | % |
Item 3.Quantitative and Qualitative Disclosures aboutAbout Market Risk
Since December 31, 2015,2016, there have been no material changes in our interest rate and foreign currency exposures or types of derivative instruments used to hedge these exposures. For a discussion of our exposure to market risk, refer to "Item 7A. Quantitative and Qualitative Disclosure about Market Risk" of our Annual Report on Form 10-K for the year ended December 31, 2015.2016.
Item 4. Controls and Procedures
We haveOur management, with the participation of our Chief Executive Officer and Chief Financial Officer, has conducted an evaluation of our disclosure controls and procedures (as defined in Rules 13a-15(e) and 15d-15(e) of the Securities Exchange Act of 1934 (the “Exchange Act”)), with the participation of our Chief Executive Officer and Chief Financial Officer.. Based on such evaluation, our Chief Executive Officer and Chief Financial Officer have concluded that, as of the end of the period covered by this quarterly report, our disclosure controls and procedures were effective.
No change in our internal control over financial reporting (as defined in Exchange Act Rules 13a-15(f) and 15d-15(f)) occurred during the quarter ended September 30, 2016,2017, that materially affected, or is reasonably likely to materially affect, our internal control over financial reporting.
PART II - OTHER INFORMATION
Item 1. Legal Proceedings
Information concerning litigation and other contingencies is described in "Note 12. 11. Legal Proceedings and Other Contingencies"Contingencies" in Part I, Item 1 of this Form 10-Q and is incorporated herein by reference.
Item 1A. Risk Factors
Since December 31, 2015,2016, there have been no material changes in our risk factors. For a discussion of our risk factors, refer to "Item 1A. Risk Factors" of our Annual Report on Form 10-K for the year ended December 31, 2015.2016.
Item 2.Unregistered Sales of Equity Securities and Use of Proceeds
(c) On January 29, 2016, our board of directors authorized a $300 million share repurchase program. As of September 30, 2017, $105.0 million remained available under the repurchase authorization.
The following is a summary of common stock repurchases completed by month forduring the third quarter ended September 30, 2016. As of September 30, 2016, $205.0 million remains available under the repurchase authorization.2017:
|
| | | | | | | | | | |
| Issuer Purchases of Equity Securities |
| | | (a) | | (b) | | (c) | | (d) |
| Total | | Total Number of Shares Purchased | | Average Price Paid per Share | | Total Number of Shares Purchased as Part of Publicly Announced Plans or Programs | | Maximum Number (or Approximate Dollar Value) of Shares that May Yet Be Purchased Under the Plans or Programs (1) |
| July 2016 | | 178,000 |
| | $44.17 | | 178,000 |
| | $222.1 million |
| August 2016 | | 385,731 |
| | $44.43 | | 385,731 |
| | $205.0 million |
| Total | | 563,731 |
| | $44.35 | | 563,731 |
| | |
_________
(1) Does not include commissions paid to repurchase shares. |
| | | | | | | | | | | | | | |
| Issuer Purchases of Equity Securities |
| | | (a) | | (b) | | (c) | | (d) |
| Period | | Total Number of Shares Purchased | | Average Price Paid per Share | | Total Number of Shares Purchased as Part of Publicly Announced Plans or Programs | | Maximum Number (or Approximate Dollar Value) of Shares that May Yet Be Purchased Under the Plans or Programs (in millions) |
| August 1, 2017 - August 31, 2017 | | 155,596 |
| | $ | 61.76 |
| | 155,596 |
| | $ | 120.4 |
|
| September 1, 2017 - September 30, 2017 | | 259,146 |
| | $ | 59.39 |
| | 259,146 |
| | $ | 105.0 |
|
| Total | | 414,742 |
| | $ | 60.28 |
| | 414,742 |
| | |
|
Item 6. Exhibits
Exhibits:
Reference is made to the exhibit index which is included herewith and is incorporated by reference hereto.
|
| | |
Exhibit Number | | Exhibit Description |
| | |
| | Filed with this Report: |
| | |
| 31A. | | |
| | |
| 31B. | | |
| | |
| 32. | | |
| | |
| 101. | | The following materials from GATX Corporation’s Quarterly Report on Form 10-Q for the quarter ended September 30, 2017, formatted in XBRL (eXtensible Business Reporting Language): (i) Consolidated Balance Sheets at September 30, 2017 and December 31, 2016, (ii) Consolidated Statements of Comprehensive Income for the three months and nine months ended September 30, 2017 and 2016, (iii) Consolidated Statements of Cash Flows for the three months and nine months ended September 30, 2017 and 2016, and (iv) Notes to the Consolidated Financial Statements. |
| | |
| | |
SIGNATURE
Pursuant to the requirements of the Securities Exchange Act of 1934, the registrant has duly caused this report to be signed on its behalf by the undersigned thereunto duly authorized.
|
|
GATX CORPORATION (Registrant) |
| |
| /s/ Robert C. Lyons |
| Robert C. Lyons |
| Executive Vice President and Chief Financial Officer |
| (Duly Authorized Officer) |
Date: October 31, 201627, 2017
EXHIBIT INDEX
|
| | |
Exhibit
Number
| | Exhibit Description |
| | |
| | Filed with this Report:
|
| | |
31A. | | Certification Pursuant to Exchange Act Rule 13a-14(a) and Rule 15d-14(a) (CEO Certification). |
| | |
31B. | | Certification Pursuant to Exchange Act Rule 13a-14(a) and Rule 15d-14(a) (CFO Certification). |
| | |
32. | | Certification Pursuant to 18 U.S.C. Section 1350 (CEO and CFO Certification). |
| | |
101. | | The following materials from GATX Corporation’s Quarterly Report on Form 10-Q for the quarter ended September 30, 2016, formatted in XBRL (eXtensible Business Reporting Language): (i) Consolidated Balance Sheets at September 30, 2016 and December 31, 2015, (ii) Consolidated Statements of Comprehensive Income for the three and nine months ended September 30, 2016 and 2015, (iii) Consolidated Statements of Cash Flows for the nine months ended September 30, 2016 and 2015, and (iv) Notes to the Consolidated Financial Statements. |