UNITED STATES
SECURITIES AND EXCHANGE COMMISSION
Washington, D.C. 20549
__________________________________________
FORM 10-Q
__________________________________________
|
| |
| ☒ | QUARTERLY REPORT PURSUANT TO SECTION 13 OR 15(d) OF THE SECURITIES EXCHANGE ACT OF 1934 |
For the quarterly period ended JuneSeptember 30, 2019
or
|
| |
| ☐ | TRANSITION REPORT PURSUANT TO SECTION 13 OR 15(d) OF THE SECURITIES EXCHANGE ACT OF 1934 |
Commission File Number: 1-2328
GATX Corporation
(Exact name of registrant as specified in its charter)
|
| |
| New York | 36-1124040 |
| (State of incorporation) | (I.R.S. Employer Identification No.) |
233 South Wacker Drive
Chicago, Illinois 60606-7147
(Address of principal executive offices, including zip code)
(312) 621-6200
(Registrant's telephone number, including area code)
Securities registered pursuant to Section 12(b) of the Act:
|
| | |
| Title of each class | Trading Symbol(s) | Name of Each Exchange on Which Registered |
| Common Stock | GATX | New York Stock Exchange |
| | | Chicago Stock Exchange |
| 5.625% Senior Notes due 2066 | GMTA | New York Stock Exchange |
Indicate by check mark whether the registrant (1) has filed all reports required to be filed by Section 13 or 15(d) of the Securities Exchange Act of 1934 during the preceding 12 months (or for such shorter period that the registrant was required to file such reports), and (2) has been subject to such filing requirements for the past 90 days. Yes ☒ No ☐
Indicate by check mark whether the registrant has submitted electronically every Interactive Data File required to be submitted pursuant to Rule 405 of Regulation S-T (§232.405 of this chapter) during the preceding 12 months (or for such shorter period that the registrant was required to submit such files). Yes ☒ No ☐
Indicate by check mark whether the registrant is a large accelerated filer, an accelerated filer, a non-accelerated filer, a smaller reporting company, or an emerging growth company. See the definitions of "large accelerated filer," "accelerated filer," "smaller reporting company," and "emerging growth company" in Rule 12b-2 of the Exchange Act.
|
| | | | | |
| | ☒ | Large accelerated filer | | ☐ | Smaller reporting company |
| | ☐ | Non-accelerated filer | | ☐ | Emerging growth company |
| | ☐ | Accelerated filer | | | |
If an emerging growth company, indicate by check mark if the registrant has elected not to use the extended transition period for complying with any new or revised financial accounting standards provided pursuant to Section 13(a) of the Exchange Act. ☐
Indicate by check mark whether the registrant is a shell company (as defined in Rule 12b-2 of the Exchange Act). Yes ☐ No ☒
There were 35.735.1 million common shares outstanding at JuneSeptember 30, 2019.
GATX CORPORATION
FORM 10-Q
QUARTERLY REPORT FOR THE PERIOD ENDED JUNESEPTEMBER 30, 2019
INDEX
|
| | |
| Item No. | | Page No. |
| | | |
| | | |
| Part I - FINANCIAL INFORMATION |
| Item 1 | | |
| | | |
| | | |
| | | |
| | | |
| | | |
| | | |
| | | |
| | | |
| | | |
| | | |
| | | |
| | | |
| | | |
| | | |
| | | |
| | | |
| | | |
| | | |
| | | |
| | | |
| Item 2 | | |
| | | |
| | | |
| | | |
| | | |
| | | |
| | | |
| Item 3 | | |
| Item 4 | | |
| | | |
| Part II - OTHER INFORMATION |
| Item 1 | | |
| Item 1A | | |
| Item 2 | | |
| Item 5 | | |
| Item 6 | | |
| |
| | |
FORWARD-LOOKING STATEMENTS
Statements in this report not based on historical facts are "forward-looking statements" within the meaning of the Private Securities Litigation Reform Act of 1995 and, accordingly, involve known and unknown risks and uncertainties that are difficult to predict and could cause our actual results, performance, or achievements to differ materially from those discussed. These include statements as to our future expectations, beliefs, plans, strategies, objectives, events, conditions, financial performance, prospects, or future events. In some cases, forward-looking statements can be identified by the use of words such as "may," "could," "expect," "intend," "plan," "seek," "anticipate," "believe," "estimate," "predict," "potential," "outlook," "continue," "likely," "will," "would", and similar words and phrases. Forward-looking statements are necessarily based on estimates and assumptions that, while considered reasonable by us and our management, are inherently uncertain. Accordingly, you should not place undue reliance on forward-looking statements, which speak only as of the date they are made, and are not guarantees of future performance. We do not undertake any obligation to publicly update or revise these forward-looking statements.
A detailed discussion of the known material risks and uncertainties that could cause actual results and events to differ materially from such forward-looking statements is included in our Annual Report on Form 10-K for the year ended December 31, 2018, and in our other filings with the Securities and Exchange Commission ("SEC"). The following factors, in addition to those discussed under "Risk Factors", in our Annual Report on Form 10-K for the year ended December 31, 2018, could cause actual results to differ materially from our current expectations expressed in forward looking statements:
|
| | |
• exposure to damages, fines, criminal and civil penalties, and reputational harm arising from a negative outcome in litigation, including claims arising from an accident involving our railcars• inability to maintain our assets on lease at satisfactory rates due to oversupply of railcars in the market or other changes in supply and demand• a significant decline in customer demand for our railcars or other assets or services, including as a result of:◦ weak macroeconomic conditions◦ weak market conditions in our customers' businesses◦ declines in harvest or production volumes◦ adverse changes in the price of, or demand for, commodities◦ changes in railroad operations or efficiency◦ changes in supply chains◦ availability of pipelines, trucks, and other alternative modes of transportation◦ other operational or commercial needs or decisions of our customers• higher costs associated with increased railcar assignments following non-renewal of leases, customer defaults, and compliance maintenance programs or other maintenance initiatives• events having an adverse impact on assets, customers, or regions where we have a concentrated investment exposure• financial and operational risks associated with long-term railcar purchase commitments, including increased costs due to tariffs or trade disputes• reduced opportunities to generate asset remarketing income | | • operational and financial risks related to our affiliate investments, including the Rolls-Royce & Partners Finance joint ventures (collectively the "RRPF affiliates")• fluctuations in foreign exchange rates• failure to successfully negotiate collective bargaining agreements with the unions representing a substantial portion of our employees• asset impairment charges we may be required to recognize• deterioration of conditions in the capital markets, reductions in our credit ratings, or increases in our financing costs• uncertainty relating to the LIBOR calculation process and potential phasing out of LIBOR after 2021• competitive factors in our primary markets, including competitors with a significantly lower cost of capital than GATX• risks related to our international operations and expansion into new geographic markets, including the imposition of new or additional tariffs, quotas, or trade barriers• changes in, or failure to comply with, laws, rules, and regulations• inability to obtain cost-effective insurance• environmental remediation costs• inadequate allowances to cover credit losses in our portfolio• inability to maintain and secure our information technology infrastructure from cybersecurity threats and related disruption of our business |
PART I - FINANCIAL INFORMATION
Item 1. Financial Statements
GATX CORPORATION AND SUBSIDIARIES
CONSOLIDATED BALANCE SHEETS (Unaudited)
(In millions, except share data)
| | | | June 30 | | December 31 | September 30 | | December 31 |
| | 2019 | | 2018 | 2019 | | 2018 |
| Assets | | | | | | |
Cash and Cash Equivalents | $ | 286.6 |
| | $ | 100.2 |
| $ | 48.6 |
| | $ | 100.2 |
|
Restricted Cash | 0.3 |
| | 6.5 |
| — |
| | 6.5 |
|
| Receivables | | | | | | |
| Rent and other receivables | 97.8 |
| | 87.0 |
| 93.1 |
| | 87.0 |
|
| Finance leases (as lessor) | 95.3 |
| | 126.4 |
| 93.3 |
| | 126.4 |
|
| Less: allowance for losses | (6.0 | ) | | (6.4 | ) | (6.0 | ) | | (6.4 | ) |
| | 187.1 |
| | 207.0 |
| 180.4 |
| | 207.0 |
|
| | | | | | | |
| Operating Assets and Facilities | 9,728.9 |
| | 9,545.9 |
| 9,759.8 |
| | 9,545.9 |
|
| Less: allowance for depreciation | (3,122.6 | ) | | (3,013.2 | ) | (3,152.1 | ) | | (3,013.2 | ) |
| | 6,606.3 |
| | 6,532.7 |
| 6,607.7 |
| | 6,532.7 |
|
| Lease Assets (as lessee) | | | | | | |
| Right-of-use assets, net of accumulated depreciation | 440.6 |
| | — |
| 430.1 |
| | — |
|
| Finance leases, net of accumulated depreciation | 16.5 |
| | 16.8 |
| — |
| | 16.8 |
|
| | 457.1 |
| | 16.8 |
| 430.1 |
| | 16.8 |
|
| | | | | | | |
Investments in Affiliated Companies | 495.8 |
| | 464.5 |
| 506.7 |
| | 464.5 |
|
Goodwill | 82.4 |
| | 82.9 |
| 79.9 |
| | 82.9 |
|
Other Assets | 237.5 |
| | 206.1 |
| 237.5 |
| | 206.1 |
|
Total Assets | $ | 8,353.1 |
| | $ | 7,616.7 |
| $ | 8,090.9 |
| | $ | 7,616.7 |
|
| | | | | | | |
| Liabilities and Shareholders’ Equity | | | | | | |
Accounts Payable and Accrued Expenses | $ | 152.8 |
| | $ | 177.5 |
| $ | 138.4 |
| | $ | 177.5 |
|
| Debt | | | | | | |
| Commercial paper and borrowings under bank credit facilities | 26.0 |
| | 110.8 |
| 112.0 |
| | 110.8 |
|
| Recourse | 4,832.5 |
| | 4,429.7 |
| 4,580.2 |
| | 4,429.7 |
|
| | 4,858.5 |
| | 4,540.5 |
| 4,692.2 |
| | 4,540.5 |
|
| Lease Obligations (as lessee) | | | | | | |
| Operating leases | 454.5 |
| | — |
| 440.3 |
| | — |
|
| Finance leases | 10.6 |
| | 11.3 |
| — |
| | 11.3 |
|
| | 465.1 |
| | 11.3 |
| 440.3 |
| | 11.3 |
|
| | | | | | | |
Deferred Income Taxes | 908.4 |
| | 877.8 |
| 910.5 |
| | 877.8 |
|
Other Liabilities | 133.5 |
| | 221.5 |
| 123.0 |
| | 221.5 |
|
Total Liabilities | 6,518.3 |
| | 5,828.6 |
| 6,304.4 |
| | 5,828.6 |
|
| Shareholders’ Equity | | | | | | |
Common stock, $0.625 par value: Authorized shares — 120,000,000 Issued shares — 67,476,417 and 67,329,081 Outstanding shares — 35,665,345 and 36,612,227 | 41.8 |
| | 41.6 |
| |
Common stock, $0.625 par value: Authorized shares — 120,000,000 Issued shares — 67,516,141 and 67,329,081 Outstanding shares — 35,089,622 and 36,612,227 | | 41.8 |
| | 41.6 |
|
| Additional paid in capital | 713.0 |
| | 706.4 |
| 716.6 |
| | 706.4 |
|
| Retained earnings | 2,533.5 |
| | 2,419.2 |
| 2,561.5 |
| | 2,419.2 |
|
| Accumulated other comprehensive loss | (155.8 | ) | | (164.6 | ) | (189.0 | ) | | (164.6 | ) |
| Treasury stock at cost (31,811,072 and 30,716,854 shares) | (1,297.7 | ) | | (1,214.5 | ) | |
| Treasury stock at cost (32,426,519 and 30,716,854 shares) | | (1,344.4 | ) | | (1,214.5 | ) |
Total Shareholders’ Equity | 1,834.8 |
| | 1,788.1 |
| 1,786.5 |
| | 1,788.1 |
|
| Total Liabilities and Shareholders’ Equity | $ | 8,353.1 |
| | $ | 7,616.7 |
| $ | 8,090.9 |
| | $ | 7,616.7 |
|
See accompanying notes to consolidated financial statements.
GATX CORPORATION AND SUBSIDIARIES
CONSOLIDATED STATEMENTS OF COMPREHENSIVE INCOME (Unaudited)
(In millions, except per share data)
| | | | Three Months Ended
June 30 | | Six Months Ended
June 30 | Three Months Ended
September 30 | | Nine Months Ended
September 30 |
| | 2019 | | 2018 | | 2019 | | 2018 | 2019 | | 2018 | | 2019 | | 2018 |
| Revenues | | | | | | | | | | | | | | |
| Lease revenue | $ | 274.0 |
| | $ | 271.0 |
| | $ | 548.4 |
| | $ | 544.2 |
| $ | 271.5 |
| | $ | 271.9 |
| | $ | 819.9 |
| | $ | 816.1 |
|
| Marine operating revenue | 60.9 |
| | 55.8 |
| | 74.0 |
| | 70.0 |
| 62.8 |
| | 60.8 |
| | 136.8 |
| | 130.8 |
|
| Other revenue | 24.5 |
| | 22.7 |
| | 54.0 |
| | 40.6 |
| 26.4 |
| | 17.0 |
| | 80.4 |
| | 57.6 |
|
| Total Revenues | 359.4 |
| | 349.5 |
| | 676.4 |
| | 654.8 |
| 360.7 |
| | 349.7 |
| | 1,037.1 |
| | 1,004.5 |
|
| Expenses | | | | | | | | | | | | | | |
| Maintenance expense | 85.7 |
| | 82.0 |
| | 166.9 |
| | 163.2 |
| 84.4 |
| | 77.5 |
| | 251.3 |
| | 240.7 |
|
| Marine operating expense | 41.0 |
| | 37.6 |
| | 53.1 |
| | 50.1 |
| 39.7 |
| | 39.4 |
| | 92.8 |
| | 89.5 |
|
| Depreciation expense | 83.8 |
| | 81.1 |
| | 163.7 |
| | 158.5 |
| 83.6 |
| | 81.6 |
| | 247.3 |
| | 240.1 |
|
| Operating lease expense | 13.7 |
| | 12.7 |
| | 27.4 |
| | 25.7 |
| 13.7 |
| | 11.8 |
| | 41.1 |
| | 37.5 |
|
| Other operating expense | 7.8 |
| | 9.1 |
| | 15.8 |
| | 17.7 |
| 7.7 |
| | 8.5 |
| | 23.5 |
| | 26.2 |
|
| Selling, general and administrative expense | 45.1 |
| | 46.2 |
| | 91.2 |
| | 91.1 |
| 44.4 |
| | 46.5 |
| | 135.6 |
| | 137.6 |
|
| Total Expenses | 277.1 |
| | 268.7 |
| | 518.1 |
| | 506.3 |
| 273.5 |
| | 265.3 |
| | 791.6 |
| | 771.6 |
|
| Other Income (Expense) | | | | | | | | | | | | | | |
| Net gain on asset dispositions | 32.9 |
| | 6.1 |
| | 41.8 |
| | 62.2 |
| 5.1 |
| | 10.3 |
| | 46.9 |
| | 72.5 |
|
| Interest expense, net | (47.1 | ) | | (42.2 | ) | | (93.6 | ) | | (82.1 | ) | (46.3 | ) | | (42.6 | ) | | (139.9 | ) | | (124.7 | ) |
| Other expense | (0.6 | ) | | (9.8 | ) | | (3.8 | ) | | (11.1 | ) | (1.8 | ) | | (3.8 | ) | | (5.6 | ) | | (14.9 | ) |
Income before Income Taxes and Share of Affiliates’ Earnings | 67.5 |
| | 34.9 |
| | 102.7 |
| | 117.5 |
| 44.2 |
| | 48.3 |
| | 146.9 |
| | 165.8 |
|
| Income taxes | (15.6 | ) | | (9.1 | ) | | (24.0 | ) | | (29.7 | ) | (11.9 | ) | | (13.1 | ) | | (35.9 | ) | | (42.8 | ) |
| Share of affiliates’ earnings, net of taxes | 16.1 |
| | 13.0 |
| | 30.8 |
| | 27.3 |
| 12.8 |
| | 11.8 |
| | 43.6 |
| | 39.1 |
|
Net Income | $ | 68.0 |
| | $ | 38.8 |
| | $ | 109.5 |
| | $ | 115.1 |
| $ | 45.1 |
| | $ | 47.0 |
| | $ | 154.6 |
| | $ | 162.1 |
|
| Other Comprehensive Income (Loss), Net of Taxes | | | | | | | | | | | | | | |
| Foreign currency translation adjustments | 11.7 |
| | (50.4 | ) | | 1.2 |
| | (35.5 | ) | (33.6 | ) | | (4.7 | ) | | (32.4 | ) | | (40.2 | ) |
| Unrealized gain on derivative instruments | 1.1 |
| | 2.2 |
| | 3.1 |
| | 0.7 |
| |
| Unrealized (loss) gain on derivative instruments | | (1.0 | ) | | 1.6 |
| | 2.1 |
| | 2.3 |
|
| Post-retirement benefit plans | 1.5 |
| | 1.9 |
| | 4.5 |
| | 3.8 |
| 1.4 |
| | 5.3 |
| | 5.9 |
| | 9.1 |
|
| Other comprehensive income (loss) | 14.3 |
| | (46.3 | ) | | 8.8 |
| | (31.0 | ) | |
| Comprehensive Income (Loss) | $ | 82.3 |
| | $ | (7.5 | ) | | $ | 118.3 |
| | $ | 84.1 |
| |
| Other comprehensive (loss) income | | (33.2 | ) | | 2.2 |
| | (24.4 | ) | | (28.8 | ) |
| Comprehensive Income | | $ | 11.9 |
| | $ | 49.2 |
| | $ | 130.2 |
| | $ | 133.3 |
|
| | | | | | | | | | | | | | | |
| Share Data | | | | | | | | | | | | | | |
| Basic earnings per share | $ | 1.89 |
| | $ | 1.03 |
| | $ | 3.02 |
| | $ | 3.05 |
| $ | 1.28 |
| | $ | 1.25 |
| | $ | 4.30 |
| | $ | 4.29 |
|
| Average number of common shares | 36.0 |
| | 37.7 |
| | 36.2 |
| | 37.8 |
| 35.4 |
| | 37.7 |
| | 35.9 |
| | 37.8 |
|
| | | | | | | | | | | | | | | |
| Diluted earnings per share | $ | 1.86 |
| | $ | 1.01 |
| | $ | 2.97 |
| | $ | 2.99 |
| $ | 1.25 |
| | $ | 1.22 |
| | $ | 4.22 |
| | $ | 4.21 |
|
| Average number of common shares and common share equivalents | 36.7 |
| | 38.4 |
| | 36.9 |
| | 38.5 |
| 36.0 |
| | 38.5 |
| | 36.6 |
| | 38.5 |
|
See accompanying notes to consolidated financial statements.
GATX CORPORATION AND SUBSIDIARIES
CONSOLIDATED STATEMENTS OF CASH FLOWS (Unaudited)
(In millions)
| | | | Six Months Ended June 30 | Nine Months Ended September 30 |
| | 2019 | | 2018 | 2019 | | 2018 |
| Operating Activities | | | | | | |
| Net income | $ | 109.5 |
| | $ | 115.1 |
| $ | 154.6 |
| | $ | 162.1 |
|
| Adjustments to reconcile net income to net cash provided by operating activities: | | | | | | |
| Depreciation expense | 169.3 |
| | 167.2 |
| 255.6 |
| | 253.3 |
|
| Net gains on sales of assets | (41.0 | ) | | (61.1 | ) | (45.5 | ) | | (70.9 | ) |
| Deferred income taxes | 15.7 |
| | 21.2 |
| 25.9 |
| | 28.0 |
|
| Share of affiliates’ earnings, net of dividends | (30.7 | ) | | (27.2 | ) | (43.6 | ) | | (39.1 | ) |
| Changes in working capital items | (47.0 | ) | | (8.5 | ) | (49.9 | ) | | 7.9 |
|
| Net cash provided by operating activities | 175.8 |
| | 206.7 |
| 297.1 |
| | 341.3 |
|
| Investing Activities | | | | | | |
| Portfolio investments and capital additions | (331.4 | ) | | (367.0 | ) | (522.5 | ) | | (536.7 | ) |
| Purchases of assets previously leased | — |
| | (39.1 | ) | — |
| | (66.6 | ) |
| Portfolio proceeds | 133.5 |
| | 149.0 |
| 185.6 |
| | 198.6 |
|
| Proceeds from sales of other assets | 14.6 |
| | 20.9 |
| 18.9 |
| | 28.5 |
|
| Proceeds from sale-leasebacks | | — |
| | 59.2 |
|
| Other | 1.5 |
| | 2.6 |
| 1.0 |
| | 2.7 |
|
| Net cash used in investing activities | (181.8 | ) | | (233.6 | ) | (317.0 | ) | | (314.3 | ) |
| Financing Activities | | | | | | |
| Net proceeds from issuances of debt (original maturities longer than 90 days) | 549.5 |
| | 297.1 |
| 549.7 |
| | 297.1 |
|
| Repayments of debt (original maturities longer than 90 days) | (160.0 | ) | | (263.1 | ) | (410.0 | ) | | (263.1 | ) |
| Net decrease in debt with original maturities of 90 days or less | (84.8 | ) | | 0.1 |
| 2.0 |
| | (4.2 | ) |
| Stock repurchases | (82.4 | ) | | (25.0 | ) | (129.0 | ) | | (37.4 | ) |
| Dividends | (36.2 | ) | | (35.7 | ) | (52.8 | ) | | (52.7 | ) |
| Other | (0.3 | ) | | (1.4 | ) | 3.1 |
| | (3.6 | ) |
| Net cash provided (used) in financing activities | 185.8 |
| | (28.0 | ) | |
| Net cash used in financing activities | | (37.0 | ) | | (63.9 | ) |
Effect of Exchange Rate Changes on Cash and Cash Equivalents | 0.4 |
| | (3.7 | ) | (1.2 | ) | | (4.2 | ) |
| Net increase (decrease) in Cash, Cash Equivalents, and Restricted Cash during the period | 180.2 |
| | (58.6 | ) | |
| Net decrease in Cash, Cash Equivalents, and Restricted Cash during the period | | (58.1 | ) | | (41.1 | ) |
| Cash, Cash Equivalents, and Restricted Cash at beginning of the period | 106.7 |
| | 299.7 |
| 106.7 |
| | 299.7 |
|
| Cash, Cash Equivalents, and Restricted Cash at end of the period | $ | 286.9 |
| | $ | 241.1 |
| $ | 48.6 |
| | $ | 258.6 |
|
| | | | | |
| Noncash Investing Transactions | | | | |
| Portfolio investments and capital additions (1) | | $ | 16.4 |
| | $ | — |
|
__________
| |
| (1) | During the third quarter of 2019, we acquired 157 railcars that were previously accounted for as a finance lease. |
See accompanying notes to consolidated financial statements.
GATX CORPORATION AND SUBSIDIARIES
CONSOLIDATED STATEMENTS OF CHANGES IN SHAREHOLDERS’ EQUITY (Unaudited)
(In millions)
| | | | Three Months Ended
June 30 | | Six Months Ended
June 30 | Three Months Ended
September 30 | | Nine Months Ended
September 30 |
| | 2019 | | 2018 | | 2019 | | 2018 | 2019 | | 2018 | | 2019 | | 2018 |
| | Shares | | Dollars | | Shares | | Dollars | | Shares | | Dollars | | Shares | | Dollars | Shares | | Dollars | | Shares | | Dollars | | Shares | | Dollars | | Shares | | Dollars |
| Common Stock | | | | | | | | | | | | | | | | | | | | | | | | | | | | | | |
| Balance at beginning of the period | 67.4 |
| | $ | 41.7 |
| | 67.2 |
| | $ | 41.6 |
| | 67.3 |
| | $ | 41.6 |
| | 67.1 |
| | $ | 41.6 |
| 67.5 |
| | $ | 41.8 |
| | 67.3 |
| | $ | 41.6 |
| | 67.3 |
| | $ | 41.6 |
| | 67.1 |
| | $ | 41.6 |
|
| Issuance of common stock | 0.1 |
| | 0.1 |
| | 0.1 |
| | — |
| | 0.2 |
| | 0.2 |
| | 0.2 |
| | — |
| — |
| | — |
| | — |
| | — |
| | 0.2 |
| | 0.2 |
| | 0.2 |
| | — |
|
| Balance at end of the period | 67.5 |
| | 41.8 |
| | 67.3 |
| | 41.6 |
| | 67.5 |
| | 41.8 |
| | 67.3 |
| | 41.6 |
| 67.5 |
| | 41.8 |
| | 67.3 |
| | 41.6 |
| | 67.5 |
| | 41.8 |
| | 67.3 |
| | 41.6 |
|
| Treasury Stock | | | | | | | | | | | | | | | | | | | | | | | | | | | | | | |
| Balance at beginning of the period | (31.2 | ) | | (1,254.5 | ) | | (29.6 | ) | | (1,124.0 | ) | | (30.7 | ) | | (1,214.5 | ) | | (29.2 | ) | | (1,099.0 | ) | (31.8 | ) | | (1,297.7 | ) | | (29.6 | ) | | (1,124.0 | ) | | (30.7 | ) | | (1,214.5 | ) | | (29.2 | ) | | (1,099.0 | ) |
| Stock repurchases | (0.6 | ) | | (43.2 | ) | | — |
| | — |
| | (1.1 | ) | | (83.2 | ) | | (0.4 | ) | | (25.0 | ) | (0.6 | ) | | (46.7 | ) | | (0.1 | ) | | (12.4 | ) | | (1.7 | ) | | (129.9 | ) | | (0.5 | ) | | (37.4 | ) |
| Balance at end of the period | (31.8 | ) | | (1,297.7 | ) | | (29.6 | ) | | (1,124.0 | ) | | (31.8 | ) | | (1,297.7 | ) | | (29.6 | ) | | (1,124.0 | ) | (32.4 | ) | | (1,344.4 | ) | | (29.7 | ) | | (1,136.4 | ) | | (32.4 | ) | | (1,344.4 | ) | | (29.7 | ) | | (1,136.4 | ) |
| Additional Paid In Capital | | | | | | | | | | | | | | | | | | | | | | | | | | | | | | |
| Balance at beginning of the period | | | 709.5 |
| | | | 699.9 |
| | | | 706.4 |
| | | | 698.0 |
| | | 713.0 |
| | | | 702.7 |
| | | | 706.4 |
| | | | 698.0 |
|
| Share-based compensation effects | | | 3.5 |
| | | | 2.8 |
| | | | 6.6 |
| | | | 4.7 |
| | | 3.6 |
| | | | 0.9 |
| | | | 10.2 |
| | | | 5.6 |
|
| Balance at end of the period | | | 713.0 |
| | | | 702.7 |
| | | | 713.0 |
| | | | 702.7 |
| | | 716.6 |
| | | | 703.6 |
| | | | 716.6 |
| | | | 703.6 |
|
| Retained Earnings | | | | | | | | | | | | | | | | | | | | | | | | | | | | | | |
| Balance at beginning of the period | | | 2,482.6 |
| | | | 2,335.9 |
| | | | 2,419.2 |
| | | | 2,261.7 |
| | | 2,533.5 |
| | | | 2,357.3 |
| | | | 2,419.2 |
| | | | 2,261.7 |
|
| Net income | | | 68.0 |
| | | | 38.8 |
| | | | 109.5 |
| | | | 115.1 |
| | | 45.1 |
| | | | 47.0 |
| | | | 154.6 |
| | | | 162.1 |
|
| Dividends declared ($0.46 and $0.44 per share QTR and $0.92 and $0.88 per share YTD) | | | (17.1 | ) | | | | (17.4 | ) | | | | (34.6 | ) | | | | (34.7 | ) | |
| Dividends declared ($0.46 and $0.44 per share QTR and $1.38 and $1.32 per share YTD) | | | | (17.1 | ) | | | | (17.3 | ) | | | | (51.7 | ) | | | | (52.0 | ) |
| Cumulative impact of accounting standard adoption | | | — |
| | | | — |
| | | | 39.4 |
| | | | 15.2 |
| | | — |
| | | | — |
| | | | 39.4 |
| | | | 15.2 |
|
| Balance at end of the period | | | 2,533.5 |
| | | | 2,357.3 |
| | | | 2,533.5 |
| | | | 2,357.3 |
| | | 2,561.5 |
| | | | 2,387.0 |
| | | | 2,561.5 |
| | | | 2,387.0 |
|
| Accumulated Other Comprehensive Loss | Accumulated Other Comprehensive Loss | | | | | | | | | | | | | Accumulated Other Comprehensive Loss | | | | | | | | | | | | |
| Balance at beginning of the period | | | (170.1 | ) | | | | (113.7 | ) | | | | (164.6 | ) | | | | (109.6 | ) | | | (155.8 | ) | | | | (160.0 | ) | | | | (164.6 | ) | | | | (109.6 | ) |
| Other comprehensive income (loss) | | | 14.3 |
| | | | (46.3 | ) | | | | 8.8 |
| | | | (31.0 | ) | |
| Other comprehensive (loss) income | | | | (33.2 | ) | | | | 2.2 |
| | | | (24.4 | ) | | | | (28.8 | ) |
| Cumulative impact of accounting standard adoption | | | — |
| | | | — |
| | | | — |
| | | | (19.4 | ) | | | — |
| | | | — |
| | | | — |
| | | | (19.4 | ) |
| Balance at end of the period | | | (155.8 | ) | | | | (160.0 | ) | | | | (155.8 | ) | | | | (160.0 | ) | | | (189.0 | ) | | | | (157.8 | ) | | | | (189.0 | ) | | | | (157.8 | ) |
Total Shareholders’ Equity | | | $ | 1,834.8 |
| | | | $ | 1,817.6 |
| | | | $ | 1,834.8 |
| | | | $ | 1,817.6 |
| | | $ | 1,786.5 |
| | | | $ | 1,838.0 |
| | | | $ | 1,786.5 |
| | | | $ | 1,838.0 |
|
See accompanying notes to consolidated financial statements.
GATX CORPORATION AND SUBSIDIARIES
NOTES TO CONSOLIDATED FINANCIAL STATEMENTS (UNAUDITED)
NOTE 1. Description of Business
As used herein, "GATX," "we," "us," "our," and similar terms refer to GATX Corporation and its subsidiaries, unless indicated otherwise.
We lease, operate, manage, and remarket long-lived, widely-used assets, primarily in the rail market. We report our financial results through four4 primary business segments: Rail North America, Rail International, Portfolio Management, and American Steamship Company ("ASC").
NOTE 2. Basis of Presentation
We prepared the accompanying unaudited consolidated financial statements in accordance with U.S. Generally Accepted Accounting Principles ("GAAP") for interim financial information and the instructions to Form 10-Q and Article 10 of Regulation S-X. Accordingly, our unaudited consolidated financial statements do not include all of the information and footnotes required for complete financial statements. We have included all of the normal recurring adjustments that we deemed necessary for a fair presentation. Certain prior year amounts have been reclassified to conform to the 2019 presentation.
Operating results for the sixnine months ended JuneSeptember 30, 2019 are not necessarily indicative of the results we may achieve for the entire year ending December 31, 2019. In particular, ASC's fleet is inactive for a significant portion of the first quarter of each year due to winter conditions on the Great Lakes. In addition, asset remarketing income does not occur evenly throughout the year. For more information, refer to the consolidated financial statements and footnotes in our Annual Report on Form 10-K for the year ended December 31, 2018.
GATX CORPORATION AND SUBSIDIARIES
NOTES TO CONSOLIDATED FINANCIAL STATEMENTS (UNAUDITED) (Continued)
New Accounting Pronouncements Adopted
|
| | |
| Standard/Description | Effective Date and Adoption Considerations | Effect on Financial Statements or Other Significant Matters |
Leases
In February 2016, the FASB issued ASU 2016-02, Leases (Topic 842), which supersedes previous lease guidance. The FASB subsequently issued ASU 2018-10, ASU 2018-11, and ASU 2018-20, Lease (Topic 842), for codification and targeted improvements to the standard. The new guidance requires companies to recognize most leases on the balance sheet and modifies accounting, presentation, and disclosure for both lessors and lessees. |
We adopted the new guidance in the first quarter of 2019, applying a modified retrospective transition method with a cumulative effect adjustment upon adoption. Comparative periods are not restated.
We elected the package of practical expedients related to whether a contract is or contains a lease, lease classification and initial direct costs. We also elected the practical expedient that allows lessors and lessees to not separate non-lease components from the associated lease components for operating leases. |
The adoption of this new standard required us to recognize right-of-use assets and lease liabilities on our balance sheet attributable to operating leases for railcars, offices, and certain equipment. This resulted in the recognition of right-of-use assets and lease liabilities of $460.7 million and $483.6 million, respectively, as of January 1, 2019.
The adoption of this new standard also required us to eliminate deferred gains associated with our railcar sale-leaseback financing arrangements, and record a one-time increase to equity of $39.4 million (after-tax). Elimination of these deferred gains will increase reported operating lease expense going forward. In 2019, we expect this impact to be approximately $4.0 million (pre-tax). |
Derivatives and Hedging
In August 2017, the FASB issued ASU 2017-12, Derivatives and Hedging (Topic 815): Targeted Improvements to Accounting for Hedging Activities, which expands and refines hedge accounting for both financial and non-financial risk components, aligns the recognition and presentation of the effects of hedging instruments and hedge items in the financial statements, and includes certain targeted improvements to ease the application of current guidance related to the assessment of hedge effectiveness. |
We adopted the new guidance in the first quarter of 2019. |
The application of this new guidance did not impact our financial statements and had an immaterial impact to related disclosures. |
Compensation
In June 2018, the FASB issued ASU 2018-07, Compensation - Stock Compensation (Topic 718): Improvements to Nonemployee Share-Based Payment Accounting, which modifies the accounting for nonemployee share-based payments. |
We adopted the new guidance in the first quarter of 2019. |
The application of this new guidance did not impact our financial statements or related disclosures. |
GATX CORPORATION AND SUBSIDIARIES
NOTES TO CONSOLIDATED FINANCIAL STATEMENTS (UNAUDITED) (Continued)
New Accounting Pronouncements Not Yet Adopted
|
| | |
| Standard/Description | Effective Date and Adoption Considerations | Effect on Financial Statements or Other Significant Matters |
Credit Losses
In June 2016, the FASB issued ASU 2016-13, Credit Losses (Topic 326): Measurement of Credit Losses on Financial Instruments, which modifies how entities will measure credit losses. |
The new guidance is effective for us in the first quarter of 2020, with early adoption permitted. |
We are evaluating the effect the new guidance will have on our financial statements and related disclosures. |
NOTE 3. Revenue
Revenue Recognition
Revenue is recognized when control of the promised goods or services is transferred to our customers, in an amount that reflects the consideration we expect to be entitled to in exchange for those goods or services.
We disaggregate revenue into three categories as presented on our income statement:
Lease Revenue
Lease revenue, which includes operating lease revenue and finance lease revenue, is our primary source of revenue. In the first quarter of 2019, we adopted Topic 842 using the modified retrospective method. As provided in the guidance, we elected the package of practical expedients that retains the classification of existing leases at the time of adoption and does not require re-evaluation of embedded leases or reassessment of initial direct costs. In addition, we elected the practical expedient that allows lessors to not separate non-lease components from the associated lease components for our operating leases. As a result, our current recognition and presentation policies for leases are substantially consistent with applicable provisions in the new lease standard.
Operating Lease Revenue
We lease railcars and other operating assets under full-service and net operating leases. We price full-service leases as an integrated service that includes amounts related to maintenance, insurance, and ad valorem taxes. We do not offer stand-alone maintenance service contracts. Operating lease revenue is within the scope of Topic 842, and we have elected to not separate non-lease components from the associated lease component for qualifying leases. Operating lease revenue will continue to be recognized on a straight-line basis over the term of the underlying lease. As a result, lease revenue may not be recognized in the same period as maintenance and other costs, which we expense as incurred. Variable rents are recognized when applicable contingencies are resolved. Revenue is not recognized if collectability is not reasonably assured.
Finance Lease Revenue
In certain cases, we lease railcars and other operating assets that, at lease inception, are classified as finance leases. In accordance with Topic 842, finance lease revenue will continue to be recognized using the interest method, which produces a constant yield over the lease term. Initial unearned income is the amount that the original lease payment receivable and the estimated residual value of the leased asset exceeds the original cost or carrying value of the leased asset.
Marine Operating Revenue
We generate marine operating revenue through shipping services completed by our marine vessels. In accordance with Topic 606, marine operating revenue is recognized over time as the performance obligation is satisfied, beginning when cargo is loaded through its delivery and discharge. Revenue is recognized pro rata over the projected duration of each voyage, which is derived from our historical voyage data.
Other Revenue
Other revenue is comprised of customer liability repair revenue, termination fees, utilization income, fee income, interest on loans, and other miscellaneous revenues. Select components of other revenue are within the scope of Topic 606. Revenue attributable to terms provided in our lease contracts are variable lease components that are recognized when earned, in accordance with Topic 842.
GATX CORPORATION AND SUBSIDIARIES
NOTES TO CONSOLIDATED FINANCIAL STATEMENTS (UNAUDITED) (Continued)
NOTE 4. Leases
Adoption of ASU 2016-02, "Leases (Topic 842)"
In the first quarter of 2019, we adopted ASU 2016-02 using the modified retrospective transition method with a cumulative effect adjustment upon adoption. Amounts for comparative periods are not required to be included in the footnote disclosures.
We elected the package of practical expedients related to whether a contract is or contains a lease, lease classification and initial direct costs. We also elected the practical expedient that allows lessors and lessees to not separate non-lease components from the associated lease components for operating leases.
The adoption of this new standard required us to recognize right-of-use assets and lease liabilities on our balance sheet attributable to operating leases for railcars, offices, and certain equipment. In addition, the adoption of this new standard also required us to eliminate deferred gains associated with our railcar sale-leaseback financing arrangements, resulting in a one-time increase to equity. Elimination of these deferred gains will increase future operating lease expense associated with operating leases recorded on the date of adoption.
The adoption of this standard did not have any impact on our cash flows.
GATX as Lessor
We lease railcars and other operating assets under full-service and net operating leases. We price full-service leases as an integrated service that includes amounts related to maintenance, insurance, and ad valorem taxes. Upon adoption of the new lease accounting standard in 2019, we elected the lessor practical expedient which allows us not to separate lease and non-lease components when reporting revenue for our full-service operating leases. In some cases, we lease railcars that, at commencement, are classified as finance leases. For certain operating leases, revenue is based on equipment usage and is recognized when earned. Typically, our leases do not provide customers with renewal options or options to purchase the asset. Our lease agreements do not generally have residual value guarantees. We collect reimbursements from customers for damage to our railcars, as well as additional rental payments for usage above specified levels, as provided in the lease agreements.
The following table shows the components of our lease income (in millions):
| | | | Three Months Ended
June 30, 2019 | | Six Months Ended
June 30, 2019 | Three Months Ended
September 30, 2019 | | Nine Months Ended
September 30, 2019 |
| Finance lease income | $ | 2.7 |
| | $ | 5.5 |
| $ | 2.2 |
| | $ | 7.7 |
|
| Operating lease income: | | | | | | |
| Fixed lease income | 253.9 |
| | 507.8 |
| 254.4 |
| | 762.2 |
|
| Variable lease income | 17.4 |
| | 35.1 |
| 14.9 |
| | 50.0 |
|
| Total operating lease income | 271.3 |
| | 542.9 |
| 269.3 |
| | 812.2 |
|
| Total lease income | $ | 274.0 |
| | $ | 548.4 |
| $ | 271.5 |
| | $ | 819.9 |
|
In accordance with the terms of our leases with customers, we may earn additional revenue, primarily for customer liability repairs. These amounts are reported in other revenue in the statements of comprehensive income and were $20.6$22.3 million and $44.3$66.6 million for the three months and sixnine months ended JuneSeptember 30, 2019.
The following table shows the components of our direct finance leases (in millions):
| | | | June 30, 2019 | September 30, 2019 |
| Total contractual lease payments receivable | $ | 93.7 |
| $ | 89.5 |
|
| Estimated unguaranteed residual value of leased assets | 41.0 |
| 41.0 |
|
| Unearned income | (39.4 | ) | (37.2 | ) |
| Finance leases | $ | 95.3 |
| $ | 93.3 |
|
GATX CORPORATION AND SUBSIDIARIES
NOTES TO CONSOLIDATED FINANCIAL STATEMENTS (UNAUDITED) (Continued)
GATX as Lessee
We lease assets, including railcars at North America, as well as other assets such as offices, maintenance facilities, and other general purpose equipment. The railcars are subleased to customers as part of our normal course of operations. Certain leases have options to purchase the underlying assets early, renew the lease, or purchase the underlying assets at the end of the lease term. The specific terms of the renewal and purchase options vary, and we did not include these amounts in our future contractual rental payments. Additionally, the contractual rental payments do not include amounts we are required to pay for licenses, taxes, insurance, and maintenance. Our lease agreements do not contain any material residual value guarantees. At JuneSeptember 30, 2019, we leased approximately 8,300 railcars at Rail North America.America, all of which are accounted for as operating leases.
We use the implicit rate to calculate the right-of-use asset amount and lease liability for our leases when readily determinable. Specifically, the implicit rate was measurable for railcars leased at Rail North America. For our other operating leases, an implicit rate was not determinable, and we used our incremental borrowing rate. Leases with an initial term of 12 months or less are not recorded on the balance sheet. Lease expense is recognized on a straight-line basis over the lease term.
The following table shows the components of lease expense (in millions): | | | | Three Months Ended
June 30, 2019 | | Six Months Ended
June 30, 2019 | Three Months Ended
September 30, 2019 | | Nine Months Ended
September 30, 2019 |
| Finance lease cost: | | | | | | |
| Amortization of right-of-use assets | $ | 0.2 |
| | $ | 0.4 |
| $ | 0.2 |
| | $ | 0.6 |
|
| Interest on lease liabilities | 0.1 |
| | 0.2 |
| 0.1 |
| | 0.3 |
|
| Operating lease cost (1): | | | | | | |
| Fixed lease cost - operating leases | 15.2 |
| | 30.4 |
| 15.0 |
| | 45.4 |
|
| Total lease cost | $ | 15.5 |
| | $ | 31.0 |
| $ | 15.3 |
| | $ | 46.3 |
|
________ | |
| (1) | Total operating lease cost includes amounts recorded in selling, general and administrative expense. Operating lease cost also includes short-term leases, which are immaterial. |
Operating lease cost includes amounts attributable to sale lease-back financing transactions for railcars we lease to customers. Lease revenue of $17.8$17.2 million and $35.8$53.0 million for the three months and sixnine months ended JuneSeptember 30, 2019 was recognized in connection with these operating leases.
The following table shows the maturities of our lease liabilities as of June 30, 2019 (in millions):
| | | | June 30, 2019 | | | |
| Operating Leases | | Finance Leases | | Total | September 30, 2019 |
| 2019 (1) | $ | 26.8 |
| | $ | 10.7 |
| | $ | 37.5 |
| $ | 8.0 |
|
| 2020 | 67.8 |
| | — |
| | 67.8 |
| 67.8 |
|
| 2021 | 66.2 |
| | — |
| | 66.2 |
| 66.3 |
|
| 2022 | 57.5 |
| | — |
| | 57.5 |
| 57.5 |
|
| 2023 | 54.7 |
| | — |
| | 54.7 |
| 54.8 |
|
| Years thereafter | 269.7 |
| | — |
| | 269.7 |
| 269.8 |
|
| Total undiscounted lease payments | $ | 542.7 |
| | $ | 10.7 |
| | $ | 553.4 |
| $ | 524.2 |
|
| Less: amounts representing interest | (88.2 | ) | | (0.1 | ) | | (88.3 | ) | (83.9 | ) |
| Total discounted lease liabilities | $ | 454.5 |
| | $ | 10.6 |
| | $ | 465.1 |
| $ | 440.3 |
|
__________
| |
| (1) | For the remainder of the year. |
GATX CORPORATION AND SUBSIDIARIES
NOTES TO CONSOLIDATED FINANCIAL STATEMENTS (UNAUDITED) (Continued)
The following table shows the lease terms and discount rates related to leases:
|
| | |
| | JuneSeptember 30, 2019 |
| Weighted-average remaining lease term (years): | |
| Operating leases | 10.0 |
|
Finance leases | 0.29.8 |
|
| | |
| Weighted-average discount rate: | |
| Operating leases | 3.69 | % |
Finance leases | 3.393.68 | % |
During the three months ended September 30, 2019, we exercised an option to acquire 157 railcars previously recorded on the balance sheet as a finance lease for $10.5 million. As of September 30, 2019, we had no finance lease assets.
The following table shows other information related to leases (in millions):
| | | | Three Months Ended
June 30, 2019 | | Six Months Ended
June 30, 2019 | Three Months Ended
September 30, 2019 | | Nine Months Ended
September 30, 2019 |
| Cash paid for amounts included in the measurement of lease liabilities: | | | | | | |
| Operating cash flows for operating leases | $ | 8.0 |
| | $ | 40.0 |
| $ | 18.8 |
| | $ | 58.8 |
|
| Operating cash flows for finance leases | 0.1 |
| | 0.2 |
| 0.1 |
| | 0.3 |
|
| Financing cash flows for finance leases | 0.3 |
| | 0.6 |
| 10.7 |
| | 11.3 |
|
| Total cash from leases | $ | 8.4 |
| | $ | 40.8 |
| $ | 29.6 |
| | $ | 70.4 |
|
NOTE 5. Fair Value Disclosure
The assets and liabilities that GATX records at fair value on a recurring basis consisted entirely of derivatives at JuneSeptember 30, 2019 and December 31, 2018.
Adoption of ASU 2017-12, "Derivatives and Hedging (Topic 815): Targeted Improvements to Accounting for Hedging Activities"
In the first quarter of 2019, we adopted ASU 2016-02. The adoption of this new standard did not have an impact on our financial statements, but certain disclosures have been modified in accordance with the new requirements.
Derivative Instruments
Fair Value Hedges
We use interest rate swaps to manage the fixed-to-floating rate mix of our debt obligations by converting a portion of our fixed rate debt to floating rate debt. For fair value hedges, we recognize changes in fair value of both the derivative and the hedged item as interest expense. We had eight8 instruments outstanding with an aggregate notional amount of $450.0 million as of JuneSeptember 30, 2019 with maturities ranging from 2020 to 2022 and nine9 instruments outstanding with an aggregate notional amount of $500.0 million as of December 31, 2018 with maturities ranging from 2019 to 2022.
Cash Flow Hedges
We use Treasury rate locks and swap rate locks to hedge our exposure to interest rate risk on anticipated transactions. We also use currency swaps and put/call options to hedge our exposure to fluctuations in the exchange rates of foreign currencies for certain loans and operating expenses denominated in non-functional currencies. We had 1412 instruments outstanding with an aggregate notional amount of $470.0$523.5 million as of JuneSeptember 30, 2019 that mature from 2019 to 2022 and eight8 instruments outstanding with an aggregate notional amount of $501.9 million as of December 31, 2018 with maturities ranging from 2019 to 2022. Within the next 12 months, we expect to reclassify $1.9$1.8 million ($1.41.3 million after-tax) of net losses on previously terminated derivatives from accumulated other comprehensive income (loss) to interest expense or operating lease expense, as applicable. We reclassify these amounts when interest and operating lease expense on the related hedged transactions affect earnings.
GATX CORPORATION AND SUBSIDIARIES
NOTES TO CONSOLIDATED FINANCIAL STATEMENTS (UNAUDITED) (Continued)
Non-Designated Derivatives
We do not hold derivative financial instruments for purposes other than hedging, although certain of our derivatives are not designated as accounting hedges. We recognize changes in the fair value of these derivatives in other (income) expense immediately.
Some of our derivative instruments contain credit risk provisions that could require us to make immediate payment on net liability positions in the event that we default on certain outstanding debt obligations. The aggregate fair value of our derivative instruments with credit risk related contingent features that are in a liability position as of JuneSeptember 30, 2019 was $10.2$3.7 million. We are not required to post any collateral on our derivative instruments and do not expect the credit risk provisions to be triggered.
In the event that a counterparty fails to meet the terms of an interest rate swap agreement or a foreign exchange contract, our exposure is limited to the fair value of the swap, if in our favor. We manage the credit risk of counterparties by transacting with institutions that we consider financially sound and by avoiding concentrations of risk with a single counterparty. We believe that the risk of non-performance by any of our counterparties is remote.
The following tables show our derivative assets and liabilities that are measured at fair value (in millions):
| | | | Balance Sheet Location | | Fair Value June 30, 2019 | | Quoted Prices in Active Markets for Identical Assets (Level 1) | | Significant Observable Inputs (Level 2) | | Significant Unobservable Inputs (Level 3) | Balance Sheet Location | | Fair Value September 30, 2019 | | Quoted Prices in Active Markets for Identical Assets (Level 1) | | Significant Observable Inputs (Level 2) | | Significant Unobservable Inputs (Level 3) |
| Derivative Assets | | | | | | | | | | | | | | | | |
| Interest rate contracts (1) | Other assets | | $ | 1.2 |
| | $ | — |
| | $ | 1.2 |
| | $ | — |
| Other assets | | $ | 2.4 |
| | $ | — |
| | $ | 2.4 |
| | $ | — |
|
| Foreign exchange contracts (1) | Other assets | | 6.1 |
| | — |
| | 6.1 |
| | — |
| Other assets | | 10.6 |
| | — |
| | 10.6 |
| | — |
|
| Foreign exchange contracts (2) | Other assets | | 0.1 |
| | — |
| | 0.1 |
| | — |
| Other assets | | 0.4 |
| | — |
| | 0.4 |
| | — |
|
| Total derivative assets | | $ | 7.4 |
| | $ | — |
| | $ | 7.4 |
| | $ | — |
| | $ | 13.4 |
| | $ | — |
| | $ | 13.4 |
| | $ | — |
|
| Derivative Liabilities | | | | | | | | | | | | | | | | |
| Interest rate contracts (1) | Other liabilities | | $ | 0.3 |
| | $ | — |
| | $ | 0.3 |
| | $ | — |
| Other liabilities | | $ | 1.8 |
| | $ | — |
| | $ | 1.8 |
| | $ | — |
|
| Foreign exchange contracts (1) | Other liabilities | | 9.9 |
| | — |
| | 9.9 |
| | — |
| Other liabilities | | 1.9 |
| | — |
| | 1.9 |
| | — |
|
| Foreign exchange contracts (2) | Other liabilities | | 7.0 |
| | — |
| | 7.0 |
| | — |
| Other liabilities | | 3.0 |
| | — |
| | 3.0 |
| | — |
|
| Total derivative liabilities | | $ | 17.2 |
| | $ | — |
| | $ | 17.2 |
| | $ | — |
| | $ | 6.7 |
| | $ | — |
| | $ | 6.7 |
| | $ | — |
|
|
| | | | | | | | | | | | | | | | | |
| | Balance Sheet Location | | Fair Value December 31, 2018 | | Quoted
Prices in
Active Markets for
Identical Assets
(Level 1) | | Significant Observable Inputs
(Level 2) | | Significant Unobservable
Inputs
(Level 3) |
| Derivative Assets | | | | | | | | | |
| Foreign exchange contracts (1) | Other assets | | $ | 4.4 |
| | $ | — |
| | $ | 4.4 |
| | $ | — |
|
| Foreign exchange contracts (2) | Other assets | | 0.5 |
| | — |
| | 0.5 |
| | — |
|
| Total derivative assets | | | $ | 4.9 |
| | $ | — |
| | $ | 4.9 |
| | $ | — |
|
| Derivative Liabilities | | | | | | | | | |
| Interest rate contracts (1) | Other liabilities | | $ | 7.7 |
| | $ | — |
| | $ | 7.7 |
| | $ | — |
|
| Foreign exchange contracts (1) | Other liabilities | | 18.2 |
| | — |
| | 18.2 |
| | — |
|
| Foreign exchange contracts (2) | Other liabilities | | 4.7 |
| | — |
| | 4.7 |
| | — |
|
| Total derivative liabilities | | | $ | 30.6 |
| | $ | — |
| | $ | 30.6 |
| | $ | — |
|
_________
(1) Designated as hedges.
| |
| (2) | Not designated as hedges. |
GATX CORPORATION AND SUBSIDIARIES
NOTES TO CONSOLIDATED FINANCIAL STATEMENTS (UNAUDITED) (Continued)
We value derivatives using a pricing model with inputs (such as yield curves and foreign currency rates) that are observable in the market or that can be derived principally from observable market data. As of JuneSeptember 30, 2019 and December 31, 2018, all derivatives were classified as Level 2 in the fair value hierarchy. There were no derivatives classified as Level 1 or Level 3.
The following table shows the amounts recorded on the balance sheet related to cumulative basis adjustments for fair value hedges as of JuneSeptember 30, 2019 and December 31, 2018 (in millions).
| | | | | Carrying Amount of the Hedged Assets/(Liabilities) | | Cumulative Amount of Fair Value Hedging Adjustment Included in the Carrying Amount of the Hedged Assets/(Liabilities) | | Carrying Amount of the Hedged Assets/(Liabilities) | | Cumulative Amount of Fair Value Hedging Adjustment Included in the Carrying Amount of the Hedged Assets/(Liabilities) |
| Line Item in the Balance Sheet in Which the Hedged Item is Included | | June 30 2019 | | December 31 2018 | | June 30 2019 | | December 31 2018 | | September 30 2019 | | December 31 2018 | | September 30 2019 | | December 31 2018 |
| | | | | | | | | | | | | | | | | |
| Recourse Debt | | $ | 449.3 |
| | $ | 493.5 |
| | $ | 0.9 |
| | $ | (7.7 | ) | |
| Recourse debt | | | $ | 450.3 |
| | $ | 493.5 |
| | $ | 2.2 |
| | $ | (7.7 | ) |
The following tables show the impacts of our derivative instruments on our statement of comprehensive income for the three months and sixnine months ended JuneSeptember 30, 2019 and 2018 (in millions):
| | | | | Amount of Loss (Gain) Recognized in Other Comprehensive Income | | Location of Loss (Gain) Reclassified from Accumulated Other Comprehensive Income into Income | | Amount of Loss (Gain) Reclassified from Accumulated Other Comprehensive Income into Income | | Amount of Loss (Gain) Recognized in Other Comprehensive Income | | Location of Loss (Gain) Reclassified from Accumulated Other Comprehensive Income into Income | | Amount of Loss (Gain) Reclassified from Accumulated Other Comprehensive Income into Income |
| | | Three Months Ended June 30 | | Three Months Ended June 30 | | Three Months Ended September 30 | | Three Months Ended September 30 |
| Derivative Designation | | 2019 | | 2018 | | 2019 | | 2018 | | 2019 | | 2018 | | 2019 | | 2018 |
| Derivatives in cash flow hedging relationships: | Derivatives in cash flow hedging relationships: | | | | | | | Derivatives in cash flow hedging relationships: | | | | | | |
| Interest rate contracts | | $ | 4.4 |
| | $ | (17.2 | ) | | Interest expense | | $ | 0.7 |
| | $ | 1.1 |
| | $ | 1.6 |
| | $ | — |
| | Interest expense | | $ | 0.5 |
| | $ | 1.1 |
|
| Foreign exchange contracts | | (0.2 | ) | | — |
| | Other (income) expense | | 5.9 |
| | (16.3 | ) | | (19.8 | ) | | (2.7 | ) | | Operating lease expense | | — |
| | 0.1 |
|
| Total | | $ | 4.2 |
| | $ | (17.2 | ) | | Total | | $ | 6.6 |
| | $ | (15.2 | ) | | $ | (18.2 | ) | | $ | (2.7 | ) | | Other (income) expense | | (19.3 | ) | | (2.2 | ) |
| | | | | | | | Total | | $ | (18.8 | ) | | $ | (1.0 | ) |
| | | | | Amount of Loss (Gain) Recognized in Other Comprehensive Income | | Location of Loss (Gain) Reclassified from Accumulated Other Comprehensive Income into Income | | Amount of Loss (Gain) Reclassified from Accumulated Other Comprehensive Income into Income | | Amount of Loss (Gain) Recognized in Other Comprehensive Income | | Location of Loss (Gain) Reclassified from Accumulated Other Comprehensive Income into Income | | Amount of Loss (Gain) Reclassified from Accumulated Other Comprehensive Income into Income |
| | | Six Months Ended June 30 | | Six Months Ended June 30 | | Nine Months Ended September 30 | | Nine Months Ended September 30 |
| Derivative Designation | | 2019 | | 2018 | | 2019 | | 2018 | | 2019 | | 2018 | | 2019 | | 2018 |
| Derivatives in cash flow hedging relationships: | Derivatives in cash flow hedging relationships: | | | | | | | Derivatives in cash flow hedging relationships: | | | | | | |
| Interest rate contracts | | $ | (8.6 | ) | | $ | (6.4 | ) | | Interest expense | | $ | 1.5 |
| | $ | 2.2 |
| | $ | 1.6 |
| | $ | — |
| | Interest expense | | $ | 2.0 |
| | $ | 3.3 |
|
| Foreign exchange contracts | | (0.1 | ) | | 0.7 |
| | Other (income) expense | | (5.1 | ) | | (8.1 | ) | | (28.5 | ) | | (8.4 | ) | | Operating lease expense | | — |
| | 0.1 |
|
| Total | | $ | (8.7 | ) | | $ | (5.7 | ) | | Total | | $ | (3.6 | ) | | $ | (5.9 | ) | | $ | (26.9 | ) | | $ | (8.4 | ) | | Other (income) expense | | (24.4 | ) | | (10.3 | ) |
| | | | | | | | Total | | $ | (22.4 | ) | | $ | (6.9 | ) |
GATX CORPORATION AND SUBSIDIARIES
NOTES TO CONSOLIDATED FINANCIAL STATEMENTS (UNAUDITED) (Continued)
The following tables show the impact of our fair value and cash flow hedge accounting relationships, as well as the impact of our non-designated derivatives, on the statement of comprehensive income for the three months and sixnine months ended JuneSeptember 30, 2019 and 2018 (in millions):
| | | | Location and Amount of Gain (Loss) Recognized in Income on Fair Value and Cash Flow Hedging Relationships | Location and Amount of Gain (Loss) Recognized in Income on Fair Value and Cash Flow Hedging Relationships |
| | Three Months Ended June 30 | | Three Months Ended June 30 | Three Months Ended September 30 | | Three Months Ended September 30 |
| | 2019 | | 2018 | 2019 | | 2018 |
| Interest (expense), net | | Other income (expense) | | Interest (expense), net | | Other income (expense) | Interest (expense), net | | Other income (expense) | | Interest (expense), net | | Other income (expense) | | Operating lease (expense) |
| Total amounts of income and expense presented in the statements of comprehensive income in which the effects of fair value or cash flow hedges are recorded | $ | (47.1 | ) | | $ | (0.6 | ) | | $ | (42.2 | ) | | $ | (9.8 | ) | $ | (46.3 | ) | | $ | (1.8 | ) | | $ | (42.6 | ) | | $ | (3.8 | ) | | $ | (11.8 | ) |
| Gain (loss) on fair value hedging relationships | | | | | | | | | | | | | | | | |
| Interest rate contracts: | | | | | | | | | | | | | | | | |
| Hedged items | (5.3 | ) | | — |
| | 1.8 |
| | — |
| (1.3 | ) | | — |
| | 1.0 |
| | — |
| | — |
|
| Derivatives designated as hedging instruments | 5.3 |
| | — |
| | (1.8 | ) | | — |
| 1.3 |
| | — |
| | (1.0 | ) | | — |
| | — |
|
| Gain (loss) on cash flow hedging relationships | | | | | | | | | | | | | | | | |
| Interest rate contracts: | | | | | | | | | | | | | | | | |
| Amount of gain (loss) reclassified from accumulated other comprehensive income into income | (0.7 | ) | | — |
| | (1.1 | ) | | — |
| (0.5 | ) | | — |
| | (1.1 | ) | | — |
| | — |
|
| Foreign exchange contracts: | | | | | | | | | | | | | | | | |
| Amount of gain (loss) reclassified from accumulated other comprehensive income into income (1) | — |
| | (5.9 | ) | | — |
| | 16.3 |
| — |
| | 19.3 |
| | — |
| | 2.2 |
| | (0.1 | ) |
| Gain (loss) on non-designated derivative contracts | — |
| | (1.9 | ) | | — |
| | 5.0 |
| — |
| | 4.0 |
| | — |
| | (3.0 | ) | | — |
|
GATX CORPORATION AND SUBSIDIARIES
NOTES TO CONSOLIDATED FINANCIAL STATEMENTS (UNAUDITED) (Continued)
| | | | Location and Amount of Gain (Loss) Recognized in Income on Fair Value and Cash Flow Hedging Relationships | Location and Amount of Gain (Loss) Recognized in Income on Fair Value and Cash Flow Hedging Relationships |
| | Six Months Ended June 30 | | Six Months Ended June 30 | Nine Months Ended September 30 | | Nine Months Ended September 30 |
| | 2019 | | 2018 | 2019 | | 2018 |
| Interest (expense), net | | Other income (expense) | | Interest (expense), net | | Other income (expense) | Interest (expense), net | | Other income (expense) | | Interest (expense), net | | Other income (expense) | | Operating lease (expense) |
| Total amounts of income and expense presented in the statements of comprehensive income in which the effects of fair value or cash flow hedges are recorded | $ | (93.6 | ) | | $ | (3.8 | ) | | $ | (82.1 | ) | | $ | (11.1 | ) | $ | (139.9 | ) | | $ | (5.6 | ) | | $ | (124.7 | ) | | $ | (14.9 | ) | | $ | (37.5 | ) |
| Gain (loss) on fair value hedging relationships | | | | | | | | | | | | | | | | |
| Interest rate contracts: | | | | | | | | | | | | | | | | |
| Hedged items | (8.5 | ) | | — |
| | 7.6 |
| | — |
| (9.8 | ) | | — |
| | 8.6 |
| | — |
| | — |
|
| Derivatives designated as hedging instruments | 8.5 |
| | — |
| | (7.6 | ) | | — |
| 9.8 |
| | — |
| | (8.6 | ) | | — |
| | — |
|
| Gain (loss) on cash flow hedging relationships | | | | | | | | | | | | | | | | |
| Interest rate contracts: | | | | | | | | | | | | | | | | |
| Amount of gain (loss) reclassified from accumulated other comprehensive income into income | (1.5 | ) | | — |
| | (2.2 | ) | | — |
| (2.0 | ) | | — |
| | (3.3 | ) | | — |
| | — |
|
| Foreign exchange contracts: | | | | | | | | | | | | | | | | |
| Amount of gain (loss) reclassified from accumulated other comprehensive income into income (1) | — |
| | 5.1 |
| | — |
| | 8.1 |
| — |
| | 24.4 |
| | — |
| | 10.3 |
| | (0.1 | ) |
| Gain (loss) on non-designated derivative contracts | — |
| | (2.7 | ) | | — |
| | 5.7 |
| — |
| | 1.3 |
| | — |
| | 2.7 |
| | — |
|
_________
| |
| (1) | These amounts are substantially offset by foreign currency remeasurement adjustments on related hedged instruments, also recognized in other income (expense). |
Other Financial Instruments
Except for derivatives, as disclosed above, GATX has no other assets and liabilities measured at fair value on a recurring basis. The carrying amounts of cash and cash equivalents, restricted cash, rent and other receivables, accounts payable, and commercial paper and bank credit facilities approximate fair value due to the short maturity of those instruments. We estimate the fair values of fixed and floating rate debt using discounted cash flow analyses that are based on interest rates currently offered for loans with similar terms to borrowers of similar credit quality. The inputs we use to estimate each of these values are classified in Level 2 of the fair value hierarchy because they are directly or indirectly observable inputs.
The following table shows the carrying amounts and fair values of our other financial instruments (in millions):
| | | | June 30, 2019 | | December 31, 2018 | September 30, 2019 | | December 31, 2018 |
| Carrying Amount | | Fair Value | | Carrying Amount | | Fair Value | Carrying Amount | | Fair Value | | Carrying Amount | | Fair Value |
| Liabilities | | | | | | | | | | | | | | |
| Recourse fixed rate debt | $ | 4,441.8 |
| | $ | 4,631.6 |
| | $ | 3,933.4 |
| | $ | 3,836.0 |
| $ | 4,193.5 |
| | $ | 4,468.9 |
| | $ | 3,933.4 |
| | $ | 3,836.0 |
|
| Recourse floating rate debt | 419.1 |
| | 416.8 |
| | 522.7 |
| | 515.1 |
| 414.2 |
| | 415.0 |
| | 522.7 |
| | 515.1 |
|
GATX CORPORATION AND SUBSIDIARIES
NOTES TO CONSOLIDATED FINANCIAL STATEMENTS (UNAUDITED) (Continued)
NOTE 6. Pension and Other Post-Retirement Benefits
The following table shows the components of our pension and other post-retirement benefits expense for the three months ended JuneSeptember 30, 2019 and 2018 (in millions):
| |
| 2019 Pension Benefits | | 2018 Pension Benefits | | 2019 Retiree Health and Life | | 2018
Retiree Health and Life | 2019 Pension Benefits | | 2018 Pension Benefits | | 2019 Retiree Health and Life | | 2018
Retiree Health and Life |
| Service cost | $ | 1.5 |
| | $ | 2.2 |
| | $ | 0.1 |
| | $ | — |
| $ | 1.7 |
| | $ | 2.0 |
| | $ | — |
| | $ | 0.1 |
|
| Interest cost | 3.8 |
| | 3.7 |
| | 0.3 |
| | 0.3 |
| 3.8 |
| | 3.7 |
| | 0.2 |
| | 0.2 |
|
| Expected return on plan assets | (5.5 | ) | | (5.5 | ) | | — |
| | — |
| (5.6 | ) | | (5.6 | ) | | — |
| | — |
|
| Settlement expense | | — |
| | 2.1 |
| | — |
| | — |
|
| Amortization of (1): | | | | | | | | | | | | | | |
| Unrecognized prior service credit | — |
| | — |
| | (0.1 | ) | | (0.1 | ) | — |
| | — |
| | — |
| | (0.1 | ) |
| Unrecognized net actuarial loss | 2.1 |
| | 2.6 |
| | (0.1 | ) | | — |
| 2.0 |
| | 2.5 |
| | — |
| | — |
|
| Net periodic cost | $ | 1.9 |
| | $ | 3.0 |
| | $ | 0.2 |
| | $ | 0.2 |
| $ | 1.9 |
| | $ | 4.7 |
| | $ | 0.2 |
| | $ | 0.2 |
|
The following table shows the components of our pension and other post-retirement benefits expense for the sixnine months ended JuneSeptember 30, 2019 and 2018 (in millions):
| |
| 2019 Pension Benefits | | 2018 Pension Benefits | | 2019 Retiree Health and Life | | 2018
Retiree Health and Life | 2019 Pension Benefits | | 2018 Pension Benefits | | 2019 Retiree Health and Life | | 2018
Retiree Health and Life |
| Service cost | $ | 3.2 |
| | $ | 4.1 |
| | $ | 0.1 |
| | $ | 0.1 |
| $ | 4.9 |
| | $ | 6.1 |
| | $ | 0.1 |
| | $ | 0.2 |
|
| Interest cost | 7.6 |
| | 7.4 |
| | 0.5 |
| | 0.5 |
| 11.4 |
| | 11.1 |
| | 0.7 |
| | 0.7 |
|
| Expected return on plan assets | (11.0 | ) | | (11.1 | ) | | — |
| | — |
| (16.6 | ) | | (16.7 | ) | | — |
| | — |
|
| Settlement expense | | — |
| | 2.1 |
| | — |
| | — |
|
| Amortization of (1): | | | | | | | | | | | | | | |
| Unrecognized prior service credit | — |
| | — |
| | (0.1 | ) | | (0.1 | ) | — |
| | — |
| | (0.1 | ) | | (0.2 | ) |
| Unrecognized net actuarial loss | 4.0 |
| | 5.1 |
| | (0.1 | ) | | — |
| |
| Unrecognized net actuarial loss (gain) | | 6.0 |
| | 7.6 |
| | (0.1 | ) | | — |
|
| Net periodic cost | $ | 3.8 |
| | $ | 5.5 |
| | $ | 0.4 |
| | $ | 0.5 |
| $ | 5.7 |
| | $ | 10.2 |
| | $ | 0.6 |
| | $ | 0.7 |
|
________
(1) Amounts reclassified from accumulated other comprehensive loss.
In the third quarter of 2018, certain lump sum distributions paid to retirees triggered settlement accounting, resulting in the recognition of $2.1 million of expense.
The service cost component of net periodic cost is recorded in selling, general and administrative expense in the statements of comprehensive income, and the non-service components of net periodic cost are recorded in other expense.
GATX CORPORATION AND SUBSIDIARIES
NOTES TO CONSOLIDATED FINANCIAL STATEMENTS (UNAUDITED) (Continued)
NOTE 7. Share-Based Compensation
During the sixnine months ended JuneSeptember 30, 2019, we granted 326,900 non-qualified employee stock options, 42,70042,960 restricted stock units, 58,340 performance shares, and 11,88417,183 phantom stock units. For the three months and sixnine months ended JuneSeptember 30, 2019, total share-based compensation expense was $4.5$4.1 million and $9.7$13.7 million and the related tax benefits were $1.1$1.0 million and $2.4$3.4 million. For the three months and sixnine months ended JuneSeptember 30, 2018, total share-based compensation expense was $4.7$5.7 million and $9.6$15.4 million and the related tax benefits were $1.2$1.4 million and $2.4$3.9 million.
The estimated fair value of our 2019 non-qualified employee stock option awards and related underlying assumptions are shown in the table below.
|
| |
| | 2019 |
| Weighted-average estimated fair value | $22.24 |
| Quarterly dividend rate | $0.46 |
| Expected term of stock options, in years | 4.2 |
| Risk-free interest rate | 2.5% |
| Dividend yield | 2.6% |
| Expected stock price volatility | 28.9% |
| Present value of dividends | $7.29 |
NOTE 8. Income Taxes
Our effective income tax rate was 23%24% for the sixnine months ended JuneSeptember 30, 2019, compared to 25%26% for the sixnine months ended JuneSeptember 30, 2018. The difference in the effective rates for the current year compared to the prior year is primarily attributable to a reduction in the corporate income tax rate ofenacted in Alberta, Canada. Additionally, the effective tax rate was impacted by the mix of pre-tax income among domestic and foreign jurisdictions, which are taxed at different rates. Incremental tax benefits associated with share-based compensation were also recognized in each period.
NOTE 9. Commercial Commitments
We have entered into various commercial commitments, such as guarantees, standby letters of credit, and performance bonds, related to certain transactions. These commercial commitments require us to fulfill specific obligations in the event of third-party demands. Similar to our balance sheet investments, these commitments expose us to credit, market, and equipment risk. Accordingly, we evaluate these commitments and other contingent obligations using techniques similar to those we use to evaluate funded transactions.
The following table shows our commercial commitments (in millions):
| | | | June 30 2019 | | December 31 2018 | September 30 2019 | | December 31 2018 |
| Lease payment guarantees | $ | — |
| | $ | 2.0 |
| $ | — |
| | $ | 2.0 |
|
| Standby letters of credit and performance bonds | 9.4 |
| | 9.5 |
| 11.8 |
| | 9.5 |
|
| Total commercial commitments (1) | $ | 9.4 |
| | $ | 11.5 |
| $ | 11.8 |
| | $ | 11.5 |
|
_______
(1) The carrying value of liabilities on the balance sheet for commercial commitments was $0.4 million at JuneSeptember 30, 2019 and $0.9 million at December 31, 2018. The expirations of these commitments range from 2022 to 2023. We are not aware of any event that would require us to satisfy any of our commitments.
Lease payment guarantees were commitments to financial institutions to make lease payments for a third party in the event of default. As of JuneSeptember 30, 2019, our obligations for these guarantees concluded.
We are also parties to standby letters of credit and performance bonds, which primarily relate to contractual obligations and general liability insurance coverages. No material claims have been made against these obligations, and no material losses are anticipated.
GATX CORPORATION AND SUBSIDIARIES
NOTES TO CONSOLIDATED FINANCIAL STATEMENTS (UNAUDITED) (Continued)
NOTE 10. Earnings per Share
We compute basic earnings per share by dividing net income available to our common shareholders by the weighted-average number of shares of our common stock outstanding. We weight shares issued or reacquired for the portion of the period that they were outstanding. Our diluted earnings per share reflect the impacts of our potentially dilutive securities, which include our equity compensation awards.
The following table shows the computation of our basic and diluted net income per common share (in millions, except per share amounts):
| | | | Three Months Ended
June 30 | | Six Months Ended
June 30 | Three Months Ended
September 30 | | Nine Months Ended
September 30 |
| | 2019 | | 2018 | | 2019 | | 2018 | 2019 | | 2018 | | 2019 | | 2018 |
| Numerator: | | | | | | | | | | | | | | |
| Net income | $ | 68.0 |
| | $ | 38.8 |
| | $ | 109.5 |
| | $ | 115.1 |
| $ | 45.1 |
| | $ | 47.0 |
| | $ | 154.6 |
| | $ | 162.1 |
|
| | | | | | | | | | | | | | | |
| Denominator: | | | | | | | | | | | | | | |
| Weighted-average shares outstanding - basic | 36.0 |
| | 37.7 |
| | 36.2 |
| | 37.8 |
| 35.4 |
| | 37.7 |
| | 35.9 |
| | 37.8 |
|
| Effect of dilutive securities: | | | | | | | | | | | | | | |
| Equity compensation plans | 0.7 |
| | 0.7 |
| | 0.7 |
| | 0.7 |
| 0.6 |
| | 0.8 |
| | 0.7 |
| | 0.7 |
|
| Weighted-average shares outstanding - diluted | 36.7 |
| | 38.4 |
| | 36.9 |
| | 38.5 |
| 36.0 |
| | 38.5 |
| | 36.6 |
| | 38.5 |
|
| Basic earnings per share | $ | 1.89 |
| | $ | 1.03 |
| | $ | 3.02 |
| | $ | 3.05 |
| $ | 1.28 |
| | $ | 1.25 |
| | $ | 4.30 |
| | $ | 4.29 |
|
| Diluted earnings per share | $ | 1.86 |
| | $ | 1.01 |
| | $ | 2.97 |
| | $ | 2.99 |
| $ | 1.25 |
| | $ | 1.22 |
| | $ | 4.22 |
| | $ | 4.21 |
|
NOTE 11. Accumulated Other Comprehensive Income (Loss)
The following table shows the change in components for accumulated other comprehensive loss (in millions):
| |
| Foreign Currency Translation Gain (Loss) | | Unrealized Loss on Derivative Instruments | | Post-Retirement Benefit Plans | | Total | Foreign Currency Translation Gain (Loss) | | Unrealized Loss on Derivative Instruments | | Post-Retirement Benefit Plans | | Total |
| Balance at December 31, 2018 | $ | (58.0 | ) | | $ | (14.0 | ) | | $ | (92.6 | ) | | $ | (164.6 | ) | $ | (58.0 | ) | | $ | (14.0 | ) | | $ | (92.6 | ) | | $ | (164.6 | ) |
| Change in component | (10.5 | ) | | 12.9 |
| | — |
| | 2.4 |
| (10.5 | ) | | 12.9 |
| | — |
| | 2.4 |
|
| Reclassification adjustments into earnings (1) | — |
| | (10.2 | ) | | 1.9 |
| | (8.3 | ) | — |
| | (10.2 | ) | | 1.9 |
| | (8.3 | ) |
| Income tax effect | — |
| | (0.7 | ) | | 1.1 |
| | 0.4 |
| — |
| | (0.7 | ) | | 1.1 |
| | 0.4 |
|
| Balance at March 31, 2019 | $ | (68.5 | ) | | $ | (12.0 | ) | | $ | (89.6 | ) | | $ | (170.1 | ) | $ | (68.5 | ) | | $ | (12.0 | ) | | $ | (89.6 | ) | | $ | (170.1 | ) |
| Change in component | 11.7 |
| | (4.9 | ) | | — |
| | 6.8 |
| 11.7 |
| | (4.9 | ) | | — |
| | 6.8 |
|
| Reclassification adjustments into earnings (1) | — |
| | 6.6 |
| | 1.9 |
| | 8.5 |
| — |
| | 6.6 |
| | 1.9 |
| | 8.5 |
|
| Income tax effect | — |
| | (0.6 | ) | | (0.4 | ) | | (1.0 | ) | — |
| | (0.6 | ) | | (0.4 | ) | | (1.0 | ) |
| Balance at June 30, 2019 | $ | (56.8 | ) | | $ | (10.9 | ) | | $ | (88.1 | ) | | $ | (155.8 | ) | $ | (56.8 | ) | | $ | (10.9 | ) | | $ | (88.1 | ) | | $ | (155.8 | ) |
| Change in component | | (33.6 | ) | | 17.7 |
| | — |
| | (15.9 | ) |
| Reclassification adjustments into earnings (1) | | — |
| | (18.8 | ) | | 2.0 |
| | (16.8 | ) |
| Income tax effect | | — |
| | 0.1 |
| | (0.6 | ) | | (0.5 | ) |
| Balance at September 30, 2019 | | $ | (90.4 | ) | | $ | (11.9 | ) | | $ | (86.7 | ) | | $ | (189.0 | ) |
________
| |
| (1) | See "Note 5. Fair Value Disclosure" and "Note 6. Pension and Other Post-Retirement Benefits" for impacts of the reclassification adjustments on the statement of comprehensive income. |
NOTE 12. Legal Proceedings and Other Contingencies
Various legal actions, claims, assessments and other contingencies arising in the ordinary course of business are pending against GATX and certain of our subsidiaries. These matters are subject to many uncertainties, and it is possible that some of these matters could ultimately be decided, resolved or settled adversely. For a full discussion of our pending legal matters, please refer to "Note 22. Legal Proceedings and Other Contingencies" ofthe notes
GATX CORPORATION AND SUBSIDIARIES
NOTES TO CONSOLIDATED FINANCIAL STATEMENTS (UNAUDITED) (Continued)
included with our consolidated financial statements in our Annual Report on Form 10-K for the year ended December 31, 2018.
GATX CORPORATION AND SUBSIDIARIES
NOTES TO CONSOLIDATED FINANCIAL STATEMENTS (UNAUDITED) (Continued)
Viareggio Derailment
In June 2009, a train consisting of fourteen liquefied petroleum gas (“LPG”) tank cars owned by GATX Rail Austria GmbH2018 and its subsidiaries (collectively, “GRA”) derailed while passing through the City of Viareggio, in the province of Lucca, Italy. Five tank cars overturned and one of the overturned cars was punctured by a peg or obstacle along the side of the track, resulting in a release of LPG, which subsequently ignited. The accident resulted in multiple deaths, personal injuries and property damage. The LPG tank cars were leased to FS Logistica S.p.A., a subsidiary of the Italian state-owned railway, Ferrovie dello Stato S.p.A (the “Italian Railway”).
In January 2017, the trial court of Lucca found various Italian Railway companies, GRA, and certain of their employees guilty of negligence-based crimes related to the accident. The court imposed a fine of 1.4 million Euros against GRA and prison sentences against eight employees. GRA and its employees appealed, andour Quarterly Reports on June 20, 2019, the court of appeal of Florence upheld the adverse verdicts, exceptForm 10-Q previously filed for the acquittal of one employee and minor reductions to the fine and prison sentences. GRA and its current and former employees intend to appeal to the Italian Supreme Court and, pending the final disposition of this appeal, the fine and penalties are not enforceable. With respect to civil claims, the insurers for the Italian Railway and GRA have fully settled and resolved most of the claims arising out of the accident. GRA believes that its employees acted diligently and in accordance with applicable laws and regulations; however, we cannot predict the ultimate outcome of the Italian appellate process and thus cannot reasonably estimate the possible amount or range of costs that may be ultimately incurred in connection with this litigation.2019 fiscal year.
NOTE 13. Financial Data of Business Segments
The financial data presented below depicts the profitability, financial position, and capital expenditures of each of our business segments.
We lease, operate, manage, and remarket long-lived, widely-used assets, primarily in the rail market. We report our financial results through four4 primary business segments: Rail North America, Rail International, Portfolio Management, and American Steamship Company ("ASC").
Rail North America is composed of our operations in the United States, Canada, and Mexico. Rail North America primarily provides railcars pursuant to full-service leases under which it maintains the railcars, pays ad valorem taxes and insurance, and provides other ancillary services.
Rail International is composed of our operations in Europe ("GATX Rail Europe" or "GRE"), India ("Rail India"), and Russia ("Rail Russia"). GRE leases railcars to customers throughout Europe pursuant to full-service leases under which it maintains the railcars and provides value-adding services according to customer requirements.
Portfolio Management is composed primarily of our ownership in a group of joint ventures with Rolls-Royce plc that lease aircraft spare engines, as well as five liquefied gas carrying vessels (the "Specialized GasVessels"Gas Vessels") and assorted other marine assets.
ASC operates the largest fleet of US-flagged vessels on the Great Lakes, providing waterborne transportation of dry bulk commodities such as iron ore, coal, limestone aggregates, and metallurgical limestone.
Segment profit is an internal performance measure used by the Chief Executive Officer to assess the profitability of each segment. Segment profit includes all revenues, expenses, pre-tax earnings from affiliates, and net gains on asset dispositions that are directly attributable to each segment. We allocate interest expense to the segments based on what we believe to be the appropriate risk-adjusted borrowing costs for each segment. Segment profit excludes selling, general and administrative expenses, income taxes, and certain other amounts not allocated to the segments. These amounts are included in Other.
GATX CORPORATION AND SUBSIDIARIES
NOTES TO CONSOLIDATED FINANCIAL STATEMENTS (UNAUDITED) (Continued)
The following tables show certain segment data for each of our business segments (in millions):
| |
|
Rail
North America | |
Rail International | |
Portfolio Management | |
ASC | | Other | | GATX Consolidated |
Rail
North America | |
Rail International | |
Portfolio Management | |
ASC | | Other | | GATX Consolidated |
| Three Months Ended June 30, 2019 | |
| | | | | | | | | | | |
| Three Months Ended September 30, 2019 | | |
| | | | | | | | | | |
| Revenues | | | | | | | | | | | | | | | | | | | | | | |
| Lease revenue | $ | 218.8 |
| | $ | 53.9 |
| | $ | 0.2 |
| | $ | 1.1 |
| | $ | — |
| | $ | 274.0 |
| $ | 214.6 |
| | $ | 55.6 |
| | $ | 0.3 |
| | $ | 1.0 |
| | $ | — |
| | $ | 271.5 |
|
| Marine operating revenue | — |
| | — |
| | 0.1 |
| | 60.8 |
| | — |
| | 60.9 |
| — |
| | — |
| | 1.9 |
| | 60.9 |
| | — |
| | 62.8 |
|
| Other revenue | 22.4 |
| | 1.8 |
| | 0.3 |
| | — |
| | — |
| | 24.5 |
| 23.9 |
| | 2.4 |
| | 0.1 |
| | — |
| | — |
| | 26.4 |
|
| Total Revenues | 241.2 |
| | 55.7 |
| | 0.6 |
| | 61.9 |
| | — |
| | 359.4 |
| 238.5 |
| | 58.0 |
| | 2.3 |
| | 61.9 |
| | — |
| | 360.7 |
|
| Expenses | | | | | | | | | | | | | | | | | | | | | | |
| Maintenance expense | 67.0 |
| | 11.2 |
| | — |
| | 7.5 |
| | — |
| | 85.7 |
| 64.0 |
| | 12.2 |
| | — |
| | 8.2 |
| | — |
| | 84.4 |
|
| Marine operating expense | — |
| | — |
| | 4.0 |
| | 37.0 |
| | — |
| | 41.0 |
| — |
| | — |
| | 3.4 |
| | 36.3 |
| | — |
| | 39.7 |
|
| Depreciation expense | 64.4 |
| | 14.2 |
| | 1.7 |
| | 3.5 |
| | — |
| | 83.8 |
| 63.9 |
| | 14.5 |
| | 1.6 |
| | 3.6 |
| | — |
| | 83.6 |
|
| Operating lease expense | 13.7 |
| | — |
| | — |
| | — |
| | — |
| | 13.7 |
| 13.7 |
| | — |
| | — |
| | — |
| | — |
| | 13.7 |
|
| Other operating expense | 6.4 |
| | 1.3 |
| | 0.1 |
| | — |
| | — |
| | 7.8 |
| 6.2 |
| | 1.4 |
| | 0.1 |
| | — |
| | — |
| | 7.7 |
|
| Total Expenses | 151.5 |
| | 26.7 |
| | 5.8 |
| | 48.0 |
| | — |
| | 232.0 |
| 147.8 |
| | 28.1 |
| | 5.1 |
| | 48.1 |
| | — |
| | 229.1 |
|
| Other Income (Expense) | | | | | | | | | | | | | | | | | | | | | | |
| Net gain on asset dispositions | 32.1 |
| | 0.5 |
| | 0.3 |
| | — |
| | — |
| | 32.9 |
| 4.3 |
| | 0.3 |
| | 0.5 |
| | — |
| | — |
| | 5.1 |
|
| Interest (expense) income, net | (34.1 | ) | | (10.1 | ) | | (2.8 | ) | | (1.6 | ) | | 1.5 |
| | (47.1 | ) | (33.1 | ) | | (10.2 | ) | | (2.8 | ) | | (1.6 | ) | | 1.4 |
| | (46.3 | ) |
| Other (expense) income | (1.9 | ) | | 1.9 |
| | — |
| | (0.2 | ) | | (0.4 | ) | | (0.6 | ) | |
| Other expense | | (1.0 | ) | | (0.1 | ) | | — |
| | (0.1 | ) | | (0.6 | ) | | (1.8 | ) |
| Share of affiliates' pre-tax income | — |
| | — |
| | 19.6 |
| | — |
| | — |
| | 19.6 |
| — |
| | — |
| | 15.8 |
| | — |
| | — |
| | 15.8 |
|
| Segment profit | $ | 85.8 |
| | $ | 21.3 |
| | $ | 11.9 |
| | $ | 12.1 |
| | $ | 1.1 |
| | $ | 132.2 |
| $ | 60.9 |
| | $ | 19.9 |
| | $ | 10.7 |
| | $ | 12.1 |
| | $ | 0.8 |
| | $ | 104.4 |
|
| Less: | | | | | | | | | | | | | | | | | | | | | | |
| Selling, general and administrative expense | Selling, general and administrative expense | 45.1 |
| Selling, general and administrative expense | 44.4 |
|
| Income taxes (includes $3.5 related to affiliates' earnings) | 19.1 |
| |
| Income taxes (includes $3.0 related to affiliates' earnings) | | Income taxes (includes $3.0 related to affiliates' earnings) | 14.9 |
|
| Net income | Net income | $ | 68.0 |
| Net income | $ | 45.1 |
|
| | | | | | | | | | | | | | | | | | | | | | | |
| Net Gain on Asset Dispositions | | | | | | | | | | | | | | | | | | | | | | |
| Asset Remarketing Income: | | | | | | | | | | | | | | | | | | | | | | |
| Net gains on disposition of owned assets | $ | 26.8 |
| | $ | — |
| | $ | — |
| | $ | — |
| | $ | — |
| | $ | 26.8 |
| $ | 4.4 |
| | $ | — |
| | $ | — |
| | $ | — |
| | $ | — |
| | $ | 4.4 |
|
| Residual sharing income | 0.1 |
| | — |
| | 0.3 |
| | — |
| | — |
| | 0.4 |
| 0.1 |
| | — |
| | 0.5 |
| | — |
| | — |
| | 0.6 |
|
| Non-remarketing net gains (1) | 5.2 |
| | 0.5 |
| | — |
| | — |
| | — |
| | 5.7 |
| (0.2 | ) | | 0.3 |
| | — |
| | — |
| | — |
| | 0.1 |
|
| | $ | 32.1 |
| | $ | 0.5 |
| | $ | 0.3 |
| | $ | — |
| | $ | — |
| | $ | 32.9 |
| $ | 4.3 |
| | $ | 0.3 |
| | $ | 0.5 |
| | $ | — |
| | $ | — |
| | $ | 5.1 |
|
| | | | | | | | | | | | | | | | | | | | | | | |
| Capital Expenditures | | | | | | | | | | | | | | | | | | | | | | |
| Portfolio investments and capital additions | $ | 105.3 |
| | $ | 73.7 |
| | $ | — |
| | $ | 3.9 |
| | $ | 1.2 |
| | $ | 184.1 |
| $ | 138.1 |
| | $ | 51.8 |
| | $ | — |
| | $ | 0.3 |
| | $ | 0.9 |
| | $ | 191.1 |
|
| | | | | | | | | | | | | | | | | | | | | | | |
| Selected Balance Sheet Data at June 30, 2019 | | | | | | | | | |
| Selected Balance Sheet Data at September 30, 2019 | | Selected Balance Sheet Data at September 30, 2019 | | | | | | | | |
| Investments in affiliated companies | $ | 0.2 |
| | $ | — |
| | $ | 495.6 |
| | $ | — |
| | $ | — |
| | $ | 495.8 |
| $ | 0.2 |
| | $ | — |
| | $ | 506.5 |
| | $ | — |
| | $ | — |
| | $ | 506.7 |
|
| Identifiable assets | $ | 5,618.8 |
| | $ | 1,440.2 |
| | $ | 628.8 |
| | $ | 331.3 |
| | $ | 334.0 |
| | $ | 8,353.1 |
| $ | 5,625.5 |
| | $ | 1,397.2 |
| | $ | 639.6 |
| | $ | 319.1 |
| | $ | 109.5 |
| | $ | 8,090.9 |
|
__________
(1) Includes net gains from scrapping of railcars.
GATX CORPORATION AND SUBSIDIARIES
NOTES TO CONSOLIDATED FINANCIAL STATEMENTS (UNAUDITED) (Continued)
| |
|
Rail North America | |
Rail International | |
Portfolio Management | |
ASC | | Other | | GATX Consolidated |
Rail North America | |
Rail International | |
Portfolio Management | |
ASC | | Other | | GATX Consolidated |
| Three Months Ended June 30, 2018 | | | | | | | | | | | | |
| Three Months Ended September 30, 2018 | | | | | | | | | | | | |
| Revenues | | | | | | | | | | | | | | | | | | | | | | |
| Lease revenue | $ | 217.6 |
| | $ | 52.2 |
| | $ | 0.2 |
| | $ | 1.0 |
| | $ | — |
| | $ | 271.0 |
| $ | 218.2 |
| | $ | 52.3 |
| | $ | 0.3 |
| | $ | 1.1 |
| | $ | — |
| | $ | 271.9 |
|
| Marine operating revenue | — |
| | — |
| | 3.5 |
| | 52.3 |
| | — |
| | 55.8 |
| — |
| | — |
| | 3.1 |
| | 57.7 |
| | — |
| | 60.8 |
|
| Other revenue | 20.1 |
| | 2.2 |
| | 0.4 |
| | — |
| | — |
| | 22.7 |
| 15.2 |
| | 1.8 |
| | — |
| | — |
| | — |
| | 17.0 |
|
| Total Revenues | 237.7 |
| | 54.4 |
| | 4.1 |
| | 53.3 |
| | — |
| | 349.5 |
| 233.4 |
| | 54.1 |
| | 3.4 |
| | 58.8 |
| | — |
| | 349.7 |
|
| Expenses | | | | | | | | | | | | | | | | | | | | | | |
| Maintenance expense | 64.1 |
| | 11.2 |
| | — |
| | 6.7 |
| | — |
| | 82.0 |
| 60.6 |
| | 10.1 |
| | — |
| | 6.8 |
| | — |
| | 77.5 |
|
| Marine operating expense | — |
| | — |
| | 4.2 |
| | 33.4 |
| | — |
| | 37.6 |
| — |
| | — |
| | 4.4 |
| | 35.0 |
| | — |
| | 39.4 |
|
| Depreciation expense | 61.8 |
| | 13.8 |
| | 1.9 |
| | 3.6 |
| | — |
| | 81.1 |
| 62.5 |
| | 13.8 |
| | 1.8 |
| | 3.5 |
| | — |
| | 81.6 |
|
| Operating lease expense | 12.7 |
| | — |
| | — |
| | — |
| | — |
| | 12.7 |
| 11.8 |
| | — |
| | — |
| | — |
| | — |
| | 11.8 |
|
| Other operating expense | 7.5 |
| | 1.5 |
| | 0.1 |
| | — |
| | — |
| | 9.1 |
| 7.1 |
| | 1.3 |
| | 0.1 |
| | — |
| | — |
| | 8.5 |
|
| Total Expenses | 146.1 |
| | 26.5 |
| | 6.2 |
| | 43.7 |
| | — |
| | 222.5 |
| 142.0 |
| | 25.2 |
| | 6.3 |
| | 45.3 |
| | — |
| | 218.8 |
|
| Other Income (Expense) | | | | | | | | | | | | | | | | | | | | | | |
| Net gain on asset dispositions | 4.7 |
| | 1.1 |
| | 0.3 |
| | — |
| | — |
| | 6.1 |
| 9.6 |
| | 0.5 |
| | 0.2 |
| | — |
| | — |
| | 10.3 |
|
| Interest (expense) income, net | (31.1 | ) | | (8.9 | ) | | (2.7 | ) | | (1.5 | ) | | 2.0 |
| | (42.2 | ) | (31.8 | ) | | (8.9 | ) | | (2.6 | ) | | (1.5 | ) | | 2.2 |
| | (42.6 | ) |
| Other expense | (1.2 | ) | | (7.3 | ) | | — |
| | (0.1 | ) | | (1.2 | ) | | (9.8 | ) | |
| Other (expense) income | | (1.2 | ) | | 0.2 |
| | — |
| | (0.1 | ) | | (2.7 | ) | | (3.8 | ) |
| Share of affiliates' pre-tax income | 0.2 |
| | — |
| | 15.9 |
| | — |
| | — |
| | 16.1 |
| 0.2 |
| | — |
| | 14.3 |
| | — |
| | — |
| | 14.5 |
|
| Segment profit | $ | 64.2 |
| | $ | 12.8 |
| | $ | 11.4 |
| | $ | 8.0 |
| | $ | 0.8 |
| | $ | 97.2 |
| |
| Segment profit (loss) | | $ | 68.2 |
| | $ | 20.7 |
| | $ | 9.0 |
| | $ | 11.9 |
| | $ | (0.5 | ) | | $ | 109.3 |
|
| Less: | | | | | | | | | | | | | | | | | | | | | | |
| Selling, general and administrative expense | Selling, general and administrative expense | 46.2 |
| Selling, general and administrative expense | 46.5 |
|
| Income taxes (includes $3.1 related to affiliates' earnings) | 12.2 |
| |
| Income taxes (includes $2.7 related to affiliates' earnings) | | Income taxes (includes $2.7 related to affiliates' earnings) | 15.8 |
|
| Net income | Net income | $ | 38.8 |
| Net income | $ | 47.0 |
|
| | | | | | | | | | | | | | | | | | | | | | | |
| Net Gain on Asset Dispositions | | | | | | | | | | | | | | | | | | | | | | |
| Asset Remarketing Income: | | | | | | | | | | | | | | | | | | | | | | |
| Net gains on disposition of owned assets | $ | 4.2 |
| | $ | — |
| | $ | — |
| | $ | — |
| | $ | — |
| | $ | 4.2 |
| $ | 6.7 |
| | $ | — |
| | $ | — |
| | $ | — |
| | $ | — |
| | $ | 6.7 |
|
| Residual sharing income | 0.3 |
| | — |
| | 0.3 |
| | — |
| | — |
| | 0.6 |
| 0.5 |
| | — |
| | 0.2 |
| | — |
| | — |
| | 0.7 |
|
| Non-remarketing net gains (1) | 0.2 |
| | 1.1 |
| | — |
| | — |
| | — |
| | 1.3 |
| 2.4 |
| | 0.5 |
| | — |
| | — |
| | — |
| | 2.9 |
|
| | $ | 4.7 |
| | $ | 1.1 |
| | $ | 0.3 |
| | $ | — |
| | $ | — |
| | $ | 6.1 |
| $ | 9.6 |
| | $ | 0.5 |
| | $ | 0.2 |
| | $ | — |
| | $ | — |
| | $ | 10.3 |
|
| | | | | | | | | | | | | | | | | | | | | | | |
| Capital Expenditures | | | | | | | | | | | | | | | | | | | | | | |
| Portfolio investments and capital additions | $ | 149.1 |
| | $ | 34.6 |
| | $ | — |
| | $ | 4.1 |
| | $ | 0.8 |
| | $ | 188.6 |
| $ | 129.1 |
| | $ | 40.4 |
| | $ | — |
| | $ | — |
| | $ | 0.2 |
| | $ | 169.7 |
|
| | | | | | | | | | | | | | | | | | | | | | | |
| Selected Balance Sheet Data at December 31, 2018 | Selected Balance Sheet Data at December 31, 2018 | | | | | | | | | Selected Balance Sheet Data at December 31, 2018 | | | | | | | | |
| Investments in affiliated companies | $ | 0.2 |
| | $ | — |
| | $ | 464.3 |
| | $ | — |
| | $ | — |
| | $ | 464.5 |
| $ | 0.2 |
| | $ | — |
| | $ | 464.3 |
| | $ | — |
| | $ | — |
| | $ | 464.5 |
|
| Identifiable assets | $ | 5,236.6 |
| | $ | 1,363.2 |
| | $ | 606.8 |
| | $ | 297.8 |
| | $ | 112.3 |
| | $ | 7,616.7 |
| $ | 5,236.6 |
| | $ | 1,363.2 |
| | $ | 606.8 |
| | $ | 297.8 |
| | $ | 112.3 |
| | $ | 7,616.7 |
|
__________
(1) Includes net gains from scrapping of railcars.
GATX CORPORATION AND SUBSIDIARIES
NOTES TO CONSOLIDATED FINANCIAL STATEMENTS (UNAUDITED) (Continued)
| |
|
Rail
North America | |
Rail International | |
Portfolio Management | |
ASC | | Other | | GATX Consolidated |
Rail
North America | |
Rail International | |
Portfolio Management | |
ASC | | Other | | GATX Consolidated |
| Six Months Ended June 30, 2019 | |
| | | | | | | | | | | |
| Nine Months Ended September 30, 2019 | | |
| | | | | | | | | | |
| Revenues | | | | | | | | | | | | | | | | | | | | | | |
| Lease revenue | $ | 439.7 |
| | $ | 106.1 |
| | $ | 0.5 |
| | $ | 2.1 |
| | $ | — |
| | $ | 548.4 |
| $ | 654.3 |
| | $ | 161.7 |
| | $ | 0.8 |
| | $ | 3.1 |
| | $ | — |
| | $ | 819.9 |
|
| Marine operating revenue | — |
| | — |
| | 2.5 |
| | 71.5 |
| | — |
| | 74.0 |
| — |
| | — |
| | 4.4 |
| | 132.4 |
| | — |
| | 136.8 |
|
| Other revenue | 49.8 |
| | 3.8 |
| | 0.4 |
| | — |
| | — |
| | 54.0 |
| 73.7 |
| | 6.2 |
| | 0.5 |
| | — |
| | — |
| | 80.4 |
|
| Total Revenues | 489.5 |
| | 109.9 |
| | 3.4 |
| | 73.6 |
| | — |
| | 676.4 |
| 728.0 |
| | 167.9 |
| | 5.7 |
| | 135.5 |
| | — |
| | 1,037.1 |
|
| Expenses | | | | | | | | | | | | | | | | | | | | | | |
| Maintenance expense | 135.8 |
| | 23.3 |
| | — |
| | 7.8 |
| | — |
| | 166.9 |
| 199.8 |
| | 35.5 |
| | — |
| | 16.0 |
| | — |
| | 251.3 |
|
| Marine operating expense | — |
| | — |
| | 8.6 |
| | 44.5 |
| | — |
| | 53.1 |
| — |
| | — |
| | 12.0 |
| | 80.8 |
| | — |
| | 92.8 |
|
| Depreciation expense | 128.7 |
| | 28.2 |
| | 3.3 |
| | 3.5 |
| | — |
| | 163.7 |
| 192.6 |
| | 42.7 |
| | 4.9 |
| | 7.1 |
| | — |
| | 247.3 |
|
| Operating lease expense | 27.4 |
| | — |
| | — |
| | — |
| | — |
| | 27.4 |
| 41.1 |
| | — |
| | — |
| | — |
| | — |
| | 41.1 |
|
| Other operating expense | 12.8 |
| | 2.8 |
| | 0.2 |
| | — |
| | — |
| | 15.8 |
| 19.0 |
| | 4.2 |
| | 0.3 |
| | — |
| | — |
| | 23.5 |
|
| Total Expenses | 304.7 |
| | 54.3 |
| | 12.1 |
| | 55.8 |
| | — |
| | 426.9 |
| 452.5 |
| | 82.4 |
| | 17.2 |
| | 103.9 |
| | — |
| | 656.0 |
|
| Other Income (Expense) | | | | | | | | | | | | | | | | | | | | | | |
| Net gain on asset dispositions | 40.3 |
| | 0.9 |
| | 0.6 |
| | — |
| | — |
| | 41.8 |
| 44.6 |
| | 1.2 |
| | 1.1 |
| | — |
| | — |
| | 46.9 |
|
| Interest (expense) income, net | (68.3 | ) | | (20.0 | ) | | (5.5 | ) | | (3.0 | ) | | 3.2 |
| | (93.6 | ) | (101.4 | ) | | (30.2 | ) | | (8.3 | ) | | (4.6 | ) | | 4.6 |
| | (139.9 | ) |
| Other expense | (2.6 | ) | | (0.4 | ) | | — |
| | (0.2 | ) | | (0.6 | ) | | (3.8 | ) | (3.6 | ) | | (0.5 | ) | | — |
| | (0.3 | ) | | (1.2 | ) | | (5.6 | ) |
| Share of affiliates' pre-tax income | — |
| | — |
| | 37.8 |
| | — |
| | — |
| | 37.8 |
| — |
| | — |
| | 53.6 |
| | — |
| | — |
| | 53.6 |
|
| Segment profit | $ | 154.2 |
| | $ | 36.1 |
| | $ | 24.2 |
| | $ | 14.6 |
| | $ | 2.6 |
| | $ | 231.7 |
| $ | 215.1 |
| | $ | 56.0 |
| | $ | 34.9 |
| | $ | 26.7 |
| | $ | 3.4 |
| | $ | 336.1 |
|
| Less: | | | | | | | | | | | | | | | | | | | | | | |
| Selling, general and administrative expense | Selling, general and administrative expense | 91.2 |
| Selling, general and administrative expense | 135.6 |
|
| Income taxes (includes $7.0 related to affiliates' earnings) | 31.0 |
| |
| Income taxes (includes $10.0 related to affiliates' earnings) | | Income taxes (includes $10.0 related to affiliates' earnings) | 45.9 |
|
| Net income | Net income | $ | 109.5 |
| Net income | $ | 154.6 |
|
| | | | | | | | | | | | | | | | | | | | | | | |
| Net Gain on Asset Dispositions | | | | | | | | | | | | | | | | | | | | | | |
| Asset Remarketing Income: | | | | | | | | | | | | | | | | | | | | | | |
| Net gains on disposition of owned assets | $ | 36.5 |
| | $ | — |
| | $ | — |
| | $ | — |
| | $ | — |
| | $ | 36.5 |
| $ | 40.9 |
| | $ | — |
| | $ | — |
| | $ | — |
| | $ | — |
| | $ | 40.9 |
|
| Residual sharing income | 0.2 |
| | — |
| | 0.6 |
| | — |
| | — |
| | 0.8 |
| 0.3 |
| | — |
| | 1.1 |
| | — |
| | — |
| | 1.4 |
|
| Non-remarketing net gains (1) | 3.6 |
| | 0.9 |
| | — |
| | — |
| | — |
| | 4.5 |
| 3.4 |
| | 1.2 |
| | — |
| | — |
| | — |
| | 4.6 |
|
| | $ | 40.3 |
| | $ | 0.9 |
| | $ | 0.6 |
| | $ | — |
| | $ | — |
| | $ | 41.8 |
| $ | 44.6 |
| | $ | 1.2 |
| | $ | 1.1 |
| | $ | — |
| | $ | — |
| | $ | 46.9 |
|
| | | | | | | | | | | | | | | | | | | | | | | |
| Capital Expenditures | | | | | | | | | | | | | | | | | | | | | | |
| Portfolio investments and capital additions | $ | 204.3 |
| | $ | 106.8 |
| | $ | — |
| | $ | 18.4 |
| | $ | 1.9 |
| | $ | 331.4 |
| $ | 342.4 |
| | $ | 158.6 |
| | $ | — |
| | $ | 18.7 |
| | $ | 2.8 |
| | $ | 522.5 |
|
| | | | | | | | | | | | | | | | | | | | | | | |
__________
(1) Includes net gains from scrapping of railcars.
GATX CORPORATION AND SUBSIDIARIES
NOTES TO CONSOLIDATED FINANCIAL STATEMENTS (UNAUDITED) (Continued)
| |
|
Rail North America | |
Rail International | |
Portfolio Management | |
ASC | | Other | | GATX Consolidated |
Rail North America | |
Rail International | |
Portfolio Management | |
ASC | | Other | | GATX Consolidated |
| Six Months Ended June 30, 2018 | | | | | | | | | | | | |
| Nine Months Ended September 30, 2018 | | | | | | | | | | | | |
| Revenues | | | | | | | | | | | | | | | | | | | | | | |
| Lease revenue | $ | 437.1 |
| | $ | 104.6 |
| | $ | 0.5 |
| | $ | 2.0 |
| | $ | — |
| | $ | 544.2 |
| $ | 655.3 |
| | $ | 156.9 |
| | $ | 0.8 |
| | $ | 3.1 |
| | $ | — |
| | $ | 816.1 |
|
| Marine operating revenue | — |
| | — |
| | 7.9 |
| | 62.1 |
| | — |
| | 70.0 |
| — |
| | — |
| | 11.0 |
| | 119.8 |
| | — |
| | 130.8 |
|
| Other revenue | 35.9 |
| | 4.2 |
| | 0.5 |
| | — |
| | — |
| | 40.6 |
| 51.1 |
| | 6.0 |
| | 0.5 |
| | — |
| | — |
| | 57.6 |
|
| Total Revenues | 473.0 |
| | 108.8 |
| | 8.9 |
| | 64.1 |
| | — |
| | 654.8 |
| 706.4 |
| | 162.9 |
| | 12.3 |
| | 122.9 |
| | — |
| | 1,004.5 |
|
| Expenses | | | | | | | | | | | | | | | | | | | | | | |
| Maintenance expense | 132.2 |
| | 23.7 |
| | — |
| | 7.3 |
| | — |
| | 163.2 |
| 192.8 |
| | 33.8 |
| | — |
| | 14.1 |
| | — |
| | 240.7 |
|
| Marine operating expense | — |
| | — |
| | 8.5 |
| | 41.6 |
| | — |
| | 50.1 |
| — |
| | — |
| | 12.9 |
| | 76.6 |
| | — |
| | 89.5 |
|
| Depreciation expense | 123.3 |
| | 27.9 |
| | 3.7 |
| | 3.6 |
| | — |
| | 158.5 |
| 185.8 |
| | 41.7 |
| | 5.5 |
| | 7.1 |
| | — |
| | 240.1 |
|
| Operating lease expense | 25.7 |
| | — |
| | — |
| | — |
| | — |
| | 25.7 |
| 37.5 |
| | — |
| | — |
| | — |
| | — |
| | 37.5 |
|
| Other operating expense | 14.4 |
| | 3.0 |
| | 0.3 |
| | — |
| | — |
| | 17.7 |
| 21.5 |
| | 4.3 |
| | 0.4 |
| | — |
| | — |
| | 26.2 |
|
| Total Expenses | 295.6 |
| | 54.6 |
| | 12.5 |
| | 52.5 |
| | — |
| | 415.2 |
| 437.6 |
| | 79.8 |
| | 18.8 |
| | 97.8 |
| | — |
| | 634.0 |
|
| Other Income (Expense) | | | | | | | | | | | | | | | | | | | | | | |
| Net gain on asset dispositions | 58.8 |
| | 2.7 |
| | 0.6 |
| | 0.1 |
| | — |
| | 62.2 |
| 68.4 |
| | 3.2 |
| | 0.8 |
| | 0.1 |
| | — |
| | 72.5 |
|
| Interest (expense) income, net | (61.3 | ) | | (17.6 | ) | | (5.0 | ) | | (2.8 | ) | | 4.6 |
| | (82.1 | ) | (93.1 | ) | | (26.5 | ) | | (7.6 | ) | | (4.3 | ) | | 6.8 |
| | (124.7 | ) |
| Other expense | (2.1 | ) | | (7.5 | ) | | — |
| | (0.1 | ) | | (1.4 | ) | | (11.1 | ) | (3.3 | ) | | (7.3 | ) | | — |
| | (0.2 | ) | | (4.1 | ) | | (14.9 | ) |
| Share of affiliates' pre-tax income | 0.3 |
| | — |
| | 33.3 |
| | — |
| | — |
| | 33.6 |
| 0.5 |
| | — |
| | 47.6 |
| | — |
| | — |
| | 48.1 |
|
| Segment profit | $ | 173.1 |
| | $ | 31.8 |
| | $ | 25.3 |
| | $ | 8.8 |
| | $ | 3.2 |
| | $ | 242.2 |
| $ | 241.3 |
| | $ | 52.5 |
| | $ | 34.3 |
| | $ | 20.7 |
| | $ | 2.7 |
| | $ | 351.5 |
|
| Less: | | | | | | | | | | | | | | | | | | | | | | |
| Selling, general and administrative expense | Selling, general and administrative expense | 91.1 |
| Selling, general and administrative expense | 137.6 |
|
| Income taxes (includes $6.3 related to affiliates' earnings) | 36.0 |
| |
| Income taxes (includes $9.0 related to affiliates' earnings) | | Income taxes (includes $9.0 related to affiliates' earnings) | 51.8 |
|
| Net income | Net income | $ | 115.1 |
| Net income | $ | 162.1 |
|
| | | | | | | | | | | | | | | | | | | | | | | |
| Net Gain on Asset Dispositions | | | | | | | | | | | | | | | | | | | | | | |
| Asset Remarketing Income: | | | | | | | | | | | | | | | | | | | | | | |
| Net gains on disposition of owned assets | $ | 54.1 |
| | $ | — |
| | $ | — |
| | $ | 0.1 |
| | $ | — |
| | $ | 54.2 |
| $ | 60.8 |
| | $ | — |
| | $ | — |
| | $ | 0.1 |
| | $ | — |
| | $ | 60.9 |
|
| Residual sharing income | 0.4 |
| | — |
| | 0.6 |
| | — |
| | — |
| | 1.0 |
| 0.9 |
| | — |
| | 0.8 |
| | — |
| | — |
| | 1.7 |
|
| Non-remarketing net gains (1) | 4.3 |
| | 2.7 |
| | — |
| | — |
| | — |
| | 7.0 |
| 6.7 |
| | 3.2 |
| | — |
| | — |
| | — |
| | 9.9 |
|
| | $ | 58.8 |
| | $ | 2.7 |
| | $ | 0.6 |
| | $ | 0.1 |
| | $ | — |
| | $ | 62.2 |
| $ | 68.4 |
| | $ | 3.2 |
| | $ | 0.8 |
| | $ | 0.1 |
| | $ | — |
| | $ | 72.5 |
|
| | | | | | | | | | | | | | | | | | | | | | | |
| Capital Expenditures | | | | | | | | | | | | | | | | | | | | | | |
| Portfolio investments and capital additions | $ | 285.6 |
| | $ | 64.1 |
| | $ | — |
| | $ | 15.8 |
| | $ | 1.5 |
| | $ | 367.0 |
| $ | 414.7 |
| | $ | 104.5 |
| | $ | — |
| | $ | 15.8 |
| | $ | 1.7 |
| | $ | 536.7 |
|
__________
(1) Includes net gains from scrapping of railcars.
Item 2. Management’s Discussion and Analysis of Financial Condition and Results of Operations
OVERVIEW
We lease, operate, manage, and remarket long-lived, widely-used assets, primarily in the rail market. We report our financial results through four primary business segments: Rail North America, Rail International, Portfolio Management, and American Steamship Company ("ASC").
The following discussion and analysis should be read in conjunction with the Management's Discussion and Analysis in our Annual Report on Form 10-K for the year ended December 31, 2018. We based the discussion and analysis that follows on financial data we derived from the financial statements prepared in accordance with U.S. Generally Accepted Accounting Standards ("GAAP") and on certain other financial data that we prepared using non-GAAP components. For a reconciliation of these non-GAAP components to the most comparable GAAP components, see "Non-GAAP Financial Measures" at the end of this item.
Operating results for the three and sixnine months ended JuneSeptember 30, 2019 are not necessarily indicative of the results we may achieve for the entire year ending December 31, 2019. In particular, ASC's fleet is inactive for a significant portion of the first quarter of each year due to winter conditions on the Great Lakes. In addition, asset remarketing income does not occur evenly throughout the year. For more information about our business, refer to our Annual Report on Form 10-K for the year ended December 31, 2018.
DISCUSSION OF OPERATING RESULTS
The following table shows a summary of our reporting segments and consolidated financial results (in millions, except per share data):
| | | | Three Months Ended
June 30 | | Six Months Ended
June 30 | Three Months Ended
September 30 | | Nine Months Ended
September 30 |
| | 2019 | | 2018 | | 2019 | | 2018 | 2019 | | 2018 | | 2019 | | 2018 |
| Segment Revenues | | | | | | | | | | | | | | |
| Rail North America | $ | 241.2 |
| | $ | 237.7 |
| | $ | 489.5 |
| | $ | 473.0 |
| $ | 238.5 |
| | $ | 233.4 |
| | $ | 728.0 |
| | $ | 706.4 |
|
| Rail International | 55.7 |
| | 54.4 |
| | 109.9 |
| | 108.8 |
| 58.0 |
| | 54.1 |
| | 167.9 |
| | 162.9 |
|
| Portfolio Management | 0.6 |
| | 4.1 |
| | 3.4 |
| | 8.9 |
| 2.3 |
| | 3.4 |
| | 5.7 |
| | 12.3 |
|
| ASC | 61.9 |
| | 53.3 |
| | 73.6 |
| | 64.1 |
| 61.9 |
| | 58.8 |
| | 135.5 |
| | 122.9 |
|
| | $ | 359.4 |
| | $ | 349.5 |
| | $ | 676.4 |
| | $ | 654.8 |
| $ | 360.7 |
| | $ | 349.7 |
| | $ | 1,037.1 |
| | $ | 1,004.5 |
|
| Segment Profit | | | | | | | | | | | | | | |
| Rail North America | $ | 85.8 |
| | $ | 64.2 |
| | $ | 154.2 |
| | $ | 173.1 |
| $ | 60.9 |
| | $ | 68.2 |
| | $ | 215.1 |
| | $ | 241.3 |
|
| Rail International | 21.3 |
| | 12.8 |
| | 36.1 |
| | 31.8 |
| 19.9 |
| | 20.7 |
| | 56.0 |
| | 52.5 |
|
| Portfolio Management | 11.9 |
| | 11.4 |
| | 24.2 |
| | 25.3 |
| 10.7 |
| | 9.0 |
| | 34.9 |
| | 34.3 |
|
| ASC | 12.1 |
| | 8.0 |
| | 14.6 |
| | 8.8 |
| 12.1 |
| | 11.9 |
| | 26.7 |
| | 20.7 |
|
| | 131.1 |
| | 96.4 |
| | 229.1 |
| | 239.0 |
| 103.6 |
| | 109.8 |
| | 332.7 |
| | 348.8 |
|
| Less: | | | | | | | | | | | | | | |
| Selling, general and administrative expense | 45.1 |
| | 46.2 |
| | 91.2 |
| | 91.1 |
| 44.4 |
| | 46.5 |
| | 135.6 |
| | 137.6 |
|
| Unallocated interest (income) expense | (1.5 | ) | | (2.0 | ) | | (3.2 | ) | | (4.6 | ) | (1.4 | ) | | (2.2 | ) | | (4.6 | ) | | (6.8 | ) |
| Other, including eliminations | 0.4 |
| | 1.2 |
| | 0.6 |
| | 1.4 |
| 0.6 |
| | 2.7 |
| | 1.2 |
| | 4.1 |
|
| Income taxes ($3.5 and $3.1 QTR and $7.0 and $6.3 YTD related to affiliates' earnings) | 19.1 |
| | 12.2 |
| | 31.0 |
| | 36.0 |
| |
Net Income | $ | 68.0 |
| | $ | 38.8 |
| | $ | 109.5 |
|
| $ | 115.1 |
| |
| Income taxes ($3.0 and $2.7 QTR and $10.0 and $9.0 YTD related to affiliates' earnings) | | 14.9 |
| | 15.8 |
| | 45.9 |
| | 51.8 |
|
Net Income (GAAP) | | $ | 45.1 |
| | $ | 47.0 |
| | $ | 154.6 |
|
| $ | 162.1 |
|
| | | | | | | | | | | | | | | |
| Net income, excluding tax adjustments and other items (non-GAAP) | $ | 65.2 |
| | $ | 44.6 |
| | $ | 106.7 |
| | $ | 120.9 |
| $ | 45.1 |
| | $ | 47.0 |
| | $ | 151.8 |
| | $ | 167.9 |
|
| Diluted earnings per share | $ | 1.86 |
| | $ | 1.01 |
| | $ | 2.97 |
| | $ | 2.99 |
| |
| Diluted earnings per share (GAAP) | | $ | 1.25 |
| | $ | 1.22 |
| | $ | 4.22 |
| | $ | 4.21 |
|
| Diluted earnings per share, excluding tax adjustments and other items (non-GAAP) | $ | 1.78 |
| | $ | 1.16 |
| | $ | 2.89 |
| | $ | 3.14 |
| $ | 1.25 |
| | $ | 1.22 |
| | $ | 4.15 |
| | $ | 4.36 |
|
| | | | | | | | | | | | | | | |
| Investment Volume | $ | 184.1 |
| | $ | 188.6 |
| | $ | 331.4 |
| | $ | 367.0 |
| $ | 191.1 |
| | $ | 169.7 |
| | $ | 522.5 |
| | $ | 536.7 |
|
The following table shows our return on equity ("ROE") for the trailing 12 months ended JuneSeptember 30:
| | | | 2019 | | 2018 | 2019 | | 2018 |
| ROE (GAAP) | 11.3 | % | | 31.0 | % | 11.2 | % | | 30.5 | % |
| ROE, excluding tax adjustments and other items (non-GAAP) (1) | 12.4 | % | | 13.3 | % | 12.3 | % | | 13.0 | % |
_________
| |
| (1) | See "Non-GAAP Financial Measures" at the end of this item for further details. |
Net income for the first sixnine months of 2019 was $109.5$154.6 million, or $2.97$4.22 per diluted share, compared to $115.1$162.1 million, or $2.99$4.21 per diluted share, in 2018. Results for the sixnine months ended JuneSeptember 30, 2019, included a net deferred tax benefit of $2.8 million, or $0.08$0.07 per diluted share, related to an enacted corporate income tax rate decrease in Alberta, Canada. Results for the sixnine months ended JuneSeptember 30, 2018 included a net negative impact of $5.8 million, or $0.15 per diluted share, attributedattributable to costs associated with the closure of a railcar maintenance facility at Rail International (see "Non-GAAP Financial Measures"Measures at the end of this item for further details). Excluding the impact of these items, net income decreased $14.2$16.1 million compared to the prior year, largely due to the timing of asset disposition gains at Rail North America, which were lower in the current year.year period.
Net income for the secondthird quarter of 2019 was $68.0$45.1 million, or $1.86$1.25 per diluted share, compared to $38.8$47.0 million, or $1.01$1.22 per diluted share, in 2018. Results for the second quarter of 2019 included a net deferred tax benefit of $2.8 million, or $0.08 per diluted share, related to an enacted corporateNet income tax rate decrease in Alberta, Canada. Results for the second quarter of 2018 included a net negative impact of $5.8 million, or $0.15 per diluted share, attributed to costs associated with the closure of a railcar maintenance facility at Rail International (see "Non-GAAP Financial Measures" at the end of this item fo further details). Excluding the impact of these items, net income increased $20.6decreased $1.9 million compared to the prior year largely due to the timing of asset disposition gains at Rail North America, which were higherlower in the current year.year period.
Segment Operations
Segment profit is an internal performance measure used by the Chief Executive Officer to assess the profitability of each segment. Segment profit includes all revenues, expenses, pre-tax earnings from affiliates, and net gains on asset dispositions that are directly attributable to each segment. We allocate interest expense to the segments based on what we believe to be the appropriate risk-adjusted borrowing costs for each segment. Segment profit excludes selling, general and administrative expenses, income taxes, and certain other amounts not allocated to the segments. These amounts are included in Other.
RAIL NORTH AMERICA
Segment Summary
During the quarter ended JuneSeptember 30, 2019, conditions in the North American railcar leasing market continueddeteriorated due to be challenging, asdecreased railcar loadings, increased railroad velocities, increased, railroad car loadings decreased, and the ongoing supply of new railcars entering the market remained robust.market. Despite this environment, Rail North America was able to maintain strong utilization throughout the quarter. At JuneSeptember 30, 2019, Rail North America's wholly owned fleet, excluding boxcars, consisted of approximately 103,600103,300 cars, and fleet utilization was 99.5%99.2% at JuneSeptember 30, 2019, compared to 99.4%99.5% at the end of the prior quarter, and 98.9%99.2% at JuneSeptember 30, 2018. Fleet utilization for our approximately 15,90015,800 boxcars was 94.1%93.5% at JuneSeptember 30, 2019, compared to 95.2%94.1% at the end of the prior quarter, and 92.8%94.7% at JuneSeptember 30, 2018.
For the secondthird quarter of 2019, an average of approximately 104,100102,700 railcars, excluding boxcars, were on lease, compared to 104,600104,100 in the prior quarter and 101,300 at June102,100 for the quarter ended September 30, 2018. The increaseChanges in railcars on lease compared to prior year is due to our ongoing purchasesperiods are impacted by the utilization of new railcars purchased under our supply agreements, with Trinity Industries and American Railcar Industries, as well as the acquisitionutilization of the railcars acquired from ECN Capital Corporation partially offset byin the prior year, and the disposition of railcars that were sold or scrapped. During the secondthird quarter of 2019, the renewal rate change of the Lease Price Index (the "LPI", see definition below) was negative 2.8%7.7%, compared to positive 5.2%negative 2.8% in the prior quarter, and negative 16.1%11.5% in the secondthird quarter of 2018. Lease terms on renewals for cars in the LPI averaged 40 months in the current quarter, compared to 3940 months in the prior quarter, and 4133 months in the secondthird quarter of 2018. Additionally, the renewal success rate, which represents the percentage of expiring leases that were renewed with the existing lessee, was 85.3%75.2% in the current quarter, compared to 83.6%85.3% in the prior quarter, and 78.6%82.9% in the secondthird quarter of 2018. Railcars returned by our customers may incur transitional costs, including additional repairs and related service prior to being leased to new customers, which may increase maintenance and associated expenses.
As of JuneSeptember 30, 2019, leases for approximately 10,6006,100 tank cars and freight cars and approximately 1,9001,200 boxcars are scheduled to expire over the remainder of 2019. These amounts exclude railcars on leases expiring in 2019 that have already been renewed or assigned to a new lessee.
The following table shows Rail North America's segment results (in millions):
| | | | Three Months Ended
June 30 | | Six Months Ended
June 30 | Three Months Ended
September 30 | | Nine Months Ended
September 30 |
| 2019 | | 2018 | | 2019 | | 2018 | 2019 | | 2018 | | 2019 | | 2018 |
| Revenues | | | | |
|
|
|
|
| | | | |
|
|
|
|
|
| Lease revenue | $ | 218.8 |
| | $ | 217.6 |
| | $ | 439.7 |
| | $ | 437.1 |
| $ | 214.6 |
| | $ | 218.2 |
| | $ | 654.3 |
| | $ | 655.3 |
|
| Other revenue | 22.4 |
| | 20.1 |
| | 49.8 |
| | 35.9 |
| 23.9 |
| | 15.2 |
| | 73.7 |
| | 51.1 |
|
| Total Revenues | 241.2 |
| | 237.7 |
| | 489.5 |
| | 473.0 |
| 238.5 |
| | 233.4 |
| | 728.0 |
| | 706.4 |
|
| | | | | | | | | | | | | | | |
| Expenses | | | | | | | | | | | | | | |
| Maintenance expense | 67.0 |
| | 64.1 |
| | 135.8 |
| | 132.2 |
| 64.0 |
| | 60.6 |
| | 199.8 |
| | 192.8 |
|
| Depreciation expense | 64.4 |
| | 61.8 |
| | 128.7 |
| | 123.3 |
| 63.9 |
| | 62.5 |
| | 192.6 |
| | 185.8 |
|
| Operating lease expense | 13.7 |
| | 12.7 |
| | 27.4 |
| | 25.7 |
| 13.7 |
| | 11.8 |
| | 41.1 |
| | 37.5 |
|
| Other operating expense | 6.4 |
| | 7.5 |
| | 12.8 |
| | 14.4 |
| 6.2 |
| | 7.1 |
| | 19.0 |
| | 21.5 |
|
| Total Expenses | 151.5 |
| | 146.1 |
| | 304.7 |
| | 295.6 |
| 147.8 |
| | 142.0 |
| | 452.5 |
| | 437.6 |
|
| | | | | | | | | | | | | | | |
| Other Income (Expense) | | | | | | | | | | | | | | |
| Net gain on asset dispositions | 32.1 |
| | 4.7 |
| | 40.3 |
| | 58.8 |
| 4.3 |
| | 9.6 |
| | 44.6 |
| | 68.4 |
|
| Interest expense, net | (34.1 | ) | | (31.1 | ) | | (68.3 | ) | | (61.3 | ) | (33.1 | ) | | (31.8 | ) | | (101.4 | ) | | (93.1 | ) |
| Other expense | (1.9 | ) | | (1.2 | ) | | (2.6 | ) | | (2.1 | ) | (1.0 | ) | | (1.2 | ) | | (3.6 | ) | | (3.3 | ) |
| Share of affiliates' pre-tax income | — |
| | 0.2 |
| | — |
| | 0.3 |
| — |
| | 0.2 |
| | — |
| | 0.5 |
|
Segment Profit | $ | 85.8 |
| | $ | 64.2 |
| | $ | 154.2 |
| | $ | 173.1 |
| $ | 60.9 |
| | $ | 68.2 |
| | $ | 215.1 |
| | $ | 241.3 |
|
| | | | | | | | | | | | | | | |
| Investment Volume | $ | 105.3 |
| | $ | 149.1 |
| | $ | 204.3 |
| | $ | 285.6 |
| $ | 138.1 |
| | $ | 129.1 |
| | $ | 342.4 |
| | $ | 414.7 |
|
The following table shows the components of Rail North America's lease revenue (in millions):
| | | | Three Months Ended
June 30 | | Six Months Ended
June 30 | Three Months Ended
September 30 | | Nine Months Ended
September 30 |
| | 2019 | | 2018 | | 2019 | | 2018 | 2019 | | 2018 | | 2019 | | 2018 |
| Railcars | $ | 191.2 |
| | $ | 188.9 |
| | $ | 383.5 |
| | $ | 379.5 |
| $ | 187.3 |
| | $ | 188.9 |
| | $ | 570.8 |
| | $ | 568.4 |
|
| Boxcars | 18.4 |
| | 19.0 |
| | 37.8 |
| | 38.3 |
| 17.9 |
| | 19.5 |
| | 55.7 |
| | 57.8 |
|
| Locomotives | 9.2 |
| | 9.7 |
| | 18.4 |
| | 19.3 |
| 9.4 |
| | 9.8 |
| | 27.8 |
| | 29.1 |
|
| Total | $ | 218.8 |
| | $ | 217.6 |
| | $ | 439.7 |
| | $ | 437.1 |
| $ | 214.6 |
| | $ | 218.2 |
| | $ | 654.3 |
| | $ | 655.3 |
|
Lease Price Index
Our LPI is an internally-generated business indicator that measures lease rate pricing on renewals for our North American railcar fleet, excluding boxcars. We calculate the index using the weighted-average lease rate for a group of railcar types that we believe best represents our overall North American fleet, excluding boxcars. The average renewal lease rate change is reported as the percentage change between the average renewal lease rate and the average expiring lease rate, weighted by fleet composition. The average renewal lease term is reported in months and reflects the average renewal lease term of railcar types in the LPI, weighted by fleet composition.
Rail North America Fleet Data
The following table shows fleet activity for Rail North America railcars, excluding boxcars, for the quarter ended:
| | | | June 30
2018 | | September 30
2018 | | December 31
2018 | | March 31
2019 | | June 30
2019 | September 30
2018 | | December 31
2018 | | March 31
2019 | | June 30
2019 | | September 30
2019 |
| Beginning balance | 102,597 |
| | 102,890 |
| | 103,420 |
| | 105,472 |
| | 104,830 |
| 102,890 |
| | 103,420 |
| | 105,472 |
| | 104,830 |
| | 103,554 |
|
| Cars added | 1,231 |
| | 1,381 |
| | 3,120 |
| | 617 |
| | 661 |
| 1,381 |
| | 3,120 |
| | 617 |
| | 661 |
| | 902 |
|
| Cars scrapped | (720 | ) | | (431 | ) | | (387 | ) | | (662 | ) | | (377 | ) | (431 | ) | | (387 | ) | | (662 | ) | | (377 | ) | | (513 | ) |
| Cars sold | (218 | ) | | (420 | ) | | (681 | ) | | (597 | ) | | (1,560 | ) | (420 | ) | | (681 | ) | | (597 | ) | | (1,560 | ) | | (688 | ) |
| Ending balance | 102,890 |
| | 103,420 |
| | 105,472 |
| | 104,830 |
| | 103,554 |
| 103,420 |
| | 105,472 |
| | 104,830 |
| | 103,554 |
| | 103,255 |
|
| Utilization rate at quarter end | 98.9 | % | | 99.2 | % | | 99.4 | % | | 99.4 | % | | 99.5 | % | 99.2 | % | | 99.4 | % | | 99.4 | % | | 99.5 | % | | 99.2 | % |
| Average active railcars | 101,330 |
| | 102,056 |
| | 103,387 |
| | 104,613 |
| | 104,089 |
| 102,056 |
| | 103,387 |
| | 104,613 |
| | 104,089 |
| | 102,653 |
|
The following table shows fleet statistics for Rail North America boxcars for the quarter ended:
| | | | June 30
2018 | | September 30
2018 | | December 31
2018 | | March 31
2019 | | June 30
2019 | September 30
2018 | | December 31
2018 | | March 31
2019 | | June 30
2019 | | September 30
2019 |
| Ending balance | 16,007 |
| | 15,859 |
| | 16,220 |
| | 16,006 |
| | 15,921 |
| 15,859 |
| | 16,220 |
| | 16,006 |
| | 15,921 |
| | 15,803 |
|
| Utilization | 92.8 | % | | 94.7 | % | | 94.2 | % | | 95.2 | % | | 94.1 | % | 94.7 | % | | 94.2 | % | | 95.2 | % | | 94.1 | % | | 93.5 | % |
Comparison of the First SixNine Months of 2019 to the First SixNine Months of 2018
Segment Profit
In the first sixnine months of 2019, segment profit of $154.2$215.1 million decreased 10.9% compared to $173.1$241.3 million for the same period in the prior year. The decrease was driven by lower net gains on asset dispositions in the current year and higher maintenance expense, offset by higher repair revenue, lease termination fees, and lease revenue. The timing of asset remarketing income varies throughout the year.
Revenues
In the first sixnine months of 2019, lease revenue increased $2.6decreased $1.0 million, or 0.6%, primarily due to0.2%. Specifically, lower usage rents on boxcars was substantially offset by more railcarscars on lease across all other car types, including the railcars acquired from ECN Capital Corporation partially offset by lower average lease rates.in the prior year. Other revenue increased $13.9$22.6 million, due to higher repair revenue and higher lease termination fees in the current year, which included reimbursement for damage to a group of returned railcars that were scrapped.
Expenses
In the first sixnine months of 2019, maintenance expense increased $3.6$7.0 million, driven by more tank qualifications in the current year, as expected, and other repairs.as well as higher repairs performed by the railroads. Depreciation expense increased $5.4$6.8 million due to new railcar investments, including the railcars acquired from ECN Capital Corporation.Corporation in the prior year. Operating lease expense increased $1.7$3.6 million, resulting from new leases on railcars entered into during the prior year, as well as the elimination of the deferred gain amortization for sale-leaseback transactions in accordance with the new lease standard. See "Note 2. Basis of Presentation" and "Note 4. Leases" in Part I, Item 1 of this Form 10-Q for further detail regarding the impact of the new lease accounting standard. Other operating expense decreased $1.6$2.5 million primarily due to lower switching, freight, and storage costs resulting from higher utilization.costs.
Other Income (Expense)
In the first sixnine months of 2019, net gain on asset dispositions decreased $18.5$23.8 million, as more railcars were sold at a lower average net gain per railcar. Net scrapping gains were also lower in the current year due to fewer railcars scrapped and lower scrap prices, as well as a scrapping loss related to the railcars subject tothat were returned in connection with the lease termination noted above.above in Revenues. Net interest expense increased $7.0$8.3 million, driven by a higher average interest rate and a higher average debt balance, as a result of investment volume in both years.years, and a higher average interest rate. Other expense increased $0.5$0.3 million, primarily due to costs related to the early termination of a secured credit facility.
Investment Volume
During the first sixnine months of 2019, investment volume was $204.3$342.4 million compared to $285.6$414.7 million in the same period in 2018. We acquired 9301,814 newly built railcars and purchased 366 railcars in the secondary market in the first halfnine months of 2019, compared to 2,3193,045 newly built railcars and 45793 railcars purchased in the secondary market in the same period in 2018.
Our investment volume is predominantly composed of acquired railcars, but also includes certain capitalized repairs and improvements to owned railcars and our maintenance facilities. As a result, the dollar value of investment volume does not necessarily correspond to the number of railcars acquired in any given period. In addition, the comparability of amounts invested and the number of railcars acquired in each period is impacted by the mix of railcars purchased, which may include tank cars and freight cars, as well as newly manufactured railcars or those purchased in the secondary market.
Comparison of the SecondThird Quarter of 2019 to the SecondThird Quarter of 2018
Segment Profit
In the secondthird quarter of 2019, segment profit of $85.8$60.9 million increased 33.6%decreased 10.7% compared to $64.2$68.2 million for the same period in the prior year. The increasedecrease was driven by higherlower net gains on asset dispositions in the current year, as well as higher repair revenuemaintenance expense, and lower lease revenue, partially offset by higher maintenance expense.repair revenue. The timing of asset remarketing income varies throughout the year.
Revenues
In the secondthird quarter of 2019, lease revenue increased $1.2decreased $3.6 million, or 0.6%1.6%, primarily due to lower usage rents on boxcars. Lease revenue on other car types was also lower as the impact of lower average lease rates substantially offset more railcars on lease, including the railcars acquired from ECN Capital Corporation, partially offset by lower average lease rates.Corporation. Other revenue increased $2.3$8.7 million due to higher repair revenue.revenue and higher lease termination fees.
Expenses
In the secondthird quarter of 2019, maintenance expense increased $2.9$3.4 million, driven by more tank qualifications in the current year, as expected, as well as higher material costs, partially offset by fewer repairs performed by the railroads. Depreciation expense increased $2.6$1.4 million due to new railcar investments, including the railcars acquired from ECN Capital Corporation.Corporation in the prior year. Operating lease expense increased $1.0$1.9 million, resulting from new leases on railcars entered into during the prior year, as well as the elimination of the deferred gain amortization for sale-leaseback transactions in accordance with the new lease standard. See "Note 2. Basis of Presentation" and "Note 4. Leases" in Part I, Item 1 of this Form 10-Q for further detail regarding the impact of the new lease accounting standard. Other operating expense decreased $1.1$0.9 million due to lower switching freight, and storage costs, resulting from higher utilization.costs.
Other Income (Expense)
In the secondthird quarter of 2019, net gain on asset dispositions increased $27.4decreased $5.3 million, attributable to morefewer railcars sold and higherlower net scrapping gains in the current year. Net interest expense increased $3.0$1.3 million, driven by a higher average interest rate and a higher average debt balance, as a result of investment volume in both years.years, and a higher average interest rate. Other expense increased $0.7 million due to costs relatedwas comparable to the early termination of a secured credit facility.prior year.
RAIL INTERNATIONAL
Segment Summary
Rail International, composed primarily of GATX Rail Europe ("GRE"), continued to produce strong operating results in the first sixnine months of 2019. In Europe, the lease rate environment continued to be strong and demand for new cars was steady. Railcar utilization for GRE was 98.9%99.4% at JuneSeptember 30, 2019, compared to 98.9% at the end of the prior quarter and 97.8%98.4% at JuneSeptember 30, 2018. In addition, Rail India and Rail Russia each benefited from more cars on lease as they continue to expand their fleets.
In the second quarter of 2018, GRE recorded $8.6 million of expense attributable to the closure of a railcar maintenance facility in Germany.
The following table shows Rail International's segment results (in millions):
| | | | Three Months Ended
June 30 | | Six Months Ended
June 30 | Three Months Ended
September 30 | | Nine Months Ended
September 30 |
| | 2019 | | 2018 | | 2019 | | 2018 | 2019 | | 2018 | | 2019 | | 2018 |
| Revenues | | | | | | | | | | | | | | |
| Lease revenue | $ | 53.9 |
| | $ | 52.2 |
| | $ | 106.1 |
| | $ | 104.6 |
| $ | 55.6 |
| | $ | 52.3 |
| | $ | 161.7 |
| | $ | 156.9 |
|
| Other revenue | 1.8 |
| | 2.2 |
| | 3.8 |
| | 4.2 |
| 2.4 |
| | 1.8 |
| | 6.2 |
| | 6.0 |
|
| Total Revenues | 55.7 |
| | 54.4 |
| | 109.9 |
| | 108.8 |
| 58.0 |
| | 54.1 |
| | 167.9 |
| | 162.9 |
|
| | | | | | | | | | | | | | | |
| Expenses | | | | | | | | | | | | | | |
| Maintenance expense | 11.2 |
| | 11.2 |
| | 23.3 |
| | 23.7 |
| 12.2 |
| | 10.1 |
| | 35.5 |
| | 33.8 |
|
| Depreciation expense | 14.2 |
| | 13.8 |
| | 28.2 |
| | 27.9 |
| 14.5 |
| | 13.8 |
| | 42.7 |
| | 41.7 |
|
| Other operating expense | 1.3 |
| | 1.5 |
| | 2.8 |
| | 3.0 |
| 1.4 |
| | 1.3 |
| | 4.2 |
| | 4.3 |
|
| Total Expenses | 26.7 |
| | 26.5 |
| | 54.3 |
| | 54.6 |
| 28.1 |
| | 25.2 |
| | 82.4 |
| | 79.8 |
|
| | | | | | | | | | | | | | | |
| Other Income (Expense) | | | | | | | | | | | | | | |
| Net gain on asset dispositions | 0.5 |
| | 1.1 |
| | 0.9 |
| | 2.7 |
| 0.3 |
| | 0.5 |
| | 1.2 |
| | 3.2 |
|
| Interest expense, net | (10.1 | ) | | (8.9 | ) | | (20.0 | ) | | (17.6 | ) | (10.2 | ) | | (8.9 | ) | | (30.2 | ) | | (26.5 | ) |
| Other income (expense) | 1.9 |
| | (7.3 | ) | | (0.4 | ) | | (7.5 | ) | |
| Other (expense) income | | (0.1 | ) | | 0.2 |
| | (0.5 | ) | | (7.3 | ) |
Segment Profit | $ | 21.3 |
| | $ | 12.8 |
| | $ | 36.1 |
| | $ | 31.8 |
| $ | 19.9 |
| | $ | 20.7 |
| | $ | 56.0 |
| | $ | 52.5 |
|
| | | | | | | | | | | | | | | |
| Investment Volume | $ | 73.7 |
| | $ | 34.6 |
| | $ | 106.8 |
| | $ | 64.1 |
| $ | 51.8 |
| | $ | 40.4 |
| | $ | 158.6 |
| | $ | 104.5 |
|
The following table shows fleet activity for GRE railcars for the quarter ended:
| | | | June 30
2018 | | September 30
2018 | | December 31
2018 | | March 31
2019 | | June 30
2019 | September 30
2018 | | December 31
2018 | | March 31
2019 | | June 30
2019 | | September 30
2019 |
| Beginning balance | 23,004 |
| | 23,124 |
| | 23,234 |
| | 23,412 |
| | 23,531 |
| 23,124 |
| | 23,234 |
| | 23,412 |
| | 23,531 |
| | 23,967 |
|
| Cars added | 245 |
| | 258 |
| | 281 |
| | 185 |
| | 491 |
| 258 |
| | 281 |
| | 185 |
| | 491 |
| | 325 |
|
| Cars scrapped or sold | (125 | ) | | (148 | ) | | (103 | ) | | (66 | ) | | (55 | ) | (148 | ) | | (103 | ) | | (66 | ) | | (55 | ) | | (81 | ) |
| Ending balance | 23,124 |
| | 23,234 |
| | 23,412 |
| | 23,531 |
| | 23,967 |
| 23,234 |
| | 23,412 |
| | 23,531 |
| | 23,967 |
| | 24,211 |
|
| Utilization rate at quarter end | 97.8 | % | | 98.4 | % | | 98.8 | % | | 98.9 | % | | 98.9 | % | 98.4 | % | | 98.8 | % | | 98.9 | % | | 98.9 | % | | 99.4 | % |
| Average active railcars | 22,407 |
| | 22,759 |
| | 22,949 |
| | 23,105 |
| | 23,480 |
| 22,759 |
| | 22,949 |
| | 23,105 |
| | 23,480 |
| | 23,877 |
|
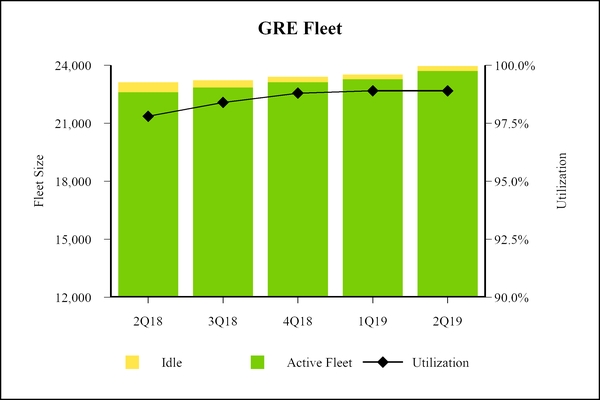
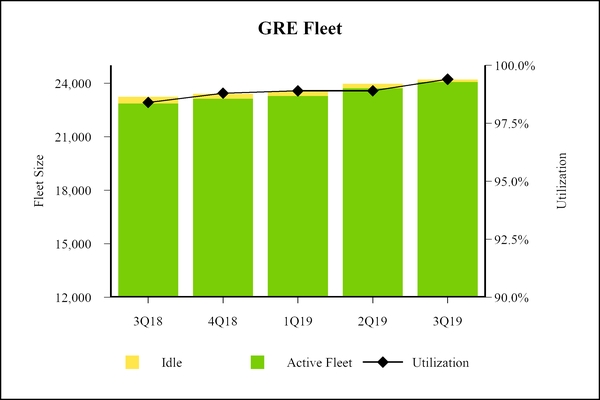 \
\
Comparison of the First SixNine Months of 2019 to the First SixNine Months of 2018
Foreign Currency
Rail International's reported financial results of operations are impacted by fluctuations in the exchange rates of the foreign currencies in which it conducts business, primarily the euro. In the first sixnine months of 2019, a weaker euro negatively impacted lease revenue by approximately $6.9$9.2 million and segment profit, excluding other income (expense), by approximately $3.2$4.3 million compared to the same period in 2018.
Segment Profit
In the first sixnine months of 2019, segment profit of $36.1$56.0 million increased 13.5%6.7% compared to $31.8$52.5 million for the same period in the prior year. The increase was largely due to the absence of the railcar maintenance facility closure costs recorded in the prior year, as well as revenue from more railcars on lease, partially offset by the negative impact of foreign exchange rates.
Revenues
In the first sixnine months of 2019, lease revenue increased $1.5$4.8 million, or 1.4%3.1%, as the revenue from more railcars on lease was partially offset by the impact of foreign exchange rates. Other revenue decreased $0.4increased $0.2 million, primarily due to lowerhigher repair revenue.
Expenses
In the first sixnine months of 2019, maintenance expense decreased $0.4increased $1.7 million, primarily due to higher regulatory compliance and wheelset costs, as well as other repairs. These negative impacts were partially offset by lower workshop costs, due in part to the elimination of expenses associated with the maintenance facility in Germany that was closed in the prior year, as well as the impact of foreign exchange rates. These positive impacts were offset by higher wheelset costs and other repairs. Depreciation expense increased $0.3$1.0 million, as the impact of new railcars added to the fleet was partially offset by the impact of foreign exchange rates.
Other Income (Expense)
In the first sixnine months of 2019, net gain on asset dispositions decreased $1.8$2.0 million, attributable to lower railcar scrapping gains, due toas a result of fewer railcars scrapped in the current year. Net interest expense increased $2.4$3.7 million, due to a higher average interest rate and a higher average debt balance. Other expense decreased $7.1$6.8 million, driven by the absence of the railcar maintenance facility closure costs recorded in the prior year and lower net litigation costs related to the Viareggio matter, which reflected insurance proceeds received in the current year, and the absence of the railcar maintenance facility closure costs recordedyear. Decreases in the prior year. These decreasesthese expenses were partially offset by the negative impact of changes in foreign exchange rates on non-functional currency items.
Investment Volume
During the first sixnine months of 2019, investment volume was $106.8$158.6 million compared to $64.1$104.5 million in the same period in 2018. In the first sixnine months of 2019, GRE acquired 6761,001 railcars, Rail India acquired 7071,161 railcars, and Rail Russia acquired 26 railcars, compared to 308566 railcars at GRE, 306648 railcars at Rail India and 2464 railcars at Rail Russia for the same period in 2018.
Our investment volume is predominantly composed of acquired railcars, but may also include certain capitalized repairs and improvements to owned railcars. As a result, the dollar value of investment volume does not necessarily correspond to the number of railcars acquired in any given period. In addition, the comparability of amounts invested and the number of railcars acquired in each period is impacted by the mix of the various car types acquired, as well as fluctuations in the exchange rates of the foreign currencies in which Rail International conducts business.
Comparison of the SecondThird Quarter of 2019 to the SecondThird Quarter of 2018
Foreign Currency
Rail International's reported financial results of operations are impacted by fluctuations in the exchange rates of the foreign currencies in which it conducts business, primarily the euro. In the secondthird quarter of 2019, a weaker euro negatively impacted lease revenue by approximately $2.9$2.3 million and segment profit, excluding other income (expense), by approximately $1.2$1.1 million compared to the same period in 2018.
Segment Profit
In the secondthird quarter of 2019, segment profit of $21.3$19.9 million increased 66.4%decreased 3.9% compared to $12.8$20.7 million for the same period in the prior year. The increasedecrease was largely due to the absence of the railcarhigher maintenance facility closure costs recorded in the prior year, as well as more railcars on lease, partially offset byexpenses and the negative impact of foreign exchange rates.rates, partially offset by revenue from more railcars on lease.
Revenues
In the secondthird quarter of 2019, lease revenue increased $1.7$3.3 million, or 3.3%6.3%, as the revenue from more railcars on lease was partially offset by the impact of foreign exchange rates. Other revenue decreased $0.4increased $0.6 million, primarily due to lowerhigher repair revenue.
Expenses
In the secondthird quarter of 2019, maintenance expense was comparable to prior yearincreased $2.1 million, driven by higher regulatory compliance and wheelset costs, as well as other repairs. These negative impacts were partially offset by lower workshop costs, due in part to the elimination of expenses associated with the maintenance facility in Germany that was closed in the prior year, andas well as the impact of foreign exchange rates were offset by higher repairs.rates. Depreciation expense increased $0.4$0.7 million as the impact of new railcars added to the fleet was partially offset by the impact of foreign exchange rates.
Other Income (Expense)
In the secondthird quarter of 2019, net gain on asset dispositions decreased $0.6$0.2 million, attributable to lower railcar scrapping gains, due to fewer railcars scrapped in the current year. Net interest expense increased $1.2$1.3 million, due to a higher average debt balance and a higher average interest rate. Other expense decreased $9.2increased $0.3 million due to lower net litigation costs related to the Viareggio matter, which reflected insurance proceeds received in the current year, and the absence of the railcar maintenance facility closure costs recorded in the prior year. These decreases were partially offset by the negative impact of changes in foreign exchange rates on non-functional currency items.
PORTFOLIO MANAGEMENT
Segment Summary
Portfolio Management's segment profit is primarily comprised of income from the RRPF affiliates, a group of 50% owned domestic and foreign joint ventures with Rolls-Royce plc (or affiliates thereof, collectively "Rolls-Royce"), a leading manufacturer of commercial aircraft jet engines. Segment profit included earnings from the RRPF affiliates of $37.8$53.6 million and $19.6$15.8 million for the sixnine months and three months ended JuneSeptember 30, 2019, compared to $33.3$47.6 million and $15.9$14.3 million for the same period in 2018. As of JuneSeptember 30, 2019, the RRPF affiliates owned 461456 aircraft spare engines with a net book value of approximately $4,537.8$4,556.2 million, compared to 452 aircraft spare engines with a net book value of approximately $4,435.6 million at December 31, 2018 and 449439 aircraft spare engines with a net book value of approximately $3,965.6$3,959.0 million at JuneSeptember 30, 2018.
Portfolio Management also owns marine assets, consisting primarily of five liquefied gas-carrying vessels (the "Specialized Gas Vessels"), previously referred to as the Norgas Vessels. During the second quarter of 2019, the prior commercial management agreement with Norgas Carriers Private Limited expired,was terminated, and we entered into a new agreement was entered into with Anthony Veder Group B.V. ("Veder"). to manage these vessels. Veder, based in the Netherlands, owns and operates a fleet of specialized gas-carrying vessels under contracts and charters with customers in the oil and gas industry. As a result of this transition, the Specialized Gas Vessels were idle for a significant portion of the second quarter of 2019. However, during the third quarter, as Veder began commercial management of the Specialized Gas Vessels, we saw increased utilization and expect future operating results to improve as the Specialized Gas Vessels commencecontinue operation pursuant to the new commercial agreement. The Specialized Gas Vessels are utilized to transport pressurized gases and chemicals, such as liquefied petroleum gas, liquefied natural gas, and ethylene, primarily on short-term spot contracts for major oil and chemical customers worldwide.
Portfolio Management's total asset base was $628.8$639.6 million at JuneSeptember 30, 2019, compared to $606.8 million at December 31, 2018, and $606.0$614.9 million at JuneSeptember 30, 2018.
The following table shows Portfolio Management’s segment results (in millions):
| | | | Three Months Ended
June 30 | | Six Months Ended
June 30 | Three Months Ended
September 30 | | Nine Months Ended
September 30 |
| | 2019 | | 2018 | | 2019 | | 2018 | 2019 | | 2018 | | 2019 | | 2018 |
| Revenues | | | | | | | | | | | | | | |
| Lease revenue | $ | 0.2 |
| | $ | 0.2 |
| | $ | 0.5 |
| | $ | 0.5 |
| $ | 0.3 |
| | $ | 0.3 |
| | $ | 0.8 |
| | $ | 0.8 |
|
| Marine operating revenue | 0.1 |
| | 3.5 |
| | 2.5 |
| | 7.9 |
| 1.9 |
| | 3.1 |
| | 4.4 |
| | 11.0 |
|
| Other revenue | 0.3 |
| | 0.4 |
| | 0.4 |
| | 0.5 |
| 0.1 |
| | — |
| | 0.5 |
| | 0.5 |
|
| Total Revenues | 0.6 |
| | 4.1 |
| | 3.4 |
| | 8.9 |
| 2.3 |
| | 3.4 |
| | 5.7 |
| | 12.3 |
|
| | | | | | | | | | | | | | | |
| Expenses | | | | | | | | | | | | | | |
| Marine operating expense | 4.0 |
| | 4.2 |
| | 8.6 |
| | 8.5 |
| 3.4 |
| | 4.4 |
| | 12.0 |
| | 12.9 |
|
| Depreciation expense | 1.7 |
| | 1.9 |
| | 3.3 |
| | 3.7 |
| 1.6 |
| | 1.8 |
| | 4.9 |
| | 5.5 |
|
| Other operating expense | 0.1 |
| | 0.1 |
| | 0.2 |
| | 0.3 |
| 0.1 |
| | 0.1 |
| | 0.3 |
| | 0.4 |
|
| Total Expenses | 5.8 |
| | 6.2 |
| | 12.1 |
| | 12.5 |
| 5.1 |
| | 6.3 |
| | 17.2 |
| | 18.8 |
|
| | | | | | | | | | | | | | | |
| Other Income (Expense) | | | | | | | | | | | | | | |
| Net gain on asset dispositions | 0.3 |
| | 0.3 |
| | 0.6 |
| | 0.6 |
| 0.5 |
| | 0.2 |
| | 1.1 |
| | 0.8 |
|
| Interest expense, net | (2.8 | ) | | (2.7 | ) | | (5.5 | ) | | (5.0 | ) | (2.8 | ) | | (2.6 | ) | | (8.3 | ) | | (7.6 | ) |
| Share of affiliates' pre-tax income | 19.6 |
| | 15.9 |
| | 37.8 |
| | 33.3 |
| 15.8 |
| | 14.3 |
| | 53.6 |
| | 47.6 |
|
Segment Profit | $ | 11.9 |
| | $ | 11.4 |
| | $ | 24.2 |
| | $ | 25.3 |
| $ | 10.7 |
| | $ | 9.0 |
| | $ | 34.9 |
| | $ | 34.3 |
|
The following table shows the net book values of Portfolio Management's assets (in millions):
| | | | June 30
2018 | | September 30
2018 | | December 31
2018 | | March 31
2019 | | June 30
2019 | September 30
2018 | | December 31
2018 | | March 31
2019 | | June 30
2019 | | September 30
2019 |
| Investment in RRPF Affiliates | $ | 462.1 |
| | $ | 474.8 |
| | $ | 464.3 |
| | $ | 479.8 |
| | $ | 495.6 |
| $ | 474.8 |
| | $ | 464.3 |
| | $ | 479.8 |
| | $ | 495.6 |
| | $ | 506.5 |
|
| Owned assets | 143.9 |
| | 140.1 |
| | 142.5 |
| | 138.5 |
| | 133.2 |
| 140.1 |
| | 142.5 |
| | 138.5 |
| | 133.2 |
| | 133.1 |
|
| Managed assets (1) | 36.0 |
| | 34.1 |
| | 32.3 |
| | 30.4 |
| | 28.5 |
| 34.1 |
| | 32.3 |
| | 30.4 |
| | 28.5 |
| | 26.6 |
|
________
| |
| (1) | Amounts shown represent the estimated net book value of assets managed for third parties and are not included in our consolidated balance sheets. |
RRPF Affiliates Engine Portfolio Data
The following table shows portfolio activity for the RRPF affiliates' aircraft spare engines for the quarter ended:
| | | | June 30
2018 | | September 30
2018 | | December 31
2018 | | March 31
2019 | | June 30
2019 | September 30
2018 | | December 31
2018 | | March 31
2019 | | June 30
2019 | | September 30
2019 |
| Beginning balance | 437 |
| | 449 |
| | 439 |
| | 452 |
| | 462 |
| 449 |
| | 439 |
| | 452 |
| | 462 |
| | 461 |
|
| Engine acquisitions | 17 |
| | 3 |
| | 19 |
| | 11 |
| | 3 |
| 3 |
| | 19 |
| | 11 |
| | 3 |
| | 5 |
|
| Engine dispositions | (5 | ) | | (13 | ) | | (6 | ) | | (1 | ) | | (4 | ) | (13 | ) | | (6 | ) | | (1 | ) | | (4 | ) | | (10 | ) |
| Ending balance | 449 |
| | 439 |
| | 452 |
| | 462 |
| | 461 |
| 439 |
| | 452 |
| | 462 |
| | 461 |
| | 456 |
|
| Utilization rate at quarter end | 94.7 | % | | 96.8 | % | | 96.9 | % | | 96.8 | % | | 97.0 | % | 96.8 | % | | 96.9 | % | | 96.8 | % | | 97.0 | % | | 95.6 | % |
Comparison of the First SixNine Months of 2019 to the First SixNine Months of 2018
Segment Profit
In the first sixnine months of 2019, segment profit was $24.2$34.9 million, compared to $25.3$34.3 million for the same period in the prior year. The decreaseincrease reflects higher RRPF affiliate income, partially offset by a lower contribution from the Specialized Gas Vessels, partially offset by higher RRPF affiliate income.Vessels.
Revenues
In the first sixnine months of 2019, lease revenue was comparable to the same period in the prior year.year period. Marine operating revenue decreased $5.4$6.6 million, due to lower revenue from the Specialized Gas Vessels. In the current year period, utilization of the vessels was lower due to idle time associated with the transition to a new commercial manager, as discussed above.previously.
Expenses
In the first sixnine months of 2019, marine operating expense was comparabledecreased $0.9 million, due to the same period in the prior year, aslower operating expenses continued to be incurred despitefor the Specialized Gas Vessels being idle for a portion of the current year.Vessels.
Other Income (Expense)
In the first sixnine months of 2019, income from our share of affiliates' earnings increased $4.5$6.0 million, driven by higher asset remarketing income and higher operating results. The increase in asset remarketing income resulted from higher disposition gains on engines sold. Operating results were higher as a result of the contribution from additionalmore engines on lease, as well as an early lease termination fee recognized in the current year, partially offset by higher depreciation expense on engines, due to a change in the useful life of certain engine types.year.
Comparison of the SecondThird Quarter of 2019 to the SecondThird Quarter of 2018
Segment Profit
In the secondthird quarter of 2019, segment profit was $11.9$10.7 million, compared to $11.4$9.0 million for the same period in the prior year.year period. The increase reflects higher income from the RRPF affiliates, partially offset by a lower contribution from the Specialized Gas Vessels.
Revenues
In the secondthird quarter of 2019, lease revenue was comparable to the same period in 2018. Marine operating revenue decreased $3.4$1.2 million, due to lower revenue from the Specialized Gas Vessels. In the current year period, utilization of the vessels was lower due to idle time associated with the transition to a new commercial manager, as discussed above.previously.
Expenses
In the secondthird quarter of 2019, marine operating expense was comparabledecreased $1.0 million, due to the same period in the prior year, aslower operating expenses continued to be incurred despitefor the Specialized Gas Vessels being idle for a portion of the current quarter.Vessels.
Other Income (Expense)
In the secondthird quarter of 2019, income from our share of affiliates' earnings increased $3.7$1.5 million, driven by higher asset remarketing income partially offset by lowerand higher operating results. TheOperating results were higher asset remarketing income resulted from higher disposition gains on engines sold. The decrease in operating results was due to higher depreciation expense due toas a change in the useful liferesult of certain engine types, which more than offset the contribution from additionalmore engines on lease.
ASC
Segment Summary
During the first sixnine months of 2019, ASC benefited from favorable sailing conditions and high water levels, allowing the vessels to operate more efficiently. In the first six months of 2019, ASC carried 9.919.5 million net tons of freight in the first nine months of 2019, compared to 9.017.7 million net tons during the first six months ofsame period in 2018.
In February 2019, one of ASC's vessels was damaged by a fire during winter maintenance. An assessment of the extent of the damage and potential outcomes for the vessel is ongoing; however, the ultimate impact is not expected to have a material adverse effect on operations or cash flows.
The following table shows ASC’s segment results (in millions):
| | | | Three Months Ended
June 30 | | Six Months Ended
June 30 | Three Months Ended
September 30 | | Nine Months Ended
September 30 |
| | 2019 | | 2018 | | 2019 | | 2018 | 2019 | | 2018 | | 2019 | | 2018 |
| Revenues | | | | | | | | | | | | | | |
| Lease revenue | $ | 1.1 |
| | $ | 1.0 |
| | $ | 2.1 |
| | $ | 2.0 |
| $ | 1.0 |
| | $ | 1.1 |
| | $ | 3.1 |
| | $ | 3.1 |
|
| Marine operating revenue | 60.8 |
| | 52.3 |
| | 71.5 |
| | 62.1 |
| 60.9 |
| | 57.7 |
| | 132.4 |
| | 119.8 |
|
| Total Revenues | 61.9 |
| | 53.3 |
| | 73.6 |
| | 64.1 |
| 61.9 |
| | 58.8 |
| | 135.5 |
| | 122.9 |
|
| | | | | | | | | | | | | | | |
| Expenses | | | | | | | | | | | | | | |
| Maintenance expense | 7.5 |
| | 6.7 |
| | 7.8 |
| | 7.3 |
| 8.2 |
| | 6.8 |
| | 16.0 |
| | 14.1 |
|
| Marine operating expense | 37.0 |
| | 33.4 |
| | 44.5 |
| | 41.6 |
| 36.3 |
| | 35.0 |
| | 80.8 |
| | 76.6 |
|
| Depreciation expense | 3.5 |
| | 3.6 |
| | 3.5 |
| | 3.6 |
| 3.6 |
| | 3.5 |
| | 7.1 |
| | 7.1 |
|
| Total Expenses | 48.0 |
| | 43.7 |
| | 55.8 |
| | 52.5 |
| 48.1 |
| | 45.3 |
| | 103.9 |
| | 97.8 |
|
| | | | | | | | | | | | | | | |
| Other Income (Expense) | | | | | | | | | | | | | | |
| Net gain on asset dispositions | — |
| | — |
| | — |
| | 0.1 |
| — |
| | — |
| | — |
| | 0.1 |
|
| Interest expense, net | (1.6 | ) | | (1.5 | ) | | (3.0 | ) | | (2.8 | ) | (1.6 | ) | | (1.5 | ) | | (4.6 | ) | | (4.3 | ) |
| Other expense | (0.2 | ) | | (0.1 | ) | | (0.2 | ) | | (0.1 | ) | (0.1 | ) | | (0.1 | ) | | (0.3 | ) | | (0.2 | ) |
| Segment Profit | $ | 12.1 |
| | $ | 8.0 |
| | $ | 14.6 |
| | $ | 8.8 |
| $ | 12.1 |
| | $ | 11.9 |
| | $ | 26.7 |
| | $ | 20.7 |
|
| | | | | | | | | | | | | | | |
| Investment Volume | $ | 3.9 |
| | $ | 4.1 |
| | $ | 18.4 |
| | $ | 15.8 |
| $ | 0.3 |
| | $ | — |
| | $ | 18.7 |
| | $ | 15.8 |
|
| Total Net Tons Carried (000's) | 8,704 |
| | 8,068 |
| | 9,902 |
| | 9,007 |
| 9,576 |
| | 8,703 |
| | 19,478 |
| | 17,710 |
|
Comparison of the First SixNine Months of 2019 to the First SixNine Months of 2018
Segment Profit
In the first sixnine months of 2019, segment profit was $14.6$26.7 million, compared to $8.8$20.7 million for the same period in the prior year. The increase was driven by higher volume as a result of favorable operating conditions and an additional vessel in service.
Revenues
In the first sixnine months of 2019, marine operating revenue increased $9.4$12.6 million, or 15.1%10.5%, primarily due to higher volume resulting from improved sailing conditions and an additional vessel in service compared to the prior year.
Expenses
In the first sixnine months of 2019, maintenance expense increased $0.5$1.9 million, driven by more winter work.work and higher operating repairs. Marine operating expense increased $2.9$4.2 million, primarily due to the impact of an additional vessel in service during the current year.
Investment Volume
ASC's investments in each period consisted of structural and mechanical improvements to our vessels.
Comparison of the SecondThird Quarter of 2019 to the SecondThird Quarter of 2018
Segment Profit
In the secondthird quarter of 2019, segment profit was $12.1 million, compared to $8.0$11.9 million for the same period in the prior year. The increase was driven by higher volume as a result of favorable operating conditions and an additional vessel in service.service, partially offset by certain maintenance events and other vessel delays.
Revenues
In the secondthird quarter of 2019, marine operating revenue increased $8.5$3.2 million, or 16.3%5.5%, primarily due to higher volume resulting from improved sailing conditions and an additional vessel in service compared to the prior year.
Expenses
In the secondthird quarter of 2019, maintenance expense increased $0.8$1.4 million, driven by more winter work.higher operating repairs. Marine operating expense increased $3.6$1.3 million, primarily due to the impact of an additional vessel in service during the current year.service.
OTHER
Other comprises selling, general and administrative expenses ("SG&A"), unallocated interest expense, and miscellaneous income and expense not directly associated with the reporting segments and eliminations.
The following table shows components of Other (in millions):
| | | | Three Months Ended
June 30 | | Six Months Ended
June 30 | Three Months Ended
September 30 | | Nine Months Ended
September 30 |
| | 2019 | | 2018 | | 2019 | | 2018 | 2019 | | 2018 | �� | 2019 | | 2018 |
| Selling, general and administrative expense | $ | 45.1 |
| | $ | 46.2 |
| | $ | 91.2 |
| | $ | 91.1 |
| $ | 44.4 |
| | $ | 46.5 |
| | $ | 135.6 |
| | $ | 137.6 |
|
| Unallocated interest (income) expense | (1.5 | ) | | (2.0 | ) | | (3.2 | ) | | (4.6 | ) | (1.4 | ) | | (2.2 | ) | | (4.6 | ) | | (6.8 | ) |
| Other expense (income), including eliminations | 0.4 |
| | 1.2 |
| | 0.6 |
| | 1.4 |
| 0.6 |
| | 2.7 |
| | 1.2 |
| | 4.1 |
|
SG&A, Unallocated Interest and Other
SG&A increased $0.1decreased $2.0 million for the first sixnine months of 2019 and decreased $1.1$2.1 million for the secondthird quarter of 2019 compared to the same periods in the prior year. Both variances were drivenfavorably impacted by the absence of accelerated depreciation recorded in the prior year related to the early termination of the corporate headquarters office lease, as well as lower pensionlease. Additionally, for the year-to-date comparison, higher compensation and other employee benefits costs and increased information technology expenses and outside legal expenses,were partially offset by higher employee compensation and information technology expenses.lower pension expense.
Unallocated interest expense (the difference between external interest expense and interest expense allocated to the reporting segments )segments) in any year is affected by our consolidated leverage position, the timing of debt issuances and investing activities, and intercompany allocations.
Other expense (income), including eliminations, decreased $0.8$2.9 million for eachthe first nine months of 2019 and $2.1 million for the six and three month periodsthird quarter of 2019 compared to the same periods in the prior year. Both variances were driven by lower non-service pension expenses. The varianceexpense. Specifically, certain lump sum distributions paid to the prior quarter was also positively impacted by the absence of expenses related to the prepayment of debt recordedretirees in the prior year, as well as the positive impactsthird quarter of foreign exchange.2018 triggered a non-recurring adjustment to pension expense for $2.1 million.
Consolidated Income Taxes
See "Note 8. Income Taxes" in Part I, Item 1 of this Form 10-Q.
CASH FLOW AND LIQUIDITY
We generate a significant amount of cash from operating activities and investment portfolio proceeds. We also access domestic and international capital markets by issuing unsecured or secured debt and commercial paper. We use these resources, along with available cash balances, to fulfill our debt, lease, and dividend obligations, to support our share repurchase programs, and to fund portfolio investments and capital additions. We primarily use cash from operations to fund daily operations.
The timing of asset dispositions and changes in working capital impact cash flows from portfolio proceeds and operations. As a result, these cash flow components may vary materially from quarter to quarter and year to year. As of JuneSeptember 30, 2019, we had an unrestricted cash balance of $286.6$48.6 million.
The following table shows our principal sources and uses of cash for the sixnine months ended JuneSeptember 30 (in millions):
| | | | 2019 | | 2018 | | 2019 | | 2018 |
| Principal sources of cash | | | | | | | |
| Net cash provided by operating activities | $ | 175.8 |
| | $ | 206.7 |
| | $ | 297.1 |
| | $ | 341.3 |
|
| Portfolio proceeds | 133.5 |
| | 149.0 |
| | 185.6 |
| | 198.6 |
|
| Other asset sales | 14.6 |
| | 20.9 |
| | 18.9 |
| | 28.5 |
|
| Proceeds from sale-leasebacks | | — |
| | 59.2 |
|
| Proceeds from issuance of debt, commercial paper, and credit facilities | 549.5 |
| | 297.2 |
| | 551.7 |
| | 297.1 |
|
| Total | $ | 873.4 |
| | $ | 673.8 |
| | $ | 1,053.3 |
| | $ | 924.7 |
|
| | | | | | | | |
| Principal uses of cash | | | | | | | |
| Portfolio investments and capital additions | $ | (331.4 | ) | | $ | (367.0 | ) | | $ | (522.5 | ) | | $ | (536.7 | ) |
| Repayments of debt, commercial paper, and credit facilities | (244.8 | ) | | (263.1 | ) | | (410.0 | ) | | (267.3 | ) |
| Purchases of assets previously leased | — |
| | (39.1 | ) | | — |
| | (66.6 | ) |
| Payments on capital lease obligations | (0.6 | ) | | (0.6 | ) | | (11.3 | ) | | (0.9 | ) |
| Stock repurchases | (82.4 | ) | | (25.0 | ) | | (129.0 | ) | | (37.4 | ) |
| Dividends | (36.2 | ) | | (35.7 | ) | | (52.8 | ) | | (52.7 | ) |
| Total | $ | (695.4 | ) | | $ | (730.5 | ) | | $ | (1,125.6 | ) | | $ | (961.6 | ) |
Net cash provided by operating activities for the first nine months of $175.82019 was $297.1 million, decreased $30.9a decrease of $44.2 million compared to the same period in 2018. Comparability among reporting periods is impacted by the timing of changes in working capital items. Specifically, cash payments were higher in 2019 with respect to interest expense, operating leases, and compensation. In the current year period,addition, higher operating lease, interest, and compensation-related paymentsmaintenance expenses were partially offset by higher leaserepair revenues and repair revenue, as well as lower income tax payments in 2019 as compared to the prior year period.same period in 2018.
Portfolio proceeds primarily consist of proceeds from sales of operating assets and finance lease receipts. Portfolio proceeds of $133.5$185.6 million for the sixnine months of 2019 decreased by $15.5$13.0 million from the prior year, primarily due to lower proceeds from sales of railcars at Rail North America.
Rail North America completed a sale-leaseback financing for 467 railcars in 2018.
Proceeds from the issuance of debt for the sixnine months ended JuneSeptember 30, 2019 were $549.5$551.7 million (net of hedges and debt issuance costs). In 2019, we issued $500.0 million of 10-year unsecured debt and increased the amount of a term note by $55.7 million at Rail International. Debt repayments of $244.8$410.0 million for the first sixnine months of 2019 were $18.3$142.7 million lowerhigher than prior year. Repayments in both years included scheduled maturity payments and the early retirement of certain debt obligations.
Portfolio investments and capital additions primarily consist of purchases of operating assets, investments in affiliates, and capitalized asset improvements. Portfolio investments and capital additions of $331.4$522.5 million for the first sixnine months of 2019 decreased $35.6$14.2 million compared to 2018, due to fewer railcars acquired at Rail North America, partially offset by more railcars acquired at Rail International.
We did not purchase any assets that were previously leased during the first sixnine months of 2019, compared to 2,4673,412 railcars for $39.1$66.6 million in 2018.
In 2019, we exercised an option to acquire 157 railcars previously recorded on the balance sheet as a finance lease for $10.5 million.
On January 25, 2019, our board of directors approved a $300.0 million share repurchase program, pursuant to which we are authorized to purchase shares of our common stock in the open market, in privately negotiated transactions, or otherwise, including pursuant to Rule 10b5-1 plans. During the sixnine months ended JuneSeptember 30, 2019, we repurchased 1.11.7 million shares of common stock for $83.3$129.9 million, compared to 0.40.5 million shares of common stock for $25.0$37.4 million during the same period in 2018. Actual cash payments in any period consist of
those transactions that settled during the current period. As of JuneSeptember 30, 2019, $216.8$170.1 million remained available under the repurchase authorization.
Contractual and Other Commercial Commitments
The following table shows our contractual commitments, including debt principal and related interest payments, lease payments, and purchase commitments at JuneSeptember 30, 2019 (in millions):
| | | | Payments Due by Period | Payments Due by Period |
| | Total | | 2019 (1) | | 2020 | | 2021 | | 2022 | | 2023 | | Thereafter | Total | | 2019 (1) | | 2020 | | 2021 | | 2022 | | 2023 | | Thereafter |
| Recourse debt | $ | 4,869.4 |
| | $ | 250.0 |
| | $ | 350.0 |
| | $ | 600.0 |
| | $ | 250.0 |
| | $ | 250.0 |
| | $ | 3,169.4 |
| $ | 4,614.4 |
| | $ | — |
| | $ | 350.0 |
| | $ | 600.0 |
| | $ | 250.0 |
| | $ | 250.0 |
| | $ | 3,164.4 |
|
| Interest on recourse debt (2) | 1,996.2 |
| | 100.4 |
| | 182.1 |
| | 170.2 |
| | 146.7 |
| | 135.4 |
| | 1,261.4 |
| 1,933.6 |
| | 40.7 |
| | 180.7 |
| | 168.8 |
| | 146.8 |
| | 135.3 |
| | 1,261.3 |
|
| Commercial paper and credit facilities | 26.0 |
| | 26.0 |
| | — |
| | — |
| | — |
| | — |
| | — |
| 112.0 |
| | 112.0 |
| | — |
| | — |
| | — |
| | — |
| | — |
|
| Finance lease obligations, including interest | 10.7 |
| | 10.7 |
| | — |
| | — |
| | — |
| | — |
| | — |
| |
| Operating lease obligations | 543.5 |
| | 27.0 |
| | 67.9 |
| | 66.3 |
| | 57.6 |
| | 54.8 |
| | 269.9 |
| 524.2 |
| | 8.0 |
| | 67.8 |
| | 66.3 |
| | 57.5 |
| | 54.8 |
| | 269.8 |
|
| Purchase commitments (3) | 2,153.2 |
| | 433.4 |
| | 563.2 |
| | 376.5 |
| | 385.4 |
| | 394.7 |
| | — |
| 2,396.5 |
| | 270.0 |
| | 635.0 |
| | 373.3 |
| | 365.3 |
| | 372.7 |
| | 380.2 |
|
| Total | $ | 9,599.0 |
| | $ | 847.5 |
| | $ | 1,163.2 |
| | $ | 1,213.0 |
| | $ | 839.7 |
| | $ | 834.9 |
| | $ | 4,700.7 |
| $ | 9,580.7 |
| | $ | 430.7 |
| | $ | 1,233.5 |
| | $ | 1,208.4 |
| | $ | 819.6 |
| | $ | 812.8 |
| | $ | 5,075.7 |
|
__________
| |
| (1) | For the remainder of the year. |
| |
| (2) | For floating rate debt, future interest payments are based on the applicable interest rate as of JuneSeptember 30, 2019. |
| |
| (3) | Primarily railcar purchase commitments. The amounts shown for all years are based on management's estimates of the timing, anticipated car types, and related costs of railcars to be purchased under its agreements. |
In 2014, we entered into a long-term supply agreement with Trinity Rail Group, LLC ("Trinity"), a subsidiary of Trinity Industries. Under the terms of that agreement, we may order up to 8,950 newly built railcars over a four-year period from March, 2016 through March, 2020. We may order either tank or freight cars; however, the majority of the order will be for tank cars. As of JuneSeptember 30, 2019, 8,2508,450 railcars have been ordered, of which 6,7547,408 railcars have been delivered. On May 24, 2018, we amended our long-term supply agreement with Trinity to extend the term to December 2023, and we agreed to purchase an additional 4,800 tank cars (1,200 per year) beginning in January 2020 and continuing through the expiration of the extended term.
On July 30, 2018, we entered into a multi-year railcar supply agreement with American Railcar Industries, Inc. ("ARI"), pursuant to which we will purchase 7,650 newly built railcars. The order encompasses a mix of tank and freight cars to be delivered over a five-year period, beginning in April 2019. ARI was subsequently acquired by The Greenbrier Companies, Inc. ("Greenbrier"). As of JuneSeptember 30, 2019, 1,2292,129 railcars have been ordered, of which 146234 railcars have been delivered. The agreement requires ARIGreenbrier to deliver 450 railcars in 2019, with the remaining 7,200 to be delivered ratably over the four-year period of 2020 to 2023. The agreement also includes an option to order up to an additional 4,400 railcars subject to certain restrictions.
Short-Term Borrowings
The following table shows additional information regarding our short-term borrowings for the sixnine months ended JuneSeptember 30, 2019:
| | | | North America (1) | | Europe (2) | North America (1) | | Europe (2) |
| Balance as of June 30 (in millions) | $ | — |
| | $ | 26.0 |
| |
| Balance as of September 30 (in millions) | | $ | 98.0 |
| | $ | 14.0 |
|
| Weighted-average interest rate | n/a |
| | 0.6 | % | 2.3 | % | | 0.7 | % |
| Euro/dollar exchange rate | n/a |
| | 1.14 |
| n/a |
| | 1.09 |
|
| | | | | | | |
| Average daily amount outstanding year to date (in millions) | $ | 19.4 |
| | $ | 15.3 |
| $ | 18.3 |
| | $ | 15.6 |
|
| Weighted-average interest rate | 2.9 | % | | 0.6 | % | 2.5 | % | | 0.7 | % |
| Average Euro/dollar exchange rate | n/a |
| | $ | 1.13 |
| n/a |
| | $ | 1.12 |
|
| | | | | | | |
| Average daily amount outstanding during 2nd quarter (in millions) | $ | — |
| | $ | 19.7 |
| |
| Average daily amount outstanding during 3rd quarter (in millions) | | $ | 16.1 |
| | $ | 16.4 |
|
| Weighted-average interest rate | — | % | | 0.6 | % | 2.4 | % | | 0.7 | % |
| Average Euro/dollar exchange rate | n/a |
| | 1.12 |
| n/a |
| | 1.11 |
|
| | | | | | | |
| Maximum daily amount outstanding (in millions) | $ | 130.0 |
| | $ | 28.2 |
| $ | 130.0 |
| | $ | 28.2 |
|
| Euro/dollar exchange rate | n/a |
| | 1.12 |
| n/a |
| | 1.12 |
|
__________
| |
| (1) | Short-term borrowings in North America are composed of commercial paper issued in the U.S. |
| |
| (2) | Short-term borrowings in Europe are composed of borrowings under bank credit facilities. |
Credit Lines and Facilities
On May 23, 2019, we entered into a new $600 million, 5-year unsecured revolving credit facility in the United States, expiring in May 2024. The new credit facility contains two one-year extension options. This replaced our prior $600 million, 5-year unsecured revolving credit facility, which was terminated upon our entry into the new credit facility. As of JuneSeptember 30, 2019, the full $600$502 million was available under this facility. Additionally, we terminated our prior $250 million 5-year secured railcar facility and entered into a new $250 million 3-year unsecured revolving credit facility in the United States, expiring in May 2022. This new credit facility also has two one-year extension options. As of JuneSeptember 30, 2019, the full $250 million was available under this facility.
In addition, our European subsidiaries have entered into unsecured credit facilities with an aggregate limit of €25 million. As of September 30, 2019, €12.2 million was available under these credit facilities.
Restrictive Covenants
Our $600 million revolving credit facility contains various restrictive covenants, including requirements to maintain a fixed charge coverage ratio and an asset coverage test. Some of our bank term loans have the same financial covenants as the facility.
The indentures for our public debt also contain various restrictive covenants, including limitations on liens provisions that restrict the amount of additional secured indebtedness that we may incur. Additionally, certain exceptions to the covenants permit us to incur an unlimited amount of purchase money and nonrecourse indebtedness.
At JuneSeptember 30, 2019, oura European rail subsidiariessubsidiary had one outstanding term loan agreement, whichfor €105 million. This loan is guaranteed by GATX Corporation.Corporation and is subject to the same restrictive covenants as the revolving credit facility noted above.
We do not anticipate any covenant violations nor do we expect that any of these covenants will restrict our operations or our ability to obtain additional financing. At JuneSeptember 30, 2019, we were in compliance with all covenants and conditions of all of our credit agreements.
Credit Ratings
The global capital market environment and outlook may affect our funding options and our financial performance. Our access to capital markets at competitive rates depends on our credit rating and rating outlook, as determined by rating agencies. As of JuneSeptember 30, 2019, our long-term unsecured debt was rated BBB by Standard & Poor's and Baa2 by Moody’s Investor Service and our short-term unsecured debt was rated A-2 by Standard & Poor's and P-2 by Moody’s Investor Service. Our rating outlook from both agencies was stable.
CRITICAL ACCOUNTING POLICIES AND ESTIMATES
The adoption of the new lease accounting standard required changes to certain policies and estimates related to our lease accounting as lessee and lessor. See "Note 4. Leases" in Part I, Item 1 of this Form 10-Q for further details. Other than these impacts, there have been no changes to our critical accounting policies during the sixnine months ended JuneSeptember 30, 2019. Refer to our Annual Report on Form 10-K for the year ended December 31, 2018, for a summary of our policies.
NON-GAAP FINANCIAL MEASURES
In addition to financial results reported in accordance with GAAP, we compute certain financial measures using non-GAAP components, as defined by the SEC. These measures are not in accordance with, or a substitute for, GAAP, and our financial measures may be different from non-GAAP financial measures used by other companies. We have provided a reconciliation of our non-GAAP components to the most directly comparable GAAP components.
Reconciliation of Non-GAAP Components Used in the Computation of Certain Financial Measures
Net Income Measures
We exclude the effects of certain tax adjustments and other items for purposes of presenting net income, diluted earnings per share, and return on equity because we believe these items are not attributable to our business operations. Management utilizes net income, excluding tax adjustments and other items, when analyzing financial performance because such amounts reflect the underlying operating results that are within management’s ability to influence. Accordingly, we believe presenting this information provides investors and other users of our financial statements with meaningful supplemental information for purposes of analyzing year-to-year financial performance on a comparable basis and assessing trends.
The following tables show our net income and diluted earnings per share, excluding tax adjustments and other items (in millions, except per share data):
Impact of Tax Adjustments and Other Items on Net Income:
| | | | Three Months Ended
June 30 | | Six Months Ended
June 30 | Three Months Ended
September 30 | | Nine Months Ended
September 30 |
| | 2019 | | 2018 | | 2019 | | 2018 | 2019 | | 2018 | | 2019 | | 2018 |
| Net income (GAAP) | $ | 68.0 |
| | $ | 38.8 |
| | $ | 109.5 |
| | $ | 115.1 |
| $ | 45.1 |
| | $ | 47.0 |
| | $ | 154.6 |
| | $ | 162.1 |
|
| Adjustments attributable to consolidated pre-tax income: | | | | | | | | | | | | | | |
| Costs related to the closure of a maintenance facility at Rail International (1) | — |
| | 8.6 |
| | — |
| | 8.6 |
| — |
| | — |
| | — |
| | 8.6 |
|
| Total adjustments attributable to consolidated pre-tax income | $ | — |
| | $ | 8.6 |
| | $ | — |
| | $ | 8.6 |
| $ | — |
| | $ | — |
| | $ | — |
| | $ | 8.6 |
|
| Income taxes thereon, based on applicable effective tax rate | — |
| | (2.8 | ) | | — |
| | (2.8 | ) | — |
| | — |
| | — |
| | (2.8 | ) |
| Other income tax adjustments attributable to consolidated income: | | | | | | | | | | | | | | |
| Income tax rate change (2) | $ | (2.8 | ) | | $ | — |
| | $ | (2.8 | ) | | $ | — |
| $ | — |
| | $ | — |
| | $ | (2.8 | ) | | $ | — |
|
| Net income, excluding tax adjustments and other items (non-GAAP) | $ | 65.2 |
| | $ | 44.6 |
| | $ | 106.7 |
| | $ | 120.9 |
| $ | 45.1 |
| | $ | 47.0 |
| | $ | 151.8 |
| | $ | 167.9 |
|
Impact of Tax Adjustments and Other Items on Diluted Earnings per Share:
| | | | Three Months Ended
June 30 | | Six Months Ended
June 30 | Three Months Ended
September 30 | | Nine Months Ended
September 30 |
| | 2019 | | 2018 | | 2019 | | 2018 | 2019 | | 2018 | | 2019 | | 2018 |
| Diluted earnings per share (GAAP) | $ | 1.86 |
| | $ | 1.01 |
| | $ | 2.97 |
| | $ | 2.99 |
| $ | 1.25 |
| | $ | 1.22 |
| | $ | 4.22 |
| | $ | 4.21 |
|
| Adjustments attributable to consolidated income, net of taxes: | | | | | | | | | | | | | | |
| Costs related to the closure of a maintenance facility at Rail International (1) | — |
| | 0.15 |
| | — |
| | 0.15 |
| — |
| | — |
| | — |
| | 0.15 |
|
| Income tax rate change (2) | (0.08 | ) | | — |
| | (0.08 | ) | | — |
| — |
| | — |
| | (0.07 | ) | | — |
|
| Diluted earnings per share, excluding tax adjustments and other items (non-GAAP) | $ | 1.78 |
| | $ | 1.16 |
| | $ | 2.89 |
| | $ | 3.14 |
| $ | 1.25 |
| | $ | 1.22 |
| | $ | 4.15 |
| | $ | 4.36 |
|
The following table shows our net income and return on equity, excluding tax adjustments and other items, for the trailing 12 months ended JuneSeptember 30 (in millions):
| | | | 2019 | | 2018 | 2019 | | 2018 |
| Net income (GAAP) | $ | 205.7 |
| | $ | 506.2 |
| $ | 203.8 |
| | $ | 504.2 |
|
| Adjustments attributable to consolidated pre-tax income: | | | | | | |
| Costs related to the closure of a maintenance facility at Rail International (1) | 0.9 |
| | 8.6 |
| 0.9 |
| | 8.6 |
|
| Total adjustments attributable to consolidated pre-tax income | $ | 0.9 |
| | $ | 8.6 |
| $ | 0.9 |
| | $ | 8.6 |
|
| Income taxes thereon, based on applicable effective tax rate | $ | (0.3 | ) | | $ | (2.8 | ) | $ | (0.3 | ) | | $ | (2.8 | ) |
| Other income tax adjustments attributable to consolidated income: | | | | | | |
| Income tax rate change (2) | (2.8 | ) | | — |
| (2.8 | ) | | — |
|
| Impact of the Tax Act (3) | (16.5 | ) | | (315.9 | ) | (16.5 | ) | | (315.9 | ) |
| Foreign tax credit utilization (4) | (1.4 | ) | | — |
| (1.4 | ) | | — |
|
| Total other income tax adjustments attributable to consolidated income | $ | (20.7 | ) | | $ | (315.9 | ) | $ | (20.7 | ) | | $ | (315.9 | ) |
| Net income, excluding tax adjustments and other items (non-GAAP) | $ | 185.6 |
| | $ | 196.1 |
| $ | 183.7 |
| | $ | 194.1 |
|
| Return on Equity (GAAP) | 11.3 | % | | 31.0 | % | 11.2 | % | | 30.5 | % |
| Return on Equity, excluding tax adjustments and other items (non-GAAP) (5) | 12.4 | % | | 13.3 | % | 12.3 | % | | 13.0 | % |
_______
| |
| (1) | Expenses related to the closure of a maintenance facility. |
| |
| (2) | Deferred income tax adjustment due to an enacted corporate income tax rate decrease in Alberta, Canada. |
| |
| (3) | Amounts attributable to the impact of corporate income tax changes enacted by the Tax Cuts and Jobs Act of 2017 (the "Tax Act"). |
| |
| (4) | Benefits attributable to the utilization of foreign tax credits. |
| |
| (5) | Shareholders' equity used in this calculation excludes the increases resulting from the impact of the Tax Act. |
Balance Sheet Measures
A portion of our North American railcar fleet is financed through sale-leasebacks that are accounted for as operating leases. Prior to 2019, these railcar assets were not recorded on the balance sheet. Under the new lease accounting standard adopted on January 1, 2019, GATX records these railcar operating leases on the balance sheet as right-of-use assets with corresponding amounts for operating lease liabilities.
Prior to 2019, we reported total on- and off-balance sheet assets in our calculation of total assets (as adjusted) because we believed it provided investors a more comprehensive representation of the magnitude of the assets we operated and that drove our financial performance. In addition, this calculation of total assets (as adjusted) provided consistency with other non-financial information we disclosed about our fleet, including the number of railcars in the fleet, average number of cars on lease, and utilization. We also provide information regarding our leverage ratios, which are expressed as a ratio of debt (including off-balance sheet debt) to equity. The off-balance sheet debt amount in this calculation was the equivalent of the off-balance sheet asset amount. We believe reporting this corresponding off-balance sheet debt amount provided investors and other users of our financial statements with a more comprehensive representation of our debt obligations, leverage, and capital structure.
Because the railcar operating lease assets and associated liabilities are now recorded on the balance sheet, beginning in 2019, the prior non-GAAP measure is no longer applicable.
The following table shows total balance sheet assets (in millions):
| | | | June 30
2019 | | March 31
2019 | | December 31
2018 | | September 30
2018 | | June 30
2018 | September 30
2019 | | June 30
2019 | | March 31
2019 | | December 31
2018 | | September 30
2018 |
| Total assets (GAAP) | $ | 8,353.1 |
| | $ | 8,240.2 |
| | $ | 7,616.7 |
| | $ | 7,517.4 |
| | $ | 7,495.5 |
| $ | 8,090.9 |
| | $ | 8,353.1 |
| | $ | 8,240.2 |
| | $ | 7,616.7 |
| | $ | 7,517.4 |
|
| Off-balance sheet assets (1): | | | | | | | | | | | | | | | | | | |
| Rail North America | — |
| | — |
| | 430.2 |
| | 432.6 |
| | 401.7 |
| — |
| | — |
| | — |
| | 430.2 |
| | 432.6 |
|
| Total off-balance sheet assets | $ | — |
| | $ | — |
| | $ | 430.2 |
| | $ | 432.6 |
| | $ | 401.7 |
| $ | — |
| | $ | — |
| | $ | — |
| | $ | 430.2 |
| | $ | 432.6 |
|
| Total assets, as adjusted (non-GAAP) | $ | 8,353.1 |
| | $ | 8,240.2 |
| | $ | 8,046.9 |
| | $ | 7,950.0 |
| | $ | 7,897.2 |
| $ | 8,090.9 |
| | $ | 8,353.1 |
| | $ | 8,240.2 |
| | $ | 8,046.9 |
| | $ | 7,950.0 |
|
| | | | | | | | | | | | | | | | | | | |
| Shareholders’ Equity (GAAP) | $ | 1,834.8 |
| | $ | 1,809.2 |
| | $ | 1,788.1 |
| | $ | 1,838.0 |
| | $ | 1,817.6 |
| $ | 1,786.5 |
| | $ | 1,834.8 |
| | $ | 1,809.2 |
| | $ | 1,788.1 |
| | $ | 1,838.0 |
|
________
| |
| (1) | Off-balance sheet assets apply to each of the quarters in 2018. In accordance with the new lease accounting standard, off-balance assets are no longer applicable beginning in 2019. |
The following table shows the components of recourse leverage (in millions, except recourse leverage ratio):
| | | | June 30
2019 | | March 31
2019 | | December 31
2018 | | September 30
2018 | | June 30
2018 | September 30
2019 | | June 30
2019 | | March 31
2019 | | December 31
2018 | | September 30
2018 |
| Debt and lease obligations, net of unrestricted cash: | | | | | | | | | | | | | | | | | | |
| Unrestricted cash | $ | (286.6 | ) | | $ | (248.4 | ) | | $ | (100.2 | ) | | $ | (254.5 | ) | | $ | (237.4 | ) | $ | (48.6 | ) | | $ | (286.6 | ) | | $ | (248.4 | ) | | $ | (100.2 | ) | | $ | (254.5 | ) |
| Commercial paper and bank credit facilities | 26.0 |
| | 15.9 |
| | 110.8 |
| | ��� |
| | 4.3 |
| 112.0 |
| | 26.0 |
| | 15.9 |
| | 110.8 |
| | — |
|
| Recourse debt | 4,832.5 |
| | 4,768.1 |
| | 4,429.7 |
| | 4,397.3 |
| | 4,397.9 |
| 4,580.2 |
| | 4,832.5 |
| | 4,768.1 |
| | 4,429.7 |
| | 4,397.3 |
|
| Operating lease obligations | 454.5 |
| | 456.3 |
| | — |
| | — |
| | — |
| 440.3 |
| | 454.5 |
| | 456.3 |
| | — |
| | — |
|
| Finance lease obligations | 10.6 |
| | 11.0 |
| | 11.3 |
| | 11.6 |
| | 11.9 |
| — |
| | 10.6 |
| | 11.0 |
| | 11.3 |
| | 11.6 |
|
| Total debt and lease obligations, net of unrestricted cash (GAAP) | 5,037.0 |
| | 5,002.9 |
| | 4,451.6 |
| | 4,154.4 |
| | 4,176.7 |
| 5,083.9 |
| | 5,037.0 |
| | 5,002.9 |
| | 4,451.6 |
| | 4,154.4 |
|
| Off-balance sheet recourse debt (1) | — |
| | — |
| | 430.2 |
| | 432.6 |
| | 401.7 |
| — |
| | — |
| | — |
| | 430.2 |
| | 432.6 |
|
| Total debt and lease obligations, net of unrestricted cash, as adjusted (non-GAAP) | $ | 5,037.0 |
| | $ | 5,002.9 |
| | $ | 4,881.8 |
| | $ | 4,587.0 |
| | $ | 4,578.4 |
| $ | 5,083.9 |
| | $ | 5,037.0 |
| | $ | 5,002.9 |
| | $ | 4,881.8 |
| | $ | 4,587.0 |
|
| | | | | | | | | | | | | | | | | | | |
| Total recourse debt (2) | $ | 5,037.0 |
| | $ | 5,002.9 |
| | $ | 4,881.8 |
| | $ | 4,587.0 |
| | $ | 4,578.4 |
| $ | 5,083.9 |
| | $ | 5,037.0 |
| | $ | 5,002.9 |
| | $ | 4,881.8 |
| | $ | 4,587.0 |
|
| Shareholders' Equity | $ | 1,834.8 |
| | $ | 1,809.2 |
| | $ | 1,788.1 |
| | $ | 1,838.0 |
| | $ | 1,817.6 |
| $ | 1,786.5 |
| | $ | 1,834.8 |
| | $ | 1,809.2 |
| | $ | 1,788.1 |
| | $ | 1,838.0 |
|
| Recourse Leverage (3) | 2.7 |
| | 2.8 |
| | 2.7 |
| | 2.5 |
| | 2.5 |
| 2.8 |
| | 2.7 |
| | 2.8 |
| | 2.7 |
| | 2.5 |
|
________
| |
| (1) | Off-balance sheet recourse debt applies to each of the quarters in 2018. In accordance with the new lease accounting standard, off-balance sheet recourse debt is no longer applicable beginning in 2019. |
| |
| (2) | Includes on- and off-balance sheet recourse debt, commercial paper and bank credit facilities, and operating and finance lease obligations, net of unrestricted cash. |
| |
| (3) | Calculated as total recourse debt / shareholder's equity. |
Item 3. Quantitative and Qualitative Disclosures About Market Risk
Since December 31, 2018, there have been no material changes in our interest rate and foreign currency exposures or types of derivative instruments used to hedge these exposures. For a discussion of our exposure to market risk, refer to "Item 7A. Quantitative and Qualitative Disclosure about Market Risk" of our Annual Report on Form 10-K for the year ended December 31, 2018.
Item 4. Controls and Procedures
Our management, with the participation of our Chief Executive Officer and Chief Financial Officer, has conducted an evaluation of our disclosure controls and procedures (as defined in Rules 13a-15(e) and 15d-15(e) of the Securities Exchange Act of 1934 (the "Exchange Act")). Based on such evaluation, our Chief Executive Officer and Chief Financial Officer have concluded that, as of the end of the period covered by this quarterly report, our disclosure controls and procedures were effective.
No changes in our internal control over financial reporting (as defined in Exchange Act Rules 13a-15(f) and 15d-15(f)) occurred during the quarter ended JuneSeptember 30, 2019, that materially affected, or is reasonably likely to materially affect, our internal control over financial reporting.
PART II - OTHER INFORMATION
Item 1. Legal Proceedings
Information concerning litigation and other contingencies is described in "Note 12. Legal Proceedings and Other Contingencies" in Part I, Item 1 of this Form 10-Q and is incorporated herein by reference.
Item 1A. Risk Factors
Since December 31, 2018, there have been no material changes in our risk factors. For a discussion of our risk factors, refer to "Item 1A. Risk Factors" of our Annual Report on Form 10-K for the year ended December 31, 2018.
Item 2. Unregistered Sales of Equity Securities and Use of Proceeds
On January 25, 2019, our board of directors approved a $300.0 million share repurchase program, pursuant to which we are authorized to purchase shares of our common stock in the open market, in privately negotiated transactions, or otherwise, including pursuant to Rule 10b5-1 plans. The share repurchase program does not have an expiration date, does not obligate the Company to repurchase any dollar amount or number of shares of common stock, and may be suspended or discontinued at any time. The timing of repurchases will be dependent on market conditions and other factors. As of JuneSeptember 30, 2019, $216.8$170.1 million remained available under the repurchase authorizations.
The following is a summary of common stock repurchases completed by month during the secondthird quarter of 2019:
| | Issuer Purchases of Equity Securities | | | | (a) | | (b) | | (c) | | (d) | | (a) | | (b) | | (c) | | (d) |
| Period | | Total Number of Shares Purchased | | Average Price Paid per Share | | Total Number of Shares Purchased as Part of Publicly Announced Plans or Programs | | Maximum Number (or Approximate Dollar Value) of Shares that May Yet Be Purchased Under the Plans or Programs (in millions) | | Total Number of Shares Purchased | | Average Price Paid per Share | | Total Number of Shares Purchased as Part of Publicly Announced Plans or Programs | | Maximum Number (or Approximate Dollar Value) of Shares that May Yet Be Purchased Under the Plans or Programs (in millions) |
| April 1, 2019 - April 30, 2019 | | 23,014 |
| | $ | 77.22 |
| | 23,014 |
| | $ | 258.2 |
| |
| May 1, 2019 - May 31, 2019 | | 263,350 |
| | $ | 75.25 |
| | 263,350 |
| | $ | 238.4 |
| |
| June 1, 2019 - June 30, 2019 | | 290,155 |
| | $ | 74.57 |
| | 290,155 |
| | $ | 216.8 |
| |
| July 1, 2019 - July 31, 2019 | | | 173,092 |
| | $ | 76.68 |
| | 173,092 |
| | $ | 203.5 |
|
| August 1, 2019 - August 31, 2019 | | | 258,725 |
| | $ | 74.01 |
| | 258,725 |
| | $ | 184.3 |
|
| September 1, 2019 - September 30, 2019 | | | 184,097 |
| | $ | 77.40 |
| | 184,097 |
| | $ | 170.1 |
|
| Total | | 576,519 |
| | $ | 74.99 |
| | 576,519 |
| | |
| | 615,914 |
| | $ | 75.77 |
| | 615,914 |
| | |
|
Item 5. Other Information
On October 25, 2019, the Board of Directors of the Company elected Jennifer M. McManus as Senior Vice President, Controller and Chief Accounting Officer, effective January 1, 2020. Ms. McManus has served as Senior Director, Investor Relations and Accounting Research, Policy & Planning since May 2017 and Director, Accounting Research, Policy & Planning from June 2015 to May 2017. Prior to joining GATX, Ms. McManus held various positions of increasing responsibility with Hyatt Hotels Corporation, including Strategic Process Design & Implementation Senior Manager from 2012 to May 2015, and Tribune Company. Ms. McManus began her career in 2002 in audit at Deloitte & Touche LLP. She holds a Bachelor of Arts in Economics and a Masters of Accounting from the University of Michigan and an M.B.A. from the University of Chicago, Booth School of Business.
Item 6. Exhibits
|
| | |
Exhibit Number | Exhibit Description |
| Filed with this Report: |
| 31A | |
| 31B | |
| 32 | |
| 101 | The following materials from GATX Corporation’s Quarterly Report on Form 10-Q for the quarter ended JuneSeptember 30, 2019, are formatted in Inline XBRL (eXtensible Business Reporting Language): (i) Consolidated Balance Sheets at JuneSeptember 30, 2019 and December 31, 2018, (ii) Consolidated Statements of Comprehensive Income for the three months and sixnine months ended JuneSeptember 30, 2019 and 2018, (iii) Consolidated Statements of Cash Flows for the sixnine months ended JuneSeptember 30, 2019 and 2018, (iv) Consolidated Statements of Changes in Shareholders' Equity for the three months and sixnine months ended JuneSeptember 30, 2019 and 2018, and (v) Notes to the Consolidated Financial Statements. |
| | |
Incorporated by Reference: |
10.1 | Five Year Credit Agreement dated as of May 23, 2019, among GATX Corporation, as borrower, Citibank, N.A. and BOFA Securities, Inc., as joint lead arrangers and joint book managers, Bank of America, N.A., as syndication agent, PNC Bank, N.A., U.S. Bank, National Association, Morgan Stanley MUFG Loan Partners, LLC and Keybank National Association, as co-documentation agents, Citibank, N.A., as administrative agent, and the lenders party thereto is incorporated herein by reference to Exhibit 10.1 of GATX’s Form 8-K dated May 23, 2019, file number 1-2328. |
SIGNATURE
Pursuant to the requirements of the Securities Exchange Act of 1934, the registrant has duly caused this report to be signed on its behalf by the undersigned thereunto duly authorized.
|
|
GATX CORPORATION (Registrant) |
| |
| /s/ Thomas A. Ellman |
| Thomas A. Ellman |
| Executive Vice President and Chief Financial Officer |
| (Duly Authorized Officer) |
Date: July 29,October 25, 2019