UNITED STATES
SECURITIES AND EXCHANGE COMMISSION
Washington, D.C. 20549
__________________________________________
FORM 10-Q
| | | | | |
| ☒ | QUARTERLY REPORT PURSUANT TO SECTION 13 OR 15(d) OF THE SECURITIES EXCHANGE ACT OF 1934 |
For the quarterly period ended September 30, 20202021
or
| | | | | |
| ☐ | TRANSITION REPORT PURSUANT TO SECTION 13 OR 15(d) OF THE SECURITIES EXCHANGE ACT OF 1934 |
Commission File Number: 1-2328
GATX Corporation
(Exact name of registrant as specified in its charter)
| | | | | |
| New York | 36-1124040 |
| (State of incorporation) | (I.R.S. Employer Identification No.) |
233 South Wacker Drive
Chicago, Illinois 60606-7147
(Address of principal executive offices, including zip code)
(312) 621-6200
(Registrant's telephone number, including area code)
Securities registered pursuant to Section 12(b) of the Act:
| | | | | | | | |
| Title of each class | Trading Symbol(s) | Name of Each Exchange on Which Registered |
| Common Stock | GATX | New York Stock Exchange |
| GATX | Chicago Stock Exchange |
5.625% Senior Notes due 2066 | GMTA | New York Stock Exchange |
Indicate by check mark whether the registrant (1) has filed all reports required to be filed by Section 13 or 15(d) of the Securities Exchange Act of 1934 during the preceding 12 months (or for such shorter period that the registrant was required to file such reports), and (2) has been subject to such filing requirements for the past 90 days. Yes ☒ No ☐
Indicate by check mark whether the registrant has submitted electronically every Interactive Data File required to be submitted pursuant to Rule 405 of Regulation S-T (§232.405 of this chapter) during the preceding 12 months (or for such shorter period that the registrant was required to submit such files). Yes ☒ No ☐
Indicate by check mark whether the registrant is a large accelerated filer, an accelerated filer, a non-accelerated filer, a smaller reporting company, or an emerging growth company. See the definitions of "large accelerated filer," "accelerated filer," "smaller reporting company," and "emerging growth company" in Rule 12b-2 of the Exchange Act.
| | | | | | | | | | | | | | | | | |
| ☒ | Large accelerated filer | | ☐ | Smaller reporting company |
| ☐ | Non-accelerated filer | | ☐ | Emerging growth company |
| ☐ | Accelerated filer | | | |
If an emerging growth company, indicate by check mark if the registrant has elected not to use the extended transition period for complying with any new or revised financial accounting standards provided pursuant to Section 13(a) of the Exchange Act. ☐
Indicate by check mark whether the registrant is a shell company (as defined in Rule 12b-2 of the Exchange Act). Yes ☐ No ☒
There were 35.035.5 million common shares outstanding at September 30, 2020.2021.
GATX CORPORATION
FORM 10-Q
QUARTERLY REPORT FOR THE PERIOD ENDED SEPTEMBER 30, 20202021
INDEX
| | | | | | | | |
| Item No. | | Page No. |
| | |
| | |
| Part I - FINANCIAL INFORMATION |
| Item 1 | | |
| | | |
| | | |
| | | |
| | |
| | |
| | |
| | |
| | |
| | |
| | |
| | |
| | |
| | |
| | |
| | |
| | |
| | |
| | |
| | |
| | |
| | |
| | |
| | |
| Item 2 | | |
| | |
| | |
| | |
| | |
| | |
| | |
| Item 3 | | |
| Item 4 | | |
| | |
| Part II - OTHER INFORMATION |
| Item 1 | | |
| Item 1A | | |
| Item 2 | | |
| Item 6 | | |
| |
| |
FORWARD-LOOKING STATEMENTS
Statements in this report not based on historical facts are "forward-looking statements" within the meaning of the Private Securities Litigation Reform Act of 1995 and, accordingly, involve known and unknown risks and uncertainties that are difficult to predict and could cause our actual results, performance, or achievements to differ materially from those discussed. These include statements as to our future expectations, beliefs, plans, strategies, objectives, events, conditions, financial performance, prospects, or future events. In some cases, forward-looking statements can be identified by the use of words such as "may," "could," "expect," "intend," "plan," "seek," "anticipate," "believe," "estimate," "predict," "potential," "outlook," "continue," "likely," "will," "would", and similar words and phrases. Forward-looking statements are necessarily based on estimates and assumptions that, while considered reasonable by us and our management, are inherently uncertain. Accordingly, you should not place undue reliance on forward-looking statements, which speak only as of the date they are made, and are not guarantees of future performance. We do not undertake any obligation to publicly update or revise these forward-looking statements.
A detailed discussion of the known material risks and uncertainties that could cause actual results and events to differ materially from such forward-looking statements is included in our Annual Report on Form 10-K for the year ended December 31, 2019,2020, and in our other filings with the Securities and Exchange Commission ("SEC"). The following factors, in addition to those discussed under "Risk Factors", in our Annual Report on Form 10-K for the year ended December 31, 2019, and Part II, Item 1A of this Quarterly Report on Form 10-Q,2020 could cause actual results to differ materially from our current expectations expressed in forward looking statements:
| | | | | | | | |
•the severityduration and durationeffects of the global COVID-19 pandemic, including adverse impacts of the pandemic and of businesses’, governments’, and suppliers' responses to the pandemic on our business, personnel, operations, commercial activity, supply chain, the demand for our transportation assets, the value of our assets, and our liquidity, and macroeconomic conditions •exposure to damages, fines, criminal and civil penalties, and reputational harm arising from a negative outcome in litigation, including claims arising from an accident involving our railcars and other transportation assets •inability to maintain our transportation assets on lease at satisfactory rates due to oversupply of assets in the market or other changes in supply and demand •a significant decline in customer demand for our transportation assets or services, including as a result of: ◦weak macroeconomic conditions ◦weak market conditions in our customers' businesses ◦declines in harvest or production volumes ◦adverse changes in the price of, or demand for, commodities
◦changes in railroad operations, or efficiency, ◦changes in railroad pricing and service offerings, including those related to "precision scheduled railroading"
◦changes in supply chains ◦availability of pipelines, trucks, and other alternative modes of transportation ◦changes in conditions affecting the aviation industry, including reduced demand for air travel, geographic exposure and customer concentrations ◦other operational or commercial needs or decisions of our customers ◦customers' desire to buy, rather than lease, our transportation assets •higher costs associated with increased assignments of our transportation assets following non-renewal of leases, customer defaults, and compliance maintenance programs or other maintenance initiatives | |
•events having an adverse impact on assets, customers, or regions where we have a concentrated investment exposure | |
•financial and operational risks associated with long-term railcar purchase commitments including increased costs due to tariffs or trade disputesfor transportation assets •reduced opportunities to generate asset remarketing income •inability to successfully consummate and manage ongoing acquisition and divestiture activities •operational and financial risks related toreliance on Rolls-Royce in connection with our affiliate investments, including the Rolls-Royce & Partners Finance joint ventures,aircraft spare engine leasing businesses, and the durability and reliability of aircraft enginesrisks that certain factors that adversely affect Rolls-Royce could have an adverse effect on those businesses •fluctuations in foreign exchange rates •failure to successfully negotiate collective bargaining agreements with the unions representing a substantial portion of our employees •asset impairment charges we may be required to recognize •deterioration of conditions in the capital markets, reductions in our credit ratings, or increases in our financing costs •uncertainty relating tochanges in banks' inter-lending rate reporting practices and the LIBOR calculation process and potential phasing out of LIBOR after 2021 •competitive factors in our primary markets, including competitors with a significantly lower costcosts of capital than GATX •risks related to our international operations and expansion into new geographic markets, including the inability to access railcar supply and the imposition of new or additionallaws, regulations, tariffs, quotas,taxes, treaties or trade barriers affecting our activities in the countries where we do business •changes in, or failure to comply with, laws, rules, and regulations •inability to obtain cost-effective insurance •environmental liabilities and remediation costs •potential obsolescence of our assets •inadequate allowances to cover credit losses in our portfolio •operational, functional and regulatory risks associated with severe weather events, climate change and natural disasters •inability to maintain and secure our information technology infrastructure from cybersecurity threats and related disruption of our business |
PART I - FINANCIAL INFORMATION
Item 1. Financial Statements
GATX CORPORATION AND SUBSIDIARIES
CONSOLIDATED BALANCE SHEETS (Unaudited)
(In millions, except share data)
| | | September 30 | | December 31 | | September 30 | | December 31 |
| | 2020 | | 2019 | | 2021 | | 2020 |
| Assets | Assets | | | | Assets | | | |
Cash and Cash Equivalents | Cash and Cash Equivalents | $ | 459.8 | | | $ | 151.0 | | Cash and Cash Equivalents | $ | 566.0 | | | $ | 292.2 | |
| | Restricted Cash | | Restricted Cash | 0.2 | | | 0.4 | |
| Receivables | Receivables | | Receivables | |
| Rent and other receivables | Rent and other receivables | 70.6 | | | 65.9 | | Rent and other receivables | 75.2 | | | 74.7 | |
| Finance leases (as lessor) | Finance leases (as lessor) | 63.3 | | | 90.3 | | Finance leases (as lessor) | 71.5 | | | 74.0 | |
| Less: allowance for losses | Less: allowance for losses | (6.2) | | | (6.2) | | Less: allowance for losses | (6.4) | | | (6.5) | |
| | 127.7 | | | 150.0 | | | 140.3 | | | 142.2 | |
| | Operating Assets and Facilities | Operating Assets and Facilities | 10,070.2 | | | 9,523.5 | | Operating Assets and Facilities | 11,025.8 | | | 10,484.0 | |
| Less: allowance for depreciation | Less: allowance for depreciation | (3,226.0) | | | (3,066.2) | | Less: allowance for depreciation | (3,352.3) | | | (3,313.3) | |
| | 6,844.2 | | | 6,457.3 | | | 7,673.5 | | | 7,170.7 | |
| Lease Assets (as lessee) | Lease Assets (as lessee) | | Lease Assets (as lessee) | |
| Right-of-use assets, net of accumulated depreciation | Right-of-use assets, net of accumulated depreciation | 364.3 | | | 411.7 | | Right-of-use assets, net of accumulated depreciation | 279.2 | | | 335.9 | |
| Finance leases, net of accumulated depreciation | Finance leases, net of accumulated depreciation | 0 | | | 8.9 | | Finance leases, net of accumulated depreciation | — | | | 37.5 | |
| | 364.3 | | | 420.6 | | | 279.2 | | | 373.4 | |
| Investments in Affiliated Companies | Investments in Affiliated Companies | 582.5 | | | 512.6 | | Investments in Affiliated Companies | 564.4 | | | 584.7 | |
Goodwill | Goodwill | 84.2 | | | 81.5 | | Goodwill | 138.7 | | | 143.7 | |
Other Assets | Other Assets | 227.6 | | | 221.0 | | Other Assets | 224.0 | | | 230.3 | |
| Assets of Discontinued Operations | 0 | | | 291.1 | | |
Total Assets | Total Assets | $ | 8,690.3 | | | $ | 8,285.1 | | Total Assets | $ | 9,586.3 | | | $ | 8,937.6 | |
| | Liabilities and Shareholders’ Equity | Liabilities and Shareholders’ Equity | | Liabilities and Shareholders’ Equity | |
Accounts Payable and Accrued Expenses | Accounts Payable and Accrued Expenses | $ | 139.2 | | | $ | 119.4 | | Accounts Payable and Accrued Expenses | $ | 164.1 | | | $ | 147.3 | |
| Debt | Debt | | Debt | |
| Commercial paper and borrowings under bank credit facilities | Commercial paper and borrowings under bank credit facilities | 13.5 | | | 15.8 | | Commercial paper and borrowings under bank credit facilities | 20.7 | | | 23.6 | |
| Recourse | Recourse | 5,183.0 | | | 4,780.4 | | Recourse | 6,029.8 | | | 5,329.0 | |
| | 5,196.5 | | | 4,796.2 | | | 6,050.5 | | | 5,352.6 | |
| Lease Obligations (as lessee) | Lease Obligations (as lessee) | | Lease Obligations (as lessee) | |
| Operating leases | Operating leases | 368.0 | | | 429.4 | | Operating leases | 292.1 | | | 348.6 | |
| Finance leases | Finance leases | 0 | | | 7.9 | | Finance leases | — | | | 33.3 | |
| | 368.0 | | | 437.3 | | | 292.1 | | | 381.9 | |
| Deferred Income Taxes | Deferred Income Taxes | 936.4 | | | 888.5 | | Deferred Income Taxes | 977.7 | | | 962.8 | |
Other Liabilities | Other Liabilities | 120.2 | | | 139.1 | | Other Liabilities | 125.0 | | | 135.6 | |
| Liabilities of Discontinued Operations | 0 | | | 69.5 | | |
Total Liabilities | Total Liabilities | 6,760.3 | | | 6,450.0 | | Total Liabilities | 7,609.4 | | | 6,980.2 | |
| Shareholders’ Equity | Shareholders’ Equity | | Shareholders’ Equity | |
Common stock, $0.625 par value: Authorized shares — 120,000,000 Issued shares — 67,685,423 and 67,536,794 Outstanding shares — 34,981,666 and 34,833,037 | 41.9 | | | 41.8 | | |
Common stock, $0.625 par value: Authorized shares — 120,000,000 Issued shares — 68,186,431 and 67,751,074 Outstanding shares — 35,478,446 and 35,047,317 | | Common stock, $0.625 par value: Authorized shares — 120,000,000 Issued shares — 68,186,431 and 67,751,074 Outstanding shares — 35,478,446 and 35,047,317 | 42.2 | | | 41.9 | |
| Additional paid in capital | Additional paid in capital | 730.8 | | | 720.1 | | Additional paid in capital | 761.7 | | | 735.4 | |
| Retained earnings | Retained earnings | 2,682.0 | | | 2,601.3 | | Retained earnings | 2,708.9 | | | 2,682.1 | |
| Accumulated other comprehensive loss | Accumulated other comprehensive loss | (160.2) | | | (163.6) | | Accumulated other comprehensive loss | (171.0) | | | (137.5) | |
| Treasury stock at cost (32,703,757 and 32,703,757 shares) | (1,364.5) | | | (1,364.5) | | |
| Treasury stock at cost (32,707,985 and 32,703,757 shares) | | Treasury stock at cost (32,707,985 and 32,703,757 shares) | (1,364.9) | | | (1,364.5) | |
Total Shareholders’ Equity | Total Shareholders’ Equity | 1,930.0 | | | 1,835.1 | | Total Shareholders’ Equity | 1,976.9 | | | 1,957.4 | |
| Total Liabilities and Shareholders’ Equity | Total Liabilities and Shareholders’ Equity | $ | 8,690.3 | | | $ | 8,285.1 | | Total Liabilities and Shareholders’ Equity | $ | 9,586.3 | | | $ | 8,937.6 | |
See accompanying notes to consolidated financial statements.
GATX CORPORATION AND SUBSIDIARIES
CONSOLIDATED STATEMENTS OF COMPREHENSIVE INCOME (Unaudited)
(In millions, except per share data)
| | | Three Months Ended
September 30 | | Nine Months Ended
September 30 | | Three Months Ended
September 30 | | Nine Months Ended
September 30 |
| | 2020 | | 2019 | | 2020 | | 2019 | | 2021 | | 2020 | | 2021 | | 2020 |
| Revenues | Revenues | | | | | | | | Revenues | | | | | | | |
| Lease revenue | Lease revenue | $ | 273.3 | | | $ | 270.5 | | | $ | 813.3 | | | $ | 816.8 | | Lease revenue | $ | 283.9 | | | $ | 273.3 | | | $ | 852.1 | | | $ | 813.3 | |
| Marine operating revenue | Marine operating revenue | 5.0 | | | 1.9 | | | 11.6 | | | 4.4 | | Marine operating revenue | 5.0 | | | 5.0 | | | 13.7 | | | 11.6 | |
| Other revenue | Other revenue | 26.1 | | | 26.4 | | | 79.4 | | | 80.4 | | Other revenue | 24.6 | | | 26.1 | | | 70.6 | | | 79.4 | |
| Total Revenues | Total Revenues | 304.4 | | | 298.8 | | | 904.3 | | | 901.6 | | Total Revenues | 313.5 | | | 304.4 | | | 936.4 | | | 904.3 | |
| Expenses | Expenses | | Expenses | |
| Maintenance expense | Maintenance expense | 76.7 | | | 76.2 | | | 244.8 | | | 235.3 | | Maintenance expense | 74.2 | | | 76.7 | | | 225.1 | | | 244.8 | |
| Marine operating expense | Marine operating expense | 3.6 | | | 3.4 | | | 10.9 | | | 12.0 | | Marine operating expense | 3.7 | | | 3.6 | | | 13.8 | | | 10.9 | |
| Depreciation expense | Depreciation expense | 83.4 | | | 80.0 | | | 245.4 | | | 240.2 | | Depreciation expense | 91.1 | | | 83.4 | | | 271.2 | | | 245.4 | |
| Operating lease expense | Operating lease expense | 12.3 | | | 13.7 | | | 38.1 | | | 41.1 | | Operating lease expense | 9.0 | | | 12.3 | | | 30.1 | | | 38.1 | |
| Other operating expense | Other operating expense | 8.3 | | | 7.7 | | | 26.0 | | | 23.5 | | Other operating expense | 9.7 | | | 8.3 | | | 31.3 | | | 26.0 | |
| Selling, general and administrative expense | Selling, general and administrative expense | 42.0 | | | 42.6 | | | 125.8 | | | 129.6 | | Selling, general and administrative expense | 45.9 | | | 42.0 | | | 140.8 | | | 125.8 | |
| Total Expenses | Total Expenses | 226.3 | | | 223.6 | | | 691.0 | | | 681.7 | | Total Expenses | 233.6 | | | 226.3 | | | 712.3 | | | 691.0 | |
| Other Income (Expense) | Other Income (Expense) | | Other Income (Expense) | |
| Net gain on asset dispositions | Net gain on asset dispositions | 8.9 | | | 5.1 | | | 42.3 | | | 46.9 | | Net gain on asset dispositions | 21.9 | | | 8.9 | | | 79.1 | | | 42.3 | |
| Interest expense, net | Interest expense, net | (48.6) | | | (44.7) | | | (141.5) | | | (135.3) | | Interest expense, net | (49.8) | | | (48.6) | | | (153.4) | | | (141.5) | |
| Other expense | Other expense | (1.2) | | | (1.7) | | | (12.2) | | | (5.3) | | Other expense | (0.3) | | | (1.2) | | | (9.7) | | | (12.2) | |
Income before Income Taxes and Share of Affiliates’ Earnings | Income before Income Taxes and Share of Affiliates’ Earnings | 37.2 | | | 33.9 | | | 101.9 | | | 126.2 | | Income before Income Taxes and Share of Affiliates’ Earnings | 51.7 | | | 37.2 | | | 140.1 | | | 101.9 | |
| Income taxes | Income taxes | (11.8) | | | (9.5) | | | (29.6) | | | (31.1) | | Income taxes | (14.4) | | | (11.8) | | | (36.4) | | | (29.6) | |
| Share of affiliates’ earnings, net of taxes | Share of affiliates’ earnings, net of taxes | 22.8 | | | 12.8 | | | 60.1 | | | 43.6 | | Share of affiliates’ earnings, net of taxes | 2.8 | | | 22.8 | | | (21.6) | | | 60.1 | |
| Net Income from Continuing Operations | Net Income from Continuing Operations | $ | 48.2 | | | $ | 37.2 | | | $ | 132.4 | | | $ | 138.7 | | Net Income from Continuing Operations | $ | 40.1 | | | $ | 48.2 | | | $ | 82.1 | | | $ | 132.4 | |
| | Discontinued Operations, Net of Taxes | Discontinued Operations, Net of Taxes | | Discontinued Operations, Net of Taxes | |
| Net income (loss) from discontinued operations, net of taxes | $ | 0 | | | $ | 7.9 | | | $ | (2.2) | | | $ | 15.9 | | |
| Net loss from discontinued operations, net of taxes | | Net loss from discontinued operations, net of taxes | $ | — | | | $ | — | | | $ | — | | | $ | (2.2) | |
| (Loss) gain on sale of discontinued operations, net of taxes | (Loss) gain on sale of discontinued operations, net of taxes | (0.3) | | | 0 | | | 3.3 | | | 0 | | (Loss) gain on sale of discontinued operations, net of taxes | — | | | (0.3) | | | — | | | 3.3 | |
| Total Discontinued Operations, Net of Taxes | $ | (0.3) | | | $ | 7.9 | | | $ | 1.1 | | | $ | 15.9 | | |
| Discontinued Operations, Net of Taxes | | Discontinued Operations, Net of Taxes | $ | — | | | $ | (0.3) | | | $ | — | | | $ | 1.1 | |
| | Net Income | Net Income | $ | 47.9 | | | $ | 45.1 | | | $ | 133.5 | | | $ | 154.6 | | Net Income | $ | 40.1 | | | $ | 47.9 | | | $ | 82.1 | | | $ | 133.5 | |
| Other Comprehensive Income, Net of Taxes | Other Comprehensive Income, Net of Taxes | | | | | | | | Other Comprehensive Income, Net of Taxes | | | | | | | |
| Foreign currency translation adjustments | Foreign currency translation adjustments | 19.7 | | | (33.6) | | | (0.9) | | | (32.4) | | Foreign currency translation adjustments | (20.7) | | | 19.7 | | | (42.0) | | | (0.9) | |
| | Unrealized gain (loss) on derivative instruments | Unrealized gain (loss) on derivative instruments | 0.3 | | | (1.0) | | | (3.7) | | | 2.1 | | Unrealized gain (loss) on derivative instruments | 0.3 | | | 0.3 | | | 1.3 | | | (3.7) | |
| Post-retirement benefit plans | Post-retirement benefit plans | 2.3 | | | 1.4 | | | 8.0 | | | 5.9 | | Post-retirement benefit plans | 2.4 | | | 2.3 | | | 7.2 | | | 8.0 | |
| Other comprehensive income (loss) | 22.3 | | | (33.2) | | | 3.4 | | | (24.4) | | |
| Other comprehensive (loss) income | | Other comprehensive (loss) income | (18.0) | | | 22.3 | | | (33.5) | | | 3.4 | |
| Comprehensive Income | Comprehensive Income | $ | 70.2 | | | $ | 11.9 | | | $ | 136.9 | | | $ | 130.2 | | Comprehensive Income | $ | 22.1 | | | $ | 70.2 | | | $ | 48.6 | | | $ | 136.9 | |
| | Share Data | Share Data | | Share Data | |
| Basic earnings per share from continuing operations | Basic earnings per share from continuing operations | $ | 1.38 | | | $ | 1.05 | | | $ | 3.79 | | | $ | 3.86 | | Basic earnings per share from continuing operations | $ | 1.13 | | | $ | 1.38 | | | $ | 2.32 | | | $ | 3.79 | |
| Basic earnings per share from discontinued operations | Basic earnings per share from discontinued operations | (0.01) | | | 0.23 | | | 0.03 | | | 0.44 | | Basic earnings per share from discontinued operations | — | | | (0.01) | | | — | | | 0.03 | |
| Basic earnings per share from consolidated operations | Basic earnings per share from consolidated operations | $ | 1.37 | | | $ | 1.28 | | | $ | 3.82 | | | $ | 4.30 | | Basic earnings per share from consolidated operations | $ | 1.13 | | | $ | 1.37 | | | $ | 2.32 | | | $ | 3.82 | |
| Average number of common shares | Average number of common shares | 35.0 | | | 35.4 | | | 34.9 | | | 35.9 | | Average number of common shares | 35.5 | | | 35.0 | | | 35.4 | | | 34.9 | |
| | Diluted earnings per share from continuing operations | Diluted earnings per share from continuing operations | $ | 1.36 | | | $ | 1.03 | | | $ | 3.74 | | | $ | 3.79 | | Diluted earnings per share from continuing operations | $ | 1.11 | | | $ | 1.36 | | | $ | 2.28 | | | $ | 3.74 | |
| Diluted earnings per share from discontinued operations | Diluted earnings per share from discontinued operations | (0.01) | | | 0.22 | | | 0.03 | | | 0.43 | | Diluted earnings per share from discontinued operations | — | | | (0.01) | | | — | | | 0.03 | |
| Diluted earnings per share from consolidated operations | Diluted earnings per share from consolidated operations | $ | 1.35 | | | $ | 1.25 | | | $ | 3.77 | | | $ | 4.22 | | Diluted earnings per share from consolidated operations | $ | 1.11 | | | $ | 1.35 | | | $ | 2.28 | | | $ | 3.77 | |
| Average number of common shares and common share equivalents | Average number of common shares and common share equivalents | 35.4 | | | 36.0 | | | 35.4 | | | 36.6 | | Average number of common shares and common share equivalents | 36.0 | | | 35.4 | | | 36.0 | | | 35.4 | |
See accompanying notes to consolidated financial statements.
GATX CORPORATION AND SUBSIDIARIES
CONSOLIDATED STATEMENTS OF CASH FLOWS (Unaudited)
(In millions)
| | | Nine Months Ended
September 30 | | Nine Months Ended
September 30 |
| | 2020 | | 2019 | | 2021 | | 2020 |
| Operating Activities | Operating Activities | | | | Operating Activities | | | |
| Net income | Net income | $ | 133.5 | | | $ | 154.6 | | Net income | $ | 82.1 | | | $ | 133.5 | |
| Income from discontinued operations, net of taxes | Income from discontinued operations, net of taxes | 1.1 | | | 15.9 | | Income from discontinued operations, net of taxes | — | | | 1.1 | |
| Net income from continuing operations | Net income from continuing operations | 132.4 | | | 138.7 | | Net income from continuing operations | 82.1 | | | 132.4 | |
| | Adjustments to reconcile net income to net cash provided by operating activities: | Adjustments to reconcile net income to net cash provided by operating activities: | | Adjustments to reconcile net income to net cash provided by operating activities: | |
| Depreciation expense | Depreciation expense | 254.6 | | | 248.4 | | Depreciation expense | 281.9 | | | 254.6 | |
| | Net gains on sales of assets | Net gains on sales of assets | (40.5) | | | (45.5) | | Net gains on sales of assets | (76.6) | | | (40.5) | |
| Deferred income taxes | Deferred income taxes | 29.8 | | | 20.9 | | Deferred income taxes | 19.7 | | | 29.8 | |
| Share of affiliates’ earnings, net of dividends | Share of affiliates’ earnings, net of dividends | (60.1) | | | (43.6) | | Share of affiliates’ earnings, net of dividends | 21.5 | | | (60.1) | |
| Changes in working capital items | Changes in working capital items | (14.1) | | | (40.7) | | Changes in working capital items | 11.4 | | | (14.1) | |
| Net cash provided by operating activities of continuing operations | Net cash provided by operating activities of continuing operations | 302.1 | | | 278.2 | | Net cash provided by operating activities of continuing operations | 340.0 | | | 302.1 | |
| Investing Activities | Investing Activities | | Investing Activities | |
| Additions to operating assets and facilities | | Additions to operating assets and facilities | (891.4) | | | (641.4) | |
| Acquisition of new businesses | | Acquisition of new businesses | (1.4) | | | — | |
| Investments in affiliates | | Investments in affiliates | (0.4) | | | — | |
| Portfolio investments and capital additions | Portfolio investments and capital additions | (641.4) | | | (503.8) | | Portfolio investments and capital additions | (893.2) | | | (641.4) | |
| Purchases of assets previously leased | — | | | (1.0) | | |
| Portfolio proceeds | Portfolio proceeds | 120.2 | | | 185.6 | | Portfolio proceeds | 159.0 | | | 120.2 | |
| Proceeds from sales of other assets | Proceeds from sales of other assets | 17.5 | | | 18.9 | | Proceeds from sales of other assets | 43.7 | | | 17.5 | |
| | Other | Other | 1.3 | | | 2.0 | | Other | 0.6 | | | 1.3 | |
| Net cash used in investing activities of continuing operations | Net cash used in investing activities of continuing operations | (502.4) | | | (298.3) | | Net cash used in investing activities of continuing operations | (689.9) | | | (502.4) | |
| Financing Activities | Financing Activities | | Financing Activities | |
| Net proceeds from issuances of debt (original maturities longer than 90 days) | Net proceeds from issuances of debt (original maturities longer than 90 days) | 1,465.8 | | | 549.7 | | Net proceeds from issuances of debt (original maturities longer than 90 days) | 1,319.1 | | | 1,465.8 | |
| Repayments of debt (original maturities longer than 90 days) | Repayments of debt (original maturities longer than 90 days) | (1,100.0) | | | (410.0) | | Repayments of debt (original maturities longer than 90 days) | (584.0) | | | (1,100.0) | |
| Net decrease in debt with original maturities of 90 days or less | Net decrease in debt with original maturities of 90 days or less | (3.1) | | | 2.0 | | Net decrease in debt with original maturities of 90 days or less | (1.9) | | | (3.1) | |
| Stock repurchases | Stock repurchases | 0 | | | (129.0) | | Stock repurchases | (0.4) | | | — | |
| Dividends | Dividends | (53.7) | | | (52.8) | | Dividends | (56.2) | | | (53.7) | |
| Purchases of assets previously leased | Purchases of assets previously leased | (40.0) | | | 0 | | Purchases of assets previously leased | (77.2) | | | (40.0) | |
| Other | Other | (13.1) | | | 3.3 | | Other | 24.4 | | | (13.1) | |
| Net cash provided by (used in) financing activities of continuing operations | 255.9 | | | (36.8) | | |
| Net cash provided by financing activities of continuing operations | | Net cash provided by financing activities of continuing operations | 623.8 | | | 255.9 | |
Effect of Exchange Rate Changes on Cash and Cash Equivalents | Effect of Exchange Rate Changes on Cash and Cash Equivalents | (1.0) | | | (1.2) | | Effect of Exchange Rate Changes on Cash and Cash Equivalents | (1.4) | | | (1.0) | |
| Net cash used in (provided by) operating activities from discontinued operations | (8.5) | | | 18.9 | | |
| Net cash provided by (used in) investing activities from discontinued operations | 240.9 | | | (18.7) | | |
| Net cash provided by (used in) financing activities from discontinued operations | 21.8 | | | (0.2) | | |
| Net cash used in operating activities from discontinued operations | | Net cash used in operating activities from discontinued operations | — | | | (8.5) | |
| Net cash provided by investing activities from discontinued operations | | Net cash provided by investing activities from discontinued operations | 1.1 | | | 240.9 | |
| Net cash provided by financing activities from discontinued operations | | Net cash provided by financing activities from discontinued operations | — | | | 21.8 | |
| Cash provided by discontinued operations, net | Cash provided by discontinued operations, net | 254.2 | | | 0 | | Cash provided by discontinued operations, net | 1.1 | | | 254.2 | |
| Net increase (decrease) in Cash and Cash Equivalents during the period | 308.8 | | | (58.1) | | |
| Cash and Cash Equivalents at beginning of the period | 151.0 | | | 106.7 | | |
| Cash and Cash Equivalents at end of the period | $ | 459.8 | | | $ | 48.6 | | |
| Net increase in Cash, Cash Equivalents, and Restricted Cash during the period | | Net increase in Cash, Cash Equivalents, and Restricted Cash during the period | 273.6 | | | 308.8 | |
| Cash, Cash Equivalents, and Restricted Cash at beginning of the period | | Cash, Cash Equivalents, and Restricted Cash at beginning of the period | 292.6 | | | 151.0 | |
| Cash, Cash Equivalents, and Restricted Cash at end of the period | | Cash, Cash Equivalents, and Restricted Cash at end of the period | $ | 566.2 | | | $ | 459.8 | |
|
See accompanying notes to consolidated financial statements.
GATX CORPORATION AND SUBSIDIARIES
CONSOLIDATED STATEMENTS OF CHANGES IN SHAREHOLDERS’ EQUITY (Unaudited)
(In millions)
| | | Three Months Ended
September 30 | | Nine Months Ended
September 30 | | Three Months Ended
September 30 | | Nine Months Ended
September 30 |
| | 2020 | | 2019 | | 2020 | | 2019 | | 2021 | | 2020 | | 2021 | | 2020 |
| | Shares | | Dollars | | Shares | | Dollars | | Shares | | Dollars | | Shares | | Dollars | | Shares | | Dollars | | Shares | | Dollars | | Shares | | Dollars | | Shares | | Dollars |
| Common Stock | Common Stock | | | | | | | | | | | | | | | | Common Stock | | | | | | | | | | | | | | | |
| Balance at beginning of the period | Balance at beginning of the period | 67.7 | | | $ | 41.8 | | | 67.5 | | | $ | 41.8 | | | 67.5 | | | $ | 41.8 | | | 67.3 | | | $ | 41.6 | | Balance at beginning of the period | 68.2 | | | $ | 42.2 | | | 67.7 | | | $ | 41.8 | | | 67.8 | | | $ | 41.9 | | | 67.5 | | | $ | 41.8 | |
| Issuance of common stock | Issuance of common stock | 0 | | | 0.1 | | | 0 | | | 0 | | | 0.2 | | | 0.1 | | | 0.2 | | | 0.2 | | Issuance of common stock | — | | | — | | | — | | | 0.1 | | | 0.4 | | | 0.3 | | | 0.2 | | | 0.1 | |
| Balance at end of the period | Balance at end of the period | 67.7 | | | 41.9 | | | 67.5 | | | 41.8 | | | 67.7 | | | 41.9 | | | 67.5 | | | 41.8 | | Balance at end of the period | 68.2 | | | 42.2 | | | 67.7 | | | 41.9 | | | 68.2 | | | 42.2 | | | 67.7 | | | 41.9 | |
| Treasury Stock | Treasury Stock | | Treasury Stock | |
| Balance at beginning of the period | Balance at beginning of the period | (32.7) | | | (1,364.5) | | | (31.8) | | | (1,297.7) | | | (32.7) | | | (1,364.5) | | | (30.7) | | | (1,214.5) | | Balance at beginning of the period | (32.7) | | | (1,364.5) | | | (32.7) | | | (1,364.5) | | | (32.7) | | | (1,364.5) | | | (32.7) | | | (1,364.5) | |
| Stock repurchases | Stock repurchases | 0 | | | 0 | | | (0.6) | | | (46.7) | | | 0 | | | 0 | | | (1.7) | | | (129.9) | | Stock repurchases | — | | | (0.4) | | | — | | | — | | | — | | | (0.4) | | | — | | | — | |
| Balance at end of the period | Balance at end of the period | (32.7) | | | (1,364.5) | | | (32.4) | | | (1,344.4) | | | (32.7) | | | (1,364.5) | | | (32.4) | | | (1,344.4) | | Balance at end of the period | (32.7) | | | (1,364.9) | | | (32.7) | | | (1,364.5) | | | (32.7) | | | (1,364.9) | | | (32.7) | | | (1,364.5) | |
| Additional Paid In Capital | Additional Paid In Capital | | Additional Paid In Capital | |
| Balance at beginning of the period | Balance at beginning of the period | | 728.8 | | | 713.0 | | | 720.1 | | | 706.4 | | Balance at beginning of the period | | 759.4 | | | 728.8 | | | 735.4 | | | 720.1 | |
| Share-based compensation effects | Share-based compensation effects | | 2.0 | | | 3.6 | | | 10.7 | | | 10.2 | | Share-based compensation effects | | 2.3 | | | 2.0 | | | 26.3 | | | 10.7 | |
| Balance at end of the period | Balance at end of the period | | 730.8 | | | 716.6 | | | 730.8 | | | 716.6 | | Balance at end of the period | | 761.7 | | | 730.8 | | | 761.7 | | | 730.8 | |
| Retained Earnings | Retained Earnings | | Retained Earnings | |
| Balance at beginning of the period | Balance at beginning of the period | | 2,651.7 | | | 2,533.5 | | | 2,601.3 | | | 2,419.2 | | Balance at beginning of the period | | 2,687.3 | | | 2,651.7 | | | 2,682.1 | | | 2,601.3 | |
| Net income | Net income | | 47.9 | | | 45.1 | | | 133.5 | | | 154.6 | | Net income | | 40.1 | | | 47.9 | | | 82.1 | | | 133.5 | |
| Dividends declared ($0.48 and $0.46 per share QTR and $1.44 and $1.38 YTD) | | (17.6) | | | (17.1) | | | (52.8) | | | (51.7) | | |
| Cumulative impact of accounting standard adoption | | 0 | | | 0 | | | 0 | | | 39.4 | | |
| Dividends declared ($0.50 and $0.48 per share QTR and $1.50 and $1.44 YTD) | | Dividends declared ($0.50 and $0.48 per share QTR and $1.50 and $1.44 YTD) | | (18.5) | | | (17.6) | | | (55.3) | | | (52.8) | |
| | Balance at end of the period | Balance at end of the period | | 2,682.0 | | | | 2,561.5 | | | 2,682.0 | | | 2,561.5 | | Balance at end of the period | | 2,708.9 | | | 2,682.0 | | | 2,708.9 | | | 2,682.0 | |
| Accumulated Other Comprehensive Loss | Accumulated Other Comprehensive Loss | | Accumulated Other Comprehensive Loss | |
| Balance at beginning of the period | Balance at beginning of the period | | (182.5) | | | (155.8) | | | (163.6) | | | (164.6) | | Balance at beginning of the period | | (153.0) | | | (182.5) | | | (137.5) | | | (163.6) | |
| Other comprehensive income (loss) | | 22.3 | | | (33.2) | | | 3.4 | | | (24.4) | | |
| Other comprehensive (loss) income | | Other comprehensive (loss) income | | (18.0) | | | 22.3 | | | (33.5) | | | 3.4 | |
| | Balance at end of the period | Balance at end of the period | | (160.2) | | | | (189.0) | | | (160.2) | | | (189.0) | | Balance at end of the period | | (171.0) | | | | (160.2) | | | (171.0) | | | (160.2) | |
Total Shareholders’ Equity | Total Shareholders’ Equity | | $ | 1,930.0 | | | | $ | 1,786.5 | | | $ | 1,930.0 | | | $ | 1,786.5 | | Total Shareholders’ Equity | | $ | 1,976.9 | | | | $ | 1,930.0 | | | $ | 1,976.9 | | | $ | 1,930.0 | |
See accompanying notes to consolidated financial statements.
GATX CORPORATION AND SUBSIDIARIES
NOTES TO CONSOLIDATED FINANCIAL STATEMENTS (UNAUDITED)
NOTE 1. Description of Business
As used herein, "GATX," "we," "us," "our," and similar terms refer to GATX Corporation and its subsidiaries, unless indicated otherwise.
We lease, operate, manage, and remarket long-lived, widely-used assets, primarily in the rail market. We report our financial results through 3 primary business segments: Rail North America, Rail International, and Portfolio Management. Historically, we also reported financial results for American Steamship Company ("ASC") as a fourth segment.
In the first quarter of 2021, GATX began investing directly in aircraft spare engines through its new entity, GATX Engine Leasing ("GEL"). During the first quarter of 2021, GEL acquired 14 aircraft spare engines for approximately $352 million, including 4 engines for $120 million from the Rolls-Royce & Partners Finance joint ventures (collectively the “RRPF affiliates” or "RRPF"). Financial results for this business are reported in the Portfolio Management segment.
On December 29, 2020, GATX acquired Trifleet Leasing Holding B.V. ("Trifleet"), one of the largest tank container lessors in the world. Financial results for this business are reported in the Other segment. See "Note 3. Business Combinations" for additional information.
On May 14, 2020, we completed the sale of our ASC business, subject to customary post-closing adjustments. As a result, ASC is now reported as discontinued operations, and financial data for the ASC segment has been segregated and presented as discontinued operations for all periods presented. See "Note 16. Discontinued Operations" of this Form 10-Q for additional information.
NOTE 2. Coronavirus Impacts
On March 11, 2020, the World Health Organization declared the Coronavirus Disease 2019 (“COVID-19”) a pandemic and on March 13, 2020, the United States declared a national emergency related to COVID-19. Our consolidated financial statements reflect estimates and assumptions at the date of the consolidated financial statements and reported amounts of revenue and expenses during the reporting periods presented. We considered the impact of COVID-19 on our operations and the assumptions and estimates used. While COVID-19 did have a negative impact on operating conditions in the three and nine months ended September 30, 2020, we determined the impact to our assumptions and estimates was not significant. However, we expect COVID-19 will continue to have an adverse impact on our operating and financial results in future periods, the magnitude and duration of which cannot be determined at this time.
On March 27, 2020, the U.S. government enacted the Coronavirus Aid, Relief, and Economic Security Act (“CARES Act”), which includes modifications to the interest expense limitation threshold and net operating loss carryback period and utilization limitation, the acceleration of payments for alternative minimum tax credit refunds, and the deferral of employer payroll tax payments. The CARES Act is not expected to have a material impact on our consolidated financial statements.
NOTE 3.2. Basis of Presentation
We prepared the accompanying unaudited consolidated financial statements in accordance with U.S. Generally Accepted Accounting Principles ("GAAP") for interim financial information and the instructions to Form 10-Q and Article 10 of Regulation S-X. Accordingly, our unaudited consolidated financial statements do not include all of the information and footnotes required for complete financial statements. We have included all of the normal recurring adjustments that we deemed necessary for a fair presentation. Certain prior year amounts have been reclassified to conform to the 20202021 presentation, including the separate presentation and reporting of discontinued operations.
Operating results for the nine months ended September 30, 20202021 are not necessarily indicative of the results we may achieve for the entire year ending December 31, 2020.2021. In particular, asset remarketing income does not occur evenly throughout the year. For more information, refer to the consolidated financial statements and footnotes in our Annual Report on Form 10-K for the year ended December 31, 2019.2020.
GATX CORPORATION AND SUBSIDIARIES
NOTES TO CONSOLIDATED FINANCIAL STATEMENTS (UNAUDITED) (Continued)
New Accounting Pronouncements Adopted
| | | | | | | | |
| Standard/Description | Effective Date and Adoption Considerations | Effect on Financial Statements or Other Significant Matters |
Credit LossesIncome Taxes
In June 2016,December 2019, the FASB issued ASU 2016-13,2019-12, Credit LossesIncome Taxes (Topic 326)740): MeasurementSimplifying the Accounting for Income Taxes, which eliminates exceptions for intraperiod tax allocation and the recognition of Credit Losses on Financial Instruments, which supersedes previous guidance. The FASB subsequently issued ASU 2018-19, clarifying operating lease receivables are not withindeferred tax liabilities for outside basis differences and clarifies the scope of subtopic 326-20 and should be accountedmethodology for calculating income taxes in accordance with Topic 842, Leases. The new guidance modifies the impairment model to be based on expected losses rather than incurred losses.an interim period. |
We adopted the new guidance in the first quarter of 2020.2021. |
The adoption of this standard required us to modify our assessment for a limited population of receivables, including the net investment in our finance leases, as well as our trade receivables at ASC. As part of our modified assessment, we considered historical information as well as current and future economic conditions. The application of this new guidance did not impact our financial statements orand had an immaterial impact on related disclosures. |
GATX CORPORATION AND SUBSIDIARIES
NOTES TO CONSOLIDATED FINANCIAL STATEMENTS (UNAUDITED) (Continued)
New Accounting Pronouncements Not Yet Adopted
| | | | | | | | |
| Standard/Description | Effective Date and Adoption Considerations | Effect on Financial Statements or Other Significant Matters |
Income TaxesReference Rate Reform
In December 2019,March 2020, the FASB issued ASU 2019-12,2020-04, Income TaxesReference Rate Reform (Topic 740)848): SimplifyingFacilitation of the Accounting for Income Taxes,Effects of Reference Rate Reform on Financial Reporting, which eliminatesprovides optional practical expedients and exceptions for intraperiod tax allocation,in the methodology for calculating income taxes in an interim period,application of GAAP principles to contracts, hedging relationships, and the recognitionother transactions that reference LIBOR or other reference rates being discontinued as a result of deferred tax liabilities for outside basis differences.reference rate reform. |
Optional expedients are available for adoption from March 12, 2020 through December 31, 2022. |
For any contracts that reference LIBOR, we are currently assessing how this standard may be applied to specific contract modifications. |
Variable Lease Payments
In July 2021, the FASB issued ASU 2021-05, Leases (Topic 842) - Lessors - Certain Leases with Variable Lease Payments, which classifies leases with variable rate payments (not dependent on a rate or index) as operating for a lessor if the lease would have been a finance lease that recognized a selling loss at lease commencement. |
The new guidance is effective for us in the first quarter of 2021, with early adoption permitted.
We plan to adopt this standard on January 1, 2021.2022. |
We are evaluating the potential impactdo not expect the new guidance willto have a significant impact on our financial statements andor related disclosures. |
NOTE 3. Business Combinations
On December 29, 2020, GATX acquired Trifleet Leasing Holding B.V. ("Trifleet"), one of the largest tank container lessors in the world, for approximately €165 million ($203.2 million) in cash. Transaction costs associated with this acquisition were approximately $2.7 million. In the third quarter of 2021, GATX paid an additional €1.1 million ($1.4 million), attributable to post-closing adjustments. Headquartered in the Netherlands with offices worldwide, Trifleet owns and manages a fleet of tank containers leased to a diverse customer base in the chemical, industrial gas, energy, food, cryogenic and pharmaceutical industries, as well as to tank container operators.
As of September 30, 2021, we have allocated $146.2 million to tangible net assets and $58.4 million to goodwill in the preliminary purchase accounting for the acquisition. The allocation of the purchase price is incomplete with respect to certain assets and liabilities acquired. The purchase price allocation will be finalized during the measurement period, which will not exceed 12 months from the acquisition date. The acquisition was not significant in relation to our financial results and, therefore, pro-forma financial information has not been presented.
NOTE 4. Revenue
Revenue Recognition
Revenue is recognized when control of the promised goods or services is transferred to our customers, in an amount that reflects the consideration we expect to be entitled to in exchange for those goods or services.
We disaggregate revenue into three categories as presented on our income statement:
Lease Revenue
Lease revenue, which includes operating lease revenue and finance lease revenue, is our primary source of revenue. In accordance with ASU 2016-02, Leases (Topic 842) ("Topic 842"), we utilize the practical expedient that allows lessors to not separate non-lease components from the associated lease components for our operating leases.
Operating Lease Revenue
We lease railcars, tank containers, aircraft spare engines, and other operating assets under full-service and net operating leases. We price full-service leases as an integrated service that includes amounts related to maintenance, insurance, and ad valorem taxes. We do not offer stand-alone maintenance service contracts. Operating lease revenue is within the scope of Topic 842, and we dohave elected not to separate non-lease components from the associated lease component for qualifying leases. Operating lease revenue is recognized on a straight-line basis over the term of the underlying lease. As a result, lease revenue may not be recognized in the same period as maintenance
GATX CORPORATION AND SUBSIDIARIES
NOTES TO CONSOLIDATED FINANCIAL STATEMENTS (UNAUDITED) (Continued)
recognized in the same period as maintenance and other costs, which we expense as incurred. Variable rents are recognized when applicable contingencies are resolved. Revenue is not recognized if collectability is not reasonably assured. See "Note 5. Leases".
Finance Lease Revenue
In certain cases, we lease railcars, tank containers, and other operating assets that, at lease inception, are classified as finance leases. In accordance with Topic 842, we recognize finance lease revenue is recognized using the interest method, which produces a constant yield over the lease term. Initial unearned income is the amount by which the original lease payment receivable and the estimated residual value of the leased asset exceeds the original cost or carrying value of the leased asset. See "Note 5. Leases".
Marine Operating Revenue
We generate marine operating revenue through shipping services completed by our marine vessels. In accordanceFor vessels operating in a pooling arrangement, we recognize pool revenue based on the right to receive our portion of net distributions reported by the pool, with ASU 2014-09, Revenue from Contracts and Customers (Topic 606) ("Topic 606"), marinenet distributions being the net voyage revenue of the pool after deduction of voyage expenses. For vessels operating out of the pool, we recognize revenue is recognized over time as the performance obligation is satisfied, beginning when cargo is loaded through its delivery and discharge. Revenue is recognized pro rata over the projected duration of each voyage, which is derived from historical voyage data.
Other Revenue
Other revenue is comprised of customer liability repair revenue, termination fees, utilization income, fee income, and other miscellaneous revenues. Select components of other revenue are within the scope of Topic 606. Revenue attributable to terms provided in our lease contracts are variable lease components that are recognized when earned, in accordance with Topic 842.
NOTE 5. Leases
GATX as Lessor
We lease railcars, tank containers, aircraft spare engines, and other operating assets under full-service and net operating leases. We price full-service leases as an integrated service that includes amounts related to maintenance, insurance, and ad valorem taxes. Upon adoption of the new lease accounting standard in 2019,In accordance with applicable guidance, we elected the lessor practical expedient which allows usdo not to separate lease and non-lease components when reporting revenue for our full-service operating leases. In some cases, we lease railcars and tank containers that, at commencement, are classified as finance leases. For certain operating leases, revenue is based on equipment usage and is recognized when earned. Typically, our leases do not provide customers with renewal options or options to purchase the asset. Our lease agreements do not generally have residual value guarantees. We collect reimbursements from customers for damage to our railcars, as well as additional rental payments for usage above specified levels, as provided in the lease agreements.
The following table shows the components of our lease income (in millions):
| | | Three Months Ended
September 30 | | Nine Months Ended
September 30 | | Three Months Ended
September 30 | | Nine Months Ended
September 30 |
| | 2020 | | 2019 | | 2020 | | 2019 | | 2021 | | 2020 | | 2021 | | 2020 |
| Operating lease income: | Operating lease income: | | | | | | | | Operating lease income: | | | | | | | |
| Fixed lease income | Fixed lease income | $ | 258.6 | | | $ | 253.4 | | | $ | 764.7 | | | $ | 759.1 | | Fixed lease income | $ | 264.6 | | | $ | 258.6 | | | $ | 795.0 | | | $ | 764.7 | |
| Variable lease income | Variable lease income | 13.2 | | | 14.9 | | | 43.7 | | | 50.0 | | Variable lease income | 17.4 | | | 13.2 | | | 51.9 | | | 43.7 | |
| Total operating lease income | Total operating lease income | $ | 271.8 | | | $ | 268.3 | | | $ | 808.4 | | | $ | 809.1 | | Total operating lease income | $ | 282.0 | | | $ | 271.8 | | | $ | 846.9 | | | $ | 808.4 | |
| Finance lease income | Finance lease income | 1.5 | | | 2.2 | | | 4.9 | | | 7.7 | | Finance lease income | 1.9 | | | 1.5 | | | 5.2 | | | 4.9 | |
| Total lease income | Total lease income | $ | 273.3 | | | $ | 270.5 | | | $ | 813.3 | | | $ | 816.8 | | Total lease income | $ | 283.9 | | | $ | 273.3 | | | $ | 852.1 | | | $ | 813.3 | |
In accordance with the terms of our leases with customers, we may earn additional revenue, primarily for customer liability repairs. These amounts are reported in other revenue in the statements of comprehensive income and were $18.9 million and $54.6 million for the three and nine months ended September 30, 2021 and $22.7 million and $69.1 million for the three and nine months ended September 30, 2020 and $22.3 million and $66.6 million for the three and nine months ended September 30, 2019.
GATX CORPORATION AND SUBSIDIARIES
NOTES TO CONSOLIDATED FINANCIAL STATEMENTS (UNAUDITED) (Continued)
NOTE 6. Investments in Affiliated Companies
Our affiliate investments primarily include interests in each of the Rolls-Royce & Partners Finance joint ventures (collectively the “RRPF affiliates”),RRPF affiliates, a group of 50% owned domestic and foreign joint ventures with Rolls-Royce plc, a leading manufacturer of commercial aircraft jet engines.
In accordance with Regulation S-X, we must assess if any of our investments in affiliated companies is a “significant subsidiary”. As of September 30, 2020,Although we determined that Alpha Partners Leasing Limited, which is part of the RRPF affiliates, triggereddid not trigger any of the significance tests as of September 30, 2021, we determined that at least one of the significance tests.tests was triggered as of September 30, 2020. As a result, and in accordance with Rule 10-01(b) of Regulation S-X, the following table shows summarized unaudited financial information for Alpha Partners Leasing Limited (in millions):
| | | Three Months Ended
September 30 | | Nine Months Ended
September 30 | | Three Months Ended
September 30 | | Nine Months Ended
September 30 |
| | 2020 | | 2019 | | 2020 | | 2019 | | 2021 | | 2020 | | 2021 | | 2020 |
| Total revenue | Total revenue | $ | 112.5 | | | $ | 94.0 | | | $ | 318.5 | | | $ | 283.5 | | Total revenue | $ | 91.1 | | | $ | 112.5 | | | $ | 277.3 | | | $ | 318.5 | |
| Total expenses | Total expenses | (95.9) | | | (75.1) | | | (271.0) | | | (227.7) | | Total expenses | (91.9) | | | (95.9) | | | (267.4) | | | (271.0) | |
| Other income, including net gains on sales of assets | Other income, including net gains on sales of assets | 10.0 | | | 6.8 | | | 48.2 | | | 33.1 | | Other income, including net gains on sales of assets | 7.7 | | | 10.0 | | | 36.2 | | | 48.2 | |
Net income | Net income | 21.7 | | | 20.8 | | | 77.6 | | | 72.0 | | Net income | 5.5 | | | 21.7 | | | 37.2 | | | 77.6 | |
(1) Net income for the nine months ended September 30, 2021 excludes the impact from the change in the enacted corporate income tax rate increase in the United Kingdom in 2021. Net income for the three and nine months ended September 30, 2020 exclude the impact from the elimination of a previously announced corporate income tax rate reduction in 2020.
NOTE 7. Fair Value Disclosure
The assets and liabilities that GATX records at fair value on a recurring basis consisted entirely of derivatives at September 30, 20202021 and December 31, 2019.2020.
In addition, we review long-lived assets, such as operating assets and facilities, investments in affiliates, and goodwill, for impairment whenever circumstances indicate that the carrying amount of these assets may not be recoverable or when assets may be classified as held for sale. We considered COVID-19 as part of our assessment during the quarter and determined there were no material impacts on our final conclusions. We will continue to monitor our long-lived assets, investments in affiliates, and goodwill for indicators of impairment as COVID-19 continues to impact the global economy.
Derivative Instruments
Fair Value Hedges
We use interest rate swaps to manage the fixed-to-floating rate mix of our debt obligations by converting a portion of our fixed rate debt to floating rate debt. For fair value hedges, we recognize changes in fair value of both the derivative and the hedged item as interest expense. We had 3 instruments outstanding with an aggregate notional amount of $200.0 million as of September 30, 2021 with maturities in 2022 and 5 instruments outstanding with an aggregate notional amount of $300.0 million as of September 30,December 31, 2020 with maturities ranging from 2021 to 2022 and 8 instruments outstanding with an aggregate notional amount of $450.0 million as of December 31, 2019 with maturities ranging from 2020 to 2022.
Cash Flow Hedges
We use Treasury rate locks and swap rate locks to hedge our exposure to interest rate risk on anticipated transactions. We also use currency swaps, forwards, and put/call options to hedge our exposure to fluctuations in the exchange rates of foreign currencies for certain loans and operating expenses denominated in non-functional currencies. We had 6 instruments outstanding with an aggregate notional amount of $136.1$293.7 million as of September 30, 2020 that mature2021 with maturities ranging from 20202021 to 2022 and 7 instruments1 instrument outstanding with an aggregate notional amount of $336.5$105.7 million as of December 31, 2019 with maturities ranging from 2020 to 2022.that matures in 2021. Within the next 12 months, we expect to reclassify $2.11.7 million ($1.61.2 million after-tax) of net losses on previously terminated derivatives from accumulated other comprehensive income (loss) to interest expense or operating lease expense, as applicable. We reclassify these amounts when interest and operating lease expense on the related hedged transactions affect earnings.
GATX CORPORATION AND SUBSIDIARIES
NOTES TO CONSOLIDATED FINANCIAL STATEMENTS (UNAUDITED) (Continued)
Non-Designated Derivatives
We do not hold derivative financial instruments for purposes other than hedging, although certain of our derivatives are not designated as accounting hedges. We recognize changes in the fair value of these derivatives in other (income) expense immediately.
Certain of our derivative instruments contain credit risk provisions that could require us to make immediate payment on net liability positions in the event that we default on certain outstanding debt obligations. The aggregate fair value of ourWe had no derivative instruments
GATX CORPORATION AND SUBSIDIARIES
NOTES TO CONSOLIDATED FINANCIAL STATEMENTS (UNAUDITED) (Continued)
with credit risk related contingent features that arewere in a liability position as of September 30, 2020 was $9.0 million.2021. We are not required to post any collateral on our derivative instruments and do not expect the credit risk provisions to be triggered.
In the event that a counterparty fails to meet the terms of an interest rate swap agreement or a foreign exchange contract, our exposure is limited to the fair value of the swap, if in our favor. We manage the credit risk of counterparties by transacting with institutions that we consider financially sound and by avoiding concentrations of risk with a single counterparty. We believe that the risk of non-performance by any of our counterparties is remote.
The following tables show our derivative assets and liabilities that are measured at fair value (in millions):
| | | Balance Sheet Location | | Fair Value
September 30, 2020 | | Quoted
Prices in
Active Markets for
Identical Assets
(Level 1) | | Significant Observable Inputs
(Level 2) | | Significant Unobservable
Inputs
(Level 3) | | Balance Sheet Location | | Fair Value
September 30,
2021 | | Quoted
Prices in
Active Markets for
Identical Assets
(Level 1) | | Significant Observable Inputs
(Level 2) | | Significant Unobservable
Inputs
(Level 3) |
| Derivative Assets | Derivative Assets | | | | | | | | | | Derivative Assets | | | | | | | | | |
| Interest rate contracts (1) | Interest rate contracts (1) | Other assets | | $ | 6.9 | | | $ | 0 | | | $ | 6.9 | | | $ | 0 | | Interest rate contracts (1) | Other assets | | $ | 2.4 | | | $ | — | | | $ | 2.4 | | | $ | — | |
| Foreign exchange contracts (1) | | Foreign exchange contracts (1) | Other assets | | 6.7 | | | — | | | 6.7 | | | — | |
| Foreign exchange contracts (2) | | Foreign exchange contracts (2) | Other assets | | 1.7 | | | — | | | 1.7 | | | — | |
| | Total derivative assets | | Total derivative assets | | $ | 10.8 | | | $ | — | | | $ | 10.8 | | | $ | — | |
| | Total derivative assets | | $ | 6.9 | | | $ | 0 | | | $ | 6.9 | | | $ | 0 | | |
| Derivative Liabilities | | | | | | | | | |
| | Foreign exchange contracts (1) | Other liabilities | | $ | 9.0 | | | $ | 0 | | | $ | 9.0 | | | $ | 0 | | |
| Foreign exchange contracts (2) | Other liabilities | | 0.9 | | | 0 | | | 0.9 | | | 0 | | |
| Total derivative liabilities | | $ | 9.9 | | | $ | 0 | | | $ | 9.9 | | | $ | 0 | | |
|
| | | Balance Sheet Location | | Fair Value
December 31, 2019 | | Quoted
Prices in
Active Markets for
Identical Assets
(Level 1) | | Significant Observable Inputs
(Level 2) | | Significant Unobservable
Inputs
(Level 3) | | Balance Sheet Location | | Fair Value
December 31,
2020 | | Quoted
Prices in
Active Markets for
Identical Assets
(Level 1) | | Significant Observable Inputs
(Level 2) | | Significant Unobservable
Inputs
(Level 3) |
| Derivative Assets | Derivative Assets | | | | | | | | | | Derivative Assets | | | | | | | | | |
| Interest rate contracts (1) | Interest rate contracts (1) | Other assets | | $ | 1.4 | | | $ | 0 | | | $ | 1.4 | | | $ | 0 | | Interest rate contracts (1) | Other assets | | $ | 5.6 | | | $ | — | | | $ | 5.6 | | | $ | — | |
| Foreign exchange contracts (1) | Foreign exchange contracts (1) | Other assets | | 6.9 | | | 0 | | | 6.9 | | | 0 | | Foreign exchange contracts (1) | Other assets | | 0.4 | | | — | | | 0.4 | | | — | |
| Foreign exchange contracts (2) | Foreign exchange contracts (2) | Other assets | | 0.2 | | | 0 | | | 0.2 | | | 0 | | Foreign exchange contracts (2) | Other assets | | 0.4 | | | — | | | 0.4 | | | — | |
| Total derivative assets | Total derivative assets | | $ | 8.5 | | | $ | 0 | | | $ | 8.5 | | | $ | 0 | | Total derivative assets | | $ | 6.4 | | | $ | — | | | $ | 6.4 | | | $ | — | |
| Derivative Liabilities | | | | | | | | | |
| Interest rate contracts (1) | Other liabilities | | $ | 0.6 | | | $ | 0 | | | $ | 0.6 | | | $ | 0 | | |
| Foreign exchange contracts (1) | Other liabilities | | 7.0 | | | 0 | | | 7.0 | | | 0 | | |
| Foreign exchange contracts (2) | Other liabilities | | 6.0 | | | 0 | | | 6.0 | | | 0 | | |
| Total derivative liabilities | | $ | 13.6 | | | $ | 0 | | | $ | 13.6 | | | $ | 0 | | |
|
_________
(1) Designated as hedges.
(2) Not designated as hedges.
GATX CORPORATION AND SUBSIDIARIES
NOTES TO CONSOLIDATED FINANCIAL STATEMENTS (UNAUDITED) (Continued)
We value derivatives using a pricing model with inputs (such as yield curves and foreign currency rates) that are observable in the market or that can be derived principally from observable market data. As of September 30, 20202021 and December 31, 2019,2020, all derivatives were classified as Level 2 in the fair value hierarchy. There were no derivatives classified as Level 1 or Level 3.
GATX CORPORATION AND SUBSIDIARIES
NOTES TO CONSOLIDATED FINANCIAL STATEMENTS (UNAUDITED) (Continued)
The following table shows the amounts recorded on the balance sheet related to cumulative basis adjustments for fair value hedges as of September 30, 20202021 and December 31, 20192020 (in millions).:
| | | Carrying Amount of the Hedged Assets/(Liabilities) | | Cumulative Amount of Fair Value Hedging Adjustment Included in the Carrying Amount of the Hedged Assets/(Liabilities) | | Carrying Amount of the Hedged Assets/(Liabilities) | | Cumulative Amount of Fair Value Hedging Adjustment Included in the Carrying Amount of the Hedged Assets/(Liabilities) |
| Line Item in the Balance Sheet in Which the Hedged Item is Included | Line Item in the Balance Sheet in Which the Hedged Item is Included | | September 30
2020 | | December 31
2019 | | September 30
2020 | | December 31
2019 | Line Item in the Balance Sheet in Which the Hedged Item is Included | | September 30
2021 | | December 31
2020 | | September 30
2021 | | December 31
2020 |
| Recourse debt | Recourse debt | | $ | (304.3) | | | $ | (449.9) | | | $ | 6.9 | | | $ | 1.4 | | Recourse debt | | $ | (201.7) | | | $ | (303.6) | | | $ | 2.4 | | | $ | 5.6 | |
The following tables show the impacts of our derivative instruments on our statement of comprehensive income for the three and nine months ended September 30, 20202021 and 20192020 (in millions):
| | | | | | | | | | | | | | | | | | | | | | | | | | | | | | | | | | | |
| | Amount of Loss (Gain) Recognized in Other Comprehensive Income | | Location of Loss (Gain) Reclassified from Accumulated Other Comprehensive Income into Income | | Amount of Loss (Gain) Reclassified from Accumulated Other Comprehensive Income into Income | |
| | Three Months Ended September 30 | | | Three Months Ended September 30 | | | |
| Derivative Designation | | 2020 | | 2019 | | | 2020 | | 2019 | | | |
| Derivatives in cash flow hedging relationships: | | | | | | | | | |
| Interest rate contracts | | $ | 0 | | | $ | 1.6 | | | Interest expense | | $ | 0.6 | | | $ | 0.5 | | | | |
| Foreign exchange contracts | | 10.5 | | | (19.8) | | | Other (income) expense | | 10.4 | | | (19.3) | | | | |
| Total | | $ | 10.5 | | | $ | (18.2) | | | Total | | $ | 11.0 | | | $ | (18.8) | | | | |
| | | Amount of Loss (Gain) Recognized in Other Comprehensive Income | | Location of Loss (Gain) Reclassified from Accumulated Other Comprehensive Income into Income | | Amount of Loss (Gain) Reclassified from Accumulated Other Comprehensive Income into Income | | | Amount of Loss (Gain) Recognized in Other Comprehensive Income | | Location of Loss (Gain) Reclassified from Accumulated Other Comprehensive Income into Income | | Amount of Loss (Gain) Reclassified from Accumulated Other Comprehensive Income into Income | |
| | Nine Months Ended
September 30 | | Nine Months Ended September 30 | | | Three Months
Ended September 30 | | Three Months
Ended September 30 | |
| Derivative Designation | Derivative Designation | | 2020 | | 2019 | | 2020 | | 2019 | | Derivative Designation | | 2021 | | 2020 | | 2021 | | 2020 | |
| Derivatives in cash flow hedging relationships: | Derivatives in cash flow hedging relationships: | | | | | | | | Derivatives in cash flow hedging relationships: | | | | | | | |
| Interest rate contracts | Interest rate contracts | | $ | (0.5) | | | $ | 1.6 | | | Interest expense | | $ | 1.4 | | | $ | 2.0 | | Interest rate contracts | | $ | — | | | $ | — | | | Interest expense | | $ | 0.4 | | | $ | 0.6 | | |
| Foreign exchange contracts | Foreign exchange contracts | | 15.2 | | | (28.5) | | | Other (income) expense | | 9.5 | | | (24.4) | | | Foreign exchange contracts | | (6.4) | | | 10.5 | | | Other (income) expense | | (6.4) | | | 10.4 | | |
| Total | Total | | $ | 14.7 | | | $ | (26.9) | | | Total | | $ | 10.9 | | | $ | (22.4) | | | Total | | $ | (6.4) | | | $ | 10.5 | | | Total | | $ | (6.0) | | | $ | 11.0 | | |
| | | | | | | | | | | | | | | | | | | | | | | | | | | | | | | | | | | |
| | Amount of Loss (Gain) Recognized in Other Comprehensive Income | | Location of Loss (Gain) Reclassified from Accumulated Other Comprehensive Income into Income | | Amount of Loss (Gain) Reclassified from Accumulated Other Comprehensive Income into Income | |
| | Nine Months Ended
September 30 | | | Nine Months Ended
September 30 | | | |
| Derivative Designation | | 2021 | | 2020 | | | 2021 | | 2020 | | | |
| Derivatives in cash flow hedging relationships: | | | | | | | | | |
| Interest rate contracts | | $ | — | | | $ | (0.5) | | | Interest expense | | $ | 1.5 | | | $ | 1.4 | | | | |
| Foreign exchange contracts | | (10.3) | | | 15.2 | | | Other (income) expense | | (10.6) | | | 9.5 | | | | |
| Total | | $ | (10.3) | | | $ | 14.7 | | | Total | | $ | (9.1) | | | $ | 10.9 | | | | |
GATX CORPORATION AND SUBSIDIARIES
NOTES TO CONSOLIDATED FINANCIAL STATEMENTS (UNAUDITED) (Continued)
The following tables show the impact of our fair value and cash flow hedge accounting relationships, as well as the impact of our non-designated derivatives, on the statement of comprehensive income for the three and nine months ended September 30, 20202021 and 20192020 (in millions):
| | | Location and Amount of Gain (Loss) Recognized in Income on Fair Value and Cash Flow Hedging Relationships | | Location and Amount of Gain (Loss) Recognized in Income on Fair Value and Cash Flow Hedging Relationships | |
| | Three Months Ended
September 30 | Three Months Ended
September 30 | | Three Months Ended
September 30 | | | Three Months Ended
September 30 |
| | 2020 | 2019 | | 2021 | 2020 | |
|
| Interest (expense), net | | Other income (expense) | | | Interest (expense), net | | Other income (expense) | |
| Interest (expense),
net | | Other income
(expense) | | | Interest (expense),
net | | Other income
(expense) | |
| Total amounts of income and expense presented in the statements of comprehensive income in which the effects of fair value or cash flow hedges are recorded | Total amounts of income and expense presented in the statements of comprehensive income in which the effects of fair value or cash flow hedges are recorded | $ | (48.6) | | | $ | (1.2) | | | | $ | (44.7) | | | $ | (1.7) | | | Total amounts of income and expense presented in the statements of comprehensive income in which the effects of fair value or cash flow hedges are recorded | $ | (49.8) | | | $ | (0.3) | | | | $ | (48.6) | | | $ | (1.2) | | |
| Gain (loss) on fair value hedging relationships | Gain (loss) on fair value hedging relationships | | | | | Gain (loss) on fair value hedging relationships | | | | |
| Interest rate contracts: | Interest rate contracts: | | | | | Interest rate contracts: | | | | |
| Hedged items | Hedged items | 1.3 | | | 0 | | | | (1.3) | | | 0 | | | Hedged items | 0.8 | | | — | | | | 1.3 | | | — | | |
| Derivatives designated as hedging instruments | Derivatives designated as hedging instruments | (1.3) | | | 0 | | | | 1.3 | | | 0 | | | Derivatives designated as hedging instruments | (0.8) | | | — | | | | (1.3) | | | — | | |
| Gain (loss) on cash flow hedging relationships | Gain (loss) on cash flow hedging relationships | | | | | Gain (loss) on cash flow hedging relationships | | | | |
| Interest rate contracts: | Interest rate contracts: | | | | | Interest rate contracts: | | | | |
| Amount of gain (loss) reclassified from accumulated other comprehensive income into income | Amount of gain (loss) reclassified from accumulated other comprehensive income into income | (0.6) | | | 0 | | | | (0.5) | | | 0 | | | Amount of gain (loss) reclassified from accumulated other comprehensive income into income | (0.4) | | | — | | | | (0.6) | | | — | | |
| Foreign exchange contracts: | Foreign exchange contracts: | | | | | Foreign exchange contracts: | | | | |
| Amount of gain (loss) reclassified from accumulated other comprehensive income into income (1) | Amount of gain (loss) reclassified from accumulated other comprehensive income into income (1) | 0 | | | (10.4) | | | | 0 | | | 19.3 | | | Amount of gain (loss) reclassified from accumulated other comprehensive income into income (1) | — | | | 6.4 | | | | — | | | (10.4) | | |
| Gain (loss) on non-designated derivative contracts | Gain (loss) on non-designated derivative contracts | 0 | | | 2.2 | | | | 0 | | | 4.0 | | | Gain (loss) on non-designated derivative contracts | — | | | 2.6 | | | | — | | | 2.2 | | |
| | | | | | | | | | | | | | | | | | | | | | | | | | |
| Location and Amount of Gain (Loss) Recognized in Income on Fair Value and Cash Flow Hedging Relationships |
| Nine Months Ended
September 30 | Nine Months Ended
September 30 |
| 2020 | 2019 |
| Interest (expense), net | | Other income (expense) | | | Interest (expense), net | | Other income (expense) | | |
| Total amounts of income and expense presented in the statements of comprehensive income in which the effects of fair value or cash flow hedges are recorded | $ | (141.5) | | | $ | (12.2) | | | | $ | (135.3) | | | $ | (5.3) | | | |
| Gain (loss) on fair value hedging relationships | | | | | | | | | | |
| Interest rate contracts: | | | | | | | | | | |
| Hedged items | (5.4) | | | 0 | | | | (9.8) | | | 0 | | | |
| Derivatives designated as hedging instruments | 5.4 | | | 0 | | | | 9.8 | | | 0 | | | |
| Gain (loss) on cash flow hedging relationships | | | | | | | | | | |
| Interest rate contracts: | | | | | | | | | | |
| Amount of gain (loss) reclassified from accumulated other comprehensive income into income | (1.4) | | | 0 | | | | (2.0) | | | 0 | | | |
| Foreign exchange contracts: | | | | | | | | | | |
| Amount of gain (loss) reclassified from accumulated other comprehensive income into income (1) | 0 | | | (9.5) | | | | 0 | | | 24.4 | | | |
| Gain (loss) on non-designated derivative contracts | 0 | | | 4.6 | | | | 0 | | | 1.3 | | | |
_________ | | | | | | | | | | | | | | | | | | | | | | | | | | |
| Location and Amount of Gain (Loss) Recognized in Income on Fair Value and Cash Flow Hedging Relationships | |
| Nine Months Ended
September 30 | | | Nine Months Ended
September 30 |
| 2021 | 2020 | |
| Interest (expense),
net | | Other income
(expense) | | | Interest (expense),
net | | Other income
(expense) | | |
| Total amounts of income and expense presented in the statements of comprehensive income in which the effects of fair value or cash flow hedges are recorded | $ | (153.4) | | | $ | (9.7) | | | | $ | (141.5) | | | $ | (12.2) | | | |
| Gain (loss) on fair value hedging relationships | | | | | | | | | | |
| Interest rate contracts: | | | | | | | | | | |
| Hedged items | 3.2 | | | — | | | | (5.4) | | | — | | | |
| Derivatives designated as hedging instruments | (3.2) | | | — | | | | 5.4 | | | — | | | |
| Gain (loss) on cash flow hedging relationships | | | | | | | | | | |
| Interest rate contracts: | | | | | | | | | | |
| Amount of gain (loss) reclassified from accumulated other comprehensive income into income | (1.5) | | | — | | | | (1.4) | | | — | | | |
| Foreign exchange contracts: | | | | | | | | | | |
| Amount of gain (loss) reclassified from accumulated other comprehensive income into income (1) | — | | | 10.6 | | | | — | | | (9.5) | | | |
| Gain (loss) on non-designated derivative contracts | — | | | 0.9 | | | | — | | | 4.6 | | | |
_______(1) These amounts are substantially offset by foreign currency remeasurement adjustments on related hedged instruments, also recognized in other income (expense).
GATX CORPORATION AND SUBSIDIARIES
NOTES TO CONSOLIDATED FINANCIAL STATEMENTS (UNAUDITED) (Continued)
Other Financial Instruments
Except for derivatives, as disclosed above, GATX has no other assets and liabilities measured at fair value on a recurring basis. The carrying amounts of cash and cash equivalents, rent and other receivables, accounts payable, and commercial paper and borrowings under bank credit facilities with maturities under one year approximate fair value due to the short maturity of those instruments. We estimate the fair values of fixed and floating rate debt using discounted cash flow analyses that are based on interest rates currently offered for loans with similar terms to borrowers of similar credit quality. The inputs we use to estimate each of these values are classified in Level 2 of the fair value hierarchy because they are directly or indirectly observable inputs.
The following table shows the carrying amounts and fair values of our other financial instruments (in millions):
| | | September 30, 2020 | | December 31, 2019 | | September 30, 2021 | | December 31, 2020 |
|
| Carrying
Amount | | Fair
Value | | Carrying
Amount | | Fair
Value |
| Carrying
Amount | | Fair
Value | | Carrying
Amount | | Fair
Value |
| Liabilities | Liabilities | | | | | | | | Liabilities | | | | | | | |
| Recourse fixed rate debt | Recourse fixed rate debt | $ | 4,788.3 | | | $ | 5,295.4 | | | $ | 4,389.3 | | | $ | 4,644.6 | | Recourse fixed rate debt | $ | 5,508.5 | | | $ | 5,926.0 | | | $ | 5,056.3 | | | $ | 5,696.9 | |
| Recourse floating rate debt | Recourse floating rate debt | 422.9 | | | 419.7 | | | 417.5 | | | 419.0 | | Recourse floating rate debt | 550.0 | | | 550.1 | | | 299.9 | | | 300.4 | |
|
NOTE 8. Pension and Other Post-Retirement Benefits
The following table shows the components of our pension and other post-retirement net periodic cost for the three months ended September 30, 20202021 and 20192020 (in millions):
|
|
| 2020
Pension
Benefits | | 2019
Pension
Benefits | | 2020
Retiree Health and Life | | 2019
Retiree Health and Life |
| 2021
Pension
Benefits | | 2020
Pension
Benefits | | 2021
Retiree Health and Life | | 2020
Retiree Health and Life |
| Service cost | Service cost | $ | 2.0 | | | $ | 1.7 | | | $ | 0 | | | $ | 0 | | Service cost | $ | 2.1 | | | $ | 2.0 | | | $ | — | | | $ | — | |
| Interest cost | Interest cost | 3.1 | | | 3.8 | | | 0.1 | | | 0.2 | | Interest cost | 2.1 | | | 3.1 | | | 0.1 | | | 0.1 | |
| Expected return on plan assets | Expected return on plan assets | (5.0) | | | (5.6) | | | 0 | | | 0 | | Expected return on plan assets | (4.6) | | | (5.0) | | | — | | | — | |
| Amortization of (1): | Amortization of (1): | | Amortization of (1): | |
| Unrecognized prior service credit | Unrecognized prior service credit | 0 | | | — | | | 0 | | | 0 | | Unrecognized prior service credit | — | | | — | | | — | | | — | |
| Unrecognized net actuarial loss (gain) | Unrecognized net actuarial loss (gain) | 3.1 | | | 2.0 | | | (0.1) | | | 0 | | Unrecognized net actuarial loss (gain) | 3.3 | | | 3.1 | | | (0.1) | | | (0.1) | |
| Net periodic cost | Net periodic cost | $ | 3.2 | | | $ | 1.9 | | | $ | 0 | | | $ | 0.2 | | Net periodic cost | $ | 2.9 | | | $ | 3.2 | | | $ | — | | | $ | — | |
|
The following table shows the components of our pension and other post-retirement benefits expensenet periodic cost for the nine months ended September 30, 20202021 and 20192020 (in millions):
|
|
| 2020
Pension
Benefits | | 2019
Pension
Benefits | | 2020
Retiree Health and Life | | 2019
Retiree Health and Life |
| 2021
Pension
Benefits | | 2020
Pension
Benefits | | 2021
Retiree Health and Life | | 2020
Retiree Health and Life |
| Service cost | Service cost | $ | 6.0 | | | $ | 4.9 | | | $ | 0.1 | | | $ | 0.1 | | Service cost | $ | 6.5 | | | $ | 6.0 | | | $ | 0.1 | | | $ | 0.1 | |
| Interest cost | Interest cost | 9.2 | | | 11.4 | | | 0.4 | | | 0.7 | | Interest cost | 6.1 | | | 9.2 | | | 0.2 | | | 0.4 | |
| Expected return on plan assets | Expected return on plan assets | (15.1) | | | (16.6) | | | 0 | | | 0 | | Expected return on plan assets | (13.9) | | | (15.1) | | | — | | | — | |
| | Amortization of (1): | Amortization of (1): | | Amortization of (1): | |
| Unrecognized prior service credit | Unrecognized prior service credit | 0 | | | — | | | (0.1) | | | (0.1) | | Unrecognized prior service credit | — | | | — | | | (0.1) | | | (0.1) | |
| Unrecognized net actuarial loss (gain) | Unrecognized net actuarial loss (gain) | 9.5 | | | 6.0 | | | (0.3) | | | (0.1) | | Unrecognized net actuarial loss (gain) | 9.9 | | | 9.5 | | | (0.2) | | | (0.3) | |
| Net periodic cost | Net periodic cost | $ | 9.6 | | | $ | 5.7 | | | $ | 0.1 | | | $ | 0.6 | | Net periodic cost | $ | 8.6 | | | $ | 9.6 | | | $ | — | | | $ | 0.1 | |
|
_______
(1) Amounts reclassified from accumulated other comprehensive loss.
GATX CORPORATION AND SUBSIDIARIES
NOTES TO CONSOLIDATED FINANCIAL STATEMENTS (UNAUDITED) (Continued)
The service cost component of net periodic cost is recorded in selling, general and administrative expense in the statements of comprehensive income, and the non-service components are recorded in other expense.
GATX CORPORATION AND SUBSIDIARIES
NOTES TO CONSOLIDATED FINANCIAL STATEMENTS (UNAUDITED) (Continued)
NOTE 9. Share-Based Compensation
During the nine months ended September 30, 2020,2021, we granted 288,000281,900 non-qualified employee stock options, 34,95034,020 restricted stock units, 54,27056,290 performance shares, and 20,36113,342 phantom stock units. For the three and nine months ended September 30, 2021, total share-based compensation expense was $4.3 million and $14.2 million and the related tax benefits were $1.1 million and $3.6 million. For the three and nine months ended September 30, 2020, total share-based compensation expense was $3.9 million and $9.8 million and the related tax benefits were $1.0 million and $2.5 million. For the three months and nine months ended September 30, 2019, total share-based compensation expense was $4.1 million and $13.7 million the related tax benefits were $1.0 million and $3.4 million.
The estimated fair value of our 20202021 non-qualified employee stock option awards and related underlying assumptions are shown in the table below.below:
| | | | | |
| 20202021 |
| Weighted-average estimated fair value | $22.50 | 29.56 | |
| Quarterly dividend rate | $0.48 | 0.50 | |
| Expected term of stock options, in years | 4.24.3 |
| Risk-free interest rate | 1.3%0.3 | % |
| Dividend yield | 2.5%2.2 | % |
| Expected stock price volatility | 28.5%34.4 | % |
| Present value of dividends | $7.89 | 8.61 | |
NOTE 10. Income Taxes
OurThe following table shows our effective income tax rate for continuing operations was 29.1% for the nine months ended September 30, 2020, compared to 24.7% for the nine months ended September 30, 2019. 30:
| | | | | | | | | | | |
| 2021 | | 2020 |
| Effective income tax rate for continuing operations | 26.0 | % | | 29.1 | % |
The difference in the effective rate for the current year compared to the prior year is primarily attributabledue to an increase in incremental benefits associated with share-based compensation in the priorcurrent year, reduction of the corporate income tax rate enacted in Alberta, Canada. Additionally, the effective tax rate was impacted byas well as the mix of pre-tax income among domestic and foreign jurisdictions, which are taxed at different rates, and the reduction of the corporate income tax rate enacted in India in the current year. Incremental tax benefits associated with share-based compensation were also recognized in each period.rates.
Our effective incomeOn March 27, 2020, the U.S. government enacted the Coronavirus Aid, Relief, and Economic Security Act (“CARES Act”), which includes modifications to the interest expense limitation threshold and net operating loss carryback period and utilization limitation, the acceleration of payments for alternative minimum tax rate for discontinued operations was 93.0% forcredit refunds, and the nine months ended September 30, 2020, compared to 23.1% for the nine months ended September 30, 2019.deferral of employer payroll tax payments. The difference in theCARES Act did not have a material impact on our effective tax rate in the current year compared to the prior year is primarily attributable to the tax impacts from the sale of our ASC business on May 14, 2020.rate.
NOTE 11. Commercial Commitments
We have entered into various commercial commitments, such as guarantees, standby letters of credit, performance bonds, and guarantees related to certain transactions. These commercial commitments require us to fulfill specific obligations in the event of third-party demands. Similar to our balance sheet investments, these commitments expose us to credit, market, and equipment risk. Accordingly, we evaluate these commitments and other contingent obligations using techniques similar to those we use to evaluate funded transactions.
The following table shows our commercial commitments (in millions):
| | | September 30
2020 | | December 31
2019 | | September 30
2021 | | December 31
2020 |
| Standby letters of credit and performance bonds | Standby letters of credit and performance bonds | $ | 9.3 | | | $ | 9.3 | | Standby letters of credit and performance bonds | $ | 9.0 | | | $ | 9.1 | |
| Derivative guarantees | Derivative guarantees | 1.5 | | | — | | Derivative guarantees | 0.5 | | | 1.5 | |
| Total commercial commitments (1) | Total commercial commitments (1) | $ | 10.8 | | | $ | 9.3 | | Total commercial commitments (1) | $ | 9.5 | | | $ | 10.6 | |
_______
(1) There were no liabilities recorded on the balance sheet for commercial commitments at September 30, 20202021 and December 31, 2019.2020. As of September 30, 2020,2021, our outstanding commitments expire in 20202022 through 2023. We are not aware of any event that would require us to satisfy any of our commitments.
GATX CORPORATION AND SUBSIDIARIES
NOTES TO CONSOLIDATED FINANCIAL STATEMENTS (UNAUDITED) (Continued)
We are parties to standby letters of credit and performance bonds, which primarily relate to contractual obligations and general liability insurance coverages. No material claims have been made against these obligations, and no material losses are anticipated. We also guarantee payment by a third partyan affiliate for final settlement of certain derivatives if they are in a liability position at expiration. There is no contractual limitation to the maximum payment under the guarantee, and theThe amount of the payment is ultimately determined by the value of the derivative upon final settlement.
NOTE 12. Earnings per Share
We compute basic earnings per share by dividing net income available to our common shareholders by the weighted-average number of shares of our common stock outstanding. We weight shares issued or reacquired for the portion of the period that they were outstanding. Our diluted earnings per share reflect the impacts of our potentially dilutive securities, which include our equity compensation awards.
The following table shows the computation of our basic and diluted net income per common share (in millions, except per share amounts):
| | | Three Months Ended
September 30 | | Nine Months Ended
September 30 | | Three Months Ended
September 30 | | Nine Months Ended
September 30 |
| | 2020 | | 2019 | | 2020 | | 2019 | | 2021 | | 2020 | | 2021 | | 2020 |
| Numerator: | Numerator: | | | | | | | | Numerator: | | | | | | | |
| Net income from continuing operations | Net income from continuing operations | $ | 48.2 | | | $ | 37.2 | | | $ | 132.4 | | | $ | 138.7 | | Net income from continuing operations | $ | 40.1 | | | $ | 48.2 | | | $ | 82.1 | | | $ | 132.4 | |
| Net (loss) income from discontinued operations | Net (loss) income from discontinued operations | (0.3) | | | 7.9 | | | 1.1 | | | 15.9 | | Net (loss) income from discontinued operations | — | | | (0.3) | | | — | | | 1.1 | |
| Net income | Net income | $ | 47.9 | | | $ | 45.1 | | | $ | 133.5 | | | $ | 154.6 | | Net income | $ | 40.1 | | | $ | 47.9 | | | $ | 82.1 | | | $ | 133.5 | |
| | Denominator: | Denominator: | | Denominator: | |
| Weighted-average shares outstanding - basic | Weighted-average shares outstanding - basic | 35.0 | | | 35.4 | | | 34.9 | | | 35.9 | | Weighted-average shares outstanding - basic | 35.5 | | | 35.0 | | | 35.4 | | | 34.9 | |
| Effect of dilutive securities: | Effect of dilutive securities: | | Effect of dilutive securities: | |
| Equity compensation plans | Equity compensation plans | 0.4 | | | 0.6 | | | 0.5 | | | 0.7 | | Equity compensation plans | 0.5 | | | 0.4 | | | 0.6 | | | 0.5 | |
| Weighted-average shares outstanding - diluted | Weighted-average shares outstanding - diluted | 35.4 | | | 36.0 | | | 35.4 | | | 36.6 | | Weighted-average shares outstanding - diluted | 36.0 | | | 35.4 | | | 36.0 | | | 35.4 | |
| | Basic earnings per share from continuing operations | Basic earnings per share from continuing operations | $ | 1.38 | | | $ | 1.05 | | | $ | 3.79 | | | $ | 3.86 | | Basic earnings per share from continuing operations | $ | 1.13 | | | $ | 1.38 | | | $ | 2.32 | | | $ | 3.79 | |
| Basic earnings per share from discontinued operations | Basic earnings per share from discontinued operations | (0.01) | | | 0.23 | | | 0.03 | | | 0.44 | | Basic earnings per share from discontinued operations | — | | | (0.01) | | | — | | | 0.03 | |
| Basic earnings per share from consolidated operations | Basic earnings per share from consolidated operations | $ | 1.37 | | | $ | 1.28 | | | $ | 3.82 | | | $ | 4.30 | | Basic earnings per share from consolidated operations | $ | 1.13 | | | $ | 1.37 | | | $ | 2.32 | | | $ | 3.82 | |
| | Diluted earnings per share from continuing operations | Diluted earnings per share from continuing operations | $ | 1.36 | | | $ | 1.03 | | | $ | 3.74 | | | $ | 3.79 | | Diluted earnings per share from continuing operations | $ | 1.11 | | | $ | 1.36 | | | $ | 2.28 | | | $ | 3.74 | |
| Diluted earnings per share from discontinued operations | Diluted earnings per share from discontinued operations | (0.01) | | | 0.22 | | | 0.03 | | | 0.43 | | Diluted earnings per share from discontinued operations | — | | | (0.01) | | | — | | | 0.03 | |
| Diluted earnings per share from consolidated operations | Diluted earnings per share from consolidated operations | $ | 1.35 | | | $ | 1.25 | | | $ | 3.77 | | | $ | 4.22 | | Diluted earnings per share from consolidated operations | $ | 1.11 | | | $ | 1.35 | | | $ | 2.28 | | | $ | 3.77 | |
GATX CORPORATION AND SUBSIDIARIES
NOTES TO CONSOLIDATED FINANCIAL STATEMENTS (UNAUDITED) (Continued)
NOTE 13. Accumulated Other Comprehensive Income (Loss)
The following table shows the change in components for accumulated other comprehensive loss (in millions):
|
|
| Foreign Currency Translation Gain (Loss) | | | Unrealized Loss on Derivative Instruments | | Post-Retirement Benefit Plans | | Total |
| Foreign Currency Translation Gain (Loss) | | | Unrealized Loss on Derivative Instruments | | Post-Retirement Benefit Plans | | Total |
| Balance at December 31, 2019 | $ | (68.1) | | | | $ | (10.1) | | | $ | (85.4) | | | $ | (163.6) | | |
| Balance at December 31, 2020 | | Balance at December 31, 2020 | $ | (43.7) | | | | $ | (14.6) | | | $ | (79.2) | | | $ | (137.5) | |
| Change in component | Change in component | (39.6) | | | | 3.9 | | | (0.2) | | | (35.9) | | Change in component | (36.6) | | | | 4.8 | | | — | | | (31.8) | |
| Reclassification adjustments into earnings (1) | Reclassification adjustments into earnings (1) | 0 | | | | (4.9) | | | 3.1 | | | (1.8) | | Reclassification adjustments into earnings (1) | — | | | | (4.1) | | | 3.3 | | | (0.8) | |
| Income tax effect | Income tax effect | 0 | | | | 0.3 | | | (0.7) | | | (0.4) | | Income tax effect | — | | | | (0.1) | | | (0.8) | | | (0.9) | |
| Balance at March 31, 2020 | $ | (107.7) | | | | $ | (10.8) | | | $ | (83.2) | | | $ | (201.7) | | |
| Balance at March 31, 2021 | | Balance at March 31, 2021 | $ | (80.3) | | | | $ | (14.0) | | | $ | (76.7) | | | $ | (171.0) | |
| Change in component | Change in component | 19.0 | | | | (8.9) | | | 1.2 | | | 11.3 | | Change in component | 15.3 | | | | (0.6) | | | — | | | 14.7 | |
| Reclassification adjustments into earnings (1) | Reclassification adjustments into earnings (1) | 0 | | | | 4.8 | | | 3.0 | | | 7.8 | | Reclassification adjustments into earnings (1) | — | | | | 1.0 | | | 3.1 | | | 4.1 | |
| Income tax effect | Income tax effect | 0 | | | | 0.8 | | | (0.7) | | | 0.1 | | Income tax effect | — | | | | — | | | (0.8) | | | (0.8) | |
| Balance at June 30, 2020 | $ | (88.7) | | | | $ | (14.1) | | | $ | (79.7) | | | $ | (182.5) | | |
| Balance at June 30, 2021 | | Balance at June 30, 2021 | $ | (65.0) | | | | $ | (13.6) | | | $ | (74.4) | | | $ | (153.0) | |
| Change in component | Change in component | 19.7 | | | | (10.6) | | | 0.1 | | | 9.2 | | Change in component | (20.7) | | | | 6.4 | | | — | | | (14.3) | |
| Reclassification adjustments into earnings (1) | Reclassification adjustments into earnings (1) | 0 | | | | 11.0 | | | 3.0 | | | 14.0 | | Reclassification adjustments into earnings (1) | — | | | | (6.0) | | | 3.2 | | | (2.8) | |
| Income tax effect | Income tax effect | 0 | | | | (0.1) | | | (0.8) | | | (0.9) | | Income tax effect | — | | | | (0.1) | | | (0.8) | | | (0.9) | |
| Balance at September 30, 2020 | $ | (69.0) | | | | $ | (13.8) | | | $ | (77.4) | | | $ | (160.2) | | |
| Balance at September 30, 2021 | | Balance at September 30, 2021 | $ | (85.7) | | | | $ | (13.3) | | | $ | (72.0) | | | $ | (171.0) | |
________
(1) See "Note 7. Fair Value Disclosure" and "Note 8. Pension and Other Post-Retirement Benefits" for impacts of the reclassification adjustments on the statement of comprehensive income.
NOTE 14. Legal Proceedings and Other Contingencies
Various legal actions, claims, assessments and other contingencies arising in the ordinary course of business are pending against GATX and certain of our subsidiaries. These matters are subject to many uncertainties, and it is possible that some of these matters could ultimately be decided, resolved or settled adversely. For a full discussion of our pending legal matters, please refer to the notes included with our consolidated financial statements in our Annual Report on Form 10-K for the year ended December 31, 2019.
Viareggio Derailment
In June 2009, tank cars owned by GATX Rail Austria GmbH and its subsidiaries (collectively, “GRA”) and leased to a subsidiary of the Italian state-owned railway (the "Italian Railway") were involved in a train derailment in Viareggio, Italy, resulting in personal injuries, deaths, and property damage. Claimants filed numerous civil claims and Italian prosecutors brought criminal charges against GRA, various Italian Railway companies, and certain of their current or former employees. The insurers for the Italian Railway and GRA have fully settled and resolved most of the civil claims. In January 2017, an Italian trial court in Lucca, Italy found the defendants guilty of negligence-based crimes related to the accident. The court imposed a fine of 1.4 million Euros against GRA and prison sentences against its employees. GRA appealed the trial court's ruling to the Court of Appeals in Florence, and on June 20, 2019, the appellate court affirmed the guilty verdicts, with minor reductions in fines and penalties. GRA and the employees appealed to the Supreme Court in Rome, Italy, which scheduled the commencement of oral argument for December 2, 2020. The length and schedule for the parties’ oral arguments are currently unknown, but we expect the Italian Supreme Court to render its decision immediately following the conclusion of the oral argument phase. GRA will continue to incur legal expenses and related costs in connection with the appeal, although these expenses are not expected to be material. We cannot predict the outcome of the appellate process and thus cannot reasonably estimate the possible amount or range of loss that ultimately may be incurred in connection with this litigation.
GATX CORPORATION AND SUBSIDIARIES
NOTES TO CONSOLIDATED FINANCIAL STATEMENTS (UNAUDITED) (Continued)
NOTE 15. Financial Data of Business Segments
The financial data presented below depicts the profitability, financial position, and capital expenditures of each of our business segments.
We lease, operate, manage, and remarket long-lived, widely-used assets, primarily in the rail market. We report our financial results through 3 primary business segments: Rail North America, Rail International, and Portfolio Management. Historically, we also reported financial results for American Steamship Company ("ASC") as a fourth segment.
In the first quarter of 2021, GATX began investing directly in aircraft spare engines through its new entity, GEL. During the first quarter of 2021, GEL acquired 14 aircraft spare engines for approximately $352 million, including 4 engines for $120 million from the RRPF affiliates. Financial results for this business are reported in the Portfolio Management segment.
On December 29, 2020, GATX acquired Trifleet Leasing Holding B.V. ("Trifleet"), one of the largest tank container lessors in the world. Financial results for this business are reported in the Other segment. See "Note 3. Business Combinations" for additional information.
On May 14, 2020, we completed the sale of our ASC business, subject to customary post-closing adjustments. As a result, ASC is now reported as discontinued operations, and financial data for the ASC segment has been segregated and presented as discontinued operations for all periods presented. See "Note 16. Discontinued Operations" of this Form 10-Q for additional information.
Rail North America is composed of our operations in the United States, Canada, and Mexico. Rail North America primarily provides railcars pursuant to full-service leases under which it maintains the railcars, pays ad valorem taxes and insurance, and provides other ancillary services.
Rail International is composed of our operations in Europe ("GATX Rail Europe" or "GRE"), India ("GRI"), and Russia ("Rail Russia"). GRE leases railcars to customers throughout Europe pursuant to full-service leases under which it maintains the railcars and provides value-adding services according to customer requirements.
Portfolio Management is composed primarily of our ownership in the RRPF affiliates, a group of joint ventures with Rolls-Royce plc that lease aircraft spare engines, and GEL, our direct ownership of aircraft spare engines that we lease, as well as 5 liquefied gas carrying vessels (the "Specialized Gas Vessels"). and assorted other marine assets.
Other includes Trifleet operations, as well as selling, general and administrative expenses, income taxes, and certain other amounts not allocated to the segments.
Segment profit is an internal performance measure used by the Chief Executive Officer to assess the profitability of each segment. Segment profit includes all revenues, expenses, pre-tax earnings from affiliates, and net gains on asset dispositions that are directly attributable to each segment. We allocate interest expense to the segments based on what we believe to be the appropriate risk-adjusted borrowing costs for each segment. Segment profit excludes selling, general and administrative expenses, income taxes, and certain other amounts not allocated to the segments. These amounts are included in Other.
GATX CORPORATION AND SUBSIDIARIES
NOTES TO CONSOLIDATED FINANCIAL STATEMENTS (UNAUDITED) (Continued)
The following tables show certain segment data for each of our business segments (in millions):
|
|
|
Rail
North America | |
Rail International | |
Portfolio Management | | Other | | GATX Consolidated |
|
Rail
North America | |
Rail International | |
Portfolio Management | | Other | | GATX Consolidated |
| Three Months Ended September 30, 2020 | | | | | | | | | |
| Three Months Ended September 30, 2021 | | Three Months Ended September 30, 2021 | | | | | | | | |
| Revenues | Revenues | | Revenues | |
| Lease revenue | Lease revenue | $ | 208.7 | | | $ | 64.5 | | | $ | 0.1 | | | $ | 0 | | | $ | 273.3 | | Lease revenue | $ | 200.4 | | | $ | 68.8 | | | $ | 8.2 | | | $ | 6.5 | | | $ | 283.9 | |
| Marine operating revenue | Marine operating revenue | 0 | | | 0 | | | 5.0 | | | 0 | | | 5.0 | | Marine operating revenue | — | | | — | | | 5.0 | | | — | | | 5.0 | |
| Other revenue | Other revenue | 23.4 | | | 2.6 | | | 0.1 | | | 0 | | | 26.1 | | Other revenue | 19.4 | | | 2.7 | | | 0.1 | | | 2.4 | | | 24.6 | |
| Total Revenues | Total Revenues | 232.1 | | | 67.1 | | | 5.2 | | | 0 | | | 304.4 | | Total Revenues | 219.8 | | | 71.5 | | | 13.3 | | | 8.9 | | | 313.5 | |
| Expenses | Expenses | | Expenses | |
| Maintenance expense | Maintenance expense | 63.2 | | | 13.5 | | | 0 | | | 0 | | | 76.7 | | Maintenance expense | 58.9 | | | 14.0 | | | — | | | 1.3 | | | 74.2 | |
| Marine operating expense | Marine operating expense | 0 | | | 0 | | | 3.6 | | | 0 | | | 3.6 | | Marine operating expense | — | | | — | | | 3.7 | | | — | | | 3.7 | |
| Depreciation expense | Depreciation expense | 65.0 | | | 17.1 | | | 1.3 | | | 0 | | | 83.4 | | Depreciation expense | 64.8 | | | 18.5 | | | 4.9 | | | 2.9 | | | 91.1 | |
| Operating lease expense | Operating lease expense | 12.3 | | | 0 | | | 0 | | | 0 | | | 12.3 | | Operating lease expense | 9.0 | | | — | | | — | | | — | | | 9.0 | |
| Other operating expense | Other operating expense | 6.6 | | | 1.6 | | | 0.1 | | | 0 | | | 8.3 | | Other operating expense | 6.6 | | | 1.8 | | | 0.6 | | | 0.7 | | | 9.7 | |
| Total Expenses | Total Expenses | 147.1 | | | 32.2 | | | 5.0 | | | 0 | | | 184.3 | | Total Expenses | 139.3 | | | 34.3 | | | 9.2 | | | 4.9 | | | 187.7 | |
| Other Income (Expense) | Other Income (Expense) | | Other Income (Expense) | |
| Net gain on asset dispositions | Net gain on asset dispositions | 7.9 | | | 0.5 | | | 0.5 | | | 0 | | | 8.9 | | Net gain on asset dispositions | 20.2 | | | 0.9 | | | 0.6 | | | 0.2 | | | 21.9 | |
| Interest (expense) income, net | (35.7) | | | (11.9) | | | (3.2) | | | 2.2 | | | (48.6) | | |
| Interest expense, net | | Interest expense, net | (32.9) | | | (10.9) | | | (4.5) | | | (1.5) | | | (49.8) | |
| Other (expense) income | Other (expense) income | (1.1) | | | 0.5 | | | 0 | | | (0.6) | | | (1.2) | | Other (expense) income | (1.1) | | | (0.2) | | | 2.0 | | | (1.0) | | | (0.3) | |
| Share of affiliates' pre-tax income | 0 | | | 0 | | | 46.8 | | | 0 | | | 46.8 | | |
| Share of affiliates' pre-tax (loss) income | | Share of affiliates' pre-tax (loss) income | (0.2) | | | — | | | 4.0 | | | — | | | 3.8 | |
| Segment profit | Segment profit | $ | 56.1 | | | $ | 24.0 | | | $ | 44.3 | | | $ | 1.6 | | | $ | 126.0 | | Segment profit | $ | 66.5 | | | $ | 27.0 | | | $ | 6.2 | | | $ | 1.7 | | | $ | 101.4 | |
| Less: | Less: | | Less: | |
| Selling, general and administrative expense | Selling, general and administrative expense | 42.0 | | Selling, general and administrative expense | 45.9 | |
| Income taxes (includes $24.0 related to affiliates' earnings) | 35.8 | | |
| Net income from continuing operations | $ | 48.2 | | |
| | Discontinued Operations, Net of Taxes | | |
| Net income from discontinued operations, net of taxes | | $ | 0 | | |
| Loss on sale of discontinued operations, net of taxes | | (0.3) | | |
| Total discontinued operations, net of taxes | $ | (0.3) | | |
| | Income taxes (includes $1.0 related to affiliates' earnings) | | Income taxes (includes $1.0 related to affiliates' earnings) | 15.4 | |
| Net income | Net income | $ | 47.9 | | Net income | $ | 40.1 | |
| | Net Gain on Asset Dispositions | Net Gain on Asset Dispositions | | Net Gain on Asset Dispositions | |
| Asset Remarketing Income: | Asset Remarketing Income: | | Asset Remarketing Income: | |
| Net gains on disposition of owned assets | Net gains on disposition of owned assets | $ | 7.8 | | | $ | 0.2 | | | $ | 0 | | | $ | 0 | | | $ | 8.0 | | Net gains on disposition of owned assets | $ | 14.4 | | | $ | 0.3 | | | $ | — | | | $ | 0.2 | | | $ | 14.9 | |
| Residual sharing income | Residual sharing income | 0.1 | | | 0 | | | 0.5 | | | 0 | | | 0.6 | | Residual sharing income | 0.2 | | | — | | | 0.6 | | | — | | | 0.8 | |
| Non-remarketing net gains (1) | Non-remarketing net gains (1) | 0 | | | 0.3 | | | 0 | | | 0 | | | 0.3 | | Non-remarketing net gains (1) | 5.6 | | | 0.6 | | | — | | | — | | | 6.2 | |
| | | $ | 7.9 | | | $ | 0.5 | | | $ | 0.5 | | | $ | 0 | | | $ | 8.9 | | | $ | 20.2 | | | $ | 0.9 | | | $ | 0.6 | | | $ | 0.2 | | | $ | 21.9 | |
| | Capital Expenditures | Capital Expenditures | | Capital Expenditures | |
| Portfolio investments and capital additions | Portfolio investments and capital additions | $ | 204.1 | | | $ | 45.3 | | | $ | 0 | | | $ | 0.5 | | | $ | 249.9 | | Portfolio investments and capital additions | $ | 178.9 | | | $ | 40.9 | | | $ | — | | | $ | 10.0 | | | $ | 229.8 | |
| | Selected Balance Sheet Data at September 30, 2020 | | |
| Selected Balance Sheet Data at September 30, 2021 | | Selected Balance Sheet Data at September 30, 2021 | |
| Investments in affiliated companies | Investments in affiliated companies | $ | 0.2 | | | $ | 0 | | | $ | 582.3 | | | $ | 0 | | | $ | 582.5 | | Investments in affiliated companies | $ | 0.2 | | | $ | — | | | $ | 564.2 | | | $ | — | | | $ | 564.4 | |
| Identifiable assets from continuing operations | $ | 5,838.9 | | | $ | 1,654.3 | | | $ | 709.7 | | | $ | 487.4 | | | $ | 8,690.3 | | |
| Identifiable assets | | Identifiable assets | $ | 6,016.0 | | | $ | 1,732.8 | | | $ | 1,030.1 | | | $ | 807.4 | | | $ | 9,586.3 | |
__________
(1) Includes net gains (losses) from scrapping of railcars.
GATX CORPORATION AND SUBSIDIARIES
NOTES TO CONSOLIDATED FINANCIAL STATEMENTS (UNAUDITED) (Continued)
|
|
|
Rail
North America | |
Rail International | |
Portfolio Management | | Other | | GATX Consolidated |
|
Rail
North America | |
Rail International | |
Portfolio Management | | Other | | GATX Consolidated |
| Three Months Ended September 30, 2019 | | | | | | | | | | |
| Three Months Ended September 30, 2020 | | Three Months Ended September 30, 2020 | | | | | | | | |
| Revenues | Revenues | | Revenues | |
| Lease revenue | Lease revenue | $ | 214.6 | | | $ | 55.6 | | | $ | 0.3 | | | $ | 0 | | | $ | 270.5 | | Lease revenue | $ | 208.7 | | | $ | 64.5 | | | $ | 0.1 | | | $ | — | | | $ | 273.3 | |
| Marine operating revenue | Marine operating revenue | 0 | | | 0 | | | 1.9 | | | 0 | | | 1.9 | | Marine operating revenue | — | | | — | | | 5.0 | | | — | | | 5.0 | |
| Other revenue | Other revenue | 23.9 | | | 2.4 | | | 0.1 | | | 0 | | | 26.4 | | Other revenue | 23.4 | | | 2.6 | | | 0.1 | | | — | | | 26.1 | |
| Total Revenues | Total Revenues | 238.5 | | | 58.0 | | | 2.3 | | | 0 | | | 298.8 | | Total Revenues | 232.1 | | | 67.1 | | | 5.2 | | | — | | | 304.4 | |
| Expenses | Expenses | | Expenses | |
| Maintenance expense | Maintenance expense | 64.0 | | | 12.2 | | | 0 | | | 0 | | | 76.2 | | Maintenance expense | 63.2 | | | 13.5 | | | — | | | — | | | 76.7 | |
| Marine operating expense | Marine operating expense | 0 | | | 0 | | | 3.4 | | | 0 | | | 3.4 | | Marine operating expense | — | | | — | | | 3.6 | | | — | | | 3.6 | |
| Depreciation expense | Depreciation expense | 63.9 | | | 14.5 | | | 1.6 | | | 0 | | | 80.0 | | Depreciation expense | 65.0 | | | 17.1 | | | 1.3 | | | — | | | 83.4 | |
| Operating lease expense | Operating lease expense | 13.7 | | | 0 | | | 0 | | | 0 | | | 13.7 | | Operating lease expense | 12.3 | | | — | | | — | | | — | | | 12.3 | |
| Other operating expense | Other operating expense | 6.2 | | | 1.4 | | | 0.1 | | | 0 | | | 7.7 | | Other operating expense | 6.6 | | | 1.6 | | | 0.1 | | | — | | | 8.3 | |
| Total Expenses | Total Expenses | 147.8 | | | 28.1 | | | 5.1 | | | 0 | | | 181.0 | | Total Expenses | 147.1 | | | 32.2 | | | 5.0 | | | — | | | 184.3 | |
| Other Income (Expense) | Other Income (Expense) | | Other Income (Expense) | |
| Net gain on asset dispositions | Net gain on asset dispositions | 4.3 | | | 0.3 | | | 0.5 | | | 0 | | | 5.1 | | Net gain on asset dispositions | 7.9 | | | 0.5 | | | 0.5 | | | — | | | 8.9 | |
| Interest (expense) income, net | Interest (expense) income, net | (33.1) | | | (10.2) | | | (2.8) | | | 1.4 | | | (44.7) | | Interest (expense) income, net | (35.7) | | | (11.9) | | | (3.2) | | | 2.2 | | | (48.6) | |
| Other expense | (1.0) | | | (0.1) | | | 0 | | | (0.6) | | | (1.7) | | |
| Other (expense) income | | Other (expense) income | (1.1) | | | 0.5 | | | — | | | (0.6) | | | (1.2) | |
| Share of affiliates' pre-tax income | Share of affiliates' pre-tax income | 0 | | | 0 | | | 15.8 | | | 0 | | | 15.8 | | Share of affiliates' pre-tax income | — | | | — | | | 46.8 | | | — | | | 46.8 | |
| Segment profit | Segment profit | $ | 60.9 | | | $ | 19.9 | | | $ | 10.7 | | | $ | 0.8 | | | $ | 92.3 | | Segment profit | $ | 56.1 | | | $ | 24.0 | | | $ | 44.3 | | | $ | 1.6 | | | $ | 126.0 | |
| Less: | Less: | | Less: | |
| Selling, general and administrative expense | Selling, general and administrative expense | 42.6 | | Selling, general and administrative expense | 42.0 | |
| Income taxes (includes $3.0 related to affiliates' earnings) | 12.5 | | |
| Income taxes (includes $24.0 related to affiliates' earnings) | | Income taxes (includes $24.0 related to affiliates' earnings) | 35.8 | |
| Net income from continuing operations | Net income from continuing operations | $ | 37.2 | | Net income from continuing operations | $ | 48.2 | |
| | Discontinued Operations, Net of Taxes | Discontinued Operations, Net of Taxes | | Discontinued Operations, Net of Taxes | |
| Net income from discontinued operations, net of taxes | Net income from discontinued operations, net of taxes | $ | 7.9 | | Net income from discontinued operations, net of taxes | | $ | — | |
| Gain on sale of discontinued operations, net of taxes | 0 | | |
| Loss on sale of discontinued operations, net of taxes | | Loss on sale of discontinued operations, net of taxes | | (0.3) | |
| Total discontinued operations, net of taxes | Total discontinued operations, net of taxes | $ | 7.9 | | Total discontinued operations, net of taxes | | $ | (0.3) | |
| | Net income | Net income | $ | 45.1 | | Net income | | $ | 47.9 | |
| | Net Gain on Asset Dispositions | Net Gain on Asset Dispositions | | Net Gain on Asset Dispositions | |
| Asset Remarketing Income: | Asset Remarketing Income: | | Asset Remarketing Income: | |
| Net gains on disposition of owned assets | Net gains on disposition of owned assets | $ | 4.4 | | | $ | 0 | | | $ | 0 | | | $ | 0 | | | $ | 4.4 | | Net gains on disposition of owned assets | $ | 7.8 | | | $ | 0.2 | | | $ | — | | | $ | — | | | $ | 8.0 | |
| Residual sharing income | Residual sharing income | 0.1 | | | 0 | | | 0.5 | | | 0 | | | 0.6 | | Residual sharing income | 0.1 | | | — | | | 0.5 | | | — | | | 0.6 | |
| Non-remarketing net gains (1) | Non-remarketing net gains (1) | (0.2) | | | 0.3 | | | 0 | | | 0 | | | 0.1 | | Non-remarketing net gains (1) | — | | | 0.3 | | | — | | | — | | | 0.3 | |
| | | $ | 4.3 | | | $ | 0.3 | | | $ | 0.5 | | | $ | 0 | | | $ | 5.1 | | | $ | 7.9 | | | $ | 0.5 | | | $ | 0.5 | | | $ | — | | | $ | 8.9 | |
| | Capital Expenditures | Capital Expenditures | | Capital Expenditures | |
| Portfolio investments and capital additions | Portfolio investments and capital additions | $ | 138.1 | | | $ | 51.8 | | | $ | 0 | | | $ | 0.9 | | | $ | 190.8 | | Portfolio investments and capital additions | $ | 204.1 | | | $ | 45.3 | | | $ | — | | | $ | 0.5 | | | $ | 249.9 | |
| | Selected Balance Sheet Data at December 31, 2019 | | |
| Selected Balance Sheet Data at December 31, 2020 | | Selected Balance Sheet Data at December 31, 2020 | |
| Investments in affiliated companies | Investments in affiliated companies | $ | 0.2 | | | $ | 0 | | | $ | 512.4 | | | $ | 0 | | | $ | 512.6 | | Investments in affiliated companies | $ | — | | | $ | — | | | $ | 584.7 | | | $ | — | | | $ | 584.7 | |
| Identifiable assets from continuing operations | $ | 5,646.7 | | | $ | 1,486.7 | | | $ | 653.7 | | | $ | 206.9 | | | $ | 7,994.0 | | |
| Identifiable assets from discontinued operations | $ | 0 | | | $ | 0 | | | $ | 0 | | | $ | 0 | | | $ | 291.1 | | |
| Identifiable assets | | Identifiable assets | $ | 5,944.4 | | | $ | 1,745.8 | | | $ | 706.1 | | | $ | 541.3 | | | $ | 8,937.6 | |
__________
(1) Includes net gains (losses) from scrapping of railcars.
GATX CORPORATION AND SUBSIDIARIES
NOTES TO CONSOLIDATED FINANCIAL STATEMENTS (UNAUDITED) (Continued)
|
|
|
Rail
North America | |
Rail International | |
Portfolio Management | | Other | | GATX Consolidated |
|
Rail
North America | |
Rail International | |
Portfolio Management | | Other | | GATX Consolidated |
| Nine Months Ended September 30, 2020 | | | | | | | | | | |
| Nine Months Ended September 30, 2021 | | Nine Months Ended September 30, 2021 | | | | | | | | | |
| Revenues | Revenues | | Revenues | |
| Lease revenue | Lease revenue | $ | 630.8 | | | $ | 181.9 | | | $ | 0.6 | | | $ | 0 | | | $ | 813.3 | | Lease revenue | $ | 611.4 | | | $ | 204.7 | | | $ | 19.8 | | | $ | 16.2 | | | $ | 852.1 | |
| Marine operating revenue | Marine operating revenue | 0 | | | 0 | | | 11.6 | | | 0 | | | 11.6 | | Marine operating revenue | — | | | — | | | 13.7 | | | — | | | 13.7 | |
| Other revenue | Other revenue | 72.5 | | | 6.5 | | | 0.4 | | | 0 | | | 79.4 | | Other revenue | 56.4 | | | 7.9 | | | 0.5 | | | 5.8 | | | 70.6 | |
| Total Revenues | Total Revenues | 703.3 | | | 188.4 | | | 12.6 | | | 0 | | | 904.3 | | Total Revenues | 667.8 | | | 212.6 | | | 34.0 | | | 22.0 | | | 936.4 | |
| Expenses | Expenses | | Expenses | |
| Maintenance expense | Maintenance expense | 206.5 | | | 38.3 | | | 0 | | | 0 | | | 244.8 | | Maintenance expense | 178.8 | | | 43.6 | | | — | | | 2.7 | | | 225.1 | |
| Marine operating expense | Marine operating expense | 0 | | | 0 | | | 10.9 | | | 0 | | | 10.9 | | Marine operating expense | — | | | — | | | 13.8 | | | — | | | 13.8 | |
| Depreciation expense | Depreciation expense | 193.0 | | | 48.4 | | | 4.0 | | | 0 | | | 245.4 | | Depreciation expense | 195.7 | | | 55.2 | | | 12.6 | | | 7.7 | | | 271.2 | |
| Operating lease expense | Operating lease expense | 38.1 | | | 0 | | | 0 | | | 0 | | | 38.1 | | Operating lease expense | 30.1 | | | — | | | — | | | — | | | 30.1 | |
| Other operating expense | Other operating expense | 20.8 | | | 4.9 | | | 0.3 | | | 0 | | | 26.0 | | Other operating expense | 22.6 | | | 5.5 | | | 1.2 | | | 2.0 | | | 31.3 | |
| Total Expenses | Total Expenses | 458.4 | | | 91.6 | | | 15.2 | | | 0 | | | 565.2 | | Total Expenses | 427.2 | | | 104.3 | | | 27.6 | | | 12.4 | | | 571.5 | |
| Other Income (Expense) | Other Income (Expense) | | Other Income (Expense) | |
| Net gain on asset dispositions | Net gain on asset dispositions | 39.9 | | | 0.8 | | | 1.6 | | | 0 | | | 42.3 | | Net gain on asset dispositions | 74.8 | | | 2.0 | | | 1.7 | | | 0.6 | | | 79.1 | |
| Interest (expense) income, net | (103.5) | | | (34.0) | | | (9.1) | | | 5.1 | | | (141.5) | | |
| Other expense | (3.2) | | | (5.7) | | | 0 | | | (3.3) | | | (12.2) | | |
| Share of affiliates' pre-tax income | 0 | | | 0 | | | 93.2 | | | 0 | | | 93.2 | | |
| Segment profit | $ | 178.1 | | | $ | 57.9 | | | $ | 83.1 | | | $ | 1.8 | | | $ | 320.9 | | |
| Interest expense, net | | Interest expense, net | (102.5) | | | (34.2) | | | (12.0) | | | (4.7) | | | (153.4) | |
| Other (expense) income | | Other (expense) income | (2.9) | | | — | | | 2.0 | | | (8.8) | | | (9.7) | |
| Share of affiliates' pre-tax (loss) income | | Share of affiliates' pre-tax (loss) income | (0.2) | | | — | | | 26.4 | | | — | | | 26.2 | |
| Segment profit (loss) | | Segment profit (loss) | $ | 209.8 | | | $ | 76.1 | | | $ | 24.5 | | | $ | (3.3) | | | $ | 307.1 | |
| Less: | Less: | | Less: | |
| Selling, general and administrative expense | Selling, general and administrative expense | 125.8 | | Selling, general and administrative expense | 140.8 | |
| Income taxes (includes $33.1 related to affiliates' earnings) | 62.7 | | |
| Net income from continuing operations | $ | 132.4 | | |
| | Discontinued operations, net of taxes | | |
| Net loss from discontinued operations, net of taxes | $ | (2.2) | | |
| Gain on sale of discontinued operations, net of taxes | 3.3 | | |
| Total discontinued operations, net of taxes | $ | 1.1 | | |
| | Income taxes (includes $47.8 related to affiliates' earnings) | | Income taxes (includes $47.8 related to affiliates' earnings) | 84.2 | |
| Net income | Net income | $ | 133.5 | | Net income | $ | 82.1 | |
| | Net Gain on Asset Dispositions | Net Gain on Asset Dispositions | | Net Gain on Asset Dispositions | |
| Asset Remarketing Income: | Asset Remarketing Income: | | Asset Remarketing Income: | |
| Net gains on disposition of owned assets | Net gains on disposition of owned assets | $ | 39.1 | | | $ | 0.2 | | | $ | 0.1 | | | $ | 0 | | | $ | 39.4 | | Net gains on disposition of owned assets | $ | 62.2 | | | $ | 0.7 | | | $ | — | | | $ | 0.5 | | | $ | 63.4 | |
| Residual sharing income | Residual sharing income | 0.3 | | | 0 | | | 1.5 | | | 0 | | | 1.8 | | Residual sharing income | 0.8 | | | — | | | 1.7 | | | — | | | 2.5 | |
| Non-remarketing net gains (1) | 0.5 | | | 0.6 | | | 0 | | | 0 | | | 1.1 | | |
| | Non-remarketing net (loss) gains (1) | | Non-remarketing net (loss) gains (1) | 11.8 | | | 1.3 | | | — | | | 0.1 | | | 13.2 | |
| | $ | 39.9 | | | $ | 0.8 | | | $ | 1.6 | | | $ | 0 | | | $ | 42.3 | | |
| | | $ | 74.8 | | | $ | 2.0 | | | $ | 1.7 | | | $ | 0.6 | | | $ | 79.1 | |
| Capital Expenditures | Capital Expenditures | | Capital Expenditures | |
| Portfolio investments and capital additions | Portfolio investments and capital additions | $ | 474.6 | | | $ | 164.5 | | | $ | 0.3 | | | $ | 2.0 | | | $ | 641.4 | | Portfolio investments and capital additions | $ | 394.4 | | | $ | 126.1 | | | $ | 353.0 | | | $ | 19.7 | | | $ | 893.2 | |
|
__________
(1) Includes net gains (losses) from scrapping of railcars.
GATX CORPORATION AND SUBSIDIARIES
NOTES TO CONSOLIDATED FINANCIAL STATEMENTS (UNAUDITED) (Continued)
|
|
|
Rail
North America | |
Rail International | |
Portfolio Management | | Other | | GATX Consolidated |
|
Rail
North America | |
Rail International | |
Portfolio Management | | Other | | GATX Consolidated |
| Nine Months Ended September 30, 2019 | | | | | | | | | | |
| Nine Months Ended September 30, 2020 | | Nine Months Ended September 30, 2020 | | | | | | | | |
| Revenues | Revenues | | Revenues | |
| Lease revenue | Lease revenue | $ | 654.3 | | | $ | 161.7 | | | $ | 0.8 | | | $ | 0 | | | $ | 816.8 | | Lease revenue | $ | 630.8 | | | $ | 181.9 | | | $ | 0.6 | | | $ | — | | | $ | 813.3 | |
| Marine operating revenue | Marine operating revenue | 0 | | | 0 | | | 4.4 | | | 0 | | | 4.4 | | Marine operating revenue | — | | | — | | | 11.6 | | | — | | | 11.6 | |
| Other revenue | Other revenue | 73.7 | | | 6.2 | | | 0.5 | | | 0 | | | 80.4 | | Other revenue | 72.5 | | | 6.5 | | | 0.4 | | | — | | | 79.4 | |
| Total Revenues | Total Revenues | 728.0 | | | 167.9 | | | 5.7 | | | 0 | | | 901.6 | | Total Revenues | 703.3 | | | 188.4 | | | 12.6 | | | — | | | 904.3 | |
| Expenses | Expenses | | Expenses | |
| Maintenance expense | Maintenance expense | 199.8 | | | 35.5 | | | 0 | | | 0 | | | 235.3 | | Maintenance expense | 206.5 | | | 38.3 | | | — | | | — | | | 244.8 | |
| Marine operating expense | Marine operating expense | 0 | | | 0 | | | 12.0 | | | 0 | | | 12.0 | | Marine operating expense | — | | | — | | | 10.9 | | | — | | | 10.9 | |
| Depreciation expense | Depreciation expense | 192.6 | | | 42.7 | | | 4.9 | | | 0 | | | 240.2 | | Depreciation expense | 193.0 | | | 48.4 | | | 4.0 | | | — | | | 245.4 | |
| Operating lease expense | Operating lease expense | 41.1 | | | 0 | | | 0 | | | 0 | | | 41.1 | | Operating lease expense | 38.1 | | | — | | | — | | | — | | | 38.1 | |
| Other operating expense | Other operating expense | 19.0 | | | 4.2 | | | 0.3 | | | 0 | | | 23.5 | | Other operating expense | 20.8 | | | 4.9 | | | 0.3 | | | — | | | 26.0 | |
| Total Expenses | Total Expenses | 452.5 | | | 82.4 | | | 17.2 | | | 0 | | | 552.1 | | Total Expenses | 458.4 | | | 91.6 | | | 15.2 | | | — | | | 565.2 | |
| Other Income (Expense) | Other Income (Expense) | | Other Income (Expense) | |
| Net gain on asset dispositions | Net gain on asset dispositions | 44.6 | | | 1.2 | | | 1.1 | | | 0 | | | 46.9 | | Net gain on asset dispositions | 39.9 | | | 0.8 | | | 1.6 | | | — | | | 42.3 | |
| Interest (expense) income, net | Interest (expense) income, net | (101.4) | | | (30.2) | | | (8.3) | | | 4.6 | | | (135.3) | | Interest (expense) income, net | (103.5) | | | (34.0) | | | (9.1) | | | 5.1 | | | (141.5) | |
| Other expense | Other expense | (3.6) | | | (0.5) | | | 0 | | | (1.2) | | | (5.3) | | Other expense | (3.2) | | | (5.7) | | | — | | | (3.3) | | | (12.2) | |
| Share of affiliates' pre-tax income | Share of affiliates' pre-tax income | 0 | | | 0 | | | 53.6 | | | 0 | | | 53.6 | | Share of affiliates' pre-tax income | — | | | — | | | 93.2 | | | — | | | 93.2 | |
| Segment profit | Segment profit | $ | 215.1 | | | $ | 56.0 | | | $ | 34.9 | | | $ | 3.4 | | | $ | 309.4 | | Segment profit | $ | 178.1 | | | $ | 57.9 | | | $ | 83.1 | | | $ | 1.8 | | | $ | 320.9 | |
| Less: | Less: | | Less: | |
| Selling, general and administrative expense | Selling, general and administrative expense | 129.6 | | Selling, general and administrative expense | 125.8 | |
| Income taxes (includes $10.0 related to affiliates' earnings) | 41.1 | | |
| Income taxes (includes $33.1 related to affiliates' earnings) | | Income taxes (includes $33.1 related to affiliates' earnings) | 62.7 | |
| Net income from continuing operations | Net income from continuing operations | $ | 138.7 | | Net income from continuing operations | $ | 132.4 | |
| | Discontinued operations, net of taxes | | |
| Net income from discontinued operations, net of taxes | $ | 15.9 | | |
| Discontinued Operations, Net of Taxes | | Discontinued Operations, Net of Taxes | |
| Net loss from discontinued operations, net of taxes | | Net loss from discontinued operations, net of taxes | | $ | (2.2) | |
| Gain on sale of discontinued operations, net of taxes | Gain on sale of discontinued operations, net of taxes | 0 | | Gain on sale of discontinued operations, net of taxes | | 3.3 | |
| Total discontinued operations, net of taxes | Total discontinued operations, net of taxes | $ | 15.9 | | Total discontinued operations, net of taxes | | $ | 1.1 | |
| | Net income | Net income | $ | 154.6 | | Net income | | $ | 133.5 | |
| | Net Gain on Asset Dispositions | Net Gain on Asset Dispositions | | Net Gain on Asset Dispositions | |
| Asset Remarketing Income: | Asset Remarketing Income: | | Asset Remarketing Income: | |
| Net gains on disposition of owned assets | Net gains on disposition of owned assets | $ | 40.9 | | | $ | 0 | | | $ | 0 | | | $ | 0 | | | $ | 40.9 | | Net gains on disposition of owned assets | $ | 39.1 | | | $ | 0.2 | | | $ | 0.1 | | | $ | — | | | $ | 39.4 | |
| Residual sharing income | Residual sharing income | 0.3 | | | 0 | | | 1.1 | | | 0 | | | 1.4 | | Residual sharing income | 0.3 | | | — | | | 1.5 | | | — | | | 1.8 | |
| Non-remarketing net gains (1) | Non-remarketing net gains (1) | 3.4 | | | 1.2 | | | 0 | | | 0 | | | 4.6 | | Non-remarketing net gains (1) | 0.5 | | | 0.6 | | | — | | | — | | | 1.1 | |
| | | $ | 44.6 | | | $ | 1.2 | | | $ | 1.1 | | | $ | 0 | | | $ | 46.9 | | | $ | 39.9 | | | $ | 0.8 | | | $ | 1.6 | | | $ | — | | | $ | 42.3 | |
| | Capital Expenditures | Capital Expenditures | | Capital Expenditures | |
| Portfolio investments and capital additions | Portfolio investments and capital additions | $ | 342.4 | | | $ | 158.6 | | | $ | 0 | | | $ | 2.8 | | | $ | 503.8 | | Portfolio investments and capital additions | $ | 474.6 | | | $ | 164.5 | | | $ | 0.3 | | | $ | 2.0 | | | $ | 641.4 | |
__________
(1) Includes net gains (losses) from scrapping of railcars.
GATX CORPORATION AND SUBSIDIARIES
NOTES TO CONSOLIDATED FINANCIAL STATEMENTS (UNAUDITED) (Continued)
NOTE 16. Discontinued Operations
On May 14, 2020, we completed the sale of our ASC business for estimatedbusiness. The proceeds of $258.3 million in cash of whichincluded $1.1 million was held in escrow, as of September 30, 2020set aside to satisfy potential indemnification claims for one year after the sale date. The final proceeds of $1.1 million were received in May 2021.
Accordingly, the results of operations from our ASC business and gain on sale of ASC are reported in the accompanying consolidated statements of operations as “discontinued operations, net of taxes” for the periodsthree and nine months ended September 30, 2020. As a result of the completion of the sale in May 2020, there were no operating results for the three and 2019. Thenine months ended September 30, 2021. There were no related assets and liabilities are classified as assets and liabilities of discontinued operations as of September 30, 20202021 and December 31, 20192020 in the accompanying balance sheets. We recognized a net gain of $3.6 million, net of taxes, during the second quarter of 2020 in connection with this sale. In the third quarter of 2020, we recognized a net loss of $0.3 million, net of taxes. The net loss on sale recognized in the current quarter wastaxes, attributable to final post-closing adjustments and expenses related to the sale.
Results of discontinued operations reflect directly attributable revenues, operating and ownership expenses, and income taxes. Results also reflect intercompany allocations for interest. Interest expense was 0zero and $2.0 million for the three and nine months ended September 30, 2020, compared to $1.6 million and $4.6 million for the same periods in 2019.2020. Interest was allocated consistent with GATX's risk-adjusted approach for continuing operations.
The following table shows the financial results of our discontinued operations (in millions):
| | | Three Months Ended
September 30 | | Nine Months Ended
September 30 | | Three Months Ended
September 30 | | Nine Months Ended
September 30 |
| | 2020 | | 2019 | | 2020 | | 2019 | | 2021 | | 2020 | | 2021 | | 2020 |
| Revenues | Revenues | $ | 0 | | | $ | 61.9 | | | $ | 27.2 | | | $ | 135.5 | | Revenues | $ | — | | $ | — | | $ | — | | $ | 27.2 |
| Expenses | Expenses | | Expenses | |
| Operating expense | Operating expense | 0 | | | 44.5 | | | 22.5 | | | 96.8 | | Operating expense | — | | — | | — | | 22.5 |
| Depreciation expense | Depreciation expense | 0 | | | 3.6 | | | 1.7 | | | 7.1 | | Depreciation expense | — | | — | | — | | 1.7 |
| Selling, general and administrative expense | Selling, general and administrative expense | 0 | | | 1.8 | | | 2.8 | | | 6.0 | | Selling, general and administrative expense | — | | — | | — | | 2.8 |
| Total Expenses | Total Expenses | 0 | | | 49.9 | | | 27.0 | | | 109.9 | | Total Expenses | — | | — | | — | | 27.0 |
| Other expense | Other expense | 0 | | | (1.7) | | | (3.0) | | | (4.9) | | Other expense | — | | — | | — | | (3.0) |
| Income (Loss) from Discontinued Operations Before Taxes | $ | 0 | | | $ | 10.3 | | | $ | (2.8) | | | $ | 20.7 | | |
| Income tax (expense) benefit | 0 | | | (2.4) | | | 0.6 | | | (4.8) | | |
| Income (Loss) from Discontinued Operations, Net of Taxes | $ | 0 | | | $ | 7.9 | | | $ | (2.2) | | | $ | 15.9 | | |
| Loss from Discontinued Operations Before Taxes | | Loss from Discontinued Operations Before Taxes | $ | — | | $ | — | | $ | — | | $ | (2.8) |
| Income tax benefit | | Income tax benefit | — | | — | | — | | 0.6 |
| Loss from Discontinued Operations, Net of Taxes | | Loss from Discontinued Operations, Net of Taxes | $ | — | | $ | — | | $ | — | | $ | (2.2) |
| (Loss) Gain on Sale of Discontinued Operations, Net of Taxes | (Loss) Gain on Sale of Discontinued Operations, Net of Taxes | (0.3) | | | 0 | | | 3.3 | | | 0 | | (Loss) Gain on Sale of Discontinued Operations, Net of Taxes | — | | (0.3) | | — | | 3.3 |
| Discontinued Operations, Net of Taxes | $ | (0.3) | | | $ | 7.9 | | | $ | 1.1 | | | $ | 15.9 | | |
| (Loss) Income from Discontinued Operations, Net of Taxes | | (Loss) Income from Discontinued Operations, Net of Taxes | $ | — | | $ | (0.3) | | $ | — | | $ | 1.1 |
The following table shows the assets and liabilities of the discontinued ASC business (in millions):
| | | | | | | | | | | |
| September 30 | | December 31 |
| 2020 | | 2019 |
| Assets of Discontinued Operations: | | | |
| Rent and other receivables | $ | 0 | | | $ | 21.2 | |
| Operating assets and facilities, net | — | | | 249.9 | |
| Other | 0 | | | 20.0 | |
| Total Assets of Discontinued Operations | $ | 0 | | | $ | 291.1 | |
| | | |
| Liabilities of Discontinued Operations: | | | |
| Accounts payable and accrued expenses | $ | 0 | | | $ | 29.7 | |
| Deferred income taxes | 0 | | | 35.8 | |
| Other | 0 | | | 4.0 | |
| Total Liabilities of Discontinued Operations | $ | 0 | | | $ | 69.5 | |
GATX CORPORATION AND SUBSIDIARIES
NOTES TO CONSOLIDATED FINANCIAL STATEMENTS (UNAUDITED) (Continued)
The following table shows cash flow information for our discontinued operations (in millions):
| | | | | | | | | | | |
| Nine Months Ended
September 30 |
| 2020 | | 2019 |
| Net Cash (Used In) Provided By Operating Activities | $ | (8.5) | | | $ | 18.9 | |
| Net Cash Provided By (Used In) Investing Activities (1) | 240.9 | | | (18.7) | |
| Net Cash Provided By (Used In) Financing Activities | 21.8 | | | (0.2) | |
| Cash provided by discontinued operations, net | $ | 254.2 | | | $ | 0 | |
| | | | | | | | | | | |
| Nine Months Ended
September 30 |
| 2021 | | 2020 |
| Net Cash Used In Operating Activities | $ | — | | | $ | (8.5) | |
| Net Cash Provided By Investing Activities (1) | 1.1 | | | 240.9 | |
| Net Cash Provided By Financing Activities | — | | | 21.8 | |
| Cash provided by discontinued operations, net | $ | 1.1 | | | $ | 254.2 | |
_________________
(1) Net cash provided by investing activities includes $1.1 million in 2021 for the nine months ended September 30, 2020 includesfinal proceeds from the sale of ASC that had been held in escrow funds and $257.2 million of $257.2 million.
Item 2. Management’s Discussion and Analysis of Financial Condition and Results of Operations
OVERVIEW
We lease, operate, manage, and remarket long-lived, widely-used assets, primarily in the rail market. We report our financial results through three primary business segments: Rail North America, Rail International, and Portfolio Management. Historically, we also reported financial results for American Steamship Company ("ASC") as a fourth segment.
In the first quarter of 2021, GATX began investing directly in aircraft spare engines through its new entity, GATX Engine Leasing ("GEL"). During the first quarter of 2021, GEL acquired 14 aircraft spare engines for approximately $352 million, including 4 engines for $120 million from the Rolls-Royce & Partners Finance joint ventures (collectively the “RRPF affiliates” or "RRPF"). All engines are on long-term leases with airline customers and are managed by RRPF. Financial results for this business are reported in the Portfolio Management segment.
On December 29, 2020, GATX acquired Trifleet Leasing Holding B.V. ("Trifleet"), one of the largest tank container lessors in the world. Financial results for this business are reported in the Other segment. See "Note 3. Business Combinations" in Part I, Item 1 of this Form 10-Q for additional information.
On May 14, 2020, we completed the sale of our ASC business, subject to customary post-closing adjustments. As a result, ASC is now reported as discontinued operations, and financial data for the ASC segment has been segregated and presented as discontinued operations for all periods presented. See "Note 16. Discontinued Operations" in Part I, Item 1 of this Form 10-Q for additional information.
The following discussion and analysis should be read in conjunction with the Management's Discussion and Analysis in our Annual Report on Form 10-K for the year ended December 31, 2019.2020. We based the discussion and analysis that follows on financial data we derived from the financial statements prepared in accordance with U.S. Generally Accepted Accounting Standards ("GAAP") and on certain other financial data that we prepared using non-GAAP components. For a reconciliation of these non-GAAP components to the most comparable GAAP components, see "Non-GAAP Financial Measures" at the end of this item.
Operating results for the three and nine months ended September 30, 20202021 are not necessarily indicative of the results we may achieve for the entire year ending December 31, 2020.2021. In particular, asset remarketing income does not occur evenly throughout the year. For more information, refer to the consolidated financial statements and footnotes in our Annual Report on Form 10-K for the year ended December 31, 2019.2020.
Coronavirus Disease 2019 ("COVID-19")
On March 11, 2020, the World Health Organization declared COVID-19 negatively impacted operating conditions for all of our business segments ina pandemic and on March 13, 2020, the third quarter. We expect COVID-19 will continueUnited States declared a national emergency related to have negative impacts onCOVID-19. Across our operating results in future periods,segments, we have implemented business continuity and crisis management plans. The COVID-19 pandemic continues to evolve, including the magnitudescope and duration of which are still uncertain. To limitdisruptions and the spread of COVID-19, governments have taken various actions, including travel banspace and restrictions, the issuance of stay-at-home orders, and social distancing guidelines. These actions caused many businesses to reduce or suspend operations, negatively impacting economic conditions and manytiming of the markets we serve. While certain of these restrictions were temporarily eased, some have been subsequently reinstated, and the economy continues to be impacted by the effects of COVID-19.eventual recovery. The global economic recovery remains tenuousuncertain due to a potential COVID-19 resurgence.resurgences. Our top priorities continue to be ensuring the health and safety of our global workforce and serving our various stakeholders with minimal disruptions.
AcrossRail North America
The initial impact of COVID-19 resulted in a decline in industry railcar loadings, had a negative impact on lease rates, and led to a reduction in the purchase and sale of railcars in the secondary market. Although North America saw a resurgence in COVID-19 cases during 2021, the operating environment has continued to improve, and the initial resurgence had minimal impact to our operating segments, we have implemented business continuity and crisis management plans. We have a strong liquidity position, solid balance sheet, and access to capital which we expect will enable GATX to effectively manage throughfinancial results during the COVID-19 pandemic. We have no outstanding debt maturities due until Junethird quarter of 2021. The risk of ongoing volatility due to future COVID-19 pandemic continuesdisruptions persists.
Rail International
While the initial impact of COVID-19 has dissipated, Europe and India saw a resurgence in COVID-19 cases during 2021. Although the resurgence had a minimal impact to evolve rapidly, including the scopeour operations in Europe, it did cause disruptions to railcar manufacturers in Europe and duration of disruptionsIndia, and the pace and timingrisk of the eventual recovery.ongoing volatility as a result of future COVID-19 disruptions persists.
Rail North America & Rail International
Industry railcar loadings have declined as the impact of COVID-19 has disrupted global manufacturing, supply chains, and consumer spending. While COVID-19 has not had a material impact on the financial performance of our global rail operations to date, we expect the reduction in economic activity to continue to impact our customers, which we expect, in turn, to impact the demand for our global railcar fleet. Maintenance Operations
Rail freight transportation and railcar repair have been deemed essential businesses globally. Our rail operations teams have implemented COVID-19 preparation and response programs to ensure the health and safety of our employees while continuing to provide critical railcar maintenance services. WhileAs a result of the resurgence in cases from the Delta variant, disruptions at our railcar repair facilities continue to operate, some have periodically reduced operating levels or closed on a temporary basis,increased during the third quarter of 2021, and future disruptions may occur as the impacts of COVID-19 continue.could occur.
Rolls-Royce & Partners Finance Joint Ventures ("RRPF affiliates")
Global air travel continues to be significantly impacted by COVID-19. In response to the drastic decline in demand, airlines have reduced system-wide capacity and grounded large portions or all of their fleets. Although some flight operations have resumed, in a limited capacity, air travel remains significantly below pre-COVID-19 levels. Many airlines are currently focused on managing their near-term liquidity positions, restructuring operations, and obtaining government financial support. While theThe major reduction in global air travel and the disruption across the aviation industry has not had a materialcontinued to adversely impact on the profitability of our aircraft spare engine leasing business and operating results to date, wein the third quarter of 2021. We expect that it will continue to have a negative impact on our futurenear-term operating results, the magnitude and duration of which are still uncertain.
DISCUSSION OF OPERATING RESULTS
The following table shows a summary of our reporting segments and consolidated financial results (in millions, except per share data):
| | | | | | | | | | | | | | | | | | | | | | | | | |
| Three Months Ended
September 30 | | Nine Months Ended
September 30 | | |
| 2020 | | 2019 | | 2020 | | 2019 | | |
| Segment Revenues | | | | | | | | | |
| Rail North America | $ | 232.1 | | | $ | 238.5 | | | $ | 703.3 | | | $ | 728.0 | | | |
| Rail International | 67.1 | | | 58.0 | | | 188.4 | | | 167.9 | | | |
| Portfolio Management | 5.2 | | | 2.3 | | | 12.6 | | | 5.7 | | | |
| $ | 304.4 | | | $ | 298.8 | | | $ | 904.3 | | | $ | 901.6 | | | |
| Segment Profit | | | | | | | | | |
| Rail North America | $ | 56.1 | | | $ | 60.9 | | | $ | 178.1 | | | $ | 215.1 | | | |
| Rail International | 24.0 | | | 19.9 | | | 57.9 | | | 56.0 | | | |
| Portfolio Management | 44.3 | | | 10.7 | | | 83.1 | | | 34.9 | | | |
| | 124.4 | | | 91.5 | | | 319.1 | | | 306.0 | | | |
| Less: | | | | | | | | | |
| Selling, general and administrative expense | 42.0 | | | 42.6 | | | 125.8 | | | 129.6 | | | |
| Unallocated interest (income) expense | (2.2) | | | (1.4) | | | (5.1) | | | (4.6) | | | |
| Other, including eliminations | 0.6 | | | 0.6 | | | 3.3 | | | 1.2 | | | |
Income taxes (includes $24.0 and $3.0 QTR and $33.1 and $10.0 YTD related to affiliates' earnings) | 35.8 | | | 12.5 | | | 62.7 | | | 41.1 | | | |
| Net Income from Continuing Operations (GAAP) | $ | 48.2 | | | $ | 37.2 | | | $ | 132.4 | | | $ | 138.7 | | | |
| | | | | | | | | |
| Discontinued Operations, Net of Taxes | | | | | | | | | |
| Net income (loss) from discontinued operations, net of taxes | — | | | 7.9 | | | (2.2) | | | 15.9 | | | |
| (Loss) gain on sale of discontinued operation, net of taxes | (0.3) | | | — | | | 3.3 | | | — | | | |
| (Loss) Income from Discontinued Operations, Net of Taxes | $ | (0.3) | | | $ | 7.9 | | | $ | 1.1 | | | $ | 15.9 | | | |
| | | | | | | | | |
| Net Income (GAAP) | $ | 47.9 | | | $ | 45.1 | | | $ | 133.5 | | | $ | 154.6 | | | |
| | | | | | | | | |
| Net income from continuing operations, excluding tax adjustments and other items (non-GAAP) | $ | 60.5 | | | $ | 37.2 | | | $ | 144.7 | | | $ | 135.9 | | | |
| Net (loss) income from discontinued operations, excluding tax adjustments and other items (non-GAAP) | (0.3) | | | 7.9 | | | 1.1 | | | 15.9 | | | |
| Net income from consolidated operations, excluding tax adjustments and other items (non-GAAP) | $ | 60.2 | | | $ | 45.1 | | | $ | 145.8 | | | $ | 151.8 | | | |
| | | | | | | | | |
| Diluted earnings per share from continuing operations (GAAP) | $ | 1.36 | | | $ | 1.03 | | | $ | 3.74 | | | $ | 3.79 | | | |
| Diluted earnings per share from discontinued operations (GAAP) | (0.01) | | | 0.22 | | | 0.03 | | | 0.43 | | | |
| Diluted earnings per share from consolidated operations (GAAP) | $ | 1.35 | | | $ | 1.25 | | | $ | 3.77 | | | $ | 4.22 | | | |
| | | | | | | | | |
| Diluted earnings per share from continuing operations, excluding tax adjustments and other items (non-GAAP) (1) | $ | 1.71 | | | $ | 1.03 | | | $ | 4.09 | | | $ | 3.72 | | | |
| Diluted earnings per share from discontinued operations, excluding tax adjustments and other items (non-GAAP) (1) | (0.01) | | | 0.22 | | | 0.03 | | | 0.43 | | | |
| Diluted earnings per share from consolidated operations, excluding tax adjustments and other items (non-GAAP) (1) | $ | 1.70 | | | $ | 1.25 | | | $ | 4.12 | | | $ | 4.15 | | | |
| | | | | | | | | |
| Investment Volume | $ | 249.9 | | | $ | 190.8 | | | $ | 641.4 | | | $ | 503.8 | | | |
The following table shows our return on equity ("ROE") for the trailing 12 months ended September 30:
| | | | | | | | | | | |
| 2020 | | 2019 |
| Return on Equity (GAAP) | 10.2 | % | | 11.2 | % |
| Return on Equity, excluding tax adjustments and other items (non-GAAP) (1) | 12.7 | % | | 12.3 | % |
_________
(1) See "Non-GAAP Financial Measures" at the end of this item for further details.
Net income from continuing operations for the first nine months of 20202021 was $82.1 million, or $2.28 per diluted share, compared to $132.4 million, or $3.74 per diluted share, comparedin 2020. Results for the nine months ended September 30, 2021 included a net negative impact of $39.7 million related to $138.7an enacted tax rate increase in the United Kingdom and a net negative impact of $3.4 million or $3.79 per diluted share, in 2019.attributable to debt extinguishment costs associated with an early redemption. Results for the nine months ended September 30, 2020 included a net deferred income tax expensenegative impact of $12.3 million or $0.35 per diluted share, related to the elimination of a previously announced corporate income tax rate reduction in the United Kingdom. Results for the nine months ended September 30, 2019 included a net deferred tax benefit of $2.8 million, or $0.07 per diluted share, related to a reduction of the corporate income tax rate enacted in Alberta, CanadaKingdom (see "Non-GAAP Financial Measures" at the end of this item for further details). Excluding the impact of these items, net income from continuing operations increased $8.8decreased $19.5 million compared to the prior year, largely due to higherlower share of affiliates' earnings, and higher contribution from our marine operations, partially offset by lowerhigher asset disposition gains and lower maintenance expenses at Rail North America and higher maintenance expenses.America.
Net income from continuing operations for the third quarter of 20202021 was $40.1 million, or $1.11 per diluted share, compared to $48.2 million, or $1.36 per diluted share, compared to $37.2 million, or $1.03 per diluted share, in 2019.2020. Results for the three months ended September 30, 2020 included a net deferred income tax expensenegative impact of $12.3 million or $0.35 diluted share, related to the elimination of a previously announced corporate income tax rate reduction in the United Kingdom. ExcludingKingdom (see "Non-GAAP Financial Measures" at the impactend of this item netfor further details). Net income from continuing operations increased $23.3decreased $20.4 million compared to the prior year, largely due to higherlower share of affiliates' earnings, andpartially offset by higher asset disposition gains and lower maintenance expenses at Rail North America.
The following table shows a summary of our reporting segments and consolidated financial results (in millions, except per share data):
| | | | | | | | | | | | | | | | | | | | | | | | | |
| Three Months Ended
September 30 | | Nine Months Ended
September 30 | | |
| 2021 | | 2020 | | 2021 | | 2020 | | |
| Segment Revenues | | | | | | | | | |
| Rail North America | $ | 219.8 | | | $ | 232.1 | | | $ | 667.8 | | | $ | 703.3 | | | |
| Rail International | 71.5 | | | 67.1 | | | 212.6 | | | 188.4 | | | |
| Portfolio Management | 13.3 | | | 5.2 | | | 34.0 | | | 12.6 | | | |
| Other | 8.9 | | | — | | | 22.0 | | | — | | | |
| $ | 313.5 | | | $ | 304.4 | | | $ | 936.4 | | | $ | 904.3 | | | |
| Segment Profit | | | | | | | | | |
| Rail North America | $ | 66.5 | | | $ | 56.1 | | | $ | 209.8 | | | $ | 178.1 | | | |
| Rail International | 27.0 | | | 24.0 | | | 76.1 | | | 57.9 | | | |
| Portfolio Management | 6.2 | | | 44.3 | | | 24.5 | | | 83.1 | | | |
| Other | 3.0 | | | — | | | 6.3 | | | — | | | |
| | 102.7 | | | 124.4 | | | 316.7 | | | 319.1 | | | |
| Less: | | | | | | | | | |
| Selling, general and administrative expense | 45.9 | | | 42.0 | | | 140.8 | | | 125.8 | | | |
| Unallocated interest expense | 0.2 | | | (2.2) | | | 0.6 | | | (5.1) | | | |
| Other, including eliminations | 1.1 | | | 0.6 | | | 9.0 | | | 3.3 | | | |
| Income taxes (includes $1.0 and $24.0 QTR and $47.8 and $33.1 YTD related to affiliates' earnings) | 15.4 | | | 35.8 | | | 84.2 | | | 62.7 | | | |
| Net Income from Continuing Operations (GAAP) | $ | 40.1 | | | $ | 48.2 | | | $ | 82.1 | | | $ | 132.4 | | | |
| | | | | | | | | |
| Discontinued Operations, Net of Taxes | | | | | | | | | |
| Loss from discontinued operations, net of taxes | $ | — | | | $ | — | | | $ | — | | | $ | (2.2) | | | |
| (Loss) gain on sale of discontinued operations, net of taxes | — | | | (0.3) | | | — | | | 3.3 | | | |
| Total Discontinued Operations, Net of Taxes (GAAP) | $ | — | | | $ | (0.3) | | | $ | — | | | $ | 1.1 | | | |
| | | | | | | | | |
| Net Income (GAAP) | $ | 40.1 | | | $ | 47.9 | | | $ | 82.1 | | | $ | 133.5 | | | |
| | | | | | | | | |
| Net income from continuing operations, excluding tax adjustments and other items (non-GAAP) (1) | $ | 40.1 | | | $ | 60.5 | | | $ | 125.2 | | | $ | 144.7 | | | |
| Net loss from discontinued operations, excluding tax adjustments and other items (non-GAAP) (1) | — | | | (0.3) | | | — | | | 1.1 | | | |
| Net income from consolidated operations, excluding tax adjustments and other items (non-GAAP) (1) | $ | 40.1 | | | $ | 60.2 | | | $ | 125.2 | | | $ | 145.8 | | | |
| | | | | | | | | |
| Diluted earnings per share from continuing operations (GAAP) | $ | 1.11 | | | $ | 1.36 | | | $ | 2.28 | | | $ | 3.74 | | | |
| Diluted earnings per share from discontinued operations (GAAP) | — | | | (0.01) | | | — | | | 0.03 | | | |
| Diluted earnings per share from consolidated operations (GAAP) | $ | 1.11 | | | $ | 1.35 | | | $ | 2.28 | | | $ | 3.77 | | | |
| | | | | | | | | |
| Diluted earnings per share from continuing operations, excluding tax adjustments and other items (non-GAAP) (1) | $ | 1.11 | | | $ | 1.71 | | | $ | 3.48 | | | $ | 4.09 | | | |
| Diluted earnings per share from discontinued operations, excluding tax adjustments and other items (non-GAAP) (1) | — | | | (0.01) | | | — | | | 0.03 | | | |
| Diluted earnings per share from consolidated operations, excluding tax adjustments and other items (non-GAAP) (1) | $ | 1.11 | | | $ | 1.70 | | | $ | 3.48 | | | $ | 4.12 | | | |
| | | | | | | | | |
| Investment Volume | $ | 229.8 | | | $ | 249.9 | | | $ | 893.2 | | | $ | 641.4 | | | |
The following table shows our return on equity ("ROE") for the trailing 12 months ended September 30:
| | | | | | | | | | | |
| 2021 | | 2020 |
| Return on Equity (GAAP) | 5.1 | % | | 10.2 | % |
| Return on Equity, excluding tax adjustments and other items (non-GAAP) (1) | 8.8 | % | | 12.7 | % |
_________
(1) See "Non-GAAP Financial Measures" at the end of this item for further details.
Segment Operations
Segment profit is an internal performance measure used by the Chief Executive Officer to assess the profitability of each segment. Segment profit includes all revenues, expenses, pre-tax earnings from affiliates, and net gains on asset dispositions that are directly attributable to each segment. We allocate interest expense to the segments based on what we believe to be the appropriate risk-adjusted borrowing costs for each segment. Segment profit excludes selling, general and administrative expenses, income taxes, and certain other amounts not allocated to the segments. These amounts are included in Other.
RAIL NORTH AMERICA
Segment Summary
During the third quarter, ended September 30, 2020,conditions in the North American railcar leasing market remained challenged duecontinued to a persistent oversupply of railcarsimprove as railroad car loadings increased, railroad velocity decreased, and weaknessindustry cars in certain markets, exacerbated by COVID-19's impact. While absolute rates were generally flat to slightly higherstorage decreased from prior year. Demand for most car types comparedincreased and absolute lease rates increased across most of the fleet during the quarter. Utilization increased to the second quarter, railcar lessors continued to compete aggressively to place new and existing railcars, resulting in significant pressure on lease rates. Despite this, our commercial team continued to deploy railcars and displace competitors, resulting in fleet utilization of 98.2%99.2% at the end of the quarter.
AlthoughWhile COVID-19 continued to challenge the operating environment at Rail North America, it has not had a materialminimal impact on Rail North America'soperating and financial results. Rail North America did not receive any new restructuring requests from customers during the third quarter, and to date, restructuring requests that have been approved did not have a significant impact on Rail North America's financial results. Railcar repair facilities continued to operate, but some experienced periodic operating disruptionsresults in the quarter. Asquarter, disruptions at our maintenance facilities increased as a result of the aforementioned factors, Rail North America expectsDelta variant, and the risk of ongoing pressure onvolatility due to future railcar utilization, lease rates, and other key performance metrics, the magnitude and duration of which are still uncertain.COVID-19 disruptions persists.
The following table shows Rail North America's segment results (in millions):
| | | Three Months Ended
September 30 | | Nine Months Ended
September 30 | | | Three Months Ended
September 30 | | Nine Months Ended
September 30 | |
| | 2020 | | 2019 | | 2020 | | 2019 | | | 2021 | | 2020 | | 2021 | | 2020 | |
| Revenues | Revenues | | | | | | | | | Revenues | | | | | | | | |
| Lease revenue | Lease revenue | $ | 208.7 | | | $ | 214.6 | | | $ | 630.8 | | | $ | 654.3 | | | Lease revenue | $ | 200.4 | | | $ | 208.7 | | | $ | 611.4 | | | $ | 630.8 | | |
| Other revenue | Other revenue | 23.4 | | | 23.9 | | | 72.5 | | | 73.7 | | | Other revenue | 19.4 | | | 23.4 | | | 56.4 | | | 72.5 | | |
| Total Revenues | Total Revenues | 232.1 | | | 238.5 | | | 703.3 | | | 728.0 | | | Total Revenues | 219.8 | | | 232.1 | | | 667.8 | | | 703.3 | | |
| | Expenses | Expenses | | | Expenses | | |
| Maintenance expense | Maintenance expense | 63.2 | | | 64.0 | | | 206.5 | | | 199.8 | | | Maintenance expense | 58.9 | | | 63.2 | | | 178.8 | | | 206.5 | | |
| Depreciation expense | Depreciation expense | 65.0 | | | 63.9 | | | 193.0 | | | 192.6 | | | Depreciation expense | 64.8 | | | 65.0 | | | 195.7 | | | 193.0 | | |
| Operating lease expense | Operating lease expense | 12.3 | | | 13.7 | | | 38.1 | | | 41.1 | | | Operating lease expense | 9.0 | | | 12.3 | | | 30.1 | | | 38.1 | | |
| Other operating expense | Other operating expense | 6.6 | | | 6.2 | | | 20.8 | | | 19.0 | | | Other operating expense | 6.6 | | | 6.6 | | | 22.6 | | | 20.8 | | |
| Total Expenses | Total Expenses | 147.1 | | | 147.8 | | | 458.4 | | | 452.5 | | | Total Expenses | 139.3 | | | 147.1 | | | 427.2 | | | 458.4 | | |
| | Other Income (Expense) | Other Income (Expense) | | | Other Income (Expense) | | |
| Net gain on asset dispositions | Net gain on asset dispositions | 7.9 | | | 4.3 | | | 39.9 | | | 44.6 | | | Net gain on asset dispositions | 20.2 | | | 7.9 | | | 74.8 | | | 39.9 | | |
| Interest expense, net | Interest expense, net | (35.7) | | | (33.1) | | | (103.5) | | | (101.4) | | | Interest expense, net | (32.9) | | | (35.7) | | | (102.5) | | | (103.5) | | |
| Other expense | Other expense | (1.1) | | | (1.0) | | | (3.2) | | | (3.6) | | | Other expense | (1.1) | | | (1.1) | | | (2.9) | | | (3.2) | | |
| | Share of affiliates' pre-tax loss | | Share of affiliates' pre-tax loss | (0.2) | | | — | | | (0.2) | | | — | | |
Segment Profit | Segment Profit | $ | 56.1 | | | $ | 60.9 | | | $ | 178.1 | | | $ | 215.1 | | | Segment Profit | $ | 66.5 | | | $ | 56.1 | | | $ | 209.8 | | | $ | 178.1 | | |
| | Investment Volume | Investment Volume | $ | 204.1 | | | $ | 138.1 | | | $ | 474.6 | | | $ | 342.4 | | | Investment Volume | $ | 178.9 | | | $ | 204.1 | | | $ | 394.4 | | | $ | 474.6 | | |
The following table shows the components of Rail North America's lease revenue (in millions):
| | | Three Months Ended
September 30 | | Nine Months Ended
September 30 | | Three Months Ended
September 30 | | Nine Months Ended
September 30 |
| | 2020 | | 2019 | | 2020 | | 2019 | | 2021 | | 2020 | | 2021 | | 2020 |
| Railcars | Railcars | $ | 184.8 | | | $ | 187.3 | | | $ | 558.3 | | | $ | 570.8 | | Railcars | $ | 177.1 | | | $ | 184.8 | | | $ | 540.6 | | | $ | 558.3 | |
| Boxcars | Boxcars | 16.5 | | | 17.9 | | | 50.0 | | | 55.7 | | Boxcars | 16.7 | | | 16.5 | | | 51.0 | | | 50.0 | |
| Locomotives | Locomotives | 7.4 | | | 9.4 | | | 22.5 | | | 27.8 | | Locomotives | 6.6 | | | 7.4 | | | 19.8 | | | 22.5 | |
| Total | Total | $ | 208.7 | | | $ | 214.6 | | | $ | 630.8 | | | $ | 654.3 | | Total | $ | 200.4 | | | $ | 208.7 | | | $ | 611.4 | | | $ | 630.8 | |
Rail North America Fleet Data
At September 30, 2020,2021, Rail North America's wholly owned fleet, excluding boxcars, consisted of approximately 103,400101,300 cars, and fleetrailcars. Fleet utilization, excluding boxcars, was 98.2%,99.2% at September 30, 2021, compared to 98.7%98.5% at the end of the prior quarter, and 99.2%98.2% at September 30, 2019.2020. Fleet utilization for our approximately 14,80012,800 boxcars was 94.5%98.4% at September 30, 2020,2021, compared to 94.6%97.1% at the end of the prior quarter, and 93.5%94.5% at September 30, 2019.2020. Utilization is calculated as the number of railcars on lease as a percentage of total railcars in the fleet.
During the third quarter of 2020,2021, an average of approximately 101,600100,500 railcars, excluding boxcars, were on lease, compared to 101,600100,700 in the prior quarter and 102,700101,600 for the quarter ended September 30, 2019.2020. Changes in railcars on lease compared to prior periods are impacted by the numbertiming of deliveries of new railcars purchased under our supply agreements, orthe number and timing of railcars acquired in the secondary market, and the disposition of railcars that were sold or scrapped, as well as the fleet utilization rate.
As of September 30, 2020,2021, leases for approximately 5,8005,000 tank cars and freight cars and approximately 1,600800 boxcars are scheduled to expire over the remainder of 2020.2021. These amounts exclude railcars on leases expiring in 20202021 that have already been renewed or assigned to a new lessee.
The following table shows fleet activity for Rail North America railcars, excluding boxcars, for the quarter ended:
| | | September 30
2019 | | December 31
2019 | | March 31
2020 | | June 30
2020 | | September 30
2020 | | September 30
2020 | | December 31
2020 | | March 31
2021 | | June 30
2021 | | September 30
2021 |
| Beginning balance | Beginning balance | 103,554 | | | 103,255 | | | 102,845 | | | 102,558 | | | 102,891 | | Beginning balance | 102,891 | | | 103,363 | | | 103,745 | | | 102,903 | | | 102,144 | |
| Cars added | Cars added | 902 | | | 965 | | | 883 | | | 1,220 | | | 1,578 | | Cars added | 1,578 | | | 1,015 | | | 977 | | | 693 | | | 742 | |
| Cars scrapped | Cars scrapped | (513) | | | (620) | | | (389) | | | (570) | | | (623) | | Cars scrapped | (623) | | | (571) | | | (1,002) | | | (770) | | | (947) | |
| Cars sold | Cars sold | (688) | | | (755) | | | (781) | | | (317) | | | (483) | | Cars sold | (483) | | | (62) | | | (817) | | | (682) | | | (598) | |
| Ending balance | Ending balance | 103,255 | | | 102,845 | | | 102,558 | | | 102,891 | | | 103,363 | | Ending balance | 103,363 | | | 103,745 | | | 102,903 | | | 102,144 | | | 101,341 | |
| Utilization rate at quarter end | Utilization rate at quarter end | 99.2 | % | | 99.3 | % | | 99.0 | % | | 98.7 | % | | 98.2 | % | Utilization rate at quarter end | 98.2 | % | | 98.1 | % | | 97.8 | % | | 98.5 | % | | 99.2 | % |
| Average active railcars | Average active railcars | 102,653 | | | 102,309 | | | 101,668 | | | 101,600 | | | 101,552 | | Average active railcars | 101,552 | | | 101,723 | | | 101,099 | | | 100,722 | | | 100,467 | |
The following table shows fleet statistics for Rail North America boxcars for the quarter ended:
| | | September 30
2019 | | December 31
2019 | | March 31
2020 | | June 30
2020 | | September 30
2020 | | September 30
2020 | | December 31
2020 | | March 31
2021 | | June 30
2021 | | September 30
2021 |
| Ending balance | Ending balance | 15,803 | | | 15,264 | | | 15,026 | | | 14,936 | | | 14,753 | | Ending balance | 14,753 | | | 14,315 | | | 13,880 | | | 12,659 | | | 12,809 | |
| Utilization | Utilization | 93.5 | % | | 95.0 | % | | 94.6 | % | | 94.6 | % | | 94.5 | % | Utilization | 94.5 | % | | 95.8 | % | | 97.1 | % | | 97.1 | % | | 98.4 | % |
Lease Price Index
Our Lease Price Index ("LPI") is an internally-generated business indicator that measures lease rate pricing on renewals for our North American railcar fleet, excluding boxcars. We calculate the index using the weighted-average lease rate for a group of railcar types that we believe best represents our overall North American fleet, excluding boxcars. The average renewal lease rate change is reported as the percentage change between the average renewal lease rate and the average expiring lease rate, weighted by fleet composition. The average renewal lease term is reported in months and reflects the average renewal lease term of railcar types in the LPI, weighted by fleet composition.
During the third quarter of 2020,2021, the renewal rate change of the LPI was negative 29.4%8.1%, compared to negative 28.0%6.7% in the prior quarter, and negative 7.7%29.4% in the third quarter of 2019.2020. Lease terms on renewals for cars in the LPI averaged 2932 months in the current quarter, compared to 3129 months in the prior quarter, and 4029 months in the third quarter of 2019.2020. Additionally, the renewal success rate, which represents the percentage of railcars on expiring leases that were renewed with the existing lessee, was 58.1%84.0% in the current quarter, compared to 71.8%77.5% in the prior quarter, and 75.2%58.1% in the third quarter of 2019.2020. The renewal success rate is an important metric because railcars returned by our customers may remain idle or incur additional maintenance and freight costs prior to being leased to new customers.
Comparison of the First Nine Months of 20202021 to the First Nine Months of 20192020
Segment Profit
In the first nine months of 2020,2021, segment profit of $178.1$209.8 million decreased 17.2%increased 17.8% compared to $215.1$178.1 million for the same period in the prior year. The decreaseincrease was primarily driven by lower lease revenue, higher maintenance expense, and lower net gains on asset dispositions in the current year.and lower maintenance expense, partially offset by lower revenue. The amount and timing of asset dispositions varies throughout thedisposition gains is dependent on a number of factors and may vary materially from year to year.
Revenues
In the first nine months of 2020,2021, lease revenue decreased $23.5$19.4 million, or 3.6%3.1%, a result ofresulting from fewer railcars and locomotives on lease, lower lease rates, and lower boxcar revenue.lease. Other revenue decreased $1.2$16.1 million, due todriven by lower repair revenue, as a result of mix of repairs, and lower lease termination fees, offset by higher repair revenue.fees.
Expenses
In the first nine months of 2020,2021, maintenance expense increased $6.7decreased $27.7 million, driven by higher assignment activity, partially offset by lowerfewer regulatory compliance events, fewer repairs performed by the railroads.railroads, improved efficiency in our owned repair shops, and a higher share of repairs being performed in GATX's owned shops versus contract shops. Depreciation expense increased $0.4$2.7 million due to the timing of new railcar investments and dispositions. Operating lease expense decreased $3.0$8.0 million, resulting from the purchase of railcars previously on operating leases. Other operating expense increased $1.8 million due to higher switching, freight,insurance and storage costs.
Other Income (Expense)
In the first nine months of 2020,2021 net gain on asset dispositions decreased $4.7increased $34.9 million, due to fewer railcars soldhigher asset remarketing gains and lowerhigher net scrapping gains. The amount and timing of disposition gains is dependent on a number of factors and may vary materially from year to year. Higher net scrapping gains were impacted by a higher scrap price per ton in 2021 and more railcars scrapped. Net interest expense increased $2.1decreased $1.0 million, primarily driven by a lower average interest rate, partially offset by a higher average debt balance and a higher average interest rate.balance.
Investment Volume
During the first nine months of 2020,2021, investment volume was $474.6$394.4 million compared to $342.4$474.6 million in the same period in 2019.2020. We acquired 3,5332,560 newly built railcars and purchased 355309 railcars in the secondary market in the first nine months of 2020,2021, compared to 1,8143,533 newly built railcars and 366355 railcars purchased in the secondary market in the same period in 2019.2020.
Our investment volume is predominantly composed of acquired railcars, but also includes certain capitalized repairs and improvements to owned railcars and our maintenance facilities. As a result, the dollar value of investment volume does not necessarily correspond to the number of railcars acquired in any given period. In addition, the comparability of amounts invested and the number of railcars acquired in each period is impacted by the mix of railcars purchased, which may include tank cars and freight cars, as well as newly manufactured railcars or those purchased in the secondary market.
Comparison of the Third Quarter of 20202021 to the Third Quarter of 20192020
Segment Profit
In the third quarter of 2020,2021, segment profit of $56.1$66.5 million decreased 7.9%increased 18.5% compared to $60.9$56.1 million for the same period in the prior year. The decreaseincrease was primarily driven by lower lease revenue, partially offset by higher net gains on asset dispositions.dispositions and lower maintenance expense, partially offset by lower revenue. The amount and timing of asset dispositions varies throughout the year.disposition gains is dependent on a number of factors and may vary materially from quarter to quarter.
Revenues
In the third quarter of 2020,2021, lease revenue decreased $5.9$8.3 million, or 2.7%4.0%, primarily due to lower utilization.resulting from fewer railcars and locomotives on lease. Other revenue decreased $0.5$4.0 million, driven by lower lease termination fees partially offset by higherand lower repair revenue.
Expenses
In the third quarter of 2020,2021, maintenance expense decreased $0.8$4.3 million, primarily driven by lowerfewer regulatory compliance events, fewer repairs performed by the railroads.railroads, improved efficiency in our owned repair shops, and a higher share of repairs being performed in GATX's owned shops versus contract shops. Depreciation expense increased $1.1decreased $0.2 million due to the timing of new railcar investments and dispositions. Operating lease expense decreased $1.4$3.3 million, due toresulting from the purchase of railcars previously on operating leases. Other operating expense increased $0.4 million duewas comparable to higher switching, freight, and storage costs.prior year.
Other Income (Expense)
In the third quarter of 2020,2021, net gain on asset dispositions increased $3.6$12.3 million, attributabledue to higher asset remarketing gains and higher net scrapping gains. The amount and timing of disposition gains is dependent on a number of factors and may vary materially from quarter to quarter. Higher net scrapping gains were impacted by a higher scrap price per ton in 2021 and more railcars sold in the secondary market.scrapped. Net interest expense increased $2.6decreased $2.8 million, primarily driven by a lower average interest rate, partially offset by a higher average debt balance and a higher average interest rate. Other expense was comparable to the same period in the prior year.balance.
RAIL INTERNATIONAL
Segment Summary
Rail International, composed primarily of GATX Rail Europe ("GRE"), continued to produce strong operating results in the first nine months of 2020. GRE experienced small lease renewal rate increases in the quarter, as demand2021. Demand for railcars in Europe remained stable.strong, and renewal lease rates for most car types continued to increase modestly. GRE continued to grow and diversify its fleet during the quarter. However, the pace of fleet growth in 2021 has been negatively impacted by new car delivery delays. COVID-19 did not have a material impact on GRE's third quarter operating results. However, GREGRE’s financial results, but the risk of ongoing volatility as a result of future COVID-19 disruptions persists.
Our rail operations in India ("GRI") continued to experience delaysfocus on investment opportunities, diversification of its fleet, and developing relationships with customers, suppliers and the Indian Railways. Similar to Europe, the pace of fleet growth in new railcar investments due to COVID-19 related interruptions at2021 has been negatively impacted by railcar manufacturing facilities. There were no new customer lease restructuring requests in the third quarter, and requests approved to datesupply disruptions as a result of COVID-19. Although COVID-19 did not have had a minimalmaterial impact on GRE'sGRI's financial results. GRE expectsresults, the risk of ongoing pressure onvolatility as a result of future railcar utilization and lease rates, the magnitude and duration of which are still uncertain.COVID-19 disruptions persists.
The following table shows Rail International's segment results (in millions):
| | | Three Months Ended
September 30 | | Nine Months Ended
September 30 | | | Three Months Ended
September 30 | | Nine Months Ended
September 30 | |
| | 2020 | | 2019 | | 2020 | | 2019 | | | 2021 | | 2020 | | 2021 | | 2020 | |
| Revenues | Revenues | | | | | | | | | Revenues | | | | | | | | |
| Lease revenue | Lease revenue | $ | 64.5 | | | $ | 55.6 | | | $ | 181.9 | | | $ | 161.7 | | | Lease revenue | $ | 68.8 | | | $ | 64.5 | | | $ | 204.7 | | | $ | 181.9 | | |
| Other revenue | Other revenue | 2.6 | | | 2.4 | | | 6.5 | | | 6.2 | | | Other revenue | 2.7 | | | 2.6 | | | 7.9 | | | 6.5 | | |
| Total Revenues | Total Revenues | 67.1 | | | 58.0 | | | 188.4 | | | 167.9 | | | Total Revenues | 71.5 | | | 67.1 | | | 212.6 | | | 188.4 | | |
| | Expenses | Expenses | | | Expenses | | |
| Maintenance expense | Maintenance expense | 13.5 | | | 12.2 | | | 38.3 | | | 35.5 | | | Maintenance expense | 14.0 | | | 13.5 | | | 43.6 | | | 38.3 | | |
| Depreciation expense | Depreciation expense | 17.1 | | | 14.5 | | | 48.4 | | | 42.7 | | | Depreciation expense | 18.5 | | | 17.1 | | | 55.2 | | | 48.4 | | |
| Other operating expense | Other operating expense | 1.6 | | | 1.4 | | | 4.9 | | | 4.2 | | | Other operating expense | 1.8 | | | 1.6 | | | 5.5 | | | 4.9 | | |
| Total Expenses | Total Expenses | 32.2 | | | 28.1 | | | 91.6 | | | 82.4 | | | Total Expenses | 34.3 | | | 32.2 | | | 104.3 | | | 91.6 | | |
| | Other Income (Expense) | Other Income (Expense) | | | Other Income (Expense) | | |
| Net gain on asset dispositions | Net gain on asset dispositions | 0.5 | | | 0.3 | | | 0.8 | | | 1.2 | | | Net gain on asset dispositions | 0.9 | | | 0.5 | | | 2.0 | | | 0.8 | | |
| Interest expense, net | Interest expense, net | (11.9) | | | (10.2) | | | (34.0) | | | (30.2) | | | Interest expense, net | (10.9) | | | (11.9) | | | (34.2) | | | (34.0) | | |
| Other income (expense) | 0.5 | | | (0.1) | | | (5.7) | | | (0.5) | | | |
| Other (expense) income | | Other (expense) income | (0.2) | | | 0.5 | | | — | | | (5.7) | | |
| Segment Profit | Segment Profit | $ | 24.0 | | | $ | 19.9 | | | $ | 57.9 | | | $ | 56.0 | | | Segment Profit | $ | 27.0 | | | $ | 24.0 | | | $ | 76.1 | | | $ | 57.9 | | |
| | Investment Volume | Investment Volume | $ | 45.3 | | | $ | 51.8 | | | $ | 164.5 | | | $ | 158.6 | | | Investment Volume | $ | 40.9 | | | $ | 45.3 | | | $ | 126.1 | | | $ | 164.5 | | |
GRE Fleet Data
At September 30, 2020,2021, GRE's wholly owned fleet consisted of approximately 26,000 cars, and fleet26,800 railcars. Fleet utilization was 98.2%98.1% at September 30, 2020,2021, compared to 98.4% at the end of the prior quarter and 99.4%98.2% at September 30, 2019.2020. Utilization is calculated as the number of railcars on lease as a percentage of total railcars in the fleet.
During the third quarter of 2020,2021, an average of approximately 25,40026,300 railcars were on lease, compared to 25,10026,200 in the prior quarter and 23,90025,400 for the quarter ended September 30, 2019.2020. Changes in railcars on lease compared to prior periods are impacted by the number and timing of new railcars purchased or acquired in the secondary market and the disposition of railcars that were sold or scrapped, as well as the fleet utilization rate.
The following table shows fleet activity for GRE railcars for the quarter ended:
| | | September 30
2019 | | December 31
2019 | | March 31
2020 | | June 30
2020 | | September 30
2020 | | September 30
2020 | | December 31
2020 | | March 31
2021 | | June 30
2021 | | September 30
2021 |
| Beginning balance | Beginning balance | 23,967 | | | 24,211 | | | 24,561 | | | 25,352 | | | 25,705 | | Beginning balance | 25,705 | | | 25,956 | | | 26,343 | | | 26,498 | | | 26,727 | |
| Cars added | Cars added | 325 | | | 416 | | | 871 | | | 423 | | | 331 | | Cars added | 331 | | | 446 | | | 226 | | | 359 | | | 213 | |
| Cars scrapped or sold | Cars scrapped or sold | (81) | | | (66) | | | (80) | | | (70) | | | (80) | | Cars scrapped or sold | (80) | | | (59) | | | (71) | | | (130) | | | (100) | |
| Ending balance | Ending balance | 24,211 | | | 24,561 | | | 25,352 | | | 25,705 | | | 25,956 | | Ending balance | 25,956 | | | 26,343 | | | 26,498 | | | 26,727 | | | 26,840 | |
| Utilization rate at quarter end | Utilization rate at quarter end | 99.4 | % | | 99.3 | % | | 98.5 | % | | 98.4 | % | | 98.2 | % | Utilization rate at quarter end | 98.2 | % | | 98.1 | % | | 98.2 | % | | 98.4 | % | | 98.1 | % |
| Average active railcars | Average active railcars | 23,877 | | | 24,216 | | | 24,622 | | | 25,100 | | | 25,369 | | Average active railcars | 25,369 | | | 25,669 | | | 25,917 | | | 26,156 | | | 26,310 | |
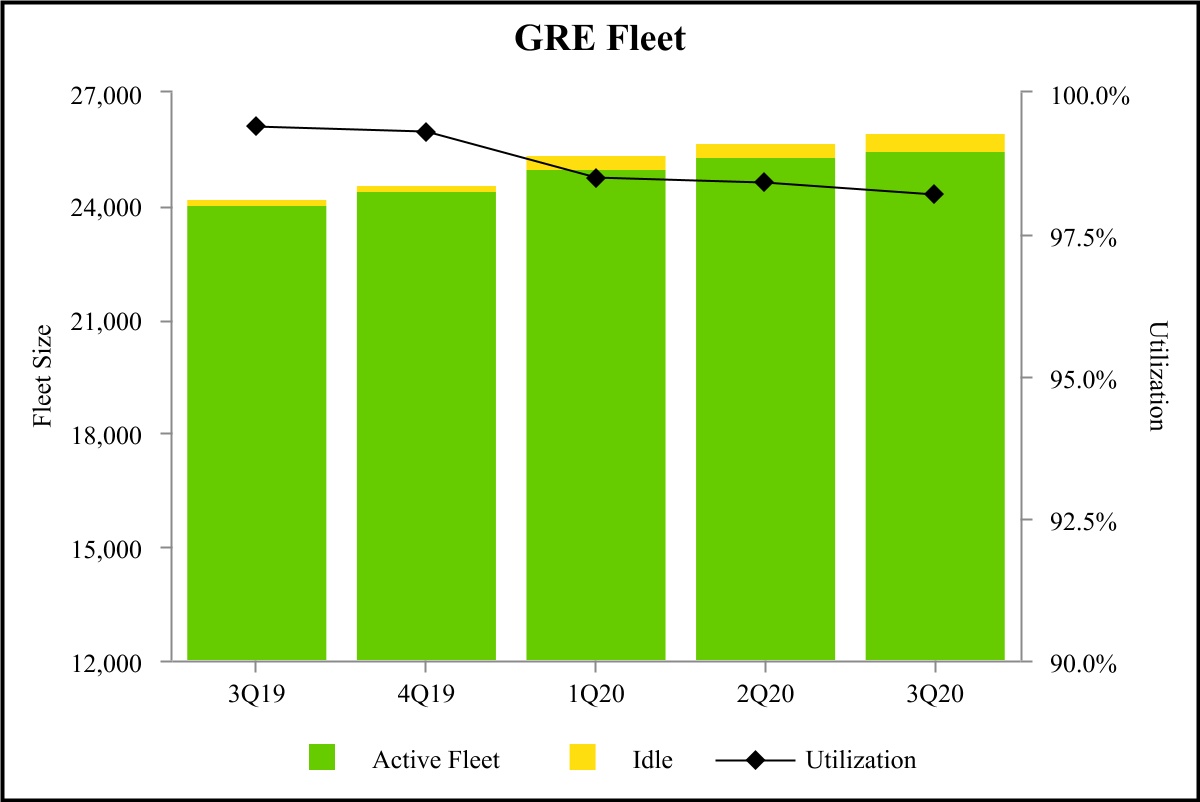
\
The following table shows fleet activity for GRI railcars for the quarter ended:
| | | | | | | | | | | | | | | | | | | | | | | | | | | | | |
| September 30
2020 | | December 31
2020 | | March 31
2021 | | June 30
2021 | | September 30
2021 |
| Beginning balance | 3,908 | | | 4,032 | | | 4,156 | | | 4,292 | | | 4,292 | |
| Cars added | 124 | | | 124 | | | 136 | | | — | | | 125 | |
| Ending balance | 4,032 | | | 4,156 | | | 4,292 | | | 4,292 | | | 4,417 | |
| Utilization rate at quarter end | 100.0 | % | | 99.0 | % | | 99.0 | % | | 99.0 | % | | 99.1 | % |
Comparison of the First Nine Months of 20202021 to the First Nine Months of 20192020
Foreign Currency
Rail International's reported results of operations are impacted by fluctuations in the exchange rates of the U.S. dollar versus foreign currencies in which it conducts business, primarily the euro. In the first nine months of 2020,ended September 30, 2021, fluctuations in the value of the euro, relative to the U.S. dollar, did not have a meaningful impact onpositively impacted lease revenue orby approximately $10.2 million and segment profit, excluding other income (expense), by approximately $5.8 million compared to the same period in 2019.2020.
Segment Profit
In the first nine months of 2020,2021, segment profit of $57.9$76.1 million increased 3.4%31.4% compared to $56.0$57.9 million for the same period in the prior year. The increase was primarily due to higher lease revenue from more railcars on lease offset by higher depreciation expense and the negative impactpositive impacts of changes in foreign exchange rates on non-functional currency items.rates.
Revenues
In the first nine months of 2020,2021, lease revenue increased $20.2$22.8 million, or 12.5%, due to more railcars on lease at GRE and Rail India.GRI and the impact of foreign exchange rates. Other revenue increased $1.4 million, driven by higher repair revenue.
Expenses
In the first nine months of 2020,2021, maintenance expense increased $2.8$5.3 million, primarily due to higher wheelset costs and higher costs for railcars leased to new customers, partially offset by lower costs for other repairs. Depreciation expense increased $5.7$6.8 million, resulting from the impact of new railcars added to the fleet.
Other Income (Expense)
In the first nine months of 2020,2021, net gain on asset dispositions decreased $0.4increased $1.2 million, attributable to lowerhigher asset remarketing gains and higher net scrapping gains. Net scrapping gains were positively impacted by a higher scrap price per ton in 2021. Net interest expense increased $3.8$0.2 million, due to a higher average debt balance, partially offset by a lower average interest rate. Other expense increased $5.2decreased $5.7 million, driven by the negativepositive impact of changes in foreign exchange rates on non-functional currency items and higher netlower litigation costs related to the Viareggio matter, which reflected the absence of insurance proceeds received in the prior year.matter.
Investment Volume
During the first nine months of 2020,2021, investment volume was $164.5$126.1 million compared to $158.6$164.5 million in the same period in 2019.2020. In the first nine months of 2020,ended September 30, 2021, GRE acquired 798 newly built railcars (including 253 assembled at the GRE Ostróda, Poland facility) compared to 1,194 newly built railcars (including 282 assembled at the GRE Ostróda, Poland facility) and 431 railcars purchased 431railcars in the secondary market and Rail India acquired 353 railcars compared to 1,001 newly built railcars at GRE, 1,161 railcars at Rail India and 26 railcars at Rail Russiamarkets for the same period in 2019.2020. In the first nine months ended September 30, 2021, GRI acquired 261 newly built railcars, compared to 353 newly built railcars for the same period in 2020.
Our investment volume is predominantly composed of acquired railcars, but may also include certain capitalized repairs and improvements to owned railcars. As a result, the dollar value of investment volume does not necessarily correspond to the number of railcars acquired in any given period. In addition, the comparability of amounts invested and the number of railcars acquired in each period is impacted by the mix of the various car types acquired, as well as fluctuations in the exchange rates of the foreign currencies in which Rail International conducts business.
Comparison of the Third Quarter of 20202021 to the Third Quarter of 20192020
Foreign Currency
Rail International's reported financial results of operations are impacted by fluctuations in the exchange rates of the U.S. dollar versus foreign currencies in which it conducts business, primarily the euro. In the third quarter of 2020, a stronger2021, fluctuations in the value of the euro, relative to the U.S. dollar, positively impacted lease revenue by approximately $2.5$0.4 million and segment profit, excluding other income (expense), by approximately $1.6$0.4 million compared to the same period in 2019.2020.
Segment Profit
In the third quarter of 2020,2021, segment profit of $24.0$27.0 million increased 20.6%12.5% compared to $19.9$24.0 million for the same period in the prior year. The increase was primarily due to higher lease revenue from more railcars on lease partially offset by higher depreciation expense.and the positive impacts of changes in foreign exchange rates.
Revenues
In the third quarter of 2020,2021, lease revenue increased $8.9$4.3 million, or 16.0%6.7%, due to more railcars on lease at GRE and Rail IndiaGRI and the impact of foreign exchange rates.
Expenses
In the third quarter of 2020,2021, maintenance expense increased $1.3$0.5 million, driven byprimarily due to higher costs for railcars leased to new customers and higher wheelset costs, andpartially offset by lower costs for other repairs. Depreciation expense increased $1.4 million, resulting from the impact of foreign exchange rates. Depreciation expense increased $2.6 million due to new railcars added to the fleet and the impact of foreign exchange rates.fleet.
Other Income (Expense)
In the third quarter of 2020,2021, net gain on asset dispositions increased $0.2$0.4 million, attributable to higher net scrapping gains. Net scrapping gains on railcars soldwere positively impacted by a higher scrap price per ton in the secondary market.2021. Net interest expense increased $1.7decreased $1.0 million, due to a higherlower average debt balance,interest rate, partially offset by a lowerhigher average interest rate.debt balance. Other expense decreased $0.6increased $0.7 million, largely due todriven by the positive impact of changes in foreign exchange rates on non-functional currency items.
PORTFOLIO MANAGEMENT
Segment Summary
Portfolio Management's segment profit is attributable primarily to income from the RRPF affiliates, a group of 50% owned domestic and foreign joint ventures with Rolls-Royce plc (or affiliates thereof, collectively "Rolls-Royce"), a leading manufacturer of commercial aircraft jet engines. Segment profit included earnings from the RRPF affiliates of $92.8$26.4 million and $46.8$4.0 million for the nine months and three months ended September 30, 2020,2021, compared to $53.6$92.8 million and $15.8$46.8 million for the same periods in 2019.2020. Financial results for the currentprior year included a transaction involving the refinancing and sale of a group of aircraft spare engines at the RRPF affiliates, which impacted both quarterly and full-year results. In this transaction, the RRPF affiliates sold 21 aircraft spare engines for total proceeds of $233.0 million in the nine months ended September 30, 2020. 18 of these aircraft spare engines were sold in the three months ended September 30, 2020 for total proceeds of $216.0 million. GATX's 50% share of the resulting pre-tax net gains were $35.3 million and $32.1 million for the nine months and three months ended September 30, 2020, respectively.
COVID-19The operating environment for RRPF continued to severelybe challenging during the third quarter of 2021 due to the ongoing adverse impact globalof COVID-19 on air traveltravel. RRPF continues to face pressure on both utilization and lease rates as a result of rent deferral requests that have been granted in the third quarter. As a result, RRPF has granted significant rent deferrals andpast, as well as the impact from a number of its customers havehaving declared bankruptcy or undertaken restructuring processes. Despite this, RRPF maintained strong utilization, with 94.3% of its engines on lease at the end of the quarter, and isremains focused on preserving a strong liquidity position in the current environment. The risk of ongoing volatility as a result of future COVID-19 disruptions persists.
In the first quarter of 2021, GATX began investing directly in aircraft spare engines through its new entity, GEL. During the first quarter of 2021, GEL acquired 14 aircraft spare engines for approximately $352 million, including 4 engines for $120 million from the RRPF continues to expect pressureaffiliates. All engines are on both engine utilizationlong-term leases with airline customers and lease rates, which will impact future operating results, the magnitude and duration of which are still uncertain.managed by RRPF.
Portfolio Management also owns marine assets, consisting of five liquefied gas-carrying vessels (the "Specialized Gas Vessels"). During the second quarter of 2019, the prior commercial management agreement with Norgas Carriers Private Limited, and related pooling arrangement, was terminated, and we entered into a new agreement with Anthony Veder Group B.V. ("Veder") to commercially manage these vessels. The Specialized Gas Vessels are utilized to transport pressurized gases and chemicals, such as liquefied petroleum gas, liquefied natural gas, and ethylene, primarily on short-term spot contracts for major oil and chemical customers worldwide.
While COVID-19 continued to have a significant impact on the gas shipping market, there were signs of improvement in the third quarter as charter rates and utilization increased modestly. We expect COVID-19 will likely continue to have a negative impact on future results, the magnitude and duration of which are still uncertain.
Portfolio Management's total asset base was $1,030.1 million at September 30, 2021, compared to $706.1 million at December 31, 2020, and $709.7 million at September 30, 2020, compared to $676.3 million at June 30, 2020, and $639.6 million at2020. The increase in total assets during the nine months ended September 30, 2019.2021 is primarily attributable to the acquisition of aircraft spare engines at GEL.
The following table shows Portfolio Management’s segment results (in millions):
| | | Three Months Ended
September 30 | | Nine Months Ended
September 30 | | | Three Months Ended
September 30 | | Nine Months Ended
September 30 | |
| | 2020 | | 2019 | | 2020 | | 2019 | | | 2021 | | 2020 | | 2021 | | 2020 | |
| Revenues | Revenues | | | | | | | | | Revenues | | | | | | | | |
| Lease revenue | Lease revenue | $ | 0.1 | | | $ | 0.3 | | | $ | 0.6 | | | $ | 0.8 | | | Lease revenue | $ | 8.2 | | | $ | 0.1 | | | $ | 19.8 | | | $ | 0.6 | | |
| Marine operating revenue | Marine operating revenue | 5.0 | | | 1.9 | | | 11.6 | | | 4.4 | | | Marine operating revenue | 5.0 | | | 5.0 | | | 13.7 | | | 11.6 | | |
| Other revenue | Other revenue | 0.1 | | | 0.1 | | | 0.4 | | | 0.5 | | | Other revenue | 0.1 | | | 0.1 | | | 0.5 | | | 0.4 | | |
| Total Revenues | Total Revenues | 5.2 | | | 2.3 | | | 12.6 | | | 5.7 | | | Total Revenues | 13.3 | | | 5.2 | | | 34.0 | | | 12.6 | | |
| | Expenses | Expenses | | | Expenses | | |
| Marine operating expense | Marine operating expense | 3.6 | | | 3.4 | | | 10.9 | | | 12.0 | | | Marine operating expense | 3.7 | | | 3.6 | | | 13.8 | | | 10.9 | | |
| Depreciation expense | Depreciation expense | 1.3 | | | 1.6 | | | 4.0 | | | 4.9 | | | Depreciation expense | 4.9 | | | 1.3 | | | 12.6 | | | 4.0 | | |
| Other operating expense | Other operating expense | 0.1 | | | 0.1 | | | 0.3 | | | 0.3 | | | Other operating expense | 0.6 | | | 0.1 | | | 1.2 | | | 0.3 | | |
| Total Expenses | Total Expenses | 5.0 | | | 5.1 | | | 15.2 | | | 17.2 | | | Total Expenses | 9.2 | | | 5.0 | | | 27.6 | | | 15.2 | | |
| | Other Income (Expense) | Other Income (Expense) | | | Other Income (Expense) | | |
| Net gain on asset dispositions | Net gain on asset dispositions | 0.5 | | | 0.5 | | | 1.6 | | | 1.1 | | | Net gain on asset dispositions | 0.6 | | | 0.5 | | | 1.7 | | | 1.6 | | |
| Interest expense, net | Interest expense, net | (3.2) | | | (2.8) | | | (9.1) | | | (8.3) | | | Interest expense, net | (4.5) | | | (3.2) | | | (12.0) | | | (9.1) | | |
| | Other income | | Other income | 2.0 | | | — | | | 2.0 | | | — | | |
| Share of affiliates' pre-tax income | Share of affiliates' pre-tax income | 46.8 | | | 15.8 | | | 93.2 | | | 53.6 | | | Share of affiliates' pre-tax income | 4.0 | | | 46.8 | | | 26.4 | | | 93.2 | | |
Segment Profit | Segment Profit | $ | 44.3 | | | $ | 10.7 | | | $ | 83.1 | | | $ | 34.9 | | | Segment Profit | $ | 6.2 | | | $ | 44.3 | | | $ | 24.5 | | | $ | 83.1 | | |
| | Investment Volume | Investment Volume | $ | — | | | $ | — | | | $ | 0.3 | | | $ | — | | | Investment Volume | $ | — | | | $ | — | | | $ | 353.0 | | | $ | 0.3 | | |
The following table shows the net book values of Portfolio Management's assets (in millions):
| | | September 30
2019 | | December 31
2019 | | March 31
2020 | | June 30
2020 | | September 30
2020 | | September 30
2020 | | December 31
2020 | | March 31
2021 | | June 30
2021 | | September 30
2021 |
| Investment in RRPF Affiliates | Investment in RRPF Affiliates | $ | 506.5 | | | $ | 512.4 | | | $ | 532.2 | | | $ | 551.2 | | | $ | 582.3 | | Investment in RRPF Affiliates | $ | 582.3 | | | $ | 584.7 | | | $ | 592.2 | | | $ | 561.0 | | | $ | 564.2 | |
| Owned assets | 133.1 | | | 141.3 | | | 125.1 | | | 125.1 | | | 127.4 | | |
| GEL owned aircraft spare engines | | GEL owned aircraft spare engines | — | | | — | | | 350.9 | | | 347.7 | | | 344.1 | |
| Other owned assets | | Other owned assets | 127.4 | | | 121.4 | | | 123.9 | | | 130.8 | | | 121.8 | |
| Managed assets (1) | Managed assets (1) | 26.6 | | | 24.8 | | | 22.9 | | | 21.0 | | | 19.1 | | Managed assets (1) | 19.1 | | | 17.3 | | | 15.4 | | | 13.5 | | | 11.6 | |
________
(1) Amounts shown represent the estimated net book value of assets managed for third parties and are not included in our consolidated balance sheets.
RRPF Affiliates Engine Portfolio Data
As of September 30, 2020,2021, the RRPF affiliates' fleet consisted of 428 aircraft spare engines with a net book value of $4,478.4 million, compared to 445 aircraft spare engines with a net book value of $4,784.1 million at December 31, 2020 and 439 aircraft spare engines with a net book value of $4,641.4 million compared to 470 aircraft spare engines with a net book value of $4,897.9 million at June 30, 2020 and 456 aircraft spare engines with a net book value of $4,556.2 million at September 30, 2019. 2020.
Engine utilization for the RRPF affiliates was 94.3%92.1% at September 30, 2020,2021, compared to 95.1%93.5% at the end of the prior quarter and 95.6%94.3% at September 30, 2019.2020. Utilization is calculated as the number of engines on lease as a percentage of total engines in the fleet.
The following table shows portfolio activity for the RRPF affiliates' aircraft spare engines for the quarter ended:
| | | September 30
2019 | | December 31
2019 | | March 31
2020 | | June 30
2020 | | September 30
2020 | | September 30
2020 | | December 31
2020 | | March 31
2021 | | June 30
2021 | | September 30
2021 |
| Beginning balance | Beginning balance | 461 | | | 456 | | | 478 | | | 478 | | | 470 | | Beginning balance | 470 | | | 439 | | | 445 | | | 438 | | | 429 | |
| Engine acquisitions | Engine acquisitions | 5 | | | 27 | | | 8 | | | 2 | | | — | | Engine acquisitions | — | | | 10 | | | 2 | | | — | | | — | |
| Engine dispositions | Engine dispositions | (10) | | | (5) | | | (8) | | | (10) | | | (31) | | Engine dispositions | (31) | | | (4) | | | (9) | | | (9) | | | (1) | |
| Ending balance | Ending balance | 456 | | | 478 | | | 478 | | | 470 | | | 439 | | Ending balance | 439 | | | 445 | | | 438 | | | 429 | | | 428 | |
| Utilization rate at quarter end | Utilization rate at quarter end | 95.6 | % | | 96.9 | % | | 95.8 | % | | 95.1 | % | | 94.3 | % | Utilization rate at quarter end | 94.3 | % | | 92.8 | % | | 92.0 | % | | 93.5 | % | | 92.1 | % |
Comparison of the First Nine Months of 20202021 to the First Nine Months of 20192020
Segment Profit
In the first nine months of 2020,2021, segment profit was $83.1$24.5 million, compared to $34.9$83.1 million for the same period in the prior year. The increaseLower segment profit reflects higher earningslower financial results at the RRPF affiliates, primarily driven by higherlower net disposition gains as well as an improved contributionand operating income, partially offset by earnings from the Specialized Gas Vessels.GEL, our direct investment in aircraft spare engines.
Revenues
In the first nine months of 2020,2021, lease revenue was comparableincreased $19.2 million, due to the same periodGEL's new investment in aircraft spare engines on lease in the priorcurrent year. Marine operating revenue increased $7.2$2.1 million, driven by higher utilization and increased charter rates from the Specialized Gas Vessels and the transition to the new commercial manager in the prior year.Vessels.
Expenses
In the first nine months of 2020,2021, marine operating expense decreased $1.1increased $2.9 million, due to lower operating expenseshigher bunker fuel expense and management fees forhigher repairs and maintenance costs. Depreciation expense increased $8.6 million, due to the Specialized Gas Vessels. The lower management fees were a result ofinvestment in new aircraft spare engines in the change in commercial manager.current year at GEL.
Other Income (Expense)
In the first nine months of 2020,2021, income from our share of affiliates' earnings increased $39.6decreased $66.8 million, driven by higher net disposition gains,lower asset remarketing income and residual realization, including $35.3 million of gains in 2020 from a a transaction at RRPF involving the refinancing and sale of a group of aircraft spare engines. Operating results wereengines, and lower primarily due to higher depreciation and bad debt expense.income from operations at RRPF.
Comparison of the Third Quarter of 20202021 to the Third Quarter of 20192020
Segment Profit
In the third quarter of 2020,2021, segment profit was $44.3$6.2 million, compared to $10.7$44.3 million for the same period in the prior year period. The increaseyear. Lower segment profit reflects higher earningslower financial results at the RRPF affiliates, primarily driven by higherlower net disposition gains, as well as an improved contributionpartially offset by earnings from the Specialized Gas Vessels.GEL, our direct investment in aircraft spare engines.
Revenues
In the third quarter of 2020,2021, lease revenue increased $8.1 million, due to GEL's new investment in aircraft spare engines on lease in the current year. Marine operating revenue was comparable to the same period in 2019. Marine operating revenue increased $3.1 million, due to higher utilization and increased charter rates from the Specialized Gas Vessels and the transition to the new commercial manager in the prior year.
Expenses
In the third quarter of 2020,2021, marine operating expense was comparable to the prior year. Depreciation expense increased $0.2$3.6 million, due to higher operating expenses for the Specialized Gas Vessels.investment in new aircraft spare engines in the current year at GEL.
Other Income (Expense)
In the third quarter of 2020,2021, income from our share of affiliates' earnings increased $31.0decreased $42.8 million, driven by higher net disposition gains,lower asset remarketing income and residual realization, including $32.1 million of gains in 2020 from a transaction at RRPF involving the refinancing and sale of a group of aircraft spare engines. Operating results wereengines, and lower primarily due to higher depreciation and bad debt expense.income from operations at RRPF.
OTHER
Other comprises Trifleet operations, as well as selling, general and administrative expenses ("SG&A"), unallocated interest expense, and miscellaneous income and expense not directly associated with the reporting segments and certain eliminations.
On December 29, 2020, GATX acquired Trifleet, one of the largest tank container lessors in the world. Financial results for this business are reported in the Other segment. See "Note 3. Business Combinations" in Part I, Item 1 of this Form 10-Q for additional information.
The following table shows components of Other (in millions):
| | | Three Months Ended
September 30 | | Nine Months Ended
September 30 | | | Three Months Ended
September 30 | | Nine Months Ended
September 30 | |
| | 2020 | | 2019 | | 2020 | | 2019 | | | 2021 | | 2020 | | 2021 | | 2020 | |
| Other segment profit | | Other segment profit | $ | 3.0 | | | $ | — | | | $ | 6.3 | | | $ | — | | |
| Selling, general and administrative expense | Selling, general and administrative expense | $ | 42.0 | | | $ | 42.6 | | | $ | 125.8 | | | $ | 129.6 | | | Selling, general and administrative expense | 45.9 | | | 42.0 | | | 140.8 | | | 125.8 | | |
| Unallocated interest (income) expense | Unallocated interest (income) expense | (2.2) | | | (1.4) | | | (5.1) | | | (4.6) | | | Unallocated interest (income) expense | 0.2 | | | (2.2) | | | 0.6 | | | (5.1) | | |
| Other expense (income), including eliminations | Other expense (income), including eliminations | 0.6 | | | 0.6 | | | 3.3 | | | 1.2 | | | Other expense (income), including eliminations | 1.1 | | | 0.6 | | | 9.0 | | | 3.3 | | |
Trifleet Summary
The tank container market continued to improve in the third quarter of 2021. Trifleet experienced increased demand and utilization during the quarter.
Trifleet Tank Container Data
At September 30, 2021, Trifleet's owned and managed fleet consisted of approximately 19,700 tank containers compared to 19,200 at the end of the prior quarter. Fleet utilization was 87.5% at September 30, 2021 compared to 84.9% at the end of the prior quarter.
Utilization is calculated as the number of tank containers on lease as a percentage of total tank containers in the fleet.
The following table shows fleet statistics for Trifleet's tank containers for the quarter ended:
| | | | | | | | | | | | | | | | | |
| March 31 2021 | | June 30
2021 | | September 30
2021 |
| Ending balance - owned and managed | 19,179 | | | 19,185 | | | 19,703 | |
| Utilization rate at quarter-end - owned and managed | 80.0 | % | | 84.9 | % | | 87.5 | % |
SG&A, Unallocated Interest and Other
SG&A decreased $3.8increased $15.0 million for the first nine months of 20202021 compared to the same period in the prior year. The decreaseincrease was largely due to higher employee compensation expenses, largely due to higher share-based compensation expenses resulting from an increase in the GATX stock price during the current year, and the inclusion of Trifleet SG&A expenses in the current year, partially offset by lower discretionary expenses as a result of COVID-19, as well as lower employee compensationtravel and entertainment expenses.
SG&A decreased $0.6increased $3.9 million for the third quarter of 20202021 compared to the same period in the prior year. The decreaseincrease was largely due to lower discretionarythe inclusion of Trifleet SG&A expenses as a result of COVID-19, as well as lowerin the current year and higher employee compensation expenses.
Unallocated interest expense (the difference between external interest expense and interest expense allocated to the reporting segments) in any year is affected by our consolidated leverage position, the timing of debt issuances and investing activities, and intercompany allocations.
Other expense (income), including eliminations increased $2.1$5.7 million for the first nine months of 20202021 compared to the same period in the prior year. The increase was primarily due to higheryear, driven by debt extinguishment costs resulting from the early redemption of debt, partially offset by lower non-service pension expense in the current year.expense.
Other expense (income), including eliminations increased $0.5 million for the third quarter of 2020 was comparable2021 compared to the same period in the prior year, as higher non-service pension expense was offsetdriven by the positivenegative impact of foreign exchange rates on a foreign pension plan.plan, partially offset by lower non-service pension expense in the current year.
Consolidated Income Taxes
See "Note 10. Income Taxes" in Part I, Item 1 of this Form 10-Q.
DISCONTINUED OPERATIONS
On May 14, 2020, we completed the sale of our ASC business, subject to customary post-closing adjustments. As a result, ASC is now reported as discontinued operations, and financial data for the ASC segment has been segregated and presented as discontinued operations for all periods presented. See "Note 16. Discontinued Operations" in Part I, Item 1 of this Form 10-Q for additional information. The ASC business comprises the entirety of GATX's discontinued operations.
The following table shows the components of discontinued operations, net of taxes (in millions):
| | | Three Months Ended
September 30 | | Nine Months Ended
September 30 | | Three Months Ended
September 30 | | Nine Months Ended
September 30 |
| | 2020 | | 2019 | | 2020 | | 2019 | | 2021 | | 2020 | | 2021 | | 2020 |
| Discontinued operations, net of taxes | Discontinued operations, net of taxes | | | | | | | | Discontinued operations, net of taxes | | | | | | | |
| Net income (loss) from discontinued operations, net of taxes | $ | — | | | 7.9 | | | $ | (2.2) | | | 15.9 | | |
| Loss from discontinued operations, net of taxes | | Loss from discontinued operations, net of taxes | $ | — | | | $ | — | | | $ | — | | | $ | (2.2) | |
| (Loss) gain on sale of discontinued operations, net of taxes | (Loss) gain on sale of discontinued operations, net of taxes | (0.3) | | | — | | | 3.3 | | | — | | (Loss) gain on sale of discontinued operations, net of taxes | — | | | (0.3) | | | — | | | 3.3 | |
| Discontinued operations, net of taxes | Discontinued operations, net of taxes | $ | (0.3) | | | $ | 7.9 | | | $ | 1.1 | | | $ | 15.9 | | Discontinued operations, net of taxes | $ | — | | | $ | (0.3) | | | $ | — | | | $ | 1.1 | |
In the first nine months of 2020, net loss from discontinued operations, net of taxes, was $2.2 million, compared to net income of $15.9 million for the same period in the prior year. As a result of the sale there were no operations during the third quarter of the current year, compared to net income of $7.9 million for the same period in the prior year. Both variances were driven by lower volume, primarily resulting from the impacts of COVID-19, as well as the timing of the sale of the ASC business in the second quarter of 2020.2020, there were no operations in the current year.
We recognized a gain of $3.6 million net of taxes, during the second quarter of 2020 in connection with this sale. In the third quarter of 2020, we recognized a loss of $0.3 million, net of taxes, attributable to final post-closing adjustments and expenses related to the sale.
CASH FLOW AND LIQUIDITY
We generate a significant amount of cash from operating activities and investment portfolio proceeds. We also access domestic and international capital markets by issuing unsecured or secured debt and commercial paper. We use these resources, along with available cash balances, to fulfill our debt, lease, and dividend obligations, to support our share repurchase programs, and to fund portfolio investments and capital additions. We primarily use cash from operations to fund daily operations. The timing of asset dispositions and changes in working capital impact cash flows from portfolio proceeds and operations. As a result, these cash flow components may vary materially from quarter to quarter and year to year.
While COVID-19 has negatively impacted all of our business segments, the impact on our financial results for the three and nine months ended September 30, 2020 was not significant. We expect COVID-19 will continue to have negative impacts on our operating and financial results in future periods, the magnitude and duration of which are still uncertain. We also expect COVID-19 to have an ongoing negative impact on our customers, including their ability to make their lease payments timely, as well as their willingness to renew existing leases or enter into new lease contracts. During the year, we have received specific requests from customers for relief through deferral of lease payments, lease rate reductions, and new car order postponement. While we have granted certain requests, the impact on our financial results was limited. However, this places increasing pressure on our cash flow and liquidity. We have a strong liquidity position, solid balance sheet, and access to capital that we expect will enable GATX to effectively manage through the COVID-19 pandemic. As of September 30, 2020,2021, we had an unrestricted cash balance of $459.8$566.0 million. We also have a $250 million 3-year unsecured revolving credit facility in the U.S. that matures in 20222024 and a $600 million, 5-year unsecured credit facility in the U.S. that matures in 2024,2026, both of which are fully available as of September 30, 2020. In addition, we have no outstanding debt maturities due until June 2021.
The following table shows our principal sources and uses of cash from continuing operations for the nine months ended September 30 (in millions):
| | | | | | | | | | | | | |
| 2020 | | 2019 | | |
| Principal sources of cash | | | | | |
| Net cash provided by operating activities | $ | 302.1 | | | $ | 278.2 | | | |
| | | | | |
| Portfolio proceeds | 120.2 | | | 185.6 | | | |
| Other asset sales | 17.5 | | | 18.9 | | | |
| | | | | |
| Proceeds from issuance of debt, commercial paper, and credit facilities | 1,465.8 | | | 551.7 | | | |
| Total | $ | 1,905.6 | | | $ | 1,034.4 | | | |
| | | | | |
| Principal uses of cash | | | | | |
| Portfolio investments and capital additions | $ | (641.4) | | | $ | (503.8) | | | |
| Repayments of debt, commercial paper, and credit facilities | (1,103.1) | | | (410.0) | | | |
| Purchases of assets previously leased | — | | | (1.0) | | | |
| Payments on finance lease obligations | (40.0) | | | — | | | |
| Stock repurchases | — | | | (129.0) | | | |
| Dividends | (53.7) | | | (52.8) | | | |
| Total | $ | (1,838.2) | | | $ | (1,096.6) | | | |
Additionally, net cash from discontinued operations, including proceeds from the sale of ASC, for the first nine months of 2020 was $254.2 million, compared to zero in the same period in the prior year. | | | | | | | | | | | | | |
| 2021 | | 2020 | | |
| Principal sources of cash | | | | | |
| Net cash provided by operating activities | $ | 340.0 | | | $ | 302.1 | | | |
| | | | | |
| Portfolio proceeds | 159.0 | | | 120.2 | | | |
| Other asset sales | 43.7 | | | 17.5 | | | |
| | | | | |
| Proceeds from issuance of debt, commercial paper, and credit facilities | 1,319.1 | | | 1,465.8 | | | |
| Total | $ | 1,861.8 | | | $ | 1,905.6 | | | |
| | | | | |
| Principal uses of cash | | | | | |
| Portfolio investments and capital additions | $ | (893.2) | | | $ | (641.4) | | | |
| Repayments of debt, commercial paper, and credit facilities | (585.9) | | | (1,103.1) | | | |
| | | | | |
| Purchases of assets previously leased - financing activities | (77.2) | | | (40.0) | | | |
| Stock repurchases | (0.4) | | | — | | | |
| Dividends | (56.2) | | | (53.7) | | | |
| Total | $ | (1,612.9) | | | $ | (1,838.2) | | | |
Net Cash Provided by Operating Activities
Net cash provided by operating activities for the first nine months of 20202021 was $302.1$340.0 million, an increase of $23.9$37.9 million compared to the same period in 2019.2020. Comparability among reporting periods is impacted by the timing of changes in working capital items. Specifically, lower cash payments for employee compensation costs, SG&A expenses,operating leases and other operating expensesincome taxes were partially offset by higher payments for interest expense and income taxes.other operating expenses.
Portfolio Proceeds
Portfolio proceeds primarily consist of proceeds from sales of operating assets and finance lease receipts, as well as capital distributions from affiliates. Portfolio proceeds of $120.2$159.0 million for the first nine months of 2020 decreased2021 increased by $65.4$38.8 million from the prior year, primarily due to lowerhigher proceeds from railcar and locomotive sales at Rail North America.
Proceeds From Issuance of Debt
Proceeds from the issuance of debt for the first nine months ended September 30, 20202021 were $1,465.8$1,319.1 million (net of hedges and debt issuance costs). In the first nine months of 2020,2021, we issued a $500$400 million of 10-year unsecured note with a 4.00% interest rate indebt, $550 million of 30-year unsecured debt, and drew $384 million from our 3-year unsecured delayed draw bank term loan. Of the U.S. We also entered into a €100$384 million 5-year bilateraloriginally drawn on the delayed draw term loan, with a 1.00% interest rate and a €100$134 million 5-year unsecured bank term loan with a 1.13% interest rate, both in Europe. In addition, we entered into a $500 million, 364-day, floating rate term loan and drew the full $250 million on our 3-year credit facility, both of which werewas subsequently repaid.
Portfolio Investments and Capital Additions
Portfolio investments and capital additions primarily consist of purchases of operating assets and capitalized asset improvements. Portfolio investments and capital additions of $641.4$893.2 million for the first nine months of 20202021 increased $137.6$251.8 million compared to 2019,2020, primarily due to morethe acquisition of 14 aircraft spare engines at GEL and tank containers at Trifleet, partially offset by fewer railcars acquired at Rail North America.America and Rail International.
Repayments of Debt
Debt repayments of $1,103.1$585.9 million for the first nine months of 20202021 were $693.1$517.2 million higherlower than prior year. Repayments in the current year consisted of $350 million of scheduled maturity payments, the prepayment of our $500 million, 364-day, floating rate term loan and the repayment of the $250 million drawn on our 3-year credit facility.
Discontinued Operations
Proceeds from the sale of ASC were $257.2 million forIn the first nine months of 2020. The proceeds from this sale were used2021, repayments included the $150 million early redemption of our 5.625% Senior Notes due 2066, $300 million redemption of Senior Notes, and $134 million pay-down on the 3-year delayed draw bank term loan.
Purchases of Assets Previously Leased
In the nine months ended September 30, 2021, we exercised options to repayacquire 2,329 railcars previously recorded on the $250balance sheet as a finance lease for $77.2 million, drawncompared to the exercise of options to acquire 732 railcars previously recorded on our 3-year credit facility.the balance sheet as a finance lease for $40.0 million in 2020.
Share Repurchase Program
On January 25, 2019, our board of directors approved a $300.0 million share repurchase program, pursuant to which we are authorized to purchase shares of our common stock in the open market, in privately negotiated transactions, or otherwise, including pursuant to Rule 10b5-1 plans. The share repurchase program does not have an expiration date, does not obligate the Company to repurchase any dollar amount or number of shares of common stock, and may be suspended or discontinued at any time. The timing of repurchases will be dependent on market conditions and other factors. No share repurchases were completed duringDuring the nine months ended September 30, 2020, compared to 1.7 million2021, we repurchased 4,228 shares of common stock for $129.9$0.4 million compared to no share repurchases during the same period in 2019. Actual cash payments in any period consist of those transactions that settled during the current period.2020. As of September 30, 2020, $150.02021, $149.6 million remained available under the repurchase authorization.
Contractual and Other Commercial Commitments
The following table shows our contractual commitments, including debt principal and related interest payments, lease payments, and purchase commitments at September 30, 20202021 (in millions):
| | | Payments Due by Period | | Payments Due by Period |
| | Total | | 2020 (1) | | 2021 | | 2022 | | 2023 | | 2024 | | Thereafter | | Total | | 2021 (1) | | 2022 | | 2023 | | 2024 | | 2025 | | Thereafter |
| Recourse debt | Recourse debt | $ | 5,212.6 | | | $ | — | | | $ | 600.0 | | | $ | 250.0 | | | $ | 250.0 | | | $ | 540.3 | | | $ | 3,572.3 | | Recourse debt | $ | 6,071.6 | | | $ | 300.0 | | | $ | 365.8 | | | $ | 500.0 | | | $ | 537.4 | | | $ | 531.6 | | | $ | 3,836.8 | |
| Interest on recourse debt (2) | Interest on recourse debt (2) | 1,962.2 | | | 48.8 | | | 186.2 | | | 170.6 | | | 159.2 | | | 147.0 | | | 1,250.4 | | Interest on recourse debt (2) | 1,793.5 | | | 49.7 | | | 190.0 | | | 178.2 | | | 163.1 | | | 148.9 | | | 1,063.6 | |
| Commercial paper and credit facilities | Commercial paper and credit facilities | 13.5 | | | 13.5 | | | — | | | — | | | — | | | — | | | — | | Commercial paper and credit facilities | 20.7 | | | 20.7 | | | — | | | — | | | — | | | — | | | — | |
| | Operating lease obligations | Operating lease obligations | 433.9 | | | 8.2 | | | 57.3 | | | 52.4 | | | 50.4 | | | 47.5 | | | 218.1 | | Operating lease obligations | 343.4 | | | 8.5 | | | 42.1 | | | 40.0 | | | 37.9 | | | 35.3 | | | 179.6 | |
| Purchase commitments (3) | Purchase commitments (3) | 1,262.3 | | | 164.6 | | | 455.8 | | | 346.9 | | | 295.0 | | | — | | | — | | Purchase commitments (3) | 1,287.5 | | | 279.0 | | | 655.4 | | | 353.1 | | | — | | | — | | | — | |
| Total | Total | $ | 8,884.5 | | | $ | 235.1 | | | $ | 1,299.3 | | | $ | 819.9 | | | $ | 754.6 | | | $ | 734.8 | | | $ | 5,040.8 | | Total | $ | 9,516.7 | | | $ | 657.9 | | | $ | 1,253.3 | | | $ | 1,071.3 | | | $ | 738.4 | | | $ | 715.8 | | | $ | 5,080.0 | |
__________
(1) For the remainder of the year.
(2) For floating rate debt, future interest payments are based on the applicable interest rate as of September 30, 2020.2021.
(3) Primarily railcar purchase commitments. The amounts shown for all years are based on management's estimates of the timing, anticipated car types, and related costs of railcars to be purchased under its agreements.
In 2014, we entered into a long-term supply agreement with Trinity Rail Group, LLC ("Trinity"), a subsidiary of Trinity Industries. Under the terms of that agreement, we agreed to order 8,950 newly built railcars. As of September 30,December 31, 2020, all 8,950 railcars have been ordered of which 8,749 railcars have beenand delivered. On May 24, 2018, we amended our long-term supply agreement with Trinity to extend the term to December 2023, and we agreed to purchase an additional 4,800 tank cars (1,200 per year) beginning in January 2020 and continuing through the expiration of the extended term. At September 30, 2020, 1,6722021, 2,826 railcars have been ordered, of which 9082,120 railcars have been delivered, pursuant to the amended terms of the agreement.
In 2018, we entered into a multi-year railcar supply agreement with American Railcar Industries, Inc. ("ARI"), pursuant to which we will purchase 7,650 newly built railcars. The order encompasses a mix of tank and freight cars that are to be delivered over a five-year period, beginning in April 2019. ARI's railcar manufacturing business was subsequently acquired by The Greenbrier Companies, Inc. ("Greenbrier") on July 26, 2019, and Greenbrier assumed all of ARI's obligations under our long-term supply agreement. Under this agreement 450 railcars were to be delivered in 2019, with the remaining 7,200 to be delivered ratably over the four-year period of 2020 to 2023. As of September 30, 2020, 3,4732021, 6,141 railcars have been ordered, of which 1,8463,401 have been delivered. The agreement also includes an option to order up to an additional 4,400 railcars subject to certain restrictions.
Short-Term Borrowings
The following table shows additional information regarding our short-term borrowings for the nine months ended September 30, 2020:2021:
| | | | | |
| Europe (1) |
| Balance as of September 30 (in millions) | $ | 13.520.7 | |
| Weighted-average interest rate | 0.9 | % |
| Euro/dollar exchange rate | 1.171.16 | |
| |
| Average daily amount outstanding year to date (in millions) | $ | 17.620.3 | |
| Weighted-average interest rate | 0.80.9 | % |
| Average Euro/dollar exchange rate | 1.121.20 | |
| |
Average daily amount outstanding during 3rdthe third quarter (in millions) | $ | 18.019.5 | |
| Weighted-average interest rate | 0.80.9 | % |
| Average Euro/dollar exchange rate | 1.171.18 | |
| |
| Maximum daily amount outstanding (in millions) | $ | 30.925.9 | |
| Euro/dollar exchange rate | 1.131.19 | |
__________
(1)Short-term borrowings in Europe are composed of borrowings under bank credit facilities.
Credit Lines and Facilities
We haveDuring the second quarter of 2021, we entered into a new $600 million, 5-year unsecured revolving credit facility in the U.S. that matures, expiring in May 2024. This2026. The new credit facility contains two one-year extension options from its then scheduled expiration date.options. This replaced our prior $600 million, 5-year unsecured revolving credit facility, which was terminated upon our entry into the new credit facility. As of September 30, 2020,2021, the full $600 million was available under this facility. Additionally we haveentered into a new $250 million 3-year unsecured revolving credit facility in the U.S. that matures, expiring in May 2022 and2024. This facility also has two one-year extension options from its then scheduled expiration date.options. This replaced our prior $250 million 3-year unsecured revolving credit facility, which was terminated upon our entry into the new credit facility. As of September 30, 2020,2021, the full $250 million was available on this facility.
Our European subsidiaries have unsecured credit facilities with an aggregate limit of €35.0 million. As of September 30, 2020, €23.52021, €17.1 million was available under these credit facilities.
Delayed Draw Term Loan
On December 14, 2020, we executed a delayed draw term loan agreement (“Term Loan���) which provides for a 3-year term loan in the aggregate principal amount of up to $500 million. Advances could have been made from December 14, 2020 through April 17, 2021 pursuant to the terms of the agreement and may not be re-borrowed. The amounts borrowed under the Term Loan agreement are required to be repaid no later than December 14, 2023. In the first quarter of 2021, we drew $384 million on the Term Loan and terminated the remaining unused commitment of $116 million. In the second quarter of 2021, we paid down $134 million of the outstanding amount. As of September 30, 2021, $250 million was drawn on the Term Loan.
Restrictive Covenants
Our $600 million revolving credit facility and $250 million revolving credit facility containcontains various restrictive covenants, including requirements to maintain a fixed charge coverage ratio and an asset coverage test. OurSome of our bank term loans have the same financial covenants as the facilities.facility.
The indentures for our public debt also contain various restrictive covenants, including limitations on liens provisions that restrict the amount of additional secured indebtedness that we may incur. Additionally, certain exceptions to the covenants permit us to incur an unlimited amount of purchase money and nonrecourse indebtedness.
At September 30, 2020,2021, our European rail subsidiaries had outstanding term loan and private placement debt balances totaling €480.0€580.0 million. The loans are guaranteed by GATX Corporation and are subject to similar restrictive covenants as the revolving credit facilitiesfacility noted above.
At September 30, 2020,2021, we were in compliance with all covenants and conditions of all of our credit agreements. We do not anticipate any covenant violations nor do we expect that any of these covenants will restrict our operations or our ability to obtain additional financing.
Credit Ratings
The global capital market environment and outlook may affect our funding options and our financial performance. Our access to capital markets at competitive rates depends on our credit rating and rating outlook, as determined by rating agencies. As of
September 30, 2020,2021, our long-term unsecured debt was rated BBB by Standard & Poor's and Baa2 by Moody’s Investor Service and our short-term unsecured debt was rated A-2 by Standard & Poor's and P-2 by Moody’s Investor Service. Our rating outlook from both agencies was stable.
Leverage
Leverage is expressed as a ratio of debt (including debt and lease obligations, net of unrestricted cash) to equity. The following table shows the components of recourse leverage (in millions, except recourse leverage ratio):
| | | September 30
2020 | | June 30
2020 | | March 31
2020 | | December 31
2019 | | September 30
2019 | | September 30
2021 | | June 30
2021 | | March 31
2021 | | December 31
2020 | | September 30
2020 |
| Debt and lease obligations, net of unrestricted cash: | Debt and lease obligations, net of unrestricted cash: | | | | | | | | | | Debt and lease obligations, net of unrestricted cash: | | | | | | | | | |
| Unrestricted cash | Unrestricted cash | $ | (459.8) | | | $ | (492.9) | | | $ | (570.7) | | | $ | (151.0) | | | $ | (48.6) | | Unrestricted cash | $ | (566.0) | | | $ | (417.9) | | | $ | (958.9) | | | $ | (292.2) | | | $ | (459.8) | |
| Commercial paper and bank credit facilities | Commercial paper and bank credit facilities | 13.5 | | | 5.9 | | | 275.5 | | | 15.8 | | | 112.0 | | Commercial paper and bank credit facilities | 20.7 | | | 17.9 | | | 19.6 | | | 23.6 | | | 13.5 | |
| Recourse debt | Recourse debt | 5,183.0 | | | 5,047.5 | | | 5,043.7 | | | 4,780.4 | | | 4,580.2 | | Recourse debt | 6,029.8 | | | 5,803.1 | | | 6,374.6 | | | 5,329.0 | | | 5,183.0 | |
| | Operating lease obligations | Operating lease obligations | 368.0 | | | 372.3 | | | 399.3 | | | 432.3 | | | 440.3 | | Operating lease obligations | 292.1 | | | 298.7 | | | 328.0 | | | 348.6 | | | 368.0 | |
| Finance lease obligations | Finance lease obligations | — | | | 31.8 | | | — | | | 7.9 | | | — | | Finance lease obligations | — | | | 43.6 | | | — | | | 33.3 | | | — | |
| Total debt and lease obligations, net of unrestricted cash | Total debt and lease obligations, net of unrestricted cash | $ | 5,104.7 | | | $ | 4,964.6 | | | $ | 5,147.8 | | | $ | 5,085.4 | | | $ | 5,083.9 | | Total debt and lease obligations, net of unrestricted cash | $ | 5,776.6 | | | $ | 5,745.4 | | | $ | 5,763.3 | | | $ | 5,442.3 | | | $ | 5,104.7 | |
| | Total recourse debt (1) | Total recourse debt (1) | $ | 5,104.7 | | | $ | 4,964.6 | | | $ | 5,147.8 | | | $ | 5,085.4 | | | $ | 5,083.9 | | Total recourse debt (1) | $ | 5,776.6 | | | $ | 5,745.4 | | | $ | 5,763.3 | | | $ | 5,442.3 | | | $ | 5,104.7 | |
| Shareholders' Equity | Shareholders' Equity | $ | 1,930.0 | | | $ | 1,875.3 | | | $ | 1,831.0 | | | $ | 1,835.1 | | | $ | 1,786.5 | | Shareholders' Equity | $ | 1,976.9 | | | $ | 1,971.4 | | | $ | 1,960.0 | | | $ | 1,957.4 | | | $ | 1,930.0 | |
| Recourse Leverage (2) | Recourse Leverage (2) | 2.6 | | | 2.6 | | | 2.8 | | | 2.8 | | | 2.8 | | Recourse Leverage (2) | 2.9 | | | 2.9 | | | 2.9 | | | 2.8 | | | 2.6 | |
________
(1) Includes recourse debt, commercial paper and bank credit facilities, and operating and finance lease obligations, net of unrestricted cash.
(2) Calculated as total recourse debt / shareholder's equity.
CRITICAL ACCOUNTING POLICIES AND ESTIMATES
There have been no changes to our critical accounting policies during the nine months ended September 30, 2020.2021. Refer to our Annual Report on Form 10-K for the year ended December 31, 2019,2020, for a summary of our policies.
NON-GAAP FINANCIAL MEASURES
In addition to financial results reported in accordance with GAAP, we compute certain financial measures using non-GAAP components, as defined by the SEC. These measures are not in accordance with, or a substitute for, GAAP, and our financial measures may be different from non-GAAP financial measures used by other companies. We have provided a reconciliation of our non-GAAP components to the most directly comparable GAAP components.
Reconciliation of Non-GAAP Components Used in the Computation of Certain Financial Measures
Net Income Measures
We exclude the effects of certain tax adjustments and other items for purposes of presenting net income, diluted earnings per share, and return on equity because we believe these items are not attributable to our business operations. Management utilizes net income, excluding tax adjustments and other items, when analyzing financial performance because such amounts reflect the underlying operating results that are within management’s ability to influence. Accordingly, we believe presenting this information provides investors and other users of our financial statements with meaningful supplemental information for purposes of analyzing year-to-year financial performance on a comparable basis and assessing trends.
The following tables show our net income and diluted earnings per share, excluding tax adjustments and other items (in millions, except per share data):
| | | | | | | | | | | | | | | | | | | | | | | |
| Impact of Tax Adjustments and Other Items on Net Income: | | | | | | | |
| Three Months Ended
September 30 | | Nine Months Ended
September 30 |
| 2021 | | 2020 | | 2021 | | 2020 |
| Net income (GAAP) | $ | 40.1 | | | $ | 47.9 | | | $ | 82.1 | | | $ | 133.5 | |
| Less: Net income from discontinued operations (GAAP) | — | | | (0.3) | | | — | | | 1.1 | |
| Net income from continuing operations (GAAP) | $ | 40.1 | | | $ | 48.2 | | | $ | 82.1 | | | $ | 132.4 | |
| | | | | | | |
| Adjustments attributable to pre-tax income from continuing operations: | | | | | | | |
| Debt extinguishment costs (1) | — | | | — | | | 4.5 | | | — | |
| Total adjustments attributable to pre-tax income from continuing operations | $ | — | | | $ | — | | | $ | 4.5 | | | $ | — | |
| Income taxes thereon, based on applicable effective tax rate | $ | — | | | $ | — | | | $ | (1.1) | | | $ | — | |
| | | | | | | |
| Adjustments attributable to affiliates' earnings, net of taxes: | | | | | | | |
| Income tax rate change (2) | — | | | 12.3 | | | 39.7 | | | 12.3 | |
| Total adjustments attributable to affiliates' earnings, net of taxes | $ | — | | | $ | 12.3 | | | $ | 39.7 | | | $ | 12.3 | |
| Net income from continuing operations, excluding tax adjustments and other items (non-GAAP) | $ | 40.1 | | | $ | 60.5 | | | $ | 125.2 | | | $ | 144.7 | |
| Net income from discontinued operations, excluding tax adjustments and other items (non-GAAP) | — | | | (0.3) | | | — | | | 1.1 | |
| Net income from consolidated operations, excluding tax adjustments and other items (non-GAAP) | $ | 40.1 | | | $ | 60.2 | | | $ | 125.2 | | | $ | 145.8 | |
Impact | | | | | | | | | | | | | | | | | | | | | | | |
| Impact of Tax Adjustments and Other Items on Diluted Earnings per Share: |
| Three Months Ended
September 30 | | Nine Months Ended
September 30 |
| 2021 | | 2020 | | 2021 | | 2020 |
| Diluted earnings per share from consolidated operations (GAAP) | $ | 1.11 | | | $ | 1.35 | | | $ | 2.28 | | | $ | 3.77 | |
| Less: Diluted earnings per share from discontinued operations (GAAP) | — | | | (0.01) | | | — | | | 0.03 | |
| Diluted earnings per share from continuing operations (GAAP) | $ | 1.11 | | | $ | 1.36 | | | $ | 2.28 | | | $ | 3.74 | |
| | | | | | | |
| Adjustments attributable to income from continuing operations, net of taxes: | | |
| Debt extinguishment costs (1) | — | | | — | | | 0.09 | | | — | |
| | | | | | | | |
| Adjustments attributable to affiliates' earnings from continuing operations, net of taxes: | | | | | | | |
| Income tax rate change (2) | — | | | 0.35 | | | 1.10 | | | 0.35 | |
| Diluted earnings per share from continuing operations, excluding tax adjustments and other items (non-GAAP) * | $ | 1.11 | | | $ | 1.71 | | | $ | 3.48 | | | $ | 4.09 | |
| Diluted earnings per share from discontinued operations, excluding tax adjustments and other items (non-GAAP) | — | | | (0.01) | | | — | | | 0.03 | |
| Diluted earnings per share from consolidated operations, excluding tax adjustments and other items (non-GAAP) * | $ | 1.11 | | | $ | 1.70 | | | $ | 3.48 | | | $ | 4.12 | |
*bSum of Tax Adjustments and Other Items on Net Income:
| | | | | | | | | | | | | | | | | | | | | | | |
| Three Months Ended
September 30 | | Nine Months Ended
September 30 |
| 2020 | | 2019 | | 2020 | | 2019 |
| Net income (GAAP) | $ | 47.9 | | | $ | 45.1 | | | $ | 133.5 | | | $ | 154.6 | |
| Less: Net income from discontinued operations (GAAP) | (0.3) | | | 7.9 | | | 1.1 | | | 15.9 | |
| Net income from continuing operations (GAAP) | $ | 48.2 | | | $ | 37.2 | | | $ | 132.4 | | | $ | 138.7 | |
| | | | | | | |
| Other income tax adjustments attributable to income from continuing operations: |
| Income tax rate change (1) | — | | | — | | | — | | | (2.8) | |
| Adjustments attributable to affiliates' earnings, net of taxes: | | | | | | | |
| Income tax rate change (2) | 12.3 | | | — | | | 12.3 | | | — | |
| Net income from continuing operations, excluding tax adjustments and other items (non-GAAP) | $ | 60.5 | | | $ | 37.2 | | | $ | 144.7 | | | $ | 135.9 | |
| Net income from discontinued operations, excluding tax adjustments and other items (non-GAAP) | $ | (0.3) | | | $ | 7.9 | | | $ | 1.1 | | | $ | 15.9 | |
| Net income from consolidated operations, excluding tax adjustments and other items (non-GAAP) | $ | 60.2 | | | $ | 45.1 | | | $ | 145.8 | | | $ | 151.8 | |
Impact of Tax Adjustments and Other Items on Diluted Earnings per Share:
| | | | | | | | | | | | | | | | | | | | | | | |
| Three Months Ended
September 30 | | Nine Months Ended
September 30 |
| 2020 | | 2019 | | 2020 | | 2019 |
| Diluted earnings per share from consolidated operations (GAAP) | $ | 1.35 | | | $ | 1.25 | | | $ | 3.77 | | | $ | 4.22 | |
| Less: Diluted earnings per share from discontinued operations (GAAP) | (0.01) | | | 0.22 | | | 0.03 | | | 0.43 | |
| Diluted earnings per share from continuing operations (GAAP) | $ | 1.36 | | | $ | 1.03 | | | $ | 3.74 | | | $ | 3.79 | |
| | | | | | | |
| Adjustments attributable to income from continuing operations, net of taxes: | | | | | | | |
| Income tax rate change (1) | — | | | — | | | — | | | (0.07) | |
| Adjustments attributable to affiliates' earnings, net of taxes: | | | | | | | |
| Income tax rate change (2) | 0.35 | | | — | | | 0.35 | | | — | |
| Diluted earnings per share from continuing operations, excluding tax adjustments and other items (non-GAAP) | $ | 1.71 | | | $ | 1.03 | | | $ | 4.09 | | | $ | 3.72 | |
| Diluted earnings per share from discontinued operations, excluding tax adjustments and other items (non-GAAP) | $ | (0.01) | | | $ | 0.22 | | | $ | 0.03 | | | $ | 0.43 | |
| Diluted earnings per share from consolidated operations, excluding tax adjustments and other items (non-GAAP) | $ | 1.70 | | | $ | 1.25 | | | $ | 4.12 | | | $ | 4.15 | |
The following table shows our net income and return on equity, excluding tax adjustments and other items, for the trailing 12 months ended September 30 (in millions):
| | | | | | | | | | | |
| 2020 | | 2019 |
| Net income (GAAP) | $ | 190.1 | | | $ | 203.8 | |
| Less: Net income from discontinued operations (GAAP) | 15.6 | | | 25.4 | |
| Net income from continuing operations (GAAP) | $ | 174.5 | | | $ | 178.4 | |
| | | |
| Adjustments attributable to pre-tax income from continuing operations: | | | |
| Costs attributable to the closure of a maintenance facility at Rail International (3) | — | | | 0.9 | |
| Total adjustments attributable to pre-tax income from continuing operations | $ | — | | | $ | 0.9 | |
| Income taxes thereon, based on applicable effective tax rate | $ | — | | | $ | (0.3) | |
| Other income tax adjustments attributable to income from continuing operations: | | | |
| Income tax rate change (1) | — | | | (2.8) | |
| Impact of the Tax Cuts and Jobs Act of 2017 (4) | — | | | (16.7) | |
| Foreign tax credit utilization (5) | — | | | (1.4) | |
| Total other income tax adjustments attributable to income from continuing operations | $ | — | | | $ | (20.9) | |
| Adjustments attributable to affiliates' earnings, net of taxes: | | | |
| Income tax rate change (2) | 12.3 | | | — | |
| Total adjustments attributable to affiliates' earnings, net of taxes | $ | 12.3 | | | $ | — | |
| Net income from continuing operations, excluding tax adjustments and other items (non-GAAP) | $ | 186.8 | | | $ | 158.1 | |
| | | |
| Adjustments attributable to discontinued operations, net of taxes: | | | |
| Net casualty gain at ASC (6) | (8.1) | | | — | |
| Impact of the Tax Cuts and Jobs Act of 2017 (4) | — | | | 0.2 | |
| Total adjustments attributable to discontinued operations, net of taxes | $ | (8.1) | | | $ | 0.2 | |
| Net income from discontinued operations, excluding tax adjustments and other items (non-GAAP) | $ | 7.5 | | | $ | 25.6 | |
| | | |
| Net income from consolidated operations, excluding tax adjustments and other items (non-GAAP) | $ | 194.3 | | | $ | 183.7 | |
| | | |
| Return on Equity (GAAP) | 10.2 | % | | 11.2 | % |
| Return on Equity, excluding tax adjustments and other items (non-GAAP) (7) | 12.7 | % | | 12.3 | % |
| | | | | | | | | | | |
| 2021 | | 2020 |
| Net income (GAAP) | $ | 99.9 | | | $ | 190.1 | |
| Less: Net income from discontinued operations (GAAP) | — | | | 15.6 | |
| Net income from continuing operations (GAAP) | $ | 99.9 | | | $ | 174.5 | |
| | | |
| Adjustments attributable to pre-tax income from continuing operations: | | | |
| Debt extinguishment costs (1) | 4.5 | | | — | |
| Total adjustments attributable to pre-tax income from continuing operations | $ | 4.5 | | | $ | — | |
| Income taxes thereon, based on applicable effective tax rate | $ | (1.1) | | | $ | — | |
| | | |
| Adjustments attributable to affiliates' earnings, net of taxes: | | | |
| Income tax rate changes (2) | 39.7 | | | 12.3 | |
| Total adjustments attributable to affiliates' earnings, net of taxes | $ | 39.7 | | | $ | 12.3 | |
| Net income from continuing operations, excluding tax adjustments and other items (non-GAAP) | $ | 143.0 | | | $ | 186.8 | |
| | | |
| Adjustments attributable to discontinued operations, net of taxes: | | | |
| Net casualty gain at ASC (3) | — | | | (8.1) | |
| Total adjustments attributable to discontinued operations, net of taxes | $ | — | | | $ | (8.1) | |
| Net income from discontinued operations, excluding tax adjustments and other items (non-GAAP) | $ | — | | | $ | 7.5 | |
| | | |
| Net income from consolidated operations, excluding tax adjustments and other items (non-GAAP) | $ | 143.0 | | | $ | 194.3 | |
| | | |
| Return on Equity (GAAP) | 5.1 | % | | 10.2 | % |
| Return on Equity, excluding tax adjustments and other items (non-GAAP) (4) | 8.8 | % | | 12.7 | % |
_______(1) Deferred income tax adjustmentWrite-off of unamortized deferred financing costs associated with the early redemption of our $150 million 5.625% Senior Notes due to a reduction of the corporate income tax rate enacted in Alberta, Canada.2066.
(2) Deferred income tax adjustmentadjustments due to an enacted corporate income tax rate increase in the United Kingdom in 2021 and the elimination of a previously announced corporate income tax rate reduction in the United Kingdom.2020.
(3) Expenses related to the closure of a maintenance facility.
(4) Amount attributable to the impact of corporate income tax changes enacted by the Tax Cuts and Jobs Act of 2017 (the "Tax Act").
(5) Benefits attributable to the utilization of foreign tax credits.
(6) Net casualty gain attributable to insurance recovery for a vessel at ASC.
(7)(4) Shareholders' equity used in this calculation excludes the increases resulting from the impact of the Tax Cuts and Jobs Act as described above.of 2017.
Item 3. Quantitative and Qualitative Disclosures About Market Risk
Since December 31, 2019,2020, there have been no material changes in our interest rate and foreign currency exposures or types of derivative instruments used to hedge these exposures. For a discussion of our exposure to market risk, refer to "Item 7A. Quantitative and Qualitative Disclosure about Market Risk" of our Annual Report on Form 10-K for the year ended December 31, 2019. The capital markets have been impacted by COVID-19, with recent debt transactions, although improving, generally having higher credit spreads than similar transactions in 2019 and earlier in 2020.
Item 4. Controls and Procedures
Our management, with the participation of our Chief Executive Officer and Chief Financial Officer, has conducted an evaluation of our disclosure controls and procedures (as defined in Rules 13a-15(e) and 15d-15(e) of the Securities Exchange Act of 1934 (the "Exchange Act")). Based on such evaluation, our Chief Executive Officer and Chief Financial Officer have concluded that, as of the end of the period covered by this quarterly report, our disclosure controls and procedures were effective.
No changes in our internal control over financial reporting (as defined in Exchange Act Rules 13a-15(f) and 15d-15(f)) occurred during the quarter ended September 30, 2020,2021, that materially affected, or is reasonably likely to materially affect, our internal control over financial reporting.
PART II - OTHER INFORMATION
Item 1. Legal Proceedings
Information concerning litigation and other contingencies is described in "Note 14. Legal Proceedings and Other Contingencies" in Part I, Item 1 of this Form 10-Q and is incorporated herein by reference.
Item 1A. Risk Factors
The global COVID-19 pandemic has had an adverse impact on our businesses and financial performance, and the duration and extent of the pandemic could prolong or increase the adverse impact. We are unable to predict the extent to which the pandemic and measures taken in response to the pandemic will adversely affect our personnel, operations, commercial activity, asset values, financial position or liquidity in the future.
We depend on continued demand from our customers to lease or use our transportation assets and services and on our customers’ ability to pay for leased assets and services. The ongoing COVID-19 pandemic has caused, and is expected to continue to cause, the slowdown of economic activity around the world (including a decrease in demand for a broad variety of goods and services), disruptions in global supply chains, a dramatic reduction in air travel, and significant volatility and disruption of financial markets. As a result, there has been reduced demand for leasing of certain railcar types and for aircraft spare engines, as well as downward pressure on asset utilization, lease rates and renewals, and asset disposition activity across our segments, which adversely affects our financial performance. Prolonged weakness in certain sectors of the global economy may make it difficult for us to lease certain types of our transportation assets that are returned either at lease end or due to customer bankruptcies or defaults. Additionally, there have been a number of requests from certain railcar- and aircraft spare engine-leasing customers for payment deferrals and rate restructurings, and we and our RRPF affiliates have made such accommodations for certain of those customers. Although these lease restructurings primarily provide for delays in the receipt of lease revenues, the pandemic may threaten the solvency of customers in certain industries and lead to an increase in customer bankruptcies. We are facing increased operational challenges from the need to protect employee health and safety, workplace disruptions and restrictions on the movement of people, raw materials and goods. The situation surrounding COVID-19 is fluid and, depending on how long markets remain disrupted, financial and market dynamics and volatility may heighten risks related to our financing activities. Conditions in the financial and credit markets may also limit the availability of funding or increase the cost of funding, which could adversely affect our business, financial position, and results of operations. Because the severity, magnitude, and duration of the COVID-19 pandemic and its economic consequences are uncertain, rapidly changing, and difficult to predict, the pandemic’s impact on our operations, financial performance, and liquidity, as well as its impact on our ability to successfully execute our business strategy, remains uncertain and difficult to predict. Further, the ultimate impact of the COVID-19 pandemic on our operations and financial performance depends on many factors that are not within our control, including, but not limited, to: governmental, business, suppliers', and individuals’ actions that have been and continue to be taken in response to the pandemic; the impact of the pandemic and actions taken in response on global and regional economies, travel, and economic activity; general economic uncertainty in the global markets we serve and volatility in financial markets; global economic conditions and levels of economic growth; and the pace of recovery when the COVID-19 pandemic subsides. As a result, we expect COVID-19 to continue to negatively impact our operating results in future periods. However, we are currently unable to provide any assurance as to the magnitude and duration of any such impact.
We also expect that the COVID-19 pandemic will increase many of the risks described in “Item 1A, Risk Factors” in our Annual Report on Form 10-K for the year endedSince December 31, 2019.
Other than as described in this item,2020, there have been no material changes in our risk factors since December 31, 2019.factors. For a discussion of our risk factors, refer to "Item 1A. Risk Factors" of our Annual Report on Form 10-K for the year ended December 31, 2019.2020.
Item 2. Unregistered Sales of Equity Securities and Use of Proceeds
On January 25, 2019, our board of directors approved a $300.0 million share repurchase program, pursuant to which we are authorized to purchase shares of our common stock in the open market, in privately negotiated transactions, or otherwise, including pursuant to Rule 10b5-1 plans. The share repurchase program does not have an expiration date, does not obligate the Company to repurchase any dollar amount or number of shares of common stock, and may be suspended or discontinued at any time. The timing of share repurchases will be dependent on market conditions and other factors.
No share repurchases were completed during the third quarter of 2020. As of September 30, 2020, $150.02021, $149.6 million remained available under the repurchase authorization.
The following is a summary of common stock repurchases completed by month during the third quarter of 2021:
| | | | | | | | | | | | | | | | | | | | | | | | | | | | | | | | | | | | | | |
| Issuer Purchases of Equity Securities |
| | (a) | | (b) | | (c) | | (d) |
| Period | | Total Number of Shares Purchased | | Average Price Paid per Share | | Total Number of Shares Purchased as Part of Publicly Announced Plans or Programs | | Maximum Number (or Approximate Dollar Value) of Shares that May Yet Be Purchased Under the Plans or Programs (in millions) |
| September 1, 2021 - September 30, 2021 | | 4,228 | | | $ | 84.64 | | | 4,228 | | | $ | 149.6 | |
| Total | | 4,228 | | | $ | 84.64 | | | 4,228 | | | |
Item 6. Exhibits
| | | | | | | | |
Exhibit Number | Exhibit Description |
| Filed with this Report: |
10.1 | |
| 31A | |
| 31B | |
| 32 | |
| 101 | The following materials from GATX Corporation’s Quarterly Report on Form 10-Q for the quarter ended September 30, 2020,2021, are formatted in Inline XBRL (eXtensible Business Reporting Language): (i) Consolidated Balance Sheets at September 30, 20202021 and December 31, 2019,2020, (ii) Consolidated Statements of Comprehensive Income for the three months and nine months ended September 30, 20202021 and 2019,2020, (iii) Consolidated Statements of Cash Flows for the three months and nine months ended September 30, 20202021 and 2019,2020, (iv) Consolidated Statements of Changes in Shareholders' Equity for the three months and nine months ended September 30, 20202021 and 2019,2020, and (v) Notes to the Consolidated Financial Statements. |
| 104 | Cover Page Interactive Data File (embedded within the Inline XBRL document). |
| | |
| Incorporated by Reference: |
| 3.1 | |
| 3.2 | |
Certain instruments evidencing long-term indebtedness of GATX Corporation are not being filed as exhibits to this Report because the total amount of securities authorized under any such instrument does not exceed 10% of GATX Corporation's total assets. GATX Corporation will furnish copies of any such instruments upon request of the Securities and Exchange Commission.
SIGNATURE
Pursuant to the requirements of the Securities Exchange Act of 1934, the registrant has duly caused this report to be signed on its behalf by the undersigned thereunto duly authorized.
| | |
GATX CORPORATION
(Registrant) |
|
| /s/ Thomas A. Ellman |
| Thomas A. Ellman |
| Executive Vice President and Chief Financial Officer |
| (Duly Authorized Officer) |
Date: October 30, 202029, 2021