UNITED STATES
SECURITIES AND EXCHANGE COMMISSION
Washington, D.C. 20549
_______________________________________________________________________________________________________________
FORM 10-Q
(Mark One)
x QUARTERLY REPORT PURSUANT TO SECTION 13 OR 15(d) OF THE SECURITIES EXCHANGE ACT OF 1934
For the quarterly period ended JuneSeptember 30, 2016
OR
o TRANSITION REPORT PURSUANT TO SECTION 13 OR 15(d) OF THE SECURITIES EXCHANGE ACT OF 1934
For the transition period from to
Commission File Number 001-15283
 DineEquity, Inc.
(Exact name of registrant as specified in its charter) |
| | |
Delaware (State or other jurisdiction of incorporation or organization) | | 95-3038279 (I.R.S. Employer Identification No.) |
| | | |
450 North Brand Boulevard, Glendale, California (Address of principal executive offices) | | 91203-1903 (Zip Code) |
(818) 240-6055
(Registrant’s telephone number, including area code)
______________________________________________________________
Indicate by check mark whether the registrant (1) has filed all reports required to be filed by Section 13 or 15(d) of the Securities Exchange Act of 1934 during the preceding 12 months (or for such shorter period that the registrant was required to file such reports), and (2) has been subject to such filing requirements for the past 90 days. Yes x No o
Indicate by check mark whether the registrant has submitted electronically and posted on its corporate Web site, if any, every Interactive Data File required to be submitted and posted pursuant to Rule 405 of Regulation S-T (§232.405 of this chapter) during the preceding 12 months (or for such shorter period that the registrant was required to submit and post such files). Yes x No o
Indicate by check mark whether the registrant is a large accelerated filer, an accelerated filer, a non-accelerated filer, or a smaller reporting company. See definitions of “large accelerated filer,” “accelerated filer,” and “smaller reporting company” in Rule 12b-2 of the Exchange Act. (Check one):
|
| | |
Large accelerated filer x | | Accelerated filer o |
| | | |
Non-accelerated filer o | | Smaller reporting company o |
| (Do not check if a smaller reporting company) | | |
Indicate by check mark whether the registrant is a shell company (as defined in Rule 12b-2 of the Exchange Act). Yes o No x
Indicate the number of shares outstanding of each of the issuer’s classes of common stock, as of the latest practicable date.
|
| | |
| Class | | Outstanding as of July 29,October 28, 2016 |
| Common Stock, $0.01 par value | | 18,212,61118,094,014 |
DineEquity, Inc. and Subsidiaries
Index
Cautionary Statement Regarding Forward-Looking Statements
Statements contained in this report may constitute forward-looking statements within the meaning of the Private Securities Litigation Reform Act of 1995. These statements involve known and unknown risks, uncertainties and other factors, which may cause actual results to be materially different from those expressed or implied in such statements. You can identify these forward-looking statements by words such as “may,” “will,” “should,” “could,” “expect,” “anticipate,” “believe,” “estimate,” “intend,” “plan” and other similar expressions. You should consider our forward-looking statements in light of the risks discussed under the heading “Risk Factors” in our most recent Annual Report on Form 10-K, as well as our consolidated financial statements, related notes, and the other financial information appearing elsewhere in this report and our other filings with the United States Securities and Exchange Commission. The forward-looking statements contained in this report are made as of the date hereof and the Company assumes no obligation to update or supplement any forward-looking statements.
Fiscal Quarter End
The Company’s fiscal quarters end on the Sunday closest to the last day of each calendar quarter. For convenience, unless otherwise specified herein, the fiscal quarters of each year are referred to as ending on March 31, June 30, September 30 and December 31. The first fiscal quarter of 2016 began on January 4, 2016 and ended on April 3, 2016; the second and third fiscal quarterquarters of 2016 ended on July 3, 2016.2016 and October 2, 2016, respectively. The first fiscal quarter of 2015 began on December 29, 2014 and ended on March 29, 2015; the second and third fiscal quarterquarters of 2015 ended on June 28, 2015.2015 and September 27, 2015, respectively.
PART I. FINANCIAL INFORMATION
Item 1. Financial Statements.
DineEquity, Inc. and Subsidiaries
Consolidated Balance Sheets
(In thousands, except share and per share amounts) | | | Assets | | June 30,
2016 | | December 31, 2015 | | September 30,
2016 | | December 31, 2015 |
| | | (Unaudited) | | | | (Unaudited) | | |
| Current assets: | | |
| | |
| | |
| | |
|
| Cash and cash equivalents | | $ | 118,293 |
| | $ | 144,785 |
| | $ | 107,823 |
| | $ | 144,785 |
|
| Receivables, net | | 101,081 |
| | 139,206 |
| | 93,935 |
| | 139,206 |
|
| Restricted cash | | 42,831 |
| | 32,528 |
| | 34,958 |
| | 32,528 |
|
| Prepaid gift card costs | | 36,455 |
| | 46,792 |
| | 36,728 |
| | 46,792 |
|
| Prepaid income taxes | | — |
| | 5,186 |
| | 1,966 |
| | 5,186 |
|
| Other current assets | | 5,637 |
| | 4,212 |
| | 5,036 |
| | 4,212 |
|
| Total current assets | | 304,297 |
| | 372,709 |
| | 280,446 |
| | 372,709 |
|
| Long-term receivables, net | | 150,922 |
| | 160,695 |
| | 145,072 |
| | 160,695 |
|
| Property and equipment, net | | 209,323 |
| | 219,580 |
| | 205,230 |
| | 219,580 |
|
| Goodwill | | 697,470 |
| | 697,470 |
| | 697,470 |
| | 697,470 |
|
| Other intangible assets, net | | 768,096 |
| | 772,949 |
| | 765,773 |
| | 772,949 |
|
| Deferred rent receivable | | 88,802 |
| | 90,030 |
| | 88,034 |
| | 90,030 |
|
| Other non-current assets, net | | 18,358 |
| | 18,417 |
| | 18,396 |
| | 18,417 |
|
| Total assets | | $ | 2,237,268 |
| | $ | 2,331,850 |
| | $ | 2,200,421 |
| | $ | 2,331,850 |
|
| Liabilities and Stockholders’ Equity | | |
| | |
| | |
| | |
|
| Current liabilities: | | |
| | |
| | |
| | |
|
| Accounts payable | | $ | 46,625 |
| | $ | 55,019 |
| | $ | 32,625 |
| | $ | 55,019 |
|
| Gift card liability | | 114,302 |
| | 167,657 |
| | 104,201 |
| | 167,657 |
|
| Accrued employee compensation and benefits | | 14,136 |
| | 25,085 |
| | 15,792 |
| | 25,085 |
|
| Dividends payable | | 16,792 |
| | 17,082 |
| | 16,675 |
| | 17,082 |
|
| Current maturities of capital lease and financing obligations | | 14,559 |
| | 14,320 |
| | 14,346 |
| | 14,320 |
|
| Income taxes payable | | 5,278 |
| | — |
| |
| Accrued advertising | | 5,948 |
| | 8,758 |
| | 11,875 |
| | 8,758 |
|
| Accrued interest payable | | 4,310 |
| | 4,257 |
| | 4,314 |
| | 4,257 |
|
| Other accrued expenses | | 13,725 |
| | 6,251 |
| | 6,565 |
| | 6,251 |
|
| Total current liabilities | | 235,675 |
| | 298,429 |
| | 206,393 |
| | 298,429 |
|
| Long-term debt, net | | 1,281,064 |
| | 1,279,473 |
| | 1,281,873 |
| | 1,279,473 |
|
| Capital lease obligations, less current maturities | | 77,116 |
| | 84,781 |
| | 73,603 |
| | 84,781 |
|
| Financing obligations, less current maturities | | 42,325 |
| | 42,395 |
| | 39,518 |
| | 42,395 |
|
| Deferred income taxes, net | | 254,758 |
| | 269,469 |
| | 252,907 |
| | 269,469 |
|
| Deferred rent payable | | 71,929 |
| | 69,397 |
| | 71,574 |
| | 69,397 |
|
| Other non-current liabilities | | 18,235 |
| | 20,683 |
| | 18,027 |
| | 20,683 |
|
| Total liabilities | | 1,981,102 |
| | 2,064,627 |
| | 1,943,895 |
| | 2,064,627 |
|
| Commitments and contingencies | |
|
| |
|
| |
|
| |
|
|
| Stockholders’ equity: | | |
| | |
| | |
| | |
|
| Common stock, $0.01 par value, shares: 40,000,000 authorized; June 30, 2016 - 25,153,608 issued, 18,218,872 outstanding; December 31, 2015 - 25,186,048 issued, 18,535,027 outstanding | | 252 |
| | 252 |
| |
| Common stock, $0.01 par value, shares: 40,000,000 authorized; September 30, 2016 - 25,138,172 issued, 18,092,139 outstanding; December 31, 2015 - 25,186,048 issued, 18,535,027 outstanding | | | 251 |
| | 252 |
|
| Additional paid-in-capital | | 288,279 |
| | 286,952 |
| | 290,365 |
| | 286,952 |
|
| Retained earnings | | 370,546 |
| | 351,923 |
| | 378,172 |
| | 351,923 |
|
| Accumulated other comprehensive loss | | (106 | ) | | (107 | ) | | (107 | ) | | (107 | ) |
| Treasury stock, at cost; shares: June 30, 2016 - 6,934,736; December 31, 2015 - 6,651,021 | | (402,805 | ) | | (371,797 | ) | |
| Treasury stock, at cost; shares: September 30, 2016 - 7,046,033; December 31, 2015 - 6,651,021 | | | (412,155 | ) | | (371,797 | ) |
| Total stockholders’ equity | | 256,166 |
| | 267,223 |
| | 256,526 |
| | 267,223 |
|
| Total liabilities and stockholders’ equity | | $ | 2,237,268 |
| | $ | 2,331,850 |
| | $ | 2,200,421 |
| | $ | 2,331,850 |
|
See the accompanying Notes to Consolidated Financial Statements.
DineEquity, Inc. and Subsidiaries
Consolidated Statements of Comprehensive Income
(In thousands, except per share amounts)
(Unaudited)
| | | | | Three Months Ended | | Six Months Ended | | Three Months Ended | | Nine Months Ended |
| | | June 30, | | June 30, | | September 30, | | September 30, |
| | | 2016 | | 2015 | | 2016 | | 2015 | | 2016 | | 2015 | | 2016 | | 2015 |
| Revenues: | | |
| | |
| | | | | | |
| | |
| | | | |
| Franchise and restaurant revenues | | $ | 126,989 |
| | $ | 137,768 |
| | $ | 256,775 |
| | $ | 279,586 |
| | $ | 123,259 |
| | $ | 128,188 |
| | $ | 380,034 |
| | $ | 407,774 |
|
| Rental revenues | | 30,830 |
| | 31,132 |
| | 62,239 |
| | 62,534 |
| | 30,507 |
| | 31,221 |
| | 92,746 |
| | 93,755 |
|
| Financing revenues | | 2,439 |
| | 2,649 |
| | 4,768 |
| | 5,243 |
| | 2,251 |
| | 3,028 |
| | 7,019 |
| | 8,271 |
|
| Total revenues | | 160,258 |
| | 171,549 |
| | 323,782 |
| | 347,363 |
| | 156,017 |
| | 162,437 |
| | 479,799 |
| | 509,800 |
|
| Cost of revenues: | | |
| | |
| | | | | | |
| | |
| | | | |
| Franchise and restaurant expenses | | 39,707 |
| | 51,423 |
| | 80,576 |
| | 103,449 |
| | 41,553 |
| | 41,984 |
| | 122,129 |
| | 145,433 |
|
| Rental expenses | | 23,030 |
| | 23,319 |
| | 46,261 |
| | 46,809 |
| | 22,771 |
| | 23,264 |
| | 69,032 |
| | 70,073 |
|
| Financing expenses | | 146 |
| | — |
| | 146 |
| | 12 |
| | 9 |
| | 504 |
| | 155 |
| | 516 |
|
| Total cost of revenues | | 62,883 |
| | 74,742 |
| | 126,983 |
| | 150,270 |
| | 64,333 |
| | 65,752 |
| | 191,316 |
| | 216,022 |
|
| Gross profit | | 97,375 |
| | 96,807 |
| | 196,799 |
| | 197,093 |
| | 91,684 |
| | 96,685 |
| | 288,483 |
| | 293,778 |
|
| General and administrative expenses | | 36,511 |
| | 34,577 |
| | 75,935 |
| | 68,807 |
| | 36,002 |
| | 41,577 |
| | 111,937 |
| | 110,384 |
|
| Interest expense | | 15,383 |
| | 15,677 |
| | 30,749 |
| | 31,323 |
| | 15,358 |
| | 15,434 |
| | 46,107 |
| | 46,757 |
|
| Amortization of intangible assets | | 2,500 |
| | 2,500 |
| | 4,980 |
| | 5,000 |
| | 2,500 |
| | 2,500 |
| | 7,480 |
| | 7,500 |
|
| Closure and impairment charges, net | | 3,291 |
| | 475 |
| | 3,726 |
| | 2,302 |
| | 206 |
| | (72 | ) | | 3,932 |
| | 2,230 |
|
| (Gain) loss on disposition of assets | | (48 | ) | | 66 |
| | 566 |
| | 57 |
| |
| Loss (gain) on disposition of assets | | | 113 |
| | (2,351 | ) | | 679 |
| | (2,294 | ) |
| Income before income tax provision | | 39,738 |
| | 43,512 |
| | 80,843 |
| | 89,604 |
| | 37,505 |
| | 39,597 |
| | 118,348 |
| | 129,201 |
|
| Income tax provision | | (12,909 | ) | | (16,615 | ) | | (28,471 | ) | | (34,295 | ) | | (13,232 | ) | | (15,340 | ) | | (41,703 | ) | | (49,635 | ) |
| Net income | | 26,829 |
| | 26,897 |
| | 52,372 |
| | 55,309 |
| | 24,273 |
| | 24,257 |
| | 76,645 |
| | 79,566 |
|
| Other comprehensive income (loss), net of tax: | | | | | | | | | | | | | | | | |
| Foreign currency translation adjustment | | — |
| | 3 |
| | 1 |
| | (12 | ) | | (1 | ) | | (14 | ) | | — |
| | (26 | ) |
| Total comprehensive income | | $ | 26,829 |
| | $ | 26,900 |
| | $ | 52,373 |
| | $ | 55,297 |
| | $ | 24,272 |
| | $ | 24,243 |
| | $ | 76,645 |
| | $ | 79,540 |
|
| Net income available to common stockholders: | | | | |
| | | | | | | | |
| | | | |
| Net income | | $ | 26,829 |
| | $ | 26,897 |
| | $ | 52,372 |
| | $ | 55,309 |
| | $ | 24,273 |
| | $ | 24,257 |
| | $ | 76,645 |
| | $ | 79,566 |
|
| Less: Net income allocated to unvested participating restricted stock | | (384 | ) | | (359 | ) | | (766 | ) | | (726 | ) | | (338 | ) | | (316 | ) | | (1,103 | ) | | (1,042 | ) |
| Net income available to common stockholders | | $ | 26,445 |
| | $ | 26,538 |
| | $ | 51,606 |
| | $ | 54,583 |
| | $ | 23,935 |
| | $ | 23,941 |
| | $ | 75,542 |
| | $ | 78,524 |
|
| Net income available to common stockholders per share: | | |
| | |
| | | | | | |
| | |
| | | | |
| Basic | | $ | 1.46 |
| | $ | 1.41 |
| | $ | 2.84 |
| | $ | 2.90 |
| | $ | 1.33 |
| | $ | 1.29 |
| | $ | 4.17 |
| | $ | 4.19 |
|
| Diluted | | $ | 1.45 |
| | $ | 1.40 |
| | $ | 2.82 |
| | $ | 2.88 |
| | $ | 1.33 |
| | $ | 1.28 |
| | $ | 4.15 |
| | $ | 4.16 |
|
| Weighted average shares outstanding: | | |
| | |
| | | | | | |
| | |
| | | | |
| Basic | | 18,085 |
| | 18,763 |
| | 18,173 |
| | 18,819 |
| | 17,950 |
| | 18,573 |
| | 18,099 |
| | 18,737 |
|
| Diluted | | 18,188 |
| | 18,895 |
| | 18,280 |
| | 18,959 |
| | 18,041 |
| | 18,706 |
| | 18,201 |
| | 18,874 |
|
| | | | | | | | | | | | | | | | | |
| Dividends declared per common share | | $ | 0.92 |
| | $ | 0.875 |
| | $ | 1.84 |
| | $ | 1.75 |
| | $ | 0.92 |
| | $ | 0.875 |
| | $ | 2.76 |
| | $ | 2.625 |
|
| Dividends paid per common share | | $ | 0.92 |
| | $ | 0.875 |
| | $ | 1.84 |
| | $ | 1.75 |
| | $ | 0.92 |
| | $ | 0.875 |
| | $ | 2.76 |
| | $ | 2.625 |
|
See the accompanying Notes to Consolidated Financial Statements.
DineEquity, Inc. and Subsidiaries
Consolidated Statements of Cash Flows
(In thousands)
| | | | | Six Months Ended | | Nine Months Ended |
| | | June 30, | | September 30, |
| | | 2016 | | 2015 | | 2016 | | 2015 |
| Cash flows from operating activities: | | |
| | |
| | |
| | |
|
| Net income | | $ | 52,372 |
| | $ | 55,309 |
| | $ | 76,645 |
| | $ | 79,566 |
|
| Adjustments to reconcile net income to cash flows provided by operating activities: | | |
| | |
| | |
| | |
|
| Depreciation and amortization | | 15,554 |
| | 15,855 |
| | 22,924 |
| | 24,134 |
|
| Non-cash interest expense | | 1,591 |
| | 1,519 |
| | 2,400 |
| | 2,292 |
|
| Deferred income taxes | | (11,896 | ) | | (12,612 | ) | | (14,852 | ) | | (12,512 | ) |
| Non-cash stock-based compensation expense | | 5,647 |
| | 4,593 |
| | 8,215 |
| | 6,312 |
|
| Tax benefit from stock-based compensation | | 1,169 |
| | 4,688 |
| | 1,153 |
| | 4,850 |
|
| Excess tax benefit from stock-based compensation | | (865 | ) | | (4,572 | ) | | (966 | ) | | (4,577 | ) |
| Closure and impairment charges | | 1,249 |
| | 2,302 |
| | 1,461 |
| | 2,230 |
|
| Loss on disposition of assets | | 566 |
| | 57 |
| |
| Loss (gain) on disposition of assets | | | 679 |
| | (2,294 | ) |
| Other | | 416 |
| | (1,534 | ) | | 456 |
| | (1,303 | ) |
| Changes in operating assets and liabilities: | | |
| | |
| | |
| | |
|
| Accounts receivable, net | | 880 |
| | (11,249 | ) | | 4,312 |
| | (95 | ) |
| Current income tax receivables and payables | | 5,291 |
| | 5,561 |
| | (1,138 | ) | | 5,703 |
|
| Gift card receivables and payables | | (18,311 | ) | | (3,256 | ) | | (30,355 | ) | | (11,816 | ) |
| Other current assets | | (1,424 | ) | | (2,299 | ) | | (824 | ) | | (3,304 | ) |
| Accounts payable | | 8,544 |
| | 6,024 |
| | (1,397 | ) | | 2,147 |
|
| Accrued employee compensation and benefits | | (10,949 | ) | | (10,790 | ) | | (9,293 | ) | | (4,915 | ) |
| Accrued interest payable | | 53 |
| | (10,240 | ) | | 57 |
| | (10,275 | ) |
| Other current liabilities | | 4,024 |
| | 8,767 |
| | 2,581 |
| | (5,554 | ) |
| Cash flows provided by operating activities | | 53,911 |
| | 48,123 |
| | 62,058 |
| | 70,589 |
|
| Cash flows from investing activities: | | |
| | |
| | |
| | |
|
| Additions to property and equipment | | (1,931 | ) | | (4,612 | ) | | (3,543 | ) | | (5,765 | ) |
| Proceeds from sale of property and equipment | | — |
| | 800 |
| | — |
| | 10,782 |
|
| Principal receipts from notes, equipment contracts and other long-term receivables | | 8,658 |
| | 9,517 |
| | 13,969 |
| | 16,498 |
|
| Other | | (250 | ) | | (110 | ) | | (393 | ) | | (274 | ) |
| Cash flows provided by investing activities | | 6,477 |
| | 5,595 |
| | 10,033 |
| | 21,241 |
|
| Cash flows from financing activities: | | | | |
| | | | |
|
| Principal payments on capital lease and financing obligations | | (6,853 | ) | | (5,975 | ) | | (10,391 | ) | | (9,711 | ) |
| Dividends paid on common stock | | | (50,790 | ) | | (49,786 | ) |
| Repurchase of common stock | | (35,008 | ) | | (35,007 | ) | | (45,010 | ) | | (50,010 | ) |
| Dividends paid on common stock | | (34,029 | ) | | (33,271 | ) | |
| Tax payments for restricted stock upon vesting | | (2,432 | ) | | (3,010 | ) | | (2,680 | ) | | (3,389 | ) |
| Proceeds from stock options exercised | | 880 |
| | 8,374 |
| | 1,282 |
| | 8,426 |
|
| Excess tax benefit from stock-based compensation | | 865 |
| | 4,572 |
| | 966 |
| | 4,577 |
|
| Change in restricted cash | | (10,303 | ) | | 11,007 |
| | (2,430 | ) | | 10,036 |
|
| Other | | — |
| | (29 | ) | | — |
| | (91 | ) |
| Cash flows used in financing activities | | (86,880 | ) | | (53,339 | ) | | (109,053 | ) | | (89,948 | ) |
| Net change in cash and cash equivalents | | (26,492 | ) | | 379 |
| | (36,962 | ) | | 1,882 |
|
| Cash and cash equivalents at beginning of period | | 144,785 |
| | 104,004 |
| | 144,785 |
| | 104,004 |
|
| Cash and cash equivalents at end of period | | $ | 118,293 |
| | $ | 104,383 |
| | $ | 107,823 |
| | $ | 105,886 |
|
| Supplemental disclosures: | | |
| | |
| | |
| | |
|
| Interest paid in cash | | $ | 34,747 |
| | $ | 46,419 |
| | $ | 51,940 |
| | $ | 64,094 |
|
| Income taxes paid in cash | | $ | 33,980 |
| | $ | 36,968 |
| | $ | 56,734 |
| | $ | 51,794 |
|
See the accompanying Notes to Consolidated Financial Statements.
DineEquity, Inc. and Subsidiaries
Notes to Consolidated Financial Statements
(Unaudited)
1. General
The accompanying unaudited consolidated financial statements of DineEquity, Inc. (the “Company” or “DineEquity”) have been prepared in accordance with United States generally accepted accounting principles (“U.S. GAAP”) for interim financial information and with the instructions to Form 10-Q and Article 10 of Regulation S-X. Accordingly, they do not include all of the information and footnotes required by U.S. GAAP for complete financial statements. In the opinion of management, all adjustments (consisting of normal recurring accruals) considered necessary for a fair presentation have been included. The operating results for the sixnine months ended JuneSeptember 30, 2016 are not necessarily indicative of the results that may be expected for the twelve months ending December 31, 2016.
The consolidated balance sheet at December 31, 2015 has been derived from the audited consolidated financial statements at that date, but does not include all of the information and footnotes required by U.S. GAAP for complete financial statements.
These consolidated financial statements should be read in conjunction with the consolidated financial statements and footnotes thereto included in the Company’s Annual Report on Form 10-K for the year ended December 31, 2015.
2. Basis of Presentation
The Company’s fiscal quarters end on the Sunday closest to the last day of each calendar quarter. For convenience, the fiscal quarters of each year are referred to as ending on March 31, June 30, September 30 and December 31. The first fiscal quarter of 2016 began on January 4, 2016 and ended on April 3, 2016; the second and third fiscal quarterquarters of 2016 ended on July 3, 2016.2016 and October 2, 2016, respectively. The first fiscal quarter of 2015 began on December 29, 2014 and ended on March 29, 2015; the second and third fiscal quarterquarters of 2015 ended on June 28, 2015.2015 and September 27, 2015, respectively.
The accompanying consolidated financial statements include the accounts of the Company and its subsidiaries that are consolidated in accordance with U.S. GAAP. All intercompany balances and transactions have been eliminated.
The preparation of financial statements in conformity with U.S. GAAP requires the Company’s management to make assumptions and estimates that affect the reported amounts of assets and liabilities, disclosures of contingent assets and liabilities, if any, at the date of the consolidated financial statements, and the reported amounts of revenues and expenses during the reporting period. Significant estimates are made in the calculation and assessment of the following: impairment of tangible assets, goodwill and other intangible assets; income taxes; allowance for doubtful accounts and notes receivables; lease accounting estimates; contingencies; and stock-based compensation. On an ongoing basis, the Company evaluates its estimates based on historical experience, current conditions and various other assumptions that are believed to be reasonable under the circumstances. The Company adjusts such estimates and assumptions when facts and circumstances dictate. Actual results could differ from those estimates.
3. Accounting Policies
Accounting Standards Adopted in the Current Fiscal Year
Various updates to accounting guidance became effective in the Company's first fiscal quarter of 2016. The majority of these updates either did not apply to the Company's operations or will only apply if the activity addressed in the guidance takes place in the future. Adoption of updates that did apply to the Company's operations did not have a material effect on the Company's financial statements.
Newly Issued Accounting Standards Not Yet Adopted
In JuneAugust 2016, the Financial Accounting Standards Board (“FASB”) issued new guidance on the classification of certain cash receipts and payments in the statement of cash flows. The new guidance is intended to reduce diversity in practice in how certain transactions are classified in the statement of cash flows. The Company will be required to adopt the new guidance beginning with its first fiscal quarter of 2018; early adoption is permitted. The Company is currently assessing the impact that the new guidance will have on its consolidated statements of cash flows.
In June 2016, the FASB issued new guidance on the measurement of credit losses on financial instruments. The new guidance will replace the incurred loss methodology of recognizing credit losses on financial instruments that is currently required with a methodology that estimates the expected credit loss on financial instruments and reflects the net amount
DineEquity, Inc. and Subsidiaries
Notes to Consolidated Financial Statements (Continued)
3. Accounting Policies (Continued)
expected to be collected on the financial instrument. Application of the new guidance may result in the earlier recognition of credit losses as the new methodology will require entities to consider forward-looking information in addition to historical and current information used in assessing incurred losses. The Company will be required to adopt the new guidance on a modified retrospective basis beginning with its first fiscal quarter of 2020, with early adoption permitted in its first fiscal quarter of 2019. The Company is currently evaluating the impact of the new guidance on its consolidated financial statements and related disclosures and whether early adoption will be elected.
DineEquity, Inc. and Subsidiaries
Notes to Consolidated Financial Statements (Continued)
3. Accounting Policies (Continued)
In March 2016, the FASB issued new guidance that addresses accounting for certain aspects of share-based payments, including excess tax benefits or deficiencies, forfeiture estimates, statutory tax withholding and cash flow classification of certain share-based payment activity. The Company will be required to adopt the new guidance beginning with its first fiscal quarter of 2017. Early adoption is permitted as long as all amendments addressed in the new guidance are adopted in the same period. The method of adoption varies based on each individual amendment.specific aspect addressed in the new guidance.
The Company believes one impact of the new guidance on its financial statements will be the recording of excess tax benefits or deficiencies in its provision for income taxes upon adoption of the new guidance instead of the current recording in additional paid-in capital (“APIC”).capital. The Company is currently evaluating the impact of other aspects of the new guidance on its consolidated financial statements and disclosures.
In February 2016, the FASB issued new guidance with respect to the accounting for leases. The new guidance will require lessees to recognize a right-of-use asset and a lease liability for virtually all leases, other than leases with a term of 12 months or less, and to provide additional disclosures about leasing arrangements. Accounting by lessors is largely unchanged from existing accounting guidance. The Company will be required to adopt the new guidance on a modified retrospective basis beginning with its first fiscal quarter of 2019. Early adoption is permitted.
While the Company is still in the process of evaluating the impact of the new guidance on its consolidated financial statements and disclosures, the Company expects adoption of the new guidance will have a material impact on its Consolidated Balance Sheets due to recognition of the right-of-use asset and lease liability related to its operating leases. While the new guidance willis also expected to impact the measurement and presentation of elements of expenses and cash flows related to leasing arrangements, the Company does not presently believe there will be a material impact on its Consolidated Statements of Comprehensive Income or Consolidated Statements of Cash Flows.
In May 2014, the FASB issued new accounting guidance on revenue recognition, which provides for a single, five-step model to be applied to all revenue contracts with customers. The new standard also requires additional financial statement disclosures that will enable users to understand the nature, amount, timing and uncertainty of revenue and cash flows relating to customer contracts. Companies have an option to use either a retrospective approach or cumulative effect adjustment approach to implement the standard. In August 2015, the FASB deferred the effective date of the new revenue guidance by one year such that the Company will be required to adopt the new guidance beginning with its first fiscal quarter of 2018. During 2016, the FASB issued three clarifications on specific topics within the new revenue recognition guidance that did not change the core principles of the guidance originally issued in May 2014.
This new guidance supersedes nearly all of the existing general revenue recognition guidance under U.S. GAAP as well as most industry-specific revenue recognition guidance, including guidance with respect to revenue recognition by franchisors. The Company believes the recognition of the majority of its revenues, including franchise royalty revenues, sales of IHOP pancake and waffle dry mix and retail sales at company-operated restaurants, will not materially be affected by the new guidance. Additionally, lease rental revenues and financing interest revenue are not within the scope of the new revenue guidance. The Company is currently evaluating the impact of the new guidance on its consolidated financial statements and related disclosures and which method of adoption will be used.
The Company reviewed all other newly issued accounting pronouncements and concluded that they either are not applicable to the Company or are not expected to have a material effect on the Company's consolidated financial statements as a result of future adoption.
DineEquity, Inc. and Subsidiaries
Notes to Consolidated Financial Statements (Continued)
4. Stockholders' Equity
Dividends
During the sixnine months ended JuneSeptember 30, 2016, the Company paid dividends on common stock of $34.0$50.8 million, representing cash dividends of $0.92 per share declared in the fourth quarter of 2015 and the first quarterand second quarters of 2016. On May 16, 2016, the Company's Board of Directors declared a second quarter 2016 cash dividend of $0.92 per share of common stock. This dividend was paid on July 8, 2016 to the Company's stockholders of record at the close of business on June 17, 2016. The Company reported a payable for this dividend of $16.8 million at June 30, 2016.
DineEquity, Inc. and Subsidiaries
Notes to Consolidated Financial Statements (Continued)
4. Stockholders' Equity (Continued)
On July 28, 2016, the Company's Board of Directors declared a third quarter 2016 cash dividend of $0.92 per share of common stock, payablestock. This dividend was paid on October 7, 2016 to the Company's stockholders of record at the close of business on September 16, 2016. The Company reported a payable for this dividend of $16.7 million at September 30, 2016.
On October 31, 2016, the Company's Board of Directors declared a fourth quarter 2016 cash dividend of $0.97 per share of common stock, payable on January 6, 2017 to stockholders of record at close of business on December 16, 2016.
Stock Repurchase Program
In October 2015, the Company's Board of Directors approved a stock repurchase program authorizing the Company to repurchase up to $150 million of DineEquity common stock (the “2015 Repurchase Program”) on an opportunistic basis from time to time in open market transactions and in privately negotiated transactions based on business, market, applicable legal requirements and other considerations. The 2015 Repurchase Program, as approved by the Board of Directors, does not require the repurchase of a specific number of shares and can be terminated at any time. During the sixnine months ended JuneSeptember 30, 2016, the Company repurchased 395,891525,550 shares of common stock at a cost of $35.0$45.0 million under the 2015 Repurchase Program. As of JuneSeptember 30, 2016, the Company has repurchased a cumulative total of 600,378730,037 shares of common stock under the 2015 Repurchase Program at a total cost of $52.5$62.5 million. As of JuneSeptember 30, 2016, a total of $97.5$87.5 million remains available for additional repurchases under the 2015 Repurchase Program.
Treasury Stock
Repurchases of DineEquity common stock are included in treasury stock at the cost of shares repurchased plus any transaction costs. Treasury stock may be re-issued when stock options are exercised, when restricted stock awards are granted and when restricted stock units settle in stock upon vesting. The cost of treasury stock re-issued is determined using the first-in, first-out (“FIFO”) method. During the sixnine months ended JuneSeptember 30, 2016, the Company re-issued 112,176130,538 shares of treasury stock at a total FIFO cost of $4.0$4.7 million.
5. Income Taxes
The Company's effective tax rate was 35.2% for the sixnine months ended JuneSeptember 30, 2016 as compared to 38.3%38.4% for the sixnine months ended JuneSeptember 30, 2015. The effective tax rate in 2016 was lower primarily due to application of a lower state tax rate to the deferred tax balances.
The total gross unrecognized tax benefit as of JuneSeptember 30, 2016 and December 31, 2015 was $4.2$3.7 million and $3.9 million, respectively, excluding interest, penalties and related tax benefits. The Company estimates the unrecognized tax benefit may decrease over the upcoming 12 months by an amount up to $1.3$1.5 million related to settlements with taxing authorities and the lapse of statutes of limitations. For the remaining liability, due to the uncertainties related to these tax matters, the Company is unable to make a reasonably reliable estimate as to when cash settlement with a taxing authority will occur.
As of JuneSeptember 30, 2016, accrued interest was $5.3$1.0 million and accrued penalties were less than $0.1 million, excluding any related income tax benefits. As of December 31, 2015, accrued interest was $4.9 million and accrued penalties were less than $0.1 million, excluding any related income tax benefits. The decrease of $3.9 million of accrued interest is primarily related to resolution of recent audits with taxing authorities. The Company recognizes interest accrued related to unrecognized tax benefits and penalties as a component of its income tax provision recognized in the Consolidated Statements of Comprehensive Income.
The Company files federal income tax returns and the Company or one of its subsidiaries files income tax returns in various state and foreign jurisdictions. With few exceptions, theThe Company is no longer subject to federal, state or non-United States tax examinations by tax authorities for years before 2008. In2011. During the secondthird quarter of 2013,2016, the Company resolved the appeals process with the Internal Revenue Service (“IRS”) issued a Revenue Agent’s Report related to its examination of the Company’s U.S federal income tax return for the tax years 2008 to 2010. The Company disagrees with a portion ofreserve previously provided related to the proposed assessmentsissues under appeal was adequate and has contested them through the IRS administrative appeals procedures. The Company anticipates the appeals process will conclude during 2016. The Company continues to believe that adequate reserves have been provided relating to all matters contained in the tax periods open to examination.did not require any additional adjustment.
DineEquity, Inc. and Subsidiaries
Notes to Consolidated Financial Statements (Continued)
6. Stock-Based Compensation
The following table summarizes the components of stock-based compensation expense included in general and administrative expenses in the Consolidated Statements of Comprehensive Income:
| | | | Three months ended June 30, | | Six months ended June 30, | Three months ended September 30, | | Nine months ended September 30, |
| | 2016 | | 2015 | | 2016 | | 2015 | 2016 | | 2015 | | 2016 | | 2015 |
| | (In millions) | (In millions) |
| Total stock-based compensation expense: | | | | | | | | | | | | | | |
| Equity classified awards expense | $ | 2.5 |
| | $ | 2.2 |
| | $ | 5.7 |
| | $ | 4.6 |
| $ | 2.6 |
| | $ | 1.8 |
| | $ | 8.3 |
| | $ | 6.4 |
|
| Liability classified awards expense | 0.3 |
| | (1.1 | ) | | 1.1 |
| | (0.8 | ) | (0.5 | ) | | 0.3 |
| | 0.6 |
| | (0.5 | ) |
| Total pre-tax stock-based compensation expense | 2.8 |
| | 1.1 |
| | 6.8 |
| | 3.8 |
| 2.1 |
| | 2.1 |
| | 8.9 |
| | 5.9 |
|
| Book income tax benefit | (1.1 | ) | | (0.4 | ) | | (2.6 | ) | | (1.4 | ) | (0.7 | ) | | (0.8 | ) | | (3.3 | ) | | (2.2 | ) |
| Total stock-based compensation expense, net of tax | $ | 1.7 |
| | $ | 0.7 |
| | $ | 4.2 |
| | $ | 2.4 |
| $ | 1.4 |
| | $ | 1.3 |
| | $ | 5.6 |
| | $ | 3.7 |
|
As of JuneSeptember 30, 2016, total unrecognized compensation expense of $16.6$14.7 million related to restricted stock and restricted stock units and $5.4$4.5 million related to stock options are expected to be recognized over a weighted average period of 1.641.55 years for restricted stock and restricted stock units and 1.651.51 years for stock options.
Equity Classified Awards - Stock Options
The estimated fair value of the stock options granted during the sixnine months ended JuneSeptember 30, 2016 was calculated using a Black-Scholes option pricing model. The following summarizes the assumptions used in the Black-Scholes model:
|
| | |
| Risk-free interest rate | 1.08 | % |
| Weighted average historical volatility | 27.1 | % |
| Dividend yield | 4.05 | % |
| Expected years until exercise | 4.5 |
|
| Weighted average fair value of options granted | $13.55 |
Stock option balances as of JuneSeptember 30, 2016 and related activity for the sixnine months ended JuneSeptember 30, 2016 were as follows:
| | | | | Shares | | Weighted Average Exercise Price | | Weighted Average Remaining Contractual Term (in Years) | | Aggregate Intrinsic Value (in Millions) | | Shares | | Weighted Average Exercise Price | | Weighted Average Remaining Contractual Term (in Years) | | Aggregate Intrinsic Value (in Millions) |
| Outstanding at December 31, 2015 | | 504,462 |
| | $ | 69.99 |
| | | | |
| | 504,462 |
| | $ | 69.99 |
| | | | |
|
| Granted | | 255,825 |
| | 90.90 |
| | | | |
| | 255,825 |
| | 90.90 |
| | | | |
|
| Exercised | | (36,088 | ) | | 24.39 |
| | | | |
| | (44,813 | ) | | 28.61 |
| | | | |
|
| Outstanding at June 30, 2016 | | 724,199 |
| | 79.65 |
| | 7.6 | | $ | 8.4 |
| |
| Vested at June 30, 2016 and Expected to Vest | | 668,490 |
| | 78.46 |
| | 7.5 | | $ | 8.4 |
| |
| Exercisable at June 30, 2016 | | 361,851 |
| | $ | 64.98 |
| | 5.9 | | $ | 8.3 |
| |
| Outstanding at September 30, 2016 | | | 707,550 |
| | 79.90 |
| | 7.4 | | $ | 6.3 |
|
| Vested at September 30, 2016 and Expected to Vest | | | 661,880 |
| | 78.94 |
| | 7.3 | | $ | 6.3 |
|
| Exercisable at September 30, 2016 | | | 353,126 |
| | $ | 65.44 |
| | 5.4 | | $ | 6.3 |
|
The aggregate intrinsic value in the table above represents the total pre-tax intrinsic value (the difference between the closing stock price of the Company’s common stock on the last trading day of the secondthird quarter of 2016 and the exercise price, multiplied by the number of in-the-money options) that would have been received by the option holders had all option holders exercised their options on JuneSeptember 30, 2016. The aggregate intrinsic value will change based on the fair market value of the Company’s common stock and the number of in-the-money options.
DineEquity, Inc. and Subsidiaries
Notes to Consolidated Financial Statements (Continued)
6. Stock-Based Compensation (Continued)
Equity Classified Awards - Restricted Stock and Restricted Stock Units
Outstanding balances as of JuneSeptember 30, 2016 and activity related to restricted stock and restricted stock units for the sixnine months ended JuneSeptember 30, 2016 were as follows:
| | | | | Restricted Stock | | Weighted Average Grant Date Fair Value | | Restricted Stock Units | | Weighted Average Grant Date Fair Value | | Restricted Stock | | Weighted Average Grant Date Fair Value | | Restricted Stock Units | | Weighted Average Grant Date Fair Value |
| Outstanding at December 31, 2015 | | 257,594 |
| | $ | 89.99 |
| | 35,116 |
| | $ | 86.30 |
| | 257,594 |
| | $ | 89.99 |
| | 35,116 |
| | $ | 86.30 |
|
| Granted | | 76,088 |
| | 90.64 |
| | 12,291 |
| | 90.90 |
| | 85,725 |
| | 89.26 |
| | 12,657 |
| | 90.90 |
|
| Released | | (63,151 | ) | | 76.33 |
| | (14,027 | ) | | 72.01 |
| | (71,876 | ) | | 77.95 |
| | (14,027 | ) | | 72.01 |
|
| Forfeited | | (19,260 | ) | | 93.05 |
| | — |
| | — |
| | (31,472 | ) | | 92.58 |
| | — |
| | — |
|
| Outstanding at June 30, 2016 | | 251,271 |
| | $ | 93.39 |
| | 33,380 |
| | $ | 93.97 |
| |
| Outstanding at September 30, 2016 | | | 239,971 |
| | $ | 93.00 |
| | 33,746 |
| | $ | 93.97 |
|
Liability Classified Awards - Long-Term Incentive Awards
The Company has granted cash long-term incentive awards (“LTIP awards”) to certain employees. Annual LTIP awards vest over a three-year period and are determined using a multiplier from 0% to 200% of the target award based on the total stockholder return of DineEquity common stock compared to the total stockholder returns of a peer group of companies. Although LTIP awards are only paid in cash, since the multiplier is based on the price of the Company's common stock, the awards are considered stock-based compensation in accordance with U.S. GAAP and are classified as liabilities. For the three months ended JuneSeptember 30, 2016 and 2015, a credit of $0.5 million and an expense of $0.3 million and a credit of $1.1 million, respectively, were included in total stock-based compensation expense related to LTIP awards. For the sixnine months ended JuneSeptember 30, 2016 and 2015, an expense of $1.1$0.6 million and a credit of $0.8$0.5 million, respectively, were included in total stock-based compensation expense related to LTIP awards. At JuneSeptember 30, 2016 and December 31, 2015, liabilities of $2.8$2.3 million and $1.6 million, respectively, related to LTIP awards were included as part of accrued employee compensation and benefits in the Consolidated Balance Sheets.
7. Segments
The Company has two reportablefour operating segments: franchise operations (an aggregation of Applebee’s and IHOP franchise operations) and, rental operations. The Company also hasoperations, company-operated restaurant operations and financing operations, but neitheroperations. The Company views all operating segments as reportable segments regardless of these operations exceededwhether any segment exceeds 10% of consolidated revenues, income before income tax provisionsegment profit or total assets.
As of JuneSeptember 30, 2016, the franchise operations segment consisted of (i) 2,027 restaurants operated by Applebee’s franchisees in the United States, two U.S. territories and 15 countries outside the United States and (ii) 1,6851,699 restaurants operated by IHOP franchisees and area licensees in the United States, twothree U.S. territories and 10 countries outside the United States. Franchise operations revenue consists primarily of franchise royalty revenues, sales of proprietary products to franchisees (primarily pancake and waffle dry mixes for the IHOP restaurants), IHOP franchise advertising fees from domestic IHOP restaurants and international restaurants of both brands and franchise fees. Franchise operations expenses include IHOP advertising expenses from domestic IHOP restaurants and international restaurants of both brands, the cost of IHOP proprietary products, IHOP and Applebee's pre-opening training expenses and other franchise-related costs.
Rental operations revenue includes revenue from operating leases and interest income from direct financing leases. Rental operations expenses are costs of operating leases and interest expense from capital leases on franchisee-operated restaurants.
At JuneSeptember 30, 2016, the company restaurant operations segment consisted of 10 IHOP company-operated restaurants, all of which are located in the United States. Company restaurant sales are retail sales at company-operated restaurants. Company restaurant expenses are operating expenses at company-operated restaurants and include food, labor, utilities, rent and other restaurant operating costs.
Financing operations revenue primarily consists of interest income from the financing of franchise fees and equipment leases and sales of equipment associated with refranchised IHOP restaurants. Financing expenses are primarily the cost of restaurant equipment associated with refranchised IHOP restaurants.
DineEquity, Inc. and Subsidiaries
Notes to Consolidated Financial Statements (Continued)
7. Segments (Continued)
Information on segments is as follows:
| | | | | Three months ended June 30, | | Six months ended June 30, | | Three months ended September 30, | | Nine months ended September 30, |
| | | 2016 | | 2015 | | 2016 | | 2015 | | 2016 | | 2015 | | 2016 | | 2015 |
| | | (In millions) | | (In millions) |
| Revenues from external customers: | | |
| | |
| | | | | | |
| | |
| | | | |
| Franchise operations | | $ | 122.5 |
| | $ | 120.3 |
| | $ | 247.5 |
| | $ | 244.8 |
| | $ | 119.2 |
| | $ | 120.1 |
| | $ | 366.7 |
| | $ | 364.9 |
|
| Rental operations | | 30.8 |
| | 31.1 |
| | 62.2 |
| | 62.5 |
| | 30.5 |
| | 31.2 |
| | 92.7 |
| | 93.8 |
|
| Company restaurants | | 4.5 |
| | 17.4 |
| | 9.3 |
| | 34.8 |
| | 4.0 |
| | 8.1 |
| | 13.4 |
| | 42.8 |
|
| Financing operations | | 2.5 |
| | 2.7 |
| | 4.8 |
| | 5.3 |
| | 2.3 |
| | 3.0 |
| | 7.0 |
| | 8.3 |
|
| Total | | $ | 160.3 |
| | $ | 171.5 |
| | $ | 323.8 |
| | $ | 347.4 |
| | $ | 156.0 |
| | $ | 162.4 |
| | $ | 479.8 |
| | $ | 509.8 |
|
| | | | | | | | | | | | | | | | | |
| Interest expense: | | |
| | |
| | | | | | |
| | |
| | | | |
| Rental operations | | $ | 3.0 |
| | $ | 3.4 |
| | $ | 6.1 |
| | $ | 6.9 |
| | $ | 2.9 |
| | $ | 3.3 |
| | $ | 9.0 |
| | $ | 10.1 |
|
| Company restaurants | | 0.1 |
| | 0.1 |
| | 0.2 |
| | 0.2 |
| | 0.1 |
| | 0.1 |
| | 0.3 |
| | 0.3 |
|
| Corporate | | 15.4 |
| | 15.7 |
| | 30.7 |
| | 31.3 |
| | 15.4 |
| | 15.4 |
| | 46.1 |
| | 46.8 |
|
| Total | | $ | 18.5 |
| | $ | 19.2 |
| | $ | 37.0 |
| | $ | 38.4 |
| | $ | 18.4 |
| | $ | 18.8 |
| | $ | 55.4 |
| | $ | 57.2 |
|
| | | | | | | | | | | | | | | | | |
| Depreciation and amortization: | | |
| | |
| | | | | | |
| | |
| | | | |
| Franchise operations | | $ | 2.6 |
| | $ | 2.6 |
| | $ | 5.2 |
| | $ | 5.2 |
| | $ | 2.7 |
| | $ | 2.6 |
| | $ | 7.9 |
| | $ | 7.8 |
|
| Rental operations | | 3.2 |
| | 3.2 |
| | 6.3 |
| | 6.4 |
| | 3.1 |
| | 3.2 |
| | 9.4 |
| | 9.6 |
|
| Company restaurants | | 0.1 |
| | 0.2 |
| | 0.2 |
| | 0.4 |
| | 0.1 |
| | 0.1 |
| | 0.3 |
| | 0.5 |
|
| Corporate | | 1.6 |
| | 2.1 |
| | 3.8 |
| | 3.9 |
| | 1.5 |
| | 2.4 |
| | 5.3 |
| | 6.2 |
|
| Total | | $ | 7.5 |
| | $ | 8.1 |
| | $ | 15.5 |
| | $ | 15.9 |
| | $ | 7.4 |
| | $ | 8.3 |
| | $ | 22.9 |
| | $ | 24.1 |
|
| | | | | | | | | | | | | | | | | |
| Income (loss) before income tax provision: | | |
| | |
| | | | | |
| Gross profit, by segment: | | | |
| | |
| | | | |
| Franchise operations | | $ | 87.5 |
| | $ | 86.2 |
| | $ | 176.8 |
| | $ | 175.2 |
| | $ | 81.9 |
| | $ | 86.8 |
| | $ | 258.7 |
| | $ | 262.0 |
|
| Rental operations | | 7.8 |
| | 7.8 |
| | 16.0 |
| | 15.7 |
| | 7.7 |
| | 8.0 |
| | 23.7 |
| | 23.7 |
|
| Company restaurants | | (0.2 | ) | | 0.1 |
| | (0.6 | ) | | 0.9 |
| | (0.2 | ) | | (0.6 | ) | | (0.7 | ) | | 0.3 |
|
| Financing operations | | 2.3 |
| | 2.7 |
| | 4.6 |
| | 5.3 |
| | 2.3 |
| | 2.5 |
| | 6.8 |
| | 7.8 |
|
| Corporate | | (57.7 | ) | | (53.3 | ) | | (116.0 | ) | | (107.5 | ) | |
| Total | | $ | 39.7 |
| | $ | 43.5 |
| | $ | 80.8 |
| | $ | 89.6 |
| |
| Total gross profit | | | 91.7 |
| | 96.7 |
| | 288.5 |
| | 293.8 |
|
| Corporate and unallocated expenses, net | | | (54.2 | ) | | (57.1 | ) | | (170.2 | ) | | (164.6 | ) |
| Income before income tax provision | | | $ | 37.5 |
| | $ | 39.6 |
| | $ | 118.3 |
| | $ | 129.2 |
|
DineEquity, Inc. and Subsidiaries
Notes to Consolidated Financial Statements (Continued)
8. Net Income per Share
The computation of the Company's basic and diluted net income per share is as follows:
| | | | Three months ended June 30, | | Six months ended June 30, | Three months ended September 30, | | Nine months ended September 30, |
| | 2016 | | 2015 | | 2016 | | 2015 | 2016 | | 2015 | | 2016 | | 2015 |
| | (In thousands, except per share data) | (In thousands, except per share data) |
| Numerator for basic and diluted income per common share: | |
| | |
| | | | | |
| | |
| | | | |
| Net income | $ | 26,829 |
| | $ | 26,897 |
| | $ | 52,372 |
| | $ | 55,309 |
| $ | 24,273 |
| | $ | 24,257 |
| | $ | 76,645 |
| | $ | 79,566 |
|
| Less: Net income allocated to unvested participating restricted stock | (384 | ) | | (359 | ) | | (766 | ) | | (726 | ) | (338 | ) | | (316 | ) | | (1,103 | ) | | (1,042 | ) |
| Net income available to common stockholders - basic | 26,445 |
| | 26,538 |
| | 51,606 |
| | 54,583 |
| 23,935 |
| | 23,941 |
| | 75,542 |
| | 78,524 |
|
| Effect of unvested participating restricted stock in two-class calculation | 1 |
| | 1 |
| | 1 |
| | 2 |
| 1 |
| | 1 |
| | 3 |
| | 3 |
|
| Net income available to common stockholders - diluted | $ | 26,446 |
| | $ | 26,539 |
| | $ | 51,607 |
| | $ | 54,585 |
| $ | 23,936 |
| | $ | 23,942 |
| | $ | 75,545 |
| | $ | 78,527 |
|
| Denominator: | |
| | |
| | | | | |
| | |
| | | | |
| Weighted average outstanding shares of common stock - basic | 18,085 |
| | 18,763 |
| | 18,173 |
| | 18,819 |
| 17,950 |
| | 18,573 |
| | 18,099 |
| | 18,737 |
|
| Dilutive effect of stock options | 103 |
| | 132 |
| | 107 |
| | 140 |
| 91 |
| | 133 |
| | 102 |
| | 137 |
|
| Weighted average outstanding shares of common stock - diluted | 18,188 |
| | 18,895 |
| | 18,280 |
| | 18,959 |
| 18,041 |
| | 18,706 |
| | 18,201 |
| | 18,874 |
|
| Net income per common share: | |
| | |
| | | | | |
| | |
| | | | |
| Basic | $ | 1.46 |
| | $ | 1.41 |
| | $ | 2.84 |
| | $ | 2.90 |
| $ | 1.33 |
| | $ | 1.29 |
| | $ | 4.17 |
| | $ | 4.19 |
|
| Diluted | $ | 1.45 |
| | $ | 1.40 |
| | $ | 2.82 |
| | $ | 2.88 |
| $ | 1.33 |
| | $ | 1.28 |
| | $ | 4.15 |
| | $ | 4.16 |
|
DineEquity, Inc. and Subsidiaries
Notes to Consolidated Financial Statements (Continued)
9. Fair Value Measurements
The Company does not have a material amount of financial assets or liabilities that are required under U.S. GAAP to be measured on a recurring basis at fair value. The Company is not a party to any derivative financial instruments. The Company does not have a material amount of non-financial assets or non-financial liabilities that are required under U.S. GAAP to be measured at fair value on a recurring basis. The Company has not elected to use the fair value measurement option, as permitted under U.S. GAAP, for any assets or liabilities for which fair value measurement is not presently required.
The Company believes the fair values of cash equivalents, accounts receivable and accounts payable approximate their carrying amounts due to their short duration.
The fair values of the Company's Series 2014-1 Class A-2 Notes (the “Class A-2 Notes”) at JuneSeptember 30, 2016 and December 31, 2015 were as follows:
|
| | | | | | | | | | | | | | | | |
| | | June 30, 2016 | | December 31, 2015 |
| | | Carrying Amount | | Fair Value | | Carrying Amount | | Fair Value |
| | | (In millions) |
| Long-term debt | | $ | 1,281.1 |
| | $ | 1,326.8 |
| | $ | 1,279.5 |
| | $ | 1,306.1 |
|
|
| | | | | | | | | | | | | | | | |
| | | September 30, 2016 | | December 31, 2015 |
| | | Carrying Amount | | Fair Value | | Carrying Amount | | Fair Value |
| | | (In millions) |
| Long-term debt | | $ | 1,281.9 |
| | $ | 1,321.2 |
| | $ | 1,279.5 |
| | $ | 1,306.1 |
|
The fair values were determined based on Level 2 inputs, including information gathered from brokers who trade in the Company’s Class A-2 Notes and information on notes that are similar to those of the Company.
10. Commitments and Contingencies
Litigation, Claims and Disputes
The Company is subject to various lawsuits, administrative proceedings, audits and claims arising in the ordinary course of business. Some of these lawsuits purport to be class actions and/or seek substantial damages. The Company is required under U.S. GAAP to record an accrual for litigation loss contingencies that are both probable and reasonably estimable. Legal fees and expenses associated with the defense of all of the Company's litigation are expensed as such fees and expenses are incurred. Management regularly assesses the Company's insurance coverage, analyzes litigation information with the Company's attorneys and evaluates the Company's loss experience in connection with pending legal proceedings. While the Company does not presently believe that any of the legal proceedings to which it is currently a party will ultimately have a material adverse impact on the Company, there can be no assurance that the Company will prevail in all the proceedings the Company is party to, or that the Company will not incur material losses from them.
Lease Guarantees
In connection with the sale of Applebee’s restaurants or previous brands to franchisees and other parties, the Company has, in certain cases, guaranteed or has potential continuing liability for lease payments totaling $386.9372.5 million as of JuneSeptember 30, 2016. This amount represents the maximum potential liability for future payments under these leases. These leases have been assigned to the buyers and expire at the end of the respective lease terms, which range from 2016 through 2048. In the event of default, the indemnity and default clauses in the sale or assignment agreements govern the Company's ability to pursue and recover damages incurred. No material lease payment guarantee liabilities have been recorded as of JuneSeptember 30, 2016.
11. Facility Exit Costs
In September 2015, the Company approved a plan to consolidate many core restaurant and franchisee support functions at its headquarters in Glendale, California and communicated the plan to employees. In conjunction with this action, the Company will exit a significant portion of the Applebee's restaurant support center in Kansas City, Missouri. The Company estimates it will incur a total of approximately $8$7 million in employee termination benefits, primarily severance and other personnel-relatedrelocation costs, associated with the consolidation, of which $5.7$5.8 million in employee termination costs has been incurred through JuneSeptember 30, 2016. The Company also estimates it will incur approximately $4 million in costs related to the exit of the facility, of which $2.5 million has been incurred through JuneSeptember 30, 2016.
DineEquity, Inc. and Subsidiaries
Notes to Consolidated Financial Statements (Continued)
11. Facility Exit Costs (Continued)
During the sixnine months ended JuneSeptember 30, 2016, the Company incurred $1.1$1.2 million of employee termination costs, primarily relocation and severance costs associated with the consolidation. These charges were included as general and administrative expenses in the Consolidated Statements of Comprehensive Income.
During the sixnine months ended JuneSeptember 30, 2016, the Company negotiated the termination of its lease on two of four floors of the Kansas City facility and recorded charges of $2.5 million related to this termination that were included as closure and impairment charges in the Consolidated Statements of Comprehensive Income.
| | | | | Employee Termination Costs | | Facility Costs | | Total Exit Costs | | Employee Termination Costs | | Facility Costs | | Total Exit Costs |
| | | (In millions ) | | (In millions ) |
| Accrued exit costs at December 31, 2014 | | $ | — |
| | $ | — |
| | $ | — |
| | $ | — |
| | $ | — |
| | $ | — |
|
| Charges | | 4.6 |
| | — |
| | 4.6 |
| | 4.6 |
| | — |
| | 4.6 |
|
| Payments | | (1.1 | ) | | — |
| | (1.1 | ) | | (1.1 | ) | | — |
| | (1.1 | ) |
| Accrued exit costs at December 31, 2015 | | 3.5 |
| | — |
| | 3.5 |
| | 3.5 |
| | — |
| | 3.5 |
|
| Charges | | 1.1 |
| | 2.5 |
| | 3.6 |
| | 1.2 |
| | 2.5 |
| | 3.7 |
|
| Payments | | (3.6 | ) | | (2.1 | ) | | (5.7 | ) | | (4.4 | ) | | (2.5 | ) | | (6.9 | ) |
| Accrued exit costs at June 30, 2016 | | $ | 1.0 |
| | $ | 0.4 |
| | $ | 1.4 |
| |
| Accrued exit costs at September 30, 2016 | | | $ | 0.3 |
| | $ | — |
| | $ | 0.3 |
|
At JuneSeptember 30, 2016, the $1.0$0.3 million of accrued termination costs was included in accrued employee compensation and benefits. At December 31, 2015, $3.3 million of accrued termination costs was included in accrued employee compensation and benefits and the $0.4 million of accrued facilities costs was included in accounts payable in the Consolidated Balance Sheet. At December 31, 2015, $3.3 million of accrued termination costs were included in accrued employee compensation and benefits and $0.2 million werewas included in other accrued expenses in the Consolidated Balance Sheet.
Item 2. Management’s Discussion and Analysis of Financial Condition and Results of Operations.
Cautionary Statement Regarding Forward-Looking Statements
Statements contained in this report may constitute forward-looking statements within the meaning of the Private Securities Litigation Reform Act of 1995. These statements involve known and unknown risks, uncertainties and other factors, which may cause actual results to be materially different from those expressed or implied in such statements. You can identify these forward-looking statements by words such as “may,” “will,” “should,” “could,” “expect,” “anticipate,” “believe,” “estimate,” “intend,” “plan” and other similar expressions. You should consider our forward-looking statements in light of the risks discussed under the heading “Risk Factors” in our most recent Annual Report on Form 10-K, as well as our consolidated financial statements, related notes, and the other financial information appearing elsewhere in this report and our other filings with the United States Securities and Exchange Commission. The forward-looking statements contained in this report are made as of the date hereof and the Company assumes no obligation to update or supplement any forward-looking statements.
You should read the following Management's Discussion and Analysis of Financial Condition and Results of Operations (“MD&A”) in conjunction with the consolidated financial statements and the related notes that appear elsewhere in this report.
Business Overview
The following discussion and analysis provides information which we believe is relevant to an assessment and understanding of our consolidated results of operations and financial condition. The discussion should be read in conjunction with the consolidated financial statements and the notes thereto included in Item 1 of Part I of this Quarterly Report and the audited consolidated financial statements and notes thereto and MD&A contained in the Company’s Annual Report on Form 10-K for the fiscal year ended December 31, 2015. Except where the context indicates otherwise, the words “we,” “us,” “our,” “DineEquity” and the “Company” refer to DineEquity, Inc., together with its subsidiaries that are consolidated in accordance with United States generally accepted accounting principles (“U.S. GAAP”).
Through various subsidiaries, we own and franchise the Applebee's Neighborhood Grill & Bar® (“Applebee's”) concept in the bar and grill segment within the casual dining category of the restaurant industry, and we own, franchise and operate the International House of Pancakes® (“IHOP”) concept in the family dining category of the restaurant industry. References herein to Applebee's® and IHOP® restaurants are to these two restaurant concepts, whether operated by franchisees, area licensees and their sub-licensees (collectively, “area licensees”) or by us. With over 3,700 restaurants combined, 99%virtually all of which are franchised, we believe we are one of the largest full-service restaurant companies in the world. The June 20, 2016 issue of Nation's Restaurant News reported that IHOP and Applebee's were the largest restaurant systems in their respectivethe family dining and casual dining categories, respectively, in terms of United States system-wide sales duringfor 2015. This marks the ninth consecutive year our two brands have achieved the number one ranking in their respective categories in Nation's Restaurant News.
Key Performance Indicators
In evaluating the performance of each restaurant concept, we consider the key performance indicators to be net franchise restaurant development and the percentage change in domestic system-wide same-restaurant sales. Since we are a 99% franchised company, expanding the number of Applebee's and IHOP franchise restaurants is an important driver of revenue growth. Growth in both the number of franchise restaurants and sales at those restaurants will drive franchise revenues in the form of higher royalty revenues, additional franchise fees and, in the case of IHOP restaurants, sales of proprietary pancake and waffle dry mix.
An overview of these key performance indicators for the three and sixnine months ended JuneSeptember 30, 2016 is as follows:
| | | | Three months ended | | Six months ended | Three months ended September 30, | | Nine months ended September 30, |
| | June 30, 2016 | | June 30, 2016 | Applebee's | | IHOP | | Applebee's | | IHOP |
| | Applebee's | | IHOP | | Applebee's | | IHOP | |
Net franchise restaurant (reduction) development (1) | (2 | ) | | 11 |
| | (6 | ) | | 12 |
| |
Net franchise restaurant development (reduction) (1) | | — |
| | 14 |
| | (6 | ) | | 26 |
|
| % (decrease) increase in domestic system-wide same-restaurant sales | (4.2 | )% | | 0.2 | % | | (3.9 | )% | | 0.8 | % | (5.2 | )% | | (0.1 | )% | | (4.4 | )% | | 0.5 | % |
(1) Franchise and area license restaurant openings, net of closings
Detailed information on each of these key performance indicators is presented under the captions “Restaurant Development Activity,” “Domestic Same-Restaurant Sales” and “Restaurant Data” that follow.
| | Restaurant Development Activity | Three months ended June 30, | | Six months ended June 30, | Three months ended September 30, | | Nine months ended September 30, |
| | 2016 | | 2015 | | 2016 | | 2015 | 2016 | | 2015 | | 2016 | | 2015 |
| Applebee's | (Unaudited) | (Unaudited) |
| Summary - beginning of period: | | | | | | | | | | | | | | |
| Franchise | 2,029 |
| | 1,991 |
| | 2,033 |
| | 1,994 |
| 2,027 |
| | 1,993 |
| | 2,033 |
| | 1,994 |
|
| Company restaurants | — |
| | 23 |
| | — |
| | 23 |
| — |
| | 23 |
| | — |
| | 23 |
|
| Total Applebee's restaurants, beginning of period | 2,029 |
| | 2,014 |
| | 2,033 |
| | 2,017 |
| 2,027 |
| | 2,016 |
| | 2,033 |
| | 2,017 |
|
| | | | | | | | | | | | | | | |
| Franchise restaurants opened: | |
| | |
| | | | | |
| | |
| | | | |
| Domestic | 2 |
| | 6 |
| | 7 |
| | 10 |
| 6 |
| | 7 |
| | 13 |
| | 17 |
|
| International | 3 |
| | 2 |
| | 4 |
| | 4 |
| 3 |
| | 2 |
| | 7 |
| | 6 |
|
| Total franchise restaurants opened | 5 |
| | 8 |
| | 11 |
| | 14 |
| 9 |
| | 9 |
| | 20 |
| | 23 |
|
| Franchise restaurants closed: | |
| | |
| | | | | |
| | |
| | | | |
| Domestic | (6 | ) | | (4 | ) | | (12 | ) | | (8 | ) | (8 | ) | | (6 | ) | | (20 | ) | | (14 | ) |
| International | (1 | ) | | (2 | ) | | (5 | ) | | (7 | ) | (1 | ) | | (1 | ) | | (6 | ) | | (8 | ) |
| Total franchise restaurants closed | (7 | ) | | (6 | ) | | (17 | ) | | (15 | ) | (9 | ) | | (7 | ) | | (26 | ) | | (22 | ) |
| Net franchise restaurant (reduction) development | (2 | ) | | 2 |
| | (6 | ) | | (1 | ) | |
| Net franchise restaurant development (reduction) | | — |
| | 2 |
| | (6 | ) | | 1 |
|
| Refranchised from Company restaurants | | — |
| | 23 |
| | — |
| | 23 |
|
| Net franchise restaurant additions (reductions) | | — |
| | 25 |
| | (6 | ) | | 24 |
|
| | | | | | | | | | | | | | | |
| Summary - end of period: | | | | | | | | | | | | | | |
| Franchise | 2,027 |
| | 1,993 |
| | 2,027 |
| | 1,993 |
| 2,027 |
| | 2,018 |
| | 2,027 |
| | 2,018 |
|
| Company restaurants | — |
| | 23 |
| | — |
| | 23 |
| — |
| | — |
| | — |
| | — |
|
| Total Applebee's restaurants, end of period | 2,027 |
| | 2,016 |
| | 2,027 |
| | 2,016 |
| 2,027 |
| | 2,018 |
| | 2,027 |
| | 2,018 |
|
| | | IHOP | |
| | |
| | | | | |
| | |
| | | | |
| Summary - beginning of period: | | | | | | | | | | | | | | |
| Franchise | 1,509 |
| | 1,470 |
| | 1,507 |
| | 1,472 |
| 1,519 |
| | 1,479 |
| | 1,507 |
| | 1,472 |
|
| Area license | 164 |
| | 167 |
| | 165 |
| | 167 |
| 166 |
| | 166 |
| | 165 |
| | 167 |
|
| Company | 11 |
| | 13 |
| | 11 |
| | 11 |
| 10 |
| | 13 |
| | 11 |
| | 11 |
|
| Total IHOP restaurants, beginning of period | 1,684 |
| | 1,650 |
| | 1,683 |
| | 1,650 |
| 1,695 |
| | 1,658 |
| | 1,683 |
| | 1,650 |
|
| | | | | | | | | | | | | | | |
| Franchise/area license restaurants opened: | | | | | | | | | | | | | | |
| Domestic franchise | 13 |
| | 7 |
| | 19 |
| | 13 |
| 7 |
| | 11 |
| | 26 |
| | 24 |
|
| Domestic area license | 2 |
| | 1 |
| | 2 |
| | 2 |
| 1 |
| | — |
| | 3 |
| | 2 |
|
| International franchise | 2 |
| | 3 |
| | 3 |
| | 3 |
| 8 |
| | 2 |
| | 11 |
| | 5 |
|
| Total franchise/area license restaurants opened | 17 |
| | 11 |
| | 24 |
| | 18 |
| 16 |
| | 13 |
| | 40 |
| | 31 |
|
| Franchise/area license restaurants closed: | |
| | |
| | | | | |
| | |
| | | | |
| Domestic franchise | (5 | ) | | (1 | ) | | (8 | ) | | (7 | ) | (2 | ) | | (4 | ) | | (10 | ) | | (11 | ) |
| Domestic area license | — |
| | (2 | ) | | (1 | ) | | (3 | ) | — |
| | — |
| | (1 | ) | | (3 | ) |
| International franchise | (1 | ) | | — |
| | (3 | ) | | — |
| — |
| | — |
| | (3 | ) | | — |
|
| Total franchise/area license restaurants closed | (6 | ) | | (3 | ) | | (12 | ) | | (10 | ) | (2 | ) | | (4 | ) | | (14 | ) | | (14 | ) |
| Net franchise/area license restaurant development | 11 |
| | 8 |
| | 12 |
| | 8 |
| 14 |
| | 9 |
| | 26 |
| | 17 |
|
| Refranchised from Company restaurants | 1 |
| | — |
| | 1 |
| | 1 |
| — |
| | 2 |
| | 1 |
| | 3 |
|
| Franchise restaurants reacquired by the Company | — |
| | — |
| | — |
| | (3 | ) | — |
| | — |
| | — |
| | (3 | ) |
| Net franchise/area license restaurant additions (reductions) | 12 |
| | 8 |
| | 13 |
| | 6 |
| |
| Net franchise/area license restaurant additions | | 14 |
| | 11 |
| | 27 |
| | 17 |
|
| | | | | | | | | | | | | | | |
| Summary - end of period: | | | | | | | | | | | | | | |
| Franchise | 1,519 |
| | 1,479 |
| | 1,519 |
| | 1,479 |
| 1,532 |
| | 1,490 |
| | 1,532 |
| | 1,490 |
|
| Area license | 166 |
| | 166 |
| | 166 |
| | 166 |
| 167 |
| | 166 |
| | 167 |
| | 166 |
|
| Company | 10 |
| | 13 |
| | 10 |
| | 13 |
| 10 |
| | 11 |
| | 10 |
| | 11 |
|
| Total IHOP restaurants, end of period | 1,695 |
| | 1,658 |
| | 1,695 |
| | 1,658 |
| 1,709 |
| | 1,667 |
| | 1,709 |
| | 1,667 |
|
Both the gross and netGross development by Applebee's franchisees for the three and six months ended JuneSeptember 30, 2016 werewas equal to the same period of the prior year, while gross development by Applebee's franchisees for the nine months ended September 30, 2016 was lower than the same period of 2015. Applebee's net development for both the three and nine months ended September 30, 2016 was lower than the same respective periods of 2015, whereasthe prior year due to a slight increase in the number of Applebee's restaurant closures.
Both the gross and net development by IHOP franchisees for the three and sixnine months ended JuneSeptember 30, 2016 werewas higher than the respective periods of 2015. The increases primarily were due to higher gross and net development by international IHOP franchisees. On a combined basis, DineEquity gross and net franchise restaurant development for the three and sixnine months ended JuneSeptember 30, 2016 was lowerhigher than the respective periods of the prior year by one restaurant in each period. Typically, the majority of gross and net franchise restaurant development for each brand takes place in the second half of any given year.
For the full year of 2016, we expect IHOP franchisees to open a total of 65 to 77 new restaurants and Applebee's franchisees to open a total of 25 to 33 new restaurants. The majority of openings for each brand is expected to be in domestic markets. The actual number of openings in 2016 may differ from both our expectations and development commitments. Historically, the actual number of restaurants developed in a particular year has been less than the total number committed to be developed due to various factors, including economic conditions and franchisee noncompliance with restaurant opening commitments in development agreements. The timing of new restaurant openings also may be affected by other factors including weather-related and other construction delays, difficulties in obtaining timely regulatory approvals and the impact of currency fluctuations on our international franchisees.
Domestic Same-Restaurant Sales
We believe that, while the U.S. economy has continued to grow in 2016, the rate of growth has been slower than in 2015 and average wages have grown at a slower pace than the overall economy. In addition, restaurants have been faced with increased competition from prepared food retailers and a widening gap between the cost of food purchased for consumption at home and the cost of food purchased at restaurants. As a result, consumers seem to be allocating less disposable personal income to restaurant visits. Based on data from Black Box Intelligence (“Black Box”), a restaurant sales reporting firm, the third quarter of 2016 was the weakest quarter for the overall restaurant industry since the second quarter of 2010.
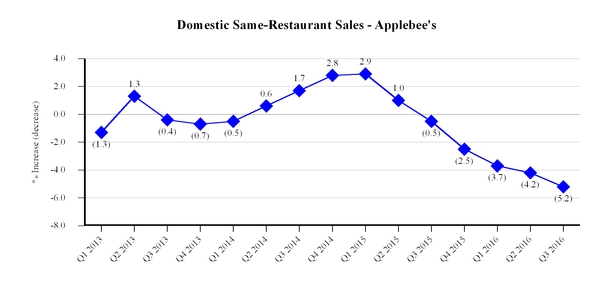
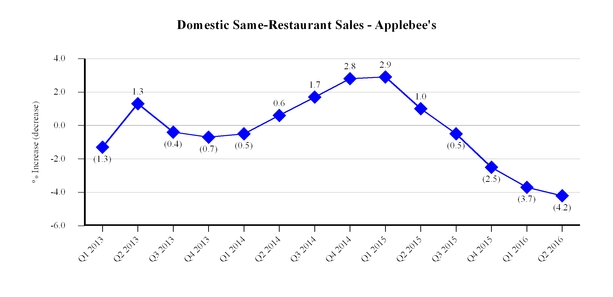
Applebee’s domestic system-wide same-restaurant sales decreased 4.2%5.2% for the three months ended JuneSeptember 30, 2016 from the same period in 2015. The decrease resulted from a decline in customer traffic that was only partially offset by a higher average customer check. The decline in Applebee's quarter-over-quarter customer traffic has grown progressively larger from the first quarter of 2015 to the secondthird quarter of 2016. To date, marketing, promotional and other initiatives have not been successful in reversing that trend, and we expect to makeWe made an incremental investments ininvestment of $2.5 million during the next several monthsthird quarter of 2016 to test additional marketing initiatives. initiatives to help address that trend.
Applebee’s domestic system-wide same-restaurant sales decreased 3.9%4.4% for the sixnine months ended JuneSeptember 30, 2016 from the same period in 2015, also due to a decline in customer traffic that was only partially offset by a higher average customer check. Same-restaurant sales for the first sixnine months of 2016 are not necessarily indicative of results expected for the full year.
Based on data from Black Box, Intelligence (“Black Box”), a restaurant sales reporting firm, the casual dining segment of the restaurant industry also experienced a decline in customer traffic and an overall decline in same-restaurant sales during the three and sixnine months ended JuneSeptember 30, 2016.2016 compared to the respective periods of the prior year. Applebee's declines in traffic and same-restaurant sales were larger than those experienced by the overall casual dining segment as reported by Black Box.segment.
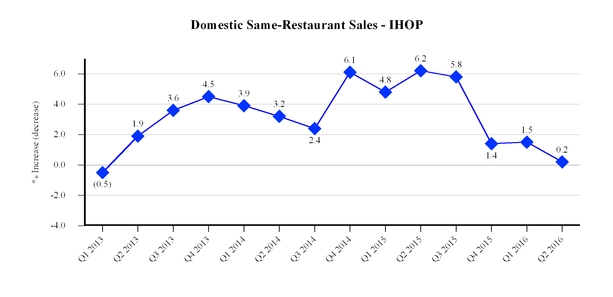
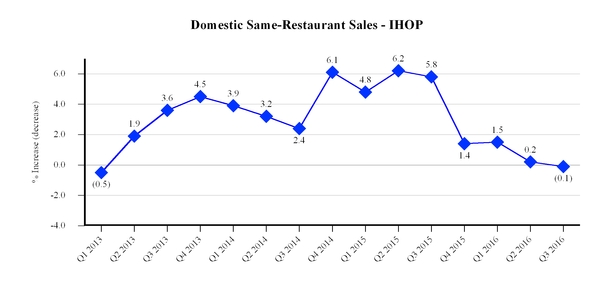
IHOP’s domestic system-wide same-restaurant sales increased 0.2%decreased 0.1% for the three months ended JuneSeptember 30, 2016 from the same period in 2015, the thirteenth consecutive quarter of positivefirst quarterly decrease in comparative same-restaurant sales for IHOP.IHOP since the first quarter of 2013. The increasedecrease resulted from a higherdecline in customer traffic that was nearly offset by an increase in average customer check partially offset by a decrease incheck. IHOP's quarter-over-quarter customer traffic. IHOP customer traffic has decreased for the past threefour quarters after increasing in the five consecutive quarters from the third quarter of 2014 to the third quarter of 2015. IHOP's domestic system-wide same-restaurant sales increased 0.8%0.5% for the sixnine months ended JuneSeptember 30, 2016 from the same period in 2015, also due to a higher average customer check, partially offset by a decrease in customer traffic. Same-restaurant sales for the first sixnine months of 2016 are not necessarily indicative of results expected for the full year.
Based on data from Black Box, the family dining segment of the restaurant industry also experienced an increase in same-restaurant sales during both the three and nine months ended September 30, 2016, compared to the same respective periods of the prior year, due to a higher average customer check partially offset by a decrease in customer traffic during the three and six months ended June 30, 2016.traffic. IHOP's increase in same-restaurant sales was greater than that of the family dining segment as reported by Black Box for both the three and sixnine months ended JuneSeptember 30, 2016, and2016. IHOP's decrease in customer traffic was lessgreater than that of the family dining segment for both the three and six months ended JuneSeptember 30, 2016, while IHOP's decrease in customer traffic was the same as that of the family dining segment for the nine months ended September 30, 2016.
As reported by Black Box, customer traffic declined for the overall restaurant industry as well as for both the casual dining and family dining segments of the restaurant industry during the three and sixnine months ended JuneSeptember 30, 2016. With respect to both our brands, a decline in customer traffic may be offset in the short term by an increase in average customer check resulting from an increase in menu prices, a favorable change in product sales mix, or a combination thereof. A sustained decline in same-restaurant customer traffic that cannot be offset by an increase in average customer check could have an adverse effect on our business, results of operations and financial condition due to, among other things, reduced royalty revenues, higher bad debt expense resulting from the failure or inability of franchisees to pay amounts owed to us when due, and a possible decline in the number of franchise restaurants because of reduced development or restaurant closures.
We strive to identify and create opportunities for growth in customer traffic and frequency, average check and same-restaurant sales. We focus on building our brands with a long-term view through a strategic combination of menu, media, remodel and development initiatives to continually innovate and evolve both brands. To drive each brand forward, we seek to innovate and remain actively focused on driving sustainable sales and traffic.
Restaurant Data
The following table sets forth the number of “Effective Restaurants” in the Applebee’s and IHOP systems and information regarding the percentage change in sales at those restaurants compared to the same periods in the prior year. Sales at restaurants that are owned by franchisees and area licensees are not attributable to the Company.Company and, as such, the percentage change in sales at Effective Restaurants is based on non-GAAP sales data. However, we believe that presentation of this information is useful in analyzing our revenues because franchisees and area licensees pay us royalties and advertising fees that are generally based on a percentage of their sales, and, where applicable, rental payments under leases that partially may be based on a percentage of their sales. Management also uses this information to make decisions about future plans for the development of additional restaurants as well as evaluation of current operations.
| | | — |
| | Three months ended June 30, | | Six months ended June 30, |
| | Three months ended September 30, | | Nine months ended September 30, |
| | | | 2016 | | 2015 | | 2016 | | 2015 | | | 2016 | | 2015 | | 2016 | | 2015 |
| Applebee's Restaurant Data | Applebee's Restaurant Data | | (Unaudited) | Applebee's Restaurant Data | | (Unaudited) |
Effective Restaurants(a) | Effective Restaurants(a) | | |
| | |
| | |
| | |
| Effective Restaurants(a) | | |
| | |
| | |
| | |
|
| Franchise | Franchise | | 2,028 |
| | 1,990 |
| | 2,029 |
| | 1,991 |
| Franchise | | 2,028 |
| | 2,011 |
| | 2,029 |
| | 1,998 |
|
| Company | Company | | — |
| | 23 |
| | — |
| | 23 |
| Company | | — |
| | 5 |
| | — |
| | 17 |
|
| Total | Total | | 2,028 |
| | 2,013 |
| | 2,029 |
| | 2,014 |
| Total | | 2,028 |
| | 2,016 |
| | 2,029 |
| | 2,015 |
|
System-wide(b) | System-wide(b) | | |
| | |
| | |
| | |
| System-wide(b) | | |
| | |
| | |
| | |
|
Sales percentage change(c) | Sales percentage change(c) | | (4.4 | )% | | 2.0 | % | | (4.2 | )% | | 2.9 | % | Sales percentage change(c) | | (5.1 | )% | | 0.4 | % | | (4.5 | )% | | 2.1 | % |
Domestic same-restaurant sales percentage change(d) | Domestic same-restaurant sales percentage change(d) | | (4.2 | )% | | 1.0 | % | | (3.9 | )% | | 2.0 | % | Domestic same-restaurant sales percentage change(d) | | (5.2 | )% | | (0.5 | )% | | (4.4 | )% | | 1.2 | % |
| | | | | | | | | | |
| �� | | �� | | | | | | | | |
Franchise(b) | Franchise(b) | | |
| | |
| | |
| | |
| Franchise(b) | | |
| | |
| | |
| | |
|
Sales percentage change(c) | Sales percentage change(c) | | (3.4 | )% | | 2.0 | % | | (3.2 | )% | | 2.9 | % | Sales percentage change(c) | | (4.9 | )% | | 1.2 | % | | (3.7 | )% | | 2.3 | % |
Domestic same-restaurant sales percentage change(d) | Domestic same-restaurant sales percentage change(d) | | (4.2 | )% | | 1.0 | % | | (3.9 | )% | | 2.0 | % | Domestic same-restaurant sales percentage change(d) | | (5.2 | )% | | 0.5 | % | | (4.4 | )% | | 1.2 | % |
| Average weekly domestic unit sales (in thousands) | Average weekly domestic unit sales (in thousands) | | $ | 46.5 |
| | $ | 48.9 |
| | $ | 47.6 |
| | $ | 50.0 |
| Average weekly domestic unit sales (in thousands) | | $ | 43.5 |
| | $ | 45.9 |
| | $ | 46.2 |
| | $ | 48.6 |
|
| | | | | | | | | | | | | | | | | | | |
| IHOP Restaurant Data | IHOP Restaurant Data | | |
| | |
| | |
| | |
| IHOP Restaurant Data | | |
| | |
| | |
| | |
|
| | | | | | | | | | | | | | | | | | | |
Effective Restaurants(a) | Effective Restaurants(a) | | |
| | |
| | |
| | |
| Effective Restaurants(a) | | |
| | |
| | |
| | |
|
| Franchise | Franchise | | 1,510 |
| | 1,471 |
| | 1,508 |
| | 1,471 |
| Franchise | | 1,521 |
| | 1,482 |
| | 1,512 |
| | 1,474 |
|
| Area license | Area license | | 165 |
| | 167 |
| | 165 |
| | 167 |
| Area license | | 167 |
| | 166 |
| | 165 |
| | 167 |
|
| Company | Company | | 11 |
| | 13 |
| | 11 |
| | 13 |
| Company | | 10 |
| | 12 |
| | 11 |
| | 13 |
|
| Total | Total | | 1,686 |
| | 1,651 |
| | 1,684 |
| | 1,651 |
| Total | | 1,698 |
| | 1,660 |
| | 1,688 |
| | 1,654 |
|
| | | | | | | | | | | | | | | | | | | |
System-wide(b) | System-wide(b) | | |
| | |
| | |
| | |
| System-wide(b) | | |
| | |
| | |
| | |
|
Sales percentage change(c) | Sales percentage change(c) | | 2.5 | % | | 7.1 | % | | 2.4 | % | | 6.6 | % | Sales percentage change(c) | | 1.3 | % | | 7.0 | % | | 2.0 | % | | 6.8 | % |
Domestic same-restaurant sales percentage change(d) | Domestic same-restaurant sales percentage change(d) | | 0.2 | % | | 6.2 | % | | 0.8 | % | | 5.5 | % | Domestic same-restaurant sales percentage change(d) | | (0.1 | )% | | 5.8 | % | | 0.5 | % | | 5.6 | % |
Franchise(b) | Franchise(b) | | |
| | |
| | |
| | |
| Franchise(b) | | |
| | |
| | |
| | |
|
Sales percentage change(c) | Sales percentage change(c) | | 2.8 | % | | 6.8 | % | | 2.6 | % | | 6.4 | % | Sales percentage change(c) | | 1.4 | % | | 6.8 | % | | 2.2 | % | | 6.5 | % |
Domestic same-restaurant sales percentage change(d) | Domestic same-restaurant sales percentage change(d) | | 0.2 | % | | 6.2 | % | | 0.8 | % | | 5.5 | % | Domestic same-restaurant sales percentage change(d) | | (0.1 | )% | | 5.8 | % | | 0.5 | % | | 5.6 | % |
| Average weekly domestic unit sales (in thousands) | Average weekly domestic unit sales (in thousands) | | $ | 37.5 |
| | $ | 37.4 |
| | $ | 37.6 |
| | $ | 37.6 |
| Average weekly domestic unit sales (in thousands) | | $ | 37.1 |
| | $ | 37.6 |
| | $ | 37.5 |
| | $ | 37.6 |
|
Area License(b) | Area License(b) | | |
| | |
| | |
| | |
| Area License(b) | | |
| | |
| | |
| | |
|
Sales percentage change(c) | Sales percentage change(c) | | 0.5 | % | | 7.7 | % | | 0.4 | % | | 7.4 | % | Sales percentage change(c) | | 2.4 | % | | 8.0 | % | | 1.1 | % | | 7.6 | % |
(a) “Effective Restaurants” are the weighted average number of restaurants open in a given fiscal period, adjusted to account for restaurants open for only a portion of the period. Information is presented for all Effective Restaurants in the Applebee’s and IHOP systems, which consist of restaurants owned by franchisees and area licensees as well as those owned by the Company.
(b) “System-wide sales” are retail sales at Applebee’s restaurants operated by franchisees and IHOP restaurants operated by franchisees and area licensees, as reported to the Company, in addition to retail sales at company-operated restaurants. Sales at restaurants that are owned by franchisees and area licensees are not attributable to the Company. UnauditedAn increase in franchisees' reported sales will result in a corresponding increase in our royalty revenue, while a decrease in franchisees' reported sales will result in a corresponding decrease in our royalty revenue.Unaudited reported sales for Applebee's domestic franchise restaurants, IHOP franchise restaurants and IHOP area license restaurants were as follows:
| | | | Three months ended June 30, | | Six months ended June 30, | Three months ended September 30, | | Nine months ended September 30, |
| | 2016 | | 2015 | | 2016 | | 2015 | 2016 | | 2015 | | 2016 | | 2015 |
| Reported sales | (In millions) | (In millions) |
| | (Unaudited) | (Unaudited) |
| | |
| | |
| | | | | |
| | |
| | | | |
| Applebee's domestic franchise restaurant sales | $ | 1,134.2 |
| | $ | 1,174.6 |
| | $ | 2,323.2 |
| | $ | 2,400.6 |
| $ | 1,058.9 |
| | $ | 1,113.2 |
| | $ | 3,382.1 |
| | $ | 3,513.8 |
|
| IHOP franchise restaurant sales | 735.4 |
| | 715.1 |
| | 1,474.3 |
| | 1,436.4 |
| 734.3 |
| | 724.5 |
| | 2,208.6 |
| | 2,160.9 |
|
| IHOP area license restaurant sales | 70.2 |
| | 69.8 |
| | 145.5 |
| | 144.8 |
| 71.0 |
| | 69.4 |
| | 216.5 |
| | 214.2 |
|
| Total | $ | 1,939.8 |
| | $ | 1,959.5 |
| | $ | 3,943.0 |
| | $ | 3,981.8 |
| $ | 1,864.2 |
| | $ | 1,907.1 |
| | $ | 5,807.2 |
| | $ | 5,888.9 |
|
(c) “Sales percentage change” reflects, for each category of restaurants, the percentage change in sales in any given fiscal period compared to the prior fiscal period for all restaurants in that category.
(d) “Domestic same-restaurant sales percentage change” reflects the percentage change in sales in any given fiscal period, compared to the same weeks in the prior fiscal period, for domestic restaurants that have been operated throughout both fiscal periods that are being compared and have been open for at least 18 months. Because of new restaurant openings and restaurant closures, the domestic restaurants open throughout both fiscal periods being compared may be different from period to period. Domestic same-restaurant sales percentage change does not include data on IHOP area license restaurants.
CONSOLIDATED RESULTS OF OPERATIONS
Comparison of the Three and SixNine Months Ended JuneSeptember 30, 2016 and 2015
Events Impacting Comparability of Financial Results
Refranchising of 23 Applebee's Company-operated Restaurants
In July 2015, we completed the refranchising and sale of related restaurant assets of 23 Applebee’s company-operated restaurants in the Kansas City, Missouri market area. As the result of this transaction, we only recognized royalty revenues from these 23 restaurants in 2016, whereas in 2015 we recognized restaurant revenues and operating costs in 2015.prior to the refranchising and royalty revenues thereafter. The impact of this refranchising on our consolidated revenue and gross profit for the three and sixnine months ended JuneSeptember 30, 2016 was as follows:
| | | | | Three months ended June 30, | | Favorable
(Unfavorable) Impact | | Six months ended June 30, | | Favorable
(Unfavorable) Impact | | Three months ended September 30, | | Favorable
(Unfavorable) Impact | | Nine months ended September 30, | | Favorable
(Unfavorable) Impact |
| | | 2016 | | 2015 | | 2016 | | 2015 | | | 2016 | | 2015 | | 2016 | | 2015 | |
| Company restaurant revenue | | $ | — |
| | $ | 12.2 |
| | $ | (12.2 | ) | | $ | — |
| | $ | 24.6 |
| | $ | (24.6 | ) | | $ | — |
| | $ | 3.0 |
| | $ | (3.0 | ) | | $ | — |
| | $ | 27.5 |
| | $ | (27.5 | ) |
| Royalty revenue | | 0.4 |
| | — |
| | 0.4 |
| | 0.9 |
| | — |
| | 0.9 |
| | 0.4 |
| | 0.3 |
| | 0.1 |
| | 1.3 |
| | 0.3 |
| | 1.0 |
|
| Total revenue impact | | 0.4 |
| | 12.2 |
| | (11.8 | ) | | 0.9 |
| | 24.6 |
| | (23.7 | ) | | 0.4 |
| | 3.3 |
| | (2.9 | ) | | 1.3 |
| | 27.8 |
| | (26.5 | ) |
| Operating costs | | — |
| | 11.7 |
| | 11.7 |
| | — |
| | 23.0 |
| | 23.0 |
| | — |
| | 3.1 |
| | 3.1 |
| | — |
| | 26.0 |
| | 26.0 |
|
| Gross profit impact | | $ | 0.4 |
| | $ | 0.5 |
| | $ | (0.1 | ) | | $ | 0.9 |
| | $ | 1.6 |
| | $ | (0.7 | ) | | $ | 0.4 |
| | $ | 0.2 |
| | $ | 0.2 |
| | $ | 1.3 |
| | $ | 1.8 |
| | $ | (0.5 | ) |
Consolidation of Kansas City Restaurant Support Center
In September 2015, we announced a strategic decision to consolidate many core Applebee's restaurant and franchisee support functions and relocate them from Kansas City, Missouri to our Glendale, California headquarters. In conjunction with this action, we estimate we will incur a total of approximately $9 million in employee termination benefitscosts and in other personnel-related costs, primarily recruiting costs, associated with this consolidation andconsolidation. We estimate we will incur approximately $5 million in costs related to the reduction in our space requirements at the Kansas City facility, whenprimarily facility exit costs and increased depreciation charges. We expect the consolidation process is completedto be complete by the end of 2016.
During the three months ended June 30,second quarter of 2016, we negotiated the termination of our lease on two of four floors of the Kansas City facility and recorded charges of $2.5 million related to this termination as part of closure and impairment costs in the Consolidated Statement of Comprehensive Income. Remaining Kansas City employees will be consolidated to a single floor. We expect to record an additional charge of approximately $1 million once the remaining space we have moved off the last remaining floor we currentlywill no longer occupy is available for sublease, which is estimated to be in the second halffourth quarter of 2016.
Charges
Costs incurred related to the consolidation for the three and sixnine months ended JuneSeptember 30, 2016, as well as cumulative totals of consolidation costs incurred since September 2015 are as follows:
| | | | | | | | | | | Three months ended September 30, | | Nine months ended September 30, | | Cumulative to September 30, |
| | Three months ended June 30, 2016 | | Six months ended June 30, 2016 | | Cumulative to June 30, 2016 | | 2016 | | 2015 | 2016 | | 2015 | | 2016 |
| | (In millions) | | (In millions) |
| Termination benefits and other personnel-related costs | $ | 0.4 |
| | $ | 2.3 |
| | $ | 7.2 |
| | $ | 0.3 |
| | $ | 3.3 |
| | $ | 2.6 |
| | $ | 3.3 |
| | $ | 7.5 |
|
| Facility costs: | | | | | | | | | | | | | | | |
| Lease termination costs | 2.5 |
| | 2.5 |
| | 2.5 |
| | — |
| | — |
| | 2.5 |
| | — |
| | 2.5 |
|
| Depreciation | 0.1 |
| | 0.2 |
| | 1.2 |
| | — |
| | 0.3 |
| | 0.2 |
| | 0.3 |
| | 1.2 |
|
| Total facility costs | 2.6 |
| | 2.7 |
| | 3.7 |
| | — |
| | 0.3 |
| | 2.7 |
| | 0.3 |
| | 3.7 |
|
| Total consolidation costs | $ | 3.0 |
| | $ | 5.0 |
| | $ | 10.9 |
| | $ | 0.3 |
| | $ | 3.6 |
| | $ | 5.3 |
| | $ | 3.6 |
| | $ | 11.2 |
|
Adjustment to Deferred Tax Liabilities
As a result of the consolidation action discussed above, our estimated state tax rate that will be effective when temporary book/tax differences are realized in the future will be lower than the effective state tax rate that was used to record net deferred tax liabilities when the temporary book/tax differences arose. Primarily because of this lower rate, we reduced deferred tax liabilities and our 2016 income tax provision by approximately $2.0 million during the three months ended June 30,second quarter of 2016. This change lowered our combined effective tax rate for the threenine months ended JuneSeptember 30, 2016 from what would have been 37.5% without the adjustment to 32.5% and our combined effective tax rate for the six months ended June 30, 2016 from what would have been 37.7%36.9%, without the adjustment, to 35.2%.
Financial Results
| | | Overview | | Three months ended June 30, | | %
increase (decrease) | | Six months ended June 30, | | %
increase (decrease) | | Three months ended September 30, | | Favorable
(Unfavorable) Variance | | Nine months ended September 30, | | Favorable
(Unfavorable) Variance |
| | | 2016 | | 2015 | | 2016 | | 2015 | | | 2016 | | 2015 | | 2016 | | 2015 | |
| | | (In millions, except per share amounts) | | | | (In millions, except per share amounts) | | | | (In millions, except per share data) |
| Gross profit | | | $ | 91.7 |
| | $ | 96.7 |
| | $ | (5.0 | ) | | $ | 288.5 |
| | $ | 293.8 |
| | $ | (5.3 | ) |
| General and administrative expenses | | | 36.0 |
| | 41.6 |
| | 5.6 |
| | 111.9 |
| | 110.4 |
| | (1.5 | ) |
| Other expense and income items, net | | | 18.2 |
| | 15.5 |
| | (2.7 | ) | | 58.3 |
| | 54.2 |
| | (4.1 | ) |
| Income before income taxes | | | 37.5 |
| | 39.6 |
| | (2.1 | ) | | 118.3 |
| | 129.2 |
| | (10.9 | ) |
| Income tax provision | | | (13.2 | ) | | (15.3 | ) | | 2.1 |
| | (41.7 | ) | | (49.6 | ) | | 7.9 |
|
| Net income | | $ | 26.8 |
| | $ | 26.9 |
| | (0.4 | )% | | $ | 52.4 |
| | $ | 55.3 |
| | (5.2 | )% | | $ | 24.3 |
| | $ | 24.3 |
| | $ | 0.0 |
| | $ | 76.6 |
| | $ | 79.6 |
| | $ | (3.0 | ) |
| Change vs. prior period | | | 0.0 | % | | | | | | (3.8 | )% | | | | |
| | | | | | | | % increase (decrease) | | | | | | % increase (decrease) |
| Net income per diluted share | | $ | 1.45 |
| | $ | 1.40 |
| | 3.6 | % | | $ | 2.82 |
| | $ | 2.88 |
| | (2.1 | )% | | $ | 1.33 |
| | $ | 1.28 |
| | 3.9 | % | | $ | 4.15 |
| | $ | 4.16 |
| | (0.2 | )% |
| Weighted average shares | | 18.2 |
| | 18.9 |
| | (3.7 | )% | | 18.3 |
| | 19.0 |
| | (3.7 | )% | | 18.0 |
| | 18.7 |
| | (3.7 | )% | | 18.2 |
| | 18.9 |
| | (3.7 | )% |
Our net income for the three months ended JuneSeptember 30, 2016 was slightly lower compared withessentially the same periodas in the third quarter of the prior year as higher2015. Our general and administrative expenses (“G&A”) and costs to terminate a leaseour effective tax rate were lower in 2016, but these favorable items were offset by a lower effective tax ratedecrease in gross profit and a small increaseloss on disposition of assets in gross profit.2016 compared to a gain on disposition of assets in 2015. The reasons for these changes are discussed in detail in the respective sections that follow. Despite flat earnings, our net income per diluted share for the three months ended September 30, 2016 increased compared with the same period of the prior year due to a lower amountsmaller number of weighted average shares outstanding.
Our net income for the sixnine months ended JuneSeptember 30, 2016 declined $2.9$3.0 million compared with the same period of the prior year as higher G&A,year. The decline in net income was due to a decrease in gross profit, costs of $2.5 million incurred to terminate a lease, a loss on disposition of assets in 2016 compared to a gain on disposition of assets in 2015 and a small decreasean increase in gross profitG&A expenses. These unfavorable items were only partially offset by a lower effective tax rate. The reasons for these changes are discussed in detail in the respective sections that follow. However, the percentage decrease in net income per diluted share compared with the same period of the prior year was substantially less than the percentage decrease in net income due to a lower amountsmaller number of weighted average shares outstanding.
The weighted average shares outstanding for both the three and sixnine months ended JuneSeptember 30, 2016 decreased primarily due to our repurchase of approximately 800,000 shares of stock pursuant to stock repurchase programs over the past twelve months.
| | | Revenue | | Three months ended June 30, | | Favorable
(Unfavorable) Variance | | Six months ended June 30, | | Favorable
(Unfavorable) Variance | | Three months ended September 30, | | Favorable
(Unfavorable) Variance | | Nine months ended September 30, | | Favorable
(Unfavorable) Variance |
| | | 2016 | | 2015 | | 2016 | | 2015 | | | 2016 | | 2015 | | 2016 | | 2015 | |
| | | (In millions) | | (In millions) |
| Franchise operations | | $ | 122.5 |
| | $ | 120.3 |
| | $ | 2.2 |
| | $ | 247.5 |
| | $ | 244.8 |
| | $ | 2.7 |
| | $ | 119.2 |
| | $ | 120.1 |
| | $ | (0.9 | ) | | $ | 366.7 |
| | $ | 364.9 |
| | $ | 1.8 |
|
| Rental operations | | 30.8 |
| | 31.1 |
| | (0.3 | ) | | 62.2 |
| | 62.5 |
| | (0.3 | ) | | 30.5 |
| | 31.2 |
| | (0.7 | ) | | 92.7 |
| | 93.8 |
| | (1.1 | ) |
| Company restaurant operations | | 4.5 |
| | 17.4 |
| | (12.9 | ) | | 9.3 |
| | 34.8 |
| | (25.5 | ) | | 4.0 |
| | 8.1 |
| | (4.1 | ) | | 13.4 |
| | 42.8 |
| | (29.4 | ) |
| Financing operations | | 2.5 |
| | 2.7 |
| | (0.2 | ) | | 4.8 |
| | 5.3 |
| | (0.5 | ) | | 2.3 |
| | 3.0 |
| | (0.7 | ) | | 7.0 |
| | 8.3 |
| | (1.3 | ) |
| Total revenue | | $ | 160.3 |
| | $ | 171.5 |
| | $ | (11.2 | ) | | $ | 323.8 |
| | $ | 347.4 |
| | $ | (23.6 | ) | | $ | 156.0 |
| | $ | 162.4 |
| | $ | (6.4 | ) | | $ | 479.8 |
| | $ | 509.8 |
| | $ | (30.0 | ) |
| Change vs. prior period | | (6.6 | )% | | | | | | (6.8 | )% | | | | | | (4.0 | )% | | | | | | (5.9 | )% | | | | |
Total revenue for the three and sixnine months ended JuneSeptember 30, 2016 decreased compared with the same period of the prior year, primarily because of the refranchising and sale of related restaurant assets of 23 Applebee's company-operated restaurants in the Kansas City area in July 2015, and decreases in Applebee's domestic same-restaurant sales.sales and the expected progressive decline in interest revenue from rental and financing operations as receivable balances are repaid. These unfavorable factors were partially offset by IHOP franchisee restaurant development over the past twelve months, higher IHOP franchise fees and increases in IHOP domestic same-restaurant sales.months.
|
| | | | | | | | | | | | | | | | | | | | | | | | |
| Gross Profit (Loss) | | Three months ended June 30, | | Favorable (Unfavorable) Variance | | Six months ended June 30, | | Favorable (Unfavorable) Variance |
| | | 2016 | | 2015 | | | 2016 | | 2015 | |
| | | (In millions) |
| Franchise operations | | $ | 87.5 |
| | $ | 86.2 |
| | $ | 1.3 |
| | $ | 176.8 |
| | $ | 175.2 |
| | $ | 1.6 |
|
| Rental operations | | 7.8 |
| | 7.8 |
| | 0.0 |
| | 16.0 |
| | 15.7 |
| | 0.3 |
|
| Company restaurant operations | | (0.2 | ) | | 0.1 |
| | (0.3 | ) | | (0.6 | ) | | 0.9 |
| | (1.5 | ) |
| Financing operations | | 2.3 |
| | 2.7 |
| | (0.4 | ) | | 4.6 |
| | 5.3 |
| | (0.7 | ) |
| Total gross profit | | $ | 97.4 |
| | $ | 96.8 |
| | $ | 0.6 |
| | $ | 196.8 |
| | $ | 197.1 |
| | $ | (0.3 | ) |
| Change vs. prior period | | 0.6 | % | | | | | | (0.2 | )% | | | | |
The increase in total gross profit for the three months ended June 30, 2016 compared with the same period of the prior year was primarily due to IHOP franchise development over the past twelve months, favorability in pancake and waffle dry mix and higher IHOP franchise fees, partially offset by a 4.2% decrease in Applebee's domestic same-restaurant sales and lower financing interest income. |
| | | | | | | | | | | | | | | | | | | | | | | | |
| Gross Profit (Loss) | | Three months ended September 30, | | Favorable (Unfavorable) Variance | | Nine months ended September 30, | | Favorable (Unfavorable) Variance |
| | | 2016 | | 2015 | | | 2016 | | 2015 | |
| | | (In millions) |
| Franchise operations | | $ | 81.9 |
| | $ | 86.8 |
| | $ | (4.9 | ) | | $ | 258.7 |
| | $ | 262.0 |
| | $ | (3.3 | ) |
| Rental operations | | 7.7 |
| | 8.0 |
| | (0.3 | ) | | 23.7 |
| | 23.7 |
| | 0.0 |
|
| Company restaurant operations | | (0.2 | ) | | (0.6 | ) | | 0.4 |
| | (0.7 | ) | | 0.3 |
| | (1.0 | ) |
| Financing operations | | 2.3 |
| | 2.5 |
| | (0.2 | ) | | 6.8 |
| | 7.8 |
| | (1.0 | ) |
| Total gross profit | | $ | 91.7 |
| | $ | 96.7 |
| | $ | (5.0 | ) | | $ | 288.5 |
| | $ | 293.8 |
| | $ | (5.3 | ) |
| Change vs. prior period | | (5.2 | )% | | | | | | (1.8 | )% | | | | |
The decrease in total gross profit for the sixthree months ended JuneSeptember 30, 2016 compared with the same period of the prior year was primarily due to a 3.9%$2.5 million franchisor contribution to the Applebee's marketing fund, a 5.2% decrease in Applebee's domestic same-restaurant sales and a decline in rental and financing interest income as receivable balances are repaid. These unfavorable items were partially offset by favorability in pancake and waffle dry mix and IHOP franchise development over the past twelve months.
The decrease in total gross profit for the nine months ended September 30, 2016 compared with the same period of the prior year was primarily due to a 4.4% decrease in Applebee's domestic same-restaurant sales, a $2.5 million franchisor contribution to Applebee's marketing fund, lower financing interest income and the refranchising and sale of related restaurant assets of 23 Applebee's company-operated restaurants in the Kansas City area in July 2015 and lower financing interest income.2015. These unfavorable factors were partially offset by IHOP franchise development over the past twelve months, favorability in pancake and waffle dry mix and lower bad debt expense and higher IHOP franchise fees.expense.
| | | | | Three months ended June 30, | | Favorable (Unfavorable) Variance | | Six months ended June 30, | | Favorable (Unfavorable) Variance | | Three months ended September 30, | | Favorable (Unfavorable) Variance | | Nine months ended September 30, | | Favorable (Unfavorable) Variance |
| Franchise Operations | | 2016 | | 2015 | | 2016 | | 2015 | | | 2016 | | 2015 | | 2016 | | 2015 | |
| | | (In millions, except number of restaurants) | | (In millions, except number of restaurants) |
Effective Franchise Restaurants:(1) | | | | | | | | | | | | | | | | | | | | | | | | |
| Applebee’s | | 2,028 |
| | 1,990 |
| | 38 |
| | 2,029 |
| | 1,991 |
| | 38 |
| | 2,028 |
| | 2,011 |
| | 17 |
| | 2,029 |
| | 1,998 |
| | 31 |
|
| IHOP | | 1,675 |
| | 1,638 |
| | 37 |
| | 1,673 |
| | 1,638 |
| | 35 |
| | 1,688 |
| | 1,648 |
| | 40 |
| | 1,677 |
| | 1,641 |
| | 36 |
|
| Franchise Revenues: | | |
| | |
| | |
| | |
| | | | | | |
| | |
| | |
| | |
| | | | |
| Applebee’s | | $ | 48.4 |
| | $ | 49.9 |
| | $ | (1.5 | ) | | $ | 99.5 |
| | $ | 102.3 |
| | $ | (2.8 | ) | | $ | 46.0 |
| | $ | 48.6 |
| | $ | (2.6 | ) | | $ | 145.5 |
| | $ | 150.9 |
| | $ | (5.4 | ) |
| IHOP | | 46.2 |
| | 44.1 |
| | 2.1 |
| | 92.0 |
| | 89.5 |
| | 2.5 |
| | 45.5 |
| | 45.0 |
| | 0.5 |
| | 137.5 |
| | 134.5 |
| | 3.0 |
|
| Advertising | | 27.9 |
| | 26.3 |
| | 1.6 |
| | 56.0 |
| | 53.0 |
| | 3.0 |
| | 27.7 |
| | 26.5 |
| | 1.2 |
| | 83.7 |
| | 79.5 |
| | 4.2 |
|
| Total franchise revenues | | 122.5 |
| | 120.3 |
| | 2.2 |
| | 247.5 |
| | 244.8 |
| | 2.7 |
| | 119.2 |
| | 120.1 |
| | (0.9 | ) | | 366.7 |
| | 364.9 |
| | 1.8 |
|
| Franchise Expenses: | | |
| | |
| | |
| | | | | | | | |
| | |
| | |
| | | | | | |
| Applebee’s | | 1.7 |
| | 1.7 |
| | 0.0 |
| | 3.6 |
| | 3.3 |
| | (0.3 | ) | | 4.5 |
| | 1.4 |
| | (3.1 | ) | | 8.1 |
| | 4.7 |
| | (3.4 | ) |
| IHOP | | 5.4 |
| | 6.1 |
| | 0.7 |
| | 11.1 |
| | 13.3 |
| | 2.2 |
| | 5.1 |
| | 5.4 |
| | 0.3 |
| | 16.2 |
| | 18.7 |
| | 2.5 |
|
| Advertising | | 27.9 |
| | 26.3 |
| | (1.6 | ) | | 56.0 |
| | 53.0 |
| | (3.0 | ) | | 27.7 |
| | 26.5 |
| | (1.2 | ) | | 83.7 |
| | 79.5 |
| | (4.2 | ) |
| Total franchise expenses | | 35.0 |
| | 34.1 |
| | (1.0 | ) | | 70.7 |
| | 69.6 |
| | (1.1 | ) | | 37.3 |
| | 33.3 |
| | (4.0 | ) | | 108.0 |
| | 102.9 |
| | (5.1 | ) |
| Franchise Segment Profit: | | |
| | |
| | |
| | | | | | | | |
| | |
| | |
| | | | | | |
| Applebee’s | | 46.7 |
| | 48.2 |
| | (1.5 | ) | | 95.9 |
| | 99.0 |
| | (3.1 | ) | | 41.5 |
| | 47.2 |
| | (5.7 | ) | | 137.4 |
| | 146.2 |
| | (8.8 | ) |
| IHOP | | 40.8 |
| | 38.0 |
| | 2.8 |
| | 80.9 |
| | 76.2 |
| | 4.7 |
| | 40.4 |
| | 39.6 |
| | 0.8 |
| | 121.3 |
| | 115.8 |
| | 5.5 |
|
| Total franchise gross profit | | $ | 87.5 |
| | $ | 86.2 |
| | $ | 1.3 |
| | $ | 176.8 |
| | $ | 175.2 |
| | $ | 1.6 |
| | $ | 81.9 |
| | $ | 86.8 |
| | $ | (4.9 | ) | | $ | 258.7 |
| | $ | 262.0 |
| | $ | (3.3 | ) |
Gross profit as % of revenue (2) | | 71.4 | % | | 71.7 | % | | | | 71.4 | % | | 71.6 | % | | | | 68.7 | % | | 72.3 | % | | | | 70.5 | % | | 71.8 | % | | |
_____________________________________________________
(1) Effective Franchise Restaurants are the weighted average number of franchise and area license restaurants open in a given fiscal period, adjusted to account for restaurants open for only a portion of the period.
(2) Percentages calculated on actual amounts, not rounded amounts presented above.
Applebee’s franchise revenue for the three months ended JuneSeptember 30, 2016 declined from the same period of the prior year, primarily due to a 4.2%5.2% decrease in domestic same-restaurant sales partially offset by $0.4 million of royalty revenues from the 23 refranchised restaurants discussed above.and a decline in franchise extension fees. Applebee’s franchise revenue for the sixnine months ended JuneSeptember 30, 2016 declined from the same period of the prior year, primarily because of a 3.9%4.4% decrease in domestic same-restaurant sales and lower franchise fees, partially offset by $0.9an increase of $1.0 million of royalty revenues from the 23 refranchised restaurants discussed above.
The increase in IHOP franchise revenue for the three months ended JuneSeptember 30, 2016 was primarily due to a 2.3%2.4% increase in Effective Franchise Restaurants higher franchise fees and favorability in pancake and waffle dry mix sales, partially offset by a 0.2% increasedecrease in franchise domestic same-restaurant sales.transfer fees. The increase in IHOP franchise revenue for the sixnine months ended JuneSeptember 30, 2016 was primarily due to a 2.1%2.2% increase in Effective Franchise Restaurants, higher franchise feesfavorability in pancake and waffle dry mix sales and a 0.8%0.5% increase in franchise domestic same-restaurant sales.
The increases in Applebee's franchise expenses for the three and nine months ended September 30, 2016 compared with the same periods of the prior year was primarily due to a $2.5 million franchisor contribution to the Applebee's national advertising fund for marketing-related initiatives, as well as an increase in bad debt expense.
The decrease in IHOP franchise expenses for the three months ended JuneSeptember 30, 2016 compared with the same period of the prior year was primarily due to favorability in pancake and waffle dry mix. The decrease in IHOP franchise expenses for the sixnine months ended JuneSeptember 30, 2016 compared with the same period of the prior year was primarily due to favorability in pancake and waffle dry mix and a decrease in bad debt expense.
Advertising contributions designated for IHOP’s national advertising fund and local marketing and advertising cooperatives, as well as advertising contributions from certain international franchise restaurants of both brands, are recognized as revenue and expense of franchise operations. However, because we have less contractual control over Applebee’s domestic advertising expenditures, that activity is considered to be an agency relationship and therefore is not recognized as franchise revenue and expense. The increases in advertising revenue and expense for the three and sixnine months ended JuneSeptember 30, 2016 were primarily because of the increases of 2.3% and 2.1%, respectively, in newIHOP franchise restaurants as discussed above.
Gross profit as a percentage of revenue declined for three and nine months ended September 30, 2016 compared to the same respective periods of the prior year primarily because of the $2.5 million franchisor contribution to the Applebee's national advertising fund as well as the increases of 0.2%in advertising revenue which generate no incremental gross profit, partially offset by favorability in pancake and 0.8%, respectively, in domestic franchise same-restaurant sales that favorably impacted IHOP franchise revenue as discussed above.
waffle dry mix.
| | | Rental Operations | | Three months ended June 30, | | Favorable
(Unfavorable) Variance | | Six months ended June 30, | | Favorable
(Unfavorable) Variance | | Three months ended September 30, | | Favorable
(Unfavorable) Variance | | Nine months ended September 30, | | Favorable
(Unfavorable) Variance |
| | | 2016 | | 2015 | | 2016 | | 2015 | | | 2016 | | 2015 | | 2016 | | 2015 | |
| | | (In millions) | | (In millions) |
| Rental revenues | | $ | 30.8 |
| | $ | 31.1 |
| | $ | (0.3 | ) | | $ | 62.2 |
| | $ | 62.5 |
| | $ | (0.3 | ) | | $ | 30.5 |
| | $ | 31.2 |
| | $ | (0.7 | ) | | $ | 92.7 |
| | $ | 93.8 |
| | $ | (1.1 | ) |
| Rental expenses | | 23.0 |
| | 23.3 |
| | 0.3 |
| | 46.3 |
| | 46.8 |
| | 0.5 |
| | 22.8 |
| | 23.2 |
| | 0.4 |
| | 69.0 |
| | 70.1 |
| | 1.1 |
|
| Rental operations gross profit | | $ | 7.8 |
| | $ | 7.8 |
| | $ | 0.0 |
| | $ | 16.0 |
| | $ | 15.7 |
| | $ | 0.3 |
| | $ | 7.7 |
| | $ | 8.0 |
| | $ | (0.3 | ) | | $ | 23.7 |
| | $ | 23.7 |
| | $ | 0.0 |
|
Gross profit as % of revenue (1) | | 25.3 | % | | 25.1 | % | | | | 25.7 | % | | 25.1 | % | | | | 25.4 | % | | 25.5 | % | | | | 25.6 | % | | 25.3 | % | | |
(1) Percentages calculated on actual amounts, not rounded amounts presented above.
Rental operations relate primarily to IHOP franchise restaurants. Rental income includes revenue from operating leases and interest income from direct financing leases. Rental expenses are costs of prime operating leases and interest expense on prime capital leases on certain franchise restaurants.
Rental segment revenue for the three and sixnine months ended JuneSeptember 30, 2016 was lower than the same periods in the prior year primarily due to the expected progressive declines of $0.3 million and $0.6$0.9 million, respectively, in interest income as direct financing leases are repaid. The decreaserepaid, as well as decreases in interestrental income for the six months ended June 30, 2016 was partially offset by scheduled increases in base rental income.based on a percentage of franchisees' retail sales. Rental segment expenses decreased for the three and sixnine months ended JuneSeptember 30, 2016 compared to the same period of the prior year primarily because of the expected progressive decline in interest expense as capital lease obligations are repaid.
| | | Company Restaurant | | Three months ended June 30, | | Favorable
(Unfavorable) Variance | | Six months ended June 30, | | Favorable
(Unfavorable) Variance | | Three months ended September 30, | | Favorable
(Unfavorable) Variance | | Nine months ended September 30, | | Favorable
(Unfavorable) Variance |
| Operations | | 2016 | | 2015 | | 2016 | | 2015 | | | 2016 | | 2015 | | 2016 | | 2015 | |
| | | (In millions) | | (In millions, except number of restaurants) |
Effective Company Restaurants:(1) | | | | | | | | | | | | | |
| Applebee’s | | | — |
| | 5 |
| | (5 | ) | | — |
| | 17 |
| | (17 | ) |
| IHOP | | | 10 |
| | 12 |
| | (2 | ) | | 11 |
| | 13 |
| | (2 | ) |
| | | | | | | | | | | | | | |
| Company restaurant sales | | $ | 4.5 |
| | $ | 17.4 |
| | $ | (12.9 | ) | | $ | 9.3 |
| | $ | 34.8 |
| | $ | (25.5 | ) | | $ | 4.0 |
| | $ | 8.1 |
| | $ | (4.1 | ) | | $ | 13.4 |
| | $ | 42.8 |
| | $ | (29.4 | ) |
| Company restaurant expenses | | 4.7 |
| | 17.3 |
| | 12.6 |
| | 9.9 |
| | 33.9 |
| | 24.0 |
| | 4.2 |
| | 8.7 |
| | 4.5 |
| | 14.1 |
| | 42.6 |
| | 28.4 |
|
| Company restaurant gross profit | | $ | (0.2 | ) | | $ | 0.1 |
| | $ | (0.3 | ) | | $ | (0.6 | ) | | $ | 0.9 |
| | $ | (1.5 | ) | | $ | (0.2 | ) | | $ | (0.6 | ) | | $ | 0.4 |
| | $ | (0.7 | ) | | $ | 0.3 |
| | $ | (1.0 | ) |
Gross profit as % of revenue (1) | | (4.9 | )% | | 0.8 | % | | |
| | (6.7 | )% | | 2.6 | % | | | |
| Gross profit as % of revenue (2) | | | (3.4 | )% | | (6.8 | )% | | |
| | (5.7 | )% | | 0.8 | % | | |
(1) Effective Company Restaurants are the weighted average number of franchise and area license restaurants open in a given fiscal period, adjusted to account for restaurants open for only a portion of the period.
(2) Percentages calculated on actual amounts, not rounded amounts presented above.
As discussed under “Events Impacting Comparability of Financial Information,” above, we refranchised 23 Applebee’s company-operated restaurants in the Kansas City, Missouri market area in July 2015. Company restaurant revenues and expenses for three and sixnine months ended JuneSeptember 30, 2016 only reflect the operation of 11 effective IHOP company restaurants, whereas restaurant revenues and expenses for three and sixnine months ended JuneSeptember 30, 2015, reflect the operation of 13 effective IHOP company restaurants as well as the 23 Applebee's restaurants.
company restaurants through July, 2015.
| | | Financing Operations | | Three months ended June 30, | | Favorable
(Unfavorable) Variance | | Six months ended June 30, | | Favorable
(Unfavorable) Variance | | Three months ended September 30, | | Favorable
(Unfavorable) Variance | | Nine months ended September 30, | | Favorable
(Unfavorable) Variance |
| | | 2016 | | 2015 | | 2016 | | 2015 | | | 2016 | | 2015 | | 2016 | | 2015 | |
| | | (In millions) | | (In millions) |
| Financing revenues | | $ | 2.5 |
| | $ | 2.7 |
| | $ | (0.2 | ) | | $ | 4.8 |
| | $ | 5.3 |
| | $ | (0.5 | ) | | $ | 2.3 |
| | $ | 3.0 |
| | $ | (0.7 | ) | | $ | 7.0 |
| | $ | 8.3 |
| | $ | (1.3 | ) |
| Financing expenses | | 0.2 |
| | — |
| | (0.2 | ) | | 0.2 |
| | 0.0 |
| | (0.2 | ) | | 0.0 |
| | 0.5 |
| | 0.5 |
| | 0.2 |
| | 0.5 |
| | 0.3 |
|
| Financing operations gross profit | | $ | 2.3 |
| | $ | 2.7 |
| | $ | (0.4 | ) | | $ | 4.6 |
| | $ | 5.3 |
| | $ | (0.7 | ) | | $ | 2.3 |
| | $ | 2.5 |
| | $ | (0.2 | ) | | $ | 6.8 |
| | $ | 7.8 |
| | $ | (1.0 | ) |
Gross profit as % of revenue (1) | | 94.0 | % | | 100.0 | % | | |
| | 96.9 | % | | 99.8 | % | | | | 99.6 | % | | 83.4 | % | | |
| | 97.8 | % | | 93.8 | % | | |
(1) Percentages calculated on actual amounts, not rounded amounts presented above.
All financing operations relate to IHOP franchise restaurants. Financing revenues primarily consist of interest income from the financing of equipment leases and franchise fees, as well as sales of equipment associated with refranchised IHOP restaurants. Financing expenses are primarily the cost of restaurant equipment associated with refranchised IHOP restaurants.
The decrease in financing revenue for the three and sixnine months ended JuneSeptember 30, 2016 was primarily due to the expected progressive decline of $0.3$0.4 million and $0.5$1.1 million, respectively, in interest revenue as note balances are repaid.
The smaller variances in financing revenues and expenses relate to fewer sales of equipment associated with refranchised IHOP restaurants in 2016 compared to 2015.
|
| | | | | | | | | | | | | | | | | | | | | | | | |
Other Expense and | | Three months ended June 30, | | Favorable
(Unfavorable) Variance | | Six months ended June 30, | | Favorable
(Unfavorable) Variance |
| Income Items | | 2016 | | 2015 | | | 2016 | | 2015 | |
| | | (In millions) |
| G&A expenses | | $ | 36.5 |
| | $ | 34.6 |
| | $ | (1.9 | ) | | $ | 75.9 |
| | $ | 68.8 |
| | $ | (7.1 | ) |
| Interest expense | | 15.4 |
| | 15.7 |
| | 0.3 |
| | 30.7 |
| | 31.3 |
| | 0.6 |
|
| Amortization of intangible assets | | 2.5 |
| | 2.5 |
| | — |
| | 5.0 |
| | 5.0 |
| | 0.0 |
|
| Closure and impairment charges | | 3.3 |
| | 0.5 |
| | (2.8 | ) | | 3.7 |
| | 2.3 |
| | (1.4 | ) |
| (Gain) loss on disposition of assets | | (0.0 | ) | | 0.1 |
| | 0.1 |
| | 0.6 |
| | 0.1 |
| | (0.5 | ) |
| Income tax provision | | 12.9 |
| | 16.6 |
| | 3.7 |
| | 28.5 |
| | 34.3 |
| | 5.8 |
|
General and Administrative Expenses |
| | | | | | | | | | | | | | | | | | | | | | | | |
| General and Administrative Expenses | | Three months ended September 30, | | Favorable
(Unfavorable) Variance | | Nine months ended September 30, | | Favorable
(Unfavorable) Variance |
| | | 2016 | | 2015 | | | 2016 | | 2015 | |
| | | (In millions) |
| G&A expenses | | $ | 36.0 |
| | $ | 41.6 |
| | $ | 5.6 |
| | $ | 111.9 |
| | $ | 110.4 |
| | $ | (1.5 | ) |
The increasedecrease in G&A expenses for the three months ended JuneSeptember 30, 2016 compared to the same period of the prior year was primarily due to a decrease of $5.5 million in personnel-related costs and a decrease of $0.9 million in depreciation charges, partially offset by an increase of $1.7$1.4 million in personnel-related costs.costs of franchisee conferences. The increasedecrease in personnel-related costs was primarily becausedue to two factors: charges of higher costs of stock-based compensation, higher salary and benefits costs for several senior management positions filled after$3.3 million incurred in the firstthird quarter of 2015 and higher severance costs, partially offset by lower bonus costs. Approximately $0.5 million of G&A expenses for the three months ended June 30, 2016 related to the consolidation action discussed under “Events Impacting Comparability of Financial Information,” above.above that did not recur in 2016; and lower costs of incentive compensation in 2016 of $1.9 million. The increase in costs of franchisee conferences was primarily due to the timing of our brands' franchisee conferences that took place in the third quarter of 2016 as compared to the fourth quarter of 2015.
The increase in G&A expenses for the sixnine months ended JuneSeptember 30, 2016 compared to the same period of the prior year was primarily due to increases of $3.9 million in personnel-related costs, $1.7$2.5 million in costs of franchisee conferences and travel and $1.4 million in recruiting and relocation costs, partially offset by $1.6 million in addition to higherlower personnel-related costs and lower costs for consumer research of $0.6 million. The increase in costs of professional servicesfranchisee conferences was primarily due to the timing of our brands' franchisee conferences which took place in the third quarter of 2016 as compared to the fourth quarter of 2015. The increase in recruiting and depreciation.relocation costs was due to personnel movement associated with the consolidation action discussed under “Events Impacting Comparability of Financial Information,” above. The increasedecrease in personnel-related costs was due primarily to higher costscharges of stock-based compensation, higher salary and benefits costs for several senior management positions filled after$3.3 million incurred in the firstthird quarter of 2015 and higher severance costs, partially offset by lower bonus costs. Approximately $2.6 million of the $7.1 million increase in G&A for the six months ended June 30, 2016 related to the consolidation action discussed under “Events Impacting Comparability of Financial Information,” above.above that did not recur in 2016 and lower costs of incentive compensation in 2016, partially offset by higher costs of stock-based compensation, salary and benefits for several senior management positions that were open during portions of the nine months ended September 30, 2015.
|
| | | | | | | | | | | | | | | | | | |
Other Expense and Income Items | | Three months ended September 30, | | Favorable
(Unfavorable) Variance | | Nine months ended September 30, | | Favorable
(Unfavorable) Variance |
| | | 2016 | | 2015 | | | 2016 | | 2015 | |
| | | (In millions) |
| Interest expense | | 15.4 |
| | 15.4 |
| | 0.0 |
| | 46.1 |
| | 46.8 |
| | 0.7 |
|
| Amortization of intangible assets | | 2.5 |
| | 2.5 |
| | — |
| | 7.5 |
| | 7.5 |
| | 0.0 |
|
| Closure and impairment charges | | 0.2 |
| | (0.1 | ) | | (0.3 | ) | | 4.0 |
| | 2.2 |
| | (1.8 | ) |
| Loss (gain) on disposition of assets | | 0.1 |
| | (2.3 | ) | | (2.4 | ) | | 0.7 |
| | (2.3 | ) | | (3.0 | ) |
| Total | | 18.2 |
| | 15.5 |
| | (2.7 | ) | | 58.3 |
| | 54.2 |
| | (4.1 | ) |
Closure and Impairment Charges
The increaseBoth the amount of and the change in closure and impairment charges for the three months ended JuneSeptember 30, 2016 were not significant. The increase in closure and impairment charges for the nine months ended September 30, 2016 was primarily due to the $2.5 million of lease termination costs related to the consolidation action discussed under “Events Impacting Comparability of Financial Information,” above.
The increase in closure and impairment charges for the six months ended June 30, 2016 was primarily due to the $2.5 million of lease termination costs related to the consolidation action notedInformation” above, partially offset by a decrease in charges related to IHOP and Applebee's restaurants. Closure and impairment charges related to restaurants of $1.2were $1.5 million for the sixnine months ended JuneSeptember 30, 2016, were comprised of approximately $1.0 million of impairment charges and $0.2$0.5 million of closure charges. The largest individually significant impairment charge of $0.6 million related to one IHOP company-operated restaurant; the closure charges related to adjustments for IHOP and Applebee's restaurants closed in prior periods.
For the sixnine months ended JuneSeptember 30, 2015, closure and impairment charges were $2.3$2.2 million, comprised of $1.6$1.5 million in closure charges and $0.7 million of impairment charges. Approximately $1.1 million of closure charges related to two IHOP franchise restaurants closed during 2015, with approximately $0.4 million related to adjustments for IHOP and Applebee's restaurants closed in prior periods. The impairment charges were individually insignificant charges attrubutableattributable to eight IHOP company-operated restaurants and one parcel of vacant land.
During the sixnine months ended JuneSeptember 30, 2016, we performed assessments to determine whether events or changes in circumstances have occurred which would potentially indicate the carrying value of tangible long-lived assets may not be recoverable. No significant impairments were noted in performing the assessments. We also considered whether there were any indicators of potential impairment to our goodwill and indefinite-lived intangible assets. No such indicators were noted.
Loss (Gain) on Disposition of Assets
As discussed under “Events Impacting Comparability of Financial Information,” above, in July 2015, we completed the refranchising and sale of related restaurant assets of 23 Applebee’s company-operated restaurants in the Kansas City area. We received proceeds of approximately $9 million from the sale and recognized a gain of approximately $2 million on the transaction. There were no other individually significant asset dispositions during the three and nine months ended September 30, 2016 and 2015, respectively.
Provision for Income Taxes
Our effective tax rate was 32.5%35.3% for the three months ended JuneSeptember 30, 2016, as compared to 38.2%38.7% for the three months ended JuneSeptember 30, 2015. The effective tax rate for the three months ended September 30, 2016 was lower primarily due to favorable foreign return-to-provision adjustments that lowered the effective rate for the third quarter of 2016 and an unfavorable adjustment to tax reserves recorded in the third quarter of 2015 that raised the effective rate for three months ended September 30, 2015.
Our effective tax rate was 35.2% for the sixnine months ended JuneSeptember 30, 2016 as compared to 38.3%38.4% for the sixnine months ended JuneSeptember 30, 2015. In each case, theThe lower rate primarily was due to the adjustment to deferred tax balances as a result of the consolidation action discussed under “Events Impacting Comparability of Financial Information,” above. This change lowered our combined effective tax rate for the nine months ended September 30, 2016 from what would have been 36.9%, without the adjustment, to 35.2%.
Liquidity and Capital Resources
At JuneSeptember 30, 2016, our outstanding long-term debt consisted of $1.3 billion of Series 2014-1 4.277% Fixed Rate Senior Notes, Class A-2 (the “Class A-2 Notes”). We also have a revolving financing facility consisting of Series 2014-1 Variable Funding Senior Notes, Class A-1 (the “Variable Funding Notes”), which allows for drawings of up to $100 million of Variable Funding Notes and the issuance of letters of credit. The Class A-2 Notes and the Variable Funding Notes are referred to collectively as the “Notes.” The Notes were issued in a private securitization transaction pursuant to which substantially all of our domestic revenue-generating assets and our domestic intellectual property are held by certain special-purpose, wholly-owned indirect subsidiaries of the Company (the “Guarantors”) that act as guarantors of the Notes and that have pledged substantially all of their assets to secure the Notes.
While the Notes are outstanding, payment of principal and interest is required to be made on the Class A-2 Notes on a quarterly basis. The quarterly principal payment of $3.25 million on the Class A-2 Notes may be suspended when the leverage ratio for the Company and its subsidiaries is less than or equal to 5.25x. At JuneSeptember 30, 2016, our leverage ratio was 4.59x4.61x (see Exhibit 12.1). Our leverage ratio has been less than 5.25x for each quarterly period since the Notes were issued and accordingly, no payments of principal have been required.
The Variable Funding Notes were not drawn upon at JuneSeptember 30, 2016 and we have not drawn on them since issuance. At JuneSeptember 30, 2016, $5.1$5.0 million was pledged against the Variable Funding Notes for outstanding letters of credit, leaving $94.9$95.0 million of Variable Funding Notes available for borrowings. The letters of credit are used primarily to satisfy insurance-related collateral requirements.
The Notes are subject to customary rapid amortization events for similar types of financing, including events tied to our failure to maintain the stated debt service coverage ratio (“DSCR”), the sum of domestic retail sales for all restaurants being below certain levels on certain measurement dates, certain manager termination events, certain events of default and the failure to repay or refinance the Notes on the Class A-2 Anticipated Repayment Date in September 2021. The Notes are also subject to certain customary events of default, including events relating to non-payment of required interest, principal or other amounts due on or with respect to the Notes, failure to maintain the stated DSCR, failure to comply with covenants within certain time frames, certain bankruptcy events, breaches of specified representations and warranties and certain judgments.
Failure to maintain a prescribed DSCR can trigger a Cash Trapping Event, A Rapid Amortization Event, a Manager Termination Event or a Default Event as described below. In a Cash Trapping Event, the Trustee is required to retain a certain percentage of excess Cash Flow (as defined) in a restricted account. In a Rapid Amortization Event, all excess Cash Flow is retained and used to retire principal amounts of debt. Key DSCRs are as follows:
•DSCR less than 1.75x but equal to or greater than 1.50x - Cash Trapping Event, 50% of Net Cash Flow
•DSCR less than 1.50x - Cash Trapping Event, 100% of Net Cash Flow
•DSCR less than 1.30x - Rapid Amortization Event
•DSCR less than 1.20x - Manager Termination Event
•DSCR less than 1.10x - Default Event
Our DSCR for the reporting period ended JuneSeptember 30, 2016 was 5.38x5.30x (see Exhibit 12.1).
Dividends
During the sixnine months ended JuneSeptember 30, 2016, we paid dividends on common stock of $34.0$50.8 million, representing cash dividends of $0.92 per share declared in botheach of the fourth quarter of 2015 and first quarterand second quarters of 2016. On May 16, 2016, the Company's Board of Directors declared a second quarter 2016 cash dividend of $0.92 per share of common stock. This dividend was paid on July 8, 2016 to the Company's stockholders of record at the close of business on June 17, 2016. We reported dividends payable of $16.8 million at June 30, 2016.
On July 28, 2016, the Company'sour Board of Directors declared a third quarter 2016 cash dividend of $0.92 per share of common stock, payablestock. This dividend was paid on October 7, 2016 to the Company's stockholders of record at the close of business on September 16, 2016. We reported dividends payable of $16.7 million at September 30, 2016.
On October 31, 2016, our Board of Directors declared a fourth quarter 2016 cash dividend of $0.97 per share of common stock, payable on January 6, 2017 to the Company's stockholders of record at the close of business on December 16, 2016. This represents an increase of 5.4% from the cash dividend of $0.92 per share of common stock we paid in each of the fourth quarter of 2015 and the first three quarters of 2016.
We evaluate dividend payments on common stock within the context of our overall capital allocation strategy with our Board of Directors on an ongoing basis, giving consideration to our current and forecasted earnings, financial condition, cash requirements and other factors.
Share Repurchases
In October 2015, our Board of Directors approved a stock repurchase program authorizing us to repurchase up to $150 million of DineEquity common stock (the “2015 Repurchase Program”) on an opportunistic basis from time to time in open market transactions and in privately negotiated transactions based on business, market, applicable legal requirements and other considerations. The 2015 Repurchase Program, as approved by the Board of Directors, does not require the repurchase of a specific number of shares and can be terminated at any time. A summary of shares repurchased under the 2015 Repurchase Program is as follows:
|
| | | | | | |
| | Shares | | Cost of shares |
| | | | (In millions) |
| Repurchased during the six months ended June 30, 2016 | 395,891 |
| | $ | 35.0 |
|
| Cumulative repurchases as of June 30, 2016 | 600,378 |
| | $ | 52.5 |
|
| Remaining dollar value of shares that may be repurchased | N/A | | $ | 97.5 |
|
|
| | | | | | |
| | Shares | | Cost of shares |
| | | | (In millions) |
| Repurchased during the nine months ended September 30, 2016 | 525,550 |
| | $ | 45.0 |
|
| Cumulative repurchases as of September 30, 2016 | 730,037 |
| | $ | 62.5 |
|
| Remaining dollar value of shares that may be repurchased | N/A | | $ | 87.5 |
|
We evaluate repurchases of common stock within the context of our overall capital allocation strategy with our Board of Directors on an ongoing basis, giving consideration to our current and forecasted earnings, financial condition, cash requirements and other factors. From time to time, we also repurchase shares owned and tendered by employees to satisfy tax withholding obligations on the vesting of restricted stock awards. Shares are deemed purchased at the closing price of our common stock on the vesting date. See Part II, Item 2 of Part II for more detail on our share repurchase activity during the secondthird quarter of 2016.
Cash Flows
In summary, our cash flows for the sixnine months ended JuneSeptember 30, 2016 and 2015 were as follows:
| | | | Six months ended June 30, | | | Nine months ended September 30, | | |
| | 2016 | | 2015 | | Variance | 2016 | | 2015 | | Variance |
| | (In millions) | (In millions) |
| Net cash provided by operating activities | $ | 53.9 |
| | $ | 48.1 |
| | $ | 5.8 |
| $ | 62.1 |
| | $ | 70.6 |
| | $ | (8.5 | ) |
| Net cash provided by investing activities | 6.5 |
| | 5.6 |
| | 0.9 |
| 10.0 |
| | 21.2 |
| | (11.2 | ) |
| Net cash used in financing activities | (86.9 | ) | | (53.3 | ) | | (33.6 | ) | (109.1 | ) | | (89.9 | ) | | (19.2 | ) |
| Net (decrease) increase in cash and cash equivalents | $ | (26.5 | ) | | $ | 0.4 |
| | $ | (26.9 | ) | $ | (37.0 | ) | | $ | 1.9 |
| | $ | (38.9 | ) |
Operating Activities
The increasedecrease in cash provided by operating activities for the sixnine months ended JuneSeptember 30, 2016 was primarily due to net changes in working capital. Our net income for the sixnine months ended JuneSeptember 30, 2016 decreased $2.9 million compared to the same period of 2015, primarily because of a decrease in gross profit, an increase in closure and impairment charges and G&A expenses and closure and impairment charges,a gain on asset disposition in 2015 that did not recur in 2016, partially offset by a lower effective tax rate, eachrate. Each of whichthese factors was discussed in preceding sections of MD&A. Our net income plus the non-cash reconciling items shown in the statement of cash flows (primarily depreciation, deferred taxes, and stock-based compensation items)items and loss/gain on disposition of assets) was essentially the same in both periods.
Net changes in working capital used cash of $11.9$36.1 million during the first sixnine months of 2016 compared to cash used of $17.5$28.1 million during the first sixnine months of 2015, a favorablean unfavorable variance of $5.6$7.9 million.
The favorableunfavorable variance in working capital changes was primarily due to our having paid less cash for interest on long-term debtcollected from gift card receivables during the nine months ended September 30, 2016 and an increase in advertising funds and marketing accruals, partially offset by lessa decrease in cash collected from gift card receivables during the six months ended June 30, 2016. Under the terms of the Notes issued in the fourth quarter of 2014, our first interest payment, representing five months of accruedpaid for interest on the Notes, was made in the first quarter of 2015. All subsequent quarterly payments of interest, including the payments made in the first and second quarters of 2016, represented three months of accrued interest on the Notes. As a result, we paid six months of interest in the six months ended June 30, 2016 as compared to eight months of interest in the six months ended June 30, 2015.
long-term debt. Each year, a high volume of gift card sales by third-party vendors takes place during the December holiday season, and collection of the receivables from those sales follows shortly thereafter. We have a 52/53 week fiscal year, and our 2015 fiscal year that ended January 3, 2016 contained 53 weeks and the fourth fiscal quarter of 2015 contained 14 weeks. Because of this timing, an extra week of higher-volume holiday gift card collections fell into the fourth fiscal quarter of 2015 as opposed to fiscal 2016.
Under the terms of the Notes issued in the fourth quarter of 2014, our first interest payment, representing five months of accrued interest on the Notes, was made in the first quarter of 2015. All subsequent quarterly payments of interest, including the payments made in the first three quarters of 2016, represented three months of accrued interest on the Notes. As a result, we paid nine months of interest during the nine months ended September 30, 2016 as compared to 11 months of interest during the nine months ended September 30, 2015.
Investing Activities
Investing activities provided net cash of $6.510.0 million for the sixnine months ended JuneSeptember 30, 2016. Principal receipts from notes, equipment contracts and other long-term receivables of $8.714.0 million were partially offset by $1.93.5 million in capital expenditures. Capital expenditures are expected to be approximately $8 million for fiscal 2016.
Financing Activities
Financing activities used net cash of $86.9109.1 million for the sixnine months ended JuneSeptember 30, 2016. Cash used in financing activities primarily consisted of repurchases of our common stock totaling $35.0 million, cash dividends paid on our common stock totaling $34.050.8 million, an increase in restricted cashrepurchases of $10.3our common stock totaling $45.0 million, repayments of capital lease obligations of $6.9$10.4 million ,an increase in restricted cash of $2.4 million and a net cash outflow of approximately $0.70.4 million related to equity compensation awards.
Cash and Cash Equivalents
At JuneSeptember 30, 2016, our cash and cash equivalents totaled $118.3107.8 million, including $53.6$41.5 million of cash held for gift card programs and advertising funds.
Based on our current level of operations, we believe that our cash flow from operations, available cash and available borrowing capacity under our Variable Funding Notes will be adequate to meet our liquidity needs for the next twelve months.
Adjusted Free Cash Flow
We define “free“adjusted free cash flow” for a given period as cash provided by operating activities, plus receipts from notes and equipment contract receivables, less additions to property and equipment. WeManagement uses this liquidity measure in its periodic assessment of, among other things, cash dividends per share of common stock and repurchases of common stock and we believe this informationit is helpful toimportant for investors to determine our cash available for general corporate purposes and for the return of cash to stockholders pursuant to our capital allocation strategy, and ishave the same measure used by management for thesethat purpose. Adjusted free cash flow does not represent residual cash flow available for discretionary purposes.
FreeAdjusted free cash flow is considered to be a non-U.S. GAAP measure. Reconciliation of the cash provided by operating activities to adjusted free cash flow is as follows:
| | | | Six months ended June 30, | | | Nine months ended September 30, | | |
| | 2016 | | 2015 | | Variance | 2016 | | 2015 | | Variance |
| | (In millions) | (In millions) |
| Cash flows provided by operating activities | $ | 53.9 |
| | $ | 48.1 |
| | $ | 5.8 |
| $ | 62.1 |
| | $ | 70.6 |
| | $ | (8.5 | ) |
| Receipts from notes and equipment contracts receivable | 4.4 |
| | 6.2 |
| | (1.8 | ) | 7.6 |
| | 10.8 |
| | (3.2 | ) |
| Additions to property and equipment | (1.9 | ) | | (4.6 | ) | | 2.7 |
| (3.5 | ) | | (5.8 | ) | | 2.3 |
|
| Free cash flow | $ | 56.4 |
| | $ | 49.7 |
| | $ | 6.7 |
| |
| Adjusted free cash flow | | $ | 66.2 |
| | $ | 75.6 |
| | $ | (9.4 | ) |
This non-U.S. GAAP measure is not defined in the same manner by all companies and may not be comparable to other similarly titled measures of other companies. Non-U.S. GAAP measures should be considered in addition to, and not as a substitute for, the U.S. GAAP information contained within our financial statements.
The increasedecrease in adjusted free cash flow for the sixnine months ended JuneSeptember 30, 2016 compared to the same period of the prior year is primarily due to the increasedecrease in cash from operating activities discussed above.above and a decrease in receipts from notes and equipment contract receivables, partially offset by lower capital expenditures.
Off-Balance Sheet Arrangements
We have obligations for guarantees on certain franchisee lease agreements, as disclosed in Note 10 - Commitments and Contingencies, of Notes to Consolidated Financial Statements of Part I, Item 1 of this Form 10-Q. Other than such guarantees, we did not have any off-balance sheet arrangements, as defined in Item 303(a)(4) of SEC Regulation S-K as of JuneSeptember 30, 2016.
Contractual Obligations and Commitments
There were no material changes to the contractual obligations table as disclosed in our Annual Report on Form 10-K for the year ended December 31, 2015.
Critical Accounting Policies and Estimates
The preparation of financial statements in accordance with U.S. GAAP requires us to make estimates and assumptions affecting the reported amounts of assets and liabilities at the date of the financial statements and the reported amounts of net revenues and expenses in the reporting period. We base our estimates and assumptions on current facts, historical experience and various other factors that we believe to be reasonable under the circumstances, the results of which form the basis for making judgments about the carrying values of assets and liabilities and the accrual of costs and expenses that are not readily apparent from other sources. We continually review the estimates and underlying assumptions to ensure they are appropriate for the circumstances. Accounting assumptions and estimates are inherently uncertain and actual results may differ materially from our estimates.
A summary of our critical accounting estimates is included in Management’s Discussion and Analysis of Financial Condition and Results of Operations contained in our Annual Report on Form 10-K for the year ended December 31, 2015. During the sixnine months ended JuneSeptember 30, 2016, there were no significant changes in our estimates and critical accounting policies.
See Note 3, “Accounting Policies,” in the Notes to Consolidated Financial Statements for a discussion of recently adopted accounting standards and newly issued accounting standards.
Item 3. Quantitative and Qualitative Disclosures about Market Risk.
There were no material changes from the information contained in the Company’s Annual Report on Form 10-K for the year ended December 31, 2015.
Item 4. Controls and Procedures.
Disclosure Controls and Procedures.
The Company’s management, with the participation of the Company’s Chief Executive Officer and Chief Financial Officer, has evaluated the effectiveness of the Company’s disclosure controls and procedures (as such term is defined in Rules 13a-15(e) and 15d-15(e) under the Securities Exchange Act of 1934, as amended (the “Exchange Act”)) as of the end of the period covered by this report. Based on such evaluation, the Company’s Chief Executive Officer and Chief Financial Officer have concluded that, as of the end of such period, the Company’s disclosure controls and procedures are effective at the reasonable assurance level.
Changes in Internal Control Over Financial Reporting.
There have been no changes in the Company’s internal control over financial reporting (as such term is defined in Rules 13a-15(f) and 15d-15(f) under the Exchange Act) during the fiscal quarter to which this report relates that have materially affected, or are reasonably likely to materially affect, the Company’s internal control over financial reporting.
Part II. OTHER INFORMATION
Item 1. Legal Proceedings.
We are subject to various lawsuits, administrative proceedings, audits and claims arising in the ordinary course of business. Some of these lawsuits purport to be class actions and/or seek substantial damages. We are required to record an accrual for litigation loss contingencies that are both probable and reasonably estimable. Legal fees and expenses associated with the defense of all of our litigation are expensed as such fees and expenses are incurred. Management regularly assesses our insurance deductibles, analyzes litigation information with our attorneys and evaluates our loss experience in connection with pending legal proceedings. While we do not presently believe that any of the legal proceedings to which we are currently a party will ultimately have a material adverse impact on us, there can be no assurance that we will prevail in all the proceedings we are party to, or that we will not incur material losses from them.
Item 1A. Risk Factors.
There are no material changes from the risk factors set forth under Item 1A of Part I of the Company’s Annual Report on Form 10-K for the fiscal year ended December 31, 2015.
Item 2. Unregistered Sales of Equity Securities and Use of Proceeds.
| | Purchases of Equity Securities by the Company | | Period | | Total number of shares purchased | | Average price paid per share | | Total number of shares purchased as part of publicly announced plans or programs (b) | | Approximate dollar value of shares that may yet be purchased under the plans or programs (b) | | Total number of shares purchased | | Average price paid per share | | Total number of shares purchased as part of publicly announced plans or programs (b) | | Approximate dollar value of shares that may yet be purchased under the plans or programs (b) |
| April 4, 2016 – May 1, 2016 | | — |
| | — |
| | — |
| | $ | 112,500,000 |
| |
May 2, 2016 – May 29, 2016(a) | | 124,919 |
| | $ | 81.93 |
| | 122,084 |
| | $ | 102,500,000 |
| |
May 30, 2016 – July 3, 2016(a) | | 60,275 |
| | $ | 84.37 |
| | 59,262 |
| | $ | 97,500,000 |
| |
| July 4, 2016 – July 31, 2016 | | | — |
| | — |
| | — |
| | $ | 97,500,000 |
|
August 1, 2016 – August 28, 2016(a) | | | 12,467 |
| | $ | 76.40 |
| | 11,815 |
| | $ | 96,600,000 |
|
August 29, 2016 – October 2, 2016(a) | | | 120,416 |
| | $ | 77.21 |
| | 117,844 |
| | $ | 87,500,000 |
|
| Total | | 185,194 |
| | $ | 82.73 |
| | 181,346 |
| | $ | 97,500,000 |
| | 132,883 |
| | $ | 77.14 |
| | 129,659 |
| | $ | 87,500,000 |
|
(a) These amounts include 2,835652 shares owned and tendered by employees at an average price of $81.92$75.93 to satisfy tax withholding obligations arising upon vesting of restricted stock awards during the fiscal month ended May 29,August 28, 2016 and 1,0132,572 shares tendered at an average price of $83.39$76.95 during the fiscal month ended July 3,October 2, 2016.
(b) In October 2015, our Board of Directors approved a stock repurchase program authorizing us to repurchase up to $150 million of DineEquity common stock on an opportunistic basis from time to time in open market transactions and in privately negotiated transactions, including Rule 10b-5 stock repurchase plans, based on business, market, applicable legal requirements and other considerations. The program does not require the repurchase of a specific number of shares and can be terminated at any time.
Item 3. Defaults Upon Senior Securities.
None.
Item 4. Mine Safety Disclosures.
Not Applicable.
Item 5. Other Information.
None.
Item 6. Exhibits.
|
| | | |
| 3.1 |
| | Restated Certificate of Incorporation of DineEquity, Inc. (Exhibit 99.3 to Registrant's Form 8-K filed on December 18, 2012 is incorporated herein by reference). |
| 3.2 |
| | Amended Bylaws of DineEquity, Inc. (Exhibit 3.2 to Registrant's Form 8-K filed on May 23, 2016 is incorporated herein by reference). |
| *†10.1 |
| | DineEquity, Inc. 2016 Stock IncentiveNonqualified Deferred Compensation Plan (Annex B to Registrant’s Proxy Statement filed on April 4, 2016 is incorporated herein by reference). |
*†10.2 |
| | DineEquity, Inc. 2016 Stock Incentive Plan Restricted Stock Agreement One-Fourth Annual Vesting - Employees |
*†10.3 |
| | DineEquity, Inc. 2016 Stock Incentive Plan Restricted Stock Agreement One-Third Annual Vesting - Employees |
*†10.4 |
| | DineEquity, Inc. 2016 Stock Incentive Plan Restricted Stock Agreement 25/25/50% Annual Vesting - Employees |
*†10.5 |
| | DineEquity, Inc. 2016 Stock Incentive Plan Restricted Stock Agreement - Employees |
*†10.6 |
| | DineEquity, Inc. 2016 Stock Incentive Plan Restricted Stock Agreement - Non-Employee Directors |
*†10.7 |
| | DineEquity, Inc. 2016 Stock Incentive Plan Stock-Settled RSU Agreement -Employees |
*†10.8 |
| | DineEquity, Inc. 2016 Stock Incentive Plan Stock-Settled RSU Agreement - Non-Employee Directors |
*†10.9 |
| | DineEquity, Inc. 2016 Stock Incentive Plan Stock-Settled RSU Agreement - International Employees |
*†10.10 |
| | DineEquity, Inc. 2016 Stock Incentive Plan Cash-Settled RSU Agreement - Employees |
*†10.11 |
| | DineEquity, Inc. 2016 Stock Incentive Plan Cash-Settled RSU Agreement - Non-Employee Directors |
*†10.12 |
| | DineEquity, Inc. 2016 Stock Incentive Plan Nonqualified Stock Option Agreement - Employees |
*†10.13 |
| | DineEquity, Inc. 2016 Stock Incentive Plan Nonqualified Stock Option Agreement - Non-Employee Directors |
*†10.14 |
| | DineEquity, Inc. 2016 Stock Incentive Plan Performance Award Agreement - Employees |
*†10.15 |
| | DineEquity, Inc. 2016 Stock Incentive Plan Performance Shares Agreement - Employees |
*†10.16 |
| | DineEquity, Inc. 2016 Stock Incentive Plan Performance Shares Agreement 50% stock / 50% cash - Employees |
*†10.17 |
| | DineEquity, Inc. 2016 Stock Incentive Plan SAR Agreement - Employees |
| *12.1 |
| | Computation of Debt Service Coverage Ratio for the Trailing Twelve Months Ended JuneSeptember 30, 2016 and Leverage Ratio as of JuneSeptember 30, 2016. |
| *31.1 |
| | Certification of Chief Executive Officer pursuant to Rule 13a-14(a) of the Securities Exchange Act of 1934, as amended. |
| *31.2 |
| | Certification of Chief Financial Officer pursuant to Rule 13a-14(a) of the Securities Exchange Act of 1934, as amended. |
| *32.1 |
| | Certification of Chief Executive Officer pursuant to 18 U.S.C. Section 1350, as adopted pursuant to Section 906 of the Sarbanes-Oxley Act of 2002.** |
| *32.2 |
| | Certification of Chief Financial Officer pursuant to 18 U.S.C. Section 1350, as adopted pursuant to Section 906 of the Sarbanes-Oxley Act of 2002.** |
| 101.INS |
| | XBRL Instance Document.*** |
| 101.SCH |
| | XBRL Schema Document.*** |
| 101.CAL |
| | XBRL Calculation Linkbase Document.*** |
| 101.DEF |
| | XBRL Definition Linkbase Document.*** |
| 101.LAB |
| | XBRL Label Linkbase Document.*** |
| 101.PRE |
| | XBRL Presentation Linkbase Document.*** |
* Filed herewith.
| |
| ** | The certifications attached as Exhibits 32.1 and 32.2 accompany this Quarterly Report pursuant to Section 906 of the Sarbanes-Oxley Act of 2002 and shall not, except to the extent required by the Sarbanes-Oxley Act of 2002, be deemed filed by the Company for purposes of Section 18 of the Securities Exchange Act of 1934, as amended. |
| |
*** | Pursuant to Rule 406T of Regulation S-T, the interactive data files on Exhibit 101 hereto are deemed not filed or part of a registration statement or prospectus for purposes of Section 11 or 12 of the Securities Act of 1933, as amended, are deemed not filed for purposes of Section 18 of the Securities and Exchange Act of 1934, as amended, and otherwise are not subject to liability under those sections. |
| |
| † | A contract, compensatory plan or arrangement in which directors or executive officers are eligible to participate. |
SIGNATURES
Pursuant to the requirements of the Securities Exchange Act of 1934, the registrant has duly caused this report to be signed on its behalf by the undersigned thereunto duly authorized.
|
| | | |
| | | DineEquity, Inc. (Registrant) | |
| | | | |
| | | | |
| Dated: | August 3,November 1, 2016 | By: | /s/ Julia A. Stewart |
| | | | Julia A. Stewart Chairman and Chief Executive Officer (Principal Executive Officer) |
| | | | |
| | | | |
| Dated: | August 3,November 1, 2016 | By: | /s/ Thomas W. Emrey |
| | | | Thomas W. Emrey Chief Financial Officer (Principal Financial Officer) |
| | | | |
| | | | |
| Dated: | August 3,November 1, 2016 | By: | /s/ Greggory Kalvin |
| | | | Greggory Kalvin Senior Vice President, Corporate Controller (Principal Accounting Officer) |