UNITED STATES
SECURITIES AND EXCHANGE COMMISSION
Washington, D.C. 20549
__________________________________________________
FORM 10-Q
(Mark One)
x☒QUARTERLY REPORT PURSUANT TO SECTION 13 OR 15(d) OF THE SECURITIES EXCHANGE ACT OF 1934
For the quarterly period ended SeptemberJune 30, 20172019
OR
o☐TRANSITION REPORT PURSUANT TO SECTION 13 OR 15(d) OF THE SECURITIES EXCHANGE ACT OF 1934
For the transition period from to
Commission File Number 001-15283

DineEquity, Dine Brands Global, Inc.
(Exact name of registrant as specified in its charter) |
| | | | |
Delaware | | | 95-3038279 |
| (State or other jurisdiction of incorporation or organization) | | 95-3038279
| (I.R.S. Employer Identification No.) |
| 450 North Brand Boulevard, | | | 91203-1903 |
| Glendale, | CA | | | |
450 North Brand Boulevard, Glendale, California (Address of principal executive offices)
| | 91203-1903
| (Zip Code) |
|
| |
| (818) | 240-6055 |
| (Registrant’s telephone number, including area code) |
______________________________________________________________
Securities registered pursuant to Section 12(b) of the Act:
|
| | | |
| Title of each class | | Trading symbol(s) | Name of each exchange on which registered |
| Common Stock, $0.01 par value | | DIN | New York Stock Exchange |
(818) 240-6055
(Registrant’s telephone number, including area code)
______________________________________________________________
Indicate by check mark whether the registrant (1) has filed all reports required to be filed by Section 13 or 15(d) of the Securities Exchange Act of 1934 during the preceding 12 months (or for such shorter period that the registrant was required to file such reports), and (2) has been subject to such filing requirements for the past 90 days. Yes x☒ No o☐
Indicate by check mark whether the registrant has submitted electronically and posted on its corporate Web site, if any, every Interactive Data File required to be submitted and posted pursuant to Rule 405 of Regulation S-T (§232.405 of this chapter) during the preceding 12 months (or for such shorter period that the registrant was required to submit and post such files). Yes x☒ No o☐
Indicate by check mark whether the registrant is a large accelerated filer, an accelerated filer, a non-accelerated filer, smaller reporting company or an emerging growth company. See definitions of “large accelerated filer,” “accelerated filer,” “smaller reporting company,” and “emerging growth company” in Rule 12b-2 of the Exchange Act.
|
| | | | |
Large accelerated filerx | ☒ | | Accelerated filero | ☐ |
| Non-accelerated filer | ☐ | | | |
| | | |
Non-accelerated filer o (Do not check if a smallerSmaller reporting company)
company | ☐ |
| | | Smaller reporting company o
|
| | | Emerging growth companyo | ☐ |
If an emerging growth company, indicate by check mark if the registrant has elected not to use the extended transition period for complying with any new or revised financial accounting standards provided pursuant to Section 13(a) of the Exchange Act o☐
Indicate by check mark whether the registrant is a shell company (as defined in Rule 12b-2 of the Exchange Act). Yes o☐
No x☒
As of July 25, 2019, the Registrant had 17,175,598 shares of Common Stock outstanding.
Indicate the number of shares outstanding of each of the issuer’s classes of common stock, as of the latest practicable date.
|
| | |
Class | | Outstanding as of November 3, 2017 |
Common Stock, $0.01 par value | | 17,988,168 |
DineEquity,Dine Brands Global, Inc. and Subsidiaries
Index
Cautionary Statement Regarding Forward-Looking Statements
Statements contained in this reportQuarterly Report on Form 10-Q may constitute forward-looking statements“forward-looking statements” within the meaning of Section 27A of the Private Securities Litigation Reform Act of 1995.1933, as amended, and Section 21E of the Securities Exchange Act of 1934, as amended. These statements involve known and unknown risks, uncertainties and other factors, which may cause actual results to be materially different from those expressed or implied in such statements. You can identify these forward-looking statements by words such as “may,” “will,” “would,” “should,” “could,” “expect,” “anticipate,” “believe,” “estimate,” “intend,” “plan”“plan,” “goal” and other similar expressions. You should consider our forward-looking statements in light of the risks discussed under the heading “Risk Factors” in our most recent Annual Report on Form 10-K,Factors,” as well as our consolidated financial statements, related notes, and the other financial information appearing elsewhere in this report and our other filings with the United States Securities and Exchange Commission. The forward-looking statements contained in this report are made as of the date hereof and the Company assumes noDine Brands Global, Inc. does not intend to, nor does it assume any obligation to, update or supplement any forward-looking statements.statements after the date of this report to reflect actual results or future events or circumstances.
Factors that could cause actual results to differ materially from the projections, forecasts, estimates and expectations discussed in this Quarterly Report on Form 10-Q include, among other things: general economic conditions; our level of indebtedness; compliance with the terms of our securitized debt; our ability to refinance our current indebtedness or obtain additional financing; our dependence on information technology; potential cyber incidents; the implementation of restaurant development plans; our dependence on our franchisees; the concentration of our Applebee’s franchised restaurants in a limited number of franchisees; the financial health of our franchisees, including any insolvency or bankruptcy; credit risks from our IHOP franchisees operating under our Previous IHOP Business Model; insufficient insurance coverage to cover potential risks associated with the ownership and operation of restaurants; our franchisees’ and other licensees’ compliance with our quality standards and trademark usage; general risks associated with the restaurant industry; potential harm to our brands’ reputation; risks of food-borne illness or food tampering; possible future impairment charges; trading volatility and fluctuations in the price of our stock; our ability to achieve the financial guidance we provide to investors; successful implementation of our business strategy; the availability of suitable locations for new restaurants; shortages or interruptions in the supply or delivery of products from third parties or availability of utilities; the management and forecasting of appropriate inventory levels; development and implementation of innovative marketing and use of social media; changing health or dietary preference of consumers; risks associated with doing business in international markets; the results of litigation and other legal proceedings; third-party claims with respect to intellectual property assets; delivery initiatives and use of third-party delivery vendors; our
allocation of human capital and our ability to attract and retain management and other key employees; compliance with federal, state and local governmental regulations; risks associated with our self-insurance; natural disasters or other serious incidents; our success with development initiatives outside of our core business; the adequacy of our internal controls over financial reporting and future changes in accounting standards; and other matters in the “Risk Factors” section of this report and our Annual Report on Form 10-K for the fiscal year ended December 31, 2018, many of which are beyond our control.
Fiscal Quarter End
The Company’s fiscal quarters end on the Sunday closest to the last day of each calendar quarter. For convenience, the fiscal quarters of each year are referred to as ending on March 31, June 30, September 30 and December 31. The first fiscal quarter of 20172019 began on January 2, 2017December 31, 2018 and ended on April 2, 2017 andMarch 31, 2019; the second and third fiscal quartersquarter of 20172019 ended on July 2, 2017 and October 1, 2017, respectively.June 30, 2019. The first fiscal quarter of 20162018 began on January 4, 20161, 2018 and ended on April 3, 2016 and1, 2018; the second and third fiscal quartersquarter of 20162018 ended on July 3, 2016 and October 2, 2016, respectively.1, 2018.
PART I. FINANCIAL INFORMATION
Item 1. Financial Statements.
DineEquity,Dine Brands Global, Inc. and Subsidiaries
Consolidated Balance Sheets
(In thousands, except share and per share amounts) | | | Assets | | September 30, 2017 | | December 31, 2016 | | June 30, 2019 | | December 31, 2018 |
| | | (Unaudited) | | | | (Unaudited) | | |
| Current assets: | | |
| | |
| | |
| | |
|
| Cash and cash equivalents | | $ | 104,212 |
| | $ | 140,535 |
| | $ | 127,555 |
| | $ | 137,164 |
|
| Receivables, net | | 96,657 |
| | 141,389 |
| | 98,786 |
| | 137,504 |
|
| Restricted cash | | 31,338 |
| | 30,256 |
| | 34,387 |
| | 48,515 |
|
| Prepaid gift card costs | | 36,667 |
| | 47,115 |
| | 29,411 |
| | 38,195 |
|
| Prepaid income taxes | | 8,749 |
| | 2,483 |
| | 7,123 |
| | 17,402 |
|
| Other current assets | | 5,703 |
| | 4,370 |
| | 7,016 |
| | 3,410 |
|
| Total current assets | | 283,326 |
| | 366,148 |
| | 304,278 |
| | 382,190 |
|
| Other intangible assets, net | | | 580,197 |
| | 585,889 |
|
| Operating lease right-of-use assets | | | 378,520 |
| | — |
|
| Goodwill | | | 343,862 |
| | 345,314 |
|
| Property and equipment, net | | | 222,818 |
| | 240,264 |
|
| Long-term receivables, net | | 131,033 |
| | 141,152 |
| | 93,607 |
| | 103,102 |
|
| Property and equipment, net | | 199,857 |
| | 205,055 |
| |
| Goodwill | | 339,236 |
| | 697,470 |
| |
| Other intangible assets, net | | 585,160 |
| | 763,431 |
| |
| Deferred rent receivable | | 84,071 |
| | 86,981 |
| | 74,075 |
| | 77,069 |
|
| Non-current restricted cash | | 14,700 |
| | 14,700 |
| | 15,700 |
| | 14,700 |
|
| Other non-current assets, net | | 3,825 |
| | 3,646 |
| | 27,601 |
| | 26,152 |
|
| Total assets | | $ | 1,641,208 |
| | $ | 2,278,583 |
| | $ | 2,040,658 |
| | $ | 1,774,680 |
|
| Liabilities and Stockholders’ (Deficit) Equity | | |
| | |
| |
| Liabilities and Stockholders’ Deficit | | | |
| | |
|
| Current liabilities: | | |
| | |
| | |
| | |
|
| Current maturities of long-term debt | | | $ | — |
| | $ | 25,000 |
|
| Accounts payable | | $ | 26,452 |
| | $ | 50,503 |
| | 43,982 |
| | 43,468 |
|
| Gift card liability | | 104,317 |
| | 170,812 |
| | 111,281 |
| | 160,438 |
|
| Current maturities of operating lease obligations | | | 67,724 |
| | — |
|
| Current maturities of finance lease and financing obligations | | | 13,563 |
| | 14,031 |
|
| Accrued employee compensation and benefits | | | 17,607 |
| | 27,479 |
|
| Dividends payable | | 17,755 |
| | 17,465 |
| | 12,176 |
| | 11,389 |
|
| Accrued employee compensation and benefits | | 13,527 |
| | 14,609 |
| |
| Current maturities of long-term debt, capital lease and financing obligations | | 16,202 |
| | 13,144 |
| |
| Accrued advertising | | 8,359 |
| | 6,369 |
| |
| Deferred franchise revenue, short-term | | | 10,244 |
| | 10,138 |
|
| Other accrued expenses | | 16,775 |
| | 13,410 |
| | 19,824 |
| | 24,243 |
|
| Total current liabilities | | 203,387 |
| | 286,312 |
| | 296,401 |
| | 316,186 |
|
| Long-term debt, less current maturities | | 1,281,950 |
| | 1,282,691 |
| | 1,287,227 |
| | 1,274,087 |
|
| Capital lease obligations, less current maturities | | 64,923 |
| | 74,665 |
| |
| Operating lease obligations, less current maturities | | | 379,123 |
| | — |
|
| Finance lease obligations, less current maturities | | | 84,344 |
| | 87,762 |
|
| Financing obligations, less current maturities | | 39,292 |
| | 39,499 |
| | 38,125 |
| | 38,482 |
|
| Deferred income taxes, net | | 178,848 |
| | 253,898 |
| | 98,294 |
| | 105,816 |
|
| Deferred rent payable | | 65,449 |
| | 69,572 |
| |
| Deferred franchise revenue, long-term | | | 60,302 |
| | 64,557 |
|
| Other non-current liabilities | | 24,036 |
| | 19,174 |
| | 11,967 |
| | 90,063 |
|
| Total liabilities | | 1,857,885 |
| | 2,025,811 |
| | 2,255,783 |
| | 1,976,953 |
|
| Commitments and contingencies | |
|
| |
|
| |
|
| |
|
|
| Stockholders’ (deficit) equity: | | |
| | |
| |
| Common stock, $0.01 par value, shares: 40,000,000 authorized; September 30, 2017 - 25,033,220 issued, 17,996,223 outstanding; December 31, 2016 - 25,134,223 issued, 17,969,636 outstanding | | 250 |
| | 251 |
| |
| Stockholders’ deficit: | | | |
| | |
|
| Common stock, $0.01 par value; shares: 40,000,000 authorized; June 30, 2019 - 24,949,103 issued, 17,252,391 outstanding; December 31, 2018 - 24,984,898 issued, 17,644,267 outstanding | | | 249 |
| | 250 |
|
| Additional paid-in-capital | | 292,255 |
| | 292,809 |
| | 240,555 |
| | 237,726 |
|
| (Accumulated deficit) retained earnings | | (86,634 | ) | | 382,082 |
| |
| Retained earnings | | | 33,832 |
| | 10,414 |
|
| Accumulated other comprehensive loss | | (105 | ) | | (107 | ) | | (59 | ) | | (60 | ) |
| Treasury stock, at cost; shares: September 30, 2017 - 7,036,997; December 31, 2016 - 7,164,587 | | (422,443 | ) | | (422,263 | ) | |
| Total stockholders’ (deficit) equity | | (216,677 | ) | | 252,772 |
| |
| Total liabilities and stockholders’ (deficit) equity | | $ | 1,641,208 |
| | $ | 2,278,583 |
| |
| Treasury stock, at cost; shares: June 30, 2019 - 7,696,712; December 31, 2018 - 7,340,631 | | | (489,702 | ) | | (450,603 | ) |
| Total stockholders’ deficit | | | (215,125 | ) | | (202,273 | ) |
| Total liabilities and stockholders’ deficit | | | $ | 2,040,658 |
| | $ | 1,774,680 |
|
See the accompanying Notes to Consolidated Financial Statements.
DineEquity,Dine Brands Global, Inc. and Subsidiaries
Consolidated Statements of Comprehensive (Loss) Income
(In thousands, except per share amounts)
(Unaudited)
|
| | | | | | | | | | | | | | | | |
| | | Three Months Ended | | Nine Months Ended |
| | | September 30, | | September 30, |
| | | 2017 | | 2016 | | 2017 | | 2016 |
| Revenues: | | |
| | |
| | | | |
| Franchise and restaurant revenues | | $ | 112,347 |
| | $ | 123,259 |
| | $ | 358,912 |
| | $ | 380,034 |
|
| Rental revenues | | 30,263 |
| | 30,507 |
| | 90,852 |
| | 92,746 |
|
| Financing revenues | | 2,061 |
| | 2,251 |
| | 6,280 |
| | 7,019 |
|
| Total revenues | | 144,671 |
| | 156,017 |
| | 456,044 |
| | 479,799 |
|
| Cost of revenues: | | |
| | |
| | | | |
| Franchise and restaurant expenses | | 41,800 |
| | 41,553 |
| | 123,476 |
| | 122,129 |
|
| Rental expenses | | 22,318 |
| | 22,771 |
| | 67,665 |
| | 69,032 |
|
| Financing expenses | | 449 |
| | 9 |
| | 449 |
| | 155 |
|
| Total cost of revenues | | 64,567 |
| | 64,333 |
| | 191,590 |
| | 191,316 |
|
| Gross profit | | 80,104 |
| | 91,684 |
| | 264,454 |
| | 288,483 |
|
| General and administrative expenses | | 38,030 |
| | 36,002 |
| | 125,701 |
| | 111,937 |
|
| Impairment and closure charges | | 532,522 |
| | 206 |
| | 535,440 |
| | 3,932 |
|
| Interest expense | | 15,353 |
| | 15,358 |
| | 46,496 |
| | 46,107 |
|
| Amortization of intangible assets | | 2,507 |
| | 2,500 |
| | 7,507 |
| | 7,480 |
|
| (Gain) loss on disposition of assets | | (35 | ) | | 113 |
| | (6,387 | ) | | 679 |
|
| (Loss) income before income tax benefit (provision) | | (508,273 | ) | | 37,505 |
| | (444,303 | ) | | 118,348 |
|
| Income tax benefit (provision) | | 56,555 |
| | (13,232 | ) | | 28,228 |
| | (41,703 | ) |
| Net (loss) income | | (451,718 | ) | | 24,273 |
| | (416,075 | ) | | 76,645 |
|
| Other comprehensive (loss) income, net of tax: | | | | | | | | |
| Foreign currency translation adjustment | | (2 | ) | | (1 | ) | | (2 | ) | | — |
|
| Total comprehensive (loss) income | | $ | (451,720 | ) | | $ | 24,272 |
| | $ | (416,077 | ) | | $ | 76,645 |
|
| Net (loss) income available to common stockholders: | | | | |
| | | | |
| Net (loss) income | | $ | (451,718 | ) | | $ | 24,273 |
| | $ | (416,075 | ) | | $ | 76,645 |
|
| Less: Net loss (income) allocated to unvested participating restricted stock | | 8,496 |
| | (338 | ) | | 6,921 |
| | (1,103 | ) |
| Net (loss) income available to common stockholders | | $ | (443,222 | ) | | $ | 23,935 |
| | $ | (409,154 | ) | | $ | 75,542 |
|
| Net (loss) income available to common stockholders per share: | | |
| | |
| | | | |
| Basic | | $ | (24.98 | ) | | $ | 1.33 |
| | $ | (23.09 | ) | | $ | 4.17 |
|
| Diluted | | $ | (24.98 | ) | | $ | 1.33 |
| | $ | (23.09 | ) | | $ | 4.15 |
|
| Weighted average shares outstanding: | | |
| | |
| | | | |
| Basic | | 17,742 |
| | 17,950 |
| | 17,718 |
| | 18,099 |
|
| Diluted | | 17,742 |
| | 18,041 |
| | 17,718 |
| | 18,201 |
|
| | | | | | | | | |
| Dividends declared per common share | | $ | 0.97 |
| | $ | 0.92 |
| | $ | 2.91 |
| | $ | 2.76 |
|
| Dividends paid per common share | | $ | 0.97 |
| | $ | 0.92 |
| | $ | 2.91 |
| | $ | 2.76 |
|
|
| | | | | | | | | | | | | | | | |
| | | Three Months Ended | | Six Months Ended |
| | | June 30, | | June 30, |
| | | 2019 | | 2018 | | 2019 | | 2018 |
| Revenues: | | |
| | | | | | |
| Franchise revenues: | | | | | | | | |
| Royalties, franchise fees and other | | 90,930 |
| | 93,236 |
| | $ | 187,226 |
| | $ | 184,713 |
|
| Advertising revenue | | 71,738 |
| | 58,705 |
| | 144,368 |
| | 122,541 |
|
| Total franchise revenues | | 162,668 |
| | 151,941 |
| | 331,594 |
| | 307,254 |
|
| Company restaurant sales | | 33,751 |
| | — |
| | 69,486 |
| | — |
|
| Rental revenues | | 29,878 |
| | 30,324 |
| | 60,589 |
| | 61,165 |
|
| Financing revenues | | 1,783 |
| | 2,206 |
| | 3,593 |
| | 4,215 |
|
| Total revenues | | 228,080 |
| | 184,471 |
| | 465,262 |
| | 372,634 |
|
| Cost of revenues: | | |
| | |
| | | | |
| Franchise expenses: | | | | | | | | |
| Advertising expenses | | 71,738 |
| | 58,705 |
| | 144,368 |
| | 122,541 |
|
| Other franchise expenses | | 7,169 |
| | 24,239 |
| | 14,842 |
| | 42,275 |
|
| Total franchise expenses | | 78,907 |
| | 82,944 |
| | 159,210 |
| | 164,816 |
|
| Company restaurant expenses | | 31,232 |
| | — |
| | 62,770 |
| | — |
|
| Rental expenses: | | | | | | | | |
| Interest expense from finance leases | | 1,445 |
| | 1,770 |
| | 2,974 |
| | 3,647 |
|
| Other rental expenses | | 21,495 |
| | 21,018 |
| | 42,590 |
| | 41,782 |
|
| Total rental expenses | | 22,940 |
| | 22,788 |
| | 45,564 |
| | 45,429 |
|
| Financing expenses | | 146 |
| | 149 |
| | 292 |
| | 299 |
|
| Total cost of revenues | | 133,225 |
| | 105,881 |
| | 267,836 |
| | 210,544 |
|
| Gross profit | | 94,855 |
| | 78,590 |
| | 197,426 |
| | 162,090 |
|
| General and administrative expenses | | 39,364 |
| | 38,759 |
| | 82,183 |
| | 80,670 |
|
| Interest expense, net | | 14,602 |
| | 15,481 |
| | 29,995 |
| | 30,680 |
|
| Amortization of intangible assets | | 2,925 |
| | 2,506 |
| | 5,849 |
| | 5,008 |
|
| Closure and impairment charges (credits) | | 289 |
| | (2,702 | ) | | 483 |
| | (98 | ) |
| Loss on extinguishment of debt | | 8,276 |
| | — |
| | 8,276 |
| | — |
|
| Loss (gain) on disposition of assets | | 332 |
| | (50 | ) | | 441 |
| | (1,477 | ) |
| Income before income tax provision | | 29,067 |
| | 24,596 |
| | 70,199 |
| | 47,307 |
|
| Income tax provision | | (7,677 | ) | | (11,883 | ) | | (17,166 | ) | | (17,521 | ) |
| Net income | | 21,390 |
| | 12,713 |
| | 53,033 |
| | 29,786 |
|
| Other comprehensive income (loss) net of tax: | | | | | | | | |
| Adjustment to unrealized loss on available-for-sale investments | | — |
| | — |
| | — |
| | 50 |
|
| Foreign currency translation adjustment | | 2 |
| | (3 | ) | | 1 |
| | (6 | ) |
| Total comprehensive income | | $ | 21,392 |
| | $ | 12,710 |
| | $ | 53,034 |
| | $ | 29,830 |
|
| Net income available to common stockholders: | | | | |
| | | | |
| Net income | | $ | 21,390 |
| | $ | 12,713 |
| | $ | 53,033 |
| | $ | 29,786 |
|
| Less: Net income allocated to unvested participating restricted stock | | (719 | ) | | (428 | ) | | (1,827 | ) | | (1,000 | ) |
| Net income available to common stockholders | | $ | 20,671 |
| | $ | 12,285 |
| | $ | 51,206 |
| | $ | 28,786 |
|
| Net income available to common stockholders per share: | | |
| | |
| | | | |
| Basic | | $ | 1.20 |
| | $ | 0.70 |
| | $ | 2.97 |
| | $ | 1.63 |
|
| Diluted | | $ | 1.18 |
| | $ | 0.69 |
| | $ | 2.91 |
| | $ | 1.61 |
|
| Weighted average shares outstanding: | | |
| | |
| | | | |
| Basic | | 17,181 |
| | 17,544 |
| | 17,262 |
| | 17,623 |
|
| Diluted | | 17,563 |
| | 17,803 |
| | 17,626 |
| | 17,827 |
|
See the accompanying Notes to Consolidated Financial Statements.
DineEquity,Dine Brands Global, Inc. and Subsidiaries
Consolidated Statements of Stockholders' Deficit
Three and Six Months ended June 30, 2019
(In thousands)
(Unaudited)
|
| | | | | | | | | | | | | | | | | | | | | | | | | | | | | | |
| | | Three Months ended June 30, 2019 |
| | | Common Stock | | | | | | Accumulated
Other
Comprehensive
Loss | | Treasury Stock | | |
| | | Shares
Outstanding | | Amount | | Additional
Paid-in
Capital | | Retained Earnings | | Shares | | Cost | | Total |
| Balance at March 31, 2019 | | 17,651 |
| | $ | 250 |
| | $ | 239,585 |
| | $ | 24,588 |
| | $ | (61 | ) | | 7,324 |
| | $ | (455,183 | ) | | $ | (190,821 | ) |
| Net income | | — |
| | — |
| | — |
| | 21,390 |
| | — |
| | — |
| | — |
| | 21,390 |
|
| Other comprehensive gain | | — |
| | — |
| | — |
| | — |
| | 2 |
| | — |
| | — |
| | 2 |
|
| Purchase of Company common stock | | (392 | ) | | — |
| | — |
| | — |
| | — |
| | 392 |
| | (35,341 | ) | | (35,341 | ) |
| Reissuance of treasury stock | | 19 |
| | (1 | ) | | (651 | ) | | — |
| | — |
| | (19 | ) | | 822 |
| | 170 |
|
| Net issuance of shares for stock plans | | (21 | ) | | — |
| | — |
| | — |
| | — |
| | — |
| | — |
| | — |
|
| Repurchase of restricted shares for taxes | | (5 | ) | | — |
| | (425 | ) | | — |
| | — |
| | — |
| | — |
| | (425 | ) |
| Stock-based compensation | | — |
| | — |
| | 1,787 |
| | — |
| | — |
| | — |
| | — |
| | 1,787 |
|
| Dividends on common stock | | — |
| | — |
| | 259 |
| | (12,146 | ) | | — |
| | — |
| | — |
| | (11,887 | ) |
| Balance at June 30, 2019 | | 17,252 |
| | $ | 249 |
| | $ | 240,555 |
| | $ | 33,832 |
| | $ | (59 | ) | | 7,697 |
| | $ | (489,702 | ) | | $ | (215,125 | ) |
|
| | | | | | | | | | | | | | | | | | | | | | | | | | | | | | |
| | | Six Months ended June 30, 2019 |
| | | Common Stock | | | | | | Accumulated
Other
Comprehensive
Loss | | Treasury Stock | | |
| | | Shares
Outstanding | | Amount | | Additional
Paid-in
Capital | | Retained Earnings | | Shares | | Cost | | Total |
| Balance at December 31, 2018 | | 17,644 |
| | $ | 250 |
| | $ | 237,726 |
| | $ | 10,414 |
| | $ | (60 | ) | | 7,341 |
| | $ | (450,603 | ) | | $ | (202,273 | ) |
| Adoption of ASC 842 (Note 3) | | — |
| | — |
| | — |
| | (5,030 | ) | | — |
| | — |
| | — |
| | (5,030 | ) |
| Net income | | — |
| | — |
| | — |
| | 53,033 |
| | — |
| | — |
| | — |
| | 53,033 |
|
| Other comprehensive gain | | — |
| | — |
| | — |
| | — |
| | 1 |
| | — |
| | — |
| | 1 |
|
| Purchase of Company common stock | | (543 | ) | | — |
| | — |
| | — |
| | — |
| | 543 |
| | (47,356 | ) | | (47,356 | ) |
| Reissuance of treasury stock | | 187 |
| | (1 | ) | | (1,318 | ) | | — |
| | — |
| | (187 | ) | | 8,257 |
| | 6,938 |
|
| Net issuance of shares for stock plans | | (12 | ) | | — |
| | — |
| | — |
| | — |
| | — |
| | — |
| | — |
|
| Repurchase of restricted shares for taxes | | (24 | ) | | — |
| | (2,242 | ) | | — |
| | — |
| | — |
| | — |
| | (2,242 | ) |
| Stock-based compensation | | — |
| | — |
| | 5,894 |
| | — |
| | — |
| | — |
| | — |
| | 5,894 |
|
| Dividends on common stock | | — |
| | — |
| | 495 |
| | (24,585 | ) | | — |
| | — |
| | — |
| | (24,090 | ) |
| Balance at June 30, 2019 | | 17,252 |
| | $ | 249 |
| | $ | 240,555 |
| | $ | 33,832 |
| | $ | (59 | ) | | 7,697 |
| | $ | (489,702 | ) | | $ | (215,125 | ) |
See the accompanying Notes to Consolidated Financial Statements.
Dine Brands Global, Inc. and Subsidiaries
Consolidated Statements of Stockholders' Deficit
Three and Six Months ended June 30, 2018
(In thousands)
(Unaudited)
|
| | | | | | | | | | | | | | | | | | | | | | | | | | | | | | |
| | | Three Months ended June 30, 2018 |
| | | Common Stock | | | | | | Accumulated Other Comprehensive Loss | | Treasury Stock | | |
| | | Shares Outstanding | | Amount | | Additional Paid-in Capital | | Retained Earnings (Accumulated Deficit) | | Shares | | Cost | | Total |
| Balance at March 31, 2018 | | 17,922 |
| | $ | 250 |
| | $ | 264,994 |
| | $ | (52,867 | ) | | $ | (58 | ) | | 7,091 |
| | $ | (429,205 | ) | | $ | (216,886 | ) |
| Net income | | — |
| | — |
| | — |
| | 12,713 |
| | — |
| | — |
| | — |
| | 12,713 |
|
| Other comprehensive loss | | — |
| | — |
| | — |
| | — |
| | (3 | ) | | — |
| | — |
| | (3 | ) |
| Purchase of Company common stock | | (137 | ) | | — |
| | — |
| | — |
| | — |
| | 137 |
| | (10,000 | ) | | (10,000 | ) |
| Reissuance of treasury stock | | 26 |
| | — |
| | (843 | ) | | — |
| | — |
| | (26 | ) | | 1,007 |
| | 164 |
|
| Net issuance of shares for stock plans | | (3 | ) | | — |
| | — |
| | — |
| | — |
| | — |
| | — |
| | — |
|
| Repurchase of restricted shares for taxes | | (5 | ) | | — |
| | (317 | ) | | — |
| | — |
| | — |
| | — |
| | (317 | ) |
| Stock-based compensation | | — |
| | — |
| | 2,273 |
| | — |
| | — |
| | — |
| | — |
| | 2,273 |
|
| Dividends on common stock | | — |
| | — |
| | (295 | ) | | — |
| | — |
| | — |
| | — |
| | (295 | ) |
| Dividends on common stock in excess of retained earnings | | — |
| | — |
| | (10,900 | ) | | — |
| | — |
| | — |
| | — |
| | (10,900 | ) |
| Balance at June 30, 2018 | | 17,803 |
|
| $ | 250 |
|
| $ | 254,912 |
|
| $ | (40,154 | ) |
| $ | (61 | ) |
| 7,202 |
|
| $ | (438,198 | ) |
| $ | (223,251 | ) |
|
| | | | | | | | | | | | | | | | | | | | | | | | | | | | | | |
| | | Six Months ended June 30, 2018 |
| | | Common Stock | | | | | | Accumulated Other Comprehensive Loss | | Treasury Stock | | |
| | | Shares Outstanding | | Amount | | Additional Paid-in Capital | | Retained Earnings (Accumulated Deficit) | | Shares | | Cost | | Total |
| Balance at December 31, 2017 | | 17,993 |
| | $ | 250 |
| | $ | 276,408 |
| | $ | (69,940 | ) | | $ | (105 | ) | | 7,029 |
| | $ | (422,153 | ) | | $ | (215,540 | ) |
| Net income | | — |
| | — |
| | — |
| | 29,786 |
| | — |
| | — |
| | — |
| | 29,786 |
|
| Other comprehensive gain | | — |
| | — |
| | — |
| | — |
| | 44 |
| | — |
| | — |
| | 44 |
|
| Purchase of Company common stock | | (276 | ) | | — |
| | — |
| | — |
| | — |
| | 276 |
| | (20,003 | ) | | (20,003 | ) |
| Reissuance of treasury stock | | 103 |
| | — |
| | (3,338 | ) | | — |
| | — |
| | (103 | ) | | 3,958 |
| | 620 |
|
| Net issuance of shares for stock plans | | 3 |
| | — |
| | — |
| | — |
| | — |
| | — |
| | — |
| | — |
|
| Repurchase of restricted shares for taxes | | (20 | ) | | — |
| | (1,400 | ) | | — |
| | — |
| | — |
| | — |
| | (1,400 | ) |
| Stock-based compensation | | — |
| | — |
| | 5,641 |
| | — |
| | — |
| | — |
| | — |
| | 5,641 |
|
| Dividends on common stock | | — |
| | — |
| | — |
| | — |
| | — |
| | — |
| | — |
| | — |
|
| Dividends on common stock in excess of retained earnings | | — |
| | — |
| | (22,399 | ) | | — |
| | — |
| | — |
| | — |
| | (22,399 | ) |
| Balance at June 30, 2018 | | 17,803 |
| | $ | 250 |
| | $ | 254,912 |
| | $ | (40,154 | ) | | $ | (61 | ) | | 7,202 |
| | $ | (438,198 | ) | | $ | (223,251 | ) |
See the accompanying Notes to Consolidated Financial Statements.
Dine Brands Global, Inc. and Subsidiaries
Consolidated Statements of Cash Flows
(In thousands)
| | | | | Nine Months Ended | | Six Months Ended |
| | | September 30, | | June 30, |
| | | 2017 | | 2016 | | 2019 | | 2018 |
| Cash flows from operating activities: | | |
| | |
| | |
| | |
| Net (loss) income | | $ | (416,075 | ) | | $ | 76,645 |
| |
| Adjustments to reconcile net (loss) income to cash flows provided by operating activities: | | |
| | |
| |
| Impairment and closure charges | | 535,306 |
| | 1,461 |
| |
| Net income | | | $ | 53,033 |
| | $ | 29,786 |
|
| Adjustments to reconcile net income to cash flows provided by operating activities: | | | | | |
|
| Depreciation and amortization | | 23,053 |
| | 22,924 |
| | 20,800 |
| | 15,842 |
|
| Non-cash stock-based compensation expense | | | 5,894 |
| | 5,641 |
|
| Non-cash interest expense | | 2,509 |
| | 2,400 |
| | 2,083 |
| | 1,744 |
|
| Closure and impairment charges (credits) | | | 483 |
| | (114 | ) |
| Loss on extinguishment of debt | | | 8,276 |
| | — |
|
| Deferred income taxes | | (77,345 | ) | | (14,852 | ) | | (3,186 | ) | | (3,606 | ) |
| Non-cash stock-based compensation expense | | 8,826 |
| | 8,215 |
| |
| Tax benefit from stock-based compensation | | — |
| | 1,153 |
| |
| Excess tax benefit from stock-based compensation | | — |
| | (966 | ) | |
| (Gain) loss on disposition of assets | | (6,422 | ) | | 679 |
| |
| Loss (gain) on disposition of assets | | | 441 |
| | (1,477 | ) |
| Other | | (2,791 | ) | | 456 |
| | (7,678 | ) | | (8,438 | ) |
| Changes in operating assets and liabilities: | | |
| | |
| | | | |
|
| Accounts receivable, net | | (1,569 | ) | | 4,312 |
| | (1,976 | ) | | (10,924 | ) |
| Current income tax receivables and payables | | (1,699 | ) | | (1,138 | ) | | 9,442 |
| | 2,776 |
|
| Gift card receivables and payables | | (26,387 | ) | | (30,355 | ) | | (7,444 | ) | | (10,334 | ) |
| Other current assets | | (1,336 | ) | | (824 | ) | | (3,607 | ) | | 5,851 |
|
| Accounts payable | | (7,530 | ) | | (1,397 | ) | | 8,995 |
| | 3,816 |
|
| Accrued employee compensation and benefits | | (1,146 | ) | | (9,293 | ) | | (9,872 | ) | | (1,411 | ) |
| Other current liabilities | | 3,606 |
| | 2,638 |
| | (6,355 | ) | | (3,360 | ) |
| Cash flows provided by operating activities | | 31,000 |
| | 62,058 |
| | 69,329 |
| | 25,792 |
|
| Cash flows from investing activities: | | |
| | |
| | |
| | |
|
| Principal receipts from notes, equipment contracts and other long-term receivables | | | 11,386 |
| | 14,923 |
|
| Additions to property and equipment | | (9,608 | ) | | (3,543 | ) | | (9,175 | ) | | (7,339 | ) |
| Proceeds from sale of property and equipment | | 1,100 |
| | — |
| | 400 |
| | 655 |
|
| Principal receipts from notes, equipment contracts and other long-term receivables | | 15,283 |
| | 13,969 |
| |
| Additions to long-term receivables | | | (1,555 | ) | | (3,030 | ) |
| Other | | (356 | ) | | (393 | ) | | (186 | ) | | (246 | ) |
| Cash flows provided by investing activities | | 6,419 |
| | 10,033 |
| | 870 |
| | 4,963 |
|
| Cash flows from financing activities: | | | | |
| | | | |
|
| Borrowings under revolving financing facility | | | — |
| | 20,000 |
|
| Repayment of revolving financing facility | | | (25,000 | ) | | — |
|
| Proceeds from issuance of long-term debt | | | 1,300,000 |
| | — |
|
| Repayment of long-term debt | | | (1,283,750 | ) | | (6,500 | ) |
| Payment of debt issuance costs | | | (12,189 | ) | | — |
|
| Dividends paid on common stock | | (52,326 | ) | | (50,790 | ) | | (23,346 | ) | | (28,757 | ) |
| Repurchase of common stock | | (10,003 | ) | | (45,010 | ) | | (46,383 | ) | | (20,003 | ) |
| Principal payments on capital lease and financing obligations | | (10,621 | ) | | (10,391 | ) | |
| Principal payments on finance lease obligations | | | (6,964 | ) | | (8,013 | ) |
| Proceeds from stock options exercised | | | 6,938 |
| | 620 |
|
| Tax payments for restricted stock upon vesting | | (2,345 | ) | | (2,680 | ) | | (2,242 | ) | | (1,400 | ) |
| Proceeds from stock options exercised | | 2,635 |
| | 1,282 |
| |
| Excess tax benefit from stock-based compensation | | — |
| | 966 |
| |
| Cash flows used in financing activities | | (72,660 | ) | | (106,623 | ) | | (92,936 | ) | | (44,053 | ) |
| Net change in cash, cash equivalents and restricted cash | | (35,241 | ) | | (34,532 | ) | | (22,737 | ) | | (13,298 | ) |
| Cash, cash equivalents and restricted cash at beginning of period | | 185,491 |
| | 192,013 |
| | 200,379 |
| | 163,146 |
|
| Cash, cash equivalents and restricted cash at end of period | | $ | 150,250 |
| | $ | 157,481 |
| | $ | 177,642 |
| | $ | 149,848 |
|
| Supplemental disclosures: | | |
| | |
| | |
| | |
|
| Interest paid in cash | | $ | 50,808 |
| | $ | 51,940 |
| | $ | 32,954 |
| | $ | 33,199 |
|
| Income taxes paid in cash | | $ | 50,813 |
| | $ | 56,734 |
| | $ | 24,205 |
| | $ | 18,267 |
|
| Non-cash conversion of accounts receivable to notes receivable | | | $ | — |
| | $ | 5,856 |
|
See the accompanying Notes to Consolidated Financial Statements.
DineEquity,Dine Brands Global, Inc. and Subsidiaries
Notes to Consolidated Financial Statements
(Unaudited)
1. General
The accompanying unaudited consolidated financial statements of DineEquity,Dine Brands Global, Inc. (the “Company” or “DineEquity”“Dine Brands Global”) have been prepared in accordance with United States generally accepted accounting principles (“U.S. GAAP”) for interim financial information and with the instructions to Form 10-Q and Article 10 of Regulation S-X. Accordingly, they do not include all of the information and footnotes required by U.S. GAAP for complete financial statements. In the opinion of management, all adjustments (consisting of normal recurring accruals) considered necessary for a fair presentation have been included. The operating results for the ninesix months ended SeptemberJune 30, 20172019 are not necessarily indicative of the results that may be expected for the twelve months ending December 31, 2017.2019.
The consolidated balance sheet at December 31, 20162018 has been derived from the audited consolidated financial statements at that date but does not include all of the information and footnotes required by U.S. GAAP for complete financial statements.
These consolidated financial statements should be read in conjunction with the consolidated financial statements and footnotes thereto included in the Company’s Annual Report on Form 10-K for the year ended December 31, 2016.2018.
2. Basis of Presentation
The Company’s fiscal quarters end on the Sunday closest to the last day of each calendar quarter. For convenience, the fiscal quarters of each year are referred to as ending on March 31, June 30, September 30 and December 31. The first fiscal quarter of 20172019 began on January 2, 2017December 31, 2018 and ended on April 2, 2017 andMarch 31, 2019; the second and third fiscal quartersquarter of 20172019 ended on July 2, 2017 and October 1, 2017, respectively.June 30, 2019. The first fiscal quarter of 20162018 began on January 4, 20161, 2018 and ended on April 3, 2016 and1, 2018; the second and third fiscal quartersquarter of 20162018 ended on July 3, 2016 and October 2, 2016, respectively.1, 2018.
The accompanying consolidated financial statements include the accounts of the Company and its subsidiaries that are consolidated in accordance with U.S. GAAP. All intercompany balances and transactions have been eliminated.
The preparation of financial statements in conformity with U.S. GAAP requires the Company’s management to make assumptions and estimates that affect the reported amounts of assets and liabilities, disclosures of contingent assets and liabilities, if any, at the date of the consolidated financial statements, and the reported amounts of revenues and expenses during the reporting period. Significant estimates are made in the calculation and assessment of the following: impairment of goodwill, other intangible assets and tangible assets; income taxes; allowance for doubtful accounts and notes receivables; lease accounting estimates; contingencies; and stock-based compensation. On an ongoing basis, the Company evaluates its estimates based on historical experience, current conditions and various other assumptions that are believed to be reasonable under the circumstances. The Company adjusts such estimates and assumptions when facts and circumstances dictate. Actual results could differ from those estimates.
3. Accounting PoliciesStandards Adopted and Newly Issued Accounting Standards Not Yet Adopted
Accounting Standards Adopted Effective January 2, 2017
In MarchFebruary 2016, the Financial Accounting Standards Board (“FASB”) issued new guidance that addresses accounting for certain aspects of share-based payments, including excess tax benefits or deficiencies, forfeiture estimates, statutory tax withholding and cash flow classification of certain share-based payment activity. The Company applied the prospective transition method in adopting the new guidance and prior period amounts have not been restated. Because of the adoption, the Company recognized an excess tax deficiency from stock-based compensation as a discrete item, increasing the income tax provision for the three and nine months ended September 30, 2017 by $0.1 million and $1.8 million, respectively. Historically, excess tax benefits or deficiencies were recorded as additional paid-in capital. The Company applied the prospective transition method with respect to the cash flow classificationaccounting for leases, as codified in Accounting Standards Topic 842 (“ASC 842”). The guidance is intended to improve financial reporting of certain share-based payment activity; accordingly, the cash flowsleasing transactions by requiring entities that lease assets to recognize assets and liabilities for the nine months ended September 30, 2016 have not been restated. rights and obligations created by leases, as well as requiring additional disclosures related to an entity's leasing activities. The Company has elected to maintain its practiceadopted this change in accounting principle using the modified retrospective method as of estimating forfeitures when recognizing expense for share-based payment awards. Amendments to the accounting for minimum statutory withholding requirements had no impact on the Company's Consolidated Financial Statements.
In November 2016, the FASB issued new guidance to reduce diversity in practice in the classification and presentationfirst day of changes in restricted cash in the statement of cash flows. The new guidance requires amounts generally described as restricted cash should be included with cash and cash equivalents when reconciling the beginning-of-period total amounts to the end-of-period total amounts shown on the statement of cash flows. Calendar year public entities will be required to adopt the new guidance beginning with the first fiscal quarter of 2018.2019. Accordingly, financial information for periods prior to the date of initial application has not been adjusted. The Company has elected the package of practical expedients for adoption that permitted the Company not to adoptreassess its prior conclusions regarding lease identification, lease classification and initial direct costs. The Company did not elect to use an allowable expedient that permitted the new guidance retrospectivelyuse of hindsight in performing evaluations of its leases.
Upon adoption of ASC 842, the Company recognized operating lease obligations of $453.0 million, which represented the present value of the remaining minimum lease payments, discounted using the Company's incremental borrowing rate. The Company recognized operating lease right-of-use assets of $395.6 million. The Company recognized an adjustment to retained earnings upon adoption of $5.0 million, net of tax of $1.7 million, primarily related to an impairment resulting from an unfavorable differential between lease payments to be made and sublease rentals to be received on certain leases. The remaining difference of $50.7 million between the recognized operating lease obligation and right-of-use assets related to the
DineEquity,Dine Brands Global, Inc. and Subsidiaries
Notes to Consolidated Financial Statements (Continued)
3. Accounting PoliciesStandards Adopted and Newly Issued Accounting Standards Not Yet Adopted (Continued)
effective January 2, 2017derecognition of certain liabilities and assets that had been recorded in accordance with U.S. GAAP that had been applied prior to the adoption of ASC 842, primarily $43.3 million of accrued rent payments. Lease-related reserves for lease incentives, closed restaurants and unfavorable leaseholds were also derecognized.
The accounting for the Company's existing finance (capital) leases upon adoption of ASC 842 remained substantially unchanged. Adoption of ASC 842 had no significant impact on the Company's cash flows for the nine months ended September 30, 2017 were restated. Adoptionfrom operations or its results of the new guidanceoperations and did not impact any covenant related to the Company's Consolidated Balance Sheets or Consolidated Statements of Comprehensive Income.
In January 2017, the FASB issued new guidance simplifying the test of goodwill for impairment.long-term debt. The new guidance requires a single-step quantitative testCompany implemented internal controls necessary to measure potential impairment based on the excess of a reporting unit's carrying amount over its fair value. Calendar year public entities will be required to adopt the new guidance beginningensure compliance with the first fiscal quarteraccounting and disclosure requirements of 2020. TheASC 842.
Additional new accounting guidance became effective for the Company has elected early adoptionas of the new guidance, as is permitted for interimbeginning of fiscal 2019 that the Company reviewed and concluded was either not applicable to its operations or annual tests of goodwill performed after January 1, 2017.had no material effect on its consolidated financial statements in the current or future fiscal years.
Newly Issued Accounting Standards Not Yet Adopted
In August 2016, the FASB issued new guidance on the classification of certain cash receipts and payments in the statement of cash flows. The new guidance is intended to reduce diversity in practice in how certain transactions are classified in the statement of cash flows. The Company will be required to adopt the new guidance beginning with its first fiscal quarter of 2018. Early adoption is permitted. The Company is currently assessing the impact that the new guidance will have on its consolidated statements of cash flows.
In June 2016, the FASB issued new guidance on the measurement of credit losses on financial instruments. The new guidance will replace the incurred loss methodology of recognizing credit losses on financial instruments that is currently required with a methodology that estimates the expected credit loss on financial instruments and reflects the net amount expected to be collected on the financial instrument. Application of the new guidance may result in the earlier recognition of credit losses as the new methodology will require entities to consider forward-looking information in addition to historical and current information used in assessing incurred losses. The Company will be required to adopt the new guidance on a modified retrospective basis beginning with its first fiscal quarter of 2020, with early adoption permitted in its first fiscal quarter of 2019. The Company is currently evaluating the impact of the new guidance on its consolidated financial statements and related disclosures and whether early adoption will be elected.
disclosures.
In February 2016, the FASB issued new guidance with respect to the accounting for leases. The new guidance will require lessees to recognize a right-of-use asset and a lease liability for virtually all leases, other than leases with a term of 12 months or less, and to provide additional disclosures about leasing arrangements. Accounting by lessors is largely unchanged from existing accounting guidance. The Company will be required to adopt the new guidance on a modified retrospective basis beginning with its first fiscal quarter of 2019. Early adoption is permitted.
While the Company is still in the process of evaluating the impact of the new guidance on its consolidated financial statements and disclosures, the Company expects adoption of the new guidance will have a material impact on its Consolidated Balance Sheets due to recognition of the right-of-use asset and lease liability related to its operating leases. While the new guidance is also expected to impact the measurement and presentation of elements of expenses and cash flows related to leasing arrangements, the Company does not presently believe there will be a material impact on its Consolidated Statements of Comprehensive Income or Consolidated Statements of Cash Flows. Recognition of a lease liability related to operating leases will not impact any covenants related to the Company's long-term debt because the debt agreements specify that covenant ratios be calculated using U.S. GAAP in effect at the time the debt agreements were entered into.
In January 2016,August 2018, the FASB issued guidance ondesigned to improve the recognitioneffectiveness of disclosures by removing, modifying and measurement of financial instruments. The guidance modifies how entities measure certain equity investments and present changes in theadding disclosures related to fair value of those investments, as well as changes how fair value of financial instruments is measured for disclosure purposes.measurements. The amendment is effective commencing with the Company's first fiscal quarter of 2018. The Company is currently evaluating the impact of the new guidance on its financial statements and disclosures.
In May 2014, the FASB issued new accounting guidance on revenue recognition, which provides for a single, five-step model to be applied to all revenue contracts with customers. The new standard also requires additional financial statement disclosures that will enable users to understand the nature, amount, timing and uncertainty of revenue and cash flows relating to customer contracts. Companies have an option to use either the full retrospective method or the modified retrospective method to implement the standard. In August 2015, the FASB deferred the effective date of the new revenue guidance by one year such that the Company will be required to adopt the new guidance beginning with its first fiscal quarter of 2018. The FASB has subsequently issued several clarifications on specific topics within the new revenue recognition guidance that did not change the core principles of the guidance originally issued in May 2014.
DineEquity, Inc. and Subsidiaries
Notes to Consolidated Financial Statements (Continued)
3. Accounting Policies (Continued)
This new guidance supersedes nearly all the existing general revenue recognition guidance under U.S. GAAP as well as most industry-specific revenue recognition guidance, including guidance with respect to revenue recognition by franchisors. The Company believes the recognition of the majority of its revenues, including franchise royalty revenues and sales of IHOP pancake and waffle dry mix will not be affected by the new guidance. Additionally, lease rental revenues are not within the scope of the new guidance.
The Company believes the new guidance will impact the timing of recognition of franchise and development fees. Under existing guidance, these fees are typically recognized upon the opening of restaurants. Under the new guidance, the Company believes the fees will have to be deferred and recognized as revenue over the term of the individual franchise agreements. However, the effect of the required deferral of fees received2020; early adoption in any given year will be mitigated by the recognition of revenue from fees retrospectively deferred from prior years. The Company has essentially completed reviewing most of its nearly 4,000 agreements to obtain the data elements necessary to implement the new guidance and is in the process of quantifying the impactinterim period after issuance of the new guidance is permitted. The Company is currently assessing the impact this guidance will have on its consolidated financial statementsstatements.
In August 2018, the FASB issued new guidance on the accounting for implementation costs incurred in a cloud computing arrangement that is a service contract. The guidance aligns the requirements for capitalizing implementation costs incurred in a hosting arrangement that is a service contract with existing guidance for capitalizing implementation cost incurred to develop or obtain internal-use software. The guidance also provides presentation and related disclosures.
disclosure requirements for such capitalized costs. The Company also believeswill be required to adopt the new guidance will impact the accounting for transactions related to the Applebee's national advertising fund. Currently, franchisee contributions to and expenditures of the Applebee's national advertising fund are not included in the Consolidated Statements of Comprehensive Income. Under the new guidance, the Company would include contributions to and expenditures from the Applebee's advertising fund within the Consolidated Statements of Comprehensive Income as is currently donebeginning with contributions to and expenditures from the IHOP national advertising fund and with international restaurants of both brands. While this change will materially impact the gross amount of reported franchise revenues and expenses, the impact would be an offsetting increase to both revenue and expense such that the impact on gross profit and net income, if any, would not be material.
The Company presently expects to use the full retrospective method of adoption when the new revenue guidance is adopted in theits first fiscal quarter of 2018.
2020; early adoption in any interim period after issuance of the new guidance is permitted. The Company is currently assessing the impact this guidance will have on its consolidated financial statements.
The Company reviewed all other newly issued accounting pronouncements and concluded that they either are not applicable to the Company's operations or that no material effect is expected on the Company's financial statements because of future adoption.
4. GoodwillRevenue Disclosures
Franchise revenue (which comprises most of the Company's revenues) and Intangible Assetsrevenue from company-operated restaurants are recognized in accordance with current guidance for revenue recognition as codified in Accounting Standards Topic (“ASC 606”). Under ASC 606, revenue is recognized upon transfer of control of promised services or goods to customers in an amount that reflects the consideration the Company expects to receive for those services or goods.
ChangesFranchising Activities
The Company owns and franchises the Applebee’s and IHOP restaurant concepts. The franchise arrangement for both brands is documented in the carrying amountform of goodwill fora franchise agreement and, in most cases, a development agreement. The franchise arrangement between the nine months ended September 30, 2017 areCompany as follows:the franchisor and the franchisee as the customer requires the Company to perform various activities to support the brand that do not directly transfer goods and services to the franchisee, but instead represent a single performance obligation, which is the transfer of the franchise license. The intellectual property subject to the franchise license is symbolic intellectual property as it does not have significant standalone functionality, and substantially all the utility is derived from its association with the Company’s past or ongoing activities. The nature of the Company’s promise in granting the franchise license is to provide the franchisee with access to the brand’s symbolic intellectual property over the term of the
|
| | | | | | | | | | | |
| | Applebee's Franchise Unit | | IHOP Franchise Unit | | Total |
| | (In millions) |
| Balance at December 31, 2016: | |
| | |
| | |
| Goodwill, gross | $ | 686.7 |
| | $ | 10.8 |
| | $ | 697.5 |
|
| Accumulated impairment loss | — |
| | — |
| | — |
|
| Goodwill | 686.7 |
| | 10.8 |
| | 697.5 |
|
| Impairment loss | (358.2 | ) | | — |
| | (358.2 | ) |
| Balance at September 30, 2017: | | | | | |
| Goodwill, gross | 686.7 |
| | 10.8 |
| | 697.5 |
|
| Accumulated impairment loss | (358.2 | ) | | — |
| | (358.2 | ) |
| Goodwill | $ | 328.5 |
| | $ | 10.8 |
| | $ | 339.2 |
|
DineEquity,Dine Brands Global, Inc. and Subsidiaries
Notes to Consolidated Financial Statements (Continued)
4. Goodwill and Intangible AssetsRevenue Disclosures (Continued)
Changeslicense. The services provided by the Company are highly interrelated with the franchise license and as such are considered to represent a single performance obligation.
The transaction price in a standard franchise arrangement for both brands primarily consists of (a) initial franchise/development fees; (b) continuing franchise fees (royalties); and (c) advertising fees. Since the carrying amountCompany considers the licensing of intangible assets for the nine months ended September 30, 2017 arefranchising right to be a single performance obligation, no allocation of the transaction price is required. Additionally, all domestic IHOP franchise agreements require franchisees to purchase proprietary pancake and waffle dry mix from the Company.
The Company recognizes the primary components of the transaction price as follows:
|
| | | | | | | | | | | | | | | | | | | |
| | Not Subject to Amortization | | Subject to Amortization | | |
| | Applebee's Tradename | | Other | | Applebee's Franchising Rights | | Leaseholds | | Total |
| | (In millions) |
| Balance at December 31, 2016 | $ | 652.4 |
| | $ | 2.0 |
| | $ | 109.0 |
| | $ | — |
| | $ | 763.4 |
|
| Impairment | (173.4 | ) | | — |
| | — |
| | — |
| | (173.4 | ) |
| Amortization expense | — |
| | — |
| | (7.5 | ) | | (0.0 | ) | | (7.5 | ) |
| Additions | — |
| | 0.4 |
| | — |
| | 2.3 |
| | 2.7 |
|
| Balance at September 30, 2017 | $ | 479.0 |
| | $ | 2.4 |
| | $ | 101.5 |
| | $ | 2.3 |
| | $ | 585.2 |
|
Franchise and development fees are recognized as revenue ratably on a straight-line basis over the term of the franchise agreement commencing with the restaurant opening date. As these fees are typically received in cash at or near the beginning of the franchise term, the cash received is initially recorded as a contract liability until recognized as revenue over time;
The Company evaluates its goodwillis entitled to royalties and advertising fees based on a percentage of the indefinite-lived Applebee's tradename for impairment annuallyfranchisee's gross sales as defined in the fourth quarterfranchise agreement. Royalty and advertising revenue are recognized when the franchisee's reported sales occur. Depending on timing within a fiscal period, the recognition of each year. In additionrevenue results in either what is considered a contract asset (unbilled receivable) or, once billed, accounts receivable, on the balance sheet.
Revenue from the sale of proprietary pancake and waffle dry mix is recognized in the period in which distributors ship the franchisee's order; recognition of revenue results in accounts receivable on the balance sheet.
Company Restaurant Revenue
Sales by company-operated restaurants are recognized when food and beverage items are sold. Company restaurant sales are reported net of sales taxes collected from guests that are remitted to the annual evaluation for impairment, goodwillappropriate taxing authorities.
In determining the amount and indefinite-lived intangible assets are evaluated more frequently iftiming of revenue from contracts with customers, the Company exercises significant judgment with respect to collectibility of the amount; however, the timing of recognition does not require significant judgments as it is based on either the term of the franchise agreement, the month of reported sales by the franchisee or the date of product shipment, none of which require estimation. The Company does not incur a significant amount of contract acquisition costs in conducting its franchising activities. The Company believes indicatorsits franchising arrangements do not contain a significant financing component.
The following table disaggregates franchise revenue by major type for the three and six months ended June 30, 2019 and 2018:
|
| | | | | | | | | | | | | | | | |
| | | Three Months Ended | | Six Months Ended |
| | | June 30, | | June 30, |
| | | 2019 | | 2018 | | 2019 | | 2018 |
| | | (In thousands) |
| Franchise Revenue: | | |
| | |
| | | | |
| Royalties | | $ | 75,747 |
| | $ | 78,102 |
| | $ | 154,382 |
| | $ | 153,199 |
|
| Advertising fees | | 71,738 |
| | 58,705 |
| | 144,368 |
| | 122,541 |
|
| Pancake and waffle dry mix sales and other | | 12,526 |
| | 12,172 |
| | 26,957 |
| | 25,269 |
|
| Franchise and development fees | | 2,657 |
| | 2,962 |
| | 5,887 |
| | 6,245 |
|
| Total franchise revenue | | $ | 162,668 |
| | $ | 151,941 |
| | $ | 331,594 |
| | $ | 307,254 |
|
Accounts receivable from franchisees as of impairment exist.
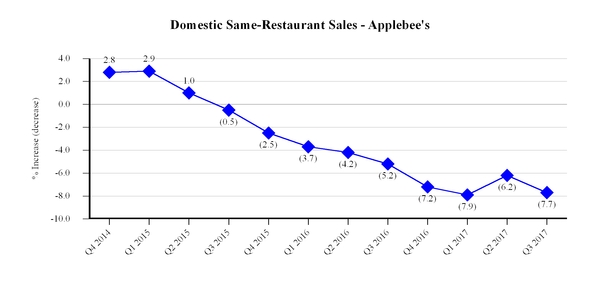
In the third quarterJune 30, 2019 and December 31, 2018 were $65.9 million (net of 2017, the Company noted that the declineallowance of $2.1 million) and $62.6 million (net of allowance of $4.6 million), respectively, and were included in receivables, net in the market price of the Company's common stock since December 31, 2016, which the Company had believed to be temporary, persisted throughout the first eight months of 2017 and that the favorable trend in Applebee's domestic same-restaurant sales experienced in the second quarter of 2017 did not continue into the first two months of the third quarter. The Company also noted a continuing increase in Applebee's bad debt expense and in royalties not recognized in income until paid in cash. Additionally, the Company also determined an increasing shortfall in franchisee contributions to the Applebee's national advertising fund could require a larger amount of future subsidization in the form of additional franchisor contributions to the fund than previously estimated. Based on these unfavorable developments, primarily the decline in the market price of the Company's common stock, the Company determined that indicators of impairment existed and that an interim test of goodwill and indefinite-lived intangible assets for impairment should be performed.Consolidated Balance Sheets.
The Company performed an interim quantitative test of impairment of Applebee's goodwill and tradename in the third quarter of 2017. In performing the quantitative test of goodwill, the Company used the income approach method of valuation that included the discounted cash flow method as well as other generally accepted valuation methodologies to determine the fair value of goodwill and intangible assets. Significant assumptions used to determine fair value under the discounted cash flow model included expected future trends in sales, operating expenses, overhead expenses, capital expenditures and changes in working capital, along with an appropriate discount rate based on the Company's estimated cost of equity capital and after-tax cost of debt.
In performing the impairment review of the tradename, the Company used the relief of royalty method under the income approach method of valuation. Significant assumptions used to determine fair value under the relief of royalty method include future trends in sales, a royalty rate and a discount rate to be applied to the forecast revenue stream.
As a result of performing the quantitative test of impairment, the Company recognized an impairment of Applebee's goodwill of $358.2 million and an impairment of Applebee's tradename of $173.4 million. The Company adopted the guidance in FASB Accounting Standards Update 2017-04 on January 1, 2017; accordingly, the amount of the goodwill impairment was determined as the amount by which the carrying amount of the goodwill exceeded the fair value of the Applebee's franchise reporting unit as estimated in the impairment test. These assets are at risk of additional impairment in the future in the event of sustained downward movement in the Company's stock price, downward revisions of long-term performance assumptions or increases in the assumed long-term discount rate.
DineEquity,Dine Brands Global, Inc. and Subsidiaries
Notes to Consolidated Financial Statements (Continued)
4. Revenue Disclosures (Continued)
Changes in the Company's contract liability for deferred franchise and development fees during the six months ended June 30, 2019 are as follows:
|
| | | | |
| | | Deferred Franchise Revenue (short- and long-term) |
| | | (In thousands) |
| Balance at December 31, 2018 | | $ | 74,695 |
|
| Recognized as revenue during the six months ended June 30, 2019 | | (5,515 | ) |
| Fees deferred during the six months ended June 30, 2019 | | 1,366 |
|
| Balance at June 30, 2019 | | $ | 70,546 |
|
The balance of deferred revenue as of June 30, 2019 is expected to be recognized as follows:
|
| | | |
| (In thousands) |
| Remainder of 2019 | $ | 6,582 |
|
| 2020 | 7,887 |
|
| 2021 | 7,798 |
|
| 2022 | 7,269 |
|
| 2023 | 6,693 |
|
| 2024 | 6,005 |
|
| Thereafter | 28,312 |
|
| Total | $ | 70,546 |
|
5. Lease Disclosures
The Company engages in leasing activity as both a lessee and a lessor. The majority of the Company's lease portfolio originated when the Company was actively involved in the development and financing of IHOP restaurants prior to the franchising of the restaurant to the franchisee. This activity included the Company's leasing or purchase of the site on which the restaurant was located and subsequently leasing/subleasing the site to the franchisee. With a few exceptions, the Company ended this practice in 2003 and the Company's current lease activity is predominantly comprised of renewals of existing lease arrangements and exercises of options on existing lease arrangements.
The Company currently leases from third parties the real property on which approximately 610 IHOP franchisee-operated restaurants and one Applebee's franchisee-operated restaurant are located; the Company (as lessor) subleases the property to the franchisees that operate those restaurants. The Company also leases property it owns to the franchisees that operate approximately 60 IHOP restaurants and one Applebee's restaurant. The Company leases from third parties the real property on which 69 Applebee's company-operated restaurants are located. The Company also leases office space for its principal corporate office in Glendale, California and restaurant support centers in Kansas City, Missouri and Raleigh, North Carolina. The Company does not have a significant amount of non-real estate leases.
The Company's existing leases related to IHOP restaurants generally provided for an initial term of 20 to 25 years with most having one or more five-year renewal options. Option periods were not included in determining liabilities and right-of-use assets related to operating leases. Approximately 240 of the Company's leases contain provisions requiring additional rent payments to the Company (as lessor) based on a percentage of restaurant sales. Approximately 260 of the Company's leases contain provisions requiring additional rent payments by the Company (as lessee) based on a percentage of restaurant sales.
The individual lease agreements do not provide information to determine the implicit rate in the agreements. The Company made significant judgments in determining the incremental borrowing rates that were used in calculating operating lease liabilities as of the adoption date. Due to the large number of leases, the Company applied a portfolio approach by grouping the leases based on the original lease term. The Company estimated the rate for each grouping primarily by reference to yield rates on debt issuances by companies of a similar credit rating as the Company, U.S. Treasury rates as of the adoption date and adjustments for differences in years to maturity.
Dine Brands Global, Inc. and Subsidiaries
Notes to Consolidated Financial Statements (Continued)
5. Lease Disclosures (Continued)
The Company's lease cost for the three and six months ended June 30, 2019 was as follows:
|
| | | | | | | |
| | Three months ended June 30, 2019 | | Six months ended June 30, 2019 |
| Finance lease cost: | (In millions) |
| Amortization of right-of-use assets | $ | 1.3 |
| | $ | 2.6 |
|
| Interest on lease liabilities | 2.0 |
| | 4.1 |
|
| Operating lease cost | 26.8 |
| | 53.2 |
|
| Variable lease cost | 0.6 |
| | 1.3 |
|
| Short-term lease cost | 0.0 |
| | 0.0 |
|
| Sublease income | (27.3 | ) | | (55.4 | ) |
| Lease cost | $ | 3.4 |
| | $ | 5.8 |
|
Future minimum lease payments under noncancelable leases as lessee as of June 30, 2019 were as follows:
|
| | | | | | | |
| | Finance Leases | | Operating Leases |
| | (In millions) |
| 2019 (remaining six months) | $ | 10.3 |
| | $ | 46.2 |
|
| 2020 | 20.1 |
| | 94.6 |
|
| 2021 | 16.5 |
| | 77.8 |
|
| 2022 | 14.7 |
| | 70.0 |
|
| 2023 | 11.6 |
| | 57.5 |
|
| Thereafter | 65.0 |
| | 217.7 |
|
| Total minimum lease payments | 138.2 |
| | 563.8 |
|
| Less: interest/imputed interest | (41.0 | ) | | (117.0 | ) |
| Total obligations | 97.2 |
| | 446.8 |
|
| Less: current portion | (12.9 | ) | | (67.7 | ) |
| Long-term lease obligations | $ | 84.3 |
| | $ | 379.1 |
|
The weighted average remaining lease term as of June 30, 2019 was 8.6 years for finance leases and 7.9 years for operating leases. The weighted average discount rate as of June 30, 2019 was 10.4% for finance leases and 5.8% for operating leases.
During the three and six months ended June 30, 2019, the Company made the following payments for leases:
|
| | | | | | | |
| | Three months ended June 30, 2019 | | Six months ended June 30, 2019 |
| | (In millions) |
| Principal payments on finance lease obligations | $ | 3.5 |
| | $ | 7.0 |
|
| Interest payments on finance lease obligations | $ | 2.0 |
| | $ | 4.1 |
|
| Payments on operating leases | $ | 22.8 |
| | $ | 45.8 |
|
| Variable lease payments | $ | 0.6 |
| | $ | 1.5 |
|
The Company's income from operating leases for the three and six months ended June 30, 2019 was as follows:
|
| | | | | | | |
| | Three months ended June 30, 2019 | | Six months ended June 30, 2019 |
| | (In millions) |
| Minimum lease payments | $ | 25.4 |
| | $ | 51.1 |
|
| Variable lease income | 2.8 |
| | 6.0 |
|
| Total operating lease income | $ | 28.2 |
| | $ | 57.1 |
|
Dine Brands Global, Inc. and Subsidiaries
Notes to Consolidated Financial Statements (Continued)
5. Lease Disclosures (Continued)
Future minimum payments to be received as lessor under noncancelable operating leases as of June 30, 2019 were as follows:
|
| | | |
| | (In millions) |
| 2019 (remaining six months) | $ | 53.1 |
|
| 2020 | 107.3 |
|
| 2021 | 101.5 |
|
| 2022 | 98.4 |
|
| 2023 | 94.0 |
|
| Thereafter | 289.6 |
|
| Total minimum rents receivable | 743.9 |
|
The Company's income from direct financing leases for the three and six months ended June 30, 2019 was as follows:
|
| | | | | | | |
| | Three months ended June 30, 2019 | | Six months ended June 30, 2019 |
| | (In millions) |
| Interest income | $ | 1.3 |
| | $ | 2.7 |
|
| Variable lease income | 0.3 |
| | 0.7 |
|
| Total operating lease income | $ | 1.6 |
| | $ | 3.4 |
|
Future minimum payments to be received as lessor under noncancelable direct financing leases as of June 30, 2019 were as follows:
|
| | | |
| | (In millions) |
| 2019 (remaining six months) | $ | 7.9 |
|
| 2020 | 14.7 |
|
| 2021 | 11.6 |
|
| 2022 | 8.2 |
|
| 2023 | 3.6 |
|
| Thereafter | 3.8 |
|
| Total minimum rents receivable | 49.8 |
|
| Less: unearned income | (10.0 | ) |
| Total net investment in direct financing leases | 39.8 |
|
| Less: current portion | (11.2 | ) |
| Long-term investment in direct financing leases | $ | 28.6 |
|
6. Long-Term Debt
At June 30, 2019 and December 31, 2018, long-term debt consisted of the following:
|
| | | | | | | |
| | June 30, 2019 | | December 31, 2018 |
| | (In millions) |
| Series 2019-1 4.194% Fixed Rate Senior Secured Notes, Class A-2-I | $ | 700.0 |
| | $ | — |
|
| Series 2019-1 4.723% Fixed Rate Senior Secured Notes, Class A-2-II | 600.0 |
| | — |
|
| Series 2014-1 4.277% Fixed Rate Senior Secured Notes, Class A-2 | — |
| | 1,283.8 |
|
| Series 2018-1 Variable Funding Senior Notes Class A-1, variable interest rate of 4.93% at December 31, 2018 | — |
| | 25.0 |
|
| Class A-2-I and A-2-II (2019) and Class A-2 (2018) Note debt issuance costs | (12.8 | ) | | (9.7 | ) |
| Long-term debt, net of debt issuance costs | 1,287.2 |
| | 1,299.1 |
|
| Current portion of long-term debt | — |
| | (25.0 | ) |
| Long-term debt | $ | 1,287.2 |
| | $ | 1,274.1 |
|
Dine Brands Global, Inc. and Subsidiaries
Notes to Consolidated Financial Statements (Continued)
6. Long-Term Debt (Continued)
On June 5, 2019, Applebee’s Funding LLC and IHOP Funding LLC (the “Co-Issuers”), each a special purpose, wholly-owned indirect subsidiary of the Company, issued two tranches of fixed rate senior secured notes, the Series 2019-1 4.194% Fixed Rate Senior Secured Notes, Class A-2-I (“Class A-2-I Notes”) in an initial aggregate principal amount of $700 million and the Series 2019-1 4.723% Fixed Rate Senior Secured Notes, Class A-2-II (“Class A-2-II Notes”) in an initial aggregate principal amount of $600 million (the “Class A-2-II Notes” and, together with the Class A-2-I Notes, the “2019 Class A-2 Notes”). The 2019 Class A-2 Notes were issued pursuant to an offering exempt from registration under the Securities Act of 1933, as amended.
The Co-Issuers also replaced their existing revolving financing facility, the 2018-1 Variable Funding Senior Notes, Class A-1 (“2018-1 Class A-1 Notes”), with a new revolving financing facility, the 2019-1 Variable Funding Senior Notes, Class A-1 (the “2019 Class A-1 Notes”), on substantially the same terms as the 2018-1 Class A-1 Notes in order to conform the term of the 2019 Class A-1 Notes to the anticipated repayment dates for the 2019 Class A-2 Notes. The 2019 Class A-1 Notes and the 2019 Class A-2 Notes are referred to collectively herein as the “New Notes.”
The New Notes were issued in a securitization transaction pursuant to which substantially all of the domestic revenue-generating assets and domestic intellectual property, as further described below, held by the Co-Issuers and certain other special-purpose, wholly-owned indirect subsidiaries of the Company (the “Guarantors”) were pledged as collateral to secure the New Notes.
The Company used the majority of the net proceeds of the offering to repay the entire outstanding balance of approximately $1.28 billion of Series 2014-1 4.277% Fixed Rate Senior Notes, Class A-2 (the “2014 Class A-2 Notes”). The Company used the remaining proceeds of the offering to pay for transactions costs associated with the securitization refinancing transaction and for general corporate purposes.
2019 Class A-2 Notes
The New Notes were issued under a Base Indenture, dated as of September 30, 2014, and amended and restated as of June 5, 2019 (the “Base Indenture”) (see Exhibit 4.1 to this Form 10-Q), and the related Series 2019-1 Supplement to the Base Indenture, dated June 5, 2019 (the “Series 2019-1 Supplement”) (see Exhibit 4.2 to this Form 10-Q), among the Co-Issuers and Citibank, N.A., as the trustee (in such capacity, the “Trustee”) and securities intermediary. The Base Indenture and the Series 2019-1 Supplement (collectively, the “Indenture”) will allow the Co-Issuers to issue additional series of notes in the future subject to certain conditions set forth therein.
The legal final maturity of the 2019 Class A-2 Notes is in June 2049, but rapid amortization will apply if the Class A-2-I Notes are not repaid by June 2024 (the “Class A-2-I Anticipated Repayment Date”) and for the Class A-2-II Notes if not repaid by June 2026 (the “Class A-2-II Anticipated Repayment Date”). If the Co-Issuers have not repaid or refinanced the Class A-2-I Notes by the Class A-2-I Anticipated Repayment Date or the Class A-2-II Notes by the Class A-2-II Anticipated Repayment Date, then additional interest will accrue on the Class A-2-I Notes and the Class A-2-II Notes, as applicable, at the greater of: (A) 5.0% and (B) the amount, if any, by which the sum of the following exceeds the applicable Series 2019-1 Class A-2 Note interest rate: (x) the yield to maturity (adjusted to a quarterly bond-equivalent basis) on the applicable anticipated repayment date of the United States Treasury Security having a term closest to 10 years plus (y) 5.0%, plus (z) 2.15% for the Series 2019-1 Class A-2-I Notes and 2.64% for the Series 2019-1 Class A-2-II Notes.
While the 2019 Class A-2 Notes are outstanding, payment of principal and interest is required to be made on the Class A-2 Notes on a quarterly basis. The payment of principal on the 2019 Class A-2 Notes may be suspended when the leverage ratio for the Company and its subsidiaries is less than or equal to 5.25x. As of June 30, 2019, the Company's leverage ratio was 4.57x; accordingly, no principal payment on the 2019 Class A-2 Notes will be required during the third quarter of 2019. Exceeding the leverage ratio of 5.25x does not violate any covenant related to the New Notes.
The Company may voluntarily repay the 2019 Class A-2 Notes at any time, however, if the Company repays the New Notes prior to certain dates it would be required to pay make-whole or call redemption premiums. As of June 30, 2019, the make-whole premium associated with voluntary prepayment of the Class A-2-I Notes was approximately $38 million; this amount declines progressively each quarter to zero in June 2022. As of June 30, 2019, the make-whole premium associated with voluntary prepayment of the Class A-2-II Notes was approximately $67 million; this amount declines progressively each quarter to zero in June 2024. In lieu of the applicable make whole premiums above, a call redemption premium will be payable upon any redemption or refinancing in full of the New Notes at any time on or after the quarterly payment date in June 2022 and on or prior to the quarterly payment date in June 2023. The call redemption premium is the lesser of 101% times the outstanding principal amount of the Class A-2-II Notes, less the outstanding principal amount of the Class A-2-II, at the time of redemption or refinancing and the applicable make-whole premium otherwise payable on the Class A-2-II Notes.
Dine Brands Global, Inc. and Subsidiaries
Notes to Consolidated Financial Statements (Continued)
6. Long-Term Debt (Continued)
The Company would also be subject to a make-whole premium in the event of a mandatory prepayment required following a Rapid Amortization Event or certain asset dispositions. The mandatory make-whole premium requirements are considered derivatives embedded in the New Notes that must be bifurcated for separate valuation. The Company estimated the fair value of these derivatives to be immaterial as of June 30, 2019, based on the probability-weighted discounted cash flows associated with either event.
2019 Class A-1 Notes
The Co-Issuers also entered into a revolving financing facility, the 2019 Class A-1 Notes, that allows for drawings up to $225 million of variable funding notes and the issuance of letters of credit. The 2019 Class A-1 Notes were issued under the Indenture. Drawings and certain additional terms related to the 2019 Class A-1 Notes are governed by the 2019 Class A-1 Note Purchase Agreement, dated June 5, 2019, among the Co-Issuers, certain special-purpose, wholly-owned indirect subsidiaries of the Company, each as a Guarantor, the Company, as manager, certain conduit investors, financial institutions and funding agents, and Barclays Bank PLC, as provider of letters credit, swingline lender and administrative agent (the “Purchase Agreement”), (see Exhibit 10.15 to this Form 10-Q).
The 2019 Class A-1 Notes are governed, in part, by the Purchase Agreement and by certain generally applicable terms contained in the Indenture. The applicable interest rate under the 2019 Class A-1 Notes depends on the type of borrowing by the Co-Issuers. The applicable interest rate for advances is generally calculated at a per annum rate equal to the commercial paper funding rate or one-, two-, three- or six-month Eurodollar Funding Rate, in either case, plus 2.15%. The applicable interest rate for swingline advances and unreimbursed draws on outstanding letters of credit is a per annum base rate equal to the sum of (a) 1.15% plus (b) the greatest of (i) the Prime Rate in effect from time to time, (ii) the Federal Funds Rate in effect from time to time plus 0.50% and (iii) the one-month Eurodollar Funding Rate plus 1.00%. There is no upfront fee for the 2019 Class A-1 Notes. There is a fee of 50 basis points on any unused portion of the revolving financing facility. Undrawn face amounts of outstanding letters of credit that are not cash collateralized accrue a fee of 2.15% per annum. It is anticipated that any principal and interest on the 2019 Class A-1 Notes will be repaid in full on or prior to the quarterly payment date in June 2024 (the “2019 Class A-1 Anticipated Repayment Date”), subject to two additional one-year extensions at the option of the Company upon the satisfaction of certain conditions.
The Company has not drawn on the 2019 Class A-1 Notes subsequent to their June 5, 2019, issuance. At June 30, 2019, $2.2 million was pledged against the 2019 Class A-1 Notes for outstanding letters of credit, leaving $222.8 million of 2019 Class A-1 Notes available for borrowing. The letters of credit are used primarily to satisfy insurance-related collateral requirements.
During the six months ended June 30, 2019, the Company repaid $25.0 million of 2018 Class A-1 Notes, representing the amount outstanding at December 31, 2018; the Company did not draw on the 2018 Class A-1 Notes during the six months ended June 30, 2019. The maximum amount of 2018 Class A-1 Notes outstanding during the six months ended June 30, 2019 was $25.0 million and the weighted average interest rate on the 2018 Class A-1 Notes for the period outstanding was 4.88%.
Guarantee and Collateral Agreement
Under the Guarantee and Collateral Agreement, dated September 30, 2014, as amended and restated as of June 5, 2019, (see Exhibit 10.16 to this Form 10-Q), among the Guarantors in favor of the Trustee, the Guarantors guarantee the obligations of the Co-Issuers under the Indenture and related documents and secure the guarantee by granting a security interest in substantially all of their assets.
The New Notes are secured by a security interest in substantially all of the assets of the Co-Issuers and the Guarantors (collectively, the “Securitization Entities”). On the Closing Date, these assets (the “Securitized Assets”) generally included substantially all of the domestic revenue-generating assets of the Company and its subsidiaries, which principally consist of franchise agreements, area license agreements, development agreements, franchisee fee notes, equipment leases, agreements related to the domestic production of and the sale of pancake and waffle dry-mixes, owned and leased real property and intellectual property.
The New Notes are the obligations only of the Co-Issuers pursuant to the Indenture and are unconditionally and irrevocably guaranteed by the Guarantors pursuant to the Guarantee and Collateral Agreement. Except as described below, neither the Company nor any subsidiary of the Company, other than the Securitization Entities, will guarantee or in any way be liable for the obligations of the Co-Issuers under the Indenture or the New Notes.
Dine Brands Global, Inc. and Subsidiaries
Notes to Consolidated Financial Statements (Continued)
6. Long-Term Debt (Continued)
Management Agreement
Under the terms of the Management Agreement, dated September 30, 2014, as amended and restated as of September 5, 2018 and as further amended and restated as of June 5, 2019, (see Exhibit 10.17 to this Form 10-Q), among the Company, the Securitization Entities, Applebee’s Services, Inc., International House of Pancakes, LLC and the Trustee, the Company will act as the manager with respect to the Securitized Assets. The primary responsibilities of the manager will be to perform certain franchising, distribution, intellectual property and operational functions on behalf of the Securitization Entities with respect to the Securitized Assets pursuant to the Management Agreement. The manager will be entitled to the payment of the weekly management fee, as set forth in the Management Agreement and will be subject to the liabilities set forth in the Management Agreement.
The manager will manage and administer the Securitized Assets in accordance with the terms of the Management Agreement and, except as otherwise provided in the Management Agreement, the management standard set forth in the Management Agreement. Subject to limited exceptions set forth in the Management Agreement, the Management Agreement does not require the manager to expend or risk its funds or otherwise incur any financial liability in the performance of any of its rights or powers under the Management Agreement if the manager has reasonable grounds for believing that repayment of such funds or adequate indemnity against such risk or liability is not compensated by payment of the weekly management fee or is otherwise not reasonably assured or provided to it.
Subject to limited exceptions set forth in the Management Agreement, the manager will indemnify each Securitization Entity, the trustee and certain other parties, and their respective officers, directors, employees and agents for all claims, penalties, fines, forfeitures, losses, liabilities, obligations, damages, actions, suits and related costs and judgments and other costs, fees and reasonable expenses that any of them may incur as a result of (a) failure of the manager to perform or observe its obligations under the Management Agreement, (b) the breach by the manager of any representation, warranty or covenant under the Management Agreement, or (c) the manager’s negligence, bad faith or willful misconduct in the performance of its duties under the Management Agreement.
Covenants and Restrictions
The New Notes are subject to a series of covenants and restrictions customary for transactions of this type, including: (i) that the Co-Issuers maintain specified reserve accounts to be used to make required payments in respect of the New Notes, (ii) provisions relating to optional and mandatory prepayments, and the related payment of specified amounts, including specified call redemption premiums in the case of Class A-2 Notes under certain circumstances; (iii) certain indemnification payments in the event, among other things, the transfers of the assets pledged as collateral for the New Notes are in stated ways defective or ineffective and (iv) covenants relating to recordkeeping, access to information and similar matters.
The New Notes are subject to customary rapid amortization events for similar types of financing, including events tied to our failure to maintain the stated debt service coverage ratio (“DSCR”), the sum of domestic retail sales for all restaurants being below certain levels on certain measurement dates, certain manager termination events, certain events of default and the failure to repay or refinance the New Notes on or before their respective Anticipated Repayment Dates. The New Notes are also subject to certain customary events of default, including events relating to non-payment of required interest, principal or other amounts due on or with respect to the Notes, failure of the Securitization Entities to maintain the stated DSCR, failure to comply with covenants within certain time frames, certain bankruptcy events, breaches of specified representations and warranties and certain judgments.
Failure to maintain a prescribed DSCR can trigger a Cash Flow Sweeping Event, A Rapid Amortization Event, a Manager Termination Event or a Default Event as described below. In a Cash Flow Sweeping Event, the Trustee is required to retain 50% of excess Cash Flow (as defined) in a restricted account. In a Rapid Amortization Event, all excess Cash Flow is retained and used to retire principal amounts of debt. Key DSCRs are as follows:
•DSCR less than 1.75x - Cash Flow Sweeping Event
•DSCR less than 1.20x - Rapid Amortization Event
•Interest-only DSCR less than 1.20x - Manager Termination Event
•Interest-only DSCR less than 1.10x - Default Event
The Company's DSCR for the reporting period ended June 30, 2019 was 5.40x.
Dine Brands Global, Inc. and Subsidiaries
Notes to Consolidated Financial Statements (Continued)
6. Long-Term Debt (Continued)
Debt Issuance Costs
The Company incurred costs of approximately $12.9 million in connection with the issuance of the 2019 Class A-2 Notes. These debt issuance costs are being amortized using the effective interest method over estimated life of each tranche of the 2019 Class A-2 Notes. Amortization of $0.1 million of these costs was included in interest expense for the three and six months ended June 30, 2019. Unamortized debt issuance costs of $12.8 million are reported as a direct reduction of the 2019 Class A-2 Notes in the Consolidated Balance Sheets.
The Company incurred costs of approximately $0.2 million in connection with the replacement of the 2018-1 Class A-1 Notes with the 2019-1 Class A-1 Notes. These debt issuance costs have been added to the remaining unamortized costs of approximately $2.8 million related to the 2018-1 Class A-1 Notes, the total of which costs is being amortized using the effective interest method over the estimated five-year life of the 2019-1 Class A-1 Notes. Amortization of these costs of $0.2 million and $0.5 million, respectively, was included in interest expense for the three and six months ended June 30, 2019.
Unamortized debt issuance costs of $3.0 million related to the 2019-1 Class A-1 Notes are reported as other long-term assets in the Consolidated Balance Sheets at June 30, 2019.
Loss on Extinguishment of Debt
In connection with the repayment of the 2014 Class A-2 Notes, the Company recognized a loss on extinguishment of debt of $8.3 million, representing the remaining unamortized costs related to the 2014 Class A-2 Notes. Prior to the extinguishment, amortization of $0.6 million and $1.4 million, respectively, of costs associated with the 2014 Class A-2 Notes was included in interest expense for the three and six months ended June 30, 2019.
For a description of the 2014 Class A-2 Notes and the 2018-1 Class A-1 Notes, refer to Note 8 of the Notes to Consolidated Financial Statements included in the Company’s Annual Report on Form 10-K for the year ended December 31, 2018.
7. Stockholders' EquityDeficit
Dividends
During the ninesix months ended SeptemberJune 30, 2017,2019, the Company paid dividends on common stock of $52.3$23.3 million, representing a cash dividendsdividend of $0.97$0.63 per share declared in the fourth quarter of 20162018, paid in January 2019 and a cash dividend of $0.69 per share declared in the first and second quartersquarter of 2017.2019, paid in April 2019. On August 10, 2017,May 13, 2019, the Company's Board of Directors declared a thirdsecond quarter 20172019 cash dividend of $0.97$0.69 per share of common stock. This dividend was paid on October 6, 2017July 12, 2019 to the Company's stockholders of record at the close of business on September 18, 2017.June 20, 2019. The Company reported dividends payable of $17.8$12.2 million at SeptemberJune 30, 2017.2019.
Dividends declared and paid per share for the three and six months ended June 30, 2019 and 2018 were as follows:
|
| | | | | | | | | | | | | | | |
| | Three months ended June 30, | | Six months ended June 30, |
| | 2019 |
| | 2018 |
| | 2019 |
| | 2018 |
|
| Dividends declared per common share | $ | 0.69 |
| | $ | 0.63 |
| | $ | 1.38 |
| | $ | 1.26 |
|
| Dividends paid per common share | $ | 0.69 |
| | $ | 0.63 |
| | $ | 1.32 |
| | $ | 1.60 |
|
Stock Repurchase Program
In February 2019, the Company’s Board of Directors approved a stock repurchase program authorizing the Company to repurchase up to $200 million of the Company’s common stock (the “2019 Repurchase Program”) on an opportunistic basis from time to time in the open market or in privately negotiated transactions based on business, market, applicable legal requirements and other considerations. The 2019 Repurchase Program, as approved by the Board of Directors, does not require the repurchase of a specific number of shares and can be terminated at any time.
Dine Brands Global, Inc. and Subsidiaries
Notes to Consolidated Financial Statements (Continued)
7. Stockholders' Deficit (Continued)
In October 2015, the Company's Board of Directors approved a stock repurchase program authorizing the Company to repurchase up to $150 million of DineEquityits common stock (the “2015 Repurchase Program”) on an opportunistic basis from time to time in open market transactions and in privately negotiated transactions based on business, market, applicable legal requirements and other considerations. The 2015 Repurchase Program, as approved by the Board of Directors, doesdid not require the repurchase of a specific number of shares and cancould be terminated at any time. In connection with the approval of the 2019 Repurchase Program, the Board of Directors terminated the 2015 Repurchase Program.
A summary of shares repurchased under the 2019 Repurchase Program and the 2015 Repurchase Program, during the ninethree and six months ended SeptemberJune 30, 20172019 and cumulatively, is as follows:
|
| | | | | | |
| | Shares | | Cost of shares |
| | | | (In millions) |
| 2019 Repurchase Program: | | | |
| Repurchased during the three months ended June 30, 2019 | 392,132 |
| | $ | 35.3 |
|
| Repurchased during the six months ended June 30, 2019 | 432,949 |
| | $ | 39.0 |
|
| Cumulative (life-of-program) repurchases | 432,949 |
| | $ | 39.0 |
|
| Remaining dollar value of shares that may be repurchased | n/a | | $ | 161.0 |
|
| 2015 Repurchase Program: | | | |
| Repurchased during the three months ended June 30, 2019 | — |
| | $ | — |
|
| Repurchased during the six months ended June 30, 2019 | 110,499 |
| | $ | 8.4 |
|
| Cumulative (life-of-program) repurchases | 1,589,995 |
| | $ | 126.2 |
|
| Remaining dollar value of shares that may be repurchased | n/a | | n/a |
|
| | | | | | |
| 2015 Repurchase Program | Shares | | Cost of shares |
| | | | (In millions) |
| Repurchased during the three months ended September 30, 2017 | — |
| | $ | — |
|
| Repurchased during the nine months ended September 30, 2017 | 145,786 |
| | $ | 10.0 |
|
| Cumulative repurchases as of September 30, 2017 | 1,000,657 |
| | $ | 82.9 |
|
| Remaining dollar value of shares that may be repurchased | n/a | | $ | 67.1 |
|
Treasury Stock
Repurchases of DineEquitythe Company's common stock are included in treasury stock at the cost of shares repurchased plus any transaction costs. Treasury stock may be re-issued when stock options are exercised, when restricted stock awards are granted and when restricted stock units settle in stock upon vesting. The cost of treasury stock re-issued is determined using the first-in, first-out (“FIFO”) method. During the ninesix months ended SeptemberJune 30, 2017,2019, the Company re-issued 273,376187,367 shares of treasury stock at a total FIFO cost of $9.8$8.3 million.
6.8. Income Taxes
The Company's effective tax rate was 6.4%24.5% for the ninesix months ended SeptemberJune 30, 20172019 as compared to 35.2%37.0% for the ninesix months ended SeptemberJune 30, 2016. 2018. The effective tax rate of 6.4%24.5% for the ninesix months ended SeptemberJune 30, 2017 (the tax benefit of $28.2 million on the pretax book loss of $444.3 million)2019 was significantly differentlower than the statutory federal tax rate of 35% because the $358.2 million impairment of goodwill (see Note 4) is not deductibleprior comparable period primarily due to Internal Revenue Service (“IRS”) audit adjustments for federal income tax purposes and therefore has no associated tax benefit. The Company did recognize a tax benefit of $65.1 million as a discrete item relatedyears 2011 to 2013 recognized in the $173.4 million impairment of Applebee's tradename.prior period.
The total gross unrecognized tax benefit as of SeptemberJune 30, 20172019 and December 31, 20162018 was $5.9$5.6 million and $3.9$5.2 million, respectively, excluding interest, penalties and related tax benefits. The Company estimates the unrecognized tax benefit may decrease over the upcoming 12 months by an amount up to $1.8$1.3 million related to settlements with taxing authorities and the lapse of statutes of limitations. For the remaining liability, due to the uncertainties related to these tax matters, the Company is unable to make a reasonably reliable estimate as to when cash settlement with a taxing authority will occur.
As of SeptemberJune 30, 2017,2019, accrued interest was $1.0$1.5 million and accrued penalties were less than $0.1 million, excluding any related income tax benefits. As of December 31, 2016,2018, accrued interest was $1.0$1.1 million and accrued penalties were less than $0.1 million, excluding any related income tax benefits. The Company recognizes interest accrued related to unrecognized tax benefits and penalties as a component of its income tax provision recognized in its Consolidated Statements of Comprehensive Income.
The Company files federal income tax returns and the Company or one of its subsidiaries filesfile income tax returns in various state and foreign jurisdictions.international jurisdictions.The IRS examination of tax years 2011 to 2013 concluded during the three months ended June 30, 2019, and the Company received a refund of $13.3 million, inclusive of interest income of $0.9 million. With few exceptions, the Company is no longer subject to federal, state or non-United States tax examinations by tax authorities for years before 2011. The Internal Revenue Service commenced examination of the Company’s U.S. federal income tax return for the tax years 2011 to 2013 during the year. The examination is currently in process. The Company believes that adequate reserves have been provided relatingrelated to all matters contained in the tax periods open to examination.
DineEquity,Dine Brands Global, Inc. and Subsidiaries
Notes to Consolidated Financial Statements (Continued)
7.
9. Stock-Based Compensation
The following table summarizes the components of stock-based compensation expense included in general and administrative expenses in the Consolidated Statements of Comprehensive Income:
|
| | | | | | | | | | | | | | | |
| | Three months ended June 30, | | Six months ended June 30, |
| | 2019 | | 2018 | | 2019 | | 2018 |
| | (In millions) |
| Total stock-based compensation expense: | | | | | | | |
| Equity classified awards expense | $ | 1.8 |
| | $ | 2.3 |
| | $ | 5.9 |
| | $ | 5.7 |
|
| Liability classified awards expense | 1.4 |
| | 0.4 |
| | 2.4 |
| | 0.9 |
|
| Total pre-tax stock-based compensation expense | 3.2 |
| | 2.7 |
| | 8.3 |
| | 6.6 |
|
| Book income tax benefit | (0.9 | ) | | (0.7 | ) | | (2.2 | ) | | (1.7 | ) |
| Total stock-based compensation expense, net of tax | $ | 2.3 |
| | $ | 2.0 |
| | $ | 6.1 |
| | $ | 4.9 |
|
|
| | | | | | | | | | | | | | | |
| | Three months ended September 30, | | Nine months ended September 30, |
| | 2017 | | 2016 | | 2017 | | 2016 |
| | (In millions) |
| Total stock-based compensation expense: | | | | | | | |
| Equity classified awards expense | $ | 1.3 |
| | $ | 2.6 |
| | $ | 9.0 |
| | $ | 8.3 |
|
| Liability classified awards expense | — |
| | (0.5 | ) | | (1.1 | ) | | 0.6 |
|
| Total pre-tax stock-based compensation expense | 1.3 |
| | 2.1 |
| | 7.9 |
| | 8.9 |
|
| Book income tax benefit | (0.5 | ) | | (0.7 | ) | | (3.0 | ) | | (3.3 | ) |
| Total stock-based compensation expense, net of tax | $ | 0.8 |
| | $ | 1.4 |
| | $ | 4.9 |
| | $ | 5.6 |
|
As of SeptemberJune 30, 20172019, total unrecognized compensation expense of $17.6$21.8 million related to restricted stock and restricted stock units and $3.2$4.5 million related to stock options are expected to be recognized over a weighted average period of 2.11.6 years for restricted stock and restricted stock units and 1.91.6 years for stock options.
Fair Value Assumptions
The Company granted 537,030132,832 stock options during the ninesix months ended SeptemberJune 30, 20172019 for which the fair value was estimated using a Black-Scholes option pricing model. The following summarizes the assumptions used in the Black-Scholes model:
|
| | |
| Risk-free interest rate | 1.92.5 | % |
| Weighted average historical volatility | 22.930.3 | % |
| Dividend yield | 7.32.8 | % |
| Expected years until exercise | 4.54.7 |
|
| Weighted average fair value of options granted | $4.3121.93 |
The Company granted 350,000 performance-based stock options
Equity Classified Awards - Stock Options
Stock option balances at June 30, 2019, and 175,000 performance-based restricted stock units duringactivity for the threesix months ended SeptemberJune 30, 2017 for which the fair value was estimated using a Monte Carlo simulation method. The following summarizes the assumptions used in estimating the fair values:2019 were as follows:
|
| | | | | | | | | | | | | |
| | | Shares | | Weighted Average Exercise Price | | Weighted Average Remaining Contractual Term (in Years) | | Aggregate Intrinsic Value (in Millions) |
| Outstanding at December 31, 2018 | | 1,439,708 |
| | $ | 63.21 |
| | | | |
|
| Granted | | 132,832 |
| | 98.97 |
| | | | |
|
| Exercised | | (118,991 | ) | | 58.32 |
| | | | |
|
| Forfeited | | (77,952 | ) | | 69.54 |
| | | | |
|
| Outstanding at June 30, 2019 | | 1,375,597 |
| | 66.72 |
| | 6.0 | | $ | 41.3 |
|
| Vested at June 30, 2019 and Expected to Vest | | 1,263,536 |
| | 67.54 |
| | 5.7 | | $ | 36.9 |
|
| Exercisable at June 30, 2019 | | 684,738 |
| | $ | 75.93 |
| | 3.4 | | $ | 14.7 |
|
|
| | |
Risk-free interest rate | 1.6 | % |
Weighted average historical volatility | 30.0 | % |
Dividend yield | 9.6 | % |
Expected years until exercise | 3.4 |
|
Weighted average fair value of options granted | $3.07 |
Weighted average fair value of restricted stock units granted | $10.19 |
DineEquity,Dine Brands Global, Inc. and Subsidiaries
Notes to Consolidated Financial Statements (Continued)
7.9. Stock-Based Compensation (Continued)
Equity Classified Awards - Stock Options
Stock option balances at September 30, 2017, and activity for the nine months ended September 30, 2017 were as follows:
|
| | | | | | | | | | | | | |
| | | Shares | | Weighted Average Exercise Price | | Weighted Average Remaining Contractual Term (in Years) | | Aggregate Intrinsic Value (in Millions) |
| Outstanding at December 31, 2016 | | 701,134 |
| | $ | 80.04 |
| | | | |
|
| Granted | | 887,030 |
| | 48.35 |
| | | | |
|
| Exercised | | (64,916 | ) | | 40.59 |
| | | | |
|
| Expired | | (58,217 | ) | | 84.43 |
| | | | |
| Forfeited | | (171,847 | ) | | 65.82 |
| | | | |
|
| Outstanding at September 30, 2017 | | 1,293,184 |
| | 61.98 |
| | 7.3 | | $ | 0.9 |
|
| Vested at September 30, 2017 and Expected to Vest | | 1,111,610 |
| | 64.50 |
| | 7.0 | | $ | 0.6 |
|
| Exercisable at September 30, 2017 | | 456,308 |
| | $ | 81.35 |
| | 3.3 | | $ | 0.0 |
|
The aggregate intrinsic value in the table above represents the total pre-tax intrinsic value (the difference between the closing stock price of the Company’s common stock on the last trading day of the thirdsecond quarter of 20172019 and the exercise price, multiplied by the number of in-the-money options) that would have been received by the option holders had all option holders exercised their options on SeptemberJune 30, 20172019. The aggregate intrinsic value will change based on the fair market value of the Company’s common stock and the number of in-the-money options.
Equity Classified Awards - Restricted Stock and Restricted Stock Units
Outstanding balances as of SeptemberJune 30, 20172019, and activity related to restricted stock and restricted stock units for the ninesix months ended SeptemberJune 30, 20172019 were as follows:
|
| | | | | | | | | | | | | | |
| | | Restricted Stock | | Weighted Average Grant Date Fair Value | | Stock-Settled Restricted Stock Units | | Weighted Average Grant Date Fair Value |
| Outstanding at December 31, 2018 | | 267,242 |
| | $ | 63.97 |
| | 374,529 |
| | $ | 31.05 |
|
| Granted | | 68,376 |
| | 97.74 |
| | 16,232 |
| | 98.97 |
|
| Released | | (58,885 | ) | | 81.19 |
| | (12,293 | ) | | 90.34 |
|
| Forfeited | | (23,437 | ) | | 66.50 |
| | (27,802 | ) | | 34.53 |
|
| Outstanding at June 30, 2019 | | 253,296 |
| | $ | 68.84 |
| | 350,666 |
| | $ | 30.66 |
|
|
| | | | | | | | | | | | | | |
| | | Restricted Stock | | Weighted Average Grant Date Fair Value | | Restricted Stock Units | | Weighted Average Grant Date Fair Value |
| Outstanding at December 31, 2016 | | 235,472 |
| | $ | 92.81 |
| | 34,058 |
| | $ | 93.95 |
|
| Granted | | 208,460 |
| | 52.08 |
| | 275,578 |
| | 22.37 |
|
| Released | | (89,911 | ) | | 88.65 |
| | (12,683 | ) | | 81.63 |
|
| Forfeited | | (73,409 | ) | | 79.44 |
| | — |
| | — |
|
| Outstanding at September 30, 2017 | | 280,612 |
| | $ | 67.38 |
| | 296,953 |
| | $ | 28.39 |
|
Liability Classified Awards - Cash-settled Restricted Stock Units
The Company has granted cash-settled restricted stock units to certain employees. These instruments are recorded as liabilities at fair value as of the respective period end.
|
| | | | | | | |
| | | Cash-Settled Restricted Stock Units | | Weighted Average Grant Date Fair Value |
| Outstanding at December 31, 2018 | | 53,766 |
| | $ | 94.45 |
|
| Granted | | 20,249 |
| | 96.12 |
|
| Released | | (317 | ) | | 82.16 |
|
| Forfeited | | (4,054 | ) | | 98.35 |
|
| Outstanding at June 30, 2019 | | 69,644 |
| | $ | 98.59 |
|
For the three months ended June 30, 2019 and 2018, $0.5 million and $0.2 million, respectively, was included as stock-based compensation expense related to cash-settled restricted stock units. For the six months ended June 30, 2019, and 2018, $1.1 million and $0.3 million, respectively, was included as stock-based compensation expense related to cash-settled restricted stock units.
Liability Classified Awards - Long-Term Incentive Awards
The Company has granted cash long-term incentive awards (“LTIP awards”) to certain employees. Annual LTIP awards vest over a three-year period and are determined using a multipliermultipliers from 0% to 200% of the target award based on (i) the total stockholder return of DineEquityDine Brands Global common stock compared to the total stockholder returns of a peer group of companies. Although LTIP awards are only paidcompanies and (ii) the percentage increase in cash, since the multiplier is based on the price of the Company's common stock, theadjusted earnings per share (as defined). The awards are considered stock-based compensation in accordance with U.S. GAAP and are classified as liabilities.liabilities measured at fair value as of the respective period end. For the three months ended SeptemberJune 30, 2017, no expense was recognized. For the three months ended September 30, 2016, a credit of $0.52019 and 2018, $0.8 million wasand $0.2 million, respectively, were included in total stock-based compensation expense related to LTIP awards. For the ninesix months ended SeptemberJune 30, 20172019 and 2016, a credit of $1.02018, $1.2 million and an expense of $0.6 million, respectively, were included in total stock-based compensation expense related to LTIP awards. At SeptemberJune 30, 20172019 and December 31, 2016,2018, liabilities of less than $0.1$2.5 million and liabilities of $1.2$2.4 million, respectively, related to LTIP awards were included as part of accrued employee compensation and benefits in the Consolidated Balance Sheets.
DineEquity,Dine Brands Global, Inc. and Subsidiaries
Notes to Consolidated Financial Statements (Continued)
8.10. Segments
The Company identifies its reporting segments based on the organizational units used by management to monitor performance and make operating decisions. The Company currently has threefive operating segments: Applebee's franchise operations, Applebee's company-operated restaurant operations, IHOP franchise operations, rental operations and financing operations. The Company has four reportable segments: franchise operations, (an aggregation of Applebee’sApplebee's and IHOP franchise operations), company-operated restaurant operations, rental operations and financing operations. Prior to June 2017, theThe Company operated 10 IHOP restaurants and those operations were consideredconsiders these to be a fourth operating segment. The Company views all operating segments asits reportable segments, regardless of whether an operatingany segment exceeds 10% of consolidated revenues, segment profitincome before income tax provision or total assets.
As of SeptemberJune 30, 2017,2019, the franchise operations segment consisted of (i) 1,9451,746 restaurants operated by Applebee’s franchisees in the United States, two U.S. territories and 1413 countries outside the United States and (ii) 1,7611,828 restaurants operated by IHOP franchisees and area licensees in the United States, three U.S. territories and 1312 countries outside the United States. Franchise operations revenue consists primarily of franchise royalty revenues, franchise advertising revenue, sales of proprietary products to franchisees (primarily pancake and waffle dry mixes for the IHOP restaurants), franchise advertising fees from domestic IHOP restaurants and international restaurants of both brands and franchise fees. Franchise operations expenses include advertising expenses, from domestic IHOP restaurants and international restaurants of both brands, the cost of IHOP proprietary products, bad debt expense, franchisor contributions to marketing funds, pre-opening training expenses and other franchise-related costs.
Company restaurant sales are retail sales at company-operated restaurants. Company restaurant expenses are operating expenses at company-operated restaurants and include food, labor, utilities, rent and other restaurant operating costs.
Rental operations revenue includes revenue from operating leases and interest income from direct financing leases. Rental operations expenses are costs of operating leases and interest expense from capital leases on franchisee-operated restaurants.
Company restaurant sales are retail sales at company-operated restaurants. Company restaurant expenses are operating expenses at company-operated restaurants and include food, labor, utilities, rent and other restaurant operating costs. In June 2017, the Company refranchised nine of ten company-operated restaurants in the Cincinnati, Ohio market area; the one restaurant not refranchised was permanently closed. As a result, the Company no longer operates any IHOP restaurants on a permanent basis. The Company has not presented these restaurants as discontinued operations as defined by U.S. GAAP because the refranchising of nine restaurants out of a total of over 3,700 restaurants did not represent a strategic shift that had a major effect on the Company's operations.
From time to time, the Company may operate IHOP restaurants reacquired from franchisees on a temporary basis until those restaurants are refranchised. There were no IHOP restaurants under temporary operation at September 30, 2017.
Financing operations revenuerevenues primarily consistsconsist of interest income from the financing of franchise fees andIHOP equipment leases and franchise fees, sales of equipment associated with refranchised IHOP restaurants.restaurants and interest income on Applebee's notes receivable from franchisees. Financing expenses are primarily the cost of restaurant equipment associated with refranchised IHOP restaurants.
Information on segments is as follows:
DineEquity,Dine Brand Global, Inc. and Subsidiaries
Notes to Consolidated Financial Statements (Continued)
8.10. Segments (Continued)
Information on segments |
| | | | | | | | | | | | | | | | |
| | | Three months ended June 30, | | Six months ended June 30, |
| | | 2019 | | 2018 | | 2019 | | 2018 |
| | | (In millions) |
| Revenues from external customers: | | |
| | |
| | | | |
| Franchise operations | | $ | 162.7 |
| | $ | 151.9 |
| | $ | 331.6 |
| | $ | 307.2 |
|
| Rental operations | | 29.9 |
| | 30.4 |
| | 60.6 |
| | 61.2 |
|
| Company restaurants | | 33.7 |
| | — |
| | 69.5 |
| | — |
|
| Financing operations | | 1.8 |
| | 2.2 |
| | 3.6 |
| | 4.2 |
|
| Total | | $ | 228.1 |
| | $ | 184.5 |
| | $ | 465.3 |
| | $ | 372.6 |
|
| | | | | | | | | |
| Interest expense: | | |
| | |
| | | | |
| Rental operations | | $ | 1.9 |
| | $ | 2.3 |
| | $ | 4.3 |
| | $ | 4.8 |
|
| Company restaurants | | 0.5 |
| | — |
| | 1.1 |
| | — |
|
| Corporate | | 14.6 |
| | 15.5 |
| | 30.0 |
| | 30.7 |
|
| Total | | $ | 17.0 |
| | $ | 17.8 |
| | $ | 35.4 |
| | $ | 35.5 |
|
| | | | | | | | | |
| Depreciation and amortization: | | |
| | |
| | | | |
| Franchise operations | | $ | 2.6 |
| | $ | 2.7 |
| | $ | 5.1 |
| | $ | 5.3 |
|
| Rental operations | | 3.4 |
| | 2.9 |
| | 6.9 |
| | $ | 5.8 |
|
| Company restaurants | | 1.8 |
| | — |
| | 3.1 |
| | — |
|
| Corporate | | 2.8 |
| | 2.3 |
| | 5.7 |
| | 4.7 |
|
| Total | | $ | 10.6 |
| | $ | 7.9 |
| | $ | 20.8 |
| | $ | 15.8 |
|
| | | | | | | | | |
| Gross profit, by segment: | | |
| | |
| | | | |
| Franchise operations | | $ | 83.8 |
| | $ | 69.0 |
| | $ | 172.4 |
| | $ | 142.4 |
|
| Rental operations | | 7.0 |
| | 7.6 |
| | 15.0 |
| | 15.8 |
|
| Company restaurants | | 2.5 |
| | — |
| | 6.7 |
| | — |
|
| Financing operations | | 1.6 |
| | 2.0 |
| | 3.3 |
| | 3.9 |
|
| Total gross profit | | 94.9 |
| | 78.6 |
| | 197.4 |
| | 162.1 |
|
| Corporate and unallocated expenses, net | | (65.8 | ) | | (54.0 | ) | | (127.2 | ) | | (114.8 | ) |
| Income before income tax provision | | $ | 29.1 |
| | $ | 24.6 |
| | $ | 70.2 |
| | $ | 47.3 |
|
11. Net Income per Share
The computation of the Company's basic and diluted net income per share is as follows:
|
| | | | | | | | | | | | | | | |
| | Three months ended June 30, | | Six months ended June 30, |
| | 2019 | | 2018 | | 2019 | | 2018 |
| | (In thousands, except per share data) |
| Numerator for basic and diluted income per common share: | |
| | |
| | | | |
| Net income | $ | 21,390 |
| | $ | 12,713 |
| | $ | 53,033 |
| | $ | 29,786 |
|
| Less: Net income allocated to unvested participating restricted stock | (719 | ) | | (428 | ) | | (1,827 | ) | | (1,000 | ) |
| Net income available to common stockholders - basic | 20,671 |
| | 12,285 |
| | 51,206 |
| | 28,786 |
|
| Effect of unvested participating restricted stock in two-class calculation | 7 |
| | — |
| | 20 |
| | 3 |
|
| Net income available to common stockholders - diluted | $ | 20,678 |
| | $ | 12,285 |
| | $ | 51,226 |
| | $ | 28,789 |
|
| Denominator: | |
| | |
| | | | |
| Weighted average outstanding shares of common stock - basic | 17,181 |
| | 17,544 |
| | 17,262 |
| | 17,623 |
|
| Dilutive effect of stock options | 382 |
| | 259 |
| | 364 |
| | 204 |
|
| Weighted average outstanding shares of common stock - diluted | 17,563 |
| | 17,803 |
| | 17,626 |
| | 17,827 |
|
| Net income per common share: | |
| | |
| | | | |
| Basic | $ | 1.20 |
| | $ | 0.70 |
| | $ | 2.97 |
| | $ | 1.63 |
|
| Diluted | $ | 1.18 |
| | $ | 0.69 |
| | $ | 2.91 |
| | $ | 1.61 |
|
|
| | | | | | | | | | | | | | | | |
| | | Three months ended September 30, | | Nine months ended September 30, |
| | | 2017 | | 2016 | | 2017 | | 2016 |
| | | (In millions) |
| Revenues from external customers: | | |
| | |
| | | | |
| Franchise operations | | $ | 112.3 |
| | $ | 119.2 |
| | $ | 351.4 |
| | $ | 366.7 |
|
| Rental operations | | 30.3 |
| | 30.5 |
| | 90.9 |
| | 92.7 |
|
| Company restaurants | | — |
| | 4.0 |
| | 7.5 |
| | 13.4 |
|
| Financing operations | | 2.1 |
| | 2.3 |
| | 6.3 |
| | 7.0 |
|
| Total | | $ | 144.7 |
| | $ | 156.0 |
| | $ | 456.0 |
| | $ | 479.8 |
|
| | | | | | | | | |
| Interest expense: | | |
| | |
| | | | |
| Rental operations | | $ | 2.6 |
| | $ | 2.9 |
| | $ | 8.0 |
| | $ | 9.0 |
|
| Company restaurants | | — |
| | 0.1 |
| | 0.2 |
| | 0.3 |
|
| Corporate | | 15.4 |
| | 15.4 |
| | 46.5 |
| | 46.1 |
|
| Total | | $ | 18.0 |
| | $ | 18.4 |
| | $ | 54.7 |
| | $ | 55.4 |
|
| | | | | | | | | |
| Depreciation and amortization: | | |
| | |
| | | | |
| Franchise operations | | $ | 2.7 |
| | $ | 2.7 |
| | $ | 8.1 |
| | $ | 7.9 |
|
| Rental operations | | 3.0 |
| | 3.1 |
| | 9.1 |
| | 9.4 |
|
| Company restaurants | | — |
| | 0.1 |
| | 0.1 |
| | 0.3 |
|
| Corporate | | 1.9 |
| | 1.5 |
| | 5.8 |
| | 5.3 |
|
| Total | | $ | 7.6 |
| | $ | 7.4 |
| | $ | 23.1 |
| | $ | 22.9 |
|
| | | | | | | | | |
| Gross profit, by segment: | | |
| | |
| | | | |
| Franchise operations | | $ | 70.5 |
| | $ | 81.9 |
| | $ | 235.7 |
| | $ | 258.7 |
|
| Rental operations | | 8.0 |
| | 7.7 |
| | 23.2 |
| | 23.7 |
|
| Company restaurants | | (0.0 | ) | | (0.2 | ) | | (0.3 | ) | | (0.7 | ) |
| Financing operations | | 1.6 |
| | 2.3 |
| | 5.9 |
| | 6.8 |
|
| Total gross profit | | 80.1 |
| | 91.7 |
| | 264.5 |
| | 288.5 |
|
| Corporate and unallocated expenses, net | | (588.4 | ) | | (54.2 | ) | | (708.8 | ) | | (170.1 | ) |
| (Loss) income before income tax provision | | $ | (508.3 | ) | | $ | 37.5 |
| | $ | (444.3 | ) | | $ | 118.3 |
|
DineEquity,Dine Brands Global, Inc. and Subsidiaries
Notes to Consolidated Financial Statements (Continued)
9. Net (Loss) Income per Share
The computation of the Company's basic and diluted net (loss) income per share is as follows:
|
| | | | | | | | | | | | | | | |
| | Three months ended September 30, | | Nine months ended September 30, |
| | 2017 | | 2016 | | 2017 | | 2016 |
| | (In thousands, except per share data) |
| Numerator for basic and diluted (loss) income per common share: | |
| | |
| | | | |
| Net (loss) income | $ | (451,718 | ) | | $ | 24,273 |
| | $ | (416,075 | ) | | $ | 76,645 |
|
| Less: Net loss (income) allocated to unvested participating restricted stock | 8,496 |
| | (338 | ) | | 6,921 |
| | (1,103 | ) |
| Net (loss) income available to common stockholders - basic | (443,222 | ) | | 23,935 |
| | (409,154 | ) | | 75,542 |
|
| Effect of unvested participating restricted stock in two-class calculation | — |
| | 1 |
| | 5 |
| | 3 |
|
| Net (loss) income available to common stockholders - diluted | $ | (443,222 | ) | | $ | 23,936 |
| | $ | (409,149 | ) | | $ | 75,545 |
|
| Denominator: | |
| | |
| | | | |
| Weighted average outstanding shares of common stock - basic | 17,742 |
| | 17,950 |
| | 17,718 |
| | 18,099 |
|
| Dilutive effect of stock options | — |
| | 91 |
| | — |
| | 102 |
|
| Weighted average outstanding shares of common stock - diluted | 17,742 |
| | 18,041 |
| | 17,718 |
| | 18,201 |
|
| Net (loss) income per common share: | |
| | |
| | | | |
| Basic | $ | (24.98 | ) | | $ | 1.33 |
| | $ | (23.09 | ) | | $ | 4.17 |
|
| Diluted | $ | (24.98 | ) | | $ | 1.33 |
| | $ | (23.09 | ) | | $ | 4.15 |
|
For the three and nine months ended September 30, 2017, diluted loss per common share was computed using the weighted average number of shares outstanding during each period as the 1,000 and 11,000 shares, respectively, from common stock equivalents would have been antidilutive.
10.12. Fair Value Measurements
The Company does not have a material amount of financial assets or liabilities that are required under U.S. GAAP to be measured on a recurring basis at fair value. The Company is not a party to any material derivative financial instruments. The Company does not have a material amount of non-financial assets or non-financial liabilities that are required under U.S. GAAP to be measured at fair value on a recurring basis. The Company has not elected to use the fair value measurement option, as permitted under U.S. GAAP, for any assets or liabilities for which fair value measurement is not presently required.
The Company believes the fair values of cash equivalents, accounts receivable and accounts payable approximate their carrying amounts due to their short duration.
The fair values of the Company's Series 2014-12019 Class A-2 Notes (the “Classat June 30, 2019 and the Company's 2014 Class A-2 Notes”)Notes at September 30, 2017 and December 31, 20162018 were as follows:
|
| | | | | | | | | |
| | | June 30, 2019 | December 31, 2018 |
| | | (In millions) |
| Face Value of Notes | | $ | 1,300.0 |
| | $ | 1,283.8 |
| |
| Fair Value of Notes | | $ | 1,322.8 |
| | $ | 1,280.9 |
| |
|
| | | | | | | | | | | | | | | | |
| | | September 30, 2017 | | December 31, 2016 |
| | | Carrying Amount | | Fair Value | | Carrying Amount | | Fair Value |
| | | (In millions) |
| Long-term debt, current and long-term | | $ | 1,285.2 |
| | $ | 1,274.0 |
| | $ | 1,282.7 |
| | $ | 1,286.2 |
|
The fair values were determined based on Level 2 inputs, including information gathered from brokers who trade in the Company’s 2019 Class A-2 Notes and traded in Company's 2014 Class A-2 Notes, as well as information on notes that are similar to those of the Company.
DineEquity, Inc. and Subsidiaries
Notes to Consolidated Financial Statements (Continued)
11.13. Commitments and Contingencies
Litigation, Claims and Disputes
The Company is subject to various lawsuits, administrative proceedings, audits and claims arising in the ordinary course of business. Some of these lawsuits purport to be class actions and/or seek substantial damages. The Company is required under U.S. GAAP to record an accrual for litigation loss contingencies that are both probable and reasonably estimable. Legal fees and expenses associated with the defense of all of the Company's litigation are expensed as such fees and expenses are incurred. Management regularly assesses the Company's insurance coverage, analyzes litigation information with the Company's attorneys and evaluates the Company's loss experience in connection with pending legal proceedings. While the Company does not presently believe that any of the legal proceedings to which it is currently a party will ultimately have a material adverse impact on the Company, there can be no assurance that the Company will prevail in all the proceedings the Company is party to, or that the Company will not incur material losses from them.
Lease Guarantees
In connection with the sale of Applebee’s restaurants or previous brands to franchisees, and other parties, the Company has, in certain cases, guaranteed or has potential continuing liability for lease payments totaling $325.2$271.5 million as of SeptemberJune 30, 20172019. This amount represents the maximum potential liability for future payments under these leases. These leases have been assigned to the buyers and expire at the end of the respective lease terms, which range from 20172019 through 2048. Excluding unexercised option periods, the Company's potential liability for future payments under these leases is $54.5$42.1 million. In the event of default, the indemnity and default clauses in the sale or assignment agreements govern the Company's ability to pursue and recover damages incurred.No material lease payment guarantee liabilities have been recorded as of September 30, 2017.
12. Allowance for Credit Losses
The Company's allowance for credit losses at September 30, 2017 and December 31, 2016 was $13.1 million and $3.1 million, respectively.
13.14. Restricted Cash
Current restricted cash of $31.3$34.4 million at SeptemberJune 30, 20172019 primarily consisted of $23.9$32.4 million of funds required to be held in trust in connection with the Company's securitized debt and $7.0$1.9 million of funds from Applebee's franchisees pursuant to franchise agreements, usage of which was restricted to advertising activities. Current restricted cash of $30.3$48.5 million at December 31, 20162018 primarily consisted of $25.7$42.3 million of funds required to be held in trust in connection with the Company's securitized debt and $4.3$6.2 million of funds from Applebee's franchisees pursuant to franchise agreements, usage of which was restricted to advertising activities.
Non-current restricted cash of $15.7 million at June 30, 2019 and $14.7 million at September 30, 2017 and December 31, 20162018 represents interest reserves required to be set aside for the duration of the Company's securitized debt.
14. Refranchising of Company-operated Restaurants
In June 2017, the Company completed the refranchising and sale of related restaurant assets of nine company-operated IHOP restaurants in the Cincinnati, Ohio market area. As part of the transaction, the Company entered into an asset purchase agreement, nine franchise agreements and nine sublease agreements for land and buildings. The Company compared the stated rent under the sublease agreements with comparable market rents and recorded net favorable lease assets of $2.3 million in connection with the transaction. The Company also received cash of $1.1 million and a note receivable for $4.8 million. After allocating a portion of the consideration to franchise fees and derecognition of the assets sold, the Company recognized a gain of $6.2 million on the refranchising and sale during the nine months ended September 30, 2017.
Item 2. Management’s Discussion and Analysis of Financial Condition and Results of Operations.
Cautionary Statement Regarding Forward-Looking Statements
Statements contained in this report may constitute forward-looking statements within the meaning of the Private Securities Litigation Reform Act of 1995. These statements involve known and unknown risks, uncertainties and other factors, which may cause actual results to be materially different from those expressed or implied in such statements. You can identify these forward-looking statements by words such as “may,” “will,” “should,” “could,” “expect,” “anticipate,” “believe,” “estimate,” “intend,” “plan” and other similar expressions. You should consider our forward-looking statements in light of the risks discussed under the heading “Risk Factors” in our most recent Annual Report on Form 10-K, as well as our consolidated financial statements, related notes, and the other financial information appearing elsewhere in this report and our other filings with the United States Securities and Exchange Commission. The forward-looking statements contained in this report are made as of the date hereof and the Company assumes no obligation to update or supplement any forward-looking statements.
You should read the following Management's Discussion and Analysis of Financial Condition and Results of Operations (“MD&A”) in conjunction with the consolidated financial statements and the related notes that appear elsewhere in this report. Statements contained in this report may constitute forward-looking statements within the meaning of the Private Securities Litigation Reform Act of 1995. Please refer to the section of this report under the heading “Cautionary Statement Regarding Forward-Looking Statements” for more information.
Overview
The following discussion and analysis provides information which we believe is relevant to an assessment and understanding of our consolidated results of operations and financial condition. The discussion should be read in conjunction with the consolidated financial statements and the notes thereto included in Item 1 of Part I of this Quarterly Report and the audited consolidated financial statements and notes thereto and the MD&A contained in the Company’s Annual Report on Form 10-K for the fiscal year ended December 31, 2016.2018. Except where the context indicates otherwise, the words “we,” “us,” “our,” “DineEquity”“Dine Brands Global” and the “Company” refer to DineEquity,Dine Brands Global, Inc., together with its subsidiaries that are consolidated in accordance with United States generally accepted accounting principles (“U.S. GAAP”).
Through various subsidiaries, we own, franchise and franchiseoperate the Applebee's Neighborhood Grill & Bar® (“Applebee's”) concept in the bar and grill segment within the casual dining category of the restaurant industry and we own and franchise the International House of Pancakes® (“IHOP”) concept in the family dining category of the restaurant industry. References herein to Applebee's® and IHOP® restaurants are to these two restaurant concepts, whether operated by franchisees, or area licensees and their sub-licensees (collectively, “area licensees”). or by us. With over 3,7003,600 restaurants combined, allthe substantial majority of which are franchised, we believe we are one of the largest full-service restaurant companies in the world. The June 19, 201717, 2019 issue of Nation's Restaurant News reported that IHOP was the largest family dining concept and Applebee's werewas the largest restaurant systems in the family dining andsecond-largest casual dining categories, respectively,concept in terms of 2018 United States system-wide sales during 2016. This markssales.
We identify our business segments based on the tenth consecutive year our two brandsorganizational units used by management to monitor performance and make operating decisions. We currently have achieved the number one ranking in Nation's Restaurant News.
The Company currently has threefive operating segments: Applebee's franchise operations, Applebee's company-operated restaurant operations, IHOP franchise operations, rental operations and financing operations. We have four reportable segments: franchise operations, (an aggregation of Applebee’sApplebee's and IHOP franchise operations), company-operated restaurant operations, rental operations and financing operations. Prior to June 2017, the Company operated 10 IHOP restaurants and those operations were consideredWe consider these to be a fourth operating segment. The Company views all operating segments asour reportable segments, regardless of whether an operatingany segment exceeds 10% of consolidated revenues, segment profitincome before income tax provision or total assets.
The financial tables appearing in Management's Discussion and Analysis present amounts in millions of dollars that are rounded from our consolidated financial statements presented in thousands of dollars. As a result, the tables may not foot or crossfoot due to rounding.
Key Financial Results
|
| | | | | | | | | | | | | | | | | | | | | | | | |
| | | Three months ended September 30, | | Favorable
(Unfavorable) Variance | | Nine months ended September 30, | | Favorable
(Unfavorable) Variance |
| | | 2017 | | 2016 | | 2017 | | 2016 | |
| | | (In millions, except per share data) |
| (Loss) income before income taxes | | $ | (508.3 | ) | | $ | 37.5 |
| | $ | (545.8 | ) | | $ | (444.3 | ) | | $ | 118.3 |
| | $ | (562.7 | ) |
| Income tax benefit (provision) | | 56.6 |
| | (13.2 | ) | | 69.8 |
| | 28.2 |
| | (41.7 | ) | | 69.9 |
|
| Net (loss) income | | $ | (451.7 | ) | | $ | 24.3 |
| | $ | (476.0 | ) | | $ | (416.1 | ) | | $ | 76.6 |
| | $ | (492.7 | ) |
| | | | | | | | | | | | | |
| Effective tax rate | | 11.1 | % | | 35.3 | % | | (24.2 | )% | | 6.4 | % | | 35.2 | % | | (28.8 | )% |
| | | | | | | | | | | | | |
| | | | | | | % increase (decrease) | | | | | | % increase (decrease) |
| Net (loss) income per diluted share | | $ | (24.98 | ) | | $ | 1.33 |
| | n.m | | $ | (23.09 | ) | | $ | 4.15 |
| | n.m. |
| Weighted average shares | | 17.7 |
| | 18.0 |
| | (1.7 | )% | | 17.7 |
| | 18.2 |
| | (2.7 | )% |
|
| | | | | | | | | | | | | | | | | | | | | | | | |
| | | Three months ended June 30, | | Favorable
(Unfavorable) Variance | | Six months ended June 30, | | Favorable
(Unfavorable) Variance |
| | | 2019 | | 2018 | | 2019 | | 2018 | |
| | | | | | | | | | | | | |
| | | (In millions, except per share data) |
| Income before income taxes | | $ | 29.1 |
| | $ | 24.6 |
| | $ | 4.5 |
| | $ | 70.2 |
| | $ | 47.3 |
| | $ | 22.9 |
|
| Income tax provision | | (7.7 | ) | | (11.9 | ) | | 4.2 |
| | (17.2 | ) | | (17.5 | ) | | 0.3 |
|
| Net income | | $ | 21.4 |
| | $ | 12.7 |
| | $ | 8.7 |
| | $ | 53.0 |
| | $ | 29.8 |
| | $ | 23.2 |
|
| | | | | | | | | | | | | |
| Effective tax rate | | 26.4 | % | | 48.3 | % | | 21.9 | % | | 24.5 | % | | 37.0 | % | | 12.5 | % |
| | | | | | | | | | | | | |
| Net income per diluted share | | $ | 1.18 |
| | $ | 0.69 |
| | $ | 0.49 |
| | $ | 2.91 |
| | $ | 1.61 |
| | $ | 1.30 |
|
n.m. - percentage change is not meaningful
The following sets forthtable highlights the significantprimary reasons for the decreasesincrease in our income before income taxes between each ofin the three and ninesix months ended SeptemberJune 30, 20172019 compared to the same periods of 2018:
|
| | | | | | | |
| | Favorable
(Unfavorable) Variance |
| | Three months ended June 30, 2019 | | Six months ended June 30, 2019 |
| | (In millions) | | (In millions) |
| Increase (decrease) in gross profit: | | | |
| Applebee's franchise operations | 14.1 |
| | $ | 27.5 |
|
| IHOP franchise operations | 0.7 |
| | 2.5 |
|
| Company restaurant operations | 2.5 |
| | 6.7 |
|
| All other operations | (1.0 | ) | | (1.4 | ) |
| Total gross profit increase | 16.3 |
| | 35.3 |
|
| Increase in General and Administrative (“G&A”) expenses | (0.6 | ) | | (1.5 | ) |
| Loss on extinguishment of debt | (8.3 | ) | | (8.3 | ) |
| Other income and expense items | (2.9 | ) | | (2.7 | ) |
| Increase in income before income taxes | $ | 4.5 |
| | $ | 22.9 |
|
The changes in Applebee's franchise gross profit for the three and six months ended June 30, 2019 compared to the respectivesame period of the prior year were primarily due to franchisor contributions to the Applebee’s National Advertising Fund (the “Applebee's NAF”) of $16.5 million and $30.0 million we made during the three and six months ended June 30, 2018, respectively, that did not recur in 2019. See “Consolidated Results of Operations - Comparison of the Three and Six Months ended June 30, 2019 and 2018” for additional discussion of the changes presented above.
Our effective income tax rate for the three and six months ended June 30, 2019 was substantially lower than the comparable periods of 2016:
|
| | | | | | | | | | | |
| | Three months ended September 30, 2017 | | Nine months ended September 30, 2017 |
| | | (In millions) | |
| Impairment of Applebee's goodwill and tradename | | $ | (531.6 | ) | | | | $ | (531.6 | ) | |
| Decrease in gross profit: | | | | | | | |
| Applebee's franchise operations | | (10.8 | ) | | | | (23.4 | ) | |
| All other operations | | (0.8 | ) | | | | (0.6 | ) | |
| Total gross profit decrease | | (11.6 | ) | | | | (24.0 | ) | |
| Increase in General and Administrative (“G&A”) expenses: | | | | | | | |
| Executive separation costs | | — |
| | | | (8.8 | ) | |
| All other G&A | | (2.0 | ) | | | | (5.0 | ) | |
| Total G&A increase | | (2.0 | ) | | | | (13.8 | ) | |
| Gain on disposition of assets | | 0.1 |
| | | | 7.1 |
| |
| Other | | (0.7 | ) | | | | (0.4 | ) | |
| Decrease in income before income taxes | | $ | (545.8 | ) | | | | $ | (562.7 | ) | |
2018. During the three and six months ended June 30, 2018, we increased our tax provision by $5.7 million related to adjustments resulting from Internal Revenue Service (“IRS”) audits for tax years 2011 through 2013, which increased our effective tax rates for those periods. Completion of the IRS audits for tax years 2011 through 2013 allowed us to accelerate the collection of certain tax benefits recognized in prior years. We performed an interim quantitative testreceived a cash refund of impairmentapproximately $13.3 million, inclusive of Applebee's goodwill and tradenameinterest income of $0.9 million, during the three months ended SeptemberJune 30, 2017. As a result of performing this test, we recognized an impairment of Applebee's goodwill of $358.2 million and an impairment of Applebee's tradename of $173.4 million. See below under the heading “Significant Known Events, Trends or Uncertainties Impacting or Expecting to Impact Comparisons of Reported or Future Results - Impairment of Applebee's Goodwill and Tradename” for additional discussion of these impairments.2019.
Our effective tax rate (“ETR”) was significantly different than the federal statutory rate of 35% for the three and nine months ended September 30, 2017, as compared to the respective periods of the prior year. The primary reason for the difference is the impairment of Applebee's goodwill noted above is not a deductible expense for federal income tax purposes so we received no tax benefit from this expense. We did recognize a deferred tax benefit of approximately $65 million related to the impairment of Applebee's tradename.
Key Performance Indicators
In evaluating the performance of each restaurant concept, we consider the key performance indicators to be the system-wide sales percentage change, the percentage change in domestic system-wide same-restaurant sales (“compdomestic same-restaurant sales”) and, net franchise restaurant development.development and the change in effective restaurants. Changes in both compdomestic same-restaurant sales and in the number of Applebee's and IHOP franchise restaurants will impact our system-wide retail sales that drive franchise royalty revenues. Restaurant development also impacts franchise revenues in the form of initial franchise fees and, in the case of IHOP restaurants, sales of proprietary pancake and waffle dry mix.
An overview of theseOur key performance indicators for the three and ninesix months ended SeptemberJune 30, 2017 is2019 were as follows:
|
| | | | | | | | | | | |
| | Three months ended September 30, 2017 | | Nine months ended September 30, 2017 |
| | Applebee's | | IHOP | | Applebee's | | IHOP |
| Sales percentage decrease | (9.7 | )% | | (0.7 | )% | | (8.6 | )% | | (0.1 | )% |
| % decrease in domestic system-wide same-restaurant sales | (7.7 | )% | | (3.2 | )% | | (7.3 | )% | | (2.5 | )% |
Net franchise restaurant (reduction) development (1) | (23 | ) | | 9 |
| | (71 | ) | | 29 |
|
|
| | | | | | | | | | | |
| | Three months ended June 30, 2019 | | Six months ended June 30, 2019 |
| | Applebee's | | IHOP | | Applebee's | | IHOP |
| Sales percentage (decrease) increase | (3.0 | )% | | 3.2 | % | | (2.2 | )% | | 2.8 | % |
| % (decrease) increase in domestic system-wide same-restaurant sales | (0.5 | )% | | 2.0 | % | | 0.6 | % | | 1.7 | % |
Net franchise restaurant (reduction) development (1) | (15 | ) | | 6 |
| | (22 | ) | | (3 | ) |
Net (decrease) increase in total effective restaurants (2) | (78 | ) | | 21 |
| | (85 | ) | | 26 |
|
(1)Franchise and area license restaurant openings, net of closings, during the three and six months ended June 30, 2019.
(2)Change in the weighted average number of franchise, area license and company-operated restaurants open during the three and six months ended June 30, 2019, compared to those open during the same periods of 2018.
The Applebee's sales percentage decrease for the three and nine months ended SeptemberJune 30, 20172019 compared to the same period of 2018 was due to a decrease in total effective restaurants caused by closures over the combined effects of declinespast 12 months and a decrease in comp sales and restaurant closures.domestic same-restaurant sales. The smaller IHOPApplebee's sales percentage decrease for the three and ninesix months ended SeptemberJune 30, 20172019 compared to the same
period of the prior year was due to declines in comp sales that were partially offset by net restaurant development.
Detailed information on each of these key performance indicators is presented under the captions “Restaurant Data,” “Domestic Same-Restaurant Sales” and “Restaurant Development Activity” that follow.
Domestic Same-Restaurant Sales
Applebee’s domestic system-wide same-restaurant sales decreased 7.7% for the three months ended September 30, 2017 from the same period in 2016. Most of the decrease resulted from a decline in customer traffic, as well as a small decrease in average customer check. Fortotal effective restaurants caused by closures over the ninepast 12 months, ended September 30, 2017, Applebee’s domestic system-wide same-restaurant sales decreased 7.3% from the same period in 2016. This decrease also resulted primarily from a decline in customer traffic as well as a small decrease in average customer check.
Based on data from Black Box Intelligence, a restaurant sales reporting firm (“Black Box”), the casual dining segment of the restaurant industry also experienced an overall decrease in same-restaurant sales during both the three and nine months ended September 30, 2017. The casual dining decreases in both periods were due to declines in customer traffic that were partially offset by an increase in average customer check. For bothdomestic same-restaurant sales. The IHOP sales percentage increases for the three and ninesix months ended SeptemberJune 30, 2017, Applebee's declines2019 was due to an increase in traffic and same-restaurant sales were substantially larger than those experienced by the overall casual dining segment. However, the 150 basis point decline in Applebee's same-restaurant salestotal effective restaurants resulting from the second to the third quarter of 2017 was the same as that of the overall casual dining segment.
We believe the differential between Applebee's performance and that of the casual dining segment is due in large part to tactical initiatives previously implemented by Applebee's that did not generate desired results and to the inconsistent quality of operations across the Applebee's system. We engaged third-party consultants during the first half of 2017 to assess the continued decline in Applebee's traffic and same-restaurant sales and to provide actionable recommendations to stabilize the decline. We expect to incur approximately $10 million of costs related to these stabilization initiatives in 2017, of which approximately $8 million was incurred during the nine months ended September 30, 2017. We also contributed $4 million to
the Applebee's National Advertising Fund (the “Applebee's NAF”) in the third quarter of 2017 to help mitigate the decline in franchisee contributions to the Applebee's NAF that are based on a percentage ofnet restaurant sales. We expect to contribute an additional $4 million to the Applebee's NAF in the fourth quarter of 2017. We may consider additional contributions in future periods as well.
Some of the stabilization actions we are implementing relate to brand repositioning and operational improvements that will take placedevelopment over the nextpast 12 to 18 months. Shorter-term actions, such as improving the quality of the customer experience across the Applebee's system, have shown improvement as the number of restaurants receiving the lowest of our internal ratings has declined since the end of 2016.months and an increase in domestic same-restaurant sales.
As discussed under the heading “Financial Results - Franchise Operations,” Applebee's has experienced a decrease in royalty revenue because of the decline in same-restaurant sales that is primarily due to a decline in customer traffic. The decline in same-restaurant sales has adversely impacted some of our franchisees' financial health, resulting in increases in our bad debt expense and in our royalties not recognized as revenue until paid in cash (“cash-basis royalties”). A franchisee that represents approximately 5% of Applebee'sDomestic Same-Restaurant Sales
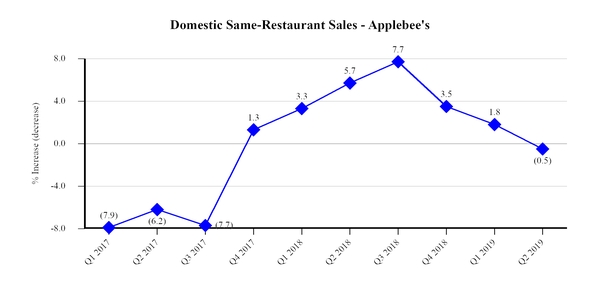
Applebee’s system-wide domestic system-wide sales is exhibiting a higher level of financial difficulty than other franchisees. We are addressing all franchisees' financial health through a collaborative effort between ourselves, a third-party advisor and franchisee representatives. We are considering various forms of assistance to franchisees, such as restaurant closures, assessing franchisee debt arrangements, temporary forbearance on payment obligations, extensions of credit and other support programs. To date, the assistance provided primarily has been the approved closures of non-viable restaurants. Any additional assistance to franchisees may entail incremental costs.
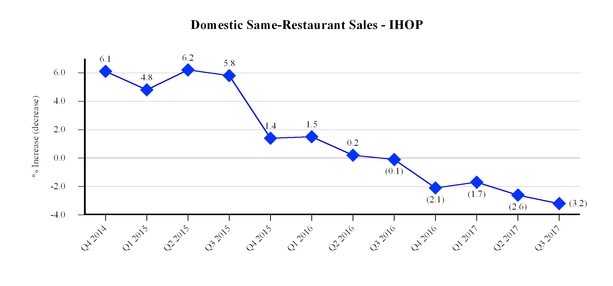
IHOP’s domestic system-wide same-restaurant sales decreased 3.2%0.5% for the three months ended SeptemberJune 30, 20172019 from the same period in 2016.2018. The decrease resulted from a decline in customer traffic that was partially offset by an increase in average customer check. The decline in IHOP's quarter-over-quarter customer traffic has grown progressively larger during the first three quarters of 2017. The decline in traffic peaked in the middle of the third quarter and lessened towards the end of the third quarter. For the nine months ended September 30, 2017, IHOP’s domestic system-wide same-restaurant sales decreased 2.5% from the same period in 2016. That decrease was also due to a decline in customer traffic that was partially offset by an increase in average customer check. The change in same-restaurant sales for the three months ended June 30, 2019 was impacted by comparisons against significant increases in same-restaurant sales and traffic for the three months ended June 30, 2018, as well as by competitive discounting within the casual dining segment. Historically, Applebee's has experienced a slight decline in sales during the Easter holiday. The results for the second quarter of 2019 were adversely impacted by a shift in the Easter holiday period, which fell in the second quarter of 2019 as compared to the first quarter of 2018. We believeestimate the shift in the Easter holiday period adversely impacted domestic same-restaurant sales for three months ended June 30, 2019 by approximately 20 basis points.
In terms of combined results for the second quarters of both 2018 and 2019, Applebee's domestic same-restaurant sales have grown 5.2%, with increases in both average customer check and customer traffic. Off-premise sales comprised 12.8% of Applebee's sales mix during the second quarter of 2019, down slightly from 13.0% in the first quarter of 2019.
Based on data from Black Box Intelligence, a restaurant sales reporting firm (“Black Box”), Applebee's decrease in same-restaurant sales was larger than that of the casual dining segment of the restaurant industry during the three months ended June 30, 2019. During that period, the casual dining segment also experienced a decrease in same-restaurant sales that was due to a decline in customer traffic that was partially offset by an increase in average customer check. While Applebee's increase in average customer check for the three months ended June 30, 2019 was larger than that of the casual dining segment, Applebee's decrease in traffic was larger than that of the casual dining segment.
Applebee’s system-wide domestic same-restaurant sales increased 0.6% for the six months ended June 30, 2019 from the same period in 2018. The increase was due to an increase in average customer check that was partially offset by a decline in customer traffic. Based on data from Black Box, Applebee's increase in same-restaurant sales was larger than that of the casual dining segment of the restaurant industry for the six months ended June 30, 2019. During that period, the casual dining segment experienced an increase in same-restaurant sales that, similar to Applebee's, was due to an increase in average customer check that was partially offset by a decline in customer traffic. Applebee's increase in average customer check was larger than that of the casual dining segment during the three and ninesix months ended SeptemberJune 30, 20172019, while Applebee's decline in customer traffic also was larger than that of the casual dining segment.
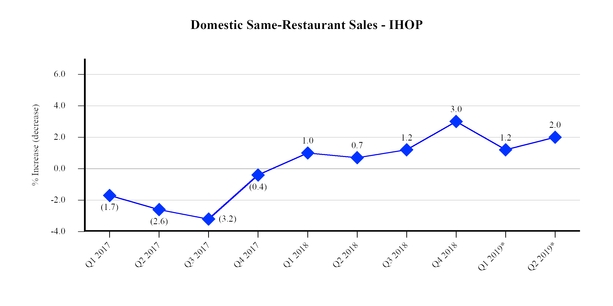
* Same-restaurant sales data includes area license restaurants beginning in 2019
IHOP’s system-wide domestic same-restaurant sales increased 2.0% (including area license restaurants) for the three months ended June 30, 2019 from the same period in 2018. This growth was due to an increase in average customer check that was partially offset by a decline in customer traffic. The increase in average customer check was due in part to softnessa favorable mix shift we believe was driven by successful promotional activity during the quarter. Historically, IHOP has experienced an increase in our dinner daypartsales during the Easter holiday. The results for the second quarter of 2019 were favorably impacted by a shift in the Easter holiday period, which fell in the second quarter of 2019 as compared to the resultfirst quarter of advertising promotions that did not drive2018. We estimate the shift in the Easter holiday period favorably impacted domestic same-restaurant sales and traffic as anticipated.for three months ended June 30, 2019 by approximately 30 basis points. Off-premise sales comprised 9.4% of IHOP's sales mix during the second quarter of 2019, down slightly from 9.5% for the first quarter of 2019.
Based on data from Black Box, the family dining segment of the restaurant industry also experienced a decreasean increase in same-restaurant sales during the three and nine months ended SeptemberJune 30, 2017,2019, compared to the same periodsperiod of the prior year, due to an increase in average customer check that was offset by a decrease in customer traffictraffic. The IHOP increase in same-restaurant sales during the three months ended June 30, 2019 was smaller than that of that the family dining segment. Both IHOP and the family dining segment experienced a similar decrease in customer traffic.
IHOP’s system-wide domestic same-restaurant sales increased 1.7% (including area license restaurants) for the six months ended June 30, 2019 from the same period in 2018. This growth was due to an increase in average customer check that was partially offset by an increase in average customer check. The IHOP declinesa decline in customer traffic and same-restaurant sales were larger than those experienced by the overall family dining segment for the three and nine months ended September 30, 2017. IHOP'straffic. The increase in average customer check was smaller thandue in part to a favorable mix shift that impacted the first and second quarters of 2019.
Based on data from Black Box, the overall family dining segment forof the threerestaurant industry also experienced an increase in same-restaurant sales during the six months ended SeptemberJune 30, 2017, whereas IHOP's2019, compared to the same period of the prior year, due to an increase in average customer check that was largeroffset by a decrease in customer traffic. The IHOP increase in same-restaurant sales during the six months ended June 30, 2019 was smaller than that of that the overallfamily dining segment. Both IHOP and the family dining segment for the nine months ended September 30, 2017.experienced a similar decrease in customer traffic.
Restaurant Data
The following table sets forth the number of “Effective Restaurants” in the Applebee’s and IHOP systems and information regarding the percentage change in sales at those restaurants compared to the same periods inperiod of the prior year. Sales at restaurants that are owned by franchisees and area licensees are not attributable to the Company and, as such, the percentage change in sales at Effective Restaurants is based on non-GAAP sales data. However, we believe that presentation of this information is useful in analyzing our revenues because franchisees and area licensees pay us royalties and advertising fees that are based on a percentage of their sales, and, where applicable, rental payments under leases that partially may be based on a percentage of their sales. Management also uses this information to make decisions about plans for future development of additional restaurants as well as evaluation of current operations.
| | | — |
| | Three months ended September 30, | | Nine months ended September 30, | |
| | | | Three months ended June 30, | | Six months ended June 30, |
| | | | 2017 | | 2016 | | 2017 | | 2016 | | 2019 | | 2018 | | 2019 | | 2018 |
| Applebee's Restaurant Data | Applebee's Restaurant Data | | (Unaudited) | | (Unaudited) |
Effective Restaurants(a) | Effective Restaurants(a) | | |
| | |
| | |
| | |
| | |
| | |
| | |
| | |
|
| Franchise | Franchise | | 1,953 |
| | 2,028 |
| | 1,981 |
| | 2,029 |
| | 1,753 |
| | 1,900 |
| | 1,758 |
| | 1,912 |
|
| Company | | | 69 |
| | — |
| | 69 |
| | — |
|
| Total | | | 1,822 |
| | 1,900 |
| | 1,827 |
| | 1,912 |
|
System-wide(b) | System-wide(b) | | |
| | |
| | |
| | |
| | |
| | |
| | |
| | |
|
Sales percentage change(c) | | (9.7 | )% | | (5.1 | )% | | (8.6 | )% | | (4.5 | )% | |
Domestic sales percentage change(c) | | | (3.0 | )% | | 3.2 | % | | (2.2 | )% | | 2.0 | % |
Domestic same-restaurant sales percentage change(d) | Domestic same-restaurant sales percentage change(d) | | (7.7 | )% | | (5.2 | )% | | (7.3 | )% | | (4.4 | )% | | (0.5 | )% | | 5.7 | % | | 0.6 | % | | 4.5 | % |
Franchise(b) | Franchise(b) | | |
| | |
| | |
| | |
| | |
| | |
| | |
| | |
|
Sales percentage change(c) | | (9.7 | )% | | (4.9 | )% | | (8.6 | )% | | (3.7 | )% | |
Domestic sales percentage change(c) | | | (6.1 | )% | | 3.2 | % | | (5.4 | )% | | 2.0 | % |
Domestic same-restaurant sales percentage change(d) | Domestic same-restaurant sales percentage change(d) | | (7.7 | )% | | (5.2 | )% | | (7.3 | )% | | (4.4 | )% | | (0.6 | )% | | 5.7 | % | | 0.5 | % | | 4.5 | % |
| Average weekly domestic unit sales (in thousands) | Average weekly domestic unit sales (in thousands) | | $ | 40.9 |
| | $ | 43.5 |
| | $ | 43.5 |
| | $ | 46.2 |
| | $ | 48.4 |
| | $ | 47.6 |
| | $ | 49.0 |
| | $ | 47.6 |
|
| | | | | | | | | | | | | | | | | | |
| IHOP Restaurant Data | IHOP Restaurant Data | | |
| | |
| | |
| | |
| | |
| | |
| | |
| | |
|
| | | | | | | | | | |
Effective Restaurants(a) | Effective Restaurants(a) | | |
| | |
| | |
| | |
| | |
| | |
| | |
| | |
|
| Franchise | Franchise | | 1,586 |
| | 1,521 |
| | 1,568 |
| | 1,512 |
| | 1,656 |
| | 1,627 |
| | 1,656 |
| | 1,623 |
|
| Area license | Area license | | 162 |
| | 167 |
| | 165 |
| | 165 |
| | 155 |
| | 163 |
| | 156 |
| | 163 |
|
| Company | | — |
| | 10 |
| | 6 |
| | 11 |
| |
| Total | Total | | 1,748 |
| | 1,698 |
| | 1,739 |
| | 1,688 |
| | 1,811 |
| | 1,790 |
| | 1,812 |
| | 1,786 |
|
| | | | | | | | | | |
System-wide(b) | System-wide(b) | | |
| | |
| | |
| | |
| | |
| | |
| | |
| | |
|
Sales percentage change(c) | Sales percentage change(c) | | (0.7 | )% | | 1.3 | % | | (0.1 | )% | | 2.0 | % | | 3.2 | % | | 3.1 | % | | 2.8 | % | | 3.5 | % |
Domestic same-restaurant sales percentage change(d) | | (3.2 | )% | | (0.1 | )% | | (2.5 | )% | | 0.5 | % | |
Domestic same-restaurant sales percentage change, including area license restaurants(d) | | | 2.0 | % | | 0.7 | % | | 1.7 | % | | 0.8 | % |
Domestic same-restaurant sales percentage change, excluding area license restaurants(d) | | | 1.9 | % | | 0.7 | % | | 1.5 | % | | 0.9 | % |
Franchise(b) | Franchise(b) | | |
| | |
| | |
| | |
| | |
| | |
| | |
| | |
|
Sales percentage change(c) | Sales percentage change(c) | | 0.3 | % | | 1.4 | % | | 0.5 | % | | 2.2 | % | | 3.3 | % | | 3.7 | % | | 2.8 | % | | 4.3 | % |
Domestic same-restaurant sales percentage change(d) | Domestic same-restaurant sales percentage change(d) | | (3.2 | )% | | (0.1 | )% | | (2.5 | )% | | 0.5 | % | | 1.9 | % | | 0.7 | % | | 1.5 | % | | 0.9 | % |
| Average weekly domestic unit sales (in thousands) | | $ | 35.7 |
| | $ | 37.1 |
| | $ | 36.3 |
| | $ | 37.5 |
| |
| Average weekly unit sales (in thousands) | | | $ | 36.8 |
| | $ | 36.2 |
| | $ | 36.9 |
| | $ | 36.7 |
|
Area License(b) | Area License(b) | | |
| | |
| | |
| | |
| | |
| | |
| | |
| | |
|
Sales percentage change(c) | Sales percentage change(c) | | (5.7 | )% | | 2.4 | % | | (3.6 | )% | | 1.1 | % | | 2.0 | % | | 1.8 | % | | 2.3 | % | | 0.8 | % |
(a) “Effective Restaurants” are the weighted average number of restaurants open in each fiscal period, adjusted to account for restaurants open for only a portion of the period. Information is presented for all Effective Restaurants in the Applebee’s and IHOP systems, which consist of restaurants owned by franchisees and area licensees as well as those owned by the Company.
(b) “System-wide sales” are retail sales at Applebee’s restaurants operated by franchisees and IHOP restaurants operated by franchisees and area licensees, as reported to the Company, in addition to retail sales at company-operated Applebee's restaurants. Sales at restaurants that are owned by franchisees and area licensees are not attributable to the Company. An increase in franchisees' reported sales will result in a corresponding increase in our royalty revenue, while a decrease in franchisees' reported sales will result in a corresponding decrease in our royalty revenue. Unaudited reported sales for Applebee's domestic franchise restaurants, Applebee's company-operated restaurants, IHOP franchise restaurants and IHOP area license restaurants were as follows: | | | | Three months ended September 30, | | Nine months ended September 30, | Three months ended June 30, | | Six months ended June 30, |
| | 2017 | | 2016 | | 2017 | | 2016 | 2019 | | 2018 | | 2019 | | 2018 |
| Reported sales (In millions) | (Unaudited) | |
| Reported sales (in millions) | | (Unaudited) |
| | |
| | |
| | | | | |
| | |
| | | | |
| Applebee's domestic franchise restaurant sales | $ | 956.5 |
| | $ | 1,058.9 |
| | $ | 3,092.3 |
| | $ | 3,382.1 |
| $ | 1,016.5 |
| | $ | 1,082.9 |
| | $ | 2,060.7 |
| | $ | 2,178.5 |
|
| Applebee's company-operated restaurants | | 33.7 |
| | — |
| | 69.5 |
| | — |
|
| IHOP franchise restaurant sales | 736.9 |
| | 734.3 |
| | 2,220.3 |
| | 2,208.6 |
| 791.6 |
| | 766.6 |
| | 1,590.4 |
| | 1,547.2 |
|
| IHOP area license restaurant sales | 67.0 |
| | 71.0 |
| | 208.7 |
| | 216.5 |
| 71.8 |
| | 70.4 |
| | 146.1 |
| | 142.8 |
|
| Total | $ | 1,760.4 |
| | $ | 1,864.2 |
| | $ | 5,521.3 |
| | $ | 5,807.2 |
| $ | 1,913.6 |
| | $ | 1,919.9 |
| | $ | 3,866.7 |
| | $ | 3,868.5 |
|
(c) “Sales percentage change” reflects, for each category of restaurants, the percentage change in sales in any given fiscal period compared to the prior fiscal period for all restaurants in that category.
(d) “Domestic same-restaurant sales percentage change” reflects the percentage change in sales in any given fiscal period, compared to the same weeks in the prior fiscal period, for domestic restaurants that have been operated throughout both fiscal periods that are being compared and have been open for at least 18 months. Because of new restaurant openings and restaurant closures, the domestic restaurants open throughout both fiscal periods being compared may be different from period to period. Domestic same-restaurant sales percentage change does not include data on IHOP area license restaurants.
| | Restaurant Development Activity | Three months ended September 30, | | Nine months ended September 30, | Three months ended June 30, | | Six months ended June 30, |
| | 2017 | | 2016 | | 2017 | | 2016 | 2019 | | 2018 | | 2019 | | 2018 |
| Applebee's | (Unaudited) | (Unaudited) |
| Summary - beginning of period: | | | | | | | | |
| Franchise | | 1,761 |
| | 1,912 |
| | 1,768 |
| | 1,936 |
|
| Company restaurants | | 69 |
| | — |
| | 69 |
| | — |
|
| Beginning of period | 1,968 |
| | 2,027 |
| | 2,016 |
| | 2,033 |
| 1,830 |
| | 1,912 |
| | 1,837 |
| | 1,936 |
|
| | | | | | | | | | | | | | | |
| Franchise restaurants opened: | |
| | |
| | | | | |
| | |
| | | | |
| Domestic | 2 |
| | 6 |
| | 7 |
| | 13 |
| — |
| | 1 |
| | — |
| | 1 |
|
| International | 2 |
| | 3 |
| | 6 |
| | 7 |
| 1 |
| | 1 |
| | 1 |
| | 3 |
|
| Total franchise restaurants opened | 4 |
| | 9 |
| | 13 |
| | 20 |
| 1 |
| | 2 |
| | 1 |
| | 4 |
|
| Franchise restaurants closed: | |
| | |
| | | | | |
| | |
| | | | |
| Domestic | (22 | ) | | (8 | ) | | (74 | ) | | (20 | ) | (13 | ) | | (30 | ) | | (17 | ) | | (52 | ) |
| International | (5 | ) | | (1 | ) | | (10 | ) | | (6 | ) | (3 | ) | | (1 | ) | | (6 | ) | | (5 | ) |
| Total franchise restaurants closed | (27 | ) | | (9 | ) | | (84 | ) | | (26 | ) | (16 | ) | | (31 | ) | | (23 | ) | | (57 | ) |
| Net franchise restaurant reduction | (23 | ) | | — |
| | (71 | ) | | (6 | ) | (15 | ) | | (29 | ) | | (22 | ) | | (53 | ) |
| | | | | | | | | | | | | | | |
| Summary - end of period: | | | | | | | | |
| Franchise | | 1,746 |
| | 1,883 |
| | 1,746 |
| | 1,883 |
|
| Company restaurants | | 69 |
| | — |
| | 69 |
| | — |
|
| Total Applebee's restaurants, end of period | 1,945 |
| | 2,027 |
| | 1,945 |
| | 2,027 |
| 1,815 |
| | 1,883 |
| | 1,815 |
| | 1,883 |
|
| Domestic | 1,791 |
| | 1,871 |
| | 1,791 |
| | 1,871 |
| 1,676 |
| | 1,731 |
| | 1,676 |
| | 1,731 |
|
| International | 154 |
| | 156 |
| | 154 |
| | 156 |
| 139 |
| | 152 |
| | 139 |
| | 152 |
|
| | | IHOP | |
| | |
| | | | | |
| | |
| | | | |
| Summary - beginning of period: | | | | | | | | | | | | | | |
| Franchise | 1,586 |
| | 1,519 |
| | 1,556 |
| | 1,507 |
| 1,663 |
| | 1,627 |
| | 1,669 |
| | 1,622 |
|
| Area license | 166 |
| | 166 |
| | 167 |
| | 165 |
| 159 |
| | 164 |
| | 162 |
| | 164 |
|
| Company | — |
| | 10 |
| | 10 |
| | 11 |
| — |
| | — |
| | — |
| | — |
|
| Total IHOP restaurants, beginning of period | 1,752 |
| | 1,695 |
| | 1,733 |
| | 1,683 |
| 1,822 |
| | 1,791 |
| | 1,831 |
| | 1,786 |
|
| | | | | | | | | | | | | | | |
| Franchise/area license restaurants opened: | | | | | | | | | | | | | | |
| Domestic franchise | 11 |
| | 7 |
| | 31 |
| | 26 |
| 9 |
| | 9 |
| | 15 |
| | 22 |
|
| Domestic area license | 1 |
| | 1 |
| | 1 |
| | 3 |
| 2 |
| | 2 |
| | 2 |
| | 2 |
|
| International franchise | 6 |
| | 8 |
| | 18 |
| | 11 |
| 2 |
| | 5 |
| | 2 |
| | 8 |
|
| Total franchise/area license restaurants opened | 18 |
| | 17 |
| | 50 |
| | 24 |
| 13 |
|
| 16 |
| | 19 |
| | 32 |
|
| Franchise/area license restaurants closed: | |
| | |
| | | | | |
| | |
| | | | |
| Domestic franchise | (2 | ) | | (2 | ) | | (11 | ) | | (10 | ) | (1 | ) | | (1 | ) | | (12 | ) | | (6 | ) |
| Domestic area license | (1 | ) | | — |
| | (2 | ) | | (1 | ) | (2 | ) | | (1 | ) | | (5 | ) | | (1 | ) |
| International franchise | (5 | ) | | — |
| | (7 | ) | | (3 | ) | (4 | ) | | — |
| | (5 | ) | | (6 | ) |
| International area license | (1 | ) | | — |
| | (1 | ) | | — |
| |
| Total franchise/area license restaurants closed | (9 | ) | | (2 | ) | | (21 | ) | | (14 | ) | (7 | ) | | (2 | ) | | (22 | ) | | (13 | ) |
| Net franchise/area license restaurant development | 9 |
| | 15 |
| | 29 |
| | 10 |
| |
| Net franchise/area license restaurant development (reduction) | | 6 |
| | 14 |
| | (3 | ) | | 19 |
|
| Refranchised from Company restaurants | — |
| | — |
| | 9 |
| | 1 |
| — |
| | — |
| | — |
| | 1 |
|
| Net franchise/area license restaurant additions | 9 |
| | 14 |
| | 38 |
| | 27 |
| |
| Franchise restaurants reacquired by the Company | | — |
| | — |
| | — |
| | (1 | ) |
| Net franchise/area license restaurant development (reduction) | | 6 |
| | 14 |
| | (3 | ) | | 19 |
|
| | | | | | | | | | | | | | | |
| Summary - end of period: | | | | | | | | | | | | | | |
| Franchise | 1,596 |
| | 1,532 |
| | 1,596 |
| | 1,532 |
| 1,669 |
| | 1,640 |
| | 1,669 |
| | 1,640 |
|
| Area license | 165 |
| | 167 |
| | 165 |
| | 167 |
| 159 |
| | 165 |
| | 159 |
| | 165 |
|
Company(a) | — |
| | 10 |
| | — |
| | 10 |
| |
| Total IHOP restaurants, end of period | 1,761 |
| | 1,709 |
| | 1,761 |
| | 1,709 |
| 1,828 |
| | 1,805 |
| | 1,828 |
| | 1,805 |
|
| Domestic | 1,655 |
| | 1,622 |
| | 1,655 |
| | 1,622 |
| 1,705 |
| | 1,688 |
| | 1,705 |
| | 1,688 |
|
| International | 106 |
| | 87 |
| | 106 |
| | 87 |
| 123 |
| | 117 |
| | 123 |
| | 117 |
|
(a)During the nine months ended September 30, 2017, nine company-operated IHOP restaurants were refranchised and one was permanently closed.
For the full year of 2017,2019, we expect Applebee's franchisees to developclose between 20 and 30 newnet restaurants globally, most of which are expected to be international openings. As part of a detailed system-wide analysis to optimize the health of the franchisee system, we anticipate the closing of between 105 to 135 Applebee's restaurants globally for the full year of 2017. The anticipated net decline in the number of Applebee's restaurants will result in a decrease in Applebee's royalty revenues. IHOP franchisees are projected to develop between 80 and 95 new IHOP restaurants globally for the full year of 2017, mostmajority of which are expected to be domestic openings. We expect the closing ofclosures. IHOP franchisees and area licensees are projected to develop between 2520 and 30 net new IHOP restaurants from natural attrition in 2017.globally, the majority of which are expected to be domestic openings.
The actual number of openings may differ from both our expectations and development commitments. Historically, the actual number of restaurants developed in any given year has been less than the total number committed to be developed due to various factors, including economic conditions and franchisee noncompliance with development agreements. The timing of new restaurant openings also may be affected by various factors including weather-related and other construction delays, difficulties in obtaining timely regulatory approvals and the impact of currency fluctuations on our international franchisees. The actual number of closures also may differ from our expectations. Our franchisees are independent businesses and decisions to close restaurants can be impacted by numerous factors, in addition to declines in same-restaurant sales, that are outside of our control, including but not limited to, franchisees' agreements with their landlords and lenders.
CONSOLIDATED RESULTS OF OPERATIONS
Comparison of the Three and NineSix Months EndedSeptemberendedJune 30, 20172019 and 20162018
Significant Known Events Trends or Uncertainties Impacting or ExpectingComparability of Financial Information
Acquisition of Franchise Restaurants
In December 2018, we acquired 69 Applebee's restaurants in North and South Carolina from a former Applebee's franchisee. While we currently intend to Impact Comparisonsown and operate these restaurants for the near term, we will assess and monitor opportunities to refranchise these restaurants under favorable circumstances. We operated no restaurants of Reported or Future Resultseither brand during the three and six months ended June 30, 2018.
Impairment of Applebee's Goodwill and Tradename
Franchisor Contributions to the Applebee’s NAF
We performed a quantitative test for impairment of Applebee's goodwillcontributed $16.5 million and tradename as of October 31, 2016, the annual testing date. We identified no impairments as a result of performing these quantitative assessments, however, we did note that the fair value of$30.0 million, respectively, to the Applebee's Franchise Reporting Unit exceededNAF during the carrying value of the unit by 9%three and therefore considered the unitsix months ended June 30, 2018, to be at risk of impairment.
In the third quarter of 2017, we noted thatmitigate the decline in franchisee contributions due to restaurant closures and the market pricenon-timely payment of our common stock since December 31, 2016, which we had believed to be temporary, persisted throughout the first eight months of 2017 and that the favorable trend in Applebee's domestic same-restaurant sales experienced in the second quarter of 2017 did not continue into the first two months of the third quarter. We also noted a continuing increase in Applebee's bad debt expense and in royalties not recognized in income until paid in cash. Additionally, we also determined an increasing shortfall in franchiseeadvertising fees by certain franchisees. Our contributions to the Applebee's national advertising fund could require a larger amountNAF ceased as of future subsidizationJune 30, 2018.
Temporary Increase in Franchisee Contribution Rate to the Applebee's NAF
The contribution rate to the Applebee’s NAF for virtually all Applebee’s franchisees was 3.50% of their gross sales for the period from January 1, 2018 to June 30, 2018. Such franchisees agreed to an incremental temporary increase of 0.75% in the form of additional franchisor contributionsadvertising contribution rate to the fund than previously estimated. Based on these unfavorable developments, primarily the decline in the market price of our common stock, we determined that indicators of impairment existed and that an interim test of goodwill and indefinite-lived intangible assets for impairment should be performed.
4.25%, effective July 1, 2018 to December 31, 2019. As a result, of performing the interim quantitative test, we recognized an impairment ofadvertising contribution rate for virtually all Applebee's goodwill of $358.2franchisees was 4.25% during the three and six months ended June 30, 2019 as compared to 3.50% during the three and six months ended June 30, 2018. This increased advertising revenue by approximately $7.9 million and an impairment of Applebee's tradename of $173.4 million. After$15.6 million, respectively, for the impairments,three and six months ended June 30, 2019.
In July 2019, such franchisees agreed to extend the balances of goodwill and the tradename intangible asset allocated to the Applebee's franchise unit as of September 30, 2017 were $328.5 million and $479.0 million, respectively.
We adopted the guidance in FASB Accounting Standards Update 2017-04 on January 1, 2017; accordingly, the amount of the goodwill impairment was determined as the amount by which the carrying amount of the goodwill exceeded the fair value of the Applebee's franchise reporting unit that was estimatedtemporary increase in the quantitative test. These assets are at risk of additional impairment in the future in the event of sustained downward movement in the Company's stock price, downward revisions of long-term performance assumptions or increases in the assumed long-term discount rate.
See additional discussion of these impairments under the heading “Financial Results - Impairment and Closure Charges.”
Executive Separation Costs
On February 17, 2017, we announced the resignation of our former Chairman and Chief Executive Officer (the “former CEO”), effective March 1, 2017. In accordance with terms of the Separation Agreement and General Release filed as Exhibit 10.1advertising contribution rate to Form 8-K filed on February 17, 2017, we recorded approximately $5.9 million for severance, separation pay and ancillary costs in the first quarter of 2017. All stock options and restricted stock awards held by the former CEO that were unvested at the time of the announcement became vested in connection with the separation. We recorded a charge of approximately $2.9 million related to the accelerated vesting of the equity awards in the first quarter of 2017. Total costs of $8.8 million related to the separation were included in G&A expenses for the nine months ended September 30, 2017, all of which were incurred in the first quarter of 2017.
4.25% through December 31, 2020.
Financial Results
| | | Revenue | | Three months ended September 30, | | Favorable
(Unfavorable) Variance | | Nine months ended September 30, | | Favorable
(Unfavorable) Variance | | Three months ended June 30, | | Favorable
(Unfavorable) Variance | | Six months ended June 30, | | Favorable
(Unfavorable) Variance |
| | | | 2019 | | 2018 | | 2019 | | 2018 | |
| | | 2017 | | 2016 | | Favorable
(Unfavorable) Variance | | 2017 | | 2016 | | Favorable
(Unfavorable) Variance | | | | | | | | | | | | |
| | | (In millions) | | (In millions) |
| Franchise operations | | $ | 112.3 |
| | $ | 119.2 |
| | $ | (6.9 | ) | | $ | 351.4 |
| | $ | 366.7 |
| | $ | (15.3 | ) | | $ | 162.7 |
| | $ | 151.9 |
| | $ | 10.8 |
| | $ | 331.6 |
| | $ | 307.2 |
| | $ | 24.4 |
|
| Rental operations | | 30.3 |
| | 30.5 |
| | (0.2 | ) | | 90.9 |
| | 92.7 |
| | (1.8 | ) | | 29.9 |
| | 30.4 |
| | (0.5 | ) | | 60.6 |
| | 61.2 |
| | (0.6 | ) |
| Company restaurant operations | | — |
| | 4.0 |
| | (4.0 | ) | | 7.5 |
| | 13.4 |
| | (5.9 | ) | | 33.7 |
| | — |
| | 33.7 |
| | 69.5 |
| | — |
| | 69.5 |
|
| Financing operations | | 2.1 |
| | 2.3 |
| | (0.2 | ) | | 6.3 |
| | 7.0 |
| | (0.7 | ) | | 1.8 |
| | 2.2 |
| | (0.4 | ) | | 3.6 |
| | 4.2 |
| | (0.6 | ) |
| Total revenue | | $ | 144.7 |
| | $ | 156.0 |
| | $ | (11.3 | ) | | $ | 456.1 |
| | $ | 479.8 |
| | $ | (23.7 | ) | | $ | 228.1 |
| | $ | 184.5 |
| | $ | 43.6 |
| | $ | 465.3 |
| | $ | 372.6 |
| | $ | 92.7 |
|
| Change vs. prior period | | (7.3 | )% | | | | | | (5.0 | )% | | | | | | 23.6 | % | | | | | | 24.9 | % | | | | |
Total revenue for the three months ended September 30, 2017 decreased compared with the same period of the prior year, primarily due to a decrease in revenue from Applebee's franchise restaurants and the refranchising of nine IHOP company-operated restaurants and closure of one IHOP company-operated restaurant in June 2017. Additional reasons for the decline in revenue include the impact of a 3.2% decrease in IHOP domestic same-restaurant sales on royalty and rental revenue and the expected progressive decline in interest revenue from rental and financing operations as receivable balances are repaid. These unfavorable factors were partially offset by IHOP franchisee restaurant development over the past twelve months.
Total revenue for the nine months ended September 30, 2017 decreased compared with the same period of the prior year, primarily due to the same factors discussed for the three-month period above. Additional reasons for the decline in revenue include the impact of a 2.5% decrease in IHOP domestic same-restaurant sales on royalty and rental revenue and the expected progressive decline in interest revenue from rental and financing operations as receivable balances are repaid. These unfavorable factors were partially offset by IHOP franchisee restaurant development over the past twelve months.
|
| | | | | | | | | | | | | | | | | | | | | | | | |
| Gross Profit (Loss) | | Three months ended September 30, | | Favorable (Unfavorable) Variance | | Nine months ended September 30, | | Favorable (Unfavorable) Variance |
| | | 2017 | | 2016 | | | 2017 | | 2016 | |
| | | (In millions) |
| Franchise operations | | $ | 70.5 |
| | $ | 81.9 |
| | $ | (11.4 | ) | | $ | 235.7 |
| | $ | 258.7 |
| | $ | (23.0 | ) |
| Rental operations | | 8.0 |
| | 7.7 |
| | 0.3 |
| | 23.2 |
| | 23.7 |
| | (0.5 | ) |
| Company restaurant operations | | (0.0 | ) | | (0.2 | ) | | 0.2 |
| | (0.3 | ) | | (0.7 | ) | | 0.4 |
|
| Financing operations | | 1.6 |
| | 2.3 |
| | (0.7 | ) | | 5.9 |
| | 6.8 |
| | (0.9 | ) |
| Total gross profit | | $ | 80.1 |
| | $ | 91.7 |
| | $ | (11.6 | ) | | $ | 264.5 |
| | $ | 288.5 |
| | $ | (24.0 | ) |
| Change vs. prior period | | (12.6 | )% | | | | | | (8.3 | )% | | | | |
Total gross profit forboth the three and ninesix months ended SeptemberJune 30, 2017 declined2019 increased compared with the same periods of the prior year, primarily due to the decreasesoperation of 69 Applebee's restaurant acquired in December 2018, the impact of a higher advertising contribution rate on Applebee's advertising revenue fromand IHOP restaurant development over the past 12 months. These items were partially offset by the impact of Applebee's restaurant closures on franchise operations an increase in Applebee's bad debt expense and the expected progressive decline in interest revenue from financing operations.revenue.
|
| | | | | | | | | | | | | | | | | | | | | | | | |
| Gross Profit | | Three months ended June 30, | | Favorable (Unfavorable) Variance | | Six months ended June 30, | | Favorable (Unfavorable) Variance |
| | | 2019 | | 2018 | | | 2019 | | 2018 | |
| | | | | | | | | | | | | |
| | | (In millions) |
| Franchise operations | | $ | 83.8 |
| | $ | 69.0 |
| | $ | 14.8 |
| | $ | 172.4 |
| | $ | 142.4 |
| | $ | 30.0 |
|
| Rental operations | | 7.0 |
| | 7.6 |
| | (0.6 | ) | | 15.0 |
| | 15.8 |
| | (0.8 | ) |
| Company restaurant operations | | 2.5 |
| | — |
| | 2.5 |
| | 6.7 |
| | — |
| | 6.7 |
|
| Financing operations | | 1.6 |
| | 2.0 |
| | (0.4 | ) | | 3.3 |
| | 3.9 |
| | (0.6 | ) |
| Total gross profit | | $ | 94.9 |
| | $ | 78.6 |
| | $ | 16.3 |
| | $ | 197.4 |
| | $ | 162.1 |
| | $ | 35.3 |
|
| Change vs. prior period | | 20.7 | % | | | | | | 21.8 | % | | | | |
Total gross profit for the three and six months ended June 30, 2019 increased compared with the same periods of the prior year, primarily due to contributions of $16.5 million and $30.0 million we made to the Applebee's NAF during the three and six months ended June 30, 2018, respectively, that did not recur in 2019. Operation of 69 Applebee's restaurants favorably impacted total gross profit for the three months ended June 30, 2019 by $1.2 million, as the gross profit of $2.5 million from operating the 69 restaurants was partially offset by royalties of approximately $1.3 million that would have been recognized in franchise operations had the restaurants been franchisee-operated. Operation of these restaurants favorably impacted total gross profit for the six months ended June 30, 2019 by $4.0 million, as the gross profit of $6.7 million from operating the 69 restaurants was partially offset by royalties of approximately $2.7 million that would have been recognized in franchise operations had the restaurants been franchisee-operated. IHOP restaurant development over the past 12 months also contributed to the increases in gross profit.
| | | | | Three months ended September 30, | | Favorable (Unfavorable) Variance | | Nine months ended September 30, | | Favorable (Unfavorable) Variance | | Three months ended June 30, | | Favorable (Unfavorable) Variance | | Six months ended June 30, | | Favorable (Unfavorable) Variance |
| Franchise Operations | | 2017 | | 2016 | | 2017 | | 2016 | | | 2019 | | 2018 | | 2019 | | 2018 | |
| | | (In millions, except number of restaurants) | | (In millions, except number of restaurants) |
Effective Franchise Restaurants:(1) | | | | | | | | | | | | | | | | | | | | | | | | |
| Applebee’s | | 1,953 |
| | 2,028 |
| | (75 | ) | | 1,981 |
| | 2,029 |
| | (48 | ) | | 1,753 |
| | 1,900 |
| | (147 | ) | | 1,758 |
| | 1,912 |
| | (154 | ) |
| IHOP | | 1,748 |
| | 1,688 |
| | 60 |
| | 1,733 |
| | 1,677 |
| | 56 |
| | 1,811 |
| | 1,790 |
| | 21 |
| | 1,812 |
| | 1,786 |
| | 26 |
|
| | | | | | | | | | | | | | |
| Franchise Revenues: | | |
| | |
| | |
| | |
| | | | | | |
| | | | |
| | |
| | | | |
| Applebee’s | | $ | 39.4 |
| | $ | 45.7 |
| | $ | (6.3 | ) | | $ | 129.3 |
| | $ | 144.7 |
| | $ | (15.4 | ) | |
| IHOP | | 44.9 |
| | 45.8 |
| | (0.9 | ) | | 137.7 |
| | 138.3 |
| | (0.6 | ) | |
| Advertising | | 28.0 |
| | 27.7 |
| | 0.3 |
| | 84.4 |
| | 83.7 |
| | 0.7 |
| |
| Applebee’s franchise fees | | | $ | 41.4 |
| | $ | 44.3 |
| | $ | (2.9 | ) | | $ | 84.7 |
| | $ | 85.0 |
| | $ | (0.3 | ) |
| IHOP franchise fees | | | 49.6 |
| | 48.9 |
| | 0.7 |
| | 102.5 |
| | 99.7 |
| | 2.8 |
|
| Advertising fees | | | 71.7 |
| | 58.7 |
| | 13.0 |
| | 144.4 |
| | 122.5 |
| | 21.9 |
|
| Total franchise revenues | | 112.3 |
| | 119.2 |
| | (6.9 | ) | | 351.4 |
| | 366.7 |
| | (15.3 | ) | | 162.7 |
| | 151.9 |
| | 10.8 |
| | 331.6 |
| | 307.2 |
| | 24.4 |
|
| Franchise Expenses: | | |
| | |
| | |
| | | | | | | | |
| | |
| | |
| | | | | | |
| Applebee’s | | 8.7 |
| | 4.2 |
| | (4.5 | ) | | 15.3 |
| | 7.3 |
| | (8.0 | ) | | 1.1 |
| | 18.1 |
| | 17.0 |
| | 1.7 |
| | 29.5 |
| | 27.8 |
|
| IHOP | | 5.1 |
| | 5.4 |
| | 0.3 |
| | 16.0 |
| | 17.0 |
| | 1.0 |
| | 6.1 |
| | 6.1 |
| | 0.0 |
| | 13.1 |
| | 12.8 |
| | (0.3 | ) |
| Advertising | | 28.0 |
| | 27.7 |
| | (0.3 | ) | | 84.4 |
| | 83.7 |
| | (0.7 | ) | |
| Advertising expenses | | | 71.7 |
| | 58.7 |
| | (13.0 | ) | | 144.4 |
| | 122.5 |
| | (21.9 | ) |
| Total franchise expenses | | 41.8 |
| | 37.3 |
| | (4.5 | ) | | 115.7 |
| | 108.0 |
| | (7.7 | ) | | 78.9 |
| | 82.9 |
| | 4.0 |
| | 159.2 |
| | 164.8 |
| | 5.6 |
|
| Franchise Gross Profit: | | |
| | |
| | |
| | | | | �� | | | |
| | |
| | |
| | | | | | |
| Applebee’s | | 30.7 |
| | 41.5 |
| | (10.8 | ) | | 114.0 |
| | 137.4 |
| | (23.4 | ) | | 40.3 |
| | 26.2 |
| | 14.1 |
| | 83.0 |
| | 55.5 |
| | 27.5 |
|
| IHOP | | 39.8 |
| | 40.4 |
| | (0.6 | ) | | 121.7 |
| | 121.3 |
| | 0.4 |
| | 43.5 |
| | 42.8 |
| | 0.7 |
| | 89.4 |
| | 86.9 |
| | 2.5 |
|
| Total franchise gross profit | | $ | 70.5 |
| | $ | 81.9 |
| | $ | (11.4 | ) | | $ | 235.7 |
| | $ | 258.7 |
| | $ | (23.0 | ) | | $ | 83.8 |
| | $ | 69.0 |
| | $ | 14.8 |
| | $ | 172.4 |
| | $ | 142.4 |
| | $ | 30.0 |
|
Gross profit as % of revenue (2) | | 62.8 | % | | 68.7 | % | | | | 67.1 | % | | 70.5 | % | | | | 51.5 | % | | 45.4 | % | | | | 52.0 | % | | 46.4 | % | | |
Gross profit as % of franchise fees (2) (3) | | | 92.1 | % | | 74.0 | % | | | | 92.1 | % | | 77.1 | % | | |
_____________________________________________________
(1) Effective Franchise Restaurants are the weighted average number of franchise and area license restaurants open in each fiscal period, adjusted to account for restaurants open for only a portion of the period.
(2) Percentages calculated on actual amounts, not rounded amounts presented above.
(3) From time to time, advertising fee revenue may be different from advertising expenses in a given accounting period. Over the long term, advertising revenue should not generate gross profit or loss.
Applebee’s franchise fee revenue for the three months ended SeptemberJune 30, 2017 declined 13.8%2019 decreased 6.7% compared to the same period of the prior year. Approximately $2.9$2.4 million of the declinedecrease was due to 147 fewer effective franchise restaurants in operation, the number of which declined due to restaurant closures by franchisees and our acquisition of 69 Applebee's restaurants in North and South Carolina from a 7.7%former Applebee's franchisee in December 2018. A decrease of 0.6% in domestic franchise same-restaurant sales. Additional factors contributingsales also contributed to the revenue decline were an increase of $1.7 million in cash-basis royalties and a $1.2 million decrease in royalties due to the net closure of franchise restaurants.revenue.
Applebee’s franchise revenue for the nine months ended September 30, 2017 declined 10.6% compared to the same period of the prior year. Approximately $9.3 million of the decline was due to a 7.3% decrease in domestic same-restaurant sales. Additional factors contributing to the revenue decline were a $2.7 million increase in cash-basis royalties, a $2.4 million decrease in royalties due to the net closure of franchise restaurants and a $0.8 million decrease in termination fees. We do not expect to receive any termination fees from approved closures of restaurants in 2017.
The increasessignificant decrease in Applebee's franchise expenses for the three and nine months ended SeptemberJune 30, 20172019 compared with the same periodsperiod of the prior year werewas primarily due to increases in bad debt expensea decrease of $2.9 million and $6.4 million, respectively, as well as an increase of $1.5$16.5 million in franchisor contributions to the Applebee's national advertising fund which impacted both periods. The Company contributed $4.0 millionNAF, as well as a decrease in bad debt expense. Our franchisor contributions to the Applebee's national advertising fund in the third quarterNAF ceased as of 2017 compared to a contribution of $2.5 million in the third quarter of 2016.June 30, 2018.
IHOP franchise fee revenue for the three months ended SeptemberJune 30, 2017 decreased2019 increased 1.3% compared to the same period of the prior year, primarily due to a $1.0 million2.0% increase in domestic franchise and area license same-restaurant sales and restaurant development over the past twelve months. These favorable items were partially offset by a decrease in sales of pancake and waffle dry mix and a 3.2% decrease in domestic same-restaurant sales. These unfavorable items were partially offset by a 3.6% increase in Effective Franchise Restaurants duelower fees related to net restaurant developmentopenings and an increase in franchise fees.
transfers. IHOP franchise revenueexpenses for the ninethree months ended SeptemberJune 30, 2017 decreased slightly2019 were unchanged from the same period of the prior year.
Gross profit, gross profit as a percentage of revenue and gross profit as a percentage of franchise fees increased for the three months ended June 30, 2019 compared to the same period of the prior year, primarily due to a $1.8the $16.5 million franchisor contribution to the Applebee's NAF made in the second quarter of 2018 that did not recur in 2019, partially offset by the decrease in Applebee's franchise revenue.
Applebee’s franchise fee revenue for the six months ended June 30, 2019 decreased slightly compared to the same period of the prior year. Revenue declined approximately $5.2 million due to 154 fewer effective franchise restaurants in operation during the period, the number of which declined due to our acquisition of 69 Applebee's restaurants as noted above and to restaurant closures by franchisees. This decrease was partially offset by an improvement in revenue collectibility of $4.9 million as a result of favorable changes in franchisee health.
The significant decrease in Applebee's franchise expenses for the six months ended June 30, 2019 compared with the same period of the prior year was primarily due to a decrease of $30.0 million in franchisor contributions to the Applebee's NAF, partially offset by $3.1 million in bad debt recoveries that had taken place during the first six months of 2018 but did not recur to the same degree in 2019. Applebee's bad debt expense was a credit of $0.4 million during the six months ended June 30, 2019.
IHOP franchise fee revenue for the six months ended June 30, 2019 increased 2.8% compared to the same period of the prior year, primarily due to an increase in royalties and sales of pancake and waffle dry mix as result of net restaurant development over the past twelve months and a 2.5% decrease1.7% increase in domestic same-restaurant sales. These unfavorable items were partially offset by a 3.3% increase in Effective Franchise Restaurants due to net restaurant development, a $0.7 million increase in international royalties and an increase in franchise fees.
The decreases in IHOP franchise expenses for the three and ninesix months ended SeptemberJune 30, 20172019 decreased compared with the same periodsperiod of the prior year, were primarily due to decreasesa decrease in bad debt expense of $0.9 million partially offset by an increase in purchases of pancake and waffle dry mixmix.
Gross profit, gross profit as a percentage of revenue and gross profit as a percentage of franchise fees increased for the six months ended June 30, 2019 compared to the same period of the prior year, primarily due to the $30.0 million franchisor contribution to the Applebee's NAF made during the first six months of 2018 that did not recur in 2019, partially offset by increased Companya decrease in Applebee's bad debt recoveries. Our franchisor contributions to marketing fundsthe Applebee's NAF ceased as of $0.2 million and $0.6 million, respectively.June 30, 2018.
Advertising contributions designated for IHOP’s national advertising fund and local marketing and advertising cooperatives, as well as advertising contributions from international franchise restaurants of both brands, are recognized as revenue and expense of franchise operations. However, due to differences in the administration of the Applebee’s marketing fund, contributions to Applebee's domestic marketing fund are not recognized as franchise revenue and expense. Advertising revenue and expense for the three and nine months ended SeptemberJune 30, 20172019 increased slightly compared to the same periodsperiod of the prior year, primarily due to increased contributions from international franchise restaurantsan increase in the franchisee advertising contribution rate to the Applebee's NAF. As noted above, virtually all domestic Applebee's franchisees agreed to an incremental temporary increase of both brands. The impact on0.75% in the advertising contribution rate to 4.25% effective July 1, 2018 to December 31, 2019. This change represented $7.9 million of the increase. In addition, advertising revenue and expense increased due to an improvement of franchisee collectibility of advertising fees from certain Applebee's franchisees, IHOP net restaurant development over the past twelve months and an increase in IHOP domestic franchise and area license same-restaurant sales, partially offset by a decrease in the number of IHOP restaurants was partially offset by the decrease in IHOP domestic same-restaurant sales.Applebee's Effective Restaurants.
Gross profit as a percentage ofAdvertising revenue declinedand expense for the three and ninesix months ended SeptemberJune 30, 20172019 increased compared to the same respective periodsperiod of the prior year, primarily becausedue to an increase in the franchisee advertising contribution rate to the Applebee's NAF noted above. This change represented $15.6 million of the increase. In addition, advertising revenue and expense increased due to an
improvement of franchisee collectibility of advertising fees from certain Applebee's franchisees, IHOP net restaurant development over the past twelve months and an increase in IHOP domestic franchise and area license same-restaurant sales, partially offset by a decrease in the number of Applebee's domestic same-restaurant sales and increasesEffective Restaurants.
It is our policy to recognize any deficiency or recovery of a previously recognized deficiency in cash-basis royalties and bad debt expense. We expect that gross profitadvertising fee revenue compared to advertising expenditure in the fourth quarter of franchise operations for the remainder of 2017 will continue to be adversely impacted by Applebee's restaurant closures and increases in Applebee's bad debt expense and cash-basis royalties.our fiscal year.
| | | Rental Operations | | Three months ended September 30, | | Favorable
(Unfavorable) Variance | | Nine months ended September 30, | | Favorable
(Unfavorable) Variance | | Three months ended June 30, | | Favorable
(Unfavorable) Variance | | Six months ended June 30, | | Favorable
(Unfavorable) Variance |
| | | 2017 | | 2016 | | 2017 | | 2016 | | | 2019 | | 2018 | | 2019 | | 2018 | |
| | | (In millions) | | (In millions) |
| Rental revenues | | $ | 30.3 |
| | $ | 30.5 |
| | $ | (0.2 | ) | | $ | 90.9 |
| | $ | 92.7 |
| | $ | (1.8 | ) | | $ | 29.9 |
| | $ | 30.4 |
| | $ | (0.5 | ) | | $ | 60.6 |
| | $ | 61.2 |
| | $ | (0.6 | ) |
| Rental expenses | | 22.3 |
| | 22.8 |
| | 0.5 |
| | 67.7 |
| | 69.0 |
| | 1.3 |
| |
| Total rental expenses | | | 22.9 |
| | 22.8 |
| | (0.1 | ) | | 45.6 |
| | 45.4 |
| | (0.2 | ) |
| Rental operations gross profit | | $ | 8.0 |
| | $ | 7.7 |
| | $ | 0.3 |
| | $ | 23.2 |
| | $ | 23.7 |
| | $ | (0.5 | ) | | $ | 7.0 |
| | $ | 7.6 |
| | $ | (0.6 | ) | | $ | 15.0 |
| | $ | 15.8 |
| | $ | (0.8 | ) |
Gross profit as % of revenue (1) | | 26.3 | % | | 25.4 | % | | | | 25.5 | % | | 25.6 | % | | | | 23.2 | % | | 24.9 | % | | | | 24.8 | % | | 25.7 | % | | |
(1) Percentages calculated on actual amounts, not rounded amounts presented above.
Rental operations relate primarily to IHOP franchise restaurants. Rental income includes sublease revenue from operating leases and interest income from direct financing leases. Rental expenses are costs of prime operating leases and interest expense on prime capital leases on certain franchise restaurants.financing leases.
Rental segment revenue for the three months ended SeptemberJune 30, 2017 was lower than2019 decreased as compared to the same period of the prior year primarily due to the expected progressive decline of $0.3$0.4 million in interest income as direct financing leases are repaid. Rental segment expenses for the three months ended June 30, 2019 were essentially unchanged from the same period of the prior year.
Rental segment revenue for the ninesix months ended SeptemberJune 30, 2017 was lower than2019 decreased as compared to the same period of the prior year primarily due to a $1.2 million decrease in rental income based on a percentage of franchisees' retail sales and the expected progressive decline of $0.9$0.7 million in interest income as direct financing leases are repaid.
repaid partially offset by contractual increases in base sub-rental income. Rental segment expenses decreased for the six months ended June 30, 2019 were essentially unchanged from the same period of the prior year.
Company Restaurant Operations
As discussed above under “Events Impacting Comparability of Financial Information,” we acquired 69 Applebee’s restaurants in North Carolina and South Carolina in December 2018. We had no company-operated restaurants of either brand during the three and ninesix months ended SeptemberJune 30, 2017 compared to the same periods of the prior year primarily because of the expected progressive declines in interest expense as capital lease obligations are repaid and in depreciation as assets age.2018.
Financing Operations
Financing revenues primarily consist of interest income from the financing of IHOP equipment leases and franchise fees, as well as sales of equipment associated with refranchised IHOP restaurants.restaurants and interest income on Applebee's notes receivable from franchisees. Financing expenses are the cost of any restaurant equipment sold associated with refranchised IHOP restaurants.
The decrease in financingFinancing revenue for the three and nine months ended September 30, 2017 was primarily due to the expected progressive declines of $0.2 million and $0.6 million, respectively, in interest revenue as note balances are repaid. The decrease in financing gross profit for the three and ninesix months ended SeptemberJune 30, 2017 was primarily2019 declined due to costs associated with the sale of equipment related to refranchised IHOP restaurants as well as the declinesdecreases in interest revenue.income as note balances are repaid.
Company Restaurant Operations |
| | | | | | | | | | | | | | | | | | | | | | | | |
| G&A Expenses | | Three months ended June 30, | | Favorable
(Unfavorable) Variance | | Six months ended June 30, | | Favorable
(Unfavorable) Variance |
| | | 2019 | | 2018 | | | 2019 | | 2018 | |
| | | (In millions) |
| | $ | 39.4 |
| | $ | 38.8 |
| | $ | (0.6 | ) | | $ | 82.2 |
| | $ | 80.7 |
| | $ | (1.5 | ) |
Effective June 19, 2017, we refranchised nine of our ten company-operated IHOP restaurants in the Cincinnati, Ohio market area; the one restaurant not refranchised was closed. As a result, we no longer operate any IHOP restaurants on a permanent basis. We did not consider these restaurants to be “discontinued operations” as defined by U.S. GAAP because the refranchising of nine restaurants out of a total of over 3,700 restaurants did not represent a strategic shift that had a major effect on our
operations. From time to time, we may continue to operate IHOP restaurants reacquired from franchisees on a temporary basis until those restaurants are refranchised. There were no IHOP restaurants under temporary operation as of September 30, 2017.
Company restaurant revenues andG&A expenses decreased for the three and nine months ended SeptemberJune 30, 20172019 increased 1.6% compared to the same period of the prior year, primarily because we did not operate any company restaurants after June 19, 2017due to an increase in personnel-related expenses and we did not operate any reacquired restaurants during the first nine monthssoftware maintenance costs, partially offset by a decrease in costs of 2017, whereas we did operate one reacquired restaurant during the first nine months of 2016. Gross profit for the three and nine months ended September 30, 2017 improved slightly because the temporary operation of reacquired restaurants typically results in a small loss.consumer research.
|
| | | | | | | | | | | | | | | | | | | | | | | | |
| G&A Expenses | | Three months ended September 30, | | Favorable
(Unfavorable) Variance | | Nine months ended September 30, | | Favorable
(Unfavorable) Variance |
| | | 2017 | | 2016 | | | 2017 | | 2016 | |
| | | (In millions) |
| | $ | 38.0 |
| | $ | 36.0 |
| | $ | (2.0 | ) | | $ | 125.7 |
| | $ | 111.9 |
| | $ | (13.8 | ) |
The increase in G&A expenses for the threesix months ended SeptemberJune 30, 20172019 increased 1.9% compared to the same period of the prior year, was primarily due to a $1.9$4.2 million increase in personnel-related costs. Increases in costs ofexpenses and software depreciation and professional services were offset by lower costs of travel and conferences. The increase in personnel-related costs is primarily due to higher costs of severance and an increase in salary and benefits related to the hiring of several senior management positions over the past twelve months, partially offset by lower costs of stock-based compensation.
The increase in G&A expenses for the nine months ended September 30, 2017 compared to the same period of the prior year was primarily due to charges of $8.8 million related to the executive separation costs discussed under “Events Impacting Comparability of Financial Information.” The additional increase in G&A of $5.0 million was due to a $5.4 million increase in professional services and a $2.5 million increase in personnel-relatedmaintenance costs, partially offset by a $2.0 million decreasedecreases in costs of professional services, consumer research, travel and conference costs and a decrease of $1.1 million in recruiting and relocation costs.
The increase in professional services was due primarily to our utilization of third-party consultants related to the Applebee's stabilization initiatives discussed under “Domestic Same-restaurant Sales - Applebee's.”conferences. The increase in personnel-related costs was primarily due to an increase in salary and benefits related to the hiring of several senior management positions over the past twelve months, an increase in severance coststhat were filled and a decrease in certain employment-related incentive credits because of our reduction of personnel in the state of Missouri, partially offset by lowerhigher costs of stock-based compensation. The decrease
Loss on Extinguishment of Debt
As discussed in traveladditional detail under “Liquidity and conferenceCapital Resources,” on June 5, 2019, we repaid our outstanding long-term debt of $1.28 billion with an anticipated repayment date of September, 2021 (the “2014 Notes”) with proceeds from the issuance of new debt totaling $1.3 billion, comprised of tranches of $700 million and $600 million having anticipated repayments dates of June 2024 and June 2026, respectively. In connection with this transaction, we recognized a loss on extinguishment of debt of $8.3 million for the three and six months ended June 30, 2019, representing the remaining unamortized issuance costs associated with the 2014 Notes.
|
| | | | | | | | | | | | | | | | | | | | | | | | |
Other Income and Expense Items
| | Three months ended June 30, | | Favorable
(Unfavorable) Variance | | Six months ended June 30, | | Favorable
(Unfavorable) Variance |
| | | 2019 | | 2018 | | | 2019 | | 2018 | |
| | | (In millions) |
| Interest expense, net | | $ | 14.6 |
| | $ | 15.5 |
| | $ | 0.9 |
| | $ | 30.0 |
| | $ | 30.7 |
| | $ | 0.7 |
|
| Amortization of intangible assets | | 2.9 |
| | 2.5 |
| | (0.4 | ) | | 5.9 |
| | 5.0 |
| | (0.9 | ) |
| Closure and impairment | | 0.3 |
| | (2.7 | ) | | (3.0 | ) | | 0.5 |
| | (0.1 | ) | | (0.6 | ) |
| Loss (gain) on disposition of assets | | 0.3 |
| | (0.1 | ) | | (0.4 | ) | | 0.4 |
| | (1.5 | ) | | (1.9 | ) |
| Total | | $ | 18.1 |
| | $ | 15.2 |
| | $ | (2.9 | ) | | $ | 36.8 |
| | $ | 34.1 |
| | $ | (2.7 | ) |
Interest expense, net
Interest expense, net for the three and six months ended June 30, 2019 was slightly lower than the same periods of the prior year, primarily due to the timing of our brands' franchisee conferences that will take place in the fourth quarter of 2017 as compared to taking place in the third quarter of 2016. The decrease in recruiting, relocation and occupancy expenses related to costs incurred as a result of the relocation of personnel and functions in 2016 that did not recur in 2017.
|
| | | | | | | | | | | | | | | | | | | | | | | | |
| Impairment and Closure Charges | | Three months ended September 30, | | Favorable
(Unfavorable) Variance | | Nine months ended September 30, | | Favorable
(Unfavorable) Variance |
| | | 2017 | | 2016 | | | 2017 | | 2016 | |
| | | (In millions) |
| Impairment of goodwill | | $ | 358.2 |
| | $ | — |
| | $ | (358.2 | ) | | $ | 358.2 |
| | $ | — |
| | $ | (358.2 | ) |
| Impairment of tradename | | 173.4 |
| | — |
| | (173.4 | ) | | 173.4 |
| | — |
| | (173.4 | ) |
| Other impairment and closure costs | | 0.9 |
| | 0.2 |
| | (0.7 | ) | | 3.8 |
| | 4.0 |
| | 0.2 |
|
| | | $ | 532.5 |
| | $ | 0.2 |
| | $ | (532.3 | ) | | $ | 535.4 |
| | $ | 4.0 |
| | $ | (531.4 | ) |
As discussed abovelower interest expense on borrowings under the heading “Significant Known Events, Trends or Uncertainties Impacting or Expecting to Impact Comparisons of Reported or Future Results - Impairment of Applebee's Goodwill and Tradename,” we performed an interim quantitative test for impairment of Applebee's goodwill and tradename during the third quarter of 2017 and recorded an impairment to goodwill of $358.2 million and an impairment to the Applebee's tradename of $173.4 million.
In determining the fair value of the Applebee's franchise reporting unit, we used the income approach method of valuation that includes the discounted cash flow methodrevolving credit facilities as well as other generally accepted valuation methodologiesan increase in interest income.
Amortization of intangible assets
Amortization of intangible assets for the three and six months ended June 30, 2019 increased compared to the same periods of the prior year due to amortization of reacquired franchise rights recognized in conjunction with the December 2018 acquisition of 69 Applebee's restaurants.
Closure and impairment
There were no individually significant closure and impairment charges during the three and six months ended June 30, 2019. During the three and six months ended June 30, 2018 we recognized closure credits of $2.7 million and $0.1 million, respectively. The large credit for the three months ended June 30, 2018 was due to a downward revision of previously established reserves for property closures, primarily a reserve of $2.5 million that had been established in the first quarter of 2018 for lease closure obligations, net of estimated sub-rental income, related to two properties on which refranchised Applebee's company-operated restaurants had been located. During the second quarter of 2018, it was determined the reserve related to the two properties was no longer required and the reserve taken in the first quarter of 2018 was reversed.
During the six months ended June 30, 2019, we performed assessments to determine the fair value ofwhether events or changes in circumstances have occurred that could indicate a potential impairment to our goodwill and indefinite-lived intangible assets. Significant assumptions made by managementWe considered, among other things, changes in estimating fair value underour key performance indicators during the discounted cash flow model includesix months ended June 30, 2019 and what, if any, impact that performance had on our long-term view of future trends in sales, operating expenses, overhead expenses, depreciation, capital expenditures and changes in working capital, along withcapital. We also considered the current market price of our common stock and the continuing impact of the Tax Cuts and Jobs Act of 2017. We concluded that an appropriate discount rate based on our estimated costinterim test for impairment was not necessary as of equity capital and after-tax costJune 30, 2019. We also considered whether there were any indicators that the carrying value of debt.tangible long-lived assets may not be recoverable. No significant indicators were noted.
In determining the fair valueLoss/gain on disposition of the Applebee's tradename, we used the relief of royalty method under the income approach method of valuation. Significant assumptions used to determine fair value under the relief of royalty method include future trends in sales, a royalty rate and a discount rate to be applied to the forecast revenue stream.assets
The assumptions used in both the discounted cash flow method and the relief of royalty method are determined by the Company based on historical results, trends and anticipated growth resulting from specific development initiatives planned to be implemented over the time horizon covered by the Company's projections. The most impactful assumptions are the discount rate and the forecast change in system-wide sales (due to a combination of changes in same-restaurant sales and in net restaurant development) that impact our royalty revenues.
There is an inherent degree of uncertainty in preparing any forecast of future results. The projections used in performing the impairment tests during the three months ended September 30, 2017, reflected an increase in system-wide sales from estimated full-year 2017 amounts, in progressively larger increments, over the time period covered by the projections. System-wide sales are dependent to a significant extent on national, regional and local economic conditions, and, to a lesser extent, on global economic conditions, particularly those conditions affecting the demographics of the guests that frequently patronize Applebee's restaurants. Accordingly, there are a number of potential events that could reasonably be expected to negatively affect the forecast of system-wide sales, including a decrease in customers' disposable income available for discretionary spending (because of circumstances such as job losses, credit constraints, higher housing costs, increased tax rates, energy costs, interest rates or other costs) or a decrease in the perceived wealth of customers (because of circumstances such as lower residential real estate values, increased foreclosure rates, increased tax rates or other economic disruptions). As a result, our business could experience a decline in sales and/or customer traffic as potential customers choose lower-cost alternatives (such as quick-service restaurants) or other alternatives to dining out. Additionally, negative trends in the availability of credit and in expenses such as interest rates and the cost of construction materials could affect our franchisees' ability to maintain and remodel existing restaurants. Any decreases in customer traffic or average customer check due to these or other reasons could reduce gross sales at franchise restaurants, resulting in lower royalty and other payments from franchisees. This could reduce the profitability of franchise restaurants, potentially impacting the ability of franchisees to make royalty payments owed to us when due (which could adversely impact our current cash flow from franchise operations) and negatively impacting franchisees’ ability to develop new restaurants (which could adversely impact our future cash flows from franchise operations).
Other impairment and closure charges for the three months ended September 30, 2017 and 2016 were not significant. For the nine months ended September 30, 2017, other impairment and closure costs of $3.8 million primarily comprised $2.2 million of costs related to the closure of one company-operated IHOP restaurant in the Cincinnati, Ohio market area. There were no other individually significant charges.
For the nine months ended September 30, 2016, other impairment and closure costs are primarily comprised of $2.5 million of lease termination costs related to the reduction of our space requirements in Kansas City, Missouri, approximately $1.0 million of impairment charges and $0.5 million of closure charges. The largest individually significant impairment charge of $0.6 million related to one IHOP company-operated restaurant. The closure charges related to adjustments for IHOP and Applebee's restaurants closed in periods prior to September 30, 2016.
|
| | | | | | | | | | | | | | | | | | | | | | | | |
| (Gain) Loss on Disposition of Assets | | Three months ended September 30, | | Favorable
(Unfavorable) Variance | | Nine months ended September 30, | | Favorable
(Unfavorable) Variance |
| | 2017 | | 2016 | | | 2017 | | 2016 | |
| | | (In millions) |
| | | $ | (0.0 | ) | | $ | 0.1 |
| | $ | 0.1 |
| | $ | (6.4 | ) | | $ | 0.7 |
| | $ | 7.1 |
|
In June 2017, we completed the refranchising and sale of related restaurant assets of nine company-operated IHOP restaurants in the Cincinnati, Ohio market area. As part of the transaction, we entered into an asset purchase agreement, nine franchise agreements and nine sublease agreements for land and buildings. The Company compared the stated rent under the sublease agreements with comparable market rents and recorded net favorable lease assets of $2.3 million in related to the transaction. The Company also received cash of $1.1 million and a note receivable for $4.8 million. After allocating a portion of the consideration to franchise fees and derecognition of the assets sold, we recognized a gain of $6.2 million on the refranchising and sale during the nine months ended September 30, 2017. There were no other individually significant asset dispositions in eitherduring the three and six months ended June 30, 2019. During the six months ended June 30, 2018, the sublease tenant of a property with lease terms favorable to the Company purchased the property, which allowed us to recognize a gain of $1.4 million on disposition of the comparative periods presented above.favorable lease asset.
|
| | | | | | | | | | | | | | | | | | | | | | | | |
Other Expense and Income Items | | Three months ended September 30, | | Favorable
(Unfavorable) Variance | | Nine months ended September 30, | | Favorable
(Unfavorable) Variance |
| | | 2017 | | 2016 | | | 2017 | | 2016 | |
| | | (In millions) |
| Interest expense | | $ | 15.4 |
| | $ | 15.4 |
| | $ | 0.0 |
| | $ | 46.5 |
| | $ | 46.1 |
| | $ | (0.4 | ) |
| Amortization of intangible assets | | 2.5 |
| | 2.5 |
| | (0.0 | ) | | 7.5 |
| | 7.5 |
| | (0.0 | ) |
| Total | | $ | 17.9 |
| | $ | 17.9 |
| | $ | 0.0 |
| | $ | 54.0 |
| | $ | 53.6 |
| | $ | (0.4 | ) |
|
| | | | | | | | | | | | | | | | | | | | | | | | |
| Income Taxes | | Three months ended June 30, | | Favorable
(Unfavorable) Variance | | Six months ended June 30, | | Favorable
(Unfavorable) Variance |
| | | 2019 | | 2018 | | | 2019 | | 2018 | |
| | | (In millions) |
| Income tax provision | | $ | 7.7 |
| | $ | 11.9 |
| | $ | 4.2 |
| | $ | 17.2 |
| | $ | 17.5 |
| | $ | 0.3 |
|
| Effective tax rate | | 26.4 | % | | 48.3 | % | | 21.9 | % | | 24.5 | % | | 37.0 | % | | 12.5 | % |
Interest expense and amortization of intangible assets for the three and nine months ended September 30, 2017 were consistent with the same periods of the prior year.
|
| | | | | | | | | | | | | | | | | | | | | | | | |
| Income Taxes | | Three months ended September 30, | | Favorable
(Unfavorable) Variance | | Nine months ended September 30, | | Favorable
(Unfavorable) Variance |
| | | 2017 | | 2016 | | | 2017 | | 2016 | |
| | | (In millions) |
| Income tax (benefit) provision | | $ | (56.6 | ) | | $ | 13.2 |
| | $ | 69.8 |
| | $ | (28.2 | ) | | $ | 41.7 |
| | $ | 69.9 |
|
| Effective tax rate | | 11.1 | % | | 35.3 | % | | 24.2 | % | | 6.4 | % | | 35.2 | % | | 28.8 | % |
Our income tax provision will vary from period to period for two reasons: a change in income before income taxes and a change in the effective tax rate. Changes in our income before income taxes between 2017 and 2016 were addressed in the preceding sections of “Consolidated“Consolidated Results of Operations - Comparison of the Three and NineSix Months Ended SeptemberJune 30, 20172019 and 2016.2018.”
Our effective tax rates for the three and ninesix months ended SeptemberJune 30, 20172019 were significantly differentlower than the statutory federalrates of the prior comparable periods. During the three and six months ended June 30, 2018, we increased our tax rate of 35%. As noted under “Impairment and Closure Charges” above, we recorded an impairment of Applebee's goodwill of $358.2provision by $5.7 million which is not deductible for federal income tax purposes and therefore there is no tax benefit associated with the impairment. We did recognize a deferred tax benefit of $65.1 million as a discrete item related to adjustments resulting from IRS audits for tax years 2011 through 2013, which increased our effective tax rates for those periods. Completion of the $173.4IRS audits for tax years 2011 through 2013 allowed us to accelerate the collection of certain tax benefits recognized in prior years. The IRS examination of tax years 2011 to 2013 concluded during the three months ended June 30, 2019, and the Company received a refund of $13.3 million, impairment charge related to Applebee's tradename.inclusive of interest income of $0.9 million.
Liquidity and Capital Resources
At September 30, 2017, our On June 5, 2019, Applebee’s Funding LLC and IHOP Funding LLC (the “Co-Issuers”), each a special purpose, wholly-owned indirect subsidiary of the Company, issued two tranches of fixed rate senior secured notes, the Series 2019-1 4.194% Fixed Rate Senior Secured Notes, Class A-2-I (“Class A-2-I Notes”) in an initial aggregate principal amount of $700 million and the Series 2019-1 4.723% Fixed Rate Senior Secured Notes, Class A-2-II (“Class A-2-II Notes”) in an initial aggregate principal amount of $600 million (the “Class A-2-II Notes” and, together with the Class A-2-I Notes, the “2019 Class A-2 Notes”). The 2019 Class A-2 Notes were issued pursuant to an offering exempt from registration under the Securities Act of 1933, as amended.
The Co-Issuers also replaced their existing revolving financing facility, the 2018-1 Variable Funding Senior Notes, Class A-1 (“2018-1 Class A-1 Notes”), with a new revolving financing facility, the 2019-1 Variable Funding Senior Notes, Class A-1 (the “2019 Class A-1 Notes”), on substantially the same terms as the 2018-1 Class A-1 Notes in order to conform the term of the 2019 Class A-1 Notes to the anticipated repayment dates for the 2019 Class A-2 Notes. The 2019 Class A-1 Notes and the 2019 Class A-2 Notes are referred to collectively herein as the “New Notes.”
The New Notes were issued in a securitization transaction pursuant to which substantially all of the domestic revenue-generating assets and domestic intellectual property held by the Co-Issuers and certain other special-purpose, wholly-owned indirect subsidiaries of the Company (the “Guarantors”) were pledged as collateral to secure the New Notes. See Note 8 - Long-Term Debt, of the Notes to Consolidated Financial Statements included in this report for additional information regarding the New Notes.
We used the majority of the net proceeds of the offering to repay the entire outstanding long-term debt consistedbalance of $1.3approximately $1.28 billion of Series 2014-1 4.277% Fixed Rate Senior Notes, Class A-2 (the “Class“2014 Class A-2 Notes”). We also have a revolving financing facility consisting of Series 2014-1 Variable Funding Senior Notes, Class A-1 (the “Variable Funding Notes”), which allowsused the remaining proceeds to pay for drawings of up to $100 million of Variable Funding Notestransactions costs associated with the securitization refinancing transaction and the issuance of letters of credit. The Class A-2 Notes and the Variable Funding Notes are referred to collectively as the “Notes.” The Notes were issued in a private securitization transaction pursuant to which substantially all our domestic revenue-generating assets and our domestic intellectual property are held by certain special-purpose, wholly-owned indirect subsidiaries of the Company (the “Guarantors”) that act as guarantors of the Notes and that have pledged substantially all their assets to secure the Notes.for general corporate purposes.
While the 2019 Class A-2 Notes are outstanding, payment of principal and interest is required to be made on the 2019 Class A-2 Notes on a quarterly basis. The quarterly principal payment of $3.25 millionprincipal on the 2019 Class A-2 Notes may be suspended when the leverage ratio for the Company and its subsidiaries is less than or equal to 5.25x. At SeptemberAs of June 30, 2017, our2019, the Company's leverage ratio was 5.36x (see Exhibit 12.1).4.57x; accordingly, no principal payment on the 2019 Class A-2 Notes will be required during the third quarter of 2019. Exceeding the leverage ratio of 5.25x does not violate any covenant related to the Notes; however, we will be required to make a principal payment of $3.25 million in the fourth quarter of 2017.New Notes.
We may voluntarily repay the Class A-2 Notes at any time; however, if we voluntarily repay the Class A-2 Notes prior to September 2018 we would be required to pay a make-whole premium. We would also be subject to a make-whole premium in the event of a mandatory prepayment occurring prior to September 2018 following a Rapid Amortization Event (as defined in the Class A-2 Notes) or certain asset dispositions. The make-whole premium requirements are considered derivatives embedded in the Class A-2 Notes that must be bifurcated for separate valuation. We estimated the fair value of these derivatives to be insignificant at September 30, 2017, based on the probability-weighted discounted cash flows associated with either event.
The Variable Funding Notes were not drawn upon at September 30, 2017 and we have not drawn on them since issuance. At September 30, 2017, $5.0 million was pledged against the Variable Funding Notes for outstanding letters of credit, leaving $95.0 million of Variable Funding Notes available for borrowings. The letters of credit are used primarily to satisfy insurance-related collateral requirements.
TheNew Notes are subject to customary rapid amortization events for similar types of financing, including events tied to our failure to maintain the stated debt service coverage ratio (“DSCR”), the sum of domestic retail sales for all restaurants being below certain levels on certain measurement dates, certain manager termination events, certain events of default and the failure to repay or refinance the Notes on the Class A-2 Anticipated Repayment Date in September 2021. The Notes are also subject to certain customary events of default, including events relating to non-payment of required interest, principal or other amounts due on or with respect to the Notes, failure to maintain the stated DSCR, failure to comply with covenants within certain time frames, certain bankruptcy events, breaches of specified representations and warranties and certain judgments.
. Failure to maintain a prescribed DSCR can trigger a Cash TrappingFlow Sweeping Event, A Rapid Amortization Event, a Manager Termination Event or a Default Event as described below. In a Cash TrappingFlow Sweeping Event, the Trustee is required to retain a certain percentage50% of excess Cash Flow (as defined) in a restricted account. In a Rapid Amortization Event, all excess Cash Flow is retained and used to retire principal amounts of debt. Key DSCRs are as follows:
•DSCR less than 1.75x but equal to or greater than 1.50x - Cash TrappingFlow Sweeping Event 50% of Net Cash Flow
•DSCR less than 1.50x - Cash Trapping Event, 100% of Net Cash Flow
•DSCR less than 1.30x1.20x - Rapid Amortization Event
•Interest-only DSCR less than 1.20x - Manager Termination Event
•Interest-only DSCR less than 1.10x - Default Event
Our DSCR for the reporting period ended SeptemberJune 30, 20172019 was 4.33x (see Exhibit 12.1)5.40x.
Use of Credit Facilities
We have not drawn on the 2019 Class A-1 Notes subsequent to their June 5, 2019, issuance. At June 30, 2019, $2.2 million was pledged against the 2019 Class A-1 Notes for outstanding letters of credit, leaving $222.8 million of 2019 Class A-1 Notes available for borrowing. The letters of credit are used primarily to satisfy insurance-related collateral requirements.
During the six months ended June 30, 2019, we repaid $25.0 million of 2018 Class A-1 Notes, representing the amount outstanding at December 31, 2018; we did not draw on the 2018 Class A-1 Notes during the six months ended June 30, 2019. The maximum amount of 2018 Class A-1 Notes outstanding during the six months ended June 30, 2019 was $25.0 million and the weighted average interest rate on the 2018 Class A-1 Notes for the period outstanding was 4.88%.
Debt Issuance Costs
We incurred costs of approximately $12.9 million in connection with the issuance of the 2019 Class A-2 Notes. These debt issuance costs are being amortized using the effective interest method over estimated life of each tranche of the 2019 Class A-2 Notes. Amortization of $0.1 million of these costs was included in interest expense for the three and six months ended June 30, 2019. Unamortized debt issuance costs of $12.8 million are reported as a direct reduction of the Class A-2 Notes in the Consolidated Balance Sheets.
We incurred debt issuance costs of approximately $0.2 million in connection with the replacement of the 2018-1 Class A-1 Notes with the 2019-1 Class A-1 Notes. These costs have been added to the remaining unamortized costs of approximately $2.8 million related to the 2018-1 Class A-1 Notes, the total of which costs is now being amortized using the effective interest method over the estimated five-year life of the 2019-1 Class A-1 Notes. Amortization of these costs of $0.2 million and $0.5 million, respectively, was included in interest expense for the three and six months ended June 30, 2019.
Unamortized debt issuance costs of $3.0 million related to the 2019-1 Class A-1 Notes are reported as other long-term assets in the Consolidated Balance Sheets at June 30, 2019.
Loss on Extinguishment of Debt
In connection with the repayment of the 2014 Class A-2 Notes, the Company recognized a loss on extinguishment of debt of $8.3 million, representing the remaining unamortized costs related to the 2014 Class A-2 Notes. Prior to the extinguishment, amortization of costs related to the 2014 Class A-2 Notes of $0.6 million and $1.4 million, respectively, was included in interest expense for the three and six months ended June 30, 2019.
Capital Allocation
Dividends
During the ninesix months ended SeptemberJune 30, 2017,2019, we paid dividends on common stock of $52.3$23.3 million, representing a cash dividendsdividend of $0.97$0.63 per share declared in the fourth quarter on 2018, paid in January 2019 and a cash dividend of 2016 and$0.69 per share declared in the first and second quartersquarter of 2017.2019, paid in April 2019. On August 10, 2017,May 13, 2019, our Board of Directors declared a thirdsecond quarter 20172019 cash dividend of $0.97$0.69 per share of common stock. This dividend was paid on October 6, 2017July 12, 2019 to our stockholders of record at the close of business on September 18, 2017.June 20, 2019. We reported dividends payable of $17.8$12.2 million at SeptemberJune 30, 2017.2019.
Share Repurchases
In October 2015, ourFebruary 2019, the Company’s Board of Directors approved a stock repurchase program authorizing usthe Company to repurchase up to $200 million of the Company’s common stock (the “2019 Repurchase Program”) on an opportunistic basis from time to time in the open market or in privately negotiated transactions based on business, market, applicable legal requirements and other considerations. The 2019 Repurchase Program, as approved by the Board of Directors, does not require the repurchase of a specific number of shares and can be terminated at any time.
In October 2015, the Company's Board of Directors approved a stock repurchase program authorizing the Company to repurchase up to $150 million of ourthe Company's common stock (the “2015 Repurchase Program”) on an opportunistic basis from time to time in open market transactions and in privately negotiated transactions based on business, market, applicable legal requirements and other considerations. The 2015 Repurchase Program, as approved by the Board of Directors, doesdid not require the repurchase of a specific number of shares and cancould be terminated at any time. In connection with the approval of the 2019 Repurchase Program, the Board of Directors terminated the 2015 Repurchase Program.
A summary of shares repurchased under the 2019 Repurchase Program and the 2015 Repurchase Program, currentlyduring the three and six months ended June 30, 2019 and cumulatively, is as follows:
|
| | | | | | |
| | Shares | | Cost of shares |
| | | | (In millions) |
| Repurchased during the three months ended September 30, 2017 | — |
| | $ | — |
|
| Repurchased during the nine months ended September 30, 2017 | 145,786 |
| | $ | 10.0 |
|
| Cumulative repurchases as of September 30, 2017 | 1,000,657 |
| | $ | 82.9 |
|
| Remaining dollar value of shares that may be repurchased | n/a | | $ | 67.1 |
|
|
| | | | | | |
| | Shares | | Cost of shares |
| | | | (In millions) |
| 2019 Repurchase Program: | | | |
| Repurchased during the three months ended June 30, 2019 | 392,132 |
| | $ | 35.3 |
|
| Repurchased during the six months ended June 30, 2019 | 432,949 |
| | $ | 39.0 |
|
| Cumulative (life-of-program) repurchases | 432,949 |
| | $ | 39.0 |
|
| Remaining dollar value of shares that may be repurchased | n/a | | $ | 161.0 |
|
| | | | |
| 2015 Repurchase Program: | | | |
| Repurchased during the three months ended June 30, 2019 | — |
| | $ | — |
|
| Repurchased during the six months ended June 30, 2019 | 110,499 |
| | $ | 8.4 |
|
| Cumulative (life-of-program) repurchases | 1,589,995 |
| | $ | 126.2 |
|
| Remaining dollar value of shares that may be repurchased | n/a | | n/a |
We evaluate dividend payments on common stock and repurchases of common stock within the context of our overall capital allocation strategy with our Board of Directors on an ongoing basis, giving consideration to our current and forecast earnings, financial condition, cash requirements and other factors.
From time to time, we also repurchase shares owned and tendered by employees to satisfy tax withholding obligations on the vesting of restricted stock awards. Shares are deemed purchased at the closing price of our common stock on the vesting date. See Part II, Item 2 for detail on all share repurchase activity during the thirdsecond quarter of 2017.2019.
Cash Flows
In summary, our cash flows for the ninesix months ended SeptemberJune 30, 20172019 and 20162018 were as follows:
| | | | Nine months ended September 30, | | | Six months ended June 30, | | |
| | 2017 | | 2016 | | Variance | 2019 | | 2018 | | Variance |
| | (In millions) | (In millions) |
| Net cash provided by operating activities | $ | 31.0 |
| | $ | 62.1 |
| | $ | (31.1 | ) | $ | 69.3 |
| | $ | 25.8 |
| | $ | 43.5 |
|
| Net cash provided by investing activities | 6.4 |
| | 10.0 |
| | (3.6 | ) | 0.9 |
| | 5.0 |
| | (4.1 | ) |
| Net cash used in financing activities | (72.7 | ) | | (106.6 | ) | | 33.9 |
| (92.9 | ) | | (44.1 | ) | | (48.8 | ) |
| Net decrease in cash, cash equivalents and restricted cash | $ | (35.2 | ) | | $ | (34.5 | ) | | $ | (0.7 | ) | $ | (22.7 | ) | | $ | (13.3 | ) | | $ | (9.4 | ) |
Operating Activities
The decline in cashCash provided by operating activities forincreased $43.5 million during the ninesix months ended SeptemberJune 30, 2017 was primarily due to a decrease in net income. Our net income for the nine months ended September 30, 2017 declined $492.7 million2019 compared to the same period of 2016, primarily because of a non-cash charge for the impairment of Applebee's goodwill and tradename.prior year. Our net income includingplus the non-cash reconciling items shown in the statementour statements of cash flows (primarily impairment charges,depreciation, deferred taxes and depreciation)stock-based compensation) increased $40.8 million from 2018. This change was $67.1primarily due to an increase in gross profit and a lower effective tax rate, each of which was discussed in preceding sections of the MD&A. Additionally, net changes in working capital used cash of $10.8 million forduring the ninesix months ended SeptemberJune 30, 20172019 compared to $98.1using cash of $13.6 million during the same period of 2016.the prior year. This favorable change of $2.8 million between years primarily resulted from a decrease in prepaid rent partially offset by an increase in payments for income taxes. The decreaseincrease of $31.1$43.5 million in cash provided by operating activities for the ninesix months ended SeptemberJune 30, 20172019 was primarily due to a declinethe favorability of $40.8 million in gross profit from franchise operationsnet income plus non-cash reconciling items and the increasefavorable change of $2.8 million in G&A expenses discussed in preceding sections of the MD&A.
Net changes incash used by working capital used cash of $36.1 million during the first nine months of 2017, unchanged from a use of cash of $36.1 million during the first nine months of 2016.changes.
Investing Activities
Investing activities provided net cash of $6.4$0.9 million for the ninesix months ended SeptemberJune 30, 2017.2019. Principal receipts from notes, equipment contracts and other long-term receivables of $15.3 million and proceeds from asset sales of $1.1$11.4 million were partially offset by $9.6$9.2 million in capital expenditures.expenditures and loans to franchisees of $1.6 million.
Financing Activities
Financing activities used net cash of $72.7$92.9 million for the ninesix months ended SeptemberJune 30, 2017. Cash2019. As discussed above, we received proceeds of $1.3 billion from issuance of our 2019 Class A-2 Notes that were used to repay $1.28 billion of our 2014 Class A-2 Notes and to pay $12.2 million for costs associated with issuance of the New Notes. Other cash used in financing activities primarily consisted of repayments of 2018-1 Class A-1 Notes of $25.0 million, cash dividends paid on our common stock totaling $52.3$23.3 million,, repurchases of our common stock totaling $10.0$46.4 million and repayments of capital lease obligations of $10.6$7.0 million. These financing outflows were partially offset bya net cash inflow of approximately $0.3$4.7 million related to equity compensation awards.awards.
Cash and Cash Equivalents
At SeptemberJune 30, 20172019, our cash and cash equivalents totaled $104.2$127.6 million,, including $36.3$49.4 million of cash held for gift card programs and advertising funds. Additionally, our franchisor subsidiaries held a total of approximately $29.3 million in cash at June 30, 2019, to maintain certain net worth requirements under state franchise disclosure laws.
Based on our current level of operations, we believe that our cash flow from operations, available cash and available borrowing capacity under our Variable Funding2019 Class A-2 Notes will be adequate to meet our liquidity needs for the next twelve months.
Adjusted Free Cash Flow
We define “adjusted free cash flow” for a given period as cash provided by operating activities, plus receipts from notes and equipment contract receivables, less additions to property and equipment. Management uses this liquidity measure in its periodic assessment of, among other things, cash dividends per share of common stock and repurchases of common stock and we believe it is important for investors to have the same measure used by management for that purpose. Adjusted free cash flow does not represent residual cash flow available for discretionary purposes.
Adjusted free cash flow is a non-U.S. GAAP measure. Reconciliation of the cash provided by operating activities to adjusted free cash flow is as follows:
|
| | | | | | | | | | | |
| | Nine months ended September 30, | | |
| | 2017 | | 2016 | | Variance |
| | (In millions) |
| Cash flows provided by operating activities | $ | 31.0 |
| | $ | 62.1 |
| | $ | (31.1 | ) |
| Receipts from notes and equipment contracts receivable | 8.0 |
| | 7.6 |
| | 0.4 |
|
| Additions to property and equipment | (9.6 | ) | | (3.5 | ) | | (6.1 | ) |
| Adjusted free cash flow | $ | 29.4 |
| | $ | 66.2 |
| | $ | (36.8 | ) |
This non-U.S. GAAP measure is not defined in the same manner by all companies and may not be comparable to other similarly titled measures of other companies. Non-U.S. GAAP measures should be considered in addition to, and not as a substitute for, the U.S. GAAP information contained within our financial statements. Reconciliation of the cash provided by operating activities to adjusted free cash flow is as follows:
|
| | | | | | | | | | | |
| | Six months ended June 30, | | |
| | 2019 | | 2018 | | Variance |
| | (In millions) |
| Cash flows provided by operating activities | $ | 69.3 |
| | $ | 25.8 |
| | $ | 43.5 |
|
| Receipts from notes and equipment contracts receivable | 5.9 |
| | 9.6 |
| | (3.7 | ) |
| Additions to property and equipment | (9.2 | ) | | (7.3 | ) | | (1.9 | ) |
| Adjusted free cash flow | $ | 66.0 |
| | $ | 28.1 |
| | $ | 37.9 |
|
The decreaseincrease in adjusted free cash flow for the ninesix months ended SeptemberJune 30, 20172019 compared to the same period of the prior year is primarily due to the decreaseincrease in cash from operating activities discussed above and an increase in capital expenditures. Capital expenditures are expected to be approximately $14 million for fiscal 2017.above.
Statement of Financial ConditionPosition
As discussed above underin Note 3 - Accounting Standards Adopted and Newly Issued Accounting Standards Not Yet Adopted, in the heading “Significant Known Events, Trends or Uncertainties Impacting or ExpectingNotes to Impact ComparisonsConsolidated Financial Statements, we adopted the guidance as codified in ASC 842 with respect to accounting for leases. We adopted this change in accounting principle using the modified retrospective method as of Reported or Future Results - Impairmentthe first day of Applebee's Goodwill and Tradename,” we performed an interim quantitative test for impairment of Applebee's goodwill and tradename during the thirdour first fiscal quarter of 20172019. Upon adoption of ASC 842, we recognized operating lease obligations of $453.0 million, which represented the present value of the remaining minimum lease payments, discounted using our incremental borrowing rate. We recognized operating lease right-of-use assets of $395.6 million and recordedalso recognized an adjustment to retained earnings upon adoption of $5.0 million, net of tax of $1.7 million, primarily related to an impairment resulting from an unfavorable differential between lease payments to goodwillbe made and sublease rentals to be received on certain leases. The remaining difference of $358.2$50.7 million between the recognized operating lease obligation and an impairment to the Applebee's tradename of $173.4 million. We recognized a deferred tax benefit of $65.1 millionright-of-use assets related to the $173.4 million impairmentderecognition of the Applebee's tradename. As a result of these items, our total assets, totalcertain liabilities and shareholders' equityassets that had been recorded in accordance with U.S. GAAP that had been applied prior to the adoption of ASC 842, primarily $43.3 million of accrued rent payments. Lease-related reserves for lease incentives, closed restaurants and unfavorable leaseholds were reduced by $531.6 million, $65.1 million and $467.5 million, respectively. Because these were non-cash transactions, there wasalso derecognized. The accounting for our existing finance (capital) leases upon adoption of ASC 842 remained substantially unchanged. Adoption of ASC 842 had no significant impact of the impairment on our consolidated cash flows.flows from operations or our results of operations.
Off-Balance Sheet Arrangements
We have obligations for guarantees on certain franchisee lease agreements, as disclosed in Note 1013 - Commitments and Contingencies, of Notes to Consolidated Financial Statements of Part I, Item 1 of this Form 10-Q. Other than such guarantees, we did not have any off-balance sheet arrangements, as defined in Item 303(a)(4) of SEC Regulation S-K as of SeptemberJune 30, 2017.2019.
Contractual Obligations and Commitments
There were no material changes to the contractual obligations table as disclosed in our Annual Report on Form 10-K for the year ended December 31, 2016.2018.
Critical Accounting Policies and Estimates
The preparation of financial statements in accordance with U.S. GAAP requires us to make estimates and assumptions affecting the reported amounts of assets and liabilities at the date of the financial statements and the reported amounts of net revenues and expenses in the reporting period. We base our estimates and assumptions on current facts, historical experience and various other factors that we believe to be reasonable under the circumstances, the results of which form the basis for making judgments about the carrying values of assets and liabilities and the accrual of costs and expenses that are not readily apparent from other sources. We continually review the estimates and underlying assumptions to ensure they are appropriate for the circumstances. Accounting assumptions and estimates are inherently uncertain and actual results may differ materially from our estimates.
A summary of our critical accounting estimates is included in Management’s Discussion and Analysis of Financial Condition and Results of Operations contained in our Annual Report on Form 10-K for the year ended December 31, 2016.2018. During the ninesix months ended SeptemberJune 30, 20172019, there were no significant changes in our estimates and critical accounting policies.
Seepolicies, other than our accounting policy for leases, which changed because of the adoption of ASC 842 as discussed in Note 3 “Accounting Policies,”- Accounting Standards Adopted and Newly Issued Accounting Standards Not Yet Adopted, in the Notes to Consolidated Financial Statements for a discussion of recently adopted accounting standards and newly issued accounting standards.Statements.
Item 3. Quantitative and Qualitative Disclosures about Market Risk.
There were no material changes from the information contained in the Company’s Annual Report on Form 10-K for the year ended December 31, 2016.2018.
Item 4. Controls and Procedures.
Disclosure Controls and Procedures.
The Company’s management, with the participation of the Company’s Chief Executive Officer and Chief Financial Officer, has evaluated the effectiveness of the Company’s disclosure controls and procedures (as such term is defined in Rules 13a-15(e) and 15d-15(e) under the Securities Exchange Act of 1934, as amended (the “Exchange Act”)) as of the end of the period covered by this report. Based on such evaluation, the Company’s Chief Executive Officer and Chief Financial Officer have concluded that, as of the end of such period, the Company’s disclosure controls and procedures are effective at the reasonable assurance level.
Changes in Internal Control Over Financial Reporting.
There have been no changes in the Company’s internal control over financial reporting (as such term is defined in Rules 13a-15(f) and 15d-15(f) under the Exchange Act) during the fiscal quarter to which this report relates that have materially affected, or are reasonably likely to materially affect, the Company’s internal control over financial reporting.
Part II. OTHER INFORMATION
Item 1. Legal Proceedings.
We are subject to various lawsuits, administrative proceedings, audits and claims arising in the ordinary course of business. Some of these lawsuits purport to be class actions and/or seek substantial damages. We are required to record an accrual for litigation loss contingencies that are both probable and reasonably estimable. Legal fees and expenses associated with the defense of all of our litigation are expensed as such fees and expenses are incurred. Management regularly assesses our insurance deductibles, analyzes litigation information with our attorneys and evaluates our loss experience in connection with pending legal proceedings. While we do not presently believe that any of the legal proceedings to which we are currently a party will ultimately have a material adverse impact on us, there can be no assurance that we will prevail in all the proceedings we are party to, or that we will not incur material losses from them.
Item 1A. Risk Factors.
There are no material changes from the risk factors set forth under Item 1A of Part I of the Company’s Annual Report on Form 10-K for the fiscal year ended December 31, 2016.2018.
Item 2. Unregistered Sales of Equity Securities and Use of Proceeds.
|
| | | | | | | | | | | | |
| Purchases of Equity Securities by the Company |
| Period | | Total number of shares purchased | | Average price paid per share | | Total number of shares purchased as part of publicly announced plans or programs (b) | | Approximate dollar value of shares that may yet be purchased under the plans or programs (b) |
| July 3, 2017 – July 30, 2017 | | — |
| | — | | — |
| | $ | 67,100,000 |
|
| July 31, 2017 – August 27, 2017 | | — |
| | — | | — |
| | $ | 67,100,000 |
|
August 28, 2017 – October 1, 2017(a) | | 598 |
| | $40.84 | | — |
| | $ | 67,100,000 |
|
| Total | | 598 |
| | $40.84 | | — |
| | $ | 67,100,000 |
|
|
| | | | | | | | | | | | | | |
| Purchases of Equity Securities by the Company |
| Period | | Total number of shares purchased | | Average price paid per share | | Total number of shares purchased as part of publicly announced plans or programs (b) | | Approximate dollar value of shares that may yet be purchased under the plans or programs (b) |
April 1, 2019 - April 28, 2019(a)
| | 118,077 |
| | $ | 90.80 |
| | 117,845 |
| | $ | 185,700,000 |
|
April 29, 2019 - May 26, 2019(a) | | 173,709 |
| | 87.82 |
| | 170,419 |
| | $ | 170,700,000 |
|
May 27, 2019 - June 30, 2019(a) | | 105,033 |
| | 93.21 |
| | 103,868 |
| | $ | 161,000,000 |
|
| | | 396,819 |
| | $ | 90.13 |
| | 392,132 |
| | $ | 161,000,000 |
|
(a) These amounts representinclude 232 shares owned and tendered by employees at an average price of $89.26 per share during the fiscal month ended April 28, 2019, 3,290 shares owned and tendered by employees at an average price of $88.46 per share during the fiscal month ended May 26, 2019 and 1,165 shares owned and tendered by employees at an average price of $96.79 per share during the fiscal month ended June 30, 2019, to satisfy tax withholding obligations arising upon vesting of restricted stock awards. Shares so surrendered by the participants are repurchased by us pursuant to the terms of the plan under which the shares were issued and the applicable individual award agreements and not pursuant to publicly announced repurchase authorizations.
(b) In October 2015, ourFebruary 2019, the Company’s Board of Directors approved a stock repurchase programthe 2019 Repurchase Program authorizing usthe Company to repurchase up to $150$200 million of DineEquitythe Company's common stock on an opportunistic basis from time to time in open market transactions and in privately negotiated transactions, including Rule 10b-5 stock repurchase plans, based on business, market, applicable legal requirements and other considerations.stock. The program2019 Repurchase Program, as approved by the Board of Directors, does not require the repurchase of a specific number of shares and can be terminated at any time.
Item 3. Defaults Upon Senior Securities.
None.
Item 4. Mine Safety Disclosures.
Not Applicable.
Item 5. Other Information.
None.
Item 6. Exhibits.
|
| | | |
| 3.1 |
| | |
| 3.2 |
| | |
| 3.3 |
| | |
| 4.1 |
| | Base Indenture, dated as of September 30, 2014, and amended and restated as of June 5, 2019, among Applebee’s Funding LLC and IHOP Funding LLC, each as Co-Issuer, and Citibank, N.A., as Trustee and Securities Intermediary (Exhibit 4.1 to Registrant's Form 8-K filed on December 18, 2012June 5, 2019 is incorporated herein by reference). |
3.24.2 |
| | Amended BylawsSeries 2019-1 Supplement to Base Indenture, dated as of DineEquity, Inc.June 5, 2019, among Applebee’s Funding LLC and IHOP Funding LLC, each as Co-Issuer, and Citibank, N.A., as Trustee and Securities Intermediary (Exhibit 3.24.2 to Registrant'sRegistrant’s Form 8-K filed on August 10, 2017June 5, 2019 is incorporated herein by reference). |
*†#10.110.1 |
| | |
*†#10.210.2 |
| | |
*†10.3 |
| | |
*†10.4 |
| | |
*†10.5 |
| | |
*†10.6 |
| | |
*†10.7 |
| | |
*†10.8 |
| | |
*†#10.310.9 |
| | |
*†10.10 |
| | |
*†10.11 |
| | |
*†10.12 |
| |
|
*†10.410.13 |
| | |
|
*12.1 |
| | |
*†10.14 |
| | |
| 10.15 |
| | Class A-1 Note Purchase Agreement, dated June 5, 2019, among Applebee’s Funding LLC and IHOP Funding LLC, each a Co-Issuer, certain special-purpose, wholly-owned indirect subsidiaries of Debt Service Coverage Ratio for the Trailing Twelve Months EndedRegistrant, each as a Guarantor, the Registrant, as manager, certain conduit investors, financial institutions and funding agents, Barclays Bank PLC as provider of letters credit and swingline lender and as administrative agent (Exhibit 10.1 to Registrant’s Form 8-K filed on June 5, 2019 is incorporated herein by reference). |
| 10.16 |
| | Guarantee and Collateral Agreement, dated September 30, 20172014, and Leverage Ratioamended and restated as of June 5, 2019, among certain special-purpose, wholly-owned indirect subsidiaries of the Registrant, each as guarantor, in favor of Citibank, N.A., as Trustee (Exhibit 10.2 to Registrant’s Form 8-K filed on June 5, 2019 is incorporated herein by reference). |
| 10.17 |
| | Management Agreement, dated September 30, 2014, and amended and restated as of September 30, 2017.5, 2018, and further amended and restated as of June 5, 2019, among Applebee’s Funding LLC and IHOP Funding LLC, each a Co-Issuer, other securitization entities party thereto from time to time, the Registrant, Applebee’s Services, Inc. and International House of Pancakes, LLC as Sub-managers and Citibank, N.A., as Trustee (Exhibit 10.3 to Registrant’s Form 8-K filed on June 5, 2019 is incorporated herein by reference). |
| *31.1 |
| | |
| *31.2 |
| | |
| *32.1 |
| | |
| *32.2 |
| | |
| 101.INS |
| | XBRL Instance Document.***Document - the instance document does not appear in the Interactive Data File because its XBRL tags are embedded within the Inline XBRL document. |
| 101.SCH |
| | XBRL Schema Document.*** |
| 101.CAL |
| | XBRL Calculation Linkbase Document.*** |
| 101.DEF |
| | XBRL Definition Linkbase Document.*** |
| 101.LAB |
| | XBRL Label Linkbase Document.*** |
| 101.PRE |
| | XBRL Presentation Linkbase Document.*** |
* Filed herewith.
| |
| ** | The certifications attached as Exhibits 32.1 and 32.2 accompany this Quarterly Report pursuant to Section 906 of the Sarbanes-Oxley Act of 2002 and shall not, except to the extent required by the Sarbanes-Oxley Act of 2002, be deemed filed by the Company for purposes of Section 18 of the Securities Exchange Act of 1934, as amended. |
| |
*** | Pursuant to Rule 406T of Regulation S-T, the interactive data files on Exhibit 101 hereto are deemed not filed or part of a registration statement or prospectus for purposes of Section 11 or 12 of the Securities Act of 1933, as amended, are deemed not filed for purposes of Section 18 of the Securities and Exchange Act of 1934, as amended, and otherwise are not subject to liability under those sections. |
| |
| † | A contract, compensatory plan or arrangement in which directors or executive officers are eligible to participate. |
| |
# | Portions of this exhibit have been omitted pending a determination by the Securities and Exchange Commission as to whether these portions should be granted confidential treatment. |
SIGNATURES
Pursuant to the requirements of the Securities Exchange Act of 1934, the registrant has duly caused this report to be signed on its behalf by the undersigned thereunto duly authorized.
|
| | | |
| | | DineEquity,Dine Brands Global, Inc.
(Registrant) | |
| | | | |
| | | | |
| Dated: | November 9, 201731st day of July, 2019 | By: | /s/ Stephen P. Joyce |
| | | | Stephen P. Joyce Chief Executive Officer (Principal Executive Officer) |
| | | | |
| | | |
| Dated: | November 9, 201731st day of July, 2019 | By: | /s/ GreggoryThomas H. KalvinSong |
| | | | GreggoryThomas H. KalvinSong
Interim Chief Financial Officer
Senior Vice President, Corporate Controller
(Principal Financial Officer and Principal Accounting Officer) |