UNITED STATES
SECURITIES AND EXCHANGE COMMISSION
Washington, D.C. 20549
__________________________________________________
FORM 10-Q
(Mark One)
x☒QUARTERLY REPORT PURSUANT TO SECTION 13 OR 15(d) OF THE SECURITIES EXCHANGE ACT OF 1934
For the quarterly period ended September 30, 2017March 31, 2021
OR
o☐TRANSITION REPORT PURSUANT TO SECTION 13 OR 15(d) OF THE SECURITIES EXCHANGE ACT OF 1934
For the transition period from to
Commission File Number 001-15283

DineEquity, Dine Brands Global, Inc.
(Exact name of registrant as specified in its charter) |
| | | | | | | | | | | | | |
Delaware | | | 95-3038279 |
| (State or other jurisdiction of incorporation or organization) | | 95-3038279
| (I.R.S. Employer Identification No.) |
| | |
450 North Brand Boulevard, | | | 91203-1903 |
Glendale, California | CA | | | |
| (Address of principal executive offices) | | 91203-1903
| (Zip Code) |
(818) 240-6055
| | | | | |
| (818) | 240-6055 |
| (Registrant’s telephone number, including area code) |
______________________________________________________________
Securities registered pursuant to Section 12(b) of the Act:
| | | | | | | | | | | |
| Title of each class | | Trading symbol(s) | Name of each exchange on which registered |
| Common Stock, $0.01 par value | | DIN | New York Stock Exchange |
Indicate by check mark whether the registrant (1) has filed all reports required to be filed by Section 13 or 15(d) of the Securities Exchange Act of 1934 during the preceding 12 months (or for such shorter period that the registrant was required to file such reports), and (2) has been subject to such filing requirements for the past 90 days. Yes x☒ No o☐
Indicate by check mark whether the registrant has submitted electronically and posted on its corporate Web site, if any, every Interactive Data File required to be submitted and posted pursuant to Rule 405 of Regulation S-T (§232.405 of this chapter) during the preceding 12 months (or for such shorter period that the registrant was required to submit and post such files). Yes x☒ No o☐
Indicate by check mark whether the registrant is a large accelerated filer, an accelerated filer, a non-accelerated filer, smaller reporting company or an emerging growth company. See definitions of “large accelerated filer,” “accelerated filer,” “smaller reporting company,” and “emerging growth company” in Rule 12b-2 of the Exchange Act.
| | | | | | | | | | | | | | |
| Large accelerated filer | ☒ | | Accelerated filer | ☐ |
| Non-accelerated filer | ☐ | | | |
| | |
Large accelerated filer x
| | Accelerated filer o
|
| | |
Non-accelerated filer o (Do not check if a smaller reporting company)
|
| | Smaller reporting company o | ☐ |
| | | Emerging growth companyo | ☐ |
If an emerging growth company, indicate by check mark if the registrant has elected not to use the extended transition period for complying with any new or revised financial accounting standards provided pursuant to Section 13(a) of the Exchange Act o☐
Indicate by check mark whether the registrant is a shell company (as defined in Rule 12b-2 of the Exchange Act). Yes o☐
No x
Indicate the number of shares outstanding of each of the issuer’s classes of common stock, as of the latest practicable date.☒
|
| | |
Class | | Outstanding as of November 3, 2017 |
Common Stock, $0.01 par value | | 17,988,168 |
As of April 28, 2021, the Registrant had 17,157,339 shares of Common Stock outstanding.
Dine Brands Global, Inc. and Subsidiaries
Index
Cautionary Statement Regarding Forward-Looking Statements
Statements contained in this reportQuarterly Report on Form 10-Q may constitute forward-looking statements“forward-looking statements” within the meaning of Section 27A of the Private Securities Litigation Reform Act of 1995.1933, as amended, and Section 21E of the Securities Exchange Act of 1934, as amended. These statements involve known and unknown risks, uncertainties and other factors, which may cause actual results to be materially different from those expressed or implied in such statements. You can identify these forward-looking statements by words such as “may,” “will,” “would,” “should,” “could,” “expect,” “anticipate,” “believe,” “estimate,” “intend,” “plan”“plan,” “goal” and other similar expressions. You should consider our forward-looking statements in light of the risks discussed under the heading “Risk Factors” in our most recent Annual Report on Form 10-K,Factors,” as well as our consolidated financial statements, related notes, and the other financial information appearing elsewhere in this report and our other filings with the United States Securities and Exchange Commission. The forward-looking statements contained in this report are made as of the date hereof and the Company assumes noDine Brands Global, Inc. does not intend to, nor does it assume any obligation to, update or supplement any forward-looking statements.statements after the date of this report to reflect actual results or future events or circumstances.
Factors that could cause actual results to differ materially from the projections, forecasts, estimates and expectations discussed in this Quarterly Report on Form 10-Q include, among other things: uncertainty regarding the duration and severity of the ongoing COVID-19 pandemic and its ultimate impact on our business; general economic conditions; our level of indebtedness; compliance with the terms of our securitized debt; our ability to refinance our current indebtedness or obtain additional financing; our dependence on information technology; potential cyber incidents; the implementation of restaurant development plans; our dependence on our franchisees; the concentration of our Applebee’s franchised restaurants in a limited number of franchisees; the financial health of our franchisees, including any insolvency or bankruptcy; credit risks from our IHOP franchisees operating under our previous IHOP business model in which we built and equipped IHOP restaurants and then franchised them to franchisees; insufficient insurance coverage to cover potential risks associated with the ownership and operation of restaurants; our franchisees’ and other licensees’ compliance with our quality standards and trademark usage; general risks associated with the restaurant industry; potential harm to our brands’ reputation; risks of food-borne illness or food tampering; possible future impairment charges; trading volatility and fluctuations in the price of our stock; our ability to achieve the financial guidance we provide to investors; successful implementation of our business strategy; the availability of suitable locations for new restaurants; shortages or interruptions in the supply or delivery of products from third parties or availability of utilities; the management and forecasting of appropriate inventory levels; development and implementation of innovative
marketing and use of social media; changing health or dietary preference of consumers; risks associated with doing business in international markets; the results of litigation and other legal proceedings; third-party claims with respect to intellectual property assets; delivery initiatives and use of third-party delivery vendors; our allocation of human capital and our ability to attract and retain management and other key employees; compliance with federal, state and local governmental regulations; risks associated with our self-insurance; natural disasters or other serious incidents; our success with development initiatives outside of our core business; the adequacy of our internal controls over financial reporting and future changes in accounting standards; and other matters in the “Risk Factors” section of this report and our Annual Report on Form 10-K for the fiscal year ended December 31, 2020 and in our other filings with the Securities and Exchange Commission, many of which are beyond our control.
Fiscal Quarter End
The Company’s fiscal quarters end on the Sunday closest to the last day of each calendar quarter. For convenience, the fiscal quarters of each year are referred to as ending on March 31, June 30, September 30 and December 31. The first fiscal quarter of 20172021 began on January 2, 20174, 2021 and ended on April 2, 2017 and the second and third fiscal quarters of 2017 ended on July 2, 2017 and October 1, 2017, respectively.4, 2021. The first fiscal quarter of 20162020 began on January 4, 2016December 30, 2019 and ended on April 3, 2016 and the second and third fiscal quartersMarch 29, 2020.
PART I. FINANCIAL INFORMATION
Item 1. Financial Statements.
DineEquity,Dine Brands Global, Inc. and Subsidiaries
Consolidated Balance Sheets
(In thousands, except share and per share amounts) |
| | | | | | | | |
| Assets | | September 30, 2017 | | December 31, 2016 |
| | | (Unaudited) | | |
| Current assets: | | |
| | |
|
| Cash and cash equivalents | | $ | 104,212 |
| | $ | 140,535 |
|
| Receivables, net | | 96,657 |
| | 141,389 |
|
| Restricted cash | | 31,338 |
| | 30,256 |
|
| Prepaid gift card costs | | 36,667 |
| | 47,115 |
|
| Prepaid income taxes | | 8,749 |
| | 2,483 |
|
| Other current assets | | 5,703 |
| | 4,370 |
|
| Total current assets | | 283,326 |
| | 366,148 |
|
| Long-term receivables, net | | 131,033 |
| | 141,152 |
|
| Property and equipment, net | | 199,857 |
| | 205,055 |
|
| Goodwill | | 339,236 |
| | 697,470 |
|
| Other intangible assets, net | | 585,160 |
| | 763,431 |
|
| Deferred rent receivable | | 84,071 |
| | 86,981 |
|
| Non-current restricted cash | | 14,700 |
| | 14,700 |
|
| Other non-current assets, net | | 3,825 |
| | 3,646 |
|
| Total assets | | $ | 1,641,208 |
| | $ | 2,278,583 |
|
| Liabilities and Stockholders’ (Deficit) Equity | | |
| | |
|
| Current liabilities: | | |
| | |
|
| Accounts payable | | $ | 26,452 |
| | $ | 50,503 |
|
| Gift card liability | | 104,317 |
| | 170,812 |
|
| Dividends payable | | 17,755 |
| | 17,465 |
|
| Accrued employee compensation and benefits | | 13,527 |
| | 14,609 |
|
| Current maturities of long-term debt, capital lease and financing obligations | | 16,202 |
| | 13,144 |
|
| Accrued advertising | | 8,359 |
| | 6,369 |
|
| Other accrued expenses | | 16,775 |
| | 13,410 |
|
| Total current liabilities | | 203,387 |
| | 286,312 |
|
| Long-term debt, less current maturities | | 1,281,950 |
| | 1,282,691 |
|
| Capital lease obligations, less current maturities | | 64,923 |
| | 74,665 |
|
| Financing obligations, less current maturities | | 39,292 |
| | 39,499 |
|
| Deferred income taxes, net | | 178,848 |
| | 253,898 |
|
| Deferred rent payable | | 65,449 |
| | 69,572 |
|
| Other non-current liabilities | | 24,036 |
| | 19,174 |
|
| Total liabilities | | 1,857,885 |
| | 2,025,811 |
|
| Commitments and contingencies | |
|
| |
|
|
| Stockholders’ (deficit) equity: | | |
| | |
|
| Common stock, $0.01 par value, shares: 40,000,000 authorized; September 30, 2017 - 25,033,220 issued, 17,996,223 outstanding; December 31, 2016 - 25,134,223 issued, 17,969,636 outstanding | | 250 |
| | 251 |
|
| Additional paid-in-capital | | 292,255 |
| | 292,809 |
|
| (Accumulated deficit) retained earnings | | (86,634 | ) | | 382,082 |
|
| Accumulated other comprehensive loss | | (105 | ) | | (107 | ) |
| Treasury stock, at cost; shares: September 30, 2017 - 7,036,997; December 31, 2016 - 7,164,587 | | (422,443 | ) | | (422,263 | ) |
| Total stockholders’ (deficit) equity | | (216,677 | ) | | 252,772 |
|
| Total liabilities and stockholders’ (deficit) equity | | $ | 1,641,208 |
| | $ | 2,278,583 |
|
| | | | | | | | | | | | | | |
| Assets | | | | |
| | March 31, 2021 | | December 31, 2020 |
| | | (Unaudited) | | |
| Current assets: | | | | |
| Cash and cash equivalents | | $ | 179,567 | | | $ | 383,369 | |
| | | | |
| | | | |
| Receivables, net of allowance of $11,854 (2021) and $15,057 (2020) | | 107,387 | | | 121,897 | |
| Restricted cash | | 60,063 | | | 39,884 | |
| Prepaid gift card costs | | 22,581 | | | 29,080 | |
| Prepaid income taxes | | 6,940 | | | 6,178 | |
| Other current assets | | 9,171 | | | 6,098 | |
| Total current assets | | 385,709 | | | 586,506 | |
| Other intangible assets, net | | 547,098 | | | 549,671 | |
| Operating lease right-of-use assets | | 338,572 | | | 346,086 | |
| Goodwill | | 251,628 | | | 251,628 | |
| Property and equipment, net | | 182,661 | | | 187,977 | |
| | | | |
| | | | |
| Long-term receivables, net of allowance of $6,455 (2021) and $7,999 (2020) | | 51,605 | | | 54,512 | |
| Deferred rent receivable | | 54,713 | | | 56,449 | |
| Non-current restricted cash | | 32,800 | | | 32,800 | |
| Other non-current assets, net | | 11,503 | | | 9,316 | |
| Total assets | | $ | 1,856,289 | | | $ | 2,074,945 | |
| Liabilities and Stockholders’ Deficit | | | | |
| Current liabilities: | | | | |
| Current maturities of long-term debt | | $ | 13,000 | | | $ | 13,000 | |
| Accounts payable | | 33,522 | | | 37,424 | |
| Gift card liability | | 121,814 | | | 144,159 | |
| Current maturities of operating lease obligations | | 70,270 | | | 69,672 | |
| Current maturities of finance lease and financing obligations | | 11,052 | | | 11,293 | |
| Accrued employee compensation and benefits | | 14,554 | | | 21,237 | |
| | | | |
| | | | |
| | | | |
| | | | |
| Deferred franchise revenue, short-term | | 8,990 | | | 7,682 | |
| Accrued advertising | | 44,477 | | | 21,641 | |
| Other accrued expenses | | 17,417 | | | 22,460 | |
| Total current liabilities | | 335,096 | | | 348,568 | |
| Long-term debt | | 1,271,438 | | | 1,491,996 | |
| Operating lease obligations, less current maturities | | 334,361 | | | 345,163 | |
| Finance lease obligations, less current maturities | | 66,234 | | | 69,012 | |
| Financing obligations, less current maturities | | 32,598 | | | 32,797 | |
| Deferred income taxes, net | | 70,006 | | | 78,293 | |
| Deferred franchise revenue, long-term | | 49,364 | | | 52,237 | |
| | | | |
| Other non-current liabilities | | 14,594 | | | 11,530 | |
| Total liabilities | | 2,173,691 | | | 2,429,596 | |
| Commitments and contingencies | | 0 | | 0 |
| Stockholders’ deficit: | | | | |
| Preferred stock, $1 par value, 10,000,000 shares authorized; 0 shares issued or outstanding | | 0 | | | 0 | |
| Common stock, $0.01 par value; shares: 40,000,000 authorized; March 31, 2021 - 25,033,181 issued, 17,142,367 outstanding; December 31, 2020 - 24,882,122 issued, 16,452,174 outstanding | | 250 | | | 249 | |
| Additional paid-in-capital | | 247,498 | | | 257,625 | |
| Accumulated deficit | | (29,950) | | | (55,553) | |
| Accumulated other comprehensive loss | | (56) | | | (55) | |
| Treasury stock, at cost; shares: March 31, 2021 - 7,890,814; December 31, 2020 - 8,429,948 | | (535,144) | | | (556,917) | |
| Total stockholders’ deficit | | (317,402) | | | (354,651) | |
| Total liabilities and stockholders’ deficit | | $ | 1,856,289 | | | $ | 2,074,945 | |
See the accompanying Notes to Consolidated Financial Statements.
DineEquity,
Dine Brands Global, Inc. and Subsidiaries
Consolidated Statements of Comprehensive (Loss) Income
(In thousands, except per share amounts)
(Unaudited)
|
| | | | | | | | | | | | | | | | |
| | | Three Months Ended | | Nine Months Ended |
| | | September 30, | | September 30, |
| | | 2017 | | 2016 | | 2017 | | 2016 |
| Revenues: | | |
| | |
| | | | |
| Franchise and restaurant revenues | | $ | 112,347 |
| | $ | 123,259 |
| | $ | 358,912 |
| | $ | 380,034 |
|
| Rental revenues | | 30,263 |
| | 30,507 |
| | 90,852 |
| | 92,746 |
|
| Financing revenues | | 2,061 |
| | 2,251 |
| | 6,280 |
| | 7,019 |
|
| Total revenues | | 144,671 |
| | 156,017 |
| | 456,044 |
| | 479,799 |
|
| Cost of revenues: | | |
| | |
| | | | |
| Franchise and restaurant expenses | | 41,800 |
| | 41,553 |
| | 123,476 |
| | 122,129 |
|
| Rental expenses | | 22,318 |
| | 22,771 |
| | 67,665 |
| | 69,032 |
|
| Financing expenses | | 449 |
| | 9 |
| | 449 |
| | 155 |
|
| Total cost of revenues | | 64,567 |
| | 64,333 |
| | 191,590 |
| | 191,316 |
|
| Gross profit | | 80,104 |
| | 91,684 |
| | 264,454 |
| | 288,483 |
|
| General and administrative expenses | | 38,030 |
| | 36,002 |
| | 125,701 |
| | 111,937 |
|
| Impairment and closure charges | | 532,522 |
| | 206 |
| | 535,440 |
| | 3,932 |
|
| Interest expense | | 15,353 |
| | 15,358 |
| | 46,496 |
| | 46,107 |
|
| Amortization of intangible assets | | 2,507 |
| | 2,500 |
| | 7,507 |
| | 7,480 |
|
| (Gain) loss on disposition of assets | | (35 | ) | | 113 |
| | (6,387 | ) | | 679 |
|
| (Loss) income before income tax benefit (provision) | | (508,273 | ) | | 37,505 |
| | (444,303 | ) | | 118,348 |
|
| Income tax benefit (provision) | | 56,555 |
| | (13,232 | ) | | 28,228 |
| | (41,703 | ) |
| Net (loss) income | | (451,718 | ) | | 24,273 |
| | (416,075 | ) | | 76,645 |
|
| Other comprehensive (loss) income, net of tax: | | | | | | | | |
| Foreign currency translation adjustment | | (2 | ) | | (1 | ) | | (2 | ) | | — |
|
| Total comprehensive (loss) income | | $ | (451,720 | ) | | $ | 24,272 |
| | $ | (416,077 | ) | | $ | 76,645 |
|
| Net (loss) income available to common stockholders: | | | | |
| | | | |
| Net (loss) income | | $ | (451,718 | ) | | $ | 24,273 |
| | $ | (416,075 | ) | | $ | 76,645 |
|
| Less: Net loss (income) allocated to unvested participating restricted stock | | 8,496 |
| | (338 | ) | | 6,921 |
| | (1,103 | ) |
| Net (loss) income available to common stockholders | | $ | (443,222 | ) | | $ | 23,935 |
| | $ | (409,154 | ) | | $ | 75,542 |
|
| Net (loss) income available to common stockholders per share: | | |
| | |
| | | | |
| Basic | | $ | (24.98 | ) | | $ | 1.33 |
| | $ | (23.09 | ) | | $ | 4.17 |
|
| Diluted | | $ | (24.98 | ) | | $ | 1.33 |
| | $ | (23.09 | ) | | $ | 4.15 |
|
| Weighted average shares outstanding: | | |
| | |
| | | | |
| Basic | | 17,742 |
| | 17,950 |
| | 17,718 |
| | 18,099 |
|
| Diluted | | 17,742 |
| | 18,041 |
| | 17,718 |
| | 18,201 |
|
| | | | | | | | | |
| Dividends declared per common share | | $ | 0.97 |
| | $ | 0.92 |
| | $ | 2.91 |
| | $ | 2.76 |
|
| Dividends paid per common share | | $ | 0.97 |
| | $ | 0.92 |
| | $ | 2.91 |
| | $ | 2.76 |
|
| | | | | | | | | | | | | | | | | | |
| | | | | Three Months Ended |
| | | | March 31, 2021 |
| | | | | | | 2021 | | 2020 |
| Revenues: | | | | | | | | |
| Franchise revenues: | | | | | | | | |
| Royalties, franchise fees and other | | | | | | $ | 80,091 | | | $ | 83,314 | |
| Advertising revenues | | | | | | 60,885 | | | 61,723 | |
| Total franchise revenues | | | | | | 140,976 | | | 145,037 | |
| Company restaurant sales | | | | | | 35,949 | | | 31,300 | |
| Rental revenues | | | | | | 26,142 | | | 29,009 | |
| Financing revenues | | | | | | 1,132 | | | 1,538 | |
| Total revenues | | | | | | 204,199 | | | 206,884 | |
| Cost of revenues: | | | | | | | | |
| Franchise expenses: | | | | | | | | |
| Advertising expenses | | | | | | 60,885 | | | 61,723 | |
| Bad debt (credit) expense | | | | | | (1,993) | | | 518 | |
| Other franchise expenses | | | | | | 6,051 | | | 7,209 | |
| Total franchise expenses | | | | | | 64,943 | | | 69,450 | |
| Company restaurant expenses | | | | | | 32,884 | | | 30,332 | |
| Rental expenses: | | | | | | | | |
| Interest expense from finance leases | | | | | | 962 | | | 1,210 | |
| Other rental expenses | | | | | | 19,996 | | | 21,323 | |
| Total rental expenses | | | | | | 20,958 | | | 22,533 | |
| Financing expenses | | | | | | 128 | | | 142 | |
| Total cost of revenues | | | | | | 118,913 | | | 122,457 | |
| Gross profit | | | | | | 85,286 | | | 84,427 | |
| General and administrative expenses | | | | | | 39,911 | | | 37,608 | |
| Interest expense, net | | | | | | 16,496 | | | 15,172 | |
| Closure and impairment charges (credit) | | | | | | 2,010 | | | (12) | |
| Amortization of intangible assets | | | | | | 2,688 | | | 2,826 | |
| | | | | | | | |
| | | | | | | | |
| Loss (gain) on disposition of assets | | | | | | 167 | | | (233) | |
| Income before income taxes | | | | | | 24,014 | | | 29,066 | |
| Income tax benefit (provision) | | | | | | 1,589 | | | (6,738) | |
| Net income | | | | | | 25,603 | | | 22,328 | |
| Other comprehensive income net of tax: | | | | | | | | |
| | | | | | | | |
| Foreign currency translation adjustment | | | | | | (1) | | | 0 | |
| Total comprehensive income | | | | | | $ | 25,602 | | | $ | 22,328 | |
| Net income available to common stockholders: | | | | | | | | |
| Net income | | | | | | $ | 25,603 | | | $ | 22,328 | |
| Less: Net income allocated to unvested participating restricted stock | | | | | | (548) | | | (748) | |
| Net income available to common stockholders | | | | | | $ | 25,055 | | | $ | 21,580 | |
| | | | | | | | |
| Net income available to common stockholders per share: | | | | | | | | |
| Basic | | | | | | $ | 1.52 | | | $ | 1.33 | |
| Diluted | | | | | | $ | 1.51 | | | $ | 1.31 | |
| Weighted average shares outstanding: | | | | | | | | |
| Basic | | | | | | 16,460 | | | 16,263 | |
| Diluted | | | | | | 16,630 | | | 16,470 | |
| | | | | | | | |
| | | | | | | | |
| | | | | | | | |
See the accompanying Notes to Consolidated Financial Statements.
Dine Brands Global, Inc. and Subsidiaries
Consolidated Statements of Stockholders' Deficit
(In thousands)
(Unaudited)
| | | | | | | | | | | | | | | | | | | | | | | | | | | | | | | | | | | | | | | | | | | | | | | | | | |
| | Three Months ended March 31, 2020 |
| | Common Stock | | | | | | Accumulated
Other
Comprehensive
Loss | | Treasury Stock | | |
| | Shares
Outstanding | | Amount | | Additional
Paid-in
Capital | | Retained Earnings | | Shares | | Cost | | Total |
| Balance at December 31, 2019 | | 16,522 | | | $ | 249 | | | $ | 246,192 | | | $ | 61,653 | | | $ | (58) | | | 8,404 | | | $ | (549,810) | | | $ | (241,774) | |
| Adoption of credit loss accounting guidance | | — | | | — | | | — | | | (497) | | | — | | | — | | | — | | | (497) | |
| Net income | | — | | | — | | | — | | | 22,328 | | | — | | | — | | | — | | | 22,328 | |
| | | | | | | | | | | | | | | | |
| Purchase of Company common stock | | (460) | | | — | | | — | | | — | | | — | | | 460 | | | (26,527) | | | (26,527) | |
| Reissuance of treasury stock | | 367 | | | — | | | 3,967 | | | — | | | — | | | (368) | | | 16,557 | | | 20,524 | |
| Net issuance of shares for stock plans | | 18 | | | — | | | — | | | — | | | — | | | — | | | — | | | — | |
| Repurchase of restricted shares for taxes | | (26) | | | — | | | (2,000) | | | — | | | — | | | — | | | — | | | (2,000) | |
| Stock-based compensation | | — | | | — | | | 4,038 | | | — | | | — | | | — | | | — | | | 4,038 | |
| Dividends on common stock | | — | | | — | | | 246 | | | (12,715) | | | — | | | — | | | — | | | (12,469) | |
| | | | | | | | | | | | | | | | |
| Balance at March 31, 2020 | | 16,421 | | | $ | 249 | | | $ | 252,443 | | | $ | 70,769 | | | $ | (58) | | | 8,496 | | | $ | (559,780) | | | $ | (236,377) | |
| | | | | | | | | | | | | | | | | | | | | | | | | | | | | | | | | | | | | | | | | | | | | | | | | | |
| | Three Months ended March 31, 2021 |
| | | Common Stock | | | | | | Accumulated
Other
Comprehensive
Loss | | Treasury Stock | | |
| | | Shares
Outstanding | | Amount | | Additional
Paid-in
Capital | | Retained Earnings (Accumulated Deficit) | | Shares | | Cost | | Total |
| Balance at December 31, 2020 | | 16,452 | | | $ | 249 | | | $ | 257,625 | | | $ | (55,553) | | | $ | (55) | | | 8,430 | | | $ | (556,917) | | | $ | (354,651) | |
| Net income | | — | | | — | | | — | | | 25,603 | | | — | | | — | | | — | | | 25,603 | |
| Other comprehensive loss | | — | | | — | | | — | | | — | | | (1) | | | — | | | — | | | (1) | |
| | | | | | | | | | | | | | | | |
| Reissuance of treasury stock | | 539 | | | 1 | | | (2,290) | | | — | | | — | | | (539) | | | 21,773 | | | 19,484 | |
| Net issuance of shares for stock plans | | 166 | | | — | | | — | | | — | | | — | | | — | | | — | | | — | |
| Repurchase of restricted shares for taxes | | (15) | | | — | | | (1,220) | | | — | | | — | | | — | | | — | | | (1,220) | |
| Stock-based compensation | | — | | | — | | | 3,094 | | | — | | | — | | | — | | | — | | | 3,094 | |
| | | | | | | | | | | | | | | | |
| Tax withheld related to settlement of restricted stock units | | — | | | — | | | (9,711) | | | — | | | — | | | — | | | — | | | (9,711) | |
| Balance at March 31, 2021 | | 17,142 | | | $ | 250 | | | $ | 247,498 | | | $ | (29,950) | | | $ | (56) | | | 7,891 | | | $ | (535,144) | | | $ | (317,402) | |
See the accompanying Notes to Consolidated Financial Statements.
Dine Brands Global, Inc. and Subsidiaries
Consolidated Statements of Cash Flows
(In thousands)
| | | | | Nine Months Ended | | Three Months Ended |
| | | September 30, | | | March 31, |
| | | 2017 | | 2016 | | | 2021 | | 2020 |
| Cash flows from operating activities: | | |
| | |
| Cash flows from operating activities: | | | | |
| Net (loss) income | | $ | (416,075 | ) | | $ | 76,645 |
| |
| Adjustments to reconcile net (loss) income to cash flows provided by operating activities: | | |
| | |
| |
| Impairment and closure charges | | 535,306 |
| | 1,461 |
| |
| Net income | | Net income | | $ | 25,603 | | | $ | 22,328 | |
| Adjustments to reconcile net income to cash flows provided by operating activities: | | Adjustments to reconcile net income to cash flows provided by operating activities: | | |
| Non-cash closure and impairment charges (credit) | | Non-cash closure and impairment charges (credit) | | 1,959 | | | (12) | |
| Depreciation and amortization | | 23,053 |
| | 22,924 |
| Depreciation and amortization | | 9,995 | | | 10,641 | |
| Non-cash stock-based compensation expense | | Non-cash stock-based compensation expense | | 3,094 | | | 4,038 | |
| Non-cash interest expense | | 2,509 |
| | 2,400 |
| Non-cash interest expense | | 712 | | | 655 | |
| | Deferred income taxes | | (77,345 | ) | | (14,852 | ) | Deferred income taxes | | (8,267) | | | (10,491) | |
| Non-cash stock-based compensation expense | | 8,826 |
| | 8,215 |
| |
| Tax benefit from stock-based compensation | | — |
| | 1,153 |
| |
| Excess tax benefit from stock-based compensation | | — |
| | (966 | ) | |
| (Gain) loss on disposition of assets | | (6,422 | ) | | 679 |
| |
| Deferred revenue | | Deferred revenue | | (1,565) | | | (1,417) | |
| | Loss (gain) on disposition of assets | | Loss (gain) on disposition of assets | | 167 | | | (227) | |
| | Other | | (2,791 | ) | | 456 |
| Other | | (1,580) | | | (1,293) | |
| Changes in operating assets and liabilities: | | |
| | |
| Changes in operating assets and liabilities: | | |
| Accounts receivable, net | | (1,569 | ) | | 4,312 |
| Accounts receivable, net | | (4,323) | | | 12,077 | |
| Current income tax receivables and payables | | (1,699 | ) | | (1,138 | ) | Current income tax receivables and payables | | (552) | | | 6,443 | |
| Gift card receivables and payables | | (26,387 | ) | | (30,355 | ) | Gift card receivables and payables | | (3,246) | | | 11,693 | |
| Other current assets | | (1,336 | ) | | (824 | ) | Other current assets | | (3,072) | | | (2,347) | |
| Accounts payable | | (7,530 | ) | | (1,397 | ) | Accounts payable | | 809 | | | (12,748) | |
| Accrued employee compensation and benefits | | (1,146 | ) | | (9,293 | ) | Accrued employee compensation and benefits | | (6,968) | | | (12,190) | |
| | Accrued advertising | | Accrued advertising | | 22,836 | | | (4,719) | |
| Other current liabilities | | 3,606 |
| | 2,638 |
| Other current liabilities | | (5,037) | | | 7,214 | |
| Cash flows provided by operating activities | | 31,000 |
| | 62,058 |
| Cash flows provided by operating activities | | 30,565 | | | 29,645 | |
| Cash flows from investing activities: | | |
| | |
| Cash flows from investing activities: | | | | |
| Additions to property and equipment | | (9,608 | ) | | (3,543 | ) | |
| Principal receipts from notes, equipment contracts and other long-term receivables | | Principal receipts from notes, equipment contracts and other long-term receivables | | 4,651 | | | 5,544 | |
| Net additions to property and equipment | | Net additions to property and equipment | | (2,357) | | | (5,084) | |
| Proceeds from sale of property and equipment | | 1,100 |
| | — |
| Proceeds from sale of property and equipment | | 946 | | | 6 | |
| Principal receipts from notes, equipment contracts and other long-term receivables | | 15,283 |
| | 13,969 |
| |
| Additions to long-term receivables | | Additions to long-term receivables | | 0 | | | (1,511) | |
| Other | | (356 | ) | | (393 | ) | Other | | (110) | | | (195) | |
| Cash flows provided by investing activities | | 6,419 |
| | 10,033 |
| |
| Cash flows provided by (used in) investing activities | | Cash flows provided by (used in) investing activities | | 3,130 | | | (1,240) | |
| Cash flows from financing activities: | | | | |
| Cash flows from financing activities: | | | | |
| | Repayment of long-term debt | | Repayment of long-term debt | | (3,250) | | | 0 | |
| Borrowing from revolving credit facility | | Borrowing from revolving credit facility | | 0 | | | 220,000 | |
| Repayment of revolving credit facility | | Repayment of revolving credit facility | | (220,000) | | | 0 | |
| | Dividends paid on common stock | | (52,326 | ) | | (50,790 | ) | Dividends paid on common stock | | 0 | | | (11,451) | |
| Repurchase of common stock | | (10,003 | ) | | (45,010 | ) | Repurchase of common stock | | 0 | | | (29,853) | |
| Principal payments on capital lease and financing obligations | | (10,621 | ) | | (10,391 | ) | |
| Principal payments on finance lease obligations | | Principal payments on finance lease obligations | | (2,621) | | | (2,981) | |
| Proceeds from stock options exercised | | Proceeds from stock options exercised | | 19,484 | | | 20,524 | |
| Tax payments for restricted stock upon vesting | | (2,345 | ) | | (2,680 | ) | Tax payments for restricted stock upon vesting | | (1,220) | | | (2,000) | |
| Proceeds from stock options exercised | | 2,635 |
| | 1,282 |
| |
| Excess tax benefit from stock-based compensation | | — |
| | 966 |
| |
| Cash flows used in financing activities | | (72,660 | ) | | (106,623 | ) | |
| Tax payments for share settlement of restricted stock units | | Tax payments for share settlement of restricted stock units | | (9,711) | | | 0 | |
| Cash flows (used in) provided by financing activities | | Cash flows (used in) provided by financing activities | | (217,318) | | | 194,239 | |
| Net change in cash, cash equivalents and restricted cash | | (35,241 | ) | | (34,532 | ) | Net change in cash, cash equivalents and restricted cash | | (183,623) | | | 222,644 | |
| Cash, cash equivalents and restricted cash at beginning of period | | 185,491 |
| | 192,013 |
| Cash, cash equivalents and restricted cash at beginning of period | | 456,053 | | | 172,475 | |
| Cash, cash equivalents and restricted cash at end of period | | $ | 150,250 |
| | $ | 157,481 |
| Cash, cash equivalents and restricted cash at end of period | | $ | 272,430 | | | $ | 395,119 | |
| Supplemental disclosures: | | |
| | |
| Supplemental disclosures: | | | | |
| Interest paid in cash | | $ | 50,808 |
| | $ | 51,940 |
| Interest paid in cash | | $ | 17,240 | | | $ | 16,446 | |
| Income taxes paid in cash | | $ | 50,813 |
| | $ | 56,734 |
| Income taxes paid in cash | | $ | 7,441 | | | $ | 10,818 | |
| Non-cash conversion of accounts receivable to notes receivable | | Non-cash conversion of accounts receivable to notes receivable | | $ | 1,269 | | | $ | 0 | |
|
See the accompanying Notes to Consolidated Financial Statements.
DineEquity,
Dine Brands Global, Inc. and Subsidiaries
Notes to Consolidated Financial Statements
(Unaudited)
1. General
The accompanying unaudited consolidated financial statements of DineEquity,Dine Brands Global, Inc. (the “Company” or “DineEquity”“Dine Brands Global”) have been prepared in accordance with United States generally accepted accounting principles (“U.S. GAAP”) for interim financial information and with the instructions to Form 10-Q and Article 10 of Regulation S-X. Accordingly, they do not include all of the information and footnotes required by U.S. GAAP for complete financial statements. In the opinion of management, all adjustments (consisting of normal recurring accruals) considered necessary for a fair presentation have been included. The operating results for the ninethree months ended September 30, 2017March 31, 2021 are not necessarily indicative of the results that may be expected for the twelve months ending December 31, 2017.2021.
The consolidated balance sheet at December 31, 20162020 has been derived from the audited consolidated financial statements at that date but does not include all of the information and footnotes required by U.S. GAAP for complete financial statements.
These consolidated financial statements should be read in conjunction with the consolidated financial statements and footnotes thereto included in the Company’s Annual Report on Form 10-K for the year ended December 31, 2016.2020.
2. Basis of Presentation
The Company’s fiscal quarters end on the Sunday closest to the last day of each calendar quarter. For convenience, the fiscal quarters of each year are referred to as ending on March 31, June 30, September 30 and December 31. The first fiscal quarter of 20172021 began on January 2, 20174, 2021 and ended on April 2, 2017 and the second and third fiscal quarters of 2017 ended on July 2, 2017 and October 1, 2017, respectively.4, 2021. The first fiscal quarter of 20162020 began on January 4, 2016December 30, 2019 and ended on April 3, 2016 and the second and third fiscal quarters of 2016 ended on July 3, 2016 and October 2, 2016, respectively.March 29, 2020.
The accompanying consolidated financial statements include the accounts of the Company and its subsidiaries that are consolidated in accordance with U.S. GAAP. All intercompany balances and transactions have been eliminated.
The preparation of financial statements in conformity with U.S. GAAP requires the Company’s management to make assumptions and estimates that affect the reported amounts of assets and liabilities, disclosures of contingent assets and liabilities, if any, at the date of the consolidated financial statements, and the reported amounts of revenues and expenses during the reporting period. Significant estimates are made inmay include the calculation and assessment of the following: impairment of goodwill, other intangible assets and tangible assets; income taxes; allowance for doubtfulcredit losses on accounts and notes receivables; lease accounting estimates; contingencies; and stock-based compensation. On an ongoing basis, the Company evaluates its estimates based on historical experience, current conditions and various other assumptions that are believed to be reasonable under the circumstances. The Company adjusts such estimates and assumptions when facts and circumstances dictate. Actual results could differ from those estimates.
Risks and Uncertainties
The Company was subject to risks and uncertainties as a result of the continuing outbreak of a novel strain of coronavirus, designated “COVID-19.” The extent of the continued impact of the COVID-19 pandemic on the Company's business is highly uncertain and difficult to predict, as measures taken in response to and the effect of the pandemic has varied and continues to vary by state and municipalities within states. Assessments of the success of measures taken and the timing of any further restrictions, or lifting of such restrictions, is rapidly evolving. The Company first began to experience impacts from COVID-19 in March 2020, as federal, state, local and international governments began to react to the public health crisis by encouraging “social distancing” and requiring, in varying degrees, restaurant dine-in limitations and other restrictions that largely limited the restaurants of the Company's franchisees and its company-operated restaurants to take-out and delivery sales. Subsequently, government-imposed dine-in restrictions have been relaxed in many of the locations in which the Company operates as incidents of infection decline within the respective governmental jurisdictions, although dining room capacity continues to be limited to 50% or less at over two-thirds of the Company's restaurants as of March 31, 2021.
Dine Brands Global, Inc. and Subsidiaries
Notes to Consolidated Financial Statements (Continued)
2. Basis of Presentation (Continued)
The Company took several actions to mitigate the effects of the COVID-19 pandemic on its operations and its franchisees, as follows: (i) drew down $220 million from its revolving credit facility in March 2020 and repaid the borrowing in March 2021;(ii) suspended repurchases of common stock; (iii) the Company's Board of Directors has not declared dividends after the first quarter of 2020; (iv) voluntarily increased the interest reserve for securitized debt from the required $16.4 million (approximately one quarter of estimated interest) to $32.8 million; (v) deferred franchisee payment of royalty, advertising and other fees, and lease obligations for up to two months on a case-by-case basis; (vi) deferred franchisee remodel and development obligations for up to 15 months; and (vii) negotiated deferrals and abatements for properties on which the Company was lessee.
The severity of the continued impact of the COVID-19 pandemic on the Company's business will depend on a number of factors, including, but not limited to, how long the pandemic will last, whether/when recurrences of the virus and variants of the virus may arise, the availability and acceptance of vaccines, what restrictions on in-restaurant dining may be imposed or re-imposed, the timing and extent of customer re-engagement with the Company's brands and, in general, what the short- and long-term impact on consumer discretionary spending the COVID-19 pandemic might have on the Company and the restaurant industry as a whole, all of which are uncertain and cannot be predicted. The Company's future results of operations and liquidity could adversely be impacted by the length of time dine-in restrictions remain in place and the success of any initiatives or programs that the Company may undertake to address financial and operational challenges faced by itself and its franchisees. As such, the extent to which the COVID-19 pandemic may continue to materially impact the Company's financial condition, liquidity, or results of operations is highly uncertain.
3. Accounting PoliciesStandards Adopted and Newly Issued Accounting Standards Not Yet Adopted
Accounting Standards Adopted Effective January 2, 2017in the Current Fiscal Year
In March 2016,December 2019, the Financial Accounting Standards Board (“FASB”) issued new guidance that addressesintended to simplify the accounting for income taxes, change the accounting for certain aspects of share-based payments, including excessincome tax benefits or deficiencies, forfeiture estimates, statutory tax withholdingtransactions, and cash flow classification of certain share-based payment activity.make other minor changes. The Company applied the prospective transition method in adoptingadopted the new guidance and prior period amounts have not been restated. Becauseat the beginning of the adoption, the Company recognized an excess tax deficiency from stock-based compensation as a discrete item, increasing the income tax provision for the three and nine months ended September 30, 2017 by $0.1 million and $1.8 million, respectively. Historically, excess tax benefits or deficiencies were recorded as additional paid-in capital. The Company applied the prospective transition method with respect to the cash flow classification of certain share-based payment activity; accordingly, the cash flows for the nine months ended September 30, 2016 have not been restated. The Company has elected to maintain its practice of estimating forfeitures when recognizing expense for share-based payment awards. Amendments to the accounting for minimum statutory withholding requirements had no impact on the Company's Consolidated Financial Statements.
In November 2016, the FASB issued new guidance to reduce diversity in practice in the classification and presentation of changes in restricted cash in the statement of cash flows. The new guidance requires amounts generally described as restricted cash should be included with cash and cash equivalents when reconciling the beginning-of-period total amounts to the end-of-period total amounts shown on the statement of cash flows. Calendar year public entities will be required to adopt the new guidance beginning with the first fiscal quarter of 2018. The Company elected to adopt2021. Adoption did not have any material effect on the consolidated financial statements.
Additional new accounting guidance retrospectively
DineEquity, Inc. and Subsidiaries
Notes to Consolidated Financial Statements (Continued)
3. Accounting Policies (Continued)
became effective January 2, 2017 and the cash flows for the nine months ended September 30, 2017 were restated. AdoptionCompany as of the new guidance didbeginning of fiscal 2021 that the Company reviewed and concluded was either not impactapplicable to its operations or had no material effect on its consolidated financial statements in the Company's Consolidated Balance Sheetscurrent or Consolidated Statements of Comprehensive Income.future fiscal years.
In January 2017, the FASB issued new guidance simplifying the test of goodwill for impairment. The new guidance requires a single-step quantitative test to measure potential impairment based on the excess of a reporting unit's carrying amount over its fair value. Calendar year public entities will be required to adopt the new guidance beginning with the first fiscal quarter of 2020. The Company has elected early adoption of the new guidance, as is permitted for interim or annual tests of goodwill performed after January 1, 2017.
Newly Issued Accounting Standards Not Yet Adopted
In August 2016, the FASB issued new guidance on the classification of certain cash receipts and payments in the statement of cash flows. The new guidance is intended to reduce diversity in practice in how certain transactions are classified in the statement of cash flows. The Company will be required to adopt the new guidance beginning with its first fiscal quarter of 2018. Early adoption is permitted. The Company is currently assessing the impact that the new guidance will have on its consolidated statements of cash flows.
In June 2016, the FASB issued new guidance on the measurement of credit losses on financial instruments. The new guidance will replace the incurred loss methodology of recognizing credit losses on financial instruments that is currently required with a methodology that estimates the expected credit loss on financial instruments and reflects the net amount expected to be collected on the financial instrument. Application of the new guidance may result in the earlier recognition of credit losses as the new methodology will require entities to consider forward-looking information in addition to historical and current information used in assessing incurred losses. The Company will be required to adopt the new guidance on a modified retrospective basis beginning with its first fiscal quarter ofMarch 2020, with early adoption permittedan update in its first fiscal quarter of 2019. The Company is currently evaluating the impact of the new guidance on its consolidated financial statements and related disclosures and whether early adoption will be elected.
In February 2016, the FASB issued new guidance with respect to the accounting for leases. The new guidance will require lessees to recognize a right-of-use asset and a lease liability for virtually all leases, other than leases with a term of 12 months or less, and to provide additional disclosures about leasing arrangements. Accounting by lessors is largely unchanged from existing accounting guidance. The Company will be required to adopt the new guidance on a modified retrospective basis beginning with its first fiscal quarter of 2019. Early adoption is permitted.
While the Company is still in the process of evaluating the impact of the new guidance on its consolidated financial statements and disclosures, the Company expects adoption of the new guidance will have a material impact on its Consolidated Balance Sheets due to recognition of the right-of-use asset and lease liability related to its operating leases. While the new guidance is also expected to impact the measurement and presentation of elements of expenses and cash flows related to leasing arrangements, the Company does not presently believe there will be a material impact on its Consolidated Statements of Comprehensive Income or Consolidated Statements of Cash Flows. Recognition of a lease liability related to operating leases will not impact any covenants related to the Company's long-term debt because the debt agreements specify that covenant ratios be calculated using U.S. GAAP in effect at the time the debt agreements were entered into.
In January 2016,2021, the FASB issued guidance on the recognition and measurement of financial instruments. The guidance modifies how entities measure certain equity investments and present changes in the fair value of those investments, as well as changes how fair value of financial instruments is measured for disclosure purposes. The amendment is effective commencing with the Company's first fiscal quarter of 2018. The Company is currently evaluating the impact of the new guidance on its financial statements and disclosures.
In May 2014, the FASB issued new accounting guidance on revenue recognition, which provides optional expedients and exceptions for a single, five-step model to be applied to all revenue contracts with customers. The new standard also requires additional financial statement disclosures that will enable users to understand the nature, amount, timing and uncertainty of revenue and cash flows relating to customer contracts. Companies have an option to use either the full retrospective method or the modified retrospective method to implement the standard. In August 2015, the FASB deferred the effective date of the new revenue guidance by one year such that the Company will be required to adopt the new guidance beginning with its first fiscal quarter of 2018. The FASB has subsequently issued several clarifications on specific topics within the new revenue recognition guidance that did not change the core principles of the guidance originally issued in May 2014.
DineEquity, Inc. and Subsidiaries
Notes to Consolidated Financial Statements (Continued)
3. Accounting Policies (Continued)
This new guidance supersedes nearly all the existing general revenue recognition guidance underapplying current U.S. GAAP as well as most industry-specific revenue recognition guidance, including guidance with respect to revenue recognition by franchisors. The Company believes the recognition of the majority of its revenues, including franchise royalty revenuescontracts, hedging relationships, and sales of IHOP pancake and waffle dry mix will not beother transactions affected by the new guidance. Additionally, lease rental revenues are not within the scopediscontinuation of the London Interbank Offered Rate (“LIBOR”) or by another reference rate expected to be discontinued. The guidance can be adopted immediately and is applicable to contracts entered into on or before December 31, 2022. We are currently evaluating our contracts that reference LIBOR and the potential effects of adopting this new guidance.
The Company believes the new guidance will impact the timing of recognition of franchise and development fees. Under existing guidance, these fees are typically recognized upon the opening of restaurants. Under the new guidance, the Company believes the fees will have to be deferred and recognized as revenue over the term of the individual franchise agreements. However, the effect of the required deferral of fees received in any given year will be mitigated by the recognition of revenue from fees retrospectively deferred from prior years. The Company has essentially completed reviewing most of its nearly 4,000 agreements to obtain the data elements necessary to implement the new guidance and is in the process of quantifying the impact of the new guidance on its consolidated financial statements and related disclosures.
The Company also believes the new guidance will impact the accounting for transactions related to the Applebee's national advertising fund. Currently, franchisee contributions to and expenditures of the Applebee's national advertising fund are not included in the Consolidated Statements of Comprehensive Income. Under the new guidance, the Company would include contributions to and expenditures from the Applebee's advertising fund within the Consolidated Statements of Comprehensive Income as is currently done with contributions to and expenditures from the IHOP national advertising fund and with international restaurants of both brands. While this change will materially impact the gross amount of reported franchise revenues and expenses, the impact would be an offsetting increase to both revenue and expense such that the impact on gross profit and net income, if any, would not be material.
The Company presently expects to use the full retrospective method of adoption when the new revenue guidance is adopted in the first fiscal quarter of 2018.
The Company reviewed all other newly issued accounting pronouncements and concluded that they either are not applicable to the Company's operations or that no material effect is expected on the Company's financial statements because of future adoption.when adoption is required in the future.
4. GoodwillRevenue Disclosures
Franchise revenue and Intangible Assetsrevenue from company-operated restaurants are recognized in accordance with current guidance for revenue recognition as codified in Accounting Standards Topic 606 (“ASC 606”). Under ASC 606, revenue is recognized upon transfer of control of promised services or goods to customers in an amount that reflects the consideration the Company expects to receive for those services or goods.
Changes in the carrying amount of goodwill for the nine months ended September 30, 2017 are as follows:
|
| | | | | | | | | | | |
| | Applebee's Franchise Unit | | IHOP Franchise Unit | | Total |
| | (In millions) |
| Balance at December 31, 2016: | |
| | |
| | |
| Goodwill, gross | $ | 686.7 |
| | $ | 10.8 |
| | $ | 697.5 |
|
| Accumulated impairment loss | — |
| | — |
| | — |
|
| Goodwill | 686.7 |
| | 10.8 |
| | 697.5 |
|
| Impairment loss | (358.2 | ) | | — |
| | (358.2 | ) |
| Balance at September 30, 2017: | | | | | |
| Goodwill, gross | 686.7 |
| | 10.8 |
| | 697.5 |
|
| Accumulated impairment loss | (358.2 | ) | | — |
| | (358.2 | ) |
| Goodwill | $ | 328.5 |
| | $ | 10.8 |
| | $ | 339.2 |
|
DineEquity,Dine Brands Global, Inc. and Subsidiaries
Notes to Consolidated Financial Statements (Continued)
4. Goodwill and Intangible AssetsRevenue Disclosures (Continued)
ChangesFranchising Activities
The Company owns, franchises and operates the Applebee's Neighborhood Grill & Bar® (“Applebee's”) concept in the carrying amountcasual dining category of intangible assets for the nine months ended September 30, 2017 are as follows:
|
| | | | | | | | | | | | | | | | | | | |
| | Not Subject to Amortization | | Subject to Amortization | | |
| | Applebee's Tradename | | Other | | Applebee's Franchising Rights | | Leaseholds | | Total |
| | (In millions) |
| Balance at December 31, 2016 | $ | 652.4 |
| | $ | 2.0 |
| | $ | 109.0 |
| | $ | — |
| | $ | 763.4 |
|
| Impairment | (173.4 | ) | | — |
| | — |
| | — |
| | (173.4 | ) |
| Amortization expense | — |
| | — |
| | (7.5 | ) | | (0.0 | ) | | (7.5 | ) |
| Additions | — |
| | 0.4 |
| | — |
| | 2.3 |
| | 2.7 |
|
| Balance at September 30, 2017 | $ | 479.0 |
| | $ | 2.4 |
| | $ | 101.5 |
| | $ | 2.3 |
| | $ | 585.2 |
|
The Company evaluates its goodwillrestaurant industry and the indefinite-lived Applebee's tradename for impairment annuallyCompany owns and franchises the International House of Pancakes® (“IHOP”) concept in the fourth quarter of each year. In addition to the annual evaluation for impairment, goodwill and indefinite-lived intangible assets are evaluated more frequently if the Company believes indicators of impairment exist.
In the third quarter of 2017, the Company noted that the decline in the market pricefamily dining category of the Company's common stock since December 31, 2016, which the Company had believed to be temporary, persisted throughout the first eight months of 2017 and that the favorable trend in Applebee's domestic same-restaurant sales experienced in the second quarter of 2017 did not continue into the first two months of the third quarter.restaurant industry. The Company also noted a continuing increase in Applebee's bad debt expense and in royalties not recognized in income until paid in cash. Additionally, the Company also determined an increasing shortfall in franchisee contributions to the Applebee's national advertising fund could require a larger amount of future subsidizationfranchise arrangement for both brands is documented in the form of additionala franchise agreement and, in most cases, a development agreement. The franchise arrangement between the Company as the franchisor contributionsand the franchisee as the customer requires the Company to perform various activities to support the brands that do not directly transfer goods and services to the fund than previously estimated. Based on these unfavorable developments, primarilyfranchisee, but instead represent a single performance obligation, which is the decline in the market pricetransfer of the Company's common stock,franchise license. The intellectual property subject to the franchise license is symbolic intellectual property as it does not have significant standalone functionality, and substantially all the utility is derived from its association with the Company’s past or ongoing activities. The nature of the Company’s promise in granting the franchise license is to provide the franchisee with access to the respective brand’s symbolic intellectual property over the term of the license. The services provided by the Company determined that indicatorsare highly interrelated with the franchise license and as such are considered to represent a single performance obligation.
The transaction price in a standard franchise arrangement for both brands primarily consists of impairment existed(a) initial franchise/development fees; (b) continuing franchise fees (royalties); and that an interim test(c) advertising fees. Since the Company considers the licensing of goodwillthe franchising right to be a single performance obligation, no allocation of the transaction price is required. All domestic IHOP franchise agreements require franchisees to purchase proprietary pancake and indefinite-lived intangible assets for impairment should be performed.waffle dry mix from the Company.
The Company performed an interim quantitative testrecognizes the primary components of impairmentthe transaction price as follows:
•Franchise and development fees are recognized as revenue ratably on a straight-line basis over the term of Applebee's goodwillthe franchise agreement commencing with the restaurant opening date. As these fees are typically received in cash at or near the beginning of the franchise term, the cash received is initially recorded as a contract liability until recognized as revenue over time;
•The Company is entitled to royalties and tradenameadvertising fees based on a percentage of the franchisee's gross sales as defined in the third quarterfranchise agreement. Royalty and advertising revenue are recognized when the franchisee's reported sales occur. Depending on timing within a fiscal period, the recognition of 2017. revenue results in either what is considered a contract asset (unbilled receivable) or, once billed, accounts receivable, and are included in “receivables, net” in the Consolidated Balance Sheets.
•Revenue from the sale of proprietary pancake and waffle dry mix is recognized in the period in which distributors ship the franchisee's order; recognition of revenue results in an accounts receivable included in “receivables, net” in the Consolidated Balance Sheets.
In performingdetermining the quantitative testamount and timing of goodwill,revenue from contracts with customers, the Company usedexercises significant judgment with respect to collectibility of the income approach methodamount; however, the timing of valuation that included the discounted cash flow methodrecognition does not require significant judgments as well as other generally accepted valuation methodologies to determine the fair value of goodwill and intangible assets. Significant assumptions used to determine fair value under the discounted cash flow model included expected future trends in sales, operating expenses, overhead expenses, capital expenditures and changes in working capital, along with an appropriate discount rateit is based on either the Company's estimated cost of equity capital and after-tax cost of debt.
In performing the impairment reviewterm of the tradename,franchise agreement, the month of reported sales by the franchisee or the date of product shipment, none of which require estimation. The Company used the reliefdoes not incur a significant amount of royalty method under the income approach methodcontract acquisition costs in conducting franchising activities. The Company's franchising arrangements do not contain a significant financing component.
Company Restaurant Revenue
Sales by company-operated restaurants are recognized when food and beverage items are sold. Company restaurant sales are reported net of valuation. Significant assumptions used to determine fair value under the relief of royalty method include future trends in sales a royalty rate and a discount rate to be appliedtaxes collected from guests that are remitted to the forecast revenue stream.appropriate taxing authorities.
As a result of performing the quantitative test of impairment, the Company recognized an impairment of Applebee's goodwill of $358.2 million and an impairment of Applebee's tradename of $173.4 million. The Company adopted the guidance in FASB Accounting Standards Update 2017-04 on January 1, 2017; accordingly, the amount of the goodwill impairment was determined as the amount by which the carrying amount of the goodwill exceeded the fair value of the Applebee's franchise reporting unit as estimated in the impairment test. These assets are at risk of additional impairment in the future in the event of sustained downward movement in the Company's stock price, downward revisions of long-term performance assumptions or increases in the assumed long-term discount rate.
DineEquity,Dine Brands Global, Inc. and Subsidiaries
Notes to Consolidated Financial Statements (Continued)
4. Revenue Disclosures (Continued)
The following table disaggregates franchise revenue by major type for the three months ended March 31, 2021 and 2020:
| | | | | | | | | | | | | | | | | | |
| | | | | Three Months Ended |
| | | | March 31, |
| | | | | | | 2021 | | 2020 |
| | | | | | (In thousands) |
| Franchise Revenue: | | | | | | | | |
| Royalties | | | | | | $ | 65,767 | | | $ | 67,600 | |
| Advertising fees | | | | | | 60,885 | | | 61,723 | |
| Pancake and waffle dry mix sales and other | | | | | | 10,890 | | | 12,848 | |
| Franchise and development fees | | | | | | 3,434 | | | 2,866 | |
| Total franchise revenue | | | | | | $ | 140,976 | | | $ | 145,037 | |
Accounts and other receivables from franchisees as of March 31, 2021 and December 31, 2020 were $79.5 million (net of allowance of $7.7 million) and $76.3 million (net of allowance of $11.4 million), respectively, and were included in receivables, net in the Consolidated Balance Sheets.
Changes in the Company's contract liability for deferred franchise and development fees during the three months ended March 31, 2021 are as follows:
| | | | | | | | |
| | Deferred Franchise Revenue (short- and long-term) |
| | (In thousands) |
| Balance at December 31, 2020 | | $ | 59,919 | |
| Recognized as revenue during the three months ended March 31, 2021 | | (3,354) | |
| Fees deferred during the three months ended March 31, 2021 | | 1,789 | |
| Balance at March 31, 2021 | | $ | 58,354 | |
The balance of deferred revenue as of March 31, 2021 is expected to be recognized as follows:
| | | | | |
| (In thousands) |
| Remainder of 2021 | $ | 7,931 | |
| 2022 | 7,130 | |
| 2023 | 6,629 | |
| 2024 | 6,044 | |
| 2025 | 5,268 | |
| Thereafter | 25,352 | |
| Total | $ | 58,354 | |
5. Current Expected Credit Losses
The CECL reserve methodology requires companies to measure expected credit losses on financial instruments based on the total estimated amount to be collected over the lifetime of the instrument. Under the CECL model, reserves may be established against financial asset balances even if the risk of loss is remote or has not yet manifested itself. The Company records specific reserves against account balances of franchisees deemed at-risk when a potential loss is likely or imminent as a result of prolonged payment delinquency (greater than 90 days past due) and where notable credit deterioration has become evident. For financial assets that are not currently deemed at-risk, an allowance is recorded based on expected loss rates derived pursuant to the Company's CECL methodology that assesses four components - historical losses, current conditions, reasonable and supportable forecasts, and a reversion to history, if applicable.
Dine Brands Global, Inc. and Subsidiaries
Notes to Consolidated Financial Statements (Continued)
5. Current Expected Credit Losses (Continued)
The Company considers its portfolio segments to be the following:
Accounts Receivable (Franchise-Related)
Most of the Company’s short-term receivables due from franchisees are derived from royalty, advertising and other franchise-related fees.
Gift Card Receivables
Gift card receivables consist primarily of amounts due from third-party vendors. Receivables related to gift card sales are subject to seasonality and usually peak around year end as a result of the December holiday season.
Notes Receivable
Notes receivable balances primarily relate to the conversion of certain Applebee's franchisee accounts receivable to notes receivable, cash loans to franchisees for working capital purposes, a note receivable in connection with the sale of IHOP company restaurants and IHOP franchise fee and other notes. The notes are typically collateralized by the franchise. A significant portion of these notes have specific reserves recorded against them amounting to $9.4 million as of March 31, 2021.
Equipment Leases Receivable
Equipment leases receivable also relate to IHOP franchise development activity prior to 2003. Equipment lease contracts are collateralized by the equipment in the restaurant. The estimated fair value of the equipment collateralizing these lease contracts are not deemed to be significant given the very seasoned and mature nature of this portfolio. The weighted average remaining life of the Company’s equipment leases is 5.2 years as of March 31, 2021.
Direct Financing Leases Receivable
Direct financing lease receivables relate to IHOP franchise development activity prior to 2003 when IHOP typically leased or purchased the restaurant site, built and equipped the restaurant, then franchised the restaurant to a franchisee. IHOP provided the financing for leasing or subleasing the site. Direct financing leases at March 31, 2021, comprised 85 leases with a weighted average remaining life of 4.1 years, and relate to locations that IHOP is leasing from third parties and subleasing to franchisees.
Distributor Receivables
Receivables due from distributors are related to the sale of IHOP’s proprietary pancake and waffle dry mix to franchisees through the Company’s network of suppliers and distributors and are included as part of Other receivables.
| | | | | | | | | | | |
| March 31, 2021 | | December 31, 2020 |
| (In millions) |
| Accounts receivable | $ | 84.8 | | | $ | 85.7 | |
| Gift card receivables | 5.4 | | | 22.5 | |
| Notes receivable | 20.4 | | | 18.6 | |
| Financing receivables: | | | |
| Equipment leases receivable | 40.8 | | | 43.9 | |
| Direct financing leases receivable | 20.1 | | | 22.7 | |
| Franchise fee notes receivable | 0.1 | | | 0.1 | |
| Other | 5.7 | | | 6.0 | |
| 177.3 | | | 199.5 | |
| Less: allowance for credit losses | (18.3) | | | (23.1) | |
| 159.0 | | | 176.4 | |
| Less: current portion | (107.4) | | | (121.9) | |
| Long-term receivables | $ | 51.6 | | | $ | 54.5 | |
Dine Brands Global, Inc. and Subsidiaries
Notes to Consolidated Financial Statements (Continued)
5. Current Expected Credit Losses (Continued)
Changes in the allowance for credit losses during the three months ended March 31, 2021 were as follows:
| | | | | | | | | | | | | | | | | | | | | | | | | | | | | | | | | | | | | | | | | |
| | | | | | | | | |
| Accounts Receivable | | Notes receivable, short-term | | Notes receivable, long-term | | Lease Receivables | | Equipment Notes | | Other (1) | | Total |
| | (In millions) |
| Balance, December 31, 2020 | $ | 11.2 | | | $ | 3.6 | | | $ | 5.3 | | | $ | 0.4 | | | $ | 2.3 | | | $ | 0.3 | | | $ | 23.1 | |
| | | | | | | | | | | | | |
| Bad debt (credit) expense for the three months ended March 31, 2021 | (2.0) | | | 0.5 | | | (0.0) | | | (0.3) | | | (0.1) | | | (0.1) | | | (2.0) | |
| Advertising provision adjustment | (1.4) | | | (0.0) | | | 0 | | | 0 | | | 0 | | | 0 | | | (1.4) | |
| Write-offs | (0.2) | | | 0 | | | 0 | | | 0.0 | | | (1.2) | | | 0 | | | (1.4) | |
| Recoveries | 0 | | | 0 | | | 0 | | | 0.0 | | | 0 | | | 0 | | | 0.0 | |
| Balance, March 31, 2021 | $ | 7.6 | | | $ | 4.1 | | | $ | 5.3 | | | $ | 0.1 | | | $ | 1.0 | | | $ | 0.2 | | | $ | 18.3 | |
(1)Primarily distributor receivables, gift card receivables and credit card receivables
The Company's primary credit quality indicator for all portfolio segments is delinquency. The delinquency status of receivables (other than accounts receivable, gift card receivables and distributor receivables) at March 31, 2021 was as follows:
| | | | | | | | | | | | | | | | | | | | | | | | | | | | | | | | | | | |
| | | | | | | | | | | |
| Notes receivable, short-term | | Notes receivable, long-term | | Lease Receivables | | Equipment Notes | | Other (1) | | Total |
| | (In millions) |
| Current | $ | 5.2 | | | $ | 12.7 | | | $ | 20.1 | | | $ | 40.8 | | | $ | 2.2 | | | $ | 81.0 | |
| 30-59 days | 0.1 | | | 0 | | | 0 | | | 0 | | | 0 | | | 0.1 | |
| 60-89 days | 0.1 | | | 0 | | | 0 | | | 0 | | | 0 | | | 0.1 | |
| 90-119 days | 0.1 | | | 0 | | | 0 | | | 0 | | | 0 | | | 0.1 | |
| 120+ days | 2.2 | | | 0 | | | 0 | | | 0 | | | 0 | | | 2.2 | |
| Total | $ | 7.7 | | | $ | 12.7 | | | $ | 20.1 | | | $ | 40.8 | | | $ | 2.2 | | | $ | 83.5 | |
(1) Primarily credit card receivables
The year of origination of the Company's financing receivables is as follows:
| | | | | | | | | | | | | | | | | | | | | | | |
| | | | | | | |
| Notes receivable, short and long-term | | Lease Receivables | | Equipment Notes | | Total |
| | (In millions) |
| 2021 | $ | 2.2 | | | $ | 0 | | | $ | 0 | | | $ | 2.2 | |
| 2020 | 1.2 | | | 1.5 | | | 0 | | | 2.7 | |
| 2019 | 2.6 | | | 0.9 | | | 0 | | | 3.5 | |
| 2018 | 8.0 | | | 0 | | | 0 | | | 8.0 | |
| 2017 | 6.3 | | | 0 | | | 0 | | | 6.3 | |
| 2016 | 0.1 | | | 17.7 | | | 40.8 | | | 58.6 | |
| Total | $ | 20.4 | | | $ | 20.1 | | | $ | 40.8 | | | $ | 81.3 | |
The Company does not place its financing receivables in non-accrual status.
6. Lease Disclosures
The Company engages in leasing activity as both a lessee and a lessor. The Company currently leases from third parties the real property on which approximately 550 IHOP franchisee-operated restaurants and 1 Applebee's franchisee-operated restaurant are located; the Company (as lessor) subleases the property to the franchisees that operate those restaurants. The Company also leases property it owns to the franchisees that operate approximately 55 IHOP restaurants and 1 Applebee's restaurant. The Company leases from third parties the real property on which 69 Applebee's company-operated restaurants are located. The Company also leases office space for its principal corporate office in Glendale, California and restaurant support centers in Kansas City, Missouri and Raleigh, North Carolina. The Company does not have a significant amount of non-real estate leases.
Dine Brands Global, Inc. and Subsidiaries
Notes to Consolidated Financial Statements (Continued)
6. Lease Disclosures (Continued)
The Company's existing leases/subleases related to IHOP restaurants generally provide for an initial term of 20 to 25 years, with most having one or more five-year renewal options. Leases related to Applebee's restaurants generally have an initial term of 10 to 20 years, with renewal terms of five to 20 years. Option periods were not included in determining liabilities and right-of-use assets related to operating leases. Approximately 240 of the Company's leases met the sales levels that required variable rent payments to the Company (as lessor), based on a percentage of restaurant sales during the three months ended March 31, 2021. Approximately 30 of the leases met the sales levels that required variable rent payments by the Company (as lessee), based on a percentage of restaurant sales during the three months ended March 31, 2021.
The Company's lease cost for the three months ended March 31, 2021 and 2020 was as follows:
| | | | | | | | | | | | | | | | | |
| | | Three months ended March 31, |
| | | | | 2021 | | 2020 |
| | | | (In millions) |
| Finance lease cost: | | | | | | | |
| Amortization of right-of-use assets | | | | | $ | 1.2 | | | $ | 1.3 | |
| Interest on lease liabilities | | | | | 1.4 | | | 1.7 | |
| Operating lease cost | | | | | 25.1 | | | 26.5 | |
| Variable lease cost | | | | | 0.3 | | | 0.4 | |
| Short-term lease cost | | | | | 0.0 | | | 0.0 | |
| Sublease income | | | | | (24.2) | | | (26.6) | |
| Lease cost | | | | | $ | 3.8 | | | $ | 3.3 | |
Future minimum lease payments under noncancelable leases as lessee as of March 31, 2021 were as follows:
| | | | | | | | | | | |
| Finance
Leases | | Operating
Leases |
| | (In millions) |
| 2021 (remaining nine months) | $ | 11.7 | | | $ | 69.0 | |
| 2022 | 14.4 | | | 86.2 | |
| 2023 | 11.6 | | | 71.0 | |
| 2024 | 9.7 | | | 65.8 | |
| 2025 | 8.5 | | | 57.0 | |
| Thereafter | 50.8 | | | 146.6 | |
| Total minimum lease payments | 106.7 | | | 495.6 | |
| Less: interest/imputed interest | (30.2) | | | (90.9) | |
| Total obligations | 76.5 | | | 404.7 | |
| Less: current portion | (10.3) | | | (70.3) | |
| Long-term lease obligations | $ | 66.2 | | | $ | 334.4 | |
The weighted average remaining lease term as of March 31, 2021 was 7.2 years for finance leases and 9.2 years for operating leases. The weighted average discount rate as of March 31, 2021 was 10.2% for finance leases and 5.6% for operating leases.
Dine Brands Global, Inc. and Subsidiaries
Notes to Consolidated Financial Statements (Continued)
6. Lease Disclosures (Continued)
During the three months ended March 31, 2021 and 2020, the Company made the following cash payments for leases:
| | | | | | | | | | | | | | | | | |
| | | Three months ended March 31, |
| | | | | 2021 | | 2020 |
| | | | (In millions) |
| Principal payments on finance lease obligations | | | | | $ | 2.6 | | | $ | 3.0 | |
| Interest payments on finance lease obligations | | | | | $ | 1.5 | | | $ | 1.7 | |
| Payments on operating leases | | | | | $ | 23.0 | | | $ | 23.4 | |
| Variable lease payments | | | | | $ | 0.3 | | | $ | 0.1 | |
The Company's income from operating leases for the three months ended March 31, 2021 and 2020 was as follows:
| | | | | | | | | | | | | | | | | |
| | | Three months ended March 31, |
| | | | | 2021 | | 2020 |
| | | | (In millions) |
| Minimum lease payments | | | | | $ | 23.8 | | | $ | 25.4 | |
| Variable lease income | | | | | 1.6 | | | 2.4 | |
| Total operating lease income | | | | | $ | 25.4 | | | $ | 27.8 | |
Minimum payments to be received as lessor under noncancelable operating leases as of March 31, 2021 were as follows:
| | | | | |
| |
| | (In millions) |
| 2021 (remaining nine months) | $ | 75.6 | |
| 2022 | 98.8 | |
| 2023 | 95.0 | |
| 2024 | 86.9 | |
| 2025 | 75.0 | |
| Thereafter | 164.3 | |
| Total minimum rents receivable | $ | 595.6 | |
The Company's income from direct financing leases for the three months ended March 31, 2021 and 2020 was as follows:
| | | | | | | | | | | | | | | | | |
| | | Three months ended March 31, |
| | | | | 2021 | | 2020 |
| | | | (In millions) |
| Interest income | | | | | $ | 0.6 | | | $ | 1.0 | |
| Variable lease income | | | | | 0.1 | | | 0.2 | |
| Total operating lease income | | | | | $ | 0.7 | | | $ | 1.2 | |
Minimum payments to be received as lessor under noncancelable direct financing leases as of March 31, 2021 were as follows:
| | | | | |
| |
| | (In millions) |
| 2021 (remaining nine months) | $ | 7.5 | |
| 2022 | 7.5 | |
| 2023 | 3.6 | |
| 2024 | 1.5 | |
| 2025 | 0.7 | |
| Thereafter | 3.1 | |
| Total minimum rents receivable | 23.9 | |
| Less: unearned income | (3.8) | |
| Total net investment in direct financing leases | 20.1 | |
| Less: current portion | (7.9) | |
| Long-term investment in direct financing leases | $ | 12.2 | |
Dine Brands Global, Inc. and Subsidiaries
Notes to Consolidated Financial Statements (Continued)
7. Long-Term Debt
At March 31, 2021 and December 31, 2020, long-term debt consisted of the following:
| | | | | | | | | | | |
| March 31, 2021 | | December 31, 2020 |
| | (In millions) |
| Series 2019-1 4.194% Fixed Rate Senior Secured Notes, Class A-2-I | $ | 696.5 | | | $ | 698.3 | |
| Series 2019-1 4.723% Fixed Rate Senior Secured Notes, Class A-2-II | 597.0 | | | 598.5 | |
| Series 2019-1 Variable Funding Senior Notes Class A-1, variable interest rate of 2.42% at December 31, 2020 | 0 | | | 220.0 | |
| Debt issuance costs | (9.1) | | | (11.8) | |
| Long-term debt, net of debt issuance costs | 1,284.4 | | | 1,505.0 | |
| Current portion of long-term debt | (13.0) | | | (13.0) | |
| Long-term debt | $ | 1,271.4 | | | $ | 1,492.0 | |
On June 5, 2019, Applebee’s Funding LLC and IHOP Funding LLC (the “Co-Issuers”), each a special purpose, wholly-owned indirect subsidiary of the Company, issued two tranches of fixed rate senior secured notes, the Series 2019-1 4.194% Fixed Rate Senior Secured Notes, Class A-2-I (“Class A-2-I Notes”) in an initial aggregate principal amount of $700 million and the Series 2019-1 4.723% Fixed Rate Senior Secured Notes, Class A-2-II (“Class A-2-II Notes”) in an initial aggregate
principal amount of $600 million (the “Class A-2-II Notes” and, together with the Class A-2-I Notes, the “2019 Class A-2 Notes”). The 2019 Class A-2 Notes were issued pursuant to an offering exempt from registration under the Securities Act of 1933, as amended.
The Co-Issuers also entered into a revolving financing facility, the 2019-1 Variable Funding Senior Notes, Class A-1 (the “Credit Facility”), that allows for drawings up to $225 million of variable funding notes and the issuance of letters of credit. The Credit Facility and the 2019 Class A-2 Notes are referred to collectively herein as the “New Notes.” The New Notes were issued in a securitization transaction pursuant to which substantially all the domestic revenue-generating assets and domestic intellectual property held by the Co-Issuers and certain other special-purpose, wholly-owned indirect subsidiaries of the Company (the “Guarantors”) were pledged as collateral to secure the New Notes.
The New Notes were issued under a Base Indenture, dated as of September 30, 2014, and amended and restated as of June 5, 2019 (the “Base Indenture”), and the related Series 2019-1 Supplement to the Base Indenture, dated June 5, 2019 (the “Series 2019-1 Supplement”), among the Co-Issuers and Citibank, N.A., as the trustee (in such capacity, the “Trustee”) and securities intermediary. The Base Indenture and the Series 2019-1 Supplement (collectively, the “Indenture”) will allow the Co-Issuers to issue additional series of notes in the future subject to certain conditions set forth therein.
2019 Class A-2 Notes
The legal final maturity of the 2019 Class A-2 Notes is in June 2049, but rapid amortization will apply if the Class A-2-I Notes are not repaid by June 2024 (the “Class A-2-I Anticipated Repayment Date”) and for the Class A-2-II Notes if not repaid by June 2026 (the “Class A-2-II Anticipated Repayment Date”). If the Co-Issuers have not repaid or refinanced the Class A-2-I Notes by the Class A-2-I Anticipated Repayment Date or the Class A-2-II Notes by the Class A-2-II Anticipated Repayment Date, then additional interest will accrue on the Class A-2-I Notes and the Class A-2-II Notes, as applicable, at the greater of: (A) 5.0% and (B) the amount, if any, by which the sum of the following exceeds the applicable Series 2019-1 Class A-2 Note interest rate: (x) the yield to maturity (adjusted to a quarterly bond-equivalent basis) on the applicable anticipated repayment date of the United States Treasury Security having a term closest to 10 years plus (y) 5.0%, plus (z) 2.15% for the Series 2019-1 Class A-2-I Notes and 2.64% for the Series 2019-1 Class A-2-II Notes.
While the 2019 Class A-2 Notes are outstanding, payment of principal and interest is required to be made on the 2019 Class A-2 Notes on a quarterly basis. The quarterly principal payment of $3.25 million on the 2019 Class A-2 Notes may be suspended when the leverage ratio for the Company and its subsidiaries is less than or equal to 5.25x. In general, the leverage ratio is the Company's indebtedness (as defined in the Indenture) divided by adjusted EBITDA (as defined in the Indenture) for the four preceding quarterly periods. The complete definitions of all calculation elements of the leverage ratio are contained in the Indenture.
Dine Brands Global, Inc. and Subsidiaries
Notes to Consolidated Financial Statements (Continued)
7. Long-Term Debt (Continued)
As of March 31, 2021, the Company's leverage ratio was 7.02x. As a result, quarterly principal payments on the 2019 Class A-2 Notes of $3.25 million continue to be required. Exceeding the leverage ratio of 5.25x does not violate any covenant related to the New Notes.
The Company may voluntarily repay the 2019 Class A-2 Notes at any time; however, if the 2019 Class A-2 Notes are repaid prior to certain dates, the Company would be required to pay make-whole premiums. As of March 31, 2021, the make-whole premium associated with voluntary prepayment of the Class A-2-I Notes was approximately $29 million; this amount declines progressively each quarter to zero in June 2022. As of March 31, 2021, the make-whole premium associated with voluntary prepayment of the Class A-2-II Notes was approximately $59 million; this amount declines progressively each quarter to zero in June 2024. The Company would also be subject to a make-whole premium in the event of a mandatory prepayment required following a Rapid Amortization Event or certain asset dispositions. The mandatory make-whole premium requirements are considered derivatives embedded in the New Notes that must be bifurcated for separate valuation. The Company estimated the fair value of these derivatives to be immaterial as of March 31, 2021, based on the probability-weighted discounted cash flows associated with either event.
2019 Class A-1 Notes
The Co-Issuers entered into the Credit Facility that allows for drawings up to $225 million of variable funding notes and the issuance of letters of credit. The applicable interest rate under the Credit Facility depends on the type of borrowing by the Co-Issuers. The applicable interest rate for advances is generally calculated at a per annum rate equal to the commercial paper funding rate or one-, two-, three- or six-month Eurodollar Funding Rate, in either case, plus 2.15%. The applicable interest rate for swingline advances and unreimbursed draws on outstanding letters of credit is a per annum base rate equal to the sum of (a) 1.15% plus (b) the greatest of (i) the Prime Rate in effect from time to time, (ii) the Federal Funds Rate in effect from time to time plus 0.50% and (iii) the one-month Eurodollar Funding Rate plus 1.00%. There is no upfront fee for the Credit Facility. There is a fee of 50 basis points on any unused portion of the revolving financing facility. Undrawn face amounts of outstanding letters of credit that are not cash collateralized accrue a fee of 2.15% per annum.
In March 2020, the Company borrowed $220.0 million against the Credit Facility. The maximum amount of borrowings from the Credit Facility outstanding during the three months ended March 31, 2021 was $220.0 million. The $220.0 million was repaid on March 5, 2021 and as of March 31, 2021, there were no outstanding borrowings under the Credit Facility. The interest rate for borrowings under the Credit Facility is the three-month LIBOR rate plus 2.15% for 60% of the advances and the commercial paper funding rate of our conduit investor plus 2.15% for 40% of the advances. The weighted average interest rate on Credit Facility borrowings for the period outstanding during the three months ended March 31, 2021 was 2.4%.
At March 31, 2021, $3.3 million was pledged against the Credit Facility for outstanding letters of credit, leaving $221.7 million available for borrowing. The letters of credit are used primarily to satisfy insurance-related collateral requirements.
Covenants and Restrictions
The New Notes are subject to a series of covenants and restrictions customary for transactions of this type, including: (i) that the Co-Issuers maintain specified reserve accounts to be used to make required payments in respect of the New Notes, (ii) provisions relating to optional and mandatory prepayments, and the related payment of specified amounts, including specified call redemption premiums in the case of Class A-2 Notes under certain circumstances; (iii) certain indemnification payments in the event, among other things, the transfers of the assets pledged as collateral for the New Notes are in stated ways defective or ineffective and (iv) covenants relating to recordkeeping, access to information and similar matters. The New Notes are subject to customary rapid amortization events provided for in the Indenture, including events tied to failure of the Securitization Entities (as defined in the Indenture) to maintain the stated debt service coverage ratio (“DSCR”), the sum of domestic retail sales for all restaurants being below certain levels on certain measurement dates, certain manager termination events, certain events of default and the failure to repay or refinance the Class A-2 Notes on the anticipated repayment dates. The New Notes are also subject to certain customary events of default, including events relating to non-payment of required interest, principal or other amounts due on or with respect to the New Notes, failure of the Securitization Entities to maintain the stated DSCR, failure to comply with covenants within certain time frames, certain bankruptcy events, breaches of specified representations and warranties and certain judgments.
Dine Brands Global, Inc. and Subsidiaries
Notes to Consolidated Financial Statements (Continued)
7. Long-Term Debt (Continued)
In general, the DSCR ratio is Net Cash Flow (as defined in the Indenture) for the four quarters preceding the calculation date divided by the total debt service payments (as defined in the Indenture) of the preceding four quarters. The complete definitions of the DSCR and all calculation elements are contained in the Indenture. Failure to maintain a prescribed DSCR can trigger a Cash Flow Sweeping Event, A Rapid Amortization Event, a Manager Termination Event or a Default Event as described below. In a Cash Flow Sweeping Event, the Trustee is required to retain 50% of excess Cash Flow (as defined in the Indenture) in a restricted account. In a Rapid Amortization Event, all excess Cash Flow is retained and used to retire principal amounts of debt. In a Manager Termination Event, the Company may be replaced as manager of the assets securitized under the Indenture. In a Default Event, the outstanding principal amount and any accrued but unpaid interest can be called to become immediately due and payable. Key DSCRs are as follows:
•DSCR less than 1.75x - Cash Flow Sweeping Event
•DSCR less than 1.20x - Rapid Amortization Event
•Interest-only DSCR less than 1.20x - Manager Termination Event
•Interest-only DSCR less than 1.10x - Default Event
The Company's DSCR for the reporting period ended March 31, 2021 was approximately 3.45x.
Debt Issuance Costs
Amortization of costs incurred in connection with the issuance of the 2019 Class A-2 Notes of $0.5 million and $0.5 million were included in interest expense for the three months ended March 31, 2021 and 2020, respectively. Amortization costs incurred in connection with the Company's Credit Facility and prior credit facility of $0.2 million and $0.2 million were included in interest expense for the three months ended March 31, 2021 and 2020, respectively.
At March 31, 2021, total unamortized debt issuance costs of $9.1 million are reported as a direct reduction of the 2019 Class A-2 Notes in the Consolidated Balance Sheets. At March 31, 2021, total unamortized debt issuance costs of $2.0 million related to the Credit Facility and prior credit facility are classified as other long-term assets because there are no borrowings outstanding against the Credit Facility.
Maturities of Long-term Debt
•The anticipated repayment date of the Class A-2-I Notes is June 2024.
•The anticipated repayment date of the Class A-2-II Notes is in June 2026.
•Quarterly principal payments on the Class A-2-I and Class A-2-II Notes totaling $3.25 million ($13.0 million per annum) are required if the Company's leverage ratio is greater than 5.25x.
8. Stockholders' EquityDeficit
Dividends
DuringDividends declared and paid per share for the ninethree months ended September 30, 2017, the Company paid dividends on common stock of $52.3 million, representing cash dividends of $0.97 per share declared in the fourth quarter of 2016March 31, 2021 and the first and second quarters of 2017. On August 10, 2017, the Company's Board of Directors declared a third quarter 2017 cash dividend of $0.97 per share of common stock. This dividend was paid on October 6, 2017 to the Company's stockholders of record at the close of business on September 18, 2017. The Company reported dividends payable of $17.8 million at September 30, 2017.2020 were as follows:
| | | | | | | | | | | | | | | | | |
| | | Three months ended March 31, |
| | | | | | 2021 | | 2020 |
| Dividends declared per common share | | | | | $ | 0 | | | $ | 0.76 | |
| Dividends paid per common share | | | | | $ | 0 | | | $ | 0.69 | |
Stock Repurchase Program
In October 2015,February 2019, the Company'sCompany’s Board of Directors approved a stock repurchase program authorizing the Company to repurchase up to $150$200 million of DineEquitythe Company’s common stock (the “2015“2019 Repurchase Program”) on an opportunistic basis from time to time in the open market transactions andor in privately negotiated transactions based on business, market, applicable legal requirements and other considerations. The 20152019 Repurchase Program, as approved by the Board of Directors, does not require the repurchase of a specific number of shares and can be terminated at any time. A summary
Dine Brands Global, Inc. and Subsidiaries
Notes to Consolidated Financial Statements (Continued)
8. Stockholders' Deficit (Continued)
The Company did 0t repurchase any shares during three months ended March 31, 2021, as compared to repurchasing 459,899 shares during the three months ended March 31, 2020. As of March 31, 2021, cumulative repurchases of stock total 1,697,597 shares repurchasedat a cost of $129.8 million, with a dollar value of $70.2 million remaining for repurchase under the 20152019 Repurchase Program, during the nine months ended September 30, 2017 and cumulatively, is as follows:Program.
|
| | | | | | |
| 2015 Repurchase Program | Shares | | Cost of shares |
| | | | (In millions) |
| Repurchased during the three months ended September 30, 2017 | — |
| | $ | — |
|
| Repurchased during the nine months ended September 30, 2017 | 145,786 |
| | $ | 10.0 |
|
| Cumulative repurchases as of September 30, 2017 | 1,000,657 |
| | $ | 82.9 |
|
| Remaining dollar value of shares that may be repurchased | n/a | | $ | 67.1 |
|
Treasury Stock
Repurchases of DineEquitythe Company's common stock are included in treasury stock at the cost of shares repurchased plus any transaction costs. Treasury stock may be re-issued when stock options are exercised, when restricted stock awards are granted and when restricted stock units settle in stock upon vesting. The cost of treasury stock re-issued is determined using the first-in, first-out (“FIFO”) method. During the ninethree months ended September 30, 2017,March 31, 2021, the Company re-issued 273,376539,134 shares of treasury stock at a total FIFO cost of $9.8$21.8 million.
6.9. Income Taxes
The Company's effective tax rate was 6.4% for the nine months ended September 30, 2017 as compared to 35.2% for the nine months ended September 30, 2016. The effective tax rate of 6.4% for the nine months ended September 30, 2017 (the(6.6)% (a tax benefit of $28.2$1.6 million on the pretax book lossincome of $444.3$24.0 million) for the three months ended March 31, 2021, as compared to 23.2% for the three months ended March 31, 2020. The effective tax rate for the three months ended March 31, 2021 was significantly differentlower than the statutory federal tax rate of 35% because the $358.2 million impairment of goodwill (see Note 4) is not deductible for federal income tax purposes and therefore has no associated tax benefit. The Company did recognize a tax benefit of $65.1 million as a discrete item relatedprior year period primarily due to the $173.4 million impairmentrecognition of Applebee's tradename.excess tax benefits on stock-based compensation.
The total gross unrecognized tax benefit as of September 30, 2017March 31, 2021 and December 31, 20162020 was $5.9$2.5 million and $3.9$2.2 million, respectively, excluding interest, penalties and related tax benefits. The Company estimates the unrecognized tax benefit as of March 31, 2021 may decrease over the upcoming 12 months by an amount up to $1.8$0.8 million related to settlements with taxing authorities and the lapse ofexpiring statutes of limitations. For the remaining liability, due to the uncertainties related to these tax matters, the Company is unable to make a reasonably reliablereasonable estimate as to when cash settlement with a taxing authority will occur.
As of September 30, 2017,March 31, 2021, accrued interest was $1.0$0.9 million and accrued penalties were less than $0.1 million, excluding any related income tax benefits. As of December 31, 2016,2020, accrued interest was $1.0$0.9 million and accrued penalties were less than $0.1 million, excluding any related income tax benefits. The Company recognizes interest accrued related to unrecognized tax benefits and penalties as a component of its income tax provision recognized in its Consolidated Statements of Comprehensive Income.
The Company files federal income tax returns and the Company or one of its subsidiaries filesfile income tax returns in various state and foreigninternational jurisdictions. With few exceptions, the Company is no longer subject to federal tax examinations by tax authorities for years before 2017 and state or non-United States tax examinations by tax authorities for years before 2011. The Internal Revenue Service commenced examination of the Company’s U.S. federal income tax return for the tax years 2011 to 2013 during the year. The examination is currently in process. The Company believes that adequate reserves have been provided relatingrelated to all matters contained in the tax periods open to examination.
On March 11, 2021, the American Rescue Plan Act of 2021 (“ARP Act”) was enacted in response to the COVID-19 pandemic. The Company is continuing to evaluate the impact of the ARP Act, but at present does not expect the ARP Act would result in a material impact to our income tax benefit or provision.
DineEquity,Dine Brands Global, Inc. and Subsidiaries
Notes to Consolidated Financial Statements (Continued)
7.10. Stock-Based Compensation
The following table summarizes the components of stock-based compensation expense included in general and administrative expenses in the Consolidated Statements of Comprehensive Income:
| | | | Three months ended September 30, | | Nine months ended September 30, | |
| | 2017 | | 2016 | | 2017 | | 2016 | | | | Three months ended March 31, |
| | (In millions) | | | | 2021 | | 2020 |
| Total stock-based compensation expense: | | | | | | | | Total stock-based compensation expense: | | (In millions) |
| | Equity classified awards expense | $ | 1.3 |
| | $ | 2.6 |
| | $ | 9.0 |
| | $ | 8.3 |
| Equity classified awards expense | | | $ | 3.1 | | | $ | 4.1 | |
| Liability classified awards expense | — |
| | (0.5 | ) | | (1.1 | ) | | 0.6 |
| |
| Liability classified awards expense (credit) | | Liability classified awards expense (credit) | | | 1.5 | | | (0.6) | |
| Total pre-tax stock-based compensation expense | 1.3 |
| | 2.1 |
| | 7.9 |
| | 8.9 |
| Total pre-tax stock-based compensation expense | | | 4.6 | | | 3.5 | |
| Book income tax benefit | (0.5 | ) | | (0.7 | ) | | (3.0 | ) | | (3.3 | ) | Book income tax benefit | | | (1.1) | | | (0.9) | |
| Total stock-based compensation expense, net of tax | $ | 0.8 |
| | $ | 1.4 |
| | $ | 4.9 |
| | $ | 5.6 |
| Total stock-based compensation expense, net of tax | | | $ | 3.5 | | | $ | 2.6 | |
As of September 30, 2017,March 31, 2021, total unrecognized compensation expense of $17.6$23.6 million related to restricted stock and restricted stock units and $3.2$4.6 million related to stock options are expected to be recognized over a weighted average period of 2.11.7 years for restricted stock and restricted stock units and 1.91.8 years for stock options.
Fair Value Assumptions
The Company granted 537,03091,743 stock options during the ninethree months ended September 30, 2017March 31, 2021 for which the fair value was estimated using a Black-Scholes option pricing model. The following summarizes the weighted average assumptions used in the Black-Scholes model:
|
| | | | |
| Risk-free interest rate | 1.90.5 | % |
Weighted average historicalHistorical volatility | 22.967.7 | % |
| Dividend yield | 7.30 | % |
| Expected years until exercise | 4.5 |
|
Weighted average fairFair value of options granted | $4.3139.85 |
The Company granted 350,000 performance-based stock options and 175,000 performance-based restricted stock units during the three months ended September 30, 2017 for which the fair value was estimated using a Monte Carlo simulation method. The following summarizes the assumptions used in estimating the fair values:
|
| | |
Risk-free interest rate | 1.6 | % |
Weighted average historical volatility | 30.0 | % |
Dividend yield | 9.6 | % |
Expected years until exercise | 3.4 |
|
Weighted average fair value of options granted | $3.07 |
Weighted average fair value of restricted stock units granted | $10.19 |
DineEquity, Inc. and Subsidiaries
Notes to Consolidated Financial Statements (Continued)
7. Stock-Based Compensation (Continued)
Equity Classified Awards - Stock Options
Stock option balances at September 30, 2017,March 31, 2021, and activity for the ninethree months ended September 30, 2017March 31, 2021 were as follows:
| | | | | | | | | | | | | | | | | | | | | | | | | | |
| | | Shares | | Weighted
Average
Exercise
Price | | Weighted Average
Remaining
Contractual Term
(in Years) | | Aggregate
Intrinsic
Value (in Millions) |
| Outstanding at December 31, 2020 | | 1,014,670 | | | $ | 64.16 | | | | | |
| Granted | | 91,743 | | | 74.57 | | | | | |
| Exercised | | (428,376) | | | 45.48 | | | | | |
| Expired | | (20,169) | | | 98.11 | | | | | |
| Forfeited | | (36,093) | | | 88.46 | | | | | |
| Outstanding at March 31, 2021 | | 621,775 | | | 76.06 | | | 6.7 | | $ | 10.5 | |
| Vested at March 31, 2021 and Expected to Vest | | 595,541 | | | 75.87 | | | 6.6 | | $ | 10.2 | |
| Exercisable at March 31, 2021 | | 423,603 | | | $ | 72.91 | | | 5.6 | | $ | 8.7 | |
|
| | | | | | | | | | | | | |
| | | Shares | | Weighted Average Exercise Price | | Weighted Average Remaining Contractual Term (in Years) | | Aggregate Intrinsic Value (in Millions) |
| Outstanding at December 31, 2016 | | 701,134 |
| | $ | 80.04 |
| | | | |
|
| Granted | | 887,030 |
| | 48.35 |
| | | | |
|
| Exercised | | (64,916 | ) | | 40.59 |
| | | | |
|
| Expired | | (58,217 | ) | | 84.43 |
| | | | |
| Forfeited | | (171,847 | ) | | 65.82 |
| | | | |
|
| Outstanding at September 30, 2017 | | 1,293,184 |
| | 61.98 |
| | 7.3 | | $ | 0.9 |
|
| Vested at September 30, 2017 and Expected to Vest | | 1,111,610 |
| | 64.50 |
| | 7.0 | | $ | 0.6 |
|
| Exercisable at September 30, 2017 | | 456,308 |
| | $ | 81.35 |
| | 3.3 | | $ | 0.0 |
|
The aggregate intrinsic value in the table above represents the total pre-tax intrinsic value (the difference between the closing stock price of the Company’s common stock on the last trading day of the thirdfirst quarter of 20172021 and the exercise price, multiplied by the number of in-the-money options) that would have been received by the option holders had all option holders exercised their options on September 30, 2017.March 31, 2021. The aggregate intrinsic value will change based on the fair market value of the Company’s common stock and the number of in-the-money options.
Dine Brands Global, Inc. and Subsidiaries
Notes to Consolidated Financial Statements (Continued)
10. Stock-Based Compensation (Continued)
Equity Classified Awards - Restricted Stock and Restricted Stock Units
Outstanding balances as of September 30, 2017,March 31, 2021, and activity related to restricted stock and restricted stock units for the ninethree months ended September 30, 2017March 31, 2021 were as follows:
| | | | | | | | | | | | | | | | | | | | | | | | | | |
| | | Restricted
Stock | | Weighted
Average
Grant Date
Fair Value | | Stock-Settled Restricted
Stock Units | | Weighted
Average
Grant Date
Fair Value |
| Outstanding at December 31, 2020 | | 254,331 | | | $ | 76.50 | | | 355,570 | | | $ | 28.01 | |
| Granted | | 110,840 | | | 82.44 | | | 68,578 | | | 62.92 | |
| Released | | (40,416) | | | 66.16 | | | (314,713) | | | 22.84 | |
| Forfeited | | (18,644) | | | 84.15 | | | 0 | | | 0 | |
| Outstanding at March 31, 2021 | | 306,111 | | | $ | 79.55 | | | 109,435 | | | $ | 64.76 | |
|
| | | | | | | | | | | | | | |
| | | Restricted Stock | | Weighted Average Grant Date Fair Value | | Restricted Stock Units | | Weighted Average Grant Date Fair Value |
| Outstanding at December 31, 2016 | | 235,472 |
| | $ | 92.81 |
| | 34,058 |
| | $ | 93.95 |
|
| Granted | | 208,460 |
| | 52.08 |
| | 275,578 |
| | 22.37 |
|
| Released | | (89,911 | ) | | 88.65 |
| | (12,683 | ) | | 81.63 |
|
| Forfeited | | (73,409 | ) | | 79.44 |
| | — |
| | — |
|
| Outstanding at September 30, 2017 | | 280,612 |
| | $ | 67.38 |
| | 296,953 |
| | $ | 28.39 |
|
Liability Classified Awards - Cash-settled Restricted Stock Units
The Company has granted cash-settled restricted stock units to certain employees. These instruments are recorded as liabilities at fair value as of the respective period end.
| | | | | | | | |
| | Cash-Settled Restricted
Stock Units |
| Outstanding at December 31, 2020 | | 52,956 | |
| | |
| Released | | (38,171) | |
| Forfeited | | (54) | |
| Outstanding at March 31, 2021 | | 14,731 | |
For the three months ended March 31, 2021 and 2020, an expense of $1.4 million and a credit of $1.3 million, respectively, was included as stock-based compensation expense related to cash-settled restricted stock units. At March 31, 2021 and December 31, 2020, liabilities of $0.8 million and $2.1 million, respectively, related to cash-settled restricted stock units were included as part of accrued employee compensation and benefits in the Consolidated Balance Sheets.
Liability Classified Awards - Long-Term Incentive Awards
The Company has granted cash long-term incentive awards (“LTIP awards”) to certain employees. Annual LTIP awards vest over a three-yearthree-year period and are determined using a multipliermultipliers from 0% to 200% of the target award based on the total stockholder return of DineEquityDine Brands Global common stock compared to the total stockholder returns of a peer group of companies. Although LTIP awards are only paid in cash, since the multiplier is based on the price of the Company's common stock, theThe awards are considered stock-based compensation in accordance with U.S. GAAP and are classified as liabilities.liabilities measured at fair value as of the respective period end. For the three months ended September 30, 2017, no expense was recognized. For the three months ended September 30, 2016, a credit of $0.5 million was included in total stock-based compensation expense related to LTIP awards. For the nine months ended September 30, 2017March 31, 2021 and 2016, a credit of $1.0 million and2020, an expense of $0.6$0.1 million and $0.8 million, respectively, were included in total stock-based compensation expense related to LTIP awards. At September 30, 2017March 31, 2021 and December 31, 2016,2020, liabilities of less than $0.1$0.8 million and liabilities of $1.2$2.1 million, respectively, related to LTIP awards were included as part of accrued employee compensation and benefits in the Consolidated Balance Sheets.
11. Segments
The Company identifies its reporting segments based on the organizational units used by management to monitor performance and make operating decisions. The Company currently has 5 operating segments: Applebee's franchise operations, Applebee's company-operated restaurant operations, IHOP franchise operations, rental operations and financing operations. The Company has 4 reportable segments: franchise operations, (an aggregation of Applebee's and IHOP franchise operations), company-operated restaurant operations, rental operations and financing operations. The Company
considers these to be its reportable segments, regardless of whether any segment exceeds 10% of consolidated revenues, income before income tax provision or total assets.
DineEquity,Dine Brand Global, Inc. and Subsidiaries
Notes to Consolidated Financial Statements (Continued)
11. Segments (Continued)
8. Segments
The Company currently has three operating segments: franchise operations (an aggregation of Applebee’s and IHOP franchise operations), rental operations and financing operations. Prior to June 2017, the Company operated 10 IHOP restaurants and those operations were considered to be a fourth operating segment. The Company views all operating segments as reportable segments regardless of whether an operating segment exceeds 10% of consolidated revenues, segment profit or total assets.
As of September 30, 2017,March 31, 2021, the franchise operations segment consisted of (i) 1,9451,636 restaurants operated by Applebee’s franchisees in the United States, two2 U.S. territories and 1411 countries outside the United States and (ii) 1,7611,749 restaurants operated by IHOP franchisees and area licensees in the United States, three2 U.S. territories and 137 countries outside the United States. Franchise operations revenue consists primarily of franchise royalty revenues, franchise advertising revenue, sales of proprietary products to franchisees (primarily pancake and waffle dry mixes for the IHOP restaurants), franchise advertising fees from domestic IHOP restaurants and international restaurants of both brands and franchise fees. Franchise operations expenses include advertising expenses, from domestic IHOP restaurants and international restaurants of both brands, the cost of IHOP proprietary products, bad debt expense, franchisor contributions to marketing funds, pre-opening training expenses and other franchise-related costs.
Company restaurant sales are retail sales at 69 Applebee's company-operated restaurants. Company restaurant expenses are operating expenses at company-operated restaurants and include food, labor, utilities, rent and other restaurant operating costs.
Rental operations revenue includes revenue from operating leases and interest income from direct financing leases. Rental operations expenses are costs of operating leases and interest expense from capitalfinance leases on franchisee-operated restaurants.
Company restaurant sales are retail sales at company-operated restaurants. Company restaurant expenses are operating expenses at company-operated restaurants and include food, labor, utilities, rent and other restaurant operating costs. In June 2017,which the Company refranchised nine of ten company-operated restaurants inis the Cincinnati, Ohio market area; the one restaurant not refranchised was permanently closed. As a result, the Company no longer operates any IHOP restaurants on a permanent basis. The Company has not presented these restaurants as discontinued operations as defined by U.S. GAAP because the refranchising of nine restaurants out of a total of over 3,700 restaurants did not represent a strategic shift that had a major effect on the Company's operations.
From time to time, the Company may operate IHOP restaurants reacquired from franchisees on a temporary basis until those restaurants are refranchised. There were no IHOP restaurants under temporary operation at September 30, 2017.
lessee.
Financing operations revenuerevenues primarily consistsconsist of interest income from the financing of IHOP equipment leases and franchise fees and equipment leases and sales of equipment associated with refranchised IHOP restaurants.interest income on Applebee's notes receivable from franchisees. Financing expenses are primarily the cost of restauranttaxes related to IHOP equipment associated with refranchised IHOP restaurants.leases.
Information on segments is as follows:
| | | | | | | | | | | | | | | | | | |
| | | | |
| | | | | Three months ended March 31, |
| | | | | | | 2021 | | 2020 |
| | | | | | | (In millions) |
| Revenues from external customers: | | | | | | | | |
| | | | | | | | |
| Franchise operations | | | | | | $ | 141.0 | | | $ | 145.1 | |
| Rental operations | | | | | | 26.1 | | | 29.0 | |
| Company restaurants | | | | | | 36.0 | | | 31.3 | |
| Financing operations | | | | | | 1.1 | | | 1.5 | |
| Total | | | | | | $ | 204.2 | | | $ | 206.9 | |
| | | | | | | | |
| Interest expense: | | | | | | | | |
| | | | | | | | |
| Rental operations | | | | | | $ | 1.3 | | | $ | 1.6 | |
| Company restaurants | | | | | | 0.9 | | | 0.5 | |
| Corporate | | | | | | 16.5 | | | 15.2 | |
| Total | | | | | | $ | 18.7 | | | $ | 17.3 | |
| | | | | | | | |
| Depreciation and amortization: | | | | | | | | |
| | | | | | | | |
| Franchise operations | | | | | | $ | 2.5 | | | $ | 2.6 | |
| Rental operations | | | | | | 2.8 | | | 3.1 | |
| Company restaurants | | | | | | 1.8 | | | 1.6 | |
| Corporate | | | | | | 2.9 | | | 3.3 | |
| Total | | | | | | $ | 10.0 | | | $ | 10.6 | |
| | | | | | | | |
| Gross profit, by segment: | | | | | | | | |
| | | | | | | | |
| Franchise operations | | | | | | $ | 76.0 | | | $ | 75.6 | |
| Rental operations | | | | | | 5.2 | | | 6.5 | |
| Company restaurants | | | | | | 3.1 | | | 1.0 | |
| Financing operations | | | | | | 1.0 | | | 1.3 | |
| Total gross profit | | | | | | 85.3 | | | 84.4 | |
| Corporate and unallocated expenses, net | | | | | | (61.3) | | | (55.3) | |
| Income before income taxes | | | | | | $ | 24.0 | | | $ | 29.1 | |
DineEquity,Dine Brands Global, Inc. and Subsidiaries
Notes to Consolidated Financial Statements (Continued)
8. Segments (Continued)
Information on segments12. Net Income per Share
The computation of the Company's basic and diluted net income per share is as follows:
| | | | | | | | | | | | | | | | | |
| | | |
| | | | Three months ended March 31, |
| | | | | | 2021 | | 2020 |
| | | | | (In thousands, except per share data) |
| Numerator for basic and diluted income per common share: | | | | | | | |
| Net income | | | | | $ | 25,603 | | | $ | 22,328 | |
| Less: Net income allocated to unvested participating restricted stock | | | | | (548) | | | (748) | |
| Net income available to common stockholders - basic | | | | | 25,055 | | | 21,580 | |
| Effect of unvested participating restricted stock in two-class calculation | | | | | 6 | | | 4 | |
| | | | | | | |
| Net income available to common stockholders - diluted | | | | | $ | 25,061 | | | $ | 21,584 | |
| Denominator: | | | | | | | |
| Weighted average outstanding shares of common stock - basic | | | | | 16,460 | | | 16,263 | |
| Dilutive effect of stock options | | | | | 170 | | | 207 | |
| Weighted average outstanding shares of common stock - diluted | | | | | 16,630 | | | 16,470 | |
| Net income per common share: | | | | | | | |
| Basic | | | | | $ | 1.52 | | | $ | 1.33 | |
| Diluted | | | | | $ | 1.51 | | | $ | 1.31 | |
13. Closure and Impairment Charges
Closure and Long-lived Asset Impairment Charges
Closure and long-lived tangible asset impairment charges for the three months ended March 31, 2021 were as follows:
| | | | | | | | | | | | | | | | | | |
| | | | Three Months Ended |
| | | | March 31, |
| | | | | | 2021 | | 2020 |
| | | | | | (In millions) |
| Closure charges | | | | | | $ | 1.9 | | | $ | (0.0) | |
| Long-lived tangible asset impairment | | | | | | 0.1 | | | 0.0 | |
| Total closure and long-lived asset impairment charges | | | | | | $ | 2.0 | | | $ | (0.0) | |
Closure Charges
The closure charges of $1.9 million for the three months ended March 31, 2021 related to the establishment of or revision to closure reserves for approximately 35 IHOP restaurants.
Long-lived Tangible Asset Impairment
The long-lived asset impairment of $0.1 million for the three months ended March 31, 2021 related 1 IHOP franchisee-operated restaurant for which the carrying amount exceeded the undiscounted cash flows. The impairment recorded represented the difference between the carrying value and the estimated fair value. The impairment related to operating lease right-of-use assets that had been recorded in 2019 upon adoption of new lease accounting guidance codified in Accounting Standards Codification Topic 842.
|
| | | | | | | | | | | | | | | | |
| | | Three months ended September 30, | | Nine months ended September 30, |
| | | 2017 | | 2016 | | 2017 | | 2016 |
| | | (In millions) |
| Revenues from external customers: | | |
| | |
| | | | |
| Franchise operations | | $ | 112.3 |
| | $ | 119.2 |
| | $ | 351.4 |
| | $ | 366.7 |
|
| Rental operations | | 30.3 |
| | 30.5 |
| | 90.9 |
| | 92.7 |
|
| Company restaurants | | — |
| | 4.0 |
| | 7.5 |
| | 13.4 |
|
| Financing operations | | 2.1 |
| | 2.3 |
| | 6.3 |
| | 7.0 |
|
| Total | | $ | 144.7 |
| | $ | 156.0 |
| | $ | 456.0 |
| | $ | 479.8 |
|
| | | | | | | | | |
| Interest expense: | | |
| | |
| | | | |
| Rental operations | | $ | 2.6 |
| | $ | 2.9 |
| | $ | 8.0 |
| | $ | 9.0 |
|
| Company restaurants | | — |
| | 0.1 |
| | 0.2 |
| | 0.3 |
|
| Corporate | | 15.4 |
| | 15.4 |
| | 46.5 |
| | 46.1 |
|
| Total | | $ | 18.0 |
| | $ | 18.4 |
| | $ | 54.7 |
| | $ | 55.4 |
|
| | | | | | | | | |
| Depreciation and amortization: | | |
| | |
| | | | |
| Franchise operations | | $ | 2.7 |
| | $ | 2.7 |
| | $ | 8.1 |
| | $ | 7.9 |
|
| Rental operations | | 3.0 |
| | 3.1 |
| | 9.1 |
| | 9.4 |
|
| Company restaurants | | — |
| | 0.1 |
| | 0.1 |
| | 0.3 |
|
| Corporate | | 1.9 |
| | 1.5 |
| | 5.8 |
| | 5.3 |
|
| Total | | $ | 7.6 |
| | $ | 7.4 |
| | $ | 23.1 |
| | $ | 22.9 |
|
| | | | | | | | | |
| Gross profit, by segment: | | |
| | |
| | | | |
| Franchise operations | | $ | 70.5 |
| | $ | 81.9 |
| | $ | 235.7 |
| | $ | 258.7 |
|
| Rental operations | | 8.0 |
| | 7.7 |
| | 23.2 |
| | 23.7 |
|
| Company restaurants | | (0.0 | ) | | (0.2 | ) | | (0.3 | ) | | (0.7 | ) |
| Financing operations | | 1.6 |
| | 2.3 |
| | 5.9 |
| | 6.8 |
|
| Total gross profit | | 80.1 |
| | 91.7 |
| | 264.5 |
| | 288.5 |
|
| Corporate and unallocated expenses, net | | (588.4 | ) | | (54.2 | ) | | (708.8 | ) | | (170.1 | ) |
| (Loss) income before income tax provision | | $ | (508.3 | ) | | $ | 37.5 |
| | $ | (444.3 | ) | | $ | 118.3 |
|
DineEquity,Dine Brands Global, Inc. and Subsidiaries
Notes to Consolidated Financial Statements (Continued)
9. Net (Loss) Income per Share
The computation of the Company's basic and diluted net (loss) income per share is as follows:
|
| | | | | | | | | | | | | | | |
| | Three months ended September 30, | | Nine months ended September 30, |
| | 2017 | | 2016 | | 2017 | | 2016 |
| | (In thousands, except per share data) |
| Numerator for basic and diluted (loss) income per common share: | |
| | |
| | | | |
| Net (loss) income | $ | (451,718 | ) | | $ | 24,273 |
| | $ | (416,075 | ) | | $ | 76,645 |
|
| Less: Net loss (income) allocated to unvested participating restricted stock | 8,496 |
| | (338 | ) | | 6,921 |
| | (1,103 | ) |
| Net (loss) income available to common stockholders - basic | (443,222 | ) | | 23,935 |
| | (409,154 | ) | | 75,542 |
|
| Effect of unvested participating restricted stock in two-class calculation | — |
| | 1 |
| | 5 |
| | 3 |
|
| Net (loss) income available to common stockholders - diluted | $ | (443,222 | ) | | $ | 23,936 |
| | $ | (409,149 | ) | | $ | 75,545 |
|
| Denominator: | |
| | |
| | | | |
| Weighted average outstanding shares of common stock - basic | 17,742 |
| | 17,950 |
| | 17,718 |
| | 18,099 |
|
| Dilutive effect of stock options | — |
| | 91 |
| | — |
| | 102 |
|
| Weighted average outstanding shares of common stock - diluted | 17,742 |
| | 18,041 |
| | 17,718 |
| | 18,201 |
|
| Net (loss) income per common share: | |
| | |
| | | | |
| Basic | $ | (24.98 | ) | | $ | 1.33 |
| | $ | (23.09 | ) | | $ | 4.17 |
|
| Diluted | $ | (24.98 | ) | | $ | 1.33 |
| | $ | (23.09 | ) | | $ | 4.15 |
|
For the three and nine months ended September 30, 2017, diluted loss per common share was computed using the weighted average number of shares outstanding during each period as the 1,000 and 11,000 shares, respectively, from common stock equivalents would have been antidilutive.
10.14. Fair Value Measurements
The Company does not have a material amount of financial assets or liabilities that are required under U.S. GAAP to be measured on a recurring basis at fair value. The Company is not a party to any material derivative financial instruments. The Company does not have a material amount of non-financial assets or non-financial liabilities that are required under U.S. GAAP to be measured at fair value on a recurring basis. The Company has not elected to use the fair value measurement option, as permitted under U.S. GAAP, for any assets or liabilities for which fair value measurement is not presently required.
The Company believes the fair values of cash equivalents, accounts receivable and accounts payable approximate their carrying amounts due to their short duration.
The fair values of the Company's Series 2014-12019 Class A-2 Notes (the “Class A-2 Notes”) at September 30, 2017March 31, 2021 and December 31, 20162020 were as follows:
|
| | | | | | | | | | | | | | | | |
| | | September 30, 2017 | | December 31, 2016 |
| | | Carrying Amount | | Fair Value | | Carrying Amount | | Fair Value |
| | | (In millions) |
| Long-term debt, current and long-term | | $ | 1,285.2 |
| | $ | 1,274.0 |
| | $ | 1,282.7 |
| | $ | 1,286.2 |
|
| | | | | | | | | | | | | | | | | |
| | | March 31, 2021 | December 31, 2020 |
| | | (In millions) |
| Face Value of Class A-2 Notes | | $ | 1,293.5 | | | $ | 1,296.8 | | |
| Fair Value of Class A-2 Notes | | $ | 1,338.5 | | | $ | 1,259.5 | | |
The fair values were determined based on Level 2 inputs, including information gathered from brokers who trade in the Company’s 2019 Class A-2 Notes, andas well as information on notes that are similar to those of the Company.
DineEquity, Inc. and Subsidiaries
Notes to Consolidated Financial Statements (Continued)
11.15. Commitments and Contingencies
Litigation, Claims and Disputes
The Company is subject to various lawsuits, administrative proceedings, audits and claims arising in the ordinary course of business. Some of these lawsuits purport to be class actions and/or seek substantial damages. The Company is required under U.S. GAAP to record an accrual for litigation loss contingencies that are both probable and reasonably estimable. Legal fees and expenses associated with the defense of all of the Company's litigation are expensed as such fees and expenses are incurred. Management regularly assesses the Company's insurance coverage, analyzes litigation information with the Company's attorneys and evaluates the Company's loss experience in connection with pending legal proceedings. While the Company does not presently believe that any of the legal proceedings to which it is currently a party will ultimately have a material adverse impact on the Company, there can be no assurance that the Company will prevail in all the proceedings the Company is party to, or that the Company will not incur material losses from them.
Lease Guarantees
In connection with the sale of Applebee’s restaurants or previous brands to franchisees, and other parties, the Company has, in certain cases, guaranteed or has potential continuing liability for lease payments totaling $325.2$235.9 million as of September 30, 2017.March 31, 2021. This amount represents the maximum potential liability for future payments under these leases. These leases have been assigned to the buyers and expire at the end of the respective lease terms, which range from 20172021 through 2048.2048. Excluding unexercised option periods, the Company's potential liability for future payments under these leases is $54.5$34.2 million. In the event of default, the indemnity and default clauses in the sale or assignment agreements govern the Company's ability to pursue and recover damages incurred.No material lease payment guarantee liabilities have been recorded as of September 30, 2017.
12. Allowance for Credit Losses
The Company's allowance for credit losses at September 30, 201716. Cash, Cash Equivalents and December 31, 2016 was $13.1 million and $3.1 million, respectively.
13. Restricted Cash
Cash and Cash Equivalents
The Company considers all highly liquid investment securities with remaining maturities at the date of purchase of three months or less to be cash equivalents. These cash equivalents are stated at cost which approximates market value. Cash held related to IHOP advertising funds and the Company's gift card programs is not considered to be restricted cash as there are no restrictions on the use of these funds.
Dine Brands Global, Inc. and Subsidiaries
Notes to Consolidated Financial Statements (Continued)
16. Restricted Cash (Continued)
The components of cash and cash equivalents were as follows:
| | | | | | | | | | | |
| March 31, 2021 | | December 31, 2020 |
| | (In millions) |
| Money market funds | $ | 30.0 | | | $ | 175.0 | |
| IHOP advertising funds and gift card programs | 72.0 | | | 71.6 | |
| Other depository accounts | 77.6 | | | 136.8 | |
| Total cash and cash equivalents | $ | 179.6 | | | $ | 383.4 | |
The decrease in total cash and cash equivalents between December 31, 2020 and March 31, 2021 was due to the repayment of $220.0 million previously drawn on the Company's Credit Facility.
Current Restricted Cash
Current restricted cash of $31.3 million at September 30, 2017 primarily consisted of $23.9 million of funds required to be held in trust in connection with the Company's securitized debt and $7.0 million of funds from Applebee's franchisees pursuant to franchise agreements, usage of which was restricted to advertising activities. CurrentThe components of current restricted cash of $30.3 million at December 31, 2016 primarily consisted of $25.7 million of funds required to be held in trust in connection with the Company's securitized debt and $4.3 million of funds from Applebee's franchisees pursuant to franchise agreements, usage of which was restricted to advertising activities. were as follows:
| | | | | | | | | | | |
| |
| March 31, 2021 | | December 31, 2020 |
| | (In millions) |
| Securitized debt reserves | $ | 33.9 | | | $ | 27.0 | |
| Applebee's advertising funds | 26.1 | | | 12.8 | |
| Other | 0.1 | | | 0.1 | |
| Total current restricted cash | $ | 60.1 | | | $ | 39.9 | |
Non-current Restricted Cash
Non-current restricted cash of $14.7was $32.8 million at September 30, 2017both March 31, 2021 and December 31, 20162020 and represents interest reserves required to be set aside for the duration of the Company's securitized debt.
14. Refranchising of Company-operated Restaurants
In June 2017, The required reserve is approximately one quarter's interest payment on the Company completed the refranchising and sale of related restaurant assets of nine company-operated IHOP restaurants in the Cincinnati, Ohio market area. As part of the transaction, the Company entered into an asset purchase agreement, nine franchise agreements and nine sublease agreements for land and buildings.Company's securitized debt, currently approximately $16 million. The Company comparedvoluntarily increased the stated rent underamount held in non-current cash to twice the sublease agreements with comparable market rents and recorded net favorable lease assets of $2.3 million in connection with the transaction. The Company also received cash of $1.1 million and a note receivable for $4.8 million. After allocating a portion of the consideration to franchise fees and derecognition of the assets sold, the Company recognized a gain of $6.2 million on the refranchising and salerequired amount during the nine monthsyear ended September 30, 2017.December 31, 2020.
Item 2. Management’s Discussion and Analysis of Financial Condition and Results of Operations.
Cautionary Statement Regarding Forward-Looking Statements
Statements contained in this report may constitute forward-looking statements within the meaning of the Private Securities Litigation Reform Act of 1995. These statements involve known and unknown risks, uncertainties and other factors, which may cause actual results to be materially different from those expressed or implied in such statements. You can identify these forward-looking statements by words such as “may,” “will,” “should,” “could,” “expect,” “anticipate,” “believe,” “estimate,” “intend,” “plan” and other similar expressions. You should consider our forward-looking statements in light of the risks discussed under the heading “Risk Factors” in our most recent Annual Report on Form 10-K, as well as our consolidated financial statements, related notes, and the other financial information appearing elsewhere in this report and our other filings with the United States Securities and Exchange Commission. The forward-looking statements contained in this report are made as of the date hereof and the Company assumes no obligation to update or supplement any forward-looking statements.
You should read the following Management's Discussion and Analysis of Financial Condition and Results of Operations (“MD&A”) in conjunction with the consolidated financial statements and the related notes that appear elsewhere in this report. Statements contained in this report may constitute forward-looking statements within the meaning of the Private Securities Litigation Reform Act of 1995. Please refer to the section of this report under the heading “Cautionary Statement Regarding Forward-Looking Statements” for more information.
Overview
The following discussion and analysis provides information which we believe is relevant to an assessment and understanding of our consolidated results of operations and financial condition. The discussion should be read in conjunction with the consolidated financial statements and the notes thereto included in Item 1 of Part I of this Quarterly Report and the audited consolidated financial statements and notes thereto and the MD&A contained in the Company’s Annual Report on Form 10-K for the fiscal year ended December 31, 2016.2020. Except where the context indicates otherwise, the words “we,” “us,” “our,” “DineEquity”“Dine Brands Global” and the “Company” refer to DineEquity,Dine Brands Global, Inc., together with its subsidiaries that are consolidated in accordance with United States generally accepted accounting principles (“U.S. GAAP”). The financial tables appearing in MD&A present amounts in millions of dollars that are rounded from our consolidated financial statements presented in thousands of dollars. As a result, the tables may not foot or crossfoot due to rounding.
Through various subsidiaries, we own, franchise and franchiseoperate the Applebee's Neighborhood Grill & Bar® (“Applebee's”) concept in the bar and grill segment within the casual dining category of the restaurant industry and we own and franchise the International House of Pancakes® (“IHOP”) concept in the family dining category of the restaurant industry. References herein to Applebee's® and IHOP® restaurants are to these two restaurant concepts, whether operated by franchisees, or area licensees and their sub-licensees (collectively, “area licensees”). or by us. With over 3,7003,458 restaurants combined, allthe substantial majority of which are franchised, we believe we are one of the largest full-service restaurant companies in the world. The June 19, 2017 issue of Nation's Restaurant News reported that
We identify our business segments based on the organizational units used by management to monitor performance and make operating decisions. We currently have five operating segments: Applebee's franchise operations, Applebee's company-operated restaurant operations, IHOP franchise operations, rental operations and Applebee's were the largest restaurant systems in the family dining and casual dining categories, respectively, in terms of United States system-wide sales during 2016. This marks the tenth consecutive year our two brandsfinancing operations. We have achieved the number one ranking in Nation's Restaurant News.
The Company currently has three operatingfour reportable segments: franchise operations (an aggregation of Applebee’sApplebee's and IHOP franchise operations), company-operated restaurant operations, rental operations and financing operations. Prior to June 2017, the Company operated 10 IHOP restaurants and those operations were consideredWe consider these to be a fourth operating segment. The Company views all operating segments asour reportable segments, regardless of whether an operatingany segment exceeds 10% of consolidated revenues, segment profitincome before income tax provision or total assets.
Ongoing Impact of COVID-19 Pandemic
The global pandemic declared in March 2020 by the World Health Organization related to the outbreak of a novel strain of coronavirus, designated “COVID-19,” continued to have an adverse impact on our operations during the three months ended March 31, 2021. The operating status of our restaurants was fluid throughout the first quarter of 2021 and subject to change as governmental authorities increased or reduced restrictions on restaurant operations in response to changes in the number of COVID-19 infections and in the availability and acceptance of vaccines within their respective jurisdictions. While the significant majority of our restaurants were open for in-restaurant dining during the three months ended March 31, 2021, many federal, state, local and international governments maintained protocols that limited restaurant dine-in occupancy levels to less than 100% of capacity.As of March 31, 2021, the operating status of our restaurants was as follows:
| | | | | | | | | | | | | | | | | |
| Status as of March 31, 2021 |
| Domestic | | |
| Dining room capacity %/other status | Applebee's | | IHOP | | International |
| 100% capacity | 374 | | | 183 | | | — | |
| > 50% capacity | 142 | | | 135 | | | 31 | |
| 26%-50% capacity | 959 | | | 1,086 | | | 112 | |
| Up to 25% capacity | 106 | | | 209 | | | 28 | |
| Off-premise/outdoors only and other | 9 | | | 21 | | | 22 | |
| Restaurants temporarily closed | 6 | | | 26 | | | 9 | |
| Total | 1,596 | | | 1,660 | | | 202 | |
Federal, state, local and international governments, began to implement restrictions on in-restaurant dining around the second week of March, 2020. Accordingly, during the three months ended March 31, 2020, our restaurants essentially operated without restriction for the first 10 weeks of the quarter, followed by an increasing level of restriction over the final three weeks of the quarter. As of March 31, 2020, the operating status of our restaurants was as follows :
| | | | | | | | | | | | | | | | | |
| Status as of March 31, 2020 |
| Domestic | | |
| Restaurant status | Applebee's | | IHOP | | International |
| Dining rooms open* | 4 | | | 204 | | | 63 | |
| Off-premise/outdoors only and other | 1,402 | | | 1,158 | | | 55 | |
| Restaurants temporarily closed | 251 | | | 347 | | | 131 | |
| Total | 1,657 | | | 1,709 | | | 249 | |
* In most instances limited to 50% capacity or less, and/or reduced operating hours.
Note that at the onset of the pandemic, information as to restaurant capacity was not available in the same detail as current data and therefore the dining room capacity details are unavailable as of March 31, 2020. Temporary closures can occur for a variety of reasons, and all temporary closures shown in the tables above were not necessarily related to COVID-19 restrictions.
Updates to several actions taken over the past 12 months to mitigate the effects of the COVID-19 pandemic on the Company, its operations and its franchisees, are discussed below:
•In March 2021, we repaid $220 million of borrowings outstanding under our revolving credit facility that initially had been drawn in March 2020. At the time of the initial draw, we had no immediate need for additional liquidity, but in light of then-current market conditions and significant uncertainty related to the COVID-19 pandemic, we drew on the revolving facility to maximize our financial flexibility. As of March 31, 2021, our borrowing capacity under the credit facility was $221.7 million. See Liquidity and Capital Resources of the Company.
•We offered Applebee's franchisees the opportunity to defer payment of their royalty, advertising and other fees, primarily amounts due for the months of March and April 2020. A total of 30 franchisees representing 94% of Applebee’s restaurants deferred payments totaling $33.4 million. Repayment of deferred amounts, scheduled over up to nine months, began in the third quarter of 2020. As of March 31, 2021, the outstanding balance of these deferrals was $3.9 million, with approximately $9.4 million collected during the three months ended March 31, 2021. Five franchisees have repaid their deferred balances in full.
•We offered IHOP franchisees the opportunity to defer their royalty, advertising, equipment rent and sublease rent payments, primarily amounts due for the months of March and April 2020. Initially, 193 franchisees representing 58% of IHOP restaurants deferred payments totaling $24.1 million. Including subsequent deferrals made on a case-by case basis, the deferral program totaled $28.5 million. Repayment of deferred amounts, scheduled over up to 36 weeks, began in the third quarter of 2020. In certain instances, repayments were temporarily paused for up to 60 days. As of March 31, 2021, the outstanding balance of these deferrals was $9.6 million, with approximately $6.8 million collected during the three months ended March 31, 2021. A total of 73 franchisees have repaid their deferred balances in full.
•We received rent deferrals and abatements on properties we lease of approximately $11 million during fiscal 2020, primarily related to rent deferrals for properties on which IHOP restaurants are located. As of March 31, 2021, the deferred rent balance of those deferrals was $2.4 million, with approximately $2.5 million paid during the three months ended March 31, 2021.
•We suspended our repurchasing of common stock after the first quarter of 2020. Our Board of Directors did not declare a dividend for the second, third and fourth quarters of 2020 and has decided not to declare a dividend for the first quarter of 2021. We evaluate dividend payments on common stock and repurchases of common stock within the context of our overall capital allocation strategy with our Board of Directors on an ongoing basis, giving consideration to our current and forecast earnings, financial condition, cash requirements and other factors. We will continue to evaluate our capital allocation strategy as industry conditions improve.
We have experienced a number of temporary and permanent closures of our restaurants during the COVID-19 pandemic. These closures occurred for a variety of reasons, and all closures were not necessarily related to the impact of the COVID-19 pandemic or related restrictions. We cannot predict how long the COVID-19 pandemic and its impact on our operations will last, whether or when recurrences of the virus and variants of the virus may arise, the availability and acceptance of vaccines, what restrictions on in-restaurant dining may be imposed or re-imposed, the timing and extent of customer re-engagement with our brands and, in general, what the short- and long-term impact on consumer discretionary spending the COVID-19 pandemic might have on our operations and the restaurant industry as a whole.
Key Financial Results
| | | | | | | | | | | | | | | | | | | | | | | | | | |
| | | | | | Three months ended March 31, | | Favorable
(Unfavorable) Variance |
| | | | | | | 2021 | | 2020 | |
| | | | | | | | | | | | |
| | | | | | | | | (In millions, except per share data) |
| Income before income taxes | | | | | | | | $ | 24.0 | | | $ | 29.1 | | | $ | (5.1) | |
| Income tax benefit (provision) | | | | | | | | 1.6 | | | (6.7) | | | 8.3 | |
| Net income | | | | | | | | $ | 25.6 | | | $ | 22.3 | | | $ | 3.3 | |
| | | | | | | | | | | | |
| | | | | | | | | | | | |
| Effective tax rate | | | | | | | | (6.6) | % | | 23.2 | % | | 29.8 | % |
| | | | | | | | | | | | |
| | | | | | | | | | | | |
| Net income per diluted share | | | | | | | | $ | 1.51 | | | $ | 1.31 | | | $ | 0.20 | |
| | | | | | | | | | | | % increase |
| Weighted average diluted shares | | | | | | | | 16.6 | | | 16.5 | | | 1.0 | % |
|
| | | | | | | | | | | | | | | | | | | | | | | | |
| | | Three months ended September 30, | | Favorable
(Unfavorable) Variance | | Nine months ended September 30, | | Favorable
(Unfavorable) Variance |
| | | 2017 | | 2016 | | 2017 | | 2016 | |
| | | (In millions, except per share data) |
| (Loss) income before income taxes | | $ | (508.3 | ) | | $ | 37.5 |
| | $ | (545.8 | ) | | $ | (444.3 | ) | | $ | 118.3 |
| | $ | (562.7 | ) |
| Income tax benefit (provision) | | 56.6 |
| | (13.2 | ) | | 69.8 |
| | 28.2 |
| | (41.7 | ) | | 69.9 |
|
| Net (loss) income | | $ | (451.7 | ) | | $ | 24.3 |
| | $ | (476.0 | ) | | $ | (416.1 | ) | | $ | 76.6 |
| | $ | (492.7 | ) |
| | | | | | | | | | | | | |
| Effective tax rate | | 11.1 | % | | 35.3 | % | | (24.2 | )% | | 6.4 | % | | 35.2 | % | | (28.8 | )% |
| | | | | | | | | | | | | |
| | | | | | | % increase (decrease) | | | | | | % increase (decrease) |
| Net (loss) income per diluted share | | $ | (24.98 | ) | | $ | 1.33 |
| | n.m | | $ | (23.09 | ) | | $ | 4.15 |
| | n.m. |
| Weighted average shares | | 17.7 |
| | 18.0 |
| | (1.7 | )% | | 17.7 |
| | 18.2 |
| | (2.7 | )% |
n.m. - percentage change is not meaningfulThe tax benefit recognized for the three months ended March 31, 2021 primarily was due to the one-time recognition of excess tax benefits on stock-based compensation related to the departure of our previous chief executive officer.
The following sets forthtable highlights the significant reasons forprimary components of the decreasesdecrease in our income before income taxes between each offor the three and nine months ended September 30, 2017 andMarch 31, 2021, compared to our income before income taxes from the respective comparable periodssame period of 2016:2020:
| | | | | | | | | |
| | Favorable
(Unfavorable) Variance |
| | (In millions) |
| Increase (decrease) in gross profit: | | | |
| Applebee's franchise operations | | | $ | 1.0 | |
| IHOP franchise operations | | | (0.6) | |
| Company restaurant operations | | | 2.1 | |
| Rental and financing operations | | | (1.6) | |
| Total increase in gross profit | | | 0.9 | |
| Closure and impairment charges | | | (2.0) | |
| Increase in G&A expenses | | | (2.3) | |
| | | |
| | | |
| Other income and expense items | | | (1.6) | |
| Decrease in income before income taxes | | | $ | (5.1) | |
|
| | | | | | | | | | | |
| | Three months ended September 30, 2017 | | Nine months ended September 30, 2017 |
| | | (In millions) | |
| Impairment of Applebee's goodwill and tradename | | $ | (531.6 | ) | | | | $ | (531.6 | ) | |
| Decrease in gross profit: | | | | | | | |
| Applebee's franchise operations | | (10.8 | ) | | | | (23.4 | ) | |
| All other operations | | (0.8 | ) | | | | (0.6 | ) | |
| Total gross profit decrease | | (11.6 | ) | | | | (24.0 | ) | |
| Increase in General and Administrative (“G&A”) expenses: | | | | | | | |
| Executive separation costs | | — |
| | | | (8.8 | ) | |
| All other G&A | | (2.0 | ) | | | | (5.0 | ) | |
| Total G&A increase | | (2.0 | ) | | | | (13.8 | ) | |
| Gain on disposition of assets | | 0.1 |
| | | | 7.1 |
| |
| Other | | (0.7 | ) | | | | (0.4 | ) | |
| Decrease in income before income taxes | | $ | (545.8 | ) | | | | $ | (562.7 | ) | |
We performed an interim quantitative testrecognized closure and impairment charges of impairment of Applebee's goodwill and tradename$2.0 million during the three months ended September 30, 2017. AsMarch 31, 2021, primarily $1.9 million related to establishment of or revision to closure reserves for approximately 35 IHOP properties, as well as a result$0.1 million impairment to one IHOP property. There were no similar charges during the three months ended March 31, 2020.
See “Consolidated Results of performing this test, we recognized an impairmentOperations - Comparison of Applebee's goodwill of $358.2 millionthe Three Months ended March 31, 2021 and an impairment of Applebee's tradename of $173.4 million. See below under the heading “Significant Known Events, Trends or Uncertainties Impacting or Expecting to Impact Comparisons of Reported or Future Results - Impairment of Applebee's Goodwill and Tradename”March 31, 2020” for additional discussion of these impairments.the changes shown above.
Our effective tax rate (“ETR”) was significantly different than the federal statutory rate of 35% for the three and nine months ended September 30, 2017, as compared to the respective periods of the prior year. The primary reason for the difference is the impairment of Applebee's goodwill noted above is not a deductible expense for federal income tax purposes so we received no tax benefit from this expense. We did recognize a deferred tax benefit of approximately $65 million related to the impairment of Applebee's tradename.
Key Performance Indicators
In evaluating the performance of each restaurant concept, we consider the key performance indicators to be the system-wide sales percentage change, the percentage change in domestic system-wide same-restaurant sales (“compdomestic same-restaurant sales”) and, net franchise restaurant development.development and the change in effective restaurants. Changes in both compdomestic same-restaurant sales and in the number of Applebee's and IHOP franchise restaurants will impact our system-wide retail sales that drive franchise royalty revenues. Restaurant development also impacts franchise revenues in the form of initial franchise fees and, in the case of IHOP restaurants, sales of proprietary pancake and waffle dry mix.
Our key performance indicators for the three and nine months ended September 30, 2017 isMarch 31, 2021 were as follows:
| | | | | | | | | | | | | | | |
| Average Weekly Unit Sales | | | Three months ended March 31, 2021 |
| | | | | Applebee's | | IHOP |
| Sales percentage increase (decrease) in reported retail sales | | | | | 1.2 | % | | (12.1) | % |
| % increase (decrease) in domestic system-wide same-restaurant sales | | | | | 11.9 | % | | (0.9) | % |
Net franchise restaurant reduction (1) | | | | | (4) | | | (19) | |
Net decrease in total effective restaurants (2) | | | | | (69) | | | (101) | |
|
| | | | | | | | | | | |
| | Three months ended September 30, 2017 | | Nine months ended September 30, 2017 |
| | Applebee's | | IHOP | | Applebee's | | IHOP |
| Sales percentage decrease | (9.7 | )% | | (0.7 | )% | | (8.6 | )% | | (0.1 | )% |
| % decrease in domestic system-wide same-restaurant sales | (7.7 | )% | | (3.2 | )% | | (7.3 | )% | | (2.5 | )% |
Net franchise restaurant (reduction) development (1) | (23 | ) | | 9 |
| | (71 | ) | | 29 |
|
(1)Franchise and area license restaurant openings,closings, net of closingsopenings, during the three months ended March 31, 2021.
(2)Change in the weighted average number of franchise, area license and company-operated restaurants open during the three months ended March 31, 2021, compared to the weighted average number of those open during the same period of 2020.
The Applebee'schanges in sales percentage decreaseand domestic same-restaurant sales of both brands were impacted by the varying degrees of restrictions on in-restaurant dining in effect during each period. Restrictions were first initiated in early March of 2020 by federal, state, local and international governments in response to the declaration of the COVID-19 pandemic. As a result, for the first 10 weeks of the 2020 first quarter, our restaurants operated without restriction, but during the last three and nine months ended September 30, 2017weeks of that quarter, in-restaurant dining was dueessentially eliminated as most of our restaurants were either limited only to off-premise sales or were temporarily closed. For all 13 weeks of the combined2021 first quarter, most of our restaurants were open for in-restaurant dining, however, the majority of restaurants that were open were operating with some degree of capacity limitation. Additionally, the calculation of the percentage change in domestic same-restaurant sales was also impacted by a shift in the weeks of comparison because of a 53rd week in fiscal 2020.
In light of the distortive effects of declinesboth the pandemic and a 53rd week in comp sales and restaurant closures. The smaller IHOP sales percentage decrease forfiscal 2020 on the three and nine months ended September 30, 2017 was due to declines in comp sales that were partially offset by net restaurant development.
Detailed information on each of these key performance indicators is presented underas noted above, we believe a comparison of average weekly unit sales, a function of reported retail sales and the captions “Restaurant Data,” “Domestic Same-Restaurant Sales”number of effective restaurants, for the months of January, February and “Restaurant Development Activity” that follow.March of 2021 and 2020, provides additional insight into each brand's performance during the three months ended March 31, 2021 as compared to the same period of the prior year:
| | | | | | | | | | | | | | | | | | | | | | | | | | | | | | | | | | | |
| Applebee's | | IHOP |
| 2021 | | 2020 | | Increase (decrease) | | 2021 | | 2020 | | Increase (decrease) |
| (in thousands) |
| January | $ | 39.5 | | | $ | 49.8 | | | $ | (10.3) | | | $ | 24.8 | | | $ | 36.1 | | | $ | (11.3) | |
| February | $ | 43.5 | | | $ | 49.7 | | | $ | (6.2) | | | $ | 27.4 | | | $ | 35.0 | | | $ | (7.6) | |
| March | $ | 54.3 | | | $ | 35.1 | | | $ | 19.2 | | | $ | 35.1 | | | $ | 25.4 | | | $ | 9.7 | |
The decrease in total effective restaurants for each brand reflects both permanent closures, net of openings, over the past 12 months as well as the weighted effect of restaurants temporarily closed during the three months ended March 31, 2021.
Domestic Same-Restaurant Sales
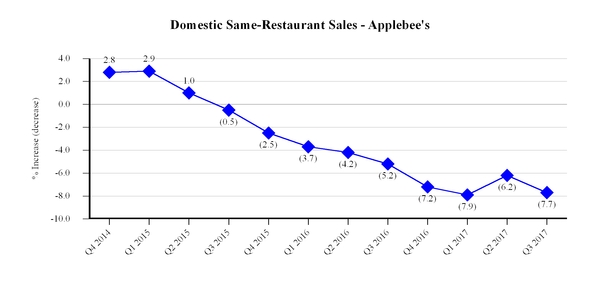
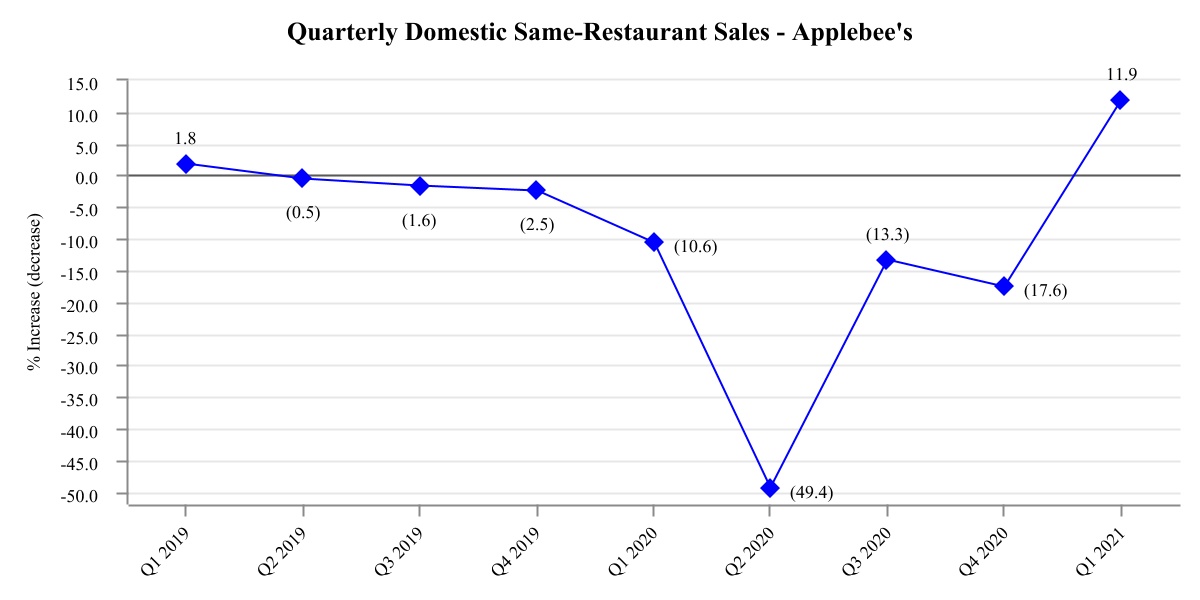
Applebee’s system-wide domestic system-wide same-restaurant sales decreased 7.7%increased 11.9% for the three months ended September 30, 2017 fromMarch 31, 2021 compared to the same periodthree months ended March 31, 2020. The increase primarily was due to a substantial increase in 2016. Most of the decrease resulted fromaverage check partially offset by a decline in customer traffic, as well as a small decreasetraffic. The increase in average customer check. Forcheck was primarily due to favorable mix shifts related to a reduction in core menu items, successful promotional offerings and a larger number of items purchased with off-premise orders. We believe the nine months ended September 30, 2017, Applebee’s domestic system-wide same-restaurant sales decreased 7.3% fromdistribution of the same periodlatest round of government stimulus checks that began in 2016. This decrease also resulted primarily from a decline in customer trafficMarch 2021 favorably impacted consumer spending behavior as well as a small decrease in average customer check.well.
Based on data from Black Box Intelligence, a restaurant sales reporting firm (“Black Box”), Applebee's increase in same-restaurant sales for the three months ended March 31, 2021 outperformed the casual dining segment of the restaurant industry (excluding Applebee's) during that same period. During the three months ended March 31, 2021, the casual dining segment also experienced an overall decreaseincrease in same-restaurant sales during boththat was due to an increase in average check and an increase in customer traffic. Applebee's increase in average check for the three and nine months ended September 30, 2017. TheMarch 31, 2021 was significantly larger than that of the casual dining decreases in both periods weresegment.
Off-premise sales totaled approximately $344 million and comprised 36.7% of sales mix for the three months ended March 31, 2021, as compared to approximately $153 million of sales comprising 16.3% of sales mix for the three months ended March 31, 2020.
IHOP's system-wide domestic same-restaurant sales decreased 0.9% for the three months ended March 31, 2021 compared to the three months ended March 31, 2020. The decrease was due to declinesa decline in customer traffic that were partiallywas nearly offset by an increase in average customer check. ForThe increase in average check was primarily due to consumer spending generally as well as increases in both the threemenu prices and nine months ended September 30, 2017, Applebee's declines in traffic and same-restaurant sales were substantially larger than those experienced by the overall casual dining segment. However, the 150 basis point decline in Applebee's same-restaurant sales from the second to the third quarter of 2017 was the same as that of the overall casual dining segment.
delivery prices. We believe the differential between Applebee's performance and thatdistribution of the casual dining segment is duelatest round of government stimulus checks that began in large part to tactical initiatives previously implemented by Applebee's that did not generate desired results and to the inconsistent quality of operations across the Applebee's system. We engaged third-party consultants during the first half of 2017 to assess the continued decline in Applebee's traffic and same-restaurant sales and to provide actionable recommendations to stabilize the decline. We expect to incur approximately $10 million of costs related to these stabilization initiatives in 2017, of which approximately $8 million was incurred during the nine months ended September 30, 2017. We also contributed $4 million toMarch 2021 favorably impacted consumer spending behavior.
the Applebee's National Advertising Fund (the “Applebee's NAF”) in the third quarter of 2017 to help mitigate the decline in franchisee contributions to the Applebee's NAF that are basedBased on a percentage of restaurant sales. We expect to contribute an additional $4 million to the Applebee's NAF in the fourth quarter of 2017. We may consider additional contributions in future periods as well.
Some of the stabilization actions we are implementing relate to brand repositioning and operational improvements that will take place over the next 12 to 18 months. Shorter-term actions, such as improving the quality of the customer experience across the Applebee's system, have shown improvement as the number of restaurants receiving the lowest of our internal ratings has declined since the end of 2016.
As discussed under the heading “Financial Results - Franchise Operations,” Applebee's has experienced adata from Black Box, IHOP's decrease in royalty revenue because of the decline in same-restaurant sales that is primarily due to a decline in customer traffic. The decline in same-restaurant sales has adversely impacted some of our franchisees' financial health, resulting in increases in our bad debt expense and in our royalties not recognized as revenue until paid in cash (“cash-basis royalties”). A franchisee that represents approximately 5% of Applebee's domestic system-wide sales is exhibiting a higher level of financial difficulty than other franchisees. We are addressing all franchisees' financial health through a collaborative effort between ourselves, a third-party advisor and franchisee representatives. We are considering various forms of assistance to franchisees, such as restaurant closures, assessing franchisee debt arrangements, temporary forbearance on payment obligations, extensions of credit and other support programs. To date, the assistance provided primarily has been the approved closures of non-viable restaurants. Any additional assistance to franchisees may entail incremental costs.
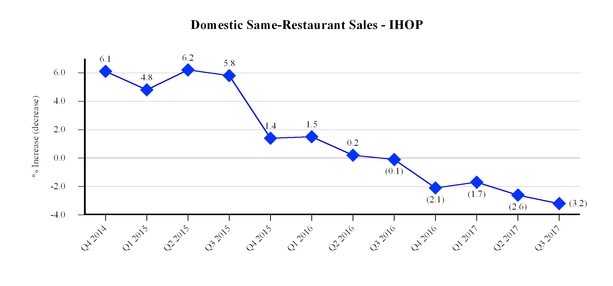
IHOP’s domestic system-wide same-restaurant sales decreased 3.2% for the three months ended September 30, 2017 fromMarch 31, 2021 outperformed the family dining segment of the restaurant industry (excluding IHOP) during that same periodperiod. During the three months ended March 31, 2021, the family dining segment experienced a decrease in 2016. Thesame-restaurant sales that was due to a decrease resulted from a decline in customer traffic that was partially offset by an increase in average customer check. The decline in IHOP's quarter-over-quarter customer traffic has grown progressively larger during the first three quarters of 2017. The declinedecrease in traffic peaked in the middle of the third quarter and lessened towards the end of the third quarter. For the nine months ended September 30, 2017, IHOP’s domestic system-wide same-restaurant sales decreased 2.5% from the same period in 2016. That decrease was also due to a decline in customer traffic that was partially offset by an increase in average customer check. We believe the decrease in customer traffic during the three and nine months ended September 30, 2017 was due in part to softness in our dinner daypart as the result of advertising promotions that did not drive sales and traffic as anticipated.
Based on data from Black Box, the family dining segment of the restaurant industry experienced a decrease in same-restaurant sales during the three and nine months ended September 30, 2017, compared to the same periods of the prior year, due to a decrease in customer traffic that was partially offset by an increase in average customer check. The IHOP declines in customer traffic and same-restaurant sales were larger than those experienced by the overall family dining segment for the three and nine months ended September 30, 2017. IHOP's increase in average customer checkMarch 31, 2021 was smaller than that of the overall family dining segmentsegment.
Off-premise sales totaled approximately $183 million and comprised 33.3% of sales mix for the three months ended September 30, 2017, whereas IHOP's increase in average customer check was larger than thatMarch 31, 2021, as compared to approximately $80 million of the overall family dining segmentsales comprising 12.8% of sales mix for the ninethree months ended September 30, 2017.March 31, 2020.
Restaurant Data
The following table sets forth the number of “Effective Restaurants” in the Applebee’s and IHOP systems and information regarding the percentage change in sales at those restaurants compared to the same periods inof the prior year. Sales at restaurants that are owned by franchisees and area licensees are not attributable to the Company and, as such, the percentage change in sales at Effective Restaurants is based on non-GAAP sales data. However, we believe that presentation of this information is useful in analyzing our revenues because franchisees and area licensees pay us royalties and advertising fees that are based on a percentage of their sales, and, where applicable, rental payments under leases that partially may be based on a percentage of their sales. Management also uses this information to make decisions about plans for future development of additional restaurants as well as evaluation of current operations.
| | | | | | | | | | | | | Three months ended March 31, |
| — |
| | Three months ended September 30, | | Nine months ended September 30, | |
| | | | 2017 | | 2016 | | 2017 | | 2016 | | | | 2021 | | 2020 |
| Applebee's Restaurant Data | Applebee's Restaurant Data | | (Unaudited) | Applebee's Restaurant Data | | | (Unaudited) |
Effective Restaurants(a) | Effective Restaurants(a) | | |
| | |
| | |
| | |
| Effective Restaurants(a) | | | | | |
| Franchise | Franchise | | 1,953 |
| | 2,028 |
| | 1,981 |
| | 2,029 |
| Franchise | | | 1,628 | | | 1,697 | |
| Company | | Company | | | 69 | | | 69 | |
| Total | | Total | | | 1,697 | | | 1,766 | |
| System-wide(b) | System-wide(b) | | |
| | |
| | |
| | |
| System-wide(b) | | | | | |
Sales percentage change(c) | | (9.7 | )% | | (5.1 | )% | | (8.6 | )% | | (4.5 | )% | |
Domestic sales percentage change(c) | | Domestic sales percentage change(c) | | | 1.2 | % | | (12.1) | % |
Domestic same-restaurant sales percentage change(d) | Domestic same-restaurant sales percentage change(d) | | (7.7 | )% | | (5.2 | )% | | (7.3 | )% | | (4.4 | )% | Domestic same-restaurant sales percentage change(d) | | | 11.9 | % | | (10.6) | % |
Franchise(b) | Franchise(b) | | |
| | |
| | |
| | |
| Franchise(b) | | | | | |
Sales percentage change(c) | | (9.7 | )% | | (4.9 | )% | | (8.6 | )% | | (3.7 | )% | |
Domestic sales percentage change(c) | | Domestic sales percentage change(c) | | | 0.7 | % | | (12.1) | % |
Domestic same-restaurant sales percentage change(d) | Domestic same-restaurant sales percentage change(d) | | (7.7 | )% | | (5.2 | )% | | (7.3 | )% | | (4.4 | )% | Domestic same-restaurant sales percentage change(d) | | | 11.5 | % | | (10.6) | % |
| Average weekly domestic unit sales (in thousands) | Average weekly domestic unit sales (in thousands) | | $ | 40.9 |
| | $ | 43.5 |
| | $ | 43.5 |
| | $ | 46.2 |
| Average weekly domestic unit sales (in thousands) | | | $ | 46.8 | | | $ | 44.6 | |
| | | | | | | | | | | | | |
| IHOP Restaurant Data | IHOP Restaurant Data | | |
| | |
| | |
| | |
| IHOP Restaurant Data | | | | | |
| | | | | | | | | | | |
Effective Restaurants(a) | Effective Restaurants(a) | | |
| | |
| | |
| | |
| Effective Restaurants(a) | | | | | |
| Franchise | Franchise | | 1,586 |
| | 1,521 |
| | 1,568 |
| | 1,512 |
| Franchise | | | 1,563 | | | 1,660 | |
| Area license | Area license | | 162 |
| | 167 |
| | 165 |
| | 165 |
| Area license | | | 157 | | | 161 | |
| Company | | — |
| | 10 |
| | 6 |
| | 11 |
| |
| | Total | Total | | 1,748 |
| | 1,698 |
| | 1,739 |
| | 1,688 |
| Total | | | 1,720 | | | 1,821 | |
| | | | | | | | | | | |
System-wide(b) | System-wide(b) | | |
| | |
| | |
| | |
| System-wide(b) | | | | | |
Sales percentage change(c) | Sales percentage change(c) | | (0.7 | )% | | 1.3 | % | | (0.1 | )% | | 2.0 | % | Sales percentage change(c) | | | (12.1) | % | | (14.2) | % |
Domestic same-restaurant sales percentage change(d) | | (3.2 | )% | | (0.1 | )% | | (2.5 | )% | | 0.5 | % | |
Domestic same-restaurant sales percentage change, including area license restaurants(d) | | Domestic same-restaurant sales percentage change, including area license restaurants(d) | | | (0.9) | % | | (14.7) | % |
| Franchise(b) | Franchise(b) | | |
| | |
| | |
| | |
| Franchise(b) | | | | | |
Sales percentage change(c) | Sales percentage change(c) | | 0.3 | % | | 1.4 | % | | 0.5 | % | | 2.2 | % | Sales percentage change(c) | | | (12.9) | % | | (14.3) | % |
Domestic same-restaurant sales percentage change(d) | Domestic same-restaurant sales percentage change(d) | | (3.2 | )% | | (0.1 | )% | | (2.5 | )% | | 0.5 | % | Domestic same-restaurant sales percentage change(d) | | | (1.9) | % | | (14.7) | % |
| Average weekly domestic unit sales (in thousands) | | $ | 35.7 |
| | $ | 37.1 |
| | $ | 36.3 |
| | $ | 37.5 |
| |
| Average weekly unit sales (in thousands) | | Average weekly unit sales (in thousands) | | | $ | 29.4 | | | $ | 31.7 | |
| Area License(b) | Area License(b) | | |
| | |
| | |
| | |
| Area License(b) | | | | | |
Sales percentage change(c) | Sales percentage change(c) | | (5.7 | )% | | 2.4 | % | | (3.6 | )% | | 1.1 | % | Sales percentage change(c) | | | (3.7) | % | | (13.8) | % |
(a) “Effective Restaurants” are the weighted average number of restaurants open in each fiscal period, adjusted to account for restaurants open for only a portion of the period. Information is presented for all Effective Restaurants in the Applebee’s and IHOP systems, which consist of restaurants owned by franchisees and area licensees as well as those owned by the Company. Effective Restaurants do not include units operated as ghost kitchens (small kitchens with no store-front presence, used to fill off-premise orders).
(b) “System-wide sales” are retail sales at Applebee’s restaurants operated by franchisees and IHOP restaurants operated by franchisees and area licensees, as reported to the Company, in addition to retail sales at company-operated Applebee's restaurants. System-wide sales do not include retail sales of ghost kitchens. Sales at restaurants that are owned by franchisees and area licensees are not attributable to the Company. An increase in franchisees' reported sales will result in a corresponding increase in our royalty revenue, while a decrease in franchisees' reported sales will result in a corresponding decrease in our royalty revenue. Unaudited reported sales for Applebee's domestic franchise restaurants, Applebee's company-operated restaurants, IHOP franchise restaurants and IHOP area license restaurants were as follows: | | | | Three months ended September 30, | | Nine months ended September 30, | | | | Three months ended March 31, |
| | 2017 | | 2016 | | 2017 | | 2016 | | | | 2021 | | 2020 |
| Reported sales (In millions) | (Unaudited) | |
| Reported sales (in millions) | | Reported sales (in millions) | | (Unaudited) |
| | |
| | |
| | | | | | | |
| Applebee's domestic franchise restaurant sales | $ | 956.5 |
| | $ | 1,058.9 |
| | $ | 3,092.3 |
| | $ | 3,382.1 |
| Applebee's domestic franchise restaurant sales | | | $ | 924.7 | | | $ | 918.2 | |
| Applebee's company-operated restaurants | | Applebee's company-operated restaurants | | | 35.9 | | | 31.3 | |
| IHOP franchise restaurant sales | 736.9 |
| | 734.3 |
| | 2,220.3 |
| | 2,208.6 |
| IHOP franchise restaurant sales | | | 596.7 | | | 684.8 | |
| IHOP area license restaurant sales | 67.0 |
| | 71.0 |
| | 208.7 |
| | 216.5 |
| IHOP area license restaurant sales | | | 61.7 | | | 64.0 | |
| Total | $ | 1,760.4 |
| | $ | 1,864.2 |
| | $ | 5,521.3 |
| | $ | 5,807.2 |
| Total | | | $ | 1,619.0 | | | $ | 1,698.3 | |
(c) “Sales percentage change” reflects, for each category of restaurants, the percentage change in sales in any given fiscal period compared to the prior fiscal period for all restaurants in that category.
(d) “Domestic same-restaurant sales percentage change” reflects the percentage change in sales in any given fiscal period, compared to the same weeks in the prior fiscal period, for domestic restaurants that have been operated throughoutduring both fiscal periods that are being compared and have been open for at least 18 months. Because of new restaurant openings and restaurant closures, the domestic restaurants open throughout both fiscal periods being compared may be different from period to period. Domestic same-restaurant sales percentage change does
| | | | | | | | | | | | | | | | | |
| Restaurant Development Activity | | | Three months ended March 31, |
| | | | | | 2021 | | 2020 |
| Applebee's | | | | (Unaudited) |
| Summary - beginning of period: | | | | | | | |
| Franchise | | | | | 1,640 | | | 1,718 | |
| Company restaurants | | | | | 69 | | | 69 | |
| Beginning of period | | | | | 1,709 | | | 1,787 | |
| | | | | | | |
| Franchise restaurants opened: | | | | | | | |
| Domestic | | | | | 2 | | | — | |
| | | | | | | |
| Total franchise restaurants opened | | | | | 2 | | | — | |
| Franchise restaurants permanently closed: | | | | | | | |
| Domestic | | | | | (4) | | | (8) | |
| International | | | | | (2) | | | (4) | |
| Total franchise restaurants permanently closed | | | | | (6) | | | (12) | |
| Net franchise restaurant reduction | | | | | (4) | | | (12) | |
| | | | | | | |
| | | | | | | |
| | | | | | | |
| Summary - end of period: | | | | | | | |
| Franchise | | | | | 1,636 | | | 1,706 | |
| Company restaurants | | | | | 69 | | | 69 | |
| Total Applebee's restaurants, end of period | | | | | 1,705 | | | 1,775 | |
| Domestic | | | | | 1,596 | | | 1,657 | |
| International | | | | | 109 | | | 118 | |
| | | | | | | | | | | | | | | | | |
| | | |
| | | | | | | |
| IHOP | | | | | | | |
| Summary - beginning of period: | | | | | | | |
| Franchise | | | | | 1,611 | | | 1,680 | |
| Area license | | | | | 158 | | | 161 | |
| Company | | | | | 3 | | | — | |
| Total IHOP restaurants, beginning of period | | | | | 1,772 | | | 1,841 | |
| | | | | | | |
| Franchise/area license restaurants opened: | | | | | | | |
| Domestic franchise | | | | | 8 | | | 6 | |
| Domestic area license | | | | | — | | | 1 | |
| International franchise | | | | | — | | | 2 | |
| | | | | | | |
| Total franchise/area license restaurants opened | | | | | 8 | | | 9 | |
| Franchise/area license restaurants permanently closed: | | | | | | | |
| Domestic franchise | | | | | (16) | | | (6) | |
| Domestic area license | | | | | (2) | | | (2) | |
| International franchise | | | | | (9) | | | (2) | |
| | | | | | | |
| Total franchise/area license restaurants permanently closed | | | | | (27) | | | (10) | |
| Net franchise/area license restaurant closures | | | | | (19) | | | (1) | |
| | | | | | | |
| Franchise restaurants reacquired by the Company | | | | | (1) | | | — | |
| Net reduction in franchise/area license restaurants | | | | | (20) | | | (1) | |
| | | | | | | |
| Summary - end of period: | | | | | | | |
| Franchise | | | | | 1,593 | | | 1,680 | |
| Area license | | | | | 156 | | | 160 | |
| Company | | | | | 4 | | | — | |
| Total IHOP restaurants, end of period | | | | | 1,753 | | | 1,840 | |
| Domestic | | | | | 1,660 | | | 1,709 | |
| International | | | | | 93 | | | 131 | |
The restaurant counts and activity presented above do not include data onthree domestic Applebee's ghost kitchens (small kitchens with no store-front presence, used to fill off-premise orders) and two international IHOP area licenseghost kitchens. The Applebee's franchise restaurant count at the beginning of the period ended March 31, 2021 was adjusted downward by two restaurants, representing ghost kitchens that had been included in the total reported as of December 31, 2020.
The closures presented in the tables above represent permanent closures of restaurants. Temporary closures, which can occur for a variety of reasons, are not reflected as reductions in this table and temporarily closed restaurants are included in the summary counts at the beginning and end of each period shown. Temporary closures are reflected in the weighted calculation of Effective Restaurants presented in the preceding Restaurant Data table.
|
| | | | | | | | | | | |
Restaurant Development Activity | Three months ended September 30, | | Nine months ended September 30, |
| | 2017 | | 2016 | | 2017 | | 2016 |
| Applebee's | (Unaudited) |
| Beginning of period | 1,968 |
| | 2,027 |
| | 2,016 |
| | 2,033 |
|
| | | | | | | | |
| Franchise restaurants opened: | |
| | |
| | | | |
| Domestic | 2 |
| | 6 |
| | 7 |
| | 13 |
|
| International | 2 |
| | 3 |
| | 6 |
| | 7 |
|
| Total franchise restaurants opened | 4 |
| | 9 |
| | 13 |
| | 20 |
|
| Franchise restaurants closed: | |
| | |
| | | | |
| Domestic | (22 | ) | | (8 | ) | | (74 | ) | | (20 | ) |
| International | (5 | ) | | (1 | ) | | (10 | ) | | (6 | ) |
| Total franchise restaurants closed | (27 | ) | | (9 | ) | | (84 | ) | | (26 | ) |
| Net franchise restaurant reduction | (23 | ) | | — |
| | (71 | ) | | (6 | ) |
| | | | | | | | |
| Total Applebee's restaurants, end of period | 1,945 |
| | 2,027 |
| | 1,945 |
| | 2,027 |
|
| Domestic | 1,791 |
| | 1,871 |
| | 1,791 |
| | 1,871 |
|
| International | 154 |
| | 156 |
| | 154 |
| | 156 |
|
|
| | | | | | | | | | | |
| IHOP | |
| | |
| | | | |
| Summary - beginning of period: | | | | | | | |
| Franchise | 1,586 |
| | 1,519 |
| | 1,556 |
| | 1,507 |
|
| Area license | 166 |
| | 166 |
| | 167 |
| | 165 |
|
| Company | — |
| | 10 |
| | 10 |
| | 11 |
|
| Total IHOP restaurants, beginning of period | 1,752 |
| | 1,695 |
| | 1,733 |
| | 1,683 |
|
| | | | | | | | |
| Franchise/area license restaurants opened: | | | | | | | |
| Domestic franchise | 11 |
| | 7 |
| | 31 |
| | 26 |
|
| Domestic area license | 1 |
| | 1 |
| | 1 |
| | 3 |
|
| International franchise | 6 |
| | 8 |
| | 18 |
| | 11 |
|
| Total franchise/area license restaurants opened | 18 |
| | 17 |
| | 50 |
| | 24 |
|
| Franchise/area license restaurants closed: | |
| | |
| | | | |
| Domestic franchise | (2 | ) | | (2 | ) | | (11 | ) | | (10 | ) |
| Domestic area license | (1 | ) | | — |
| | (2 | ) | | (1 | ) |
| International franchise | (5 | ) | | — |
| | (7 | ) | | (3 | ) |
| International area license | (1 | ) | | — |
| | (1 | ) | | — |
|
| Total franchise/area license restaurants closed | (9 | ) | | (2 | ) | | (21 | ) | | (14 | ) |
| Net franchise/area license restaurant development | 9 |
| | 15 |
| | 29 |
| | 10 |
|
| Refranchised from Company restaurants | — |
| | — |
| | 9 |
| | 1 |
|
| Net franchise/area license restaurant additions | 9 |
| | 14 |
| | 38 |
| | 27 |
|
| | | | | | | | |
| Summary - end of period: | | | | | | | |
| Franchise | 1,596 |
| | 1,532 |
| | 1,596 |
| | 1,532 |
|
| Area license | 165 |
| | 167 |
| | 165 |
| | 167 |
|
Company(a) | — |
| | 10 |
| | — |
| | 10 |
|
| Total IHOP restaurants, end of period | 1,761 |
| | 1,709 |
| | 1,761 |
| | 1,709 |
|
| Domestic | 1,655 |
| | 1,622 |
| | 1,655 |
| | 1,622 |
|
| International | 106 |
| | 87 |
| | 106 |
| | 87 |
|
(a)During the nine months ended September 30, 2017, nine company-operatedClosures of Applebee's and IHOP restaurants were refranchised and one was permanently closed.
For the full year of 2017, we expect Applebee's franchisees to develop between 20 and 30 new restaurants globally, most of which are expected to be international openings. As part of a detailedadversely impact our system-wide analysis to optimize the health of the franchisee system, we anticipate the closing of between 105 to 135 Applebee's restaurants globally for the full year of 2017. The anticipated net declineretail sales that drive our franchise royalty revenues as well as, in the numbercase of Applebee's restaurants will result in a decrease in Applebee's royalty revenues. IHOP franchisees are projected to develop between 80 and 95 new IHOP restaurants, globally forsales of proprietary pancake and waffle dry mix. Further, with certain restaurants, we own or lease the full year of 2017, most of which are expectedunderlying property and sublease it to the applicable franchisee. Thus, our rental income also could be domestic openings. We expect the closing of between 25 and 30 IHOP restaurants from natural attrition in 2017.
The actual number of openings may differ from both our expectations and development commitments. Historically, the actual number of restaurants developed in any given year has been less than the total number committed to be developedadversely affected due to various factors, including economic conditions and franchisee noncompliance with development agreements. The timing of new restaurant openings also may be affected by various factors including weather-related andour obligation to make rental or other construction delays, difficulties in obtaining timely regulatory approvals and the impact of currency fluctuations on our international franchisees. The actual number of closures also may differ from our expectations. Our franchisees are independent businesses and decisions to close restaurants can be impacted by numerous factors in addition to declines in same-restaurant sales that are outside of our control, including but not limited to, franchisees' agreements with landlords and lenders.payments for such properties.
CONSOLIDATED RESULTS OF OPERATIONS
Comparison of the Three Months ended March 31, 2021 and Nine Months EndedSeptember 30, 2017 and 20162020
Significant Known Events, Trends or Uncertainties Impacting or Expecting to Impact Comparisons of Reported or Future Results
Impairment of Applebee's Goodwill and Tradename
We performed a quantitative test for impairment of Applebee's goodwill and tradename as of October 31, 2016, the annual testing date. We identified no impairments as a result of performing these quantitative assessments, however, we did note that the fair value of the Applebee's Franchise Reporting Unit exceeded the carrying value of the unit by 9% and therefore considered the unit to be at risk of impairment.
In the third quarter of 2017, we noted that the decline in the market price of our common stock since December 31, 2016, which we had believed to be temporary, persisted throughout the first eight months of 2017 and that the favorable trend in Applebee's domestic same-restaurant sales experienced in the second quarter of 2017 did not continue into the first two months of the third quarter. We also noted a continuing increase in Applebee's bad debt expense and in royalties not recognized in income until paid in cash. Additionally, we also determined an increasing shortfall in franchisee contributions to the Applebee's national advertising fund could require a larger amount of future subsidization in the form of additional franchisor contributions to the fund than previously estimated. Based on these unfavorable developments, primarily the decline in the market price of our common stock, we determined that indicators of impairment existed and that an interim test of goodwill and indefinite-lived intangible assets for impairment should be performed.
As a result of performing the interim quantitative test, we recognized an impairment of Applebee's goodwill of $358.2 million and an impairment of Applebee's tradename of $173.4 million. After the impairments, the balances of goodwill and the tradename intangible asset allocated to the Applebee's franchise unit as of September 30, 2017 were $328.5 million and $479.0 million, respectively.
We adopted the guidance in FASB Accounting Standards Update 2017-04 on January 1, 2017; accordingly, the amount of the goodwill impairment was determined as the amount by which the carrying amount of the goodwill exceeded the fair value of the Applebee's franchise reporting unit that was estimated in the quantitative test. These assets are at risk of additional impairment in the future in the event of sustained downward movement in the Company's stock price, downward revisions of long-term performance assumptions or increases in the assumed long-term discount rate.
See additional discussion of these impairments under the heading “Financial Results - Impairment and Closure Charges.”
Executive Separation Costs
On February 17, 2017, we announced the resignation of our former Chairman and Chief Executive Officer (the “former CEO”), effective March 1, 2017. In accordance with terms of the Separation Agreement and General Release filed as Exhibit 10.1 to Form 8-K filed on February 17, 2017, we recorded approximately $5.9 million for severance, separation pay and ancillary costs in the first quarter of 2017. All stock options and restricted stock awards held by the former CEO that were unvested at the time of the announcement became vested in connection with the separation. We recorded a charge of approximately $2.9 million related to the accelerated vesting of the equity awards in the first quarter of 2017. Total costs of $8.8 million related to the separation were included in G&A expenses for the nine months ended September 30, 2017, all of which were incurred in the first quarter of 2017.
Financial Results
| | | | | | | | | | | | | | | | | | | | | | | | | | |
| Revenue | | | | | | Three months ended March 31, | | Favorable
(Unfavorable) Variance |
| | | | | | | 2021 | | 2020 | |
| | | | | | | | | | | | |
| | | | | | | | | (In millions) |
| Franchise operations | | | | | | | | $ | 141.0 | | | $ | 145.1 | | | $ | (4.1) | |
| Rental operations | | | | | | | | 26.1 | | | 29.0 | | | (2.9) | |
| Company restaurant operations | | | | | | | | 36.0 | | | 31.3 | | | 4.7 | |
| Financing operations | | | | | | | | 1.1 | | | 1.5 | | | (0.4) | |
| Total revenue | | | | | | | | $ | 204.2 | | | $ | 206.9 | | | $ | (2.7) | |
| Change vs. prior period | | | | | | | | (1.3) | % | | | | |
|
| | | | | | | | | | | | | | | | | | | | | | | | |
| Revenue | | Three months ended September 30, | | Favorable
(Unfavorable) Variance | | Nine months ended September 30, | | Favorable
(Unfavorable) Variance |
| | | 2017 | | 2016 | | 2017 | | 2016 | |
| | | (In millions) |
| Franchise operations | | $ | 112.3 |
| | $ | 119.2 |
| | $ | (6.9 | ) | | $ | 351.4 |
| | $ | 366.7 |
| | $ | (15.3 | ) |
| Rental operations | | 30.3 |
| | 30.5 |
| | (0.2 | ) | | 90.9 |
| | 92.7 |
| | (1.8 | ) |
| Company restaurant operations | | — |
| | 4.0 |
| | (4.0 | ) | | 7.5 |
| | 13.4 |
| | (5.9 | ) |
| Financing operations | | 2.1 |
| | 2.3 |
| | (0.2 | ) | | 6.3 |
| | 7.0 |
| | (0.7 | ) |
| Total revenue | | $ | 144.7 |
| | $ | 156.0 |
| | $ | (11.3 | ) | | $ | 456.1 |
| | $ | 479.8 |
| | $ | (23.7 | ) |
| Change vs. prior period | | (7.3 | )% | | | | | | (5.0 | )% | | | | |
Total revenue for franchise and rental operations for the three months ended September 30, 2017March 31, 2021 decreased compared with the same periodperiods of the prior year, primarily due to a decrease in revenue from Applebee's franchise restaurantsrestaurant closures and lease-buy-outs over the refranchising of nine IHOP company-operated restaurants and closure of one IHOP company-operated restaurant in June 2017. Additional reasons forpast 12 months, while financing revenues declined due to the decline in revenue include the impact of a 3.2% decrease in IHOP domestic same-restaurant sales on royalty and rental revenue and the expected progressive decline in interest revenue from rental and financing operations as receivablenote balances are repaid. Rental operations revenue was also impacted a decline in rent paid based on a percentage of franchisees' retail sales. These unfavorable factorsdeclines were partially offset by IHOP franchisee restaurant development overan increase in revenue from Applebee's company-operated restaurants due to a higher average check and increased traffic during the past twelve months.three months ended March 31, 2021 as compared to the same period of the prior year.
| | | | | | | | | | | | | | | | | | | | | | | | | | |
| Gross Profit | | | | | | Three months ended March 31, | | Favorable
(Unfavorable) Variance |
| | | | | | | | 2021 | | 2020 | |
| | | | | | | | | | | | |
| | | | | | | | | (In millions) |
| Franchise operations | | | | | | | | $ | 76.0 | | | $ | 75.6 | | | $ | 0.4 | |
| Rental operations | | | | | | | | 5.2 | | | 6.5 | | | (1.3) | |
| Company restaurant operations | | | | | | | | 3.1 | | | 1.0 | | | 2.1 | |
| Financing operations | | | | | | | | 1.0 | | | 1.3 | | | (0.3) | |
| Total gross profit | | | | | | | | $ | 85.3 | | | $ | 84.4 | | | $ | 0.9 | |
| Change vs. prior period | | | | | | | | 1.0 | % | | | | |
Total revenuegross profit for the ninethree months ended September 30, 2017 decreasedMarch 31, 2021 increased compared with the same period of the prior year, primarily due to the same factors discussed for the three-month period above. Additional reasons for theincreased revenue from Applebee's company-operated restaurants, partially offset by a decline in revenue include the impact of a 2.5% decrease in IHOP domestic same-restaurant sales on royalty and rental revenue and the expected progressive decline in interest revenue from rental and financing operations as receivable balances are repaid. These unfavorable factors were partially offset by IHOP franchisee restaurant development over the past twelve months.operations.
|
| | | | | | | | | | | | | | | | | | | | | | | | |
| Gross Profit (Loss) | | Three months ended September 30, | | Favorable (Unfavorable) Variance | | Nine months ended September 30, | | Favorable (Unfavorable) Variance |
| | | 2017 | | 2016 | | | 2017 | | 2016 | |
| | | (In millions) |
| Franchise operations | | $ | 70.5 |
| | $ | 81.9 |
| | $ | (11.4 | ) | | $ | 235.7 |
| | $ | 258.7 |
| | $ | (23.0 | ) |
| Rental operations | | 8.0 |
| | 7.7 |
| | 0.3 |
| | 23.2 |
| | 23.7 |
| | (0.5 | ) |
| Company restaurant operations | | (0.0 | ) | | (0.2 | ) | | 0.2 |
| | (0.3 | ) | | (0.7 | ) | | 0.4 |
|
| Financing operations | | 1.6 |
| | 2.3 |
| | (0.7 | ) | | 5.9 |
| | 6.8 |
| | (0.9 | ) |
| Total gross profit | | $ | 80.1 |
| | $ | 91.7 |
| | $ | (11.6 | ) | | $ | 264.5 |
| | $ | 288.5 |
| | $ | (24.0 | ) |
| Change vs. prior period | | (12.6 | )% | | | | | | (8.3 | )% | | | | |
Total gross profit for the three and nine months ended September 30, 2017 declined compared with the same periods of the prior year, primarily due to the decreases in revenue from franchise operations, an increase in Applebee's bad debt expense and the expected progressive decline in interest revenue from financing operations.
| | | | | Three months ended September 30, | | Favorable (Unfavorable) Variance | | Nine months ended September 30, | | Favorable (Unfavorable) Variance | | | Three months ended March 31, | | Favorable
(Unfavorable) Variance |
| Franchise Operations | | 2017 | | 2016 | | 2017 | | 2016 | | Franchise Operations | | | 2021 | | 2020 | |
| | | (In millions, except number of restaurants) | | | | (In millions, except number of restaurants) |
Effective Franchise Restaurants:(1) | | | | | | | | | | | | | Effective Franchise Restaurants:(1) | | | |
| Applebee’s | | 1,953 |
| | 2,028 |
| | (75 | ) | | 1,981 |
| | 2,029 |
| | (48 | ) | Applebee’s | | | 1,628 | | | 1,697 | | | (69) | |
| IHOP | | 1,748 |
| | 1,688 |
| | 60 |
| | 1,733 |
| | 1,677 |
| | 56 |
| IHOP | | | 1,720 | | | 1,821 | | | (101) | |
| | Franchise Revenues: | | |
| | |
| | |
| | |
| | | | | Franchise Revenues: | | | | |
| Applebee’s | | $ | 39.4 |
| | $ | 45.7 |
| | $ | (6.3 | ) | | $ | 129.3 |
| | $ | 144.7 |
| | $ | (15.4 | ) | |
| IHOP | | 44.9 |
| | 45.8 |
| | (0.9 | ) | | 137.7 |
| | 138.3 |
| | (0.6 | ) | |
| Advertising | | 28.0 |
| | 27.7 |
| | 0.3 |
| | 84.4 |
| | 83.7 |
| | 0.7 |
| |
| Applebee’s franchise fees | | Applebee’s franchise fees | | | $ | 38.7 | | | $ | 37.8 | | | $ | 0.9 | |
| IHOP franchise fees | | IHOP franchise fees | | | 41.4 | | | 45.5 | | | (4.1) | |
| Advertising fees | | Advertising fees | | | 60.9 | | | 61.8 | | | (0.9) | |
| Total franchise revenues | | 112.3 |
| | 119.2 |
| | (6.9 | ) | | 351.4 |
| | 366.7 |
| | (15.3 | ) | Total franchise revenues | | | 141.0 | | | 145.1 | | | (4.1) | |
| Franchise Expenses: | | |
| | |
| | |
| | | | | | | Franchise Expenses: | | | | | | | |
| Applebee’s | | 8.7 |
| | 4.2 |
| | (4.5 | ) | | 15.3 |
| | 7.3 |
| | (8.0 | ) | Applebee’s | | | 1.1 | | | 1.2 | | | 0.1 | |
| IHOP | | 5.1 |
| | 5.4 |
| | 0.3 |
| | 16.0 |
| | 17.0 |
| | 1.0 |
| IHOP | | | 3.0 | | | 6.5 | | | 3.5 | |
| Advertising | | 28.0 |
| | 27.7 |
| | (0.3 | ) | | 84.4 |
| | 83.7 |
| | (0.7 | ) | |
| Advertising expenses | | Advertising expenses | | | 60.9 | | | 61.8 | | | 0.9 | |
| Total franchise expenses | | 41.8 |
| | 37.3 |
| | (4.5 | ) | | 115.7 |
| | 108.0 |
| | (7.7 | ) | Total franchise expenses | | | 65.0 | | | 69.5 | | | 4.5 | |
| Franchise Gross Profit: | | |
| | |
| | |
| | | | | �� | | Franchise Gross Profit: | | | | | | | |
| Applebee’s | | 30.7 |
| | 41.5 |
| | (10.8 | ) | | 114.0 |
| | 137.4 |
| | (23.4 | ) | Applebee’s | | | 37.6 | | | 36.6 | | | 1.0 | |
| IHOP | | 39.8 |
| | 40.4 |
| | (0.6 | ) | | 121.7 |
| | 121.3 |
| | 0.4 |
| IHOP | | | 38.4 | | | 39.0 | | | (0.6) | |
| Total franchise gross profit | | $ | 70.5 |
| | $ | 81.9 |
| | $ | (11.4 | ) | | $ | 235.7 |
| | $ | 258.7 |
| | $ | (23.0 | ) | Total franchise gross profit | | | $ | 76.0 | | | $ | 75.6 | | | $ | 0.4 | |
Gross profit as % of revenue (2) | | 62.8 | % | | 68.7 | % | | | | 67.1 | % | | 70.5 | % | | | Gross profit as % of revenue (2) | | | 53.9 | % | | 52.1 | % | | |
Gross profit as % of franchise fees (2)(3) | | Gross profit as % of franchise fees (2)(3) | | | 94.9 | % | | 90.7 | % | |
_____________________________________________________
(1) Effective Franchise Restaurants are the weighted average number of franchise and area license restaurants open in each fiscal period, adjusted to account for restaurants open for only a portion of the period.
(2) Percentages calculated on actual amounts, not rounded amounts presented above.
(3) From time to time, advertising fee revenue may be different from advertising expenses in a given accounting period. Over the long term, advertising activity should not generate gross profit or loss.
Applebee’s franchise fee revenue for the three months ended September 30, 2017 declined 13.8%March 31, 2021 increased 2.2% compared to the same period of the prior year. Approximately $2.9$1.3 million of the declineincrease was due to a 7.7% decreasethe improvement in domestic franchise same-restaurant sales. Additional factors contributingsales, approximately $1.0 million was due to the revenue decline wereimproved collectibility and a slightly higher effective royalty rate, and $0.6 million was due to an increase of $1.7 million in cash-basis royalties andother franchise fees. These favorable items were partially offset by a $1.2$1.0 million decrease in royaltiesroyalty revenue due to the net closure of franchise restaurants.
Applebee’s franchise revenue for the nine months ended September 30, 2017 declined 10.6% compared to the same period of the prior year. Approximately $9.3 million of the decline was due torestaurant closures, a 7.3% decrease in domestic same-restaurant sales. Additional factors contributing to the revenue decline were a $2.7$0.5 million increase in cash-basis royalties, a $2.4 million decrease in royalties due to the net closure of franchise restaurantsdelivery credits that reduce royalty revenue and aan $0.8 million decrease in termination fees. We do not expect to receive any termination fees from approved closures of restaurants in 2017.international revenues.
The increasesdecrease in Applebee's franchise expenses for the three and nine months ended September 30, 2017March 31, 2021 compared with the same periodsperiod of the prior year were primarily was due to increasesa decrease in bad debt expense. Bad debt expense for the three months ended March 31, 2021 was less than $0.1 million as compared to bad debt expense of $2.9$0.3 million and $6.4 million, respectively, as well as an increase of $1.5 million in franchisor contributions toduring the Applebee's national advertising fund which impacted both periods. The Company contributed $4.0 million to the Applebee's national advertising fund in the third quarter of 2017 compared to a contribution of $2.5 million in the third quarter of 2016.three months ended March 31, 2020.
IHOP franchise fee revenue for the three months ended September 30, 2017March 31, 2021 decreased 8.9% compared to the same period of the prior year, primarily due to lower royalty and pancake and waffle dry mix revenues resulting from a $1.0decrease in domestic franchise same-restaurant sales, a decline of $0.9 million in international revenues and a decrease of $0.6 million due to restaurant closures. These unfavorable changes were partially offset by a $1.6 million increase in termination and other franchise fees.
IHOP franchise expenses for the three months ended March 31, 2021 declined from the same period of the prior year primarily due to a $2.3 million decrease in salesbad debt expense and a decline in purchases of pancake and waffle dry mixmix. IHOP reduced its allowance for bad debts by $2.1 million during the three months ended March 31, 2021 compared to a bad debt expense of $0.2 million in the prior year period. Favorable changes to the aging status of certain franchisee receivables resulted in a downward revision of estimated reserve requirements.
Advertising revenue and expense by brand for the three months ended March 31, 2021 and 2020 were as follows:
| | | | | | | | | | | | | | | | | | | | | | | | | | |
| | | | | | Three months ended March 31, | | Increase (decrease) |
| | | | | | | 2021 | | 2020 | |
| | | | | | | | (In millions) |
| Advertising Revenues and Expenses: | | | | | | | | | | | | |
| Applebee’s | | | | | | | | $ | 38.6 | | | $ | 36.6 | | | $ | 2.0 | |
| IHOP | | | | | | | | 22.3 | | | 25.2 | | | (2.9) | |
| Total advertising revenues and expenses | | | | | | | | $ | 60.9 | | | $ | 61.8 | | | $ | (0.9) | |
| | | | | | | | | | | | |
| | | | | | | | | | | | |
| | | | | | | | | | | | |
| | | | | | | | | | | | |
| | | | | | | | | | | | |
Applebee's advertising revenue and expense for the three months ended March 31, 2021 increased 5.7% compared to the same period of the prior year. Approximately $2.1 million of the increase was due to improved collectibilty from franchisees, and $1.4 million was due to the increase in domestic franchise same-restaurant sales. Partially offsetting the increases was a decrease of $1.1 million due to permanent domestic restaurant closures and a 3.2% decrease in domestic same-restaurant sales. These unfavorable items were partially offset by a 3.6%$0.5 million increase in Effective Franchise Restaurants due to net restaurant developmentdelivery credits that reduce advertising revenue. IHOP's advertising revenue and an increase in franchise fees.
IHOP franchise revenueexpense for the ninethree months ended September 30, 2017March 31, 2021 decreased slightly11.6% compared to the same period of the prior year, primarily due to a $1.8 million decrease in sales of pancake and waffle dry mix and a 2.5%the decrease in domestic franchise same-restaurant sales. These unfavorable items were partially offset by a 3.3% increase in Effective Franchise Restaurants due to net restaurant development, a $0.7 million increase in international royalties and an increase in franchise fees.
The decreases in IHOP franchise expenses for the three and nine months ended September 30, 2017 compared with the same periods of the prior year were primarily due to decreases in purchases of pancake and waffle dry mix partially offset by increased Company contributions to marketing funds of $0.2 million and $0.6 million, respectively.
Advertising contributions designated for IHOP’s national advertising fund and local marketing and advertising cooperatives,sales, as well as advertising contributions from international franchise restaurants of both brands, are recognized as revenue and expense of franchise operations. However,a $0.5 million decrease due to differencespermanent restaurant closures.
It is our accounting policy to recognize any deficiency in advertising fee revenue compared to advertising expenditure or any recovery of a previously recognized deficiency in advertising fee revenue compared to advertising expenditure in the administrationfourth quarter of the Applebee’s marketing fund, contributions to Applebee's domestic marketing fund are not recognized as franchise revenue and expense. Advertising revenue and expense for the three and nine months ended September 30, 2017 increased slightly compared to the same periods of the prior year, primarily due to increased contributions from international franchise restaurants of both brands. The impact on advertising revenue and expense of the increase in the number of IHOP restaurants was partially offset by the decrease in IHOP domestic same-restaurant sales.our fiscal year.
Gross profit as a percentage of revenue declined for the three and nine months ended September 30, 2017 compared to the same respective periods of the prior year, primarily because of the decrease in Applebee's domestic same-restaurant sales and increases in cash-basis royalties and bad debt expense. We expect that gross profit of franchise operations for the remainder of 2017 will continue to be adversely impacted by Applebee's restaurant closures and increases in Applebee's bad debt expense and cash-basis royalties.
| | | Rental Operations | | Three months ended September 30, | | Favorable
(Unfavorable) Variance | | Nine months ended September 30, | | Favorable
(Unfavorable) Variance | Rental Operations | | | Three months ended March 31, | | Favorable
(Unfavorable) Variance |
| | | 2017 | | 2016 | | 2017 | | 2016 | | | | | 2021 | | 2020 | |
| | | (In millions) | | | | (In millions) |
| Rental revenues | | $ | 30.3 |
| | $ | 30.5 |
| | $ | (0.2 | ) | | $ | 90.9 |
| | $ | 92.7 |
| | $ | (1.8 | ) | Rental revenues | | | $ | 26.1 | | | $ | 29.0 | | | $ | (2.9) | |
| | Rental expenses | | 22.3 |
| | 22.8 |
| | 0.5 |
| | 67.7 |
| | 69.0 |
| | 1.3 |
| Rental expenses | | | 20.9 | | | 22.5 | | | 1.6 | |
| Rental operations gross profit | | $ | 8.0 |
| | $ | 7.7 |
| | $ | 0.3 |
| | $ | 23.2 |
| | $ | 23.7 |
| | $ | (0.5 | ) | Rental operations gross profit | | | $ | 5.2 | | | $ | 6.5 | | | $ | (1.3) | |
Gross profit as % of revenue (1) | | 26.3 | % | | 25.4 | % | | | | 25.5 | % | | 25.6 | % | | | Gross profit as % of revenue (1) | | | 19.8 | % | | 22.3 | % | | |
(1) Percentages calculated on actual amounts, not rounded amounts presented above.
Rental operations relate primarily to IHOP franchise restaurants. Rental income includes sublease revenue from operating leases and interest income from direct financing leases. Rental expenses are costs of prime operating leases and interest expense on prime capital leases on certain franchise restaurants.finance leases.
Rental segment revenue for the three months ended September 30, 2017 was lower than the same period of the prior year primarily dueMarch 31, 2021 decreased as compared to the expected progressive decline of $0.3 million in interest income as direct financing leases are repaid. Rental segment revenue for the nine months ended September 30, 2017 was lower than the same period of the prior year, primarily due to a $1.2$0.9 million decrease in rental income based on a percentage of franchisees' retail sales, a $0.9 million decrease due to restaurant closures and the expectedlease buy-outs, a $0.7 million progressive decline in level rent adjustments and a progressive decline of $0.9$0.4 million in interest income as direct financing leases are repaid.
Rental segment expenses decreased for the three and nine months ended September 30, 2017March 31, 2021 decreased compared to the same periodsperiod of the prior year due to an $0.8 million decrease in rental expenses, primarily becausedue to restaurant closures and lease buy-outs, a $0.4 million decrease in depreciation expense, a $0.2 million decrease in rent paid based on a percentage of the expected progressive declinesfranchisees' retail sales and a $0.2 million decrease in interest expense as capitalfinance lease obligations are repaidrepaid.
Company Restaurant Operations
| | | | | | | | | | | | | | | | | | | | | | | | | | |
| | | | | | Three months ended March 31, | | Favorable
(Unfavorable) Variance |
| | | | | | | | 2021 | | 2020 | |
| | | | | | | | | | | | |
| Effective Restaurants | | | | | | | | 69 | | | 69 | | | — | |
| | | | | | | | | (In millions) |
Applebee's Company restaurant sales (1) | | | | | | | | $ | 36.0 | | | $ | 31.3 | | | $ | 4.7 | |
Applebee's Company restaurant expenses (1) | | | | | | | | 32.7 | | | 30.3 | | | (2.4) | |
IHOP restaurant expenses (2) | | | | | | | | 0.2 | | | — | | | (0.2) | |
| Company restaurant gross profit | | | | | | | | $ | 3.1 | | | $ | 1.0 | | | $ | 2.1 | |
| Average weekly sales (in thousands) | | | | | | | | $ | 39.9 | | | $ | 34.8 | | | |
Gross profit as % of revenue (3) | | | | | | | | 9.0 | % | | 3.1 | % | | |
(1) Related to 69 Applebee's company-operated restaurants.
(2) Costs associated with IHOP restaurants in the process of being refranchised.
(3) Calculated for Applebee's company-operated restaurants only. Percentages calculated on actual amounts, not rounded amounts presented above.
Applebee's company restaurant sales for the three months ended March 31, 2021 increased compared to the same period of 2020, due to an increase in average check as well as an increase in traffic. The increase in average check was due to favorable product mix and daypart shifts. We believe the distribution of the latest round of government stimulus checks in depreciationMarch 2021 favorably impacted both traffic and average check. All 69 of the Applebee's company-operated restaurants are located in South Carolina or North Carolina. Since the second week of January 2021, the 27 restaurants in South Carolina have operated without capacity limitations, while the 42 restaurants in North Carolina have operated at 50% capacity. In comparison, all 69 restaurants operated without restriction for the first 10 weeks of the 2020 first quarter but essentially were limited to off-premise sales for the last three weeks of the first quarter of 2020.
Gross profit and gross profit as assets age.a percentage of revenue for the three months ended March 31, 2021 improved compared to gross profit for the three months ended March 31, 2020, which was adversely impacted by the COVID-19-related operating constraints described above.
In addition, Company segment restaurant expenses for the three months ended March 31, 2021 include approximately $0.2 million of costs associated with reacquired IHOP restaurants in the process of being refranchised. None of the reacquired IHOP restaurants were operated during the three months ended March 31, 2021.
Financing Operations
Financing revenues primarily consist of interest income from the financing of IHOP equipment leases and franchise fees as well as sales of equipment associated with refranchised IHOP restaurants.interest income on Applebee's notes receivable from franchisees. Financing expenses are the cost of any restauranttaxes related to IHOP equipment sold associated with refranchised IHOP restaurants.leases.
The decrease in financingFinancing revenue and gross profit for the three and nine months ended September 30, 2017 wasMarch 31, 2021 declined primarily due to the expectedbecause of progressive declines of $0.2 million and $0.6 million, respectively,decline in interest revenueincome as note balances are repaid. The decrease in financing gross profit
| | | | | | | | | | | | | | | | | | | | | | | | | | |
| G&A Expenses | | | | | | Three months ended March 31, | | Favorable
(Unfavorable) Variance |
| | | | | | | 2021 | | 2020 | |
| | | | | | | | | (In millions) | |
| Total G&A expenses | | | | | | | | $ | 39.9 | | | $ | 37.6 | | | $ | (2.3) | |
G&A expenses for the three and nine months ended September 30, 2017 was primarily due to costs associated with the sale of equipment related to refranchised IHOP restaurants as well as the declines in interest revenue.
Company Restaurant Operations
Effective June 19, 2017, we refranchised nine of our ten company-operated IHOP restaurants in the Cincinnati, Ohio market area; the one restaurant not refranchised was closed. As a result, we no longer operate any IHOP restaurants on a permanent basis. We did not consider these restaurants to be “discontinued operations” as defined by U.S. GAAP because the refranchising of nine restaurants out of a total of over 3,700 restaurants did not represent a strategic shift that had a major effect on our
operations. From time to time, we may continue to operate IHOP restaurants reacquired from franchisees on a temporary basis until those restaurants are refranchised. There were no IHOP restaurants under temporary operation as of September 30, 2017.
Company restaurant revenues and expenses decreased for the three and nine months ended September 30, 2017March 31, 2021 increased 6.1% compared to the same period of the prior year, primarily because we did not operate any company restaurants after June 19, 2017 and we did not operate any reacquired restaurants during the first nine months of 2017, whereas we did operate one reacquired restaurant during the first nine months of 2016. Gross profit for the three and nine months ended September 30, 2017 improved slightly because the temporary operation of reacquired restaurants typically resultsdue to an increase in personnel-related costs, partially offset by a small loss.
|
| | | | | | | | | | | | | | | | | | | | | | | | |
| G&A Expenses | | Three months ended September 30, | | Favorable
(Unfavorable) Variance | | Nine months ended September 30, | | Favorable
(Unfavorable) Variance |
| | | 2017 | | 2016 | | | 2017 | | 2016 | |
| | | (In millions) |
| | $ | 38.0 |
| | $ | 36.0 |
| | $ | (2.0 | ) | | $ | 125.7 |
| | $ | 111.9 |
| | $ | (13.8 | ) |
decrease in travel costs. The increase in personnel-related costs primarily was due to higher costs of equity-based and other incentive compensation. Included in total G&A expenses for the three months ended September 30, 2017 comparedMarch 31, 2021 were $1.2 million of expenses related to company-operated restaurants, an amount similar to same period of the prior year.
| | | | | | | | | | | | | | | | | | | | | | | | | | |
| Closure and Impairment Charges | | | | | | Three months ended March 31, | | Favorable
(Unfavorable) Variance |
| | | | | | | 2021 | | 2020 | |
| | | | | | | | | (In millions) |
| Closure charges | | | | | | | | $ | 1.9 | | | $ | (0.0) | | | $ | (1.9) | |
| Long-lived tangible asset impairment | | | | | | | | 0.1 | | | — | | | $ | (0.1) | |
| Total closure and impairment charges | | | | | | | | $ | 2.0 | | | $ | (0.0) | | | $ | (2.0) | |
Closure charges for the three months ended March 31, 2021 related the establishment of or revision to closure reserves for approximately 35 IHOP restaurants. The $0.1 million of impairment related to the operating lease right-of-use asset of one IHOP restaurant.
| | | | | | | | | | | | | | | | | | | | | | | | | | |
Other Income and Expense Items
| | | | | | Three months ended March 31, | | Favorable
(Unfavorable) Variance |
| | | | | | | 2021 | | 2020 | |
| | | | | | | | | (In millions) |
| Interest expense, net | | | | | | | | $ | 16.5 | | | $ | 15.2 | | | $ | (1.3) | |
| | | | | | | | | | | | |
| Amortization of intangible assets | | | | | | | | 2.7 | | | 2.8 | | | 0.1 | |
| Loss (gain) on disposition of assets | | | | | | | | 0.2 | | | (0.2) | | | (0.4) | |
| Total | | | | | | | | $ | 19.4 | | | $ | 17.8 | | | $ | (1.6) | |
Interest expense, net
Interest expense, net for the three months ended March 31, 2021 was higher than the same period of the prior year, was primarily due to a $1.9 million increase in personnel-related costs. Increases in costs of software, depreciation and professional services were offset by lower costs of travel and conferences. The increase in personnel-related costs is primarily due to higher costs of severance and an increase in salary and benefits related to the hiring of several senior management positions over the past twelve months, partially offset by lower costs of stock-based compensation.
The increase in G&A expenses for the nine months ended September 30, 2017 compared to the same period of the prior year was primarily due to charges of $8.8 million related to the executive separation costs discussed under “Events Impacting Comparability of Financial Information.” The additional increase in G&A of $5.0 million was due to a $5.4 million increase in professional services and a $2.5 million increase in personnel-related costs, partially offset by a $2.0 million decrease in travel and conference costs and a decrease of $1.1 million in recruiting and relocation costs.
The increase in professional services was due primarily to our utilization of third-party consultants related to the Applebee's stabilization initiatives discussed under “Domestic Same-restaurant Sales - Applebee's.” The increase in personnel-related costs was primarily due to an increase in salary and benefits related to the hiring of several senior management positions over the past twelve months, an increaseinterest expense on $220.0 million borrowed under our Credit Facility in severance costs and a decrease in certain employment-related incentive credits because of our reduction of personnel in the state of Missouri, partially offset by lower costs of stock-based compensation.March 2020. The decrease in travel and conference costs$220.0 million was primarily due to the timing of our brands' franchisee conferences that will take place in the fourth quarter of 2017 as compared to taking place in the third quarter of 2016. The decrease in recruiting, relocation and occupancy expenses related to costs incurred as a result of the relocation of personnel and functions in 2016 that did not recur in 2017.
|
| | | | | | | | | | | | | | | | | | | | | | | | |
| Impairment and Closure Charges | | Three months ended September 30, | | Favorable
(Unfavorable) Variance | | Nine months ended September 30, | | Favorable
(Unfavorable) Variance |
| | | 2017 | | 2016 | | | 2017 | | 2016 | |
| | | (In millions) |
| Impairment of goodwill | | $ | 358.2 |
| | $ | — |
| | $ | (358.2 | ) | | $ | 358.2 |
| | $ | — |
| | $ | (358.2 | ) |
| Impairment of tradename | | 173.4 |
| | — |
| | (173.4 | ) | | 173.4 |
| | — |
| | (173.4 | ) |
| Other impairment and closure costs | | 0.9 |
| | 0.2 |
| | (0.7 | ) | | 3.8 |
| | 4.0 |
| | 0.2 |
|
| | | $ | 532.5 |
| | $ | 0.2 |
| | $ | (532.3 | ) | | $ | 535.4 |
| | $ | 4.0 |
| | $ | (531.4 | ) |
As discussed above under the heading “Significant Known Events, Trends or Uncertainties Impacting or Expecting to Impact Comparisons of Reported or Future Results - Impairment of Applebee's Goodwill and Tradename,” we performed an interim quantitative testoutstanding for impairment of Applebee's goodwill and tradename during the third quarter of 2017 and recorded an impairment to goodwill of $358.2 million and an impairment to the Applebee's tradename of $173.4 million.
In determining the fair value of the Applebee's franchise reporting unit, we used the income approach method of valuation that includes the discounted cash flow method as well as other generally accepted valuation methodologies to determine the fair value of goodwill and intangible assets. Significant assumptions made by management in estimating fair value under the discounted cash flow model include future trends in sales, operating expenses, overhead expenses, depreciation, capital expenditures and changes in working capital, along with an appropriate discount rate based on our estimated cost of equity capital and after-tax cost of debt.
In determining the fair value of the Applebee's tradename, we used the relief of royalty method under the income approach method of valuation. Significant assumptions used to determine fair value under the relief of royalty method include future trends in sales, a royalty rate and a discount rate to be applied to the forecast revenue stream.
The assumptions used in both the discounted cash flow method and the relief of royalty method are determined by the Company based on historical results, trends and anticipated growth resulting from specific development initiatives planned to be implemented over the time horizon covered by the Company's projections. The most impactful assumptions are the discount rate and the forecast change in system-wide sales (due to a combination of changes in same-restaurant sales and in net restaurant development) that impact our royalty revenues.
There is an inherent degree of uncertainty in preparing any forecast of future results. The projections used in performing the impairment testsapproximately nine weeks during the three months ended September 30, 2017, reflected an increase in system-wide sales from estimated full-year 2017 amounts, in progressively larger increments, over the time period covered by the projections. System-wide sales are dependentMarch 31, 2021, compared to a significant extent on national, regional and local economic conditions, and, to a lesser extent, on global economic conditions, particularly those conditions affecting the demographics of the guests that frequently patronize Applebee's restaurants. Accordingly, there are a number of potential events that could reasonably be expected to negatively affect the forecast of system-wide sales, including a decrease in customers' disposable income available$220.0 million outstanding for discretionary spending (because of circumstances such as job losses, credit constraints, higher housing costs, increased tax rates, energy costs, interest rates or other costs) or a decrease in the perceived wealth of customers (because of circumstances such as lower residential real estate values, increased foreclosure rates, increased tax rates or other economic disruptions). As a result, our business could experience a decline in sales and/or customer traffic as potential customers choose lower-cost alternatives (such as quick-service restaurants) or other alternatives to dining out. Additionally, negative trends in the availability of credit and in expenses such as interest rates and the cost of construction materials could affect our franchisees' ability to maintain and remodel existing restaurants. Any decreases in customer traffic or average customer check due to these or other reasons could reduce gross sales at franchise restaurants, resulting in lower royalty and other payments from franchisees. This could reduce the profitability of franchise restaurants, potentially impacting the ability of franchisees to make royalty payments owed to us when due (which could adversely impact our current cash flow from franchise operations) and negatively impacting franchisees’ ability to develop new restaurants (which could adversely impact our future cash flows from franchise operations).
Other impairment and closure charges forless than two weeks during the three months ended September 30, 2017March 31, 2020. See “Liquidity and 2016 were not significant. For the nine months ended September 30, 2017, other impairment and closure costs of $3.8 million primarily comprised $2.2 million of costsCapital Resources” for additional discussion related to the closureborrowing.
Loss on disposition of one company-operated IHOP restaurant in the Cincinnati, Ohio market area. assets
There were no other individually significant charges.
Forlosses or gains on disposition of assets during the ninethree months ended September 30, 2016, other impairmentMarch 31, 2021 and closure costs are primarily comprised of $2.5 million of lease termination costs related to the reduction of our space requirements in Kansas City, Missouri, approximately $1.0 million of impairment charges and $0.5 million of closure charges. The largest individually significant impairment charge of $0.6 million related to one IHOP company-operated restaurant. The closure charges related to adjustments for IHOP and Applebee's restaurants closed in periods prior to September 30, 2016.2020.
| | | | | | | | | | | | | | | | | | | | | | | | | | |
| Income Taxes | | | | | | Three months ended March 31, | | Favorable
(Unfavorable) Variance |
| | | | | | | 2021 | | 2020 | |
| | | | | | | | | (In millions) |
| Income before income taxes | | | | | | | | $ | 24.0 | | | $ | 29.1 | | | $ | (5.1) | |
| Income tax (benefit) provision | | | | | | | | $ | (1.6) | | | $ | 6.7 | | | $ | 8.3 | |
| Effective tax rate | | | | | | | | (6.6) | % | | 23.2 | % | | 29.8 | % |
|
| | | | | | | | | | | | | | | | | | | | | | | | |
| (Gain) Loss on Disposition of Assets | | Three months ended September 30, | | Favorable
(Unfavorable) Variance | | Nine months ended September 30, | | Favorable
(Unfavorable) Variance |
| | 2017 | | 2016 | | | 2017 | | 2016 | |
| | | (In millions) |
| | | $ | (0.0 | ) | | $ | 0.1 |
| | $ | 0.1 |
| | $ | (6.4 | ) | | $ | 0.7 |
| | $ | 7.1 |
|
In June 2017, we completed the refranchising and sale of related restaurant assets of nine company-operated IHOP restaurants in the Cincinnati, Ohio market area. As part of the transaction, we entered into an asset purchase agreement, nine franchise agreements and nine sublease agreements for land and buildings. The Company compared the stated rent under the sublease agreements with comparable market rents and recorded net favorable lease assets of $2.3 million in related to the transaction. The Company also received cash of $1.1 million and a note receivable for $4.8 million. After allocating a portion of the consideration to franchise fees and derecognition of the assets sold, we recognized a gain of $6.2 million on the refranchising and sale during the nine months ended September 30, 2017. There were no other individually significant asset dispositions in either of the comparative periods presented above.
|
| | | | | | | | | | | | | | | | | | | | | | | | |
Other Expense and Income Items | | Three months ended September 30, | | Favorable
(Unfavorable) Variance | | Nine months ended September 30, | | Favorable
(Unfavorable) Variance |
| | | 2017 | | 2016 | | | 2017 | | 2016 | |
| | | (In millions) |
| Interest expense | | $ | 15.4 |
| | $ | 15.4 |
| | $ | 0.0 |
| | $ | 46.5 |
| | $ | 46.1 |
| | $ | (0.4 | ) |
| Amortization of intangible assets | | 2.5 |
| | 2.5 |
| | (0.0 | ) | | 7.5 |
| | 7.5 |
| | (0.0 | ) |
| Total | | $ | 17.9 |
| | $ | 17.9 |
| | $ | 0.0 |
| | $ | 54.0 |
| | $ | 53.6 |
| | $ | (0.4 | ) |
Interest expense and amortization of intangible assets for the three and nine months ended September 30, 2017 were consistent with the same periods of the prior year.
|
| | | | | | | | | | | | | | | | | | | | | | | | |
| Income Taxes | | Three months ended September 30, | | Favorable
(Unfavorable) Variance | | Nine months ended September 30, | | Favorable
(Unfavorable) Variance |
| | | 2017 | | 2016 | | | 2017 | | 2016 | |
| | | (In millions) |
| Income tax (benefit) provision | | $ | (56.6 | ) | | $ | 13.2 |
| | $ | 69.8 |
| | $ | (28.2 | ) | | $ | 41.7 |
| | $ | 69.9 |
|
| Effective tax rate | | 11.1 | % | | 35.3 | % | | 24.2 | % | | 6.4 | % | | 35.2 | % | | 28.8 | % |
Our income tax provision or benefit will vary from period to period in our normal course of business for two reasons: a change in income before income taxes and a change in the effective tax rate. Changes in our income before income taxes between 2017 and 2016 were addressed in the preceding sections of “Consolidated“Consolidated Results of Operations - Comparison of the Three and Nine Months Ended September 30, 2017March 31, 2021 and 2016.2020.”
Our effective tax ratesrate for the three and nine months ended September 30, 2017 wereMarch 31, 2021 was significantly different than the rate of the prior comparable period and the statutory federal tax rate of 35%. As noted under “Impairment and Closure Charges” above, we recorded an impairment21%, primarily due to the one-time recognition of Applebee's goodwill of $358.2 million, which is not deductible for federal incomeexcess tax purposes and therefore there is no tax benefit associated with the impairment. We did recognize a deferred tax benefit of $65.1 million as a discrete itembenefits on stock-based compensation related to the $173.4 million impairment charge related to Applebee's tradename.departure of our previous chief executive officer.
Liquidity and Capital Resources
At September 30, 2017, our outstanding long-term debt consisted On June 5, 2019, Applebee’s Funding LLC and IHOP Funding LLC (the “Co-Issuers”), each a special purpose, wholly-owned indirect subsidiary of $1.3 billionthe Company, issued two tranches of fixed rate senior secured notes, the Series 2014-1 4.277%2019-1 4.194% Fixed Rate Senior Secured Notes, Class A-2A-2-I (“Class A-2-I Notes”) in an initial aggregate principal amount of $700 million and the Series 2019-1 4.723% Fixed Rate Senior Secured Notes, Class A-2-II (“Class A-2-II Notes”) in an initial aggregate principal amount of $600 million (the “Class A-2-II Notes” and, together with the Class A-2-I Notes, the “2019 Class A-2 Notes”). WeThe 2019 Class A-2 Notes were issued pursuant to an offering exempt from registration under the Securities Act of 1933, as amended.
The Co-Issuers also haveestablished a new revolving financing facility, consisting of Series 2014-1the 2019-1 Variable Funding Senior Notes, Class A-1 (the “Variable Funding Notes”“Credit Facility”), which that allows for drawings of up to $100$225 million of Variable Funding Notesvariable funding notes and the issuance of letters of credit. The 2019 Class A-2 Notes and the Variable Funding NotesCredit Facility are referred to collectively herein as the “Notes.“New Notes.” The New Notes were issued in a private securitization transaction pursuant to which substantially all ourthe domestic revenue-generating assets and our domestic intellectual property are held by the Co-Issuers and certain other special-purpose, wholly-owned indirect subsidiaries of the Company (the “Guarantors”) that actwere pledged as guarantors of the Notes and that have pledged substantially all their assetscollateral to secure the New Notes.
While the 2019 Class A-2 Notes are outstanding, payment of principal and interest is required to be made on the 2019 Class A-2 Notes on a quarterly basis. The quarterly principal payment oftotaling $3.25 million on the 2019 Class A-2 Notes may be suspended when the leverage ratio for the Company and its subsidiaries is less than or equal to 5.25x. AtThe complete definitions of all calculation elements of the leverage ratio are contained in the Base Indenture, dated as of September 30, 2017,2014, amended and restated as of June 5, 2019 (the “Base Indenture”), as supplemented by the related Series 2019-1 Supplement to the Base Indenture, dated June 5, 2019 (the “Series 2019-1 Supplement”), among the Co-Issuers and Citibank, N.A., as the trustee (in such capacity, the “Trustee”) and securities intermediary (the Base Indenture and the Series 2019-1 Supplement, collectively, the “Indenture”). In general, the leverage ratio is our indebtedness (as defined in the Indenture) divided by adjusted EBITDA (as defined in the Indenture) for the four preceding quarterly periods.
As of March 31, 2021, our leverage ratio was 5.36x (see Exhibit 12.1). Exceeding7.02x. As a result, quarterly principal payments on the 2019 Class A-2 Notes of $3.25 million continue to be required. The leverage ratio is not a maintenance covenant and exceeding the leverage ratio of 5.25x does not violate any covenant related to the Notes; however, we will be required to make a principal payment of $3.25 million in the fourth quarter of 2017.New Notes.
WeThe Company may voluntarily repay the 2019 Class A-2 Notes at any time; however, if we voluntarily repay the 2019 Class A-2 Notes prior to September 2018certain dates we would be required to pay a make-whole premium.premiums. As of March 31, 2021, the make-whole premium associated with voluntary prepayment of the Class A-2-I Notes was approximately $29 million; this amount declines each quarter to zero in June 2022. As of March 31, 2021, the make-whole premium associated with voluntary prepayment of the Class A-2-II Notes was approximately $59 million; this amount declines each quarter to zero in June 2024. We would also be subject to a make-whole premium in the event of a mandatory prepayment occurring prior to September 2018required following a Rapid Amortization Event (as defined in the Class A-2 Notes) or certain asset dispositions. The mandatory make-whole premium requirements are considered derivatives embedded in the Class A-2New Notes that must be bifurcated for separate valuation. We estimated the fair value of these derivatives to be insignificant at September 30, 2017,immaterial as of March 31, 2021, based on the probability-weighted discounted cash flows associated with either event.
Covenants and Restrictions
The Variable FundingNew Notes were not drawn upon at September 30, 2017are subject to a series of covenants and we have not drawn on them since issuance. At September 30, 2017, $5.0 million wasrestrictions customary for transactions of this type, including: (i) that the Co-Issuers maintain specified reserve accounts to be used to make required payments in respect of the New Notes, (ii) provisions relating to optional and mandatory prepayments, and the related payment of specified amounts, including specified call redemption premiums in the case of Class A-2 Notes under certain circumstances; (iii) certain indemnification payments in the event, among other things, the transfers of the assets pledged againstas collateral for the Variable FundingNew Notes for outstanding letters of credit, leaving $95.0 million of Variable Funding Notes available for borrowings.are in stated ways defective or ineffective and (iv) covenants relating to recordkeeping, access to information and similar matters. The letters of credit are used primarily to satisfy insurance-related collateral requirements.
TheNew Notes are subject to customary rapid amortization events provided for similar types of financing,in the Indenture, including events tied to our failure of the Securitization Entities to maintain the stated debt service coverage ratio (“DSCR”), the sum of domestic retail sales for all restaurants being below certain levels on certain measurement dates, certain manager termination events, certain events of default and the failure to repay or refinance the Class A-2 Notes on the Class A-2 Anticipated Repayment Date in September 2021.anticipated repayment dates. The New Notes are also subject to certain customary events of default, including events relating to non-payment of required interest, principal or other amounts due on or with respect to the New Notes, failure of the Securitization Entities to maintain the stated DSCR, failure to comply with covenants within certain time frames, certain bankruptcy events, breaches of specified representations and warranties and certain judgments.
In general, the DSCR ratio is Net Cash Flow (as defined in the Indenture) for the four quarters preceding the calculation date divided by the total debt service payments (as defined in the Indenture) of the preceding four quarters. The complete definitions of the DSCR and all calculation elements are contained in the Indenture. Failure to maintain a prescribed DSCR can trigger a Cash TrappingFlow Sweeping Event, A Rapid Amortization Event, a Manager Termination Event or a Default Event as described below. In a Cash TrappingFlow Sweeping Event, the Trustee is required to retain a certain percentage50% of excess Cash Flow (as defined)defined in the Indenture) in a restricted account. In a Rapid Amortization Event, all excess Cash Flow is retained and used to retire principal amounts of debt. In a Manager Termination Event, the Company may be replaced as manager of the assets securitized under the Indenture. In a Default Event, the outstanding principal amount and any accrued but unpaid interest can be called to become immediately due and payable. Key DSCRs are as follows:
•DSCR less than 1.75x but equal to or greater than 1.50x - Cash TrappingFlow Sweeping Event 50% of Net Cash Flow
•DSCR less than 1.50x - Cash Trapping Event, 100% of Net Cash Flow
•DSCR less than 1.30x1.20x - Rapid Amortization Event
•Interest-only DSCR less than 1.20x - Manager Termination Event
•Interest-only DSCR less than 1.10x - Default Event
Our DSCR for the reporting period ended March 31, 2021 was approximately 3.45x.
During the second quarter of 2020, we voluntarily increased the interest reserve set aside for our securitized debt from the required $16.4 million to $32.8 million, which represented an estimated six months of interest and fees related to the 2019 Class A-2 Notes and the Credit Facility. In April 2021, we reduced the balance of the interest reserve to $16.4 million, the required three months of interest and fees related to the 2019 Class A-2 Notes and the Credit Facility. Also, during the second quarter of 2020, we voluntarily began accelerating the funding of interest on the 2019 Class A-2 Notes and the Credit Facility with the redirection of cash receipts within our securitization structure. As of April 27, 2021, the interest payments on the 2019 Class A-2 Notes and the Credit Facility that are due June 7, 2021 and September 30, 20177, 2021 have been fully funded within the securitization structure, in addition to the $16.4 million of interest reserve noted above.
Use of Credit Facilities
In March 2020, the Co-Issuers drew down a total of $220.0 million from the Credit Facility. The $220.0 million borrowing was 4.33x (see Exhibit 12.1)repaid on March 5, 2021. The current interest rate for borrowings under the Credit Facility is the three-month LIBOR rate plus 2.15% for 60% of the advances and the commercial paper funding rate of our conduit investor plus 2.15% for 40% of the advances. The weighted average interest rate on Credit Facility borrowings for the period outstanding during the three months ended March 31, 2021 was 2.4%.
At March 31, 2021, there were no outstanding borrowings under the Credit Facility. At March 31, 2021, $3.3 million was pledged against the Credit Facility for outstanding letters of credit, leaving $221.7 million available for borrowing. The letters of credit are used primarily to satisfy insurance-related collateral requirements.
Capital Allocation
Dividends
During the nine months ended September 30, 2017, we paid dividends on common stock of $52.3 million, representing cash dividends of $0.97 per share declared in the fourth quarter of 2016 and the first and second quarters of 2017. On August 10, 2017, our Board of Directors declared a third quarter 2017 cash dividend of $0.97 per share of common stock. This dividend was paid on October 6, 2017 to our stockholders of record at the close of business on September 18, 2017. We reported dividends payable of $17.8 million at September 30, 2017.
Share Repurchases
In October 2015, our Board of Directors approved a stock repurchase program authorizing us to repurchase up to $150 million of our common stock (the “2015 Repurchase Program”) on an opportunistic basis from time to time in open market transactions and in privately negotiated transactions based on business, market, applicable legal requirements and other considerations. The 2015 Repurchase Program, as approved by the Board of Directors, does not require the repurchase of a specific number of shares and can be terminated at any time. A summary of shares repurchased under the 2015 Repurchase Program, currently and cumulatively, is as follows:
|
| | | | | | |
| | Shares | | Cost of shares |
| | | | (In millions) |
| Repurchased during the three months ended September 30, 2017 | — |
| | $ | — |
|
| Repurchased during the nine months ended September 30, 2017 | 145,786 |
| | $ | 10.0 |
|
| Cumulative repurchases as of September 30, 2017 | 1,000,657 |
| | $ | 82.9 |
|
| Remaining dollar value of shares that may be repurchased | n/a | | $ | 67.1 |
|
We evaluate dividend payments on common stock and repurchases of common stock within the context of our overall capital allocation strategy with our Board of Directors on an ongoing basis, giving consideration to our current and forecast earnings, financial condition, cash requirements and other factors. To maintain financial flexibility in light of the COVID-19 pandemic, we have not declared any dividends after the first quarter of 2020 and have suspended repurchasing our common stock. We will continue to evaluate our capital allocation strategy as industry conditions evolve and normal restaurant operations resume.
Dividends
We did not declare or pay dividends during the three months ended March 31, 2021.
Stock Repurchases
In February 2019, the Company’s Board of Directors approved a stock repurchase program authorizing the Company to repurchase up to $200 million of the Company’s common stock (the “2019 Repurchase Program”) on an opportunistic basis from time to time in the open market or in privately negotiated transactions based on business, market, applicable legal requirements and other considerations. The 2019 Repurchase Program, as approved by the Board of Directors, does not require the repurchase of a specific number of shares and can be terminated at any time.
We did not repurchase any shares under the 2019 Repurchase Program during the three months ended March 31, 2021. As of March 31, 2021, cumulative repurchases of stock total 1,697,597 shares at a cost of $129.8 million, with a dollar value of $70.2 million remaining for repurchase under the 2019 Repurchase Program.
From time to time, we also repurchase shares owned and tendered by employees to satisfy tax withholding obligations on the vesting of restricted stock awards. Shares are deemed purchased at the closing price of our common stock on the vesting date. See Part II, Item 2 for detail on all sharethis stock repurchase activity during the thirdfirst quarter of 2017.2021.
Cash Flows
In summary, our cash flows for the ninethree months ended September 30, 2017March 31, 2021 and 2016March 31, 2020 were as follows:
|
| | | | | | | | | | | |
| | Nine months ended September 30, | | |
| | 2017 | | 2016 | | Variance |
| | (In millions) |
| Net cash provided by operating activities | $ | 31.0 |
| | $ | 62.1 |
| | $ | (31.1 | ) |
| Net cash provided by investing activities | 6.4 |
| | 10.0 |
| | (3.6 | ) |
| Net cash used in financing activities | (72.7 | ) | | (106.6 | ) | | 33.9 |
|
| Net decrease in cash, cash equivalents and restricted cash | $ | (35.2 | ) | | $ | (34.5 | ) | | $ | (0.7 | ) |
| | | | | | | | | | | | | | | | | |
| Three months ended March 31, | | |
| | 2021 | | 2020 | | Variance |
| | (In millions) |
| Net cash provided by operating activities | $ | 30.6 | | | $ | 29.6 | | | $ | 1.0 | |
| Net cash provided by (used in) investing activities | 3.1 | | | (1.2) | | | 4.3 | |
| Net cash (used in) provided by financing activities | (217.3) | | | 194.2 | | | (411.5) | |
| Net (decrease) increase in cash, cash equivalents and restricted cash | $ | (183.6) | | | $ | 222.6 | | | $ | (406.2) | |
Operating Activities
The decline in cashCash provided by operating activities forincreased $1.0 million during the ninethree months ended September 30, 2017March 31, 2021 compared to the same period of the prior year. Our net income plus the non-cash reconciling items shown in our statements of cash flows (primarily closure and impairment charges, depreciation, deferred taxes and stock-based compensation) increased $5.9 million from 2020. This was primarily due to the recognition of excess tax benefits on stock-based compensation and an increase in gross profit, partially offset by an increase in G&A expenses, each of which was discussed in preceding sections of the MD&A. Net changes in working capital provided cash of $0.4 million during the three months ended March 31, 2021 compared to providing cash of $5.4 million during the same period of the prior year, an unfavorable change of $5.0 million. The unfavorable change in working capital was primarily due to a decrease in net income. Our net income forcash from trade and gift card receivables. Typically we see an increase in cash collections in the nine months ended September 30, 2017 declined $492.7 millionfirst fiscal quarter of the year due to gift card sales during the preceding holiday season. Due to the pandemic, gift card sales in the fourth quarter of 2020 were lower than the fourth quarter of 2019, resulting in lower cash collections in the first quarter of 2021 compared to the same periodfirst quarter of 2016, primarily because2020. This was partially offset by the timing of a non-cash charge for the impairment of Applebee's goodwill and tradename. Our net income including the non-cash reconciling items shown in the statement of cash flows (primarily impairment charges, deferred taxes and depreciation) was $67.1 million for the nine months ended September 30, 2017 compared to $98.1 million the same period of 2016. The decrease of $31.1 million in cash provided by operating activities for the nine months ended September 30, 2017 was primarily due to a decline in gross profit from franchise operations and the increase in G&A expenses discussed in preceding sections of the MD&A.marketing disbursements.
Net changes in working capital used cash of $36.1 million during the first nine months of 2017, unchanged from a use of cash of $36.1 million during the first nine months of 2016.
Investing Activities
Investing activities provided net cash of $6.4$3.1 million for the ninethree months ended September 30, 2017.March 31, 2021. Principal receipts from notes, equipment contracts and other long-term receivables of $15.3$4.7 million and proceeds from asset sales of $1.1$1.0 million were partially offset by $9.6capital expenditures of $2.4 million. Investing activities used net cash of $1.2 million for the three months ended March 31, 2020. The variance between the two periods primarily was due to a decrease in capital expenditures.expenditures during the three months ended March 31, 2021 compared to the same period of the prior year.
Financing Activities
Financing activities used net cash of $72.7$217.3 million for the ninethree months ended September 30, 2017. Cash used in financing activities primarily consistedMarch 31, 2021. As discussed above under Use of cash dividendsCredit Facilities, we repaid $220.0 million borrowed from our Credit Facility. We also paid $9.7 million for taxes withheld for vesting of restricted stock units and made payments totaling $5.9 million on our common stock totaling $52.3 million, repurchases of our common stock totaling $10.0 millionlong-term debt and repayments of capital lease obligations of $10.6 million, partially offset byobligations. We had a net cash inflow of approximately $0.3$18.3 million related to equity compensation awards.awards.
Financing activities provided net cash of $194.2 million for the three months ended March 31, 2020, primarily due to a $220 million drawdown from our Credit Facility and $20.5 million in proceeds from stock option exercises, offset by stock repurchases and dividend payments totaling $41.3 million. The variance of $411.5 million between periods primarily was due to the $440 million swing in use of the Credit Facility, partially offset by our not having repurchased stock or paid dividends during the three months ended March 31, 2021.
Cash and Cash Equivalents
At September 30, 2017, ourOur total cash balances as of March 31, 2021 and December 31, 2020 were are follows:
| | | | | | | | | | | | | | |
| | March 31, 2021 | | December 31, 2020 |
| | (In millions) |
| Cash and cash equivalents | | $ | 179.6 | | | $ | 383.4 | |
| Restricted cash, current | | 60.1 | | | 39.9 | |
| Restricted cash, non-current | | 32.8 | | | 32.8 | |
| Total | | $ | 272.5 | | | $ | 456.1 | |
Cash and cash equivalents totaled $104.2include $72.0 million, including $36.3 and $71.6 million of cash held for gift card programs and advertising funds.funds as of March 31, 2021 and December 31, 2020, respectively. The decrease in cash and cash equivalents between December 31, 2020 and March 31, 2021 was due to the repayment of $220.0 million discussed above under Use of Credit Facilities.
Based on our current level of operations, weWe believe that our unrestricted cash on hand, cash flow from operations, available cash and availablethe $221.7 million of borrowing capacity available under our Variable Funding NotesCredit Facility will beprovide us with adequate to meet our liquidity needs for the next twelve months.
Adjusted Free Cash Flow
We define “adjusted free cash flow” for a given period as cash provided by operating activities, plus receipts from notes and equipment contract receivables, less additions to property and equipment. Management uses this liquidity measure in its periodic assessment of, among other things, cash dividends per share of common stock and repurchases of common stock and we believe it is important for investors to have the same measure used by management for that purpose. Adjusted free cash flow does not represent residual cash flow available for discretionary purposes.
Adjusted free cash flow is a non-U.S. GAAP measure. Reconciliation of the cash provided by operating activities to adjusted free cash flow is as follows:
|
| | | | | | | | | | | |
| | Nine months ended September 30, | | |
| | 2017 | | 2016 | | Variance |
| | (In millions) |
| Cash flows provided by operating activities | $ | 31.0 |
| | $ | 62.1 |
| | $ | (31.1 | ) |
| Receipts from notes and equipment contracts receivable | 8.0 |
| | 7.6 |
| | 0.4 |
|
| Additions to property and equipment | (9.6 | ) | | (3.5 | ) | | (6.1 | ) |
| Adjusted free cash flow | $ | 29.4 |
| | $ | 66.2 |
| | $ | (36.8 | ) |
This non-U.S. GAAP measure is not defined in the same manner by all companies and may not be comparable to other similarly titled measures of other companies. Non-U.S. GAAP measures should be considered in addition to, and not as a substitute for, the U.S. GAAP information contained within our financial statements.
The decrease in Reconciliation of the cash provided by operating activities to adjusted free cash flow for the nine months ended September 30, 2017 compared to the same period of the prior year is primarily due to the decrease in cash from operating activities discussed above and an increase in capital expenditures. Capital expenditures are expected to be approximately $14 million for fiscal 2017.as follows:
Financial Condition
| | | | | | | | | | | | | | | | | |
| Three months ended March 31, | | |
| 2021 | | 2020 | | Variance |
| (In millions) |
| Cash flows provided by operating activities | $ | 30.6 | | | $ | 29.6 | | | $ | 1.0 | |
| Receipts from notes and equipment contracts receivable | 2.5 | | | 3.0 | | | (0.5) | |
| Additions to property and equipment | (2.4) | | | (5.1) | | | 2.7 | |
| Adjusted free cash flow | $ | 30.7 | | | $ | 27.5 | | | $ | 3.2 | |
As discussed above under the heading “Significant Known Events, Trends or Uncertainties Impacting or Expecting to Impact Comparisons of Reported or Future Results - Impairment of Applebee's Goodwill and Tradename,” we performed an interim quantitative test for impairment of Applebee's goodwill and tradename during the third quarter of 2017 and recorded an impairment to goodwill of $358.2 million and an impairment to the Applebee's tradename of $173.4 million. We recognized a deferred tax benefit of $65.1 million related to the $173.4 million impairment of the Applebee's tradename. As a result of these items, our total assets, total liabilities and shareholders' equity were reduced by $531.6 million, $65.1 million and $467.5 million, respectively. Because these were non-cash transactions, there was no impact of the impairment on our consolidated cash flows.
Off-Balance Sheet Arrangements
We have obligations for guarantees on certain franchisee lease agreements, as disclosed in Note 1015 - Commitments and Contingencies, of Notes to Consolidated Financial Statements of Part I, Item 1 of this Form 10-Q. Other than such guarantees, we did not have any off-balance sheet arrangements, as defined in Item 303(a)(4) of SEC Regulation S-K as of September 30, 2017.March 31, 2021.
Contractual Obligations and Commitments
ThereAs discussed above, in March 2021, we repaid $220 million of borrowings outstanding under our Credit Facility. Other than this repayment, there were no material changes to the contractual obligations table as disclosed in our Annual Report on Form 10-K for the year ended December 31, 2016.2020.
Critical Accounting Policies and Estimates
The preparation of financial statements in accordance with U.S. GAAP requires us to make estimates and assumptions affecting the reported amounts of assets and liabilities at the date of the financial statements and the reported amounts of net revenues and expenses in the reporting period. We base our estimates and assumptions on current facts, historical experience and various other factors that we believe to be reasonable under the circumstances, the results of which form the basis for making judgments about the carrying values of assets and liabilities and the accrual of costs and expenses that are not readily apparent from other sources. We continually review the estimates and underlying assumptions to ensure they are appropriate for the circumstances. Accounting assumptions and estimates are inherently uncertain and actual results may differ materially from our estimates.
A summary of our critical accounting estimates is included in Management’s Discussion and Analysis of Financial Condition and Results of Operations contained in our Annual Report on Form 10-K for the year ended December 31, 2016.2020. During the ninethree months ended September 30, 2017,March 31, 2021, there were no significant changes in our estimates and critical accounting policies.policies or in our critical accounting estimates.
See Note 3, “Accounting Policies,” in the Notes to Consolidated Financial Statements for a discussion of recently adopted accounting standards and newly issued accounting standards.
Item 3. Quantitative and Qualitative Disclosures about Market Risk.
There were no material changesThe following change from the information contained in the Company’s Annual Report on Form 10-K for the year ended December 31, 2016.2020 took place during the three months ended March 31, 2021:
Interest Rate Risk
We are only exposed to interest rate risk on borrowings we make under our Credit Facility, borrowings from which are subject to variable interest rates. As of March 2021, we have no borrowings outstanding under the Credit Facility and currently are not exposed to interest rate risk.
Item 4. Controls and Procedures.
Disclosure Controls and Procedures.
The Company’s management, with the participation of the Company’s Chief Executive Officer and Chief Financial Officer, has evaluated the effectiveness of the Company’s disclosure controls and procedures (as such term is defined in Rules 13a-15(e) and 15d-15(e) under the Securities Exchange Act of 1934, as amended (the “Exchange Act”)) as of the end of the period covered by this report. Based on such evaluation, the Company’s Chief Executive Officer and Chief Financial Officer have concluded that, as of the end of such period, the Company’s disclosure controls and procedures are effective at the reasonable assurance level.
Changes in Internal Control Over Financial Reporting.
There have been no changes in the Company’s internal control over financial reporting (as such term is defined in Rules 13a-15(f) and 15d-15(f) under the Exchange Act) during the fiscal quarter to which this report relates that have materially affected, or are reasonably likely to materially affect, the Company’s internal control over financial reporting.
Part II. OTHER INFORMATION
Item 1. Legal Proceedings.
We are subject to various lawsuits, administrative proceedings, audits and claims arising in the ordinary course of business. Some of these lawsuits purport to be class actions and/or seek substantial damages. We are required to record an accrual for litigation loss contingencies that are both probable and reasonably estimable. Legal fees and expenses associated with the defense of all of our litigation are expensed as such fees and expenses are incurred. Management regularly assesses our insurance deductibles, analyzes litigation information with our attorneys and evaluates our loss experience in connection with pending legal proceedings. While we do not presently believe that any of the legal proceedings to which we are currently a party will ultimately have a material adverse impact on us, there can be no assurance that we will prevail in all the proceedings we are party to, or that we will not incur material losses from them.
Item 1A. Risk Factors.
There are no material changes from the risk factors set forth under Item 1A of Part I of the Company’s Annual Report on
Form 10-K for the fiscal year ended December 31, 2016.2020.
Item 2. Unregistered Sales of Equity Securities and Use of Proceeds.
| | | | | | | | | | | | | | | | | | | | | | | | | | |
| Purchases of Equity Securities by the Company |
| Period | | Total number of
shares
purchased | | Average price
paid per
share | | Total number of
shares purchased as
part of publicly
announced plans or
programs (b) | | Approximate dollar value of
shares that may yet be
purchased under the
plans or programs (b) |
January 4, 2021 - January 31, 2021(a) | | 902 | | | $ | 70.48 | | | — | | | $ | 70,200,000 | |
February 1, 2021 - February 28, 2021(a) | | 11,733 | | | 80.74 | | | — | | | $ | 70,200,000 | |
March 1, 2021 - April 4, 2021(a) | | 2,366 | | | 88.55 | | | — | | | $ | 70,200,000 | |
| | 15,001 | | | $ | 81.35 | | | — | | | $ | 70,200,000 | |
|
| | | | | | | | | | | | |
| Purchases of Equity Securities by the Company |
| Period | | Total number of shares purchased | | Average price paid per share | | Total number of shares purchased as part of publicly announced plans or programs (b) | | Approximate dollar value of shares that may yet be purchased under the plans or programs (b) |
| July 3, 2017 – July 30, 2017 | | — |
| | — | | — |
| | $ | 67,100,000 |
|
| July 31, 2017 – August 27, 2017 | | — |
| | — | | — |
| | $ | 67,100,000 |
|
August 28, 2017 – October 1, 2017(a) | | 598 |
| | $40.84 | | — |
| | $ | 67,100,000 |
|
| Total | | 598 |
| | $40.84 | | — |
| | $ | 67,100,000 |
|
(a) These amounts represent shares owned and tendered by employees to satisfy tax withholding obligations arising upon vesting of restricted stock awards. Shares so surrendered by the participants are repurchased by us pursuant to the terms of the plan and the applicable individual award agreements under which the shares were issued and not pursuant to publicly announced repurchase authorizations.
(b) In October 2015, ourFebruary 2019, the Company’s Board of Directors approved a stock repurchase programthe 2019 Repurchase Program authorizing usthe Company to repurchase up to $150$200 million of DineEquitythe Company's common stock on an opportunistic basis from time to time in open market transactions and in privately negotiated transactions, including Rule 10b-5 stock repurchase plans, based on business, market, applicable legal requirements and other considerations.stock. The program2019 Repurchase Program, as approved by the Board of Directors, does not require the repurchase of a specific number of shares and can be terminated at any time.
Item 3. Defaults Upon Senior Securities.
None.
Item 4. Mine Safety Disclosures.
Not Applicable.
Item 5. Other Information.
None.
Item 6. Exhibits.
|
| | | | | | | |
3.1*†10.1 |
| | |
3.2 |
| | |
*†#10.1 |
| | |
*†#10.210.2 |
| | |
*†#10.331.1 |
| |
|
*†10.4 |
| |
|
*12.1 |
| | |
*31.1 |
| | |
| *31.2 |
| | |
| *32.1 |
| | |
| *32.2 |
| | |
| 101.INS |
| | XBRL Instance Document.***Document - the instance document does not appear in the Interactive Data File because its XBRL tags are embedded within the Inline XBRL document. |
| 101.SCH |
| | Inline XBRL Schema Document.*** |
| 101.CAL |
| | Inline XBRL Calculation Linkbase Document.*** |
| 101.DEF |
| | Inline XBRL Definition Linkbase Document.*** |
| 101.LAB |
| | Inline XBRL Label Linkbase Document.*** |
| 101.PRE |
| | Inline XBRL Presentation Linkbase Document.*** |
| 104 | | | Cover page Interactive Data File (formatted as Inline XBRL and contained in Exhibit 101) |
* Filed herewith.
| |
** | The certifications attached as Exhibits 32.1 and 32.2 accompany this Quarterly Report pursuant to Section 906 of the Sarbanes-Oxley Act of 2002 and shall not, except to the extent required by the Sarbanes-Oxley Act of 2002, be deemed filed by the Company for purposes of Section 18 of the Securities Exchange Act of 1934, as amended. |
| |
***** The certifications attached as Exhibits 32.1 and 32.2 accompany this Quarterly Report pursuant to Section 906 of the Sarbanes-Oxley Act of 2002 and shall not, except to the extent required by the Sarbanes-Oxley Act of 2002, be deemed filed by the Company for purposes of Section 18 of the Securities Exchange Act of 1934, as amended. ***Pursuant to Rule 406T of Regulation S-T, the interactive data files on Exhibit 101 and 104 hereto are deemed not filed or part of a registration statement or prospectus for purposes of Section 11 or 12 of the Securities Act of 1933, as amended, are deemed not filed for purposes of Section 18 of the Securities and Exchange Act of 1934, as amended, and otherwise are not subject to liability under those sections. † A contract, compensatory plan or arrangement in which directors or executive officers are eligible to participate.
| Pursuant to Rule 406T of Regulation S-T, the interactive data files on Exhibit 101 hereto are deemed not filed or part of a registration statement or prospectus for purposes of Section 11 or 12 of the Securities Act of 1933, as amended, are deemed not filed for purposes of Section 18 of the Securities and Exchange Act of 1934, as amended, and otherwise are not subject to liability under those sections. |
| |
† | A contract, compensatory plan or arrangement in which directors or executive officers are eligible to participate. |
| |
# | Portions of this exhibit have been omitted pending a determination by the Securities and Exchange Commission as to whether these portions should be granted confidential treatment. |
SIGNATURES
Pursuant to the requirements of the Securities Exchange Act of 1934, the registrant has duly caused this report to be signed on its behalf by the undersigned thereunto duly authorized.
|
| | | | | | | | | | |
| | DineEquity,Dine Brands Global, Inc.
(Registrant)
| |
| | | |
| | | |
| Dated: | November 9, 20175th day of May, 2021 | By: | /s/ Stephen P. JoyceJohn W. Peyton |
| | | Stephen P. JoyceJohn W. Peyton
Chief Executive Officer (Principal Executive Officer) |
| | | |
Dated: | November 9, 2017 | By: | /s/ Greggory H. Kalvin |
| Dated: | 5th day of May, 2021 | By: | /s/ Allison Hall |
| | | Greggory H. KalvinAllison Hall
Interim Chief Financial Officer Senior Vice President, Corporate Controller
(Principal Financial Officer and Principal Accounting Officer) |