UNITED STATES
SECURITIES AND EXCHANGE COMMISSION
Washington, D.C. 20549
FORM 10‑Q
(Mark One)
|
| |
| þ | QUARTERLY REPORT PURSUANT TO SECTION 13 OR 15(d) OF THE SECURITIES EXCHANGE ACT OF 1934 |
For the quarterly period ended March 31,June 30, 2017
or
|
| |
| o | TRANSITION REPORT PURSUANT TO SECTION 13 OR 15(d) OF THE SECURITIES EXCHANGE ACT OF 1934 |
For the transition period from_____________________to__________
Commission File Number 1‑3473
TESORO CORPORATIONANDEAVOR
(Exact name of registrant as specified in its charter)
|
| | |
| Delaware | | 95‑0862768 |
| (State or other jurisdiction of | (I.R.S. Employer |
| incorporation or organization) | Identification No.) |
| | |
| | |
| 19100 Ridgewood Pkwy, San Antonio, Texas 78259-1828 |
| (Address of principal executive offices) (Zip Code) |
| 210-626-6000 |
| (Registrant’s telephone number, including area code) |
Indicate by check mark whether the registrant (1) has filed all reports required to be filed by Section 13 or 15(d) of the Securities Exchange Act of 1934 during the preceding 12 months (or for such shorter period that the registrant was required to file such reports), and (2) has been subject to such filing requirements for the past 90 days. YesþNoo
Indicate by check mark whether the registrant has submitted electronically and posted on its corporate Website, if any, every Interactive Data File required to be submitted and posted pursuant to Rule 405 of Regulation S-T (§232.405 of this chapter) during the preceding 12 months (or for such shorter period that the registrant was required to submit and post such files). YesþNoo
Indicate by check mark whether the registrant is a large accelerated filer, an accelerated filer, a non-accelerated filer, or a smaller reporting company. See definitions of “large accelerated filer,” “accelerated filer,” “smaller reporting company” and “emerging growth companycompany” in Rule 12b-2 of the Exchange Act.
|
| | | | | | |
| | Large accelerated filer | þ | | Accelerated filer | o | |
| | Non-accelerated filer | o(Do (Do not check if a smaller reporting company) | | Smaller reporting company | o | |
| | | | | Emerging growth company | o | |
If an emerging growth company, indicate by check mark if the registrant has elected not to use the extended transition period for complying with any new or revised financial accounting standards provided pursuant to Section 13(a) of the Exchange Act. o
Indicate by check mark whether the registrant is a shell company (as defined in Rule 12b-2 of the Exchange Act). YesoNoþ
There were 117,520,990156,901,569 shares of the registrant’s Common Stock outstanding at MayAugust 4, 2017.
TESORO CORPORATIONANDEAVOR
QUARTERLY REPORT ON FORM 10-Q
FOR THE QUARTERLY PERIOD ENDED MARCH 31,JUNE 30, 2017
This Quarterly Report on Form 10-Q (including documents incorporated by reference herein) contains statements with respect to our expectations or beliefs as to future events. These types of statements are “forward-looking” and subject to uncertainties. See “Important Information Regarding Forward-Looking Statements” in Management’s Discussion and Analysis of Financial Condition and Results of Operations in Part I, Item 2.
PART I - FINANCIAL INFORMATION
ITEM 1. FINANCIAL STATEMENTS
TESORO CORPORATION
ANDEAVOR
CONDENSED STATEMENTS OF CONSOLIDATED OPERATIONS
(Unaudited)
| | | | Three Months Ended March 31, | Three Months Ended June 30, | | Six Months Ended June 30, |
| | 2017 | | 2016 | 2017 | | 2016 | | 2017 | | 2016 |
| | (In millions, except per share amounts) | (In millions, except per share amounts) |
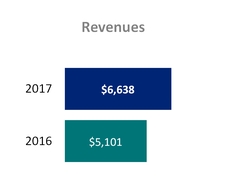
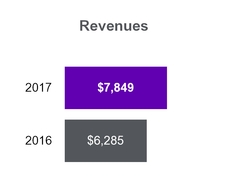
| Revenues (a) | $ | 6,638 |
| | $ | 5,101 |
| $ | 7,849 |
| | $ | 6,285 |
| | $ | 14,487 |
| | $ | 11,386 |
|
| Costs and Expenses | | | | | | | | | | |
| Cost of sales (excluding the lower of cost or market inventory valuation adjustment) (a) | 5,426 |
| | 3,866 |
| 6,217 |
| | 5,023 |
| | 11,643 |
| | 8,889 |
|
| Lower of cost or market inventory valuation adjustment | — |
| | 147 |
| 209 |
| | (363 | ) | | 209 |
| | (216 | ) |
| Operating expenses | 654 |
| | 611 |
| 739 |
| | 602 |
| | 1,393 |
| | 1,213 |
|
| General and administrative expenses | 136 |
| | 82 |
| 248 |
| | 94 |
| | 384 |
| | 176 |
|
| Depreciation and amortization expenses | 226 |
| | 212 |
| 240 |
| | 210 |
| | 466 |
| | 422 |
|
| Loss on asset disposals and impairments | 1 |
| | 4 |
| |
| (Gain) loss on asset disposals and impairments | | (22 | ) | | 1 |
| | (21 | ) | | 5 |
|
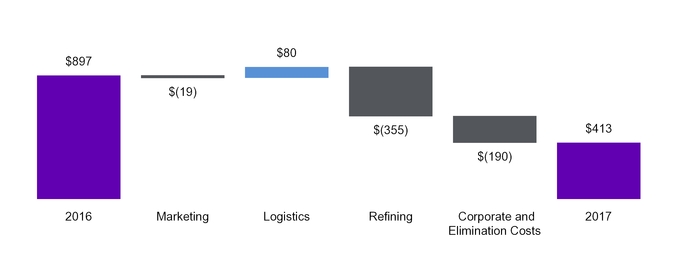
| Operating Income | 195 |
| | 179 |
| 218 |
| | 718 |
| | 413 |
| | 897 |
|
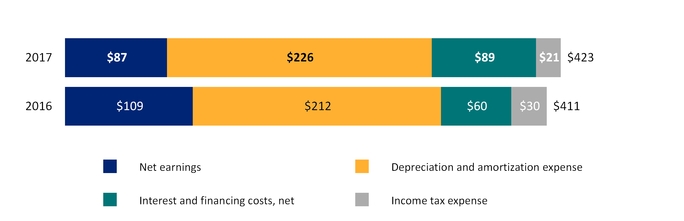
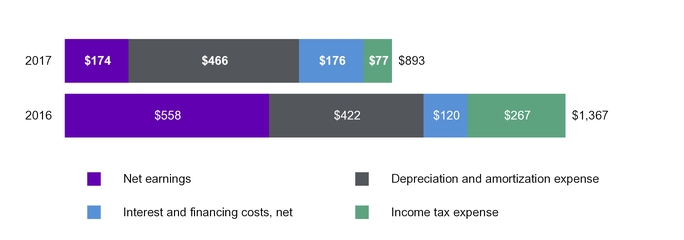
| Interest and financing costs, net | (89 | ) | | (60 | ) | (87 | ) | | (60 | ) | | (176 | ) | | (120 | ) |
| Equity in earnings of equity method investments | | 3 |
| | 3 |
| | 3 |
| | 5 |
|
| Other income, net | 2 |
| | 9 |
| 9 |
| | 25 |
| | 11 |
| | 32 |
|
| Earnings Before Income Taxes | 108 |
| | 128 |
| 143 |
| | 686 |
| | 251 |
| | 814 |
|
| Income tax expense | 21 |
| | 30 |
| 56 |
| | 237 |
| | 77 |
| | 267 |
|
| Net Earnings from Continuing Operations | 87 |
| | 98 |
| 87 |
| | 449 |
| | 174 |
| | 547 |
|
| Earnings from discontinued operations, net of tax | — |
| | 11 |
| — |
| | — |
| | — |
| | 11 |
|
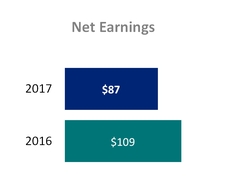
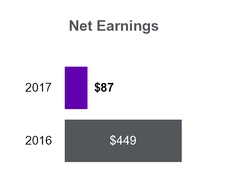
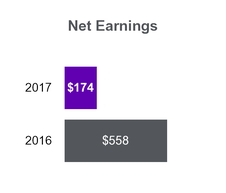
| Net Earnings | 87 |
| | 109 |
| 87 |
| | 449 |
| | 174 |
| | 558 |
|
| Less: Net earnings from continuing operations attributable to noncontrolling interest | 37 |
| | 40 |
| 47 |
| | 31 |
| | 84 |
| | 71 |
|
| Net Earnings Attributable to Tesoro Corporation | $ | 50 |
| | $ | 69 |
| |
| Net Earnings Attributable to Andeavor | | $ | 40 |
| | $ | 418 |
| | $ | 90 |
| | $ | 487 |
|
| | | | | | | | | | | |
| Net Earnings Attributable to Tesoro Corporation | | | | |
| Net Earnings Attributable to Andeavor | | | | | | | | |
| Continuing operations | $ | 50 |
| | $ | 58 |
| $ | 40 |
| | $ | 418 |
| | $ | 90 |
| | $ | 476 |
|
| Discontinued operations | — |
| | 11 |
| — |
| | — |
| | — |
| | 11 |
|
| Total | $ | 50 |
| | $ | 69 |
| $ | 40 |
| | $ | 418 |
| | $ | 90 |
| | $ | 487 |
|
| Net Earnings per Share - Basic | | | | | | | | | | |
| Continuing operations | $ | 0.43 |
| | $ | 0.49 |
| $ | 0.31 |
| | $ | 3.50 |
| | $ | 0.73 |
| | $ | 3.98 |
|
| Discontinued operations | — |
| | 0.09 |
| — |
| | — |
| | — |
| | 0.09 |
|
| Total | $ | 0.43 |
| | $ | 0.58 |
| $ | 0.31 |
| | $ | 3.50 |
| | $ | 0.73 |
| | $ | 4.07 |
|
| Weighted average common shares outstanding - Basic | 117.1 |
| | 119.6 |
| 130.8 |
| | 119.5 |
| | 124.0 |
| | 119.5 |
|
| Net Earnings per Share - Diluted | | | | | | | | | | |
| Continuing operations | $ | 0.42 |
| | $ | 0.48 |
| $ | 0.31 |
| | $ | 3.47 |
| | $ | 0.72 |
| | $ | 3.94 |
|
| Discontinued operations | — |
| | 0.09 |
| — |
| | — |
| | — |
| | 0.09 |
|
| Total | $ | 0.42 |
| | $ | 0.57 |
| $ | 0.31 |
| | $ | 3.47 |
| | $ | 0.72 |
| | $ | 4.03 |
|
| Weighted average common shares outstanding - Diluted | 118.1 |
| | 121.2 |
| 131.7 |
| | 120.6 |
| | 125.0 |
| | 120.8 |
|
| | | | | | | | | | | |
| Dividends per Share | $ | 0.55 |
| | $ | 0.50 |
| $ | 0.55 |
| | $ | 0.50 |
| | $ | 1.10 |
| | $ | 1.00 |
|
| | | | | |
| Supplemental Information | | | | | | | | | | |
(a) Includes excise taxes collected by our Marketing segment | $ | 134 |
| | $ | 142 |
| $ | 153 |
| | $ | 148 |
| | $ | 287 |
| | $ | 290 |
|
The accompanying notes are an integral part of these condensed consolidated financial statements.
|
| | |
| | | March 31,June 30, 2017 | 3
|
TESORO CORPORATIONANDEAVOR
CONDENSED CONSOLIDATED BALANCE SHEETS
(Unaudited)
| | | | March 31,
2017 | | December 31,
2016 | June 30,
2017 | | December 31,
2016 |
| | (In millions, except share data) | (In millions, except share data) |
| ASSETS | | | | | | |
| Current Assets | | | | | | |
Cash and cash equivalents (TLLP: $35 and $688, respectively) | $ | 2,298 |
| | $ | 3,295 |
| |
Cash and cash equivalents (Logistics: $31 and $688, respectively) | | $ | 1,061 |
| | $ | 3,295 |
|
| Receivables, net of allowance for doubtful accounts | 1,007 |
| | 1,108 |
| 1,391 |
| | 1,108 |
|
| Inventories | 2,624 |
| | 2,640 |
| |
| Inventories, net | | 3,075 |
| | 2,640 |
|
| Prepayments and other current assets | 332 |
| | 371 |
| 508 |
| | 371 |
|
| Total Current Assets | 6,261 |
| | 7,414 |
| 6,035 |
| | 7,414 |
|
Property, Plant and Equipment, Net (TLLP: $3,986 and $3,444, respectively) | 10,603 |
| | 9,976 |
| |
Acquired Intangibles, Net (TLLP: $1,090 and $947, respectively) | 1,413 |
| | 1,277 |
| |
Other Noncurrent Assets, Net (TLLP: $504 and $531, respectively) | 1,792 |
| | 1,731 |
| |
Property, Plant and Equipment, Net (Logistics: $4,420 and $3,444, respectively) | | 14,143 |
| | 9,976 |
|
Goodwill (Logistics: $127 and $117, respectively) | | 3,202 |
| | 190 |
|
Acquired Intangibles, Net (Logistics: $1,054 and $947, respectively) | | 1,621 |
| | 1,277 |
|
Other Noncurrent Assets, Net (Logistics: $402 and $414, respectively) | | 2,028 |
| | 1,541 |
|
| Total Assets | $ | 20,069 |
| | $ | 20,398 |
| $ | 27,029 |
| | $ | 20,398 |
|
| | | | | | | |
| LIABILITIES AND EQUITY | | | | | | |
| Current Liabilities | | | | | | |
| Accounts payable | $ | 1,644 |
| | $ | 2,032 |
| $ | 2,445 |
| | $ | 2,032 |
|
| Current maturities of debt | 465 |
| | 465 |
| 478 |
| | 465 |
|
| Other current liabilities | 944 |
| | 1,057 |
| 1,230 |
| | 1,057 |
|
| Total Current Liabilities | 3,053 |
| | 3,554 |
| 4,153 |
| | 3,554 |
|
| Deferred Income Taxes | 1,493 |
| | 1,428 |
| 2,088 |
| | 1,428 |
|
Debt, Net of Unamortized Issuance Costs (TLLP: $3,765 and $4,053, respectively) | 6,178 |
| | 6,468 |
| |
Debt, Net of Unamortized Issuance Costs (Logistics: $4,092 and $4,053, respectively) | | 7,164 |
| | 6,468 |
|
| Other Noncurrent Liabilities | 1,011 |
| | 821 |
| 1,201 |
| | 821 |
|
| Total Liabilities | 11,735 |
| | 12,271 |
| 14,606 |
| | 12,271 |
|
| Commitments and Contingencies (Note 8) | | | | |
| Commitments and Contingencies (Note 9) | | | | |
| Equity | | | | | | |
| Tesoro Corporation Stockholders’ Equity | | | | |
Common stock, par value $0.162/3; authorized 300,000,000 shares (200,000,000 in 2016); 160,222,281 shares issued (159,474,572 in 2016) | 27 |
| | 27 |
| |
| Andeavor Stockholders’ Equity | | | | |
Common stock, par value $0.162/3; authorized 300,000,000 shares (200,000,000 in 2016); 200,004,789 shares issued (159,474,572 in 2016) | | 33 |
| | 27 |
|
| Additional paid-in capital | 1,531 |
| | 1,473 |
| 4,929 |
| | 1,473 |
|
| Retained earnings | 6,422 |
| | 6,437 |
| 6,397 |
| | 6,437 |
|
Treasury stock, 42,825,622 common shares (42,574,625 in 2016), at cost | (2,306 | ) | | (2,284 | ) | |
Treasury stock, 41,446,523 common shares (42,574,625 in 2016), at cost | | (2,293 | ) | | (2,284 | ) |
| Accumulated other comprehensive loss, net of tax | (188 | ) | | (188 | ) | (188 | ) | | (188 | ) |
| Total Tesoro Corporation Stockholders’ Equity | 5,486 |
| | 5,465 |
| |
| Total Andeavor Stockholders’ Equity | | 8,878 |
| | 5,465 |
|
| Noncontrolling Interest | 2,848 |
| | 2,662 |
| 3,545 |
| | 2,662 |
|
| Total Equity | 8,334 |
| | 8,127 |
| 12,423 |
| | 8,127 |
|
| Total Liabilities and Equity | $ | 20,069 |
| | $ | 20,398 |
| $ | 27,029 |
| | $ | 20,398 |
|
The accompanying notes are an integral part of these condensed consolidated financial statements.
TESORO CORPORATIONANDEAVOR
CONDENSED STATEMENTS OF CONSOLIDATED CASH FLOWS
(Unaudited)
| | | | Three Months Ended March 31, | Six Months Ended June 30, |
| | 2017 | | 2016 | 2017 | | 2016 |
| | (In millions) | (In millions) |
| Cash Flows From (Used In) Operating Activities | | | | | | |
| Net earnings | $ | 87 |
| | $ | 109 |
| $ | 174 |
| | $ | 558 |
|
| Adjustments to reconcile net earnings to net cash from operating activities: | | | | | | |
| Depreciation and amortization expenses | 226 |
| | 212 |
| 466 |
| | 422 |
|
| Lower of cost or market inventory valuation adjustment | — |
| | 147 |
| 209 |
| | (216 | ) |
| Stock-based compensation expense (benefit) | 14 |
| | (3 | ) | |
| Amortization of debt issuance costs and discounts | | 10 |
| | 8 |
|
| Gain on asset disposals and improvements | | (21 | ) | | (12 | ) |
| Stock-based compensation expense | | 34 |
| | 8 |
|
| Deferred income taxes | 38 |
| | — |
| 50 |
| | 91 |
|
| Turnaround and branding charges | (117 | ) | | (133 | ) | (311 | ) | | (226 | ) |
| Equity in earnings of equity method investments, net of distributions | | 13 |
| | 10 |
|
| Other operating activity | 10 |
| | (3 | ) | (6 | ) | | (3 | ) |
| Changes in current assets and current liabilities | (315 | ) | | (22 | ) | (4 | ) | | 22 |
|
| Changes in noncurrent assets and noncurrent liabilities | 157 |
| | (123 | ) | 156 |
| | (34 | ) |
| Net cash from operating activities | 100 |
| | 184 |
| 770 |
| | 628 |
|
| Cash Flows From (Used In) Investing Activities | | | | | | |
| Capital expenditures | (258 | ) | | (217 | ) | (539 | ) | | (426 | ) |
| Acquisitions, net of cash | (672 | ) | | (314 | ) | (938 | ) | | (394 | ) |
| Proceeds from asset sales | | 44 |
| | 18 |
|
| Other investing activities | 1 |
| | (4 | ) | (15 | ) | | (4 | ) |
| Net cash used in investing activities | (929 | ) | | (535 | ) | (1,448 | ) | | (806 | ) |
| Cash Flows From (Used In) Financing Activities | | | | | | |
| Borrowings under revolving credit agreements | 44 |
| | 297 |
| 764 |
| | 600 |
|
| Repayments on revolving credit agreements | (334 | ) | | (67 | ) | (514 | ) | | (666 | ) |
| Proceeds from debt offering | | — |
| | 701 |
|
| Repayments of debt | (3 | ) | | (252 | ) | (1,636 | ) | | (253 | ) |
| Dividend payments | (65 | ) | | (60 | ) | (130 | ) | | (121 | ) |
| Net proceeds from issuance of Tesoro Logistics LP common units | 281 |
| | 5 |
| |
| Distributions by Tesoro Logistics LP to noncontrolling interest | (63 | ) | | (48 | ) | |
| Net proceeds from issuance of Andeavor Logistics LP common units | | 281 |
| | 334 |
|
| Distributions by Andeavor Logistics LP to noncontrolling interest | | (133 | ) | | (98 | ) |
| Purchases of common stock | | (148 | ) | | (100 | ) |
| Taxes paid related to net share settlement of equity awards | (22 | ) | | (20 | ) | (31 | ) | | (24 | ) |
| Other financing activities | (6 | ) | | (7 | ) | (9 | ) | | (16 | ) |
| Net cash used in financing activities | (168 | ) | | (152 | ) | |
| Decrease in Cash and Cash Equivalents | (997 | ) | | (503 | ) | |
| Net cash from (used in) financing activities | | (1,556 | ) | | 357 |
|
| Increase (Decrease) in Cash and Cash Equivalents | | (2,234 | ) | | 179 |
|
| Cash and Cash Equivalents, Beginning of Period | 3,295 |
| | 942 |
| 3,295 |
| | 942 |
|
| Cash and Cash Equivalents, End of Period | $ | 2,298 |
| | $ | 439 |
| $ | 1,061 |
| | $ | 1,121 |
|
The accompanying notes are an integral part of these condensed consolidated financial statements.
|
| | |
| | | March 31,June 30, 2017 | 5
|
|
| | |
| NOTES TO CONDENSED CONSOLIDATED FINANCIAL STATEMENTS (UNAUDITED) | | |
NOTE 1 – BASIS OF PRESENTATION
ORGANIZATION
Effective August 1, 2017, Tesoro Corporation changed its name to Andeavor. As used in this report, the terms “Tesoro,“Andeavor,” the “Company,” “we,” “us” or “our” may refer to Tesoro Corporation,Andeavor, one or more of its consolidated subsidiaries or all of them taken as a whole. The words “we,” “us” or “our” generally include TesoroAndeavor Logistics LP (“TLLP”Andeavor Logistics”) (formerly Tesoro Logistics LP) and Western Refining Logistics, LP (“WNRL”), a publicly tradedpublicly-traded limited partnership,partnerships, and itstheir subsidiaries as consolidated subsidiaries of Tesoro CorporationAndeavor with certain exceptions where there are transactions or obligations between TLLPAndeavor Logistics, WNRL and Tesoro CorporationAndeavor or its other subsidiaries. When used in descriptions
WESTERN REFINING.On June 1, 2017, pursuant to the Agreement and Plan of agreementsMerger, dated as of November 16, 2016 (the “Merger Agreement”), by and transactions, “TLLP”among Western Refining, Inc. (“Western Refining”), the Company, our wholly-owned subsidiaries Tahoe Merger Sub 1, Inc. and Tahoe Merger Sub 2, LLC, Tahoe Merger Sub 1 was merged with and into Western Refining, with Western Refining surviving such merger as a wholly-owned subsidiary of the Company (the “Merger” or the “Partnership” refers“Western Refining Acquisition”). As a result of the Merger, we obtained Western Refining’s 53% ownership interest in WNRL. Thus, these condensed consolidated financial statements reflect the operations, financial position and cash flows associated with Western Refining, WNRL and their related subsidiaries with all intercompany transactions eliminated upon consolidation.
WNRL is a publicly-traded master limited partnership that owns and operates logistic assets consisting of pipeline and gathering, terminalling, storage and transportation assets and provides services to TLLPour Refining segment. The majority of WNRL's logistics assets are integral to the operations of our El Paso, Gallup and its consolidated subsidiaries.St. Paul Park refineries. It also owns a wholesale business that operates primarily in the Southwest United States and includes the operations of several bulk petroleum distribution plants and a fleet of crude oil, asphalt and refined product delivery trucks. It distributes commercial wholesale petroleum products primarily in Arizona, Colorado, Nevada, New Mexico and Texas.
PRINCIPLES OF CONSOLIDATION AND BASIS OF PRESENTATION
PRINCIPLES OF CONSOLIDATION. These interim condensed consolidated financial statements and notes hereto of Tesoro CorporationAndeavor and its subsidiaries have been prepared by management without audit according to the rules and regulations of the Securities and Exchange Commission (“SEC”) and reflect all adjustments that, in the opinion of management, are necessary for a fair presentation of results for the periods presented. Such adjustments are of a normal recurring nature, unless otherwise disclosed. The consolidated balance sheet at December 31, 2016 has been condensed from the audited consolidated financial statements at that date. We prepare our condensed consolidated financial statements in conformity with accounting principles generally accepted in the United States of America (“U.S. GAAP”). However, certain information and notes normally included in financial statements prepared in accordance with U.S. GAAP have been condensed or omitted pursuant to the SEC’s rules and regulations. Management believes that the disclosures presented herein are adequate to present the information fairly. The accompanying condensed consolidated financial statements and notes should be read in conjunction with ourthe Andeavor and Western Refining Annual ReportReports on Form 10-K for the year ended December 31, 2016.
BASIS OF PRESENTATION. We are required under U.S. GAAP to make estimates and assumptions that affect the reported amounts and disclosures of assets and liabilities at the date of the financial statements and the reported amounts of revenues and expenses during the periods presented. We review our estimates on an ongoing basis. Changes in facts and circumstances may result in revised estimates and actual results could differ from those estimates. The results of operations for any interim period are not necessarily indicative of results for the full year. Certain prior year balances have been aggregated or disaggregated in order to conform to the current year presentation.
ForThe consolidated statements of comprehensive income for the threesix months ended March 31,June 30, 2017 have been omitted, as there was no change to accumulated other comprehensive income. Due to there being no material impactchange to accumulated other comprehensive income for the threesix months ended March 31,June 30, 2017. For the six months ended June 30, 2016, accumulated other comprehensive income decreased $10 million, net of tax, due to the recognition of a settlement loss for one of our executive retirement plans and remeasurement of the pension liability.
CONDENSED CONSOLIDATING FINANCIAL INFORMATION.Andeavor’s senior notes and its revolving credit facility (the “Revolving Credit Facility”) were fully and unconditionally and jointly and severally guaranteed by certain of our subsidiaries. Andeavor Logistics, in which we had a 33%ownership interest as of June 30, 2017, and 2016,other subsidiaries did not guarantee these obligations. Pursuant to the consolidated statementsterms of comprehensive income have been omitted.the Revolving Credit Facility and the indentures governing the Andeavor senior notes, any guarantees on our obligations were subject to release if the Company satisfactorily achieved an investment grade rating from either Moody’s Investors Service or S&P Global Ratings, as the Company already had achieved such rating from Fitch Ratings, Inc. On June 5, 2017, S&P Global Ratings raised its corporate credit and senior unsecured debt rating on the Company to BBB- from BB+, with a stable outlook. As a result, the guarantees of the Andeavor senior notes and Revolving Credit Facility were released upon the discharge of the terms of the Andeavor senior notes and Revolving Credit Facility agreements. The Company is now exempt from disclosing condensed consolidating financial information in accordance with Rule 3-10 of Regulation S-X, as enacted under the Securities Act of 1933.
|
| | |
| NOTES TO CONDENSED CONSOLIDATED FINANCIAL STATEMENTS (UNAUDITED) | |
TLLP.VARIABLE INTEREST ENTITIES. Our condensed consolidated financial statements include TLLP, atwo variable interest entity. TLLPentities, Andeavor Logistics and WNRL, which together comprise our Logistics segment. For variable interest entity reporting purposes, we aggregate these entities based on the similarity of their operations. For parenthetical purposes on the consolidated statement of financial position, balances do not include Andeavor’s basis in WNRL. Andeavor Logistics is a publicly traded limited partnership that waswe formed to own, operate, develop and acquire logistics assets. Its assets are integral to the success of Tesoro’sour refining and marketing operations and are used to gather crude oil and natural gas, process natural gas, and distribute, transport and store crude oil and refined products. TLLPAndeavor Logistics provides us and third parties with various terminal distribution, storage, pipeline transportation, natural gas liquids processing, trucking and petroleum-coke handling services under long-term, fee-based commercial agreements, many of which contain minimum volume commitments. We do not provide financial or equity support through any liquidity arrangements or financial guarantees to TLLP.Andeavor Logistics.
Tesoro Logistics GP, LLC (“TLGP”), our wholly-owned subsidiary, serves as the general partner of TLLP.Andeavor Logistics. We held an approximate 33% and 34% interest in TLLPAndeavor Logistics at March 31,June 30, 2017 and December 31, 2016, respectively, including the general partner interest (approximately 2% at both March 31,June 30, 2017 and December 31, 2016) and all of the incentive distribution rights. As the general partner of TLLP,Andeavor Logistics, we have the sole ability to direct the activities of TLLPAndeavor Logistics that most significantly impact its economic performance.performance, and therefore we consolidate Andeavor Logistics. We are also considered to be the primary beneficiary for accounting purposes and are TLLP’sAndeavor Logistics’ largest customer. In the event TLLPAndeavor Logistics incurs a loss, our operating results will reflect TLLP’sAndeavor Logistics’ loss, net of intercompany eliminations. Under our various long-term, fee-based commercial agreements with TLLP,Andeavor Logistics, transactions with us accounted for 48%49% of Andeavor Logistics’ total revenues for both the three and 56%six months ended June 30, 2017, respectively, and 57% of TLLP’sAndeavor Logistics’ total revenues for both the three and six months ended June 30, 2016.
As of June 30, 2017, we owned a 53% interest in WNRL. Western Refining Logistics GP, LLC (“WGP”), our wholly-owned subsidiary, serves as the general partner of WNRL and has the sole ability to direct the activities that most significantly impact WNRL's economic performance, and therefore we consolidate WNRL. All intercompany transactions with WNRL are eliminated upon consolidation. We are WNRL’s primary logistics customer and a significant wholesale customer through our Marketing segment. WNRL generates revenues by charging tariffs and fees for transporting petroleum products and crude oil though its pipelines by charging fees for terminalling refined products and other hydrocarbons, and storing and providing other services at its storage tanks and terminals. Additionally, WNRL sells various finished petroleum products to us and other third-party customers. We accounted for 36% of WNRL’s total revenues for the three months ended March 31,period of June 1, 2017 through June 30, 2017 under our long-term agreements with WNRL. These agreements contain minimum volume commitments. Each agreement has fees that are indexed for inflation and 2016, respectively.provides us with options to renew for two additional five-year terms. In addition to commercial agreements, we are also party to an omnibus agreement with WNRL that among other things provides for reimbursement to us for various general and administrative services provided to WNRL. We are also party to an operational services agreement with WNRL, under which we are reimbursed for personnel services provided by us in support of WNRL's operations of its pipelines, terminals and storage facilities. We do not provide financial or equity support through any liquidity arrangements and/or debt guarantees to WNRL.
DISCONTINUED OPERATIONS. On September 25, 2013, we completed the sale of all of our interest in Tesoro Hawaii, LLC, which operated a 94 thousand barrels per day Hawaii refinery, retail stationssites and associated logistics assets (the “Hawaii Business”). The sale of the Hawaii Business was subject to an earn-out provision based on the annual gross margin (as defined in sale agreement) in the three annual periods beginning with the year ended December 31, 2014 and ending with the year ended December 31, 2016. Additionally, we retained liability for certain regulatory improvements required at the Hawaii refinery and
|
| | |
| NOTES TO CONDENSED CONSOLIDATED FINANCIAL STATEMENTS (UNAUDITED) | |
tank replacement efforts at certain retail sites. The results of operations for this business have been presented as discontinued operations in the condensed statements of consolidated operations. There were no revenues and no earnings or loss recorded for the three and six months ended March 31,June 30, 2017 and there were no revenues for the three and six months ended March 31,June 30, 2016. However, we recorded $17 million in pre-tax earnings ($11 million after-tax) primarily related to the earn-out provision of the sale during the six months ended June 30, 2016. No gain or loss was recorded for the three months ended March 31,June 30, 2016. Cash flows used in discontinued operations were $5$6 million for the threesix months ended March 31,June 30, 2017 and $2cash flows from discontinued operations were $12 million for the threesix months ended March 31,June 30, 2016. Unless otherwise noted, the information in the notes to the condensed consolidated financial statements relates to our continuing operations.
WESTERN REFINING. On November 16, 2016, Tesoro entered into an Agreement and Plan of Merger with Western Refining, Inc. (“Western Refining”) and Tesoro’s wholly-owned subsidiaries Tahoe Merger Sub 1, Inc. and Tahoe Merger Sub 2, LLC (the “Merger”). Under the terms of the agreement, Western Refining’s shareholders can elect to receive 0.4350 shares of Tesoro for each share of Western Refining stock they own, or $37.30 in cash per share of Western Refining stock. Elections to receive cash will be subject to proration to the extent they exceed 10,843,042 shares (or approximately $404 million in the aggregate). Stock elections will not be subject to proration. On March 24, 2017, stockholders of both Tesoro and Western Refining voted to approve Tesoro’s expected acquisition of Western Refining. At separate special stockholders’ meetings, Tesoro stockholders approved, among other things, the issuance of shares of Tesoro common stock in connection with the expected acquisition and stockholders of Western Refining approved the adoption of the previously disclosed agreement and plan of merger. Completion of the Merger is subject to the satisfaction or waiver of certain customary closing conditions, including the expiration or termination of the waiting period applicable under the Hart-Scott-Rodino Antitrust Improvements Act of 1976. The aggregate proceeds of the debt financing, together with the available cash of the Company, will be sufficient for the Company to pay the aggregate cash consideration, refinance certain indebtedness of Western Refining and its subsidiaries and pay all related fees and expenses payable in connection with the Merger.
NEW ACCOUNTING STANDARDS AND DISCLOSURES
REVENUE RECOGNITION. In May 2014, the Financial Accounting Standards Board (“FASB”) issued Accounting Standards Update (“ASU”) 2014-09, “Revenue from Contracts with Customers” (“ASU 2014-09”) and has since amended the standard with ASU 2015-14, “Revenue from Contracts with Customers: Deferral of the Effective Date”, ASU 2016-08, “Revenue from Contracts with Customers: Principal versus Agent Considerations (Reporting Revenue Gross versus Net)”, ASU 2016-10, “Revenue from Contracts with Customers: Identifying Performance Obligations and Licensing”, and ASU 2016-12, “Revenue from Contracts with Customers: Narrow-Scope Improvements and Practical Expedients”. These standards replace existing revenue recognition rules with a single comprehensive model to use in accounting for revenue arising from contracts with customers. We are required to adopt ASU 2014-09 on January 1, 2018. We preliminarily expect to transition to the new standard under the modified retrospective transition method, whereby a cumulative effect adjustment iswill be recognized upon adoption, if applicable, and the guidance iswill be applied prospectively.
|
| | |
| NOTES TO CONDENSED CONSOLIDATED FINANCIAL STATEMENTS (UNAUDITED) |
We are progressing through our implementation plan and continue to evaluate the impact of the standard’s revenue recognition model on our contracts with customers in the Refining, Marketing, Logistics and TLLPRefining segments along with our business processes, accounting systems, controls and financial statement disclosures. Additionally, we have commenced our assessment of the standard’s impact on Western Refining and WNRL following the Western Refining Acquisition. While we have made substantial progress in our review and documentation of the impact of the standard on our revenue agreements, we continue to assess the impact in certain areas where industry consensus continues to be formed such as agreements with terms that include non-cash consideration tiered pricing structures and other unique considerations. At this time, we are unable to estimate the full impact of the standard until the industry reaches a consensus on certain industry specific issues, especially in relation to the TLLP segment. We do not expect the standard to have a material impact to the amount or timing of revenues recognized for substantially all of our revenue arrangements in the RefiningMarketing and MarketingRefining segments, although we do expect some impact on presentation and disclosures in our financial statements.statements relating to Logistics segment for contracts that include minimum volume commitments with claw back provisions, or where revenue is based on non-cash consideration. In addition, we will make an election to present our Marketing segment revenues net of excise taxes, consistent with our current presentation of Refining and Logistics segment revenues.
INVENTORY.In July 2015, the FASB issued ASU 2015-11, “Inventory: Simplifying the Measurement of Inventory” (“ASU 2015-11”), which simplifies the subsequent measurement of inventories by replacing the lower of cost or market test with a lower of cost and net realizable value test for inventories determined by methods other than last-in-first-out (“LIFO”) and the retail inventory method, which remain subject to existing impairment models. We adopted ASU 2015-11 is effective for the three months ended March 31,as of January 1, 2017, which resulted in changes to how we performedperform our lower of cost or market tests for inventory. These changes did not have an impact on our financial statements.
LEASES. In February 2016, the FASB issued ASU 2016-02, “Leases” (“ASU 2016-02”), which amends existing accounting standards for lease accounting and adds additional disclosures about leasing arrangements. Under the new guidance, lessees are required to recognize right-of-use assets and lease liabilities on the balance sheet for all leases with terms longer than 12 months. Leases will be classified as either a financing lease or operating lease, with classification affecting the pattern of expense recognition in the income statement and presentation of cash flows in the statement of cash flows. ASU 2016-02 is effective for
|
| | |
NOTES TO CONDENSED CONSOLIDATED FINANCIAL STATEMENTS (UNAUDITED) | | |
annual reporting periods beginning after December 15, 2018, and interim reporting periods within those annual reporting periods. Early adoption is permitted and modified retrospective application is required, however, we do not intend to early adopt the standard. While it is early in our assessment of the impacts from this standard, we expect that the recognition of right-of-use assets and lease liabilities not currently reflected in our balance sheet could have a material impact on total assets and liabilities. Additionally, we expect the presentation changes required for amounts currently reflected in our statement of operations to impact certain financial statement line items. We cannot estimate the impact on our business processes, accounting systems, controls and financial statement disclosures due to the implementation of this standard given the preliminary stage of our assessment.
CREDIT LOSSES.In June 2016, the FASB issued ASU 2016-13, “Measurement of Credit Losses on Financial Instruments” (“ASU 2016-13”), which amends guidance on the impairment of financial instruments. The ASU estimatesrequires the estimation of credit losses based on expected losses and provides for a simplified accounting model for purchased financial assets with credit deterioration. ASU 2016-13 is effective for annual reporting periods beginning after December 15, 2019, and interim reporting periods within those annual reporting periods. Early adoption is permitted for annual reporting periods beginning after December 15, 2018. While we are still evaluating the impact of ASU 2016-13, we do not expect the adoption of this standard to have a material impact on our financial statements.
DEFINITION OF A BUSINESS.In January 2017, the FASB issued ASU 2017-01, “Clarifying the Definition of a Business” (“ASU 2017-01”), which revises the definition of a business and assists in the evaluation of when a set of transferred assets and activities is a business. ASU 2017-01 is effective for interim and annual reporting periods beginning after December 15, 2017, and should be applied prospectively. Early adoption is permitted under certain circumstances. At this time, we are evaluating the potential impact of this standard on our financial statements, including the reporting requirements for transactions between entities under common control, and whether we will early adopt this standard in 2017.
GOODWILL.In January 2017, the FASB issued ASU 2017-04, “Simplifying the Test for Goodwill Impairment” (“ASU 2017-04”), which eliminates the second step from the goodwill impairment test that requires goodwill impairments to be measured atas the amount thethat a reporting unit’s carrying amount of goodwill exceeds theexceeded its implied fair value of reporting unit goodwill. Instead, an entity can perform its annual, or interim, goodwill impairment test by comparing the fair value of a reporting unit with its carrying amount with any impairment being limited to the total amount of goodwill allocated to that reporting unit. ASU 2017-04 is effective for interim and annual reporting periods beginning after December 15, 2019 and should be applied on a prospective basis. As permitted under ASU 2017-04, we have elected to early adopt this standard for our 2017 goodwill impairment tests to be performed as of November 1, 2017. The adoption of this standard is not expected to have a material impact on our financial statements.
PENSION AND POSTRETIREMENT COSTS. In March 2017, the FASB issued ASU 2017-07, “Improving the Presentation of Net Periodic Pension Cost and Net Periodic Postretirement Benefit Cost” (“ASU 2017-07”), which requires the current service-cost component of net benefit costs to be presented similarly with other current compensation costs for related employees on the condensed statement of consolidated operations. Additionally,operations, and stipulates that only the service cost component of net benefit costs is eligible for capitalization. The Company will present other components of net benefit costs elsewhere on the condensed statement of consolidated operations and stipulates that only the service cost component of net benefit cost is eligible for capitalization.operations. ASU 2017-07 is effective for interim and annual reporting periods beginning after December 15, 2017, with early adoption permitted in the first quarter of 2017 only. The amendments to the presentation of the condensed statement of consolidated operations in this update should be applied retrospectively while the change in capitalized benefit cost is to be applied prospectively. We have evaluated the impact of this standard on our financial statements and determined there will be no impact
|
| | |
| NOTES TO CONDENSED CONSOLIDATED FINANCIAL STATEMENTS (UNAUDITED) | |
to net earnings, but it is expected to have an immaterial impact on other line items such as operating income. We have elected not to early adopt and will implement when the standard becomes effective.
SHARE-BASED COMPENSATION. In May 2017, the FASB issued ASU 2017-09, “Compensation - Stock Compensation (Topic 718): Scope of Modification Accounting” (“ASU 2017-09”), which provides guidance about which changes to the terms or conditions of a share-based payment awarded require an entity to apply modification accounting. ASU 2017-09 is effective for interim and annual reporting periods beginning after December 15, 2017, with early adoption permitted. The amendments in ASU 2017-09 are to be applied prospectively to an award modified on or after the adoption date, consequently the impact will be dependent on whether we modify any share-based payment awards and the nature of such modifications. The adoption of this standard is not expected to have a material impact on our financial statements.
NOTE 2 – INVENTORIESACQUISITIONS AND DIVESTITURES
COMPONENTS OF INVENTORIESWESTERN REFINING, INC. ACQUISITION
On June 1, 2017, we completed the Western Refining Acquisition. Under the terms of the Merger Agreement, the shareholders of Western Refining elected cash consideration of $37.30 per share up to the maximum aggregate cash election of $405 million with each remaining Western Refining share being exchanged for 0.4350 shares of the Company. This resulted in the issuance of 42,617,738 of our shares, which was comprised of 39,499,524 newly issued shares of common stock and 3,118,214 shares of treasury stock. Based on our $83.25 per share closing stock price on June 1, 2017, the aggregate value of consideration paid to Western Refining shareholders was $4.0 billion, including approximately $3.6 billion of our stock and approximately $424 million of cash, including cash payable upon accelerated vesting of Western Refining equity awards. The cash portion of the purchase price, along with the settlement of $1.6 billion of certain Western Refining debt and other transaction related costs, was funded using cash on hand and $575 million of funds drawn on the Revolving Credit Facility, the capacity of which increased to $3.0 billion following the Merger.
We accounted for the Western Refining Acquisition using the acquisition method of accounting, which requires, among other things, that assets acquired at their fair values and liabilities assumed be recognized on the balance sheet as of the acquisition date. The purchase price allocation for the Western Refining Acquisition is preliminary and has been allocated based on estimated fair values of the assets acquired and liabilities assumed at the acquisition date, pending the completion of an independent valuation and other information as it becomes available to us. We expect that, as we obtain more information, the preliminary purchase price allocation disclosed below may change. The purchase price allocation adjustments can be made through the end of Andeavor’s measurement period, which is not to exceed one year from the acquisition date.
PRELIMINARY ACQUISITION DATE PURCHASE PRICE ALLOCATION (in millions)
|
| | | | | | | |
| | March 31,
2017 | | December 31,
2016 |
| Domestic crude oil and refined products | $ | 2,219 |
| | $ | 2,099 |
|
| Foreign subsidiary crude oil | 171 |
| | 310 |
|
| Materials and supplies | 153 |
| | 149 |
|
| Oxygenates and by-products | 80 |
| | 81 |
|
| Merchandise | 1 |
| | 1 |
|
| Total Inventories | $ | 2,624 |
| | $ | 2,640 |
|
|
| | | |
| Cash | $ | 159 |
|
| Receivables | 499 |
|
| Inventories | 807 |
|
| Prepayments and Other Current Assets | 213 |
|
| Property, Plant and Equipment (a) | 3,390 |
|
| Goodwill | 3,001 |
|
| Acquired Intangibles | 258 |
|
| Other Noncurrent Assets | 158 |
|
| Accounts Payable | (701 | ) |
| Accrued Liabilities | (326 | ) |
| Current Portion of Long-term Debt | (12 | ) |
| Deferred Income Taxes | (586 | ) |
| Debt | (2,073 | ) |
| Other Noncurrent Liabilities | (88 | ) |
| Noncontrolling Interest | (719 | ) |
| Total purchase price | $ | 3,980 |
|
| |
| (a) | Estimated useful lives ranging from 3 to 28 years have been assumed based on the preliminary valuation. |
GOODWILL. Andeavor evaluated several factors that contributed to the amount of goodwill presented above. These factors include the acquisition of an existing integrated refining, marketing and logistics business located in areas with access to cost-advantaged feedstocks with an assembled workforce that cannot be duplicated at the same costs by a new entrant. Further, the Western Refining Acquisition provides a platform for future growth through operating efficiencies Andeavor expects to gain from the application of best practices across the combined company and an ability to realize synergies from the geographic diversification
|
| | |
| NOTES TO CONDENSED CONSOLIDATED FINANCIAL STATEMENTS (UNAUDITED) |
of Andeavor’s business and rationalization of general and administrative costs. The amount of goodwill by reportable segment is as follows: Refining $1.9 billion, Logistics $1.0 billion and Marketing $84 million. Based on information evaluated to date, we estimate approximately $2.1 billion of the $3.0 billion in goodwill resulting from the tax-free Merger with Western Refining to be non-deductible for tax purposes. As a result of prior acquisitions, Western Refining has tax-deductible goodwill, in which we received carryover basis, providing tax deductibility for an estimated $0.9 billion of the $3.0 billion in goodwill that otherwise would not be deductible.
PROPERTY, PLANT AND EQUIPMENT. The fair value of property, plant and equipment is $3.4 billion. This preliminary fair value is based on a valuation using a combination of the income, cost and market approaches. The useful lives are based on similar assets at Andeavor.
ACQUIRED INTANGIBLE ASSETS. We estimated the fair value of the acquired identifiable intangible assets at $258 million. This fair value is based on a preliminary valuation completed for the business enterprise, along with the related tangible assets, using a combination of the income method, cost method and comparable market transactions. We recognized intangible assets associated with customer relationships, trade names and favorable leases, all of which will be amortized over a definite-life. We also recognized an intangible asset of approximately $38 million related to liquor licenses, which have an indefinite life. We considered the assets' history, accounting by Western Refining, our plans for the continued use and marketing of the assets, and how a market participant would use the assets in determining whether the intangible assets have an indefinite or definite life. We amortize acquired intangibles with finite lives on a straight-line basis over an estimated weighted average useful life of 15years, and we include the amortization in depreciation and amortization expenses on our condensed statement of consolidated operations. The gross carrying value of our finite life intangibles acquired from the Western Refining Acquisition was $220 million and the accumulated amortization was $1 millionas of June 30, 2017. Amortization expense is expected to be approximately $15 million per year for the next five years. We have not yet finalized our valuation estimate and related evaluation of the useful lives; accordingly, future amortization of intangible assets related to customer relationships may be revised.
CONTINGENCIES. We assumed environmental, legal and asset retirement obligation liabilities of approximately $23 million in the Western Refining Acquisition. The fair value of these liabilities is preliminary, pending the completion of an independent valuation and other information as it becomes available to us.
INTERESTS IN WNRL AND MINNESOTA PIPE LINE COMPANY. With the Western Refining Acquisition, we acquired a controlling interest in WNRL. The fair value of the non-controlling interest in WNRL is based on the share price, shares outstanding and the percent of public unitholders of WNRL on June 1, 2017. Additionally, we acquired a 17% common equity interest in Minnesota Pipe Line Company, LLC (“MPL”). We are accounting for our investment in MPL under the equity method of accounting given our ability to exercise significant influence over MPL.
ACQUISITION COSTS. We recognized acquisition costs related to the Western Refining Acquisition of $61 million and $68 million in general and administrative expenses for the three and six months ended June 30, 2017, respectively.Additionally, we recognized $48 million of severance costs, of which $41 million was due to the change of control and $7 million of expected severance and retention payments in future periods. We had $7 million recognized in accrued liabilities remaining to be paid.
WESTERN REFINING REVENUES AND NET EARNINGS. For the period from June 1, 2017 through June 30, 2017, we recognized $831 millionin revenues and $32 millionof netloss related to the business acquired. The net loss for this period includes an allocation of the lower of cost or market adjustment related to Western Refining’s post-Merger operations along with related acquisition and severance costs.
PRO FORMA FINANCIAL INFORMATION. The following unaudited pro forma information combines the historical operations of Tesoro and Western Refining, giving effect to the merger and related transactions as if they had been consummated on January 1, 2016, the beginning of the earliest period presented.
PRO FORMA CONSOLIDATED REVENUES AND CONSOLIDATED NET EARNINGS (in millions)
|
| | | | | | | | | | | | | | | |
| | Three Months Ended June 30, | | Six Months Ended June 30, |
| | 2017 | | 2016 | | 2017 | | 2016 |
| Revenues | $ | 9,591 |
| | $ | 8,426 |
| | $ | 18,581 |
| | $ | 15,010 |
|
| Net earnings (a) | 215 |
| | 565 |
| | 360 |
| | 637 |
|
| |
| (a) | While many recurring adjustments impact the pro forma figures presented, the increase in pro forma net earnings compared to our net earnings presented on the condensed statements of consolidated operations for both the three months and six months ended June 30, 2017 include a significant non-recurring adjustment removing acquisition and integration costs from 2017 and reflects these costs in the first quarter of 2016, the period the acquisition was assumed to be completed for pro forma purposes. |
|
| | |
| NOTES TO CONDENSED CONSOLIDATED FINANCIAL STATEMENTS (UNAUDITED) | |
NORTH DAKOTA GATHERING AND PROCESSING ASSETS ACQUISITION
On January 1, 2017, Andeavor Logistics acquired crude oil, natural gas and produced water gathering systems and two natural gas processing facilities from Whiting Oil and Gas Corporation, GBK Investments, LLC and WBI Energy Midstream, LLC (the "North Dakota Gathering and Processing Assets") for total consideration of approximately $705 million, including payments for working capital adjustments. The replacementNorth Dakota Gathering and Processing Assets include crude oil, natural gas and produced water gathering pipelines, natural gas processing and fractionation capacity in the Sanish and Pronghorn fields of the Williston Basin in North Dakota. This acquisition was immaterial to our condensed consolidated financial statements.
DIVESTITURES
On June 2, 2017, pursuant to our consent decree with the state of Alaska associated with our acquisition of certain terminalling and storage assets in Alaska during 2016, Andeavor Logistics sold one of its existing Alaska products terminals (“Alaska Terminal”). The sale of the Alaska Terminal resulted in a $25 million gain on sale being recognized in our condensed consolidated statement of operations for both the three and six months ended June 30, 2017. The Alaska Terminal divestiture did not have an impact on our Logistics segment’s operations.
NOTE 3 – INVENTORIES
COMPONENTS OF INVENTORIES (in millions)
|
| | | | | | | |
| | June 30,
2017 | | December 31,
2016 |
| Domestic crude oil and refined products (a) | $ | 2,911 |
| | $ | 2,099 |
|
| Foreign subsidiary crude oil (b) | 35 |
| | 310 |
|
| Materials and supplies (a) | 227 |
| | 149 |
|
| Oxygenates and by-products | 62 |
| | 81 |
|
| Merchandise (a) | 49 |
| | 1 |
|
| Less: Lower of cost or market reserve | (209 | ) | | — |
|
| Total Inventories | $ | 3,075 |
| | $ | 2,640 |
|
| |
| (a) | Increase primarily related to Western Refining Acquisition. See Note 2. |
| |
| (b) | In April 2017, our pipeline and storage lease in Panama terminated. |
We recorded a lower of cost or market reserve adjustment of$209 million at June 30, 2017 for our crude oil, refined products, oxygenates and refined productby-product inventories accounted for usingto adjust the LIFO costing method exceeded carrying value by approximately $25 millionof our inventories to reflect replacement costs at March 31, 2017.the reporting date. We reverse any lower of cost or market reserve in the subsequent period because the inventories are sold or used and then perform a complete lower of cost or market assessment of ending inventories at the end of each reporting period to determine if a reserve is required. At December 31, 2016, prior to changes in our lower of cost or market test following the effectiveness of ASU 2015-11, the replacement cost of our crude oil and refined product inventories exceeded carrying value, both in the aggregate, by approximately $107 million.
NOTE 34 – PROPERTY, PLANT AND EQUIPMENT
PROPERTY, PLANT AND EQUIPMENT (in millions)
| | | | March 31,
2017 | | December 31,
2016 | June 30,
2017 | | December 31,
2016 |
Refining | $ | 8,196 |
| | $ | 8,067 |
| $ | 10,169 |
| | $ | 8,067 |
|
| TLLP | 4,645 |
| | 4,059 |
| |
| Logistics (a) | | 6,011 |
| | 4,059 |
|
Marketing | 936 |
| | 934 |
| 1,208 |
| | 934 |
|
| Corporate | 455 |
| | 412 |
| 523 |
| | 412 |
|
| Property, Plant and Equipment, at Cost | 14,232 |
| | 13,472 |
| 17,911 |
| | 13,472 |
|
| Accumulated depreciation | (3,629 | ) | | (3,496 | ) | (3,768 | ) | | (3,496 | ) |
| Property, Plant and Equipment, Net | $ | 10,603 |
| | $ | 9,976 |
| $ | 14,143 |
| | $ | 9,976 |
|
| |
| (a) | Increase primarily related to Western Refining Acquisition. See Note 2. |
|
| | |
| NOTES TO CONDENSED CONSOLIDATED FINANCIAL STATEMENTS (UNAUDITED) |
We capitalize interest as part of the cost of major projects during the construction period. Capitalized interest totaled $10$12 million and $6 million for the three months ended March 31,June 30, 2017 and 2016, respectively, and $22 million and $12 million for the six months ended June 30, 2017 and 2016, respectively, and is recorded as a reduction to net interest and financing costs in our condensed statements of consolidated operations.
NORTH DAKOTA GATHERING AND PROCESSING ASSETS ACQUISITION
On January 1, 2017, TLLP acquired crude oil, natural gas and produced water gathering systems and two natural gas processing facilities from Whiting Oil and Gas Corporation, GBK Investments, LLC and WBI Energy Midstream, LLC (the "North Dakota Gathering and Processing Assets") for total consideration of approximately $705 million, including payments for working capital adjustments. The North Dakota Gathering and Processing Assets include crude oil, natural gas and produced water gathering pipelines, natural gas processing and fractionation capacity in the Sanish and Pronghorn fields of the Williston Basin in North Dakota. This acquisition was immaterial to our condensed consolidated financial statements.
NOTE 45 – DERIVATIVE INSTRUMENTS
In the ordinary course of business, our profit margins, earnings and cash flows are impacted by the timing, direction and overall change in pricing for commodities used throughout our operations. We use non-trading derivative instruments to manage our exposure to the following:
price risks associated with the purchase or sale of feedstocks, refined products and energy supplies related to our refineries, terminals, marketing fuel inventory and customers;
price risks associated with inventories above or below our target levels;
future emission credit requirements; and
exchange rate fluctuations on our purchases of Canadian crude oil.
Our accounting for derivative instruments depends on whether the underlying commodity will be used or sold in the normal course of business. For contracts where the crude oil or refined products are expected to be used or sold in the normal course of business, we apply the normal purchase normal sale exception and follow the accrual method of accounting. All other derivative instruments are recorded at fair value using mark-to-market accounting.
Our derivative instruments can include forward purchase and sale contracts (“Forward Contracts”), exchange-traded futures (“Futures Contracts”), over-the-counter swaps, including those cleared on an exchange (“Swap Contracts”), options (“Options”), and over-the-counter options (“OTC Option Contracts”). Forward Contracts are agreements to buy or sell the commodity at a predetermined price at a specified future date. Futures Contracts are standardized agreements, traded on a futures exchange, to buy or sell the commodity at a predetermined price at a specified future date. Options provide the right, but not the obligation to buy or sell the commodity at a specified price in the future. Swap Contracts and OTC Option Contracts require cash settlement for the commodity based on the difference between a contracted fixed or floating price and the market price on the settlement date. Certain of these contracts require cash collateral to be received or paid if our asset or liability position, respectively, exceeds specified thresholds. We believe that we have minimal credit risk with respect to our counterparties.
|
| | |
NOTES TO CONDENSED CONSOLIDATED FINANCIAL STATEMENTS (UNAUDITED) | | |
The following table presents the fair value of our derivative instruments as of March 31,June 30, 2017 and December 31, 2016. The fair value amounts below are presented on a gross basis and do not reflect the netting of asset and liability positions permitted under the terms of our master netting arrangements including cash collateral on deposit with, or received from, brokers. We offset the recognized fair value amounts for multiple derivative instruments executed with the same counterparty in our financial statements when a legal right of offset exists. As a result, the asset and liability amounts below will not agree with the amounts presented in our condensed consolidated balance sheets.
DERIVATIVE ASSETS AND LIABILITIES (in millions)
| | | | | Derivative Assets | | Derivative Liabilities | | Derivative Assets | | Derivative Liabilities |
| | Balance Sheet Location | March 31,
2017 | | December 31,
2016 | | March 31,
2017 | | December 31,
2016 | Balance Sheet Location | June 30,
2017 | | December 31,
2016 | | June 30,
2017 | | December 31,
2016 |
| Commodity Futures Contracts | Prepayments and other current assets | $ | 566 |
| | $ | 821 |
| | $ | 567 |
| | $ | 871 |
| Prepayments and other current assets | $ | 756 |
| | $ | 821 |
| | $ | 724 |
| | $ | 871 |
|
| Commodity Swap Contracts | | Prepayments and other current assets | 15 |
| | 11 |
| | 9 |
| | 13 |
|
| Commodity Swap Contracts | Prepayments and other current assets | 5 |
| | 11 |
| | 6 |
| | 13 |
| Receivables | 5 |
| | — |
| | — |
| | — |
|
| Commodity Swap Contracts | Accounts payable | — |
| | — |
| | — |
| | 2 |
| Payables | — |
| | — |
| | 1 |
| | 2 |
|
| Commodity Options Contracts | Prepayments and other current assets | — |
| | 1 |
| | — |
| | — |
| Prepayments and other current assets | — |
| | 1 |
| | — |
| | — |
|
| Commodity Forward Contracts | Receivables | 2 |
| | 6 |
| | — |
| | — |
| Receivables | 8 |
| | 6 |
| | — |
| | — |
|
| Commodity Forward Contracts | Accounts payable | — |
| | — |
| | 2 |
| | 2 |
| Accounts payable | — |
| | — |
| | 5 |
| | 2 |
|
| Total Gross Mark-to-Market Derivatives | Total Gross Mark-to-Market Derivatives | 573 |
| | 839 |
| | 575 |
| | 888 |
| Total Gross Mark-to-Market Derivatives | 784 |
| | 839 |
| | 739 |
| | 888 |
|
| Less: Counterparty Netting and Cash Collateral (a) | Less: Counterparty Netting and Cash Collateral (a) | (533 | ) | | (744 | ) | | (565 | ) | | (832 | ) | Less: Counterparty Netting and Cash Collateral (a) | (731 | ) | | (744 | ) | | (725 | ) | | (832 | ) |
| Total Net Fair Value of Derivatives | Total Net Fair Value of Derivatives | $ | 40 |
| | $ | 95 |
| | $ | 10 |
| | $ | 56 |
| Total Net Fair Value of Derivatives | $ | 53 |
| | $ | 95 |
| | $ | 14 |
| | $ | 56 |
|
| |
| (a) | Certain of our derivative contracts, under master netting arrangements, include both asset and liability positions. We offset both the fair value amounts and any related cash collateral amounts recognized for multiple derivative instruments executed with the same counterparty when there is a legally enforceable right and an intention to settle net or simultaneously. As of March 31,June 30, 2017 and December 31, 2016, weour counterparties had provided cash collateral amounts of $32 million and $88 million, respectively, related to our unrealized derivative positions. Cash collateral amounts are netted with mark-to-market derivative assets. |
|
| | |
| NOTES TO CONDENSED CONSOLIDATED FINANCIAL STATEMENTS (UNAUDITED) | |
provided cash collateral of $6 million related to our unrealized derivative positions. As of December 31, 2016, we had provided cash collateral amounts of $88 million related to our unrealized derivative positions. Cash collateral amounts are netted with mark-to-market derivative assets.
GAINS (LOSSES) ON MARK-TO-MARKET DERIVATIVES (in millions)
| | | | Three Months Ended March 31, | Three Months Ended June 30, | | Six Months Ended June 30, |
| | 2017 | | 2016 | 2017 | | 2016 | | 2017 | | 2016 |
| Commodity Contracts | $ | 28 |
| | $ | 38 |
| $ | 92 |
| | $ | (82 | ) | | $ | 120 |
| | $ | (44 | ) |
| Foreign Currency Forward Contracts | — |
| | 1 |
| — |
| | — |
| | — |
| | 1 |
|
| Total Gain on Mark-to-Market Derivatives | $ | 28 |
| | $ | 39 |
| |
| Total Gain (Loss) on Mark-to-Market Derivatives | | $ | 92 |
| | $ | (82 | ) | | $ | 120 |
| | $ | (43 | ) |
INCOME STATEMENT LOCATION OF GAINS (LOSSES) ON MARK-TO-MARKET DERIVATIVES (in millions)
| | | | Three Months Ended March 31, | Three Months Ended June 30, | | Six Months Ended June 30, |
| | 2017 | | 2016 | 2017 | | 2016 | | 2017 | | 2016 |
| Revenues | $ | 8 |
| | $ | 15 |
| $ | 1 |
| | $ | (20 | ) | | $ | 9 |
| | $ | (5 | ) |
| Cost of sales | 20 |
| | 23 |
| 91 |
| | (62 | ) | | 111 |
| | (39 | ) |
| Other income, net | — |
| | 1 |
| — |
| | — |
| | — |
| | 1 |
|
| Total Gain on Mark-to-Market Derivatives | $ | 28 |
| | $ | 39 |
| |
| Total Gain (Loss) on Mark-to-Market Derivatives | | $ | 92 |
| | $ | (82 | ) | | $ | 120 |
| | $ | (43 | ) |
|
| | |
| NOTES TO CONDENSED CONSOLIDATED FINANCIAL STATEMENTS (UNAUDITED) | |
OPEN LONG (SHORT) POSITIONS
OUTSTANDING COMMODITY AND OTHER CONTRACTS (units in thousands)
| | | | Contract Volumes by Year of Maturity | | Unit of Measure | Contract Volumes by Year of Maturity | | Unit of Measure |
| Mark-to-Market Derivative Instrument | 2017 | | 2018 | | 2019 | | 2017 | | 2018 | | 2019 | |
| Crude oil, refined products and blending products: | | |
| Futures Contracts - short | (3,687) | | (785) | | — | | Barrels | |
| Swap Contracts - long | — | | 990 | | — | | Barrels | 3,931 | | 367 | | — | | Barrels |
| Swap Contracts - short | (853) | | — | | — | | Barrels | |
| Forward Contracts - Long | 394 | | — | | — | | Barrels | |
| Futures Contracts - long | | 7,193 | | 864 | | — | | Barrels |
| Options - short | | (274) | | — | | — | | Barrels |
| Forward Contracts - long | | 2,045 | | — | | — | | Barrels |
| Carbon emissions credits: | | |
| Futures Contracts - long | 1,000 | | — | | — | | Tons | 50 | | — | | — | | Tons |
| Corn: | | |
| Futures Contracts - short | (145) | | — | | — | | Bushels | |
| Futures Contracts - long | | 545 | | 20 | | — | | Bushels |
At March 31,June 30, 2017, we had open Forward Contracts to purchase CAD $14$5 million that were settled on AprilJuly 24, 2017.
NOTE 56 – FAIR VALUE MEASUREMENTS
We classify financial assets and liabilities according to the fair value hierarchy. Financial assets and liabilities classified as level 1 instruments are valued using quoted prices in active markets for identical assets and liabilities. Level 2 instruments are valued using quoted prices for similar assets and liabilities in active markets, and inputs other than quoted prices, such as liquidity, that are observable for the asset or liability. Our level 2 instruments include derivatives valued using market quotations from independent price reporting agencies, third-party brokers and commodity exchange price curves that are corroborated with market data. Level 3 instruments are valued using significant unobservable inputs that are not supported by sufficient market activity. We do not have any financial assets or liabilities classified as level 3 at March 31,June 30, 2017 or December 31, 2016.
Our financial assets and liabilities measured at fair value on a recurring basis include derivative instruments. Additionally, our financial liabilities include obligations for Renewable Identification Numbers (“RINs”) and cap-and-trade emission credits for the state of California (together with RINs, our “Environmental Credit Obligations”). See Note 45 for further information on our derivative instruments. Amounts presented below for Environmental Credit Obligations represent the estimated fair value amount at each balance sheet date for which we do not have sufficient RINs and California cap-and-trade credits to satisfy our obligations to the U.S. Environmental Protection Agency (“EPA”) and the state of California, respectively.
FINANCIAL ASSETS AND LIABILITIES AT FAIR VALUE (in millions)
|
| | | | | | | | | | | | | | | | | | | |
| | March 31, 2017 |
| | Level 1 | | Level 2 | | Level 3 | | Netting and Collateral (a) | | Total |
| Assets: | | | | | | | | | |
| Commodity Futures Contracts | $ | 562 |
| | $ | 4 |
| | $ | — |
| | $ | (528 | ) | | $ | 38 |
|
| Commodity Swap Contracts | — |
| | 5 |
| | — |
| | (5 | ) | | — |
|
| Commodity Forward Contracts | — |
| | 2 |
| | — |
| | — |
| | 2 |
|
| Total Assets | $ | 562 |
| | $ | 11 |
| | $ | — |
| | $ | (533 | ) | | $ | 40 |
|
| | | | | | | | | | |
| Liabilities: | | | | | | | | | |
| Commodity Futures Contracts | $ | 567 |
| | $ | — |
| | $ | — |
| | $ | (560 | ) | | $ | 7 |
|
| Commodity Swap Contracts | — |
| | 6 |
| | — |
| | (5 | ) | | 1 |
|
| Commodity Forward Contracts | — |
| | 2 |
| | — |
| | — |
| | 2 |
|
| Environmental Credit Obligations | — |
| | 199 |
| | — |
| | — |
| | 199 |
|
| Total Liabilities | $ | 567 |
| | $ | 207 |
| | $ | — |
| | $ | (565 | ) | | $ | 209 |
|
|
| | |
| | | March 31,June 30, 2017 | 1113
|
|
| | |
| NOTES TO CONDENSED CONSOLIDATED FINANCIAL STATEMENTS (UNAUDITED) | | |
FINANCIAL ASSETS AND LIABILITIES AT FAIR VALUE (in millions)
|
| | | | | | | | | | | | | | | | | | | |
| | June 30, 2017 |
| | Level 1 | | Level 2 | | Level 3 | | Netting and Collateral (a) | | Total |
| Assets: | | | | | | | | | |
| Commodity Futures Contracts | $ | 751 |
| | $ | 5 |
| | $ | — |
| | $ | (722 | ) | | $ | 34 |
|
| Commodity Swap Contracts | — |
| | 20 |
| | — |
| | (9 | ) | | 11 |
|
| Commodity Forward Contracts | — |
| | 8 |
| | — |
| | — |
| | 8 |
|
| Total Assets | $ | 751 |
| | $ | 33 |
| | $ | — |
| | $ | (731 | ) | | $ | 53 |
|
| | | | | | | | | | |
| Liabilities: | | | | | | | | | |
| Commodity Futures Contracts | $ | 723 |
| | $ | 1 |
| | $ | — |
| | $ | (716 | ) | | $ | 8 |
|
| Commodity Swap Contracts | — |
| | 10 |
| | — |
| | (9 | ) | | 1 |
|
| Commodity Forward Contracts | — |
| | 5 |
| | — |
| | — |
| | 5 |
|
| Environmental Credit Obligations | — |
| | 217 |
| | — |
| | — |
| | 217 |
|
| Total Liabilities | $ | 723 |
| | $ | 233 |
| | $ | — |
| | $ | (725 | ) | | $ | 231 |
|
|
| | | | | | | | | | | | | | | | | | | |
| | December 31, 2016 |
| | Level 1 | | Level 2 | | Level 3 | | Netting and Collateral (a) | | Total |
| Assets: | | | | | | | | | |
| Commodity Futures Contracts | $ | 821 |
| | $ | — |
| | $ | — |
| | $ | (733 | ) | | $ | 88 |
|
| Commodity Swap Contracts | — |
| | 11 |
| | — |
| | (11 | ) | | — |
|
| Commodity Options Contracts | 1 |
| | — |
| | — |
| | — |
| | 1 |
|
| Commodity Forward Contracts | — |
| | 6 |
| | — |
| | — |
| | 6 |
|
| Total Assets | $ | 822 |
| | $ | 17 |
| | $ | — |
| | $ | (744 | ) | | $ | 95 |
|
| | | | | | | | | | |
| Liabilities: | | | | | | | | | |
| Commodity Futures Contracts | $ | 870 |
| | $ | 1 |
| | $ | — |
| | $ | (821 | ) | | $ | 50 |
|
| Commodity Swap Contracts | — |
| | 15 |
| | — |
| | (11 | ) | | 4 |
|
| Commodity Forward Contracts | — |
| | 2 |
| | — |
| | — |
| | 2 |
|
| Environmental Credit Obligations | — |
| | 79 |
| | — |
| | — |
| | 79 |
|
| Total Liabilities | $ | 870 |
| | $ | 97 |
| | $ | — |
| | $ | (832 | ) | | $ | 135 |
|
| |
| (a) | Certain of our derivative contracts, under master netting arrangements, include both asset and liability positions. We offset both the fair value amounts and any related cash collateral amounts recognized for multiple derivative instruments executed with the same counterparty when there is a legally enforceable right and an intention to settle net or simultaneously. As of March 31,June 30, 2017, and our counterparties had provided cash collateral of $6 million related to our unrealized derivative positions. As of December 31, 2016, we had provided cash collateral amounts of $32$88 million and $88 million, respectively, related to our unrealized derivative positions. Cash collateral amounts are netted with mark-to-market derivative assets. |
We believe the carrying value of our other financial instruments, including cash and cash equivalents, receivables, accounts payable and certain accrued liabilities approximate fair value. Our fair value assessment incorporates a variety of considerations, including the short-term duration of the instruments and the expected continued insignificance of bad debt expense, which includes an evaluation of counterparty credit risk. The borrowings under our Revolving Credit Facility, the Tesoro Corporation revolving credit facility (the “Revolving Credit Facility”), the TLLPAndeavor Logistics senior secured revolving credit agreement (the “TLLP“Andeavor Logistics Revolving Credit Facility”), the secured Andeavor Logistics drop down credit facility (the “Andeavor Logistics Dropdown Credit Facility”) and the secured TLLP drop downWNRL revolving credit facility (the “TLLP Dropdown“WNRL Revolving Credit Facility”), which include variable interest rates, approximate fair value. The fair value of our fixed rate debt is based on prices from recent trade activity and is categorized in level 2 of the fair value hierarchy. The carrying value and fair value of our debt were approximately $6.7$7.7 billionand $7.0$8.1 billion as of March 31,June 30, 2017, respectively, and $7.0 billion and $7.3 billion at December 31, 2016, respectively. These carrying and fair values of our debt do not consider the unamortized issuance costs, which are netted against our total debt.
NOTE 6 – DEBT
DEBT BALANCE, NET OF UNAMORTIZED ISSUANCE COSTS (in millions)
|
| | | | | | | |
| | March 31,
2017 | | December 31,
2016 |
| Total debt (a) | $ | 6,749 |
| | $ | 7,042 |
|
| Unamortized issuance costs | (106 | ) | | (109 | ) |
| Current maturities | (465 | ) | | (465 | ) |
| Debt, Net of Current Maturities and Unamortized Issuance Costs | $ | 6,178 |
| | $ | 6,468 |
|
| |
(a) | Total debt related to TLLP, which is non-recourse to Tesoro, except for TLGP, was $3.8 billion and $4.1 billion at March 31, 2017 and December 31, 2016, respectively.
|
|
| | |
1214 | Tesoro Corporation
| | |
|
| | |
| NOTES TO CONDENSED CONSOLIDATED FINANCIAL STATEMENTS (UNAUDITED) | |
CREDIT FACILITIESNOTE 7 – DEBT
DEBT BALANCE, NET OF CURRENT MATURITIES AND UNAMORTIZED ISSUANCE COSTS (in millions)
|
| | | | | | | |
| | June 30,
2017 | | December 31,
2016 |
| Total debt (a) | $ | 7,715 |
| | $ | 7,042 |
|
| Unamortized issuance costs and premiums (b) | (73 | ) | | (109 | ) |
| Current maturities | (478 | ) | | (465 | ) |
| Debt, Net of Current Maturities and Unamortized Issuance Costs (c) | $ | 7,164 |
| | $ | 6,468 |
|
| |
| (a) | Total debt related to Andeavor Logistics, which is non-recourse to Andeavor, except for TLGP, was $3.8 billion and $4.1 billion at June 30, 2017 and December 31, 2016, respectively. Total debt related to WNRL, which is non-recourse to Andeavor, except for WGP, was $320 million at June 30, 2017. |
| |
| (b) | Includes premium of $26 million related to the incremental fair value of the WNRL Revolving Credit Facility upon acquisition. |
| |
| (c) | Increase primarily related to borrowings on our Revolving Credit Facility for the Western Refining Acquisition and WNRL’s outstanding debt. See Note 2. |
AVAILABLE CAPACITY UNDER CREDIT FACILITIES (in millions)
|
| | | | | | | | | | | | | | | | | |
| | Total Capacity | | Amount Borrowed as of March 31, 2017 | | Outstanding Letters of Credit | | Available Capacity | | Expiration |
| Tesoro Corporation Revolving Credit Facility (a) | $ | 2,000 |
| | $ | — |
| | $ | 4 |
| | $ | 1,996 |
| | September 30, 2020 |
| TLLP Revolving Credit Facility (b) | 600 |
| | 40 |
| | — |
| | 560 |
| | January 29, 2021 |
| TLLP Dropdown Credit Facility | 1,000 |
| | — |
| | — |
| | 1,000 |
| | January 29, 2021 |
| Letter of Credit Facilities | 975 |
| | — |
| | — |
| | 975 |
| | |
| Total Credit Facilities | $ | 4,575 |
| | $ | 40 |
| | $ | 4 |
| | $ | 4,531 |
| | |
|
| | | | | | | | | | | | | | | | | | | | |
| | Total Capacity | | Amount Borrowed as of June 30, 2017 | | Outstanding Letters of Credit | | Available Capacity | | Weighted Average Interest Rate | | Expiration |
| Andeavor Revolving Credit Facility (a) | $ | 3,000 |
| | $ | 575 |
| | $ | 46 |
| | $ | 2,379 |
| | 2.56 | % | | September 30, 2020 |
| Andeavor Logistics Revolving Credit Facility | 600 |
| | 50 |
| | — |
| | 550 |
| | 3.31 | % | | January 29, 2021 |
| Andeavor Logistics Dropdown Credit Facility | 1,000 |
| | — |
| | — |
| | 1,000 |
| | — | % | | January 29, 2021 |
| WNRL Revolving Credit Facility | 500 |
| | 20 |
| | 1 |
| | 479 |
| | 3.08 | % | | October 16, 2018 |
| Letter of Credit Facilities | 975 |
| | — |
| | — |
| | 975 |
| | | | |
| Total Credit Facilities | $ | 6,075 |
| | $ | 645 |
| | $ | 47 |
| | $ | 5,383 |
| | | | |
| |
| (a) | The $2.0$3.0 billion Andeavor Revolving Credit Facility total capacity does not includeincludes the additional $1.0$1.0 billion related to the incremental revolver, as defined in Note 12 to our consolidated financial statements in our Annual Report on Form 10-K for the year ended December 31, 2016,, which may bewas used to fund amounts required for the acquisition of Western Refining and certain other specified uses in connection with the transaction. |
WESTERN REFINING ACQUISITION FINANCING.On June 1, 2017, to finance the approximately $424 million in total cash consideration, $1.6 billion repayment of certain Western Refining and Northern Tier Energy LP (“NTI”) indebtedness and fees and expenses related to the Western Refining Acquisition, we borrowed $575 million under our Revolving Credit Facility and utilized cash on hand, including the proceeds from the 4.750% Senior Notes due 2023 and the 5.125% Senior Notes due 2026 we issued in December 2016. Included in the $1.6 billion of debt payments were Western Refining’s $532 million Term Loan - 5.25% Credit Facility due 2020, $350 million of 6.25% Senior Unsecured Notes due 2021, $371 million Term Loan - 5.50% Credit Facility due 2023 and NTI’s $350 million of 7.125% Senior Secured Notes due 2020 along with approximately $45 million to pay down the outstanding credit facilities at Western Refining and NTI at June 1, 2017. The Western Refining and NTI revolving credit facilities were terminated upon completion of the Merger. We paid premiums of approximately $23 million in paying off the Western Refining and NTI senior notes, which were included in the fair value due to the change of control triggering event of these debt instruments at acquisition. The WNRL revolving credit facility and senior notes remained following the acquisition, see details below.
Following the completion of the Merger, our Revolving Credit Facility increased in capacity from $2.0 billion to $3.0 billion in accordance with the amendment entered into in December 2016. For more details, see Note 12 of our Annual Report on Form 10-K for the year ended December 31, 2016.
WNRL REVOLVING CREDIT FACILITY. On June 1, 2017, in connection with the Merger, we consolidated WNRL and its $500 million senior secured WNRL Revolving Credit Facility, which WNRL originally entered into on October 16, 2013. This credit facility expires on October 16, 2018. The total commitment of the WNRL Revolving Credit Facility is $500 million, but WNRL has the ability to increase the total commitment up to $150 million for a total facility size of up to $650 million, subject to receiving increased commitments from lenders and to the satisfaction of certain conditions. The WNRL Revolving Credit Facility includes a $25 million sub-limit for standby letters of credit and a $10 million sub-limit for swing line loans. Obligations under the WNRL Revolving Credit Facility and certain cash management and hedging obligations are guaranteed by all of WNRL's subsidiaries and, with certain
|
| | |
(b) | | The weighted average interest rate for borrowings under the TLLP Revolving Credit Facility wasJune 30, 2017 3.23%| at March 31, 2017.15
|
|
| | |
| NOTES TO CONDENSED CONSOLIDATED FINANCIAL STATEMENTS (UNAUDITED) |
exceptions, will be guaranteed by any formed or acquired subsidiaries. Obligations under the WNRL Revolving Credit Facility are secured by a first priority lien on substantially all significant assets of WNRL and its subsidiaries. Borrowings under the WNRL Revolving Credit Facility bear interest at either a base rate plus an applicable margin ranging from 0.75% to 1.75% or at LIBOR plus an applicable margin ranging from 1.75% to 2.75%. The applicable margin will vary based upon WNRL's consolidated total leverage ratio, as defined in the WNRL Revolving Credit Facility. The effective rate of the WNRL Revolving Credit Facility was 3.49% at June 30, 2017. The WNRL Revolving Credit Facility contains covenants that limit or restrict WNRL's ability to make cash distributions. WNRL is required to maintain certain financial ratios that are tested on a quarterly basis for the immediately preceding four quarter period.
WNRL SENIOR NOTES. WNRL has $300 million of 7.5% senior notes (the “WNRL Senior Notes”), which WNRL originally entered into on February 11, 2015 and mature on February 11, 2023. The fair value of these notes at June 1, 2017 was $326 million and is reflected in our preliminary acquisition date purchase price allocation, see Note 2 for more details. WNRL and WNRL Finance Corp., a Delaware corporation and 100% owned subsidiary of WNRL, issued the WNRL Senior Notes along with the guarantors named therein and U.S. Bank National Association, as trustee. WNRL pays interest on the WNRL Senior Notes semi-annually in cash in arrears on February 15 and August 15 of each year. The WNRL Senior Notes contain covenants that limit WNRL’s and its restricted subsidiaries’ ability to, among other things: (i) incur, assume or guarantee additional indebtedness or issue preferred units, (ii) create liens to secure indebtedness, (iii) pay distributions on equity securities, repurchase equity securities or redeem subordinated indebtedness, (iv) make investments, (v) restrict distributions, loans or other asset transfers from the WNRL’s restricted subsidiaries, (vi) consolidate with or merge with or into, or sell substantially all of the WNRL’s properties to, another person, (vii) sell or otherwise dispose of assets, including equity interests in subsidiaries and (viii) enter into transactions with affiliates. These covenants are subject to a number of important limitations and exceptions. The WNRL Senior Notes also provide for events of default, which, if any of them occur, would permit or require the principal, premium, if any, and interest on all the then outstanding WNRL Senior Notes to be due and payable immediately.
NOTE 78 – BENEFIT PLANS
COMPONENTS OF PENSION AND OTHER POSTRETIREMENT BENEFIT EXPENSE (INCOME) (in millions)
| | | | Pension Benefits | | Other Postretirement Benefits | Pension Benefits |
| | Three Months Ended March 31, | Three Months Ended June 30, | | Six Months Ended June 30, |
| | 2017 | | 2016 | | 2017 | | 2016 | 2017 | | 2016 | | 2017 | | 2016 |
| Service cost | $ | 13 |
| | $ | 11 |
| | $ | 1 |
| | $ | 1 |
| $ | 13 |
| | $ | 12 |
| | $ | 26 |
| | $ | 23 |
|
| Interest cost | 8 |
| | 8 |
| | — |
| | 1 |
| 8 |
| | 7 |
| | 16 |
| | 15 |
|
| Expected return on plan assets | (7 | ) | | (7 | ) | | — |
| | — |
| (7 | ) | | (7 | ) | | (14 | ) | | (14 | ) |
| Recognized net actuarial loss | | 6 |
| | 5 |
| | 11 |
| | 10 |
|
| Recognized curtailment loss and settlement cost | | — |
| | — |
| | — |
| | 5 |
|
| Net Periodic Benefit Expense | | $ | 20 |
| | $ | 17 |
| | $ | 39 |
| | $ | 39 |
|
| | | | | | | | | |
| | | Other Postretirement Benefits |
| | | Three Months Ended June 30, | | Six Months Ended June 30, |
| | | 2017 | | 2016 | | 2017 | | 2016 |
| Service cost | | $ | — |
| | $ | 1 |
| | $ | 1 |
| | $ | 2 |
|
| Interest cost | | 1 |
| | — |
| | 1 |
| | 1 |
|
| Amortization of prior service credit | — |
| | — |
| | (8 | ) | | (9 | ) | (9 | ) | | (9 | ) | | (17 | ) | | (18 | ) |
| Recognized net actuarial loss | 5 |
| | 5 |
| | 1 |
| | 1 |
| 1 |
| | 1 |
| | 2 |
| | 2 |
|
| Recognized curtailment loss and settlement cost | — |
| | 5 |
| | — |
| | — |
| |
| Net Periodic Benefit Expense (Income) | $ | 19 |
| | $ | 22 |
| | $ | (6 | ) | | $ | (6 | ) | |
| Net Periodic Benefit Income | | $ | (7 | ) | | $ | (7 | ) | | $ | (13 | ) | | $ | (13 | ) |
WESTERN REFINING BENEFIT PLANS. We assumed all of Western Refining’s existing defined contribution and benefit plans as a result of the Merger. All benefits remain within their respective Western Refining and subsidiaries’ plans. The impact of these benefit plans are immaterial to our financial statements as a whole.
|
| | |
| NOTES TO CONDENSED CONSOLIDATED FINANCIAL STATEMENTS (UNAUDITED) | |
NOTE 89 – COMMITMENTS AND CONTINGENCIES
We are incurring and expect to continue to incur expenses for environmental remediation liabilities at a number of currently and previously owned or operated refining, pipeline, terminal and retail station properties. Additionally, in the ordinary course of business, we may become party to lawsuits, administrative proceedings and governmental investigations, including environmental, regulatory and other matters. There were no new reportableThe outcome of these matters that arose duringcannot always be predicted accurately, but we will accrue liabilities for these matters if the first quarteramount is probable and can be reasonably estimated. Other than as described in (i) Part II, Item 1 of 2017. In addition, no material developments occurred with respect to proceedings previously reported inthis Report or (ii) our Annual Report on Form 10-K for the year ended December 31, 2016. See Item 1 in Part II2016 or our Quarterly Report on Form 10-Q for further details regarding legal proceedings. Althoughthe quarter ended March 31, 2017, we cannot provide assurance, we believe that an adverse resolution of such proceedings woulddo not have aany other material impact on our liquidity, consolidated financial position,outstanding lawsuits, administrative proceedings or consolidated results of operations.
|
| | |
NOTES TO CONDENSED CONSOLIDATED FINANCIAL STATEMENTS (UNAUDITED) | | |
governmental investigations.
TAX. We are subject to federal, state and foreign tax laws and regulations. We are also subject to audits by federal, state and foreign taxing authorities in the normal course of business. It is possible that tax audits could result in claims against us in excess of recorded liabilities. However, we believe that resolution of any such claim(s) would not have a material impact on our liquidity, financial position or results of operations.
Newly enacted tax laws and regulations, and changes in existing tax laws and regulations, could result in increased expenditures in the future. For instance, upon a transfer of assets to TLLP, TesoroAndeavor Logistics, Andeavor historically has received a distribution of cash from partnership debt used to finance the transaction. This distribution has historically been treated as non-taxable loan proceeds to the extent of Tesoro’sAndeavor’s 100% indemnity of such loan. New Federal Income Tax Regulations in effect for leveraged partnership transactions occurring on or after January 3, 2017, will reduce the amount treated as non-taxable loan proceeds to that portion equal to Tesoro’sAndeavor’s partnership profit sharing ratio in TLLP.Andeavor Logistics. This could result in a taxable gain being recognized by TesoroAndeavor in a period when no such gain is recognized in the financial statements, causing an increase in the current portion of income tax expense.
NOTE 910 – STOCKHOLDERS’ EQUITY AND EARNINGS PER SHARE
CHANGES TO EQUITY (in millions)
| | | | Tesoro Corporation Stockholders’ Equity | | Noncontrolling Interest | | Total Equity | Andeavor Stockholders’ Equity | | Noncontrolling Interest | | Total Equity |
| Balance at December 31, 2016 (a) | $ | 5,465 |
| | $ | 2,662 |
| | $ | 8,127 |
| $ | 5,465 |
| | $ | 2,662 |
| | $ | 8,127 |
|
| Issuance of shares for Western Refining Acquisition (b) | | 3,548 |
| | — |
| | 3,548 |
|
| Net earnings | 50 |
| | 37 |
| | 87 |
| 90 |
| | 84 |
| | 174 |
|
| Purchases of common stock | | (148 | ) | | — |
| | (148 | ) |
| Dividend payments | (65 | ) | | — |
| | (65 | ) | (130 | ) | | — |
| | (130 | ) |
| Net effect of amounts related to equity-based compensation (b) | 16 |
| | 1 |
| | 17 |
| |
| Net effect of amounts related to equity-based compensation | | 33 |
| | 5 |
| | 38 |
|
| Taxes paid related to net share settlement of equity awards | (22 | ) | | — |
| | (22 | ) | (30 | ) | | (1 | ) | | (31 | ) |
| Net proceeds from issuance of TLLP common units (c) | (1 | ) | | 282 |
| | 281 |
| |
| Net proceeds from issuance of Andeavor Logistics common units (c) | | (1 | ) | | 282 |
| | 281 |
|
| Distributions to noncontrolling interest | — |
| | (63 | ) | | (63 | ) | — |
| | (133 | ) | | (133 | ) |
| Transfers to (from) Tesoro paid-in capital related to: | | | | | | |
| TLLP’s issuance of common units | 43 |
| | (71 | ) | | (28 | ) | |
| Balance at March 31, 2017 (a)(d) | $ | 5,486 |
| | $ | 2,848 |
| | $ | 8,334 |
| |
| Noncontrolling interest acquired from Western Refining | | — |
| | 719 |
| | 719 |
|
| Consideration for Western Refining related to stock awards | | 8 |
| | — |
| | 8 |
|
| Transfers to (from) Andeavor paid-in capital related to: | | | | | | |
| Andeavor Logistics’ issuance of common units | | 45 |
| | (73 | ) | | (28 | ) |
| Equity issuance costs related to the Western Refining Acquisition | | (3 | ) | | — |
| | (3 | ) |
| Other | | 1 |
| | — |
| | 1 |
|
| Balance at June 30, 2017 (a)(d) | | $ | 8,878 |
| | $ | 3,545 |
| | $ | 12,423 |
|
| |
| (a) | We have 5.0 million shares of preferred stock authorized with no par value per share. No shares of preferred stock were outstanding as of March 31,June 30, 2017 and December 31, 2016. |
| |
| (b) | We issued less than 0.1 million42,617,738 shares during bothfor the three months ended March 31, 2017Western Refining Acquisition, comprised of 39,499,524 newly issued shares of common stock and 2016,3,118,214 shares of treasury stock, resulting in an increase to amounts recorded for proceedscommon stock of $2$7 million and $1 million, respectively, primarily foradditional paid-in capital of $3.4 billion along with a decrease in treasury stock option exercises under our equity-based compensation plans. See Note 10 for information on stock-based compensation.of $169 million. |
| |
| (c) | TLLPAndeavor Logistics sold 5,000,000 of its common units at a price of $56.19 per unit on February 27, 2017 and used the net proceeds to repay borrowings outstanding under the TLLPAndeavor Logistics Revolving Credit Facility. |
| |
| (d) | During a special stockholder meeting on March 24, 2017, TesoroAndeavor stockholders approved, among other things, the issuance of shares of TesoroAndeavor common stock in connection with the Merger and an amendment to Tesoro’sAndeavor’s restated certificate of incorporation increasing authorized shares from 200 million to 300 million. |
|
| | |
| NOTES TO CONDENSED CONSOLIDATED FINANCIAL STATEMENTS (UNAUDITED) |
EARNINGS PER SHARE
We compute basic earnings per share by dividing net earnings attributable to Tesoro CorporationAndeavor stockholders by the weighted average number of common shares outstanding during the period. Diluted earnings per share include the effects of potentially dilutive shares outstanding during the period.
SHARE CALCULATIONS (in millions)
| | | | Three Months Ended March 31, | Three Months Ended June 30, | | Six Months Ended June 30, |
| | 2017 | | 2016 | 2017 | | 2016 | | 2017 | | 2016 |
| Weighted average common shares outstanding | 117.1 |
| | 119.6 |
| 130.8 |
| | 119.5 |
| | 124.0 |
| | 119.5 |
|
| Common stock equivalents | 1.0 |
| | 1.6 |
| 0.9 |
| | 1.1 |
| | 1.0 |
| | 1.3 |
|
| Total Diluted Shares | 118.1 |
| | 121.2 |
| 131.7 |
| | 120.6 |
| | 125.0 |
| | 120.8 |
|
|
| | |
| NOTES TO CONDENSED CONSOLIDATED FINANCIAL STATEMENTS (UNAUDITED) | |
Potentially dilutive common stock equivalents are excluded from the calculation of diluted earnings per share if the effect of including such securities in the calculation would have been anti-dilutive. Anti-dilutive securities were 0.30.4 million for both the three months ended March 31,June 30, 2017 and 2016.2016, respectively, and 0.3 million for both the six months ended June 30, 2017 and 2016, respectively.
SHARE REPURCHASES
We are authorized by our Board of Directors (the “Board”) to purchase shares of our common stock in open market transactions at our discretion. The Board’s authorization has no time limit and may be suspended or discontinued at any time. Purchases of our common stock can also be made to offset the dilutive effect of stock-based compensation awards and to meet our obligations under employee benefit and compensation plans, including the exercise of stock options and vesting of restricted stock and to fulfill other stock compensation requirements. There were no repurchasesDuring the six months ended June 30, 2017 and 2016, we repurchased approximately 1.6 million and 1.3 million shares of our common stock during either the three months ended March 31, 2017 or2016. During 2017, pursuant to the terms of the Merger, we are precluded from repurchasing shares under our current board authorization prior to the Merger.for approximately $148 million and $100 million, respectively.
CASH DIVIDENDS
We paid cash dividends totaling $65 million and $60$130 million for the three and six months ended March 31,June 30, 2017, and 2016, respectively, based on a $0.55 per share quarterly cash dividend on common stock. We paid cash dividends totaling $61 million and $121 million for the three and six months ended June 30, 2016, respectively, based on a $0.50 per share quarterly cash dividend on common stock, respectively.stock. On May 5,August 7, 2017, our Board declared a cash dividend of $0.55 $0.59per share payable on JuneSeptember 15, 2017 to shareholders of record on May 19,August 31, 2017.
NOTE 1011 – STOCK-BASED COMPENSATION
STOCK-BASED COMPENSATION EXPENSE (BENEFIT) (in millions)
| | | | Three Months Ended March 31, | Three Months Ended June 30, | | Six Months Ended June 30, |
| | 2017 | | 2016 | 2017 | | 2016 | | 2017 | | 2016 |
| Stock appreciation rights (a) | $ | — |
| | $ | (13 | ) | $ | — |
| | $ | (2 | ) | | $ | — |
| | $ | (15 | ) |
| Performance share awards (b) | 5 |
| | 2 |
| 3 |
| | 2 |
| | 8 |
| | 4 |
|
| Market stock units (c) | 7 |
| | 7 |
| 7 |
| | 7 |
| | 14 |
| | 14 |
|
| Other stock-based awards (d) | 2 |
| | 1 |
| 20 |
| | 4 |
| | 22 |
| | 5 |
|
| Total Stock-Based Compensation Expense (Benefit) | $ | 14 |
| | $ | (3 | ) | |
| Total Stock-Based Compensation Expense | | $ | 30 |
| | $ | 11 |
| | $ | 44 |
| | $ | 8 |
|
| |
| (a) | We had $4$6 millionand $6 million recorded in other current liabilities associated with our stock appreciation rights (“SARs”) awards at March 31, 2017 and December 31, 2016, respectively.2016. There were no SARs outstanding at June 30, 2017. We paid cash of $2$4 million to settle 0.040.1 million SARs that were exercised during the threesix months ended March 31,June 30, 2017 and $20$20 million to settle 0.3 million SARs that were exercised during the threesix months ended March 31, 2016. June 30, 2016. |
| |
| (b) | We granted 0.1 million market condition performance share awards at a weighted average grant date fair value of $118.09$118.09 per share under the amended and restated 2011 Long-Term Incentive Plan (“2011 Plan”) during the threesix months ended March 31, 2017. June 30, 2017. |
| |
| (c) | We granted 0.4 million market stock units at a weighted average grant date fair value of $107.43$107.43 per unit under the 2011 Plan during the threesix months ended March 31, 2017. June 30, 2017. |
| |
| (d) | We have aggregated expensesexpense for certain award types as they are not considered significant.significant, including awards issued by Andeavor Logistics. During the three and six months ended June 30, 2017, we recognized expense of $17 million related to pre-existing Western Refining, NTI and WNRL awards due to accelerated recognition required upon change-in-control on June 1, 2017. WNRL’s phantom units are the only pre-existing awards that have not been settled or converted to Andeavor awards. These Western Refining, NTI and WNRL awards were converted to Andeavor shares. See Note 2. |
The income tax effect recognized in the income statement for stock-based compensation was a benefit of $20$13 million and $12$6 million for the three months ended March 31,June 30, 2017 and 2016, respectively, and $33 million and $18 million for the six months ended June 30, 2017 and 2016, respectively. Included in the tax benefits for the three months ended March 31, 2017 and 2016 were $14$3 million and $13 million, respectively, of excess tax benefits from exercises and vestings that occurred during each period.for both the three months ended June 30, 2017 and 2016, and $17 million and $16 million for the six months ended June 30, 2017 and 2016, respectively. The reduction in current taxes payable recognized from tax deductions resulting from exercises and vestings under all of our stock-based compensation arrangements totaled $25$7 million and $29$6 million for the three months ended March 31,June 30, 2017 and 2016, respectively, and $32 million and $36 million for the six months ended June 30, 2017 and 2016, respectively.
All outstanding equity awards from Western Refining and NTI stock-based compensation plans were converted to Andeavor shares but remain under their respective Western Refining and NTI plans.
NOTE 1112 – OPERATING SEGMENTS
The Company’s revenues are derived from three operating segments: Marketing, Logistics and Refining. These results include the contribution from Western Refining TLLP and Marketing.for the period of June 1, 2017 to June 30, 2017. We evaluate the performance of our segments based primarily on segment operating income. Segment operating income includes those revenues and expenses that are directly attributable to management of the respective segment. The TLLPMarketing and MarketingLogistics segments include transactions with our Refining segment. Corporate depreciationThe Logistics segment results for the three and corporatesix months ended June 30, 2017, includes the contribution from (i) Andeavor Logistics and (ii) WNRL for the period of June 1, 2017 to June 30, 2017. Corporate general and administrative and depreciation expenses are excluded from segment operating income.
SEGMENT INFORMATION RELATED TO CONTINUING OPERATIONS
|
| | | | | | | | | | | | | | | |
| | Three Months Ended June 30, | | Six Months Ended June 30, |
| | 2017 | | 2016 | | 2017 | | 2016 |
| | (In millions) |
| Revenues | | | | | | | |
| Marketing: | | | | | | | |
| Fuel (a) | $ | 4,712 |
| | $ | 4,077 |
| | $ | 8,795 |
| | $ | 7,375 |
|
| Merchandise | 71 |
| | 6 |
| | 77 |
| | 12 |
|
| Other | 21 |
| | 16 |
| | 36 |
| | 30 |
|
| Logistics: | | | | | | | |
| Gathering and processing | 250 |
| | 150 |
| | 495 |
| | 312 |
|
| Terminalling and transportation | 192 |
| | 143 |
| | 367 |
| | 281 |
|
| Wholesale (b) | 165 |
| | — |
| | 165 |
| | — |
|
| Refining: | | | | | | | |
| Refined products | 6,658 |
| | 5,508 |
| | 12,470 |
| | 9,793 |
|
| Crude oil resales and other | 391 |
| | 242 |
| | 635 |
| | 453 |
|
| Intersegment sales | (4,611 | ) | | (3,857 | ) | | (8,553 | ) | | (6,870 | ) |
| Total Revenues | $ | 7,849 |
| | $ | 6,285 |
| | $ | 14,487 |
| | $ | 11,386 |
|
| Segment Operating Income | | | | | | | |
| Marketing | 236 |
| | 161 |
| | 369 |
| | 388 |
|
| Logistics (c) | 167 |
| | 118 |
| | 317 |
| | 237 |
|
| Refining (c) | 45 |
| | 527 |
| | 79 |
| | 434 |
|
| Total Segment Operating Income | 448 |
| | 806 |
| | 765 |
| | 1,059 |
|
| Corporate and unallocated costs | (228 | ) | | (88 | ) | | (350 | ) | | (162 | ) |
| Elimination and other costs | (2 | ) | | — |
| | (2 | ) | | — |
|
| Operating Income | 218 |
| | 718 |
| | 413 |
| | 897 |
|
| Interest and financing costs, net | (87 | ) | | (60 | ) | | (176 | ) | | (120 | ) |
| Equity in earnings of equity method investments | 3 |
| | 3 |
| | 3 |
| | 5 |
|
| Other income, net | 9 |
| | 25 |
| | 11 |
| | 32 |
|
| Earnings Before Income Taxes | $ | 143 |
| | $ | 686 |
| | $ | 251 |
| | $ | 814 |
|
|
| | |
| NOTES TO CONDENSED CONSOLIDATED FINANCIAL STATEMENTS (UNAUDITED) | | |
SEGMENT INFORMATION RELATED TO CONTINUING OPERATIONS
|
| | | | | | | |
| | Three Months Ended March 31, |
| | 2017 | | 2016 |
| | (In millions) |
| Revenues | | | |
| Refining: | | | |
| Refined products | $ | 5,812 |
| | $ | 4,285 |
|
| Crude oil resales and other | 244 |
| | 211 |
|
| TLLP: | | | |
| Gathering and processing | 245 |
| | 162 |
|
| Terminalling and transportation | 175 |
| | 138 |
|
| Marketing: | | | |
| Fuel (a) | 4,083 |
| | 3,298 |
|
| Other non-fuel | 21 |
| | 20 |
|
| Intersegment sales | (3,942 | ) | | (3,013 | ) |
| Total Revenues | $ | 6,638 |
| | $ | 5,101 |
|
| Segment Operating Income (Loss) | | | |
| Refining (b) | $ | 34 |
| | $ | (93 | ) |
| TLLP (b) (c) | 150 |
| | 119 |
|
| Marketing | 133 |
| | 227 |
|
| Total Segment Operating Income | 317 |
| | 253 |
|
| Corporate and unallocated costs (c) | (122 | ) | | (74 | ) |
| Operating Income | 195 |
| | 179 |
|
| Interest and financing costs, net | (89 | ) | | (60 | ) |
| Other income, net | 2 |
| | 9 |
|
| Earnings Before Income Taxes | $ | 108 |
| | $ | 128 |
|
| Depreciation and Amortization Expenses | | | |
| Refining (b) | $ | 148 |
| | $ | 148 |
|
| TLLP (b) | 58 |
| | 46 |
|
| Marketing | 13 |
| | 12 |
|
| Corporate | 7 |
| | 6 |
|
| Total Depreciation and Amortization Expenses | $ | 226 |
| | $ | 212 |
|
| Capital Expenditures | | | |
| Refining (b) | $ | 132 |
| | $ | 100 |
|
| TLLP (b) | 45 |
| | 60 |
|
| Marketing | 6 |
| | 13 |
|
| Corporate | 43 |
| | 15 |
|
| Total Capital Expenditures | $ | 226 |
| | $ | 188 |
|
|
| | | | | | | | | | | | | | | |
| | Three Months Ended June 30, | | Six Months Ended June 30, |
| | 2017 | | 2016 | | 2017 | | 2016 |
| | (In millions) |
| Depreciation and Amortization Expenses | | | | | | | |
| Marketing | $ | 14 |
| | $ | 12 |
| | $ | 27 |
| | $ | 24 |
|
| Logistics (c) | 68 |
| | 46 |
| | 126 |
| | 92 |
|
| Refining (c) | 153 |
| | 146 |
| | 301 |
| | 294 |
|
| Corporate | 7 |
| | 6 |
| | 14 |
| | 12 |
|
| Intersegment eliminations | (2 | ) | | — |
| | (2 | ) | | — |
|
| Total Depreciation and Amortization Expenses | $ | 240 |
| | $ | 210 |
| | $ | 466 |
| | $ | 422 |
|
| Capital Expenditures | | | | | | | |
| Marketing | $ | 7 |
| | $ | 6 |
| | $ | 13 |
| | $ | 19 |
|
| Logistics (c) | 49 |
| | 60 |
| | 94 |
| | 120 |
|
| Refining (c) | 154 |
| | 119 |
| | 286 |
| | 219 |
|
| Corporate | 57 |
| | 24 |
| | 100 |
| | 39 |
|
| Total Capital Expenditures | $ | 267 |
| | $ | 209 |
| | $ | 493 |
| | $ | 397 |
|
| |
| (a) | Federal and state motor fuel excise taxes on sales by our Marketing segment at retail sites where we own the inventory are included in both revenues and cost of sales in our condensed statements of consolidated operations. These taxes totaled $134$153 million and $142$148 million for the three months ended March 31,June 30, 2017 and 2016,, respectively, and $287 million and $290 million for the six months ended June 30, 2017 and 2016, respectively. |
| |
| (b) | Wholesale business obtained in the Western Refining Acquisition. |
| |
| (c) | When TLLPAndeavor Logistics acquires certain assets from our Refining segment (the “Predecessors”), the associated liabilities and results of operations of the Predecessors, as applicable, are recast as if the assets were owned by TLLPAndeavor Logistics for all periods presented. Adjusted for the historical results of the Predecessors. |
| |
(c) | We present TLLP’s segment operating income net of general and administrative expenses totaling $10 million and $8 million representing TLLP’s corporate costs for the three months ended March 31, 2017 and 2016, respectively, which are not allocated by TLLP to its operating segments.
|
IDENTIFIABLE ASSETS RELATED TO CONTINUING OPERATIONS
|
| | |
| NOTES TO CONDENSED CONSOLIDATED FINANCIAL STATEMENTS (UNAUDITED) | |
NOTE 12 – CONDENSED CONSOLIDATING FINANCIAL INFORMATION
Separate condensed consolidating financial information of Tesoro Corporation (the “Parent”), subsidiary guarantors and non-guarantors is presented below. At March 31, 2017, Tesoro and certain subsidiary guarantors have fully and unconditionally guaranteed our 4.250% Senior Notes due 2017, 5.375% Senior Notes due 2022, 4.750% Senior Notes due 2023, 5.125% Senior Notes due 2024 and 5.125% Senior Notes due 2026. TLLP, (in which we had a 33% ownership interest as of March 31, 2017, and other subsidiaries have not guaranteed these obligations. As a result of these guarantee arrangements, we are required to present the following condensed consolidating financial information, which should be read in conjunction with the accompanying condensed consolidated financial statements and notes thereto. This information is provided as an alternative to providing separate financial statements for guarantor subsidiaries. Separate financial statements of Tesoro’s subsidiary guarantors are not included because the guarantees are full and unconditional and these subsidiary guarantors are 100% owned and are jointly and severally liable for Tesoro’s outstanding senior notes. The information is presented using the equity method of accounting for investments in subsidiaries. Certain intercompany and intracompany transactions between subsidiaries are presented gross and eliminated in the consolidating adjustments column. Additionally, the results of operations of the Hawaii Businessmillions; intersegment balances have been reported as discontinued operations in these condensed consolidating statements of operations and comprehensive income for the three months ended March 31, 2017 and 2016.
CONDENSED CONSOLIDATING STATEMENT OF OPERATIONS
FOR THE THREE MONTHS ENDED MARCH 31, 2017
(In millions)eliminated)
|
| | | | | | | | | | | | | | | |
| | Parent | Guarantor Subsidiaries | Non- Guarantors | Consolidating Adjustments | Consolidated |
| Revenues | $ | — |
| $ | 7,114 |
| $ | 942 |
| $ | (1,418 | ) | $ | 6,638 |
|
| Costs and Expenses | | | | | |
| Cost of sales (excluding the lower of cost or market inventory valuation adjustment) | — |
| 6,217 |
| 551 |
| (1,342 | ) | 5,426 |
|
| Operating, general and administrative expenses | 2 |
| 694 |
| 170 |
| (76 | ) | 790 |
|
| Depreciation and amortization expenses | — |
| 164 |
| 62 |
| — |
| 226 |
|
| Loss on asset disposals and impairments | — |
| 1 |
| — |
| — |
| 1 |
|
| Operating Income (Loss) | (2 | ) | 38 |
| 159 |
| — |
| 195 |
|
| Interest and financing costs, net | (41 | ) | (9 | ) | (39 | ) | — |
| (89 | ) |
| Equity in earnings of subsidiaries | 80 |
| 63 |
| — |
| (143 | ) | — |
|
| Other income, net | — |
| — |
| 2 |
| — |
| 2 |
|
| Earnings Before Income Taxes | 37 |
| 92 |
| 122 |
| (143 | ) | 108 |
|
| Income tax expense (benefit) (a) | (13 | ) | 6 |
| 28 |
| — |
| 21 |
|
| Net Earnings | 50 |
| 86 |
| 94 |
| (143 | ) | 87 |
|
| Less: Net earnings from continuing operations attributable to noncontrolling interest | — |
| — |
| 37 |
| — |
| 37 |
|
| Net Earnings Attributable to Tesoro Corporation | $ | 50 |
| $ | 86 |
| $ | 57 |
| $ | (143 | ) | $ | 50 |
|
| | | | | | |
| Comprehensive Income | | | | | |
| Total comprehensive income | $ | 50 |
| $ | 86 |
| $ | 94 |
| $ | (143 | ) | $ | 87 |
|
| Less: Noncontrolling interest in comprehensive income | — |
| — |
| 37 |
| — |
| 37 |
|
| Comprehensive Income Attributable to Tesoro Corporation | $ | 50 |
| $ | 86 |
| $ | 57 |
| $ | (143 | ) | $ | 50 |
|
| |
(a) | The income tax expense (benefit) reflected in each column does not include any tax effect of the equity in earnings from corporate subsidiaries, but does include the tax effect of the corporate partners’ share of partnership income. |
|
| | |
NOTES TO CONDENSED CONSOLIDATED FINANCIAL STATEMENTS (UNAUDITED) | | |
CONDENSED CONSOLIDATING STATEMENT OF OPERATIONS
FOR THE THREE MONTHS ENDED MARCH 31, 2016
(In millions)
|
| | | | | | | | | | | | | | | |
| | Parent | Guarantor Subsidiaries | Non- Guarantors | Consolidating Adjustments | Consolidated |
| Revenues | $ | — |
| $ | 5,377 |
| $ | 857 |
| $ | (1,133 | ) | $ | 5,101 |
|
| Costs and Expenses | | | | | |
| Cost of sales (excluding the lower of cost or market inventory valuation adjustment) | — |
| 4,369 |
| 545 |
| (1,048 | ) | 3,866 |
|
| Lower of cost or market inventory valuation adjustment | — |
| 146 |
| 1 |
| — |
| 147 |
|
| Operating, general and administrative expenses | 1 |
| 603 |
| 174 |
| (85 | ) | 693 |
|
| Depreciation and amortization expenses | — |
| 154 |
| 58 |
| — |
| 212 |
|
| Loss on asset disposals and impairments | — |
| 3 |
| 1 |
| — |
| 4 |
|
| Operating Income (Loss) | (1 | ) | 102 |
| 78 |
| — |
| 179 |
|
| Interest and financing costs, net | (14 | ) | (16 | ) | (30 | ) | — |
| (60 | ) |
| Equity in earnings of subsidiaries | 71 |
| 46 |
| — |
| (117 | ) | — |
|
| Other income (loss), net | — |
| (1 | ) | 10 |
| — |
| 9 |
|
| Earnings Before Income Taxes | 56 |
| 131 |
| 58 |
| (117 | ) | 128 |
|
| Income tax expense (benefit) (a) | (2 | ) | 30 |
| 2 |
| — |
| 30 |
|
| Net Earnings from Continuing Operations | 58 |
| 101 |
| 56 |
| (117 | ) | 98 |
|
| Earnings from discontinued operations, net of tax | 11 |
| — |
| — |
| — |
| 11 |
|
| Net Earnings | 69 |
| 101 |
| 56 |
| (117 | ) | 109 |
|
| Less: Net earnings from continuing operations attributable to noncontrolling interest | — |
| — |
| 40 |
| — |
| 40 |
|
| Net Earnings Attributable to Tesoro Corporation | $ | 69 |
| $ | 101 |
| $ | 16 |
| $ | (117 | ) | $ | 69 |
|
| | | | | | |
| Comprehensive Income | | | | | |
| Total comprehensive income (b) | $ | 59 |
| $ | 101 |
| $ | 56 |
| $ | (117 | ) | $ | 99 |
|
| Less: Noncontrolling interest in comprehensive income | — |
| — |
| 40 |
| — |
| 40 |
|
| Comprehensive Income Attributable to Tesoro Corporation | $ | 59 |
| $ | 101 |
| $ | 16 |
| $ | (117 | ) | $ | 59 |
|
|
| | | | | | | |
| | June 30,
2017 | | December 31,
2016 |
| Marketing (a) | $ | 1,889 |
| | $ | 1,295 |
|
| Logistics (a) | 8,832 |
| | 5,759 |
|
| Refining (a) | 15,280 |
| | 10,350 |
|
| Corporate | 1,028 |
| | 2,994 |
|
| Total Assets (a) | $ | 27,029 |
| | $ | 20,398 |
|
| |
| (a) | The income tax expense (benefit) reflected in each column does not include any tax effect of the equity in earnings from corporate subsidiaries, but does include the tax effect of the corporate partners’ share of partnership income.Increase primarily related to Western Refining Acquisition. See Note 2. |
| |
(b) | Accumulated other comprehensive income decreased $10 million, net of tax, due to the recognition of a settlement loss for one of our executive retirement plans and remeasurement of the pension liability in the three months ended March 31, 2016.
|
|
| | |
| NOTES TO CONDENSED CONSOLIDATED FINANCIAL STATEMENTS (UNAUDITED) | |
CONDENSED CONSOLIDATING BALANCE SHEET
AS OF MARCH 31, 2017
(In millions)
|
| | | | | | | | | | | | | | | |
| | Parent | Guarantor Subsidiaries | Non- Guarantors | Consolidating Adjustments | Consolidated |
| ASSETS | | | | | |
| Current Assets | | | | | |
| Cash and cash equivalents | $ | — |
| $ | 2,220 |
| $ | 78 |
| $ | — |
| $ | 2,298 |
|
| Receivables, net of allowance for doubtful accounts | — |
| 843 |
| 164 |
| — |
| 1,007 |
|
| Short-term receivables from affiliates | — |
| 5 |
| 15 |
| (20 | ) | — |
|
| Inventories | — |
| 2,441 |
| 183 |
| — |
| 2,624 |
|
| Prepayments and other current assets | 47 |
| 262 |
| 23 |
| — |
| 332 |
|
| Total Current Assets | 47 |
| 5,771 |
| 463 |
| (20 | ) | 6,261 |
|
| Property, Plant and Equipment, Net | — |
| 6,271 |
| 4,332 |
| — |
| 10,603 |
|
| Investment in Subsidiaries | 9,310 |
| 805 |
| — |
| (10,115 | ) | — |
|
| Long-Term Receivables from Affiliates | 3,322 |
| — |
| — |
| (3,322 | ) | — |
|
| Long-Term Intercompany Note Receivable | — |
| — |
| 2,386 |
| (2,386 | ) | — |
|
| Acquired Intangibles, Net | — |
| 322 |
| 1,091 |
| — |
| 1,413 |
|
| Other Noncurrent Assets, Net | 50 |
| 1,224 |
| 520 |
| (2 | ) | 1,792 |
|
| Total Assets | $ | 12,729 |
| $ | 14,393 |
| $ | 8,792 |
| $ | (15,845 | ) | $ | 20,069 |
|
| |
|
|
|
|
|
|
|
|
|
|
| LIABILITIES AND EQUITY |
|
|
|
|
|
|
| Current Liabilities | | | | | |
| Accounts payable | $ | 1 |
| $ | 1,442 |
| $ | 201 |
| $ | — |
| $ | 1,644 |
|
| Short-term payables to affiliates | — |
| 15 |
| 5 |
| (20 | ) | — |
|
| Current maturities of debt | 450 |
| 14 |
| 1 |
| — |
| 465 |
|
| Other current liabilities | 113 |
| 674 |
| 157 |
| — |
| 944 |
|
| Total Current Liabilities | 564 |
| 2,145 |
| 364 |
| (20 | ) | 3,053 |
|
| Long-Term Payables to Affiliates | — |
| 3,029 |
| 293 |
| (3,322 | ) | — |
|
| Deferred Income Taxes | 1,492 |
| 2 |
| 1 |
| (2 | ) | 1,493 |
|
| Debt, Net of Unamortized Issuance Costs | 2,322 |
| 91 |
| 3,765 |
| — |
| 6,178 |
|
| Long-Term Intercompany Note Payable | 2,386 |
| — |
| — |
| (2,386 | ) | — |
|
| Other Noncurrent Liabilities | 479 |
| 472 |
| 60 |
| — |
| 1,011 |
|
| Equity-Tesoro Corporation | 5,486 |
| 8,654 |
| 1,461 |
| (10,115 | ) | 5,486 |
|
| Equity-Noncontrolling Interest | — |
| — |
| 2,848 |
| — |
| 2,848 |
|
| Total Liabilities and Equity | $ | 12,729 |
| $ | 14,393 |
| $ | 8,792 |
| $ | (15,845 | ) | $ | 20,069 |
|
|
| | |
| | | March 31,June 30, 2017 | 19
|
|
| | |
NOTES TO CONDENSED CONSOLIDATED FINANCIAL STATEMENTS (UNAUDITED) | | |
CONDENSED CONSOLIDATING BALANCE SHEET
AS OF DECEMBER 31, 2016
(In millions)
|
| | | | | | | | | | | | | | | |
| | Parent | Guarantor Subsidiaries | Non- Guarantors | Consolidating Adjustments | Consolidated |
| ASSETS | | | | | |
| Current Assets | | | | | |
| Cash and cash equivalents | $ | — |
| $ | 2,576 |
| $ | 719 |
| $ | — |
| $ | 3,295 |
|
| Receivables, net of allowance for doubtful accounts | 10 |
| 882 |
| 216 |
| — |
| 1,108 |
|
| Short-term receivables from affiliates | — |
| 171 |
| 28 |
| (199 | ) | — |
|
| Inventories | — |
| 2,321 |
| 319 |
| — |
| 2,640 |
|
| Prepayments and other current assets | 50 |
| 298 |
| 23 |
| — |
| 371 |
|
| Total Current Assets | 60 |
| 6,248 |
| 1,305 |
| (199 | ) | 7,414 |
|
| Property, Plant and Equipment, Net | — |
| 6,183 |
| 3,793 |
| — |
| 9,976 |
|
| Investment in Subsidiaries | 9,201 |
| 785 |
| — |
| (9,986 | ) | — |
|
| Long-Term Receivables from Affiliates | 3,326 |
| — |
| — |
| (3,326 | ) | — |
|
| Long-Term Intercompany Note Receivable | — |
| — |
| 2,386 |
| (2,386 | ) | — |
|
| Acquired Intangibles, Net | — |
| 329 |
| 948 |
| — |
| 1,277 |
|
| Other Noncurrent Assets, Net | 46 |
| 1,138 |
| 549 |
| (2 | ) | 1,731 |
|
| Total Assets | $ | 12,633 |
| $ | 14,683 |
| $ | 8,981 |
| $ | (15,899 | ) | $ | 20,398 |
|
| | | | | | |
| LIABILITIES AND EQUITY | | | | | |
| Current Liabilities | | | | | |
| Accounts payable | $ | 6 |
| $ | 1,762 |
| $ | 264 |
| $ | — |
| $ | 2,032 |
|
| Short-term payables to affiliates | — |
| 28 |
| 171 |
| (199 | ) | — |
|
| Current maturities of debt | 450 |
| 14 |
| 1 |
| — |
| 465 |
|
| Other current liabilities | 98 |
| 853 |
| 106 |
| — |
| 1,057 |
|
| Total Current Liabilities | 554 |
| 2,657 |
| 542 |
| (199 | ) | 3,554 |
|
| Long-Term Payables to Affiliates | — |
| 3,074 |
| 252 |
| (3,326 | ) | — |
|
| Deferred Income Taxes | 1,428 |
| 2 |
| — |
| (2 | ) | 1,428 |
|
| Debt, Net of Unamortized Issuance Costs | 2,321 |
| 94 |
| 4,053 |
| — |
| 6,468 |
|
| Long-Term Intercompany Note Payable | 2,386 |
| — |
| — |
| (2,386 | ) | — |
|
| Other Noncurrent Liabilities | 479 |
| 289 |
| 53 |
| — |
| 821 |
|
| Equity-Tesoro Corporation | 5,465 |
| 8,567 |
| 1,419 |
| (9,986 | ) | 5,465 |
|
| Equity-Noncontrolling Interest | — |
| — |
| 2,662 |
| — |
| 2,662 |
|
| Total Liabilities and Equity | $ | 12,633 |
| $ | 14,683 |
| $ | 8,981 |
| $ | (15,899 | ) | $ | 20,398 |
|
|
| | |
| NOTES TO CONDENSED CONSOLIDATED FINANCIAL STATEMENTS (UNAUDITED)MANAGEMENT’S DISCUSSION AND ANALYSIS | |
CONDENSED CONSOLIDATING STATEMENT OF CASH FLOWS
FOR THE THREE MONTHS ENDED MARCH 31, 2017
(In millions)
|
| | | | | | | | | | | | | | | |
| | Parent | Guarantor Subsidiaries | Non- Guarantors | Consolidating Adjustments | Consolidated |
| Cash Flows From (Used In) Operating Activities | | | | | |
| Net cash from (used in) operating activities | $ | 36 |
| $ | (208 | ) | $ | 359 |
| $ | (87 | ) | $ | 100 |
|
| Cash Flows From (Used In) Investing Activities | | | | | |
| Capital expenditures | — |
| (200 | ) | (58 | ) | — |
| (258 | ) |
| Acquisitions, net of cash | — |
| — |
| (672 | ) | — |
| (672 | ) |
| Intercompany notes, net | 57 |
| — |
| — |
| (57 | ) | — |
|
| Investment in subsidiaries | — |
| (24 | ) | — |
| 24 |
| — |
|
| Other investing activities | — |
| 1 |
| — |
| — |
| 1 |
|
| Net cash from (used in) investing activities | 57 |
| (223 | ) | (730 | ) | (33 | ) | (929 | ) |
| Cash Flows From (Used In) Financing Activities | | | | | |
| Borrowings under revolving credit agreements | — |
| — |
| 44 |
| — |
| 44 |
|
| Repayments on revolving credit agreements | — |
| — |
| (334 | ) | — |
| (334 | ) |
| Repayments of debt | — |
| (3 | ) | — |
| — |
| (3 | ) |
| Dividend payments | (65 | ) | — |
| — |
| — |
| (65 | ) |
| Net proceeds from issuance of Tesoro Logistics LP common units | — |
| — |
| 281 |
| — |
| 281 |
|
| Distributions by Tesoro Logistics LP to noncontrolling interest | — |
| — |
| (63 | ) | — |
| (63 | ) |
| Taxes paid related to net share settlement of equity awards | (22 | ) | — |
| — |
| — |
| (22 | ) |
| Net intercompany borrowings (repayments) | — |
| 78 |
| (135 | ) | 57 |
| — |
|
| Contribution by parent | — |
| — |
| 24 |
| (24 | ) | — |
|
| Distributions to affiliates | — |
| — |
| (87 | ) | 87 |
| — |
|
| Other financing activities | (6 | ) | — |
| — |
| — |
| (6 | ) |
| Net cash from (used in) financing activities | (93 | ) | 75 |
| (270 | ) | 120 |
| (168 | ) |
| Decrease in Cash And Cash Equivalents | — |
| (356 | ) | (641 | ) | — |
| (997 | ) |
| Cash and Cash Equivalents, Beginning of Period | — |
| 2,576 |
| 719 |
| — |
| 3,295 |
|
| Cash and Cash Equivalents, End of Period | $ | — |
| $ | 2,220 |
| $ | 78 |
| $ | — |
| $ | 2,298 |
|
|
| | |
NOTES TO CONDENSED CONSOLIDATED FINANCIAL STATEMENTS (UNAUDITED) | | |
CONDENSED CONSOLIDATING STATEMENT OF CASH FLOWS
FOR THE THREE MONTHS ENDED MARCH 31, 2016
(In millions)
|
| | | | | | | | | | | | | | | |
| | Parent | Guarantor Subsidiaries | Non- Guarantors | Consolidating Adjustments | Consolidated |
| Cash Flows From (Used In) Operating Activities | | | | | |
| Net cash from (used in) operating activities | $ | 26 |
| $ | (146 | ) | $ | 363 |
| $ | (59 | ) | $ | 184 |
|
| Cash Flows From (Used In) Investing Activities | | | | | |
| Capital expenditures | — |
| (128 | ) | (89 | ) | — |
| (217 | ) |
| Acquisitions, net of cash | — |
| — |
| (314 | ) | — |
| (314 | ) |
| Intercompany notes, net | 373 |
| — |
| — |
| (373 | ) | — |
|
| Investment in subsidiaries | (319 | ) | (45 | ) | — |
| 364 |
| — |
|
| Other investing activities | — |
| — |
| (4 | ) | — |
| (4 | ) |
| Net cash from (used in) investing activities | 54 |
| (173 | ) | (407 | ) | (9 | ) | (535 | ) |
| Cash Flows From (Used In) Financing Activities | | | | | |
| Borrowings under revolving credit agreements | — |
| — |
| 297 |
| — |
| 297 |
|
| Repayments on revolving credit agreements | — |
| — |
| (67 | ) | — |
| (67 | ) |
| Repayments of debt | — |
| (1 | ) | (251 | ) | — |
| (252 | ) |
| Dividend payments | (60 | ) | — |
| — |
| — |
| (60 | ) |
| Net proceeds from issuance of Tesoro Logistics LP common units | — |
| — |
| 5 |
| — |
| 5 |
|
| Distributions by Tesoro Logistics LP to noncontrolling interest | — |
| — |
| (48 | ) | — |
| (48 | ) |
| Taxes paid related to net share settlement of equity awards | (20 | ) | — |
| — |
| — |
| (20 | ) |
| Net intercompany borrowings (repayments) | — |
| (175 | ) | (198 | ) | 373 |
| — |
|
| Contribution by parent | — |
| — |
| 364 |
| (364 | ) | — |
|
| Distributions to affiliates | — |
| — |
| (59 | ) | 59 |
| — |
|
| Other financing activities | — |
| — |
| (7 | ) | — |
| (7 | ) |
| Net cash from (used in) financing activities | (80 | ) | (176 | ) | 36 |
| 68 |
| (152 | ) |
| Decrease in Cash And Cash Equivalents | — |
| (495 | ) | (8 | ) | — |
| (503 | ) |
| Cash and Cash Equivalents, Beginning of Period | — |
| 895 |
| 47 |
| — |
| 942 |
|
| Cash and Cash Equivalents, End of Period | $ | — |
| $ | 400 |
| $ | 39 |
| $ | — |
| $ | 439 |
|
|
| | |
| | MANAGEMENT’S DISCUSSION AND ANALYSIS |
ITEM 2. MANAGEMENT’S DISCUSSION AND ANALYSIS OF FINANCIAL CONDITION AND RESULTS OF OPERATIONS
| |
| ITEM 2. | MANAGEMENT’S DISCUSSION AND ANALYSIS OF FINANCIAL CONDITION AND RESULTS OF OPERATIONS |
Those statements in this section that are not historical in nature should be deemed forward-looking statements that are inherently uncertain. See “Important Information Regarding Forward-Looking Statements” for a discussion of the factors that could cause actual results to differ materially from those projected in these statements. This section should be read in conjunction with Management’s Discussion and Analysis of Financial Condition, Results of Operations and Glossary of Terms in our Annual Report on Form 10-K for the year ended December 31, 2016.
BUSINESS STRATEGY AND OVERVIEW
OVERVIEWWe are the leading integrated refining, marketing and logistics company in our strategic foot print and are driven to create value by operating an integrated business model. Our diversified and integrated portfolio of assets and operations provides us with strong growth opportunities across our value chains.
In recent years,On June 1, 2017, we acquired Western Refining, Inc. (“Western Refining”) and controlling interest in Western Refining Logistics LP (“WNRL”) (the “Western Refining Acquisition” or the “Merger”). This transformational acquisition provides:
| |
| • | three retail and convenience store brands (Giant®, SUPERAMERICA® and Howdy’s®) to serve a broader customer base and regional preferences; |
an extensive and complementary logistics network with access to advantaged crude oil basins, including the Permian Basin; and
three refineries located in Texas, New Mexico and Minnesota with a total refining capacity of approximately 262 thousand barrels per day (“Mbpd”).
The Western Refining Acquisition aligns with our Strategic Priorities as we drive to world class operational efficiencies and effectiveness, deliver value through optimizing our value chains and improving our financial discipline. Additionally, it furthers the transformation we have implemented strategies to drive improvementsinthebusinessthrough growth and productivity efforts. Identifying new value creation opportunities to grow the company is core to our strategy. Our continued successful execution has resulted in a transformation of the company and also the composition of our portfolio of refining, logistics and marketing businesses. undergone since 2010.
In 2010, the majority of our operating income was generated through our Refining segment with only a small portion attributable to our previous retail segment, and we did not have significant third party logistics operations. However, in recent years, we have successfully implemented strategies to drive operational productivity improvements, organic growth and portfolio enhancing acquisitions. Identifying new value creation opportunities to grow the Company is core to our strategy. Our focused execution of this strategy has resulted in a transformation of the Company into a highly integrated, well
diversified marketing, logistics and refining business. As of 2017, Tesoro Logistics, LP (“TLLP”) has grown significantly, and our Marketing segment continues to expand at a steady rate asand Andeavor Logistics LP (“Andeavor Logistics”) has grown significantly resulting in each having a percentage oflarger and more balanced contribution to our consolidated operating income.results. We believe our integrated business model positionscoupled with our Guiding Principles and Strategic Priorities will position us to create the mostleading value for shareholders by optimization of each of our value chains in each region through growth and productivity efforts and how we execute our commercial optimization efforts. In addition to organically growing the business and driving improvements through optimization and productivity, high return growth through acquisition is also a key element of our strategy.investors.
WESTERN REFINING ACQUISITION. On November 16, 2016, Tesoro entered into an Agreement and Plan of Merger with Western Refining, Inc. (“Western Refining”) and other Tesoro wholly-owned subsidiaries (the “Merger”). Western Refining has:
three refineries in Texas, New Mexico and Minnesota with a total refining capacity of approximately 254 thousand barrels per day (“Mbpd”), which would expand the combined company’s operational capabilities and improve our access to advantaged crude oil and extended product regions;
three premium and value retail and convenience store brands to serve a broader customer base and regional preferences; and
an extensive and complementary logistics network with access to advantaged crude oil basins, including the Permian Basin.
The completion of the Merger is expected in the second quarter of 2017, subject to the satisfaction or waiver of certain customary closing conditions, including the expiration or
termination of the waiting period applicable under the Hart-Scott-Rodino Antitrust Improvements Act of 1976. On March 24, 2017, the shareholders for both companies approved the Merger. We believe the Merger aligns with the strategic objectives for our refining, marketing and logistics businesses, which are discussed below. The transaction was valued at approximately $4.1 billion, consisting of stock and cash consideration, as disclosed in the registration statement on Form S-4, which was declared effective February 16, 2017. See Note 1 in Part I, Item 1 for more details about the Merger.
STRATEGY AND GOALS
As the leading integrated refining, marketing and logistics company in our strategic foot print, we are driven to create value by driving significant business improvements to provide for sustainable earnings growth, utilizing a disciplined approach to capital allocation to create significant long-term shareholder value and consistently executing on our goals in the delivery of results. Our diversified and integrated portfolio of assets and operations provides us with strong growth opportunities across the refining, marketing and logistics value chains. The following discussion outlines how we create value in each of our business segments and across our integrated businesses.
REFINING. In our Refining segment, our strategy focuses on creating the safest and beyond compliant operations, driving operational excellence enabling asset availability in excess of 97%, maintaining strict operating cost discipline, enhancing capital efficiency through superior execution and maximizing capital productivity through process optimization including our ability to access regionally advantaged crude oil. To meet our strategic objectives, we invest in high return capital projects designed to enhance our feedstock flexibility, improve our yields and lower our costs.
TLLP. Through our ownership of TLLP and TLLP’s continued growth, we expect our logistics assets and in-region placement to minimize our transportation costs and maximize our overall performance by focusing on a stable, fee-based business, optimizing its existing asset base, pursuing organic expansion opportunities and growing through strategic acquisitions. Additionally, our ownership in TLLP creates value to our shareholders through the lower cost of capital available to TLLP as a limited partnership, our receipt of TLLP’s quarterly
|
| | |
MANAGEMENT’S DISCUSSION AND ANALYSIS | | |
distributions, including amounts attributable to our incentive distribution rights, and through the sale of logistics assets to TLLP. For example, we received $77 millionin distributions from TLLP during the three months ended March 31, 2017 (“2017 Quarter”) compared to $50 million in the three months ended March 31, 2016 (“2016 Quarter”). We believe TLLP is well positioned to achieve its primary business objectives and execute business strategies based on its long-term fee-based contracts, relationship with us, strategically positioned assets and financial flexibility provided by its balanced capital structure, revolving credit facility capacity, dropdown credit facility, ability to access equity capital markets through its continuous issuance program and financial support from us.
MARKETING. Our marketing assets provide a secure and ratable offtake of gasoline and diesel production from our refineries. We are driving growth and improvements in our Marketing segment by focusing on higher value, branded distribution channels, adding new retail sites to our network, and implementing store improvements, to enhance our convenience store position.OUR CULTURE
GUIDING PRINCIPLES. Underpinning our strategy and goalsgoal execution for all of our businesses is a high performing culture where employees lead according to our guiding principlesGuiding Principles and hashave the opportunity to make a difference. These guiding principlesGuiding Principles are as follows:
CORE VALUES – We act individually and collectively with the highest level of integrity and we are steadfast in our commitment to safety, health and the environment.
EXCEPTIONAL PEOPLE – We employ the best people and develop our capabilities and leadership to realize our objectives.
SHARED PURPOSE – Everyone clearly understands and owns our vision, strategy, how they fit and what they are expected to contribute.
POWERFUL COLLABORATION – We leverage the power of collaboration and our individual and collective expertise to create value and competitive advantage.
SUPERIOR EXECUTION – We pursue and deliver our objectives with energy, passion and a sense of urgency to deliver industry-leading results.
STRATEGIC PRIORITIES.By following our guiding principles,Guiding Principles, we aim to achieve our strategic priorities that are focused on the delivery of operational efficiency and effectiveness, value chain optimization, financial discipline, and value-driven growth.Strategic Priorities outlined below. In addition, we take a principles-based approach to conducting our business, seeking to create shared value for key stakeholders including employees, communities, business partners, government and the environment.
|
| | |
| MANAGEMENT’S DISCUSSION AND ANALYSIS |
|
| | | | | | | | |
| STRATEGIC PRIORITIES | | | | | | | |
| | | | OPERATIONAL EFFICIENCY & EFFECTIVENESS continuously improving safety, compliance, reliability, system improvements and cost leadership | |
| | | | | | |
| | | | | | |
HIGH PERFORMING CULTURE
fostering a culture that is committed to building leadership at all levels of the organization and across our value chain with employees from diverse backgrounds and experiences while being firmly grounded in our guiding principles | | | | | | | |
| | | | VALUE CHAIN OPTIMIZATION enhancing margin capture through our supply and trading activities, optimization of our integrated businesses and customer focus | |
| | | | |
| | | | |
| | | | | | | |
| | | | | | | |
| | | | | | | |
| | | | FINANCIAL DISCIPLINE maintaining a strong financial position by exercising capital discipline and focusing on a balanced use of free cash flow | |
| | | | |
| | | | |
| | | | | | | |
| | | | | | VALUE-DRIVEN GROWTH extending our capabilities and growing earnings through growth in our logistics and marketing businesses and other strategic opportunities accretive to shareholder value | |
| | | | | | |
| | | | | | |
| | | | | | | | |
OUR STRATEGY AND GOALS
Execution of our strategy and the achievement of our goals across our business segments is driven by our commitment to our Guiding Principles and Strategic Priorities. The following discussion outlines how we create value in each of our business segments and across our integrated businesses.
MARKETING. Our marketing operations provide a secure and ratable offtake of gasoline and diesel production from our refineries and allow us to enhance our margin capture as refined product moves through the value chain. We are driving growth and improvements in our Marketing segment by focusing on higher value, branded distribution channels, adding new retail sites to our network and implementing store improvements to enhance our convenience store position.
With the closing of the Western Refining Acquisition, we have added 544 stores to our branded network, including 457 company-owned, company-operated stores, bringing our total store count to 3,073 stores. These stores will further drive volumes through higher-value, branded channels thus maximizing capture of margin downstream within the value chain.
LOGISTICS.Our Logistics segment includes assets that establish a market position that helps to minimize our transportation costs as well as maximize our overall performance by focusing on a stable, fee-based business. We achieve value by optimizing our existing asset base, pursuing organic expansion opportunities and growing through strategic acquisitions across three business lines: Gathering and Processing, Terminalling and Transportation and Wholesale.
Additionally, our ownership in Andeavor Logistics and WNRL creates value to our shareholders through the lower cost of capital, our receipt of quarterly distributions, including amounts attributable to our incentive distribution rights, and through the sale of logistics assets to Andeavor Logistics. For example, we received $71 million and $59 million in distributions from Andeavor Logistics during the three months ended June 30, 2017 (“2017 Quarter”) and 2016 (“2016 Quarter”), respectively, and $148 million and $109 million in distributions
from Andeavor Logistics during the six months ended June 30, 2017 (“2017 Period”) and 2016 (“2016 Period”), respectively.
During the quarter, Andeavor indicated it had authorized management to work with the board of directors and management of Andeavor Logistics to consider and begin to negotiate a merger of Andeavor Logistics and WNRL and changes to the capital structure of Andeavor Logistics with respect to the incentive distribution rights (“IDRs”).
After evaluating many options related to the IDRs, both Andeavor and Andeavor Logistics’ preferred approach is to pursue a buy-in in exchange for common units. The transactions require approval of the board of directors of all three companies as well as the conflicts committees of both Andeavor Logistics and WNRL.
REFINING. In our Refining segment, our strategy focuses on:
driving operational excellence enabling asset
availability in excess of 97%;
•maintaining strict operating cost discipline;
enhancing capital efficiency through superior execution; and
maximizing capital productivity through process optimization including our ability to access regionally advantaged crude oil.
To meet our strategic objectives, we invest in high return capital projects designed to enhance our feedstock flexibility, improve our yields and lower our costs. In addition to the above strategies and goals, we aim to execute on our strategic priorities to further create value for our shareholders through the achievement of annual improvements to operating income and the capturing of synergies associated with the Western Refining Acquisition.
|
| | |
| MANAGEMENT’S DISCUSSION AND ANALYSIS | |
IMPROVEMENTS TO OPERATING INCOME.Our plans, as presented in November 2016, are to deliver $475 to $575 million of improvements to operating income during 2017, which is comprised of $395 to $475 million of growth and productivity and $80 to $100 million of higher throughput and other operational improvements. These improvements consist of $45 to $70 million in Marketing, $125 to $150 million in Logistics and $305 to $355 million in Refining. In addition to these improvements, we outlined market assumptions for 2017, which have not changed, and include fuel margins of 11 to 14 cents per gallon in our Marketing segment and an Tesoro Index of $12 to $14 per throughput barrel in our Refining segment. All of these improvements exclude any expected synergies from the Western acquisition.
Through the first half of the year, the Company has delivered approximately 50% to 55% of the improvements.
Estimated Marketing and Logistics improvements are trending above their ranges, however, estimated Refining and throughput improvements are trending slightly below the range.
SYNERGIES.Concurrent with the closing of the Western Refining Acquisition, we outlined expected synergies of $350 to $425 million on an annual basis with this run rate expected to be achieved by June 2019, the second year following the closing of the transaction. This includes approximately $120 to $160 million from value chain optimization, $130 to $140 million from operational improvements and $100 to $125 million from corporate efficiencies. Andeavor estimates it has realized approximately $80 million in annual synergies as of August 8, 2017, consisting primarily of approximately $70 million of Corporate Efficiencies and the remainder in Value Chain Optimization and Operational Improvements.
Our goals wereare focused on these strategic prioritiesStrategic Priorities and, thus far, we have accomplished the following in 2017:
|
| | | | | | | | | | |
| | | Operational Efficiency & Effectiveness | | Value Chain Optimization | | Financial Discipline | | Value Driven Growth | | High Performing Culture |
SAFETY.Our Anacortes refinery received the “Gold Distinguished Safety Award” from the American Fuel & Petrochemical Manufacturers. Our Salt Lake City refinery achieved two years with zero process safety incidents. | | ü | | | | | | | | ü |
TLLPWESTERN REFINING ACQUISITION. On June 1, 2017, we completed the previously announced acquisition of Western Refining for approximately $4.0 billion.
| | | | ü | | ü | | ü | | |
NORTH DAKOTA LOGISTICS ACQUISITION.On January 1, 2017, TLLPAndeavor Logistics completed its previously announced acquisition of crude oil, natural gas and produced water gathering pipelines and two processing facilities in the Bakken Region of North Dakota for $705 million. | | | | ü | | ü | | ü | | |
RECOGNITION. JOINT DEVELOPMENT AGREEMENT.Our Anacortes refinery On May 24, 2017, we announced our joint development agreement with EP Energy Corporation to fund oil and natural gas development in the Uinta Basin of Utah. We also entered into a multi-year Crude Oil Supply Agreement with EP Energy Corporation for yellow and black waxy crude oil to supply our Salt Lake City Refinery.
| | ü | | ü | | ü | | | | |
RETURNING MONEY TO SHAREHOLDERS. We purchased 1.6 million shares of our common stock and paid $0.55 per share dividends, returning $278 million in the first half of 2017. | | | | | | ü | | | | |
INVESTMENT GRADE. We received investment grade rating from Fitch, S&P and Moody’s providing us with incremental operational and financial flexibility. | | | | | | ü | | | | |
MEXICOOPERATIONS.We entered into a new wholesale marketing agreement to supply transportation fuels and launch the ARCO brand in northwest Mexico. We also reached a definitive agreement with Petróleos Mexicanos (Pemex) to utilize logistics assets to support this operation in the region. | | | | ü | | | | ü | | |
MARKETING ACQUISITION. We acquired 39 retail stores primarily in Northern California to strengthen our value chain and to further growing our Marketing business. | | | | ü | | | | ü | | |
PROJECT PERMITS. We received the “Gold Distinguished Safety Award”permits and began construction for both the Los Angeles Refinery Integration and Compliance Project and the Anacortes Isomerization Project. | | | | ü | | | | ü | | ü |
|
| | |
| MANAGEMENT’S DISCUSSION AND ANALYSIS |
|
| | | | | | | | | | |
| | Operational Efficiency & Effectiveness | | Value Chain Optimization | | Financial Discipline | | Value Driven Growth | | High Performing Culture |
DICKINSON REFINERY. We received a grant from the American Fuel & Petrochemical Manufacturers.North Dakota Industrial Commission to begin processing renewable feedstocks into diesel allowing the refinery to retrofit its existing diesel hydrotreater to be able to co-process up to 16,800 gallons per day of renewable feedstocks. | | ü | | | | | | | | ü |
TLLPANDEAVOR LOGISTICS EQUITY ISSUANCE.On February 21, 2017, TLLPAndeavor Logistics and TLGP entered into an underwriting agreement which provided for the issuance and sale of an aggregate ofTesoro Logistics GP, LLC (“TLGP”) issued 5.0 million common units representing limited partner interests in TLLP at a price of $56.19 per common unit. TLLP receivedunit receiving net proceeds from the offering of approximately $281 million and used the net proceeds to repay borrowings outstanding under the TLLP revolving credit facility and for general partnership purposes.million.
| | | | | | ü | | | | |
CURRENT MARKET CONDITIONS
DOMESTIC.Volatility in the markets within which we operate was evidenced with the price of Brent crude oil (“Brent”) in the first quarter starting near $57 per barrel and reaching a low near $50 per barrel towards the end of the quarter. Despite setting record crude stock levels in the U.S. during the period, the price of crude oil was higher than levels seen in 2016 influenced by the agreement between OPEC and non-OPEC producers to reduce production. This higher crude price led to an increase in the domestic rig count as shale oil production economics became more favorable. This increase of light sweet crude production led to additional export growth as certain refiners continued to import medium and heavy grades. In addition, supply outages and changing logistical infrastructure, as well as improving domestic macroeconomic conditions have influenced all portions of our business.
In the markets in which we operate, gasoline fundamentals on the West Coast were more constructive than the U.S. as a whole with PADD 5 gasoline stocks trending below the five year range the majority of the quarter. Similarly, PADD 5 distillate inventory levels ended the quarter near the five-year average while overall U.S. stocks ended the period far above the five-year average. In addition, we continue to see export opportunities for refined products to Latin America. Refining margins in the first quarter were within seasonal norms as high overall U.S. product stock levels weighed on improved West Coast balances. We continue to monitor U.S.
and global demand trends and the impact of changes in market prices and fundamentals on our business.
GLOBAL.Continued improvement in global macro-economic factors remains supportive to healthy refined product demand. The market for crude oil, natural gas and refined products is affected by changes in economic conditions and the associated supply and demand balance changes as well as geopolitical events which can impede trade flows. Product values and crude oil prices are generally set by the global market balances.
PERFORMANCE OBJECTIVES
ANNUAL IMPROVEMENTS TO OPERATING INCOME.Our plans, as presented in November 2016, are to deliver $475 to $575 million of annual improvements to operating income during 2017, which is comprised of $395 to $475 million of growth and productivity and $80 to $100 million of higher throughput and other operational improvements. These improvements consist of $305 to $355 million in Refining, $125 to $150 million in TLLP and $45 to $70 million in Marketing. In addition to these improvements, we outlined market assumptions for 2017, which have not changed, and include a Tesoro Index of $12 to $14 per throughput barrel in our Refining segment and fuel margins of 11 to 14 cents per gallon in our Marketing segment.
|
| | |
MANAGEMENT’S DISCUSSION AND ANALYSIS | | |
RESULTS OF OPERATIONS
Adiscussionand analysis of the factors contributing to our results of operations is presented below. The accompanying condensed consolidated financial statements, together with the following information, are intended to provide investors with a reasonable basis for assessing our historical operations, but should not serve as the only criteria for predicting our future performance.
ITEMS IMPACTING COMPARABILITY
On June 1, 2017, we closed the Western Refining Acquisition. Our results include the operations from Western Refining for the period of June 1, 2017 to June 30, 2017 and thus prior periods may not be comparable. With the Western Refining Acquisition, we have updated our segments to reflect the results and operations of Western Refining and WNRL. Our Marketing segment reflects our expanded marketing business that, combined with Western, now consists of expanded wholesale marketing operations and approximately 3,000 retail stores marketed under multiple well-known fuel brands including ARCO®, SUPERAMERICA®, Shell®, Exxon®, Mobil®, Conoco®, Tesoro®, USA GasolineTM andGiant®. Our renamed Logistics segment includes the combined results of Andeavor Logistics and WNRL. We now report the Logistics segment’s results for the combined Gathering and Processing, Terminalling and Transportation and Wholesale Marketing business lines. Our Refining segment reports the results of our refining system that now consists of ten refineries in the western United States with a combined capacity of approximately 1.2 million barrels per day. The TLLPRefining segment includes the results from Andeavor’s existing Refining segment and Western’s Refining segment, excluding third-party wholesale marketing operations that is now reported in our Marketing segment.
The Logistics segment’s financial and operational data presented include thehistoricalresultsofallassetsacquiredfromTesoro Andeavor priorto theacquisitiondates.TheacquisitionsfromTesoro Andeavor weretransfersbetweenentitiesundercommoncontrol.Accordingly, the financial information of TLLP contained herein has been retrospectively adjusted to include the historical results of the assets acquired from TesoroAndeavor prior to the effective date of each acquisition for all periods presented and do not include revenue for transactions with Tesoro.Andeavor. The TLLPLogistics segment’s financial data is derived from the combined financial results of the TLLPLogistics segment’s predecessor (the “Predecessor”). We refer to the TLLP Predecessorand,priortoeach
acquisitiondate,theacquisitions from TesoroAndeavor collectively, as “Predecessors.”
NON-GAAP MEASURES
Our management uses certain “non-GAAP” performance measures to analyze operating segment performance and non-GAAP financial measures to evaluate past performance and prospects for the future to supplement our GAAP financial information presented in accordance with accounting principles generally accepted in the United States of America (“U.S. GAAP”). These financial non-GAAP measures are important factors in assessing our operating results and profitability and include:
EBITDA—U.S.GAAP-basednetearningsbeforeinterest,incometaxes,anddepreciationandamortization expenses; and
Debt to capitalization ratio excluding TLLP—Andeavor Logistics and WNRL—the ratio achieved by dividing the net result of our consolidated debt less all debt owed by TLLPAndeavor Logistics and WNRL (both net of unamortized issuance costs) by the sum of our consolidated debt less TLLP’sAndeavor Logistics’ and WNRL’s total debt (both net of unamortized issuance costs) and our total equity less noncontrolling interest associated with the public ownership of TLLP.Andeavor Logistics and WNRL.
We present these measures because we believe they may help investors, analysts, lenders and ratings agencies analyze our results of operations and liquidity in conjunction with our U.S. GAAP results, including but not limited to:
our operating performance as compared to other publicly traded companies in the refining, logistics and marketing industries, without regard to historical cost basis or financing methods;
our ability to incur and service debt and fund capital expenditures; and
the viability of acquisitions and other capital expenditure projects and the returns on investment of various investment opportunities.
|
| | |
| MANAGEMENT’S DISCUSSION AND ANALYSIS | |
Management also uses these measures to assess internal performance, and we believe they may provide meaningful supplemental information to the users of our financial statements.performance. Non-GAAP measures have important limitations as analytical tools, because they exclude some, but not all, items that affect net earnings and operating income. These measures should not be considered substitutes for their most directly comparable U.S. GAAP financial measures.
HIGHLIGHTS - FOR THE 2017 QUARTER AND THE 2016 QUARTER (in millions)
|
| | |
| | MANAGEMENT’S DISCUSSION AND ANALYSIS |
RECONCILIATION OF NET EARNINGS TO EBITDA (in millions)
2017 COMPARED TO 2016
OVERVIEW.Our net earnings of $87 million($0.42 per diluted share) for the 2017 Quarter decreased compared to $109 million($0.57 per diluted share) for the 2016 Quarter primarily due to higher interest costs of $29 million and increased general and administrative expenses in the 2017 Quarter partially offset by increased margins in our Refining and TLLP segments. Conversely, the 2017 Quarter EBITDA increased$12 million, or 3%, to $423 million compared to the same period in 2016, in which a lower of cost or market (“LCM”) adjustment was recognized.
GROSS MARGINS.Our gross refining marginincreased$161 million during the2017 Quarter primarily due to the $147 million LCM adjustment recorded in the 2016 Quarter. With a continued volatile price environment, the impact of our lower of cost of market adjustment can vary and may increase in the future. The 24% increase in our gross refining margin per barrel also included the benefit of higher throughput in the year due to continued demand growth and the realization of business improvements and synergies. TLLP revenues, net of cost of natural gas liquid sales (“NGLs”) and operating expenses,increased$45 milliondue to the acquisition of crude oil, natural gas and produced water gatheringsystemsandnatural gas processing facilities from Whiting Oil and Gas Corporation, GBK Investments, LLC and WBI Energy Midstream, LLC (the "North Dakota Gathering and Processing Assets") in January 2017 as well as certain terminalling and storage assets owned by Tesoro (the “Alaska Storage and Terminalling Assets”) in the third quarter of 2016 and certain terminalling and storage assets (the “Northern California Terminalling and Storage Assets”) acquired in the fourth quarter of 2016. Our Marketing gross fuel margindecreased$100 millionprimarily due to a weaker margin environment in 2017 as well as 3% lower fuel sales due to an abnormally rainy winter in California.
OPERATING AND OTHER EXPENSES.Operating expenses increased $43 million to $654 millionin the 2017 Quarter compared to the 2016 Quarter primarily due to extended maintenanceatour Californiarefineries,higherenergypricesand TLLP’s acquisition of the North Dakota Gathering and Processing Assets. Similarly, depreciation and amortization expenses increased$14 millionto$226 million in the 2017 Quarter compared to the 2016 Quarter primarily due to the acquisition of the North Dakota Gathering and Processing Assets along with new assets and turnarounds placed into service since last year. General and administrative expenses increased $54 million in the 2017 Quarter compared to the 2016 Quarter largely due to training and data conversion costs associated with our Enterprise Resource Planning project along with costs associated with the Merger and higher stock-based compensation expense recorded in the 2017 Quarter compared to the 2016 Quarter.
INTEREST AND FINANCING COSTS.Interest and financing costs of $89 million in the 2017 Quarter were higher than the $60 million incurred in the 2016 Quarter due to the impact of Tesoro’s 4.75% Senior Notes Due 2023 and 5.125% Senior Notes Due 2026 that were issued in connection with the Merger as well as TLLP’s 5.25% Senior Notes due 2025, all of which were issued subsequent to the 2016 Quarter.
INCOME TAXES.Our income tax expense totaled $21 million in the 2017 Quarter compared to $30 million in the 2016 Quarter. The combined federal and state effective income tax rate was 19% and 23% during the 2017 Quarter and 2016 Quarter, respectively. The 2017 Quarter and 2016 Quarter effective income tax rates benefited from excess tax benefits related to equity compensation, which had a greater impact on the 2017 Quarter due to lower pre-tax net earnings.
|
| | |
MANAGEMENT’S DISCUSSION AND ANALYSIS | | |
SEGMENT RESULTS OF OPERATIONS

REFINING SEGMENT
HIGHLIGHTS - FOR THE 2017 QUARTER AND THE 2016 QUARTER (in millions)
We currently own and operate petroleum refineries located in the western United States and sell transportation fuels to a wide variety of customers. Our refineries produce the majority of the transportation fuels that we sell. We purchase crude oil and other feedstocks from domestic and foreign sources, including the Middle East, South America, western Africa, Canada and other locations either in the spot market or through term agreements with renewal provisions. Our Marketing segment, including its branded retail network, provides a committed outlet for the majority of the gasoline produced by our refineries; however, we also sell gasoline and gasoline blendstocks, jet fuel, diesel fuel, heavy fuel oils and residual products in bulk and opportunistically export refined products to certain foreign markets.
REFINING UTILIZATION (a)
| |
(a) | Tesoro had a total refining capacity of 895 Mbpd in 2016 following the acquisition of the Dickinson refinery in June. Prior to the Dickinson refinery acquisition, Tesoro had a total refining capacity of 875 Mbpd. |
MARKET OVERVIEW.Results from our Refining segment are highly volatile and subject to many factors that are beyond our control. Revenue is not a good proxy for financial performance as the key driver of revenue is the underlying price per barrel of crude oil. Gross refining margin, refinery throughputs, crack spreads and crude oil differentials are
more useful metrics to measure the performance of the Refining segment.OVERVIEW
The gross refining margin ismarkets in which we operate are subject to market volatility through the difference between the prices of all manufactured refined products sold and the costprice of crude oil and other feedstocks used to producewe acquire for refining and the price we can sell our refined products including the cost of transportationthrough our Marketing, Logistics and distribution paid to TLLP and third parties at contractual rates. The market for crude oil and products is affected by changes in economic conditions and supply and demand balance. ProductRefining segments. Refined product values and crude oil prices are generally set by the global market balances. However, refined product demand trends and are outside ofcrude oil supplies in the U.S. and globally have a significant impact on our control. When evaluatingbusiness.
REFINED PRODUCTS. Globally, continued improvement in global macro-economic factors remains supportive to healthy refined product demand. In the markets in which we operate, we utilizerefined product fundamentals in the second quarter were supported by a number of planned and unplanned refinery outages in the western region. This resulted in PADD 5 refinery production receding from their peak at the start of the quarter to finish the period below the five-year average contributing to the PADD 5 refined product stocks ending the quarter near the five-year average. However, the overall U.S. refined products stock level remained more well-supplied. We continue to see attractive export opportunities for refined products to Latin America due to their persistent low refinery utilization rates.
LOGISTICS.Although our Logistics segment generally does not have commodity exposure, during the second quarter, the pricing market for the commodities our Logistics segment handles was mixed. Crude oil, natural gas and refined products pricing fell while natural gas liquids (“NGLs”) pricing rose. Lower retail prices and sound domestic economic conditions during the second quarter continued to support healthy refined product demand from our Logistics segment’s downstream and marketing customers. Despite an extension of the OPEC and non-OPEC production cuts, crude oil prices faced headwinds from ample global inventories and higher production from the U.S. Energy Information Administration and other industry sourcescountries. The U.S. oil and gas drilling productivity continues to gather supply, demand,improve with increased rig counts, premium locational drilling and enhanced completion techniques. At current prices, U.S. crude production is expected to show material growth year over year. Additionally, overall U.S. refinery utilization importwas at record levels as growing export opportunities provided an incentive to maximize production of gasoline and export information to forecastdiesel. These factors create a positive outlook for U.S. oil, gas and monitor market conditions for our operating regions. We focusrefined product throughput volumes, however, regional impacts may differ.
REFINING MARGINS. Refining margins in the second quarter were within seasonal norms as high overall U.S. gasoline stock levels weighed on PADD V, or the West Coast product balances. The market prices for crude oil and other feedstocks continued to experience significantly volatility during the quarter. The
agreement between OPEC and non-OPEC producers to extend production cuts failed to increase crude prices as stock levels remained ample. Furthermore, increased crude production in Libya, Nigeria and the U.S. helped to partially offset OPEC and non-OPEC production cuts. After reaching a high of $56 per barrel in the beginning of the U.S., wheresecond quarter, the majorityprice of Brent crude oil (“Brent”) declined to a low of $45 per barrel near the end of the quarter. Despite being reduced over 30 million barrels, largely in part to record refinery demand, U.S. inventories still remained above the five-year range. Moreover, additional increases in domestic shale crude production continued to add to light, sweet crude supply. These changes in the supply and demand of crude oil and refined products have significant impacts on the crack spreads that drive our operations are located. PADD V is defined by the Petroleum Administration for Defense Districts as the states of Alaska, Arizona, California, Hawaii, Nevada, Oregon and Washington.refining margins.
As a performance benchmark and a comparison with other industry participants, we utilizehave utilized the West Coast and Mid-Continent crack spreads. The crack spread is a measure of the difference between market prices for crude oil and refined products and is a commonly used proxy within the industry to estimate or identify trends in gross refining margins. Crack spreads can fluctuate significantly over time as a result of market conditions and supply and demand balances. The West Coast 321 crack spread is calculated using 3 barrels of Alaska North Slope crude oil (“ANS”) producing 2 barrels of Los Angeles CARB gasoline and 1 barrel of Los Angeles CARB diesel. The Mid-Continent 321 crack spread is calculated using 3 barrels of West Texas Intermediate crude oil (“WTI”) producing 2 barrels of Group 3 gasoline and 1 barrel of Group 3 diesel.
West Coast and Mid Continent crack spreads remained relatively flat during the 2017 Quarter and the 2017 Period compared to last year. The U.S. West Coast crack spread averaged $18.94 per barrel in the 2017 Quarter and $17.77 per barrel in the 2017 Period compared to $18.50 per barrel in the 2016 Quarter and $17.55 in the 2016 Period. The Mid-Continent crack spread averaged $14.35 per barrel in the 2017 Quarter and $13.75 per barrel in the 2017 Period compared to $12.95 per barrel in the 2016 Quarter and $11.75 in the 2016 Period.
|
| | |
| | MANAGEMENT’S DISCUSSION AND ANALYSIS |
Our actual gross refining margins differ from these crack spreads based on the actual slate of crude oil we run at our refineries and the products we produce. The global commodity markets for crude oil and refined products are subject to significant volatility resulting in rapidly changing prices and margin environments. Our refineries process a variety of crude oils that are sourced from around the world. The slate of crude oil we process can vary over time as a result
of changes in market prices and shipping rates. Additionally, our refining gross margin is impacted by the changing crude oil price differentials, which is the difference between the benchmark crude oils, WTI and Brent crude oil, and the actual crude oil we run at our refineries. We may experience financial risk associated with price volatility of crude oil and refined products, and we may utilize financial hedge instruments to help mitigate such risks where possible.
KEY INFORMATION USED TO MONITOR OUR BUSINESS - CRUDE OIL DIFFERENTIALS
|
| | |
| MANAGEMENT’S DISCUSSION AND ANALYSIS |
2017 2ND QUARTER VERSUS 2016 2ND QUARTER
HIGHLIGHTS (in $/barrel)millions)
Source: PLATTSPERCENTAGE OF SEGMENT OPERATING INCOME BY OPERATING SEGMENT
OPERATING INCOME RECONCILIATION BY SEGMENT (in millions)
|
| | |
| MANAGEMENT’S DISCUSSION AND ANALYSIS | |
RECONCILIATION OF NET EARNINGS TO EBITDA (in millions)
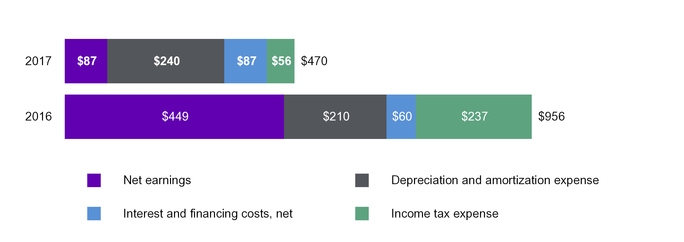
WEST COAST.OVERVIEW. Average U.S. West Coast crack spread margins remained relatively flatOur net earnings of $87 million ($0.31 per diluted share) for the 2017 Quarter decreased compared to $449 million ($3.47 per diluted share) for the 2016 Quarter driven by a $500 million decrease in operating income to $218 million and a decrease in EBITDA of $486 million, to $470 million compared to the same period in 2016. These decreases were primarily driven by reduced operating income in our Refining segment and higher corporate costs. However, these decreases were partially offset by increases in operating income for our Marketing and Logistics segments. Net earnings also benefited from lower income tax expense.
SEGMENT RESULTS.Refer to our detailed discussion of each segment’s operating and financial results contained in this section.
CORPORATE COSTS.General and administrative expenses increased $154 million in the 2017 Quarter compared to the 2016 Quarter. The ANSQuarter largely due to Bakken differential increased approximately 48% per barrelthe recognition of $61 million in acquisition costs and $63 million of integration costs associated with the Western Refining Acquisition, including $48 million of severance and equity payouts, of which $41 million was due to the change of control and $7 million of expected
severance and retention payments in future periods, as well as training and data conversion costs associated with our Enterprise Resource Planning project.
INTEREST AND FINANCING COSTS.Interest and financing costs of $87 million in the 2017 Quarter reflecting an overall lower cost for Bakken relative to ANS decreasingwere higher than the price of Bakken, which resulted in higher gross margins$60 million incurred in the Pacific Northwest. Further improving our gross margins2016 Quarter due to the impact of Andeavor’s 4.75% Senior Notes Due 2023 and 5.125% Senior Notes Due 2026 that were issued in connection with the Pacific Northwest was the 208% increase in the ANS to Canadian Light Sweet differential from the 2017 QuarterMerger as well as Andeavor Logistics’ 5.25% Senior Notes due 2025, all of which were issued subsequent to the 2016 Quarter. The ANS to San Joaquin Valley Heavy differential remained flat over the same period.
MID-CONTINENT.INCOME TAXES. Average Mid-Continent crack spread margins were up approximately 55%Our income tax expense totaled $56 million in the 2017 Quarter versuscompared to $237 million in the 2016 Quarter primarily due to lower pre-tax earnings during the 2017 Quarter. The improved margin environment alongcombined federal and state effective income tax rate was 39% and 35% during the 2017 Quarter and 2016 Quarter, respectively. The 2017 Quarter effective income tax rate was higher due to various non-recurring tax effects associated with the Western Refining Acquisition.
2017 YEAR TO DATE PERIOD VERSUS 2016 YEAR TO DATE PERIOD
HIGHLIGHTS (in millions)
|
| | |
| MANAGEMENT’S DISCUSSION AND ANALYSIS |
PERCENTAGE OF SEGMENT OPERATING INCOME BY OPERATING SEGMENT
OPERATING INCOME RECONCILIATION BY SEGMENT (in millions)
RECONCILIATION OF NET EARNINGS TO EBITDA (in millions)
|
| | |
| MANAGEMENT’S DISCUSSION AND ANALYSIS | |
OVERVIEW.Our net earnings of $174 million($0.72 per diluted share) for the 2017 Period decreased compared to $558 million ($4.03 per diluted share) for the 2016 Period driven by a $484 million decrease in operating income to $413 million and a decrease in EBITDA of $474 million to $893 million compared to the same period in 2016. These decreases were primarily driven by reduced operating income in our Refining segment, higher corporate costs, and higher interest costs. However, these decreases were partially offset by an increase in operating income for our Logistics segment and reduced tax expense associated with the lower earnings. Results for our Marketing segment were relatively flat period over period.
SEGMENT RESULTS. Refer to our detailed discussion of each segment’s operating and financial results contained in this section.
CORPORATE COSTS. General and administrative expenses increased throughput positively impacted our results$208 million in the 2017 Quarter, particularlyPeriod compared to the 2016 Period largely due to $68 million of acquisition costs and $72 million of integration costs associated with the Western Refining Acquisition, including $48 million of severance and equity payouts, of which $41 million was due to the change of control and $7 million of expected severance and retention
payments in North Dakotafuture periods, as well as training and Utah. Offsetting the improved margin environment, the WTI to Bakken differential decreased by approximately 43% per barreldata conversion costs associated with our Enterprise Resource Planning project.
INTEREST AND FINANCING COSTS.Interest and financing costs of $176 million in the 2017 Quarter increasingPeriod were higher than the price$120 million incurred in the 2016 Period due to the impact of Bakken relativeAndeavor’s 4.75% Senior Notes Due 2023 and 5.125% Senior Notes Due 2026 that were issued in connection with the Merger as well as Andeavor Logistics’ 5.25% Senior Notes due 2025, all of which were issued subsequent to WTI, which resultedthe 2016 Period.
INCOME TAXES.Our income tax expense totaled $77 million in the 2017 Period compared to $267 million in the 2016 Period primarily due to lower gross margins.pre-tax earnings during the 2017 Period. The combined federal and state effective income tax rate was 31% and 33% during the 2017 Period and 2016 Period, respectively. The 2017 Period effective income tax rate was lower due to an increased percentage of income from non-taxable noncontrolling interests attributable to Andeavor Logistics and WNRL.
 MARKETING SEGMENT
We sell convenience store products and gasoline and diesel fuel in the central and western U.S. through Retail, Branded, and Unbranded channels. Our Retail business is made up of company-owned or leased properties offering fuel and convenience store products. Site operations include company-operated stores and third party-operated stores (multi-site operators (“MSO”)). The Branded business is comprised primarily of fuel sales made to Jobbers and Dealers under one of the many successful brands in our portfolio. Our Retail and Branded channels primarily use the ARCO®, SUPERAMERICA®, Shell®, and Mobil® brands for fuel sales and SUPERAMERICA®, Giant®, and ampm® brands for convenience stores. Capturing this brand value results in higher fuel margins for our Marketing segment. Our Unbranded business includes fuel sales through agreements with third-party distributors/operators without an associated fuel brand. The combined use of these channels provides both income from merchandise sales through convenience stores as well as a profitable outlet for the majority of the fuel produced by our refineries. In addition to added profitability, our Marketing business enables our refineries to run optimally, which lowers overall operating costs per barrel.
OPERATIONAL DATA AND RESULTS.Management uses various operating metrics to evaluate performancefuel margin per gallon and efficiency andmerchandise margin to compare profitabilityresults to other companies in the industry. These measures include:
Gross refiningThere are a variety of ways to calculate fuel margin per barrel—calculatedgallon and merchandise margin; different companies may calculate them in different ways. We calculate fuel margin per gallon by dividing fuel gross refining margin (revenues less costs of feedstocks, purchased refined products, transportationby fuel sales volumes and distribution) by total refining throughput
Manufacturing costs before depreciation and amortization expense (“Manufacturing Costs”) per throughput barrel—calculatedmerchandise margin by dividing Manufacturing Coststhe difference between merchandise sales and merchandise cost of products sold by total refining throughput
merchandise sales. Merchandise margin is frequently used in the convenience store industry to measure operating results related to merchandise sales. With the Marketing assets in the Western Refining Acquisition, we are reporting fuel margin for our Retail and Branded operations as well as our Unbranded operations. Investors and analysts may use these financial measuresmetrics to help analyze and compare companies in the industry on the basis of operating performance. These financial measures should not be considered alternatives to revenues, segment operating income revenues, costs of sales and operating expenses or any other measuremeasures of financial performance presented in accordance with U.S. GAAP. Fuel margin and fuel margin per gallon include the effect of intersegment purchases from the Refining segment.
NUMBER OF RETAIL AND BRANDED STORES (at end of period)
| |
| (a) | 457 company operated stores and 87 jobber/dealer operated stores were obtained in the Western Refining Acquisition. |
|
| | |
| MANAGEMENT’S DISCUSSION AND ANALYSIS |
2017 2ND QUARTER VERSUS 2016 2ND QUARTER
HIGHLIGHTS
MARKETING SEGMENT OPERATING DATA AND RESULTS (dollars in millions)
|
| | | | | | | |
| | Three Months Ended June 30, |
| | 2017 | | 2016 |
| Revenues | $ | 4,804 |
| | $ | 4,099 |
|
| Expenses | | | |
| Cost of Sales | 4,446 |
| | 3,847 |
|
| Operating expenses | 102 |
| | 76 |
|
| Selling, general and administrative expenses | 5 |
| | 2 |
|
| Depreciation and amortization expense | 14 |
| | 12 |
|
| Loss on asset disposals and impairments | 1 |
| | 1 |
|
| Segment Operating Income | $ | 236 |
| | $ | 161 |
|
| | | | |
| Fuel Sales (millions of gallons) |
| Retail | 353 |
| | 299 |
|
| Branded | 861 |
| | 845 |
|
| Total Retail and Branded | 1,214 |
| | 1,144 |
|
| Unbranded | 1,170 |
| | 1,077 |
|
| Total Fuel Sales | 2,384 |
| | 2,221 |
|
OVERVIEW.Operating income increased $75 million to $236 million for the 2017 Quarter compared to the 2016 Quarter primarily due to stronger fuel margins in all sales channels. Retail and Branded sales increased benefiting from the additional sites obtained in the Western Refining Acquisition on June 1, 2017 and other acquisitions. The Western Refining Acquisition resulted in higher fuel sales partially offset by increased operating expenses, contributing to a higher operating income for the 2017 Quarter.
RETAIL AND BRANDED. Gross margin increased $55 million to $282 million during the 2017 Quarter compared to the 2016 Quarter. Increased fuel sales of 70 million gallons, an increase of 627 additional stores and higher fuel margins in the regions in which we operate contributed to the improved gross margin in the 2017 Quarter. Included in the increase in stores were 544 stores acquired in the Western Refining Acquisition.
UNBRANDED. Gross margin increased $30 million to $37 million during the 2017 Quarter compared to the 2016 Quarter. Stronger margins along with increased fuel sales of 93 million gallons contributed to the improved gross margin in the 2017 Quarter.
MERCHANDISE MARGIN.Gross margin increased $18 million to $20 million during the 2017 Quarter compared to the 2016 Quarter primarily reflecting the Western Refining Acquisition. However, this also resulted in a decrease in merchandise margin to 28.3% for the 2017 Quarter compared to 35.6% for the 2016 Quarter primarily due to product mix of the acquired business.
MARKETING SEGMENT OPERATING RESULTS BY CATEGORY (dollars in millions, except cents per gallon and percent)
|
| | | | | | | | | | | | | | | | | | | | | | | | | | | | | | | | | | | | | | | |
| | Three Months Ended June 30, |
| | 2017 | | 2016 | | 2017 | | 2016 | | 2017 | | 2016 | | 2017 | | 2016 | | 2017 | | 2016 |
| | Retail and
Branded Fuel | | Unbranded Fuel | | Total Fuel | | Merchandise | | Other |
| | | | | | | | | | | | | | | | | | | | |
| Revenues | $ | 2,676 |
| | $ | 2,333 |
| | $ | 2,036 |
| | $ | 1,744 |
| | $ | 4,712 |
| | $ | 4,077 |
| | $ | 71 |
| | $ | 6 |
| | $ | 21 |
| | $ | 16 |
|
| Cost of Sales | 2,394 |
| | 2,106 |
| | 1,999 |
| | 1,737 |
| | 4,393 |
| | 3,843 |
| | 51 |
| | 4 |
| | 2 |
| | — |
|
| Gross Margin | $ | 282 |
| | $ | 227 |
| | $ | 37 |
| | $ | 7 |
| | $ | 319 |
| | $ | 234 |
| | $ | 20 |
| | $ | 2 |
| | $ | 19 |
| | $ | 16 |
|
| | | | | | | | | | | | | | | | | | | | |
| Fuel Margin (¢/gallon) | 23.2 | ¢ | | 19.8 | ¢ | | 3.1 | ¢ | | 0.7 | ¢ | | 13.4 | ¢ | | 10.5 | ¢ | | | | | | | | |
| Merchandise Margin (%) | | | | | | | | | | | | | 28.3 | % | | 35.6 | % | | | | |
|
| | |
| | | March 31,June 30, 2017 | 29
|
|
| | |
| MANAGEMENT’S DISCUSSION AND ANALYSIS | | |
REFINING THROUGHPUT (Mbpd)2017 YEAR TO DATE PERIOD VERSUS 2016 YEAR TO DATE PERIOD
HIGHLIGHTS
| |
(a) | We define heavy crude oil as crude oil with an American Petroleum Institute gravity of 24 degrees or less. |
YIELD (Mbpd)
REFINED PRODUCT SALES (a) (Mbpd)
| |
(a) | Sources of total refined product sales include refined products manufactured at our refineries and refined products purchased from third parties. Total refined product sales include sales of manufactured and purchased refined products. Refined product sales include all sales through our Marketing segment as well as in bulk markets and exports through our Refining segment. |
|
| | |
| | MANAGEMENT’S DISCUSSION AND ANALYSIS |
REFININGMARKETING SEGMENT OPERATING DATA AND RESULTS (in millions, except per barrel amounts)(dollars in millions)
|
| | | | | | | |
| | Three Months Ended March 31, |
| | 2017 | | 2016 |
| Refining Revenues | | | |
| Refined products (a) | $ | 5,812 |
| | $ | 4,285 |
|
| Crude oil resales and other | 244 |
| | 211 |
|
| Total Revenues | 6,056 |
| | 4,496 |
|
| Refining Cost of Sales | | | |
| Cost of sales (excluding LCM) | 5,355 |
| | 3,809 |
|
| LCM | — |
| | 147 |
|
| Total Cost of Sales | 5,355 |
| | 3,956 |
|
| Gross refining margin | 701 |
| | 540 |
|
| Expenses | | | |
| Operating expenses | | | |
| Manufacturing costs | 421 |
| | 395 |
|
| Other operating expenses | 95 |
| | 88 |
|
| General and administrative expenses | 2 |
| | 2 |
|
| Depreciation and amortization expenses | 148 |
| | 148 |
|
| Loss on asset disposals and impairments | 1 |
| | — |
|
| Segment Operating Income (Loss) | $ | 34 |
| | $ | (93 | ) |
| Gross refining margin per throughput barrel | $ | 9.44 |
| | $ | 7.59 |
|
| Manufacturing costs per throughput barrel | $ | 5.67 |
| | $ | 5.55 |
|
|
| | | | | | | |
| | Six Months Ended June 30, 2017 |
| | 2017 | | 2016 |
| Revenues | $ | 8,908 |
| | $ | 7,417 |
|
| Expenses | | | |
| Cost of Sales | 8,331 |
| | 6,847 |
|
| Operating expenses | 170 |
| | 148 |
|
| Selling, general and administrative expenses | 10 |
| | 7 |
|
| Depreciation and amortization expense | 27 |
| | 24 |
|
| Loss on asset disposals and impairments | 1 |
| | 3 |
|
| Segment Operating Income | $ | 369 |
| | $ | 388 |
|
| | | | |
| Fuel Sales (millions of gallons) |
| Retail | 594 |
| | 583 |
|
| Branded | 1,681 |
| | 1,655 |
|
| Total Retail and Branded | 2,275 |
| | 2,238 |
|
| Unbranded | 2,177 |
| | 2,149 |
|
| Total Fuel Sales | 4,452 |
| | 4,387 |
|
| |
(a) | Refined product sales include intersegment sales to our Marketing segment of $3.7 billion and $3.0 billion for the 2017 Quarter and the 2016 Quarter, respectively. |
2017 QUARTER COMPARED TO 2016 QUARTER
OVERVIEW. Operating income for our Refining segmentincreased$127decreased $19 million to income of$34$369 million during the 2017 QuarterPeriod compared to the 2016 Quarter duePeriod primarily attributable to the impact of the lower of cost or market adjustment recordedweaker fuel margins experienced in the 2016 Quarterfirst quarter of 2017 partially offset by rising manufacturing costs. Average U.S. West Coast crack spreads were approximately $17 per barrel, which remained relatively flatstronger margins in the 2017 Quarter and the operations obtained in the Western Refining Acquisition and other acquisitions.
RETAIL AND BRANDED. Gross margin decreased $69 million to $471 million during the 2017 Period compared to the 2016 Quarter.
REFINING THROUGHPUT.Total refining throughputPeriod. The June contribution from the Western Refining Acquisition increased fuel sales volumes and store count, but was higheroffset by unfavorable weather conditions along the West Coast in the first quarter of 2017, which reduced demand and dampened margins in the 2017 Quarter at 825 Mbpd comparedPeriod.
UNBRANDED. Gross margin increased $53 million to 782 Mbpd$49 million during the 2016 Quarter primarily due to strong operating performance and reliability this period along with the incremental impact of the Dickinson refinery acquired in June 2016 and several planned and unplanned maintenance activities at a few of our facilities in the 2016 Quarter. Total refinery utilization of 92% in the 2017 Quarter improved versus the 89% experienced in the 2016 Quarter.
GROSS REFINING MARGIN.Total gross refining margin increased $161 million, or 30%, to $701 million in the 2017 QuarterPeriod compared to the 2016 Quarter. Gross refining margins inPeriod driven by a stronger margin environment along with higher fuel sales of 28 million gallons, including contributions from the California, Pacific Northwest and Mid-Continent regions increased by $75 million, $60 million and $26 million, respectively. On a per barrel basis, our gross refiningWestern Refining Acquisition.
MERCHANDISE MARGIN.Gross margin increased $1.85 per barrel, or 24%,$19 million to $9.44 per barrel in$23 million during the 2017 QuarterPeriod compared to the same period2016 Period driven by the June contribution from the Western Refining Acquisition. However, this also resulted in 2016. During the 2016 Quarter, we recorded a $147 million lower of cost or market adjustment that reduced gross refining margin. Additionally,decrease in the 2017 Quarter we experienced slightly improved product margins. The lower of cost or market adjustment reduced the 2016 Quarter’s gross refiningmerchandise margin by $2.07 per barrel.
MANUFACTURING COSTS AND OTHER OPERATING EXPENSES. Total manufacturing coststo 28.8% for the 2017 Quarter increased $26 million versusPeriod compared to 35.5% for the 2016 Quarter primarilyPeriod due to increased energy prices in 2017.product mix of the acquired business.
|
| | |
MANAGEMENT’S DISCUSSION AND ANALYSIS | | |
REFININGMARKETING SEGMENT OPERATING RESULTS BY REGIONCATEGORY (dollars in millions, except cents per barrel amounts)gallon and percent)
|
| | | | | | | | | | | | | | | | | | | | | | | |
| | Three Months Ended March 31, |
| | 2017 | | 2016 | | 2017 | | 2016 | | 2017 | | 2016 |
| | California (Martinez and Los Angeles) | | Pacific Northwest (Washington and Alaska) | | Mid-Continent (North Dakota and Utah) |
Revenues | | | | | | | | | | | |
| Refined products | $ | 3,924 |
| | $ | 2,947 |
| | $ | 1,092 |
| | $ | 782 |
| | $ | 796 |
| | $ | 556 |
|
| Crude oil resales and other | 144 |
| | 80 |
| | 53 |
| | 28 |
| | 47 |
| | 102 |
|
| Total Revenues | 4,068 |
| | 3,027 |
| | 1,145 |
| | 810 |
| | 843 |
| | 658 |
|
| Refining Cost of Sales | | | | | | | | | | | |
| Cost of sales (excluding LCM) | 3,594 |
| | 2,537 |
| | 1,017 |
| | 709 |
| | 744 |
| | 562 |
|
| LCM | — |
| | 91 |
| | — |
| | 33 |
| | — |
| | 23 |
|
| Total Cost of Sales | 3,594 |
| | 2,628 |
| | 1,017 |
| | 742 |
| | 744 |
| | 585 |
|
| Gross refining margin | 474 |
| | 399 |
| | 128 |
| | 68 |
| | 99 |
| | 73 |
|
| Expenses | | | | | | | | | | | |
| Manufacturing costs | 295 |
| | 283 |
| | 67 |
| | 64 |
| | 59 |
| | 48 |
|
| Other operating expenses | 56 |
| | 36 |
| | 18 |
| | 13 |
| | 21 |
| | 39 |
|
| General and administrative expenses | 2 |
| | 2 |
| | — |
| | — |
| | — |
| | — |
|
| Depreciation and amortization expenses | 94 |
| | 91 |
| | 27 |
| | 23 |
| | 27 |
| | 34 |
|
| Loss on asset disposals and impairments | 1 |
| | — |
| | — |
| | — |
| | — |
| | — |
|
| Operating Income (Loss) | $ | 26 |
| | $ | (13 | ) | | $ | 16 |
| | $ | (32 | ) | | $ | (8 | ) | | $ | (48 | ) |
| Refining throughput (Mbpd) | 500 |
| | 461 |
| | 186 |
| | 186 |
| | 139 |
| | 135 |
|
| Gross refining margin per throughput barrel | $ | 10.53 |
| | $ | 9.51 |
| | $ | 7.65 |
| | $ | 4.02 |
| | $ | 7.91 |
| | $ | 5.94 |
|
| Manufacturing costs per throughput barrel | $ | 6.56 |
| | $ | 6.74 |
| | $ | 4.00 |
| | $ | 3.81 |
| | $ | 4.72 |
| | $ | 3.85 |
|
|
| | | | | | | | | | | | | | | | | | | | | | | | | | | | | | | | | | | | | | | | |
| | Six Months Ended June 30, 2017 |
| | 2017 | | 2016 | | 2017 | | 2016 | | 2017 | | 2016 | | 2017 | | 2016 | | 2017 | | 2016 |
| | Retail and
Branded Fuel | | Unbranded Fuel | | Total Fuel | | Merchandise | | Other |
| | | | | | | | | | | | | | | | | | | | |
| Revenues | $ | 5,000 |
| | $ | 4,322 |
| | $ | 3,795 |
| | $ | 3,053 |
|
| $ | 8,795 |
| 4,322 |
| $ | 7,375 |
| | $ | 77 |
| | $ | 12 |
| | $ | 36 |
| | $ | 30 |
|
| Cost of Sales | 4,529 |
| | 3,782 |
| | 3,746 |
| | 3,057 |
|
| 8,275 |
| 3,782 |
| 6,839 |
| | 54 |
| | 8 |
| | 2 |
| | — |
|
| Gross Margin | $ | 471 |
| | $ | 540 |
| | $ | 49 |
| | $ | (4 | ) |
| $ | 520 |
| 540 |
| $ | 536 |
| | $ | 23 |
| | $ | 4 |
| | $ | 34 |
| | $ | 30 |
|
| | | | | | | | | | | | | | | | | | | | |
| Fuel Margin (¢/gallon) | 20.5 | ¢ | | 24.2 | ¢ | | 2.3 | ¢ | | (0.2 | )¢ | | 11.6 | ¢ | | 12.2 | ¢ | | | | | | | | |
| Merchandise Margin (%) | | | | | | | | | | | | | 28.8 | % | | 35.5 | % | | | | |
|
| | |
| MANAGEMENT’S DISCUSSION AND ANALYSIS |
HIGHLIGHTS - FOR THE 2017 QUARTER AND THE 2016 QUARTER (in millions)
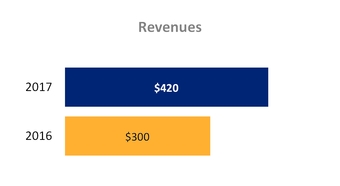
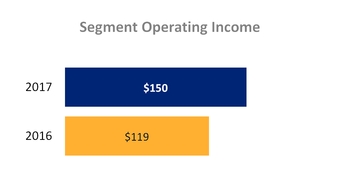
TLLP is a publicly traded limited partnership that was formed to own, operate, developOur Logistics segment operates across three business lines: Gathering and acquire logistics assets.Processing, Terminalling and Transportation and Wholesale. A significant portion of itsthe assets within this segment are integral to the success of Tesoro’sour refining and marketing operations andoperations. These business lines generate revenue by charging fees for gathering crude oil, natural gas, and water, for terminalling, transporting and storing crude oil and refined products in terminals and forstorage tanks, processing and fractionating NGLs.
NGLs and the sale of fuel through wholesale commercial contracts. The supply of and demand for crude oil, natural gas and refined petroleum products in the regions that our Logistics segment serves bear significant influence on its results of operations.
OPERATIONAL DATA AND RESULTS. Management uses severalSeveral operating metrics are used by management to evaluate performance and efficiency and compare profitability to other companies in the industry. These metrics include:
Average margin on fuel sales per gallon—calculated as the difference between the fuel sales and the costs associated with the fuel sales divided by total fuel sales volumes;
Average margin on NGL sales per barrel—calculated as the difference between the NGL sales and the costs associated with the NGL sales divided by total NGL sales volumes;
|
| | |
| | MANAGEMENT’S DISCUSSION AND ANALYSIS |
Average gas gathering and processing revenue per Million British thermal units (“MMBtu”)—calculated as total gathering and processing fee-based revenue divided by total gas gathering throughput;
Average crude oil and water gathering revenue per barrel—calculated as total crude oil and water gathering fee-based revenue divided by total crude oil and water gathering throughput;
Average terminalling revenue per barrel—calculated as total terminalling revenue divided by total terminalling throughput; and
Average pipeline transportation revenue per barrel—calculated as total pipeline transportation revenue divided by total pipeline transportation throughput.
Investors and analysts use these financial measures to help analyze and compare companies in the industry on the basis of operating performance. These financial measures should not be considered as an alternative to segment operating income, revenues and operating expenses or any other measure of financial performance presented in accordance with U.S. GAAP.
MARKET OVERVIEW.During the 2017 Quarter, spot prices increased for the majority of commodities that TLLP handles; including crude oil, natural gas, NGLs and refined
products. Crude oil prices rose to the highest levels since mid-2015 on OPEC and non-OPEC producers agreeing to a reduction of crude production; however, in March crude oil prices declined as visible onshore inventories failed to show stock declines. Despite these price declines, the U.S. oil and gas drilling landscape continues to improve given continued price appreciation from 2016, increased rig counts, premium locational drilling and enhanced completion techniques. Additionally, the current administration took steps to advance major midstream projects such as approvals for the Dakota Access Pipeline and the Keystone XL pipeline. These factors create positive outlook for U.S. oil and gas production growth and associated throughput volumes.
Continued improvements in the U.S. economic landscape, such as lower unemployment, wage growth, strong consumer sentiment and robust manufacturing, support healthy refined product demand from TLLP’s downstream and marketing customers. Also, growing U.S. export opportunities in both crude oil and refined products create additional outlets for incremental production. TLLP continues to monitor the impactofthese changes in market prices and fundamentals as it relates to its business. Given the outlined market conditions, TLLP believes its diversified portfolios of businesses as well as its customers’ minimum volume commitments are sufficient to continue to meet its goals and objectives.
2017 2ND QUARTER VERSUS 2016 2ND QUARTER
TLLP SEGMENT VOLUMETRIC DATA
HIGHLIGHTS (in millions)
| |
(a) | Volumes represent barrels sold under TLLP’s keep-whole arrangements, net barrels retained under its percent of proceeds (“POP”) arrangements and other associated products.
|
|
| | |
| MANAGEMENT’S DISCUSSION AND ANALYSIS | |
LOGISTICS SEGMENT VOLUMETRIC DATA
| |
| (a) | Volumes represent barrels sold under Andeavor Logistics’ keep-whole arrangements, net barrels retained under its percent of proceeds (“POP”) arrangements and other associated products. |
| |
| (b) | Fuel sales represent Wholesale business obtained in the Western Refining Acquisition. |
|
| | |
| MANAGEMENT’S DISCUSSION AND ANALYSIS |
LOGISTICS SEGMENT OPERATING RESULTS (in millions, except per barrel and per MMBtu amounts)
|
| | | | | | | |
| | Three Months Ended June 30, |
| | 2017 | | 2016 (a) |
| Revenues | | | |
| Gathering and Processing | | | |
| NGL sales (b) | $ | 81 |
| | $ | 27 |
|
| Gas gathering and processing | 87 |
| | 63 |
|
| Crude oil and water gathering | 41 |
| | 32 |
|
| Pass-thru and other revenue | 41 |
| | 28 |
|
| Terminalling and Transportation | | | |
| Terminalling | 159 |
| | 112 |
|
| Pipeline transportation | 33 |
| | 31 |
|
| Wholesale | | | |
| Fuel sales (c) | 165 |
| | — |
|
| Total Revenues (d) | 607 |
| | 293 |
|
| Costs and Expenses | | | |
| Gathering and Processing | | | |
| Cost of NGL sales (b) | 56 |
| | 1 |
|
| Operating expenses (e) | 82 |
| | 59 |
|
| Terminalling and Transportation | | | |
| Operating expenses (e) | 60 |
| | 47 |
|
| Wholesale | | | |
| Cost of fuel sales | 162 |
| | — |
|
| Operating expenses (e) | 10 |
| | — |
|
| General and administrative expenses (f) | 28 |
| | 22 |
|
| Depreciation and amortization expenses | 68 |
| | 46 |
|
| Gain on asset disposals | (26 | ) | | — |
|
| Segment Operating Income | $ | 167 |
| | $ | 118 |
|
| Average margin on NGL sales per barrel (b) | $ | 37.45 |
| | $ | 36.69 |
|
| Average gas gathering and processing revenue per MMBtu | $ | 1.00 |
| | $ | 0.81 |
|
| Average crude oil and water gathering revenue per barrel | $ | 1.64 |
| | $ | 1.72 |
|
| Average terminalling revenue per barrel | $ | 1.39 |
| | $ | 1.21 |
|
| Average pipeline transportation revenue per barrel | $ | 0.40 |
| | $ | 0.40 |
|
| Average margin on fuel sales per gallon (c) | $ | 0.03 |
| | $ | — |
|
OVERVIEW.Operating income increased $49 million to $167 million for the 2017 Quarter compared to 2016 Quarter primarily due to the acquisitions in the second half of 2016 of certain terminalling and storage assets owned by Andeavor (the “Alaska Storage and Terminalling Assets”) and certain terminalling and storage assets (“the Northern California Terminalling and Storage Assets”), the Andeavor Logistics acquired crude oil, natural gas and produced water gathering systems and two natural gas processing facilities from Whiting Oil and Gas Corporation, GBK Investments, LLC and WBI Energy Midstream, LLC (the "North Dakota Gathering and Processing Assets") in January 2017 and one month of contribution from the operations obtained in the Western Refining Acquisition. The 2017 Quarter also reflects a $25 million gain on the sale of a products terminal in Alaska.
GATHERING AND PROCESSING. The Gathering and Processing revenues, net of cost of NGL sales and operating expenses, increased $22 million, or 24%, in the 2017 Quarter compared to the 2016 Quarter. Revenues increased across the natural gas gathering and processing systems and crude oil and water gathering systems due primarily to the acquisition of the North Dakota Gathering and Processing Assets, the impact of one month of contribution from the operations obtained in the Western Refining Acquisition and expanded capabilities on our existing Logistics assets. The increase was partially offset by a decline in revenues resulting from lower volumes in the Rockies Region, lower volumes and margins from our Refining segment due to the Mandan refinery undergoing a turnaround in the 2017 Quarter and incremental operating expenses primarily associated with the acquisitions.
TERMINALLING AND TRANSPORTATION. The Terminalling and Transportation revenues, net of operating expenses, increased $36 million, or 38%, primarily due to higher revenues associated with new commercial terminalling and storage agreements executed with our Refining segment in connection with the Northern California Terminalling and Storage Assets and the Alaska Storage and Terminalling Assets acquisitions in the second half of 2016. Also contributing to the increase were higher marine terminalling revenues driven by higher refinery utilization and one month of contribution from the operations obtained in the Western Refining Acquisition. The increase was partially offset by higher operating expenses, particularly related to the Alaska Storage and Terminalling Assets.
WHOLESALE. The Wholesale revenues, net of cost of fuel sales and operating expenses, are the results of operations obtained in the Western Refining Acquisition on June 1, 2017.
| |
| (a) | Adjusted to include the historical results of the Predecessors. Refer to “Items Impacting Comparability” for further discussion. |
| |
| (b) | For the 2017 Quarter, Logistics had 20.9 Mbpd of gross NGL sales under POP and keep-whole arrangements, of which Logistics retained 7.3 Mbpd. The difference between gross sales barrels and barrels retained is reflected in costs of sales due to the gross presentation required for the POP arrangements associated with the North Dakota Gathering and Processing Assets. |
| |
| (c) | Fuel sales represent the Wholesale business obtained in the Western Refining Acquisition. |
| |
| (d) | Logistics revenues from services provided to Andeavor were $271 million and $168 million for the 2017 Quarter and the 2016 Quarter, respectively. These amounts are eliminated upon consolidation. |
| |
| (e) | Logistics segment operating expenses include amounts billed by Andeavor for services provided to Logistics under various operational contracts. Amounts billed by Andeavor totaled $44 million and $34 million for the 2017 Quarter and the 2016 Quarter, respectively. The net amounts billed include imbalance gains and reimbursements of $5 million for both the 2017 Quarter and the 2016 Quarter. These amounts are eliminated upon consolidation. Logistics third-party operating expenses related to the transportation of crude oil and refined products related to Andeavor’s sale of those refined products during the ordinary course of business are reclassified to cost of sales upon consolidation. |
|
| | |
| MANAGEMENT’S DISCUSSION AND ANALYSIS | |
| |
| (f) | Logistics segment general and administrative expenses include amounts charged by Andeavor for general and administrative services provided to Logistics under various operational and administrative contracts. These amounts totaled $19 million and $16 million for the 2017 Quarter and the 2016 Quarter, respectively, and are eliminated upon consolidation. Logistics segment third-party general and administrative expenses are reclassified to cost of sales as it relates to Andeavor’s sale of refined products in our condensed statements of consolidated operations upon consolidation. |
2017 YEAR TO DATE PERIOD VERSUS 2016 YEAR TO DATE PERIOD
HIGHLIGHTS (in millions)
LOGISTICS SEGMENT VOLUMETRIC DATA
| |
| (a) | Volumes represent barrels sold under Andeavor Logistics’ keep-whole arrangements, net barrels retained under its POP arrangements and other associated products. |
| |
| (b) | Fuel sales represent Wholesale business obtained in the Western Refining Acquisition. |
|
| | |
| MANAGEMENT’S DISCUSSION AND ANALYSIS |
TLLPLOGISTICS SEGMENT OPERATING RESULTS (in millions, except per barrel and per MMBtu amounts)
| | | | Three Months Ended March 31, | Six Months Ended June 30, |
| | 2017 | | 2016 (a) | 2017 | | 2016 (a) |
| Revenues | | | | | | |
| Gathering and Processing | | | | | | |
| NGL sales (b) | $ | 83 |
| | $ | 27 |
| $ | 164 |
| | $ | 54 |
|
| Gas gathering and processing | 80 |
| | 68 |
| 167 |
| | 131 |
|
| Crude oil and water gathering | 39 |
| | 35 |
| 80 |
| | 67 |
|
Pass-thru and other revenue | 43 |
| | 32 |
| 84 |
| | 60 |
|
| Terminalling and transportation | | | | |
| Terminalling and Transportation | | | | |
| Terminalling | 145 |
| | 108 |
| 304 |
| | 220 |
|
| Pipeline transportation | 30 |
| | 30 |
| 63 |
| | 61 |
|
| Total Revenues (c) | 420 |
| | 300 |
| |
| Wholesale | | | | |
| Fuel sales (c) | | 165 |
| | — |
|
| Total Revenues (d) | | 1,027 |
| | 593 |
|
| Costs and Expenses | | | | | | |
| Cost of NGL sales (b)(d) | 59 |
| | — |
| |
| Operating expenses (e) | 126 |
| | 110 |
| |
| General and administrative expenses (f) | 27 |
| | 24 |
| |
| Gathering and Processing | | | | |
| Cost of NGL sales (b)(e) | | 115 |
| | 1 |
|
| Operating expenses (f) | | 159 |
| | 122 |
|
| Terminalling and Transportation | | | | |
| Operating expenses (f) | | 109 |
| | 94 |
|
| Wholesale (c) | | | | |
| Cost of fuel sales | | 162 |
| | — |
|
| Operating expenses (f) | | 10 |
| | — |
|
| General and administrative expenses (g) | | 55 |
| | 46 |
|
| Depreciation and amortization expenses | 58 |
| | 46 |
| 126 |
| | 92 |
|
| Loss on asset disposals and impairments | — |
| | 1 |
| |
| (Gain) Loss on asset disposals | | (26 | ) | | 1 |
|
| Segment Operating Income | $ | 150 |
| | $ | 119 |
| $ | 317 |
| | $ | 237 |
|
| Average margin on NGL sales per barrel (b)(d) | $ | 39.15 |
| | $ | 34.49 |
| $ | 38.30 |
| | $ | 35.54 |
|
| Average gas gathering and processing revenue per MMBtu | $ | 0.94 |
| | $ | 0.83 |
| $ | 0.97 |
| | $ | 0.82 |
|
| Average crude oil and water gathering revenue per barrel | $ | 1.73 |
| | $ | 1.77 |
| $ | 1.68 |
| | $ | 1.74 |
|
| Average terminalling revenue per barrel | $ | 1.58 |
| | $ | 1.31 |
| $ | 1.47 |
| | $ | 1.26 |
|
| Average pipeline transportation revenue per barrel | $ | 0.40 |
| | $ | 0.40 |
| $ | 0.40 |
| | $ | 0.40 |
|
| Average margin on fuel sales per gallon (c) | | $ | 0.03 |
| | $ | — |
|
2017 QUARTER COMPARED TO 2016 QUARTER
OVERVIEW. Operating income for TLLP increased $31$80 million to $150$317 million for the 2017 QuarterPeriod compared to the same period in 2016 primarily as a result ofdue to the acquisitionacquisitions of the Alaska Storage and Terminalling Assets and the Northern California Terminalling and Storage Assets acquired from TesoroAndeavor in the second half of 2016 and the North Dakota Gathering and Processing Assets acquiredin January 2017. The 2017 Period also reflects a $25 million gain on January 1, 2017.the sale of a products terminal in Alaska.
REVENUESGATHERING AND THROUGHPUT.PROCESSING. RevenuesThe Gathering and Processing revenues, net of cost of NGL sales and operating expenses, increased $120$32 million, to $420 million duringor 17%, in the 2017 QuarterPeriod compared to the 2016 QuarterPeriod. Revenues increased across the natural gas gathering and processing systems and crude oil and water gathering systems due primarily due to the acquisition of the North Dakota Gathering and Processing Assets the acquisition of the Northern California Terminalling and Storage Assets in the fourth quarter of 2016, and the acquisition of the Alaska Storage and Terminalling Assets in the third quarter of 2016. NGL sales increased as a result of the North Dakota Gathering and Processing Assets acquired while increases in natural gas production, which led to increased volumesexpanded capabilities on our gathering system and processing volumes at TLLP’s facilitiesexisting Logistics assets. The increases were partially offset by declines at its facilitiesa decline in revenues resulting from lower volumes in the Rockies region. Crude oilRegion, lower volumes and water gathering volumes increased asmargins from our Refining segment due to the Mandan refinery undergoing a result of projects to expandturnaround and incremental operating expenses primarily associated with the pipelineacquisition.
gatheringTERMINALLING AND TRANSPORTATION. systemcapabilities,whichincludeadditional origin and destination interconnections.The Terminalling and pipeline transportation throughputTransportation revenues, net of operating expenses, increased 106 Mbpd and 10 Mbpd, respectively,$71 million, or 38%, primarily due to throughputhigher revenues associated with new commercial terminalling and storage agreements executed with our Refining segment in connection with the Northern California Terminalling and Storage Assets and the Alaska Storage and Terminalling Assets acquiredacquisitions in the second half of 2016. Additionally, there was anAlso contributing to the increase were higher marine terminalling revenues driven by higher refinery utilization. The increase in California marine volumes as a result ofrevenues were partially offset by higher Tesoro refinery utilization inoperating expenses, particularly related to the 2017 Quarter.Alaska Storage and Terminalling Assets.
OPERATING AND OTHER EXPENSES.WHOLESALE. CostThe Wholesale revenues, net of NGLcost of fuel sales and operating expenses, and depreciation and amortization expenses all increasedare the results of operations obtained in the 2017 Quarter versus the 2016 Quarter principally due to the acquisition of the North Dakota Gathering and Processing Assets.Western Refining Acquisition on June 1, 2017.
| |
| (a) | Adjusted to include the historical results of TLLP’sthe Predecessors. Refer to “Items Impacting Comparability” for further discussion. |
| |
| (b) | Forthe 2017 Quarter, TLLPPeriod, Logistics had 21.121.0 Mbpd of gross NGL sales under POP and keep-whole arrangements. TLLParrangements, of which Logistics retained7.4Mbpdunderthese arrangements. Mbpd. The difference between gross sales barrels and barrels retained is reflected in costs of sales resultingfromthegrosspresentation required for the POP arrangements associated with the North Dakota Gathering and Processing Assets. |
| |
| (c) | TLLPFuel sales represent the Wholesale business obtained in the Western Refining Acquisition. |
| |
| (d) | Logistics segment revenues from services provided to our Refining segmentAndeavor were $203$474 million and $169$337 million for the 2017 QuarterPeriod and the 2016 Quarter,Period, respectively. These amounts are eliminated upon consolidation. |
| |
(d)(e) | Included in cost of NGL sales for the 2017 QuarterPeriod were approximately $2 million of cost of sales related to crude oil volumes obtained in connection with the acquisition of the North Dakota Gathering and Processing Assets. The corresponding revenues were recognized in pass-thru and other revenue. As such, the calculation of the average margin on NGL sales per barrel excludes this amount. |
| |
(e)(f) | TLLP segmentLogistics operating expenses include amounts billed by TesoroAndeavor for services provided to TLLPLogistics under various operational contracts. Amounts billed by TesoroAndeavor totaled $39$83 million and $35$69 million for the 2017 QuarterPeriod and the 2016 Quarter,Period, respectively. The net amounts billed include imbalance gains and reimbursements of $5$10 million and $7$12 million for the 2017 QuarterPeriod and the 2016 Quarter,Period, respectively. These amounts are eliminated upon consolidation. TLLP segment third-party operating expenses related to the transportation of crude oil and refined products related to Tesoro’s sale of those refined products during the ordinary course of business are reclassified to cost of sales upon consolidation. |
| |
(f) | TLLP segment general and administrative expenses include amounts charged by Tesoro for general and administrative services provided to TLLP under various operational and administrative contracts. These amounts totaled $20 million and $17 million for the 2017 Quarter and the 2016 Quarter, respectively, and are eliminated upon consolidation. TLLP segment third-party general and administrative expenses are reclassified to cost of sales as it relates to Tesoro’s sale of refined products in our condensed statements of consolidated operations upon consolidation.
|
|
| | |
| | MANAGEMENT’S DISCUSSION AND ANALYSIS |

MARKETING SEGMENT
HIGHLIGHTS - FOR THE 2017 QUARTER AND THE 2016 QUARTER
We sell gasoline and diesel fuel in the western U.S. throughbrandedandunbrandedchannels.Ourbranded operations are made up of Jobber/Dealers and multi-site operators(“MSOs”).Ourunbrandedbusinessincludesvolumes sold through agreements with third-party distributors/operators. Our branded and unbranded channels provide profitable and committed outlets for the majority of the gasoline produced by our refineries. Our Marketing segment included a network of retail stations under the ARCO®, Shell®, Exxon®,Mobil®,USAGasolineTM,RebelTM,ThriftyTMandTesoro® brands. Our unique brand portfolio allows us to regionally select premium and value brands consistent with consumer preferences. In addition to added profitability, our Marketing business enables our refineries to run optimally, which lowers overall operating costs per barrel.
OPERATIONAL DATA AND RESULTS. Management uses fuel margin per gallon to compare fuel results to other companies in the industry. There are a variety of ways to calculate fuel margin per gallon; different companies may calculate it in different ways. We calculate fuel margin per gallon by dividing fuel gross margin by fuel sales volumes. Investors and analysts may use fuel margin per gallon to help analyze and compare companies in the industry on the basis of operating performance. This financial measure should not be considered an alternative to revenues, segment operating income or any other measure of financial performance presented in accordance with U.S. GAAP. Fuel margin and fuel margin per gallon include the effect of intersegment purchases from the Refining segment.
NUMBER OF BRANDED STATIONS
|
| | |
| | | March 31,June 30, 2017 | 35
|
|
| | |
| MANAGEMENT’S DISCUSSION AND ANALYSIS | |
amounts are eliminated upon consolidation. Logistics third-party operating expenses related to the transportation of crude oil and refined products related to Andeavor’s sale of those refined products during the ordinary course of business are reclassified to cost of sales upon consolidation.
| |
| (g) | Logistics general and administrative expenses include amounts charged by Andeavor for general and administrative services provided under various operational and administrative contracts. These amounts totaled $39 million and $33 million for the 2017 Period and the 2016 Period, respectively, and are eliminated upon consolidation. Logistics third-party general and administrative expenses are reclassified to cost of sales as it relates to Andeavor’s sale of refined products in our condensed statements of consolidated operations upon consolidation. |
SEGMENT RESULTS OF OPERATIONS
 REFINING SEGMENT
We currently own and operate ten petroleum refineries located in the western and mid-continent United States and sell transportation fuels to a wide variety of customers. Our refineries produce the majority of the transportation fuels that we sell. We purchase crude oil and other feedstocks from domestic and foreign sources, including the Middle East, South America, western Africa, Canada and other locations either in the spot market or through term agreements with renewal provisions. Our Marketing segment, including its branded retail network, provides a committed outlet for the majority of the gasoline produced by our refineries; however, we also sell gasoline and gasoline blendstocks, jet fuel, diesel fuel, heavy fuel oils and residual products in bulk and opportunistically export refined products to certain foreign markets.
Results from our Refining segment are highly volatile and subject to many factors that are beyond our control. Revenue is not a good proxy for financial performance as the key driver of revenue is the underlying price per barrel of crude oil. Gross refining margin, refinery throughputs, crack spreads and crude oil differentials are more useful metrics to measure the performance of the Refining segment.
The gross refining margin is the difference between the prices of all manufactured refined products sold and the cost of crude oil and other feedstocks used to produce refined products, including the cost of transportation and distribution paid to Andeavor Logistics, WNRL and third parties at contractual rates. The market for crude oil and products is affected by changes in economic conditions and supply and demand balance. Product values and crude oil prices are set by the market and are outside of our control. When evaluating the markets in which we operate, we utilize the U.S. Energy Information Administration and other industry sources to gather supply, demand, utilization, import and export information to forecast and monitor market conditions for our operating regions. We focus on the western and mid-continent U.S., where the majority of our operations are located.
Refining utilization is a key metric used by management to evaluate refining operational performance. High utilization allows for efficient operations and lower costs per barrel.
REFINING UTILIZATION (a)
| |
| (a) | Andeavor has a total refining capacity of 1,157 Mbpd for 2017 following the Merger. Prior to the Merger, Andeavor had a total refining capacity of 895 Mbpd following the acquisition of the Dickinson refinery in June 2016 and 875 Mbpd beforehand. |
OPERATIONAL DATA AND RESULTS. Various operating metrics are used by management to evaluate performance and efficiency and to compare profitability to other companies in the industry. These measures include:
Gross refining margin per barrel-calculated by dividing gross refining margin (revenues less costs of feedstocks, purchased refined products, transportation and distribution) by total refining throughput; and
Manufacturing costs before depreciation and amortization expense (“Manufacturing Costs”) per throughput barrel-calculated by dividing Manufacturing Costs by total refining throughput.
Investors and analysts use these financial measures to help analyze and compare companies in the industry on the basis of operating performance. These financial measures should not be considered alternatives to segment operating income, revenues, costs of sales and operating expenses or any other measure of financial performance presented in accordance with U.S. GAAP.
|
| | |
| MANAGEMENT’S DISCUSSION AND ANALYSIS |
2017 2ND QUARTER VERSUS 2016 2ND QUARTER
HIGHLIGHTS
REFINING THROUGHPUT (Mbpd)
| |
| (a) | We define heavy crude oil as crude oil with an American Petroleum Institute gravity of 24 degrees or less. |
YIELD (Mbpd)
REFINED PRODUCT SALES (a) (Mbpd)
| |
| (a) | Sources of total refined product sales include refined products manufactured at our refineries and refined products purchased from third parties. Total refined product sales include sales of manufactured and purchased refined products. Refined product sales include all sales through our Marketing segment as well as in bulk markets and exports through our Refining segment. |
|
| | |
| MANAGEMENT’S DISCUSSION AND ANALYSIS | |
MARKETINGREFINING SEGMENT OPERATING DATA AND RESULTS (dollars in(in millions, except cents per gallon)barrel amounts)
|
| | | | | | | |
| | Three Months Ended March 31, |
| | 2017 | | 2016 |
| Marketing Revenues | | | |
| Fuel | $ | 4,083 |
| | $ | 3,298 |
|
| Other non-fuel | 21 |
| | 20 |
|
| Total Revenues | 4,104 |
| | 3,318 |
|
| Marketing Cost of Sales | | | |
| Fuel | 3,881 |
| | 2,996 |
|
| Other non-fuel | 4 |
| | 4 |
|
| Total Cost of Sales | 3,885 |
| | 3,000 |
|
| Marketing Gross Margin | | | |
| Fuel | 202 |
| | 302 |
|
| Other non-fuel | 17 |
| | 16 |
|
| Total Gross Margin | 219 |
| | 318 |
|
| Expenses | | | |
| Operating expenses | 68 |
| | 72 |
|
| General and administrative expenses | 5 |
| | 5 |
|
| Depreciation and amortization expenses | 13 |
| | 12 |
|
| Loss on asset disposals and impairments | — |
| | 2 |
|
| Segment Operating Income | $ | 133 |
| | $ | 227 |
|
| | | | |
| Fuel sales in millions of gallons | 2,097 |
| | 2,166 |
|
| Fuel margin per gallon |
| 9.6 | ¢ | |
| 13.9 | ¢ |
|
| | | | | | | |
| | Three Months Ended June 30, |
| | 2017 | | 2016 |
| Refining Revenues | | | |
| Refined products (a) | $ | 6,658 |
| | $ | 5,508 |
|
| Crude oil resales and other | 391 |
| | 242 |
|
| Total Revenues | 7,049 |
| | 5,750 |
|
| Refining Cost of Sales | | | |
| Cost of sales (excluding LCM) | 6,072 |
| | 4,967 |
|
| LCM | 209 |
| | (363 | ) |
| Total Cost of Sales | 6,281 |
| | 4,604 |
|
| Gross refining margin | 768 |
| | 1,146 |
|
| Expenses | | | |
| Operating expenses | | | |
| Manufacturing costs | 460 |
| | 365 |
|
| Other operating expenses | 104 |
| | 106 |
|
| General and administrative expenses | 3 |
| | 2 |
|
| Depreciation and amortization expenses | 153 |
| | 146 |
|
| Loss on asset disposals and impairments | 3 |
| | — |
|
| Segment Operating Income | $ | 45 |
| | $ | 527 |
|
| Gross refining margin per throughput barrel | $ | 9.45 |
| | $ | 15.70 |
|
| Manufacturing costs per throughput barrel | $ | 5.67 |
| | $ | 5.01 |
|
| |
| (a) | Refined product sales include intersegment sales to our Marketing segment of $3.9 billion and $3.8 billion for the 2017 Quarter and the 2016 Quarter, respectively. |
2017 QUARTER COMPARED TO 2016 QUARTER
OVERVIEW.Operating income decreasedfor our Refining segment $94decreased $482 millionto $133$45 million during the 2017 Quarter compared to the 2016 Quarter primarily from weaker fuel margins in alldue to the impacts of the regions in which we operate in conjunction with lower fuel sales, partially offset by lower operating expenses. Fuel sales volumes decreased3% during theof cost or market (“LCM”) adjustments. The 2017 Quarter versus the same period in 2016 driven by inclement weather along the West Coast. The resultinghad a negative impact on demand was partially offset by growthof $209 million, but the 2016 Quarter had a positive impact of $363 million. In addition, manufacturing costs were higher primarily due higher energy costs and one month of operating expenses related to the Western Refining Acquisition. Average U.S. Mid-Continent crack spreads increased $8.21 to $21.13 in our portfolio of branded stations.
GROSS MARGIN. Gross margin decreased$99 million to $219 million during the 2017 Quarter compared to the 2016 Quarter. Gasoline marginsAverage U.S. West Coast crack spreads were approximately $19 per barrel, which remained relatively flat in Southern California returnedthe 2017 Quarter compared to the normal range after experiencing above average margins2016 Quarter.
CALIFORNIA REGION. Gross refining margin declined $220 million in the 2017 Quarter to $521 million, or $10.78 per barrel, compared to the 2016 Quarter of $741 million, or $15.87 per barrel, primarily due to the impacts of the LCM in each period. LCM for the 2017 Quarter negatively impacted gross margin by $98 million compared to a positive impact in the 2016 Quarter driven by volatilityof $235 million. Partially offsetting this impact was an increase in refining throughput for the West Coast gasoline market. Near record weather conditions alongregion of 18 Mbpd to 531 Mbpd for the West Coast reduced demand and dampened margins2017 Quarter. In addition, manufacturing costs increased in the 2017 Quarter to $6.02 per barrel compared to $5.47 per barrel driven by higher energy prices and the timing of maintenance expenses.
PACIFIC NORTHWEST REGION. Gross refining margin declined $124 million in the 2017 Quarter to $73 million, or $4.72 per barrel, compared to the 2016 Quarter of $197 million, or $13.70 per barrel, primarily due to the impacts of the LCM in each period. LCM for the 2017 Quarter negatively impacted gross margin by $46 million compared to a positive impact in the 2016 Quarter of $85 million. Partially offsetting this impact was an increase in refining throughput for the region of 12 Mbpd to 170 Mbpd for the 2017 Quarter. In addition, manufacturing costs increased in the 2017 Quarter to $4.72 per barrel compared to $3.95 per barrel driven by higher energy prices and unplanned maintenance expenses.
MID-CONTINENT REGION.Gross refining margin declined $34 million in the 2017 Quarter to $174 million, or $9.96 per barrel, compared to the 2016 Quarter of $208 million, or $17.45 per barrel primarily due to the impacts of the LCM in each period. LCM for the 2017 Quarter negatively impacted gross margin by $65 million compared to a positive impact in the 2016 Quarter of $43 million. In addition, our Mandan refinery throughput was lower due to a longer than expected turnaround during the 2017 Quarter. Partially offsetting this impact were the results from the operations from the Western Refining Acquisition for the month of June, which led to a significant increase in refining throughput for the region of 61 Mbpd to 192 Mbpd for the 2017 Quarter. In addition, manufacturing costs increased in the 2017 Quarter to $5.49 per barrel compared to $4.45 per barrel driven by higher energy prices and additional operations.
|
| | |
| MANAGEMENT’S DISCUSSION AND ANALYSIS |
REFINING SEGMENT OPERATING RESULTS BY REGION (dollars in millions, except per barrel amounts)
|
| | | | | | | | | | | | | | | | | | | | | | | |
| | Three Months Ended June 30, |
| | 2017 | | 2016 | | 2017 | | 2016 | | 2017 | | 2016 |
| | California (Martinez and Los Angeles) | | Pacific Northwest (Washington and Alaska) | | Mid-Continent (North Dakota, Utah, Minnesota, New Mexico and Texas) |
Revenues | | | | | | | | | | | |
| Refined products | $ | 4,048 |
| | $ | 3,731 |
| | $ | 1,174 |
| | $ | 1,006 |
| | $ | 1,436 |
| | $ | 771 |
|
| Crude oil resales and other | 77 |
| | 22 |
| | 65 |
| | 58 |
| | 249 |
| | 163 |
|
| Total Revenues | 4,125 |
| | 3,753 |
| | 1,239 |
| | 1,064 |
| | 1,685 |
| | 934 |
|
| Refining Cost of Sales | | | | | | | | | | | |
| Cost of sales (excluding LCM) | 3,506 |
| | 3,247 |
| | 1,120 |
| | 952 |
| | 1,446 |
| | 769 |
|
| LCM | 98 |
| | (235 | ) | | 46 |
| | (85 | ) | | 65 |
| | (43 | ) |
| Total Cost of Sales | 3,604 |
| | 3,012 |
| | 1,166 |
| | 867 |
| | 1,511 |
| | 726 |
|
| Gross refining margin | 521 |
| | 741 |
| | 73 |
| | 197 |
| | 174 |
| | 208 |
|
| Expenses | | | | | | | | | | | |
| Manufacturing costs | 291 |
| | 255 |
| | 73 |
| | 57 |
| | 96 |
| | 53 |
|
| Other operating expenses | 59 |
| | 50 |
| | 20 |
| | 15 |
| | 25 |
| | 41 |
|
| General and administrative expenses | 2 |
| | 2 |
| | — |
| | — |
| | 1 |
| | — |
|
| Depreciation and amortization expenses | 93 |
| | 97 |
| | 27 |
| | 21 |
| | 33 |
| | 28 |
|
| Loss on asset disposals and impairments | 3 |
| | — |
| | — |
| | — |
| | — |
| | — |
|
| Operating Income (Loss) | $ | 73 |
| | $ | 337 |
| | $ | (47 | ) | | $ | 104 |
| | $ | 19 |
| | $ | 86 |
|
| Refining throughput (Mbpd) | 531 |
| | 513 |
| | 170 |
| | 158 |
| | 192 |
| | 131 |
|
| Gross refining margin per throughput barrel | $ | 10.78 |
| | $ | 15.87 |
| | $ | 4.72 |
| | $ | 13.70 |
| | $ | 9.96 |
| | $ | 17.45 |
|
| Manufacturing costs per throughput barrel | $ | 6.02 |
| | $ | 5.47 |
| | $ | 4.72 |
| | $ | 3.95 |
| | $ | 5.49 |
| | $ | 4.45 |
|
2017 YEAR TO DATE PERIOD VERSUS 2016 YEAR TO DATE PERIOD
HIGHLIGHTS
|
| | |
| MANAGEMENT’S DISCUSSION AND ANALYSIS | |
REFINING THROUGHPUT (Mbpd)
| |
| (a) | We define heavy crude oil as crude oil with an American Petroleum Institute gravity of 24 degrees or less. |
YIELD (Mbpd)
REFINED PRODUCT SALES (a) (Mbpd)
| |
| (a) | Sources of total refined product sales include refined products manufactured at our refineries and refined products purchased fromthird parties. Total refined product sales include sales of manufactured and purchased refined products. Refined product sales include all sales through our Marketing segment as well as in bulk markets and exports through our Refining segment. |
|
| | |
| MANAGEMENT’S DISCUSSION AND ANALYSIS |
REFINING SEGMENT OPERATING DATA AND RESULTS (in millions, except per barrel amounts)
|
| | | | | | | |
| | Six Months Ended June 30, |
| | 2017 | | 2016 |
| Refining Revenues | | | |
| Refined products (a) | $ | 12,470 |
| | $ | 9,793 |
|
| Crude oil resales and other | 635 |
| | 453 |
|
| Total Revenues | 13,105 |
| | 10,246 |
|
| Refining Cost of Sales | | | |
| Cost of sales (excluding LCM) | 11,427 |
| | 8,776 |
|
| LCM | 209 |
| | (216 | ) |
| Total Cost of Sales | 11,636 |
| | 8,560 |
|
| Gross refining margin | 1,469 |
| | 1,686 |
|
| Expenses | | | |
| Operating expenses | | | |
| Manufacturing costs | 881 |
| | 760 |
|
| Other operating expenses | 199 |
| | 194 |
|
| General and administrative expenses | 5 |
| | 4 |
|
| Depreciation and amortization expenses | 301 |
| | 294 |
|
| Loss on asset disposals and impairments | 4 |
| | — |
|
| Segment Operating Income | $ | 79 |
| | $ | 434 |
|
| Gross refining margin per throughput barrel | $ | 9.45 |
| | $ | 11.70 |
|
| Manufacturing costs per throughput barrel | $ | 5.67 |
| | $ | 5.28 |
|
| |
| (a) | Refined product sales include intersegment sales to our Marketing segment of $7.7 billion and $6.8 billion for the 2017 Period and the 2016 Period, respectively. |
OVERVIEW. Operating income for our Refining segment decreased $355 million to $79 million during the 2017 Period compared to the 2016 Period due to the impact of the LCM adjustments. The 2017 Period had a negative impact of $209 million, but the 2016 Period had a positive impact of $216 million. In addition, manufacturing costs were higher primarily due to higher energy costs. Average U.S. Mid-Continent crack spreads increased $7.19 to $18.92 in the 2017 Period compared to the 2016 Period. Average U.S. West Coast crack spreads were approximately $18 per barrel in the 2017 Period, which remained relatively flat compared to the 2016 Period.
CALIFORNIA REGION. Gross refining margin declined $145 million in the 2017 Period to $995 million, or $10.65 per barrel, compared to the 2016 Period of $1.1 billion, or $12.86 per barrel, primarily due to the impacts of the LCM in each period. LCM for the 2017 Period negatively impacted gross margin by $98 million compared to a positive impact in the 2016 Period of $144 million. Partially offsetting this impact was an increase in refining throughput for the region of 29 Mbpd to 516 Mbpd for the 2017 Period. In addition, manufacturing costs increased in the 2017 Period to $6.27 per barrel compared to $6.07 per barrel driven by higher energy prices and the timing of maintenance expenses.
PACIFIC NORTHWEST REGION. Gross refining margin declined $64 million in the 2017 Period to $201 million, or $6.24 per barrel, compared to the 2016 Period of $265 million, or $8.47 per barrel, primarily due to the impacts of the LCM in each period. LCM for the 2017 Period negatively impacted gross margin by $46 million compared to a positive impact in the 2016 Period of $52 million. Partially offsetting this impact was an increase in refining throughput for the region of 6 Mbpd to 178 Mbpd for the 2017 Period. In addition, manufacturing costs increased in the 2017 Period to $4.35 per barrel compared to $3.87 per barrel driven by higher energy prices and unplanned maintenance expenses.
MID-CONTINENT REGION.Gross refining margin declined slightly in the 2017 Period to $273 million, or $9.14 per barrel, compared to the 2016 Period of $281 million, or $11.61 per barrel primarily due to the impacts of the LCM in each period. LCM for the 2017 Period negatively impacted gross margin by $65 million compared to a positive impact in the 2016 Period of $20 million. Partially offsetting this impact were the results from the operations from the Western Refining Acquisition for the month of June, which led to a significant increase in refining throughput for the region of 32 Mbpd to 165 Mbpd for the 2017 Period. In addition, manufacturing costs increased in the 2017 Period to $5.19 per barrel compared to $4.17 per barrel driven by higher energy prices and additional operations.
|
| | |
| MANAGEMENT’S DISCUSSION AND ANALYSIS | |
REFINING SEGMENT OPERATING RESULTS BY REGION (dollars in millions, except per barrel amounts)
|
| | | | | | | | | | | | | | | | | | | | | | | |
| | Six Months Ended June 30, |
| | 2017 | | 2016 | | 2017 | | 2016 | | 2017 | | 2016 |
| | California (Martinez and Los Angeles) | | Pacific Northwest (Washington and Alaska) | | Mid-Continent (North Dakota, Utah, Minnesota, New Mexico and Texas) |
Revenues | | | | | | | | | | | |
| Refined products | $ | 7,972 |
| | $ | 6,678 |
| | $ | 2,266 |
| | $ | 1,788 |
| | $ | 2,232 |
| | $ | 1,327 |
|
| Crude oil resales and other | 221 |
| | 102 |
| | 118 |
| | 86 |
| | 296 |
| | 265 |
|
| Total Revenues | 8,193 |
| | 6,780 |
| | 2,384 |
| | 1,874 |
| | 2,528 |
| | 1,592 |
|
| Refining Cost of Sales | | | | | | | | | | | |
| Cost of sales (excluding LCM) | 7,100 |
| | 5,784 |
| | 2,137 |
| | 1,661 |
| | 2,190 |
| | 1,331 |
|
| LCM | 98 |
| | (144 | ) | | 46 |
| | (52 | ) | | 65 |
| | (20 | ) |
| Total Cost of Sales | 7,198 |
| | 5,640 |
| | 2,183 |
| | 1,609 |
| | 2,255 |
| | 1,311 |
|
| Gross refining margin | 995 |
| | 1,140 |
| | 201 |
| | 265 |
| | 273 |
| | 281 |
|
| Expenses | | | | | | | | | | | |
| Manufacturing costs | 586 |
| | 538 |
| | 140 |
| | 121 |
| | 155 |
| | 101 |
|
| Other operating expenses | 115 |
| | 86 |
| | 38 |
| | 28 |
| | 46 |
| | 80 |
|
| General and administrative expenses | 4 |
| | 4 |
| | — |
| | — |
| | 1 |
| | — |
|
| Depreciation and amortization expenses | 187 |
| | 188 |
| | 54 |
| | 44 |
| | 60 |
| | 62 |
|
| Loss on asset disposals and impairments | 4 |
| | — |
| | — |
| | — |
| | — |
| | — |
|
| Operating Income (Loss) | $ | 99 |
| | $ | 324 |
| | $ | (31 | ) | | $ | 72 |
| | $ | 11 |
| | $ | 38 |
|
| Refining throughput (Mbpd) | 516 |
| | 487 |
| | 178 |
| | 172 |
| | 165 |
| | 133 |
|
| Gross refining margin per throughput barrel | $ | 10.65 |
| | $ | 12.86 |
| | $ | 6.24 |
| | $ | 8.47 |
| | $ | 9.14 |
| | $ | 11.61 |
|
| Manufacturing costs per throughput barrel | $ | 6.27 |
| | $ | 6.07 |
| | $ | 4.35 |
| | $ | 3.87 |
| | $ | 5.19 |
| | $ | 4.17 |
|
|
| | |
| MANAGEMENT’S DISCUSSION AND ANALYSIS |
CAPITAL RESOURCES AND LIQUIDITY
OVERVIEW
Our capital resources and liquidity are impacted by changes in the price of crude oil and refined products, availability of trade credit, market uncertainty and a variety of additional factors beyond our control. These factors include the level of consumer demand for transportation fuels, weather conditions, fluctuations in seasonal demand, governmental regulations, geo-political conditions and overall market and global economic conditions. See “Important Information Regarding Forward-Looking Statements” for further information related to risks and other factors. Future capital expenditures, as well as borrowings under our credit agreements and other sources of capital, may be affected by these conditions.
|
| | |
| | MANAGEMENT’S DISCUSSION AND ANALYSIS |
CAPITALIZATION
CAPITAL STRUCTURE (in millions)
|
| | | | | | | |
| | March 31,
2017 | | December 31,
2016 |
| Debt, including current maturities: | | | |
| Tesoro Senior Notes | $ | 2,825 |
| | $ | 2,825 |
|
| Term Loan Facility | 63 |
| | 64 |
|
| Capital lease obligations and other | 42 |
| | 44 |
|
| Tesoro Debt | 2,930 |
| | 2,933 |
|
| TLLP Credit Facilities | 40 |
| | 330 |
|
| TLLP Senior Notes | 3,770 |
| | 3,770 |
|
| TLLP Capital lease obligations and other | 9 |
| | 9 |
|
| TLLP Debt | 3,819 |
| | 4,109 |
|
| Total Debt | 6,749 |
| | 7,042 |
|
| Unamortized Issuance Costs (a) | (106 | ) | | (109 | ) |
| Debt, Net of Unamortized Issuance Costs | 6,643 |
| | 6,933 |
|
| Total Equity | 8,334 |
| | 8,127 |
|
| Total Capitalization | $ | 14,977 |
| | $ | 15,060 |
|
|
| | | | | | | |
| | June 30,
2017 | | December 31,
2016 |
| Debt, including current maturities: | | | |
| Andeavor | | | |
| Credit Facility | $ | 575 |
| | $ | — |
|
| Senior Notes | 2,825 |
| | 2,825 |
|
| Term Loan Facility | 59 |
| | 64 |
|
| Capital Lease Obligations and Other | 107 |
| | 44 |
|
| Andeavor Debt | 3,566 |
| | 2,933 |
|
| Andeavor Logistics | | | |
| Credit Facilities | 50 |
| | 330 |
|
| Senior Notes | 3,770 |
| | 3,770 |
|
| Capital Lease Obligations and Other | 9 |
| | 9 |
|
| Andeavor Logistics Debt | 3,829 |
| | 4,109 |
|
| WNRL | | | |
| Credit Facilities | 20 |
| | — |
|
| Senior Notes | 300 |
| | — |
|
| WNRL Debt | 320 |
| | — |
|
| Total Debt | 7,715 |
| | 7,042 |
|
| Unamortized Issuance Costs and Premiums(a) | (73 | ) | | (109 | ) |
| Debt, Net of Unamortized Issuance Costs | 7,642 |
| | 6,933 |
|
| Total Equity | 12,423 |
| | 8,127 |
|
| Total Capitalization | $ | 20,065 |
| | $ | 15,060 |
|
| |
(a) | The unamortized issuance costs for TLLP were $53 million and $55 million as of March 31, 2017 and December 31, 2016, respectively.
|
Our debt, net of unamortized issuance costs, to capitalization ratio was 44%38% and 46% at March 31,June 30, 2017 and December 31, 2016, respectively. Our debt to capitalization ratio, excluding TLLP,Andeavor Logistics and WNRL, was 34%28% and 35% at March 31,June 30, 2017 and December 31, 2016; this2016. This calculation excludes (a) TLLPAndeavor Logistics total debt, which is net of unamortized issuance costs, of $3.8 billion and $4.1 billion at March 31,June 30, 2017 and December 31, 2016, respectively, (b) WNRL total debt of $346 million at June 30, 2017 and (b)(c) noncontrolling interest of $2.8$3.5 billion and $2.7 billion at March 31,June 30, 2017 and December 31, 2016, respectively. TLLP’sAndeavor Logistics’ and WNRL’s debt is non-recourse to Tesoro,Andeavor, except for TLGP.TLGP and Western Refining Logistics GP, LLC.
CREDIT FACILITIES OVERVIEW
Our primary sources of liquidity are cash flows from operations with additional sources available under borrowing capacity from our revolving lines of credit. We ended the 2017 Quarter with $2.3$1.1 billion of cash and cash equivalents and $40equivalents. As of June 30, 2017, there was $575 million inof borrowings under the TLLP’s senior secured revolving credit agreement (the “TLLP Revolving Credit Facility”). There were no borrowings under the Tesoro CorporationAndeavor revolving credit facility (the “Revolving Credit Facility”) or, $50 million in borrowings under the Andeavor Logistics senior secured revolving credit agreement (the “Andeavor Logistics Revolving Credit Facility”), $20 million in borrowings under the WNRL secured revolving credit agreement (the “WNRL Revolving Credit Facility”), and no borrowings under the secured TLLP drop downAndeavor Logistics dropdown credit facility (the “TLLP“Andeavor Logistics Dropdown Credit Facility”). During the 2017 Quarter we paid the balance, approximately $45 million, of Western Refining’s revolving credit facilities upon acquisition. We believe available capital resources will be adequate to meet our capital expenditure, working capital, debt service and planned acquisition requirements.
AVAILABLE CAPACITY UNDER CREDIT FACILITIES (in millions)
|
| | | | | | | | | | | | | | | | | |
| | Total Capacity | | Amount Borrowed as of March 31, 2017 | | Outstanding Letters of Credit | | Available Capacity | | Expiration |
Tesoro Corporation Revolving Credit Facility (a) | $ | 2,000 |
| | $ | — |
| | $ | 4 |
| | $ | 1,996 |
| | September 30, 2020 |
| TLLP Revolving Credit Facility | 600 |
| | 40 |
| | — |
| | 560 |
| | January 29, 2021 |
| TLLP Dropdown Credit Facility | 1,000 |
| | — |
| | — |
| | 1,000 |
| | January 29, 2021 |
| Letter of Credit Facilities | 975 |
| | — |
| | — |
| | 975 |
| | |
| Total Credit Facilities | $ | 4,575 |
| | $ | 40 |
| | $ | 4 |
| | $ | 4,531 |
| | |
| |
| (a) | The $2.0 billion total capacity does not includeunamortized issuance costs for Andeavor Logistics were $50 million and $55 million as of June 30, 2017 and December 31, 2016, respectively. The incremental fair value of the additional $1.0 billion related toWNRL senior notes was $26 million at acquisition, which is reflected in the incremental revolving facility. $73 million presented above and will be amortized over the life of the senior notes. |
|
| | |
| | | March 31,June 30, 2017 | 3743
|
|
| | |
| MANAGEMENT’S DISCUSSION AND ANALYSIS | |
AVAILABLE CAPACITY UNDER CREDIT FACILITIES (in millions)
|
| | | | | | | | | | | | | | | | | | | | |
| | Total Capacity | | Amount Borrowed as of June 30, 2017 | | Outstanding Letters of Credit | | Available Capacity | | Weighted Average Interest Rate | | Expiration |
| Andeavor Revolving Credit Facility (a) | $ | 3,000 |
| | $ | 575 |
| | $ | 46 |
| | $ | 2,379 |
| | 2.56 | % | | September 30, 2020 |
| Andeavor Logistics Revolving Credit Facility | 600 |
| | 50 |
| | — |
| | 550 |
| | 3.31 | % | | January 29, 2021 |
| Andeavor Logistics Dropdown Credit Facility | 1,000 |
| | — |
| | — |
| | 1,000 |
| | — | % | | January 29, 2021 |
| WNRL Revolving Credit Facility | 500 |
| | 20 |
| | 1 |
| | 479 |
| | 3.08 | % | | October 16, 2018 |
| Letter of Credit Facilities | 975 |
| | — |
| | — |
| | 975 |
| | | | |
| Total Credit Facilities | $ | 6,075 |
| | $ | 645 |
| | $ | 47 |
| | $ | 5,383 |
| | | | |
| |
| (a) | The $3.0 billion Andeavor Revolving Credit Facility total capacity includes the additional $1.0 billion related to the incremental revolving facility. |
REVOLVING CREDIT FACILITIES EXPENSES AND FEES
|
| | | | | | | | | |
| Credit Facility | 30 Day Eurodollar (LIBOR) Rate at March 31, 2017 | | Eurodollar Margin | | Base Rate | | Base Rate Margin | | Commitment Fee
(unused portion) |
Tesoro Corporation Revolving Credit Facility ($2.0 billion) | 0.98% | | 1.75% | | 4.00% | | 0.75% | | 0.300% |
| TLLP Revolving Credit Facility ($600 million) (a) | 0.98% | | 2.25% | | 4.00% | | 1.25% | | 0.375% |
| TLLP Dropdown Credit Facility ($1.0 billion) | 0.98% | | 2.26% | | 4.00% | | 1.26% | | 0.375% |
|
| | | | | | | | | |
| Credit Facility | 30 Day Eurodollar (LIBOR) Rate at June 30, 2017 | | Eurodollar Margin | | Base Rate | | Base Rate Margin | | Commitment Fee
(unused portion) |
Andeavor Revolving Credit Facility ($3.0 billion) | 1.74% | | 1.50% | | 4.25% | | 0.50% | | 0.225% |
| Andeavor Logistics Revolving Credit Facility ($600 million) | 1.74% | | 2.25% | | 4.25% | | 1.25% | | 0.375% |
| Andeavor Logistics Dropdown Credit Facility ($1.0 billion) | 1.74% | | 2.26% | | 4.25% | | 1.26% | | 0.375% |
WNRL Revolving Credit Facility ($500 million) | 1.23% | | 2.00% | | 4.25% | | 1.00% | | 0.300% |
| |
(a) | The weighted average interest rate for borrowings under the secured TLLP Revolving Credit Facility was 3.23% at March 31, 2017.
|
COVENANTS.OurThe Andeavor Revolving Credit Facility, as amended,Andeavor senior notes, TLLPAndeavor Logistics Revolving Credit Facility, TLLPAndeavor Logistics Dropdown Credit Facility, Andeavor Logistics senior notes, WNRL Revolving Credit Facility, and TLLPWNRL senior notes include certain negative, affirmative and financial covenants a number of which will either no longer apply or become less restrictive if an investment grade rating from either Moody's Investors Service or S&P Global Ratings is achieved, that may limit or restrict the ability of TesoroAndeavor, Andeavor Logistics, WNRL and itstheir subsidiaries to:
pay dividends and make other distributions with respect to our capital stock and purchase, redeem or retire our capital stock;
enter into certain hedging agreements;
incur additional indebtedness;
sell assets unless the proceeds from those sales are used to repay debt or are reinvested in our business;
incur liens on assets to secure certain debt;
engage in certain business activities;
make certain payments and distributions from our subsidiaries;
engage in certain investments, mergers or consolidations and transfers of assets; and
enter into non-arm’s length transactions with affiliates.
Following S&P Global Ratings raising Andeavor’s corporate credit and senior unsecured issue ratings in the 2017 Quarter to “BBB-” with a stable outlook from “BB+”, a number of these covenants as it relates to Andeavor debt either no longer apply or have become less restrictive. We do not believe that the limitations related to the remaining covenants will restrict our ability to pay dividends (distributions for TLLP)Andeavor Logistics and WNRL) or repurchase stock under our current programs. We also have financial covenants that require Tesoro or TLLPAndeavor Logistics and WNRL to maintain certain interest coverage and leverage ratios. There were no changes to the covenants for Andeavor Logistics and WNRL during the 2017 Quarter. We were in compliance with our debt covenants as of and for the threesix months ended March 31,June 30, 2017.
SHARE REPURCHASES
We are authorized by our Board of Directors (the “Board”) to purchase shares of our common stock in open market transactionsatourdiscretion.TheBoard’s authorization has no time limit and may be suspended or discontinued at any time.Wecanrepurchaseourcommonstocktooffsetthedilutiveeffectofstock-basedcompensationawardsandto meetourobligationsunderemployeebenefitandcompensationplans. We did notcan repurchase any shares of our common stock in open market transactions duringto offset the dilutive effect of stock-based compensation awards and to meet our obligations under employee benefit and compensation plans. During the six months ended June 30, 2017 Quarter or theand 2016, Quarter. We have over $2.1 billion remaining under our authorized programs as of March 31, 2017.
CASH DIVIDENDS
We paid cash dividends totaling $65we repurchased approximately 1.6 million during the 2017 Quarter based on $0.55 per share and $601.3 million for the 2016 Quarter based on $0.50 per share. On May 5, 2017, our Board declared a cash dividend of $0.55 per share payable on June 15, 2017 to shareholders of record on May 19, 2017.
CASH FLOW SUMMARY
Working capital (excluding cash) increased $345 million in the 2017 Quarter primarily related to the timing of our payments for crude oil and refined product purchases.
COMPONENTS OF OUR CASH FLOWS (in millions)
|
| | | | | | | |
| | Three Months Ended March 31, |
| | 2017 | | 2016 |
| Cash Flows From (Used in): | | | |
| Operating activities | $ | 100 |
| | $ | 184 |
|
| Investing activities | (929 | ) | | (535 | ) |
| Financing activities | (168 | ) | | (152 | ) |
| Decrease in Cash and Cash Equivalents | $ | (997 | ) | | $ | (503 | ) |
OPERATING ACTIVITIES. Net cash from operating activities during the 2017 Quarter totaled $100 million compared to $184 million in the 2016 Quarter. The $84 million decrease in cash from operating activities was primarily driven by higher maintenance costs at our California refineries, higher energy costs, and acquisition and integration costs associated with the Merger and TLLP’s acquisition of the North Dakota Gathering and Processing Assets during the 2017 Quarter.
INVESTING ACTIVITIES.The increase of $394 million in net cash used in investing activities to $929 million for the 2017 Quarter compared to $535 million in the 2016 Quarter was primarily due to TLLP’s acquisition of the North Dakota Gathering and Processing Assets. The 2016 Quarter included our acquisition of Great Northern Midstream LLC.
shares
|
| | |
3844 | Tesoro Corporation
| | |
|
| | |
| | | MANAGEMENT’S DISCUSSION AND ANALYSIS |
of our common stock for approximately $148 million and $100 million, respectively. We have approximately $2.0 billion remaining under our authorized programs as of June 30, 2017.
CASH DIVIDENDS
We paid cash dividends totaling $130 million during the 2017 Period based on $0.55 per share and $121 million for the 2016 Period based on $0.50 per share. On August 7, 2017, our Board declared a cash dividend of $0.59 per share payable on September 15, 2017 to shareholders of record on August 31, 2017.
CASH FLOW SUMMARY
Working capital (excluding cash) increased $256 million in the 2017 Period primarily due to the acquisition of Western Refining.
COMPONENTS OF OUR CASH FLOWS (in millions)
|
| | | | | | | |
| | Six Months Ended June 30, |
| | 2017 | | 2016 |
| Cash Flows From (Used in): | | | |
| Operating activities | $ | 770 |
| | $ | 628 |
|
| Investing activities | (1,448 | ) | | (806 | ) |
| Financing activities | (1,556 | ) | | 357 |
|
| Increase (Decrease) in Cash and Cash Equivalents | $ | (2,234 | ) | | $ | 179 |
|
FINANCINGACTIVITIES.OPERATING ACTIVITIES. Netcashusedinfinancing from operating activities during the 2017 QuarterPeriod totaled $168$770 million compared to $152$628 million in the 2016 Period. The $142 million increase in cash from operating activities was primarily driven by higher cash flow from changes in assets and liabilities along with higher net earnings before the impact of non-cash items such as the LCM adjustments and depreciation and amortization expenses partially offset by higher turnaround and branding charges.
INVESTING ACTIVITIES.The increase of $642 million in net cash used in investing activities to $1.4 billion for the 2017 Period compared to $806 million in the 2016 Period was primarily due to the North Dakota Gathering and Processing Assets acquisition by Andeavor Logistics, our Western Refining Acquisition and higher capital expenditures. The 2016 Period included our acquisitions of Great Northern Midstream LLC, our Dickinson refinery and assets from Flint Hills Resources.
FINANCING ACTIVITIES. Net cash from financing activities during the 2016 Quarter.Period totaled $357 million compared to $1.6 billion used in the 2017 Period. The $16 million$1.9 billion increase in cash used was primarily attributable to netpaymentsof$290millionontheTLLPRevolvingCredit Facility$1.6 billion in the 2017 Quarter offset by $281repayments of debt related to Western Refining compared to $253 million of netduring 2016. In addition, we did not have any proceeds from debt offerings, but the issuance of TLLP common units2016 Period had $701 million. Partially offsetting these uses in February 2017.cash was increased funding from credit facilities, mostly attributable to funding for the Western Refining Acquisition.
CAPITAL EXPENDITURES
In our Annual Report on Form 10-K for the year ended December 31, 2016, we had expected capital expenditures at TesoroAndeavor for the year ended December 31, 2017 to be $870 million comprising of growth, maintenance andregulatoryexpendituresof$325 $325 million, $455 million and $90 million, respectively. However, givenin conjunction with the delay in timing of permit approvalsMerger, we have updated our expectations for capital expenditures for the Company’s major projects, Tesoroyear ended December 31, 2017. Andeavor now anticipates full year 2017 capital expenditures to be approximately $770$1.35 billion, consisting of approximately $1.0 billion at Andeavor, $325 million reflecting a new growth capital expectationat Andeavor Logistics and $25 million at WNRL. During the quarter, we received permits on the Los Angeles Refinery Integration and Compliance and the Anacortes Isomerization projects and commenced work on both starting in the third quarter of $225 million with no change to maintenance or regulatory expenditures. Additionally, TLLP continues to expect2017capitalspendingtobe$325 million comprised of growth and maintenance expenditures of $230 million and$95 million,respectively. Aside from the delay in timing for certain of our growth projects as a result of the permitting process, there have been no other material changes to committed amounts for our major capital projects previously discussed in our Annual Report on Form 10-K for the year ended December 31, 2016.2017.
TURNAROUNDS AND BRANDING CHARGES
There have been no material changes toWe updated our planned turnaround and branding charges expenditures and the refinery locations that have scheduled turnarounds due to the Western Refining Acquisition from our plan outlined insince our Annual Report on Form 10-K for the year ended December 31, 2016. We continue to expect expenditures for turnaroundsTurnarounds and branding charges to beas disclosed in our 10-K were $360 million and $100 million, respectively. We now expect approximately $485 million in turnaround expenditures with no changes to branding charges.
OFF-BALANCE SHEET ARRANGEMENTS
We have not entered into any transactions, agreements or other contractual arrangements that would result in off-balance sheet liabilities other than our leasing arrangements described in Note 15 of our Annual Report on Form 10-K for the year ended December 31, 2016.
ENVIRONMENTAL LIABILITIES
We are subject to extensive federal, state and local environmental laws and regulations. These laws, which change frequently, regulate the discharge of materials into the environment and may require us to remove or mitigate the environmental effects of the disposal or release of petroleum or chemical substances at various sites, install additional controls or make other modifications to certain emission sources, equipment or facilities. See further discussion in Part II, Item 7 of our Annual Report on Form 10-K for the year ended December 31, 2016.
We are incurring and expect to continue to incur expenses for environmental remediation liabilities at a number of currently and previously owned or operated refining, pipeline, terminal and retail stationstore properties. We have accrued liabilities totaling $210$208 million and $227 million at March 31,June 30, 2017 and December 31, 2016, respectively, including $18$13 million and $22 million for TLLP,Andeavor Logistics, respectively.
No material developments occurred with respect to proceedings previously reported in our Annual Report on Form 10-K for the year ended December 31, 2016.
OTHER MATTERS
|
| | |
| MANAGEMENT’S DISCUSSION AND ANALYSIS | |
OTHER MATTERS
In the ordinary course of business, we become party to lawsuits, administrative proceedings and governmental investigations, including regulatory, environmental regulatory and other matters. Large, and sometimes unspecified, damages or
penalties may be sought from us in some matters. We have not established accruals for these matters unless a loss is probable, and the amount of loss is currently estimable. We assumed all contractual obligations of Western Refining in the Western Refining Acquisition.
IMPORTANT INFORMATION REGARDING FORWARD-LOOKING STATEMENTS
This report (including information incorporated by reference) contains “forward-looking statements” within the meaning of Section 27A of the Securities Act of 1933 and Section 21E of the Securities Exchange Act of 1934. All statements other than statements of historical fact, including without limitation statements regarding our business strategy and goals, and expectations regarding refining margins, revenues, cash flows, capital expenditures, turnaround expenses, other financial items, growth, acquisitions, our market position, future operations, margins and profitability, are forward-looking statements. Forward-looking statements may be identified by use of the words “anticipate,” “believe,” “could,” “estimate,” “expect,” “intend,” “may,” “plan,” “predict,” “project,” “will,” “would” and similar terms and phrases. Although we believe our assumptions concerning future events are reasonable, a number of risks, uncertainties and other factors could cause actual results and trends to differ materially from those projected, including, but not limited to:
the constantlychanging margin between the price we pay forcrudeoilandotherrefineryfeedstocksaswellasrenewableidentificationnumbers(“RINs”)and environmental credits, and the prices at which we are able to sell refined products;
changes in the expected value of and benefits derived from acquisitions and capital projects;projects, including any inability to successfully integrate acquisitions or realize expected synergies;
changes in global economic conditions on our business, especially in California, and the business of our suppliers, customers, business partners and credit lenders;
|
| | |
MANAGEMENT’S DISCUSSION AND ANALYSIS | | |
changes in fuel and utility costs for our facilities;
changes in the cost or availability of third-party vessels, pipelines and other means of transporting crude oil feedstocks and refined products;
regulatory and other requirements concerning the transportation of crude oil, particularly from the Bakken area;
changes in the carrying costs of our inventory;
the timing and extent of changes in commodity prices and underlying demand for our refined products, natural gas and NGLs;
the availability and costs of crude oil, other refinery feedstocks, refined products and RINs;
changes in our cash flow from operations;
direct or indirect effects on our business resulting from actual or threatened terrorist incidents, cyber-security breaches or acts of war;
weather conditions, earthquakes or other natural disasters
affecting our operations or the areas in which our refined products are marketed;
actions of customers and competitors;
state and federal environmental, economic, health and safety, energy and other policies and regulations, including
those related to climate change and any changes therein, and any legal or regulatory investigations, delays in obtaining necessary approvals and permits, compliance costs or other factors beyond our control;
adverse rulings, judgments, or settlements in litigation or other legal or tax matters, including unexpected environmental remediation costs in excess of any reserves;
operational hazards inherent in refining operations and in transporting and storing crude oil and refined products;
changes in our credit profile;
changes in capital requirements or in execution of planned capital projects;
disruptions due to equipment interruption or failure at our facilities or third-party facilities;
seasonal variations in demand for refined products and natural gas;
risks related to labor relations and workplace safety;
political developments; and
the factors described in greater detail under “Competition” and “Risk Factors” in Items 1 and 1A of our Annual Report on Form 10-K for the year ended December 31, 2016,, and our other filings with the SEC.
Securities and Exchange Commission (“SEC”).
All forward-looking statements included in this report are based on information available to us on the date of this report. We undertake no obligation to revise or update any forward-looking statements as a result of new information, future events or otherwise.
ITEM 3. QUANTITATIVE AND QUALITATIVE DISCLOSURES ABOUT MARKET RISK
| |
| ITEM 3. | QUANTITATIVE AND QUALITATIVE DISCLOSURES ABOUT MARKET RISK |
There have been no material changes to our market risks as of and for the threesix months ended March 31,June 30, 2017 from the risks discussed in Part II, Item 7A of our Annual Report on Form 10-K for the year ended December 31, 2016.
ITEM 4. CONTROLS AND PROCEDURES
Our disclosure controls and procedures are designed to provide reasonable assurance that the information that we are required to disclose in reports we file under the Securities Exchange Act of 1934, as amended (“the Exchange Act”), is accumulated and appropriately communicated to management. There have been no significant changes in ourthe registrant's internal controlscontrol over financial reporting (as definedidentified in connection with the evaluation required by applicable Securities andparagraph (d) of Exchange Commission rules)Act Rules 13a-15 or 15d-15 that occurred during the Company's second quarter ended March 31,of 2017 that havehas materially affected, or areis reasonably likely to materially affect, these controls.the registrant's internal control over financial reporting.
We carried out an evaluation required by Rule 13a-15(b) of the Exchange Act, under the supervision and with the participation of our management, including the Chief Executive Officer and Chief Financial Officer, of the effectiveness of the design and operation of our disclosure controls and procedures at the end of the reporting period. Based on that evaluation, the Chief Executive Officer and Chief Financial Officer concluded that our disclosure controls and procedures are effective.were effective as of the end of the reporting period.
We acquired Western Refining, Inc. on June 1, 2017 and its total assets and revenues constituted 30.8% and 5.7%, respectively, of Andeavor’s consolidated total assets and revenues as shown on our consolidated financial statements as of and for the six months ended June 30, 2017. We will exclude Western Refining, Inc.’s internal control over financial reporting from the scope of management’s 2017 annual assessment of the effectiveness of Andeavor’s disclosure controls and procedures. This exclusion is in accordance with the general guidance issued by the Staff of the SEC that an assessment of a recent business combination may be omitted from management's report on internal control over financial reporting in the first year of consolidation.
|
| | |
40| Tesoro Corporation
| | June 30, 2017 |47 |
|
| | |
| LEGAL PROCEEDINGS AND RISK FACTORS | | |
PART II — OTHER INFORMATION
ITEM 1. LEGAL PROCEEDINGS
In the ordinary course of business, we may become party to lawsuits, administrative proceedings and governmental investigations, including environmental, regulatory and other matters. The information below describes new proceedings or material developments in proceedings that (i) we previously reported in our Annual Report on Form 10-K for the year ended December 31, 2016.2016 or our Quarterly Report on Form 10-Q for the quarter ended March 31, 2017 or (ii) Western Refining previously reported in its Annual Report on Form 10-K for the year ended December 31, 2016 or its Quarterly Report on Form 10-Q for the quarter ended March 31, 2017. Although we cannot provide assurance, we believe that an adverse resolution of such proceedings would not have a material impact on our liquidity, consolidated financial position, or consolidated results of operations.
MERGER-RELATED LITIGATION.2010 WASHINGTON REFINERY FIRE. As describedOn June 8, 2017, the Board of Industrial Insurance Appeals’ (“BIIA”) Judge issued a proposed decision and order vacating the entire citation issued to our Washington refinery by the Washington State Department of Labor & Industries (“L&I”) after the 2010 naphtha hydrotreater unit fire. L&I and the United Steel Workers (“USW”) have until August 31, 2017 to file an appeal. L&I initiated an investigation of the incident and issued a citation in October 2010 with an assessed fine of approximately a $2 million. We appealed the citation in January 2011 as we disagree with L&I’s characterizations of operations at the refinery and believe, based on available evidence and scientific reviews, that many of the agency’s conclusions are mistaken. In separate September 2013, November 2013 and February 2015 orders, the BIIA granted partial summary judgment in our Annual Report on Form 10-K forfavor rejecting 33 of the year ended December 31, 2016, on February 7, 2017, a Tesoro stockholder filed a purported class action complaintoriginal 44 allegations in the Court of Chancery ofcitation as lacking legal or evidentiary support. The hearing on the State of Delaware, on behalf of himself and all other Tesoro stockholders against the current members of our board of directors. The case has been voluntarily dismissed by the plaintiff without prejudice.
AIR QUALITY REGULATIONS. On January 31, 2017, we received an offer to settle 51 Notice of Violations (“NOV”) received from the Bay Area Air Quality Management District (“BAAQMD”). The NOVs were issued fromremaining 11 allegations concluded in July 2011 to July 2015 and allege violations of various air quality regulations at our Martinez refinery.2016. While we are negotiating a settlement of the allegations with the BAAQMD, we cannot currently estimate the final amount or timing of the resolution of this matter, pending an appeal by L&I or the USW, we have retained our previously established accrual for this matter.
ENVIRONMENTAL REQUIREMENTS.On June 30, 2017, we received an offer to settle five Notice of Violations (“NOVs”) received from the South Coast Air Quality Management District (“SCAQMD”). The NOVs were issued from January 2014 to March 2016 and allege violations of air quality regulations at our Los Angeles refinery. While we believeare negotiating a settlement with the SCAQMD and cannot currently estimate the timing of the resolution of this matter, the outcome will not have a material impact on our liquidity, financial position,positions or results of operations.
On July 19, 2017, we finalized settlement of alleged violations of the Resource Conservation and Recovery Act regulations resulting from an EPA inspection of the Gallup refinery in August 2014. The settlement did not contain requirements for groundwater clean-up or capital expenditure and did not have a material impact on our liquidity, financial positions, or results of operations.
On June 6, 2017, we received an offer to settle a NOV that we received from the U.S. Environmental Protection Agency (“EPA”) alleging violations of air emission limits at our St. Paul Park refinery. The NOV was issued in January 2016 and alleges hydrogen sulfide concentrations from the flare exceeds the limit that is required under the Marathon NSR Consent Decree, which was negotiated by the prior owner, Marathon, in 2008-2009. While we are negotiating a settlement with the EPA and cannot currently estimate the timing of the resolution of this matter, the outcome will not have a material impact on our liquidity, financial positions, or results of operations.
In March 2016, the EPA conducted a Risk Management Program inspection at our Gallup refinery and issued an accompanying April 7, 2016 Inspection Report identifying Areas of Concern (“AOC”). We are currently working with the EPA to address the AOC. Although we cannot estimate the timing of the resolution of this matter, the outcome will not have a material impact on our liquidity, financial positions, or results of operations.
ITEM 1A. RISK FACTORS
There have been no significant changes from the risk factors previously disclosed in Item 1A of our Annual Report on Form 10-K for the year ended December 31, 2016.
|
| | |
| UNREGISTERED SALES OF EQUITY SECURITIES AND OTHER INFORMATION |
ITEM 2. UNREGISTERED SALES OF EQUITY SECURITIES AND USE OF PROCEEDS
| |
| ITEM 2. | UNREGISTERED SALES OF EQUITY SECURITIES AND USE OF PROCEEDS |
PURCHASES BY TESORO CORPORATIONANDEAVOR OF ITS COMMON STOCK
|
| | | | | | | | | | | | | |
| Period | Total Number of Shares Purchased (a) | | Average Price Paid per Share | | Total Number of Shares Purchased as Part of Publicly Announced Plans or Programs (b) | | Approximate Dollar
Value of Shares that May
Yet Be Purchased Under the Plans or Programs (in Millions) (b) |
| January 2017 | 35,940 |
| | $ | 80.50 |
| | — |
| | $ | 2,106 |
|
| February 2017 | 212,975 |
| | $ | 88.00 |
| | — |
| | $ | 2,106 |
|
| March 2017 | 2,082 |
| | $ | 82.48 |
| | — |
| | $ | 2,106 |
|
| Total | 250,997 |
| | | | — |
| | |
|
| | | | | | | | | | | | | |
| Period | Total Number of Shares Purchased (a) | | Average Price Paid per Share | | Total Number of Shares Purchased as Part of Publicly Announced Plans or Programs (b) | | Approximate Dollar
Value of Shares that May
Yet Be Purchased Under the Plans or Programs (in Millions) (b) |
| April 2017 | 58,447 |
| | $ | 78.80 |
| | — |
| | $ | 2,106 |
|
| May 2017 | 91 |
| | $ | 83.46 |
| | — |
| | $ | 2,106 |
|
| June 2017 | 1,680,408 |
| | $ | 90.20 |
| | 1,638,274 |
| | $ | 1,958 |
|
| Total | 1,738,946 |
| | | | 1,638,274 |
| | |
| |
| (a) | RepresentsIncludes 100,672 shares acquired from employees during the firstsecond quarter of 2017 to satisfy tax withholding obligations in connection with the vesting of performance share awards, market stock units and restricted stock issued to them. |
| |
| (b) | Our Board of Directors (“Board”) authorized a $1.0 billion share repurchase program on July 30, 2014. On October 28, 2015, our Board approved a new $1.0 billion share repurchase program to become effective upon the full completion of the previous $1.0 billion of share repurchases authorized. On November 16, 2016, the Board approved an additional $1.0 billion of share repurchases. |
|
| | |
OTHER INFORMATION AND EXHIBITS |
ITEM 5. OTHER INFORMATION
SUBMISSION OF MATTERS TO A VOTE OF SECURITY HOLDERS
The Annual Meeting of Stockholders of the Company was held on May 4, 2017. There were 117,379,880 shares of common stock entitled to vote and 94,657,588 or 81% shares present in person or by proxy at the Annual Meeting.
Four items of business were acted upon by stockholders at the Annual Meeting. The number of shares voted for each matter was as follows:
ELECTION OF DIRECTORS
|
| | | | | | | | |
| Name | | For | | Against | | Withheld | | Broker Non-Votes |
| Rodney F. Chase | | 85,770,726 | | 836,633 | | 81,890 | | 7,968,339 |
| Edward G. Galante | | 85,744,142 | | 862,542 | | 82,565 | | 7,968,339 |
| Gregory J. Goff | | 82,354,989 | | 3,649,337 | | 684,923 | | 7,968,339 |
| David Lilley | | 86,090,317 | | 511,814 | | 87,118 | | 7,968,339 |
| Mary Pat McCarthy | | 86,478,867 | | 137,643 | | 72,739 | | 7,968,339 |
| J.W. Nokes | | 86,203,502 | | 409,062 | | 76,685 | | 7,968,339 |
| William H. Schumann, III | | 86,451,085 | | 150,961 | | 87,203 | | 7,968,339 |
| Susan Tomasky | | 85,847,653 | | 757,816 | | 83,780 | | 7,968,339 |
| Michael E. Wiley | | 85,435,389 | | 1,172,150 | | 81,710 | | 7,968,339 |
| Patrick Y. Yang | | 85,939,921 | | 671,360 | | 77,968 | | 7,968,339 |
ADVISORY VOTE ON EXECUTIVE COMPENSATION
|
| | | | | | |
| For | | Against | | Withheld | | Broker Non-Votes |
| 82,918,787 | | 3,618,764 | | 151,696 | | 7,968,341 |
RATIFICATION OF THE APPOINTMENT OF ERNST & YOUNG LLP AS THE COMPANY’S INDEPENDENT REGISTERED PUBLIC ACCOUNTING FIRM FOR 2017
|
| | | | | | |
| For | | Against | | Withheld | | Broker Non-Votes |
| 93,750,818 | | 773,199 | | 133,571 | | — |
ADVISORY VOTE ON FREQUENCY OF FUTURE ADVISORY VOTES ON EXECUTIVE COMPENSATION
|
| | | | | | | | |
| 1 Year | | 2 Year | | 3 Year | | Withheld | | Broker Non-Votes |
| 77,159,189 | | 171,047 | | 9,271,100 | | 87,910 | | 7,968,342 |
The Board of Directors determined, consistent with our stockholders’ vote, to hold future advisory votes regarding the compensation of our named executive officers every year until the next vote on the frequency of such advisory votes.
ITEM 6. EXHIBITS
(a) Exhibits
|
| | | | | | | | |
| | | | | Incorporated by Reference (File No. 1-3473, unless otherwise indicated) |
| Exhibit Number | | Description of Exhibit | | Form | | Exhibit | | Filing Date |
| 2.1 | | Agreement and Plan of Merger among Western Refining, Inc., Tesoro Corporation, Tahoe Merger Sub 1, Inc., and Tahoe Merger Sub 2, LLC, dated as of November 16, 2016 (Schedules have been omitted pursuant to Item 601(b)(2) of Regulation S-K. Tesoro Corporation agrees to furnish supplementally a copy of such schedules, or any section thereof, to the SEC upon request.) | | 8-K | | 2.1 | | 11/18/2016 |
| | | | | | | | | |
| 3.1 | | | | S-3ASR (File No. 333-183872) | | 3.1 | | 9/13/2012 |
| | | | | | | | | |
| 3.2 | | | | 8-K | | 3.1 | | 10/25/2016 |
| | | | | | | | | |
| †10.1 | | | | 8-K | | 10.1 | | 2/21/2017 |
| | | | | | | | | |
| †10.2 | | | | 8-K | | 10.2 | | 2/21/2017 |
| | | | | | | | | |
| †10.3 | | | | 8-K | | 10.3 | | 2/21/2017 |
| | | | | | | | | |
| †10.4 | | | | 8-K | | 10.4 | | 2/21/2017 |
| | | | | | | | | |
| *31.1 | | | | | | | | |
| | | | | | | | | |
| *31.2 | | | | | | | | |
| | | | | | | | | |
| *32.1 | | | | | | | | |
| | | | | | | | | |
| *32.2 | | | | | | | | |
| | | | | | | | | |
| **101.INS | | XBRL Instance Document | | | | | | |
| | | | | | | | | |
| **101.SCH | | XBRL Taxonomy Extension Schema Document | | | | | | |
| | | | | | | | | |
| **101.CAL | | XBRL Taxonomy Extension Calculation Linkbase Document | | | | | | |
| | | | | | | | | |
| **101.DEF | | XBRL Taxonomy Extension Definition Linkbase Document | | | | | | |
| | | | | | | | | |
| **101.LAB | | XBRL Taxonomy Extension Label Linkbase Document | | | | | | |
| | | | | | | | | |
| **101.PRE | | XBRL Taxonomy Extension Presentation Linkbase Document | | | | | | |
|
| | | | | | | | |
| | | | | Incorporated by Reference (File No. 1-3473, unless otherwise indicated) |
| Exhibit Number | | Description of Exhibit | | Form | | Exhibit | | Filing Date |
| 2.1 | | Agreement and Plan of Merger among Western Refining, Inc., Tesoro Corporation, Tahoe Merger Sub 1, Inc., and Tahoe Merger Sub 2, LLC, dated as of November 16, 2016 (Schedules have been omitted pursuant to Item 601(b)(2) of Regulation S-K. Tesoro Corporation agrees to furnish supplementally a copy of such schedules, or any section thereof, to the SEC upon request.) | | 8-K | | 2.1 | | 11/18/2016 |
| | | | | | | | | |
| 3.1 | | | | 8-K | | 3.1 | | 8/1/2017 |
| | | | | | | | | |
| 3.2 | | | | 8-K | | 3.2 | | 8/1/2017 |
| | | | | | | | | |
| *31.1 | | | | | | | | |
| | | | | | | | | |
| *31.2 | | | | | | | | |
| | | | | | | | | |
| *32.1 | | | | | | | | |
| | | | | | | | | |
| *32.2 | | | | | | | | |
| | | | | | | | | |
| **101.INS | | XBRL Instance Document | | | | | | |
| | | | | | | | | |
| **101.SCH | | XBRL Taxonomy Extension Schema Document | | | | | | |
| | | | | | | | | |
| **101.CAL | | XBRL Taxonomy Extension Calculation Linkbase Document | | | | | | |
| | | | | | | | | |
| **101.DEF | | XBRL Taxonomy Extension Definition Linkbase Document | | | | | | |
| | | | | | | | | |
| **101.LAB | | XBRL Taxonomy Extension Label Linkbase Document | | | | | | |
| | | | | | | | | |
| **101.PRE | | XBRL Taxonomy Extension Presentation Linkbase Document | | | | | | |
| |
| ** | Submitted electronically herewith. |
| |
† | Compensatory plan or arrangement. |
|
| | |
| | | March 31,June 30, 2017 | 4349
|
SIGNATURES
Pursuant to the requirements of the Securities Exchange Act of 1934, the registrant has duly caused this report to be signed on its behalf by the undersigned thereunto duly authorized.
|
| | |
| | | TESORO CORPORATIONANDEAVOR |
| | | |
| Date: | MayAugust 9, 2017 | /s/ STEVEN M. STERIN |
| | | Steven M. Sterin |
| | | Executive Vice President and Chief Financial Officer |
| | | (Principal Financial Officer and Duly Authorized Officer) |
|
| | |
4450 | Tesoro Corporation
| | |