UNITED STATES SECURITIES AND EXCHANGE COMMISSION
Washington, D.C. 20549
FORM 10-Q
(Mark One)
| QUARTERLY REPORT PURSUANT TO SECTION 13 OR 15(d) OF THE SECURITIES EXCHANGE ACT OF 1934 | |||
| For the quarterly period ended | March 28, 2020 | ||
Or
| TRANSITION REPORT PURSUANT TO SECTION 13 OR 15(d) OF THE SECURITIES EXCHANGE ACT OF 1934 | ||
For the transition period from to | ||
Commission File Number 000-06217

INTEL CORPORATION
(Exact name of registrant as specified in its charter)
| Delaware | 94-1672743 | |||
| (State or other jurisdiction of incorporation or organization) | (I.R.S. Employer Identification No.) | |||
| 2200 Mission College Boulevard, | Santa Clara, | California | 95054-1549 | |
| (Address of principal executive offices) | (Zip Code) | |||
(408) 765-8080
(Registrant’s telephone number, including area code)
N/A
(Former name, former address and former fiscal year, if changed since last report)
Securities registered pursuant to Section 12(b) of the Act:
| Title of each class | Trading Symbol(s) | Name of each exchange on which registered |
| Common stock, $0.001 par value | INTC | Nasdaq Global Select Market |
Indicate by check mark whether the registrant (1) has filed all reports required to be filed by Section 13 or 15(d) of the Securities Exchange Act of 1934 during the preceding 12 months (or for such shorter period that the registrant was required to file such reports), and (2) has been subject to such filing requirements for the past 90 days. Yes þ☑ No ¨
Indicate by check mark whether the registrant has submitted electronically and posted on its corporate Web site, if any, every Interactive Data File required to be submitted and posted pursuant to Rule 405 of Regulation S-T (§232.405 of this chapter) during the preceding 12 months (or for such shorter period that the registrant was required to submit and post such files). Yes þ☑ No ¨
Indicate by check mark whether the registrant is a large accelerated filer, an accelerated filer, a non-accelerated filer, a smaller reporting company, or an emerging growth company. See the definitions of “large accelerated filer,” “accelerated filer,” “smaller reporting company,” and "emerging growth company" in Rule 12b-2 of the Exchange Act.
Large Accelerated Filer | Accelerated filer | Non-accelerated filer | Smaller reporting company | Emerging growth company |
| ☑ | ¨ | ☐ | ☐ | |
If an emerging growth company, indicate by check mark if the registrant has elected not to use the extended transition period for complying with any new or revised financial accounting standards provided pursuant to Section 13(a) of the Exchange Act. ¨
Indicate by check mark whether the registrant is a shell company (as defined in Rule 12b-2 of the Exchange Act). Yes ¨☐ No þ☑
TABLE OF CONTENTS
THE ORGANIZATION OF OUR QUARTERLY REPORT ON FORM 10-Q
The order and presentation of content in our Form 10-Q differs from the Registrant’s common stock:traditional SEC Form 10-Q format. Our format is designed to improve readability and better presents how we organize and manage our business. See "Form 10-Q Cross-Reference Index" within Other Key Information for a cross-reference index to the traditional SEC Form 10-Q format. To reflect our focus on transforming from a PC-centric1 company to a data-centric company, we have presented our data-centric businesses1 first in the "Segment Trends and Results" within MD&A.
We have defined certain terms and abbreviations used throughout our Form 10-Q in "Key Terms" within the Consolidated Condensed Financial Statements and Supplemental Details.
The preparation of our Consolidated Condensed Financial Statements is in conformity with U.S. GAAP. Our Form 10-Q includes key metrics that we use to measure our business, some of which are non-GAAP measures. See "Non-GAAP Financial Measures" within MD&A for an explanation of these measures and why management uses them and believes they provide investors with useful supplemental information.
| Page | ||||
| FORWARD-LOOKING STATEMENTS | ||||
| OUR PANDEMIC RESPONSE | ||||
| CONSOLIDATED CONDENSED FINANCIAL STATEMENTS AND SUPPLEMENTAL DETAILS | ||||
| Consolidated Condensed Statements of Income | ||||
| Consolidated Condensed Statements of Comprehensive Income | ||||
| Consolidated Condensed Balance Sheets | ||||
| Consolidated Condensed Statements of Cash Flows | ||||
| Consolidated Condensed Statements of Stockholders' Equity | ||||
| Notes to Consolidated Condensed Financial Statements | ||||
| Key Terms | ||||
| MANAGEMENT'S DISCUSSION AND ANALYSIS | ||||
| Segment Trends and | ||||
| Consolidated Results of Operations | ||||
| Liquidity and Capital Resources | ||||
| Contractual Obligations | ||||
| Quantitative and Qualitative Disclosures | ||||
| Non-GAAP Financial Measures | ||||
| OTHER KEY INFORMATION | ||||
| Risk Factors | ||||
| Controls and Procedures | ||||
| Issuer Purchases of Equity Securities | ||||
| Form 10-Q Cross-Reference Index | ||||
1 | Intel's definition is included in "Key Terms" within the Consolidated Condensed Financial Statements and Supplemental Details. |
FORWARD-LOOKING STATEMENTS
This Quarterly Report on Form 10-Q contains forward-looking statements that involve a number of risks and uncertainties. Words such as "anticipates,"anticipate," "expects,"expect," "intends,"intend," "goals,"pledge," "committed," "plans," "opportunities," "future," "believes," "seeks,"target," "on-track," "estimates," "continues,"continue," "likely," "may," "will," “would,”"would," "should," “could,”"could," and variations of such words and similar expressions are intended to identify such forward-looking statements. In addition, any statements that refer to future responses to and effects of COVID-19; projections of our future financial performance and demand; our anticipated growth and trends in our businesses or operations; projected growth and trends in markets relevant to our businesses; future products and technology and the expected availability and benefits of such products and technology; expectations regarding construction projects; expected timing and impact of acquisitions, divestitures, and other significant transactions; expected completion of restructuring activities; availability, uses, sufficiency, and cost of capital and capital resources, including expected returns to stockholders such as dividends and share repurchases; accounting estimates and judgments regarding reported matters, events and contingencies and the actual results thereof; future production capacity and product supply, uncertain events or assumptions, and other characterizations of future events or circumstances are forward-looking statements. Such statements are based on management's expectations as of the date of this filing and involve many risks and uncertainties that could cause our actual results to differ materially from those expressed or implied in our forward-looking statements. Such risks and uncertainties include those described throughout this report and our Annual Report on Form 10-K for the year ended December 31, 2016,28, 2019, particularly the "Risk Factors" sections of such reports. Given these risks and uncertainties, readers are cautioned not to place undue reliance on such forward-looking statements. Readers are urged to carefully review and consider the various disclosures made in this Form 10-Q and in other documents we file from time to time with the Securities and Exchange CommissionSEC that disclose risks and uncertainties that may affect our business. TheUnless specifically indicated otherwise, the forward-looking statements in this Form 10-Q do not reflect the potential impact of any divestitures, mergers, acquisitions, or other business combinations that hadhave not been completed as of October 26, 2017.the date of this filing. In addition, the forward-looking statements in this Form 10-Q are made as of the date of this filing, including expectations based on third-party information and projections that management believes to be reputable, and Intel does not undertake, and expressly disclaims any duty, to update such statements, whether as a result of new information, new developments, or otherwise, except to the extent that disclosure may be required by law.
Intel, the Intel logo, 3D XPoint, Intel Atom, Intel Core, Intel Optane, and Xeon, are trademarks of Intel Corporation or its subsidiaries in the U.S. and/or other countries.
* Other names and brands may be claimed as the property of others.
 | 1 | |
| OUR PANDEMIC RESPONSE |
Our top priority during the COVID-19 pandemic is protecting the health and safety of our employees. As governments institute new restrictions on commercial operations, we are working to ensure our compliance while also maintaining business continuity for essential operations in our factories. At this time, our factories continue to operate around the world in accordance with guidance issued by local and national government authorities. We remain open as we support our employees who work in labs and factories critical to our world’s digital infrastructure.
For the first three months of 2020 we observed strong notebook platform demand driven by the increase in working and learning from home and saw continued strength in data center demand as cloud service providers increased capacity. However, weakness in the industrial and retail verticals drove weaker demand in our IOTG business.
Our technology runs most of the world’s internet, communications, and government digital infrastructures, and our products and capabilities are delivering vital computing power for medical research, robotics for assisted patient care, and artificial intelligence and data analytics for public health. Our platforms that support telemedicine have also taken on greater importance since the outbreak of COVID-19 as hospitals and healthcare workers scale to meet the increasing demand for care. The PCs and networking technologies that we and our customers deliver are supporting the unprecedented volume of remote workers and enabling personal connections while social distancing.
We are focused on protecting the health and safety of our employees and we continue to operate to deliver for our customers while contributing to our communities.
OUR EMPLOYEES
Intel’s Pandemic Leadership Team, established more than 15 years ago to improve Intel’s crisis management response capability, is deeply engaged to keep our employees safe. This specialized team includes medical and safety experts who work to safeguard the well-being of employees and minimize the spread of infection. They also collaborate with local governments and public health organizations and implement their recommendations. In the past, the team has successfully helped us manage through global health issues such as bird flu, SARS, Ebola, Zika, and the H1N1 virus.
Working-from-home and social distancing policies. As we navigate through the effects of the COVID-19 pandemic we are working to ensure compliance with orders and restrictions imposed by government authorities. We have significantly reduced the number of people in our offices, helping to protect our employees who work in our labs and factories and who are essential to keeping our business running. Maintaining safe facilities is core to how we operate, and we are implementing additional practices in our fabs and assembly test plants so manufacturing employees can safely continue performing critical work on site. In addition to increased cleaning of our facilities, our manufacturing sites are taking extra steps to effectively implement social distancing. Some of these measures include staggering shift changes, adjusting meeting locations and schedules, limiting activities that require close proximity, and making thermometers and masks available (in addition to the normal protective gear worn by many factory employees). At our construction sites, we are working closely with our general contractors to implement social distancing, increased cleaning, and other protocols to safeguard the health of all workers on site.
Compensation and expanded benefits. We are investing more than $100 million in additional benefits to aid and support employees, including special recognition for employees that have been working on-site and healthcare coverage changes under the U.S. Coronavirus Aid, Relief, and Economic Security Act (CARES Act).
Employees and contractors asked to work from home or self-quarantine due to travel restrictions will be paid their regular pay, and Intel will reimburse up to 30 days of care services for employees who need backup childcare and/or elder care in the case where there are school or care center closures or if an employee or family member is required to be self-quarantined.
To aid in the overall well-being of our employees, we also have our existing global Employee Assistance Plan that provides confidential counseling and work-life services to employees and immediate family members.
OUR CUSTOMERS
We are in the midst of what is likely a historic deployment of remote work and digital access to services. We are committed to our customers to enable the support they need to continue providing vital services, tools, and infrastructure to millions.
Operations. Our factories continue to operate world-wide in compliance with the orders and restrictions imposed by government authorities in each of our locations, and we are working with our customers to meet their specific shipment needs. Our world-class safety standards have to date allowed our factories to continue to operate safely and with mostly on-time deliveries. We only allow employees in our factories who are essential to the factories’ operations. By design, our “cleanrooms” and factories are among the cleanest places in the world. While most of our construction projects have remained operational, we temporarily paused a few projects due to local government restrictions at a small number of our sites. We currently expect these interruptions to have minimal impact on our product ramps and do not expect them to impact our process technology transition timelines. We remain on-track to add sufficient wafer capacity this year to meet anticipated market demand and restore our PC unit inventory levels.
| OUR PANDEMIC RESPONSE | 2 | |
Supply chain. Our employees and partners around the world have collaborated and leveraged lessons learned—in recent months and from past challenges—to safely keep the global tech supply chain functioning. Our Pandemic Leadership Team is at the center of these efforts and through our Business Continuity Program we perform ongoing work with our suppliers to review their preparations to handle sudden disruptions to the supply chain. We have taken several actions throughout the pandemic to address our supply chain. For example:
Where feasible and practicable, we increased inventory of raw materials as well as our supply of our finished goods coming out of China in early February. It is our practice to plan for scenarios where supply will be restricted or compromised in our supply chain for 30-60 days or more.
We activated backup planning to reroute and obtain charter flights if needed into and from China, securing capacity early. As the virus spread, we leveraged the successful methodology used in China for other parts of Asia and Europe.
We evaluated the end-to-end supply line needs for all products ramping this year, worked on securing supply lines and deployed our business continuity plans to mitigate potential risks.
We are working with governments around the world to confirm our compliance with local requirements for continued operation as an essential business. We have also worked closely with our suppliers to help protect their employees' health and safety, to provide supplier assistance to mitigate supply disruptions, and to clarify our continued expectations for labor practices and human rights in line with the Responsible Business Alliance Code of Conduct.
OUR COMMUNITY
Intel has a longstanding commitment to support the local communities where we operate and to create a better world through the power of our technology. We have committed over $60 million to accelerate access to technology needed to combat the crisis and to support the needs of frontline healthcare workers and people in our local communities. We've also been inspired by our employees who have proposed innovative ideas for how we can apply our resources and technology to support our stakeholders throughout this crisis.
Using our technology to help. In April, we pledged $50 million in a Pandemic Response Technology Initiative to combat COVID-19 through accelerating access to technology at the point of patient care, speeding scientific research, and ensuring access to online learning for students. A portion of this amount has been allocated to an additional innovation fund that supports requests from external partners and employee-led relief projects where access to Intel expertise and resources can have immediate impact. This initiative builds on prior announcements of $10 million in donations that are supporting local communities during this critical time.
We are providing access to our intellectual property and partnering with customers to put technology to work towards understanding and fighting COVID-19. For example:
We are giving COVID-19 scientists and researchers free access to our worldwide intellectual property portfolio. We will continue to invent—and protect—our intellectual property, but we offer it freely to those working to protect people from this pandemic.
We are teaming with Lenovo and BGI Genomics to accelerate the analysis of genomic characteristics of COVID-19. Our combined work will further advance the capabilities of BGI’s sequencing tools to help scientists investigate transmission patterns of the virus and create better diagnostic methods.
We are deploying Intel platform-based robots in hospitals to protect doctors and nurses by transporting medical supplies and surgical equipment to reduce human-to-human interactions.
We are working with Dyson and medical consultancy firm TTP to supply FPGAs for CoVent, a new ventilator specifically designed in response to the U.K. government’s request for help.
We are collaborating with Medtronic to add remote monitoring capabilities to their PB980 ventilator, which helps reduce exposure for healthcare providers treating COVID-19 patients.
Philanthropic efforts. We are also committed to providing monetary and non-monetary support to our communities. For example:
We committed a $1 million donation to the International Red Cross to support global relief efforts for the COVID-19 pandemic.
We announced the Intel Foundation is providing $4 million to support COVID-19 relief efforts in communities where we have significant presence. The foundation also offered a special monetary matching opportunity for every regular full-time and part-time employee and U.S. Intel retiree up to a total of $2 million for relief efforts around major Intel sites.
We donated more than 1 million items of personal protective equipment—masks, gloves, and other gear—to healthcare workers that were sourced from our factory stock and emergency supplies.
We also joined the global XPRIZE Pandemic Alliance along with other companies to fuel collaboration on solutions through shared innovation to effectively address the immediate needs of the crisis.
| OUR PANDEMIC RESPONSE | 3 | |
MOVING FORWARD
There is uncertainty around the impacts the pandemic will have on our business and the additional measures that may be necessary going forward. We will continue to actively monitor the situation, including the status of our workforce and factories, supply chain, and customers, suppliers, and vendors, to determine the appropriate actions to protect the health and safety of our employees and our ongoing operations for our customers. This includes actions informed by the requirements and recommendations of the federal, state or local authorities.
Economic and demand uncertainty in the current environment may impact our future results. We continue to assess how the effects of COVID-19 on the economy may offset the immediate catalysts from more remote work and learning, and we recognize that our operations could be disrupted if our employees working in our fabs and factories contract the virus. We expect continued strength from cloud service providers and communications service providers in the second quarter of 2020, and anticipate enterprise and government demand to weaken in the second half of 2020. We also expect lower demand in IOTG and Mobileye for the rest of the year. As global GDP estimates are revised down, we expect PC TAM to decline in the second half of the year. We remain focused on cash flow management, including careful management of operating expenses, capital expenditures, and working capital.
| OUR PANDEMIC RESPONSE | 4 | |
| A QUARTER IN REVIEW |
Total revenue of $19.8 billion was up $3.8 billion year over year as our data-centric businesses and PC-centric business grew by 34% and 14% respectively. Data-centric revenue was up, driven by growth across all DCG business market segments, strong mix of high-performance Intel® Xeon® processors, NSG bit growth, and improved NAND pricing. Our PC-centric business was up, driven by notebook platform1 volume strength and higher modem sales. Increased platform unit sales, ASP strength, and lower period charges resulted in higher gross margins and operating income, partially offset by higher platform unit cost. In the first three months we generated $6.2 billion of cash flow from operations and returned $5.6 billion to stockholders, including $1.4 billion in dividends and $4.2 billion in buybacks.
| REVENUE | OPERATING INCOME | DILUTED EPS | CASH FLOWS | |||
■PC-CENTRIC $B ■DATA-CENTRIC $B | ■ GAAP $B■NON-GAAP $B | ■ GAAP■NON-GAAP | ■OPERATING CASH FLOW$B ■FREE CASH FLOW $B | |||
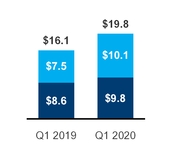
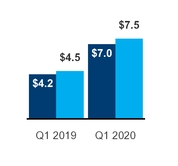
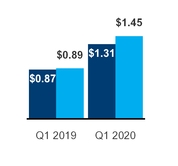
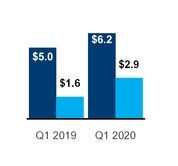
| $19.8B | $7.0B | $7.5B | $1.31 | $1.45 | $6.2B | $2.9B | ||||||||
| GAAP | GAAP | non-GAAP2 | GAAP | non-GAAP2 | GAAP | non-GAAP2 | ||||||||
| Revenue up $3.8B or 23% from Q1 2019 | Operating income up $2.9B or 69% from Q1 2019; Q1 2020 operating margin at 35% | Operating income up $3.0B or 67% from Q1 2019; Q1 2020 operating margin at 38% | Diluted EPS up $0.44 or 51% from Q1 2019 | Diluted EPS up $0.56 or 63% from Q1 2019 | Operating cash flow up $1.2B or 24% from Q1 2019 | Free cash flow up $1.3B or 76% from Q1 2019 | ||||||||
| Growth in most data-centric businesses and growth in the PC-centric business | Higher gross margin from increase in platform unit sales and platform ASP strength, lower period charges, NAND market recovery and improved NAND unit cost, partially offset by increase in platform unit cost | Higher platform volume, platform ASP strength, lower period charges, NAND market recovery and improved unit cost, and lower shares outstanding, partially offset by higher platform unit cost and higher tax | Higher net income offset by working capital changes driven by other assets and liabilities and accounts receivable | |||||||||||
BUSINESS SUMMARY
We introduced a broad, data-centric portfolio for 5G network infrastructure including the new Intel Atom® P5900, a 10nm SoC for wireless base stations; a next-generation structured ASIC for 5G network acceleration; and the launch of new 2nd Gen Intel® Xeon® Scalable processors. |
| • | We announced the 10th Gen Intel® Core™ H-series mobile processors, a new family of mobile processors aimed at gamers and creators everywhere, which deliver faster performance with up to 5.3GHz Turbo, eight cores, and 16 threads. |
| • | We experienced growth in most data-centric businesses. DCG grew across all segments and adjacencies continued to ramp. NSG grew with record revenue driven by NAND and Intel® Optane™ memory bit growth and higher ASP. Mobileye recognized record revenue with increasing ADAS adoption. IOTG declined on COVID-19 impact. |
PC-centric growth was driven by notebook demand strength as consumers and businesses are relying on PCs for working and learning at home.
| Three Months Ended | Nine Months Ended | |||||||||||||||
| (In Millions, Except Per Share Amounts) | Sep 30, 2017 | Oct 1, 2016 | Sep 30, 2017 | Oct 1, 2016 | ||||||||||||
| Net revenue | $ | 16,149 | $ | 15,778 | $ | 45,708 | $ | 43,013 | ||||||||
| Cost of sales | 6,092 | 5,795 | 17,406 | 16,927 | ||||||||||||
| Gross margin | 10,057 | 9,983 | 28,302 | 26,086 | ||||||||||||
| Research and development | 3,223 | 3,069 | 9,824 | 9,460 | ||||||||||||
| Marketing, general and administrative | 1,666 | 2,006 | 5,624 | 6,239 | ||||||||||||
| Restructuring and other charges | 4 | 372 | 189 | 1,786 | ||||||||||||
| Amortization of acquisition-related intangibles | 49 | 74 | 124 | 253 | ||||||||||||
| Operating expenses | 4,942 | 5,521 | 15,761 | 17,738 | ||||||||||||
| Operating income | 5,115 | 4,462 | 12,541 | 8,348 | ||||||||||||
| Gains (losses) on equity investments, net | 846 | (12 | ) | 1,440 | 488 | |||||||||||
| Interest and other, net | (31 | ) | (132 | ) | 336 | (340 | ) | |||||||||
| Income before taxes | 5,930 | 4,318 | 14,317 | 8,496 | ||||||||||||
| Provision for taxes | 1,414 | 940 | 4,029 | 1,742 | ||||||||||||
| Net income | $ | 4,516 | $ | 3,378 | $ | 10,288 | $ | 6,754 | ||||||||
| Basic earnings per share of common stock | $ | 0.96 | $ | 0.71 | $ | 2.19 | $ | 1.43 | ||||||||
| Diluted earnings per share of common stock | $ | 0.94 | $ | 0.69 | $ | 2.12 | $ | 1.39 | ||||||||
| Cash dividends declared per share of common stock | $ | 0.5450 | $ | 0.5200 | $ | 1.0775 | $ | 1.0400 | ||||||||
| Weighted average shares of common stock outstanding: | ||||||||||||||||
| Basic | 4,688 | 4,734 | 4,707 | 4,728 | ||||||||||||
| Diluted | 4,821 | 4,877 | 4,849 | 4,872 | ||||||||||||
| Three Months Ended | Nine Months Ended | |||||||||||||||
| (In Millions) | Sep 30, 2017 | Oct 1, 2016 | Sep 30, 2017 | Oct 1, 2016 | ||||||||||||
| Net income | $ | 4,516 | $ | 3,378 | $ | 10,288 | $ | 6,754 | ||||||||
| Changes in other comprehensive income, net of tax: | ||||||||||||||||
| Net unrealized holding gains (losses) on available-for-sale investments | 399 | 412 | 408 | 357 | ||||||||||||
| Deferred tax asset valuation allowance | — | (2 | ) | — | (5 | ) | ||||||||||
| Net unrealized holding gains (losses) on derivatives | 19 | 61 | 350 | 274 | ||||||||||||
| Net prior service (costs) credits | 2 | 1 | (8 | ) | 4 | |||||||||||
| Actuarial valuation | 11 | 10 | 241 | (289 | ) | |||||||||||
| Net foreign currency translation adjustment | 5 | (2 | ) | 513 | (1 | ) | ||||||||||
| Other comprehensive income (loss) | 436 | 480 | 1,504 | 340 | ||||||||||||
| Total comprehensive income | $ | 4,952 | $ | 3,858 | $ | 11,792 | $ | 7,094 | ||||||||
| (In Millions) | Sep 30, 2017 | Dec 31, 2016 | ||||||
| Assets | ||||||||
| Current assets: | ||||||||
| Cash and cash equivalents | $ | 9,075 | $ | 5,560 | ||||
| Short-term investments | 1,446 | 3,225 | ||||||
| Trading assets | 6,983 | 8,314 | ||||||
| Accounts receivable, net | 5,954 | 4,690 | ||||||
| Inventories | 6,929 | 5,553 | ||||||
| Assets held for sale | — | 5,210 | ||||||
| Other current assets | 2,767 | 2,956 | ||||||
| Total current assets | 33,154 | 35,508 | ||||||
| Property, plant and equipment, net of accumulated depreciation of $58,048 ($53,934 as of December 31, 2016) | 39,472 | 36,171 | ||||||
| Marketable equity securities | 6,059 | 6,180 | ||||||
| Other long-term investments | 3,844 | 4,716 | ||||||
| Goodwill | 24,389 | 14,099 | ||||||
| Identified intangible assets, net | 13,058 | 9,494 | ||||||
| Other long-term assets | 7,112 | 7,159 | ||||||
| Total assets | $ | 127,088 | $ | 113,327 | ||||
| Liabilities, temporary equity, and stockholders’ equity | ||||||||
| Current liabilities: | ||||||||
| Short-term debt | $ | 4,142 | $ | 4,634 | ||||
| Accounts payable | 3,554 | 2,475 | ||||||
| Accrued compensation and benefits | 2,805 | 3,465 | ||||||
| Accrued advertising | 892 | 810 | ||||||
| Deferred income | 1,706 | 1,718 | ||||||
| Liabilities held for sale | — | 1,920 | ||||||
| Other accrued liabilities | 7,590 | 5,280 | ||||||
| Total current liabilities | 20,689 | 20,302 | ||||||
| Long-term debt | 27,498 | 20,649 | ||||||
| Long-term deferred tax liabilities | 2,943 | 1,730 | ||||||
| Other long-term liabilities | 4,152 | 3,538 | ||||||
| Contingencies (Note 18) | ||||||||
| Temporary equity | 870 | 882 | ||||||
| Stockholders’ equity: | ||||||||
| Preferred stock | — | — | ||||||
| Common stock and capital in excess of par value, 4,680 issued and outstanding (4,730 issued and outstanding as of December 31, 2016) | 26,547 | 25,373 | ||||||
| Accumulated other comprehensive income (loss) | 1,610 | 106 | ||||||
| Retained earnings | 42,779 | 40,747 | ||||||
| Total stockholders’ equity | 70,936 | 66,226 | ||||||
| Total liabilities, temporary equity, and stockholders’ equity | $ | 127,088 | $ | 113,327 | ||||
| Nine Months Ended | ||||||||
| (In Millions) | Sep 30, 2017 | Oct 1, 2016 | ||||||
| Cash and cash equivalents, beginning of period | $ | 5,560 | $ | 15,308 | ||||
| Cash flows provided by (used for) operating activities: | ||||||||
| Net income | 10,288 | 6,754 | ||||||
| Adjustments to reconcile net income to net cash provided by operating activities: | ||||||||
| Depreciation | 4,990 | 4,684 | ||||||
| Share-based compensation | 1,051 | 1,136 | ||||||
| Restructuring and other charges | 189 | 1,786 | ||||||
| Amortization of intangibles | 999 | 1,176 | ||||||
| (Gains) losses on equity investments, net | (1,372 | ) | (414 | ) | ||||
| (Gains) losses on divestitures | (387 | ) | — | |||||
| Deferred taxes | 570 | (188 | ) | |||||
Changes in assets and liabilities:1 | ||||||||
| Accounts receivable | (1,128 | ) | (100 | ) | ||||
| Inventories | (1,245 | ) | (118 | ) | ||||
| Accounts payable | 171 | 188 | ||||||
| Accrued compensation and benefits | (551 | ) | (1,874 | ) | ||||
| Income taxes payable and receivable | 979 | 961 | ||||||
| Other assets and liabilities | 315 | (333 | ) | |||||
| Total adjustments | 4,581 | 6,904 | ||||||
| Net cash provided by operating activities | 14,869 | 13,658 | ||||||
| Cash flows provided by (used for) investing activities: | ||||||||
| Additions to property, plant and equipment | (7,709 | ) | (6,095 | ) | ||||
| Acquisitions, net of cash acquired | (14,499 | ) | (15,151 | ) | ||||
| Purchases of available-for-sale investments | (1,977 | ) | (7,962 | ) | ||||
| Sales of available-for-sale investments | 4,610 | 3,793 | ||||||
| Maturities of available-for-sale investments | 3,488 | 4,928 | ||||||
| Purchases of trading assets | (9,792 | ) | (9,953 | ) | ||||
| Maturities and sales of trading assets | 11,806 | 7,867 | ||||||
| Investments in loans receivable and reverse repurchase agreements | — | (223 | ) | |||||
| Collection of loans receivable and reverse repurchase agreements | 250 | 911 | ||||||
| Investments in non-marketable equity investments | (726 | ) | (893 | ) | ||||
| Proceeds from divestitures | 3,124 | — | ||||||
| Other investing | 893 | 405 | ||||||
| Net cash used for investing activities | (10,532 | ) | (22,373 | ) | ||||
| Cash flows provided by (used for) financing activities: | ||||||||
| Increase (decrease) in short-term debt, net | (5 | ) | 426 | |||||
| Issuance of long-term debt, net of issuance costs | 7,716 | 2,734 | ||||||
| Repayment of debt | (1,502 | ) | — | |||||
| Proceeds from sales of common stock through employee equity incentive plans | 637 | 1,024 | ||||||
| Repurchase of common stock | (3,611 | ) | (2,054 | ) | ||||
| Restricted stock unit withholdings | (424 | ) | (434 | ) | ||||
| Payment of dividends to stockholders | (3,794 | ) | (3,692 | ) | ||||
| Other financing | 161 | 155 | ||||||
| Net cash provided by (used for) financing activities | (822 | ) | (1,841 | ) | ||||
| Net increase (decrease) in cash and cash equivalents | 3,515 | (10,556 | ) | |||||
| Cash and cash equivalents, end of period | $ | 9,075 | $ | 4,752 | ||||
| Supplemental disclosures of noncash investing activities and cash flow information: | ||||||||
| Acquisition of property, plant, and equipment included in accounts payable and accrued liabilities | $ | 1,736 | $ | 1,505 | ||||
| Non-marketable equity investment in McAfee from divestiture | $ | 1,078 | $ | — | ||||
| Cash paid during the period for: | ||||||||
| Interest, net of capitalized interest and interest rate swap payments/receipts | $ | 386 | $ | 472 | ||||
| Income taxes, net of refunds | $ | 2,328 | $ | 843 | ||||
1 | See "Key Terms" within Consolidated Condensed Financial Statements and |
2 | See "Non-GAAP Financial Measures" within |
| A QUARTER IN REVIEW | 5 | |
| CONSOLIDATED CONDENSED STATEMENTS OF INCOME |
| Three Months Ended | ||||||||
| (In Millions, Except Per Share Amounts; Unaudited) | Mar 28, 2020 | Mar 30, 2019 | ||||||
| Net revenue | $ | 19,828 | $ | 16,061 | ||||
| Cost of sales | 7,812 | 6,972 | ||||||
| Gross margin | 12,016 | 9,089 | ||||||
| Research and development | 3,275 | 3,332 | ||||||
| Marketing, general and administrative | 1,541 | 1,583 | ||||||
| Restructuring and other charges | 162 | — | ||||||
| Operating expenses | 4,978 | 4,915 | ||||||
| Operating income | 7,038 | 4,174 | ||||||
| Gains (losses) on equity investments, net | (111 | ) | 434 | |||||
| Interest and other, net | (313 | ) | (61 | ) | ||||
| Income before taxes | 6,614 | 4,547 | ||||||
| Provision for taxes | 953 | 573 | ||||||
| Net income | $ | 5,661 | $ | 3,974 | ||||
| Earnings per share—basic | $ | 1.33 | $ | 0.88 | ||||
| Earnings per share—diluted | $ | 1.31 | $ | 0.87 | ||||
| Weighted average shares of common stock outstanding: | ||||||||
| Basic | 4,266 | 4,492 | ||||||
| Diluted | 4,312 | 4,564 | ||||||
See accompanying notes.
| FINANCIAL STATEMENTS | Consolidated Condensed Statements of Income | 6 |
| CONSOLIDATED CONDENSED STATEMENTS OF COMPREHENSIVE INCOME |
| Three Months Ended | ||||||||
| (In Millions; Unaudited) | Mar 28, 2020 | Mar 30, 2019 | ||||||
| Net income | $ | 5,661 | $ | 3,974 | ||||
| Changes in other comprehensive income, net of tax: | ||||||||
| Net unrealized holding gains (losses) on derivatives | (268 | ) | 102 | |||||
| Actuarial valuation and other pension benefits (expenses), net | 12 | 9 | ||||||
| Translation adjustments and other | (5 | ) | 50 | |||||
| Other comprehensive income (loss) | (261 | ) | 161 | |||||
| Total comprehensive income | $ | 5,400 | $ | 4,135 | ||||
See accompanying notes.
| FINANCIAL STATEMENTS | Consolidated Condensed Statements of Comprehensive Income | 7 |
| CONSOLIDATED CONDENSED BALANCE SHEETS |
| (In Millions) | Mar 28, 2020 | Dec 28, 2019 | ||||||
| (unaudited) | ||||||||
| Assets | ||||||||
| Current assets: | ||||||||
| Cash and cash equivalents | $ | 11,380 | $ | 4,194 | ||||
| Short-term investments | 1,296 | 1,082 | ||||||
| Trading assets | 8,127 | 7,847 | ||||||
| Accounts receivable | 8,455 | 7,659 | ||||||
| Inventories | 9,246 | 8,744 | ||||||
| Other current assets | 2,997 | 1,713 | ||||||
| Total current assets | 41,501 | 31,239 | ||||||
| Property, plant and equipment, net of accumulated depreciation of $75,686 ($73,321 as of December 28, 2019) | 56,770 | 55,386 | ||||||
| Equity investments | 3,880 | 3,967 | ||||||
| Other long-term investments | 2,943 | 3,276 | ||||||
| Goodwill | 26,276 | 26,276 | ||||||
| Identified intangible assets, net | 10,429 | 10,827 | ||||||
| Other long-term assets | 5,911 | 5,553 | ||||||
| Total assets | $ | 147,710 | $ | 136,524 | ||||
| Liabilities, temporary equity, and stockholders’ equity | ||||||||
| Current liabilities: | ||||||||
| Short-term debt | $ | 3,464 | $ | 3,693 | ||||
| Accounts payable | 4,638 | 4,128 | ||||||
| Accrued compensation and benefits | 2,358 | 3,853 | ||||||
| Other accrued liabilities | 13,435 | 10,636 | ||||||
| Total current liabilities | 23,895 | 22,310 | ||||||
| Debt | 36,455 | 25,308 | ||||||
| Contract liabilities | 1,353 | 1,368 | ||||||
| Income taxes payable, non-current | 4,651 | 4,919 | ||||||
| Deferred income taxes | 2,027 | 2,044 | ||||||
| Other long-term liabilities | 2,975 | 2,916 | ||||||
| Contingencies (Note 12) | ||||||||
| Temporary equity | — | 155 | ||||||
| Stockholders’ equity: | ||||||||
| Preferred stock | — | — | ||||||
| Common stock and capital in excess of par value, 4,234 issued and outstanding (4,290 issued and outstanding as of December 28, 2019) | 25,251 | 25,261 | ||||||
| Accumulated other comprehensive income (loss) | (1,541 | ) | (1,280 | ) | ||||
| Retained earnings | 52,644 | 53,523 | ||||||
| Total stockholders’ equity | 76,354 | 77,504 | ||||||
| Total liabilities, temporary equity, and stockholders’ equity | $ | 147,710 | $ | 136,524 | ||||
See accompanying notes.
| FINANCIAL STATEMENTS | Consolidated Condensed Balance Sheets | 8 |
| CONSOLIDATED CONDENSED STATEMENTS OF CASH FLOWS |
| Three Months Ended | ||||||||
| (In Millions; Unaudited) | Mar 28, 2020 | Mar 30, 2019 | ||||||
| Cash and cash equivalents, beginning of period | $ | 4,194 | $ | 3,019 | ||||
| Cash flows provided by (used for) operating activities: | ||||||||
| Net income | 5,661 | 3,974 | ||||||
| Adjustments to reconcile net income to net cash provided by operating activities: | ||||||||
| Depreciation | 2,623 | 2,229 | ||||||
| Share-based compensation | 449 | 389 | ||||||
| Amortization of intangibles | 427 | 396 | ||||||
| (Gains) losses on equity investments, net | 134 | (274 | ) | |||||
| Changes in assets and liabilities: | ||||||||
| Accounts receivable | (796 | ) | (235 | ) | ||||
| Inventories | (548 | ) | (512 | ) | ||||
| Accounts payable | 117 | 196 | ||||||
| Accrued compensation and benefits | (1,500 | ) | (1,620 | ) | ||||
| Prepaid supply agreements | (87 | ) | (228 | ) | ||||
| Income taxes | 753 | 440 | ||||||
| Other assets and liabilities | (1,075 | ) | 204 | |||||
| Total adjustments | 497 | 985 | ||||||
| Net cash provided by operating activities | 6,158 | 4,959 | ||||||
| Cash flows provided by (used for) investing activities: | ||||||||
| Additions to property, plant and equipment | (3,268 | ) | (3,321 | ) | ||||
| Purchases of available-for-sale debt investments | (513 | ) | (872 | ) | ||||
| Maturities and sales of available-for-sale debt investments | 625 | 948 | ||||||
| Purchases of trading assets | (3,897 | ) | (1,869 | ) | ||||
| Maturities and sales of trading assets | 3,660 | 1,554 | ||||||
| Sales of equity investments | 20 | 1,077 | ||||||
| Other investing | (363 | ) | (239 | ) | ||||
| Net cash used for investing activities | (3,736 | ) | (2,722 | ) | ||||
| Cash flows provided by (used for) financing activities: | ||||||||
| Increase (decrease) in short-term debt, net | — | 1,682 | ||||||
| Issuance of long-term debt, net of issuance costs | 10,247 | 135 | ||||||
| Repayment of debt and debt conversion | (1,075 | ) | (861 | ) | ||||
| Proceeds from sales of common stock through employee equity incentive plans | 503 | 290 | ||||||
| Repurchase of common stock | (4,229 | ) | (2,530 | ) | ||||
| Payment of dividends to stockholders | (1,408 | ) | (1,414 | ) | ||||
| Other financing | 726 | 596 | ||||||
| Net cash provided by (used for) financing activities | 4,764 | (2,102 | ) | |||||
| Net increase (decrease) in cash and cash equivalents | 7,186 | 135 | ||||||
| Cash and cash equivalents, end of period | $ | 11,380 | $ | 3,154 | ||||
| Supplemental disclosures of noncash investing activities and cash flow information: | ||||||||
| Acquisition of property, plant, and equipment included in accounts payable and accrued liabilities | $ | 2,294 | $ | 2,259 | ||||
| Cash paid during the period for: | ||||||||
| Interest, net of capitalized interest | $ | 67 | $ | 109 | ||||
| Income taxes, net of refunds | $ | 211 | $ | 125 | ||||
See accompanying notes.
| FINANCIAL STATEMENTS | Consolidated Condensed Statements of Cash Flows | 9 |
| CONSOLIDATED CONDENSED STATEMENTS OF STOCKHOLDERS' EQUITY |
| Common Stock and Capital in Excess of Par Value | Accumulated Other Comprehensive Income (Loss) | Retained Earnings | Total | ||||||||||||||||
| (In Millions, Except Per Share Amounts; Unaudited) | Shares | Amount | |||||||||||||||||
| Three Months Ended | |||||||||||||||||||
| Balance as of December 29, 2019 | 4,290 | $ | 25,261 | $ | (1,280 | ) | $ | 53,523 | $ | 77,504 | |||||||||
| Net income | — | — | — | 5,661 | 5,661 | ||||||||||||||
| Other comprehensive income (loss) | — | — | (261 | ) | — | (261 | ) | ||||||||||||
| Employee equity incentive plans and other | 17 | 620 | — | — | 620 | ||||||||||||||
| Share-based compensation | — | 449 | — | — | 449 | ||||||||||||||
| Temporary equity reduction | — | 155 | — | — | 155 | ||||||||||||||
| Convertible debt | — | (750 | ) | — | — | (750 | ) | ||||||||||||
| Repurchase of common stock | (71 | ) | (420 | ) | — | (3,689 | ) | (4,109 | ) | ||||||||||
| Restricted stock unit withholdings | (2 | ) | (64 | ) | — | (32 | ) | (96 | ) | ||||||||||
| Cash dividends declared ($0.66 per share) | — | — | — | (2,819 | ) | (2,819 | ) | ||||||||||||
| Balance as of March 28, 2020 | 4,234 | $ | 25,251 | $ | (1,541 | ) | $ | 52,644 | $ | 76,354 | |||||||||
| Balance as of December 28, 2018 | 4,516 | $ | 25,365 | $ | (974 | ) | $ | 50,172 | $ | 74,563 | |||||||||
| Net income | — | — | — | 3,974 | 3,974 | ||||||||||||||
| Other comprehensive income (loss) | — | — | 161 | — | 161 | ||||||||||||||
| Employee equity incentive plans and other | 11 | 372 | — | — | 372 | ||||||||||||||
| Share-based compensation | — | 389 | — | — | 389 | ||||||||||||||
| Temporary equity reduction | — | 145 | — | — | 145 | ||||||||||||||
| Convertible debt | — | (592 | ) | — | — | (592 | ) | ||||||||||||
| Repurchase of common stock | (49 | ) | (278 | ) | — | (2,172 | ) | (2,450 | ) | ||||||||||
| Restricted stock unit withholdings | (1 | ) | (55 | ) | — | (17 | ) | (72 | ) | ||||||||||
| Cash dividends declared ($0.63 per share) | — | — | — | (2,829 | ) | (2,829 | ) | ||||||||||||
| Balance as of March 30, 2019 | 4,477 | $ | 25,346 | $ | (813 | ) | $ | 49,128 | $ | 73,661 | |||||||||
See accompanying notes.
| FINANCIAL STATEMENTS | Consolidated Condensed Statements of Stockholders' Equity | 10 |
| NOTES TO CONSOLIDATED CONDENSED FINANCIAL STATEMENTS |
| NOTE 1 : | BASIS OF PRESENTATION |
We prepared our interim consolidated condensed financial statementsConsolidated Condensed Financial Statements that accompany these notes in conformity with U.S. generally accepted accounting principles,GAAP, consistent in all material respects with those applied in our Annual Report on Form 10-K for the fiscal year ended December 31, 2016 (2016 Form 10-K).
We have made estimates and judgments affecting the amounts reported in our consolidated condensed financial statementsConsolidated Condensed Financial Statements and the accompanying notes. The inputs into our judgments and estimates consider the economic implications of COVID-19 on our critical and significant accounting estimates. The actual results that we experience may differ materially from our estimates. The interim financial information is unaudited, butand reflects all normal adjustments that are, in our opinion, necessary to provide a fair statement of results for the interim periods presented. This report should be read in conjunction with the consolidated financial statementsConsolidated Financial Statements in our 20162019 Form 10-K.10-K where we include additional information about our policies and the methods and assumptions used in our estimates.
We manage our business through the following operating segments:
DCG
Mobileye
NSG
PSG
CCG
We derive a substantial majority of our revenue from platform products, which are our principal products and considered as one class of product. We offer platformsplatform products that incorporate various components and technologies, including a microprocessor and chipset, a stand-alone System-on-Chip,SoC, or a multichip package. A platform may be enhanced by additional hardware, software, and services offered by Intel. PlatformsPlatform products are used in various form factors across our DCG, IOTG, and CCG operating segments. Our non-platform, or adjacent products, can be combined with platform products to form comprehensive platform solutions to meet customer needs.
DCG and IOTGCCG are our reportable operating segments. IOTG, Mobileye, NSG, and PSG do not meet the quantitative thresholds to qualify as reportable operating segments; however, we have elected to disclose the results of these non-reportable operating segments. Our Internet of Things portfolio, presented as Internet of Things, is comprised of IOTG and Mobileye operating segments.
We derive a substantial majority of our revenue from platforms, which is our principal product.
results of operations from non-reportable segments;
| • | historical results of operations from divested businesses; |
| • | results of operations of start-up businesses that support our initiatives, including our foundry business; |
| • | amounts included within restructuring and other charges; |
| • | a portion of employee benefits, compensation, and other expenses not allocated to the operating segments; and |
acquisition-related costs, including amortization and any impairment of acquisition-related intangibles and goodwill.
The Chief Operating Decision Maker (CODM), whichCODM, who is our Chief Executive Officer (CEO),CEO, does not evaluate operating segments using discrete asset information. Operating segments do not record inter-segment revenue. We do not allocate gains and losses from equity investments, interest and other income, or taxes to operating segments. Although the CODM uses operating income to evaluate the segments, operating costs included in one segment may benefit other segments. Except for these differences, the accounting policies for segment reporting are the same as for Intel as a whole.
| FINANCIAL STATEMENTS | Notes to Financial Statements | 11 |
Net revenue and operating income (loss) for each period were as follows:
| Three Months Ended | ||||||||
| (In Millions) | Mar 28, 2020 | Mar 30, 2019 | ||||||
| Net revenue: | ||||||||
| Data Center Group | ||||||||
| Platform | $ | 6,427 | $ | 4,482 | ||||
| Adjacent | 566 | 420 | ||||||
| 6,993 | 4,902 | |||||||
| Internet of Things | ||||||||
| IOTG | 883 | 910 | ||||||
| Mobileye | 254 | 209 | ||||||
| 1,137 | 1,119 | |||||||
| Non-Volatile Memory Solutions Group | 1,338 | 915 | ||||||
| Programmable Solutions Group | 519 | 486 | ||||||
| Client Computing Group | ||||||||
| Platform | 8,712 | 7,824 | ||||||
| Adjacent | 1,063 | 762 | ||||||
| 9,775 | 8,586 | |||||||
| All other | 66 | 53 | ||||||
| Total net revenue | $ | 19,828 | $ | 16,061 | ||||
| Operating income (loss): | ||||||||
| Data Center Group | $ | 3,492 | $ | 1,841 | ||||
| Internet of Things | ||||||||
| IOTG | 243 | 251 | ||||||
| Mobileye | 88 | 68 | ||||||
| 331 | 319 | |||||||
| Non-Volatile Memory Solutions Group | (66 | ) | (297 | ) | ||||
| Programmable Solutions Group | 97 | 89 | ||||||
| Client Computing Group | 4,225 | 3,072 | ||||||
| All other | (1,041 | ) | (850 | ) | ||||
| Total operating income | $ | 7,038 | $ | 4,174 | ||||
| FINANCIAL STATEMENTS | Notes to Financial Statements | 12 |
| Three Months Ended | Nine Months Ended | |||||||||||||||
| (In Millions) | Sep 30, 2017 | Oct 1, 2016 | Sep 30, 2017 | Oct 1, 2016 | ||||||||||||
| Net revenue: | ||||||||||||||||
| Client Computing Group | ||||||||||||||||
| Platform | $ | 8,132 | $ | 8,258 | $ | 23,163 | $ | 22,395 | ||||||||
| Other | 728 | 634 | 1,886 | 1,384 | ||||||||||||
| 8,860 | 8,892 | 25,049 | 23,779 | |||||||||||||
| Data Center Group | ||||||||||||||||
| Platform | 4,439 | 4,164 | 12,344 | 11,589 | ||||||||||||
| Other | 439 | 378 | 1,138 | 979 | ||||||||||||
| 4,878 | 4,542 | 13,482 | 12,568 | |||||||||||||
| Internet of Things Group | ||||||||||||||||
| Platform | 680 | 605 | 1,926 | 1,673 | ||||||||||||
| Other | 169 | 84 | 364 | 239 | ||||||||||||
| 849 | 689 | 2,290 | 1,912 | |||||||||||||
| Non-Volatile Memory Solutions Group | 891 | 649 | 2,631 | 1,760 | ||||||||||||
| Programmable Solutions Group | 469 | 425 | 1,334 | 1,249 | ||||||||||||
| All other | 202 | 581 | 922 | 1,745 | ||||||||||||
| Total net revenue | $ | 16,149 | $ | 15,778 | $ | 45,708 | $ | 43,013 | ||||||||
| Operating income (loss): | ||||||||||||||||
| Client Computing Group | $ | 3,600 | $ | 3,327 | $ | 9,656 | $ | 7,123 | ||||||||
| Data Center Group | 2,255 | 2,110 | 5,403 | 5,639 | ||||||||||||
| Internet of Things Group | 146 | 191 | 390 | 403 | ||||||||||||
| Non-Volatile Memory Solutions Group | (52 | ) | (134 | ) | (291 | ) | (453 | ) | ||||||||
| Programmable Solutions Group | 113 | 78 | 302 | (184 | ) | |||||||||||
| All other | (947 | ) | (1,110 | ) | (2,919 | ) | (4,180 | ) | ||||||||
| Total operating income | $ | 5,115 | $ | 4,462 | $ | 12,541 | $ | 8,348 | ||||||||
| Three Months Ended | ||||||||
| (In Millions) | Mar 28, 2020 | Mar 30, 2019 | ||||||
| Platform revenue | ||||||||
| DCG platform | $ | 6,427 | $ | 4,482 | ||||
| IOTG platform | 795 | 825 | ||||||
| CCG Desktop platform | 2,840 | 2,886 | ||||||
| CCG Notebook platform | 5,857 | 4,926 | ||||||
CCG other platform1 | 15 | 12 | ||||||
| 15,934 | 13,131 | |||||||
Adjacent revenue2 | 3,894 | 2,930 | ||||||
| Total revenue | $ | 19,828 | $ | 16,061 | ||||
1 | Includes our tablet and service provider revenue. |
2 | Includes all of our non-platform products for DCG, IOTG, and CCG such as modem, Ethernet, and silicon photonics, as well as Mobileye, NSG, and PSG products. |
Planned Divestiture of our Home Gateway Platform Division
We signed a definitive agreement on April 5, 2020 to sell the majority of Home Gateway Platform, a division of CCG. The transaction contemplates the transfer of certain employees, equipment, and an on-going supply agreement for future units. We reclassified the assets and liabilities as held-for-sale within other current assets/liabilities. We expect to close the transaction in the third quarter of 2020.
| NOTE 3 : | EARNINGS PER SHARE |
We computed basic earnings per share of common stock based on the weighted average number of shares of common stock outstanding during the period. We computed diluted earnings per share of common stock based on the weighted average number of shares of common stock outstanding plus potentially dilutive shares of common stock outstanding during the period.
In all periods presented, potentially dilutive securitiesSecurities which would have been antidilutiveanti-dilutive are insignificant and are excluded from the computation of diluted earnings per share.Inshare in all periods presented, we includedpresented.
Note 6: Other Financial Statement Details
InventoriesINVENTORIES
Deferred IncomeINTEREST AND OTHER, NET
INTEL CORPORATIONNOTES TO CONSOLIDATED CONDENSED FINANCIAL STATEMENTS — Unaudited (Continued)
Gains (Losses) on Equity Investments, NetThe components of gains (losses) on equity investments, net for each period were as follows:
Interest and Other, Net
Note 7: Restructuring and Other Charges
2016 Restructuring ProgramInA restructuring program was approved in the secondfirst quarter of 2017, we2020 to further align our workforce with our continuing investments in the business and execute the planned divestiture of Home Gateway Platform, a division of CCG. We expect these actions to be substantially completedcomplete in the 2016 Restructuring Program. For further information, see "Note 7: Restructuring and Other Charges" in Part II, Item 8third quarter of our 2016 Form 10-K.2020.
INTEL CORPORATIONNOTES TO CONSOLIDATED CONDENSED FINANCIAL STATEMENTS — Unaudited (Continued)
Restructuring and other activity for the 2016 Restructuring Program for the first nine months of 2017 was as follows:
A substantial majority of the accrued restructuring balance as of September 30, 2017 is expected to be paid within the next 12 months and was recorded within accrued compensation and benefits. Restructuring actions related to this program that were approved in 2016 impacted approximately 15,000 employees.Other charges
Note 8: Income Taxes
Our effective income tax rate was 28.1%DEBT INVESTMENTSNote 9: InvestmentsAvailable-for-Sale Investments
INTEL CORPORATIONNOTES TO CONSOLIDATED CONDENSED FINANCIAL STATEMENTS — Unaudited (Continued)
During the third quarter of 2017, we sold available-for sale investments for proceeds of $2.9 billion ($195 million in the third quarter of 2016). During the first nine months of 2017, we sold available-for-sale investments for proceeds of $4.7 billion ($4.0 billion in the first nine months of 2016). The gross realized gains on sales of available-for-sale investments were $927 million in the third quarter of 2017 and $2.0 billion in the first nine months of 2017 ($41 million in the third quarter of 2016 and $538 million in the first nine months of 2016).On April 28, 2017, Cloudera, Inc. (Cloudera) completed its initial public offering and we have designated our previous equity and cost method investments in Cloudera as available-for-sale. During the second quarter of 2017, we determined we had an other-than-temporary decline in the fair value of our investment and recognized an impairment charge of $278 million. We recognized the impairment in the second quarter due to the duration and severity of the decline in the investment's fair value, which we determined was below cost based upon observable market prices after the initial public offering.
Equity Method InvestmentsMcAfeeIn the second quarter1 Sale of 2017, we closed our divestitureequity investments and other includes realized gains (losses) on sales of the ISecG business and retained a 49% interest in McAfee as partial consideration. Our investment is accounted for under thenon-marketable equity method of accounting and is classified within other long-term assets. In the third quarter of 2017, we received a $735 million dividend from McAfee and recordedinvestments, our share of equity method investee losses. The carryinggains (losses) and distributions, and initial fair value ofadjustments recorded upon a security becoming marketable.IM Flash Technologies, LLCSince the inception of IM Flash Technologies, LLC (IMFT)formed in 2006 by Micron Technology, Inc. (Micron) and Intel haveto jointly developeddevelop NAND flash memory and most recently, 3D XPoint™ technology products. Intel also purchases jointly developed products directly from Micron under certain supply agreements.
IMFT is a variable interest entity and all costs of IMFT are passed on to Micron and Intel through sale of products or services in proportional share of ownership. Our portion of IMFT costs, primarily related to product purchases and production-related services, was approximately $115 million in the third quarter of 2017and approximately $350 million in the first nine months of 2017 (approximately $115 million in the third quarter of 2016 and approximately $315 million in the first nine months of 2016)28, 2019). The amount due to IMFT for product purchases and services provided was approximately $73 million as of September 30, 2017 (approximately $95 million as of December 31, 2016).IMFT depends on Micron and Intel for any additional cash needs. Our known maximum exposure to loss approximated the carrying value of our investment balance in IMFT. Except for the amount due to IMFT for product purchases and production-related services, we did not have any additional liabilities recognized on our consolidated condensed balance sheets in connection with our interests in this joint venture as of September 30, 2017. Our potential future losses could be higher than the carrying amount of our investment, as Intel and Micron are liable for other future operating costs or obligations of IMFT. Future cash calls could also increase our investment balance and the related exposure to loss. In addition, because we are currently committed to purchasing 49%of IMFT’s production output and production-related services, we may be required to purchase products at a cost in excess of realizable value.INTEL CORPORATIONNOTES TO CONSOLIDATED CONDENSED FINANCIAL STATEMENTS — Unaudited (Continued)
Non-marketable Cost Method InvestmentsBeijing UniSpreadtrum Technology Ltd.During 2014, we entered into a series of agreements with Tsinghua Unigroup Ltd. (Tsinghua Unigroup), an operating subsidiary of Tsinghua Holdings Co. Ltd., to, among other things, jointly develop Intel® architecture- and communications-based solutions for phones. We agreed to invest up to 9.0 billion Chinese yuan (approximately $1.5 billion as of the date of the agreement) for a minority stake of approximately 20% of Beijing UniSpreadtrum Technology Ltd., a holding company under Tsinghua Unigroup. During 2015, we invested$966 million to complete the first phase of the equity investment and accounted for our interest using the cost method of accounting. During the second quarter of 2017, we reduced our expectation of the company's future operating performance due to competitive pressures, which resulted in an other-than-temporary impairment charge of $147 million.Trading AssetsNet gains related to trading assets still held at the reporting date were $81 million in the third quarter of 2017 and $433 million in the first nine months of 2017 (there were $72 million net gains related to trading assets still held at the reporting date in the third quarter of 2016 and $245 million of net gains in the first nine months of 2016). Net losses on the related derivatives were $75 millionin the third quarter of 2017 and $402 millionin the first nine months of 2017 (net losses of $54 million in the third quarter of 2016 and $224 million in the first nine months of 2016).Note 10: Acquisitions and DivestituresAcquisition of MobileyeOn August 21, 2017, we completed our tender offer for all of the outstanding ordinary shares of Mobileye, a global leader in the development of computer vision and machine learning, data analysis, localization and mapping for advanced driver assistance systems and autonomous driving. This acquisition combines Mobileye's leading computer vision expertise with Intel’s high-performance computing and connectivity expertise to create automated driving solutions from car to cloud. The combination is expected to accelerate innovation for the automotive industry and position Intel as a leading technology provider in the fast-growing market for highly and fully autonomous vehicles. The transaction also extends Intel’s strategy to invest in data-intensive market opportunities that build on our strengths in computing and connectivity from the cloud, through the network, to the device.As of the completion of the tender offer, we acquired substantially all of the outstanding ordinary shares of Mobileye. We acquired 84.4% of the outstanding shares on August 8, 2017 and 97.3% as of August 21, 2017, and we intend to acquire all remaining outstanding shares. We have reflected the acquisition of the additional outstanding shares and reduction to the noncontrolling interest by $1.8 billion in the tables below.Total consideration to acquire Mobileye was $14.5 billion (net of $366 million of cash and cash equivalents acquired).The preliminary fair values of the assets acquired and liabilities assumed by major class in the acquisition of Mobileye were recognized as follows:
We assumed outstanding unvested Mobileye stock options and RSUs granted under two Mobileye equity plans. We will not grant additional equity awards under these two Mobileye equity plans. In connection with the acquisition, we recognized share-based compensation expense of $71 million for cash-settled awards.INTEL CORPORATIONNOTES TO CONSOLIDATED CONDENSED FINANCIAL STATEMENTS — Unaudited (Continued)
The preliminary allocation of the purchase price was based upon estimates and assumptions that are subject to change within the one year measurement period. The primary areas of the purchase price allocation that are not yet finalized are certain tax matters, identification of contingencies, and goodwill.The fair value of the noncontrolling interest was determined based on the quoted share price of Mobileye as of August 8, 2017, and the remaining outstanding shares that constitute the noncontrolling interest. We recorded the noncontrolling interest as a component of equity.Goodwill of $10.3 billion arising from the acquisition is attributed to the expected synergies and other benefits that will be generated from the combination of Intel and Mobileye. Substantially all of the goodwill recognized is not expected to be deductible for tax purposes. The goodwill recognized from the acquisition is included within "all other."The identified intangible assets assumed in the acquisition of Mobileye were recognized as follows:
Acquired developed technology represents the fair value of Mobileye products that have reached technological feasibility and are a part of Mobileye’s product offerings, as opposed to in-process research and development which represents the fair value of products that have not reached technological feasibility. Customer relationships represent the fair values of the underlying relationships and agreements with Mobileye’s customers.Divestiture of Intel Security GroupOn April 3, 2017, we closed the transaction with TPG VII Manta Holdings, L.P., now known as Manta Holdings, L.P. (TPG), transferring certain assets and liabilities relating to ISecG to a newly formed, jointly-owned, separate cybersecurity company called McAfee.Total consideration received was $4.2 billion, consisting of $924 million in cash proceeds, $1.1 billion in the form of equity representing a 49% ownership interest in McAfee, and $2.2 billion in the form of promissory notes issued by McAfee and TPG. During the third quarter of 2017, McAfee and TPG repaid the $2.2 billion of promissory notes, which are included within proceeds from divestiture.The carrying amounts of the major classes of ISecG assets and liabilities as of the transaction close date included the following:
INTEL CORPORATIONNOTES TO CONSOLIDATED CONDENSED FINANCIAL STATEMENTS — Unaudited (Continued)
As of the transaction close date, we recognized a pre-tax gain of $387 million within "Interest and other, net," which is net of $507 million of currency translation adjustment losses reclassified from accumulated other comprehensive income (loss) associated with currency charges on the carrying values of ISecG goodwill and identified intangible assets. In addition, we recognized a tax expense of $822 million.Note 11: Identified Intangible AssetsAs a result of our acquisition of Mobileye during the third quarter of 2017, we recorded $4.5 billion of identified intangible assets. For further information about these acquired identified intangible assets, see "Note 10: Acquisitions and Divestitures."
Amortization expenses recorded in the consolidated condensed statements of income for each period were as follows:
INTEL CORPORATIONNOTES TO CONSOLIDATED CONDENSED FINANCIAL STATEMENTS — Unaudited (Continued)
We expect future amortization expense for the next five years to be as follows:
Note 12: Other Long-Term Assets
Note 13: BorrowingsShort-Term Debt
Our current portion of long-term debt includes our 2009 junior subordinated convertible debentures due 2039.
During the second quarter of 2017, we repaid $500 million of our 1.75% senior notes that matured in May 2017.INTEL CORPORATIONNOTES TO CONSOLIDATED CONDENSED FINANCIAL STATEMENTS — Unaudited (Continued)
Long-Term DebtLONG-TERM DEBT
Our indebtedness is carried at amortized cost net of applicable hedge adjustments.
INTEL CORPORATION
NOTES TO CONSOLIDATED CONDENSED FINANCIAL STATEMENTS — Unaudited (Continued)
During the third quarter of 2017, we redeemed the $1.0 billion 4.90% senior notes due August 2045. Additionally, we issued a total of $640 million aggregate principal amount of senior notes. We used the net proceeds from the offering of the notes to finance a portion of the redemption price of our 4.90% senior notes due August 2045.For further information on our debt instruments, see "Note 14: Borrowings" in Part II, Item 8
Fair Value Option for Loans Receivable
As of September 30, 2017 and December 31, 2016, the fair value of our loans receivable for which we elected the fair value option did not significantly differ from the contractual principal balance based on the contractual currency.
Assets Measured and Recorded at Fair Value on a Non-Recurring BasisASSETS MEASURED AND RECORDED AT FAIR VALUE ON A NON-RECURRING BASISWe classifiedrecognized in the current period. If an observable price adjustment or impairment is recognized on our non-marketable equity investmentssecurities during the period, we classify these assets as Level 3. Impairments recognized3 within the fair value hierarchy based on non-marketable equity investments held asthe nature of September 30, 2017 were insignificant during the third quarter of 2017 and $335 million during the first nine months of 2017 ($48 million during the third quarter of 2016 and $132 million during the first nine months of 2016 on non-marketable equity investments held as of October 1, 2016).fair value inputs.The carrying amounts and fair values of financial instruments not recorded at fair value on a recurring basis atinclude non-marketable equity securities and equity method investments that have not been remeasured or impaired in the endcurrent period, grants receivable, loans receivable, reverse repurchase agreements, and issued debt.
Inthese financial instruments approximates their carrying value and is categorized as Level 2 within the third quarter of 2017, we began assigning fair value hierarchy levels for our short-term and long-term debt based on the underlying instrument type. We have reclassified prior period amounts to conform tonature of the current period presentation.fair value inputs.
INTEL CORPORATION
NOTES TO CONSOLIDATED CONDENSED FINANCIAL STATEMENTS — Unaudited (Continued)
Note 15: Other Comprehensive Income (Loss)
INTEL CORPORATIONNOTES TO CONSOLIDATED CONDENSED FINANCIAL STATEMENTS — Unaudited (Continued)
The amounts reclassified out of accumulated other comprehensive income (loss) into the consolidated condensed statements of income for each period were as follows:
The amortization of pension and postretirement benefit components are included in the computation of net periodic benefit cost. For further information, see "Note 18: Retirement Benefit Plans" in Part II, Item 8 of our 2016 Form 10-K.During the second quarter of 2017, we reclassified approximately $507 million (before taxes) of currency translation adjustment losses included in accumulated other comprehensive income (loss) into earnings as a result of our divestiture of ISecG. For more information see "Note 10: Acquisitions and Divestitures."
INTEL CORPORATIONNOTES TO CONSOLIDATED CONDENSED FINANCIAL STATEMENTS — Unaudited (Continued)
Note 16: Derivative Financial Instruments
For further information on our derivative policies, see “Note 2: Accounting Policies" in Part II, Item 8 of our 2016 Form 10-K.VOLUME OF DERIVATIVE ACTIVITYVolume of Derivative Activity
Fair Value of Derivative Instruments in the Consolidated Condensed Balance SheetsFAIR VALUE OF DERIVATIVE INSTRUMENTS
INTEL CORPORATION
NOTES TO
Amounts Offset in the Consolidated Condensed Balance SheetsBALANCE SHEETS
INTEL CORPORATIONNOTES TO CONSOLIDATED CONDENSED FINANCIAL STATEMENTS — Unaudited (Continued)
Derivatives in Cash Flow Hedging RelationshipsDERIVATIVES IN CASH FLOW HEDGING RELATIONSHIPSFor information on the unrealized holding gains (losses) on derivatives reclassified out
Derivatives in Fair Value Hedging Relationships
ThereThe amounts recorded on the Consolidated Condensed Balance Sheets related to cumulative basis adjustments for fair value hedges for each period were as follows:
Derivatives Not Designated as Hedging InstrumentsDERIVATIVES NOT DESIGNATED AS HEDGING INSTRUMENTS
Note 17: Employee Equity Incentive Plans
Our equity incentive plans are broad-based, long-term programs intended to attract and retain talented employees and align stockholder and employee interests.In May 2017, stockholders approved an extension of the expiration date of the 2006 Equity Incentive Plan to June 2020 and approved an additional 33 million shares reserved for issuance under the plan. As of September 30, 2017, 218 million shares of common stock remained available for future grants.Share-Based CompensationShare-based compensation expense recognized was $397 million, which includes $71 million of cash-settled awards in connection with the Mobileye acquisition, in the third quarter of 2017 and $1.1 billion in the first nine months of 2017 ($324 million in the third quarter of 2016 and $1.1 billion in the first nine months of 2016).INTEL CORPORATIONNOTES TO CONSOLIDATED CONDENSED FINANCIAL STATEMENTS — Unaudited (Continued)
Restricted Stock Unit AwardsRestricted stock unit activity in the first nine months of 2017 was as follows:
The aggregate fair value of awards that vested in the first nine months of 2017 was $1.5 billion, which represents the market value of our common stock on the date that the RSUs vested. The grant-date fair value of awards that vested in first nine months of 2017 was $1.0 billion. The number of RSUs vested includes shares of common stock that we withheld on behalf of employees to satisfy the minimum statutory tax withholding requirements. RSUs that are expected to vest are net of estimated future forfeitures.Stock Purchase PlanThe 2006 Stock Purchase Plan allows eligible employees to purchase shares of our common stock at 85% of the value of our common stock on specific dates. Rights to purchase shares of common stock are granted during the first and third quarters of each year. The 2006 Stock Purchase Plan has 150 million shares of common stock remaining through August 2021 for issuance.Employees purchased 15 million shares of common stock in the first nine months of 2017 for $432 million (16.5 million shares of common stock in the first nine months of 2016 for $415 million) under the 2006 Stock Purchase Plan.Note 18: ContingenciesLegal ProceedingsLEGAL PROCEEDINGSINTEL CORPORATION
NOTES TO CONSOLIDATED CONDENSED FINANCIAL STATEMENTS — Unaudited (Continued)
Shareholder Derivative Litigation regarding Related to Security Vulnerabilities
In June 2015, the International Brotherhood of Electrical Workers (IBEW)2019 Intel filed a shareholder derivative actionrequest for rehearing on the second IPR petition. In January 2020, the USPTO denied the rehearing and petition on the first IPR petition.INTEL CORPORATIONNOTES TO CONSOLIDATED CONDENSED FINANCIAL STATEMENTS — Unaudited (Continued)
In April 2016, John Esposito filed a shareholder derivative action in the Superior Court of California in Santa Clara County against Intel, current members of our Board of Directors, and certain former officers and employees. Esposito made a demand on our Board in 2013 to investigate whether our officers or directors should be sued for their participation in the events described in In re High Tech Employee Antitrust Litigation. In November 2015, our Board decided not to take further action on Esposito’s demandChinese Patent No. CN 102386226 (‘226 Patent) based on the recommendationmanufacturing and sale of Intel’s Core i3 microprocessors. Defendants in the Audit Committeesecond case are Lenovo (Beijing) Co., Ltd. (Lenovo) and Beijing Jiayun Huitong Technology Development Co. Ltd. (BJHT). Defendants in the third case are Intel Corp., Intel China Co., Ltd., the Intel China Beijing Branch, Beijing Digital China Co., Ltd. (Digital China), and JD. Both complaints demand injunctions plus litigation costs and reserve the right to claim damages in unspecified amounts. No proceedings have occurred or are yet scheduled in these lawsuits. In December 2019, Lenovo tendered indemnity to Intel, which Intel granted in March 2020. Given the procedural posture and the nature of these cases, the Board after its investigation of relevant factsunspecified nature and circumstances. Esposito seeks to set aside such decision, and alleges that the Board was not disinterested in making that decision and that the investigation was inadequate. In November 2016, the court granted Intel’s motion to dismiss the case, without leave to amend. In March 2017, plaintiff filed a motion for fees. The court denied plaintiff’s fee motion in May 2017, and entered final judgment in this matter in June 2017. In August 2017, Esposito appealed the final judgment.McAfee, Inc. Shareholder LitigationOn August 19, 2010, we announced that we had agreed to acquire all of the common stock of McAfee, Inc. (McAfee) for $48.00 per share. Four McAfee shareholders filed putative class-action lawsuits in Santa Clara County, California Superior Court challenging the proposed transaction. The cases were ordered consolidated in September 2010. Plaintiffs filed an amended complaint that named former McAfee board members, McAfee, and Intel as defendants, and alleged that the McAfee board members breached their fiduciary duties and that McAfee and Intel aided and abetted those breaches of duty. The complaint requested rescission of the merger agreement, such other equitable relief as the court may deem proper, and an awardextent of damages in an unspecified amount. In June 2012,claimed by IMECAS, and uncertainty regarding the plaintiffs’ damages expert asserted that the valueavailability of a McAfee share for the purposes of assessing damages should be $62.08.In January 2012, the court certified the action as a class action, appointed the Central Pension Laborers’ Fund to act as the class representative and scheduled trial to begin in January 2013. In March 2012, defendants filed a petition with the California Court of Appeal for a writ of mandate to reverse the class certification order; the petition was denied in June 2012. In March 2012, at defendants’ request, the court held that plaintiffs were not entitled to a jury trial and ordered a bench trial. In April 2012, plaintiffs filed a petition with the California Court of Appeal for a writ of mandate to reverse that order, which the court of appeal denied in July 2012. In August 2012, defendants filed a motion for summary judgment. The trial court granted that motion in November 2012, and entered final judgment in the case in February 2013. In April 2013, plaintiffs appealed the final judgment. The California Court of Appeal heard oral argument in October 2017, and the parties await the court’s decision. Because the resolution of the appeal may materially impact the scope and nature of the proceeding,injunctive relief under applicable law, we are unable to make a reasonable estimate of the potential loss or range of losses, if any, arising from this matter.these matters. We dispute the class-actionIMECAS’s claims and intend to continue tovigorously defend the lawsuit vigorously.against them.In March 2014, we filed a complaint against Future Link Systems, LLC (Future Link) in the United States District Court for the District of Delaware, requesting a declaratory judgment that Intel and our customers do not infringe any valid, enforceable claim of nine patents owned by Future Link. In July 2015, Future Link filed counterclaims against Intel alleging infringement of fifteen patents. In June 2017, the court denied both parties’ Daubert motions to exclude opinions of the other parties’ damages experts. In July 2017, the court ruled on numerous motions for summary judgment of certain claims filed by both Intel and Future Link. As of July 2017, Future Link alleged infringement of fourteen patents, claimed past damages in the amount of approximately $9.9 billion in its experts’ reports, and sought additional damages accrued through trial and ongoing royalties after trial in an unspecified amount. The court scheduled a jury trial for September 2017 on Future Link’s infringement claims regarding three patents with a past damages claim of approximately $2.9 billion and ordered that other proceedings be stayed. In August 2017, the parties reached a confidential settlement agreement resolving all claims. The settlement did not have a material financial impact to Intel.
| Three Months Ended | ||||||||
| (In Millions, Except Per Share Amounts) | Mar 28, 2020 | Mar 30, 2019 | ||||||
| Net income available to common stockholders | $ | 5,661 | $ | 3,974 | ||||
| Weighted average shares of common stock outstanding—basic | 4,266 | 4,492 | ||||||
| Dilutive effect of employee equity incentive plans | 46 | 53 | ||||||
| Dilutive effect of convertible debt | — | 19 | ||||||
| Weighted average shares of common stock outstanding—diluted | 4,312 | 4,564 | ||||||
| Earnings per share—basic | $ | 1.33 | $ | 0.88 | ||||
| Earnings per share—diluted | $ | 1.31 | $ | 0.87 | ||||
| Three Months Ended | Nine Months Ended | |||||||||||||||
| (In Millions, Except Per Share Amounts) | Sep 30, 2017 | Oct 1, 2016 | Sep 30, 2017 | Oct 1, 2016 | ||||||||||||
| Net income available to common stockholders | $ | 4,516 | $ | 3,378 | $ | 10,288 | $ | 6,754 | ||||||||
| Weighted average shares of common stock outstanding—basic | 4,688 | 4,734 | 4,707 | 4,728 | ||||||||||||
| Dilutive effect of employee equity incentive plans | 34 | 47 | 43 | 54 | ||||||||||||
| Dilutive effect of convertible debt | 99 | 96 | 99 | 90 | ||||||||||||
| Weighted average shares of common stock outstanding—diluted | 4,821 | 4,877 | 4,849 | 4,872 | ||||||||||||
| Basic earnings per share of common stock | $ | 0.96 | $ | 0.71 | $ | 2.19 | $ | 1.43 | ||||||||
| Diluted earnings per share of common stock | $ | 0.94 | $ | 0.69 | $ | 2.12 | $ | 1.39 | ||||||||
Potentially dilutive shares of common stock from employee equity incentive plans are determined by applying the treasury stock method to the assumed exercise of outstanding stock options, the assumed vesting of outstanding restricted stock units (RSUs),RSUs, and the assumed issuance of common stock under the stock purchase plan. Potentially dilutive shares
In January 2020, we fully redeemed the remaining principal of our 2009 Debentures. We included our 2009 Debentures in the calculation of diluted earnings per share of common stock for our 2005 debentures are determined by applying the if-converted method. However, as our 2009 debentures require settlement of the principal amount of the debt in cash upon conversion, with the conversion premium paid in cash or stock at our option, potentially dilutive shares of common stock are determined2019 by applying the treasury stock method.method because the average market price was above the conversion price.
| FINANCIAL STATEMENTS | Notes to Financial Statements | 13 |
| NOTE 4 : | CONTRACT LIABILITIES |
| (In Millions) | Mar 28, 2020 | Dec 28, 2019 | ||||||
| Prepaid supply agreements | $ | 1,718 | $ | 1,805 | ||||
| Other | 271 | 236 | ||||||
| Total contract liabilities | $ | 1,989 | $ | 2,041 | ||||
Contract liabilities are primarily related to prepayments received from customers on long-term prepaid supply agreements toward future NSG product delivery. The short-term portion of contract liabilities is reported on the Consolidated Condensed Balance Sheets within other accrued liabilities.
The following table shows the changes in contract liability balances relating to long-term prepaid supply agreements during the first three months of 2020:
| (In Millions) | ||||
| Prepaid supply agreements balance as of December 28, 2019 | $ | 1,805 | ||
| Prepayments utilized | (87 | ) | ||
| Prepaid supply agreements balance as of March 28, 2020 | $ | 1,718 | ||
If new long-term prepaid supply agreements are entered into and performance obligations are negotiated, this component of the contract liability balance will increase, and as customers purchase product and utilize their prepaid balances, the balance will decrease.
The timing and amount of future anticipated revenues from these agreements may vary from our 2009 debenturesexpectations due to changes in the calculation of diluted earnings per share of common stock because the averagesupply, demand, and market price was above the conversion price. We could potentially exclude the 2009 debentures in the future if the average market price is below the conversion price.pricing.
| NOTE 5 : | OTHER FINANCIAL STATEMENT DETAILS |
| (In Millions) | Mar 28, 2020 | Dec 28, 2019 | ||||||
| Raw materials | $ | 877 | $ | 840 | ||||
| Work in process | 6,654 | 6,225 | ||||||
| Finished goods | 1,715 | 1,679 | ||||||
| Total inventories | $ | 9,246 | $ | 8,744 | ||||
| (In Millions) | Sep 30, 2017 | Dec 31, 2016 | ||||||
| Raw materials | $ | 1,115 | $ | 695 | ||||
| Work in process | 3,965 | 3,190 | ||||||
| Finished goods | 1,849 | 1,668 | ||||||
| Total inventories | $ | 6,929 | $ | 5,553 | ||||
| (In Millions) | Sep 30, 2017 | Dec 31, 2016 | ||||||
| Deferred income on shipments of components to distributors | $ | 1,530 | $ | 1,475 | ||||
| Deferred income from software, services and other | 176 | 243 | ||||||
| Current deferred income | $ | 1,706 | $ | 1,718 | ||||
| Three Months Ended | Nine Months Ended | |||||||||||||||
| (In Millions) | Sep 30, 2017 | Oct 1, 2016 | Sep 30, 2017 | Oct 1, 2016 | ||||||||||||
| Share of equity method investee losses, net | $ | (110 | ) | $ | (10 | ) | $ | (129 | ) | $ | (30 | ) | ||||
| Impairments | (10 | ) | (48 | ) | (613 | ) | (137 | ) | ||||||||
| Gains on sales, net | 944 | 38 | 2,020 | 553 | ||||||||||||
| Dividends | — | — | 68 | 74 | ||||||||||||
| Other, net | 22 | 8 | 94 | 28 | ||||||||||||
| Total gains (losses) on equity investments, net | $ | 846 | $ | (12 | ) | $ | 1,440 | $ | 488 | |||||||
The components of interest and other, net for each period were as follows:
| Three Months Ended | ||||||||
| (In Millions) | Mar 28, 2020 | Mar 30, 2019 | ||||||
| Interest income | $ | 93 | $ | 135 | ||||
| Interest expense | (135 | ) | (138 | ) | ||||
| Other, net | (271 | ) | (58 | ) | ||||
| Total interest and other, net | $ | (313 | ) | $ | (61 | ) | ||
| Three Months Ended | Nine Months Ended | |||||||||||||||
| (In Millions) | Sep 30, 2017 | Oct 1, 2016 | Sep 30, 2017 | Oct 1, 2016 | ||||||||||||
| Interest income | $ | 137 | $ | 56 | $ | 349 | $ | 159 | ||||||||
| Interest expense | (191 | ) | (180 | ) | (493 | ) | (575 | ) | ||||||||
| Other, net | 23 | (8 | ) | 480 | 76 | |||||||||||
| Total interest and other, net | $ | (31 | ) | $ | (132 | ) | $ | 336 | $ | (340 | ) | |||||
Interest expense in the preceding table is net of $77$83 million of interest capitalized in the third quarterfirst three months of 2017 and $2122020 ($125 million in the first ninethree months of 2017 ($36 million in the third quarter of 2016 and $82 million in the first nine months of 2016)2019).
| FINANCIAL STATEMENTS | Notes to Financial Statements | 14 |
| NOTE 6 : | RESTRUCTURING AND OTHER CHARGES |
| Three Months Ended | Nine Months Ended | |||||||||||||||
| (In Millions) | Sep 30, 2017 | Oct 1, 2016 | Sep 30, 2017 | Oct 1, 2016 | ||||||||||||
| 2016 Restructuring Program | $ | 2 | $ | 349 | $ | (51 | ) | $ | 1,763 | |||||||
| Other charges | 2 | 23 | 240 | 23 | ||||||||||||
| Total restructuring and other charges | $ | 4 | $ | 372 | $ | 189 | $ | 1,786 | ||||||||
Restructuring and other charges by type for the 2016 Restructuring Program for the period were as follows:
| Three Months Ended | ||||
| (In Millions) | Mar 28, 2020 | |||
| Employee severance and benefit arrangements | $ | 105 | ||
| Asset impairment and other charges | 57 | |||
| Total restructuring and other charges | $ | 162 | ||
| Three Months Ended | Nine Months Ended | |||||||||||||||
| (In Millions) | Sep 30, 2017 | Oct 1, 2016 | Sep 30, 2017 | Oct 1, 2016 | ||||||||||||
| Employee severance and benefit arrangements | $ | (2 | ) | $ | 338 | $ | (72 | ) | $ | 1,752 | ||||||
| Pension settlement charges | — | 10 | — | 10 | ||||||||||||
| Asset impairment and other charges | 4 | 1 | 21 | 1 | ||||||||||||
| Total restructuring and other charges | $ | 2 | $ | 349 | $ | (51 | ) | $ | 1,763 | |||||||
| (In Millions) | Employee Severance and Benefits | Asset Impairments and Other | Total | |||||||||
| Accrued restructuring balance as of December 31, 2016 | $ | 585 | $ | 10 | $ | 595 | ||||||
| Additional accruals | — | 21 | 21 | |||||||||
| Adjustments | (72 | ) | — | (72 | ) | |||||||
| Cash payments | (282 | ) | (25 | ) | (307 | ) | ||||||
| Non-cash settlements | — | (2 | ) | (2 | ) | |||||||
| Accrued restructuring balance as of September 30, 2017 | $ | 231 | $ | 4 | $ | 235 | ||||||
| Three Months Ended | Nine Months Ended | |||||||||||||||
| (In Millions) | Sep 30, 2017 | Oct 1, 2016 | Sep 30, 2017 | Oct 1, 2016 | ||||||||||||
| ISecG separation costs | $ | 1 | $ | 23 | $ | 144 | $ | 23 | ||||||||
| Other | 1 | — | 96 | — | ||||||||||||
| Total other charges | $ | 2 | $ | 23 | $ | 240 | $ | 23 | ||||||||
| NOTE 7 : | INVESTMENTS |
Trading Assets
Net losses related to trading assets still held at the reporting date were $231 million in the first ninethree months of 2017 compared to 20.5%2020 ($16 million of net gains in the first ninethree months of 2016. A majority of2019). Net gains on the increaserelated derivatives were $100 million in the effective rate was attributable tofirst three months of 2020 ($2 million of net gains in the $822 million tax expense due to our divestiturefirst three months of ISecG.2019).
Available-for-Sale Debt Investments
| March 28, 2020 | December 28, 2019 | |||||||||||||||||||||||||||||||
| (In Millions) | Adjusted Cost | Gross Unrealized Gains | Gross Unrealized Losses | Fair Value | Adjusted Cost | Gross Unrealized Gains | Gross Unrealized Losses | Fair Value | ||||||||||||||||||||||||
| Corporate debt | $ | 3,656 | $ | 46 | $ | (9 | ) | $ | 3,693 | $ | 2,914 | $ | 44 | $ | — | $ | 2,958 | |||||||||||||||
| Financial institution instruments | 9,482 | 12 | (2 | ) | 9,492 | 3,007 | 15 | (1 | ) | 3,021 | ||||||||||||||||||||||
| Government debt | 748 | 11 | (1 | ) | 758 | 560 | 4 | — | 564 | |||||||||||||||||||||||
| Total available-for-sale debt investments | $ | 13,886 | $ | 69 | $ | (12 | ) | $ | 13,943 | $ | 6,481 | $ | 63 | $ | (1 | ) | $ | 6,543 | ||||||||||||||
| September 30, 2017 | December 31, 2016 | |||||||||||||||||||||||||||||||
| (In Millions) | Adjusted Cost | Gross Unrealized Gains | Gross Unrealized Losses | Fair Value | Adjusted Cost | Gross Unrealized Gains | Gross Unrealized Losses | Fair Value | ||||||||||||||||||||||||
| Corporate debt | $ | 2,603 | $ | 12 | $ | (7 | ) | $ | 2,608 | $ | 3,847 | $ | 4 | $ | (14 | ) | $ | 3,837 | ||||||||||||||
| Financial institution instruments | 7,709 | 6 | (4 | ) | 7,711 | 6,098 | 5 | (11 | ) | 6,092 | ||||||||||||||||||||||
| Government debt | 986 | 3 | (3 | ) | 986 | 1,581 | — | (8 | ) | 1,573 | ||||||||||||||||||||||
| Marketable equity securities | 2,101 | 3,958 | — | 6,059 | 2,818 | 3,363 | (1 | ) | 6,180 | |||||||||||||||||||||||
| Total available-for-sale investments | $ | 13,399 | $ | 3,979 | $ | (14 | ) | $ | 17,364 | $ | 14,344 | $ | 3,372 | $ | (34 | ) | $ | 17,682 | ||||||||||||||
Government debt includes instruments such as non-U.S. government bonds and U.S. agency securities. Financial institution instruments include instruments issued or managed by financial institutions in various forms such as commercial paper, fixed and floating rate bonds, money market fund deposits, and time deposits. Substantially all time deposits were issued by institutions outside the U.S. as of September 30, 2017 (most time deposits were issued by institutions outside the U.S. as of March 28, 2020 and December 31, 2016).28, 2019.
The fair value of available-for-sale debt investments, by contractual maturity, as of September 30, 2017,March 28, 2020, was as follows:
| (In Millions) | Fair Value | |||
| Due in 1 year or less | $ | 3,443 | ||
| Due in 1–2 years | 1,589 | |||
| Due in 2–5 years | 1,354 | |||
| Due after 5 years | — | |||
| Instruments not due at a single maturity date | 7,557 | |||
| Total | $ | 13,943 | ||
| FINANCIAL STATEMENTS | Notes to Financial Statements | 15 |
EQUITY INVESTMENTS
| (In Millions) | Mar 28, 2020 | Dec 28, 2019 | ||||||
| Marketable equity securities | $ | 330 | $ | 450 | ||||
| Non-marketable equity securities | 3,522 | 3,480 | ||||||
| Equity method investments | 28 | 37 | ||||||
| Total | $ | 3,880 | $ | 3,967 | ||||
We recognized $143 million of impairment charges on our non-marketable portfolio in the first three months of 2020 based on our assessment of the impact of recent public and private market volatility and tightening of liquidity.
The components of gains (losses) on equity investments, net for each period were as follows:
| Three Months Ended | ||||||||
| (In Millions) | Mar 28, 2020 | Mar 30, 2019 | ||||||
| Ongoing mark-to-market adjustments on marketable equity securities | $ | (103 | ) | $ | 253 | |||
| Observable price adjustments on non-marketable equity securities | 79 | 8 | ||||||
| Impairment charges | (143 | ) | (23 | ) | ||||
| Sale of equity investments and other¹ | 56 | 196 | ||||||
| Total gains (losses) on equity investments, net | $ | (111 | ) | $ | 434 | |||
| (In Millions) | Fair Value | |||
| Due in 1 year or less | $ | 3,314 | ||
| Due in 1–2 years | 1,573 | |||
| Due in 2–5 years | 2,200 | |||
| Due after 5 years | 71 | |||
| Instruments not due at a single maturity date | 4,147 | |||
| Total | $ | 11,305 | ||
Gains and losses for our investmentmarketable and non-marketable equity securities during the period were as follows:
| Three Months Ended | ||||||||
| (In Millions) | Mar 28, 2020 | Mar 30, 2019 | ||||||
| Net gains (losses) recognized during the period on equity securities | $ | (140 | ) | $ | 263 | |||
| Less: Net (gains) losses recognized during the period on equity securities sold during the period | (7 | ) | (190 | ) | ||||
| Unrealized gains (losses) recognized during the reporting period on equity securities still held at the reporting date | $ | (147 | ) | $ | 73 | |||
IMFT
IMFT was $257 million as of September 30, 2017. For further information related to the divestiture of the ISecG business, see "Note 10: Acquisitions and Divestitures".
As of SeptemberMarch 30, 2017,2019, we ownhad a carrying value of $1.5 billion in IMFT and owned a 49% interest in IMFT. The carrying valuethe unconsolidated variable interest entity. We sold our non-controlling interest in IMFT to Micron in October 2019. We will continue to purchase product manufactured by Micron at the IMFT facility under supply agreements, which include the next generation of 3DXpoint technology.
| NOTE 8 : | BORROWINGS |
As of March 28, 2020, our short-term debt was $3.5 billion, primarily comprised of the current portion of our investment was $855 million as of September 30, 2017long-term debt ($849 million3.7 billion as of December 31, 2016) and is classified within other long-term assets.
| (In Millions) | ||||
| Short-term investments and marketable securities | $ | 370 | ||
| Tangible assets | 227 | |||
| Goodwill | 10,278 | |||
| Identified intangible assets | 4,482 | |||
| Current liabilities | (69 | ) | ||
| Deferred tax liabilities and other | (418 | ) | ||
| Noncontrolling interest | (375 | ) | ||
| Total | $ | 14,495 | ||
| Fair Value (In Millions) | Weighted Average Estimated Useful Life (In Years) | |||||
| Developed technology | $ | 2,346 | 9 | |||
| Customer relationships | 713 | 12 | ||||
| Brands | 64 | 10 | ||||
| Identified intangible assets subject to amortization | 3,123 | |||||
| In-process research and development | 1,359 | |||||
| Identified intangible assets not subject to amortization | 1,359 | |||||
| Total identified intangible assets | $ | 4,482 | ||||
| (In Millions) | Apr 3, 2017 | |||
| Accounts receivable | $ | 317 | ||
| Goodwill | 3,601 | |||
| Identified intangible assets | 965 | |||
| Other assets | 276 | |||
| Total assets | $ | 5,159 | ||
| Deferred income | $ | 1,553 | ||
| Other liabilities | 276 | |||
| Total liabilities | $ | 1,829 | ||
| September 30, 2017 | ||||||||||||
| (In Millions) | Gross Assets | Accumulated Amortization | Net | |||||||||
| Acquisition-related developed technology | $ | 8,937 | $ | (1,686 | ) | $ | 7,251 | |||||
| Acquisition-related customer relationships | 2,052 | (265 | ) | 1,787 | ||||||||
| Acquisition-related brands | 143 | (24 | ) | 119 | ||||||||
| Licensed technology and patents | 3,237 | (1,504 | ) | 1,733 | ||||||||
| Identified intangible assets subject to amortization | 14,369 | (3,479 | ) | 10,890 | ||||||||
| In-process research and development | 2,168 | — | 2,168 | |||||||||
| Identified intangible assets not subject to amortization | 2,168 | — | 2,168 | |||||||||
| Total identified intangible assets | $ | 16,537 | $ | (3,479 | ) | $ | 13,058 | |||||
| December 31, 2016 | ||||||||||||
| (In Millions) | Gross Assets | Accumulated Amortization | Net | |||||||||
| Acquisition-related developed technology | $ | 7,405 | $ | (1,836 | ) | $ | 5,569 | |||||
| Acquisition-related customer relationships | 1,449 | (260 | ) | 1,189 | ||||||||
| Acquisition-related brands | 87 | (21 | ) | 66 | ||||||||
| Licensed technology and patents | 3,285 | (1,423 | ) | 1,862 | ||||||||
| Identified intangible assets subject to amortization | 12,226 | (3,540 | ) | 8,686 | ||||||||
| In-process research and development | 808 | — | 808 | |||||||||
| Identified intangible assets not subject to amortization | 808 | — | 808 | |||||||||
| Total identified intangible assets | $ | 13,034 | $ | (3,540 | ) | $ | 9,494 | |||||
| Three Months Ended | Nine Months Ended | |||||||||||||||||
| (In Millions) | Location | Sep 30, 2017 | Oct 1, 2016 | Sep 30, 2017 | Oct 1, 2016 | |||||||||||||
| Acquisition-related developed technology | Cost of sales | $ | 243 | $ | 235 | $ | 650 | $ | 705 | |||||||||
| Acquisition-related customer relationships | Amortization of acquisition-related intangibles | 45 | 69 | 113 | 234 | |||||||||||||
| Acquisition-related brands | Amortization of acquisition-related intangibles | 4 | 5 | 11 | 19 | |||||||||||||
| Licensed technology and patents | Cost of sales | 73 | 76 | 225 | 218 | |||||||||||||
| Total amortization expense | $ | 365 | $ | 385 | $ | 999 | $ | 1,176 | ||||||||||
| (In Millions) | Remainder of 2017 | 2018 | 2019 | 2020 | 2021 | |||||||||||||||
| Acquisition-related developed technology | $ | 262 | $ | 1,045 | $ | 1,043 | $ | 1,011 | $ | 976 | ||||||||||
| Acquisition-related customer relationships | 48 | 181 | 180 | 179 | 179 | |||||||||||||||
| Acquisition-related brands | 5 | 20 | 20 | 20 | 20 | |||||||||||||||
| Licensed technology and patents | 61 | 239 | 227 | 202 | 187 | |||||||||||||||
| Total future amortization expenses | $ | 376 | $ | 1,485 | $ | 1,470 | $ | 1,412 | $ | 1,362 | ||||||||||
| (In Millions) | Sep 30, 2017 | Dec 31, 2016 | ||||||
| Equity method investments | $ | 1,406 | $ | 1,328 | ||||
| Non-marketable cost method investments | 2,719 | 3,098 | ||||||
| Non-current deferred tax assets | 789 | 907 | ||||||
| Pre-payments for property, plant and equipment | 468 | 347 | ||||||
| Loans receivable | 543 | 236 | ||||||
| Reverse repurchase agreements | — | 250 | ||||||
| Other | 1,187 | 993 | ||||||
| Total other long-term assets | $ | 7,112 | $ | 7,159 | ||||
| (In Millions) | Sep 30, 2017 | Dec 31, 2016 | ||||||
| Drafts payable | $ | 21 | $ | 25 | ||||
| Current portion of long-term debt | 4,129 | 4,618 | ||||||
| Less: debt issuance costs associated with the current portion of long-term debt | (8 | ) | (9 | ) | ||||
| Total short-term debt | $ | 4,142 | $ | 4,634 | ||||
We have an ongoing authorization from our Board of Directors to borrow up to $10.0 billion under our commercial paper program. This amount includes an increase
| FINANCIAL STATEMENTS | Notes to Financial Statements | 16 |
| Mar 28, 2020 | Dec 28, 2019 | ||||||||||
| (In Millions) | Effective Interest Rate | Amount | Amount | ||||||||
| Floating-rate senior notes: | |||||||||||
| Three-month LIBOR plus 0.08%, due May 2020 | 1.93 | % | $ | 700 | $ | 700 | |||||
| Three-month LIBOR plus 0.35%, due May 2022 | 2.19 | % | 800 | 800 | |||||||
| Fixed-rate senior notes: | |||||||||||
| 1.85%, due May 2020 | 1.88 | % | 1,000 | 1,000 | |||||||
| 2.45%, due July 2020 | 2.47 | % | 1,750 | 1,750 | |||||||
| 1.70%, due May 2021 | 1.77 | % | 500 | 500 | |||||||
| 3.30%, due October 2021 | 2.96 | % | 2,000 | 2,000 | |||||||
| 2.35%, due May 2022 | 1.95 | % | 750 | 750 | |||||||
| 3.10%, due July 2022 | 2.68 | % | 1,000 | 1,000 | |||||||
| 4.00%, due December 2022¹ | 3.61 | % | 325 | 382 | |||||||
| 2.70%, due December 2022 | 2.27 | % | 1,500 | 1,500 | |||||||
| 4.10%, due November 2023 | 3.20 | % | 400 | 400 | |||||||
| 2.88%, due May 2024 | 2.30 | % | 1,250 | 1,250 | |||||||
| 2.70%, due June 2024 | 2.12 | % | 600 | 600 | |||||||
| 3.40%, due March 2025 | 3.46 | % | 1,500 | — | |||||||
| 3.70%, due July 2025 | 3.81 | % | 2,250 | 2,250 | |||||||
| 2.60%, due May 2026 | 2.28 | % | 1,000 | 1,000 | |||||||
| 3.75%, due March 2027 | 3.80 | % | 1,000 | — | |||||||
| 3.15%, due May 2027 | 2.84 | % | 1,000 | 1,000 | |||||||
| 2.45%, due November 2029 | 2.45 | % | 2,000 | 1,250 | |||||||
| 3.90%, due March 2030 | 3.94 | % | 1,500 | — | |||||||
| 4.00%, due December 2032 | 2.82 | % | 750 | 750 | |||||||
| 4.60%, due March 2040 | 4.63 | % | 750 | — | |||||||
| 4.80%, due October 2041 | 3.75 | % | 802 | 802 | |||||||
| 4.25%, due December 2042 | 3.00 | % | 567 | 567 | |||||||
| 4.90%, due July 2045 | 3.78 | % | 772 | 772 | |||||||
| 4.10%, due May 2046 | 3.04 | % | 1,250 | 1,250 | |||||||
| 4.10%, due May 2047 | 3.00 | % | 1,000 | 1,000 | |||||||
| 4.10%, due August 2047 | 2.58 | % | 640 | 640 | |||||||
| 3.73%, due December 2047 | 3.30 | % | 1,967 | 1,967 | |||||||
| 3.25%, due November 2049 | 3.22 | % | 2,000 | 1,500 | |||||||
| 4.75%, due March 2050 | 4.77 | % | 2,250 | — | |||||||
| 3.10%, due February 2060 | 3.12 | % | 1,000 | — | |||||||
| 4.95%, due March 2060 | 5.02 | % | 1,000 | — | |||||||
| Oregon and Arizona bonds: | |||||||||||
| 2.40%-2.70%, due December 2035 - 2040 | 2.49 | % | 423 | 423 | |||||||
| 5.00%, due March 2049 | 2.11 | % | 138 | 138 | |||||||
| 5.00%, due June 2049 | 2.13 | % | 438 | 438 | |||||||
| Junior Subordinated Convertible Debentures: | |||||||||||
| 3.25%, due August 2039 | — | — | 372 | ||||||||
| Total Senior Notes and Other Borrowings | 38,572 | 28,751 | |||||||||
| Unamortized Premium/Discount and Issuance Costs | (379 | ) | (529 | ) | |||||||
| Hedge Accounting Fair Value Adjustments | 1,726 | 781 | |||||||||
| Long-term debt | 39,919 | 29,003 | |||||||||
| Current portion of long-term debt | (3,464 | ) | (3,695 | ) | |||||||
| Total long-term debt | $ | 36,455 | $ | 25,308 | |||||||
| (In Millions) | Sep 30, 2017 | Dec 31, 2016 | ||||||
| Floating-rate senior notes: | ||||||||
| $700, three-month LIBOR plus 0.08%, due May 2020 | $ | 700 | $ | — | ||||
| $800, three-month LIBOR plus 0.35%, due May 2022 | 800 | — | ||||||
| Fixed-rate senior notes: | ||||||||
| $500, 1.75%, due May 2017 | — | 501 | ||||||
| $3,000, 1.35%, due December 2017 | 3,000 | 2,999 | ||||||
| $600, 2.50%, due November 2018 | 602 | 604 | ||||||
A$250, 3.25%, due December 20191 | 196 | 180 | ||||||
| $1,000, 1.85%, due May 2020 | 1,000 | — | ||||||
| $1,750, 2.45%, due July 2020 | 1,749 | 1,749 | ||||||
| $500, 1.70%, due May 2021 | 499 | 499 | ||||||
| $2,000, 3.30%, due October 2021 | 1,995 | 1,988 | ||||||
| $750, 2.35%, due May 2022 | 747 | — | ||||||
| $1,000, 3.10%, due July 2022 | 994 | 987 | ||||||
A$550, 4.00%, due December 20221 | 431 | 394 | ||||||
| $1,500, 2.70%, due December 2022 | 1,491 | 1,480 | ||||||
| $400, 4.10%, due November 2023 | 421 | 424 | ||||||
| $1,250, 2.88%, due May 2024 | 1,242 | — | ||||||
| $600, 2.70%, due June 2024 | 596 | — | ||||||
| $2,250, 3.70%, due July 2025 | 2,177 | 2,148 | ||||||
| $1,000, 2.60%, due May 2026 | 993 | 983 | ||||||
| $1,000, 3.15%, due May 2027 | 991 | — | ||||||
| $750, 4.00%, due December 2032 | 745 | 745 | ||||||
| $1,500, 4.80%, due October 2041 | 1,491 | 1,491 | ||||||
| $925, 4.25%, due December 2042 | 924 | 924 | ||||||
| $2,000, 4.90%, due July 2045 | 1,999 | 1,999 | ||||||
| $1,007, 4.90%, due August 2045 | — | 995 | ||||||
| $915, 4.70%, due December 2045 | 910 | 894 | ||||||
| $1,250, 4.10%, due May 2046 | 1,243 | 1,243 | ||||||
| $1,000, 4.10%, due May 2047 | 994 | — | ||||||
| $640, 4.10%, due August 2047 | 638 | — | ||||||
| Junior subordinated convertible debentures: | ||||||||
| $1,600, 2.95%, due December 2035 | 1,004 | 992 | ||||||
| $2,000, 3.25%, due August 2039 | 1,130 | 1,118 | ||||||
| Long-term debt | 31,702 | 25,337 | ||||||
| Less: current portion of long-term debt | (4,129 | ) | (4,618 | ) | ||||
| Less: debt issuance costs | (75 | ) | (70 | ) | ||||
| Total long-term debt | $ | 27,498 | $ | 20,649 | ||||
1 | To manage foreign currency risk associated with the Australian-dollar-denominated notes issued in 2015, we entered into currency interest rate swaps with an aggregate notional amount of |
| FINANCIAL STATEMENTS | Notes to Financial Statements | 17 |
In November 2019, we issued a notice of redemption for the remaining $372 million of 2009 Debentures with a redemption date of January 9, 2020. During the secondfourth quarter of 2017,2019, the closing stock price conversion right condition of the 2009 Debentures continued to be met and therefore the debentures were convertible at the option of the holders until January 6, 2020. All 2009 Debentures were either converted prior to January 6, 2020 or redeemed on the redemption date.
In the first three months of 2020, we issued a total of $7.1$10.3 billion aggregate principal amount of senior notes. We intend to use the net proceeds from the offering of the notes for general corporate purposes, which may include refinancing of outstanding debt, or repurchases offunding for working capital and capital expenditures, and repurchasing shares of our common stock.
Our senior floating rate notes pay interest quarterly and our senior fixed rate notes pay interest semiannually. We may redeem the fixed rate notes prior to their maturity at our option at specified redemption prices and subject to certain restrictions. The obligations under the notes rank equally in right of payment with all of our other existing and future senior unsecured indebtedness and effectively rank junior to all liabilities of our subsidiaries.
| FINANCIAL STATEMENTS | Notes to Financial Statements | 18 |
ContentsINTEL CORPORATIONNOTES TO CONSOLIDATED CONDENSED FINANCIAL STATEMENTS — Unaudited (Continued)
Note 14: Fair ValueFor information about our fair value policies, and methods and assumptions used in estimating the fair value of our financial assets and liabilities, see “Note 2: Accounting Policies" and "Note 15: Fair Value" in Part II, Item 8 of our 2016 Form 10-K.Assets and Liabilities Measured and Recorded at Fair Value on a Recurring Basis
INTEL CORPORATIONNOTES TO CONSOLIDATED CONDENSED FINANCIAL STATEMENTS — Unaudited (Continued)
In the second quarter
| NOTE 9 : | FAIR VALUE |
| September 30, 2017 | December 31, 2016 | |||||||||||||||||||||||||||||||
| Fair Value Measured and Recorded at Reporting Date Using | Fair Value Measured and Recorded at Reporting Date Using | |||||||||||||||||||||||||||||||
| (In Millions) | Level 1 | Level 2 | Level 3 | Total | Level 1 | Level 2 | Level 3 | Total | ||||||||||||||||||||||||
| Assets | ||||||||||||||||||||||||||||||||
| Cash equivalents: | ||||||||||||||||||||||||||||||||
| Corporate debt | $ | — | $ | 150 | $ | — | $ | 150 | $ | — | $ | 498 | $ | — | $ | 498 | ||||||||||||||||
Financial institution instruments 1 | 4,146 | 1,619 | — | 5,765 | 1,920 | 811 | — | 2,731 | ||||||||||||||||||||||||
Government debt 2 | — | 100 | — | 100 | — | 332 | — | 332 | ||||||||||||||||||||||||
| Reverse repurchase agreements | — | 1,599 | — | 1,599 | — | 768 | — | 768 | ||||||||||||||||||||||||
| Short-term investments: | ||||||||||||||||||||||||||||||||
| Corporate debt | — | 750 | 6 | 756 | — | 1,332 | 6 | 1,338 | ||||||||||||||||||||||||
Financial institution instruments 1 | — | 557 | — | 557 | — | 1,603 | — | 1,603 | ||||||||||||||||||||||||
Government debt 2 | — | 133 | — | 133 | — | 284 | — | 284 | ||||||||||||||||||||||||
| Trading assets: | ||||||||||||||||||||||||||||||||
| Asset-backed securities | — | 12 | — | 12 | — | 87 | — | 87 | ||||||||||||||||||||||||
| Corporate debt | — | 2,269 | — | 2,269 | — | 2,847 | — | 2,847 | ||||||||||||||||||||||||
Financial institution instruments 1 | 57 | 990 | — | 1,047 | 36 | 1,608 | — | 1,644 | ||||||||||||||||||||||||
Government debt 2 | 31 | 3,624 | — | 3,655 | 32 | 3,704 | — | 3,736 | ||||||||||||||||||||||||
| Other current assets: | ||||||||||||||||||||||||||||||||
| Derivative assets | 2 | 289 | — | 291 | — | 382 | — | 382 | ||||||||||||||||||||||||
| Loans receivable | — | 88 | — | 88 | — | 326 | — | 326 | ||||||||||||||||||||||||
| Marketable equity securities | 5,584 | 475 | — | 6,059 | 6,180 | — | — | 6,180 | ||||||||||||||||||||||||
| Other long-term investments: | ||||||||||||||||||||||||||||||||
| Corporate debt | — | 1,697 | 5 | 1,702 | — | 1,995 | 6 | 2,001 | ||||||||||||||||||||||||
Financial institution instruments 1 | — | 1,389 | — | 1,389 | — | 1,758 | — | 1,758 | ||||||||||||||||||||||||
Government debt 2 | — | 753 | — | 753 | — | 957 | — | 957 | ||||||||||||||||||||||||
| Other long-term assets: | ||||||||||||||||||||||||||||||||
| Derivative assets | — | 74 | 9 | 83 | — | 31 | 9 | 40 | ||||||||||||||||||||||||
| Loans receivable | — | 543 | — | 543 | — | 236 | — | 236 | ||||||||||||||||||||||||
| Total assets measured and recorded at fair value | 9,820 | 17,111 | 20 | 26,951 | 8,168 | 19,559 | 21 | 27,748 | ||||||||||||||||||||||||
| Liabilities | ||||||||||||||||||||||||||||||||
| Other accrued liabilities: | ||||||||||||||||||||||||||||||||
| Derivative liabilities | — | 449 | — | 449 | — | 371 | — | 371 | ||||||||||||||||||||||||
| Other long-term liabilities: | ||||||||||||||||||||||||||||||||
| Derivative liabilities | — | 166 | 7 | 173 | — | 179 | 33 | 212 | ||||||||||||||||||||||||
| Total liabilities measured and recorded at fair value | $ | — | $ | 615 | $ | 7 | $ | 622 | $ | — | $ | 550 | $ | 33 | $ | 583 | ||||||||||||||||
| March 28, 2020 | December 28, 2019 | |||||||||||||||||||||||||||||||
Fair Value Measured and Recorded at Reporting Date Using | Fair Value Measured and Recorded at Reporting Date Using | |||||||||||||||||||||||||||||||
| (In Millions) | Level 1 | Level 2 | Level 3 | Total | Level 1 | Level 2 | Level 3 | Total | ||||||||||||||||||||||||
| Assets | ||||||||||||||||||||||||||||||||
| Cash equivalents: | ||||||||||||||||||||||||||||||||
| Corporate debt | $ | — | $ | 1,348 | $ | — | $ | 1,348 | $ | — | $ | 713 | $ | — | $ | 713 | ||||||||||||||||
| Financial institution instruments¹ | 7,557 | 600 | — | 8,157 | 1,064 | 408 | — | 1,472 | ||||||||||||||||||||||||
| Government debt² | — | 199 | — | 199 | — | — | — | — | ||||||||||||||||||||||||
| Reverse repurchase agreements | — | 1,150 | — | 1,150 | — | 1,500 | — | 1,500 | ||||||||||||||||||||||||
| Short-term investments: | ||||||||||||||||||||||||||||||||
| Corporate debt | — | 493 | — | 493 | — | 347 | — | 347 | ||||||||||||||||||||||||
| Financial institution instruments¹ | — | 803 | — | 803 | — | 724 | — | 724 | ||||||||||||||||||||||||
| Government debt² | — | — | — | — | — | 11 | — | 11 | ||||||||||||||||||||||||
| Trading assets: | ||||||||||||||||||||||||||||||||
| Corporate debt | — | 2,850 | — | 2,850 | — | 2,848 | — | 2,848 | ||||||||||||||||||||||||
| Financial institution instruments¹ | 78 | 2,020 | — | 2,098 | 87 | 1,578 | — | 1,665 | ||||||||||||||||||||||||
| Government debt² | — | 3,179 | — | 3,179 | — | 3,334 | — | 3,334 | ||||||||||||||||||||||||
| Other current assets: | ||||||||||||||||||||||||||||||||
| Derivative assets | 5 | 372 | — | 377 | 50 | 230 | — | 280 | ||||||||||||||||||||||||
| Loans receivable³ | — | 339 | — | 339 | — | — | — | — | ||||||||||||||||||||||||
| Marketable equity securities | 330 | — | — | 330 | 450 | — | — | 450 | ||||||||||||||||||||||||
| Other long-term investments: | ||||||||||||||||||||||||||||||||
| Corporate debt | — | 1,852 | — | 1,852 | — | 1,898 | — | 1,898 | ||||||||||||||||||||||||
| Financial institution instruments¹ | — | 532 | — | 532 | — | 825 | — | 825 | ||||||||||||||||||||||||
| Government debt² | — | 559 | — | 559 | — | 553 | — | 553 | ||||||||||||||||||||||||
| Other long-term assets: | ||||||||||||||||||||||||||||||||
| Derivative assets | — | 1,604 | 35 | 1,639 | — | 690 | 16 | 706 | ||||||||||||||||||||||||
| Loans receivable³ | — | 203 | — | 203 | — | 554 | — | 554 | ||||||||||||||||||||||||
| Total assets measured and recorded at fair value | $ | 7,970 | $ | 18,103 | $ | 35 | $ | 26,108 | $ | 1,651 | $ | 16,213 | $ | 16 | $ | 17,880 | ||||||||||||||||
| Liabilities | ||||||||||||||||||||||||||||||||
| Other accrued liabilities: | ||||||||||||||||||||||||||||||||
| Derivative liabilities | $ | 190 | $ | 614 | $ | — | $ | 804 | $ | 3 | $ | 287 | $ | — | $ | 290 | ||||||||||||||||
| Other long-term liabilities: | ||||||||||||||||||||||||||||||||
| Derivative liabilities | — | 106 | — | 106 | — | 13 | — | 13 | ||||||||||||||||||||||||
| Total liabilities measured and recorded at fair value | $ | 190 | $ | 720 | $ | — | $ | 910 | $ | 3 | $ | 300 | $ | — | $ | 303 | ||||||||||||||||
1 | Level 1 investments consist of money market funds. Level 2 investments consist primarily of commercial paper, certificates of deposit, time deposits, and notes and bonds issued by financial institutions. |
2 |
3 | The fair value of our loans receivable for which we elected the fair value option did not significantly differ from the contractual principal balance based on the contractual currency. |
| FINANCIAL STATEMENTS | Notes to Financial Statements | 19 |
Our non-marketable equity investments, marketablesecurities, equity method investments, and certain non-financial assets, such as intangible assets and property, plant and equipment, are recorded at fair value only if an impairment or observable price adjustment is recognized.
FINANCIAL INSTRUMENTS NOT RECORDED AT FAIR VALUE ON A RECURRING BASIS
Financial Instruments Not Recorded at Fair Value on a Recurring Basis
As of each period wereMarch 28, 2020, the aggregate carrying value of grants receivable, loans receivable, and reverse repurchase agreements was $534 million ($543 million as follows:
| September 30, 2017 | ||||||||||||||||||||
| (In Millions) | Carrying Amount | Fair Value Measured Using | Fair Value | |||||||||||||||||
| Level 1 | Level 2 | Level 3 | ||||||||||||||||||
| Grants receivable | $ | 646 | $ | — | $ | 646 | $ | — | $ | 646 | ||||||||||
| Loans receivable | $ | 15 | $ | — | $ | 15 | $ | — | $ | 15 | ||||||||||
| Non-marketable cost method investments | $ | 2,719 | $ | — | $ | — | $ | 3,336 | $ | 3,336 | ||||||||||
| Reverse repurchase agreements | $ | 250 | $ | — | $ | 250 | $ | — | $ | 250 | ||||||||||
| Short-term debt | $ | 4,121 | $ | — | $ | 4,703 | $ | — | $ | 4,703 | ||||||||||
| Long-term debt | $ | 27,498 | $ | — | $ | 29,485 | $ | — | $ | 29,485 | ||||||||||
| December 31, 2016 | ||||||||||||||||||||
| (In Millions) | Carrying Amount | Fair Value Measured Using | Fair Value | |||||||||||||||||
| Level 1 | Level 2 | Level 3 | ||||||||||||||||||
| Grants receivable | $ | 361 | $ | — | $ | 362 | $ | — | $ | 362 | ||||||||||
| Loans receivable | $ | 265 | $ | — | $ | 265 | $ | — | $ | 265 | ||||||||||
| Non-marketable cost method investments | $ | 3,098 | $ | — | $ | — | $ | 3,890 | $ | 3,890 | ||||||||||
| Reverse repurchase agreements | $ | 250 | $ | — | $ | 250 | $ | — | $ | 250 | ||||||||||
| Short-term debt | $ | 4,609 | $ | — | $ | 5,120 | $ | — | $ | 5,120 | ||||||||||
| Long-term debt | $ | 20,649 | $ | — | $ | 21,957 | $ | — | $ | 21,957 | ||||||||||
of December 28, 2019). The carrying amount andestimated fair value of short-term debt exclude drafts payable.
As of March 28, 2020, the fair value of our issued debt was$41.3 billion($30.6 billion as of December 28, 2019). These liabilities are classified as Level 2 within the fair value hierarchy based on the nature of the fair value inputs.
| NOTE 10 : | OTHER COMPREHENSIVE INCOME (LOSS) |
The changes in accumulated other comprehensive income (loss) by component and related tax effects in the first ninethree months of 20172020 were as follows:
| (In Millions) | Unrealized Holding Gains (Losses) on Derivatives | Actuarial Valuation and Other Pension Expenses | Translation Adjustments and Other | Total | ||||||||||||
| Balance as of December 29, 2019 | $ | 54 | $ | (1,382 | ) | $ | 48 | $ | (1,280 | ) | ||||||
| Other comprehensive income (loss) before reclassifications | (373 | ) | 3 | (6 | ) | (376 | ) | |||||||||
| Amounts reclassified out of accumulated other comprehensive income (loss) | 68 | 14 | — | 82 | ||||||||||||
| Tax effects | 37 | (5 | ) | 1 | 33 | |||||||||||
| Other comprehensive income (loss) | (268 | ) | 12 | (5 | ) | (261 | ) | |||||||||
| Balance as of March 28, 2020 | $ | (214 | ) | $ | (1,370 | ) | $ | 43 | $ | (1,541 | ) | |||||
| (In Millions) | Unrealized Holding Gains (Losses) on Available-for-Sale Investments | Unrealized Holding Gains (Losses) on Derivatives | Prior Service Credits (Costs) | Actuarial Gains (Losses) | Foreign Currency Translation Adjustment | Total | ||||||||||||||||||
| December 31, 2016 | $ | 2,164 | $ | (259 | ) | $ | (40 | ) | $ | (1,240 | ) | $ | (519 | ) | $ | 106 | ||||||||
Other comprehensive income (loss) before reclassifications1 | 2,589 | 528 | — | 213 | 6 | 3,336 | ||||||||||||||||||
| Amounts reclassified out of accumulated other comprehensive income | (1,962 | ) | (28 | ) | (9 | ) | 55 | 507 | (1,437 | ) | ||||||||||||||
| Tax effects | (219 | ) | (150 | ) | 1 | (27 | ) | — | (395 | ) | ||||||||||||||
| Other comprehensive income (loss) | 408 | 350 | (8 | ) | 241 | 513 | 1,504 | |||||||||||||||||
| September 30, 2017 | $ | 2,572 | $ | 91 | $ | (48 | ) | $ | (999 | ) | $ | (6 | ) | $ | 1,610 | |||||||||
| Income Before Taxes Impact (In Millions) | ||||||||||||||||||
| Three Months Ended | Nine Months Ended | |||||||||||||||||
| Comprehensive Income Components | Sep 30, 2017 | Oct 1, 2016 | Sep 30, 2017 | Oct 1, 2016 | Location | |||||||||||||
Unrealized holding gains (losses)1 on available-for-sale investments: | ||||||||||||||||||
| $ | 916 | $ | 42 | $ | 1,962 | $ | 530 | Gains (losses) on equity investments, net | ||||||||||
| 916 | 42 | 1,962 | 530 | |||||||||||||||
| Unrealized holding gains (losses) on derivatives: | ||||||||||||||||||
| Foreign currency contracts | (13 | ) | (11 | ) | (60 | ) | (70 | ) | Cost of sales | |||||||||
| 24 | (2 | ) | 10 | (5 | ) | Research and development | ||||||||||||
| 4 | 1 | (2 | ) | — | Marketing, general and administrative | |||||||||||||
| 12 | — | 28 | 11 | Gains (losses) on equity investments, net | ||||||||||||||
| 17 | 19 | 52 | 36 | Interest and other, net | ||||||||||||||
| 44 | 7 | 28 | (28 | ) | ||||||||||||||
| Amortization of pension and postretirement benefit components: | ||||||||||||||||||
| Prior service credits (costs) | (3 | ) | (2 | ) | 9 | (6 | ) | |||||||||||
| Actuarial gains (losses) | (15 | ) | (20 | ) | (55 | ) | (46 | ) | ||||||||||
| (18 | ) | (22 | ) | (46 | ) | (52 | ) | |||||||||||
| Currency translation adjustment | — | — | (507 | ) | — | Interest and other, net | ||||||||||||
| Total amounts reclassified out of accumulated other comprehensive income (loss) | $ | 942 | $ | 27 | $ | 1,437 | $ | 450 | ||||||||||
We estimate that we will reclassify approximately $94$135 million (before taxes) of net derivative gainslosses included in accumulated other comprehensive income (loss) into earnings within the next 12 months.
| FINANCIAL STATEMENTS | Notes to Financial Statements | 20 |
| NOTE 11 : | DERIVATIVE FINANCIAL INSTRUMENTS |
Total gross notional amounts for outstanding derivatives (recorded at fair value) at the end of each period were as follows:
| (In Millions) | Sep 30, 2017 | Dec 31, 2016 | Oct 1, 2016 | Mar 28, 2020 | Dec 28, 2019 | |||||||||||||||
| Foreign currency contracts | $ | 18,573 | $ | 17,960 | $ | 17,833 | $ | 27,039 | $ | 23,981 | ||||||||||
| Interest rate contracts | 18,171 | 14,228 | 10,046 | 13,859 | 14,302 | |||||||||||||||
| Other | 1,461 | 1,340 | 1,355 | 1,726 | 1,753 | |||||||||||||||
| Total | $ | 38,205 | $ | 33,528 | $ | 29,234 | $ | 42,624 | $ | 40,036 | ||||||||||
| March 28, 2020 | December 28, 2019 | |||||||||||||||
| (In Millions) | Assets1 | Liabilities2 | Assets1 | Liabilities2 | ||||||||||||
| Derivatives designated as hedging instruments: | ||||||||||||||||
Foreign currency contracts3 | $ | 10 | $ | 465 | $ | 56 | $ | 159 | ||||||||
| Interest rate contracts | 1,635 | — | 690 | 9 | ||||||||||||
| Total derivatives designated as hedging instruments | 1,645 | 465 | 746 | 168 | ||||||||||||
| Derivatives not designated as hedging instruments: | ||||||||||||||||
Foreign currency contracts3 | 362 | 135 | 179 | 78 | ||||||||||||
| Interest rate contracts | 4 | 120 | 11 | 54 | ||||||||||||
| Equity contracts | 5 | 190 | 50 | 3 | ||||||||||||
| Total derivatives not designated as hedging instruments | 371 | 445 | 240 | 135 | ||||||||||||
| Total derivatives | $ | 2,016 | $ | 910 | $ | 986 | $ | 303 | ||||||||
| September 30, 2017 | December 31, 2016 | |||||||||||||||
| (In Millions) | Assets 1 | Liabilities 2 | Assets 1 | Liabilities 2 | ||||||||||||
| Derivatives designated as hedging instruments: | ||||||||||||||||
Foreign currency contracts 3 | $ | 296 | $ | 33 | $ | 21 | $ | 252 | ||||||||
| Interest rate contracts | 8 | 125 | 3 | 187 | ||||||||||||
| Total derivatives designated as hedging instruments | 304 | 158 | 24 | 439 | ||||||||||||
| Derivatives not designated as hedging instruments: | ||||||||||||||||
Foreign currency contracts 3 | 48 | 437 | 374 | 114 | ||||||||||||
| Interest rate contracts | 11 | 27 | 15 | 30 | ||||||||||||
| Other | 11 | — | 9 | — | ||||||||||||
| Total derivatives not designated as hedging instruments | 70 | 464 | 398 | 144 | ||||||||||||
| Total derivatives | $ | 374 | $ | 622 | $ | 422 | $ | 583 | ||||||||
1 | Derivative assets are recorded as other assets, current and non-current. |
2 | Derivative liabilities are recorded as other liabilities, current and non-current. |
3 | The majority of these instruments mature within 12 months. |
| FINANCIAL STATEMENTS | Notes to Financial Statements | 21 |
AMOUNTS OFFSET IN THE CONSOLIDATED CONDENSED FINANCIAL STATEMENTS — Unaudited (Continued)
The gross amounts of our derivative instruments and reverse repurchase agreements subject to master netting arrangements with various counterparties, and cash and non-cash collateral posted under such agreements at the end of each period were as follows:
| September 30, 2017 | March 28, 2020 | |||||||||||||||||||||||||||||||||||||||||||||||
| Gross Amounts Not Offset in the Balance Sheet | Gross Amounts Not Offset in the Balance Sheet | |||||||||||||||||||||||||||||||||||||||||||||||
| (In Millions) | Gross Amounts Recognized | Gross Amounts Offset in the Balance Sheet | Net Amounts Presented in the Balance Sheet | Financial Instruments | Cash and Non-Cash Collateral Received or Pledged | Net Amount | Gross Amounts Recognized | Gross Amounts Offset in the Balance Sheet | Net Amounts Presented in the Balance Sheet | Financial Instruments | Cash and Non-Cash Collateral Received or Pledged | Net Amount | ||||||||||||||||||||||||||||||||||||
| Assets: | ||||||||||||||||||||||||||||||||||||||||||||||||
| Derivative assets subject to master netting arrangements | $ | 360 | $ | — | $ | 360 | $ | (201 | ) | $ | (159 | ) | $ | — | $ | 2,005 | $ | — | $ | 2,005 | $ | (457 | ) | $ | (1,513 | ) | $ | 35 | ||||||||||||||||||||
| Reverse repurchase agreements | 1,849 | — | 1,849 | — | (1,849 | ) | — | 1,500 | — | 1,500 | — | (1,418 | ) | 82 | ||||||||||||||||||||||||||||||||||
| Total assets | 2,209 | — | 2,209 | (201 | ) | (2,008 | ) | — | $ | 3,505 | $ | — | $ | 3,505 | $ | (457 | ) | $ | (2,931 | ) | $ | 117 | ||||||||||||||||||||||||||
| Liabilities: | ||||||||||||||||||||||||||||||||||||||||||||||||
| Derivative liabilities subject to master netting arrangements | 603 | — | 603 | (201 | ) | (377 | ) | 25 | $ | 865 | $ | — | $ | 865 | $ | (457 | ) | $ | (221 | ) | $ | 187 | ||||||||||||||||||||||||||
| Total liabilities | $ | 603 | $ | — | $ | 603 | $ | (201 | ) | $ | (377 | ) | $ | 25 | $ | 865 | $ | — | $ | 865 | $ | (457 | ) | $ | (221 | ) | $ | 187 | ||||||||||||||||||||
| December 28, 2019 | ||||||||||||||||||||||||
| Gross Amounts Not Offset in the Balance Sheet | ||||||||||||||||||||||||
| (In Millions) | Gross Amounts Recognized | Gross Amounts Offset in the Balance Sheet | Net Amounts Presented in the Balance Sheet | Financial Instruments | Cash and Non-Cash Collateral Received or Pledged | Net Amount | ||||||||||||||||||
| Assets: | ||||||||||||||||||||||||
| Derivative assets subject to master netting arrangements | $ | 974 | $ | — | $ | 974 | $ | (144 | ) | $ | (808 | ) | $ | 22 | ||||||||||
| Reverse repurchase agreements | 1,850 | — | 1,850 | — | (1,850 | ) | — | |||||||||||||||||
| Total assets | $ | 2,824 | $ | — | $ | 2,824 | $ | (144 | ) | $ | (2,658 | ) | $ | 22 | ||||||||||
| Liabilities: | ||||||||||||||||||||||||
| Derivative liabilities subject to master netting arrangements | $ | 262 | $ | — | $ | 262 | $ | (144 | ) | $ | (72 | ) | $ | 46 | ||||||||||
| Total liabilities | $ | 262 | $ | — | $ | 262 | $ | (144 | ) | $ | (72 | ) | $ | 46 | ||||||||||
| December 31, 2016 | ||||||||||||||||||||||||
| Gross Amounts Not Offset in the Balance Sheet | ||||||||||||||||||||||||
| (In Millions) | Gross Amounts Recognized | Gross Amounts Offset in the Balance Sheet | Net Amounts Presented in the Balance Sheet | Financial Instruments | Cash and Non-Cash Collateral Received or Pledged | Net Amount | ||||||||||||||||||
| Assets: | ||||||||||||||||||||||||
| Derivative assets subject to master netting arrangements | $ | 433 | $ | — | $ | 433 | $ | (368 | ) | $ | (42 | ) | $ | 23 | ||||||||||
| Reverse repurchase agreements | 1,018 | — | 1,018 | — | (1,018 | ) | — | |||||||||||||||||
| Total assets | 1,451 | — | 1,451 | (368 | ) | (1,060 | ) | 23 | ||||||||||||||||
| Liabilities: | ||||||||||||||||||||||||
| Derivative liabilities subject to master netting arrangements | 588 | — | 588 | (368 | ) | (201 | ) | 19 | ||||||||||||||||
| Total liabilities | $ | 588 | $ | — | $ | 588 | $ | (368 | ) | $ | (201 | ) | $ | 19 | ||||||||||
We obtain and secure available collateral from counterparties against obligations, including securities lending transactions and reverse repurchase agreements, when we deem it appropriate.
The before-tax net gains or losses attributed to the effective portion of cash flow hedges, recognized in other comprehensive income (loss), were $83$373 million net gainslosses in the third quarterfirst three months of 2017 and $5282020 ($29 million net gains in the first ninethree months of 2017 ($92 million net gains in the third quarter of 2016 and $374 million net gains in the first nine months of 2016)2019). Substantially all of our cash flow hedges arewere foreign currency contracts for the first nine months of 2017 and 2016.all periods presented.
During the first ninethree months of 20172020 and 2016, hedge ineffectiveness and2019, the amounts excluded from effectiveness testing were insignificant.
| FINANCIAL STATEMENTS | Notes to Financial Statements | 22 |
DERIVATIVES IN FAIR VALUE HEDGING RELATIONSHIPS
The effects of derivative instruments designated as fair value hedges, recognized in interest and other, net for each period were as follows:
| Three Months Ended | Nine Months Ended | Gains (Losses) Recognized in Consolidated Condensed Statements of Income on Derivatives | ||||||||||||||||||||||
| (In Millions) | Sep 30, 2017 | Oct 1, 2016 | Sep 30, 2017 | Oct 1, 2016 | ||||||||||||||||||||
Three Months Ended (In Millions) | Mar 28, 2020 | Mar 30, 2019 | ||||||||||||||||||||||
| Interest rate contracts | $ | (15 | ) | $ | (34 | ) | $ | 67 | $ | 188 | $ | 954 | $ | 485 | ||||||||||
| Hedged items | 15 | 34 | (67 | ) | (188 | ) | (954 | ) | (485 | ) | ||||||||||||||
| Total | $ | — | $ | — | $ | — | $ | — | $ | — | $ | — | ||||||||||||
| Line Item in the Consolidated Condensed Balance Sheet in Which the Hedged Item is Included | Carrying Amount of the Hedged Item Asset/(Liabilities) | Cumulative Amount of Fair Value Hedging Adjustment Included in the Carrying Amount Assets/(Liabilities) | ||||||||||||||
| (In Millions) | Mar 28, 2020 | Dec 28, 2019 | Mar 28, 2020 | Dec 28, 2019 | ||||||||||||
| Long-term debt | $ | (13,632 | ) | $ | (12,678 | ) | $ | (1,635 | ) | $ | (681 | ) | ||||
The total notional amount of pay variable and receive fixed interest rate swaps wasno ineffectiveness during all periods presented in the preceding table. $12.0 billion as of March 28, 2020 and as of December 28, 2019.
The effects of derivative instruments not designated as hedging instruments on the consolidated condensed statementsConsolidated Condensed Statements of incomeIncome for each period were as follows:
| Three Months Ended | ||||||||||
| (In Millions) | Location of Gains (Losses) Recognized in Income on Derivatives | Mar 28, 2020 | Mar 30, 2019 | |||||||
| Foreign currency contracts | Interest and other, net | $ | 154 | $ | 57 | |||||
| Interest rate contracts | Interest and other, net | (77 | ) | (14 | ) | |||||
| Other | Various | (268 | ) | 146 | ||||||
| Total | $ | (191 | ) | $ | 189 | |||||
| Three Months Ended | Nine Months Ended | |||||||||||||||||
| (In Millions) | Location of Gains (Losses) Recognized in Income on Derivatives | Sep 30, 2017 | Oct 1, 2016 | Sep 30, 2017 | Oct 1, 2016 | |||||||||||||
| Foreign currency contracts | Interest and other, net | $ | (91 | ) | $ | (35 | ) | $ | (521 | ) | $ | (209 | ) | |||||
| Interest rate contracts | Interest and other, net | (3 | ) | 7 | (4 | ) | (8 | ) | ||||||||||
| Other | Various | 40 | 72 | 135 | 90 | |||||||||||||
| Total | $ | (54 | ) | $ | 44 | $ | (390 | ) | $ | (127 | ) | |||||||
| NOTE 12 : | CONTINGENCIES |
Number of RSUs (In Millions) | Weighted Average Grant-Date Fair Value | ||||||
| December 31, 2016 | 106.8 | $ | 28.99 | ||||
| Granted | 41.1 | $ | 34.46 | ||||
| Assumed in acquisition | 1.1 | $ | 34.90 | ||||
| Vested | (38.3 | ) | $ | 27.33 | |||
| Forfeited | (11.1 | ) | $ | 29.97 | |||
| September 30, 2017 | 99.6 | $ | 31.84 | ||||
We are a party to various legal proceedings, including those noted in this section. Although management at present believes that the ultimate outcome of these proceedings, individually and in the aggregate, will not materially harm our financial position, results of operations, cash flows, or overall trends, legal proceedings and related government investigations are subject to inherent uncertainties, and unfavorable rulings or other events could occur. Unfavorable resolutions could include substantial monetary damages. In addition, in matters for which injunctive relief or other conduct remedies are sought, unfavorable resolutions could include an injunction or other order prohibiting us from selling one or more products at all or in particular ways, precluding particular business practices, or requiring other remedies. An unfavorable outcome may result in a material adverse impact on our business, results of operations, financial position, and overall trends. We might also conclude that settling one or more such matters is in the best interests of our stockholders, employees, and customers, and any such settlement could include substantial payments. Except as specifically described below, we have not concluded that settlement of any of the legal proceedings noted in this section is appropriate at this time.
| FINANCIAL STATEMENTS | Notes to Financial Statements | 23 |
European Commission Competition Matter
In 2001, the European Commission (EC)EC commenced an investigation regarding claims by Advanced Micro Devices, Inc. (AMD) that we used unfair business practices to persuade customers to buy our microprocessors. We received numerous requests for information and documents from the EC and we responded to each of those requests. The EC issued a Statement of Objections in July 2007 and held a hearing on that Statement in March 2008. The EC issued a Supplemental Statement of Objections in July 2008. In May 2009, the EC issued a decision finding that we had violated Article 82 of the EC Treaty and Article 54 of the European Economic Area Agreement. In general, the EC found that we violated Article 82 (later renumbered as Article 102 by a new treaty) by offering alleged "conditional rebates and payments" that required our customers to purchase all or most of their x86 microprocessors from us. The EC also found that we violated Article 82 by making alleged "payments to prevent sales of specific rival products." The EC imposed a fine in the amount of €1.1 billion ($1.4 billion as of May 2009), which we subsequently paid during the third quarter of 2009, and ordered us to "immediately bring to an end the infringement referred to in" the EC decision.
The EC decision contained no specific direction on whether or how we should modify our business practices. Instead, the decision stated that we should "cease and desist" from further conduct that, in the EC's opinion, would violate applicable law. We took steps, which are subject to the EC's ongoing review, to comply with that decision pending appeal. We had discussions with the EC to better understand the decision and to explain changes to our business practices.
We appealed the EC decision to the Court of First Instance (which has been renamed the General Court) in July 2009. The hearing of our appeal took place in July 2012. In June 2014, the General Court rejected our appeal in its entirety. In August 2014, we filed an appeal with the European Court of Justice. In November 2014, Intervener Association for Competitive Technologies filed comments in support of Intel’s grounds of appeal. The EC and interveners filed briefs in November 2014, we filed a reply in February 2015, and the EC filed a rejoinder in April 2015. The Court of Justice held oral argument in June 2016. In October 2016, Advocate General Wahl, an advisor to the Court of Justice, issued a non-binding advisory opinion whichthat favored Intel on a number of grounds.The Court of Justice issued its decision in September 2017, setting aside the judgment of the General Court and sending the case back to the General Court to examine whether the rebates at issue arewere capable of restricting competition. The General Court has appointed a panel of five judges to consider our appeal of the EC’s 2009 decision in light of the Court of Justice’s clarifications of the law. TheIn November 2017, the parties are expected to filefiled initial “Observations” about the Court of Justice’s decision and the appeal and were invited by the General Court to offer supplemental comments to each other’s “Observations,” which the parties submitted in November 2017.March 2018. Responses to other questions posed by the General Court were filed in May and June 2018. The General Court heard oral argument in March 2020. Pending the final decision in this matter, the fine paid by Intel has been placed by the EC in commercial bank accounts where it accrues interest.
In re High Tech Employee Antitrust LitigationJune 2017, a Google research team notified us and other companies that it had identified security vulnerabilities (now commonly referred to as “Spectre” and “Meltdown”) that affect many types of microprocessors, including our products. As is standard when findings like these are presented, we worked together with other companies in the industry to verify the research and develop and validate software and firmware updates for impacted technologies. On January 3, 2018, information on the security vulnerabilities was publicly reported, before software and firmware updates to address the vulnerabilities were made widely available. Numerous lawsuits relating to the Spectre and Meltdown security vulnerabilities, as well as another variant of these vulnerabilities (“Foreshadow”) that has since been identified, have been filed against Intel and, in certain cases, our current and former executives and directors, in U.S. federal and state courts and in certain courts in other countries.
As of April 22, 2020, consumer class action lawsuits relating to certain security vulnerabilities publicly disclosed in 2018 were pending in the U.S., Canada, and Israel. The plaintiffs, who purport to represent various classes of purchasers of our products, generally claim to have been harmed by Intel's actions and/or omissions in connection with the security vulnerabilities and assert a variety of common law and statutory claims seeking monetary damages and equitable relief. In the U.S., numerous individual class action suits filed in various jurisdictions were consolidated in April 2018 for all pretrial proceedings in the U.S. District Court for the District of Oregon. In March 2014,2020, the Police Retirement System of St. Louis (PRSSL) filed a shareholder derivativecourt granted Intel's motion to dismiss the complaint in that consolidated action, but granted plaintiffs leave to file an amended complaint. In Canada, in one case pending in the Superior Court of CaliforniaJustice of Ontario, an initial status conference has not yet been scheduled. In a second case pending in Santa Clara Countythe Superior Court of Justice of Quebec, the court has stayed the case until April 2020. In Israel, both consumer class action lawsuits were filed in the District Court of Haifa. In the first case, the District Court denied the parties' joint motion to stay filed in January 2019, but to date has deferred Intel's deadline to respond to the complaint in view of Intel's pending motion to dismiss in the consolidated proceeding in the U.S. Intel filed a motion to stay the second case pending resolution of the consolidated proceeding in the U.S., and a hearing on that motion has been scheduled for May 2020. Additional lawsuits and claims may be asserted seeking monetary damages or other related relief. We dispute the pending claims described above and intend to defend those lawsuits vigorously. Given the procedural posture and the nature of those cases, including that the pending proceedings are in the early stages, that alleged damages have not been specified, that uncertainty exists as to the likelihood of a class or classes being certified or the ultimate size of any class or classes if certified, and that there are significant factual and legal issues to be resolved, we are unable to make a reasonable estimate of the potential loss or range of losses, if any, that might arise from those matters.
| FINANCIAL STATEMENTS | Notes to Financial Statements | 24 |
In addition to these lawsuits, Intel stockholders filed multiple shareholder derivative lawsuits since January 2018 against Intel, certain current and former members of our Board of Directors and certain current and former officers. The complaint allegesofficers, alleging that the defendants breached their duties to Intel in connection with the company by participatingdisclosure of the security vulnerabilities and the failure to take action in or allowing, purported antitrust violations, whichrelation to alleged insider trading. The complaints sought to recover damages from the defendants on behalf of Intel. Some of the derivative actions were alleged in a now-settled antitrust class action lawsuit captioned In re High Tech Employee Antitrust Litigation claiming thatIntel, Adobe Systems Incorporated, Apple Inc., Google Inc., Intuit Inc., Lucasfilm Ltd., and Pixar conspired to suppress their employees’ compensation. In March 2014, a second plaintiff, Barbara Templeton, filed a substantially similar derivative suit in the same court. In May 2014, a third shareholder, Robert Achermann,U.S. District Court for the Northern District of California and were consolidated, and the others were filed a substantially similar derivative action in the same court.Superior Court of the State of California in San Mateo County and were consolidated. The court consolidated the three actions into one, which is captioned In re Intel Corporation Shareholder Derivative Litigation. Plaintiffs filed a consolidated complaint in July 2014. In August 2015, thefederal court granted ourdefendants' motion to dismiss the consolidated complaint.complaint in the federal action in August 2018 on the ground that plaintiffs failed to plead facts sufficient to show they were excused from making a pre-lawsuit demand on the Board. The federal court granted plaintiffs thereafterleave to amend their complaint, but subsequently dismissed the cases without prejudice in January 2019 at plaintiffs' request. In August 2018, the California Superior Court granted defendants' motion to dismiss the consolidated complaint in the state court action on the ground that plaintiffs failed to plead facts sufficient to show they were excused from making a pre-lawsuit demand on the Board, but granted plaintiffs leave to amend. The court subsequently granted defendants' motion to dismiss plaintiffs' first, second, and third amended complaints, on the same ground, and in March 2020 granted defendants' motion to dismiss plaintiffs' third amended complaint without granting plaintiffs leave to amend. Plaintiffs filed a motion for reconsideration of the court's final order of dismissal, which is scheduled for hearing in June 2020.
Institute of Microelectronics, Chinese Academy of Sciences v. Intel China, Ltd., et al.
In February 2018, the Institute of Microelectronics of the Chinese Academy of Sciences (IMECAS) sued Intel China, Ltd., Dell China, Ltd. (Dell) and Beijing JingDong Century Information Technology, Ltd. (JD) for patent infringement in the Beijing High Court. IMECAS alleges that Intel’s Core series processors infringe Chinese patent CN 102956457 (’457 Patent). The complaint demands an injunction and damages of at least RMB 200,000,000 plus the cost of litigation. A trial date is not yet set. In March 2018, Dell tendered indemnity to Intel, which Intel granted in April 2018. JD also tendered indemnity to Intel, which Intel granted in October 2018. In March 2018, Intel filed an invalidation request on the ‘457 patent with the Chinese Patent Reexamination Board (PRB). The PRB held an oral hearing in September 2018 and in February 2019 upheld the validity of the challenged claims. In January 2020, Intel filed a second invalidation request on the ‘457 patent with the PRB. In September 2018 and March 2019, Intel filed petitions with the United States Patent & Trademark Office (USPTO) requesting institution of inter partes review (IPR) of U.S. Patent No. 9,070,719, the U.S. counterpart to the ‘457 patent. The USPTO denied institution of Intel’s petitions in March and October 2019, respectively. In April 2019, Intel filed a request for rehearing and a motionpetition for new trial, bothPrecedential Opinion Panel (POP) in the USPTO to challenge the denial of which the court deniedits first IPR petition, and in October 2015. In November 2015, plaintiffs PRSSL and Templeton appealed the court's decision. The appeal is fully briefed, and we are waiting on a hearing date from the appellate court.
In October 2019, IMECAS filed second and third lawsuits, in the ChanceryBeijing IP Court, in Delaware against Intel, certain current and former membersalleging infringement of our Board of Directors, and former officers. The lawsuit makes allegations substantially similar to those in the California shareholder derivative litigation described above, but additionally alleges breach of the duty of disclosure with respect to In re High Tech Employee Antitrust Litigation and that Intel's 2013 and 2014 proxy statements misrepresented the effectiveness of the Board’s oversight of compliance issues at Intel and the Board’s compliance with Intel’s Code of Conduct and Board of Director Guidelines on Significant Corporate Governance Issues. In October 2015, the court stayed the IBEW lawsuit for six months pending further developments in the California case. In March 2016, Intel and IBEW entered into a stipulated dismissal pursuant to which IBEW dismissed its complaint but may re-file upon the withdrawal or final resolution of the appeal in the PRSSL California shareholder derivative litigation.
| FINANCIAL STATEMENTS | 25 | |
| KEY TERMS |
We use terms throughout our document that are specific to Intel or that are abbreviations that may not be commonly known or used. Below is a list of these terms used in our document.
| TERM | DEFINITION | |
| 2009 Debentures | 3.25% junior subordinated convertible debentures due 2039 | |
| 5G | The next-generation mobile network, which is expected to bring dramatic improvements in network speeds and latency, and which we view as a transformative technology and opportunity for many industries | |
| ADAS | Advanced driver-assistance systems | |
| Adjacent products | All of our non-platform products for CCG, DCG, and IOTG, such as modem, Ethernet and silicon photonics, as well as Mobileye, Non-Volatile Memory Solutions Group (NSG), and Programmable Solutions Group (PSG) products. Combined with our platform products, adjacent products form comprehensive platform solutions to meet customer needs | |
| ASIC | Application-specific integrated circuit | |
| ASP | Average Selling Price | |
| CODM | Chief operating decision maker | |
| COVID-19 | The infectious disease caused by the most recently discovered coronavirus (aka coronavirus 2 or SARS-CoV-2), which was declared a global pandemic by the World Health Organization | |
| CPU | Processor or central processing unit | |
| Data-centric businesses | Includes our Data Center Group (DCG), Internet of Things Group (IOTG), Mobileye, Non-Volatile Memory Solutions Group (NSG), Programmable Solutions Group (PSG), and all other businesses | |
| EC | European Commission | |
| Edge | Allocated resources that move, store, and process data closer to the source or point of service delivery | |
| Form 10-K | Annual Report on Form 10-K | |
| Form 10-Q | Quarterly Report on Form 10-Q | |
| FPGA | Field-programmable gate array | |
| IMFT | IM Flash Technologies, LLC | |
| Internet of Things | Refers to the Internet of Things market in which we sell our IOTG and Mobileye products | |
| IP | Intellectual property | |
| McAfee | Business, post divestiture of Intel Security Group in Q2 2017, which we retained an interest in as part of our investment strategy | |
| MD&A | Management's Discussion & Analysis | |
| MG&A | Marketing, general and administrative | |
| NAND | NAND flash memory | |
| nm | Nanometer | |
| OEM | Original equipment manufacturer | |
| PC-centric business | Our Client Computing Group (CCG) business, including both platform and adjacent products | |
| Platform products | A microprocessor (CPU) and chipset, a stand-alone SoC, or a multichip package, based on Intel® architecture. Platform products are primarily used in solutions sold through the CCG, DCG, and IOTG segments | |
| PRQ | Product Release Qualification, which is the milestone when costs to manufacture a product are included in inventory valuation | |
| QLC | Quad-level cell | |
| R&D | Research and development | |
| RSU | Restricted stock unit | |
| SEC | U.S. Securities and Exchange Commission | |
| SoC | System-on-Chip | |
| SSD | Solid-state drive | |
| TAM | Total addressable market | |
| TLC | Triple-level cell | |
| U.S. GAAP | U.S. Generally Accepted Accounting Principles | |
| FINANCIAL STATEMENTS | Notes to Financial Statements | 26 |
| MANAGEMENT'S DISCUSSION AND ANALYSIS |
For additional key highlights of our results of operations, see "A Quarter in Review" and "Our Pandemic Response."
DATA CENTER GROUP
DCG develops workload-optimized platforms for compute, storage, and network functions. Market segments include cloud service providers, enterprise and government, and communications service providers. We offer customers an unmatched, broad portfolio of platforms and technologies designed to provide workload-optimized performance across compute, storage, and network. These offerings span the full spectrum from the data center core to the network edge.
| DCG REVENUE $B | DCG OPERATING INCOME $B | ||
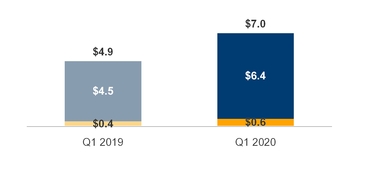
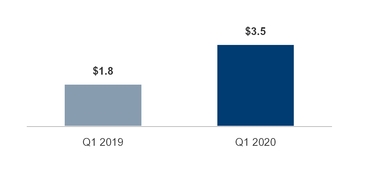
■Platform | ■Adjacent | |
| REVENUE SUMMARY |
Revenue in Q1 2020 was up 43% compared to Q1 2019 driven by increased volume and strong mix of platform products resulting in higher ASPs. In Q1 2020, revenue in the cloud service providers market segment was up 53% as cloud service providers added capacity to serve demand. The enterprise and government market segment was up 34%, and the communications service providers market segment was up 33% year over year.
We expect continued strength from cloud service providers and communications service providers in Q2 2020, and anticipate demand in the enterprise and government segment to weaken in the second half of 2020.
| Q1 2020 vs. Q1 2019 | ||||||
| (Dollars in Millions) | % | $ Impact | ||||
| Platform volume | up | 27% | $ | 1,230 | ||
| Platform ASP | up | 13% | 715 | |||
| Adjacent products | up | 35% | 146 | |||
| Total change in revenue | $ | 2,091 | ||||
| OPERATING INCOME SUMMARY |
Operating income in Q1 2020 increased 90% from Q1 2019, with an operating margin of 50%.
| (In Millions) | ||||
| $ | 3,492 | Q1 2020 DCG Operating Income | ||
| 1,785 | Higher gross margin from platform revenue | |||
| (80 | ) | Higher operating expenses | ||
| (54 | ) | Other | ||
| $ | 1,841 | Q1 2019 DCG Operating Income | ||
| MD&A | 27 | |
INTERNET OF THINGS
As more intelligence is moving to the edge, more industries are harnessing the power of data to create business value, to innovate, and to grow. We are using our architecture, accelerators, and software assets, combined with scale and partners, to develop a growing Internet of Things portfolio. Our Internet of Things portfolio is comprised of our IOTG and Mobileye businesses.
IOTG develops high-performance compute for targeted verticals and embedded markets. Our customers include retailers, manufacturers, health care providers, energy companies, automakers, and governments. We facilitate our customers creating, storing, and processing data generated by connected devices to accelerate business transformations.
Mobileye is the global leader in driving assistance and automation solutions. Our product portfolio employs a broad set of technologies, covering computer vision and machine learning-based sensing, data analysis, localization, mapping, and driving policy technology for ADAS and autonomous driving. Mobileye’s ADAS products form the building blocks for higher levels of autonomy. Our customers and strategic partners include major global OEMs and Tier 1 automotive system integrators.
| INTERNET OF | INTERNET OF THINGS OPERATING INCOME $B | ||
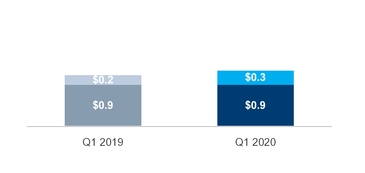
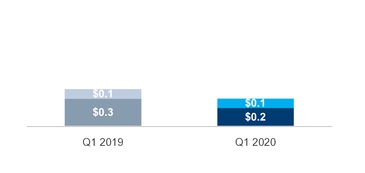
■ IOTG | ■ Mobileye | ■ IOTG | ■ Mobileye | ||||
| REVENUE AND OPERATING INCOME SUMMARY |
| Q1 2020 vs. Q1 2019 |
IOTG revenue was $883 million, down $27 million, driven by weaker demand for IOTG platform products in industrial and retail due to COVID-19. We expect this weakening to continue for the rest of the year. Operating income was $243 million, down $8 million year over year.
Mobileye recognized record revenue of $254 million, up $45 million, due to our growing market share and the increasing adoption of our ADAS solutions. Operating income was $88 million, up $20 million. We expect demand will soften in 2020 as the effects of COVID-19 continue to slow automotive production.
| MD&A | 28 | |
NON-VOLATILE MEMORY SOLUTIONS GROUP
NSG is a technology leader in next-generation memory and storage products based on breakthrough Intel® Optane™ technology and Intel® 3D NAND technology. NSG is disrupting the memory and storage hierarchy with new tiers that balance capacity, performance, and cost. We offer 64-layer TLC and QLC NAND high-capacity SSDs, and unparalleled low latency and high performance with Intel® Optane™ technology—both available in innovative new form factors and densities to address the memory and storage challenges our customers face in a rapidly evolving technological landscape. Our customers include enterprise and cloud-based data centers, and users of business and consumer desktops and laptops.
| NSG REVENUE $B | NSG OPERATING INCOME $B | ||
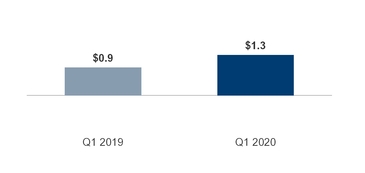
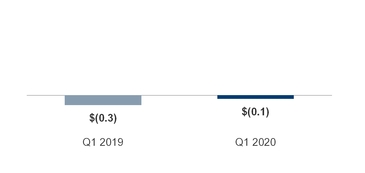
| REVENUE AND OPERATING INCOME SUMMARY |
| Q1 2020 vs. Q1 2019 |
NSG recognized record revenue of $1.3 billion, up $423 million from Q1 2019, driven by $358 million higher volume due to strong demand for NAND products. Our lower operating loss of $66 million in Q1 2020, was due to continued improvements in unit cost, market pricing recovery, and strong demand.
| MD&A | 29 | |
PROGRAMMABLE SOLUTIONS GROUP
PSG offers programmable semiconductors, primarily FPGAs, structured ASICs, and related products, for a broad range of market segments, including communications, data center, industrial, and military. The PSG product portfolio delivers FPGA acceleration in tandem with Intel microprocessors and enables Intel to combine the benefits of its broad portfolio of technologies to allow more flexibility for systems to operate with increased efficiency and higher performance.
| PSG REVENUE $B | PSG OPERATING INCOME $B | ||
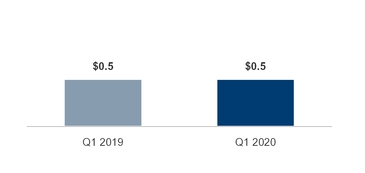
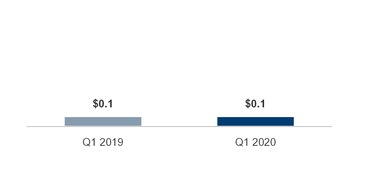
| REVENUE AND OPERATING INCOME SUMMARY |
| Q1 2020 vs. Q1 2019 |
Revenue was $519 million, up $33 million due to growth in the cloud and enterprise market segment, partially offset by weaker embedded and communications. PSG experienced growth in advanced products. Operating income was $97 million, up $8 million.
| MD&A | 30 | |
CLIENT COMPUTING GROUP
As we evolve to deliver leading end-to-end products across architectures and workloads for the data explosion, CCG’s contribution is the human touchpoint of this new data-centric era—the PC. As the largest business unit at Intel, CCG deploys platforms that connect people to data, allowing each person to focus, create, and engage in ways that unlock their individual potential. The PC market remains a critical facet of our business, providing an important source of IP, scale, and cash flow. Our mission is to continue to deliver leadership products in our PC business as well as our adjacent businesses. The PC is more essential than ever before with more people working and learning from home due to COVID-19-related shelter-in-place orders. We are dedicated to helping people around the world overcome this crisis.
| CCG REVENUE $B | CCG OPERATING INCOME $B | ||
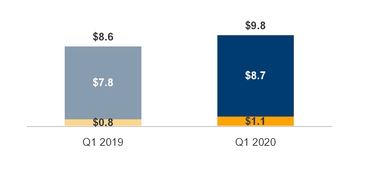
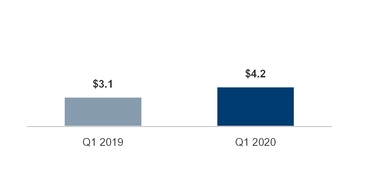
■Platform | ■Adjacent | |
| REVENUE SUMMARY |
Revenue in Q1 2020 was up 14% compared to Q1 2019, driven by strong demand for notebook platform products and incremental LTE modem volume, offset slightly by lower ASPs due to increased small core mix. Strength in notebook platform products reflects the increased reliance on PCs as more people are working and learning from home due to COVID-19.
We expect this strength to continue for the first half of the year but anticipate PC TAM to decline in the second half of 2020.
| Q1 2020 vs. Q1 2019 | |||||||
| (Dollars in Millions) | % | $ Impact | |||||
| Desktop platform volume | down | (4)% | $ | (143 | ) | ||
| Desktop platform ASP | up | 4% | 97 | ||||
| Notebook platform volume | up | 22% | 1,100 | ||||
| Notebook platform ASP | down | (3)% | (169 | ) | |||
| Adjacent products and other | 304 | ||||||
| Total change in revenue | $ | 1,189 | |||||
| OPERATING INCOME SUMMARY |
Operating income in Q1 2020 increased 38% from Q1 2019, with an operating margin of 43%.
| (In Millions) | ||||
| $ | 4,225 | Q1 2020 CCG Operating Income | ||
| 710 | Higher gross margin from platform revenue | |||
| 700 | Lower period charges primarily due to 2019 reserved non-qualified platform product | |||
| 305 | Lower operating expenses driven by lower investments in modem | |||
| (590 | ) | Higher platform unit cost due to ramp of 10nm products | ||
| 28 | Other | |||
| $ | 3,072 | Q1 2019 CCG Operating Income | ||
| MD&A | 31 | |
| CONSOLIDATED RESULTS OF OPERATIONS |
| Three Months Ended | ||||||||||||||
| Q1 2020 | Q1 2019 | |||||||||||||
| (Dollars in Millions, Except Per Share Amounts) | Amount | % of Net Revenue | Amount | % of Net Revenue | ||||||||||
| Net revenue | $ | 19,828 | 100.0 | % | $ | 16,061 | 100.0 | % | ||||||
| Cost of sales | 7,812 | 39.4 | % | 6,972 | 43.4 | % | ||||||||
| Gross margin | 12,016 | 60.6 | % | 9,089 | 56.6 | % | ||||||||
| Research and development | 3,275 | 16.5 | % | 3,332 | 20.7 | % | ||||||||
| Marketing, general and administrative | 1,541 | 7.8 | % | 1,583 | 9.9 | % | ||||||||
| Restructuring and other charges | 162 | 0.8 | % | — | — | % | ||||||||
| Operating income | 7,038 | 35.5 | % | 4,174 | 26.0 | % | ||||||||
| Gains (losses) on equity investments, net | (111 | ) | (0.6 | )% | 434 | 2.7 | % | |||||||
| Interest and other, net | (313 | ) | (1.6 | )% | (61 | ) | (0.4 | )% | ||||||
| Income before taxes | 6,614 | 33.4 | % | 4,547 | 28.3 | % | ||||||||
| Provision for taxes | 953 | 4.8 | % | 573 | 3.6 | % | ||||||||
| Net income | $ | 5,661 | 28.6 | % | $ | 3,974 | 24.7 | % | ||||||
| Earnings per share—diluted | $ | 1.31 | $ | 0.87 | ||||||||||
| MD&A | 32 | |
REVENUE
| SEGMENT REVENUE WALK $B | ||
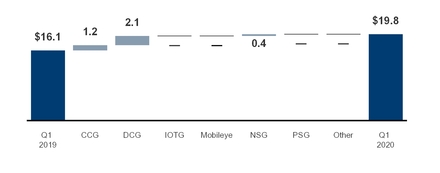
Q1 2020 vs. Q1 2019
Our Management’s DiscussionQ1 2020 revenue was $19.8 billion, up $3.8 billion or 23% from Q1 2019. Compared to a year ago, our data-centric businesses were collectively up 34% as demand from data center customers continued to strengthen as cloud service providers increased capacity to serve customer demand. We also saw higher volume from strong demand for NAND products and Analysis of Financial Condition and Results of Operations (MD&A) is providedan offset from weaker demand in addition to the accompanying consolidated condensed financial statements and notes to assist readers in understanding our results of operations, financial condition, and cash flows. MD&A is organized as follows:
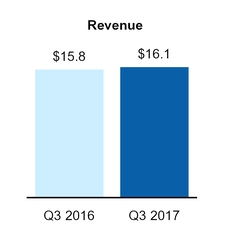
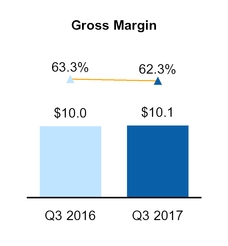
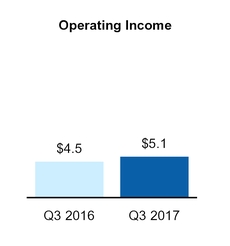
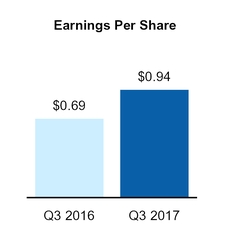

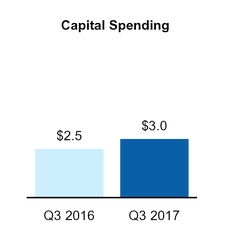
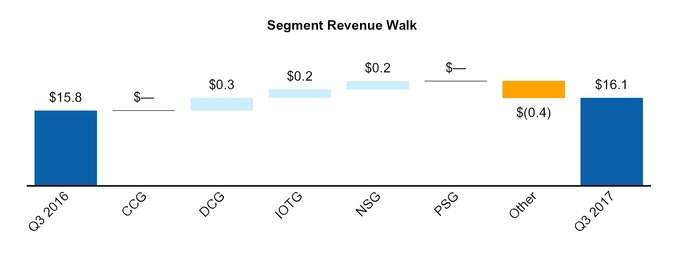
| Three Months Ended | Nine Months Ended | |||||||||||||||||||||||||||
| Q3 2017 | Q3 2016 | YTD 2017 | YTD 2016 | |||||||||||||||||||||||||
| (Dollars in Millions, Except Per Share Amounts) | Dollars | % of Net Revenue | Dollars | % of Net Revenue | Dollars | % of Net Revenue | Dollars | % of Net Revenue | ||||||||||||||||||||
| Net revenue | $ | 16,149 | 100.0 | % | $ | 15,778 | 100.0 | % | $ | 45,708 | 100.0 | % | $ | 43,013 | 100.0 | % | ||||||||||||
| Cost of sales | 6,092 | 37.7 | % | 5,795 | 36.7 | % | 17,406 | 38.1 | % | 16,927 | 39.4 | % | ||||||||||||||||
| Gross margin | 10,057 | 62.3 | % | 9,983 | 63.3 | % | 28,302 | 61.9 | % | 26,086 | 60.6 | % | ||||||||||||||||
| Research and development | 3,223 | 20.0 | % | 3,069 | 19.4 | % | 9,824 | 21.5 | % | 9,460 | 22.0 | % | ||||||||||||||||
| Marketing, general and administrative | 1,666 | 10.3 | % | 2,006 | 12.7 | % | 5,624 | 12.3 | % | 6,239 | 14.5 | % | ||||||||||||||||
| Restructuring and other charges | 4 | — | % | 372 | 2.4 | % | 189 | 0.4 | % | 1,786 | 4.1 | % | ||||||||||||||||
| Amortization of acquisition-related intangibles | 49 | 0.3 | % | 74 | 0.5 | % | 124 | 0.3 | % | 253 | 0.6 | % | ||||||||||||||||
| Operating income | 5,115 | 31.7 | % | 4,462 | 28.3 | % | 12,541 | 27.4 | % | 8,348 | 19.4 | % | ||||||||||||||||
| Gains (losses) on equity investments, net | 846 | 5.2 | % | (12 | ) | (0.1 | )% | 1,440 | 3.2 | % | 488 | 1.1 | % | |||||||||||||||
| Interest and other, net | (31 | ) | (0.2 | )% | (132 | ) | (0.8 | )% | 336 | 0.7 | % | (340 | ) | (0.7 | )% | |||||||||||||
| Income before taxes | 5,930 | 36.7 | % | 4,318 | 27.4 | % | 14,317 | 31.3 | % | 8,496 | 19.8 | % | ||||||||||||||||
| Provision for taxes | 1,414 | 8.7 | % | 940 | 6.0 | % | 4,029 | 8.8 | % | 1,742 | 4.1 | % | ||||||||||||||||
| Net income | $ | 4,516 | 28.0 | % | $ | 3,378 | 21.4 | % | $ | 10,288 | 22.5 | % | $ | 6,754 | 15.7 | % | ||||||||||||
| Diluted earnings per common share | $ | 0.94 | $ | 0.69 | $ | 2.12 | $ | 1.39 | ||||||||||||||||||||
| (In Millions) | Gross Margin Reconciliation | |||
| $ | 10,057 | Q3 2017 Gross Margin | ||
| 290 | Lower platform unit cost, primarily on 14nm cost improvement | |||
| 280 | Higher gross margin from platform revenue | |||
| (170 | ) | Impact of the ISecG divestiture, offset by higher gross margin from adjacent businesses | ||
| (260 | ) | Higher period charges associated with the ramp of our 10nm process technology | ||
| (66 | ) | Other | ||
| $ | 9,983 | Q3 2016 Gross Margin | ||
| GROSS MARGIN $B |
(Percentages in chart indicate gross margin as a percentage of total revenue)
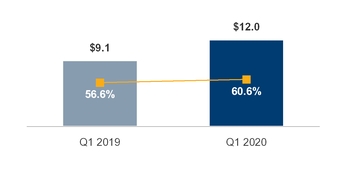
| (In Millions) | Gross Margin Reconciliation | |||
| $ | 28,302 | YTD 2017 Gross Margin | ||
| 1,795 | Higher gross margin from platform revenue | |||
| 930 | Lower platform unit cost, primarily on 14nm cost improvement | |||
| 480 | Lower Altera and other acquisition-related charges | |||
| (300 | ) | Impact of the ISecG divestiture, offset by higher gross margin from adjacent businesses | ||
| (580 | ) | Higher factory start-up costs, primarily driven by the ramp of our 10nm process technology | ||
| (109 | ) | Other | ||
| $ | 26,086 | YTD 2016 Gross Margin | ||
| (In Millions) | ||||
| $ | 12,016 | Q1 2020 Gross Margin | ||
| 2,470 | Higher gross margin from platform revenue | |||
| 770 | Lower period charges primarily due to 2019 reserved non-qualified platform product | |||
| 335 | Higher gross margin from adjacent businesses primarily due to NAND | |||
| (585 | ) | Higher platform unit cost primarily from increased mix of 10nm and performance products | ||
| (63 | ) | Other | ||
| $ | 9,089 | Q1 2019 Gross Margin | ||
| MD&A | 33 | |
OPERATING EXPENSES
Total R&D and MG&A expenses for Q1 2020 were $4.8 billion, down 2% from Q1 2019. These expenses represent 24.3% of revenue for Q1 2020 and 30.6% of revenue for Q1 2019.
| (Dollars in Millions) | Q3 2017 | Q3 2016 | % Change | YTD 2017 | YTD 2016 | % Change | ||||||||||||||||
| Platform revenue | $ | 8,132 | $ | 8,258 | (2 | )% | $ | 23,163 | $ | 22,395 | 3 | % | ||||||||||
| Other revenue | 728 | 634 | 15 | % | 1,886 | 1,384 | 36 | % | ||||||||||||||
| Net revenue | $ | 8,860 | $ | 8,892 | — | % | $ | 25,049 | $ | 23,779 | 5 | % | ||||||||||
| Operating income | $ | 3,600 | $ | 3,327 | 8 | % | $ | 9,656 | $ | 7,123 | 36 | % | ||||||||||
| CCG platform unit sales | (7 | )% | (3 | )% | ||||||||||||||||||
| CCG platform average selling prices | 7 | % | 7 | % | ||||||||||||||||||
| RESEARCH AND DEVELOPMENT $B | MARKETING, GENERAL AND ADMINISTRATIVE $B | ||
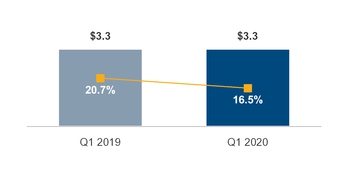
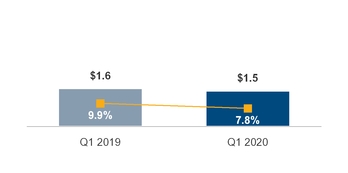
| (In Millions) | Revenue Reconciliation | |||
| $ | 8,860 | Q3 2017 CCG Revenue | ||
| (192 | ) | Lower desktop platform unit sales, down 6% | ||
| 94 | Higher CCG other revenue, including modem products | |||
| 66 | Other platform impacts | |||
| $ | 8,892 | Q3 2016 CCG Revenue | ||
| RESEARCH AND DEVELOPMENT |
Q1 2020 vs. Q1 2019
| (In Millions) | Revenue Reconciliation | |||
| $ | 25,049 | YTD 2017 CCG Revenue | ||
| 657 | Higher notebook platform unit sales, up 5% | |||
| 571 | Higher notebook platform average selling prices, up 4%, from mix of processors | |||
| 502 | Higher CCG other revenue, including modem products | |||
| (482 | ) | Lower desktop platform unit sales, down 4% | ||
| 22 | Other platform impacts | |||
| $ | 23,779 | YTD 2016 CCG Revenue | ||
| R&D decreased by $57 million, or 1.7%, driven by the following: | |
| - | Ramp down of 5G smartphone modem business |
| + | Investments in our PC and data-centric businesses |
| + | Investments in process technology |
| + | Profit dependent compensation |
| (In Millions) | Operating Income Reconciliation | |||
| $ | 3,600 | Q3 2017 CCG Operating Income | ||
| 275 | Lower CCG platform unit cost, primarily on 14nm cost improvement | |||
| 145 | Lower factory start-up costs, primarily driven by the ramp of our 10nm process technology | |||
| (215 | ) | Higher period charges associated with the ramp of our 10nm process technology | ||
| 68 | Other | |||
| $ | 3,327 | Q3 2016 CCG Operating Income | ||
| MARKETING, GENERAL AND ADMINISTRATIVE |
Q1 2020 vs. Q1 2019
| (In Millions) | Operating Income Reconciliation | |||
| $ | 9,656 | YTD 2017 CCG Operating Income | ||
| 1,025 | Lower CCG platform unit cost, primarily on 14nm cost improvement | |||
| 865 | Higher gross margin from CCG platform revenue | |||
| 565 | Lower CCG spending and share of technology development and MG&A costs | |||
| 78 | Other | |||
| $ | 7,123 | YTD 2016 CCG Operating Income | ||
| MG&A decreased by $42 million, or 2.7%, driven by the following: | |
| - | Corporate spending efficiencies |
| + | Profit dependent compensation |
| MD&A | 34 | |
GAINS (LOSSES) ON EQUITY INVESTMENTS AND INTEREST AND OTHER, NET
| (Dollars in Millions) | Q3 2017 | Q3 2016 | % Change | YTD 2017 | YTD 2016 | % Change | ||||||||||||||||
| Platform revenue | $ | 4,439 | $ | 4,164 | 7 | % | $ | 12,344 | $ | 11,589 | 7 | % | ||||||||||
| Other revenue | 439 | 378 | 16 | % | 1,138 | 979 | 16 | % | ||||||||||||||
| Net revenue | $ | 4,878 | $ | 4,542 | 7 | % | $ | 13,482 | $ | 12,568 | 7 | % | ||||||||||
| Operating income | $ | 2,255 | $ | 2,110 | 7 | % | $ | 5,403 | $ | 5,639 | (4 | )% | ||||||||||
| DCG platform unit sales | 4 | % | 3 | % | ||||||||||||||||||
| DCG platform average selling prices | 2 | % | 3 | % | ||||||||||||||||||
| (In Millions) | Revenue Reconciliation | |||
| $ | 4,878 | Q3 2017 DCG Revenue | ||
| 173 | Higher DCG platform unit sales, up 4% | |||
| 102 | Higher DCG platform average selling prices, up 2%, from mix of processors | |||
| 61 | Other | |||
| $ | 4,542 | Q3 2016 DCG Revenue | ||
| (In Millions) | Revenue Reconciliation | |||
| $ | 13,482 | YTD 2017 DCG Revenue | ||
| 384 | Higher DCG platform unit sales, up 3% | |||
| 371 | Higher DCG platform average selling prices, up 3%, from mix of processors | |||
| 159 | Other | |||
| $ | 12,568 | YTD 2016 DCG Revenue | ||
| (In Millions) | Operating Income Reconciliation | |||
| $ | 2,255 | Q3 2017 DCG Operating Income | ||
| 255 | Higher gross margin from DCG platform revenue | |||
| (145 | ) | Higher factory start-up costs, primarily driven by the ramp of our 10nm process technology | ||
| 35 | Other | |||
| $ | 2,110 | Q3 2016 DCG Operating Income | ||
| (In Millions) | Operating Income Reconciliation | |||
| $ | 5,403 | YTD 2017 DCG Operating Income | ||
| (555 | ) | Higher factory start-up costs, primarily driven by the ramp of our 10nm process technology | ||
| (365 | ) | Higher DCG operating expense, primarily on increased share of technology development and MG&A costs | ||
| 710 | Higher gross margin from DCG platform revenue | |||
| (26 | ) | Other | ||
| $ | 5,639 | YTD 2016 DCG Operating Income | ||
| (Dollars in Millions) | Q3 2017 | Q3 2016 | % Change | YTD 2017 | YTD 2016 | % Change | ||||||||||||||||
| Platform revenue | $ | 680 | $ | 605 | 12 | % | $ | 1,926 | $ | 1,673 | 15 | % | ||||||||||
| Other revenue | 169 | 84 | 101 | % | 364 | 239 | 52 | % | ||||||||||||||
| Net revenue | $ | 849 | $ | 689 | 23 | % | $ | 2,290 | $ | 1,912 | 20 | % | ||||||||||
| Operating income | $ | 146 | $ | 191 | (24 | )% | $ | 390 | $ | 403 | (3 | )% | ||||||||||
| (Dollars in Millions) | Q3 2017 | Q3 2016 | % Change | YTD 2017 | YTD 2016 | % Change | ||||||||||||||||
| Net revenue | $ | 891 | $ | 649 | 37 | % | $ | 2,631 | $ | 1,760 | 49 | % | ||||||||||
| Operating income (loss) | $ | (52 | ) | $ | (134 | ) | 61 | % | $ | (291 | ) | $ | (453 | ) | 36 | % | ||||||
| (Dollars in Millions) | Q3 2017 | Q3 2016 | % Change | YTD 2017 | YTD 2016 | % Change | ||||||||||||||||
| Net revenue | $ | 469 | $ | 425 | 10 | % | $ | 1,334 | $ | 1,249 | 7 | % | ||||||||||
| Operating income (loss) | $ | 113 | $ | 78 | 45 | % | $ | 302 | $ | (184 | ) | n/m | ||||||||||
| (Dollars in Millions) | Q3 2017 | Q3 2016 | YTD 2017 | YTD 2016 | ||||||||||||
| Research and development (R&D) | $ | 3,223 | $ | 3,069 | $ | 9,824 | $ | 9,460 | ||||||||
| Marketing, general and administrative (MG&A) | $ | 1,666 | $ | 2,006 | $ | 5,624 | $ | 6,239 | ||||||||
| R&D and MG&A as percentage of net revenue | 30.3 | % | 32.2 | % | 33.8 | % | 36.5 | % | ||||||||
| Restructuring and other charges | $ | 4 | $ | 372 | $ | 189 | $ | 1,786 | ||||||||
| Amortization of acquisition-related intangibles | $ | 49 | $ | 74 | $ | 124 | $ | 253 | ||||||||
| (In Millions) | Q3 2017 | Q3 2016 | YTD 2017 | YTD 2016 | ||||||||||||
| 2016 Restructuring Program | $ | 2 | $ | 349 | $ | (51 | ) | $ | 1,763 | |||||||
| Other charges | 2 | 23 | 240 | 23 | ||||||||||||
| Total restructuring and other charges | $ | 4 | $ | 372 | $ | 189 | $ | 1,786 | ||||||||
| (In Millions) | Q3 2017 | Q3 2016 | YTD 2017 | YTD 2016 | Q1 2020 | Q1 2019 | ||||||||||||||||||
| Ongoing mark-to-market adjustments on marketable equity securities | $ | (103 | ) | $ | 253 | |||||||||||||||||||
| Observable price adjustments on non-marketable equity securities | 79 | 8 | ||||||||||||||||||||||
| Impairment charges | (143 | ) | (23 | ) | ||||||||||||||||||||
Sale of equity investments and other | 56 | 196 | ||||||||||||||||||||||
| Gains (losses) on equity investments, net | $ | 846 | $ | (12 | ) | $ | 1,440 | $ | 488 | $ | (111 | ) | $ | 434 | ||||||||||
| Interest and other, net | $ | (31 | ) | $ | (132 | ) | $ | 336 | $ | (340 | ) | $ | (313 | ) | $ | (61 | ) | |||||||
Gains (losses) on equity investments, net
We recognized higher net realizeda $103 million ongoing mark-to-market loss during the first three months of 2020, primarily related to our interest in Cloudera Inc. During the first three months of 2019, we recognized ongoing mark-to-market gains on sales of a portion of$253 million, primarily driven by our interest in ASML of $926 million in Q3 2017 and $2.0 billion in the first nine months of 2017 compared to $407 million for the first nine months of 2016. The higher net realized gains were partially offset by $613Holding N.V. (ASML).
We recognized $143 million of impairment charges andon our share of equity method investee losses fornon-marketable portfolio in the first ninethree months of 2017.2020 based on our assessment of the impact of recent public and private market volatility and tightening of liquidity.
We recognized $154 million of McAfee dividends during the first three months of 2019.
Interest and other, net
| (Dollars in Millions) | Q3 2017 | Q3 2016 | YTD 2017 | YTD 2016 | Q1 2020 | Q1 2019 | ||||||||||||||||||
| Income before taxes | $ | 5,930 | $ | 4,318 | $ | 14,317 | $ | 8,496 | $ | 6,614 | $ | 4,547 | ||||||||||||
| Provision for taxes | $ | 1,414 | $ | 940 | $ | 4,029 | $ | 1,742 | $ | 953 | $ | 573 | ||||||||||||
| Effective tax rate | 23.8 | % | 21.8 | % | 28.1 | % | 20.5 | % | 14.4 | % | 12.6 | % | ||||||||||||
| MD&A | 35 | |
We consider the following when assessing our liquidity and capital resources:
| (Dollars in Millions) | Sep 30, 2017 | Dec 31, 2016 | Mar 28, 2020 | Dec 28, 2019 | ||||||||||||
| Cash and cash equivalents, short-term investments, and trading assets | $ | 17,504 | $ | 17,099 | $ | 20,803 | $ | 13,123 | ||||||||
| Other long-term investments | $ | 3,844 | $ | 4,716 | $ | 2,943 | $ | 3,276 | ||||||||
| Loans receivable and other | $ | 894 | $ | 996 | $ | 1,294 | $ | 1,239 | ||||||||
| Reverse repurchase agreements with original maturities greater than three months | $ | 250 | $ | 250 | $ | 350 | $ | 350 | ||||||||
| Total debt | $ | 31,640 | $ | 25,283 | $ | 39,919 | $ | 29,001 | ||||||||
| Temporary equity | $ | 870 | $ | 882 | $ | — | $ | 155 | ||||||||
| Debt as percentage of permanent stockholders’ equity | 44.6 | % | 38.2 | % | 52.3 | % | 37.4 | % | ||||||||
Cash generated by operations is our primary source of liquidity. When assessing our sources of liquidity, we include investments as shown in the preceding table. We maintain a diverse investment portfolio that we continually analyze based on issuer, industry, and country. When assessing our sources of liquidity we include investments as shown in the preceding table. Substantially all of our investments in debt instruments and financing receivables are in investment-grade securities.
Other potential sources of liquidity include our commercial paper program and our automatic shelf registration statement on file with the SEC, pursuant to which we may offer an unspecified amount of debt, equity, and other securities. Under our commercial paper program, we have an ongoing authorization from our Board of Directors to borrow up to $10.0 billion. This amount includes an increase of $5.0 billion in the authorization limit approved by our Board of Directors in April 2017. No commercial paper remained outstanding as of September 30, 2017. In Q3 2017, we redeemed our $1.0 billion, 4.90% senior notes due August 2045 as well as issued a total of $640 million aggregate principal amount of senior notes to finance a portion of the senior notes redeemed.
As of September 30, 2017, $10.0 billion of our $17.5 billion of cash and cash equivalents, short-term investments, and trading assets was held by our non-U.S. subsidiaries. Of the $10.0 billion held by our non-U.S. subsidiaries, approximately $4.9 billion was available for use in the U.S. without incurring additional U.S. income taxes in excess of the amounts already accrued in our financial statements as of September 30, 2017. The remaining amount of non-U.S. cash and cash equivalents, short-term investments, and trading assets has been indefinitely reinvested and, therefore,March 28, 2020, we had no U.S. current or deferred taxes have been accrued. This amount is earmarked for near-term investment in our operations outside the U.S. and future acquisitions of non-U.S. entities. We believe our U.S. sources of cash and liquidity are sufficient to meet our business needs in the U.S., and do not expect that we will need to repatriate the funds we have designated as indefinitely reinvested outside the U.S. Under current tax laws, should our plans change and we were to choose to repatriate some or all of the funds we have designated as indefinitely reinvested outside the U.S., such amounts would be subject to U.S. income taxes and applicable non-U.S. income and withholding taxes.outstanding commercial paper.
We believe we have sufficient financial resources to meet our business requirements in the next 12 months, including capital expenditures for worldwide manufacturing and assembly and test; working capital requirements; and potential dividends, commonacquisitions, strategic investments, and dividends. As we enter a period of economic uncertainty, we took actions this quarter that further strengthen our liquidity. During the first three months of 2020 we issued a total of $10.3 billion aggregate principal amount of senior notes. Additionally, on March 24, 2020 we suspended the use of our financial resources for stock repurchases, acquisitions,having repurchased approximately $7.6 billion of our planned $20.0 billionrepurchases announced in October 2019. The suspension of stock repurchases will not impact dividend payments to stockholders and strategic investments.the company has the ability to reinstate stock repurchases as circumstances warrant.
| Nine Months Ended | ||||||||
| (In Millions) | Sep 30, 2017 | Oct 1, 2016 | ||||||
| Net cash provided by operating activities | $ | 14,869 | $ | 13,658 | ||||
| Net cash used for investing activities | (10,532 | ) | (22,373 | ) | ||||
| Net cash provided by (used for) financing activities | (822 | ) | (1,841 | ) | ||||
| Net increase (decrease) in cash and cash equivalents | $ | 3,515 | $ | (10,556 | ) | |||
| CASH FROM OPERATIONS $B | CAPITAL EXPENDITURES $B | CASH TO STOCKHOLDERS $B | |||
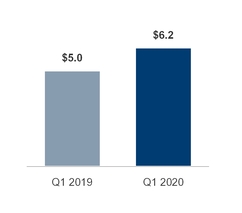
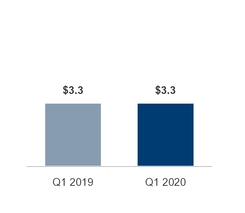
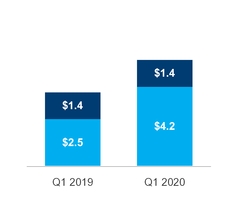
■Dividends ■ Buybacks | ||||
| Three Months Ended | ||||||||
| (In Millions) | Mar 28, 2020 | Mar 30, 2019 | ||||||
| Net cash provided by operating activities | $ | 6,158 | $ | 4,959 | ||||
| Net cash used for investing activities | (3,736 | ) | (2,722 | ) | ||||
| Net cash provided by (used for) financing activities | 4,764 | (2,102 | ) | |||||
| Net increase (decrease) in cash and cash equivalents | $ | 7,186 | $ | 135 | ||||
| MD&A | 36 | |
Operating Activities
Cash provided by operating activities is net income adjusted for certain non-cash items and changes in assets and liabilities.
For the first ninethree monthsof 20172020 compared to the first ninethree monthsof 2016,2019, the $1.2 billion increase in cash provided by operations was primarily due to higher net income. This increase was partiallyincome offset by adjustments to net income for non-cash items, primarily driven by reduced restructuring charges, as well as changes in working capital which benefited from $1.0 billion receipts of customer deposits.driven by other assets and liabilities and accounts receivable.
Investing Activities
Investing cash flows consist primarily of capital expenditures; investment purchases, sales, maturities, and disposals; and proceeds from divestitures and cash used for acquisitions.
Cash used for investing activities was lower forhigher in the first ninethree monthsof 20172020 compared to the first ninethree monthsof 20162019 primarily due to netdecreased sales of available-for-saleequity investments and trading assets, as well as proceeds(substantially all from our divestiture of ISecG. This activity was partially offset by higher capital expenditures.ASML sales).
Financing Activities
Financing cash flows consist primarily of repurchases of common stock, payment of dividends to stockholders, issuance and repayment of short-term and long-term debt, and proceeds from the sale of shares of common stock through employee equity incentive plans.
Cash was provided by financing activities in the first three months of 2020 compared to cash used for financing activities was lower in the first ninethree monthsof 2017 compared to the first nine monthsof 20162019 primarily due to higherincreased long-term debt issuances of long-term debt. This increase was partially offset by higherincreased repurchases of common stock and repayment ofreduced proceeds from short-term debt.
During Q2 2017,Q1 2020, we issued $7.1a total of $10.3 billion in aggregate principal amount of senior unsecured notes. Our remaining total cash payments (including anticipated interest payments on fixed rate debt that are not recorded on the consolidated condensed balance sheets, and excluding interest payments relating to our floating rate debt) over the life of these long-term debt obligations are expected to be approximately $9.2$19.1 billion. During Q3 2017, we issued a total of $640 million aggregate principal amount of senior notes.These payments include anticipated interest on fixed rate debt that is not recorded on the Consolidated Condensed Balance Sheets. For further information, see "Note 13:8: Borrowings" inwithin the notes to consolidated condensed financial statements on this Form 10-Q.Consolidated Condensed Financial Statements and Supplemental Details.
We are affected by changes in currency exchange and interest rates, as well as equity and commodity prices. For discussion about marketOur risk management programs are designed to reduce, but may not entirely eliminate, the impacts of these risks. We performed sensitivity analyses of these risks to our financial positions as of December 28, 2019, and updated that sensitivity analysis relatedas of March 28, 2020, to determine whether material changes in market risks pertaining to currency exchange rates,and interest rates or equity prices, and commodity prices refer to Part II, Item 7A, Quantitativehave occurred as a result of the COVID-19 pandemic. No material revisions were noted since disclosing "Quantitative and Qualitative Disclosures About Market Risk,Risk" within MD&A, in our 20162019 Form 10-K. Risks related to a slowdown or recession are described below under “Risk Factors.”
| MD&A | 37 | |
NON-GAAP FINANCIAL MEASURES
In addition to disclosing financial results in accordance with U.S. GAAP, this document contains references to the participationnon-GAAP financial measures below. We believe these non-GAAP financial measures provide investors with useful supplemental information about the financial performance of our Chief Executive Officer (CEO)business, enable comparison of financial results between periods where certain items may vary independent of business performance, and Chief Financial Officer (CFO)), asallow for greater transparency with respect to key metrics used by management in operating our business and measuring our performance.
Our non-GAAP financial measures reflect adjustments based on one or more of the endfollowing items, as well as the related income tax effects where applicable. Income tax effects have been calculated using an appropriate tax rate for each adjustment. These non-GAAP financial measures should not be considered a substitute for, or superior to, financial measures calculated in accordance with U.S. GAAP, and the financial results calculated in accordance with U.S. GAAP and reconciliations from these results should be carefully evaluated.
| Non-GAAP adjustment or measure | Definition | Usefulness to management and investors |
| Acquisition-related adjustments | Amortization of acquisition-related intangible assets consists of amortization of intangible assets such as developed technology, brands, and customer relationships acquired in connection with business combinations. Charges related to the amortization of these intangibles are recorded within both cost of sales and MG&A in our U.S. GAAP financial statements. Amortization charges are recorded over the estimated useful life of the related acquired intangible asset, and thus are generally recorded over multiple years. | We exclude amortization charges for our acquisition-related intangible assets for purposes of calculating certain non-GAAP measures because these charges are inconsistent in size and are significantly impacted by the timing and valuation of our acquisitions. These adjustments facilitate a useful evaluation of our current operating performance and comparison to our past operating performance and provide investors with additional means to evaluate cost and expense trends. |
| Restructuring and other charges | Restructuring charges are costs associated with a formal restructuring plan and are primarily related to employee severance and benefit arrangements. Other charges include asset impairments, pension charges, and costs associated with restructuring activity. | We exclude restructuring and other charges, including any adjustments to charges recorded in prior periods, for purposes of calculating certain non-GAAP measures because these costs do not reflect our current operating performance and are significantly impacted by the timing of restructuring activity. These adjustments facilitate a useful evaluation of our current operating performance and comparisons to past operating results and provide investors with additional means to evaluate expense trends. |
| Ongoing mark-to-market on marketable equity securities | After the initial mark-to-market adjustment is recorded upon a security becoming marketable, gains and losses are recognized from ongoing mark-to-market adjustments of our marketable equity securities. | We exclude these ongoing gains and losses for purposes of calculating certain non-GAAP measures because we do not believe this volatility correlates to our core operational performance. These adjustments facilitate a useful evaluation of our current operating performance and comparisons to past operating results. |
| Free cash flow | We reference a non-GAAP financial measure of free cash flow, which is used by management when assessing our sources of liquidity, capital resources, and quality of earnings. Free cash flow is operating cash flow adjusted to exclude additions to property, plant, and equipment. | This non-GAAP financial measure is helpful in understanding our capital requirements and provides an additional means to evaluate the cash flow trends of our business. |
| MD&A | 38 | |
Following are the reconciliations of our most comparable U.S. GAAP measures to our non-GAAP measures presented:
| Three Months Ended | ||||||||
| (In Millions, Except Per Share Amounts) | Mar 28, 2020 | Mar 30, 2019 | ||||||
| Operating income | $ | 7,038 | $ | 4,174 | ||||
| Acquisition-related adjustments | 339 | 331 | ||||||
| Restructuring and other charges | 162 | — | ||||||
| Non-GAAP operating income | $ | 7,539 | $ | 4,505 | ||||
| Operating margin | 35.5 | % | 26.0 | % | ||||
| Acquisition-related adjustments | 1.7 | % | 2.1 | % | ||||
| Restructuring and other charges | 0.8 | % | — | % | ||||
| Non-GAAP operating margin | 38.0 | % | 28.0 | % | ||||
| Earnings per share—diluted | $ | 1.31 | $ | 0.87 | ||||
| Acquisition-related adjustments | 0.08 | 0.07 | ||||||
| Restructuring and other charges | 0.04 | — | ||||||
| Ongoing mark-to-market on marketable equity securities | 0.03 | (0.05 | ) | |||||
| Income tax effect | (0.01 | ) | — | |||||
| Non-GAAP earnings per share—diluted | $ | 1.45 | $ | 0.89 | ||||
| Net cash provided by operating activities | $ | 6,158 | $ | 4,959 | ||||
| Additions to property, plant and equipment | (3,268 | ) | (3,321 | ) | ||||
| Free cash flow | $ | 2,890 | $ | 1,638 | ||||
| Net cash used for investing activities | $ | (3,736 | ) | $ | (2,722 | ) | ||
| Net cash provided by (used for) financing activities | $ | 4,764 | $ | (2,102 | ) | |||
| MD&A | 39 | |
| OTHER KEY INFORMATION |
RISK FACTORS
The risks described in "Risk Factors" within Other Key Information in our 2019 Form 10-K could materially and adversely affect our business, financial condition, and results of operations, and the trading price of our common stock could decline. In addition to our discussion in “Our Pandemic Response,” MD&A, and other sections of this report to address effects of the period covered byCOVID-19 pandemic, we have provided an additional risk factor regarding COVID-19 below and have updated the risk factors included in our 2019 Form 10-K titled "Global or regional conditions can harm our financial results" and "Catastrophic events can have a material adverse effect on our operations and financial results." As discussed below, the impact of COVID-19 can also exacerbate other risks discussed in the Risk Factors sections of our 2019 Form 10-K and this report, which could in turn have a material adverse effect on us. The Risk Factors section in our CEO2019 Form 10-K otherwise remains current in all material respects. These risk factors do not identify all risks that we face—our operations could also be affected by factors that are not presently known to us or that we currently consider to be immaterial to our operations. Due to risks and CFOuncertainties, known and unknown, our past financial results may not be a reliable indicator of future performance and historical trends should not be used to anticipate results or trends in future periods.
The COVID-19 pandemic could materially adversely affect our financial condition and results of operations. The novel strain of the coronavirus identified in China in late 2019 (COVID-19) has globally spread throughout other areas such as Asia, Europe, the Middle East, and North America and has resulted in authorities imposing, and businesses and individuals implementing, numerous unprecedented measures to try to contain the virus, such as travel bans and restrictions, quarantines, shelter-in-place/stay-at-home and social distancing orders, and shutdowns. These measures have concludedimpacted and may further impact our workforce and operations, the operations of our customers, and those of our respective vendors, suppliers, and partners. We have significant manufacturing operations in the U.S., Ireland, Israel, China, Malaysia, and Vietnam, and each of these countries has been affected by the outbreak and taken measures to try to contain it. The ultimate impact and efficacy of government measures and potential future measures is currently unknown.
There is considerable uncertainty regarding the business impacts from such measures and potential future measures. While we have been able to operate our factories on a relatively normal basis to date, shelter-in-place orders and other measures, including work-from-home and social distancing policies implemented to protect employees, have resulted in reduced workforce availability at some of our sites, construction delays, and reduced capacity at some of our vendors and suppliers. Restrictions on our access to or operation of our manufacturing facilities or on our support operations or workforce, or similar limitations for our vendors and suppliers, can impact our ability to meet customer demand and could have a material adverse effect on our financial condition and results of operations, particularly if prolonged. Similarly, current and future restrictions or disruptions of transportation, such as reduced availability of air transport, port closures, and increased border controls or closures, can also impact our ability to meet demand and could materially adversely affect us. Our customers have experienced, and may continue to experience, disruptions in their operations and supply chains, which can result in delayed, reduced, or canceled orders, or collection risks, and which may adversely affect our results of operations. We have paused new construction projects at several of our manufacturing sites due to local government restrictions. Our current expectation that these interruptions will have a minimal impact on our disclosureproduct ramps and will not affect our timelines for process technology transitions could prove to be inaccurate, and it is possible our plans could be adversely affected to the extent these interruptions are prolonged, additional projects are paused, or other unexpected consequences impacting production occur.
The pandemic has significantly increased economic and demand uncertainty. It is likely that the current outbreak and continued spread of COVID-19 will cause an economic slowdown, and it is possible that it could cause a global recession. There is a significant degree of uncertainty and lack of visibility as to the extent and duration of any such slowdown or recession. Risks related to a slowdown or recession are described in our risk factor titled “Global or regional conditions can harm our financial results,” below, and include the risk that demand for our products will be significantly harmed. We are currently seeing negative impacts on demand in some of our businesses, and are expecting slowing economic conditions to adversely affect those and certain other segments in the second half of 2020, as discussed in the “Our Pandemic Response” section of this report. Given the significant economic uncertainty and volatility created by the pandemic, it is difficult to predict the nature and extent of impacts on demand for our products. These expectations are subject to change without warning and investors are cautioned not to place undue reliance on them.
The pandemic has led to increased disruption and volatility in capital markets and credit markets. We issued over $10 billion in new debt in Q1 2020 and announced the suspension of our stock repurchases on March 24, 2020 to strengthen our liquidity position given the uncertainty regarding the length and severity of the pandemic and ongoing economic uncertainty. Unanticipated consequences of the pandemic and resulting economic uncertainty could adversely affect our liquidity and capital resources in the future. Market volatility has negatively impacted, and may continue to negatively impact, our equity investment portfolio.
The spread of COVID-19 has caused us to modify our business practices (including employee travel, employee work locations, cancellation of physical participation in meetings, events and conferences, and social distancing measures), and we may take further actions as may be required by government authorities or that we determine are in the best interests of our employees, customers, partners, vendors, and suppliers. Work-from-home and other measures introduce additional operational risks, including cybersecurity risks, and have affected the way we conduct our product development, validation, and qualification, customer support, and other activities, which could have an adverse effect on our operations. There is no certainty that such measures will be sufficient to mitigate the risks posed by the virus, and illness and workforce disruptions could lead to unavailability of key personnel and harm our ability to perform critical functions.
| OTHER KEY INFORMATION | 40 | |
The degree to which COVID-19 impacts our results will depend on future developments, which are highly uncertain and cannot be predicted, including, but not limited to, the duration and spread of the outbreak, its severity, the actions to contain the virus or treat its impact, other actions taken by governments, businesses, and individuals in response to the virus and resulting economic disruption, and how quickly and to what extent normal economic and operating conditions can resume. We are similarly unable to predict the degree to which the pandemic impacts our customers, suppliers, vendors, and other partners, and their financial conditions, but a material effect on these parties could also adversely affect us. The impact of COVID-19 can also exacerbate other risks discussed in the Risk Factors sections of our 2019 Form 10-K and this report, which could in turn have a material adverse effect on us. Developments related to COVID-19 have been rapidly changing, and additional impacts and risks may arise that we are not aware of or able to appropriately respond to currently.
Global or regional conditions can harm our financial results.We have manufacturing, assembly and test, R&D, sales, and other operations in many countries, and some of our business activities are concentrated in one or more geographic areas. Moreover, sales outside the U.S. accounted for approximately 78% of our revenue for the fiscal year ended December 28, 2019, with revenue from billings to China, including Hong Kong, contributing approximately 28% of our total revenue. As a result, our operations and our financial results, including our ability to manufacture, assemble and test, design, develop, or sell products, and the demand for our products, are at times adversely affected by a number of global and regional factors outside of our control.
Adverse changes in global or regional economic conditions, including recession or slowing growth, changes or uncertainty in fiscal, monetary, or trade policy, higher interest rates, tighter credit, inflation, lower capital expenditures by businesses including on IT infrastructure, increases in unemployment, and lower consumer confidence and spending, periodically occur. The COVID-19 pandemic has significantly increased economic and demand uncertainty. It is likely that the current outbreak and continued spread of COVID-19 will cause an economic slowdown, and it is possible that it could cause a global recession. Adverse changes in economic conditions, including as a result of the pandemic, can significantly harm demand for our products and make it more challenging to forecast our operating results and make business decisions, including regarding prioritization of investments in our business. An economic downturn or increased uncertainty may also lead to increased credit and collectability risks, higher borrowing costs or reduced availability of capital markets, reduced liquidity, adverse impacts on our suppliers, failures of counterparties including financial institutions and insurers, asset impairments, and declines in the value of our financial instruments.
International trade disputes at times result in increased tariffs, trade barriers, and other protectionist measures that can increase our manufacturing costs, make our products less competitive, reduce demand for our products, limit our ability to sell to certain customers, limit our ability to procure components or raw materials, or impede or slow the movement of our goods across borders. Increasing protectionism and economic nationalism may lead to further changes in trade policy, domestic sourcing initiatives, or other formal and informal measures that could make it more difficult to sell our products in, or restrict our access to, some markets.
Escalating trade tensions between the U.S. and China have led to increased tariffs and trade restrictions, including tariffs applicable to some of our products, and have affected customer ordering patterns. The U.S. has imposed restrictions on the export of U.S.-regulated products and technology to certain Chinese technology companies, including certain of our customers. These restrictions have reduced our sales, and continuing or future restrictions could adversely affect our financial results, result in reputational harm to us due to our relationship with such companies, or lead such companies to develop or adopt technologies that compete with our products. It is difficult to predict what further trade-related actions governments may take, which may include additional or increased tariffs and trade restrictions, and we may be unable to quickly and effectively react to such actions. For example, U.S. legislation has expanded the power of the U.S. Department of Commerce to restrict the export of “emerging and foundational technologies” yet to be identified, which could impact our current or future products.
Trade disputes and protectionist measures, or continued uncertainty about such matters, could result in declining consumer confidence and slowing economic growth or recession, and could cause our customers to reduce, cancel, or alter the timing of their purchases with us. Sustained trade tensions could lead to long-term changes in global trade and technology supply chains, which could adversely affect our business and growth prospects.
We can be adversely affected by other global and regional factors that periodically occur, including:
geopolitical and security issues, such as armed conflict and civil or military unrest, political instability, human rights concerns, and terrorist activity, including, for example, geopolitical tensions and conflict affecting Israel, where our Mobileye business headquarters and certain of our fabrication facilities are located;
natural disasters, public health issues (including the COVID-19 pandemic discussed further in the risk factor “The COVID-19 pandemic could materially adversely affect our financial condition and results of operations,” above), and other catastrophic events;
inefficient infrastructure and other disruptions, such as supply chain interruptions and large-scale outages or unreliable provision of services from utilities, transportation, data hosting, or telecommunications providers;
formal or informal imposition of new or revised export, import, or doing-business regulations, including trade sanctions, tariffs, and changes in the ability to obtain export licenses, which could be changed without notice;
government restrictions on, or nationalization of, our operations in any country, or restrictions on our ability to repatriate earnings from a particular country;
adverse changes relating to government grants, tax credits, or other government incentives;
differing employment practices and labor issues;
ineffective legal protection of our IP rights in certain countries;
| OTHER KEY INFORMATION | 41 | |
local business and cultural factors that differ from our current standards and practices;
continuing uncertainty regarding social, political, immigration, and tax and trade policies in the U.S. and abroad, including as a result of the United Kingdom's withdrawal from the European Union;
fluctuations in the market values of our domestic and international investments, which can be negatively affected by liquidity, credit deterioration or losses, interest rate changes, financial results, political risk, sovereign risk, or other factors; and
uncertainty regarding LIBOR—certain of our interest rate derivatives and investments are based on LIBOR, and a portion of our indebtedness bears interest at variable interest rates, primarily based on LIBOR: LIBOR is the subject of recent national, international and other regulatory guidance and proposals for reform, which may cause LIBOR to disappear entirely after 2021 or to perform differently than in the past, and while we expect that reasonable alternatives to LIBOR will be implemented prior to the 2021 target date, we cannot predict the consequences and timing of these developments, and they could include an increase in our interest expense and/or a reduction in our interest income.
We are subject to laws and regulations worldwide that differ among jurisdictions, affecting our operations in areas including, but not limited to: IP ownership and infringement; tax; import and export requirements; anti-corruption; foreign exchange controls and cash repatriation restrictions; data privacy requirements; competition; advertising; employment; product regulations; environment, health, and safety requirements; and consumer laws. Compliance with such requirements can be onerous and expensive, and may otherwise impact our business operations negatively. For example, unfavorable developments with evolving laws and regulations worldwide related to 5G or autonomous driving technology may limit global adoption, impede our strategy, and negatively impact our long-term expectations for our investments in these areas. Expanding privacy legislation and compliance costs of privacy-related and data protection measures could adversely affect our customers and their products and services, particularly in cloud, Internet of Things, and AI applications, which could in turn reduce demand for our products used for those workloads.
Although we have policies, controls, and procedures (as defined in Rules 13a-15(e) and 15d-15(e) under the Securities Exchange Act of 1934, as amended (the Exchange Act)), are effectivedesigned to provide reasonablehelp ensure compliance with applicable laws, there can be no assurance that information required to be disclosed byour employees, contractors, suppliers, or agents will not violate such laws or our policies. Violations of these laws and regulations can result in fines; criminal sanctions against us, in reports that we fileour officers, or submit underour employees; prohibitions on the Exchange Act is recorded, processed, summarized,conduct of our business; and reported within the time periods specified in SEC rules and forms, and is accumulated and communicated to management, including our principal executive officer and principal financial officer, as appropriate, to allow timely decisions regarding required disclosure.
Catastrophic events can have a material adverse effect on our operations and financial reporting (as definedresults.Our operations and business, and those of our customers and suppliers, can be disrupted by natural disasters; industrial accidents; public health issues (including the COVID-19 pandemic discussed further in Rules 13a-15(f) and 15d-15(f) under the Exchange Act) that occurred during the quarter ended September 30, 2017 that haverisk factor “The COVID-19 pandemic could materially affected, or are reasonably likely to materiallyadversely affect our internal control over financial reporting.condition and results of operations,” above); cybersecurity incidents; interruptions of service from utilities, transportation, telecommunications, or IT systems providers; manufacturing equipment failures; or other catastrophic events. For example, we have at times experienced disruptions in our manufacturing processes as a result of power outages, improperly functioning equipment, and disruptions in supply of raw materials or components, including due to cybersecurity incidents affecting our suppliers. Our headquarters and many of our operations and facilities are in locations that are prone to earthquakes and other natural disasters. Global climate change can result in certain natural disasters occurring more frequently or with greater intensity, such as drought, wildfires, storms, sea-level rise, and flooding, and could disrupt the availability of water necessary for the operation of our fabrication facilities located in semi-arid regions. Catastrophic events could make it difficult or impossible to manufacture or deliver products to our customers, receive production materials from our suppliers, or perform critical functions, which could adversely affect our revenue and require significant recovery time and expenditures to resume operations. While we maintain business recovery plans that are intended to enable us to recover from natural disasters or other events that can be disruptive to our business, some of our systems are not fully redundant and we cannot be sure that our plans will fully protect us from all such disruptions. Furthermore, even if our operations are unaffected or recover quickly, if our customers cannot timely resume their own operations due to a catastrophic event, they may reduce or cancel their orders, which may adversely affect our results of operations.
We maintain a program of insurance coverage for a variety of property, casualty, and other risks. The types and amounts of insurance we obtain vary depending on availability, cost, and decisions with respect to risk retention. Some of our policies have large deductibles and broad exclusions. In addition, one or more of our insurance providers may be unable or unwilling to pay a claim. Losses not covered by insurance may be large, which could harm our results of operations and financial condition.
| OTHER KEY INFORMATION | 42 | |
CONTROLS AND PROCEDURES
Inherent Limitations on Effectiveness of Controls
Our management, including the CEOprincipal executive officer and CFO,principal financial officer, does not expect that our disclosure controls and procedures or our internal control over financial reporting will prevent or detect all errors and all fraud. A control system, no matter how well-designed and operated, can provide only reasonable, not absolute, assurance that the control system’s objectives will be met. The design of a control system must reflect the fact that there are resource constraints, and the benefits of controls must be considered relative to their costs. Further, because of the inherent limitations in all control systems, no evaluation of controls can provide absolute assurance that misstatements due to error or fraud will not occur or that all control issues and instances of fraud, if any, have been detected.
Evaluation of Disclosure Controls and Procedures
Due to the COVID-19 pandemic, a significant portion of our employees are now working from home, while also under shelter-in-place orders or other restrictions. Established business continuity plans were activated in order to mitigate the impact to our control environment, operating procedures, data and internal controls. The design of any systemour processes and controls allow for remote execution with accessibility to secure data.
Based on management’s evaluation (with the participation of our principal executive officer and principal financial officer), as of the end of the period covered by this report, our principal executive officer and principal financial officer have concluded that our disclosure controls is basedand procedures (as defined in part on certain assumptions aboutRules 13a-15(e) and 15d-15(e) under the likelihoodSecurities Exchange Act of future events, and there can be no1934, as amended (the Exchange Act)), are effective to provide reasonable assurance that any design will succeedinformation required to be disclosed by us in achieving its stated goalsreports that we file or submit under all potential future conditions. Projections of any evaluation of the effectiveness of controlsExchange Act is recorded, processed, summarized, and reported within the time periods specified in SEC rules and forms, and is accumulated and communicated to future periodsmanagement, including our principal executive officer and principal financial officer, as appropriate, to allow timely decisions regarding required disclosure.
Changes in Internal Control Over Financial Reporting
There were no changes to our internal control over financial reporting (as defined in Rules 13a-15(f) and 15d-15(f) under the Exchange Act) that occurred during the quarter ended March 28, 2020 that have materially affected, or are subjectreasonably likely to risks. Over time, controls may become inadequate because of changes in conditions or deterioration in the degree of compliance with policies or procedures.
We have an ongoing authorization, (originally adoptedoriginally approved by our Board of Directors in 2005 and subsequently amended)amended, to repurchase shares of our common stock in open market or negotiated transactions. On March 24, 2020, we suspended stock repurchases in light of the COVID-19 pandemic and we have the ability to reinstate repurchases as circumstances warrant. As of September 30, 2017,March 28, 2020, we were authorized to repurchase up to $75.0$110.0 billion,, of which $13.2$19.7 billion remained available. This amount includes an increase of $10.0 billion in the authorization limit approved by our Board of Directors in April 2017.
Common stock repurchase activity under our publicly announced stock repurchase program during the thirdfirst quarter of 20172020 was as follows:
| Period | Total Number of Shares Purchased (In Millions) | Average Price Paid Per Share | Dollar Value of Shares That May Yet Be Purchased Under the Program (In Millions) | ||||||||
| December 29, 2019 - January 25, 2020 | 17.9 | $ | 60.39 | $ | 22,687 | ||||||
| January 26, 2020 - February 22, 2020 | 17.2 | $ | 66.27 | $ | 21,547 | ||||||
| February 23, 2020 - March 28, 2020 | 36.2 | $ | 52.11 | $ | 19,658 | ||||||
| Total | 71.3 | ||||||||||
| Period | Total Number of Shares Purchased (In Millions) | Average Price Paid Per Share | Dollar Value of Shares That May Yet Be Purchased (In Millions) | ||||||||
| July 2, 2017 - July 29, 2017 | 11.6 | $ | 34.27 | $ | 13,800 | ||||||
| July 30, 2017 - August 26, 2017 | 8.1 | $ | 35.59 | $ | 13,512 | ||||||
| August 27, 2017 - September 30, 2017 | 8.9 | $ | 36.03 | $ | 13,191 | ||||||
| Total | 28.6 | $ | 35.19 | ||||||||
We issue RSUs as part of our equity incentive plans. In our consolidated condensed financial statements,Consolidated Condensed Financial Statements, we treat shares of common stock withheld for tax purposes on behalf of our employees in connection with the vesting of RSUs as common stock repurchases because they reduce the number of shares that would have been issued upon vesting. These withheld shares of common stock are not considered common stock repurchases under our authorized common stock repurchase planprogram and accordingly are not included in the common stock repurchase totals in the preceding table.
| OTHER KEY INFORMATION | 43 | |
EXHIBITS
| Incorporated by Reference | ||||||||||||
Exhibit Number | Exhibit Description | Form | File Number | Exhibit | Filing Date | Filed or Furnished Herewith | ||||||
| 3.1 | 8-K | 000-06217 | 3.1 | 5/22/2006 | ||||||||
| 3.2 | 8-K | 000-06217 | 3.2 | 1/17/2019 | ||||||||
| 4.1 | 8-K | 000-06217 | 4.1 | 2/13/2020 | ||||||||
| 4.2 | 8-K | 000-06217 | 4.2 | 2/13/2020 | ||||||||
| 4.3 | 8-K | 000-06217 | 4.1 | 3/25/2020 | ||||||||
10.1† | X | |||||||||||
10.2† | 8-K | 000-06217 | 10.1 | 1/22/2020 | ||||||||
10.3† | X | |||||||||||
| 31.1 | X | |||||||||||
| 31.2 | X | |||||||||||
| 32.1 | X | |||||||||||
| 101.INS | XBRL Instance Document - the instance document does not appear in the Interactive Data File because its XBRL tags are embedded within the Inline XBRL document | X | ||||||||||
| 101.SCH | XBRL Taxonomy Extension Schema Document | X | ||||||||||
| 101.CAL | XBRL Taxonomy Extension Calculation Linkbase Document | X | ||||||||||
| 101.DEF | XBRL Taxonomy Extension Definition Linkbase Document | X | ||||||||||
| 101.LAB | XBRL Taxonomy Extension Label Linkbase Document | X | ||||||||||
| 101.PRE | XBRL Taxonomy Extension Presentation Linkbase Document | X | ||||||||||
| 104 | Cover Page Interactive Data File - formatted in Inline XBRL and included as Exhibit 101 | X | ||||||||||
† Management contracts or compensation plans or arrangements in which directors or executive officers are eligible to participate.
| OTHER KEY INFORMATION | 44 | |
FORM 10-Q CROSS-REFERENCE INDEX
| Item Number | Item | |
| Part I - Financial Information | ||
| Item 1. | Financial Statements | |
| Item 2. | Management's Discussion and Analysis of Financial Condition and Results of Operations: | |
| Results of operations | ||
| Liquidity and capital resources | ||
| Off-balance sheet arrangements | (a) | |
| Contractual obligations | Page 37 | |
| Item 3. | Quantitative and Qualitative Disclosures About Market Risk | Page 37 |
| Item 4. | Controls and Procedures | Page 43 |
| Part II - Other Information | ||
| Item 1. | Legal Proceedings | |
| Item 1A. | Risk Factors | |
| Item 2. | Unregistered Sales of Equity Securities and Use of Proceeds | Page 43 |
| Item 3. | Defaults Upon Senior Securities | Not applicable |
| Item 4. | Mine Safety Disclosures | Not applicable |
| Item 5. | Other Information | Not applicable |
| Item 6. | Exhibits | Page 44 |
| Signatures | Page 46 | |
| OTHER KEY INFORMATION | 45 | |
| Incorporated by Reference | ||||||||||||
Exhibit Number | Exhibit Description | Form | File Number | Exhibit | Filing Date | Filed or Furnished Herewith | ||||||
| 3.1 | 8-K | 000-06217 | 3.1 | 5/22/2006 | ||||||||
| 3.2 | 8-K | 000-06217 | 3.2 | 1/26/2016 | ||||||||
| 4.1 | 8-K | 000-06217 | 4.1 | 8/14/2017 | ||||||||
| 12.1 | X | |||||||||||
| 31.1 | X | |||||||||||
| 31.2 | X | |||||||||||
| 32.1 | X | |||||||||||
| 101.INS | XBRL Instance Document | X | ||||||||||
| 101.SCH | XBRL Taxonomy Extension Schema Document | X | ||||||||||
| 101.CAL | XBRL Taxonomy Extension Calculation Linkbase Document | X | ||||||||||
| 101.DEF | XBRL Taxonomy Extension Definition Linkbase Document | X | ||||||||||
| 101.LAB | XBRL Taxonomy Extension Label Linkbase Document | X | ||||||||||
| 101.PRE | XBRL Taxonomy Extension Presentation Linkbase Document | X | ||||||||||
SIGNATURES
Pursuant to the requirements of the Securities Exchange Act of 1934, the registrant has duly caused this report to be signed on its behalf by the undersigned thereunto duly authorized.
| INTEL CORPORATION (Registrant) | |||||
| Date: | By: | /s/ GEORGE S. DAVIS | |||
| Executive Vice President, Chief Financial Officer and Principal Financial Officer | |||||
| Date: | April 23, 2020 | By: | /s/ KEVIN T. MCBRIDE | ||
| Kevin T. McBride | |||||
| Vice President of Finance, Corporate Controller and Principal Accounting Officer | |||||
| 46 | |