UNITED STATES SECURITIES AND EXCHANGE COMMISSION
Washington, D.C. 20549
FORM 10-Q
(Mark One)
| | | | | | | | | | | |
| | ☑ | QUARTERLY REPORT PURSUANT TO SECTION 13 OR 15(d) OF THE SECURITIES EXCHANGE ACT OF 1934 |
| | For the quarterly period ended | April 1, 2023March 30, 2024 |
or
| | | | | | | | |
| | ☐ | TRANSITION REPORT PURSUANT TO SECTION 13 OR 15(d) OF THE SECURITIES EXCHANGE ACT OF 1934 |
| | For the transition period from to |
Commission File Number: 000-06217
INTEL CORPORATION
(Exact name of registrant as specified in its charter)
| | | | | | | | | | | | | | |
| Delaware | | | 94-1672743 |
| (State or other jurisdiction of incorporation or organization) | | (I.R.S. Employer Identification No.) |
| | | | |
| 2200 Mission College Boulevard, | Santa Clara, | California | | 95054-1549 |
| (Address of principal executive offices) | | (Zip Code) |
(408) 765-8080
(Registrant’s telephone number, including area code)
N/A
(Former name, former address and former fiscal year, if changed since last report)
Securities registered pursuant to Section 12(b) of the Act:
| | | | | | | | |
| Title of each class | Trading symbol(s) | Name of each exchange on which registered |
| Common stock, $0.001 par value | INTC | Nasdaq Global Select Market |
Indicate by check mark whether the registrant (1) has filed all reports required to be filed by Section 13 or 15(d) of the Securities Exchange Act of 1934 during the preceding 12 months (or for such shorter period that the registrant was required to file such reports), and (2) has been subject to such filing requirements for the past 90 days. Yes ☑ No ¨
Indicate by check mark whether the registrant has submitted electronically every Interactive Data File required to be submitted pursuant to Rule 405 of Regulation S-T (§232.405 of this chapter) during the preceding 12 months (or for such shorter period that the registrant was required to submit such files). Yes ☑ No ¨
Indicate by check mark whether the registrant is a large accelerated filer, an accelerated filer, a non-accelerated filer, a smaller reporting company, or an emerging growth company. See the definitions of “large accelerated filer,” “accelerated filer,” “smaller reporting company,” and "emerging growth company" in Rule 12b-2 of the Exchange Act.
| | | | | | | | | | | | | | | | | |
| Large accelerated filer | | Accelerated filer | | Non-accelerated filer | | Smaller reporting company | Emerging growth company |
☑
| | ¨ | | ¨ | | ☐ | ☐ |
| | | | | | | |
If an emerging growth company, indicate by check mark if the registrant has elected not to use the extended transition period for complying with any new or revised financial accounting standards provided pursuant to Section 13(a) of the Exchange Act. ¨
Indicate by check mark whether the registrant is a shell company (as defined in Rule 12b-2 of the Exchange Act). Yes ☐ No ☑
As of April 21, 2023,19, 2024, the registrant had outstanding 4,1714,257 million shares of common stock.
Table of Contents
Organization of Our Form 10-Q
The order and presentation of content in our Form 10-Q differs from the traditional SEC Form 10-Q format. Our format is designed to improve readability and better present how we organize and manage our business. See "Form 10-Q Cross-Reference Index" within Risk Factors and Other Key Information for a cross-reference index to the traditional SEC Form 10-Q format.
We have defined certain terms and abbreviations used throughout our Form 10-Q in "Key Terms" within the Consolidated Condensed Financial Statements and Supplemental Details.
The preparation of our Consolidated Condensed Financial Statements is in conformity with US GAAP. Our Form 10-Q includes key metrics that we use to measure our business, some of which are non-GAAP measures. See "Non-GAAP Financial Measures" within MD&A for an explanation of these measures and why management uses them and believes they provide investors with useful supplemental information.
| | | | | | | | | | | |
| | | Page |
| Forward-Looking Statements | |
| Availability of Company Information | |
| A Quarter in Review | |
| Consolidated Condensed Financial Statements and Supplemental Details | |
| Consolidated Condensed Statements of Income | |
| Consolidated Condensed Statements of Comprehensive Income | |
| Consolidated Condensed Balance Sheets | |
| Consolidated Condensed Statements of Cash Flows | |
| Consolidated Condensed Statements of Stockholders' Equity | |
| Notes to Consolidated Condensed Financial Statements | |
| Key Terms | |
| | | |
| Management's Discussion and Analysis (MD&A) | |
| | |
| | |
| Segment Trends and Results | |
| | | |
| | | |
| | | |
| | | |
| | | |
| Consolidated Condensed Results of Operations | |
| Liquidity and Capital Resources | |
| | |
| | |
| Non-GAAP Financial Measures | |
| | | |
| Risk Factors and Other Key Information | |
| | |
| Risk Factors | |
| | |
| Quantitative and Qualitative Disclosures About Market Risk | |
| | Risk Factors | |
| Controls and Procedures | |
| | |
| Issuer Purchases of Equity Securities | |
| Rule 10b5-1 Trading Arrangements | |
| Disclosure Pursuant to Section 13(r) of the Securities Exchange Act of 1934 | |
| Exhibits | |
| Form 10-Q Cross-Reference Index | |
Forward-Looking Statements
This Form 10-Q contains forward-looking statements that involve a number of risks and uncertainties. Words such as "accelerate," "achieve," "aim," "ambitions," "anticipate," "believe," "committed," "continue," "could," "designed," "estimate," "expect," "forecast," "future," "goals," "grow," "guidance," "intend," "likely," "may," "might," "milestones,""accelerate", "achieve", "aim", "ambitions", "anticipate", "believe", "committed", "continue", "could", "designed", "estimate", "expect", "forecast", "future", "goals", "grow", "guidance", "intend", "likely", "may", "might", "milestones", "next generation," "objective,"generation", "objective", "on track," "opportunity," "outlook," "pending," "plan," "position," "potential," "possible," "predict," "progress," "ramp," "roadmap," "seeks," "should," "strive," "targets,"track", "opportunity", "outlook", "pending", "plan", "position", "possible", "potential", "predict", "progress", "ramp", "roadmap", "seek", "should", "strive", "targets", "to be," "upcoming," "will," "would,"be", "upcoming", "will", "would", and variations of such words and similar expressions are intended to identify such forward-looking statements, which may include statements regarding:
•our business plans and strategy and anticipated benefits therefrom, including with respect to our IDM 2.0 strategy, ourSmart Capital strategy, partnership with Brookfield, the transition to an internal foundry model, updated reporting structure, and updates to our reporting structure;AI strategy;
•projections of our future financial performance, including future revenue, gross margins, capital expenditures, and cash flows;
•projected costs and yield trends;
•future cash requirements, and the availability, uses, sufficiency, and cost of capital resources, and sources of funding, including for future capital and R&D investments credit rating expectations, and expectedfor returns to stockholders, such as stock repurchases and dividends;dividends, and credit ratings expectations;
•future products, services, and technologies, and the expected goals, timeline, ramps, progress, availability, production, regulation, and benefits of such products, services, and technologies, including future process nodes and packaging technology, product roadmaps, schedules, future product architectures, expectations regarding process performance, per-watt parity, and metrics, and expectations regarding product and process leadership;
•investment plans and impacts of investment plans, including in the US and abroad;
•internal and external manufacturing plans, including future internal manufacturing volumes, manufacturing expansion plans and the financing therefor, and external foundry usage;
•future production capacity and product supply;
•supply expectations, including regarding constraints, limitations, pricing, and industry shortages;
•plans and goals related to Intel’sIntel's foundry business, including with respect to anticipated customers, future manufacturing capacity and foundry service, offerings, including technology, and IP offerings;
•expected timing and impact of acquisitions, divestitures, and other significant transactions, including statements relating to the completion of our acquisition of Tower Semiconductor Ltd. and the sale of our NAND memory business;
•expected completion and impacts of restructuring activities and cost-saving or efficiency initiatives, including those related to the 2022 Restructuring Program;initiatives;
•future social and environmental performance goals, measures, strategies, and strategies;results;
•our anticipated growth, future market share, and trends in our businesses and operations;
•projected growth and trends in markets relevant to our businesses;
•anticipated trends and impacts related to industry component, substrate, and foundry capacity utilization, shortages, and constraints;
•expectations regarding government incentives;
•future technology trends;trends and developments, such as AI;
•future macro environmental and economic conditions, including regional or global downturns or recessions;
•future responses to and effects of COVID-19, including as to manufacturing, transportation and operational restrictions and disruptions and broader economic conditions;
•geopolitical conditions, including the impacts of Russia's wartensions and conflicts and their potential impact on Ukraine;our business;
•tax- and accounting-related expectations;
•expectations regarding our relationships with certain sanctioned parties; and
•other characterizations of future events or circumstances.
Such statements involve many risks and uncertainties that could cause our actual results to differ materially from those expressed or implied, including:
•changes in demand for our products;
•changes in product mix;
•the complexity and fixed cost nature of our manufacturing operations;including those associated with:
•the high level of competition and rapid technological change in our industry;
•the significant upfrontlong-term and inherently risky investments we are making in R&D and our business, products, technologies, and manufacturing capabilities;facilities that may not realize a favorable return;
•vulnerability tothe complexities and uncertainties in developing and implementing new product development and manufacturing-related risks, including product defects or errata, particularly as we develop next generationsemiconductor products and implement next generationmanufacturing process technologies;
•risks associated with highly complex global supply chain, including from disruptions, delays, trade tensions, or shortages;our ability to time and scale our capital investments appropriately and successfully secure favorable alternative financing arrangements and government grants;
•sales-related risks, including customer concentrationimplementing new business strategies and the use of distributorsinvesting in new businesses and other third parties;technologies;
•potential security vulnerabilitieschanges in demand for our products;
•macroeconomic conditions and geopolitical tensions and conflicts, including geopolitical and trade tensions between the US and China, the impacts of Russia's war on Ukraine, tensions and conflict affecting Israel and the Middle East, and rising tensions between mainland China and Taiwan;
•the evolving market for products with AI capabilities;
•our complex global supply chain, including from disruptions, delays, trade tensions and conflicts, or shortages;
•product defects, errata and other product issues, particularly as we develop next-generation products and implement next-generation manufacturing process technologies;
•potential security vulnerabilities in our products;
•increasing and evolving cybersecurity threats and privacy risks;
•investment and transaction risk;
•IP risks and risks associated withincluding related litigation and regulatory proceedings;
•the need to attract, retain, and motivate key talent;
•strategic transactions and investments;
•sales-related risks, including customer concentration and the use of distributors and other third parties;
•our significantly reduced return of capital in recent years;
•our debt obligations and our ability to access sources of capital;
•complex and evolving regulatorylaws and legal requirementsregulations across many jurisdictions;
•geopoliticalfluctuations in currency exchange rates;
•changes in our effective tax rate;
•catastrophic events;
•environmental, health, safety, and international trade conditions;product regulations;
•our debt obligations;
•risks of large scale global operations;.
•macroeconomic conditions;
•impacts of the COVID-19 or similar such pandemic;initiatives and new legal requirements with respect to corporate responsibility matters; and
•other risks and uncertainties described in this report, our 20222023 Form 10-K and our other filings with the SEC.
Given these risks and uncertainties, readers are cautioned not to place undue reliance on such forward-looking statements. Readers are urged to carefully review and consider the various disclosures made in this Form 10-Q and in other documents we file from time to time with the SEC that disclose risks and uncertainties that may affect our business.
Unless specifically indicated otherwise, the forward-looking statements in this Form 10-Q do not reflect the potential impact of any divestitures, mergers, acquisitions, or other business combinations that have not been completed as of the date of this filing. In addition, the forward-looking statements in this Form 10-Q are based on management's expectations as of the date of this filing, unless an earlier date is specified, including expectations based on third-party information and projections that management believes to be reputable. We do not undertake, and expressly disclaim any duty, to update such statements, whether as a result of new information, new developments, or otherwise, except to the extent that disclosure may be required by law.
Availability of Company Information
We use our Investor Relations website, www.intc.com, as a routine channel for distribution of important, and often material, information about us, including our quarterly and annual earnings results and presentations, press releases, announcements, information about upcoming webcasts, analyst presentations, and investor days, archives of these events, financial information, corporate governance practices, and corporate responsibility information. We do not distributealso post our financial results via a news wire service.filings on this website the same day they are electronically filed with, or furnished to, the SEC, including our annual and quarterly reports on Forms 10-K and 10-Q and current reports on Form 8-K, our proxy statements, and any amendments to those reports. All such information is available on our Investor Relations website free of charge. Our Investor Relations website allows interested persons to sign up to automatically receive e-mail alerts when we post financial information and issue press releases, and to receive information about upcoming events. We encourage interested persons to follow our Investor Relations website in addition to our filings with the SEC to timely receive information about the company.
Intel, the Intel logo, Intel Core, and XeonAltera are trademarks of Intel Corporation or its subsidiaries in the US and/or other countries.
* Other names and brands may be claimed as the property of others.
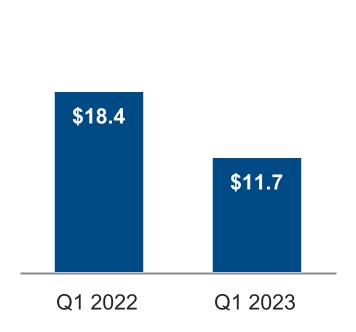
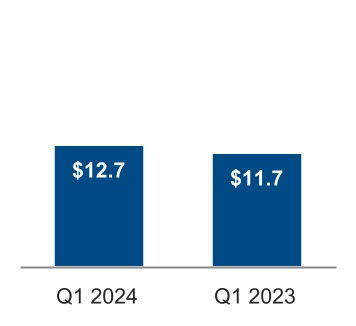
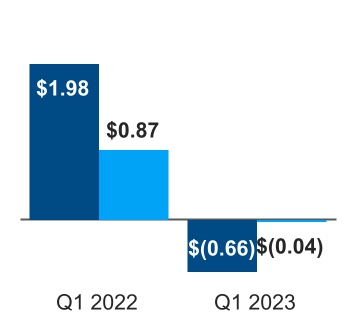
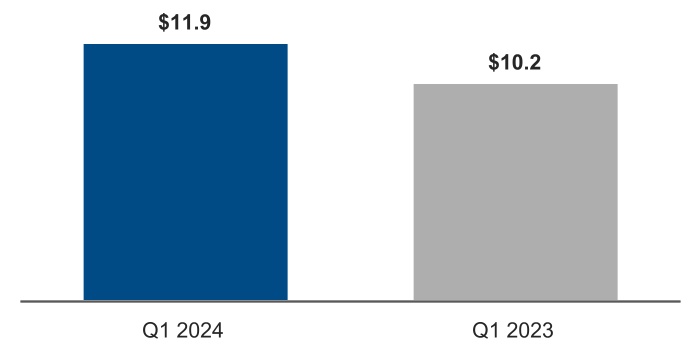
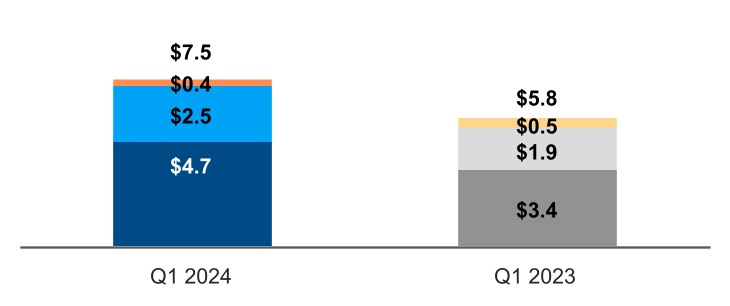
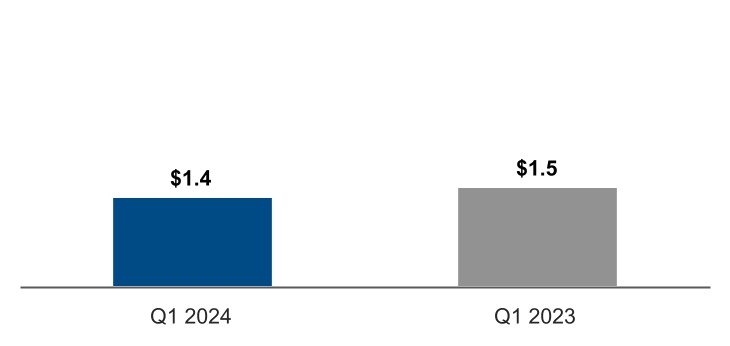
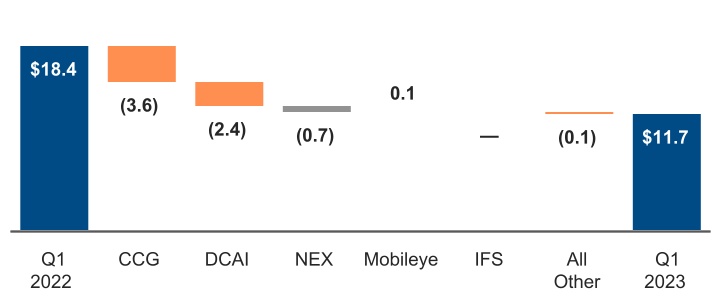
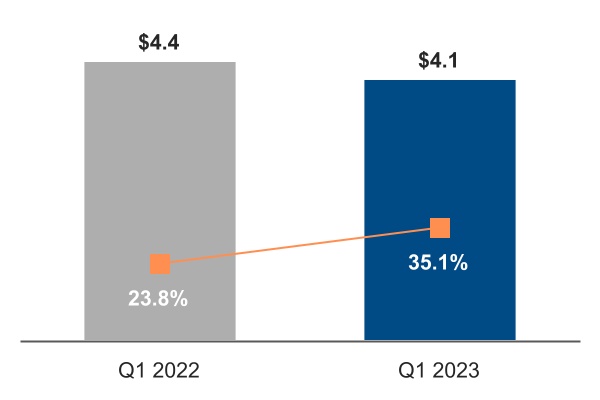
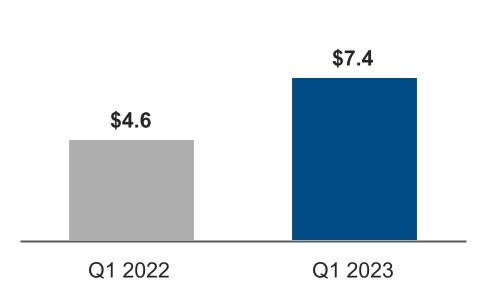
Total revenue of $11.7$12.7 billion was down $6.6up $1.0 billion or 36%9% from Q1 2022,2023, as CCG revenue decreased 38%increased 31%, DCAI revenue decreased 39%increased 5%, and NEX revenue decreased 30%8%. CCG revenue increased primarily due to higher notebook and desktop volumes as customer inventory levels normalized compared to higher levels in Q1 2023 results were impacted2023. DCAI revenue increased due to higher server ASPs primarily due to a lower mix of hyperscale customer-related revenue and a higher mix of high core count products, partially offset by lower server volume due to lower demand in a competitive environment and a higher mix of high core count products. NEX revenue decreased primarily due to 5G customers tempering purchases to reduce existing inventories, partially offset by higher Edge and Network revenue. Altera, an uncertain macroeconomic environment, with slowing consumerIntel Company (previously Intel's Programmable Solutions Group) and enterprise demand, persistent inflation, and higher interest rates, that we believe impacts our target markets and creates a high level of uncertainty with our customers. We believe CCG, DCAI, and NEXMobileye revenue decreased as customers among others, tempered purchases to reduce their existing inventories and adjust to the macroeconomic uncertainty. CCG revenue decreased due to lower notebook and desktop volumes on lower demand, while notebook ASPs decreased due to a higher mix of small core and older generation products. DCAI revenue decreased due to lower server volume resulting from a softening data center market, partially offset by an increase in revenue from the FPGA product line. NEX revenue decreased due to lower demand for Edge, Network Xeon, and Ethernet products.inventories.
| | | | | | | | | | | | | | | | | | | | |
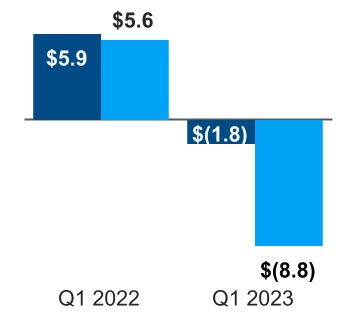
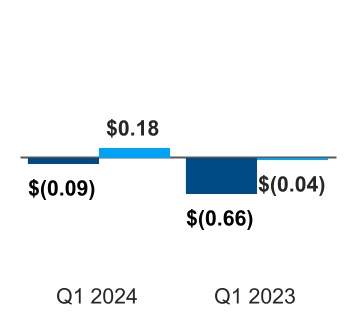
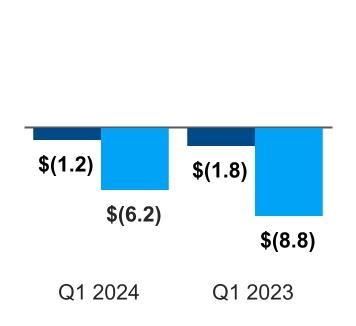
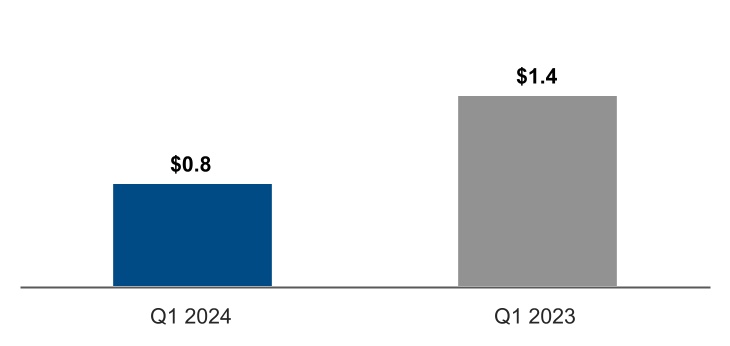
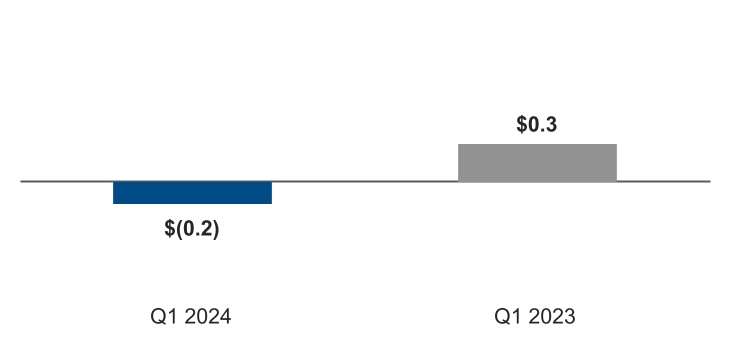
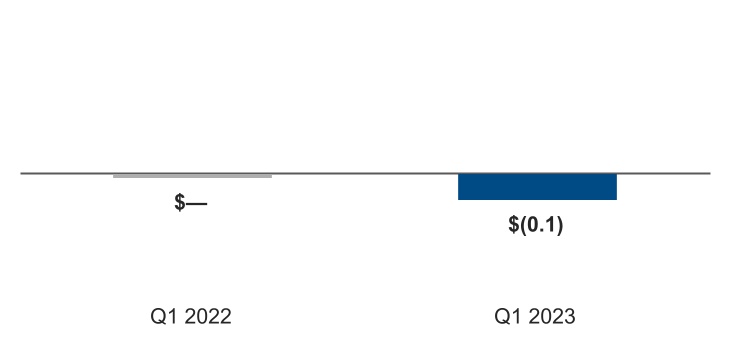
| Revenue | | Gross Margin | | Diluted EPS attributable to Intel | | Cash Flows |
■ GAAP $B | | ■ GAAP ■ Non-GAAP | | ■ GAAP ■ Non-GAAP | | ■ Operating Cash Flow $B ■ Adjusted Free Cash Flow $B |
| | | | | | | | | | | | | | | | | | | | | | | | | | | | | | | | | | | | | | | | | | | | |
| | | | | | |
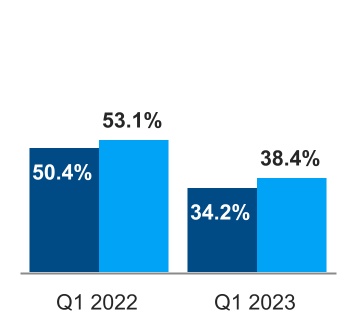
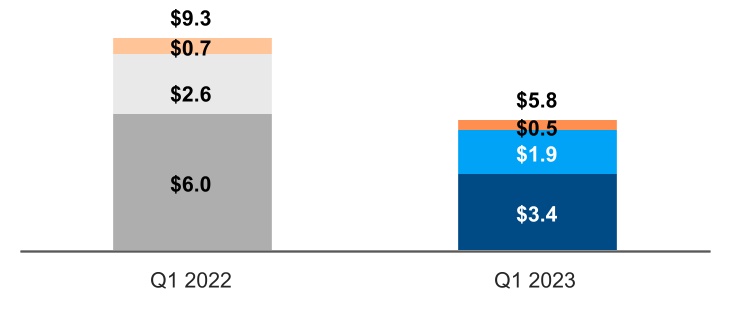
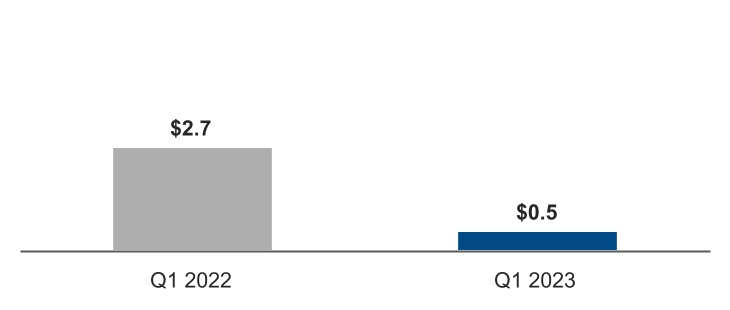
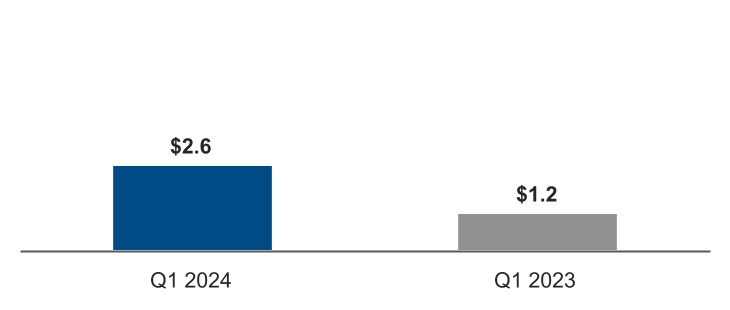
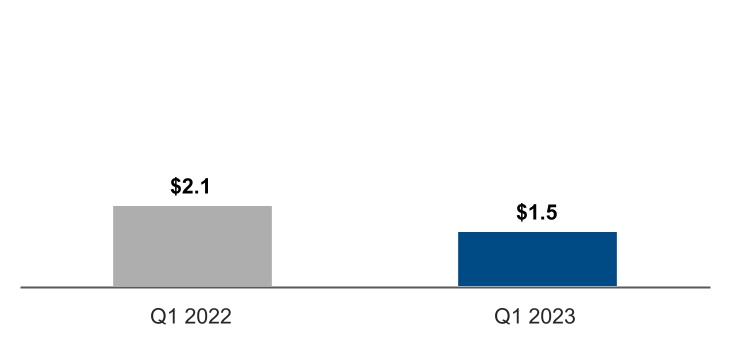
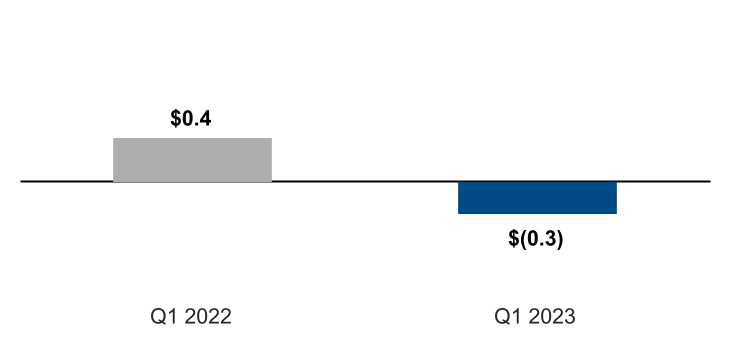
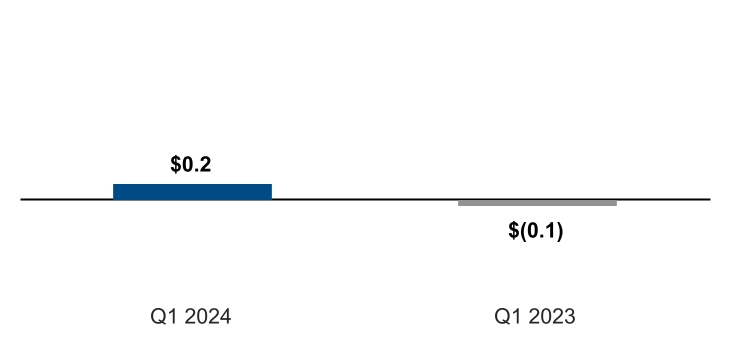
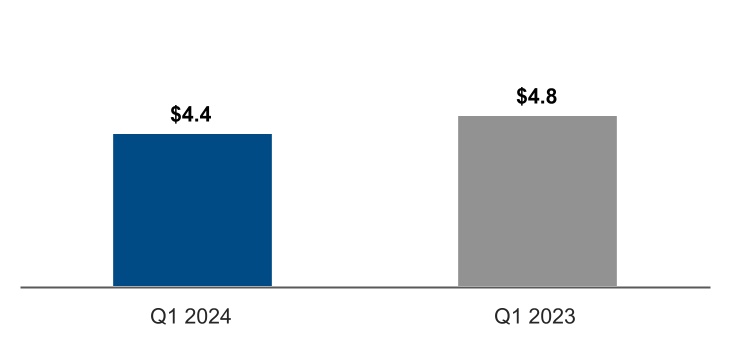
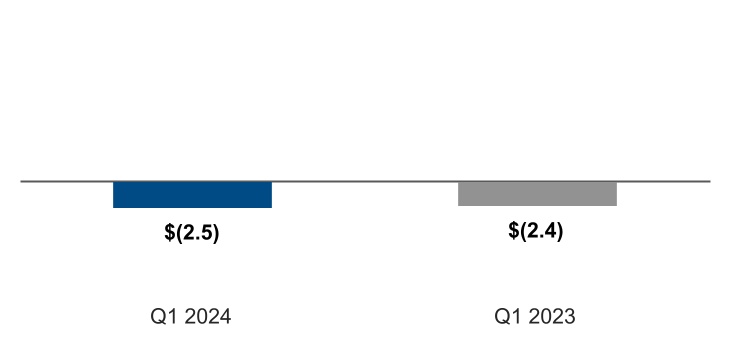
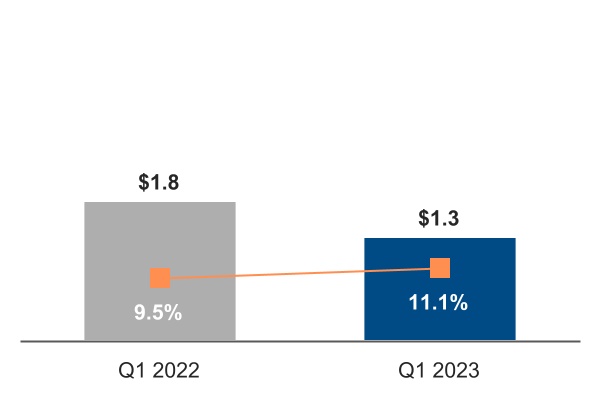
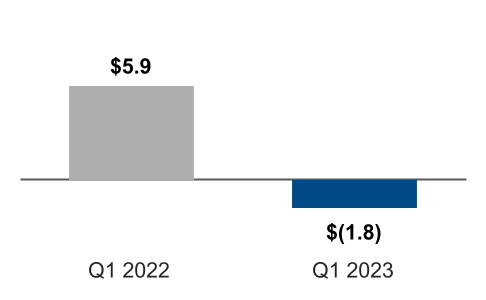
| $11.7B | | 34.2% | | 38.4% | | $(0.66) | | $(0.04) | | $(1.8)B | | $(8.8)B |
| GAAP | | GAAP | | non-GAAP1 | | GAAP | | non-GAAP1 | | GAAP | | non-GAAP1 |
| Revenue down $6.6B or 36% from Q1 2022 | | Gross margin down 16.2 ppts from Q1 2022 | | Gross margin down 14.7 ppts from Q1 2022 | | Diluted EPS down $2.64 or 133% from Q1 2022 | | Diluted EPS down $0.91 or 105% from Q1 2022 | | Operating cash flow down $7.7B or 131% from Q1 2022 | | Adjusted free cash flow down $14.4B or 257% from Q1 2022 |
| | | | | | | | | | | | |
| Lower revenue in CCG, DCAI, and NEX. | | Lower GAAP gross margin from lower revenue, higher unit cost, and higher excess capacity charges, partially offset by a decrease in product ramp costs. | | Lower GAAP EPS from lower gross margin, and lack of one-time benefits recognized in Q1 2022 (gains on the sale of McAfee and the NAND divestiture, and the benefit from the EC fine reversal). | | Lower operating cash flow driven primarily by a net operating loss. |
| | | | | | | | | | | | | | | | | | | | | | | | | | | | | | | | | | | | | | | | | | | | |
| | | | | | |
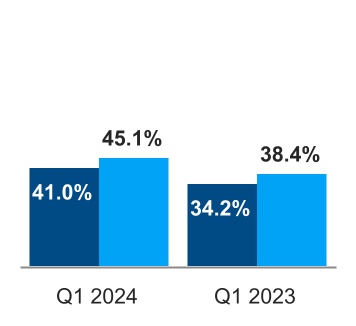
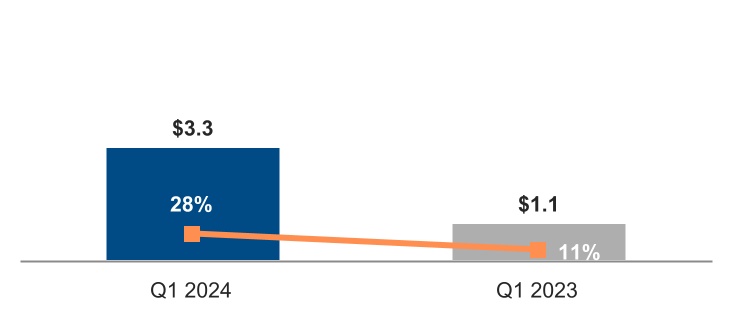
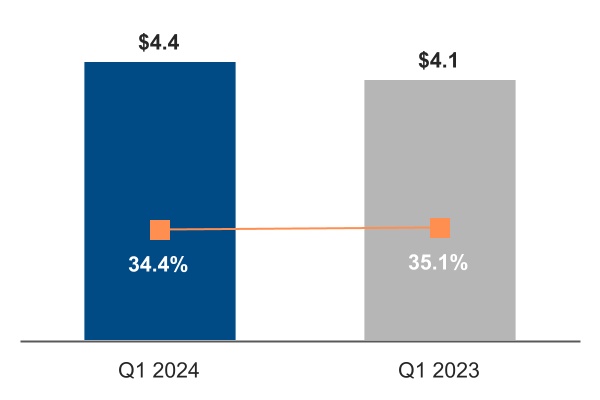
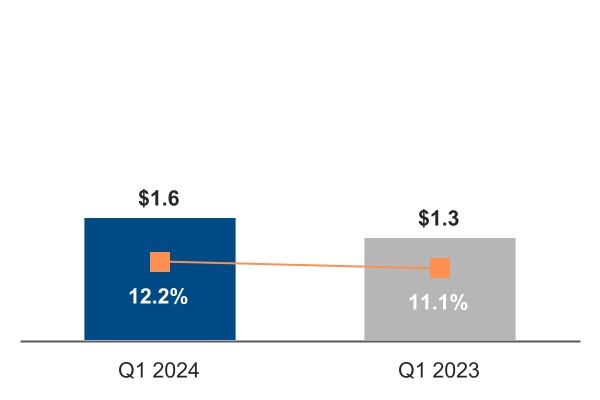
| $12.7B | | 41.0% | | 45.1% | | $(0.09) | | $0.18 | | $(1.2)B | | $(6.2)B |
| GAAP | | GAAP | | non-GAAP1 | | GAAP | | non-GAAP1 | | GAAP | | non-GAAP1 |
| Revenue up $1.0B or 9% from Q1 2023 | | Gross margin up 6.8 ppts from Q1 2023 | | Gross margin up 6.7 ppts from Q1 2023 | | Diluted EPS attributable to Intel up $0.57 or 86% from Q1 2023 | | Diluted EPS attributable to Intel up $0.22 from Q1 2023 | | Operating cash flow up $0.6B or 31% from Q1 2023 | | Adjusted free cash flow up $2.6B or 30% from Q1 2023 |
| | | | | | | | | | | | |
| Higher CCG revenue. | | Higher GAAP gross margin from higher revenue and lower period charges, partially offset by higher unit cost. | | Higher GAAP EPS attributable to Intel from higher gross margin and a tax benefit compared to a tax expense in Q1 2023, partially offset by higher operating expenses. | | Lower cash used for operating activities driven primarily by a reduced net operating loss, partially offset by certain cash unfavorable changes in working capital. |
Key Developments
▪CCG introducedWe launched Intel Foundry as a more sustainable systems foundry business designed for the 13th Gen Intel® Core™ mobile processor family, led by the launch of the first 24-core processorAI era and announced an expanded process roadmap, which includes evolutions for a laptop,Intel 3, Intel 18A, and introduced the new Intel vPro® platform powered by the full lineup of 13th Gen Intel Core processors.14A process technologies.
▪DCAI launchedThe U.S. Department of Commerce has proposed up to $8.5 billion in direct funding and to make up to $11.0 billion in loans available under the 4th Gen Intel® Xeon® Scalable processors, a critical part ofCHIPS and Science Act to help advance our heterogeneous hardwaremanufacturing and software portfolio to accelerate real-world workloads, including AI,research and announced the 5th Gen Xeon Scalable processor.development projects at sites in Arizona, New Mexico, Ohio, and Oregon.
▪NEXWe launched the 4th Gen IntelAltera® Xeon® Scalable processors with Intel® vRAN Boost,as a new general-purpose chip that fully integrates Layer 1 acceleration intostandalone FPGA company, in order to deliver programmable solutions and accessible AI across a broad range of applications in the Xeon SoCcloud, network, and is designed to eliminate the need for external accelerator cards.edge markets.
▪IFS announced a multigeneration agreement with Arm to enable chip designers to build low-power compute system-on-chips (SoCs) onWe opened Fab 9 in New Mexico, producing the Intel 18A process.world's most advanced packaging solutions at scale.
1 See "Non-GAAP Financial Measures" within MD&A.
| | | | | |
| Consolidated Condensed Statements of Income | |
| |
| | | |
| | | | | Three Months Ended | |
| (In Millions, Except Per Share Amounts; Unaudited) | (In Millions, Except Per Share Amounts; Unaudited) | | Apr 1, 2023 | | Apr 2, 2022 | |
| (In Millions, Except Per Share Amounts; Unaudited) | |
| (In Millions, Except Per Share Amounts; Unaudited) | |
| Net revenue | |
| Net revenue | |
| Net revenue | Net revenue | | $ | 11,715 | | | $ | 18,353 | | |
| Cost of sales | Cost of sales | | 7,707 | | | 9,109 | | |
| Cost of sales | |
| Cost of sales | |
| Gross margin | |
| Gross margin | |
| Gross margin | Gross margin | | 4,008 | | | 9,244 | | |
| Research and development | Research and development | | 4,109 | | | 4,362 | | |
| Research and development | |
| Research and development | |
| Marketing, general, and administrative | |
| Marketing, general, and administrative | |
| Marketing, general, and administrative | Marketing, general, and administrative | | 1,303 | | | 1,752 | | |
| Restructuring and other charges | Restructuring and other charges | | 64 | | | (1,211) | | |
| Restructuring and other charges | |
| Restructuring and other charges | |
| Operating expenses | |
| Operating expenses | |
| Operating expenses | Operating expenses | | 5,476 | | | 4,903 | | |
| Operating income (loss) | Operating income (loss) | | (1,468) | | | 4,341 | | |
| Operating income (loss) | |
| Operating income (loss) | |
| Gains (losses) on equity investments, net | |
| Gains (losses) on equity investments, net | |
| Gains (losses) on equity investments, net | Gains (losses) on equity investments, net | | 169 | | | 4,323 | | |
| Interest and other, net | Interest and other, net | | 141 | | | 997 | | |
| Interest and other, net | |
| Interest and other, net | |
| Income (loss) before taxes | Income (loss) before taxes | | (1,158) | | | 9,661 | | |
| Provision for taxes | | 1,610 | | | 1,548 | | |
| Income (loss) before taxes | |
| Income (loss) before taxes | |
| Provision for (benefit from) taxes | |
| Provision for (benefit from) taxes | |
| Provision for (benefit from) taxes | |
| Net income (loss) | |
| Net income (loss) | |
| Net income (loss) | Net income (loss) | | (2,768) | | | 8,113 | | |
| Less: Net income (loss) attributable to non-controlling interests | Less: Net income (loss) attributable to non-controlling interests | | (10) | | | — | | |
| Less: Net income (loss) attributable to non-controlling interests | |
| Less: Net income (loss) attributable to non-controlling interests | |
| Net income (loss) attributable to Intel | |
| Net income (loss) attributable to Intel | |
| Net income (loss) attributable to Intel | Net income (loss) attributable to Intel | | $ | (2,758) | | | $ | 8,113 | | |
| Earnings (loss) per share attributable to Intel—basic | Earnings (loss) per share attributable to Intel—basic | | $ | (0.66) | | | $ | 1.99 | | |
| Earnings (loss) per share attributable to Intel—basic | |
| Earnings (loss) per share attributable to Intel—basic | |
| Earnings (loss) per share attributable to Intel—diluted | |
| Earnings (loss) per share attributable to Intel—diluted | |
| Earnings (loss) per share attributable to Intel—diluted | Earnings (loss) per share attributable to Intel—diluted | | $ | (0.66) | | | $ | 1.98 | | |
| | Weighted average shares of common stock outstanding: | Weighted average shares of common stock outstanding: | | | | | |
| | Weighted average shares of common stock outstanding: | |
| | Weighted average shares of common stock outstanding: | |
| Basic | |
| Basic | |
| Basic | Basic | | 4,154 | | | 4,079 | | |
| Diluted | Diluted | | 4,154 | | | 4,107 | | |
| Diluted | |
| Diluted | |
See accompanying notes.
| | | | | | | | | | | |
| Financial Statements | Consolidated Condensed Statements of Income | 4 |
| | | | | |
| Consolidated Condensed Statements of Comprehensive Income | |
| |
| | | Three Months Ended | |
| | Three Months Ended | |
| | Three Months Ended | |
| (In Millions; Unaudited) | |
| (In Millions; Unaudited) | |
| (In Millions; Unaudited) | |
| Net income (loss) | |
| Net income (loss) | |
| Net income (loss) | |
| Changes in other comprehensive income (loss), net of tax: | |
| Changes in other comprehensive income (loss), net of tax: | |
| Changes in other comprehensive income (loss), net of tax: | |
| | | Three Months Ended | |
| (In Millions; Unaudited) | | Apr 1, 2023 | | Apr 2, 2022 | |
| Net income (loss) | | $ | (2,768) | | | $ | 8,113 | | |
| Changes in other comprehensive income, net of tax: | | | | | |
| Net unrealized holding gains (losses) on derivatives | |
| | Net unrealized holding gains (losses) on derivatives | |
| | Net unrealized holding gains (losses) on derivatives | Net unrealized holding gains (losses) on derivatives | | 142 | | | (115) | | |
| Actuarial valuation and other pension benefits (expenses), net | Actuarial valuation and other pension benefits (expenses), net | | 1 | | | 18 | | |
| Actuarial valuation and other pension benefits (expenses), net | |
| Actuarial valuation and other pension benefits (expenses), net | |
| Translation adjustments and other | |
| Translation adjustments and other | |
| Translation adjustments and other | Translation adjustments and other | | — | | | (25) | | |
| Other comprehensive income (loss) | Other comprehensive income (loss) | | 143 | | | (122) | | |
| Other comprehensive income (loss) | |
| Other comprehensive income (loss) | |
| Total comprehensive income (loss) | |
| Total comprehensive income (loss) | |
| Total comprehensive income (loss) | Total comprehensive income (loss) | | (2,625) | | | 7,991 | | |
| Less: comprehensive income (loss) attributable to non-controlling interests | Less: comprehensive income (loss) attributable to non-controlling interests | | (10) | | | — | | |
| Less: comprehensive income (loss) attributable to non-controlling interests | |
| Less: comprehensive income (loss) attributable to non-controlling interests | |
| Total comprehensive income (loss) attributable to Intel | Total comprehensive income (loss) attributable to Intel | | $ | (2,615) | | | $ | 7,991 | | |
| Total comprehensive income (loss) attributable to Intel | |
| Total comprehensive income (loss) attributable to Intel | |
See accompanying notes.
| | | | | | | | | | | |
| Financial Statements | Consolidated Condensed Statements of Comprehensive Income | 5 |
| | | | | |
| Consolidated Condensed Balance Sheets | |
| |
| | (In Millions; Unaudited) | (In Millions; Unaudited) | | Apr 1, 2023 | | Dec 31, 2022 | (In Millions; Unaudited) | | Mar 30, 2024 | | Dec 30, 2023 |
| | Assets | Assets | |
| Assets | |
| Assets | |
| Current assets: | Current assets: | |
| Current assets: | |
| Current assets: | |
| Cash and cash equivalents | |
| Cash and cash equivalents | |
| Cash and cash equivalents | Cash and cash equivalents | | $ | 8,232 | | | $ | 11,144 | |
| Short-term investments | Short-term investments | | 19,302 | | | 17,194 | |
| | Accounts receivable, net | Accounts receivable, net | | 3,847 | | | 4,133 | |
| Accounts receivable, net | |
| Accounts receivable, net | |
| Inventories | Inventories | | 12,993 | | | 13,224 | |
| | Other current assets | Other current assets | | 3,940 | | | 4,712 | |
| Other current assets | |
| Other current assets | |
| Total current assets | Total current assets | | 48,314 | | | 50,407 | |
| | Property, plant and equipment, net of accumulated depreciation of $94,550 ($93,386 as of December 31, 2022) | | 85,734 | | | 80,860 | |
| Property, plant, and equipment, net of accumulated depreciation of $99,315 ($98,010 as of December 30, 2023) | |
| Property, plant, and equipment, net of accumulated depreciation of $99,315 ($98,010 as of December 30, 2023) | |
| Property, plant, and equipment, net of accumulated depreciation of $99,315 ($98,010 as of December 30, 2023) | |
| Equity investments | Equity investments | | 6,029 | | | 5,912 | |
| | Goodwill | |
| Goodwill | |
| Goodwill | Goodwill | | 27,591 | | | 27,591 | |
| Identified intangible assets, net | Identified intangible assets, net | | 5,567 | | | 6,018 | |
| Other long-term assets | Other long-term assets | | 12,068 | | | 11,315 | |
| Total assets | Total assets | | $ | 185,303 | | | $ | 182,103 | |
| | Liabilities and stockholders’ equity | Liabilities and stockholders’ equity | |
| Liabilities and stockholders’ equity | |
| Liabilities and stockholders’ equity | |
| Current liabilities: | Current liabilities: | |
| Current liabilities: | |
| Current liabilities: | |
| Short-term debt | |
| Short-term debt | |
| Short-term debt | Short-term debt | | $ | 1,437 | | | $ | 4,367 | |
| Accounts payable | Accounts payable | | 8,083 | | | 9,595 | |
| Accrued compensation and benefits | Accrued compensation and benefits | | 2,497 | | | 4,084 | |
| | Income taxes payable | Income taxes payable | | 4,046 | | | 2,251 | |
| | Income taxes payable | |
| | Income taxes payable | |
| Other accrued liabilities | Other accrued liabilities | | 11,330 | | | 11,858 | |
| Total current liabilities | Total current liabilities | | 27,393 | | | 32,155 | |
| | Debt | Debt | | 48,836 | | | 37,684 | |
| Debt | |
| Debt | |
| | Long-term income taxes payable | | 3,831 | | | 3,796 | |
| | | Other long-term liabilities | Other long-term liabilities | | 4,840 | | | 5,182 | |
| Contingencies (Note 12) | |
| | Other long-term liabilities | |
| | Other long-term liabilities | |
| Contingencies (Note 13) | | Contingencies (Note 13) | | |
| | Stockholders’ equity: | Stockholders’ equity: | |
| Stockholders’ equity: | |
| Stockholders’ equity: | |
| | Common stock and capital in excess of par value, 4,171 issued and outstanding (4,137 issued and outstanding as of December 31, 2022) | | 32,829 | | | 31,580 | |
| Common stock and capital in excess of par value, 4,257 issued and outstanding (4,228 issued and outstanding as of December 30, 2023) | |
| | Common stock and capital in excess of par value, 4,257 issued and outstanding (4,228 issued and outstanding as of December 30, 2023) | |
| | Common stock and capital in excess of par value, 4,257 issued and outstanding (4,228 issued and outstanding as of December 30, 2023) | |
| Accumulated other comprehensive income (loss) | Accumulated other comprehensive income (loss) | | (419) | | | (562) | |
| Retained earnings | Retained earnings | | 65,649 | | | 70,405 | |
| Total Intel stockholders' equity | Total Intel stockholders' equity | | 98,059 | | | 101,423 | |
| Non-controlling interests | Non-controlling interests | | 2,344 | | | 1,863 | |
| Total stockholders' equity | Total stockholders' equity | | 100,403 | | | 103,286 | |
| Total liabilities and stockholders’ equity | Total liabilities and stockholders’ equity | | $ | 185,303 | | | $ | 182,103 | |
See accompanying notes.
| | | | | | | | | | | |
| Financial Statements | Consolidated Condensed Balance Sheets | 6 |
| | | | | |
| Consolidated Condensed Statements of Cash Flows | |
| |
| | | | | Three Months Ended | | | Three Months Ended |
| (In Millions; Unaudited) | (In Millions; Unaudited) | | Apr 1, 2023 | | Apr 2, 2022 | (In Millions; Unaudited) | | Mar 30, 2024 | | Apr 1, 2023 |
| | Cash and cash equivalents, beginning of period | Cash and cash equivalents, beginning of period | | $ | 11,144 | | | $ | 4,827 | |
| Cash and cash equivalents, beginning of period | |
| Cash and cash equivalents, beginning of period | |
| Cash flows provided by (used for) operating activities: | Cash flows provided by (used for) operating activities: | | | | |
| Net income (loss) | Net income (loss) | | (2,768) | | | 8,113 | |
| Adjustments to reconcile net income to net cash provided by operating activities: | |
| Net income (loss) | |
| Net income (loss) | |
| Adjustments to reconcile net income (loss) to net cash provided by operating activities: | |
| Depreciation | |
| Depreciation | |
| Depreciation | Depreciation | | 1,901 | | | 2,847 | |
| Share-based compensation | Share-based compensation | | 739 | | | 707 | |
| | Restructuring and other charges | Restructuring and other charges | | 55 | | | 17 | |
| Restructuring and other charges | |
| Restructuring and other charges | |
| Amortization of intangibles | Amortization of intangibles | | 465 | | | 501 | |
| (Gains) losses on equity investments, net | (Gains) losses on equity investments, net | | (167) | | | (4,325) | |
| (Gains) losses on divestitures | | — | | | (1,121) | |
| | | Changes in assets and liabilities: | Changes in assets and liabilities: | |
| | Changes in assets and liabilities: | |
| | Changes in assets and liabilities: | |
| Accounts receivable | |
| Accounts receivable | |
| Accounts receivable | Accounts receivable | | 286 | | | 2,384 | |
| Inventories | Inventories | | 231 | | | (1,147) | |
| Accounts payable | Accounts payable | | (771) | | | (128) | |
| Accrued compensation and benefits | Accrued compensation and benefits | | (1,560) | | | (1,884) | |
| | Income taxes | Income taxes | | 1,344 | | | 1,219 | |
| Income taxes | |
| Income taxes | |
| Other assets and liabilities | Other assets and liabilities | | (1,540) | | | (1,292) | |
| Total adjustments | Total adjustments | | 983 | | | (2,222) | |
| Net cash provided by (used for) operating activities | Net cash provided by (used for) operating activities | | (1,785) | | | 5,891 | |
| Cash flows provided by (used for) investing activities: | Cash flows provided by (used for) investing activities: | | | | |
| Additions to property, plant and equipment | | (7,413) | | | (4,604) | |
| Additions to property, plant, and equipment | |
| Additions to property, plant, and equipment | |
| Additions to property, plant, and equipment | |
| | Proceeds from capital-related government incentives | |
| Proceeds from capital-related government incentives | |
| Proceeds from capital-related government incentives | |
| | Purchases of short-term investments | |
| Purchases of short-term investments | |
| Purchases of short-term investments | Purchases of short-term investments | | (16,132) | | | (19,091) | |
| Maturities and sales of short-term investments | Maturities and sales of short-term investments | | 14,173 | | | 10,490 | |
| | Sales of equity investments | | 116 | | | 4,682 | |
| | Proceeds from divestitures | | — | | | 6,544 | |
| | Other investing | Other investing | | 735 | | | (660) | |
| Net cash used for investing activities | | (8,521) | | | (2,639) | |
| | Other investing | |
| | Other investing | |
| Net cash provided by (used for) investing activities | |
| Cash flows provided by (used for) financing activities: | Cash flows provided by (used for) financing activities: | | | | |
| Issuance of commercial paper, net of issuance costs | |
| Issuance of commercial paper, net of issuance costs | |
| Issuance of commercial paper, net of issuance costs | |
| Repayment of commercial paper | Repayment of commercial paper | | (2,930) | | | — | |
| | | Payments on finance leases | |
| | Payments on finance leases | |
| | Payments on finance leases | Payments on finance leases | | (15) | | | (299) | |
| Partner contributions | Partner contributions | | 449 | | | — | |
| | Issuance of long-term debt, net of issuance costs | Issuance of long-term debt, net of issuance costs | | 10,968 | | | — | |
| Issuance of long-term debt, net of issuance costs | |
| Issuance of long-term debt, net of issuance costs | |
| | Proceeds from sales of common stock through employee equity incentive plans | |
| Proceeds from sales of common stock through employee equity incentive plans | |
| Proceeds from sales of common stock through employee equity incentive plans | Proceeds from sales of common stock through employee equity incentive plans | | 659 | | | 589 | |
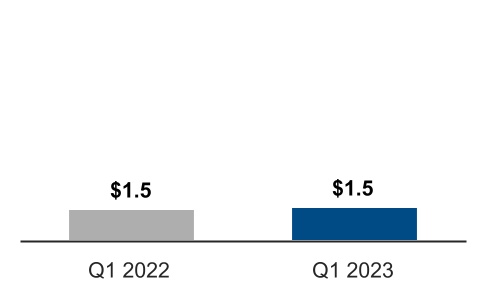
| | Payment of dividends to stockholders | Payment of dividends to stockholders | | (1,512) | | | (1,487) | |
| | Payment of dividends to stockholders | |
| | Payment of dividends to stockholders | |
| | Other financing | |
| | Other financing | |
| | | Other financing | Other financing | | (225) | | | (667) | |
| Net cash provided by (used for) financing activities | Net cash provided by (used for) financing activities | | 7,394 | | | (1,864) | |
| | Net increase (decrease) in cash and cash equivalents | Net increase (decrease) in cash and cash equivalents | | (2,912) | | | 1,388 | |
| Net increase (decrease) in cash and cash equivalents | |
| Net increase (decrease) in cash and cash equivalents | |
| Cash and cash equivalents, end of period | Cash and cash equivalents, end of period | | $ | 8,232 | | | $ | 6,215 | |
| | Supplemental disclosures: | Supplemental disclosures: | |
| Acquisition of property, plant and equipment included in accounts payable and accrued liabilities | | $ | 4,711 | | | $ | 2,949 | |
| Supplemental disclosures: | |
| Supplemental disclosures: | |
| Acquisition of property, plant, and equipment included in accounts payable and accrued liabilities | |
| Acquisition of property, plant, and equipment included in accounts payable and accrued liabilities | |
| Acquisition of property, plant, and equipment included in accounts payable and accrued liabilities | |
| | Cash paid during the period for: | Cash paid during the period for: | |
| | Cash paid during the period for: | |
| | Cash paid during the period for: | |
| Interest, net of capitalized interest | |
| Interest, net of capitalized interest | |
| Interest, net of capitalized interest | Interest, net of capitalized interest | | $ | 313 | | | $ | 177 | |
| Income taxes, net of refunds | Income taxes, net of refunds | | $ | 267 | | | $ | 335 | |
| |
See accompanying notes.
| | | | | | | | | | | |
| Financial Statements | Consolidated Condensed Statements of Cash Flows | 7 |
| | | | | |
| Consolidated Condensed Statements of Stockholders' Equity | |
| |
| | (In Millions, Except Per Share Amounts; Unaudited) | (In Millions, Except Per Share Amounts; Unaudited) | | Common Stock and Capital in Excess of Par Value | | Accumulated Other Comprehensive Income (Loss) | | Retained Earnings | | Non-Controlling Interests | | Total | (In Millions, Except Per Share Amounts; Unaudited) | | Common Stock and Capital in Excess of Par Value | | Accumulated Other Comprehensive Income (Loss) | | Retained Earnings | | Non-Controlling Interests | | Total |
| Shares | | Amount | | | |
| Three Months Ended | Three Months Ended | |
| Three Months Ended | |
| Three Months Ended | |
| | Balance as of December 31, 2022 | | $ | 4,137 | | | $ | 31,580 | | | $ | (562) | | | $ | 70,405 | | | $ | 1,863 | | | $ | 103,286 | |
| Balance as of December 30, 2023 | |
| | Balance as of December 30, 2023 | |
| | Balance as of December 30, 2023 | |
| | Net income (loss) | Net income (loss) | | — | | | — | | | — | | | (2,758) | | | (10) | | | (2,768) | |
| Net income (loss) | |
| Net income (loss) | |
| Other comprehensive income (loss) | Other comprehensive income (loss) | | — | | | — | | | 143 | | | — | | | — | | | 143 | |
| Net proceeds received from partner contributions | | — | | — | | — | | | — | | | — | | | 449 | | | 449 | |
| Net proceeds from partner contributions | |
| Employee equity incentive plans and other | Employee equity incentive plans and other | | 36 | | | 659 | | | — | | | — | | | — | | | 659 | |
| Share-based compensation | Share-based compensation | | — | | | 697 | | | — | | | — | | | 42 | | | 739 | |
| | Restricted stock unit withholdings | Restricted stock unit withholdings | | (2) | | | (107) | | | — | | | 38 | | | — | | | (69) | |
| Cash dividends declared ($0.49 per share) | | — | | | — | | | — | | | (2,036) | | | — | | | (2,036) | |
| Balance as of April 1, 2023 | | $ | 4,171 | | | $ | 32,829 | | | $ | (419) | | | $ | 65,649 | | | $ | 2,344 | | | $ | 100,403 | |
| | Balance as of December 25, 2021 | | $ | 4,070 | | | $ | 28,006 | | | $ | (880) | | | $ | 68,265 | | | $ | — | | | $ | 95,391 | |
| | Restricted stock unit withholdings | |
| | Restricted stock unit withholdings | |
| Cash dividends declared ($0.13 per share of common stock) | |
| Balance as of March 30, 2024 | |
| | Balance as of December 31, 2022 | |
| Balance as of December 31, 2022 | |
| Balance as of December 31, 2022 | |
| | Net income (loss) | Net income (loss) | | — | | | — | | | — | | | 8,113 | | | — | | | 8,113 | |
| Net income (loss) | |
| Net income (loss) | |
| Other comprehensive income (loss) | Other comprehensive income (loss) | | — | | | — | | | (122) | | | — | | | — | | | (122) | |
| Net proceeds from partner contributions | |
| | Employee equity incentive plans and other | |
| Employee equity incentive plans and other | |
| Employee equity incentive plans and other | Employee equity incentive plans and other | | 20 | | | 589 | | | — | | | — | | | — | | | 589 | |
| Share-based compensation | Share-based compensation | | — | | | 707 | | | — | | | — | | | — | | | 707 | |
| Restricted stock unit withholdings | |
| Cash dividends declared ($0.49 per share of common stock) | |
| Balance as of April 1, 2023 | |
| | Restricted stock unit withholdings | | (1) | | | (58) | | | — | | | 3 | | | — | | | (55) | |
| Cash dividends declared ($0.37 per share) | | — | | | — | | | — | | | (1,487) | | | — | | | (1,487) | |
| Balance as of April 2, 2022 | | $ | 4,089 | | | $ | 29,244 | | | $ | (1,002) | | | $ | 74,894 | | | $ | — | | | $ | 103,136 | |
| |
See accompanying notes.
| | | | | | | | | | | |
| Financial Statements | Consolidated Condensed Statements of Stockholders' Equity | 8 |
| | | | | |
| Notes to Consolidated Condensed Financial Statements | |
| |
| | | | | |
| Note 1 : | Basis of Presentation |
We prepared our interim Consolidated Condensed Financial Statements that accompany these notes in conformity with US GAAP, consistent in all material respects with those applied in our 20222023 Form 10-K.
We have a 52- or 53-week fiscal year that ends on the last Saturday in December. Fiscal year 2023 is a 52-week fiscal year; fiscal 2022 was a 53-week fiscal year, with the extra week included in the first quarter of 2022.
We have made estimates and judgments affecting the amounts reported in our Consolidated Condensed Financial Statements and the accompanying notes. The actual results that we experience may differ materially from our estimates. The interim financial information is unaudited, and reflects all normal adjustments that are, in our opinion, necessary to provide a fair statement of results for the interim periods presented. This report should be read in conjunction with the Consolidated Financial Statements in our 20222023 Form 10-K where we include additional information on our critical accounting estimates, policies, and the methods and assumptions used in our estimates.
| | | | | |
| Note 2 : | Operating Segments |
We previously announced the organizational changeimplementation of our internal foundry operating model, which took effect in the first quarter of 2024, and creates a foundry relationship between our Intel Products business (collectively CCG, DCAI, and NEX) and our Intel Foundry business. Intel Products consists substantially of design and development of CPUs and related solutions for third party customers. Intel Foundry consists substantially of process engineering, manufacturing, and foundry services groups that provide manufacturing, test, and assembly services to integrate AXG into CCG and DCAI. This change is intended to drive a more effective go-to-market capabilityour Intel Products business and to acceleratethird party customers. Both businesses utilize marketing, sales, and other support functions.
Our internal foundry model is a key component of our strategy and is designed to reshape our operational dynamics and drive greater transparency, accountability, and focus on costs and efficiency. We also previously announced our intent to operate Altera, an Intel Company (previously Intel's Programmable Solutions Group), as a standalone business, with segment reporting beginning in the scalefirst quarter of 2024. Altera was previously included in our DCAI segment results. As a result of these businesses, while also reducing costs. As a result,changes, we modified our segment reporting in the first quarter of 20232024 to align to this and certain other business reorganizations.new operating model. All prior-periodprior period segment data has been retrospectively adjusted to reflect the way our CODMChief Operating Decision Maker (CODM) internally receives information and manages and monitors our operating segment performance starting in fiscal year 2023.2024. There are no changes to our consolidated financial statements for any prior periods.
We now manageorganize our business through the following operating segments:as follows:
▪ClientIntel Products:
▪Client Computing Group (CCG)
▪Data Center and AI (DCAI)
▪Network and Edge (NEX)
▪MobileyeIntel Foundry
▪All other
▪Altera
▪Mobileye
▪Other
CCG, DCAI, and Intel Foundry Services (IFS)qualify as reportable operating segments. NEX, Altera, and Mobileye do not qualify as reportable operating segments; however, we have elected to disclose their results. When we enter into federal contracts, they are aligned to the sponsoring operating segment.
The accounting policies for our segment reporting are the same for Intel as a whole. A summary of the basis for which we report our operating segment revenues and operating margin is as follows:
Intel Products: CCG, DCAI, and NEX
We derive▪Segment revenue: consists of revenues from third party customers. The Intel Products operating segments represent a substantial majority of ourIntel consolidated revenue and are derived from our principal products that incorporate various components and technologies, including a microprocessor and chipset, a stand-alone SoC, or a multichip package, which isare based on Intel® architecture.
▪Segment expenses: consists of intersegment charges for product manufacturing and related services from Intel Foundry, external foundry and other manufacturing, product development costs, allocated expenses as described below, and direct operating expenses.
| | | | | | | | | | | |
| Financial Statements | Notes to Financial Statements | 9 |
Intel Foundry
▪Segment revenue: consists substantially of intersegment product and services revenue for wafer fabrication and related products and services sold to Intel Products, Altera, and certain other Intel internal businesses. We recognize intersegment revenue when we satisfy performance obligations as evidenced by the transfer of control of Intel Foundry products and services to the Intel Products businesses, which is generally at the completion of wafer sorting and at the completion of assembly and test services. Intersegment sales are recorded at prices that are intended to approximate market pricing. Intel Foundry also includes certain third party foundry and assembly and test revenues from external customers that were $27 million in first three months of 2024 and $118 million in the first three months of 2023.
▪Segment expenses: consists of direct expenses for technology development, product manufacturing and services provided by Intel Foundry to internal and external customers, allocated expenses as described below, and direct operating expenses. Direct expenses for product manufacturing includes excess capacity charges that were previously allocated primarily to CCG, DCAI, and NEX are our reportableNEX.
All other: Altera & Mobileye
▪Segment revenue: consists of product revenues from third party customers. Altera revenue is derived from programmable semiconductors, primarily FPGAs, CPLDs, acceleration platforms, software, IP, and related products. Mobileye revenue is derived from advanced driver-assistance systems (ADAS) and autonomous driving technologies and solutions.
▪Segment expenses: Altera expenses consist of intersegment charges for product manufacturing and related services from Intel Foundry, third party manufacturing, allocated expenses as described below, and direct operating segments.expenses. Mobileye expenses consists of third party direct expenses for product manufacturing and IFS do not qualify as reportablerelated services for the manufacturing of Mobileye products and direct operating segments; however, we have elected to disclose the results of these non-reportable operating segments. When we enter into federal contracts, they are aligned to the sponsoring operating segment.expenses.
We have sales and marketing, manufacturing, engineering, finance, and administration groups. Expenses for these groups are generally allocated to the operating segments.
We have anOur "all other" category that includes revenue, expenses, and charges such as:also consists of "other", which includes:
▪results of operations from non-reportable segments not otherwise presented, and from start-up businesses that support our initiatives; and
▪historical results of operations from divested businesses;businesses.
We allocate operating expenses from our sales and marketing group to the Intel Products operating segments, and allocate operating expenses from our finance and administration groups to all of our operating segments, except Mobileye. Previously, operating expense from all of these groups as well as manufacturing and engineering, were generally allocated to all the operating segments, except Mobileye.
We estimate that the substantial majority of our consolidated depreciation expense was incurred by Intel Foundry in the first three months of 2024 and in the first three months of 2023. Intel Foundry depreciation expense is substantially included in overhead cost pools and then combined with other costs, and subsequently absorbed into inventory as each product passes through the manufacturing process and is sold to Intel Products and other customers. As a result, it is impractical to determine the total depreciation expense included as a component of each Intel Products operating segment's operating income (loss) results.
We do not allocate to our operating segments corporate operating expenses that primarily consist of:
▪amounts included within restructuring and other charges;charges;
▪employee benefits, compensation,share-based compensation;
▪certain impairment charges, and other expenses not allocated to the operating segments;charges; and
▪certain acquisition-related costs, including amortization and any impairment of acquisition-related intangibles and goodwill.
We do not allocate to our operating segments non-operating items such as:
▪gains and losses from equity investments;
▪interest and other income; and
▪income taxes.
The CODM, who is our CEO, allocates resources to and assesses the performance of each operating segment using information about the operating segment's revenue and operating income (loss). The CODM does not evaluate operating segments using discrete asset information, and we do not identify or allocate assets by operating segments. Based on the interchangeable nature of our manufacturing and assembly and test assets, most of the related depreciation expense is not directly identifiable within our operating segments, as it is included in overhead cost pools and subsequently absorbed into inventory as each product passes through our manufacturing process. Because our products are then sold across multiple operating segments, it is impracticable to determine the total depreciation expense included as a component of each operating segment's operating income (loss) results. We do not allocate gains and losses from equity investments, interest and other income, share-based compensation, or taxes to our operating segments. Although the CODM uses operating income (loss) to evaluate the segments, operating costs included in one segment may benefit other segments. The measures regularly provided to and used by our CODM under our new operating model continue to evolve; currently, our CODM does not regularly review or receive discrete asset information by segment.
Intersegment eliminations: Intersegment sales and related gross margin on inventory recorded at the end of the period or sold through to third party customers is eliminated for consolidation purposes. The Intel Products operating segments and Intel Foundry are meant to reflect separate fabless semiconductor and foundry companies. Thus certain intersegment activity is captured within the intersegment eliminations upon consolidation and presented at the Intel consolidated level. This activity primarily relates to inventory reserves which are determined and recorded based on our accounting policies for segment reporting are the same as for Intel as a whole. There have been no changeswhole, but are only recorded by the Intel Products operating segments upon transfer of inventory from Intel Foundry. If a reserve is identified prior to our segment accounting policies disclosed in our 2022 Form 10-K except for the organizational change described above.related inventory transferring to Intel Products, that reserve is presented as activity within the intersegment eliminations.
| | | | | | | | | | | |
| Financial Statements | Notes to Financial Statements | 910 |
NetReporting units and goodwill reallocation: As a result of modifying our segment reporting in the first quarter of 2024, we reallocated goodwill among our affected reporting units on a relative fair value basis. We performed a quantitative goodwill impairment assessment for each of our reporting units immediately before and after our business reorganization. We concluded based on our pre-reorganization impairment test that goodwill was not impaired. As a result of our post-reorganization impairment test, we recognized a non-cash goodwill impairment loss of $222 million in the first three months of 2024 related to our new Intel Foundry reporting unit as the estimated fair value of the new reporting unit was lower than the assigned carrying value, which now includes substantially all of our allocated property, plant, and equipment. The Intel Foundry reporting unit has no remaining goodwill. The fair value substantially exceeded the carrying value for all remaining reporting units tested as part of our post-reorganization impairment test.
Operating segment and consolidated net revenue and operating income (loss) for each period were as follows:
| | Three Months Ended | |
| | Three Months Ended | |
| | Three Months Ended | |
| | Three Months Ended | |
| (In Millions) | (In Millions) | | Apr 1, 2023 | | Apr 2, 2022 | |
| Net revenue: | | | | | |
| Client Computing | |
| (In Millions) | |
| (In Millions) | |
| Operating segment revenue: | |
| Operating segment revenue: | |
| Operating segment revenue: | |
| Intel Products: | |
| Intel Products: | |
| Intel Products: | |
| Client Computing Group | |
| Client Computing Group | |
| Client Computing Group | |
| Desktop | |
| Desktop | |
| Desktop | Desktop | | $ | 1,879 | | | $ | 2,641 | | |
| Notebook | Notebook | | 3,407 | | | 5,959 | | |
| Notebook | |
| Notebook | |
| Other | Other | | 481 | | | 722 | | |
| 5,767 | | | 9,322 | | |
| | Other | |
| Other | |
| | 7,533 | |
| | 7,533 | |
| | 7,533 | |
| Data Center and AI | |
| Data Center and AI | |
| Data Center and AI | Data Center and AI | | 3,718 | | | 6,074 | | |
| Network and Edge | Network and Edge | | 1,489 | | | 2,139 | | |
| Network and Edge | |
| Network and Edge | |
| Total Intel Products revenue | |
| Total Intel Products revenue | |
| Total Intel Products revenue | |
| | Intel Foundry | |
| | Intel Foundry | |
| | Intel Foundry | |
| All other | |
| All other | |
| All other | |
| Altera | |
| Altera | |
| Altera | |
| Mobileye | Mobileye | | 458 | | | 394 | | |
| Intel Foundry Services | | 118 | | | 156 | | |
| All other | | 165 | | | 268 | | |
| Mobileye | |
| Mobileye | |
| Other | |
| Other | |
| Other | |
| Total all other revenue | |
| Total all other revenue | |
| Total all other revenue | |
| Total operating segment revenue | |
| Total operating segment revenue | |
| Total operating segment revenue | |
| Intersegment eliminations | |
| Intersegment eliminations | |
| Intersegment eliminations | |
| Total net revenue | |
| Total net revenue | |
| Total net revenue | Total net revenue | | $ | 11,715 | | | $ | 18,353 | | |
| | Operating income (loss): | |
| Client Computing | | $ | 520 | | | $ | 2,722 | | |
| Segment operating income (loss): | |
| | Segment operating income (loss): | |
| | Segment operating income (loss): | |
| Intel Products: | |
| Intel Products: | |
| Intel Products: | |
| Client Computing Group | |
| Client Computing Group | |
| Client Computing Group | |
| Data Center and AI | |
| Data Center and AI | |
| Data Center and AI | Data Center and AI | | (518) | | | 1,393 | | |
| Network and Edge | Network and Edge | | (300) | | | 416 | | |
| Network and Edge | |
| Network and Edge | |
| Total Intel Products operating income (loss) | |
| Total Intel Products operating income (loss) | |
| Total Intel Products operating income (loss) | |
| | Intel Foundry | |
| | Intel Foundry | |
| | Intel Foundry | |
| All Other | |
| All Other | |
| All Other | |
| Altera | |
| Altera | |
| Altera | |
| Mobileye | Mobileye | | 123 | | | 148 | | |
| Intel Foundry Services | | (140) | | | (23) | | |
| All other | | (1,153) | | | (315) | | |
| Mobileye | |
| Mobileye | |
| Other | |
| Other | |
| Other | |
| Total all other operating income (loss) | |
| Total all other operating income (loss) | |
| Total all other operating income (loss) | |
| Total segment operating income (loss) | |
| Total segment operating income (loss) | |
| Total segment operating income (loss) | |
| Intersegment eliminations | |
| Intersegment eliminations | |
| Intersegment eliminations | |
| Corporate unallocated expenses | |
| Corporate unallocated expenses | |
| Corporate unallocated expenses | |
| Total operating income (loss) | Total operating income (loss) | | $ | (1,468) | | | $ | 4,341 | | |
| Total operating income (loss) | |
| Total operating income (loss) | |
|
| | | | | | | | | | | |
| Financial Statements | Notes to Financial Statements | 11 |
Corporate Unallocated Expenses
Corporate unallocated expenses represent costs incurred that are not directly attributed to an operating segment. The nature of these expenses may vary, but primarily consist of restructuring and other charges, share-based compensation, certain impairment charges, and certain acquisition-related costs. | | | | | | | | | | | | | | | | |
| | Three Months Ended | | |
| (In Millions) | | Mar 30, 2024 | | Apr 1, 2023 | | |
| Acquisition-related adjustments | | $ | (265) | | | $ | (371) | | | |
| Share-based compensation | | (1,179) | | | (739) | | | |
| Restructuring and other charges | | (348) | | | (64) | | | |
| Other | | (396) | | | 130 | | | |
| Total corporate unallocated expenses | | $ | (2,188) | | | $ | (1,044) | | | |
| | | | | |
| Note 3 : | Non-Controlling Interests |
| | | | | | | | | | | | | | | | | | | | | | | | | | |
| | Mar 30, 2024 | | Dec 30, 2023 |
| (In Millions) | | Non-Controlling Interests | | Non-Controlling Ownership % | | Non-Controlling Interests | | Non-Controlling Ownership % |
| Arizona Fab LLC | | $ | 2,760 | | | 49 | % | | $ | 2,359 | | | 49 | % |
| Mobileye | | 1,854 | | | 12 | % | | 1,838 | | | 12 | % |
| IMS Nanofabrication | | 169 | | | 32 | % | | 178 | | | 32 | % |
| Non-controlling interests | | $ | 4,783 | | | | | $ | 4,375 | | | |
Semiconductor Co-Investment Program
In 2022, we closed a transaction with Brookfield Asset Management (Brookfield) resulting in the formation of Arizona Fab LLC (Arizona Fab), a VIE for which we and Brookfield own 51% and 49%, respectively. Because we are the primary beneficiary of the VIE, we fully. We consolidate the results of Arizona Fab, a VIE, into our consolidated financial statements.statements because we are the primary beneficiary. Generally, contributions will be made to, and distributions will be received from Arizona Fab based on both parties’parties' proportional ownership. We will be the sole operator and majority ownermain beneficiary of two new chip factories that will be constructed by Arizona Fab, and we will have the right to purchase 100% of the related factory output. Once production commences, we will be required to operate Arizona Fab at minimum production levels measured in wafer starts per week and will be required to limit excess inventory held on site or we will be subject to certain penalties.
We have an unrecognized commitment to fund our respective share of the total construction costs of Arizona Fab of $29.0 billion.
As of April 1, 2023, a substantial majorityMarch 30, 2024, substantially all of the assets of Arizona Fab consisted of property, plant, and equipment. The assets held by Arizona Fab, which can be used only to settle obligations of the VIE and are not available to us, were $2.75.6 billion as of April 1, 2023March 30, 2024 ($1.84.8 billion as of December 31, 2022)30, 2023).
Non-controlling interest in Arizona Fab was $1.3 billion as of April 1, 2023 ($874 million as of December 31, 2022). Net loss attributable to non-controlling interest in Arizona Fab was $5 million in the first three months of 2023; there was no net income (loss) attributable to non-controlling interest in the first three months of 2022.
Mobileye
In October 2022, Mobileye completed its IPO and certain other equity financing transactions that resulted in transactions. During 2023, we converted 38.5 million of our Mobileye Class B shares into Class A shares, representing 5% of Mobileye's outstanding capital stock, and subsequently sold the Class A shares for $42 per share as part of a secondary offering, receiving net proceeds of $1.0 billion. As$1.6 billion and increasing our capital in excess of April 1,par value by $663 million, net of tax. We continue to consolidate the results of Mobileye into our consolidated financial statements.
IMS Nanofabrication
In 2023, we closed agreements to sell a combined 32% minority stake in our IMS business, a business within our Intel held approximately 94% (94% asFoundry operating segment —including a 20% stake to Bain Capital and a 10% stake to Taiwan Semiconductor Manufacturing Company. Net proceeds resulting from the minority stake sales totaled $1.4 billion, and our capital in excess of December 31, 2022)par value increased by $958 million, net of tax. We continue to consolidate the outstanding equity interest in Mobileye. Non-controlling interest in Mobileye was $1.0 billion asresults of April 1, 2023 ($1.0 billion as of December 31, 2022). Net loss attributable to non-controlling interest in Mobileye was $5 million in the first three months of 2023; there was no net income (loss) attributable to non-controlling interest in the first three months of 2022.IMS into our consolidated financial statements.
| | | | | | | | | | | |
| Financial Statements | Notes to Financial Statements | 1012 |
| | | | | |
| Note 4 : | Earnings (Loss) Per Share |
We computed basic earnings (loss) per share of common stock based on the weighted average number of shares of common stock outstanding during the period. We computed diluted earnings (loss) per share of common stock based on the weighted average number of shares of common stock outstanding plus potentially dilutive shares of common stock outstanding during the period.
| | | |
| | | | | Three Months Ended |
| (In Millions, Except Per Share Amounts) | (In Millions, Except Per Share Amounts) | | Apr 1, 2023 | | Apr 2, 2022 |
| (In Millions, Except Per Share Amounts) | |
| (In Millions, Except Per Share Amounts) | |
| Net income (loss) | |
| Net income (loss) | |
| Net income (loss) | Net income (loss) | | $ | (2,768) | | | $ | 8,113 | |
| Less: Net income (loss) attributable to non-controlling interests | Less: Net income (loss) attributable to non-controlling interests | | (10) | | | — | |
| Less: Net income (loss) attributable to non-controlling interests | |
| Less: Net income (loss) attributable to non-controlling interests | |
| Net income (loss) attributable to Intel | |
| Net income (loss) attributable to Intel | |
| Net income (loss) attributable to Intel | Net income (loss) attributable to Intel | | (2,758) | | | 8,113 | |
| Weighted average shares of common stock outstanding—basic | Weighted average shares of common stock outstanding—basic | | 4,154 | | | 4,079 | |
| Dilutive effect of employee equity incentive plans | | — | | | 28 | |
| Weighted average shares of common stock outstanding—basic | |
| Weighted average shares of common stock outstanding—basic | |
| | Weighted average shares of common stock outstanding—diluted | |
| | Weighted average shares of common stock outstanding—diluted | |
| | | Weighted average shares of common stock outstanding—diluted | Weighted average shares of common stock outstanding—diluted | | 4,154 | | | 4,107 | |
Earnings (loss) per share attributable to Intel—basic
| Earnings (loss) per share attributable to Intel—basic
| | $ | (0.66) | | | $ | 1.99 | |
| Earnings (loss) per share attributable to Intel—basic | |
| Earnings (loss) per share attributable to Intel—basic | |
Earnings (loss) per share attributable to Intel—diluted
| Earnings (loss) per share attributable to Intel—diluted
| | $ | (0.66) | | | $ | 1.98 | |
| Earnings (loss) per share attributable to Intel—diluted | |
| Earnings (loss) per share attributable to Intel—diluted | |
Potentially dilutive shares of common stock from employee equity incentive plans are determined by applying the treasury stock method to the assumed exercise of outstanding stock options, the assumed vesting of outstanding RSUs, and the assumed issuance of common stock under the stock purchase plan.
Due to our net losslosses in the first three months ofended March 30, 2024 and April 1, 2023, the assumed exercise of outstanding stock options, the assumed vesting of outstanding RSUs, and the assumed issuance of common stock under the stock purchase plan had an antidilutiveanti-dilutive effect on diluted earningsloss per share.
Securities which were anti-dilutive were insignificantshare for the period and were excluded from the computation of diluted earningsloss per share in all periods presented.share.
| | | | | |
| Note 5 : | Other Financial Statement Details |
Accounts Receivable
We sell certain of our accounts receivable on a non-recourse basis to third-party financial institutions. We record these transactions as sales of receivables and present cash proceeds as cash provided by operating activities in the Consolidated Condensed Statements of Cash Flows. Accounts receivable sold under non-recourse factoring arrangements were $500 million during the first three months of 2023, and we did not factor accounts receivable during2024 ($500 million in the first three months of 2022.2023). After the sale of our accounts receivable, we willexpect to collect payment from the customers and remit it to the third-party financial institution.
Inventories
| | (In Millions) | (In Millions) | | Apr 1, 2023 | | Dec 31, 2022 | (In Millions) | | Mar 30, 2024 | | Dec 30, 2023 |
| Raw materials | Raw materials | | $ | 1,358 | | | $ | 1,517 | |
| Work in process | Work in process | | 7,415 | | | 7,565 | |
| Finished goods | Finished goods | | 4,220 | | | 4,142 | |
| Total inventories | Total inventories | | $ | 12,993 | | | $ | 13,224 | |
Other Accrued Liabilities
Other accrued liabilities include deferred compensation of $2.9 billion as of March 30, 2024 ($2.9 billion as of December 30, 2023).
Interest and Other, Net
| | | | | | | | | | | | | | |
| | | Three Months Ended |
| (In Millions) | | Apr 1, 2023 | | Apr 2, 2022 |
| Interest income | | $ | 334 | | | $ | 47 | |
| Interest expense | | (193) | | | (124) | |
| Other, net | | — | | | 1,074 | |
| Total interest and other, net | | $ | 141 | | | $ | 997 | |
| | | | | | | | | | | | | | | | | | |
| | | Three Months Ended | | |
| (In Millions) | | Mar 30, 2024 | | Apr 1, 2023 | | | | |
| Interest income | | $ | 323 | | | $ | 334 | | | | | |
| Interest expense | | (258) | | | (193) | | | | | |
| Other, net | | 80 | | | — | | | | | |
| Total interest and other, net | | $ | 145 | | | $ | 141 | | | | | |
Interest expense is net of $363 million of interest capitalized in the first three months of 20232024 ($142363 million in the first three months of 2022)2023).Other, net includes a gain in 2022 of $1.0 billion resulting from the first closing of the divestiture of our NAND memory business.
| | | | | | | | | | | |
| Financial Statements | Notes to Financial Statements | 1113 |
Property, Plant and Equipment
Effective January 2023, we increased the estimated useful life of certain production machinery and equipment from 5 years to 8 years. We estimate this change resulted in an approximate $360 million increase to gross margin, an approximate $100 million decrease in R&D expenses, and an approximate $525 million decrease in ending inventory values in Q1 2023 when compared to what the impact would have been using the estimated useful life in place prior to this change.
| | | | | |
| Note 6 : | Restructuring and Other Charges |
| | Three Months Ended | |
| | Three Months Ended | |
| | Three Months Ended | |
| | Three Months Ended | |
| (In Millions) | (In Millions) | | Apr 1, 2023 | | Apr 2, 2022 | |
| (In Millions) | |
| (In Millions) | |
| Employee severance and benefit arrangements | |
| Employee severance and benefit arrangements | |
| Employee severance and benefit arrangements | Employee severance and benefit arrangements | | $ | (39) | | | $ | 5 | | |
| | Litigation charges and other | Litigation charges and other | | 77 | | | (1,216) | | |
| | Litigation charges and other | |
| | Litigation charges and other | |
| Asset impairment charges | |
| Asset impairment charges | |
| Asset impairment charges | Asset impairment charges | | 26 | | | — | | |
| Total restructuring and other charges | Total restructuring and other charges | | $ | 64 | | | $ | (1,211) | | |
| Total restructuring and other charges | |
| Total restructuring and other charges | |
The 2022 Restructuring Program was approvedEmployee severance and benefit arrangements includes a charge of $129 million in the third first quarter of 20222024 relating to rebalance our workforceactions taken to streamline operations and operations to create efficiencies and improve our product execution in alignment with our strategy.reduce costs. We expect these actions to be substantially completed by the endthird quarter of 2023,2024, but this is subject to change. Any changes to the estimates or timing of executing the 2022 Restructuring Program will be reflected in our results of operations.
| | | | | | | | | | | | |
Restructuring activity for the 2022 Restructuring Program during the first three months of 2023 was as follows: |
| | | | | | |
(In Millions) | | | | | | |
Accrued restructuring balance as of December 31, 2022 | | $ | 873 | | | | | |
| | | | | | |
Adjustments | | (41) | | | | | |
Cash payments | | (487) | | | | | |
| | | | | | |
Accrued restructuring balance as of April 1, 2023 | | $ | 345 | | | | | |
The accrued restructuring balance as of April 1, 2023, was recorded as a current liability within accrued compensation and benefits on theConsolidated Condensed Balance Sheets.
LitigationAsset impairment charges and other includes a $1.2 billion benefitgoodwill impairment loss of $222 million in the first three monthsquarter of 2022 from the annulled penalty2024 related to an EC fine that was recorded and paid in 2009.our new Intel Foundry reporting unit. Refer to "Note 12: Contingencies"2: Operating Segments" within the Notes to Consolidated Condensed Financial Statements for further information on legal proceedings related to the EC fine.our business reorganization and goodwill impairment.
| | | | | | | | | | | | | | | | | | |
| | Three Months Ended | | |
| (In Millions) | | Mar 30, 2024 | | Apr 1, 2023 | | | | |
| Income (loss) before taxes | | $ | (719) | | | $ | (1,158) | | | | | |
| Provision for (benefit from) taxes | | $ | (282) | | | $ | 1,610 | | | | | |
| Effective tax rate | | 39.2 | % | | (139.0) | % | | | | |
Our provision for, or benefit from, income taxes for an interim period has historically been determined using an estimated annual effective tax rate, adjusted for discrete items, if any. Under certain circumstances where we are unable to make a reliable estimate of the annual effective tax rate, we use the actual effective tax rate for the year-to-date period. During the first quarter of 2024, we used the actual effective tax rate approach due to the variability of the rate as a result of fluctuations in forecasted income and the effects of being taxed in multiple tax jurisdictions.
Short-term Investments
Short-term investments include marketable debt investments in corporate debt, government debt, and financial institution instruments.instruments, and are recorded within cash and cash equivalents and short-term investments on theConsolidated Condensed Balance Sheets. Government debt includes instruments such as non-US government bills and bonds and US agency securities. Financial institution instruments include instruments issued or managed by financial institutions in various forms, such as commercial paper, fixed- and floating-rate bonds, money market fund deposits, and time deposits. As of April 1, 2023,March 30, 2024, and December 31, 2022, 30, 2023, substantially all time deposits were issued by institutions outside the US.
For certain of our marketable debt investments, we economically hedge market risks at inception with a related derivative instrument or the marketable debt investment itself is used to economically hedge currency exchange rate risk from remeasurement. These hedged investments are reported at fair value with gains or losses from the investments and the related derivative instruments recorded in interest and other, net. The fair value of our hedged investments was $18.2$13.8 billion as of April 1, 2023March 30, 2024 ($16.217.1 billion as of December 31, 2022)30, 2023). For hedged investments still held at the reporting date, we recorded net gainslosses of $90$307 million in the first three months of 20232024 ($41190 million of net gains in the first three months of 2023). We recorded net gains on the related derivatives of $345 million in the first three months of 2024 ($102 million of net losses in the first three months of 2022). We recorded net losses on the related derivatives of $102 million in the first three months of 2023 ($377 million of net gains in the first three months of 2022)2023).
Our remaining unhedged marketable debt investments are reported at fair value, with unrealized gains or losses, net of tax, recorded in accumulated other comprehensive income (loss) and realized gains or losses recorded in interest and other, net. The adjusted cost of our unhedged investments was $7.0$4.0 billion as of April 1, 2023March 30, 2024 ($10.24.7 billion as of December 31, 2022)30, 2023), which approximated the fair value for these periods.
| | | | | | | | | | | |
| Financial Statements | Notes to Financial Statements | 1214 |
The fair value of marketable debt investments, by contractual maturity, as of April 1, 2023,March 30, 2024, was as follows:
| | | | | | | | |
| (In Millions) | | Fair Value |
| Due in 1 year or less | | $ | 15,8745,579 | |
| Due in 1–2 years | | 1,8052,457 | |
| Due in 2–5 years | | 4,8506,915 | |
| Due after 5 years | | 734433 | |
Instruments not due at a single maturity date1 | | 1,9472,460 | |
| Total | | $ | 25,21017,844 | |
1 Instruments not due at a single maturity date is comprised of money market fund deposits, which are classified as either short-term investments or cash and cash equivalents.
Equity Investments
| | (In Millions) | (In Millions) | | Apr 1, 2023 | | Dec 31, 2022 | (In Millions) | | Mar 30, 2024 | | Dec 30, 2023 |
Marketable equity securities1 | Marketable equity securities1 | | $ | 1,421 | | | $ | 1,341 | |
| Non-marketable equity securities | Non-marketable equity securities | | 4,598 | | | 4,561 | |
| Equity method investments | Equity method investments | | 10 | | | 10 | |
| Total | Total | | $ | 6,029 | | | $ | 5,912 | |
1 OverApproximately 90% of our marketable equity securities are subject to trading-volume or market-based restrictions, which limit the number of shares we may sell in a specified period of time, impacting our ability to liquidate these investments. TheCertain of the trading volume restrictions generally apply for as long as we own more than 1% of the outstanding shares. Market-based restrictions result from the rules of the respective exchange.
The components of gains (losses) on equity investments, net for each period were as follows:
| | | |
| | | | | Three Months Ended | |
| (In Millions) | (In Millions) | | Apr 1, 2023 | | Apr 2, 2022 | |
| (In Millions) | |
| (In Millions) | |
| Ongoing mark-to-market adjustments on marketable equity securities | |
| Ongoing mark-to-market adjustments on marketable equity securities | |
| Ongoing mark-to-market adjustments on marketable equity securities | Ongoing mark-to-market adjustments on marketable equity securities | | $ | 188 | | | $ | (430) | | |
| Observable price adjustments on non-marketable equity securities | Observable price adjustments on non-marketable equity securities | | 10 | | | 71 | | |
| Observable price adjustments on non-marketable equity securities | |
| Observable price adjustments on non-marketable equity securities | |
| Impairment charges | |
| Impairment charges | |
| Impairment charges | Impairment charges | | (36) | | | (23) | | |
Sale of equity investments and other1 | Sale of equity investments and other1 | | 7 | | | 4,705 | | |
Sale of equity investments and other1 | |
Sale of equity investments and other1 | |
| Total gains (losses) on equity investments, net | Total gains (losses) on equity investments, net | | $ | 169 | | | $ | 4,323 | | |
| Total gains (losses) on equity investments, net | |
| Total gains (losses) on equity investments, net | |
1 Sale of equity investments and other includes initial fair value adjustments recorded upon a security becoming marketable, realized gains (losses) on sales of non-marketable equity investments and equity method investments, and our share of equity method investee gains (losses) and distributions.
Net unrealized gains and losses for our marketable and non-marketable equity securities for each period were as follows:
| | | | | | | | | | | | | | | | | | | | |
| | Three Months Ended | | | | |
| (In Millions) | | Apr 1, 2023 | | Apr 2, 2022 | | | | | | |
| Net unrealized gains (losses) recognized during the period on equity securities | | $ | 166 | | | $ | (244) | | | | | | | |
| Less: Net (gains) losses recognized during the period on equity securities sold during the period | | (3) | | | (17) | | | | | | | |
| Net unrealized gains (losses) recognized during the reporting period on equity securities still held at the reporting date | | $ | 163 | | | $ | (261) | | | | | | | |
McAfee Corp.
During the first quarter of 2022, the sale of the McAfee consumer business was completed and we received $4.6 billion in cash for the sale of our remaining share of McAfee, recognizing a $4.6 billion gain in sale of equity investments and other.
| | | | | | | | | | | |
| Financial Statements | Notes to Financial Statements | 13 |
| | | | | |
Note 89 : | Acquisitions and Divestitures |
Acquisitions
Acquisition of Tower Semiconductor
During the first quarter of 2022, we entered into a definitive agreement to acquire Tower Semiconductor Ltd. (Tower) in a cash-for-stock transaction. Tower is a leading foundry for analog semiconductor solutions. The acquisition is expected to advance our IDM 2.0 strategy by accelerating our global end-to-end foundry business. Upon completion of the acquisition, each issued and outstanding ordinary share of Tower will be converted into the right to receive $53 per share in cash, representing a total enterprise value of approximately $5.4 billion as of the agreement date. We continue to work to close the transaction, which is subject to certain regulatory approvals and customary closing conditions. If regulatory approvals are not received prior to August 15, 2023, and the agreement is terminated by either party, we may be obligated to pay Tower a termination fee of $353 million. Tower will be included in our IFS operating segment.
Divestitures
NAND Memory Business
On December 29, 2021, we closed the first phase of our agreement with SK hynix Inc. (SK hynix) to divest ourThe NAND memory business for $9.0 billion in cash. Our NAND memory business includesincluded ourNAND memory technology and manufacturing business (the NAND OpCo Business), of which we deconsolidated our ongoing interests in as part of the sale. The transaction will be completed in two closings and upon first closing in the first three months 2022,phase of our sale agreement with SK hynix paid $7.0 billion of consideration and we recognizedInc (SK hynix) on December 29, 2021. We have a pre-tax gain of $1.0 billionreceivable within interest and other net, and tax expense of $495 million. We recorded a receivable in other long-termcurrent assets for the remaining proceeds of $1.9$2.0 billion, which remains outstanding as of April 1, 2023,March 30, 2024 and will be received upon the second closing of the transaction, expected to be no earlier thanin March 2025.
The wafer manufacturing and sale agreement includes incentives and penalties that are contingent on the cost of operation and output of the NAND OpCo Business. These incentives and penalties present a maximum exposure of up to $500 million annually, and $1.5 billion in the aggregate. We are currently in negotiations with SK hynix to update the operating plan of the NAND OpCo Business, in light of the current business environment and projections, which may impact the metrics associated with the incentives and penalties and our expectations of the performance of the NAND OpCo Business against those metrics.
AsWe were reimbursed for costs that we incurred on behalf of April 1, 2023, we also have a receivable due from the NAND OpCo Business a deconsolidated entity, of $184 million recorded within other current assets on the Consolidated Condensed Balance Sheets. We will be reimbursed for costs of approximately $35 million per quarter in 2023 for corporate function services, which include human resources, information technology, finance, supply chain, and other compliance requirements associated with being wholly owned subsidiaries.requirements. We recorded a receivable related to these reimbursable costs due from the NAND OpCo Business, a deconsolidated entity, of $150 million within other current assets as of March 30, 2024 ($145 million recorded as of December 30, 2023).
| | | | | | | | | | | |
| Financial Statements | Notes to Financial Statements | 15 |
In the first quarter of 2023,2024, we issued a total of $11.0$2.6 billion aggregate principal amount of senior notes. We also amendedexpanded both our 5-year $5.0 billion revolving credit facility agreement extendingand our 364-day $5.0 billion credit facility agreement, to $7.0 billion and $8.0 billion, respectively, and the maturity datedates were extended by one year to March 2028,February 2029 and our 364-day credit facility agreement, extending the maturity date to March 2024.January 2025, respectively. The revolving credit facilities had no borrowings outstanding as of April 1, 2023.March 30, 2024.
We have an ongoing authorization from our Board of Directors to borrow up to $10.0 billion under our commercial paper program. In the first quarter of 2023, we settled in cash $2.9 billion of our commercial paper andWe had $1.0 billion$793 million of commercial paper outstanding as of April 1, 2023.March 30, 2024 (no commercial paper outstanding as of December 30, 2023).
Our senior fixed rate notes pay interest semiannually. We may redeem the fixed rate notes prior to their maturity at our option at specified redemption prices and subject to certain restrictions. The obligations under our senior fixed rate notes rank equally in the right of payment with all of our other existing and future senior unsecured indebtedness and effectively rank junior to all liabilities of our subsidiaries.
| | | | | | | | | | | |
| Financial Statements | Notes to Financial Statements | 14 |
Assets and Liabilities Measured and Recorded at Fair Value on a Recurring Basis
| | Apr 1, 2023 | | Dec 31, 2022 | |
| Fair Value Measured and Recorded at Reporting Date Using | | | | Fair Value Measured and Recorded at Reporting Date Using | | | |
| | Mar 30, 2024 | |
| | Mar 30, 2024 | |
| | Mar 30, 2024 | |
| | Fair Value Measured and Recorded at Reporting Date Using | |
| | Fair Value Measured and Recorded at Reporting Date Using | |
| | Fair Value Measured and Recorded at Reporting Date Using | |
| (In Millions) | |
| (In Millions) | |
| (In Millions) | (In Millions) | | Level 1 | | Level 2 | | Level 3 | | Total | | Level 1 | | Level 2 | | Level 3 | | Total | |
| Assets | Assets | | | | | | | | | | | | | | | | | |
| Assets | |
| Assets | |
| Cash equivalents: | |
| Cash equivalents: | |
| Cash equivalents: | Cash equivalents: | | |
| Corporate debt | Corporate debt | | $ | — | | | $ | 1,395 | | | $ | — | | | $ | 1,395 | | | $ | — | | | $ | 856 | | | $ | — | | | $ | 856 | | |
| Corporate debt | |
| Corporate debt | |
| Financial institution instruments¹ | |
| Financial institution instruments¹ | |
| Financial institution instruments¹ | |
| | Reverse repurchase agreements | |
| | Reverse repurchase agreements | |
| | Reverse repurchase agreements | |
| Short-term investments: | |
| Short-term investments: | |
| Short-term investments: | |
| Corporate debt | |
| Corporate debt | |
| Corporate debt | |
| Financial institution instruments¹ | |
| Financial institution instruments¹ | |
| Financial institution instruments¹ | Financial institution instruments¹ | | 1,806 | | | 2,177 | | | — | | | 3,983 | | | 6,899 | | | 1,474 | | | — | | | 8,373 | | |
| Government debt² | Government debt² | | 233 | | | 297 | | | — | | | 530 | | | — | | | — | | | — | | | — | | |
| Reverse repurchase agreements | | — | | | 1,700 | | | — | | | 1,700 | | | — | | | 1,301 | | | — | | | 1,301 | | |
| Short-term investments: | | |
| Corporate debt | | — | | | 5,441 | | | — | | | 5,441 | | | — | | | 5,381 | | | — | | | 5,381 | | |
| Financial institution instruments¹ | | 141 | | | 5,019 | | | — | | | 5,160 | | | 196 | | | 4,729 | | | — | | | 4,925 | | |
| Government debt² | |
| Government debt² | Government debt² | | 49 | | | 8,652 | | | — | | | 8,701 | | | 48 | | | 6,840 | | | — | | | 6,888 | | |
| Other current assets: | Other current assets: | | |
| Other current assets: | |
| Other current assets: | |
| Derivative assets | Derivative assets | | 78 | | | 959 | | | — | | | 1,037 | | | — | | | 1,264 | | | — | | | 1,264 | | |
| Loans receivable³ | | — | | | 54 | | | — | | | 54 | | | — | | | 53 | | | — | | | 53 | | |
| Derivative assets | |
| Derivative assets | |
| | Marketable equity securities | |
| | Marketable equity securities | |
| | Marketable equity securities | Marketable equity securities | | 1,421 | | | — | | | — | | | 1,421 | | | 1,341 | | | — | | | — | | | 1,341 | | |
| Other long-term assets: | Other long-term assets: | | |
| Other long-term assets: | |
| Other long-term assets: | |
| Derivative assets | |
| Derivative assets | |
| Derivative assets | Derivative assets | | — | | | 5 | | | — | | | 5 | | | — | | | 10 | | | — | | | 10 | | |
| | Total assets measured and recorded at fair value | Total assets measured and recorded at fair value | | $ | 3,728 | | | $ | 25,699 | | | $ | — | | | $ | 29,427 | | | $ | 8,484 | | | $ | 21,908 | | | $ | — | | | $ | 30,392 | | |
| | Total assets measured and recorded at fair value | |
| | Total assets measured and recorded at fair value | |
| Liabilities | |
| Liabilities | |
| Liabilities | Liabilities | | | | | | | | | | | | | | | | | |
| Other accrued liabilities: | Other accrued liabilities: | | |
| Other accrued liabilities: | |
| Other accrued liabilities: | |
| Derivative liabilities | |
| Derivative liabilities | |
| Derivative liabilities | Derivative liabilities | | $ | 8 | | | $ | 350 | | | $ | 81 | | | $ | 439 | | | $ | 111 | | | $ | 485 | | | $ | 89 | | | $ | 685 | | |
| | Other long-term liabilities: | Other long-term liabilities: | | |
| | Other long-term liabilities: | |
| | Other long-term liabilities: | |
| Derivative liabilities | |
| Derivative liabilities | |
| Derivative liabilities | Derivative liabilities | | — | | | 515 | | | — | | | 515 | | | — | | | 699 | | | — | | | 699 | | |
| Total liabilities measured and recorded at fair value | Total liabilities measured and recorded at fair value | | $ | 8 | | | $ | 865 | | | $ | 81 | | | $ | 954 | | | $ | 111 | | | $ | 1,184 | | | $ | 89 | | | $ | 1,384 | | |
| Total liabilities measured and recorded at fair value | |
| Total liabilities measured and recorded at fair value | |
1Level 1 investments consist of money market funds. Level 2 investments consist primarily of commercial paper, certificates of deposit, time deposits, andcommercial paper, notes and bonds issued by financial institutions.
2Level 1 investments consist primarily of US Treasury securities. Level 2 investments consist primarily of non-US government debt.
3The fair value of our loans receivable for which we elected the fair value option did not significantly differ from the contractual principal balance.
Assets Measured and Recorded at Fair Value on a Non-Recurring Basis
Our non-marketable equity securities, equity method investments, and certain non-financial assets, assets—such as intangible assets, goodwill, and property, plant, and equipment, equipment—are recorded at fair value only if an impairment or observable price adjustment is recognized in the current period. If an observable price adjustment or impairment is recognized on our non-marketable equity securities during the period, we classify these assets as Level 3.
| | | | | | | | | | | |
| Financial Statements | Notes to Financial Statements | 16 |
Financial Instruments Not Recorded at Fair Value on a Recurring Basis
Financial instruments not recorded at fair value on a recurring basis include non-marketable equity securities and equity method investments that have not been remeasured or impaired in the current period, grants receivable, reverse repurchase agreements with original maturities greater than three months,certain other receivables, and issued debt.
| | | | | | | | | | | |
| Financial Statements | Notes to Financial Statements | 15 |
We classify the fair value of grants receivable and reverse repurchase agreements with original maturities greater than three months as Level 2. The estimated fair value of these financial instruments approximates their carrying value. The aggregate carrying value of grants receivable as of April 1, 2023March 30, 2024 was $459$666 million (the aggregate carrying value as of December 31, 2022 was $437 million). The aggregate carrying value of reverse repurchase agreements with original maturities greater than three months as of April 1,30, 2023 was $0 million (the aggregate carrying value as of December 31, 2022 was $400$559 million).
We classify the fair value of issued debt (excluding any commercial paper) as Level 2. The fair value of our issued debt was $45.9$48.7 billion as of April 1, 2023March 30, 2024 ($34.347.6 billion as of December 31, 2022)30, 2023).
| | | | | |
Note 1112 : | Derivative Financial Instruments |
Volume of Derivative Activity
Total gross notional amounts for outstanding derivatives (recorded at fair value) at the end of each period were as follows:
| | (In Millions) | (In Millions) | | Apr 1, 2023 | | Dec 31, 2022 | |
| (In Millions) | |
| (In Millions) | |
| Foreign currency contracts | |
| Foreign currency contracts | |
| Foreign currency contracts | Foreign currency contracts | | $ | 30,847 | | | $ | 31,603 | | |
| Interest rate contracts | Interest rate contracts | | 16,590 | | | 16,011 | | |
| Interest rate contracts | |
| Interest rate contracts | |
| Other | |
| Other | |
| Other | Other | | 2,058 | | | 2,094 | | |
| Total | Total | | $ | 49,495 | | | $ | 49,708 | | |
| Total | |
| Total | |
The total notional amount of outstanding pay-variable, receive-fixed interest rate swaps was $12.0 billion as of March 30, 2024 and December 30, 2023.
Fair Value of Derivative Instruments in the Consolidated Condensed Balance Sheets
| | | | | Apr 1, 2023 | | Dec 31, 2022 | | | Mar 30, 2024 | | Dec 30, 2023 |
| (In Millions) | (In Millions) | | Assets1 | | Liabilities2 | | Assets1 | | Liabilities2 | (In Millions) | | Assets1 | | Liabilities2 | | Assets1 | | Liabilities2 |
| Derivatives designated as hedging instruments: | Derivatives designated as hedging instruments: | | | | | | | | |
Foreign currency contracts3 | Foreign currency contracts3 | | $ | 187 | | | $ | 185 | | | $ | 142 | | | $ | 290 | |
Foreign currency contracts3 | |
Foreign currency contracts3 | |
| Interest rate contracts | Interest rate contracts | | — | | | 585 | | | — | | | 777 | |
| Total derivatives designated as hedging instruments | Total derivatives designated as hedging instruments | | 187 | | | 770 | | | 142 | | | 1,067 | |
| Derivatives not designated as hedging instruments: | Derivatives not designated as hedging instruments: | | | | | | | | |
Foreign currency contracts3 | |
Foreign currency contracts3 | |
Foreign currency contracts3 | Foreign currency contracts3 | | 537 | | | 156 | | | 866 | | | 194 | |
| Interest rate contracts | Interest rate contracts | | 240 | | | 20 | | | 266 | | | 12 | |
| Equity contracts | Equity contracts | | 78 | | | 8 | | | — | | | 111 | |
| Total derivatives not designated as hedging instruments | Total derivatives not designated as hedging instruments | | 855 | | | 184 | | | 1,132 | | | 317 | |
| Total derivatives | Total derivatives | | $ | 1,042 | | | $ | 954 | | | $ | 1,274 | | | $ | 1,384 | |
1Derivative assets are recorded as other assets, current and long-term.
2Derivative liabilities are recorded as other liabilities, current and long-term.
3TheA substantial majority of these instruments mature within 12 months.
| | | | | | | | | | | |
| Financial Statements | Notes to Financial Statements | 1617 |
Amounts Offset in the Consolidated Condensed Balance Sheets
Agreements subject to master netting arrangements with various counterparties, and cash and non-cash collateral posted under such agreements at the end of each period were as follows:
| | Apr 1, 2023 | |
| | Gross Amounts Not Offset in the Balance Sheet | | |
| | Mar 30, 2024 | |
| | Mar 30, 2024 | |
| | Mar 30, 2024 | |
| | | | | | | | Gross Amounts Not Offset in the Balance Sheet | |
| | | | | | | | Gross Amounts Not Offset in the Balance Sheet | |
| | | | | | | | Gross Amounts Not Offset in the Balance Sheet | |
| (In Millions) | |
| (In Millions) | |
| (In Millions) | (In Millions) | | Gross Amounts Recognized | | Gross Amounts Offset in the Balance Sheet | | Net Amounts Presented in the Balance Sheet | | Financial Instruments | | Cash and Non-Cash Collateral Received or Pledged | | Net Amount | |
| Assets: | Assets: | | | | | | | | | | | | | |
| Assets: | |
| Assets: | |
| Derivative assets subject to master netting arrangements | |
| Derivative assets subject to master netting arrangements | |
| Derivative assets subject to master netting arrangements | Derivative assets subject to master netting arrangements | | $ | 966 | | | $ | — | | | $ | 966 | | | $ | (471) | | | $ | (495) | | | $ | — | | |
| Reverse repurchase agreements | Reverse repurchase agreements | | 1,700 | | | — | | | 1,700 | | | — | | | (1,700) | | | — | | |
| Reverse repurchase agreements | |
| Reverse repurchase agreements | |
| Total assets | |
| Total assets | |
| Total assets | Total assets | | 2,666 | | | — | | | 2,666 | | | (471) | | | (2,195) | | | — | | |
| Liabilities: | Liabilities: | | | | | | | | | | | | | |
| Liabilities: | |
| Liabilities: | |
| Derivative liabilities subject to master netting arrangements | |
| Derivative liabilities subject to master netting arrangements | |
| Derivative liabilities subject to master netting arrangements | Derivative liabilities subject to master netting arrangements | | 935 | | | — | | | 935 | | | (471) | | | (392) | | | 72 | | |
| Total liabilities | Total liabilities | | $ | 935 | | | $ | — | | | $ | 935 | | | $ | (471) | | | $ | (392) | | | $ | 72 | | |
| Total liabilities | |
| Total liabilities | |
| | Dec 31, 2022 |
| | Gross Amounts Not Offset in the Balance Sheet | |
| | Dec 30, 2023 | | | | Dec 30, 2023 |
| | | | | | | | Gross Amounts Not Offset in the Balance Sheet | |
| (In Millions) | |
| (In Millions) | |
| (In Millions) | (In Millions) | | Gross Amounts Recognized | | Gross Amounts Offset in the Balance Sheet | | Net Amounts Presented in the Balance Sheet | | Financial Instruments | | Cash and Non-Cash Collateral Received or Pledged | | Net Amount | | Gross Amounts Recognized | | Gross Amounts Offset in the Balance Sheet | | Net Amounts Presented in the Balance Sheet | | Financial Instruments | | Cash and Non-Cash Collateral Received or Pledged | | Net Amount |
| Assets: | Assets: | | | | | | | | | | | | |
| Derivative assets subject to master netting arrangements | |
| Derivative assets subject to master netting arrangements | |
| Derivative assets subject to master netting arrangements | Derivative assets subject to master netting arrangements | | $ | 1,231 | | | $ | — | | | $ | 1,231 | | | $ | (546) | | | $ | (682) | | | $ | 3 | |
| Reverse repurchase agreements | Reverse repurchase agreements | | 1,701 | | | — | | | 1,701 | | | — | | | (1,701) | | | — | |
| Total assets | Total assets | | 2,932 | | | — | | | 2,932 | | | (546) | | | (2,383) | | | 3 | |
| Liabilities: | Liabilities: | | | | | | | | | | | | |
| Derivative liabilities subject to master netting arrangements | Derivative liabilities subject to master netting arrangements | | 1,337 | | | — | | | 1,337 | | | (546) | | | (712) | | | 79 | |
| Derivative liabilities subject to master netting arrangements | |
| Derivative liabilities subject to master netting arrangements | |
| Total liabilities | Total liabilities | | $ | 1,337 | | | $ | — | | | $ | 1,337 | | | $ | (546) | | | $ | (712) | | | $ | 79 | |
We obtain and secure available collateral from counterparties against obligations, including securities lending transactions and reverse repurchase agreements, when we deem it appropriate.
Derivatives in Cash Flow Hedging Relationships
The before-tax net gains or losses attributed to cash flow hedges recognized in other comprehensive income (loss) were $53$431 million net loss in the first three months of 2024 ($53 million net gains in the first three months of 2023 ($115 million net losses in the first three months of 2022)2023). Substantially all of our cash flow hedges were foreign currency contracts for all periods presented.
During the first three months of 20232024 and 2022,2023, the amounts excluded from effectiveness testing were insignificant.
| | | | | | | | | | | |
| Financial Statements | Notes to Financial Statements | 1718 |
Derivatives in Fair Value Hedging Relationships
The effects of derivative instruments designated as fair value hedges, recognized in interest and other, net for each period were as follows: | | Gains (Losses) Recognized in Consolidated Condensed Statements of Income on Derivatives | |
| Three Months Ended | |
| | Gains (Losses) on Derivatives Recognized in Consolidated Condensed Statements of Income | |
| | Gains (Losses) on Derivatives Recognized in Consolidated Condensed Statements of Income | |
| | Gains (Losses) on Derivatives Recognized in Consolidated Condensed Statements of Income | |
| | Three Months Ended | |
| (In Millions) | |
| (In Millions) | |
| (In Millions) | (In Millions) | | Apr 1, 2023 | | Apr 2, 2022 | |
| Interest rate contracts | Interest rate contracts | | $ | 192 | | | $ | (711) | | |
| Interest rate contracts | |
| Interest rate contracts | |
| Hedged items | |
| Hedged items | |
| Hedged items | Hedged items | | (192) | | | 711 | | |
| Total | Total | | $ | — | | | $ | — | | |
| Total | |
| Total | |
The amounts recorded on the Consolidated Condensed Balance Sheets related to cumulative basis adjustments for fair value hedges for each period were as follows:
| | | | | | | | | | | | | | | | | | | | | | | | | | | |
| Line Item in the Consolidated Condensed Balance Sheets in Which the Hedged Item is Included | | Carrying Amount of the Hedged Item Asset/(Liabilities) | | Cumulative Amount of Fair Value Hedging Adjustment Included in the Carrying Amount Assets/(Liabilities) | |
| (In Millions) | | Apr 1, 2023 | | Dec 31, 2022 | | Apr 1, 2023 | | Dec 31, 2022 | |
| Long-term debt | | $ | (11,413) | | | $ | (11,221) | | | $ | 584 | | | $ | 776 | | |
The total notional amount of pay-variable and receive-fixed interest rate swaps was $12.0 billion as of April 1, 2023 and $12.0 billion as of December 31, 2022. | | | | | | | | | | | | | | | | | | | | | | | | | | | |
| Line Item in the Consolidated Condensed Balance Sheets in Which the Hedged Item is Included | | Carrying Amount of the Hedged Item Assets/(Liabilities) | | Cumulative Amount of Fair Value Hedging Adjustment Included in the Carrying Amount Assets/(Liabilities) | |
| (In Millions) | | Mar 30, 2024 | | Dec 30, 2023 | | Mar 30, 2024 | | Dec 30, 2023 | |
| Long-term debt | | $ | (11,275) | | | $ | (11,419) | | | $ | 722 | | | $ | 578 | | |
Derivatives Not Designated as Hedging Instruments
The effects of derivative instruments not designated as hedging instruments on the Consolidated Condensed Statements of Income for each period were as follows:
| | | |
| | | | | Three Months Ended | |
| (In Millions) | (In Millions) | | Location of Gains (Losses)
Recognized in Income on Derivatives | | Apr 1, 2023 | | Apr 2, 2022 | |
| (In Millions) | |
| (In Millions) | |
| Foreign currency contracts | |
| Foreign currency contracts | |
| Foreign currency contracts | Foreign currency contracts | | Interest and other, net | | $ | 1 | | | $ | 158 | | |
| Interest rate contracts | Interest rate contracts | | Interest and other, net | | (34) | | | 94 | | |
| Interest rate contracts | |
| Interest rate contracts | |
| Other | |
| Other | |
| Other | Other | | Various | | 115 | | | (134) | | |
| Total | Total | | $ | 82 | | | $ | 118 | | |
| Total | |
| Total | |
Legal Proceedings
We are regularly party to various ongoing claims, litigation, and other proceedings, including those noted in this section. We have accrued a charge of $2.2$1.0 billion related to litigation involving VLSI and a charge of $401 million related to an EC-imposed fine, both as described below. Excluding the VLSI claims, described below, management at present believes that the ultimate outcome of these proceedings, individually and in the aggregate, will not materially harm our financial position, results of operations, cash flows, or overall trends; however, legal proceedings and related government investigations are subject to inherent uncertainties, and unfavorable rulings, excessive verdicts, or other events could occur. Unfavorable resolutions could include substantial monetary damages, fines, or penalties. Certain of these outstanding matters include speculative, substantial, or indeterminate monetary awards. In addition, in matters for which injunctive relief or other conduct remedies are sought, unfavorable resolutions could include an injunction or other order prohibiting us from selling one or more products at all or in particular ways, precluding particular business practices, or requiring other remedies. An unfavorable outcome may result in a material adverse impact on our business, results of operations, financial position, and overall trends. We might also conclude that settling one or more such matters is in the best interests of our stockholders, employees, and customers, and any such settlement could include substantial payments. Except asUnless specifically described below, we have not concluded that settlement of any of the legal proceedings noted in this section is appropriate at this time.
| | | | | | | | | | | |
| Financial Statements | Notes to Financial Statements | 1819 |
European Commission Competition Matter
InIn 2009, the European Commission (EC)EC found that Intelwe had used unfair business practices to persuade customers to buy microprocessors in violation of Article 82 of the EC Treaty (later renumbered Article 102) and Article 54 of the European Economic Area Agreement. In general, the EC found that we violated Article 82 by offering alleged “conditional rebates and payments” that required customers to purchase all or most of their x86 microprocessors from us and by making alleged “payments to prevent sales of specific rival products.” The EC ordered us to end the alleged infringement referred to in its decision and imposed a €1.1 billion fine, which we paid in the third quarter of 2009.
We appealed the EC decision to the European Court of Justice in 2014, after the General Court (then called the Court of First Instance) rejected our appeal of the EC decision in its entirety. In September 2017, the Court of Justice sent the case back to the General Court to examine whether the rebates at issue were capable of restricting competition.
In January 2022, the General Court annulled the EC’s 2009 findings against Intelus regarding rebates, as well as the €1.1 billion fine imposed on Intel, which was returned to us in February 2022. The General Court’s January 2022 decision did not annul the EC’s 2009 finding that we made payments to prevent sales of specific rival products.
In April 2022 the EC appealed the General Court’s decision to the Court of Justice. A hearing dateIn addition, in September 2023 the EC imposed a €376 million ($401 million) fine against us based on the appeal has not been scheduled. The General Court’s January 2022 decision did not annul the EC’s 2009its finding that Intelwe made payments to prevent sales of specific rival products,products. We have appealed the EC’s decision. We have accrued a charge for the fine and in January 2023 the EC reopened its administrative procedure to determine a fine against Intel based on that alleged conduct. Given the procedural posture and the nature of this proceeding, we are unable to make a reasonable estimate of the potential loss or range of losses if any, that might arise fromin excess of this matter.amount given the procedural posture and the nature of these proceedings.
In a related matter, in April 2022 we filed applications with the General Court seeking an order requiring the EC to pay Intelus approximately €593 million in default interest on the original €1.1 billion fine that was held by the EC for 12 years, which applications have been stayed pending the EC’s appeal of the General Court’s January 2022 decision.decision.
Litigation Related to Security Vulnerabilities
In June 2017, a Google research team notified Intel and other companies that it had identified security vulnerabilities, the first variants of which are now commonly referred to as “Spectre” and “Meltdown,” that affect many types of microprocessors, including our products. As is standard when findings like these are presented, we worked together with other companies in the industry to verify the research and develop and validate software and firmware updates for impacted technologies. In January 2018, information on the security vulnerabilities was publicly reported, before software and firmware updates to address the vulnerabilities were made widely available.
Numerous lawsuits have been filed against Intel relating to Spectre, Meltdown, and other variants of the security vulnerabilities that have been identified since 2018. As of January 25, 2023,April 24, 2024, consumer class action lawsuits against Intelus were pending in the United States, Canada,US and Argentina.Canada. The plaintiffs, who purport to represent various classes of purchasers of our products, generally claim to have been harmed by Intel'sour actions and/or omissions in connection with theSpectre, Meltdown, and other variants of this class of security vulnerabilities that have been identified since 2018, and assert a variety of common law and statutory claims seeking monetary damages and equitable relief. In the United States,US, class action suits filed in various jurisdictions between 2018 and 2021 were consolidated for all pretrial proceedings in the US District Court for the District of Oregon, which entered final judgment in favor of Intel in July 2022 based on plaintiffs’ failure to plead a viable claim. Plaintiffs have appealed that decision to theThe Ninth Circuit Court of Appeals.Appeals affirmed the district court’s judgment in November 2023, ending the litigation. In November 2023, new plaintiffs filed a consumer class action complaint in the US District Court for the Northern District of California with respect to a further vulnerability variant disclosed in August 2023 and commonly referred to as “Downfall.” We moved to dismiss that complaint in January 2024. In Canada, an initial status conference has not yet been scheduled in one case relating to Spectre and Meltdown pending in the Superior Court of Justice of Ontario, and a stay of a second case pending in the Superior Court of Justice of Quebec is in effect.In Argentina, Intel Argentina was served with, and responded to, a class action relating to Spectre and Meltdown previously pending in Argentina, plaintiffs’ appeal of a May 2023 order dismissing their complaint for lack of standing was denied in June 2022.February 2024, ending the lawsuit. Additional lawsuits and claims may be asserted seeking monetary damages or other related relief. We dispute the pending claims described above and intend to defend those lawsuits vigorously. Given the procedural posture and the nature of thosethese cases, including that the pending proceedings are in the early stages, that alleged damages have not been specified, that uncertainty exists as to the likelihood of a class or classes being certified or the ultimate size of any class or classes if certified, and that there are significant factual and legal issues to be resolved, we are unable to make a reasonable estimate of the potential loss or range of losses, if any, that might arise from thosethese matters.
Litigation Related to 7nm Product Delay Announcement
Multiple securities class action lawsuits were filed in the US District Court for the Northern District of California against Intelus and certain officers following Intel’sour July 2020 announcement of 7nm product delays. The court consolidated the lawsuits and appointed lead plaintiffs in October 2020, and in January 2021 plaintiffs filed a consolidated complaint. Plaintiffs purport to represent all persons who purchased or otherwise acquired Intelour common stock from October 25, 2019 through October 23, 2020, and they generally allege that defendants violated the federal securities laws by making false or misleading statements about the timeline for 7nm products. In March 2023, the district court granted the defendants’ motion to dismiss the consolidated complaint, with leaveand in April 2023 entered judgment. Plaintiffs appealed, and on April 19, 2024 the Ninth Circuit affirmed the judgment; the Ninth Circuit’s ruling is subject to amend.appeal. Given the procedural posture and the nature of the case, including that it is in the early stages, that alleged damages have not been specified, that uncertainty exists as to the likelihood of a class being certified or the ultimate size of any class if certified, and that there are significant factual and legal issues to be resolved, we are unable to make a reasonable estimate of the potential loss or range of losses, if any, that might arise from the matter. In July 2021, Intelwe introduced a new process node naming structure, and the 7nm process is now called Intel 4.
| | | | | | | | | | | |
| Financial Statements | Notes to Financial Statements | 1920 |
Litigation Related to Patent and IP Claims
We have had IP infringement lawsuits filed against us, including but not limited to those discussed below. Most involve claims that certain of our products, services, and technologies infringe others' IP rights. Adverse results in these lawsuits may include awards of substantial fines and penalties, costly royalty or licensing agreements, or orders preventing us from offering certain features, functionalities, products, or services. As a result, we may have to change our business practices, and develop non-infringing products or technologies, which could result in a loss of revenue for us and otherwise harm our business. In addition, certain agreements with our customers require us to indemnify them against certain IP infringement claims, which can increase our costs as a result of defending such claims, and may require that we pay significant damages, accept product returns, or supply our customers with non-infringing products if there were an adverse ruling in any such claims. In addition, our customers and partners may discontinue the use of our products, services, and technologies, as a result of injunctions or otherwise, which could result in loss of revenue and adversely affect our business.
VLSI Technology LLC v. Intel
In October 2017, VLSI Technology LLC (VLSI) filed a complaint against Intelus in the US District Court for the Northern District of California alleging that various Intel FPGA and processor products infringe eight patents that VLSI acquired from NXP Semiconductors, N.V. (NXP). FourIntel prevailed on all eight patents remain at issue in the case, and VLSI estimates its damages to be approximately $900 million, and seeks enhanced damages, future royalties, attorneys’ fees, costs, and interest. Intel filed Inter Partes Review (IPR) petitions with the Patent Trial and Appeal Board (PTAB) in 2018 challenging patentability, and the parties stipulated to stay the district court action pending the PTAB's review. The PTAB subsequently found all claims of two patents, and some claims of two other patents, to be unpatentable. The district court lifted the stayentered final judgment in September 2021 and scheduled trial for March 2024 on the claims that were found patentable by the PTAB.
In June 2018, VLSI filed a second suit against Intel, in US District Court for the District of Delaware, seeking $4.4 billion in damages for the alleged infringement by various Intel processors of five additional patents that VLSI acquired from NXP. In December 2022, VLSI stipulated to dismiss with prejudice its claims, for which Intel paid nothing. The court dismissed the case in January 2023.
April 2024. Further appeals are possible. In April 2019, VLSI filed three infringement suits against Intelus in the US District Court for the Western District of Texas accusing various Intelof our processors of infringement of eight additional patents it had acquired from NXP. NXP:
▪The first Texas case went to trial in February 2021, and the jury awarded VLSI $1.5 billion for literal infringement of one patent and $675 million for infringement of another patent under the doctrine of equivalents. In April 2022, the court entered final judgment, awarding VLSI $2.2$2.1 billion in damages and approximately $162.3 million in pre-judgment and post-judgment interest. Intel hasWe appealed the judgment to the Federal Circuit Court of Appeals, including itsthe court’s rejection of Intel’s claim to have a license from Fortress Investment Group’s acquisition of Finjan. The Federal Circuit Court heard oral argument in October 2023. In December 2023, the Federal Circuit reversed the finding of infringement as to the patent for which VLSI was awarded $675 million. The Federal Circuit affirmed the finding of infringement as to the patent for which VLSI had been awarded $1.5 billion, but vacated the damages award and sent the case back to the trial court for further damages proceedings on that patent. The Federal Circuit also ruled that Intel can advance the defense that it is licensed to VLSI’s patents. In December 2021 and January 2022 the PTABPatent Trial and Appeal Board (PTAB) instituted IPRsInter Partes Reviews (IPR) on the claims found to have been infringed in the first Texas case, butand in May and June 2023 found all of those claims unpatentable; VLSI has appealed the PTAB’s decision. In March 2024, Intel filed a motion to stay the case pending appeals of the IPRs. In April 2024, Intel moved to add the defense that it has not yet issued a final written decision on either petition.is licensed to VLSI’s patents.
▪The second Texas case went to trial in April 2021, and the jury found that Intel doeswe do not infringe the asserted patents. VLSI had sought approximately $3.0 billion for alleged infringement, plus enhanced damages for willful infringement. The court has not yet entered final judgment following the second trial in Texas. judgment.
▪The third Texas case went to trial in November 2022, with VLSI asserting one remaining patent. The jury found the patent valid and infringed, and awarded VLSI approximately $949 million in damages, plus interest and a running royalty. The court has not yet entered final judgment following the third trial in Texas.judgment. In February 2023, Intelwe filed motions for a new trial and for judgment as a matter of law notwithstanding the verdict on various grounds. Further appeals are possible. In April 2024, Intel moved to add the defense that it is licensed to VLSI’s patents.
In May 2019, VLSI filed a case in Shenzhen Intermediate People’s Court against Intel, Intel (China) Co., Ltd., Intel Trading (Shanghai) Co., Ltd., and Intel Products (Chengdu) Co., Ltd. VLSI assertsasserted one patent against certain Intel Core processors. Defendants filed an invalidation petition in October 2019 with the China National Intellectual Property Administration (CNIPA), which held a hearing in September 2021. CNIPA has not yet issued a decision. The Shenzhen court held trial proceedings in July 2021, and stated that further trial proceedings were needed but would be stayed pending the outcome of defendants’ invalidity challenge at the CNIPA.September 2023. VLSI seekssought an injunction as well as RMB 1.3 million in costs and expenses, but no damages. In September 2023, the CNIPA invalidated every claim of the asserted patent. In November 2023, the trial court dismissed VLSI’s case.
In May 2019, VLSI filed a case in Shanghai Intellectual Property Court against Intel (China) Co., Ltd., Intel Trading (Shanghai) Co., Ltd., and Intel Products (Chengdu) Co., Ltd. asserting one patent against certain Intel core processors. The court held a trial hearing in December 2020, where VLSI requested expenses (RMB 300 thousand) and an injunction. In December 2022, we filed a petition to invalidate the patent at issue. The court held a second trial hearing in May 2022, but has yet to issue its final decision.and in October 2023, issued a decision finding no infringement and dismissing all claims. In December 2022, Intel filed a second petition to invalidateNovember 2023, VLSI appealed the patent at issue.finding of non-infringement.
Intel hasAs of March 30, 2024, we have accrued a charge of approximately $2.2$1.0 billion related to the VLSI litigation. While we dispute VLSI’s claims and intend to vigorously defend against them, we are unable to make a reasonable estimate of losses in excess of recorded amounts given recent developments and future proceedings.
| | | | | | | | | | | |
| Financial Statements | Notes to Financial Statements | 21 |
R2 Semiconductor Patent Litigation
In November 2022, R2 Semiconductor, Inc. (R2) filed a lawsuit in the High Court of Justice in the UK against Intel Corporation (UK) Limited and Intel Corporation, and a lawsuit in the Dusseldorf Regional Court in Germany against Intel Deutschland GmbH and certain Intel customers. R2 asserts one European patent is infringed by Intel’s Ice Lake, Tiger Lake, Alder Lake and Ice Lake Server (Xeon) processors (the accused products), and customer servers and laptops that contain those processors. R2 seeks an injunction in both actions prohibiting the sale and requiring the recall of the alleged infringing products. Intel is indemnifying its customers in the German lawsuit.
Intel disputes R2’s claims and intends to defend the lawsuits vigorously. In December 2022, Intel responded in the UK action that the asserted patent is not infringed and that the patent is invalid. In April 2023, defendants filed statements of defense in the German action that the asserted patent is not infringed and that an injunction would be a disproportionate remedy. In May 2023, defendants also filed a nullity action in the German Federal Patent Court on the ground that the asserted patent is invalid.
In December 2023, the German Federal Patent Court issued a preliminary opinion finding R2’s patent valid. The German Federal Patent Court’s final decision on invalidity is expected in October 2024. In December 2023, the court in Dusseldorf held a trial on the issue of infringement. In February 2024, the court found Intel’s processors infringe and issued an injunction and recall order against Intel and its customers. R2 has not yet sought to enforce the order. Intel has appealed the decision. In April 2024, Intel also filed a complaint with the Constitutional Court seeking a stay and a reversal of the finding of infringement and filed additional evidence with the appeals court to demonstrate that it does not infringe R2’s patent.
In March 2024, Intel filed an action in Milan, Italy seeking an order that it does not infringe R2’s patent.
In April 2024, R2 filed an action against Intel and its customers Dell, HP, and HPE for patent infringement in Paris, France. Intel and its customers have filed a nullity action against the patent in France.
Trial in the UK matter is scheduled for April 2024.
We are unable to make a reasonable estimate of the potential loss or range of losses, if any, that might arise from these lawsuits and the injunction and order of the Dusseldorf Regional Court due to the procedural posture and the nature of these cases, including that there are significant factual and legal issues to be resolved and that uncertainty exists as to, among other things: (i) whether and, if so, at what point in time the order in Germany may take effect, including as a result of a potential stay; (ii) whether and, if so, at what point we may be successful in appealing the decisions in Germany as to infringement and validity, (iii) the extent to which we and our customers are able to mitigate the impact of the injunction of the Dusseldorf Regional Court, (iv) the costs of recalling products if the recall order of the Dusseldorf Regional Court is enforced, (v) the extent to which R2 may be awarded damages, and (vi) the extent to which we may agree to compensate our customers for losses in connection with the injunction and recall and any potential damage award.
| | | | | | | | | | | |
| Financial Statements | Notes to Financial Statements | 2022 |
We use terms throughout our document that are specific to Intel or that are abbreviations that may not be commonly known or used. Below is a list of these terms used in our document.
| | | | | | | | | | | | | | |
| Term | | Definition |
| | | | |
| | | | |
| | | | |
| | |
| | | | |
| | | | |
| | | | |
| | | | |
| | | | |
| | | | |
| 5G | | The fifth-generation mobile network, which brings dramatic improvements in network speeds and latency, and which we view as a transformative technology and opportunity for many industries |
| | | | |
| ADAS | | Advanced driver-assistance systems |
| | |
| AI | | Artificial intelligence |
| | | | |
| ASIC | | | | |
| | Application-specific integrated circuit |
| ASP | | Average selling price |
| | | | |
| | |
| | | | |
| | | | |
| | |
AXGBack end services | | Advanced ComputingIncludes assembly, test and Graphics operating segmentpackaging services |
| CCG | | Client Computing Group operating segment |
| | | | |
| | | | |
| | | | |
| CODM | | Chief operating decision maker |
| | | | |
| | |
| CPU | | Processor or central processing unit
| | | | |
| | | | |
| | | | |
| DCAI | | Data Center and Artificial Intelligence operating segment |
| EC | | European Commission |
| | | | |
| | | | |
| | | | |
| | | | |
| EPS | | Earnings per share | | |
| | | | |
| | | | |
| Form 10-K | | Annual Report on Form 10-K for the year ended December 31, 202230, 2023 |
| Form 10-Q | | Quarterly Report on Form 10-Q for the quarter ended April 1, 2023March 30, 2024 |
| FPGA | | Field-programmable gate array |
| | | | |
| GPU | |
| | |
| |
| | | | |
| | | | |
| | |
| | |
| | | | |
| | |
| | | | |
| HPC | | Graphics processing unitHigh performance computing |
| IDM 2.0 | | Integrated device manufacturer, a semiconductor companyEvolution of our IDM model that both designscombines our internal factory network, strategic use of foundry capacity and builds chips |
| |
| | | | |
| | | | |
| | |
| | |
| | | | |
| | |
| | | | |
| | |
| our IFS | | Intel Foundry Services operating segment business to position us to drive technology and product leadership |
| | |
| | |
| IP | | Intellectual property |
| | | | |
| | | | |
| | | |
| | | | |
| | | | |
| | | | |
| | | | |
| | | | |
| | | | |
| | | | |
| | | | |
| | |
| | |
| IPO | | Initial public offering | | |
| MD&A | | Management's Discussion and Analysis |
| | | | |
| MG&A | | Marketing, general, and administrative |
| | | | |
| | | | |
| MNC | | Multinational corporation | |
| NAND | | NAND flash memory |
| Network Xeon | | Part of the Intel Xeon processor family designed for network and edge solutions
| NEX | | Networking and Edge operating segment |
| | |
| nm | | Nanometer |
| | |
| | | | |
| ODM | | Original design manufacturer
| | |
| | | | |
| | | | |
| | | | |
| | | | |
| | | | |
| | |
| | | | |
| | | | |
| | | |
| | | | |
| | | | |
| | | | |
| | | | |
| | | | |
| | |
| | | | |
| | | | |
| | | | |
| | | | |
| | | | |
| | | | |
| | | | |
| R&D | | Research and development |
| | | | |
| | | | |
| | | | |
| RSU | | Restricted stock unit |
| | | | |
| | | | |
| | | | |
| | | | |
| | | | |
| | |
| SEC | | US Securities and Exchange Commission |
| | | | |
| Smart Capital | | | | Our Smart Capital approach accelerates progress on our IDM 2.0 strategy. This approach is designed to enable us to adjust quickly to opportunities in the market, while managing our margin structure and capital spending. The elements of Smart Capital include capacity investments, government incentives, customer commitments, continued use of external foundries. |
| SoC | | A system on a chip, which integrates most of the components of a computer or other electronic system into a single silicon chip. We offer a range of SoC products in CCG, DCAI, and NEX. In ourOur DCAI and NEX businesses we offer SoCs across many market segments for a variety of applications, including products targeted for 5G base stations and network infrastructure |
| | | | |
| | | | |
| | |
| SSD | | Solid-state drive
| | |
| | | | |
| | | | |
| | | | |
| | | | |
| | | | |
| | | | |
| | | | |
| | | | |
| | | | |
| US | | United States | | |
| US GAAP | | US Generally Accepted Accounting Principles |
| VIE | | Variable interest entity |
| VLSI | | VLSI Technology LLC |
| vRAN | | Virtualized radio access network | |
| | | | |
| | | | |
| | | | |
| | | | |
| | | | |
| | | | | | | | | | | |
| Financial Statements | Notes to Financial Statements | 2123 |
| | | | | |
| Management's Discussion and Analysis | |
| |
This report should be read in conjunction with the Consolidated Financial Statements in our Form 10-K where we include additional information on our business, operating segments, risk factors, critical accounting estimates, policies, and the methods and assumptions used in our estimates, among other important information.We previously announced the organizational change to integrate AXG into CCG and DCAI to drive a more effective go-to-market capability, accelerating the scale of these businesses while further reducing costs. As a result, we modified our segment reporting in the first quarter of 2023 to align to this and certain other business reorganizations. All prior-period segment data has been retrospectively adjusted to reflect the way we internally manage and monitor segment performance starting in fiscal year 2023.
"Note 2: Operating Segments” within Notes to Consolidated Condensed Financial Statements of this Form 10-Q provides additional information about our operating segments including the nature of segment revenues and expenses and reconciles our segment revenues presented below to our total consolidated net revenues, and our segment operating marginincome (loss) presented below to our total consolidated operating marginincome (loss), for each of the periods presented.
For additional key highlights of our results of operations, see "A Quarter in Review."
Intel Products
Intel Products consists substantially of design and development of CPUs and related solutions for third party customers. Intel Products is comprised of three operating segments: CCG, DCAI, and NEX.
Financial Performance
| | | | | | | | | | | | | | |
| Intel Products Operating Segments Revenue $B | | Intel Products Segments Operating Income $B | |
| | |
| Operating Segments Revenue and Segments Operating Income Summary |
Total Intel Products revenue was $11.9 billion in Q1 2024 and $10.2 billion in Q1 2023. Revenue increased primarily due to our CCG operating segment. Total Intel Products operating income increased to $3.3 billion, or 28% operating margin for Q1 2024 from $1.1 billion or 11% operating margin in Q1 2023. This Q1 2024 increase is primarily due to higher CCG revenue, lower period charges across each of the Intel Products' operating segments due to the sell-through of previously reserved inventory and lower reserves taken, and lower CCG operating expenses and sample costs, partially offset by higher Q1 2024 unit costs in DCAI and CCG.
Client Computing Group
We are committed to advancing PC experiences by delivering an annual cadence of leadership products and deepening our relationships with industry partners to co-engineer and deliver leading platform innovation. We engage in an intentional effort focused on a long-termto bring together the operating system, system architecture, hardware, and software application integration that enablesto enable industry-leading PC experiences. We will embrace these opportunities by simplifying and focusing our roadmap, rampingdelivering innovative PC capabilities, even more aggressively, and designing advanced PC experiences even more deliberately.experiences. By doing this, we believe we willhelp continue to fuel innovation across Intel,the industry, providing a growingsolid source of IP, scale, and cash flow.flow for Intel.
Financial Performance
| | | | | | | | | | | | | | |
| CCG Operating Segment Revenue $B | | CCG Segment Operating Income $B | |
| | | | | | | | | | | | |
| ■ |■ Notebook | ■ |■ Desktop | ■ |■ Other | |
| | | | | | | | | | | | | | |
| Operating Segment Revenue Summary |
| | | | | | | | | | | | | | |
Q1 20232024 vs. Q1 20222023 | | | | |
▪Notebook revenue was $3.4$4.7 billion, down $2.6up $1.3 billion from Q1 2022. Notebook volume decreased 37% in Q1 2023 due to customers tempering purchases to reduce existing inventories and due to lower demand. Notebook ASPs decreased 9% in Q1 2023 due to a higher mix of small core and older generation products.
▪Desktopdesktop revenue was $1.9$2.5 billion, down $762up $582 million from Q1 2022. Desktop2023. Notebook volume decreased 32%increased 39% in Q1 2023, driven by lower demand in the small2024 and medium business and education market segments, and due to customers tempering purchases to reduce existing inventories. Desktop ASPsdesktop volume increased 5%29% in Q1 2023 due2024 as customer inventory levels normalized compared to an increased mix of commercialhigher levels in Q1 2023. Notebook and gaming products.desktop ASPs were roughly flat with Q1 2023.
▪Other revenue was $481$391 million, down $241$90 million from Q1 2022,2023 primarily driven by lower demand for our wireless and connectivity products.the exit of legacy businesses.
| | |
| Segment Operating Income Summary |
Operating income decreased 81%increased 124% from Q1 2022,2023, with an operating margin of 9%35%.
| | | | | | | | |
| (In Millions) | | |
| $ | 5202,645 | | | Q1 2023 CCG2024 Operating Income |
(2,358)987 | | | LowerHigher product marginprofit primarily from higher notebook and desktop revenue |
(164)285 | | | Higher desktop unit cost primarily from increased mix of Intel 7 products |
(120) | | | Higher period charges related to excess capacity charges |
251 | | | Lower period charges primarily driven by a decrease in product ramp coststhe sell-through of previously reserved inventory |
200163 | | | Lower operating expenses driven by various cost-cutting measures |
(11)154 | | | OtherLower period charges primarily driven by lower product sample costs |
| (124) | | |
| | |
| | Higher unit costs primarily from increased mix of Intel 4 and Intel 7 products |
| $ | 2,7221,180 | | | Q1 2022 CCG2023 Operating Income |
Data Center and AI
DCAI delivers industry-leadingcutting-edge workload-optimized solutions to cloud service providers and enterprise customers,enterprises, along with silicon devices for communications service providers, network and high-performance computingedge, and HPC customers. We are uniquely positioned to deliver solutionsOur unique capabilities enable us to help solve our customers’customers' most complex challenges with the depth and breadth of our hardware and software portfolio, combined with silicon and platforms, advanced packaging, and at-scale manufacturing made possible by being the world’s only IDM at scale.through a resilient, global supply chain. Our global customers and partners includeencompass cloud hyperscalers, MNCs, small andmultinational corporations, small-and medium-sized businesses,enterprises, independent software vendors, systems integrators, communications service providers, and governments around the world.governments.
Financial Performance
| | | | | | | | | | | |
| DCAI Operating Segment Revenue $B | | DCAI Segment Operating Income (Loss) $B |
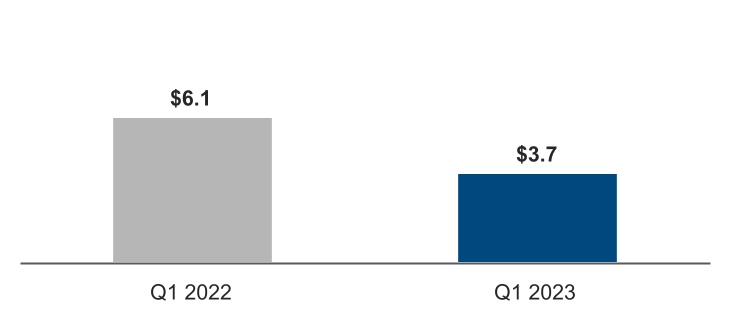
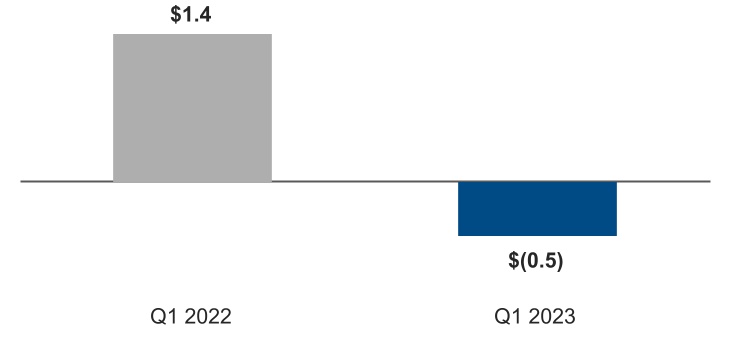
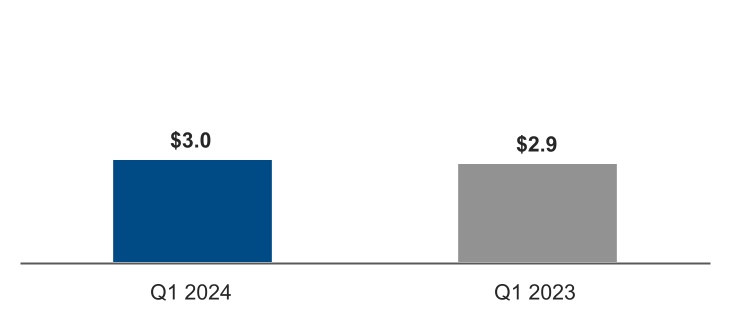
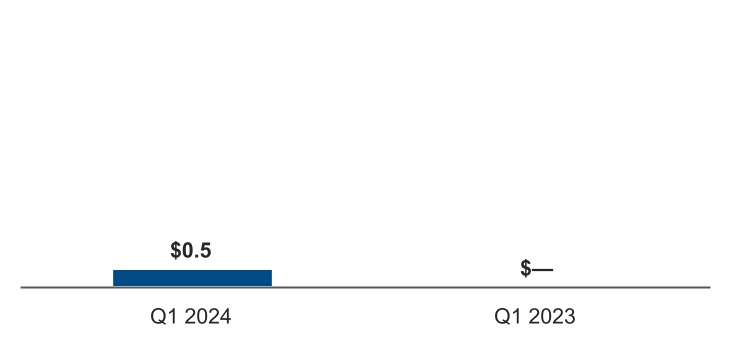
| | |
| Operating Segment Revenue Summary |
| | |
Q1 20232024 vs. Q1 20222023 |
Revenue was $3.7$3.0 billion, down $2.4 billionup $135 million from Q1 2022,2023, driven by a decreasean increase in server revenue. Server ASPs increased 25% primarily due to a lower mix of hyperscale customer-related revenue and a higher mix of high core count products. Server volume decreased 50%13% in Q1 2023,2024, due to lower demand and from customers tempering purchases to reduce existing inventories in a softening data center market. The decrease in server revenue was partially offset by an increase in revenue from the FPGA product line.competitive environment and a higher mix of high core count products.
| | |
Segment Operating Income (Loss) Summary |
We hadOperating income increased $460 million from Q1 2023, with an operating lossmargin of $518 million, compared to operating income of $1.4 billion in Q1 2022.16%.
| | | | | | | | |
| (In Millions) | | |
| $ | (518)482 | | | Q1 2023 DCAI2024 Operating Income (Loss) |
(1,935)429 | | | Lower serverHigher product margin due to lower server revenue, partially offset by an increase in product marginprofit primarily from higher DCAI other productserver revenue |
(257)310 | | | Higher server unit cost from increased mix of 10nm SuperFin products |
(154) | | | Higher period charges related to excess capacity charges |
199 | | | Lower operating expenses driven by various cost-cutting measures |
193 | | | Lower period charges primarily driven by a decrease in product ramp costs |
135 | | | Lower period charges driven by the sell-through of previously reserved inventory and lower reserves taken |
| (279) | | | Higher server unit cost primarily from increased mix of Intel 7 products |
| (92) | |
| Other | |
| $ | 1,39322 | | | Q1 2022 DCAI2023 Operating Income (Loss) |
Network & Edge
NEX lifts the world's networks and edge compute systems from inflexible fixed-function hardware to general-purpose compute, acceleration, and networking devices running cloud native software on programmable hardware. We work with partners and customers to deliver and deploy intelligent edge platforms that allow software developers to achieve agility and to drive automation using AI for efficient operations while securing the integrity of their data at the edge. We have a broad portfolio of hardware and software platforms, tools, and ecosystem partnerships for the rapid digital transformation happening from the cloud to the edge. We are leveraging our core strengths in process, software, and manufacturing at scale to grow traditional markets and to accelerate entry into emerging ones.
Financial Performance
| | | | | | | | | | | |
| NEX Operating Segment Revenue $B | | NEX Segment Operating Income (Loss) $B |
| | |
| Operating Segment Revenue Summary |
| | |
Q1 20232024 vs. Q1 20222023 |
Revenue was $1.5$1.4 billion, down $650$125 million from Q1 2022, as2023 primarily due to 5G customers temperedtempering purchases to reduce existing inventories, partially offset by higher Edge and adjust to a lower demand environment for Edge, Network Xeon and Ethernet products.
revenue.
| | |
| Segment Operating Income (Loss) Summary |
We hadOperating margin increased $253 million from Q1 2023, with an operating lossmargin of $300 million, compared to operating income of $416 million in Q1 2022.13%.
| | | | | | | | | | |
| (In Millions) | | | | |
| $ | (300)184 | | | Q1 2023 NEX2024 Operating Income (Loss) | | |
(475)185 | | | Lower product margin from lower Edge, Network Xeon, and Ethernet revenue | | |
(139) | | | Higher period charges driven by the sell-through of previously reserved inventory and lower reserves taken in Q1 2023 | | |
| | | | |
(102)68 | | | Other including lower operating expenses driven by various cost-cutting measures | | |
| | | | |
| | | | |
| | | | |
| | | | |
| | | | |
| $ | 416(69) | | | Q1 2022 NEX2023 Operating Income (Loss) | | |
MobileyeIntel Foundry
Intel Foundry, comprising our Foundry Technology Development, Foundry Manufacturing and Supply Chain, and Foundry Services organizations, is on a mission to deliver the best systems foundry capabilities to our customers and reshape the world’s semiconductor industry. As the stewards of Moore’s law, we continually innovate and advance world-class silicon process and advanced packaging technologies for customers. Our systems foundry offerings are strengthened by a robust design ecosystem with key industry partners, our systems of chips capabilities, and our secure, resilient and more sustainable supply chain. Our systems foundry is built on the foundation of our silicon process and advanced packaging technology offerings and enables co-optimized solutions for our customers in the AI era. We are strengthening the resilience of the global semiconductor supply chain for leading-edge and mature node semiconductor products by investing in geographically balanced and more sustainable manufacturing capacity. As a systems foundry for the AI era, Intel Foundry brings together these critical components to help our global customers drive the next phase of technology innovation.
Financial Performance
| | | | | | | | | | | |
| Intel Foundry Operating Segment Revenue $B | | Intel Foundry Segment Operating Loss $B |
| | |
| Operating Segment Revenue Summary |
Revenue was $4.4 billion, down $462 million from Q1 2023. Intersegment revenue was $4.3 billion, down $371 million from Q1 2023, driven by lower back end services and product sample revenues. External revenue was $27 million, down $91 million from Q1 2023, driven by lower equipment sales and traditional packaging services.
| | |
| Segment Operating Loss Summary |
We had an operating loss of $2.5 billion, compared to an operating loss of $2.4 billion in Q1 2023.
| | | | | | | | |
| (In Millions) | | |
| $ | (2,474) | | | Q1 2024 Operating Loss |
| (367) | | | Lower product and services profit primarily driven by lower revenue |
| | |
| 300 | | | Lower period charges related to excess capacity charges |
| 209 | | | Lower period charges primarily driven by lower intersegment inventory reserves taken |
| (256) | | | Higher period charges primarily related to factory start-up costs and process development costs |
| | |
| $ | (2,360) | | | Q1 2023 Operating Loss |
All Other
Our "all other" category includes results of operations from our Altera and Mobileye businesses, from "other" non-reportable segments not otherwise presented, from start-up businesses that support our initiatives, and historical results of operations from divested businesses. Altera offers programmable semiconductors, primarily FPGAs, CPLDs, acceleration platforms, software, IP, and related products, for a broad range of applications across our embedded, communications, cloud, and enterprise market segments. Mobileye is a global leader in driving assistance and self-driving solutions. Oursolutions, with a product portfolio is designed to encompass the entire stack required for assisted and autonomous driving, including compute platforms, computer vision, and machine learning-based perception, mapping and localization, driving policy, and active sensors in development. We pioneered ADAS technology more than 20 years ago, and have continuously expanded the scope of our ADAS offerings while leading the evolution to autonomous driving solutions. Our unique assets in ADAS allow for building a scalable self-driving stack that meets the requirements for both robotaxi and consumer-owned autonomous vehicles. Our customers and strategic partners include major global original equipment manufacturers, Tier 1 automotive system integrators, and public transportation operators.
Financial Performance
| | | | | | | | | | | | | | |
| MobileyeAll Other Operating Segments Revenue $B | | MobileyeAll Other Segments Operating Income (Loss) $B | |
| | |
| Operating Segments Revenue and Segments Operating Income (Loss) Summary |
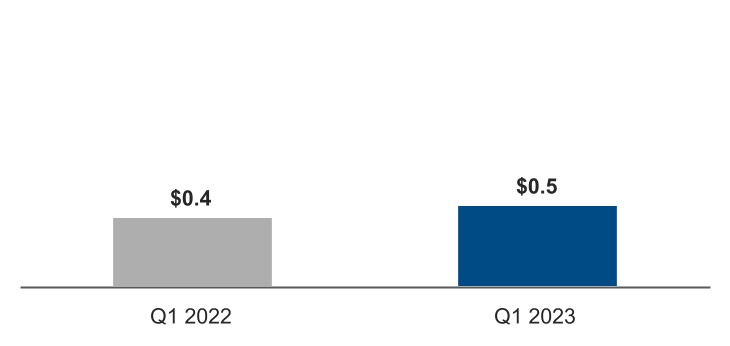
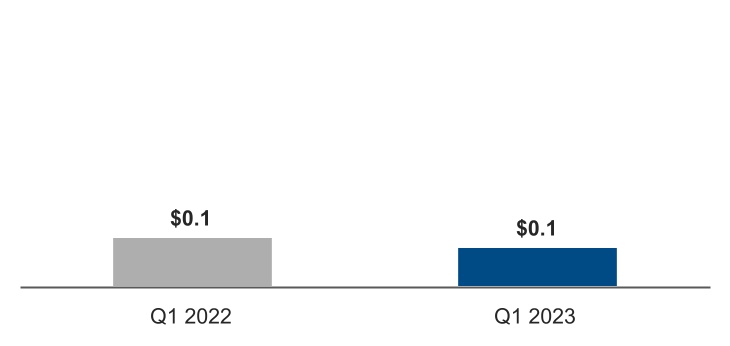
| | | | | | | | |
Revenue and Operating Income Summary | MD&A | 29 |
| | | | | |
Q1 2023 vs. Q1 2022Consolidated Condensed Results of Operations | |
| |
| | | | | | | | | | | | | | | | | | | | | | | | | | | |
| | Three Months Ended | |
| | Q1 2024 | | Q1 2023 | |
| (In Millions, Except Per Share Amounts) | | Amount | | % of Net
Revenue | | Amount | | % of Net
Revenue | |
| Net revenue | | $ | 12,724 | | | 100.0 | % | | $ | 11,715 | | | 100.0 | % | |
| Cost of sales | | 7,507 | | | 59.0 | % | | 7,707 | | | 65.8 | % | |
| Gross margin | | 5,217 | | | 41.0 | % | | 4,008 | | | 34.2 | % | |
| Research and development | | 4,382 | | | 34.4 | % | | 4,109 | | | 35.1 | % | |
| Marketing, general, and administrative | | 1,556 | | | 12.2 | % | | 1,303 | | | 11.1 | % | |
| Restructuring and other charges | | 348 | | | 2.7 | % | | 64 | | | 0.5 | % | |
| Operating income (loss) | | (1,069) | | | (8.4) | % | | (1,468) | | | (12.5) | % | |
| Gains (losses) on equity investments, net | | 205 | | | 1.6 | % | | 169 | | | 1.4 | % | |
| Interest and other, net | | 145 | | | 1.1 | % | | 141 | | | 1.2 | % | |
| Income (loss) before taxes | | (719) | | | (5.7) | % | | (1,158) | | | (9.9) | % | |
| Provision for (benefit from) taxes | | (282) | | | (2.2) | % | | 1,610 | | | 13.7 | % | |
| Net income (loss) | | (437) | | | (3.4) | % | | (2,768) | | | (23.6) | % | |
| Less: Net income (loss) attributable to non-controlling interests | | (56) | | | (0.4) | % | | (10) | | | (0.1) | % | |
| Net income (loss) attributable to Intel | | $ | (381) | | | (3.0) | % | | $ | (2,758) | | | (23.5) | % | |
| | | | | | | | | |
| Earnings (loss) per share attributable to Intel—diluted | | $ | (0.09) | | | | | $ | (0.66) | | | | |
| | | | | | | | | |
Consolidated Revenue
| | | | | | | |
Consolidated Revenue Walk $B1 | |
| | | |
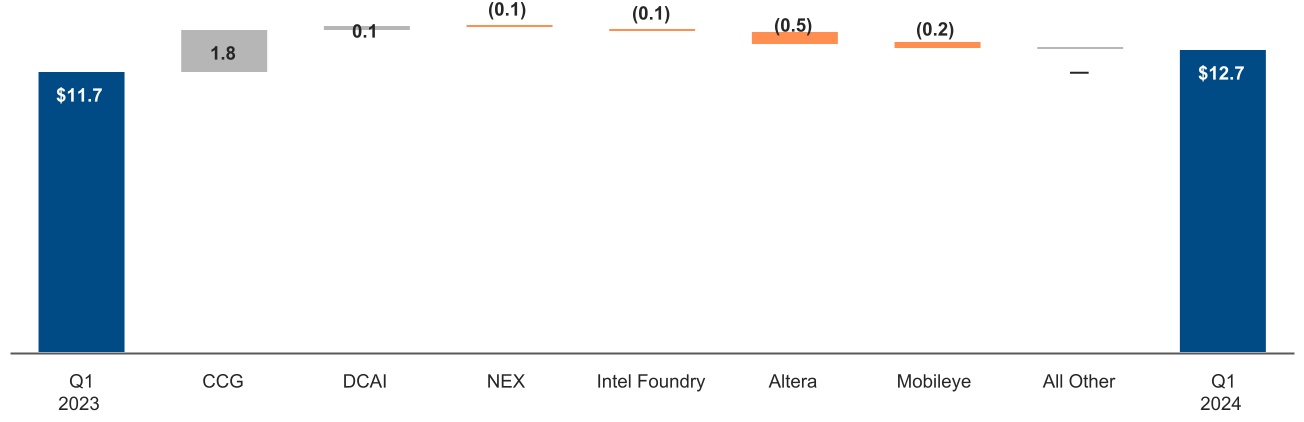
Q1 2024 vs. Q1 2023
Our Q1 2024 revenue was $458 million,$12.7 billion, up $64 million$1.0 billion or 9% from Q1 2022 primarily driven by higher demand for EyeQ® products and Mobileye SuperVision* systems. Operating income was $123 million, down $25 million2023. CCG revenue increased 31% from Q1 2022,2023 primarily due to higher notebook and desktop volumes as customer inventory levels normalized compared to higher levels in Q1 2023. Notebook and desktop ASPs were roughly flat with Q1 2023. DCAI revenue increased investments5% from Q1 2023 due to higher server ASPs primarily due to a lower mix of hyperscale customer-related revenue and a higher mix of high core count products, partially offset by lower server volume due to lower demand in leadershipa competitive environment. NEX revenue decreased 8% primarily due to 5G customers tempering purchases to reduce existing inventories, partially offset by higher Edge and Network Xeon revenue. Altera revenue decreased 58% from Q1 2023 as customers tempered purchases to reduce existing inventories across all product lines and Mobileye revenue decreased 48% from Q1 2023 as customers tempered purchases to reduce existing inventories across EyeQ products. External Intel Foundry revenue decreased 77% from Q1 2023 due to lower multi-beam mask writer tool sales.
Incentives offered to certain customers to accelerate purchases and to strategically position our products with customers for market segment share purposes, particularly in CCG, contributed approximately $1.6 billion to our revenue during Q1 2024 compared to approximately $900 million during Q1 2023. The impacts of these Q1 2024 incentives were contemplated in our financial guidance for Q2 2024, as included in our Form 8-K dated April 25, 2024.
Intel Foundry Services
As the first Open System Foundry, we offer customers differentiated full stack solutions created from the best of Intel and the foundry industry ecosystem, delivered from a secure and sustainable source of supply with an array of flexible business models to enable customers to lead in their industry. In addition to a world-class foundry offering enabled by a rich ecosystem, customers have access to our expertise and technologies, including cores, accelerators, and advanced packaging such as Embedded Multi-die Interconnect Bridge. Our early customers and strategic partners include traditional fabless customers, cloud service providers, automotive customers, and military, aerospace, and defense firms. We also offer mask-making equipment for advanced lithography used by many of the world’s leading-edge foundries.
| | | | | | | | | | | |
| IFS Revenue $B | | IFS Operating Income (Loss) $B |
| | |
Revenue and Operating Income (Loss) Summary |
Revenue was $118 million, down $38 million from Q1 2022 driven by lower sales of multi-beam mask writer tools. We had an operating loss of $140 million, compared to an operating loss of $23 million in Q1 2022, primarily due to increased factory startup costs.
| | | | | |
Consolidated Condensed Results of Operations | |
| |
| | | | | | | | | | | | | | | | | | | | | | | | | | | | | | | | | | |
| | Three Months Ended | | |
| | Q1 2023 | | Q1 2022 | | | | |
| (In Millions, Except Per Share Amounts) | | Amount | | % of Net
Revenue | | Amount | | % of Net
Revenue | | | | | | | | |
| Net revenue | | $ | 11,715 | | | 100.0 | % | | $ | 18,353 | | | 100.0 | % | | | | | | | | |
| Cost of sales | | 7,707 | | | 65.8 | % | | 9,109 | | | 49.6 | % | | | | | | | | |
| Gross margin | | 4,008 | | | 34.2 | % | | 9,244 | | | 50.4 | % | | | | | | | | |
| Research and development | | 4,109 | | | 35.1 | % | | 4,362 | | | 23.8 | % | | | | | | | | |
| Marketing, general, and administrative | | 1,303 | | | 11.1 | % | | 1,752 | | | 9.5 | % | | | | | | | | |
| Restructuring and other charges | | 64 | | | 0.5 | % | | (1,211) | | | (6.6) | % | | | | | | | | |
| Operating income (loss) | | (1,468) | | | (12.5) | % | | 4,341 | | | 23.7 | % | | | | | | | | |
| Gains (losses) on equity investments, net | | 169 | | | 1.4 | % | | 4,323 | | | 23.6 | % | | | | | | | | |
| Interest and other, net | | 141 | | | 1.2 | % | | 997 | | | 5.4 | % | | | | | | | | |
| Income (loss) before taxes | | (1,158) | | | (9.9) | % | | 9,661 | | | 52.6 | % | | | | | | | | |
| Provision for taxes | | 1,610 | | | 13.7 | % | | 1,548 | | | 8.4 | % | | | | | | | | |
| Net income (loss) | | (2,768) | | | (23.6) | % | | 8,113 | | | 44.2 | % | | | | | | | | |
| Less: Net income (loss) attributable to non-controlling interests | | (10) | | | (0.1) | % | | — | | | — | % | | | | | | | | |
| Net income (loss) attributable to Intel | | $ | (2,758) | | | (23.5) | % | | $ | 8,113 | | | 44.2 | % | | | | | | | | |
| | | | | | | | | | | | | | | | |
| Earnings (loss) per share attributable to Intel—diluted | | $ | (0.66) | | | | | $ | 1.98 | | | | | | | | | | | |
| | | | | | | | | | | | | | | | |
Revenue
Q1 2023 results were impacted by an uncertain macroeconomic environment, with slowing consumer and enterprise demand, persistent inflation, and higher interest rates, that we believe impacts our target markets and creates a high level of uncertainty with our customers. We believe CCG, DCAI, and NEX customers, among others, tempered purchases to reduce their existing inventories and adjust to the macroeconomic uncertainty. We expect this macroeconomic uncertainty and the challenging market environment will continue during 2023.
Q1 2023 vs. Q1 2022
Our Q1 2023 revenue was $11.7 billion, down $6.6 billion or 36% from Q1 2022. CCG revenue decreased 38% from Q1 2022 due to lower notebook and desktop volumes on lower demand, while notebook ASPs decreased due to a higher mix of small core and older generation products. DCAI revenue decreased 39% from Q1 2022 due to lower server volume resulting from a softening data center market, partially offset by an increase in revenue from the FPGA product line. NEX revenue decreased 30% from Q1 2022, due to lower demand for Edge, Network Xeon, and Ethernet products.
Incentives offered to certain customers to compete in the market, accelerate purchases, and to strategically position our products with customers for market segment share purposes, particularly in CCG, contributed approximately $900 million to our revenue during the first quarter of 2023, the impacts of which were contemplated in our financial guidance for Q2 2023 as included in our Form 8-K dated April 27, 2023.
Gross Margin
We derived mosta substantial majority of our overall gross margin in Q1 20232024 primarily from the sale of products in theour Intel Products business sales through our CCG, DCAI, and DCAINEX operating segments. Our overall gross margin dollars in Q1 2023 decreased2024 increased by $5.2$1.2 billion, or 57%30%, compared to Q1 2022.2023.
| | |
Consolidated Gross Margin $B1 |
|
(Percentages in chart indicate gross margin as a percentage of total revenue)
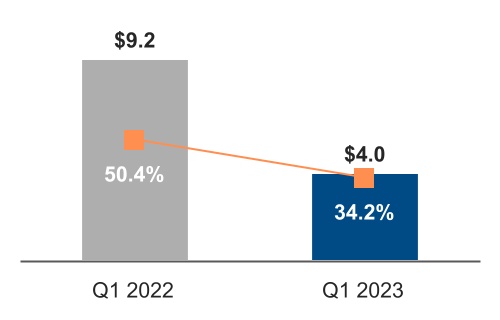
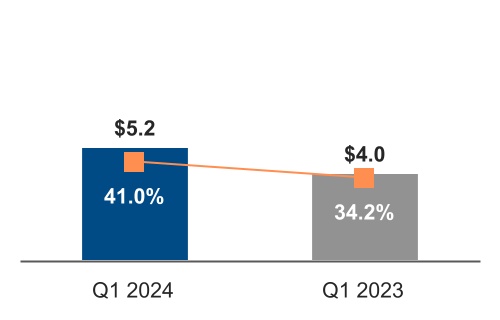
| | | | | | | | |
| (In Millions) | | |
| $ | 4,0085,217 | | | Q1 20232024 Gross Margin |
(2,358)1,079 | | | LowerHigher product marginprofit primarily from lowerhigher notebook and desktop revenue |
(1,935)553 | | | Lower serverperiod charges driven by the sell-through of previously reserved inventory and lower reserves taken |
| 407 | | | Higher product marginprofit primarily due to lower revenue, partially offset by an increase in product margin from higher DCAI other productserver revenue |
(475)300 | | | Lower period charges related to excess capacity charges |
| 138 | | | Lower period charges primarily driven by a decrease in product sample costs |
| (540) | | | Lower product marginprofit primarily from lower Edge, Network Xeon,Altera and EthernetMobileye revenue |
(421)(313) | | | Higher unit cost primarily from increased mix of Intel 7 and 10nm SuperFinIntel 4 products |
(352)(213) | | | Higher period charges primarily related to excess capacity chargesfactory start-up costs and process development costs |
444 (202) | | | Lower period charges primarily driven by a decrease in product ramp costs |
| | |
| | |
| | |
| | |
(139) | | | Other |
| $ | 9,2444,008 | | | Q1 20222023 Gross Margin |
1 Excludes intersegment activity
Effective January 2023, we increased the estimated useful life of certain production machinery and equipment from 5 years to 8 years. We estimate this change resulted in an approximate $360 million increase to gross margin, an approximate $100 million decrease in R&D expenses, and an approximate $525 million decrease in ending inventory values in Q1 2023 when compared to what the impact would have been using the estimated useful life in place prior to this change.
When compared to the estimated useful life in place as of the end of 2022, we expect total depreciation expense in 2023 to be reduced by $4.1 billion. We expect this change will result in an approximately $2.3 billion increase to gross margin, a $400 million decrease in R&D expenses, and a $1.4 billion decrease in ending inventory values.
Consolidated Operating Expenses
Total R&D and MG&A expenses for Q1 20232024 were $5.4$5.9 billion, down 11%up 10% from Q1 2022.2023. These expenses represent 46.7% of revenue for Q1 2024 and 46.2% of revenue for Q1 2023 and 33.3% of revenue for Q1 2022.2023. In support of our strategy, described in our 20222023 Form 10-K, we continue to make significant investments to accelerate our process technology roadmap. This requires continued investments in R&D and focused efforts to attract and retain talent. We have implemented certain cost-cutting measures whilecontinue to focus on cost efficiency initiatives that may offset some of the incremental costs that may be required periodically as we continue to improve our product execution.execution and cost structure.
| | | | | | | | | | | |
| Research and Development $B | | Marketing, General, and Administrative $B |
| |
(Percentages in chart indicate operating expenses as a percentage of total revenue)
Q1 20232024 vs. Q1 20222023
| | | | | |
R&D decreasedincreased by $253$273 million, or 6%7%, driven by the following: |
| |
-+ | LowerHigher share-based compensation and incentive-based cash compensation |
+- | Increased investments in our process technology roadmap and additional corporate spending to drive strategic growth, partially offset by theThe effects of various cost-cutting measures |
| |
| |
| |
| | |
| Marketing, General, and Administrative |
Q1 20232024 vs. Q1 20222023
| | | | | |
MG&A decreasedincreased by $449$253 million, or 26%19%, driven by the following: |
| |
-+ | Lower corporate spending as a result of various cost-cutting measures |
- | LowerHigher share-based compensation and incentive-based cash compensation |
| + | Increase in corporate spending, primarily from higher marketing expenses |
| |
| |
| |
| |
Restructuring and Other Charges
| | | | | | | | | | | | | | | | | | |
| | | | | | |
| (In Millions) | | Q1 2024 | | Q1 2023 | | | | |
| Employee severance and benefit arrangements | | $ | 129 | | | $ | (39) | | | | | |
| | | | | | | | |
| Litigation charges and other | | — | | | 77 | | | | | |
| Asset impairment charges | | 219 | | | 26 | | | | | |
| Total restructuring and other charges | | $ | 348 | | | $ | 64 | | | | | |
Employee severance and benefit arrangements includes a charge of $129 million in Q1 2024 relating to actions taken to streamline operations and to reduce costs.
Asset impairment charges includes a goodwill impairment loss of $222 million in Q1 2024 related to our new Intel Foundry reporting unit. Refer to "Note 2: Operating Segments" within Notes to Consolidated Condensed Financial Statements for further information.
Restructuring and Other Charges
| | | | | | | | | | | | | | | | | | | |
| (In Millions) | | Q1 2023 | | Q1 2022 | | | | | |
| Employee severance and benefit arrangements | | $ | (39) | | | $ | 5 | | | | | | |
| | | | | | | | | |
| Litigation charges and other | | 77 | | | (1,216) | | | | | | |
| Asset impairment charges | | 26 | | | — | | | | | | |
| Total restructuring and other charges | | $ | 64 | | | $ | (1,211) | | | | | | |
The 2022 Restructuring Program was approved in Q3 2022 to rebalance our workforce and operations to create efficiencies and improve our product execution in alignment with our strategy. During Q1 2023, activity related to the 2022 Restructuring Program substantially related to cash settlement of previously accrued employee severance and benefit arrangements and we expect any additional actions pursuant to the 2022 Restructuring Program to be substantially completed by the end of 2023, but this is subject to change. We expect that our 2022 Restructuring Plan, in conjunction with other initiatives, will reduce our cost structure and allow us to reinvest certain of these cost savings in resources and capacity to develop, manufacture, market, sell, and deliver our products in furtherance of our strategy.
Litigation charges and other includes a $1.2 billion benefit in Q1 2022 from the annulled penalty related to an EC fine that was recorded and paid in 2009.
Gains (Losses) on Equity Investments and Interest and Other, Net
| | | | | | | | | | | | | | | | | | | | | | | | | |
| (In Millions) | | Q1 2023 | | Q1 2022 | | | | | | | | | |
| Ongoing mark-to-market adjustments on marketable equity securities | | $ | 188 | | | $ | (430) | | | | | | | | | | |
| Observable price adjustments on non-marketable equity securities | | 10 | | | 71 | | | | | | | | | | |
| Impairment charges | | (36) | | | (23) | | | | | | | | | | |
Sale of equity investments and other | | 7 | | | 4,705 | | | | | | | | | | |
| Total gains (losses) on equity investments, net | | $ | 169 | | | $ | 4,323 | | | | | | | | | | |
| | | | | | | | | | | | | |
| Interest and other, net | | $ | 141 | | | $ | 997 | | | | | | | | | | |
Gains (losses) on equity investments, net | | | | | | | | | | | | | | | | | | | |
| (In Millions) | | Q1 2024 | | Q1 2023 | | | | | |
| Ongoing mark-to-market adjustments on marketable equity securities | | $ | (91) | | | $ | 188 | | | | | | |
| Observable price adjustments on non-marketable equity securities | | 24 | | | 10 | | | | | | |
| Impairment charges | | (69) | | | (36) | | | | | | |
Sale of equity investments and other | | 341 | | | 7 | | | | | | |
| Total gains (losses) on equity investments, net | | $ | 205 | | | $ | 169 | | | | | | |
| | | | | | | | | |
| Interest and other, net | | $ | 145 | | | $ | 141 | | | | | | |
Ongoing mark-to-market adjustments for Q1 2024 were primarily driven by our interests in Astera Labs, Inc and Montage Technology Co., Ltd; Q1 2023 and Q1 2022 werewas primarily related to our interest in Montage Technology Co., Ltd and others.
In Q1 2022, the sale of McAfee to an investor group was completed and2024, we received $4.6 billion in cash for the sale of our remaining share of McAfee, recognizingrecognized a $4.6 billion gain in$336 million initial fair value adjustment within sale of equity investments and other.upon Astera Labs, Inc shares becoming marketable.
Interest and other, net
In 2022, we recognized a gain of $1.0 billion from the first closing of the divestiture of our NAND memory business.
Provision for (Benefit from) Taxes
| | (In Millions) | (In Millions) | | Q1 2023 | | Q1 2022 | |
| (In Millions) | |
| (In Millions) | |
| Income (loss) before taxes | Income (loss) before taxes | | $ | (1,158) | | | $ | 9,661 | | |
| Provision for taxes | | $ | 1,610 | | | $ | 1,548 | | |
| Income (loss) before taxes | |
| Income (loss) before taxes | |
| Provision for (benefit from) taxes | |
| Provision for (benefit from) taxes | |
| Provision for (benefit from) taxes | |
| Effective tax rate | Effective tax rate | | (139.0) | % | | 16.0 | % | |
| Effective tax rate | |
| Effective tax rate | |
In Q1 2023,2024, we recognized a provision forbenefit from taxes as we applied our estimated annualyear-to-date actual effective tax rate to our year-to-date measure of ordinary income (loss) before taxes, which reflects a higher proportionour jurisdictional mix of ourordinary income being taxed in non-US jurisdictions. and losses.
Our effective tax rate decreased in Q1 2023 compared to Q1 2022, due to a loss beforeprovision for, or benefit from, income taxes the application of ourfor an interim period has historically been determined using an estimated annual effective tax rate, adjusted for discrete items, if any. Under certain circumstances where we are unable to make a reliable estimate of the annual effective tax rate, we use the actual effective tax rate for the year-to-date period. In Q1 2024, we used the actual effective tax rate approach due to the variability of the rate as a result of fluctuations in forecasted income and the unfavorableeffects of being taxed in multiple tax rate effects associated with the gains recognized in jurisdictions.
Q1 2022 from the equity sale of McAfee and the divestiture of our NAND memory business.
Liquidity and Capital Resources
We consider the following when assessing our liquidity and capital resources:
| | (In Millions) | (In Millions) | | Apr 1, 2023 | | Dec 31, 2022 | (In Millions) | | Mar 30, 2024 | | Dec 30, 2023 |
| Cash and cash equivalents | Cash and cash equivalents | | $ | 8,232 | | | $ | 11,144 | |
| Short-term investments | Short-term investments | | 19,302 | | | 17,194 | |
| | Loans receivable and other | | 64 | | | 463 | |
Total cash and investments1 | | $ | 27,598 | | | $ | 28,801 | |
| | Total cash and short-term investments | |
| | Total cash and short-term investments | |
| | Total cash and short-term investments | |
| | Total debt | Total debt | | $ | 50,273 | | | $ | 42,051 | |
| | Total debt | |
| | Total debt | |
We believe we have sufficient sources of funding to meet our business requirements for the next 12 months and in the longer term. Cash generated by operations, supplemented by ourand total cash and short-term investments1, as shown in the preceding table, isare our primary sourcesources of liquidity for funding our strategic business requirements. These sources are further supplemented by our committed credit facilities and other borrowing capacity and certain other Smart Capital initiatives that we have undertaken. Our short-term funding requirements include capital expenditures for worldwide manufacturing and assembly and test, including investments in our process technology roadmap; working capital requirements; and potential and pending acquisitions, strategic investments, and dividends. This includes a commitment of $5.4 billion associated with our pending acquisition of Tower. Our long-term funding requirements incrementally contemplate investments in significant manufacturing expansion plans and investments to accelerate our process technology.
Our total cash and short-term investments and related cash flows may be affected by certain discretionary actions we may take with customers and suppliers to accelerate or delay certain cash receipts or payments to manage liquidity for our strategic business requirements. These actions can include, among others, negotiating with suppliers to optimize our payment terms and conditions, adjusting the timing of cash flows associated with customer sales programs and collections, managing inventory levels and purchasing practices, and selling certain of our accounts receivables on a non-recourse basis to third party financial institutions.
We expect to continue to benefit from government incentives, and any incentives above our current expectations would enable us to increase the pace and size of our IDM 2.0 investments. Conversely, incentives below our expectations would increase our anticipated cash requirements.requirements and/or potentially curtail planned investments.
In Q1 2023, weApril 2024 our Board of Directors declared a reduced quarterly dividend of $0.125 per share on the company’s common stock, which will be payable on June 1, 2024, to stockholders of record as of May 7, 2024. Future declarations of dividends and the establishment of future record and payment dates are subject to the final determination of our common stock. This dividend reduction reflects our deliberate approach to capital allocation, is expected to support the critical investments needed to execute our business strategy, and is designed to position us to create long-term value.Board of Directors.
In Q1 2023,2024, we issued a total of $11.0$2.6 billion aggregate principal amount of senior notes. We intend to use the proceeds from the offeringnotes for general corporate purposes, including, but not limited to, refinancing of outstanding debt and funding for working capital and capital expenditures. We also amendedexpanded both our 5-year $5.0 billion revolving credit facility extending the maturity date by one year to March 2028,agreement and our 364-day $5.0 billion credit facility agreement, extendingto $7.0 billion and $8.0 billion, respectively, and the maturity datedates were extended by one year to March 2024.February 2029 and January 2025, respectively. We have other potential sources of liquidity includeincluding our commercial paper program and our automatic shelf registration statement on file with the SEC, pursuant to which we may offer an unspecified amount of debt, equity, and other securities. Under our commercial paper program, we have an ongoing authorization from our Board of Directors to borrow up to $10.0 billion and, asbillion. As of April 1, 2023March 30, 2024, we had $1.0 billion$793 million of commercial paper obligations outstanding. As of April 1, 2023,March 30, 2024, we had no outstanding borrowings on the revolving credit facilities.
We maintain a diverse investment portfolio that we continually analyze based on issuer, industry, and country. Substantially all of our investments in debt instruments and financing receivables were in investment-grade securities.
| | | | | | | | | | | | | | | | | |
| Cash from (used for) Operations $B | | Capital Expenditures $B | | Dividends $B |
1Cash flows from operating, investing and financing activities for Q1 2024 and Q1 2023 were as follows: See "Non-GAAP Financial Measures" within MD&A.
| | Three Months Ended |
| | Three Months Ended | | | | Three Months Ended |
| (In Millions) | (In Millions) | | Apr 1, 2023 | | Apr 2, 2022 | (In Millions) | | Mar 30, 2024 | | Apr 1, 2023 |
| Net cash provided by (used for) operating activities | Net cash provided by (used for) operating activities | | $ | (1,785) | | | $ | 5,891 | |
| Net cash used for investing activities | | (8,521) | | | (2,639) | |
| Net cash provided by (used for) investing activities | |
| Net cash provided by (used for) financing activities | Net cash provided by (used for) financing activities | | 7,394 | | | (1,864) | |
| | Net increase (decrease) in cash and cash equivalents | Net increase (decrease) in cash and cash equivalents | | $ | (2,912) | | | $ | 1,388 | |
| Net increase (decrease) in cash and cash equivalents | |
| Net increase (decrease) in cash and cash equivalents | |
Operating Activities
Operating cash flows consist of net income adjusted for certain non-cash items and changes in certain assets and liabilities.
The decrease in cash provided byused for operations in the first three months of 20232024 was primarily driven by oura lower net operating loss in comparisoncompared to our net operating income for the first three months of 2022.2023, partially offset by certain cash unfavorable changes in working capital.
Investing Activities
Investing cash flows consist primarily of capital expenditures; investment purchases, sales, maturities, and disposals; and proceeds from divestitures.capital-related government incentives.
Cash used for investing activities was higherlower in the first three months of 20232024 compared to the first three months of 2022,2023, primarily due to the absencelower purchases of short-term investments; lower additions to property, plant, and equipment; and increased proceeds from the divestiturecapital-related government incentives. These favorable cash impacts were partially offset by lower maturities and sales of our NAND businessshort-term investments and proceeds for our remaining share of McAfee, both of which occurred in the first three months of 2022; as well as higher capital expenditures in the first three months of 2023. Thesecertain other cash unfavorable cash impactsinvesting activities during the first three months of 2023 were partially offset by the favorable cash impacts of lower purchases of short-term investments, net of maturities and sales, during the first three months of 2023.2024.
Financing Activities
Financing cash flows consist primarily of payment of dividends to stockholders, issuance and repayment of short-term and long-term debt, and proceeds from the sale of shares of common stock through employee equity incentive plans.partner contributions and equity-related issuances.
Cash provided by financing activities was lower in the first three months of 20232024 compared to the first three months of 2023. This decrease was primarily due to a reduction in net proceeds from our debt and commercial paper issuances, net of commercial paper repayments; partially offset by the cash used for financing activitiesfavorable impacts of reduced dividend payments in the first three months of 2022 was primarily due to net proceeds from our debt issuance, partially offset by commercial paper repayments, during the first three months of 2023.
Non-GAAP Financial Measures
In addition to disclosing financial results in accordance with US GAAP, this document contains references to the non-GAAP financial measures below. We believe these non-GAAP financial measures provide investors with useful supplemental information about our operating performance, enable comparison of financial trends and results between periods where certain items may vary independent of business performance, and allow for greater transparency with respect to key metrics used by management in operating our business and measuring our performance. These non-GAAP financial measures are used in our performance-based RSUs and our cash bonus plans.
Our non-GAAP financial measures reflect adjustments based on one or more of the following items, as well as the related income tax effects. Beginning in 2023, incomeIncome tax effects are calculated using a fixed long-term projected tax rate of 13% across all adjustments. We project this long-term non-GAAP tax rate on an annual basis using a five-year non-GAAP financial projection that excludes the income tax effects of each adjustment. The projected non-GAAP tax rate also considers factors such as our tax structure, our tax positions in various jurisdictions, and key legislation in significant jurisdictions where we operate. This long-term non-GAAP tax rate may be subject to change for a variety of reasons, including the rapidly evolving global tax environment, significant changes in our geographic earnings mix, or changes to our strategy or business operations. Management uses this non-GAAP tax rate in managing internal short- and long-term operating plans and in evaluating our performance; we believe this approach facilitates comparison of our operating results and provides useful evaluation of our current operating performance. Prior-period non-GAAP results have been retroactively adjusted to reflect this updated approach.
TheseOur non-GAAP financial measures should not be considered a substitute for, or superior to, financial measures calculated in accordance with US GAAP, and the financial results calculated in accordance with US GAAP and reconciliations from these results should be carefully evaluated.
| | | | | | | | |
| Non-GAAP adjustment or measure | Definition | Usefulness to management and investors |
| | |
| Acquisition-related adjustments | Amortization of acquisition-related intangible assets consists of amortization of intangible assets such as developed technology, brands, and customer relationships acquired in connection with business combinations. Charges related to the amortization of these intangibles are recorded within both cost of sales and MG&A in our US GAAP financial statements. Amortization charges are recorded over the estimated useful life of the related acquired intangible asset, and thus are generally recorded over multiple years. | We exclude amortization charges for our acquisition-related intangible assets for purposes of calculating certain non-GAAP measures because these charges are inconsistent in size and are significantly impacted by the timing and valuation of our acquisitions. These adjustments facilitate a useful evaluation of our current operating performance and comparison to our past operating performance and provide investors with additional means to evaluate cost and expense trends. |
| Share-based compensation | Share-based compensation consists of charges related to our employee equity incentive plans. | We exclude charges related to share-based compensation for purposes of calculating certain non-GAAP measures because we believe these adjustments provide better comparability to peer company results and because these charges are not viewed by management as part of our core operating performance. We believe these adjustments provide investors with a useful view, through the eyes of management, of our core business model, how management currently evaluates core operational performance, and additional means to evaluate expense trends, including in comparison to other peer companies. |
| | |
| | |
| Restructuring and other charges | Restructuring charges are costs associated with a formal restructuring plan and are primarily related to employee severance and benefit arrangements. Other charges may include periodic goodwill and asset impairments, certain pension charges, and costs associated with restructuring activity, and in Q1 2022 includes a benefit related to the annulled EC fine.activity. | We exclude restructuring and other charges, including any adjustments to charges recorded in prior periods, for purposes of calculating certain non-GAAP measures because these costs do not reflect our core operating performance. These adjustments facilitate a useful evaluation of our core operating performance and comparisons to past operating results and provide investors with additional means to evaluate expense trends. |
Gains (losses)(Gains) losses on equity investments, net | (Gains) losses on equity investments, net consists of ongoing mark-to-market adjustments on marketable equity securities, observable price adjustments on non-marketable equity securities, related impairment charges, and the sale of equity investments and other. | We exclude these non-operating gains and losses for purposes of calculating certain non-GAAP measures because it provides comparability between periods. The exclusion reflects how management evaluates the core operations of the business. |
| | | | | | | | |
| (Gains) losses from divestiture | Gains (losses)(Gains) losses are recognized at the close of a divestiture, or over a specified deferral period when deferred consideration is received at the time of closing. Based on our ongoing obligation under the NAND wafer manufacturing and sale agreement entered into in connection with the first closing of the sale of our NAND memory business on December 29, 2021, a portion of the initial closing consideration was deferred and will be recognized between first and second closing. | We exclude gains or losses resulting from divestitures for purposes of calculating certain non-GAAP measures because they do not reflect our current operating performance. These adjustments facilitate a useful evaluation of our current operating performance and comparisons to past operating results. |
| (Gains) losses on equity investments, net | (Gains) losses on equity investments, net consists of ongoing mark-to-market adjustments on marketable equity securities, observable price adjustments on non-marketable equity securities, related impairment charges, and the sale of equity investments and other. | We exclude these non-operating gains and losses for purposes of calculating certain non-GAAP measures because it provides better comparability between periods. The exclusion reflects how management evaluates the core operations of the business.
| | |
| | |
| Adjusted free cash flow | We reference a non-GAAP financial measure of adjusted free cash flow, which is used by management when assessing our sources of liquidity, capital resources, and quality of earnings. Adjusted free cash flow is operating cash flow adjusted for (1) additions to property, plant, and equipment, net of proceeds from capital grantscapital-related government incentives and partner contributions, and (2) payments on finance leases, and (3) proceeds from the McAfee equity sale.leases. | This non-GAAP financial measure is helpful in understanding our capital requirements and sources of liquidity by providing an additional means to evaluate the cash flow trends of our business. Since the 2017 divestiture, McAfee equity distributions and sales contributed to prior operating and free cash flow, and while the McAfee equity sale in Q1 2022 would have typically been excluded from adjusted free cash flow as an equity sale, we believe including the sale proceeds in adjusted free cash flow facilitate a better, more consistent comparison to past presentations of liquidity. |
Total cash and investments | Total cash and investments is used by management when assessing our sources of liquidity, which include cash and cash equivalents, short-term investments, and loans receivable and other. | This non-GAAP measure is helpful in understanding our capital resources and liquidity position. |
| | |
| | |
Following are the reconciliations of our most comparable US GAAP measures to our non-GAAP measures presented:
| | | Three Months Ended | |
| | Three Months Ended | |
| | Three Months Ended | |
| | Mar 30, 2024 | |
| | Mar 30, 2024 | |
| | Mar 30, 2024 | |
| | | Three Months Ended | |
| | Apr 1, 2023 | | Apr 2, 2022 | |
| | Gross margin percentage | |
| | Gross margin percentage | |
| | Gross margin percentage | Gross margin percentage | | 34.2 | % | | 50.4 | % | |
| Acquisition-related adjustments | Acquisition-related adjustments | | 2.8 | % | | 1.9 | % | |
| Acquisition-related adjustments | |
| Acquisition-related adjustments | |
| Share-based compensation | Share-based compensation | | 1.4 | % | | 0.8 | % | |
| Share-based compensation | |
| Share-based compensation | |
| | Non-GAAP gross margin percentage | |
| | Non-GAAP gross margin percentage | |
| | Non-GAAP gross margin percentage | Non-GAAP gross margin percentage | | 38.4 | % | | 53.1 | % | |
| | | Earnings (loss) per share attributable to Intel—diluted | Earnings (loss) per share attributable to Intel—diluted | | $ | (0.66) | | | $ | 1.98 | | |
| | Earnings (loss) per share attributable to Intel—diluted | |
| | Earnings (loss) per share attributable to Intel—diluted | |
| Acquisition-related adjustments | |
| Acquisition-related adjustments | |
| Acquisition-related adjustments | Acquisition-related adjustments | | 0.09 | | | 0.10 | | |
| | Share-based compensation | Share-based compensation | | 0.18 | | | 0.17 | | |
| | Share-based compensation | |
| | Share-based compensation | |
| | Restructuring and other charges | Restructuring and other charges | | 0.01 | | | (0.30) | | |
| | Restructuring and other charges | |
| | Restructuring and other charges | |
| (Gains) losses on equity investments, net | (Gains) losses on equity investments, net | | (0.04) | | | (1.05) | | |
| (Gains) losses on equity investments, net | |
| (Gains) losses on equity investments, net | |
| (Gains) losses from divestiture | |
| (Gains) losses from divestiture | |
| (Gains) losses from divestiture | (Gains) losses from divestiture | | (0.01) | | | (0.27) | | |
| | Total adjustments attributable to non-controlling interest | | — | | | — | | |
| Adjustments attributable to non-controlling interest | |
| | Adjustments attributable to non-controlling interest | |
| | Adjustments attributable to non-controlling interest | |
| Income tax effects | |
| Income tax effects | |
| Income tax effects | Income tax effects | | 0.39 | | | 0.24 | | |
| | Non-GAAP earnings (loss) per share attributable to Intel—diluted | Non-GAAP earnings (loss) per share attributable to Intel—diluted | | $ | (0.04) | | | $ | 0.87 | | |
| | Non-GAAP earnings (loss) per share attributable to Intel—diluted | |
| | Non-GAAP earnings (loss) per share attributable to Intel—diluted | |
|
| | | | | | | | | | | | | | |
| | Three Months Ended |
| (In Millions) | | Apr 1, 2023 | | Apr 2, 2022 |
| Net cash provided by (used for) operating activities | | $ | (1,785) | | | $ | 5,891 | |
| Net additions to property, plant and equipment | | (6,964) | | | (4,603) | |
| Payments on finance leases | | (15) | | | (299) | |
| Sale of equity investment | | — | | | 4,561 | |
| Adjusted free cash flow | | $ | (8,764) | | | $ | 5,550 | |
| | | | |
| Net cash used for investing activities | | $ | (8,521) | | | $ | (2,639) | |
| Net cash provided by (used for) financing activities | | $ | 7,394 | | | $ | (1,864) | |
| | | | |
| | | | |
| | | | | | | | | | | | | | |
| | Three Months Ended |
| (In Millions) | | Mar 30, 2024 | | Apr 1, 2023 |
| Net cash provided by (used for) operating activities | | $ | (1,223) | | | $ | (1,785) | |
| Net additions to property, plant, and equipment | | (4,955) | | | (6,964) | |
| Payments on finance leases | | — | | | (15) | |
| | | | |
| Adjusted free cash flow | | $ | (6,178) | | | $ | (8,764) | |
| | | | |
| Net cash provided by (used for) investing activities | | $ | (2,563) | | | $ | (8,521) | |
| Net cash provided by (used for) financing activities | | $ | 3,630 | | | $ | 7,394 | |
| | | | |
| | | | |
| | | | | |
| Risk Factors and Other Key Information | |
| |
Quantitative and Qualitative Disclosures About Market Risk
We are affected by changes in currency exchange and interest rates, as well as equity and commodity prices. Our risk management programs are designed to reduce, but may not entirely eliminate, the impacts of these risks. For a discussion about market risk and sensitivity analysis related to changes in currency exchange rates, interest rates, equity prices, and commodity prices refer to "Quantitative and Qualitative Disclosures About Market Risk" within MD&A in our 2022 Form 10-K.
Risk Factors
The risks described in "Risk Factors" within Other Key Information in our 20222023 Form 10-K could materially and adversely affect our business, financial condition, and results of operations, and the trading price of our common stock could decline. These risk factors do not identify all risks that we face—our operations could also be affected by factors that are not presently known to us or that we currently consider to be immaterial to our operations. Due to risks and uncertainties, known and unknown, our past financial results may not be a reliable indicator of future performance and historical trends should not be used to anticipate results or trends in future periods. Refer also to the other information set forth in this Form 10-Q, including in the Forward-Looking Statements, MD&A, and the Consolidated Condensed Financial Statements and Supplemental Details sections.
Quantitative and Qualitative Disclosures About Market Risk
We are affected by changes in currency exchange and interest rates, as well as equity and commodity prices. Our risk management programs are designed to reduce, but may not entirely eliminate, the impacts of these risks. For a discussion about market risk and sensitivity analysis related to changes in currency exchange rates, interest rates, equity prices, and commodity prices refer to "Quantitative and Qualitative Disclosures About Market Risk" within MD&A in our 2023 Form 10-K.
Controls and Procedures
Inherent Limitations on Effectiveness of Controls
Our management, including the principal executive officer and principal financial officer, does not expect that our disclosure controls and procedures or our internal control over financial reporting will prevent or detect all errors and all fraud. A control system, no matter how well-designed and operated, can provide only reasonable, not absolute, assurance that the control system’s objectives will be met. The design of a control system must reflect the fact that there are resource constraints, and the benefits of controls must be considered relative to their costs. Further, because of the inherent limitations in all control systems, no evaluation of controls can provide absolute assurance that misstatements due to error or fraud will not occur or that all control issues and instances of fraud, if any, have been detected.
Evaluation of Disclosure Controls and Procedures
Based on management’s evaluation (with the participation of our principal executive officer and principal financial officer), as of the end of the period covered by this report, our principal executive officer and principal financial officer have concluded that our disclosure controls and procedures (as defined in Rules 13a-15(e) and 15d-15(e) under the Securities Exchange Act of 1934, as amended (the Exchange Act)), were effective to provide reasonable assurance that information required to be disclosed by us in reports that we file or submit under the Exchange Act is recorded, processed, summarized, and reported within the time periods specified in SEC rules and forms, and is accumulated and communicated to management, including our principal executive officer and principal financial officer, as appropriate, to allow timely decisions regarding required disclosure.
Changes in Internal Control Over Financial Reporting
There were no changes to our internal control over financial reporting (as defined in Rules 13a-15(f) and 15d-15(f) under the Exchange Act) that occurred during the quarter ended April 1, 2023March 30, 2024 that have materially affected, or are reasonably likely to materially affect, our internal control over financial reporting.
Issuer Purchases of Equity Securities
We have an ongoing authorization, originally approved by our Board of Directors in 2005 and subsequently amended, to repurchase shares of our common stock in open market or negotiated transactions. No shares were repurchased during the quarter ending April 1, 2023.March 30, 2024. As of April 1, 2023,March 30, 2024, we were authorized to repurchase up to $110.0 billion, of which $7.2 billion remained available.
We issue RSUs as part of our equity incentive plans. In our Consolidated Condensed Financial Statements, we treat shares of common stock withheld for tax purposes on behalf of our employees in connection with the vesting of RSUs in a similar manner as common stock repurchases because they reduce the number of shares that would have been issued upon vesting. These withheld shares of common stock are not considered common stock repurchases under our authorized common stock repurchase program.
Rule 10b5-1 Trading Arrangements
Our directors and officers (as defined in Rule 16a-1 under the Exchange Act) may from time to time enter into plans or other arrangements for the purchase or sale of our shares that are intended to satisfy the affirmative defense conditions of Rule 10b5–1(c) or may represent a non-Rule 10b5-1 trading arrangement under the Exchange Act. During the quarter ended March 30, 2024, no such plans or arrangements were adopted or terminated, including by modification.
| | | | | | | | |
| Other Key Information | 3739 |
Disclosure Pursuant to Section 13(r) of the Securities Exchange Act of 1934
Section 13(r) of the Exchange Act requires an issuer to disclose certain information in its periodic reports if it or any of its affiliates knowingly engaged in certain activities, transactions, or dealings with individuals or entities subject to specific US economic sanctions during the reporting period, even when the activities, transactions, or dealings are conducted in compliance with applicable law. On March 2, 2021, the US Secretary of State designated the Federal Security Service of the Russian Federation (FSB) as a party subject to one such sanction. From timeThough Intel has suspended sales in Russia, there may be a need to time,file documents or engage with FSB as Intel winds up our local subsidiaries are required to engage with the FSB as a licensing authority and file documents in order to conduct business within the Russian Federation.offices. All such dealings are explicitly authorized by general licensesGeneral License 1B issued by the US Department of the Treasury’s Office of Foreign Assets Control (OFAC), and there are no gross revenues or net profits directly associated with any such dealings by us with the FSB. As announced on April 5, 2022, Intel suspended all business operations in Russia until further notice, and we plan to continue limited activities as required to conduct business in the Russian Federation to the extent permitted by applicable law.
On April 15, 2021, the US Department of the Treasury designated Pozitiv Teknolodzhiz, AO (Positive Technologies), a Russian IT security firm, as a party subject to one of the sanctions specified in Section 13(r). Prior to the designation, we communicated with Positive Technologies regarding its IT security research and coordinated disclosure of security vulnerabilities identified by the firm. Based on a license issued by OFAC, we resumed such communications. There are no gross revenues or net profits directly associated with any such activities. We plan to continue these communications in accordance with the terms and conditions of the OFAC license.
| | | | | | | | |
| Other Key Information | 3840 |
Exhibits
| | | | | | | | | | | | | | | | | | | | | | | | | | | | | | | | | | | | | | |
| | | | | Incorporated by Reference | | |
Exhibit
Number | | Exhibit Description | | Form | | File Number | | Exhibit | | Filing
Date | | Filed or
Furnished
Herewith |
| 3.1 | | | | 8-K | | 000-06217 | | 3.1 | | 5/22/2006 | | |
| 3.2 | | | | 8-K | | 000-06217 | | 3.2 | | 3/16/2021 | | |
| 4.1 | |
| | 8-K | | 000-06217 | | 4.1 | | 2/10/2023 | | |
| 10.1† | | | | 10-K | | 000-6217 | | 10.5 | | 1/27/2023 | | |
| 10.2† | | | | | | | | | | | | X |
| 31.1 | | | | | | | | | | | | X |
| 31.2 | | | | | | | | | | | | X |
| | | | | | | | | | | | |
| 32.1 | | | | | | | | | | | | X |
| 101 | | Inline XBRL Document Set for the consolidated condensed financial statements and accompanying notes in Consolidated Condensed Financial Statements and Supplemental Details | | | | | | | | | | X |
| | | | | | | | | | | | |
| | | | | | | | | | | | |
| | | | | | | | | | | | |
| | | | | | | | | | | | |
| | | | | | | | | | | | |
| 104 | | Cover Page Interactive Data File - formatted in Inline XBRL and included as Exhibit 101 | | | | | | | | | | X |
| | | | | | | | | | | | | | | | | | | | | | | | | | | | | | | | | | | | | | |
| | | | | Incorporated by Reference | | |
Exhibit
Number | | Exhibit Description | | Form | | File Number | | Exhibit | | Filing
Date | |
Filed or Furnished Herewith |
| 3.1 | | | | 10-Q | | 000-06217 | | 3.1 | | 10/27/2023 | | |
| 3.2 | | | | 8-K | | 000-06217 | | 3.2 | | 12/5/2023 | | |
| 4.1 | | | | 8-K | | 000-06217 | | 4.1 | | 2/21/2024 | | |
10.1† | | | | 8-K | | 000-06217 | | 10.1 | | 2/16/2024 | | |
| 31.1 | | | | | | | | | | | | X |
| 31.2 | | | | | | | | | | | | X |
| | | | | | | | | | | | |
| 32.1 | | | | | | | | | | | | X |
| 101 | | Inline XBRL Document Set for the consolidated condensed financial statements and accompanying notes in Consolidated Condensed Financial Statements and Supplemental Details | | | | | | | | | | X |
| | | | | | | | | | | | |
| | | | | | | | | | | | |
| | | | | | | | | | | | |
| | | | | | | | | | | | |
| | | | | | | | | | | | |
| 104 | | Cover Page Interactive Data File - formatted in Inline XBRL and included as Exhibit 101 | | | | | | | | | | X |
† Management contracts or compensation plans or arrangements in which directors or executive officers are eligible to participate.
| | | | | | | | |
| Other Key Information | 3941 |
Form 10-Q Cross-Reference Index
| | | | | | | | |
| Item Number | Item | |
| Part I - Financial Information | |
| Item 1. | Financial Statements | |
| Item 2. | Management's Discussion and Analysis of Financial Condition and Results of Operations: | |
| Liquidity and capital resources | |
| Results of operations | |
| | |
| | |
| Critical accounting estimates | |
| Item 3. | Quantitative and Qualitative Disclosures About Market Risk | |
| Item 4. | Controls and Procedures | |
| | |
| Part II - Other Information | |
| Item 1. | Legal Proceedings | |
| Item 1A. | Risk Factors | |
| Item 2. | Unregistered Sales of Equity Securities and Use of Proceeds | |
| Item 3. | Defaults Upon Senior Securities | Not applicable |
| Item 4. | Mine Safety Disclosures | Not applicable |
| Item 5. | Other Information | |
| | |
| Rule 10b5-1 Trading Arrangements | |
| Disclosure Pursuant to Section 13(r) of the Securities Exchange Act of 1934 | |
| Item 6. | Exhibits | |
| | |
| Signatures | |
| | | | | | | | |
| Other Key Information | 4042 |
Signatures
Pursuant to the requirements of the Securities Exchange Act of 1934, the registrant has duly caused this report to be signed on its behalf by the undersigned thereunto duly authorized.
| | | | | | | | | | | | | | | | | |
| | | INTEL CORPORATION
(Registrant) |
| | | | | |
| Date: | April 27, 202325, 2024 | | By: | | /s/ DAVID ZINSNER |
| | | | | David Zinsner |
| | | | | Executive Vice President, Chief Financial Officer, and
Principal Financial Officer |
| | | | | |
| Date: | April 27, 202325, 2024 | | By: | | /s/ SCOTT GAWEL |
| | | | | Scott Gawel |
| | | | | Corporate Vice President, Chief Accounting Officer, and
Principal Accounting Officer |