UNITED STATES
SECURITIES AND EXCHANGE COMMISSION
WASHINGTON, D.C. 20549
FORM 10-Q
ý ☒QUARTERLY REPORT PURSUANT TO SECTION 13 OR 15(d) OF THE SECURITIES EXCHANGE ACT OF 1934
For the Quarterly Period Ended SeptemberJune 30, 20172023
¨ ☐TRANSITION REPORT PURSUANT TO SECTION 13 OR 15(d) OF THE SECURITIES EXCHANGE ACT OF 1934
For the Transition Period From to
_________________________________________
Commission File Number 1-3157001-03157
INTERNATIONAL PAPER COMPANY
(Exact name of registrant as specified in its charter)
|
| | | | |
| New York | 13-0872805 |
(State or other jurisdiction of incorporation) | (I.R.S. Employer Identification No.) |
incorporation of organization) | Identification No.) |
| |
6400 Poplar Avenue, Memphis, TNTennessee | 38197 |
(Address of principal executive offices)Principal Executive Offices) | (Zip Code) |
Registrant’s telephone number, including area code: (901) 419-7000
Securities registered pursuant to Section 12(b) of the Act: | | | | | | | | |
| Title of each class | Trading Symbol(s) | Name of each exchange on which registered |
| Common Shares | IP | New York Stock Exchange |
Indicate by check mark whether the registrant (1) has filed all reports required to be filed by Section 13 or 15(d) of the Securities Exchange Act of 1934 during the preceding 12 months (or for such shorter period that the registrant was required to file such reports), and (2) has been subject to such filing requirements for the past 90 days. Yes ý☒ No ¨
Indicate by check mark whether the registrant has submitted electronically and posted on its corporate Web site, if any, every Interactive Data File required to be submitted and posted pursuant to Rule 405 of Regulation S-T (paragraph 232.405 of this chapter) during the preceding 12 months (or for such shorter period that the registrant was required to submit and post such files). Yes ý☒ No ¨
Indicate by check mark whether the registrant is a large accelerated filer, an accelerated filer, a non-accelerated filer, or a smaller reporting company or an emerging growth company. See the definitions of “large accelerated filer,” “accelerated filer,” “smaller reporting company,” and "emerging growth company" in Rule 12b-2 of the Exchange Act.
|
| | | | | | | | | | |
| Large accelerated filer | ý☒ | Accelerated filer | ¨☐ |
| | | |
| Non-accelerated filer | ¨☐ | Smaller reporting company | ¨☐ |
| | Emerging growth company | ¨☐ |
If an emerging growth company, indicate by check mark if the registrant has elected not to use the extended transition period for complying with any new or revised financial accounting standards provided pursuant to Section 13 (a) of the Exchange
Act. ¨
Indicate by check mark whether the registrant is a shell company (as defined in Rule 12b-2 of the Exchange Act). Yes ¨☐ No ý☒
The number of shares outstanding of the registrant’s common stock, par value $1.00 per share, as of October 27, 2017July 21, 2023 was 412,928,210.345,999,129.
INDEX
| | | | | | | | |
| | PAGE NO. |
| | |
| | |
| | PAGE NO. |
| | |
| | |
| | |
| | |
| Condensed Consolidated Statement of Operations - Three Months and NineSix Months Ended SeptemberJune 30, 20172023 and 20162022 | |
| | |
| Condensed Consolidated Statement of Comprehensive Income - Three Months and NineSix Months Ended SeptemberJune 30, 20172023 and 20162022 | |
| | |
| Condensed Consolidated Balance Sheet - SeptemberJune 30, 20172023 and December 31, 20162022 | |
| | |
| Condensed Consolidated Statement of Cash Flows - NineSix Months Ended SeptemberJune 30, 20172023 and 20162022 | |
| | |
| | |
| | |
| | |
| | |
| | |
| | |
| | |
| | |
| | |
| | |
| | |
| | |
| | |
| | |
| | |
| | |
| | |
| | |
| | |
| | |
| | |
| | |
| | |
| |
| |
PART I. FINANCIAL INFORMATION
| |
ITEM 1. | FINANCIAL STATEMENTS |
INTERNATIONAL PAPER COMPANY
Condensed Consolidated Statement of Operations
(Unaudited)
(In millions, except per share amounts)
| | | | Three Months Ended
September 30, | | Nine Months Ended
September 30, | | Three Months Ended
June 30, | | Six Months Ended
June 30, |
| | 2017 | | 2016 | | 2017 | | 2016 | | 2023 | | 2022 | | 2023 | | 2022 |
| Net Sales | $ | 5,913 |
| | $ | 5,266 |
| | $ | 17,196 |
| | $ | 15,698 |
| Net Sales | $ | 4,682 | | | $ | 5,389 | | | $ | 9,702 | | | $ | 10,626 | |
| Costs and Expenses | | | | | | | | Costs and Expenses | |
| Cost of products sold | 4,024 |
| | 3,622 |
| | 12,069 |
| | 11,345 |
| Cost of products sold | 3,360 | | | 3,806 | | | 7,002 | | | 7,645 | |
| Selling and administrative expenses | 431 |
| | 380 |
| | 1,275 |
| | 1,142 |
| Selling and administrative expenses | 336 | | | 300 | | | 717 | | | 641 | |
| Depreciation, amortization and cost of timber harvested | 373 |
| | 314 |
| | 1,075 |
| | 899 |
| Depreciation, amortization and cost of timber harvested | 244 | | | 267 | | | 485 | | | 528 | |
| Distribution expenses | 386 |
| | 353 |
| | 1,155 |
| | 1,012 |
| Distribution expenses | 376 | | | 442 | | | 798 | | | 866 | |
| Taxes other than payroll and income taxes | 44 |
| | 41 |
| | 132 |
| | 123 |
| Taxes other than payroll and income taxes | 40 | | | 36 | | | 76 | | | 72 | |
| Restructuring and other charges | — |
| | 46 |
| | (16 | ) | | 47 |
| |
| Net (gains) losses on sales and impairments of businesses | — |
| | 5 |
| | 9 |
| | 70 |
| |
| Litigation settlement | — |
| | — |
| | 354 |
| | — |
| |
| Net bargain purchase gain on acquisition of business | — |
| | — |
| | (6 | ) | | — |
| |
| Net (gains) losses on mark to market investments | | Net (gains) losses on mark to market investments | — | | | (3) | | | — | | | (49) | |
| Interest expense, net | 152 |
| | 132 |
| | 431 |
| | 384 |
| Interest expense, net | 59 | | | 74 | | | 121 | | | 143 | |
| Non-operating pension expense (income) | | Non-operating pension expense (income) | 12 | | | (47) | | | 27 | | | (96) | |
| Earnings (Loss) From Continuing Operations Before Income Taxes and Equity Earnings | 503 |
| | 373 |
| | 718 |
| | 676 |
| Earnings (Loss) From Continuing Operations Before Income Taxes and Equity Earnings | 255 | | | 514 | | | 476 | | | 876 | |
| Income tax provision (benefit) | 153 |
| | 107 |
| | 147 |
| | 139 |
| Income tax provision (benefit) | 33 | | | 96 | | | 81 | | | 191 | |
| Equity earnings (loss), net of taxes | 45 |
| | 43 |
| | 113 |
| | 151 |
| Equity earnings (loss), net of taxes | — | | | (2) | | | (1) | | | (2) | |
| Earnings (Loss) From Continuing Operations | 395 |
| | 309 |
| | 684 |
| | 688 |
| Earnings (Loss) From Continuing Operations | $ | 222 | | | $ | 416 | | | $ | 394 | | | $ | 683 | |
| Discontinued operations, net of taxes | — |
| | — |
| | — |
| | (5 | ) | Discontinued operations, net of taxes | 13 | | | 95 | | | 13 | | | 188 | |
| Net Earnings (Loss) | 395 |
| | 309 |
| | 684 |
| | 683 |
| Net Earnings (Loss) | $ | 235 | | | $ | 511 | | | $ | 407 | | | $ | 871 | |
| Less: Net earnings (loss) attributable to noncontrolling interests | — |
| | (3 | ) | | — |
| | (3 | ) | |
| Net Earnings (Loss) Attributable to International Paper Company | $ | 395 |
| | $ | 312 |
| | $ | 684 |
| | $ | 686 |
| |
| Basic Earnings (Loss) Per Share Attributable to International Paper Company Common Shareholders | | | | | | | | |
| Basic Earnings (Loss) Per Share | | Basic Earnings (Loss) Per Share | |
| Earnings (loss) from continuing operations | $ | 0.96 |
| | $ | 0.76 |
| | $ | 1.65 |
| | $ | 1.68 |
| Earnings (loss) from continuing operations | $ | 0.64 | | | $ | 1.13 | | | $ | 1.13 | | | $ | 1.83 | |
| Discontinued operations, net of taxes | — |
| | — |
| | — |
| | (0.01 | ) | Discontinued operations, net of taxes | 0.04 | | | 0.26 | | | 0.04 | | | 0.51 | |
| Net earnings (loss) | $ | 0.96 |
| | $ | 0.76 |
| | $ | 1.65 |
| | $ | 1.67 |
| Net earnings (loss) | $ | 0.68 | | | $ | 1.39 | | | $ | 1.17 | | | $ | 2.34 | |
| Diluted Earnings (Loss) Per Share Attributable to International Paper Company Common Shareholders | | | | | | | | |
| Diluted Earnings (Loss) Per Share | | Diluted Earnings (Loss) Per Share | |
| Earnings (loss) from continuing operations | $ | 0.95 |
| | $ | 0.75 |
| | $ | 1.64 |
| | $ | 1.66 |
| Earnings (loss) from continuing operations | $ | 0.64 | | | $ | 1.13 | | | $ | 1.12 | | | $ | 1.82 | |
| Discontinued operations, net of taxes | — |
| | — |
| | — |
| | (0.01 | ) | Discontinued operations, net of taxes | 0.04 | | | 0.25 | | | 0.04 | | | 0.50 | |
| Net earnings (loss) | $ | 0.95 |
| | $ | 0.75 |
| | $ | 1.64 |
| | $ | 1.65 |
| Net earnings (loss) | $ | 0.68 | | | $ | 1.38 | | | $ | 1.16 | | | $ | 2.32 | |
| Average Shares of Common Stock Outstanding – assuming dilution | 417.4 |
| | 415.3 |
| | 417.4 |
| | 415.5 |
| Average Shares of Common Stock Outstanding – assuming dilution | 346.5 | | | 370.7 | | | 349.5 | | | 375.7 | |
| Cash Dividends Per Common Share | $ | 0.4625 |
| | $ | 0.4400 |
| | $ | 1.3875 |
| | $ | 1.3200 |
| |
| Amounts Attributable to International Paper Company Common Shareholders | | | | | | | | |
| Earnings (loss) from continuing operations | $ | 395 |
| | $ | 312 |
| | $ | 684 |
| | $ | 691 |
| |
| Discontinued operations, net of taxes | — |
| | — |
| | — |
| | (5 | ) | |
| Net earnings (loss) | $ | 395 |
| | $ | 312 |
| | $ | 684 |
| | $ | 686 |
| |
The accompanying notes are an integral part of these condensed financial statements.
INTERNATIONAL PAPER COMPANY
(Unaudited)
(In millions)
|
| | | | | | | | | | | | | | | |
| | Three Months Ended
September 30, | | Nine Months Ended
September 30, |
| | 2017 | | 2016 | | 2017 | | 2016 |
| Net Earnings (Loss) | $ | 395 |
| | $ | 309 |
| | $ | 684 |
| | $ | 683 |
|
| Other Comprehensive Income (Loss), Net of Tax: | | | | | | | |
| Amortization of pension and post-retirement prior service costs and net loss: | | | | | | | |
| U.S. plans | 59 |
| | 72 |
| | 176 |
| | 471 |
|
| Pension and postretirement liability adjustments: | | | | | | | |
| U.S. plans | — |
| | (53 | ) | | — |
| | (598 | ) |
| Non-U.S. plans | — |
| | — |
| | 1 |
| | 17 |
|
| Change in cumulative foreign currency translation adjustment | 100 |
| | 3 |
| | 234 |
| | 373 |
|
| Net gains/losses on cash flow hedging derivatives: | | | | | | | |
| Net gains (losses) arising during the period | 1 |
| | 5 |
| | 9 |
| | (5 | ) |
| Reclassification adjustment for (gains) losses included in net earnings (loss) | (2 | ) | | (3 | ) | | (6 | ) | | (7 | ) |
| Total Other Comprehensive Income (Loss), Net of Tax | 158 |
| | 24 |
| | 414 |
| | 251 |
|
| Comprehensive Income (Loss) | 553 |
| | 333 |
| | 1,098 |
| | 934 |
|
| Net (earnings) loss attributable to noncontrolling interests | — |
| | 3 |
| | — |
| | 3 |
|
| Other comprehensive (income) loss attributable to noncontrolling interests | 1 |
| | (1 | ) | | (1 | ) | | (1 | ) |
| Comprehensive Income (Loss) Attributable to International Paper Company | $ | 554 |
| | $ | 335 |
| | $ | 1,097 |
| | $ | 936 |
|
| | | | | | | | | | | | | | | | | | | | | | | |
| | Three Months Ended
June 30, | | Six Months Ended
June 30, |
| | 2023 | | 2022 | | 2023 | | 2022 |
| Net Earnings (Loss) | $ | 235 | | | $ | 511 | | | $ | 407 | | | $ | 871 | |
| Other Comprehensive Income (Loss), Net of Tax: | | | | | | | |
| Amortization of pension and post-retirement prior service costs and net loss: | | | | | | | |
| U.S. plans | 21 | | | 23 | | | 44 | | | 43 | |
| Change in cumulative foreign currency translation adjustment | (30) | | | 182 | | | (39) | | | 134 | |
| Total Other Comprehensive Income (Loss), Net of Tax | (9) | | | 205 | | | 5 | | | 177 | |
| Comprehensive Income (Loss) | $ | 226 | | | $ | 716 | | | $ | 412 | | | $ | 1,048 | |
The accompanying notes are an integral part of these condensed financial statements.
INTERNATIONAL PAPER COMPANY
|
| | | | | | | |
| | September 30,
2017 | | December 31,
2016 |
| | (unaudited) | | |
| Assets | | | |
| Current Assets | | | |
| Cash and temporary investments | $ | 998 |
| | $ | 1,033 |
|
| Accounts and notes receivable, net | 3,343 |
| | 3,001 |
|
| Inventories | 2,465 |
| | 2,438 |
|
| Other current assets | 405 |
| | 198 |
|
| Total Current Assets | 7,211 |
| | 6,670 |
|
| Plants, Properties and Equipment, net | 14,065 |
| | 13,990 |
|
| Forestlands | 468 |
| | 456 |
|
| Investments | 336 |
| | 360 |
|
| Financial Assets of Special Purpose Entities (Note 13) | 7,047 |
| | 7,033 |
|
| Goodwill | 3,420 |
| | 3,364 |
|
| Deferred Charges and Other Assets | 1,266 |
| | 1,220 |
|
| Total Assets | $ | 33,813 |
| | $ | 33,093 |
|
| Liabilities and Equity | | | |
| Current Liabilities | | | |
| Notes payable and current maturities of long-term debt | $ | 958 |
| | $ | 239 |
|
| Accounts payable | 2,408 |
| | 2,309 |
|
| Accrued payroll and benefits | 447 |
| | 430 |
|
| Other accrued liabilities | 1,056 |
| | 1,091 |
|
| Total Current Liabilities | 4,869 |
| | 4,069 |
|
| Long-Term Debt | 11,373 |
| | 11,075 |
|
| Nonrecourse Financial Liabilities of Special Purpose Entities (Note 13) | 6,289 |
| | 6,284 |
|
| Deferred Income Taxes | 3,505 |
| | 3,127 |
|
| Pension Benefit Obligation | 2,069 |
| | 3,400 |
|
| Postretirement and Postemployment Benefit Obligation | 315 |
| | 330 |
|
| Other Liabilities | 460 |
| | 449 |
|
| Equity | | | |
| Common stock, $1 par value, 2017 – 448.9 shares and 2016 – 448.9 shares | 449 |
| | 449 |
|
| Paid-in capital | 6,176 |
| | 6,189 |
|
| Retained earnings | 4,918 |
| | 4,818 |
|
| Accumulated other comprehensive loss | (4,949 | ) | | (5,362 | ) |
| | 6,594 |
| | 6,094 |
|
| Less: Common stock held in treasury, at cost, 2017 – 36.0 shares and 2016 – 37.7 shares | 1,680 |
| | 1,753 |
|
| Total International Paper Shareholders’ Equity | 4,914 |
| | 4,341 |
|
| Noncontrolling interests | 19 |
| | 18 |
|
| Total Equity | 4,933 |
| | 4,359 |
|
| Total Liabilities and Equity | $ | 33,813 |
| | $ | 33,093 |
|
| | | | | | | | | | | |
| June 30,
2023 | | December 31,
2022 |
| | (unaudited) | | |
| Assets | | | |
| Current Assets | | | |
| Cash and temporary investments | $ | 746 | | | $ | 804 | |
| Accounts and notes receivable, net | 3,140 | | | 3,284 | |
| Contract assets | 490 | | | 481 | |
| Inventories | 1,911 | | | 1,942 | |
| Assets held for sale | 30 | | | 133 | |
| Other current assets | 159 | | | 126 | |
| Total Current Assets | 6,476 | | | 6,770 | |
| Plants, Properties and Equipment, net | 10,473 | | | 10,431 | |
| Investments | 183 | | | 186 | |
| Long-Term Financial Assets of Variable Interest Entities (Note 14) | 2,303 | | | 2,294 | |
| Goodwill | 3,043 | | | 3,041 | |
| Overfunded Pension Plan Assets | 315 | | | 297 | |
| Right of Use Assets | 449 | | | 424 | |
| Deferred Charges and Other Assets | 441 | | | 497 | |
| Total Assets | $ | 23,683 | | | $ | 23,940 | |
| Liabilities and Equity | | | |
| Current Liabilities | | | |
| Notes payable and current maturities of long-term debt | $ | 248 | | | $ | 763 | |
| Accounts payable | 2,394 | | | 2,708 | |
| Accrued payroll and benefits | 385 | | | 355 | |
| Other current liabilities | 1,040 | | | 1,174 | |
| Total Current Liabilities | 4,067 | | | 5,000 | |
| Long-Term Debt | 5,572 | | | 4,816 | |
| Long-Term Nonrecourse Financial Liabilities of Variable Interest Entities (Note 14) | 2,110 | | | 2,106 | |
| Deferred Income Taxes | 1,735 | | | 1,732 | |
| Underfunded Pension Benefit Obligation | 283 | | | 281 | |
| Postretirement and Postemployment Benefit Obligation | 139 | | | 150 | |
| Long-Term Lease Obligations | 304 | | | 283 | |
| Other Liabilities | 1,069 | | | 1,075 | |
| Equity | | | |
| Common stock, $1 par value, 2023 – 448.9 shares and 2022 – 448.9 shares | 449 | | | 449 | |
| Paid-in capital | 4,688 | | | 4,725 | |
| Retained earnings | 9,938 | | | 9,855 | |
| Accumulated other comprehensive loss | (1,920) | | | (1,925) | |
| 13,155 | | | 13,104 | |
| Less: Common stock held in treasury, at cost, 2023 – 102.9 shares and 2022 – 98.6 shares | 4,751 | | | 4,607 | |
| Total Equity | 8,404 | | | 8,497 | |
| Total Liabilities and Equity | $ | 23,683 | | | $ | 23,940 | |
The accompanying notes are an integral part of these condensed financial statements.
INTERNATIONAL PAPER COMPANY
(Unaudited)
(In millions)
| | | | | | | | | | | |
| | Six Months Ended
June 30, |
| | 2023 | | 2022 |
| Operating Activities | | | |
| Net earnings (loss) | $ | 407 | | | $ | 871 | |
| Depreciation, amortization and cost of timber harvested | 485 | | | 528 | |
| Deferred income tax provision (benefit), net | (13) | | | (5) | |
| Net (gains) losses on mark to market investments | — | | | (49) | |
| Net (gains) losses on sales and impairments of equity method investments | 76 | | | — | |
| Equity method dividends received | 13 | | | 204 | |
| Equity (earnings) losses, net of taxes | (88) | | | (186) | |
| Periodic pension (income) expense, net | 47 | | | (58) | |
| Other, net | 34 | | | 72 | |
| Changes in current assets and liabilities | | | |
| Accounts and notes receivable | 160 | | | (276) | |
| Contract assets | (9) | | | (129) | |
| Inventories | 87 | | | (133) | |
| Accounts payable and accrued liabilities | (280) | | | 199 | |
| Interest payable | (23) | | | 3 | |
| Other | (23) | | | (63) | |
| Cash Provided By (Used For) Operations | 873 | | | 978 | |
| Investment Activities | | | |
| Invested in capital projects, net of insurance recoveries | (608) | | | (371) | |
| Proceeds from exchange of equity securities | — | | | 144 | |
| Proceeds from sale of fixed assets | 3 | | | 11 | |
| Other | 2 | | | (1) | |
| Cash Provided By (Used For) Investment Activities | (603) | | | (217) | |
| Financing Activities | | | |
| Repurchases of common stock and payments of restricted stock tax withholding | (218) | | | (823) | |
| Issuance of debt | 772 | | | 232 | |
| Reduction of debt | (536) | | | (243) | |
| Change in book overdrafts | (33) | | | (47) | |
| Dividends paid | (322) | | | (344) | |
| Other | (1) | | | (1) | |
| Cash Provided By (Used For) Financing Activities | (338) | | | (1,226) | |
| Effect of Exchange Rate Changes on Cash and Temporary Investments | 10 | | | (4) | |
| Change in Cash and Temporary Investments | (58) | | | (469) | |
| Cash and Temporary Investments | | | |
| Beginning of period | 804 | | | 1,295 | |
| End of period | $ | 746 | | | $ | 826 | |
|
| | | | | | | |
| | Nine Months Ended
September 30, |
| | 2017 | | 2016 |
| Operating Activities | | | |
| Net earnings (loss) | $ | 684 |
| | $ | 683 |
|
| Depreciation, amortization and cost of timber harvested | 1,075 |
| | 899 |
|
| Deferred income tax provision (benefit), net | 295 |
| | 45 |
|
| Restructuring and other charges | (16 | ) | | 47 |
|
| Pension plan contributions | (1,250 | ) | | (750 | ) |
| Net bargain purchase gain on acquisition of business | (6 | ) | | — |
|
| Net (gains) losses on sales and impairments of businesses | 9 |
| | 70 |
|
| Ilim dividends received | 129 |
| | 58 |
|
| Equity (earnings) loss, net | (113 | ) | | (151 | ) |
| Periodic pension expense, net | 237 |
| | 718 |
|
| Other, net | 92 |
| | 67 |
|
| Changes in current assets and liabilities | | | |
| Accounts and notes receivable | (293 | ) | | (83 | ) |
| Inventories | (70 | ) | | (6 | ) |
| Accounts payable and accrued liabilities | 5 |
| | (37 | ) |
| Interest payable | (11 | ) | | 24 |
|
| Other | (198 | ) | | (18 | ) |
| Cash Provided By (Used For) Operations | 569 |
| | 1,566 |
|
| Investment Activities | | | |
| Invested in capital projects | (935 | ) | | (903 | ) |
| Acquisitions, net of cash acquired | (45 | ) | | (56 | ) |
| Proceeds from divestitures, net of cash divested | 4 |
| | 105 |
|
| Proceeds from sale of fixed assets | 22 |
| | 13 |
|
| Other | (54 | ) | | (130 | ) |
| Cash Provided By (Used For) Investment Activities | (1,008 | ) | | (971 | ) |
| Financing Activities | | | |
| Repurchases of common stock and payments of restricted stock tax withholding | (46 | ) | | (132 | ) |
| Issuance of debt | 1,366 |
| | 3,447 |
|
| Reduction of debt | (369 | ) | | (1,855 | ) |
| Change in book overdrafts | 5 |
| | (5 | ) |
| Dividends paid | (573 | ) | | (543 | ) |
| Debt tender premiums paid | (1 | ) | | (31 | ) |
| Other | (2 | ) | | (3 | ) |
| Cash Provided By (Used For) Financing Activities | 380 |
| | 878 |
|
| Effect of Exchange Rate Changes on Cash | 24 |
| | 39 |
|
| Change in Cash and Temporary Investments | (35 | ) | | 1,512 |
|
| Cash and Temporary Investments | | | |
| Beginning of period | 1,033 |
| | 1,050 |
|
| End of period | $ | 998 |
| | $ | 2,562 |
|
The accompanying notes are an integral part of these condensed financial statements.
INTERNATIONAL PAPER COMPANY
(Unaudited)
The accompanying unaudited condensed consolidated financial statements have been prepared in conformity with accounting principles generally accepted in the United States and in accordance with the instructions to Form 10-Q and, in the opinion of management, include all adjustments that are necessary for the fair presentation of International Paper Company’s (International Paper’s, the Company’s("International Paper's," "the Company’s" or our)"our") financial position, results of operations, and cash flows for the interim periods presented. Except as disclosed herein, such adjustments are of a normal, recurring nature. Results for the first ninesix months of the year may not necessarily be indicative of full year results. It is suggested thatYou should read these condensed financial statements be read in conjunction with the audited financial statements and the notes thereto included in the Company’s Annual Report on Form 10-K for the year ended December 31, 2016 and the Company's Current Report on Form 8-K dated July 31, 2017 (collectively the "2016 10-K"2022 (the "Annual Report"), both of which have previously been filed with the Securities and Exchange Commission.
These condensed consolidated financial statements have been prepared in conformity with accounting principles generally accepted in the United States that require the use of management’s estimates. Actual results could differ from management’s estimates.
Russia-Ukraine Conflict
The Current Report on Form 8-K dated July 31, 2017 was filedmilitary conflict between Russia and Ukraine, including ongoing sanctions, actions by the Russian government, and associated domestic and global economic and geopolitical conditions, has adversely affected and may continue to retrospectively adjust portionsadversely affect our Ilim joint venture and our businesses, financial condition, results of operations and cash flows. On January 24, 2023, we announced that we have reached an agreement to sell our equity interest in Ilim S.A. ("Ilim") and have also received from the same purchaser an indication of interest to purchase our equity investment in JSC Ilim Group ("Ilim Group" and together with Ilim, the "Ilim joint venture"), however, we cannot be certain if and when the completion of these sales may occur. Our ability to complete such sales is subject to various risks, including (i) purchasers’ inability to obtain necessary regulatory approvals or to finance the purchase pursuant to the terms of the Company's Annual Reportagreement, (ii) adverse actions by the Russian government, and (iii) new or expanded sanctions imposed by the U.S., the United Kingdom, or the European Union or its member countries. We are unable to predict the full impact that Russia’s ongoing invasion of Ukraine, current or potential future sanctions, ongoing or potential disruptions resulting from the conflict, the changing regulatory environment in Russia, negative macroeconomic conditions arising from such conflict, supply chain disruptions, and geopolitical instability and shifts, may have on Form 10-K forus or our ability to complete the year ended December 31, 2016, to reflect the adoptionsale of the required guidance in ASU 2015-17, "Income Taxes (Topic 740): Balance Sheet Classification of Deferred Taxes." In addition, as a result of an internal reorganizationour interest in the 2017 first quarter, the net sales and operating profits for the Asian Distribution operations are included in the results of the businesses that manufacture the products, and as such, prior year amounts have been reclassified to conform with the presentation in 2017.Ilim joint venture.
During the fourth quarter of 2016, the Company completed the acquisition of Weyerhaeuser's pulp business (see Note 7). Subsequent to the acquisition, the Company began reporting Global Cellulose Fibers as a separate reportable business segment in the fourth quarter of 2016 due to the increased materiality of the results of this business. This segment includes the Company's legacy pulp business and the newly acquired pulp business. As such, amounts related to the legacy pulp business have been reclassified out of the Printing Papers' segment and included in the new Global Cellulose Fibers business segment for all prior periods to conform with current year presentation.
NOTE 2 - RECENT ACCOUNTING DEVELOPMENTS
Derivatives and HedgingRecently Adopted Accounting Pronouncements
Reference Rate Reform
In August 2017,March 2020, the FASB issued ASU 2017-12, "Derivatives and Hedging2020-04, "Reference Rate Reform (Topic 815)848): Targeted ImprovementsFacilitation of the Effects of Reference Rate Reform on Financial Reporting." This guidance provides companies with optional guidance to Accounting for Hedging Activities." The objective of this newease the potential accounting burden associated with transitioning away from reference rates that are expected to be discontinued. This guidance is the improvement of the financial reporting of hedging relationshipseffective upon issuance and generally can be applied through December 31, 2024. The Company has applied and will continue to better portray the economic results of an entity’s risk management activities in its financial statements. In addition to that main objective,apply the amendments in this update to account for contract modifications due to changes in reference rates as those modifications occur. We do not expect these amendments to have a material impact on our consolidated financial statements and related disclosures.
Liabilities - Supplier Finance Programs
In September 2022, the FASB issued ASU 2022-04, "Liabilities - Supplier Finance Programs (Subtopic 405-50): Disclosure of Supplier Finance Program Obligations." This guidance make certain targeted improvementsrequires a business entity operating as a buyer in a supplier finance agreement to simplify the application of the hedge accounting guidance in current GAAP.disclose qualitative and quantitative information about its supplier finance programs. This guidance is effective for annual reporting periods beginning after December 15, 2018, and interim periods within those years. Early adoption is permitted. The Company is currently evaluating the provisions of this guidance, but plans to early adopt the provisions of this guidance for the year beginning January 1, 2018.
Retirement Benefits
In March 2017, the FASB issued ASU 2017-07, "Compensation - Retirement Benefits (Topic 715): Improving the Presentation of Net Periodic Pension Cost and Net Periodic Postretirement Benefit Cost." Under this new guidance, employers will present the service costs component of the net periodic benefit cost in the same income statement line item(s) as other employee compensation costs arising from services rendered during the period. In addition, only the service cost component will be eligible for capitalization in assets. Employers will present the other components separately from the line items(s) that includes the service cost and outside of any subtotal of operating income. In addition, disclosure of the line(s) used to present the other components of net periodic benefit cost will be required if the components are not presented separately in the income statement. This guidance is effective for annual reporting periods beginning after December 15, 2017, and interim periods within those years. Early adoption is permitted as of the beginning of an annual period for which financial statements (interim or annual) have not been issued or made available for issuance. The Company is currently evaluating the provisions of this guidance; however, we expect the adoption of ASU 2017-07 to result in a change in our adjusted operating profit (used to measure the earnings performance of the Company's business segments), which will be offset by a corresponding change in non-operating pension expense to reflect the impact of presenting the amortization of the prior service cost component of net periodic pension expense outside of operating income. We expect to adopt the provisions of this guidance on January 1, 2018 using the retrospective method. We also do not expect ASU 2017-07 to have an impact on our statements of financial position or cash flows.
Intangibles
In January 2017, the FASB issued ASU 2017-04, "Intangibles - Goodwill and Other (Topic 350): Simplifying the Test for Goodwill Impairment." This guidance eliminates the requirement to calculate the implied fair value of goodwill under Step 2 of today's goodwill impairment test to measure a goodwill impairment charge. Instead, entities will record an impairment charge based on the excess of a reporting unit's carrying amount over its fair value. This guidance should be applied prospectively and is effective for annual reporting periods beginning after December 15, 2019, for any impairment test performed in 2020. Early adoption is permitted for annual and interim goodwill impairment testing dates after January 1, 2017. The Company is currently evaluating the provisions of this guidance; however, we do not anticipate adoption having material impact given we have no impairment triggers.
Business Combinations
In January 2017, the FASB issued ASU 2017-01, "Business Combinations (Topic 805): Clarifying the Definition of a Business." Under the new guidance, an entity must first determine whether substantially all of the fair value of the gross assets acquired is concentrated in a single identifiable asset or a group of similar identifiable assets. If this threshold is met, the set of transferred assets and activities is not a business. If this threshold is not met, the entity then evaluates whether the set meets the requirement that a business include, at a minimum, an input and a substantive process that together significantly contribute to the ability to create outputs. This guidance is effective for annual reporting periods beginning after December 15, 2017, and interim periods within those years. Early adoption is permitted. The Company is currently evaluating the provisions of this guidance; however, we do not anticipate the adoption having a material impact on the financial statements.
Income Taxes
In October 2016, the FASB issued ASU 2016-16, "Income Taxes (Topic 740): Intra-Entity Transfers of Assets Other Than Inventory." This ASU requires companies to recognize the income tax effects of intercompany sales and transfers of assets other than inventory in the period in which the transfer occurs rather than defer the income tax effects which is current practice. This new guidance is effective for annual reporting periods beginning after December 15, 2017,2022, and interim periods within those years. The guidance requires companies to apply a modified retrospective approach with a cumulative catch-up adjustment to opening retained earnings in the period of adoption. Early adoption is permitted. The Company does not expect that the adoption of the standard will result in a material impact on the financial statements.
Stock Compensation
In May 2017, the FASB issued ASU 2017-09, "Compensation - Stock Compensation (Topic 718): Scope of Modification Accounting." This guidance clarifies when changes to the terms or conditions of a share-based payment award must be accounted for as modifications. Under this guidance, entities will apply the modification accounting guidance if the value, vesting conditions or classification of the award changes. This guidance is effective for annual reporting periods beginning after December 15, 2017, and interim periods within those years. Early adoption is permitted, including adoption in any interim period. The Company is currently evaluating the provisions of this guidance; however, we do not anticipate the adoption having a material impact on the financial statements.
In March 2016, the FASB issued ASU 2016-09, "Compensation - Stock Compensation (Topic 718): Improvements to Employee Share-Based Payment Accounting." Under this new guidance, all excess tax benefits and tax deficiencies are recognized in the income statement as they occur and therefore impact the Company's effective tax rate. This guidance replaced previous guidance which required tax benefits that exceed compensation costs (windfalls) to be recognized in equity. The new guidance also changed the cash flow presentation of excess tax benefits, classifying them as operating inflows rather than financing activities as they were previously classified. In addition, the new guidance allows companies to provide net settlement of stock-based compensation to cover tax withholding as long as the net settlement does not exceed the maximum individual statutory tax rate in the employee's tax jurisdiction. Amendments related to the timing of when excess tax benefits are recognized, minimum statutory withholding requirements, forfeitures, and intrinsic value were to be applied using a modified retrospective transition method by means of a cumulative-effect adjustment to equity as of the beginning of the period in which the guidance is adopted. Amendments related to the presentation of employee taxes paid on the statement of cash flows when an employer withholds shares to meet the minimum statutory withholding requirement were to be applied retrospectively. Amendments requiring recognition of excess tax benefits and tax deficiencies in the income statement and the practical expedient for estimating expected term were applied prospectively. An entity could elect to apply the amendments related to the presentation of excess tax benefits on the statement of cash flows using either a prospective transition method or a retrospective transition method. This ASU was effective for annual reporting periods beginning after December 15, 2016, and interim periods with those years. The Company prospectively adopted the provisions of this
ASUguidance in the first quarter of
2017 with no material impact2023. See Note 8 - Supplemental Financial Information.
Generally, the Company recognizes revenue on a point-in-time basis when the financial statements.
Leases
In February 2016,customer takes title to the FASB issued ASU 2016-02, "Leases Topic (842): Leases." This ASU will require most leases to be recognized on the balance sheet which will increase reported assets and liabilities. Lessor accounting will remain substantially similar to current U.S. GAAP. This ASU is effective for annual reporting periods beginning after December 15, 2018, and interim periods within those years, and mandates a modified retrospective transition method for all entities. The Company expects to adopt this guidance using a modified retrospective transition approach for leases existing at, or entered into after, the beginning of the earliest comparative period presented in the financial statements. We expect to recognize a liability and corresponding asset associated with in-scope operating and finance leases but are still in the process of determining those amounts and the processes required to account for leasing activity on an ongoing basis.
Revenue Recognition
In May 2014, the FASB issued ASU 2014-09, "Revenue from Contracts with Customers." This guidance replaces most existing revenue recognition guidance and provides that an entity should recognize revenue to depict the transfer of promised goods or services to customers in an amount that reflects the consideration to which the entity expects to be entitled in exchange for those goods and services. This ASU was effectiveassumes the risks and rewards for annual reporting periods beginning after December 15, 2016, and interim periods within those years and permits the use of either the retrospective or cumulative effect transition method; however, in August 2015, the FASB issued ASU 2015-14 which defers the effective date by one year making the guidance effective for annual reporting periods beginning after December 15, 2017. The FASB has continued to clarify this guidance in various updates during 2015, 2016 and 2017, all of which, have the same effective date as the original guidance.
We are currently evaluating the impact of ASU 2014-09 and all related ASU's on our financial statements. During the second quarter of 2017, we finalized our plan to adopt the new revenue guidance effective January 1, 2018 using the modified retrospective transition method. The Company's transition team, including representatives from all of our business segments, continues to review and analyze the impact of the standard on our revenue contracts. Surveys were developed and reviews of customer contracts have been performed in order to gather information and identify areas of the Company's business where potential differences could result in applying the requirements of the new standard to its revenue contracts. The results of the surveys and contract reviews indicate that the adoption of the standard may require acceleration of revenue for products produced by the Company without an alternative future use andgoods. For customized goods where the Company would havehas a legally enforceable right ofto payment for productionthe goods, the Company recognizes revenue over time which, generally, is as the goods are produced.
Disaggregated Revenue
| | | | | | | | | | | | | | | | | | | | | | | | | | |
| | Three Months Ended June 30, 2023 |
| In millions | | Industrial Packaging | | Global Cellulose Fibers | | Corporate & Intersegment | | Total |
| Primary Geographical Markets (a) | | | | | | | | |
| United States | | $ | 3,305 | | | $ | 616 | | | $ | 100 | | | $ | 4,021 | |
| EMEA | | 351 | | | 26 | | | — | | | 377 | |
| Pacific Rim and Asia | | 7 | | | 56 | | | — | | | 63 | |
| Americas, other than U.S. | | 221 | | | — | | | — | | | 221 | |
| Total | | $ | 3,884 | | | $ | 698 | | | $ | 100 | | | $ | 4,682 | |
| | | | | | | | |
| Operating Segments | | | | | | | | |
| North American Industrial Packaging | | $ | 3,550 | | | $ | — | | | $ | — | | | $ | 3,550 | |
| EMEA Industrial Packaging | | 351 | | | — | | | — | | | 351 | |
| Global Cellulose Fibers | | — | | | 698 | | | — | | | 698 | |
| Intra-segment Eliminations | | (17) | | | — | | | — | | | (17) | |
| Corporate & Intersegment Sales | | — | | | — | | | 100 | | | 100 | |
| Total | | $ | 3,884 | | | $ | 698 | | | $ | 100 | | | $ | 4,682 | |
(a) Net sales are attributed to countries based on the location of the seller.
| | | | | | | | | | | | | | | | | | | | | | | | | | |
| | Six Months Ended June 30, 2023 |
| In millions | | Industrial Packaging | | Global Cellulose Fibers | | Corporate & Intersegment | | Total |
| Primary Geographical Markets (a) | | | | | | | | |
| United States | | $ | 6,760 | | | $ | 1,346 | | | $ | 226 | | | $ | 8,332 | |
| EMEA | | 742 | | | 51 | | | — | | | 793 | |
| Pacific Rim and Asia | | 15 | | | 112 | | | — | | | 127 | |
| Americas, other than U.S. | | 450 | | | — | | | — | | | 450 | |
| Total | | $ | 7,967 | | | $ | 1,509 | | | $ | 226 | | | $ | 9,702 | |
| | | | | | | | |
| Operating Segments | | | | | | | | |
| North American Industrial Packaging | | $ | 7,274 | | | $ | — | | | $ | — | | | $ | 7,274 | |
| EMEA Industrial Packaging | | 742 | | | — | | | — | | | 742 | |
| Global Cellulose Fibers | | — | | | 1,509 | | | — | | | 1,509 | |
| Intra-segment Eliminations | | (49) | | | — | | | — | | | (49) | |
| Corporate & Intersegment Sales | | — | | | — | | | 226 | | | 226 | |
| Total | | $ | 7,967 | | | $ | 1,509 | | | $ | 226 | | | $ | 9,702 | |
(a) Net sales are attributed to countries based on the location of the seller.
| | | | | | | | | | | | | | | | | | | | | | | | | | |
| | Three Months Ended June 30, 2022 |
| In millions | | Industrial Packaging | | Global Cellulose Fibers | | Corporate & Intersegment | | Total |
Primary Geographical Markets (a) | | | | | | | | |
| United States | | $ | 3,842 | | | $ | 752 | | | $ | 109 | | | $ | 4,703 | |
| EMEA | | 413 | | | 25 | | | — | | | 438 | |
| Pacific Rim and Asia | | 11 | | | 11 | | | 1 | | | 23 | |
| Americas, other than U.S. | | 225 | | | — | | | — | | | 225 | |
| Total | | $ | 4,491 | | | $ | 788 | | | $ | 110 | | | $ | 5,389 | |
| | | | | | | | |
| Operating Segments | | | | | | | | |
| North American Industrial Packaging | | $ | 4,126 | | | $ | — | | | $ | — | | | $ | 4,126 | |
| EMEA Industrial Packaging | | 413 | | | — | | | — | | | 413 | |
| Global Cellulose Fibers | | — | | | 788 | | | — | | | 788 | |
| Intra-segment Eliminations | | (48) | | | — | | | — | | | (48) | |
| Corporate & Intersegment Sales | | — | | | — | | | 110 | | | 110 | |
| Total | | $ | 4,491 | | | $ | 788 | | | $ | 110 | | | $ | 5,389 | |
(a) Net sales are attributed to countries based on the location of the seller.
| | | | | | | | | | | | | | | | | | | | | | | | | | |
| | Six Months Ended June 30, 2022 |
| In millions | | Industrial Packaging | | Global Cellulose Fibers | | Corporate & Intersegment | | Total |
| Primary Geographical Markets (a) | | | | | | | | |
| United States | | $ | 7,603 | | | $ | 1,414 | | | $ | 229 | | | $ | 9,246 | |
| EMEA | | 823 | | | 55 | | | — | | | 878 | |
| Pacific Rim and Asia | | 21 | | | 29 | | | 2 | | | 52 | |
| Americas, other than U.S. | | 450 | | | — | | | — | | | 450 | |
| Total | | $ | 8,897 | | | $ | 1,498 | | | $ | 231 | | | $ | 10,626 | |
| | | | | | | | |
| Operating Segments | | | | | | | | |
| North American Industrial Packaging | | $ | 8,151 | | | $ | — | | | $ | — | | | $ | 8,151 | |
| EMEA Industrial Packaging | | 823 | | | — | | | — | | | 823 | |
| Global Cellulose Fibers | | — | | | 1,498 | | | — | | | 1,498 | |
| Intra-segment Eliminations | | (77) | | | — | | | — | | | (77) | |
| Corporate & Intersegment Sales | | — | | | — | | | 231 | | | 231 | |
| Total | | $ | 8,897 | | | $ | 1,498 | | | $ | 231 | | | $ | 10,626 | |
(a) Net sales are attributed to countries based on the location of the seller.
Revenue Contract Balances
A contract asset is created when the Company recognizes revenue on its customized products completedprior to date.having an unconditional right to payment from the customer, which generally does not occur until title and risk of loss passes to the customer.
A contract liability is created when customers prepay for goods prior to the Company transferring those goods to the customer. The contract liability is reduced once control of the goods is transferred to the customer. The majority of our customer prepayments are received during the fourth quarter each year for goods that will be transferred to customers over the following twelve months. Contract liabilities of $22 million and $38 million are included in Other current liabilities in the accompanying condensed consolidated balance sheet as of June 30, 2023 and December 31, 2022, respectively. The Company also recorded a contract liability of $115 million related to a previous acquisition. The balance of this contract liability was $95 million and $99 million at June 30, 2023 and December 31, 2022, respectively, and is continuing to evaluaterecorded in Other current liabilities and Other Liabilities in the terms of its revenue contracts, including evaluatingaccompanying condensed consolidated balance sheet.
The difference between the materialityopening and closing balances of the potential impactCompany's contract assets and contract liabilities primarily results from the difference between the price and quantity at comparable points in time for goods for which we have an unconditional right to payment or receive prepayment from the financial statements; however, due to the repetitive naturecustomer, respectively.
NOTE 34 - EQUITY
A summary of the changes in equity for the ninethree and six months ended SeptemberJune 30, 20172023 and 20162022 is provided below:
| | | | | | | | | | | | | | | | | | | | | | | | | | | | | | | | | | | |
| Three Months Ended June 30, 2023 |
| In millions, except per share amounts | Common Stock Issued | | Paid-in Capital | | Retained Earnings | Accumulated Other Comprehensive Income (Loss) | | Treasury Stock | | Total
Equity | |
| Balance, April 1 | $ | 449 | | | $ | 4,699 | | | $ | 9,866 | | $ | (1,911) | | | $ | 4,714 | | | $ | 8,389 | | |
| Issuance of stock for various plans, net | — | | | (11) | | | — | | — | | | (3) | | | (8) | | |
| Repurchase of stock | — | | | — | | | — | | — | | | 40 | | | (40) | | |
Common stock dividends ($0.4625 per share) | — | | | — | | | (163) | | — | | | — | | | (163) | | |
| Comprehensive income (loss) | — | | | — | | | 235 | | (9) | | | — | | | 226 | | |
| Ending Balance, June 30 | $ | 449 | | | $ | 4,688 | | | $ | 9,938 | | $ | (1,920) | | | $ | 4,751 | | | $ | 8,404 | | |
| | | | | | | | | | | | | | | | | | | | | | | | | | | | | | | | | | | |
| Six Months Ended June 30, 2023 |
| In millions, except per share amounts | Common Stock Issued | | Paid-in Capital | | Retained Earnings | Accumulated Other Comprehensive Income (Loss) | | Treasury Stock | | Total
Equity | |
| Balance, January 1 | $ | 449 | | | $ | 4,725 | | | $ | 9,855 | | $ | (1,925) | | | $ | 4,607 | | | $ | 8,497 | | |
| Issuance of stock for various plans, net | — | | | (37) | | | — | | — | | | (75) | | | 38 | | |
| Repurchase of stock | — | | | — | | | — | | — | | | 219 | | | (219) | | |
Common stock dividends ($0.9250 per share) | — | | | — | | | (324) | | — | | | — | | | (324) | | |
| Comprehensive income (loss) | — | | | — | | | 407 | | 5 | | | — | | | 412 | | |
| Ending Balance, June 30 | $ | 449 | | | $ | 4,688 | | | $ | 9,938 | | $ | (1,920) | | | $ | 4,751 | | | $ | 8,404 | | |
| | | | | | | | | | | | | | | | | | | | | | | | | | | | | | | | | | | |
| Three Months Ended June 30, 2022 |
| In millions, except per share amounts | Common Stock Issued | | Paid-in Capital | | Retained Earnings | Accumulated Other Comprehensive Income (Loss) | | Treasury Stock | | Total
Equity | |
| Balance, April 1 | $ | 449 | | | $ | 4,670 | | | $ | 9,218 | | $ | (1,694) | | | $ | 3,756 | | | $ | 8,887 | | |
| Issuance of stock for various plans, net | — | | | 5 | | | — | | — | | | (2) | | | 7 | | |
| Repurchase of stock | — | | | — | | | — | | — | | | 395 | | | (395) | | |
| Common stock dividends ($0.4625 per share) | — | | | — | | | (172) | | — | | | — | | | (172) | | |
| Comprehensive income (loss) | — | | | — | | | 511 | | 205 | | | — | | | 716 | | |
| Ending Balance, June 30 | $ | 449 | | | $ | 4,675 | | | $ | 9,557 | | $ | (1,489) | | | $ | 4,149 | | | $ | 9,043 | | |
| | | | | | | | | | | | | | | | | | | | | | | | | | | | | | | | | | | |
| Six Months Ended June 30, 2022 |
| In millions, except per share amounts | Common Stock Issued | | Paid-in Capital | | Retained Earnings | Accumulated Other Comprehensive Income (Loss) | | Treasury Stock | | Total
Equity | |
| Balance, January 1 | $ | 449 | | | $ | 4,668 | | | $ | 9,029 | | $ | (1,666) | | | $ | 3,398 | | | $ | 9,082 | | |
| Issuance of stock for various plans, net | — | | | 7 | | | — | | — | | | (72) | | | 79 | | |
| Repurchase of stock | — | | | — | | | — | | — | | | 823 | | | (823) | | |
Common stock dividends ($0.9250 per share) | — | | | — | | | (343) | | — | | | — | | | (343) | | |
| Comprehensive income (loss) | — | | | — | | | 871 | | 177 | | | — | | | 1,048 | | |
| Ending Balance, June 30 | $ | 449 | | | $ | 4,675 | | | $ | 9,557 | | $ | (1,489) | | | $ | 4,149 | | | $ | 9,043 | | |
|
| | | | | | | | | | | | | | | | | | | | | | | |
| | Nine Months Ended
September 30, |
| | 2017 | | 2016 |
| In millions, except per share amounts | Total International Paper Shareholders’ Equity | | Noncontrolling Interests | | Total Equity | | Total International Paper Shareholders’ Equity | | Noncontrolling Interests | | Total Equity |
| Balance, January 1 | $ | 4,341 |
| | $ | 18 |
| | $ | 4,359 |
| | $ | 3,884 |
| | $ | 25 |
| | $ | 3,909 |
|
| Issuance of stock for various plans, net | 130 |
| | — |
| | 130 |
| | 100 |
| | — |
| | 100 |
|
| Repurchase of stock | (46 | ) | | — |
| | (46 | ) | | (132 | ) | | — |
| | (132 | ) |
| Common stock dividends ($1.3875 per share in 2017 and $1.3200 per share in 2016) | (584 | ) | | — |
| | (584 | ) | | (550 | ) | | — |
| | (550 | ) |
| Transactions of equity method investees | (24 | ) | | — |
| | (24 | ) | | (37 | ) | | — |
| | (37 | ) |
| Divestiture of noncontrolling interests | — |
| | — |
| | — |
| | — |
| | (3 | ) | | (3 | ) |
| Other | — |
| | — |
| | — |
| | 8 |
| | — |
| | 8 |
|
| Comprehensive income (loss) | 1,097 |
| | 1 |
| | 1,098 |
| | 936 |
| | (2 | ) | | 934 |
|
| Ending Balance, September 30 | $ | 4,914 |
| | $ | 19 |
| | $ | 4,933 |
| | $ | 4,209 |
| | $ | 20 |
| | $ | 4,229 |
|
The following table presents changes in AOCIAccumulated Other Comprehensive Income (Loss) (AOCI), net of tax, for the three-month periodthree months and six months ended SeptemberJune 30, 2017:2023 and 2022:
| | | | | | | | | | | | | | | | | | | | | | | |
| Three Months Ended
June 30, | | Six Months Ended
June 30, |
| In millions | 2023 | | 2022 | | 2023 | | 2022 |
| Defined Benefit Pension and Postretirement Adjustments | | | | | | | |
| Balance at beginning of period | $ | (1,172) | | | $ | (942) | | | $ | (1,195) | | | $ | (962) | |
| | | | | | | |
| Amounts reclassified from accumulated other comprehensive income | 21 | | | 23 | | | 44 | | | 43 | |
| Balance at end of period | (1,151) | | | (919) | | | (1,151) | | | (919) | |
| Change in Cumulative Foreign Currency Translation Adjustments | | | | | | | |
| Balance at beginning of period | (731) | | | (742) | | | (722) | | | (694) | |
| Other comprehensive income (loss) before reclassifications | (30) | | | 182 | | | (39) | | | 134 | |
| | | | | | | |
| Balance at end of period | (761) | | | (560) | | | (761) | | | (560) | |
| Net Gains and Losses on Cash Flow Hedging Derivatives | | | | | | | |
| Balance at beginning of period | (8) | | | (10) | | | (8) | | | (10) | |
| | | | | | | |
| | | | | | | |
| Balance at end of period | (8) | | | (10) | | | (8) | | | (10) | |
| Total Accumulated Other Comprehensive Income (Loss) at End of Period | $ | (1,920) | | | $ | (1,489) | | | $ | (1,920) | | | $ | (1,489) | |
|
| | | | | | | | | | | | | | | | |
| In millions | | Defined Benefit Pension and Postretirement Items (a) | | Change in Cumulative Foreign Currency Translation Adjustments (a) | | Net Gains and Losses on Cash Flow Hedging Derivatives (a) | | Total (a) |
| Balance, July 1, 2017 | | $ | (2,954 | ) | | $ | (2,155 | ) | | $ | 1 |
| | $ | (5,108 | ) |
| Other comprehensive income (loss) before reclassifications | | — |
| | 101 |
| | 1 |
| | 102 |
|
| Amounts reclassified from accumulated other comprehensive income | | 59 |
| | (1 | ) | | (2 | ) | | 56 |
|
| Net Current Period Other Comprehensive Income (Loss) | | 59 |
| | 100 |
| | (1 | ) | | 158 |
|
| Other Comprehensive Income (Loss) Attributable to Noncontrolling Interest | | — |
| | 1 |
| | — |
| | 1 |
|
| Balance, September 30, 2017 | | $ | (2,895 | ) | | $ | (2,054 | ) | | $ | — |
| | $ | (4,949 | ) |
| |
(a) | All amounts are net of tax. |
The following table presents changes in AOCI for the three-month period ended September 30, 2016:
|
| | | | | | | | | | | | | | | | |
| In millions | | Defined Benefit Pension and Postretirement Items (a) | | Change in Cumulative Foreign Currency Translation Adjustments (a) | | Net Gains and Losses on Cash Flow Hedging Derivatives (a) | | Total (a) |
| Balance, July 1, 2016 | | $ | (3,298 | ) | | $ | (2,179 | ) | | $ | (4 | ) | | $ | (5,481 | ) |
| Other comprehensive income (loss) before reclassifications | | (53 | ) | | 3 |
| | 5 |
| | (45 | ) |
| Amounts reclassified from accumulated other comprehensive income | | 72 |
| | — |
| | (3 | ) | | 69 |
|
| Net Current Period Other Comprehensive Income (Loss) | | 19 |
| | 3 |
| | 2 |
| | 24 |
|
| Other Comprehensive Income (Loss) Attributable to Noncontrolling Interest | | — |
| | (1 | ) | | — |
| | (1 | ) |
| Balance, September 30, 2016 | | $ | (3,279 | ) | | $ | (2,177 | ) | | $ | (2 | ) | | $ | (5,458 | ) |
| |
(a) | All amounts are net of tax. |
The following table presents changes in AOCI for the nine-month period ended September 30, 2017:
|
| | | | | | | | | | | | | | | | |
| In millions | | Defined Benefit Pension and Postretirement Items (a) | | Change in Cumulative Foreign Currency Translation Adjustments (a) | | Net Gains and Losses on Cash Flow Hedging Derivatives (a) | | Total (a) |
| Balance, January 1, 2017 | | $ | (3,072 | ) | | $ | (2,287 | ) | | $ | (3 | ) | | $ | (5,362 | ) |
| Other comprehensive income (loss) before reclassifications | | 1 |
| | 235 |
| | 9 |
| | 245 |
|
| Amounts reclassified from accumulated other comprehensive income | | 176 |
| | (1 | ) | | (6 | ) | | 169 |
|
| Net Current Period Other Comprehensive Income | | 177 |
| | 234 |
| | 3 |
| | 414 |
|
| Other Comprehensive Income (Loss) Attributable to Noncontrolling Interest | | — |
| | (1 | ) | | — |
| | (1 | ) |
| Balance, September 30, 2017 | | $ | (2,895 | ) | | $ | (2,054 | ) | | $ | — |
| | $ | (4,949 | ) |
| |
(a) | All amounts are net of tax. |
The following table presents changes in AOCI for the nine-month period ended September 30, 2016:
|
| | | | | | | | | | | | | | | | |
| In millions | | Defined Benefit Pension and Postretirement Items (a) | | Change in Cumulative Foreign Currency Translation Adjustments (a) | | Net Gains and Losses on Cash Flow Hedging Derivatives (a) | | Total (a) |
| Balance, January 1, 2016 | | $ | (3,169 | ) | | $ | (2,549 | ) | | $ | 10 |
| | $ | (5,708 | ) |
| Other comprehensive income (loss) before reclassifications | | (581 | ) | | 376 |
| | (5 | ) | | (210 | ) |
| Amounts reclassified from accumulated other comprehensive income | | 471 |
| | (3 | ) | | (7 | ) | | 461 |
|
| Net Current Period Other Comprehensive Income | | (110 | ) | | 373 |
| | (12 | ) | | 251 |
|
| Other Comprehensive Income (Loss) Attributable to Noncontrolling Interest | | — |
| | (1 | ) | | — |
| | (1 | ) |
| Balance, September 30, 2016 | | $ | (3,279 | ) | | $ | (2,177 | ) | | $ | (2 | ) | | $ | (5,458 | ) |
| |
(a) | All amounts are net of tax. |
The following table presents details of the reclassifications out of AOCI for the three-monththree months and nine-month periodssix months ended SeptemberJune 30, 20172023 and 2016:2022:
| | | | | | | | | | | | | | | | | | | | | | | | | | | | | |
| In millions: | Amount Reclassified from Accumulated Other Comprehensive Income | | Location of Amount Reclassified from AOCI |
Three Months Ended
June 30, | Six Months Ended
June 30, | |
| 2023 | | 2022 | | 2023 | | 2022 | |
| Defined benefit pension and postretirement items: | | | | | | | | | |
| Prior-service costs | $ | (6) | | | $ | (6) | | | $ | (12) | | | $ | (11) | | (a) | Non-operating pension expense (income) |
| Actuarial gains (losses) | (22) | | | (24) | | | (46) | | | (46) | | (a) | Non-operating pension expense (income) |
| Total pre-tax amount | (28) | | | (30) | | | (58) | | | (57) | | | |
| Tax (expense) benefit | 7 | | | 7 | | | 14 | | | 14 | | | |
| Net of tax | (21) | | | (23) | | | (44) | | | (43) | | | |
| | | | | | | | | |
| | | | | | | | | |
| | | | | | | | | |
| | | | | | | | | |
| | | | | | | | | |
| | | | | | | | | |
| Total reclassifications for the period | $ | (21) | | | $ | (23) | | | $ | (44) | | | $ | (43) | | | |
(a)These accumulated other comprehensive income components are included in the computation of net periodic pension cost (see Note 16 for additional details).
|
| | | | | | | | | | | | | | | | | | | |
| Details About Accumulated Other Comprehensive Income Components | | Amounts Reclassified from Accumulated Other Comprehensive Income | | Location of Amount Reclassified from AOCI |
| | Three Months Ended
September 30, | | Nine Months Ended
September 30, | | |
| | 2017 | | 2016 | | 2017 | | 2016 | | |
| In millions: | | | | | | | | | | | |
| Defined benefit pension and postretirement items: | | | | | | | | | | | |
| Prior-service costs | | $ | (6 | ) | | $ | (9 | ) | | $ | (19 | ) | | $ | (27 | ) | | (a) | Cost of products sold |
| Actuarial gains (losses) | | (89 | ) | | (108 | ) | | (266 | ) | | (739 | ) | | (a) | Cost of products sold |
| Total pre-tax amount | | (95 | ) | | (117 | ) | | (285 | ) | | (766 | ) | | | |
| Tax (expense) benefit | | 36 |
| | 45 |
| | 109 |
| | 295 |
| | | |
| Net of tax | | (59 | ) | | (72 | ) | | (176 | ) | | (471 | ) | | | |
| | | | | | | | | | | | |
| Change in cumulative foreign currency translation adjustments: | | | | | | | | | | | |
| Business acquisitions/divestitures | | 1 |
| | — |
| | 1 |
| | 3 |
| | | Net (gains) losses on sales and impairments of businesses |
| Tax (expense)/benefit | | — |
| | — |
| | — |
| | — |
| | | |
| Net of tax | | 1 |
| | — |
| | 1 |
| | 3 |
| | | |
| | | | | | | | | | | | |
| Net gains and losses on cash flow hedging derivatives: | | | | | | | | | | | |
| Foreign exchange contracts | | 3 |
| | 5 |
| | 8 |
| | 10 |
| | (b) | Cost of products sold |
| Total pre-tax amount | | 3 |
| | 5 |
| | 8 |
| | 10 |
| | | |
| Tax (expense)/benefit | | (1 | ) | | (2 | ) | | (2 | ) | | (3 | ) | | | |
| Net of tax | | 2 |
| | 3 |
| | 6 |
| | 7 |
| | | |
| Total reclassifications for the period | | $ | (56 | ) | | $ | (69 | ) | | $ | (169 | ) | | $ | (461 | ) | | | |
| |
(a) | These accumulated other comprehensive income components are included in the computation of net periodic pension cost (see Note 16 for additional details). |
| |
(b) | This accumulated other comprehensive income component is included in our derivatives and hedging activities (see Note 15 for additional details). |
Basic earnings per common share areis computed by dividing earnings by the weighted average number of common shares outstanding. Diluted earnings per common share areis computed assuming that all potentially dilutive securities were converted into common shares. There are no adjustments required to be made to net income for purposes of computing basic and diluted earnings per share. A reconciliation of the amounts included in the computation of basic earnings (loss) per common share from continuing operations and diluted earnings (loss) per common share from continuing operations is as follows:
| | | | | | | | | | | | | | | | | | | | | | | |
| | Three Months Ended
June 30, | | Six Months Ended
June 30, |
| In millions, except per share amounts | 2023 | | 2022 | | 2023 | | 2022 |
| Earnings (loss) from continuing operations | $ | 222 | | | $ | 416 | | | $ | 394 | | | $ | 683 | |
| Weighted average common shares outstanding | 346.2 | | | 367.6 | | | 347.7 | | | 371.4 | |
| Effect of dilutive securities | | | | | | | |
| Restricted performance share plan | 0.3 | | | 3.1 | | | 1.8 | | | 4.3 | |
| Weighted average common shares outstanding – assuming dilution | 346.5 | | | 370.7 | | | 349.5 | | | 375.7 | |
| Basic earnings (loss) per share from continuing operations | $ | 0.64 | | | $ | 1.13 | | | $ | 1.13 | | | $ | 1.83 | |
| Diluted earnings (loss) per share from continuing operations | $ | 0.64 | | | $ | 1.13 | | | $ | 1.12 | | | $ | 1.82 | |
|
| | | | | | | | | | | | | | | |
| | Three Months Ended
September 30, | | Nine Months Ended
September 30, |
| In millions, except per share amounts | 2017 | | 2016 | | 2017 | | 2016 |
| Earnings (loss) from continuing operations | $ | 395 |
| | $ | 312 |
| | $ | 684 |
| | $ | 691 |
|
| Effect of dilutive securities | — |
| | — |
| | — |
| | — |
|
| Earnings (loss) from continuing operations – assuming dilution | $ | 395 |
| | $ | 312 |
| | $ | 684 |
| | $ | 691 |
|
| Average common shares outstanding | 412.9 |
| | 411.2 |
| | 412.6 |
| | 411.0 |
|
| Effect of dilutive securities | | | | | | | |
| Restricted stock performance share plan | 4.5 |
| | 4.1 |
| | 4.8 |
| | 4.5 |
|
| Average common shares outstanding – assuming dilution | 417.4 |
| | 415.3 |
| | 417.4 |
| | 415.5 |
|
| Basic earnings (loss) from continuing operations per common share | $ | 0.96 |
| | $ | 0.76 |
| | $ | 1.65 |
| | $ | 1.68 |
|
| Diluted earnings (loss) from continuing operations per common share | $ | 0.95 |
| | $ | 0.75 |
| | $ | 1.64 |
| | $ | 1.66 |
|
NOTE 6 - RESTRUCTURING AND OTHER CHARGES
2017: There were no restructuring and other charges recorded during the three months ended September 30, 2017.
During the three months ended June 30, 2017, restructuring and other charges totaling a $16 million benefit before taxes were recorded. Details of these charges were as follows:
|
| | | |
| In millions | Three Months Ended
June 30, 2017 |
| Gain on sale of investment in ArborGen | $ | (14 | ) |
| Other | (2 | ) |
| Total | $ | (16 | ) |
There were no restructuring and other charges recorded during the three months ended March 31, 2017.
2016: During the three months ended September 30, 2016, restructuring and other charges totaling $46 million before taxes were recorded. Details of these charges were as follows:
|
| | | |
| In millions | Three Months Ended
September 30, 2016 |
| Early debt extinguishment costs | $ | 29 |
|
| India packaging evaluation write-off | 17 |
|
| Total | $ | 46 |
|
There were no restructuring and other charges recorded during the three months ended June 30, 2016.
During the three months ended March 31, 2016, restructuring and other charges totaling $1 million before taxes were recorded. Details of these charges were as follows: |
| | | |
| In millions | Three Months Ended
March 31, 2016 |
| Gain on sale of investment in Arizona Chemical | $ | (8 | ) |
| Riegelwood mill conversion costs | 9 |
|
| Total | $ | 1 |
|
NOTE 7 - ACQUISITIONSDIVESTITURES AND IMPAIRMENTS
Tangier, Morocco Facility
On June 30, 2017, the Company completed the acquisition of Europac's Tangier, Morocco facility, a corrugated packaging facility, for €40 million (approximately $46 million using the June 30, 2017 exchange rate), subject to certain post-closing adjustments. Approximately 80% of the fair value has been provisionally allocated to property, plant and equipment. Adjustments, if any, to provisional amounts will be finalized within the measurement period of up to one year from the acquisition date. Pro forma information related to the acquisition of the Europac business has not been included as it is impractical to obtain the information due to the lack of availability of financial data and does not have a material effect on the Company’s consolidated results of operations.
Weyerhaeuser Pulp Business
On DecemberOctober 1, 2016, the Company completed the acquisition of Weyerhaeuser Company's pulp business for approximately $2.2 billion in cash. Under the terms of the agreement, International Paper acquired four fluff pulp mills, one Northern bleached softwood kraft mill and two converting facilities of modified fiber, located in the United States, Canada and Poland.
The following table summarizes the provisional fair value assigned to assets and liabilities acquired as of December 1, 2016:
|
| | | |
| In millions | |
| Cash and temporary investments | $ | 12 |
|
| Accounts and notes receivable | 195 |
|
| Inventory | 238 |
|
| Other current assets | 11 |
|
| Plants, properties and equipment | 1,711 |
|
| Goodwill | 52 |
|
| Other intangible assets | 212 |
|
| Deferred charges and other assets | 6 |
|
| Total assets acquired | 2,437 |
|
| Accounts payable and accrued liabilities | 114 |
|
| Long-term debt | 104 |
|
| Other long-term liabilities | 28 |
|
| Total liabilities assumed | 246 |
|
| Net assets acquired | $ | 2,191 |
|
The assignment to fair value is provisional and could be revised as a result of additional information obtained regarding assets acquired and liabilities assumed, and revisions of provisional estimates of fair values, including, but not limited to, the completion of independent appraisals and valuations related to property, plant and equipment and intangible assets. While we do not anticipate these changes to be significant, the provisional amounts will not be finalized until the end of the measurement period of up to one year from the acquisition date.
In connection with the business combination, inventories were written up by $33 million to their estimated fair value. During the first quarter of 2017, $14 million before taxes ($8 million after taxes) were expensed to Cost of products sold as the related inventory was sold.
The identifiable intangible assets acquired in connection with the acquisition of the Weyerhaeuser pulp business included the following:
|
| | | | | |
| In millions | | Estimated
Fair Value | Average
Remaining
Useful Life |
| Asset Class: | | | (at acquisition
date) |
| Customer relationships and lists | | $ | 95 |
| 24 years |
| Trade names, patents, trademarks and developed technology | | 113 |
| 8 years |
| Other | | 4 |
| 10 years |
| Total | | $ | 212 |
| |
Holmen Paper Newsprint Mill
On June 30, 2016, the Company completed the acquisition of Holmen Paper's newsprint mill in Madrid, Spain. Under the terms of the acquisition agreement, International Paper purchased the Madrid newsprint mill, as well as associated recycling operations and a 50% ownership interest in a cogeneration facility. The Company intends to convert the mill during the fourth quarter of 2017, to produce recycled containerboard with an expected capacity of 440,000 tons. Once completed, the converted mill will support the Company's corrugated packaging business in EMEA.
The Company's aggregate purchase price for the mill, recycling operations and 50% ownership of the cogeneration facility was €53 million (approximately $59 million using the June 30, 2016 exchange rate). The assignment of fair value to assets acquired and liabilities assumed was completed in the first quarter of 2017. Approximately $60 million was allocated to property, plant and equipment, $14 million to current assets (primarily cash and accounts receivable), $14 million to equity method investments, $5 million to long-term assets, $9 million to short-term liabilities and $16 million to long-term liabilities related to a supply contract entered into with the seller. The final fair values assigned indicated that the sum of the cash consideration paid was less than the fair value of the underlying net assets, after adjustments, by $6 million, resulting in a bargain purchase gain being recorded on this transaction. Pro forma information related to the acquisition of the Holmen business has not been included as it is impractical to obtain the information due to the lack of availability of financial data and does not have a material effect on the Company’s consolidated results of operations.
The Company has accounted for the above acquisitions under ASC 805, "Business Combinations" and the results of operations have been included in International Paper's financial statements beginning with the dates of acquisition.
NOTE 8 - DIVESTITURES / SPINOFF
Other Divestitures and Impairments
2017: On September 7, 2017,2021, the Company completed the previously announced salespin-off of its foodservice businessPrinting Papers segment along with certain mixed-use coated paperboard and pulp businesses in China to Huhtamaki Hong Kong Limited. Proceeds received totaled approximately RMB 129 million ($18 million usingNorth America, France and Russia into a standalone, publicly-traded company, Sylvamo Corporation. The transaction was implemented through the September 30, 2017 exchange rate). Under the termsdistribution of shares of the transaction,standalone company to International Paper's shareholders (the "Distribution"). The Company retained 19.9% of the shares of Sylvamo at the time of the separation with the intent to monetize its investment and after post-closing adjustments, International Paper received approximately RMB 49 million in exchange for its ownership interest in two China foodservice entities and RMB 80 million for the sale of notes receivable from the acquired entities.
Subsequentprovide additional proceeds to the announced agreement in June 2017, a determination was made that the current book value of the asset group exceeded its estimated fair value of $7 million, which was the agreed upon selling price.Company. As a result a pre-tax charge of $9 million was recorded during the second quarter of 2017, inDistribution, Sylvamo Corporation is an independent public company that trades on the Company's Consumer Packaging segment, to write downNew York Stock Exchange under the long-lived assets of this business to their estimated fair value. Amounts related to this business included insymbol "SLVM."
In connection with the Company's statement of operations were immaterial for both the three months and nine months ended September 30, 2017.
2016: On June 30, 2016,Distribution, the Company completedand Sylvamo entered into a separation and distribution agreement as well as various other agreements that govern the previously announced salerelationships between the parties following the Distribution, including a transition services agreement, a tax matters agreement and an employee matters agreement. These agreements provide for the allocation between the Company and Sylvamo of its corrugated packaging business in Chinaassets, liabilities and Southeast Asiaobligations attributable to Xiamen Bridge Hexing Equity Investment Partnership Enterprise. Under the terms of the transactionperiods prior to, at and after post-closing adjustments, International Paper received a total of approximately RMB 957 million (approximately $144 million at the June 30, 2016 exchange rate), which included the buyer's assumption of the liability for outstanding loans of approximately $55 million which are payable up to three years from the closing of the sale. The remaining balance of the outstanding loans payable to International Paper as of September 30, 2017, totaled $9 million.
Subsequent to the announced agreement in March 2016, a determination was made that the current book value of the asset group exceeded its estimated fair value of $155 million which was the agreed upon selling price, less costs incurred to sell. As a result, a pre-tax charge of $41 million was recorded during the six months ended June 30, 2016 in the Company's Industrial Packaging segment to write down the long-lived assets of this business to their estimated fair value. In addition,Distribution and govern certain relationships between the Company recorded a pre-tax charge of $24 million inand Sylvamo after the 2016 second quarter for severance that was contingent upon the sale of this business.Distribution. The amount of pre-tax losses related to this IP Asia Packaging business included in the Company's statement of operationsCompany has various ongoing operational agreements with Sylvamo under which it sells fiber, paper and other products. Related party sales under these agreements were $7$211 million and $80$409 million for the three months and ninesix months ended SeptemberJune 30, 2016.2022, respectively. Following the sale of the Company's ownership interest in Sylvamo during the third quarter 2022, Sylvamo is no longer considered a related party.
In the second quarter 2022, the Company exchanged 4,132,000 shares of Sylvamo common stock owned by the Company in exchange and as repayment for an approximately $144 million term loan obligation which resulted in the reversal of a $31 million deferred tax liability due to the tax-free exchange of the Sylvamo Corporation common stock. In the third quarter 2022, the Company exchanged the remaining 4,614,358 shares of Sylvamo common stock owned by the Company in exchange for $167 million and as partial repayment of a $210 million term loan obligation. This also resulted in the reversal of a $35 million deferred tax liability due to the tax-free exchange of the Sylvamo Corporation common stock. As of the end of the third quarter 2022, the Company no longer had an ownership interest in Sylvamo.
Temporary Investments
Temporary investments with an original maturity of three months or less and money market funds with greater than three month maturities but with the right to redeem without notices are treated as cash equivalents and are stated at cost. Temporary investments totaled $663$642 million and $757$690 million at SeptemberJune 30, 20172023 and December 31, 2016,2022, respectively.
Accounts and Notes Receivable
| | | In millions | September 30, 2017 | | December 31, 2016 | In millions | June 30, 2023 | | December 31, 2022 |
| Accounts and notes receivable, net: | | | | Accounts and notes receivable, net: | |
| Trade | $ | 3,098 |
| | $ | 2,759 |
| |
| Trade (less allowances of $35 in 2023 and $31 in 2022) | | Trade (less allowances of $35 in 2023 and $31 in 2022) | $ | 2,892 | | | $ | 3,064 | |
| Other | 245 |
| | 242 |
| Other | 248 | | | 220 | |
| Total | $ | 3,343 |
| | $ | 3,001 |
| Total | $ | 3,140 | | | $ | 3,284 | |
The allowance for doubtful accounts was $78 millionInventories
| | | | | | | | | | | |
| In millions | June 30, 2023 | | December 31, 2022 |
| Raw materials | $ | 251 | | | $ | 267 | |
| Finished pulp, paper and packaging | 986 | | | 1,071 | |
| Operating supplies | 600 | | | 516 | |
| Other | 74 | | | 88 | |
| Total | $ | 1,911 | | | $ | 1,942 | |
Plants, Properties and $70 million at September 30, 2017 and December 31, 2016, respectively.Equipment
Inventories
|
| | | | | | | |
| In millions | September 30, 2017 | | December 31, 2016 |
| Raw materials | $ | 275 |
| | $ | 296 |
|
| Finished pulp, paper and packaging | 1,453 |
| | 1,381 |
|
| Operating supplies | 646 |
| | 661 |
|
| Other | 91 |
| | 100 |
|
| Total | $ | 2,465 |
| | $ | 2,438 |
|
Depreciation
Accumulated depreciation was $22.7$18.8 billion and $21.6$18.4 billion at SeptemberJune 30, 20172023 and December 31, 2016.2022, respectively. Depreciation expense was $341$235 million and $294$256 million for the three months ended SeptemberJune 30, 20172023 and 2016,2022, respectively, and $997$467 million and $845$506 million for the ninesix months ended SeptemberJune 30, 20172023 and 2016,2022, respectively.
Non-cash additions to plants, properties and equipment included within accounts payable were $74 million and $185 million at June 30, 2023 and December 31, 2022, respectively.
There were no insurance recoveries included within capital spending for the six months ended June 30, 2023. Insurance recoveries included in capital spending were $25 million for the six months ended June 30, 2022.
Accounts Payable
Under a supplier finance program, IP agrees to pay a bank the stated amount of confirmed invoices from its designated suppliers on the original maturity dates of the invoices. IP or the bank may terminate the agreement upon at least 90 days’ notice. The supplier invoices that have been confirmed as valid under the program require payment in full on the due date with no terms exceeding 180 days. The accounts payable balance included $139 million and $122 million of supplier finance program liabilities as of June 30, 2023 and December 31, 2022, respectively.
Interest
Interest payments made during the ninesix months ended SeptemberJune 30, 20172023 and 20162022 were $600$240 million and $511$165 million, respectively.
Amounts related to interest were as follows:
| | | | | | | | | | | | | | | | | | | | | | | |
| | Three Months Ended
June 30, | | Six Months Ended
June 30, |
| In millions | 2023 | | 2022 | | 2023 | | 2022 |
| Interest expense | $ | 103 | | | $ | 83 | | | $ | 206 | | | $ | 160 | |
| Interest income | 44 | | | 9 | | | 85 | | | 17 | |
| Capitalized interest costs | 6 | | | 4 | | | 11 | | | 8 | |
Asset Retirement Obligations
The Company recorded liabilities in Other Liabilities in the accompanying condensed consolidated balance sheet of $103 million and $105 million related to asset retirement obligations at June 30, 2023 and December 31, 2022, respectively.
|
| | | | | | | | | | | | | | | |
| | Three Months Ended
September 30, | | Nine Months Ended
September 30, |
| In millions | 2017 | | 2016 | | 2017 | | 2016 |
| Interest expense | $ | 198 |
| | $ | 181 |
| | $ | 571 |
| | $ | 513 |
|
| Interest income | 46 |
| | 49 |
| | 140 |
| | 129 |
|
| Capitalized interest costs | 6 |
| | 7 |
| | 18 |
| | 21 |
|
International Paper leases various real estate, including certain operating facilities, warehouses, office space and land. The Company also leases material handling equipment, vehicles, and certain other equipment. The Company's leases have a remaining lease term of up to 30 years. Total lease costs were $73 million and $64 million for the three months ended June 30, 2023 and 2022, respectively, and $148 million and $124 million for the six months ended June 30, 2023 and 2022, respectively.
Supplemental Balance Sheet Information Related to Leases
| | | | | | | | | | | | | | | | | | | | |
| In millions | | Classification | | June 30, 2023 | | December 31, 2022 |
| Assets | | | | | | |
| Operating lease assets | | Right-of-use assets | | $ | 449 | | | $ | 424 | |
| Finance lease assets | | Plants, properties and equipment, net (a) | | 48 | | | 49 | |
| Total leased assets | | | | $ | 497 | | | $ | 473 | |
| Liabilities | | | | | | |
| Current | | | | | | |
| Operating | | Other current liabilities | | $ | 152 | | | $ | 147 | |
| Finance | | Notes payable and current maturities of long-term debt | | 11 | | | 10 | |
| Noncurrent | | | | | | |
| Operating | | Long-term lease obligations | | 304 | | | 283 | |
| Finance | | Long-term debt | | 46 | | | 49 | |
| Total lease liabilities | | | | $ | 513 | | | $ | 489 | |
(a)Finance leases are recorded net of accumulated amortization of $64 million and $59 million as of June 30, 2023 and December 31, 2022, respectively.
The Company accounts for the following investment under the equity method of accounting.
Ilim S.A.
The Company has a 50% equity interest in Ilim, which has subsidiaries, including the Ilim Group, whose primary operations are in Russia. The Company announced in January 2023 that it had entered into an agreement to sell its interest in Ilim to its joint venture partners for $484 million. The completion of the sale is subject to various closing conditions, including the receipt of regulatory approvals in Russia.
The Company also received an indication of interest from its Ilim joint venture partners to purchase all of the Company’s shares (constituting a 2.39% stake) in Ilim Group for $24 million, on terms and conditions to be agreed. The Company intends to pursue an agreement to sell the Ilim Group shares, and to divest other non-material residual interests associated with Ilim, to its Ilim joint venture partners.
In conjunction with the entry into the announced agreement, a determination was made that the book value of the Ilim and Ilim Group investments plus associated cumulative translation losses, exceeded fair value, based on the agreed upon transaction price for Ilim and the offer price for Ilim Group. As a result, an other than temporary impairment of $33 million, $43 million and $533 million was recorded for the three months ended June 30, 2023, March 31, 2023 and December 31, 2022, respectively, and $76 million for the six months ended June 30, 2023, to write down these investments to fair value. The impairment charges included approximately $60 million, $43 million and $375 million of foreign currency cumulative translation adjustment loss for the three months ended June 30, 2023, March 31, 2023 and December 31, 2022, respectively, and $103 million for the six months ended June 30, 2023. As of June 30, 2023, approximately $478 million of cumulative translation adjustment loss remained within AOCI with the recognition of this loss recorded as an offset to the investment balance.
The Company evaluated facts and circumstances as of December 31, 2022 and June 30, 2023 and concluded that the held for sale balance sheet classification criteria had been met and therefore classified the Ilim joint venture investment balance, net of impairment, as Assets held for sale.
All current and historical results of the Ilim joint venture investment are presented as Discontinued Operations, net of taxes in the condensed consolidated statement of operations. The Company recorded equity earnings, net of taxes, of $46 million and $95 million for the three months ended June 30, 2023 and 2022, respectively and $89 million and $188 million for the six months ended June 30, 2023 and 2022, respectively. The Company received cash dividends from the Ilim joint venture of $13 million and $204 million during the first six months of 2023 and 2022, respectively. At June 30, 2023 and December 31, 2022, the Company's investment in the Ilim joint venture, which is recorded in Assets held for sale in the condensed consolidated balance sheets, was $30 million and $133 million, respectively, which was $467 million and $403 million, respectively, lower than the Company's proportionate share of the Ilim joint venture's underlying net assets.
Summarized financial information for the Ilim joint venture is presented in the following tables:
Balance Sheet
| | | | | | | | | | | |
| In millions | June 30, 2023 | | December 31, 2022 |
| Current assets | $ | 708 | | | $ | 766 | |
| Noncurrent assets | 3,044 | | | 3,663 | |
| Current liabilities | 1,453 | | | 1,275 | |
| Noncurrent liabilities | 1,261 | | | 2,040 | |
| Noncontrolling interests | 38 | | | 40 | |
Income Statement | | | | | | | | | | | | | | | | | | | | | | | |
| Three Months Ended
June 30, | | Six Months Ended
June 30, |
| In millions | 2023 | | 2022 | | 2023 | | 2022 |
| Net sales | $ | 581 | | | $ | 815 | | | $ | 1,203 | | | $ | 1,522 | |
| Gross profit | 253 | | | 444 | | | 530 | | | 843 | |
| Income (loss) from continuing operations | 92 | | | 189 | | | 176 | | | 372 | |
| Net income (loss) | 88 | | | 185 | | | 168 | | | 362 | |
The Company's remaining equity method investments are not material.
Goodwill
The following table presents changes in goodwill balances as allocated to each business segment for the nine-month periodsix months ended SeptemberJune 30, 2017:2023:
|
| | | | | | | | | | | | | | | | | | | |
| In millions | Industrial Packaging | | Global Cellulose Fibers | | Printing Papers | | Consumer Packaging | | Total |
| Balance as of January 1, 2017 | | | | | | | | | |
| Goodwill | $ | 3,316 |
| | $ | 19 |
| | $ | 2,143 |
| | $ | 1,664 |
| | $ | 7,142 |
|
| Accumulated impairment losses (a) | (237 | ) | | — |
| | (1,877 | ) | | (1,664 | ) | | (3,778 | ) |
| | 3,079 |
| | 19 |
| | 266 |
| | — |
| | 3,364 |
|
| Reclassifications and other (b) | 5 |
| | — |
| | 14 |
| | — |
| | 19 |
|
| Additions/reductions | 5 |
| (c) | 33 |
| (d) | (1 | ) | | — |
| | 37 |
|
| Balance as of September 30, 2017 | | | | | | | | | |
| Goodwill | 3,326 |
| | 52 |
| | 2,156 |
| | 1,664 |
| | 7,198 |
|
| Accumulated impairment losses (a) | (237 | ) | | — |
| | (1,877 | ) | | (1,664 | ) | | (3,778 | ) |
| Total | $ | 3,089 |
| | $ | 52 |
| | $ | 279 |
| | $ | — |
| | $ | 3,420 |
|
| | | | | | | | | | | | | | | | | |
| In millions | Industrial
Packaging | | Global Cellulose Fibers | | Total |
| Balance as of January 1, 2023 | | | | | |
| Goodwill | $ | 3,413 | | | $ | 52 | | | $ | 3,465 | |
| Accumulated impairment losses | (372) | | | (52) | | | (424) | |
| 3,041 | | | — | | | 3,041 | |
| Currency translation and other (a) | 2 | | | — | | | 2 | |
| Accumulated impairment loss additions / reductions | — | | | — | | | — | |
| Balance as of June 30, 2023 | | | | | |
| Goodwill | 3,415 | | | 52 | | | 3,467 | |
| Accumulated impairment losses | (372) | | | (52) | | | (424) | |
| Total | 3,043 | | | — | | | 3,043 | |
| |
(a) | Represents accumulated goodwill impairment charges since the adoption of ASC 350, “Intangibles – Goodwill and Other” in 2002. |
| |
(b) | Represents the effects of foreign currency translations and reclassifications. |
| |
(c) | Reflects the acquisition of the newly acquired Moroccan box plant. |
| |
(d) | Represents purchase price adjustments related to the the newly acquired pulp business. |
(a)Represents the effects of foreign currency translations.
Other Intangibles
Identifiable intangible assets are recorded in Deferred Charges and Other Assets in the accompanying condensed consolidated balance sheet and comprised the following:
| | | | September 30, 2017 | | December 31, 2016 | | June 30, 2023 | | December 31, 2022 |
| In millions | Gross Carrying Amount | | Accumulated Amortization | | Gross Carrying Amount | | Accumulated Amortization | In millions | Gross
Carrying
Amount | | Accumulated
Amortization | | Net Intangible Assets | | Gross
Carrying
Amount | | Accumulated
Amortization | | Net Intangible Assets |
| Customer relationships and lists | $ | 612 |
| | $ | 242 |
| | $ | 605 |
| | $ | 211 |
| Customer relationships and lists | $ | 494 | | | $ | 321 | | | $ | 173 | | | $ | 490 | | | $ | 303 | | | $ | 187 | |
| Non-compete agreements | 71 |
| | 71 |
| | 69 |
| | 64 |
| |
| Tradenames, patents and trademarks, and developed technology | 173 |
| | 69 |
| | 173 |
| | 56 |
| Tradenames, patents and trademarks, and developed technology | 170 | | | 150 | | | 20 | | | 170 | | | 146 | | | 24 | |
| Land and water rights | 8 |
| | 2 |
| | 10 |
| | 2 |
| Land and water rights | 8 | | | 2 | | | 6 | | | 8 | | | 2 | | | 6 | |
| Software | 23 |
| | 22 |
| | 21 |
| | 20 |
| |
| Other | 50 |
| | 38 |
| | 48 |
| | 26 |
| Other | 21 | | | 18 | | | 3 | | | 23 | | | 20 | | | 3 | |
| Total | $ | 937 |
| | $ | 444 |
| | $ | 926 |
| | $ | 379 |
| Total | $ | 693 | | | $ | 491 | | | $ | 202 | | | $ | 691 | | | $ | 471 | | | $ | 220 | |
The Company recognized the following amounts as amortization expense related to intangible assets:
| | | | | | | | | | | | | | | | | | | | | | | |
| | Three Months Ended
June 30, | | Six Months Ended
June 30, |
| In millions | 2023 | | 2022 | | 2023 | | 2022 |
| Amortization expense related to intangible assets | $ | 9 | | | $ | 11 | | | $ | 18 | | | $ | 22 | |
|
| | | | | | | | | | | | | | | |
| | Three Months Ended
September 30, | | Nine Months Ended
September 30, |
| In millions | 2017 | | 2016 | | 2017 | | 2016 |
| Amortization expense related to intangible assets | $ | 27 |
| | $ | 14 |
| | $ | 60 |
| | $ | 39 |
|
NOTE 1112 - INCOME TAXES
International Paper made income tax payments, net of refunds, of $122$215 million and $68$150 million for the ninesix months ended SeptemberJune 30, 20172023 and 2016,2022, respectively.
The following table presents a rollforward of unrecognized tax benefits and related accrued estimated interest and penalties for the nine months ended September 30, 2017:
|
| | | | | | | |
| In millions | Unrecognized Tax Benefits | | Accrued Estimated Interest and Tax Penalties |
| Balance at December 31, 2016 | $ | (98 | ) | | $ | (22 | ) |
| Activity for three months ended March 31, 2017 | (2 | ) | | 2 |
|
| Activity for the three months ended June 30, 2017 | (42 | ) | | 1 |
|
| Activity for the three months ended September 30, 2017 | 1 |
| | — |
|
| Balance at September 30, 2017 | $ | (141 | ) | | $ | (19 | ) |
The Company currently estimates, that as a result of ongoing discussions, pending tax settlements and expirations of statutes of limitations, the amount of unrecognized tax benefits could be reduced by approximately $4$12 million during the next 12 months.
International Paper uses the flow-through method to account for investment tax credits earned on eligible open loop-biomass facilities and Combined Heat and Power system expenditures. Under this method, the investment tax credits are recognized as a reduction to income tax expense in the year they are earned rather than a reduction in the asset basis. The Company recorded a tax benefit of $29 million in the third quarter related to Investment Tax Credits earned in tax years 2016-2017.
NOTE 1213 - COMMITMENTS AND CONTINGENCIES
Guarantees
In connection with sales of businesses, property, equipment, forestlands and other assets, International Paper commonly makes representations and warranties relating to such businesses or assets, and may agree to indemnify buyers with respect to tax and environmental liabilities, breaches of representations and warranties, and other matters. Where liabilities for such matters are determined to be probable and reasonably estimable, accrued liabilities are recorded at the time of sale as a cost of the transaction.
Brazil Goodwill Tax Matter: The Brazilian Federal Revenue Service has challenged the deductibility of goodwill amortization generated in a 2007 acquisition by Sylvamo do Brasil Ltda. ("Sylvamo Brazil"), which was a wholly-owned subsidiary of the Company, until the October 1, 2021 spin-off of the Printing Papers business, after which it became a subsidiary of Sylvamo. Sylvamo Brazil received assessments for the tax years 2007-2015 totaling approximately $121 million in tax, and $414 million in interest, penalties, and fees as of June 30, 2023 (adjusted for variation in currency exchange rates). After an initial favorable ruling challenging the basis for these assessments, Sylvamo Brazil received subsequent unfavorable decisions from the Brazilian Administrative Council of Tax Appeals. Sylvamo Brazil has appealed these decisions and intends to appeal any future unfavorable administrative judgments to the Brazilian federal courts; however, this tax litigation matter may take many years to resolve. Sylvamo Brazil and International Paper believe the transaction underlying these assessments was appropriately evaluated, and that Sylvamo Brazil's tax position would be sustained, based on Brazilian tax law.
This matter pertains to a business that was conveyed to Sylvamo as of October 1, 2021, as part of our spin-off transaction. Pursuant to the terms of the tax matters agreement entered into between the Company and Sylvamo, the Company will pay 60% and Sylvamo will pay 40%, on up to $300 million of any assessment related to this matter, and the Company will pay all amounts of the assessment over $300 million. Under the terms of the agreement, decisions concerning the conduct of the litigation related to this matter, including strategy, settlement, pursuit and abandonment, will be made by the Company. Sylvamo thus has no control over any decision related to this ongoing litigation. The Company intends to vigorously defend this historic tax position against the current assessments and any similar assessments that may be issued for tax years subsequent to 2015. The Brazilian government may enact a tax amnesty program that would allow Sylvamo Brazil to resolve this dispute for
less than the assessed amount. As of October 1, 2021, in connection with the recording of the distribution of assets and liabilities resulting from the spin-off transaction, the Company established a liability representing the initial fair value of the contingent liability under the tax matters agreement. The contingent liability was determined in accordance with ASC 460 "Guarantees" based on the probability weighting of various possible outcomes. The initial fair value estimate and recorded liability as of December 31, 2022 was $48 million and remains this amount at June 30, 2023. This liability will not be increased in subsequent periods unless facts and circumstances change such that an amount greater than the initial recognized liability becomes probable and estimable.
Environmental
International PaperThe Company has been named as a potentially responsible party (PRP)("PRP") in environmental remediation actions under various federal and state laws, including the Comprehensive Environmental Response, Compensation and Liability Act (CERCLA)("CERCLA"). Many of these proceedings involve the cleanup of hazardous substances at large commercial landfills that received waste from many different sources. While joint and several liability is authorized under CERCLA and equivalent state laws, as a practical matter, liability for CERCLA cleanups is typically allocated among the many PRPs. There are other remediation costs typically associated with the cleanup of hazardous substances at the Company’s current, closed orand formerly-owned facilities, and recorded as liabilities in the balance sheet.
Remediation costs are recorded in the consolidated financial statements when they become probable and reasonably estimable. International Paper has estimated the probable liability associated with these environmental remediation matters, including those described herein, to be approximately $130$238 million and $243 million in the aggregate at Septemberas of June 30, 2017.2023 and December 31, 2022, respectively. Other than as described above,below, completion of required environmental remedial actions is not expected to have a material effect on our consolidated financial statements.
Cass Lake: One of the matters included above arises out of a closed wood-treatingwood-treatment facility located in Cass Lake, Minnesota. In June 2011, the United States Environmental Protection Agency (EPA)("EPA") selected and published a proposed soil remedy at the site with an estimated cost of $46 million. The overall remediation reserve for the site is currently $48 million to address the selection of an alternative for the soil remediation component of the overall site remedy which includes the ongoing groundwater remedy. In October 2011, the EPA released a public statement indicating that the final soil remedy decision would be delayed. In March 2016,April 2020, the EPA issued a proposedfinal plan concerning clean-up standards at a portion of the site, the estimated cost of which is included within the $48 million reservesoil remedy referenced above. In October 2012, the Natural Resource Trustees for this site provided notice to International Paper and other potentially responsible parties of their intent to perform a Natural Resource Damage Assessment. It is premature to predict the outcome of this assessment or to estimate a loss or range of loss, if any, which may be incurred.
Kalamazoo River: The Company is a PRP with respect to the Allied Paper, Inc./Portage Creek/Kalamazoo River Superfund Site in Michigan. The EPA asserts that the site is contaminated by polychlorinated biphenyls (PCBs)("PCBs") primarily as a result of discharges from various paper mills located along the Kalamazoo River, including a paper mill (the Allied Paper Mill) formerly owned by St. Regis Paper Company (St. Regis). The Company is a successor in interest to St. Regis.
•Operable Unit 5, Area 1: In March 2016, the Company and other PRPs received a special notice letter from the EPA (i) inviting participation in implementing a remedy for a portion of the site known as Operable Unit 5, Area 1, and (ii) demanding reimbursement of EPA past costs related to this portion of the site totaling $37 million, including $19 millionin past costs previously demanded by the EPA. The Company responded to the special notice letter. In December 2016, the EPA issued a unilateral administrative order to the Company and other PRPs to perform the remedy for this portion of the site.remedy. The Company responded to the unilateral administrative order, agreeing to comply with the order subject to its sufficient cause defenses.
In April 2016, the EPA issued a separate unilateral administrative order to the Company and certain other PRPs for a time-critical removal action (TCRA) of PCB-contaminated sediments from a different portion of the site. The Company responded to the unilateral administrative order, agreeing to comply with the order subject to its sufficient cause defenses.
•Operable Unit 1: In October 2016, the Company and another PRP received a special notice letter from the EPA inviting participation in the remedial design ("RD") component of the landfill remedy for the Allied Paper Mill.Mill, which is also known as Operable Unit 1. The recordRecord of decisionDecision ("ROD") establishing the final landfill remedy for the Allied Paper Mill was issued by the EPA in September 2016. The Company responded to the Allied Paper Mill special notice letter in late December 2016.2016. In February 2017, the EPA informed the Company that it would make other arrangements for the performance of the RD. In the summer 2021, remedial design.
action ("RA") activities were initiated by the EPA. In October 2022, the Company received a unilateral administrative order to perform the RA. As a result, the Company increased its reserve by $27 million in the fourth quarter of 2022. The total reserve for the Kalamazoo River superfund site was $35 million and $37 million as of June 30, 2023 and December 31, 2022, respectively.
In addition, in December 2019, the United States published notice in the Federal Register of a proposed consent decree with NCR Corporation (one of the parties to the allocation/apportionment litigation described below), the State of Michigan and natural resource trustees under which NCR Corporation would make payments of more than $100 million and perform work in Operable Unit 5, Areas 2, 3, and 4 at an estimated cost of $136 million. In December 2020, the Federal District Court approved the proposed consent decree.
The Company’s CERCLA liability has not been finally determined with respect to these or any other portions of the site, and except as noted above, the Company has declined to perform any work or reimburse the EPA at this time. As noted below, the
Company is involved in allocation/apportionment litigation with regard to the site. Accordingly, it is premature to predict the outcome or estimate our maximum reasonably possible loss or range of loss with respect to this site. However, we do not believeWe have recorded a liability for future remediation costs at the site that any material loss is probable.are probable and reasonably estimable, and it remains reasonably possible that additional losses in excess of this recorded liability could be material.
The Company was named as a defendant by Georgia-Pacific Consumer Products LP, Fort James Corporation and Georgia Pacific LLC (collectively, "GP") in a contribution and cost recovery action for alleged pollution at the site. NCR Corporation and Weyerhaeuser Company are also named as defendants in the suit. The suit seeks contribution under CERCLA for costs purportedly expended by plaintiffs ($($79 million as of the filing of the complaint) and for future remediation costs. The suit alleges that a mill, duringIn June 2018, the time it was allegedly ownedCourt issued its Final Judgment and operated by St. Regis, discharged PCB contaminated solidsOrder, which fixed the past cost amount at approximately $50 million (plus interest to be determined) and paper residuals resulting from paper de-inking and recycling. NCR Corporation and Weyerhaeuser Company are also named as defendants in the suit. In mid-2011, the suit was transferred from the District Court for the Eastern District of Wisconsinallocated to the District CourtCompany a 15% share of responsibility for the Western District of Michigan. The trial of the initial liability phase took place in February 2013. Weyerhaeuser conceded prior to trial that it was a liable party with respect to the site. In September 2013, an opinion and order was issued in the suit. The order concluded that the Company (as the successor to St. Regis) was not an “operator,” but was an “owner,” of the mill at issue during a portion of the relevant period and is therefore liable under CERCLA. The order also determined that NCR is a liable party as an "arranger for disposal" of PCBs in waste paper that was de-inked and recycled by mills along the Kalamazoo River. The order did not address the Company's responsibility, if any, forthose past or future costs. The parties’ responsibility, including that of the Company, was the subject of a second trial, which was concluded in late 2015. A decision hasCourt did not been rendered and it is unclear to what extent the Court will address responsibility for future costs in its decision. In July 2018, the Company and each of the other parties filed notices appealing the Final Judgment and prior orders incorporated into that decision. We are unableJudgment. On April 25, 2022, the appellate court reversed the Judgment of the Court, finding that the suit against the Company was time-barred by the applicable statute of limitations. On May 9, 2022, GP filed a petition for remaining with the Sixth Circuit Court of Appeals. The Sixth Circuit issued an order denying GP's petition on July 14, 2022. On November 14, 2022, GP filed a petition for writ of certiorari with the U.S. Supreme Court. The Company has filed a brief in opposition to predict the outcome or estimate our maximum reasonably possible loss. However, we do not believe that any material loss is probable.this writ.
Harris County:International Paper and McGinnis Industrial Maintenance Corporation (MIMC)("MIMC"), a subsidiary of Waste Management, Inc. (WMI)("WMI"), are PRPs at the San Jacinto River Waste Pits Superfund Site in Harris County, Texas. The PRPs have been actively participating in the activities at the site. site and share the costs of these activities.
In September 2016, the EPA issued a proposed remedial action plan (PRAP) for the site, which identified the preferred remedy as the removal of the contaminated material currently protected by an armored cap. In addition, the EPA selected a preferred remedy for the separate southern impoundment that requires offsite disposal. In January 2017, the PRPs submitted comments on the PRAP.
On October 11, 2017, the EPA issued a Record of Decision (ROD)ROD selecting the final remedy for the site: removal and relocation of the waste material from both the northern and southern impoundments. The EPA did not specify the methods or practices needed to perform this work. On October 25, 2017,The EPA’s selected remedy was accompanied by a cost estimate of approximately $115 million ($105 million for the northern impoundment, and $10 million for the southern impoundment). Subsequent to the issuance of the ROD, there have been numerous meetings between the EPA and the PRPs, received a letter fromand the Company continues to work with the EPA inviting participationand MIMC/WMI to develop the remedial design.
To this end, in April 2018, the PRPs entered into an Administrative Order on Consent ("AOC") with the EPA, agreeing to work together to develop the remedial design componentfor the northern impoundment. That remedial design work is ongoing. The AOC does not include any agreement to perform waste removal or other construction activity at the site. Rather, it involves adaptive management techniques and a pre-design investigation, the objectives of which include filling data gaps (including but not limited to post-Hurricane Harvey technical data generated prior to the EPA’sROD and not incorporated into the selected remedy), refining areas and volumes of materials to be addressed, determining if an excavation remedy is able to be implemented in a manner protective of human health and the environment, and investigating potential impacts of remediation activities to infrastructure in the vicinity.
During the first quarter of 2020, through a series of meetings among the Company, MIMC/WMI, our consultants, the EPA and the Texas Commission on Environmental Quality ("TCEQ"), progress was made to resolve key technical issues previously preventing the Company from determining the manner in which the selected remedy for the site,northern impoundment would be feasibly implemented. As a result of these developments, the Company reserved the following amounts in relation to remediation at this site: (a) $10 million for the southern impoundment; and (b) $55 million for the northern impoundment, which represents the Company's 50% share of our estimate of the low end of the range of probable remediation costs.
We submitted the Final Design Package for the southern impoundment to the EPA, and the EPA approved this plan May 7, 2021. The EPA issued a Unilateral Administrative Order for Remedial Action of the southern impoundment on August 5, 2021. An addendum to the Final 100% Remedial Design (Amended April 2021) was submitted to the EPA for the southern impoundment on June 2, 2022. This addendum incorporated additional data collected to date which indicated that additional waste material removal will be required, lengthening the time to complete the remedial action.
With respect to the northern impoundment, the respondents submitted final component of the 90% remedial design to the EPA on November 8, 2022. Upon submittal of the final component, an updated engineering estimate was developed and the Company plansincreased the reserved amount by approximately $21 million, which represents the Company's 50% share of our estimate of the low end of the range of probable remediation costs. While several key technical issues have been resolved, respondents still face significant challenges remediating this area in a cost-efficient manner and without a release to participate in this remedial design processthe environment, and therefore our discussions with the EPA on the best approach to determine ifremediation will continue. Because of ongoing questions regarding cost effectiveness, timing and how the remedy can be accomplished. We expect this process will include additional studies to determine feasible alternatives and costs to complete this final remedy. Consequently, whilegathering other technical data, additional losses in excess of our
recorded liability are probablepossible. The total reserve for the southern and northern impoundment was $91 million and $95 million as of June 30, 2023 and December 31, 2022, respectively.
Asbestos-Related Matters
We have been named as a resultdefendant in various asbestos-related personal injury litigation, in both state and federal court, primarily in relation to the prior operations of certain companies previously acquired by the selected remedy, we are currently unableCompany. The Company's total recorded liability with respect to determine any adjustment to our immaterial recorded liability. Itpending and future asbestos-related claims was $111 million, net of estimated insurance recoveries and $105 million, net of estimated insurance recoveries as of June 30, 2023 and December 31, 2022, respectively. While it is reasonably possible that additionalthe Company may incur losses could be material as the remedial design processin excess of its recorded liability with the EPA continues over the coming quarters.
International Paper and MIMC/WMIrespect to asbestos-related matters, we are also defending an additional lawsuit related to the site brought by approximately 600 individuals who allege property damage and personal injury. Because this case is still in the discovery phase, it is premature to predict the outcome orunable to estimate aany loss or range of loss if any, which may be incurred.
in excess of such liability, and do not believe additional material losses are probable.
Antitrust
Containerboard: On June 27,
In March 2017, the Company enteredItalian Competition Authority ("ICA") commenced an investigation into the Italian packaging industry to determine whether producers of corrugated sheets and boxes violated the applicable European competition law. In April 2019, the ICA concluded its investigation and issued initial findings alleging that over 30 producers, including our Italian packaging subsidiary ("IP Italy"), improperly coordinated the production and sale of corrugated sheets and boxes. In August 2019, the ICA issued its decision and assessed IP Italy a settlement agreement withfine of €29 million (approximately $31 million at the class plaintiffs in the class action lawsuit captionedKleen Products LLC et al. v. International Paper Co. et al. (N.D. Ill.) then-current exchange rates) which was filedrecorded in September
2010, and is pending in the United States District Court for the Northern District of Illinois. Eight containerboard producers, including the Company, Temple-Inland and Weyerhaeuser Company (the "Released Defendants"), were named as defendants in the lawsuit which alleges a civil violation of Section 1 of the Sherman Act. In particular, the lawsuit alleges that the defendants conspired to limit the supply and thereby increase prices of containerboard products during the period from February 15, 2004, through November 8, 2010. Four similar complaints were filed and consolidated in the Northern District of Illinois. In March 2015, the District Court certified a plaintiff class consisting of all persons who purchased containerboard products directly from the defendant for use or delivery in the United States during the class period.
Under the terms of the settlement agreement, on August 1, 2017, the Company paid $354 million into a settlement fund in return for a dismissal of the Released Defendants and release of all claims and alleged damages asserted against the Released Defendants in the lawsuit or that are related to or arise from the direct purchase of containerboard products from the Released Defendants by the class members from the beginning of time up to preliminary approval of the settlement agreement by the district court, which occurred on July 13, 2017. Any attorneys' fees awarded by the district court and all costs of notice and claims administration will be paid from the settlement fund. On October 17, 2017, the district court granted final approval of the settlement agreement and thus the release is now effective as to all class members.
In June 2016, a lawsuit captioned Ashley Furniture Indus., Inc. v. Packaging Corporation of America (W.D. Wis.), was filed in federal court in Wisconsin against ten defendants, including the Company, Temple-Inland and Weyerhaeuser Company. The Ashley Furniture lawsuit closely tracks the allegations found in the Kleen Products complaint, alleging a practically identical civil violation of Section 1 of the Sherman Act, but also asserts Wisconsin state antitrust claims. In January 2011, International Paper was named as a defendant in a lawsuit filed in state court in Cocke County, Tennessee alleging that International Paper violated Tennessee law by conspiring to limit the supply and fix the prices of containerboard from mid-2005 to the present. Plaintiffs in the state court action seek certification of a class of Tennessee indirect purchasers of containerboard products, damages and costs, including attorneys' fees. No class certification materials have been filed to date in the Tennessee action.
The Company continues to dispute the allegations made in the Ashley Furniture and Tennessee lawsuits and vigorously defend each. At this time, however, because the actions are in a preliminary stage, we are unable to predict an outcome or estimate a range of reasonably possible loss.
Contract
Signature: In August 2014, a lawsuit captioned Signature Industrial Services LLC et al. v. International Paper Company was filed in state court in Texas. The Signature lawsuit arises out of approximately $1 million in disputed invoices related to the installation of new equipment at the Company's Orange, Texas mill. In addition to the invoices in dispute, Signature and its president allege consequential damages arising from the Company's nonpayment of those invoices. The lawsuit was tried before a jury in Beaumont, Texas, in May 2017. On June 1, 2017, the jury returned a verdict awarding approximately $125 million in damages to the plaintiffs. The verdict will not be final until post-trial motions are decided, and the Company will appeal the final judgment thereafter. The Company has numerous and strong bases for appeal, and we believe we will prevail on appeal. Because post-trial proceedings are in a preliminary stage, we are unable to estimate a range of reasonably possible loss, but we expect the amount of any loss to be immaterial.
Tax
On October 16, 2015, the Company was notified of a $110 million tax assessment issued by the state of Sao Paulo, Brazil (State) for tax years 2011 through 2013. The assessment pertained to invoices issued by the Company related to the sale of paper to the editorial segment, which is exempt from the payment of ICMS value-added tax. During the second quarter of 2016, the Company received a favorable first instance judgment vacating the State's assessment. During the third quarter of 2017,2019. We appealed the Company received a favorableICA decision and our appeal was denied in May 2021. We further appealed the decision to the Italian Council of State, and in March 2023 the Council of State largely upheld the ICA’s findings, but referred the calculation of IP Italy’s fine back to the ICA, finding that it was disproportionately high based on the second instance judgment after the Stateconduct found. We have further appealed the first instance. In OctoberItalian Council of 2017,State decision to uphold the ICA’s findings. The Company was notifiedand other producers also have been named in lawsuits, and we have received other claims, by a number of customers in Italy for damages associated with the State willalleged anticompetitive conduct. We do not appeal the second instance judgment, making the decision finalbelieve material losses arising from such private lawsuits and canceling the tax assessment.claims are probable.
General
The Company is involved in various other inquiries, administrative proceedings and litigation relating to environmental and safety matters, personal injury, product liability, labor and employment, contracts, sales of property, intellectual property, tax, and other matters, some of which allege substantial monetary damages. While any proceeding or litigation hasAssessments of lawsuits and claims can involve a series of complex judgments about future events, can rely heavily on estimates and assumptions, and are otherwise subject to significant uncertainties. As a result, there can be no certainty that the elementCompany will not ultimately incur charges in excess of uncertainty, thepresently recorded liabilities. The Company believes that loss contingencies arising from pending matters including the outcome of any of these lawsuits or claims that are pending or threatened or all of them combined (other than those that cannot be assessed due to their preliminary nature)matters described herein, will not have a material effect on itsthe consolidated financial statements.position or liquidity of the Company. However, in light of the inherent uncertainties involved in pending or threatened legal matters, some of which are beyond the Company's control, and the large or indeterminate damages sought in some of these matters, a future adverse ruling, settlement, unfavorable development, or increase in accruals with respect to these matters could result in future charges that could be material to the Company's results of operations or cash flows in any particular reporting period.
Variable Interest Entities
As of SeptemberJune 30, 2017,2023, the fair value of the Timber Notes and Extension Loans is $4.80for the 2007 Financing Entities was $2.3 billion and $4.32$2.1 billion, respectively, for the 2015 Financing Entities.respectively. The Timber Notes and Extension Loans are classified as Level 2 within the fair value hierarchy, which is further defined in Note 141 in the Company’s Annual Report on Form 10-K for the year ended December 31, 2016.Report.
Activity between the Company and the 2015 Financing Entities was as follows:
|
| | | | | | | | | | | | | | | |
| | Three Months Ended
September 30, | | Nine Months Ended
September 30, |
| In millions | 2017 | | 2016 | | 2017 | | 2016 |
| Revenue (a) | $ | 24 |
| | $ | 24 |
| | $ | 71 |
| | $ | 71 |
|
| Expense (a) | 32 |
| | 32 |
| | 96 |
| | 96 |
|
| Cash receipts (b) | 48 |
| | 47 |
| | 95 |
| | 76 |
|
| Cash payments (c) | 64 |
| | 64 |
| | 128 |
| | 98 |
|
| |
(a) | The revenue and expense are included in Interest expense, net in the accompanying statement of operations. |
| |
(b) | The cash receipts are interest received on the Financial assets of special purpose entities. |
| |
(c) | The cash payments represent interest paid on Nonrecourse financial liabilities of special purpose entities. |
As of September 30, 2017, the fair value of the Timber Notes and Extension Loans is $2.23 billion and $2.09 billion, respectively, for the 2007 Financing Entities. The Timber Notes of $2.3 billion and the Extension Loans of $2.1 billion both mature in 2027 and are classified as Level 2 withinshown in Long-term nonrecourse financial assets of variable interest entities and Long-term nonrecourse financial liabilities of variable interest entities, respectively, on the fair value hierarchy, which is further defined in Note 14 in the Company’s Annual Report on Form 10-K for the year ended December 31, 2016.accompanying condensed consolidated balance sheet.
Activity between the Company and the 2007 Financing Entities was as follows:
| | | | Three Months Ended
September 30, | | Nine Months Ended
September 30, | | Three Months Ended
June 30, | | Six Months Ended
June 30, |
| In millions | 2017 | | 2016 | | 2017 | | 2016 | In millions | 2023 | | 2022 | | 2023 | | 2022 |
| Revenue (a) | $ | 12 |
| | $ | 8 |
| | $ | 35 |
| | $ | 26 |
| Revenue (a) | $ | 36 | | | $ | 6 | | | $ | 69 | | | $ | 13 | |
| Expense (b) | 13 |
| | 10 |
| | 36 |
| | 26 |
| Expense (b) | 35 | | | 10 | | | 66 | | | 16 | |
| Cash receipts (c) | 7 |
| | 4 |
| | 19 |
| | 10 |
| Cash receipts (c) | 28 | | | 2 | | | 55 | | | 3 | |
| Cash payments (d) | 10 |
| | 7 |
| | 28 |
| | 19 |
| Cash payments (d) | 30 | | | 6 | | | 57 | | | 10 | |
| |
(a) | The revenue is included in Interest expense, net in the accompanying statement of operations and includes approximately $5 million and $14 million for the three and nine months ended September 30, 2017 and 2016, respectively, of accretion income for the amortization of the purchase accounting adjustment on the Financial assets of special purpose entities. |
| |
(b) | The expense is included in Interest expense, net in the accompanying statement of operations and includes approximately $2 million and $5 million for the three and nine months ended September 30, 2017 and 2016, respectively, of accretion expense for the amortization of the purchase accounting adjustment on the Nonrecourse financial liabilities of special purpose entities. |
| |
(c) | The cash receipts are interest received on the Financial assets of special purpose entities. |
| |
(d) | The cash payments are interest paid on Nonrecourse financial liabilities of special purpose entities. |
(a)The revenue is included in Interest expense, net in the accompanying statement of operations and includes approximately $4 million and $9 million for the three months and six months ended June 30, 2023 and 2022, respectively, of accretion income for the amortization of the basis difference adjustment on the Financial assets of special purpose entities.
(b)The expense is included in Interest expense, net in the accompanying statement of operations and includes approximately $1 million and $3 million for the three months and six months ended June 30, 2023 and 2022, respectively, of accretion expense for the amortization of the basis difference adjustment on the Nonrecourse financial liabilities of special purpose entities.
(c)The cash receipts are interest received on the Financial assets of special purpose entities.
(d)The cash payments are interest paid on Nonrecourse financial liabilities of special purpose entities.
On September 2, 2022, the Company and the Internal Revenue Service agreed to settle the previously disclosed timber monetization restructuring tax matter involving wholly-owned, special purpose entities (the "2015 Financing Entities"). Under this agreement, the Company was required to fully resolve the matter and pay $252 million in U.S. federal income taxes. As a result, interest was charged upon closing of the audit. The amount of interest expense recognized in 2022 was $58 million. As of June 30, 2023, $252 million in U.S. federal income taxes and $58 million in interest expense have been paid as a result of the settlement agreement. The Company paid $163 million in U.S. federal income taxes and $30 million in interest during the first quarter of 2023 and has now fully satisfied the payment terms of the settlement agreement regarding the 2015 Financing Entities timber monetization restructuring tax matter. The reversal of the Company’s remaining deferred tax liability associated with the 2015 Financing Entities of $604 million was recognized as a one-time tax benefit in the third quarter of 2022.
In August 2017, International Paper issued $1.0 billionThe borrowing capacity of 4.35% senior unsecured notes with a maturity date in 2048. The proceeds from this offering, together with a combination of available cash and other borrowings, were used to make a $1.25 billion voluntary cash contribution to the Company's pension plan.
Subsequent to September 30, 2017, International Paper repaid approximately $382 million of notes with an interest rate of 7.95% and an original maturity date in 2018.
In June 2016, International Paper entered into a commercial paper program with a borrowing capacity of $750 million.is $1.0 billion supported by its $1.4 billion credit agreement. Under the terms of the program, individual maturities on borrowings may vary, but not exceed one year from the date of issue. Interest bearing notes may be issued either as fixed or floating rate notes. As of SeptemberJune 30, 2017,2023, the Company had $445borrowings of $80 million outstanding under the program.
At June 30, 2023, International Paper’s credit facilities totaled $1.9 billion. The credit facilities generally provide for interest rates at a floating rate index plus a pre-determined margin dependent upon International Paper’s credit rating. The credit facilities previously included a $1.5 billion contractually committed bank facility with a maturity date of June 2026. In June 2023, the Company amended and restated its credit agreement to, among other things, (i) reduce the size of the contractually committed bank facility from $1.5 billion to $1.4 billion, (ii) extend the maturity date from June 2026 to June 2028, and (iii) replace the LIBOR-based rate with a SOFR-based rate. The liquidity facilities also included up to $500 million of uncommitted financings based on eligible receivables balances under a receivables securitization program that expires in June 2025. At June 30, 2023, the Company had no borrowings outstanding under the program atreceivables securitization program.
During the first quarter of 2023, the Company entered into a weighted averagevariable term loan agreement providing for a $600 million term loan which was fully drawn on the date of such loan agreement and matures in 2028. The $600 million debt was issued following the repayment of $410 million of commercial paper earlier in 2023. Additionally during the first quarter of 2023, the Company issued an approximately $72 million environmental development bond (EDB) with an interest rate of 1.39%.4.00% and a maturity date of April 1, 2026. The proceeds from this issuance were used to repay an approximately $72 million outstanding EDB that matured on April 1, 2023.
During the second quarter of 2023, the Company issued approximately $24 million of debt with a variable interest rate and a maturity date of December 1, 2027. The Company had debt reductions of approximately $49 million of variable interest EDBs with current maturities. Additionally during the second quarter of 2023, the Company issued an approximately $54 million EDB with a variable rate and a maturity date of May 1, 2028. The proceeds of this were used to repay an approximately $54 million EDB that matured on May 1, 2023. The Company issued an approximately $25 million EDB with a variable rate and a maturity date of June 1, 2030. The proceeds of this were used to repay an approximately $25 million EDB that matured on June 1, 2023.
The Company’s financial covenants require the maintenance of a minimum net worth, as defined in our debt agreements, of $9 billion and a total debt-to-capital ratio of less than 60%. Net worth is defined as the sum of common stock, paid-in capital and retained earnings, less treasury stock plus any cumulative goodwill impairment charges. The calculation also excludes accumulated other comprehensive income/loss and both the current and long-term Nonrecourse Financial Liabilities of Variable Interest Entities. The total debt-to-capital ratio is defined as total debt divided by the sum of total debt plus net worth. As of June 30, 2023, we were in compliance with our debt covenants.
At SeptemberJune 30, 2017,2023, the fair value of International Paper’s $12.3$5.8 billion of debt was approximately $13.5$5.5 billion. The fair value of the Company’s long-term debt is estimated based on the quoted market prices for the same or similar issues. International Paper’s long-term debt is classified as Level 2 within the fair value hierarchy, which is further defined in Note 141 in the Company’s Annual Report on Form 10-K for the year ended December 31, 2016.Report.
NOTE 15 - DERIVATIVES AND HEDGING ACTIVITIES
As a multinational company we are exposed to market risks, such as changes in interest rates, currency exchanges rates and commodity prices.
For detailed information regarding the Company’s hedging activities and related accounting, refer to Note 14 in the Company’s Annual Report on Form 10-K for the fiscal year ended December 31, 2016.
The notional amounts of qualifying and non-qualifying financial instruments used in hedging transactions were as follows: |
| | | | | | | | |
| In millions | September 30, 2017 | | December 31, 2016 | |
| Derivatives in Cash Flow Hedging Relationships: | | | | |
| Foreign exchange contracts (a) | $ | 348 |
| | $ | 275 |
| |
| Derivatives Not Designated as Hedging Instruments: | | | | |
| Electricity contract | 12 |
| | 6 |
| |
| Foreign exchange contracts | 11 |
| | 24 |
| |
| |
(a) | These contracts had maturities of two years or less as of September 30, 2017. |
The following table shows gains or losses recognized in AOCI, net of tax, related to derivative instruments:
|
| | | | | | | | | | | | | | | |
| | Gain (Loss) Recognized in AOCI on Derivatives (Effective Portion) |
| | Three Months Ended
September 30, | | Nine Months Ended
September 30, |
| In millions | 2017 | | 2016 | | 2017 | | 2016 |
| Foreign exchange contracts | $ | 1 |
| | $ | 5 |
| | $ | 9 |
| | $ | 6 |
|
| Interest rate contracts | — |
| | — |
| | — |
| | (11 | ) |
| Total | $ | 1 |
| | $ | 5 |
| | $ | 9 |
| | $ | (5 | ) |
During the next 12 months, the amount of the September 30, 2017 AOCI balance, after tax, that is expected to be reclassified to earnings is a gain of $2 million.
The amounts of gains and losses recognized in the statement of operations on qualifying and non-qualifying financial instruments used in hedging transactions were as follows: |
| | | | | | | | | | | | | | | | |
| | Gain (Loss) Reclassified from AOCI (Effective Portion) | Location of Gain (Loss) Reclassified from AOCI (Effective Portion) |
| | Three Months Ended
September 30, | | Nine Months Ended
September 30, | |
| In millions | 2017 | | 2016 | | 2017 | | 2016 | |
| Derivatives in Cash Flow Hedging Relationships: | | | | | | | | |
| Foreign exchange contracts | $ | 2 |
| | $ | 3 |
| | $ | 6 |
| | $ | 7 |
| Cost of products sold |
| Total | $ | 2 |
| | $ | 3 |
| | $ | 6 |
| | $ | 7 |
| |
|
| | | | | | | | | | | | | | | | |
| | Gain (Loss) Recognized | Location of Gain (Loss) In Statement of Operations |
| | Three Months Ended
September 30, | | Nine Months Ended
September 30, | |
| In millions | 2017 | | 2016 | | 2017 | | 2016 | |
| Derivatives Not Designated as Hedging Instruments: | | | | | | | | |
| Electricity contract | $ | (8 | ) | | $ | — |
| | $ | (10 | ) | | $ | — |
| Cost of products sold |
| Foreign exchange contracts | — |
| | — |
| | — |
| | — |
| Cost of products sold |
| Interest rate contracts | — |
|
| 2 |
| | — |
| | 5 |
| Interest expense, net |
| Total | $ | (8 | ) | | $ | 2 |
| | $ | (10 | ) | | $ | 5 |
| |
The following activity is related to fully effective interest rate swaps designated as fair value hedges:
|
| | | | | | | | | | | | | | | | | | | | | | | |
| |
|
| 2017 |
| |
|
|
| 2016 |
| |
| In millions | Issued |
| | Terminated |
| | Undesignated |
|
| Issued |
|
| Terminated |
| | Undesignated |
|
| Third Quarter | $ | — |
| | $ | — |
| | $ | — |
| | $ | — |
| | $ | — |
| | $ | — |
|
| Second Quarter | — |
| | — |
| | — |
| | — |
| | — |
| | — |
|
| First Quarter | — |
| | — |
| | — |
| | — |
|
| 55 |
|
| — |
|
| Total | $ | — |
| | $ | — |
| | $ | — |
| | $ | — |
| | $ | 55 |
| | $ | — |
|
Fair Value Measurements
For a discussion of the Company’s fair value measurement policies under the fair value hierarchy, refer to Note 14 in the Company’s Annual Report on Form 10-K for the fiscal year ended December 31, 2016.
The Company has not changed its valuation techniques for measuring the fair value of any financial assets or liabilities during the year. Transfers between levels, if any, are recognized at the end of the reporting period.
The following table provides a summary of the impact of our derivative instruments in the balance sheet:
Fair Value Measurements
Level 2 – Significant Other Observable Inputs
|
| | | | | | | | | | | | | | | | |
| | Assets | | Liabilities | |
| In millions | September 30, 2017 | | December 31, 2016 | | September 30, 2017 | | December 31, 2016 | |
| Derivatives designated as hedging instruments | | | | | | | | |
| Foreign exchange contracts – cash flow | $ | 9 |
| (a) | $ | 3 |
| (b) | $ | 3 |
| (c) | $ | 4 |
| (e) |
| Total derivatives designated as hedging instruments | 9 |
| | 3 |
| | 3 |
| | 4 |
| |
| Derivatives not designated as hedging instruments | | | | | | | | |
| Electricity contract | — |
|
| — |
|
| 8 |
| (d) | 2 |
| (e) |
| Total derivatives not designated as hedging instruments | — |
| | — |
| | 8 |
| | 2 |
| |
| Total derivatives | $ | 9 |
| | $ | 3 |
| | $ | 11 |
| | $ | 6 |
| |
| |
(a) | Includes $8 million recorded in Other current assets and $1 million recorded in Deferred charges and other assets in the accompanying balance sheet. |
| |
(b) | Included in Other current assets in the accompanying balance sheet. |
| |
(c) | Includes $2 million recorded in Other accrued liabilities and $1 million recorded in Other liabilities in the accompanying consolidated balance sheet.
|
| |
(d) | Includes $4 million recorded in Other accrued liabilities and $4 million recorded in Other liabilities in the accompanying consolidated balance sheet.
|
| |
(e) | Included in Other accrued liabilities in the accompanying balance sheet. |
The above contracts are subject to enforceable master netting arrangements that provide rights of offset with each counterparty when amounts are payable on the same date in the same currency or in the case of certain specified defaults. Management has made an accounting policy election to not offset the fair value of recognized derivative assets and derivative liabilities in the
balance sheet. The amounts owed to the counterparties and owed to the Company are considered immaterial with respect to each counterparty and in the aggregate with all counterparties.
Credit-Risk-Related Contingent Features
Certain of the Company’s financial instruments used in hedging transactions are governed by standard credit support arrangements with counterparties. If the lower of the Company’s credit rating by Moody’s or S&P were to drop below investment grade, the Company would be required to post collateral for all of its derivatives in a net liability position, although no derivatives would terminate. The fair values of derivative instruments containing credit risk-related contingent features in a net liability position were $2 million and $3 million as of September 30, 2017 and December 31, 2016, respectively. The Company was not required to post any collateral as of September 30, 2017 or December 31, 2016. For more information on credit-risk-related contingent features, refer to Note 14 in the Company’s Annual Report on Form 10-K for the fiscal year ended December 31, 2016.
NOTE 16 - RETIREMENT PLANS
International Paper sponsors and maintains the Retirement Plan of International Paper Company (the Pension Plan)"Pension Plan"), a tax-qualified defined benefit pension plan that provides retirement benefits to substantially all U.S. salaried employees and hourly employees (receiving salaried benefits) hired prior to July 1, 2004, and substantially all other U.S. hourly and union employees who work at a participating business unit regardless of hire date. These employees generally are eligible to participate in theunit. The Pension Plan upon attaining 21 yearswas frozen as of age and completing one year of eligibility service. U.S.January 1, 2019 for salaried employees and hourly employees (receiving salaried benefits) hired after June 30, 2004, are not eligible for the Pension Plan, but receive a company contribution to their individual savings plan accounts; however, salaried employees hired by Temple Inland prior to March 1, 2007 or Weyerhaeuser Company's Cellulose Fibers division prior to December 1, 2011 also participate in the Pension Plan.participants.
The Pension Plan provides defined pension benefits based on years of credited service and either final average earnings (salaried employees and hourly employees receiving salaried benefits), hourly job rates or specified benefit rates (hourly and union employees).
The Company will freeze participation, including credited service and compensation, for salaried employees under the Pension Plan, the Pension Restoration Plan and the two SERP plans for all service on or after January 1, 2019. This change will not affect benefits accrued through December 31, 2018.
Net periodic pension expense (income) for our qualified and nonqualified U.S. defined benefit plans comprised the following:
| | | | Three Months Ended
September 30, | | Nine Months Ended
September 30, | | Three Months Ended
June 30, | | Six Months Ended
June 30, |
| In millions | 2017 | | 2016 | | 2017 | | 2016 | In millions | 2023 | | 2022 | | 2023 | | 2022 |
| Service cost | $ | 39 |
| | $ | 41 |
| | $ | 118 |
| | $ | 114 |
| Service cost | $ | 12 | | | $ | 20 | | | $ | 24 | | | $ | 43 | |
| Interest cost | 138 |
| | 135 |
| | 415 |
| | 449 |
| Interest cost | 114 | | | 85 | | | 230 | | | 169 | |
| Expected return on plan assets | (192 | ) | | (199 | ) | | (577 | ) | | (611 | ) | Expected return on plan assets | (133) | | | (163) | | | (265) | | | (325) | |
| Actuarial loss | 87 |
| | 103 |
| | 260 |
| | 293 |
| Actuarial loss | 22 | | | 23 | | | 46 | | | 44 | |
| Amortization of prior service cost | 7 |
| | 11 |
| | 21 |
| | 31 |
| Amortization of prior service cost | 6 | | | 5 | | | 12 | | | 11 | |
| Settlement | — |
| | 3 |
| | — |
| | 442 |
| |
| Net periodic pension expense | $ | 79 |
| | $ | 94 |
| | $ | 237 |
| | $ | 718 |
| |
| Net periodic pension expense (income) | | Net periodic pension expense (income) | $ | 21 | | | $ | (30) | | | $ | 47 | | | $ | (58) | |
InThe components of net periodic pension expense (income) other than the first quarter of 2016, International Paper offered a voluntary, limited-time opportunity for former employees who were participantsService cost component are included in Non-operating pension expense (income) in the Retirement Plancondensed consolidated statement of International Paper Company (the Pension Plan) to request early payment of their entire Pension Plan benefit in the form of a single lump sum payment. The amount of total payments under this program was approximately $1.2 billion, and were made from Plan trust assets on June 30, 2016. Based on the level of payments made, settlement accounting rules applied and resulted in a plan remeasurement as of the June 30, 2016 payment date. The discount rate used in the plan remeasurement was 3.80%, down from 4.40% at December 31, 2015. As a result of settlement accounting, the Company recognized a pro-rata portion of the unamortized net actuarial loss, after remeasurement, resulting in a $439 million non-cash charge to the Company's earnings in the second quarter of 2016. Additional payments of $8 million were made during the third quarter of 2016 due to mandatory cash payouts and a small lump sum payout project, and the pension plan was subsequently remeasured at September 30, 2016 using a discount rate of 3.60%, down from 3.80% at June 30, 2016. As a result of settlement accounting, the Company recognized a pro-rata portion of the unamortized net actuarial loss, after remeasurement, resulting in a $3 million non-cash charge to the Company's earnings in the third quarter of 2016.operations.
The Company’s funding policy for our pension plans is to contribute amounts sufficient to meet legal funding requirements, plus any additional amounts that the Company may determine to be appropriate considering the funded status of the plan, tax deductibility, the cash flows generated by the Company, and other factors. The Company made no voluntary cash contributions of $1.25 billion and $750 million to the qualified pension plan in the first ninesix months of 2017 and 2016, respectively.2023 or 2022. The nonqualified defined benefit plans are funded to the extent of benefit payments, which totaled $34$10 million for the ninesix months ended SeptemberJune 30, 2017.2023.
On September 26, 2017, the Company entered into an agreement with The Prudential Insurance Company of America to purchase a group annuity contract and transfer approximately $1.3 billion of International Paper's U.S. qualified pension plan projected benefit obligations, subject to customary closing conditions. The transaction closed on October 3, 2017 and was funded with pension plan assets. Under the transaction, at the end of 2017, Prudential will assume responsibility for pension benefits and annuity administration for approximately 45,000 retirees or their beneficiaries receiving less than $450 in monthly benefit payments from the plan. The Company expects to recognize a non-cash pension settlement charge of approximately $400 million before tax in the fourth quarter of 2017.
NOTE 17 - STOCK-BASED COMPENSATION
International PaperThe Company has an Incentive Compensation Plan (ICP)("ICP") which is administered by the Management Development and Compensation Committee of the Board of Directors (the Committee). The ICP authorizes the grants of restricted stock, restricted or deferred stock units, performance awards payable in cash or stock upon the attainment of specified performance goals, dividend equivalents, stock options, stock appreciation rights, other stock-based awards and cash-based awards at the discretion of the Committee. As of SeptemberJune 30, 2017, 13.12023, 5.5 million shares were available for grant under the ICP.
Stock-based compensation expense and related income tax benefits were as follows:
| | | | Three Months Ended
September 30, | | Nine Months Ended
September 30, | | Three Months Ended
June 30, | | Six Months Ended
June 30, |
| In millions | 2017 | | 2016 | | 2017 | | 2016 | In millions | 2023 | | 2022 | | 2023 | | 2022 |
| Total stock-based compensation expense (selling and administrative) | $ | 38 |
| | $ | 33 |
| | $ | 120 |
| | $ | 100 |
| |
| Total stock-based compensation (benefit) expense (selling and administrative) | | Total stock-based compensation (benefit) expense (selling and administrative) | $ | (8) | | | $ | 6 | | | $ | 26 | | | $ | 72 | |
| Income tax benefits related to stock-based compensation | (2 | ) | | — |
| | 45 |
| | 33 |
| Income tax benefits related to stock-based compensation | — | | | 1 | | | 11 | | | 13 | |
The company recognized $8 million of stock-based compensation benefit in the three months ended June 30, 2023 as a result of revised estimates regarding the achievement of certain performance metrics.
At SeptemberJune 30, 2017, $1102023, $103 million, net of estimated forfeitures, of compensation cost related to unvested restricted performancetime-based and performance-based shares, executive continuity awards and restricted stock attributable to future service had not yet been recognized. This amount will be recognized in expense over a weighted-average period of 1.81.2 years.
Performance ShareLong-Term Incentive Plan
During the first ninesix months of 2017,2023, the Company granted 2.21.6 million performance units at an average grant date fair value of $51.78.$37.83 and 1.3 million time-based units at an average grant date fair value of $34.63.
International Paper’s business segments, Industrial Packaging and Global Cellulose Fibers, Printing Papers, and Consumer Packaging, are consistent with the internal structure used to manage these businesses. AllBoth segments are differentiated on a common product, common customer basis consistent with the business segmentation generally used in the Forest Products industry. Subsequent to the acquisition of the Weyerhaeuser pulp business in December 2016, the Company began reporting the Global Cellulose Fibers business as a separate business segment due to the increased materiality of the results of this business. This segment includes the Company's legacy pulp business and the newly acquired pulp business. As such, amounts related to the legacy pulp business have been reclassified out of the Printing Papers business segment and into the new Global Cellulose Fibers business segment for all prior periods.
Business segment operating profits (losses) are used by International Paper's management to measure the earnings performance of its businesses. Management believes that this measure allows a better understanding of trends in costs, operating efficiencies, prices and volumes. Business segment operating profits (losses) are defined as earnings (loss) from continuing operations before income taxes and equity earnings, but including the impact of noncontrolling interests,less than wholly owned subsidiaries, and excluding interest expense, net, corporate expenses, net, corporate net special items, business net special items and corporate special items.non-operating pension expense.
The Company also has a 50% equity interest in Ilim Holding S.A. (Ilim) operating in Russia, that is a separate business segment. The Company recorded equity earnings (losses), net of taxes, of $48 million and $46 million for the three months
ended September 30, 2017 and 2016, respectively, and $119 million and $154 million for the nine months ended September 30, 2017 and 2016, respectively, for Ilim. The Company received cash dividends from the joint venture of $129 million during the first nine months of 2017. At September 30, 2017 and December 31, 2016, the Company's investment in Ilim was $279 million and $302 million, respectively, which was $158 million and $164 million, respectively, more than the Company's proportionate share of the joint venture's underlying net assets. The differences primarily relate to purchase price fair value adjustments and currency translation adjustments. The Company is party to a joint marketing agreement with Ilim, under which the Company purchases, markets and sells paper produced by Ilim. Purchases under this agreement were $52 million and $40 million for the three months ended September 30, 2017 and 2016, respectively, and $151 million and $124 million for the nine months ended September 30, 2017 and 2016, respectively.
SalesNet sales by business segment for the three months and ninesix months ended SeptemberJune 30, 20172023 and 20162022 were as follows:
| | | | | | | | | | | | | | | | | | | | | | | |
| | Three Months Ended
June 30, | | Six Months Ended
June 30, |
| In millions | 2023 | | 2022 | | 2023 | | 2022 |
| Industrial Packaging | $ | 3,884 | | | $ | 4,491 | | | $ | 7,967 | | | $ | 8,897 | |
| Global Cellulose Fibers | 698 | | | 788 | | | 1,509 | | | 1,498 | |
| Corporate and Intersegment Sales | 100 | | | 110 | | | 226 | | | 231 | |
| Net Sales | $ | 4,682 | | | $ | 5,389 | | | $ | 9,702 | | | $ | 10,626 | |
|
| | | | | | | | | | | | | | | | |
| | Three Months Ended
September 30, | | Nine Months Ended
September 30, | |
| In millions | 2017 | | 2016 | | 2017 | | 2016 | |
| Industrial Packaging | $ | 3,734 |
| | $ | 3,491 |
| | $ | 10,939 |
| | $ | 10,422 |
| |
| Global Cellulose Fibers | 654 |
| | 242 |
| | 1,830 |
| | 713 |
| |
| Printing Papers | 1,039 |
| | 1,019 |
| | 3,051 |
| | 3,003 |
| |
| Consumer Packaging | 491 |
| | 494 |
| | 1,431 |
| | 1,490 |
| |
| Corporate and Intersegment Sales | (5 | ) | | 20 |
| | (55 | ) | | 70 |
| |
| Net Sales | $ | 5,913 |
| | $ | 5,266 |
| | $ | 17,196 |
| | $ | 15,698 |
| |
Operating profit (loss) by business segment for the three months and ninesix months ended SeptemberJune 30, 20172023 and 20162022 were as follows:
| | | | | | | | | | | | | | | | | | | | | | | |
| | Three Months Ended
June 30, | | Six Months Ended
June 30, |
| In millions | 2023 | | 2022 | | 2023 | | 2022 |
| Industrial Packaging | $ | 304 | | | $ | 560 | | | $ | 626 | | | $ | 957 | |
| Global Cellulose Fibers | 30 | | | 25 | | | 14 | | | (24) | |
| Business Segment Operating Profit (Loss) | $ | 334 | | | 585 | | $ | 640 | | | 933 |
| | | | | | | |
| Earnings (loss) from continuing operations before income taxes and equity earnings | $ | 255 | | | $ | 514 | | | $ | 476 | | | $ | 876 | |
| Interest expense, net | 59 | | | 74 | | | 121 | | | 143 | |
| Adjustment for less than wholly owned subsidiaries | — | | | (1) | | | — | | | (1) | |
| Corporate expenses, net | 8 | | | 27 | | | 16 | | | 39 | |
| Corporate net special items | — | | | 18 | | | — | | | (28) | |
| | | | | | | |
| Non-operating pension expense (income) | 12 | | | (47) | | | 27 | | | (96) | |
| Business Segment Operating Profit (Loss) | $ | 334 | | | $ | 585 | | | $ | 640 | | | $ | 933 | |
|
| | | | | | | | | | | | | | | | |
| | Three Months Ended
September 30, | | Nine Months Ended
September 30, | |
| In millions | 2017 | | 2016 | | 2017 | | 2016 | |
| Industrial Packaging | $ | 469 |
| (a) | $ | 423 |
| (f) | $ | 884 |
| (a) | $ | 1,277 |
| (f) |
| Global Cellulose Fibers | 49 |
| (b) | (38 | ) | (g) | (14 | ) | (b) | (109 | ) | (g) |
| Printing Papers | 135 |
|
| 167 |
|
| 321 |
| (c) | 419 |
| |
| Consumer Packaging | 54 |
|
| 61 |
|
| 73 |
| (d) | 150 |
| (h) |
| Business Segment Operating Profits | 707 |
| | 613 |
| | 1,264 |
| | 1,737 |
| |
| | | | | | | | | |
| Earnings (loss) from continuing operations before income taxes and equity earnings | 503 |
| | 373 |
| | 718 |
| | 676 |
| |
| Interest expense, net | 152 |
|
| 132 |
| | 431 |
| (e) | 384 |
| |
| Noncontrolling interests/equity earnings adjustment (j) | — |
| | 1 |
| | (1 | ) | | 1 |
| |
| Corporate items, net | 19 |
| | 11 |
| | 34 |
| | 57 |
| |
| Special items, net | — |
| | 54 |
| | (16 | ) | | 46 |
| |
| Non-operating pension expense | 33 |
| | 42 |
|
| 98 |
| | 573 |
| (i) |
| $ | 707 |
| | $ | 613 |
| | $ | 1,264 |
| | $ | 1,737 |
| |
| |
(a) | Includes a charge of $354 million for the nine months ended September 30, 2017 related to the agreement to settle the Kleen Products anti-trust class action lawsuit, a charge of $10 million for the three months and nine months ended September 30, 2017 for the accelerated amortization of an intangible asset in Brazil, a gain of $6 million for the nine months ended September 30, 2017 for a net bargain purchase gain associated with the June 2016 acquisition of Holmen Paper's newsprint mill in Madrid, Spain, and charges of $5 million and $9 million for the three months and nine months ended September 30, 2017, respectively, for other items. |
| |
(b) | Includes charges of $6 million and $15 million for the three months and nine months ended September 30, 2017, respectively, for costs associated with the acquisition of the pulp business acquired in December 2016, a charge of $14 million for the nine months ended September 30, 2017 for the amortization of the inventory fair value step-up for that business and charges of $2 million and $3 million for the three months and nine months ended September 30, 2017, respectively, for other items. |
| |
(c) | Includes a charge of $2 million for the nine months ended September 30, 2017 for other items. |
| |
(d) | Includes a charge of $9 million for the nine months ended September 30, 2017 for the impairment of the assets of our Foodservice business in Asia. |
| |
(e) | Includes a gain of $4 million for the nine months ended September 30, 2017 for interest income associated with an income tax refund claim. |
| |
(f) | Includes charges of $5 million and $70 million for the three months and nine months ended September 30, 2016, respectively, for the impairment of the assets of our corrugated packaging business in Asia and costs associated with the sale of that business.
|
| |
(g) | Includes charges of $7 million and $12 million for the three months and nine months ended September 30, 2016, respectively, for costs associated with the agreement to purchase the Weyerhaeuser pulp business.
|
| |
(h) | Includes a charge of $9 million for the nine months ended September 30, 2016 for costs associated with the Riegelwood conversion to 100% pulp production.
|
| |
(i) | Includes a charge of $439 million for the nine months ended September 30, 2016 for a settlement accounting charge associated with term-vested lump sum payments.
|
| |
(j) | Operating profits for business segments include each segment's percentage share of the profits of subsidiaries included in that segment that are less than wholly owned. The pre-tax noncontrolling interest and equity earnings for these subsidiaries are adjusted here to present consolidated earnings before income taxes and equity earnings. |
NOTE 19 - SUBSEQUENT EVENTThe following discussion and analysis of our financial condition and results of operations should be read in conjunction with our condensed consolidated financial statements and related notes included in "Financial Statements and Supplementary Data" of this Quarterly Report on Form 10-Q (this "Form 10-Q") and the Company's Annual Report on Form 10-K for the year ended December 31, 2022 (our "Annual Report"). In addition to historical consolidated financial information, the following discussion contains forward-looking statements that reflect our plans, estimates, and beliefs that involve significant risks and uncertainties. Our actual results could differ materially from those discussed in the forward-looking statements. Factors that could cause or contribute to those differences include those discussed below and in our Annual Report, particularly under "Risk Factors" and "Forward-Looking Statements" of this Form 10-Q and our Annual Report.
On October 23, 2017, the Company entered into an agreement to contribute its North American Consumer Packaging business, which includes its North American Coated Paperboard and Foodservice businesses, to a subsidiary of Graphic Packaging Holding Company, in a transaction valued at $1.8 billion. International Paper will receive a 20.5% ownership interest, valued at $1.14 billion, in a subsidiary of Graphic Packaging Holding Company that will hold the assets of the combined business. International Paper plans to use $660 million in cash proceeds from a new loan expected to be entered into prior to closing to pay down existing debt. The new loan will be assumed by a subsidiary of Graphic Packaging Holding Company on the transaction closing date. The transaction is expected to close in early 2018, subject to the receipt of regulatory approval and certain other closing conditions.
| |
ITEM 2. | MANAGEMENT’S DISCUSSION AND ANALYSIS OF FINANCIAL CONDITION AND RESULTS OF OPERATIONS |
EXECUTIVE SUMMARY
Net earnings (loss) attributable to International Paper common shareholders were $395$235 million ($0.95 per diluted share) in the third quarter of 2017, compared with $80 million ($0.190.68 per diluted share) in the second quarter of 2017 and $3122023, compared with $172 million ($0.750.49 per diluted share) in the thirdfirst quarter of 2016. Adjusted Operating Earnings is a non-GAAP measure2023 and is defined as net earnings from continuing operations (a GAAP measure) excluding special items and non-operating pension expense. International Paper generated Adjusted Operating Earnings Attributable to International Paper Common Shareholders of $449$511 million ($1.081.38 per diluted share) in the thirdsecond quarter of 2017, compared with $2702022. The Company generated Adjusted operating earnings (a non-GAAP measure defined below) of $204 million ($0.650.59 per diluted share) in the 2017 second quarter and $380of 2023, compared with $185 million ($0.910.53 per diluted share) in the 2016 third quarter.first quarter of 2023 and $364 million ($0.99 per diluted share) in the second quarter of 2022.
International Paper delivered strong resultsPaper’s second quarter 2023 earnings reflect solid performance in the 2017 third quarter, with sequential earnings growth across all our business segments. This earnings growth was driven by continued solid global demand and price realization, particularly in our North American Industrial Packaging and Global Cellulose Fibers businesses.face of a challenging macroeconomic environment. During the quarter, results were negatively impacted by operational headwinds related to Hurricanes Harvey and Irma along with record high OCC prices. The Global Cellulose Fibers continued to generate strong results during the quarter, delivering more synergies at a faster pace than expected. Finally, in October 2017, we signed an agreement to transfer our North American Consumer Packaging business, which includes the North American Coated Paperboard mills and Foodservice operations, to a subsidiary of Graphic Packaging Holding Company in a transaction valued at $1.8 billion.
Prices were up across the Company’s portfolio, driving significant earnings improvement in the 2017 third quarter versus the 2017 second quarter, particularly in our North American Industrial Packaging and Global Cellulose Fibers businesses. The North American Industrial Packaging business continues towe delivered $55 million of year-over-year incremental earnings benefit from higher pricing and flow-through in export containerboard exports. Volume was lower onour Building a sequential quarter basis primarily due to one less shipping day in our North American corrugated box business. Operations were negatively impacted by approximately $30Better IP initiatives, bringing total benefits of $120 million of costs tied to mill and box plant disruptions caused by Hurricanes Harvey and Irma. As expected, maintenance outage expenses were significantly lower in the 2017 third quarter versus the 2017 second quarter. Input costs continued to be a significant headwind due to elevated OCC costs which continued to rise above 2017 second quarter levels, reaching a new historical high. In the 2017 third quarter, our Ilim joint venture again delivered strong results driven by improved pricing, partially offset by lower volume. Equity earnings also benefited from a non-cash foreign exchange gain on the joint venture's U.S. dollar denominated net debt.
Looking ahead, the Company is well positioned for strong fourth quarter results and cash generation. In our North American Industrial Packaging business, we expect to see flow-through benefits from containerboard and box price increases from the first half of 2017, along2023. Additionally, our mill system continued to perform well in the current environment as we optimized our system while taking care of our customers. Underlying demand for our products improved throughout the second quarter 2023, but remained constrained by inventory destocking as our customers and the broader supply chain worked through elevated inventories of their products. Based on discussions with further realizationour customers and trends observed across the various end-use segments for packaging and pulp products, we believe consumer priorities in the second quarter remained focused on services as well as non-discretionary goods. This trend has been influenced by the pull forward of priorgoods during the pandemic, as well as inflationary pressures and rising interest rates. Margins remained under pressure due to the resulting weak volumes and lower prices across our portfolio; however, this was mitigated by lower input costs. Regarding capital allocation in the second quarter 2023, we returned $200 million to shareowners including $160 million of dividends and $40 million of share repurchases. Finally, with respect to the sale of our interest in the Ilim joint venture, we previously reported the approval from a Russian commission overseeing exits by foreign companies but we are still awaiting approval from the Russian competition authority. The buyers continue to pursue this approval and we expect to close as soon as all regulatory approvals are secured.
Comparing our performance in the second quarter 2023 to the first quarter 2023, price increases in exports. We anticipate additional price realization in our Global Cellulose Fibers business tied to continued strong global demand, particularly in China. Demandand mix was lower in our North American Industrial Packaging business will be unfavorably impacted by one less shipping day; however, we anticipate stable volumes across all of our other businesses with some seasonal improvementdue to prior index movements and lower export prices. Price in our EMEA Printing Papers and Global Cellulose Fibers businesses. Manufacturing performance should improvebusiness was lower as we move past the effectsa result of the previously mentioned hurricanesprior index movements and other one-off operational issues experienced at some of our mills during the 2017 third quarter. Input costsunfavorable mix driven by lower absorbent pulp shipments. Volume in our North American Industrial Packaging business should benefit from declining OCCwas sequentially higher despite one less shipping day, as demand improved throughout the quarter. However, overall demand for packaging continued to be impacted by ongoing inventory destocking across the supply chain. Fluff pulp volumes in our Global Cellulose Fibers business were lower due to weaker demand in absorbent products including the impact of continued customer inventory destocking. Operations and costs were higher in our North American Industrial Packaging business, primarily due to higher economic downtime in the second quarter 2023. Operations and costs were lower in our Global Cellulose Fibers business driven by lower distribution costs and seasonal mill efficiencies. Maintenance outages were sequentially lower in the second quarter 2023 as the first quarter 2023 represented the highest planned maintenance outage quarter of 2023 and as a result of deferring some outages into the second half of the year. Input costs were significantly lower in both business segments, primarily driven by lower energy, wood and distribution costs.
Looking ahead to the third quarter 2023, as compared to the second quarter 2023, in our Industrial Packaging business, we expect price and mix to be lower primarily due to prior index movements along with lower prices partlyin the export market. Volume is expected to be higher in North America, partially offset by one less shipping day. Operations and costs are expected to improve due to lower unabsorbed fixed costs from increased production volume. Maintenance outage expense is expected to decrease relative to the second quarter 2023 as we have now completed approximately 70% of planned maintenance outages. Input costs are expected to be higher wooddriven by increased average energy costs. In our Global Cellulose Fibers business, we expect price and mix to decrease earnings on prior index movements. Volume is expected to be higher as demand recovers on lower inventory destocking. Operations and costs are expected to be favorable due to lower employee benefit costs in the third
quarter 2023. Maintenance outage expense is expected to be lower along with lower input costs, primarily due to lower fiber and chemical costs. We expect higher input costs in our other businesses, partly due to the lingering effects of the hurricanes, particularly in the case of wood and chemicals. Finally, for our Ilim joint venture, we expect improved operational results in the 2017 fourth quarter on strong, demand-driven market fundamentals.
Adjusted Operating Earnings and Adjusted Operating Earnings Per Share are non-GAAP measures. Dilutedmeasures and are defined as net earnings (loss) (a GAAP measure) excluding discontinued operations, net special items and non-operating pension expense (income). Net earnings (loss) and Diluted earnings (loss) per share attributable to common shareholders are the most directdirectly comparable GAAP measures. The Company calculates Adjusted Operating Earnings by excluding the after-tax effect of discontinued operations, non-operating pension expense (income) and items considered by management to be unusual (net special items) from thenet earnings (loss) reported under GAAP, non-operating pension expense (includes all U.S. pension costs, excluding service costs and prior service costs), and discontinued operations.GAAP. Adjusted Operating Earnings Per Share is calculated by dividing Adjusted Operating Earnings by diluted average shares of common stock outstanding. Management uses this measure to focus on on-going operations, and believes that it is useful to investors because it enables them to perform meaningful comparisons of past and present consolidated operating results.results from continuing operations. The Company believes that using this information, along with the most direct comparable GAAP measure, provides for a more complete analysis of the results of operations.
The following are reconciliations of DilutedNet earnings (loss) attributable to common shareholders to Adjusted Operating Earnings attributableoperating earnings (loss) on a total and per share basis. Additional detail is provided later in this Form 10-Q regarding the net special items expense (income) referenced in the charts below.
| | | | | | | | | | | | | | | | | |
| | Three Months Ended
June 30, | | Three Months Ended March 31, |
| In millions | 2023 | | 2022 | | 2023 |
| Net earnings (loss) | $ | 235 | | | $ | 511 | | | $ | 172 | |
| Less - Discontinued operations (gain) loss | (13) | | | (95) | | | — | |
| Earnings (loss) from continuing operations | 222 | | | 416 | | | 172 | |
| Add back - Non-operating pension expense (income) | 12 | | | (47) | | | 15 | |
| Add back - Net special items expense (income) | (6) | | | 18 | | | 3 | |
| Income taxes - Non-operating pension and special items | (24) | | | (23) | | | (5) | |
| Adjusted operating earnings (loss) | $ | 204 | | | $ | 364 | | | $ | 185 | |
| | | | | | | | | | | | | | | | | |
| | Three Months Ended
June 30, | | Three Months Ended March 31, |
| 2023 | | 2022 | | 2023 |
| Diluted earnings (loss) per share | $ | 0.68 | | | $ | 1.38 | | | $ | 0.49 | |
| Less - Discontinued operations (gain) loss per share | (0.04) | | | (0.25) | | | — | |
| Diluted earnings (loss) per share from continuing operations | 0.64 | | | 1.13 | | | 0.49 | |
| Add back - Non-operating pension expense (income) per share | 0.03 | | | (0.13) | | | 0.04 | |
| Add back - Net special items expense (income) per share | (0.02) | | | 0.05 | | | 0.01 | |
| Income taxes per share - Non-operating pension and special items | (0.06) | | | (0.06) | | | (0.01) | |
| Adjusted operating earnings (loss) per share | $ | 0.59 | | | $ | 0.99 | | | $ | 0.53 | |
Cash provided by operations, including discontinued operations, totaled $873 million and $978 million for the first six months of 2023 and 2022, respectively. The Company generated free cash flow of approximately $265 million and $607 million in the first six months of 2023 and 2022, respectively. Free cash flow is a non-GAAP measure and the most directly comparable GAAP measure is cash provided by operations. Management utilizes this measure in connection with managing our business and believes that free cash flow is useful to common shareholders.investors as a liquidity measure because it measures the amount of cash generated that is available, after reinvesting in the business, to maintain a strong balance sheet, pay dividends, repurchase stock, service debt and make investments for future growth. It should not be inferred that the entire free cash flow amount is available for discretionary expenditures. By adjusting for certain items that are not indicative of the Company's ongoing performance, we believe that free cash flow also enables investors to perform meaningful comparisons between past and present periods.
|
| | | | | | | | | | | |
| | Three Months Ended
September 30, | | Three Months Ended June 30, |
| | 2017 | | 2016 | | 2017 |
| Diluted Earnings (Loss) Attributable to Shareholders | $ | 395 |
| | $ | 312 |
| | $ | 80 |
|
| Add back - Discontinued operations (gain) loss | — |
| | — |
| | — |
|
| Diluted Earnings (Loss) from Continuing Operations | 395 |
| | 312 |
| | 80 |
|
| Add Back - Non-operating pension (income) expense | 33 |
| | 43 |
| | 34 |
|
| Add Back - Net special items expense (income) | 23 |
| | 65 |
| | 353 |
|
| Income tax effect - Non-operating pension and special items expense | (2 | ) | | (40 | ) | | (197 | ) |
| Adjusted Operating Earnings (Loss) Attributable to Shareholders | $ | 449 |
| | $ | 380 |
| | $ | 270 |
|
| | | | | | | | | | | |
| | Six Months Ended
June 30, |
| In millions | 2023 | | 2022 |
| Cash provided by operations | $ | 873 | | | $ | 978 | |
| Adjustments: | | | |
| Cash invested in capital projects, net of insurance recoveries | (608) | | | (371) | |
| Free Cash Flow | $ | 265 | | | $ | 607 | |
The non-GAAP financial measures presented in this Form 10-Q as referenced above have limitations as analytical tools and should not be considered in isolation or as a substitute for an analysis of our results calculated in accordance with GAAP. In addition, because not all companies utilize identical calculations, the Company's presentation of non-GAAP measures in this Form 10-Q may not be comparable to similarly titled measures disclosed by other companies, including companies in the same industry as the Company.
|
| | | | | | | | | | | |
| | Three Months Ended
September 30, | | Three Months Ended June 30, |
| | 2017 | | 2016 | | 2017 |
| Diluted Earnings (Loss) Per Share Attributable to Shareholders | $ | 0.95 |
| | $ | 0.75 |
| | $ | 0.19 |
|
| Add Back - Discontinued operations (gain) loss per share | — |
| | — |
| | — |
|
| Diluted Earnings (Loss) Per Share from Continuing Operations | 0.95 |
| | 0.75 |
| | 0.19 |
|
| Add Back - Non-operating pension (income) expense per share | 0.08 |
| | 0.10 |
| | 0.08 |
|
| Add Back - Net special items expense (income) per share | 0.05 |
| | 0.16 |
| | 0.85 |
|
| Income tax effect per share - Non-operating pension and special items expense | — |
| | (0.10 | ) | | (0.47 | ) |
| Adjusted Operating Earnings (Loss) Per Share Attributable to Shareholders | $ | 1.08 |
| | $ | 0.91 |
| | $ | 0.65 |
|
RESULTS OF OPERATIONS
For the thirdsecond quarter of 2017,2023, International Paper Company reported net sales of $5.9$4.7 billion, compared with $5.8$5.0 billion in the first quarter of 2023 and $5.4 billion in the second quarter of 2017 and $5.3 billion in the third quarter of 2016.2022.
Net earnings attributable to International Paper(loss) totaled $395$235 million, or $0.95$0.68 per share, in the 2017 third quarter. This compared with $80 million, or $0.19 perdiluted share, in the second quarter of 2017 and $3122023. This compared with $172 million, or $0.75$0.49 per diluted share, in the thirdfirst quarter of 2016.
Earnings from continuing operations attributable to International Paper Company were $3952023 and $511 million, in the third quarter of 2017 compared with $312 million in the third quarter of 2016 and $80 millionor $1.38 per diluted share, in the second quarter of 2017. 2022.
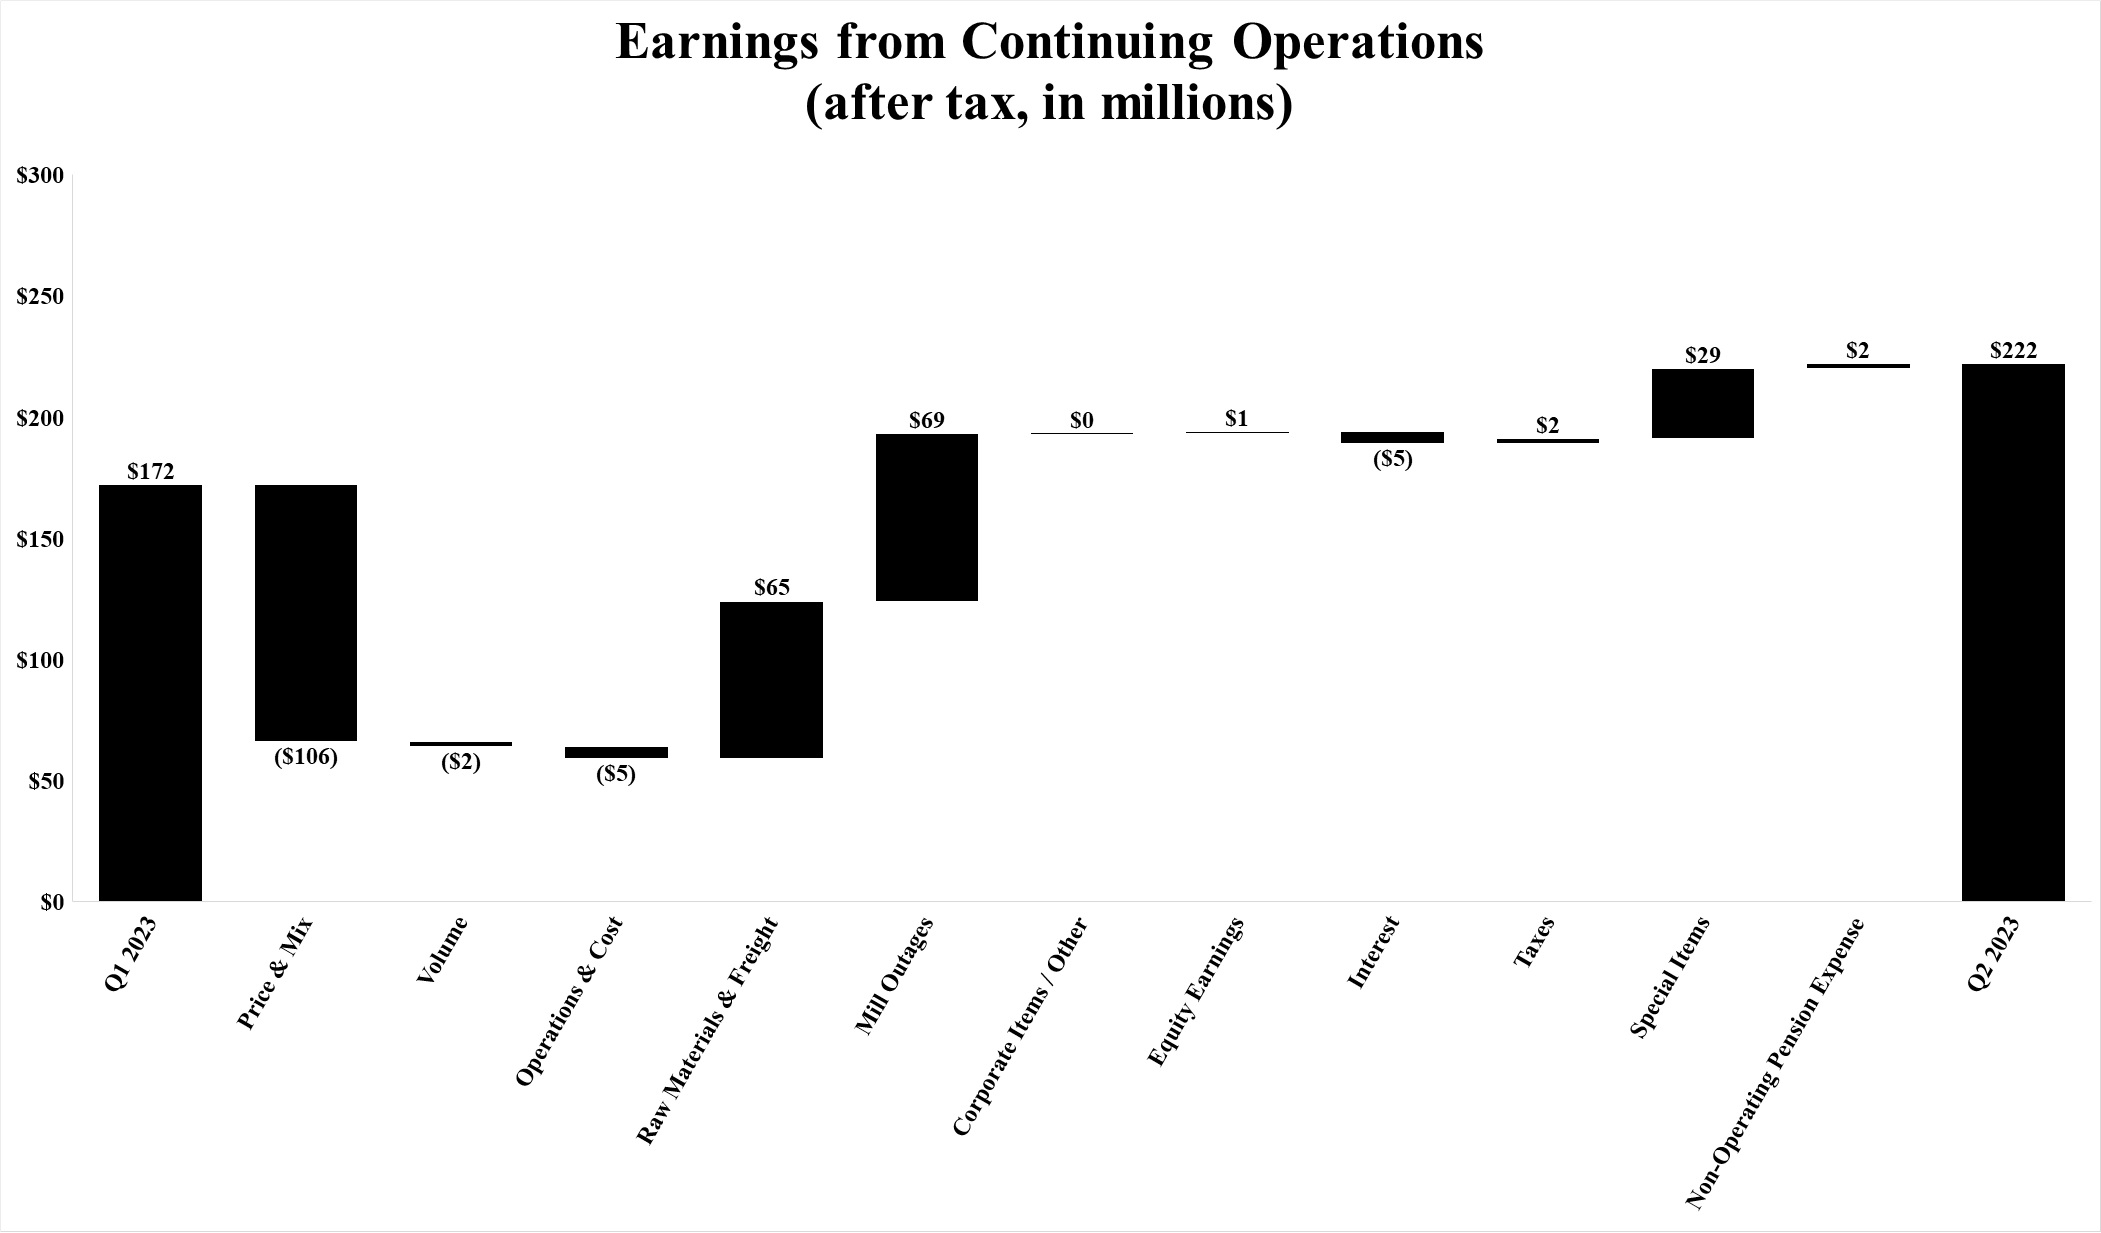
Compared with the thirdfirst quarter of 2016, the 2017 third quarter reflects higher average sales price realizations net of an unfavorable mix2023, earnings from continuing operations benefited from lower raw material and freight costs ($16465 million), lower mill maintenance outage costs ($21 million), the operating results for the recently acquired pulp business which was not included in the prior year ($3669 million), lower tax expense ($162 million) reflecting a lower estimated tax rate, and lower non-operating pension expense ($62 million). These benefits were offset by lower average sales prices and an unfavorable mix ($106 million), lower sales volumes ($62 million), higher operating costs ($725 million), higher raw material and freight costs ($66 million), higher corporate and other costs ($12 million), and higher net interest expense ($145 million). Equity earnings, net of taxes, relating to International Paper’s investment in Ilim Holding S.A. were $2$1 million higher in the 2017 thirdsecond quarter of 2023 than in the 2016 third quarter.first quarter of 2023. Net special items in the 2017 thirdsecond quarter of 2023 were a lossgain of $34$27 million compared with a losscharge of $42$2 million in the 2016 third quarter.first quarter of 2023.
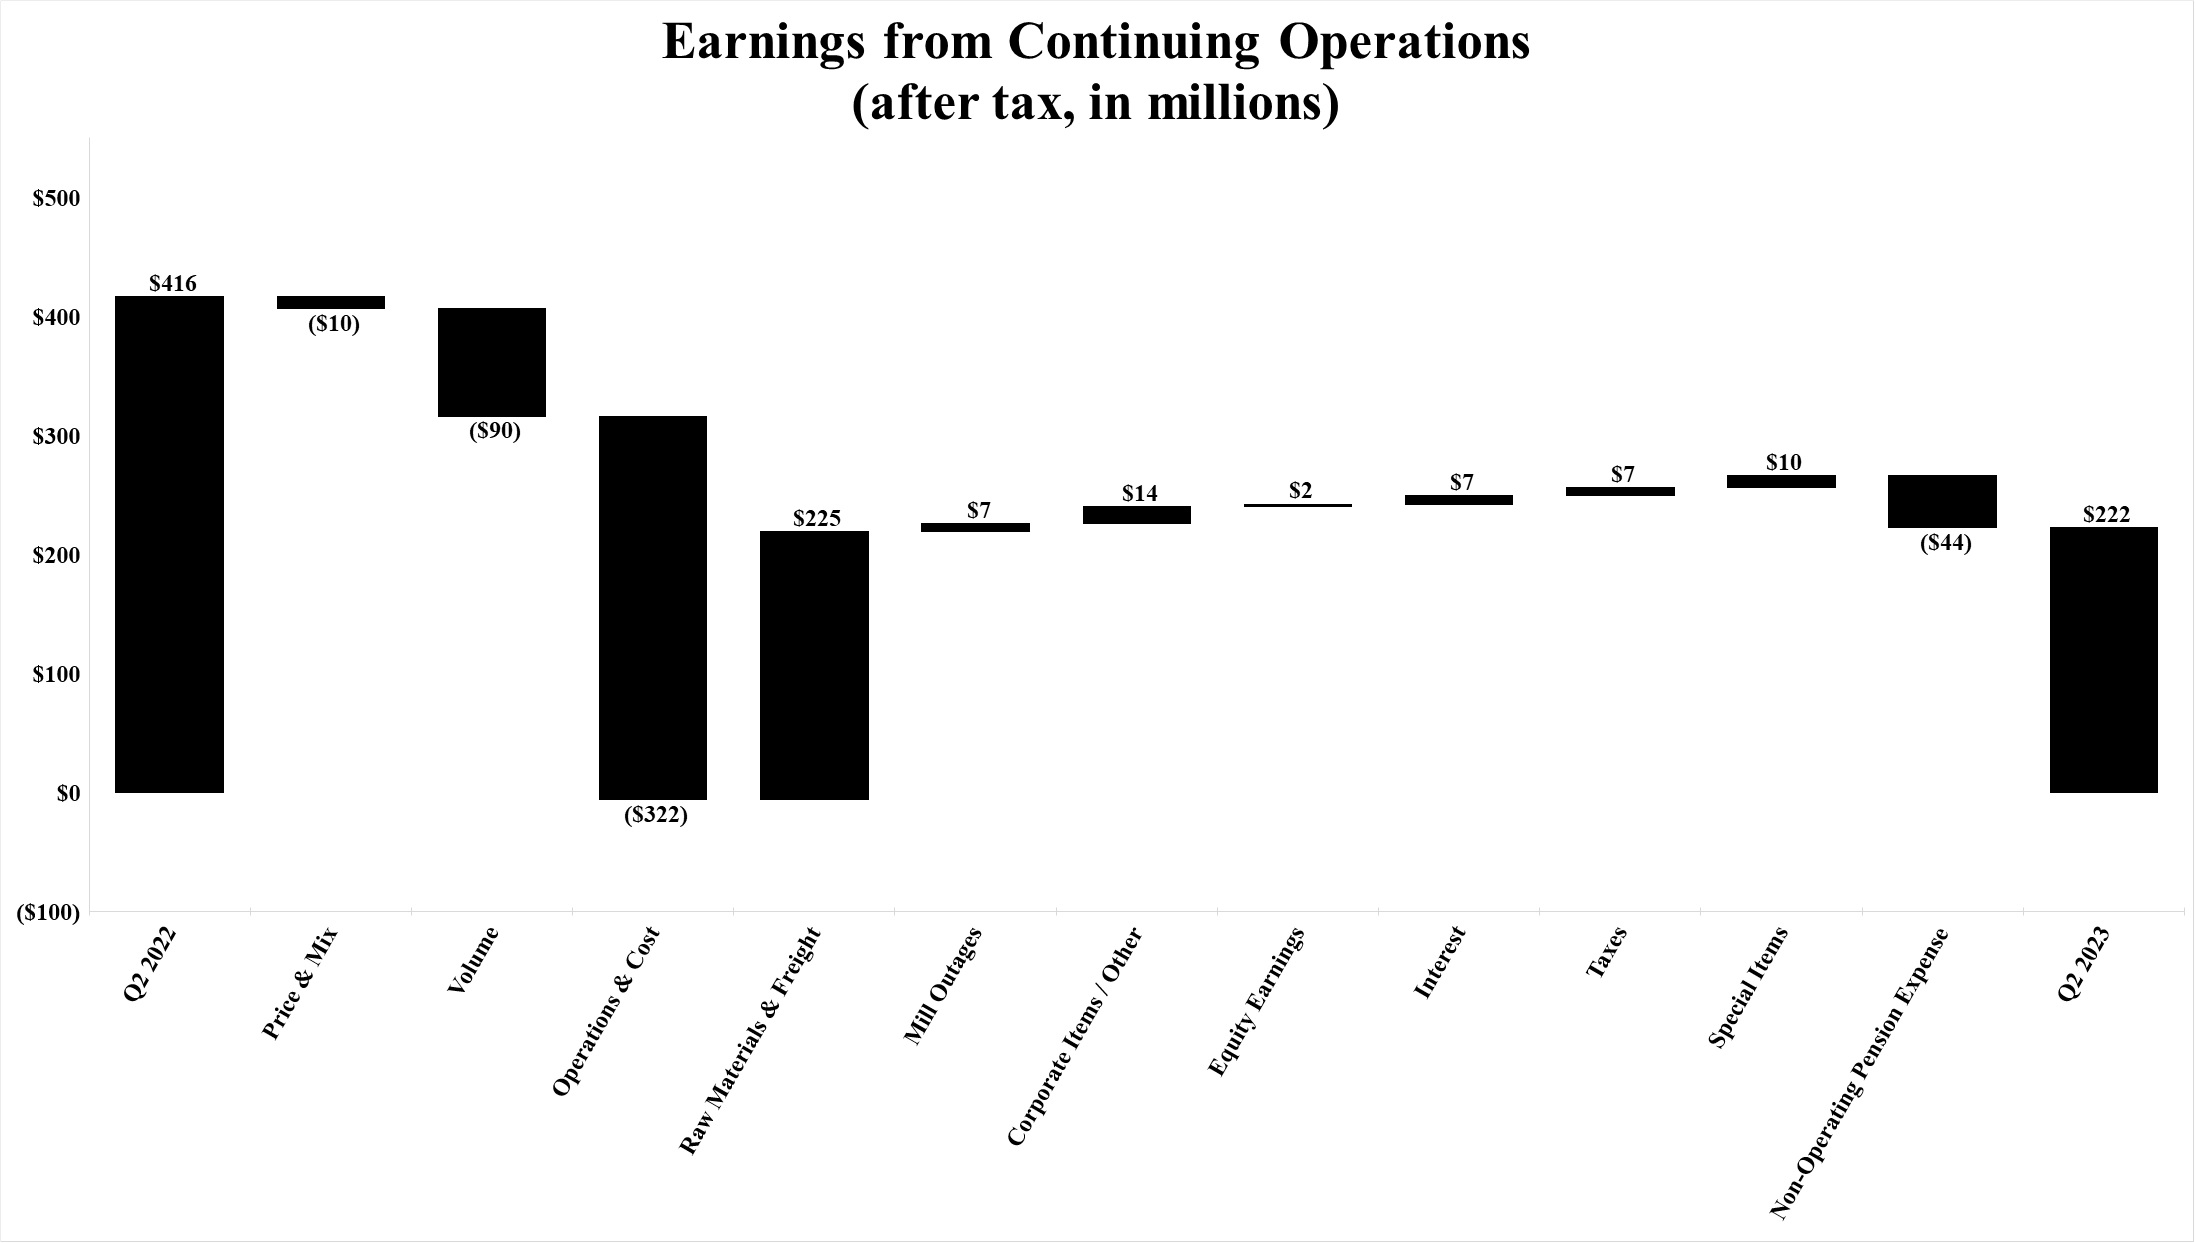
Compared with the second quarter of 2017, earnings2022, the second quarter of 2023 benefited from higher average sales price realizations net of an unfavorable mixlower raw material and freight costs ($76225 million), lower mill maintenance outage costs ($1237 million), lower corporate and other costs ($14 million), lower net interest expense ($7 million) and lower tax expense ($13 million) reflecting a lower estimated tax rate and lower non-operating pension expense ($17 million). These benefits were offset by an unfavorable mix net of higher average sales prices ($10 million), lower sales volumes ($1190 million), higher operating costs ($10 million), higher raw material and freight costs ($16 million), higher corporate and other items ($15322 million) and higher net interestnon-operating pension expense ($844 million). Equity earnings, net of taxes, for Ilim Holding, S.A. were $27$2 million higher in the second quarter of 2023 than in the 2017 second quarter.quarter of 2022. Net special items in the 2017 thirdsecond quarter of 2023 were a lossgain of $34$27 million compared with a lossgain of $169$17 million in the 2017 second quarter.quarter of 2022.
Business Segment Operating Profitssegment operating profits (losses) are used by International Paper's management to measure the earnings performance of its businesses. Management believes that this measure allows a better understanding of trends in costs, operating efficiencies, prices and volumes. Business Segment Operating Profits are defined as earnings (loss) from continuing operations before income taxes and equity earnings, but including the impact of equity earnings and noncontrolling interests, excluding corporate items and corporate special items.
International Paper operates in four segments: Industrial Packaging, Global Cellulose Fibers, Printing Papers and Consumer Packaging.
The following table presents a reconciliation of net earnings attributable to International Paper Company to its Total Business Segment Operating Profit:
|
| | | | | | | | | | | |
| | Three Months Ended |
| | September 30 | | June 30, |
| In millions | 2017 | | 2016 | | 2017 |
| Earnings (Loss) From Continuing Operations Attributable to International Paper Company | $ | 395 |
| | $ | 312 |
| | $ | 80 |
|
| Add back (deduct): | | | | | |
| Income tax provision (benefit) | 153 |
| | 107 |
| | (89 | ) |
| Equity (earnings) loss, net of taxes | (45 | ) | | (43 | ) | | (20 | ) |
| Noncontrolling interests, net of taxes | — |
| | (3 | ) | | — |
|
| Earnings (Loss) From Continuing Operations Before Income Taxes and Equity Earnings | 503 |
| | 373 |
| | (29 | ) |
| Interest expense, net | 152 |
| | 132 |
| | 137 |
|
| Noncontrolling interests / equity earnings included in operations | — |
| | 1 |
| | (1 | ) |
| Corporate items | 19 |
| | 11 |
| | 4 |
|
| Special items (income) expense | — |
| | 54 |
| | (16 | ) |
| Non-operating pension expense | 33 |
| | 42 |
| | 34 |
|
| Adjusted Operating Profit | $ | 707 |
| | $ | 613 |
| | $ | 129 |
|
| Business Segment Operating Profit: | | | | | |
| Industrial Packaging | $ | 469 |
| | $ | 423 |
| | $ | 50 |
|
| Global Cellulose Fibers | 49 |
| | (38 | ) | | 7 |
|
| Printing Papers | 135 |
| | 167 |
| | 86 |
|
| Consumer Packaging | 54 |
| | 61 |
| | (14 | ) |
| Total Business Segment Operating Profit | $ | 707 |
| | $ | 613 |
| | $ | 129 |
|
Business Segment Operating Profit
Total business segment operating profits of $707 million in the 2017 third quarter were higher than the $613 million in the 2016 third quarter and the $129 million in the 2017 second quarter. Compared with the third quarter of 2016, operating profits in the current quarter benefited from higher average sales price realizations net of an unfavorable mix ($236 million), lower mill outage costs ($30 million) and the operating results for the recently acquired pulp business which are not included in the prior year ($52 million). These benefits were offset by lower sales volumes ($9 million), higher operating costs ($104 million), higher raw material and freight costs ($95 million), and higher other costs ($5 million). Special items were a loss of $23 million in the 2017 third quarter compared with a loss of $12 million in the 2016 third quarter.
Compared with the second quarter of 2017, operating profits benefited from higher average sales price realizations net of an unfavorable mix ($109 million) and lower mill outage costs ($176 million). These benefits were offset by lower sales volumes ($15 million), higher operating costs ($14 million), higher raw material and freight costs ($23 million) and higher other items ($5 million). Special items were a loss of $23 million in the 2017 third quarter compared with a loss of $373 million in the 2017 second quarter.
During the 2017 third quarter, International Paper took approximately 93,000 tons of downtime of which none were economic-related, compared with approximately 226,000 tons of downtime, which included about 107,000 tons that were economic-related, in the 2016 third quarter. During the 2017 second quarter, International Paper took approximately 291,000 tons of downtime of which none were economic-related. Economic downtime is taken to balance internal supply with our customer demand, while maintenance downtime is taken periodically during the year.
Sales Volumes by Product (a)
Sales volumes of major products for the three months and nine months ended September 30, 2017 and 2016 were as follows:
|
| | | | | | | | | | | |
| | Three Months Ended
September 30, | | Nine Months Ended
September 30, |
| In thousands of short tons (except as noted) | 2017 | | 2016 | | 2017 | | 2016 |
| Industrial Packaging | | | | | | | |
| North American Corrugated Packaging (c) | 2,599 |
| | 2,640 |
| | 7,784 |
| | 7,801 |
|
| North American Containerboard | 828 |
| | 801 |
| | 2,438 |
| | 2,311 |
|
| North American Recycling | 924 |
| | 977 |
| | 2,799 |
| | 2,873 |
|
| North American Saturated Kraft | 45 |
| | 51 |
| | 132 |
| | 142 |
|
| North American Gypsum/Release Kraft | 54 |
| | 49 |
| | 165 |
| | 142 |
|
| North American Bleached Kraft | 7 |
| | 7 |
| | 20 |
| | 18 |
|
| EMEA Industrial Packaging (c) (d) | 350 |
| | 344 |
| | 1,124 |
| | 1,091 |
|
| Asian Box (c) (e) | — |
| | — |
| | — |
| | 208 |
|
| Brazilian Packaging (c) | 93 |
| | 93 |
| | 266 |
| | 254 |
|
| Industrial Packaging | 4,900 |
| | 4,962 |
| | 14,728 |
| | 14,840 |
|
Cellulose Fibers (in thousands of metric tons) (b) | 933 |
| | 415 |
| | 2,706 |
| | 1,233 |
|
| Printing Papers | | | | | | | |
| North American Uncoated Papers | 497 |
| | 467 |
| | 1,451 |
| | 1,402 |
|
| EMEA and Russian Uncoated Papers | 365 |
| | 358 |
| | 1,104 |
| | 1,120 |
|
| Brazilian Uncoated Papers | 280 |
| | 274 |
| | 832 |
| | 800 |
|
| Indian Uncoated Papers | 58 |
| | 51 |
| | 186 |
| | 175 |
|
| Uncoated Papers | 1,200 |
| | 1,150 |
| | 3,573 |
| | 3,497 |
|
| Consumer Packaging | | | | | | | |
| North American Consumer Packaging | 296 |
| | 301 |
| | 876 |
| | 915 |
|
| EMEA Coated Paperboard | 103 |
| | 105 |
| | 296 |
| | 298 |
|
| Consumer Packaging | 399 |
| | 406 |
| | 1,172 |
| | 1,213 |
|
| |
(a) | Sales volumes include third party and inter-segment sales and exclude sales of equity investees. |
| |
(b) | Includes North American, European and Brazilian volumes and internal sales to mills. Includes sales volumes from the pulp business acquired beginning December 1, 2016. |
| |
(c) | Volumes for corrugated box sales reflect consumed tons sold (CTS). Board sales for these businesses reflect invoiced tons. |
| |
(d) | Excludes newsprint sales volumes at the Madrid, Spain mill. |
| |
(e) | Includes sales volumes through the date of sale on June 30, 2016. |
Income Taxes
An income tax provision of $153 million was recorded for the 2017 third quarter and the reported effective income tax rate for continuing operations was 30.5%. Excluding an expense of $11 million related to the tax effects of special items and a benefit of $13 million related to the tax effects of non-operating pension expense, the effective income tax rate for continuing operations was 28.0% for the quarter.
An income tax benefit of $89 million was recorded for the 2017 second quarter and the reported effective income tax rate for continuing operations was 298%. Excluding a benefit of $184 million related to the tax effects of special items and a benefit of $13 million related to the tax effects of non-operating pension expense, the effective income tax rate for continuing operations was 30.0% for the quarter.
An income tax provision of $107 million was recorded for the 2016 third quarter and the reported effective income tax rate for continuing operations was 29%. Excluding a benefit of $24 million related to the tax effects of special items and a benefit of $16 million related to the tax effects of non-operating pension expense, the effective income tax rate for continuing operations was 30.5% for the quarter.
Interest Expense and Noncontrolling Interest
Net interest expense for the 2017 third quarter was $152 million compared with $137 million which includes interest income of $4 million related to income tax refund claims in the 2017 second quarter and $132 million in the 2016 third quarter.
Effects of Special Items
Details of special items for the three months are as follows:
|
| | | | | | | | | | | | | | | | | | | | | | | | |
| | | Three Months Ended |
| | | September 30 | | June 30, |
| | | 2017 | | 2016 | | 2017 |
| In millions | | Before Tax | | After Tax | | Before Tax | | After Tax | | Before Tax | | After Tax |
| Business Segments | | | | | | | | | | | | |
| Kleen Products anti-trust class action lawsuit settlement | | $ | — |
| | $ | — |
| | $ | — |
| | $ | — |
| | $ | 354 |
| | $ | 219 |
|
| Weyerhaeuser pulp business integration costs | | 6 |
| | 4 |
| | 7 |
| | 4 |
| | 5 |
| | 3 |
|
| Asia Packaging restructuring and impairment | | — |
| | — |
| | 5 |
| | 4 |
| | — |
| | — |
|
| Foodservice Asia impairment | | — |
| | — |
| | — |
| | — |
| | 9 |
| | 4 |
|
| Brazil intangible asset accelerated amortization | | 10 |
| | 7 |
| | — |
| | — |
| | — |
| | — |
|
| Abandoned property | | 7 |
| | 4 |
| | — |
| | — |
| | 5 |
| | 3 |
|
| Business Segments Total | | 23 |
| | 15 |
| | 12 |
| | 8 |
| | 373 |
| | 229 |
|
| Corporate | | | | | | | | | | | | |
| Debt extinguishment | | — |
| | — |
| | 29 |
| | 18 |
| | — |
| | — |
|
| Write-off of certain regulatory pre-engineering costs | | — |
| | — |
| | 8 |
| | 5 |
| | — |
| | — |
|
| India Packaging business evaluation write-off | | — |
| | — |
| | 17 |
| | 11 |
| | (2 | ) | | (2 | ) |
| Gain on sale of investment in ArborGen | | — |
| | — |
| | — |
| | — |
| | (14 | ) | | (9 | ) |
| Interest income related to income tax refund claim | | — |
| | — |
| | — |
| | — |
| | (4 | ) | | (2 | ) |
| Corporate Total | | — |
| | — |
| | 54 |
| | 34 |
| | (20 | ) | | (13 | ) |
| Total special items | | 23 |
| | 15 |
| | 66 |
| | 42 |
| | 353 |
| | 216 |
|
| Non-operating pension expense | | 33 |
| | 20 |
| | 42 |
| | 26 |
| | 34 |
| | 21 |
|
| Total | | $ | 56 |
| | $ | 35 |
| | $ | 108 |
| | $ | 68 |
| | $ | 387 |
| | $ | 237 |
|
Special items include the following tax expenses (benefits):
|
| | | | | | | | | | | | |
| | | Three Months Ended |
| | | September 30 | | June 30, |
| In millions | | 2017 | | 2016 | | 2017 |
| Income tax refund claims | | $ | — |
| | $ | — |
| | $ | (85 | ) |
| Pension contribution return to accrual | | — |
| | — |
| | 38 |
|
| International investment restructuring | | 19 |
| | — |
| | — |
|
| Total | | $ | 19 |
| | $ | — |
| | $ | (47 | ) |
Details of special items for the nine months are as follows:
|
| | | | | | | | | | | | | | | | |
| | | Nine Months Ended |
| | | September 30 |
| | | 2017 | | 2016 |
| In millions | | Before Tax | | After Tax | | Before Tax | | After Tax |
| Business Segments | | | | | | | | |
| Kleen Products anti-trust class action lawsuit settlement | | $ | 354 |
| | $ | 219 |
| | $ | — |
| | $ | — |
|
| Pulp business acquisition inventory fair value step-up amortization | | 14 |
| | 8 |
| | — |
| | — |
|
| Weyerhaeuser pulp business integration costs | | 15 |
| | 9 |
| | 12 |
| | 7 |
|
| Holmen mill net bargain purchase gain | | (6 | ) | | (6 | ) | | — |
| | — |
|
| Riegelwood mill conversion costs | | — |
| | — |
| | 9 |
| | 6 |
|
| Asia Packaging restructuring and impairment | | — |
| | — |
| | 70 |
| | 58 |
|
| Foodservice Asia impairment | | 9 |
| | 4 |
| | — |
| | — |
|
| Abandoned property | | 14 |
| | 9 |
| | — |
| | — |
|
| Brazil Packaging Intangible Asset Accelerated Amortization | | 10 |
| | 7 |
| | — |
| | — |
|
| Business Segments Total | | 410 |
| | 250 |
| | 91 |
| | 71 |
|
| Corporate | | | | | | | | |
| Debt extinguishment | | — |
| | — |
| | 29 |
| | 18 |
|
| Write-off of certain regulatory pre-engineering costs | | — |
| | — |
| | 8 |
| | 5 |
|
| Gain on sale of investment in Arizona Chemical | | — |
| | — |
| | (8 | ) | | (5 | ) |
| India Packaging business evaluation write-off | | (2 | ) | | (2 | ) | | 17 |
| | 11 |
|
| Gain on sale of investment in ArborGen | | (14 | ) | | (9 | ) | | — |
| | — |
|
| Interest income related to income tax refund claim | | (4 | ) | | (2 | ) | | — |
| | — |
|
| Corporate Total | | (20 | ) | | (13 | ) | | 46 |
| | 29 |
|
| Total special items | | 390 |
| | 237 |
| | 137 |
| | 100 |
|
| Non-operating pension expense | | 98 |
| | 60 |
| | 573 |
| | 352 |
|
| Total | | $ | 488 |
| | $ | 297 |
| | $ | 710 |
| | $ | 452 |
|
Special items include the following tax expenses (benefits):
|
| | | | | | | | |
| | | Nine Months Ended |
| | | September 30 |
| In millions | | 2017 | | 2016 |
| Income tax refund claims | | $ | (85 | ) | | $ | — |
|
| Pension contribution return to accrual | | 38 |
| | 23 |
|
| International investment restructuring | | 34 |
| | (63 | ) |
| Federal income tax audit closure | | — |
| | (14 | ) |
| Total | | $ | (13 | ) | | $ | (54 | ) |
BUSINESS SEGMENT OPERATING RESULTS
The following tables present net sales and operating profit (loss) which is the Company's measure of segment profitability. The tables include a detail of special items in each year, where applicable, in order to show operating profit before special items. The Company calculates Operating Profit Before Special Items (non-GAAP) by excluding the pre-tax effect of items considered by management to be unusual from the earnings reported under U.S. generally accepted accounting principles (“GAAP”). Management uses this measure to focus on on-going operations, and believes that it is useful to investors because it enables them to perform meaningful comparisons of past and present operating results. International Paper believes that using this information, along with net earnings, provides for a more complete analysis of the results of operations by quarter. Business segment operating profits (losses) are defined as earnings (loss) from continuing operations before income taxes and equity earnings, but including the impact of less than wholly owned subsidiaries, and excluding interest expense, net, corporate expenses, net, corporate net special items, business net special items and non-operating pension expense. Business segment operating profit (loss) is a measure reported to our management for purposes of making decisions about allocating resources to our business segments and assessing the performance of our business segments and is presented in our financial statement footnotes in accordance with ASC 280.
The Company currently operates in two segments: Industrial Packaging and Global Cellulose Fibers. On January 24, 2023, the Company announced an agreement to sell its Ilim equity investment and, as a result, all current and historical results of the Ilim investment are presented as Discontinued Operations, net of taxes and our equity investment is no longer a separate reportable industry segment.
The following table presents a reconciliation of Net earnings attributable(loss) from continuing operations to International Paperits total business segment operating profit (loss):
| | | | | | | | | | | | | | | | | |
| | Three Months Ended |
| | June 30, | | March 31, |
| In millions | 2023 | | 2022 | | 2023 |
| Net Earnings (Loss) from Continuing Operations | $ | 222 | | | $ | 416 | | | $ | 172 | |
| Add back (deduct): | | | | | |
| Income tax provision (benefit) | 33 | | | 96 | | | 48 | |
| Equity (earnings) loss, net of taxes | — | | | 2 | | | 1 | |
| Earnings (Loss) From Continuing Operations Before Income Taxes and Equity Earnings | 255 | | | 514 | | | 221 | |
| Interest expense, net | 59 | | | 74 | | | 62 | |
| Less than wholly owned subsidiaries included in operations | — | | | (1) | | | — | |
| Corporate expenses, net | 8 | | | 27 | | | 8 | |
| Corporate net special items | — | | | 18 | | | — | |
| | | | | |
| Non-operating pension expense (income) | 12 | | | (47) | | | 15 | |
| Adjusted Operating Profit | $ | 334 | | | $ | 585 | | | $ | 306 | |
| Business Segment Operating Profit (Loss): | | | | | |
| Industrial Packaging | $ | 304 | | | $ | 560 | | | $ | 322 | |
| Global Cellulose Fibers | 30 | | | 25 | | | (16) | |
| Total Business Segment Operating Profit (Loss) | $ | 334 | | | $ | 585 | | | $ | 306 | |
Business Segment Operating Profit (Loss)
Total business segment operating profits (losses) were $334 million in the second quarter of 2023, $306 million in the first quarter of 2023 and $585 million in the second quarter of 2022.
Compared with the first quarter of 2023, operating profits benefited from lower raw material and freight costs ($83 million) and lower mill outage costs ($88 million). These benefits were offset by lower average sales prices and an unfavorable mix ($135 million), lower sales volumes ($2 million) and higher operating costs ($6 million).
Compared with the second quarter of 2022, operating profits in the current quarter benefited from lower raw material and freight costs ($298 million) and lower mill outage costs ($9 million). These benefits were offset by an unfavorable mix net of higher average sales prices ($13 million), lower sales volumes ($119 million) and higher operating costs ($426 million).
Sales Volumes by Product (a)
Sales volumes of major products for the three months and six months ended June 30, 2023 and 2022 were as follows:
| | | | | | | | | | | | | | | | | | | | | | | |
| | Three Months Ended
June 30, | | Six Months Ended
June 30, |
| In thousands of short tons (except as noted) | 2023 | | 2022 | | 2023 | | 2022 |
| Industrial Packaging | | | | | | | |
| Corrugated Packaging (b) | 2,393 | | | 2,619 | | | 4,774 | | | 5,237 | |
| Containerboard | 600 | | | 707 | | | 1,144 | | | 1,419 | |
| Recycling | 528 | | | 535 | | | 1,088 | | | 1,099 | |
| Saturated Kraft | 44 | | | 51 | | | 78 | | | 95 | |
| Gypsum/Release Kraft | 61 | | | 64 | | | 121 | | | 118 | |
| EMEA Packaging (b) | 317 | | | 354 | | | 652 | | | 722 | |
| Industrial Packaging | 3,943 | | | 4,330 | | | 7,857 | | | 8,690 | |
Global Cellulose Fibers (in thousands of metric tons) (c) | 625 | | | 720 | | | 1,313 | | | 1,432 | |
(a)Sales volumes include third party and intersegment sales and exclude sales of equity investees.
(b)Volumes for corrugated box sales reflect consumed tons sold ("CTS'). Board sales for these businesses reflect invoiced tons.
(c)Includes North American volumes and internal sales to mills.
Discontinued Operations
On January 24, 2023, the Company announced it had reached an agreement to sell its equity investment in Ilim and had also received an indication of interest to purchase its equity investment in Ilim Group. All current and historical results of the Ilim joint venture investment are presented as Discontinued Operations, net of taxes in the condensed consolidated statement of operations. This transaction is discussed further in Note 10 - Equity Method Investments of Item 1. Financial Statements.
Discontinued operations include the equity earnings of the Ilim joint venture. Discontinued operations also includes after-tax net special items charges of $33 million and $43 million for the three months ended June 30, 2023 and March 31, 2023, respectively.
Details of these charges were as follows:
| | | | | | | | | | | | | | | | | | | | | | | |
| Three Months | | Three Months |
| June 30, | | March 31, |
| 2023 | | 2023 |
| In millions | Before Tax | | After Tax | | Before Tax | | After Tax |
| Ilim equity method investment impairment | $ | 33 | | | $ | 33 | | | $ | 43 | | | $ | 43 | |
| Total | $ | 33 | | | $ | 33 | | | $ | 43 | | | $ | 43 | |
Income Taxes
An income tax provision of $33 million was recorded for the second quarter of 2023 and the reported effective income tax rate was 13%. Excluding a benefit of $21 million related to the tax effects of net special items and a benefit of $3 million related to the tax effects of non-operating pension expense, the operational effective income tax rate was 22% for the second quarter of 2023. The reported effective tax rate for the second quarter of 2023 was lower than the first quarter of 2023 primarily due to a benefit recorded related to the closure of the 2015-2016 federal audits.
An income tax provision of $48 million was recorded for the first quarter of 2023 and the reported effective income tax rate was 22%. Excluding a benefit of $1 million related to the tax effects of net special items and benefit of $4 million related to the tax effects of non-operating pension expense, the operational effective income tax rate was 22% for the first quarter of 2023.
An income tax provision of $96 million was recorded for the second quarter of 2022 and the reported effective income tax rate was 19%. Excluding a benefit of $35 million related to the tax effects of net special items and expense of $12 million related to the tax effects of non-operating pension expense, the operational effective income tax rate was 25% for the second quarter of 2022.
The operational effective tax provision and rate are non-GAAP measures and are calculated by adjusting the income tax provision from continuing operations and rate to exclude the tax effect of net special items and non-operating pension expense (income). Management believes that the presentation provides useful information to investors by providing a more meaningful comparison of the income tax rate between past and present periods.
Interest Expense
Net interest expense was $59 million in the second quarter of 2023, compared with $62 million in the first quarter of 2023 and $74 million in the second quarter of 2022. The second quarter of 2023 includes $6 million of interest income related to the settlement of tax audits. The first quarter of 2023 includes $3 million of interest expense related to the previously announced settlement of the timber monetization restructuring tax matter.
Effects of Net Special Items Expense (Income) and Non-Operating Pension Expense
Details of net special items expense (income), excluding interest expense, and non-operating pension expense (income) for the three months ended are as follows:
| | | | | | | | | | | | | | | | | | | | | | | | | | | | | | | | | | | | | | |
| Three Months Ended |
| June 30, | | March 31, | |
| 2023 | | 2022 | | 2023 | |
| In millions | Before Tax | | After Tax | | Before Tax | | After Tax | | Before Tax | | After Tax | |
| Environmental remediation reserve adjustment | $ | — | | | $ | — | | | $ | 15 | | | $ | 11 | | | $ | — | | | $ | — | | |
| Sylvamo investment | — | | | — | | | (3) | | | (2) | | | — | | | — | | |
| Other | — | | | — | | | 6 | | | 5 | | | — | | | — | | |
| Total net special items expense (income) | — | | | — | | | 18 | | | 14 | | | — | | | — | | |
| Non-operating pension expense (income) | 12 | | | 9 | | | (47) | | | (35) | | | 15 | | | 11 | | |
| Total net special items and non-operating pension expense (income) | $ | 12 | | | $ | 9 | | | $ | (29) | | | $ | (21) | | | $ | 15 | | | $ | 11 | | |
Net special items expense (income) include the following tax expenses (benefits):
| | | | | | | | | | | | | | | | | | | | |
| | Three Months Ended |
| | June 30, | | March 31, |
| In millions | | 2023 | | 2022 | | 2023 |
| Tax benefit related to the settlement of tax audits | | $ | (23) | | | $ | — | | | $ | — | |
| Tax benefit related to tax-free exchange of Sylvamo shares | | — | | | (31) | | | — | |
| | | | | | |
| Total | | $ | (23) | | | $ | (31) | | | $ | — | |
The following tables present net sales and business segment operating profit (loss) which is the
most directly comparable GAAP measure. See Note 18 - Business Segment Information in the Condensed Notes to the Consolidated Financial Statements for the GAAP reconciliationCompany's measure of segment operating profit.profitability.
Industrial Packaging
|
| | | | | | | | | | | | | | | | | | | | | | | |
| Total Industrial Packaging | 2017 | | 2016 |
| In millions | 3rd Quarter | | 2nd Quarter | | Nine Months | | 3rd Quarter | | 2nd Quarter | | Nine Months |
| Sales | $ | 3,734 |
| | $ | 3,706 |
| | $ | 10,939 |
| | $ | 3,491 |
| | $ | 3,520 |
| | $ | 10,422 |
|
| Operating Profit | $ | 469 |
| | $ | 50 |
| | $ | 884 |
| | $ | 423 |
| | $ | 458 |
| | $ | 1,277 |
|
| Asia Packaging restructuring and impairment | — |
| | — |
| | — |
| | 5 |
| | 28 |
| | 70 |
|
| Holmen mill bargain purchase gain | — |
| | — |
| | (6 | ) | | — |
| | — |
| | — |
|
| Kleen Products anti-trust settlement | — |
| | 354 |
| | 354 |
| | — |
| | — |
| | — |
|
| Brazil Intangible Asset Accelerated Amortization | 10 |
| | — |
| | 10 |
| | — |
| | — |
| | — |
|
| Other | 5 |
| | 3 |
| | 9 |
| | — |
| | — |
| | — |
|
| Operating Profit Before Special Items | $ | 484 |
| | $ | 407 |
| | $ | 1,251 |
| | $ | 428 |
| | $ | 486 |
| | $ | 1,347 |
|
| | | | | | | | | | | | | | | | | | | | | | | | | | | | | | | | | | | |
| Total Industrial Packaging | 2023 | | 2022 |
| In millions | 2nd Quarter | | 1st Quarter | | Six Months | | 2nd Quarter | | 1st Quarter | | Six Months |
| Sales | $ | 3,884 | | | $ | 4,083 | | | $ | 7,967 | | | $ | 4,491 | | | $ | 4,406 | | | $ | 8,897 | |
| Operating Profit (Loss) | $ | 304 | | | $ | 322 | | | $ | 626 | | | $ | 560 | | | $ | 397 | | | $ | 957 | |
Industrial Packaging net sales for the thirdsecond quarter of 20172023 were 1% higher than5% lower compared with the first quarter of 2023 and 14% lower compared with the second quarter of 2022. Operating profit was 6% lower in the second quarter of 20172023 compared with the first quarter of 2023 and 46% lower compared with the second quarter of 2022.
| | | | | | | | | | | | | | | | | | | | | | | | | | | | | | | | | | | |
| North American Industrial Packaging | 2023 | 2022 |
| In millions | 2nd Quarter | | 1st Quarter | | Six Months | | 2nd Quarter | | 1st Quarter | | Six Months |
| Sales (a) | $ | 3,550 | | | $ | 3,724 | | | $ | 7,274 | | | $ | 4,126 | | | $ | 4,025 | | | $ | 8,151 | |
| Operating Profit (Loss) | $ | 284 | | | $ | 302 | | | $ | 586 | | | $ | 550 | | | $ | 400 | | | $ | 950 | |
| | | | | | | | | | | |
(a)Includes intra-segment sales of $17 million and $48 million for the three months ended June 30, 2023 and 2022, respectively; $32 million and $29 million for the three months ended March 31, 2023 and 2022, respectively; and $49 million and $77 million for the six months ended June 30, 2023 and 2022, respectively.
North American Industrial Packaging average sales margins were 7%lower driven by lower average sales prices for corrugated boxes and containerboard from prior index movement. Sales volumes in the second quarter of 2023 were higher thancompared to the first quarter of 2023 for corrugated boxes and containerboard despite one less shipping day in the second quarter of 2023. Total maintenance and economic downtime was about 124,000 short tons higher in the second quarter of 2023 compared with the first quarter of 2023, due to higher economic downtime reflecting a continued soft demand environment across all product segments. The increase in economic downtime was partially offset by lower maintenance downtime. Operating costs were
higher driven by increased economic downtime and timing of spending. Planned maintenance downtime costs were $54 million lower in the second quarter of 2023 compared with the first quarter of 2023. Input costs were lower, primarily for energy, freight and wood.
Compared with the second quarter of 2022, sales volumes in the second quarter of 2023 were lower for corrugated boxes and containerboard reflecting the soft demand environment as consumers continue to focus spending on non-discretionary goods and services and retailers and manufacturers pull down inventory levels. Total maintenance and economic downtime was about 597,000 short tons higher in the second quarter of 2023, primarily due to higher economic downtime. Average sales prices for boxes were higher reflecting previous price increases. Containerboard prices were lower driven by prior index movements. Operating costs increased, driven by economic downtime, inflation on goods and services and distribution costs. Planned maintenance downtime costs were slightly higher in the second quarter of 2023 compared with the second quarter of 2022. Input costs were significantly lower driven by recovered fiber and energy costs.
Entering the third quarter of 2023, sales volumes are expected to be higher compared to the second quarter of 2023. There is one less shipping day in the third quarter. Average sales margins are expected to be lower. Operating costs are expected to be lower. Planned maintenance downtime costs are expected to be lower in the third quarter of 2016. Operating profit before special items was 19% higher in2023 compared with the thirdsecond quarter of 2017 than2023. Input costs are expected to be higher driven by recovered fiber and energy.
| | | | | | | | | | | | | | | | | | | | | | | | | | | | | | | | | | | |
| EMEA Industrial Packaging | 2023 | 2022 |
| In millions | 2nd Quarter | | 1st Quarter | | Six Months | | 2nd Quarter | | 1st Quarter | | Six Months |
| Sales | $ | 351 | | | $ | 391 | | | $ | 742 | | | $ | 413 | | | $ | 410 | | | $ | 823 | |
| Operating Profit (Loss) | $ | 20 | | | $ | 20 | | | $ | 40 | | | $ | 10 | | | $ | (3) | | | $ | 7 | |
EMEA Industrial Packaging sales volumes for corrugated boxes in the second quarter of 2017 and 13% higher than in2023 were seasonally lower compared with the thirdfirst quarter of 2016.
|
| | | | | | | | | | | | | | | | | | | | | | | |
| North American Industrial Packaging | 2017 | | 2016 |
| In millions | 3rd Quarter | | 2nd Quarter | | Nine Months | | 3rd Quarter | | 2nd Quarter | | Nine Months |
| Sales (a) | $ | 3,383 |
| | $ | 3,336 |
| | $ | 9,874 |
| | $ | 3,151 |
| | $ | 3,138 |
| | $ | 9,344 |
|
| Operating Profit | $ | 487 |
| | $ | 51 |
| | $ | 899 |
| | $ | 439 |
| | $ | 496 |
| | $ | 1,373 |
|
| Kleen Products anti-trust settlement | — |
| | 354 |
| | 354 |
| | — |
| | — |
| | — |
|
| Other | 5 |
| | 3 |
| | 9 |
| | — |
| | — |
| | — |
|
| Operating Profit Before Special Items | $ | 492 |
| | $ | 408 |
| | $ | 1,262 |
| | $ | 439 |
| | $ | 496 |
| | $ | 1,373 |
|
| |
(a) | Includes intra-segment sales of $50 million and $35 million for the three months ended September 30, 2017 and 2016, respectively, $31 million and $32 million for the three months ended June 30, 2017 and 2016, respectively, and $113 million and $112 million for the nine months ended September 30, 2017 and 2016, respectively. |
North American Industrial Packaging 2023. Average sales volumesmargins for corrugated boxes were stable. Average sales margins for containerboard were lower. Operating costs were higher. There were no planned maintenance outages in either the thirdsecond quarter of 20172023 or the first quarter of 2023. Input costs were lower thandriven by energy costs.
Compared with the second quarter of 2022, sales volumes in the second quarter of 20172023 were lower reflecting one less shipping day andsoft demand in the impact of Hurricanes Harvey and Irma. Containerboard shipments to export markets increased, butEurozone. Higher average sales margins for corrugated boxes were more than offset by lower domestic shipments. Total maintenance downtime decreased 72,000 tons from 157,000 tons to 85,000 tons. There was no economic downtime taken in either period. Average sales margins for boxes were higher due to the realization of box sales price increases. Average sales price realizations for containerboard also increased in both the domestic and export markets. Input costs were higher, primarily for recycled fiber, but also for energy, wood and chemicals. Planned maintenance downtime costs were $62 million lower in the 2017 third quarter compared with the 2017 second quarter.containerboard. Operating costs were higher includingdriven by inflation on goods and services. There were no planned maintenance outages in either the hurricane-related temporary shutdownsecond quarter of two mills. The total negative impact2023 or the second quarter of the hurricanes was approximately $20 million during the quarter.2022. Input costs were lower primarily for energy and recovered fiber.
Compared with
Looking ahead to the third quarter of 2016,2023, sales volumes for boxes were lower in the third quarter of 2017 which included two fewer shipping days. Sales volumes for containerboard increased in export markets, while domestic shipments decreased. Total maintenance and economic downtime was 108,000 tons lower in the third quarter of 2017 which comprises a decrease of 1,000 tons for maintenance downtime and a decrease of 107,000 tons for economic downtime. Average sales margins for boxes increased primarily due to higher average sales price realizations. Average sales price realizations in both domestic and export containerboard markets were also higher. Input costs for recycled fiber were significantly higher, while slightly higher costs for energy, chemicals and freight were offset by lower wood costs. Planned maintenance downtime costs were $6 million lower in the third quarter of 2017 compared with the third quarter of 2016. Earnings were also impacted by higher mill operating costs.
Entering the fourth quarter of 2017, sales volumes forcorrugated boxes are expected to be stable, but will include one less shipping day. Containerboard export shipments are expected to decrease. Input costs for recycled fiber are expected to be significantly lower, partially offset by higher energy, chemicalin Europe and freight costs. Planned maintenance downtime costs should be $8 million lower.
|
| | | | | | | | | | | | | | | | | | | | | | | |
| EMEA Industrial Packaging | 2017 | | 2016 |
| In millions | 3rd Quarter | | 2nd Quarter | | Nine Months | | 3rd Quarter | | 2nd Quarter | | Nine Months |
| Sales | $ | 333 |
| | $ | 341 |
| | $ | 991 |
| | $ | 313 |
| | $ | 295 |
| | $ | 902 |
|
| Operating Profit | $ | (5 | ) | | $ | 5 |
| | $ | 14 |
| | $ | — |
| | $ | 6 |
| | $ | 13 |
|
| Holmen mill net bargain purchase gain | — |
| | — |
| | (6 | ) | | — |
| | — |
| | — |
|
| Operating Profit Before Special Items | $ | (5 | ) | | $ | 5 |
| | $ | 8 |
| | $ | — |
| | $ | 6 |
| | $ | 13 |
|
EMEA Industrial Packaging sales volumes for boxes in the third quarter of 2017 were seasonally lower than in the second quarter of 2017 in Morocco and the Euro-zone. Average sales margins decreased due to higher input costs for containerboard. Input costs for energy were flat, while distribution costs decreased due to lower export shipments from Turkey and Morocco. Operating costs were lower.
Compared with the third quarter of 2016, sales volumes in the third quarter of 2017 were higher. Average sales margins decreased in the Euro-zone and Morocco due to higher containerboard costs. Input costs for energy were lower, but distribution costs were higher due to increased export shipments.
Looking ahead to the fourth quarter of 2017, sales volumes are expected to be seasonally stronger. Average sales margins are expected to recover duebe lower. Operating costs are expected to the realization of prior price increases and a more favorable mix. Earnings will be negatively impacted by costs at the Madrid mill during its conversion to recycled containerboard production.
|
| | | | | | | | | | | | | | | | | | | | | | | |
| Brazilian Industrial Packaging | 2017 | | 2016 |
| In millions | 3rd Quarter | | 2nd Quarter | | Nine Months | | 3rd Quarter | | 2nd Quarter | | Nine Months |
| Sales | $ | 68 |
| | $ | 60 |
| | $ | 187 |
| | $ | 62 |
| | $ | 51 |
| | $ | 155 |
|
| Operating Profit | $ | (13 | ) | | $ | (6 | ) | | $ | (29 | ) | | $ | (9 | ) | | $ | (12 | ) | | $ | (29 | ) |
| Brazil Intangible Asset Accelerated Amortization | 10 |
| | — |
| | 10 |
| | — |
| | — |
| | — |
|
| Operating Profit Before Special Items | $ | (3 | ) | | $ | (6 | ) | | $ | (19 | ) | | $ | (9 | ) | | $ | (12 | ) | | $ | (29 | ) |
Brazilian Industrial Packaging sales volumeshigher. There are no planned maintenance outages in the third quarter of 2017 compared with the second quarter of 2017 were higher for boxes, but slightly lower for containerboard. Improved average sales margins reflect higher sales prices for both boxes and containerboard, partially offset by an unfavorable mix. Operating costs were favorable while input costs, primarily for natural gas, were higher.
Compared with the third quarter of 2016, sales volumes in the third quarter of 2017 were higher for boxes, but lower for containerboard, while average sales price realizations for both boxes and containerboard increased.2023. Input costs primarily for recycled fiber and wood, decreased. Operating costs were also lower.
Looking ahead to the fourth quarter of 2017, sales volumes are expected to be about flat. Average sales margins are expected to increase reflecting prior sales price realizations for both boxes and containerboard, partially offset by an unfavorable mix. Input costs should be slightly higher and operating costs are expected to increase, primarily due to labor costs.stable.
|
| | | | | | | | | | | | | | | | | | | | | | | |
| Asian Industrial Packaging | 2017 | | 2016 |
| In millions | 3rd Quarter | | 2nd Quarter | | Nine Months | | 3rd Quarter | | 2nd Quarter | | Nine Months |
| Sales | $ | — |
| | $ | — |
| | $ | — |
| | $ | — |
| | $ | 68 |
| | $ | 133 |
|
| Operating Profit | $ | — |
| | $ | — |
| | $ | — |
| | $ | (7 | ) | | $ | (32 | ) | | $ | (80 | ) |
| Asia Packaging Restructuring and Impairment | — |
| | — |
| | — |
| | 5 |
| | 28 |
| | 70 |
|
| Operating Profit Before Special Items | $ | — |
| | $ | — |
| | $ | — |
| | $ | (2 | ) | | $ | (4 | ) | | $ | (10 | ) |
Asian Industrial Packaging
On June 30, 2016, the Company completed the sale of its corrugated packaging business in China and Southeast Asia to Xiamen Bridge Hexing Equity Investment Partnership Enterprise. See Note 8 - Divestitures / Spinoff in the Condensed Notes to the Consolidated Financial Statements for further discussion of the sale of this business.
Global Cellulose Fibers
|
| | | | | | | | | | | | | | | | | | | | | | | |
| Total Global Cellulose Fibers | 2017 | | 2016 |
| In millions | 3rd Quarter | | 2nd Quarter | | Nine Months | | 3rd Quarter | | 2nd Quarter | | Nine Months |
| Sales | $ | 654 |
| | $ | 612 |
| | $ | 1,830 |
| | $ | 242 |
| | $ | 259 |
| | $ | 713 |
|
| Operating Profit | $ | 49 |
| | $ | 7 |
| | $ | (14 | ) | | $ | (38 | ) | | $ | (21 | ) | | $ | (109 | ) |
| Acquisition costs | 6 |
| | 5 |
| | 15 |
| | 7 |
| | 5 |
| | 12 |
|
| Inventory fair value step-up amortization | — |
| | — |
| | 14 |
| | — |
| | — |
| | — |
|
| Other | 2 |
| | — |
| | 3 |
| | — |
| | — |
| | — |
|
| Operating Profit Before Special Items | $ | 57 |
| | $ | 12 |
| | $ | 18 |
| | $ | (31 | ) | | $ | (16 | ) | | $ | (97 | ) |
| | | | | | | | | | | | | | | | | | | | | | | | | | | | | | | | | | | |
| Total Global Cellulose Fibers | 2023 | 2022 |
| In millions | 2nd Quarter | | 1st Quarter | | Six Months | | 2nd Quarter | | 1st Quarter | | Six Months |
| Sales | $ | 698 | | | $ | 811 | | | $ | 1,509 | | | $ | 788 | | | $ | 710 | | | $ | 1,498 | |
| Operating Profit (Loss) | $ | 30 | | | $ | (16) | | | $ | 14 | | | $ | 25 | | | $ | (49) | | | $ | (24) | |
Global Cellulose Fibers includes the results of the pulp business acquired from Weyerhaeuser beginning in December 2016. See Note 7 - Acquisitions net sales in the Condensed Notes to Consolidated Financial Statements for further discussion of this acquisition. Net sales were 7% higher in the thirdsecond quarter of 20172023 were 14% lower compared with the first quarter of 2023 and 11% lower than in the second quarter of 2017 and significantly higher than in the third quarter of 2016 due to the acquisition.2022. Operating profit before special items was 375% higher in the third quarter of 2017 thanincreased in the second quarter of 2017 and 284% higher than in2023 compared with the thirdfirst quarter of 2016. Sales volumes in the third quarter of 2017 increased2023 and were 20% higher compared with the second quarter of 2017 reflecting steady demand.2022.
Sales volumes in the second quarter of 2023, compared with the first quarter of 2023, were lower driven by customer inventory destocking. Total maintenance and economic downtime was about 12,000 short tons lower in the second quarter of 2023 compared with the first quarter of 2023 driven by less maintenance downtime. Average sales margins were lower as the benefits from contract restructuring were offset by price realizationsindex movement and an unfavorable product mix. Operating costs were lower driven by distribution and overhead costs and seasonality. Planned maintenance downtime costs in the second quarter of 2023 were $34 million lower compared with the first quarter of 2023. Input costs were lower, primarily for chemicals and energy.
Compared with the second quarter of 2022, sales volumes in the second quarter of 2023 were lower driven by customer inventory destocking. Total maintenance and economic downtime was about 150,000 short tons higher in the second quarter of 2023, due to economic downtime. Average sales margins were higher primarily for fluff pulp, but werereflecting higher average sales prices partially offset by an unfavorable product mix. Operating costs and inputwere higher driven by economic downtime. Planned maintenance downtime costs
in the second quarter of 2023 were $10 million lower compared with the second quarter of 2022. Input costs were flat.lower primarily for energy and chemicals.
Entering the third quarter of 2023, sales volumes are expected to be higher. Average sales margins are expected to be lower. Planned maintenance downtime costs in the third quarter of 2017 were $37 million2023 are expected to be lower than incompared with the second quarter of 2017. Costs associated with Hurricane Irma negatively impacted the business by approximately $5 million in the quarter. In Europe and Russia, sales volumes were lower, while average sales price realizations were favorable.
Compared with the third quarter of 2016, for the legacy business sales volumes increased in the third quarter of 2017. Average sales price realizations improved reflecting a stronger pricing environment. Planned maintenance downtime2023. Operating costs in the third quarter of 2017 were $14 million lower than in the third quarter of 2016. Input costs decreased slightly, although in Europe and Russia input costs were higher for wood, energy and purchased pulp. In Europe and Russia, sales volumes decreased and average sales margins were unfavorably impacted by lower sales price realizations partially offset by a favorable mix.
Entering the fourth quarter of 2017, sales volumes are expected to be seasonally higher. Average sales price realizations are expected to reflect the further recognition of recent price increases. Average sales margins will also benefit from a more favorable product mix. Input costs are expected to be higher. Planned maintenance downtime costs should be $5 million higher in the fourth quarter of 2017. Sales volumes and average sales price realizations are expected to increase in Europe and Russia.lower.
Printing Papers
|
| | | | | | | | | | | | | | | | | | | | | | | |
| Total Printing Papers | 2017 | | 2016 |
| In millions | 3rd Quarter | | 2nd Quarter | | Nine Months | | 3rd Quarter | | 2nd Quarter | | Nine Months |
| Sales | $ | 1,039 |
| | $ | 1,017 |
| | $ | 3,051 |
| | $ | 1,019 |
| | $ | 1,012 |
| | $ | 3,003 |
|
| Operating Profit | $ | 135 |
| | $ | 86 |
| | $ | 321 |
| | $ | 167 |
| | $ | 117 |
| | $ | 419 |
|
| Other | — |
| | 2 |
| | 2 |
| | — |
| | — |
| | — |
|
| Operating Profit Before Special Items | $ | 135 |
| | $ | 88 |
| | $ | 323 |
| | $ | 167 |
| | $ | 117 |
| | $ | 419 |
|
Printing Papers net sales for the third quarter of 2017 were 2% higher than in the second quarter of 2017 and 2% higher than in the third quarter of 2016. Operating profit before special items in the third quarter of 2017 was 53% higher than in the second quarter of 2017 but 19% lower than in the third quarter of 2016.
|
| | | | | | | | | | | | | | | | | | | | | | | |
| North American Papers | 2017 | | 2016 |
| In millions | 3rd Quarter | | 2nd Quarter | | Nine Months | | 3rd Quarter | | 2nd Quarter | | Nine Months |
| Sales | $ | 470 |
| | $ | 446 |
| | $ | 1,384 |
| | $ | 477 |
| | $ | 466 |
| | $ | 1,425 |
|
| Operating Profit | $ | 54 |
| | $ | 19 |
| | $ | 106 |
| | $ | 81 |
| | $ | 51 |
| | $ | 193 |
|
| Other | — |
| | 2 |
| | 2 |
| | — |
| | — |
| | — |
|
| Operating Profit Before Special Items | $ | 54 |
| | $ | 21 |
| | $ | 108 |
| | $ | 81 |
| | $ | 51 |
| | $ | 193 |
|
North American Papers sales volumes in the third quarter of 2017 were higher than in the second quarter of 2017 reflecting seasonally higher domestic demand. Average sales price realizations for uncoated freesheet paper were lower due to competitive pressures. Average sales margins were also negatively impacted by an unfavorable mill sourcing mix. Input costs were slightly higher, primarily for wood. Planned maintenance downtime costs were $34 million lower in the third quarter of 2017, which included no outages, compared with the second quarter of 2017.
Compared with the third quarter of 2016, sales volumes in the third quarter of 2017 were higher primarily due to increased shipments of uncoated freesheet paper to export markets. Average sales price realizations were lower, reflecting weaker market conditions. Average sales margins were also impacted by unfavorable geographic and mill sourcing mix. Input costs increased.
Entering the fourth quarter of 2017, sales volumes are expected to be seasonally lower, while average sales price realizations are expected to be stable with the partial realization of a previous sales price increase for uncoated freesheet paper. Input costs are expected to be steady. Planned maintenance downtime costs should be $11 million higher with an outage scheduled in the fourth quarter at our Eastover mill.
|
| | | | | | | | | | | | | | | | | | | | | | | |
| European Papers | 2017 | | 2016 |
| In millions | 3rd Quarter | | 2nd Quarter | | Nine Months | | 3rd Quarter | | 2nd Quarter | | Nine Months |
| Sales | $ | 292 |
| | $ | 299 |
| | $ | 865 |
| | $ | 278 |
| | $ | 288 |
| | $ | 825 |
|
| Operating Profit | $ | 38 |
| | $ | 26 |
| | $ | 93 |
| | $ | 40 |
| | $ | 34 |
| | $ | 114 |
|
European Papers sales volumes for uncoated freesheet paper in the third quarter of 2017 compared with the second quarter of 2017 were lower in both Russia and Europe. Average sales margins for uncoated freesheet paper increased in Europe due to the partial realization of a sales price increase, and in Russia due to a favorable geographic mix. Input costs were higher, primarily for wood and energy. Planned maintenance downtime costs in the third quarter of 2017 were $6 million lower than in the second quarter of 2017 which included an outage at the Svetogorsk mill. Manufacturing operating costs were lower.
Sales volumes for uncoated freesheet paper in the third quarter of 2017 compared with the third quarter of 2016, were lower in Europe, but higher in Russia. Average sales price realizations for uncoated freesheet paper increased in Europe, but were slightly lower in Russia. Input costs, primarily for wood and energy, were higher. Planned maintenance downtime costs in the third quarter of 2017 were $9 million lower than in the third quarter of 2016 which included an outage at the Kwidzyn mill.
Looking forward to the fourth quarter of 2017, sales volumes for uncoated freesheet paper are expected to increase. Average sales price realizations should be higher in both Europe and Russia. Input costs are expected to be higher for wood in Russia and higher in Europe for wood and energy.
|
| | | | | | | | | | | | | | | | | | | | | | | |
| Brazilian Papers | 2017 | | 2016 |
| In millions | 3rd Quarter | | 2nd Quarter | | Nine Months | | 3rd Quarter | | 2nd Quarter | | Nine Months |
| Sales (a) | $ | 239 |
| | $ | 232 |
| | $ | 685 |
| | $ | 229 |
| | $ | 219 |
| | $ | 637 |
|
| Operating Profit | $ | 46 |
| | $ | 43 |
| | $ | 128 |
| | $ | 54 |
| | $ | 34 |
| | $ | 123 |
|
| |
(a) | Includes intra-segment sales of $6 million and $0 million for the three months ended September 30, 2017 and 2016, respectively, $7 million and $3 million for the three months ended June 30, 2017 and 2016, respectively, and $22 million and $4 million for the nine months ended September 30, 2017 and 2016, respectively. |
Brazilian Papers sales volumes in the third quarter of 2017 were lower than in the second quarter of 2017 reflecting higher than anticipated export shipments in the second quarter along with the negative impact of logistical issues in the third quarter, partially offset by seasonally stronger demand in Brazil. Average sales margins were higher due to increased average sales price realizations for export uncoated freesheet papers, as well as a favorable geographic mix. Input costs increased for purchased pulp and energy. Planned maintenance downtime costs were $3 million lower than in the second quarter of 2017 which included an outage at the Mogi Guacu mill.
Compared with the third quarter of 2016, sales volumes for uncoated freesheet paper in the third quarter of 2017 increased in other Latin American countries, but were flat in Brazil. Average sales margins improved, reflecting higher average sales price realizations for export markets, improved customer mix in Brazil and a favorable geographic mix, partially offset by an unfavorable product mix. Input costs were stable.
Entering the fourth quarter of 2017, sales volumes for uncoated freesheet paper are expected to be seasonally higher in Brazil while export shipments should also increase due to the recovery from the logistical issues that occurred during the third quarter. Average sales margins should benefit from a more favorable geographic mix. Input costs are expected to be higher, particularly for purchased pulp and energy.
|
| | | | | | | | | | | | | | | | | | | | | | | |
| Indian Papers | 2017 | | 2016 |
| In millions | 3rd Quarter | | 2nd Quarter | | Nine Months | | 3rd Quarter | | 2nd Quarter | | Nine Months |
| Sales | $ | 44 |
| | $ | 47 |
| | $ | 139 |
| | $ | 35 |
| | $ | 42 |
| | $ | 120 |
|
| Operating Profit | $ | (3 | ) | | $ | (2 | ) | | $ | (6 | ) | | $ | (8 | ) | | $ | (2 | ) | | $ | (11 | ) |
Indian Papers sales volumes in the third quarter of 2017 compared with the second quarter of 2017 were lower due to reduced production capacity associated with a planned maintenance outage and a 6-day contract workers' strike. Average sales price realizations were slightly lower. Input costs were lower, primarily for wood and coal, but this benefit was more than offset by higher operating costs. Planned maintenance outage costs were $1 million higher than in the second quarter of 2017 due to an
outage at the Rajahmundry mill. Compared with the third quarter of 2016, sales volumes in the third quarter of 2017 were higher and average sales price realizations increased. Input costs were lower for wood, partially offset by higher chemical costs.
Looking ahead to the fourth quarter of 2017, sales volumes are expected to be higher as the third-quarter production constraints do not recur. Average sales price realizations should be slightly higher. Planned maintenance outage costs are expected to be $1 million lower than in the third quarter of 2017 with no outages scheduled in the fourth quarter.
Consumer Packaging
|
| | | | | | | | | | | | | | | | | | | | | | | |
| Total Consumer Packaging | 2017 | | 2016 |
| In millions | 3rd Quarter | | 2nd Quarter | | Nine Months | | 3rd Quarter | | 2nd Quarter | | Nine Months |
| Sales | $ | 491 |
| | $ | 474 |
| | $ | 1,431 |
| | $ | 494 |
| | $ | 501 |
| | $ | 1,490 |
|
| Operating Profit | $ | 54 |
| | $ | (14 | ) | | $ | 73 |
| | $ | 61 |
| | $ | 73 |
| | $ | 150 |
|
| Riegelwood mill conversion costs | — |
| | — |
| | — |
| | — |
| | — |
| | 9 |
|
| Foodservice Asia asset impairment | — |
| | 9 |
| | 9 |
| | — |
| | — |
| | — |
|
| Operating Profit Before Special Items | $ | 54 |
| | $ | (5 | ) | | $ | 82 |
| | $ | 61 |
| | $ | 73 |
| | $ | 159 |
|
Consumer Packaging net sales in the third quarter of 2017 were 4% higher than in the second quarter of 2017, but 1% lower than in the third quarter of 2016. Operating profit before special items was higher in the third quarter of 2017 than in the second quarter of 2017, but 11% lower than in the third quarter of 2016.
|
| | | | | | | | | | | | | | | | | | | | | | | |
| North American Consumer Packaging | 2017 | | 2016 |
| In millions | 3rd Quarter | | 2nd Quarter | | Nine Months | | 3rd Quarter | | 2nd Quarter | | Nine Months |
| Sales | $ | 403 |
| | $ | 395 |
| | $ | 1,186 |
| | $ | 407 |
| | $ | 416 |
| | $ | 1,241 |
|
| Operating Profit | $ | 33 |
| | $ | (28 | ) | | $ | 19 |
| | $ | 39 |
| | $ | 48 |
| | $ | 77 |
|
| Riegelwood mill conversion costs | — |
| | — |
| | — |
| | — |
| | — |
| | 9 |
|
| Foodservice Asia asset impairment | — |
| | 9 |
| | 9 |
| | — |
| | — |
| | — |
|
| Operating Profit Before Special Items | $ | 33 |
| | $ | (19 | ) | | $ | 28 |
| | $ | 39 |
| | $ | 48 |
| | $ | 86 |
|
North American Consumer Packaging Coated paperboard sales volumes in the third quarter of 2017 were higher than in the second quarter of 2017. Average sales price realizations increased reflecting the effect of a 2017 second quarter sales price increase. Planned maintenance downtime costs were $33 million lower than in the second quarter of 2017 which included outages at our Augusta and Texarkana mills. Operating costs improved due to the resolution of some performance issues at our Augusta mill during the 2017 second quarter. Input costs for wood were slightly lower.
Compared with the third quarter of 2016, sales volumes in the third quarter of 2017 were slightly lower. Average sales price realizations increased slightly, reflecting the realization of second-quarter 2017 sales price increases offset by competitive price erosion. Operating costs were higher due to reliability issues at our Augusta mill, while input costs were steady.
Foodservice sales volumes in the third quarter of 2017 were seasonally lower than in the second quarter of 2017. Average sales margins increased, reflecting higher average sales price realizations partially offset by an unfavorable customer mix. Distribution costs were lower due to the impact of freight savings initiatives. Compared with the third quarter of 2016, sales volumes in the third quarter of 2017 decreased slightly reflecting weaker customer demand. Average sales margin decreased as higher input costs for resin and board were only partially offset by the realization of 2017 second quarter sales price increases.
Looking forward to the fourth quarter of 2017, coated paperboard sales volumes are expected to be seasonally weaker. Average prior sales price realizations are expected to be flat, but average sales margins should benefit from a favorable mix. Input costs for wood and polystyrene costs are expected to be higher following the hurricanes that occurred in the third quarter. Planned maintenance downtime costs should be $4 million higher in the fourth quarter of 2017 with an outage scheduled at our Texarkana mill. Operating costs are expected to recover. For Foodservice, sales volumes are expected to be seasonally higher while average sales margins should be relatively flat.
|
| | | | | | | | | | | | | | | | | | | | | | | |
| European Consumer Packaging | 2017 | | 2016 |
| In millions | 3rd Quarter | | 2nd Quarter | | Nine Months | | 3rd Quarter | | 2nd Quarter | | Nine Months |
| Sales | $ | 88 |
| | $ | 79 |
| | $ | 245 |
| | $ | 87 |
| | $ | 85 |
| | $ | 249 |
|
| Operating Profit | $ | 21 |
| | $ | 14 |
| | $ | 54 |
| | $ | 22 |
| | $ | 25 |
| | $ | 73 |
|
European Consumer Packaging sales volumes in the third quarter of 2017 compared with the second quarter of 2017 were higher in both Europe and Russia. Average sales margins decreased in both regions, reflecting lower sales price realizations partially mitigated by favorable mix. Input costs were higher in both Europe and Russia. Planned maintenance downtime costs
were $2 million lower in the third quarter of 2017 compared with the second quarter of 2017. Operating costs were also favorable.
Compared with the third quarter of 2016, sales volumes decreased in both Europe and Russia. In Russia, average sales margins decreased due to lower average sales price realizations, but in Europe sales margins reflected higher average sales price realizations and a more favorable mix. Input costs increased for wood, energy and purchased pulp. Planned maintenance downtime costs were $3 million lower in the third quarter of 2017 than in the third quarter of 2016.
Entering the fourth quarter of 2017, sales volumes are expected to be higher in Russia, but about flat in Europe. Average sales margins are expected to increase, reflecting higher sales price realizations in Europe. Input costs for wood and energy are expected to be higher.
Equity Earnings, Net of Taxes – Ilim
Since October 2007, International Paper
On January 24, 2023, the Company announced it had reached an agreement to sell its equity investment in Ilim and also received from the same purchasers an indication of interest to purchase its equity investment in Ilim Group. This transaction is discussed further in Note 10 - Equity Method Investments of Item 1. Financial Statements .
In conjunction with the entry into the announced agreement, a determination was made that the book value of the Ilim and Ilim Holding S.A. (Ilim) have operatedGroup investments plus associated cumulative translation losses, exceeded fair value, based upon the agreed upon transaction price for Ilim and the offer price for Ilim Group. As a 50:50result, an other than temporary impairment of $33 million, $43 million and $533 million was recorded for the three months ended June 30, 2023, March 31, 2023 and December 31, 2022, respectively, and $76 million for the six months ended June 30, 2023, to write down these investments to fair value. As of June 30, 2023 and December 31, 2022, approximately $478 million and $375 million, respectively, of cumulative translation adjustment loss remained within AOCI with the recognition of this loss recorded as an offset to the investment balance.
All current and historical results of the Ilim joint venture investment are presented as Discontinued Operations, net of taxes in Russia. Ilim is a separate reportable business segment.the condensed consolidated statement of operations. The Company recorded equity earnings, net of taxes, of $48$46 million in the thirdsecond quarter of 2017,2023, compared with $21earnings of $43 million in the first quarter 2023 and $95 million in the second quarter of 20172022.
The Company received cash dividends from the Ilim joint venture of $13 million and $46$204 million induring the thirdfirst six months of 2023 and 2022, respectively.
Compared with the first quarter of 2016. In the third quarter of 2017, the after-tax foreign exchange impact primarily on the remeasurement of U.S. dollar-denominated net debt was a gain of $7 million compared with a loss of $18 million2023, results in the second quarter of 2017. 2023 were relatively flat, reflecting the negative impact of lower average sales prices, offset by higher volume, lower operating costs and the positive impact of a weaker ruble.
Compared with the second quarter of 2017, sales volumes2022, results in the thirdsecond quarter of 20172023 were significantly lower, primarily forreflecting lower sales of softwood pulp and containerboard in China, partially offset by higher sales of hardwood pulp and containerboard in Russia. Average sales price realizations increased, primarily for sales of hardwood pulp and containerboard in China and other export markets, partially offset by softwood and hardwood pulp and containerboard sales in Russia. Input costs were relatively flat, while planned maintenance downtime costs were higher in the third quarter of 2017.
Compared with the third quarter of 2016, sales volumes in the third quarter of 2017 were relatively flat overall, while sales of hardwood pulp to China and containerboard sales in Russia increased, but wereprices, partially offset by lower salesinterest costs and the positive impact of softwood pulp to China and Russia. Average sales price realizations were higher, primarily for sales of softwood and hardwood pulp in China and in Russia and for sales of containerboard in all countries. Input costs, primarily for wood and energy, were higher. Operating costs were negatively impacted by the planned maintenance downtime taken in the third quarter of 2017. An after-tax foreign exchange gain of $3 million primarily on the remeasurement of U.S. dollar denominated net debt was recorded in the third quarter of 2016.a weaker ruble.
Looking forward to the fourth quarter of 2017, sales volumes are expected to increase. Average sales price realizations are expected to increase compared with the third quarter of 2017, primarily for export sales of softwood and hardwood pulp, and containerboard. Input costs are expected to be seasonally higher for wood and energy.
Cash provided by operations totaled $569$873 million for the first ninesix months of 2017,2023, compared with $1.6 billion$978 million for the comparable 2016nine-month2022 six-month period. Cash used for working capital components totaled $567 million for the first nine months of 2017 compared to $120 million for the comparable 2016nine-month period. The increase to working capital in 2017 includes income tax receivables primarily driven by the pension contribution and the Kleen Products litigation settlement.
The Company generated free cash flow of approximately $1.2 billion and $1.4 billion in the first nine months of 2017 and 2016, respectively. Free cash flow is a non-GAAP measure and the most directly comparable GAAP measure is cash provided by operations. Management believes that free cash flow is useful to investors as a liquidity measure because it measures the amount of cash generated that is available, after reinvesting in the business, to maintain a strong balance sheet, pay dividends, repurchase stock, service debt and make investments for future growth. It should not be inferred that the entire free cash flow amount is available for discretionary expenditures. By adjusting for certain items that are not indicative of the Company's ongoing performance, free cash flow also enables investors to perform meaningful comparisons between past and present periods.
The following is a reconciliation of cash provided by operations to free cash flow:
|
| | | | | | | |
| | Nine Months Ended
September 30, |
| In millions | 2017 | | 2016 |
| Cash provided by operations | $ | 569 |
| | $ | 1,566 |
|
| Adjustments: | | | |
| Cash invested in capital projects | (935 | ) | | (903 | ) |
| Cash contribution to pension plan | 1,250 |
| | 750 |
|
| Cash payment for Kleen settlement | 354 |
| | — |
|
| Free Cash Flow | $ | 1,238 |
| | $ | 1,413 |
|
Investments in capital projects, net of insurance recoveries, totaled $935$608 million in the first ninesix months of 20172023, compared to $903$371 million in the first ninesix months of 2016.2022. Full-year 20172023 capital spending is currently expected to be approximately $1.5$1.1 billion to $1.2 billion, or about 107%110% to 120% of depreciation and amortization expense for our current businesses.amortization.
Financing activities for the first ninesix months of 20172023 included a $997$236 million net increase in debt versus a $1.6 billion$11 million net increasedecrease in debt during the comparable 2016 nine-month2022 six-month period. During the third quarter
See Note 15 - Debt of 2017,Item 1. Financial Statements for a discussion of various debt-related actions taken by the Company issued $1.0 billion of 4.35% senior unsecured notes with a maturity date in 2048. The proceeds from this offering, together with a combination of available cash and other borrowings, were used to make a $1.25 billion voluntary cash contribution toduring the Company's pension plan.six months ended June 30, 2023.
Amounts related to early debt extinguishmentextinguishments during the three and six months ended June 30, 2023 and 2022 were as follows:
| | | | | | | | | | | | | | | | | | | | | | | |
| | Three Months Ended
June 30, | | Six Months Ended
June 30, |
| In millions | 2023 | | 2022 | | 2023 | | 2022 |
| Early debt reductions (a) | $ | — | | | $ | 5 | | | $ | — | | | $ | 5 | |
(a)Reductions related to notes with interest rates ranging from 4.35% to 4.40% with original maturities from 2047 to 2048 for both the three months and ninesix months ended SeptemberJune 30, 2017 and 2016 were as follows:2022.
|
| | | | | | | | | | | | | | | |
| | Three Months Ended
September 30, | | Nine Months Ended
September 30, |
| In millions | 2017 | | 2016 | | 2017 | | 2016 |
| Early debt reductions (a) | $ | 95 |
| | $ | 266 |
| | $ | 122 |
| | $ | 266 |
|
| Pre-tax early debt extinguishment costs | 2 |
| | 29 |
| | 2 |
| | 29 |
|
| |
(a) | Reductions related to notes with interest rates ranging from 4.63% to 6.63% with original maturities from 2018 to 2031 and from 1.57% to 6.63% with original maturities from 2018 to 2031 for the three and nine months ended September 30, 2017, and 7.95% with an original maturity in 2018 for the three and nine months ended September 30, 2016. |
At SeptemberJune 30, 2017,2023, contractual obligations for future payments of debt maturities (including finance lease liabilities disclosed in Note 9 - Leases and excluding the timber monetization structure disclosed in Note 14 - Variable Interest Entities) by calendar year were as follows: $476$245 million in 2017; $4612023; $136 million in 2018; $4222024; $191 million in 2019; $1592025; $144 million in 2020; $6632026; $323 million in 2021; $923 million in 2022;2027; and $9.23$4.8 billion thereafter.
Maintaining an investment-grade credit rating is an important element of International Paper’s financing strategy. At SeptemberJune 30, 2017,2023, the Company held long-term credit ratings of BBB (stable outlook) and Baa2 (stable outlook) by S&P and Moody’s, respectively. In addition, the Company held short-term credit ratings of A2 and P2 by S&P and Moody's, respectively, for borrowings during the current quarter under the Company's commercial paper program.
At SeptemberJune 30, 2017,2023, International Paper’s credit agreements totaled $2.1$1.9 billion, which managementis comprised of the $1.4 billion contractually committed bank credit agreement and up to $500 million under the receivables securitization program. In June 2023, the Company amended and restated its credit agreement to, among other things (i) reduce the size of the contractually committed bank facility from $1.5 billion to $1.4 billion, (ii) extend the maturity date from June 2026 to June 2028, and (iii) replace the LIBOR-based rate with a SOFR-based rate. Management believes that the Company's credit agreements are adequate to cover expected operating cash flow variability during the current economic cycle. The credit agreements generally provide for interest rates at a floating rate index plus a pre-determined margin dependent upon International Paper’s credit rating. The liquidity facilities include a $1.5At June 30, 2023, the Company had no borrowings outstanding under the $1.4 billion contractually committed bank credit agreement that expiresor the $500 million receivables securitization program. The Company’s credit agreements are not subject to any restrictive covenants other than the financial covenants as disclosed in December 2021Note 15 - Debt, and has a facility fee of 0.15% per annum payable quarterly. The liquidity facilities also include up to $600 million of uncommitted financings based on eligible receivable balances ($600 million available at September 30, 2017)the borrowings under athe receivables securitization program that expiresbeing limited by eligible receivables. The Company was in December 2017.compliance with all its debt covenants at June 30, 2023, and was well below the thresholds stipulated under the covenants as defined in the credit agreements. Further the financial covenants do not restrict any borrowings under the credit agreements.
In June 2016,addition to the $1.9 billion capacity under the Company's credit agreements, International Paper entered intohas a commercial paper program with a borrowing capacity of $750 million.$1.0 billion supported by its $1.4 billion credit agreement. Under the terms of the program, individual maturities on borrowings may vary, but not exceed one year from the date of issue. Interest bearing notes may be issued either as fixed notes or floating rate notes. As of SeptemberJune 30, 2017,2023, the Company had $445$80 million of borrowings outstanding under thisthe program at a weighted average interest ratewith remaining capacity of 1.39%.$920 million, and the remaining credit agreement capacity was $1.3 billion.
Subsequent to September 30, 2017, International Paper repaid approximately $382 million of notes with an interest rate of 7.95% and an original maturity date in 2018.
During the first nine monthsquarter of 2017, International Paper used 2.6 million shares of treasury stock for various incentive plans. International Paper also acquired 0.9 million shares of treasury stock, including shares for the payment of restricted stock tax withholding. Repurchases of common stock and payments of restricted stock withholding taxes totaled $46 million. In
September 2013,2023, the Company announcedentered into a share repurchase programvariable term loan agreement providing for a $600 million term loan which was fully drawn on the date of such loan agreement and matures in 2028. The $600 million debt was issued following the repayment of $410 million of commercial paper earlier in 2023 and will be used to acquire up to $1.5 billionrepay debt maturing later in 2023 and for general corporate purposes.
During the second quarter of the Company's common stock in open market repurchase transactions. In addition, in July 2014,2023, the Company announced that it would acquire up to $1.5 billionissued approximately $24 million of additional sharesdebt with a variable interest rate and a maturity date of December 1, 2027. The Company had debt reductions of approximately $49 million of variable interest EDB with current maturities. Additionally during the Company's common stock to supplement the $1.5 billion share repurchase program authorized in September 2013 and would continue to repurchase such shares in open market repurchase transactions. Under this $3.0 billion share repurchase program,second quarter of 2023, the Company has repurchased 44.6issued an approximately $54 million shares atEDB with a variable rate and a maturity date of May 1, 2028. The proceeds of this were used to repay an average priceapproximately $54 million EDB that matured on May 1, 2023. The Company issued an approximately $25 million EDB with a variable rate and a maturity date of $46.40, for a totalJune 1, 2030. The proceeds of this were used to repay an approximately $2.1 billion, as of September 30, 2017.$25 million EDB that matured on June 1, 2023.
During the first nine months of 2016, International Paper used approximately 2.7 million shares of treasury stock for various incentive plans. International Paper also acquired 3.6 million shares of treasury stock, including restricted stock tax withholding. Repurchases of common stock and payments of restricted stock withholding taxes totaled $131.7 million, including $100.1 million related to shares repurchased under the Company's $3.0 billion share repurchase program. Cash dividend payments related to common stock totaled $573 million and $543 million for the first nine months of 2017 and 2016, respectively. Dividends were $1.3875 per share and $1.3200 per share for the first nine months in 2017 and 2016, respectively.
International Paper expects to be able to meet projected capital expenditures, service existing debt, and meet working capital and dividend requirements during 2017and make common stock and/or debt repurchases for the next 12 months and for the foreseeable future thereafter with current cash balances and cash from operations, supplemented as required by its existing credit facilities. The Company will continue to rely on debt and capital markets for the majority of any necessary long-term funding not provided by operating cash flows. Funding decisions will be guided by our capital structure planning objectives. The primary goals of the Company’s capital structure planning are to maximize financial flexibility and preservemaintain appropriate levels of liquidity to meet our needs while reducingmanaging balance sheet debt and interest expense.expense, and we have repurchased, and may continue to repurchase, our common stock (under our existing share repurchase program) and debt (including in open market purchases) to the extent consistent with this capital structure planning, and subject to prevailing market conditions, our liquidity requirements, applicable securities laws requirements, and other factors. The majority of International Paper’s debt is accessed through global public capital markets where we have a wide base of investors.
Acquisitions
During the first six months of 2023, International Paper used 1.6 million shares of treasury stock for various incentive plans. International Paper also acquired 5.9 million shares of treasury stock, including restricted stock tax withholdings. Repurchases of common stock and payments of restricted stock withholding taxes totaled $218 million, including $197 million related to shares repurchased under the Company's repurchase program. Our current share repurchase program approved by our Board of Directors on October 11, 2022, which does not have an expiration date, has approximately $2.96 billion aggregate amount of shares of common stock remaining authorized for purchase as of June 30, 2023.
During the first six months of 2022, International Paper used approximately 1.5 million shares of treasury stock for various incentive plans. International Paper also acquired 18.1 million shares of treasury stock, including restricted stock tax withholding. Repurchases of common stock and payments of restricted stock withholding taxes totaled $823 million, including $801 million related to shares repurchased under the Company's repurchase program.
Cash dividend payments related to common stock totaled $322 million and $344 million for the first six months of 2023 and 2022, respectively. Dividends were $0.9250 per share for the first six months of 2023 and 2022.
Our pension plan is currently fully funded and we do not anticipate any required contributions for the next 12 months.
Variable Interest Entities
Information concerning variable interest entities is set forth in
Note 7 - Acquisitions15 in the Condensed Notes toCompany's Annual Report on Form 10-K for the Consolidated Financial Statements. Ilim Holding S.A. Shareholders’ Agreement
year ended December 31, 2022. In October 2007, in connection with the formation2006 International Paper installment sale of forestlands, we received $4.8 billion of installment notes. These installment notes were used by variable interest entities as collateral for borrowings from third-party lenders. These variable interest entities were restructured in 2015 when the installment notes and third-party loans were extended. The restructured variable interest entities held installment notes of $4.8 billion and third-party loans of $4.2 billion which both matured in August 2021. We settled the third-party loans at their maturity with the proceeds from the installment notes. This resulted in cash proceeds of approximately $630 million representing our equity in the variable interest entities. Maturity of the Ilim Holding S.A. joint venture, International Paper entered intoinstallment notes and termination of the monetization structure also resulted in a shareholder’s agreement$72 million tax liability that includes provisions relating towas paid in the reconciliationfourth quarter of disputes among the partners. This agreement provides that at any time, either2021. On September 2, 2022, the Company or its partners may commence procedures specified underand the deadlock agreement. If these or any other deadlock procedures underInternal Revenue Service agreed to settle the shareholder's agreement are commenced, although it is not obligated to do so, the Company may in certain situations choose to purchase its partners' 50% interest in Ilim. Any such transaction would be subject to review and approval by Russian and other relevant anti-trust authorities. Based on the provisions of the2015 Financing Entities timber monetization restructuring tax matter. Under this agreement, the Company estimates thatwill fully resolve the current purchase price for its partners' 50% interests wouldmatter and pay $252 million in U.S. federal income taxes. As a result, interest will also be approximately $1.3 billion, which could be satisfied by payment of cash or International Paper common stock, or some combinationcharged upon closing of the two, ataudit. The amount of interest expense recognized during the Company's option.first six months of 2023 was $58 million. As of June 30, 2023, $252 million in U.S. federal income taxes and $58 million in interest expense have been paid as a result of the settlement agreement. The purchase byCompany has now fully satisfied the Companypayment terms of its partners’ 50% interest in Ilim would resultthe settlement agreement regarding the 2015 Financing Entities timber monetization restructuring tax matter. The reversal of the Company’s remaining deferred tax liability associated with the 2015 Financing Entities of $604 million was recognized as a one-time tax benefit in the consolidationthird quarter of Ilim's financial position and results of operations in all subsequent periods. The parties have informed each other that they have no current intention to commence procedures specified under the deadlock provisions of the shareholder’s agreement.2022.
CRITICAL ACCOUNTING POLICIES AND SIGNIFICANT ACCOUNTING ESTIMATES
The preparation of financial statements in conformity with accounting principles generally accepted in the United States requires International Paper to establish accounting policies and to make estimates that affect both the amounts and timing of the recording of assets, liabilities, revenues and expenses. Some of these estimates require judgments about matters that are inherently uncertain.
Accounting policies whose application may have a significant effect on the reported results of operations and financial position of International Paper, and that can require judgments by management that affect their application, include accounting for contingencies, impairment or disposal of long-lived assets, goodwill and other intangible assets, pensions postretirement benefits other than pensions,and income taxes and business combinations.taxes.
The Company has included in its 2016 Form 10-KAnnual Report a discussion of these critical accounting policies, which are important to the portrayal of the Company’s financial condition and results of operations and require management’s judgments. The Company has not made any changes in these critical accounting policies during the first ninesix months of 2017, other than a change in the timing of the annual impairment testing of goodwill which is referenced in Note 1 in the Condensed Notes to the Consolidated Financial Statements and discussed below.2023.
Pension Accounting
Net pension expense totaled approximately $237 million for International Paper’s U.S. plans for the nine months ended September 30, 2017, or about $481 million less than the pension expense for the first nine months of 2016. The decrease in U.S. plan expense was due to $442 million plan settlement accounting charges in the second and third quarters of 2016, and
lower amortization of unrecognized actuarial losses and prior service cost. Net pension expense for non-U.S. plans was about $3 million for the first nine months of 2017 and 2016.
In the first quarter of 2016, International Paper offered a voluntary, limited-time opportunity for former employees who were participants in the Retirement Plan of International Paper Company (the Pension Plan) to request early payment of their entire Pension Plan benefit in the form of a single lump sum payment. The amount of total payments under this program was approximately $1.2 billion, and were made from Plan trust assets on June 30, 2016. Based on the level of payments made, settlement accounting rules applied and resulted in a plan remeasurement as of the June 30, 2016 payment date. The discount rate used in the plan remeasurement was 3.80%, down from 4.40% at December 31, 2015. As a result of settlement accounting, the Company recognized a pro-rata portion of the unamortized net actuarial loss, after remeasurement, resulting in a $439 million non-cash charge to the Company's earnings in the second quarter of 2016. Additional payments of $8 million were made during the third quarter of 2016 due to mandatory cash payouts and a small lump sum payout project, and the pension plan was subsequently remeasured at September 30, 2016 using a discount rate of 3.60%, down from 3.80% at June 30, 2016. As a result of settlement accounting, the Company recognized a pro-rata portion of the unamortized net actuarial loss, after remeasurement, resulting in a $3 million non-cash charge to the Company's earnings in the third quarter of 2016.
After consultation with our actuaries, International Paper determines key actuarial assumptions on December 31 of each year that are used to calculate liability information as of that date and pension expense for the following year. Key assumptions affecting pension expense include the discount rate, the expected long-term rate of return on plan assets, the projected rate of future compensation increases, and various demographic assumptions including expected mortality. The discount rate assumption is determined based on approximately 500 Aa-rated bonds appropriate to provide the projected benefit payments of the plan. A bond portfolio is selected and a single rate is determined that equates the market value of the bonds purchased to the discounted value of the plan’s benefit payments. The expected long-term rate of return on plan assets is based on projected rates of return for current and planned asset classes in the plan’s investment portfolio. At September 30, 2017, the market value of plan assets for International Paper’s U.S. plans totaled approximately $12.4 billion, consisting of approximately 45% equity securities, 36% fixed income securities, and 19% real estate and other assets. Plan assets did not include International Paper common stock.
The Company’s funding policy for our pension plans is to contribute amounts sufficient to meet legal funding requirements, plus any additional amounts that the Company may determine to be appropriate considering the funded status of the plan, tax deductibility, the cash flows generated by the Company, and other factors. The Company made voluntary cash contributions of $1.25 billion and $750 million to the qualified pension plan in the first nine months of 2017 and 2016, respectively. The U.S. nonqualified plans are only funded to the extent of benefits paid, which totaled $34 million for the nine months ended September 30, 2017.
On September 26, 2017, the Company entered into an agreement with The Prudential Insurance Company of America to purchase a group annuity contract and transfer approximately $1.3 billion of International Paper's U.S. qualified pension plan projected benefit obligations, subject to customary closing conditions. The transaction closed on October 3, 2017 and was funded with pension plan assets. Under the transaction, at the end of 2017, Prudential will assume responsibility for pension benefits and annuity administration for approximately 45,000 retirees or their beneficiaries receiving less than $450 in monthly benefit payments from the plan. The Company expects to recognize a non-cash pension settlement charge of approximately $400 million before tax in the fourth quarter of 2017.
FORWARD-LOOKING STATEMENTS
Certain statements in this Quarterly Report on Form 10-Q that are not historical in nature may be considered “forward-looking” statements“forward-looking statements” within the meaning of the Private Securities Litigation Reform Act of 1995. These statements are often identified by the words, “will,Words such as “expects,” “may,“anticipates,” “should,“believes,” “continue,” “anticipate,” “believe,” “expect,” “plan,” “appear,” “project,” “estimate,” “intend,”“estimates” and words of a similar nature.expressions identify forward-looking statements. These statements are not guarantees of future performance and reflect management’s current views with respect to future events, whichand are subject to risks and uncertainties that could cause actual results to differ materially from those expressed or implied in these statements. Factors which could cause actual
results to differ include but are not limited to: (i) risks with respect to climate change and global, regional, and local weather conditions, as well as risks related to our ability to meet targets and goals with respect to climate change and the emission of GHGs and other environmental, social and governance matters; (ii) the level of our indebtedness and changes in interest rates; (ii)rates (including the impact of current elevated interest rate levels); (iii) the impact of global and domestic economic conditions and industry conditions, including but not limitedwith respect to current negative macroeconomic conditions, inflationary pressures and changes in the cost or availability of raw materials, energy sources and transportation costs,sources, supply chain shortages and disruptions, competition we face, cyclicality and changes in consumer preferences, demand and pricing for our products; (iii) global economicproducts, and conditions impacting the credit, capital and political changes,financial markets, including but not limitedpossible instability in such markets and/or disruptions to the impairment of financial institutions,banking system due to potential or actual bank failures; (iv) domestic and global geopolitical conditions, changes in currency exchange rates, trade protectionist policies, downgrades in our credit ratings, and/or the credit ratings of banks issuing certain letters of credit, issued by recognized credit rating organizations,organizations; (v) the amount of our future pension funding obligation, changes in tax lawsobligations, and pension and health carehealthcare costs; (iv)(vi) unanticipated expenditures or other adverse developments related to the cost of compliance with existing and new environmental, tax, labor and employment, privacy, anti-bribery and anti-corruption, and other U.S. and non-U.S. governmental regulationslaws and to actual or potential litigation; (v) whether we experience aregulations; (vii) any material disruption at oneany of our manufacturing facilities; (vi)facilities or other adverse impact on our operations due to severe weather, natural disasters, climate change or other causes; (viii) the impact of the conflict involving Russia and Ukraine, including in connection with related escalated sanctions imposed by the United States, the European Union, G7 and other countries and possible actions by the Russian government, and the impact of such developments on domestic and global economic and geopolitical conditions in general and on us and our Ilim joint venture, which could be materially and adversely affected by such developments, and our inability to predict the full impact of the Russian invasion of Ukraine, current or future sanctions, current or future actions by the Russian government, geopolitical instability and the possibility of broadened military conflict on our Ilim joint venture, on our receipt of dividends from our Ilim joint venture and on our ability to complete the sale of our interest in the Ilim joint venture under the terms of the agreement with our joint venture partners to purchase our interest (and, if we are unable to complete such a sale, on the value of and our ability to sell our interest to another purchaser); (ix) risks inherent in conducting business through joint ventures; (vii) the failure to realize the expected synergies and cost-savings from our purchase of the pulp business of Weyerhaeuser Company or delay in realization thereof; (viii) purchase price adjustments relating to our pending transaction to transfer our North American
consumer packaging business to Graphic Packaging Holding Company in exchange for, among other things, an equity interest in an entity that will hold the assets for the combined business; (ix) receipt of regulatory approvals for the Graphic Packing transaction and the successful fulfillment or waiver of all other closing conditions without unexpected delays or conditions; (x) the successful closing of the Graphic Packing transaction within the estimated timeframe; (xi) the uncertainty of the expected financial performance of the combined business following completion of the Graphic Packaging transaction; (xii) the failure of the combined business to realize the expected synergies, cost-savings and other benefits from the Graphic Packaging transaction or delay in realization thereof; (xiii) the successful financing of the Graphic Packaging transaction; (ix) unforeseen tax treatment relating to the Graphic Packaging transaction, (xv) litigation related to the Graphic Packaging transaction or limitations or restrictions imposed by regulatory authorities that may delay or negatively impact the Graphic Packaging transaction; and (xvi) our ability to achieve the benefits we expectexpected from, alland other strategicrisks associated with, acquisitions, joint ventures, divestitures, spinoffs and restructurings;other corporate transactions, (xi) cybersecurity and (xvii)information technology risks; (xii) loss contingencies and pending, threatened or future litigation, including with respect to environmental related matters; (xiii) our exposure to claims under our agreements with Sylvamo Corporation; (xiv) our failure to realize the anticipated benefits of the spin-off of Sylvamo Corporation and the qualification of such spin-off as a tax-free transaction for U.S. federal income tax purposes; and (xv) our ability to attract and retain qualified personnel, particularly in light of current labor market conditions. These and other factors youthat could cause or contribute to actual results differing materially from such forward-looking statements can findbe found in our press releases and filings withSEC filings. In addition, other risks and uncertainties not presently known to the Securities and Exchange Commission, includingCompany or that we currently believe to be immaterial could affect the risk factors identified in Item 1Aaccuracy of Part I of the Company’s Annual Report on Form 10-K for the fiscal year ended December 31, 2016, as updated in Item 1A of Part II of this Quarterly Report on Form 10-Q ("Risk Factors"). We undertakeany forward-looking statements. The Company undertakes no obligation to publicly update any forward-looking statements, whether as a result of new information, future events or otherwise.
| |
ITEM 3. | QUANTITATIVE AND QUALITATIVE DISCLOSURES ABOUT MARKET RISK |
Information relating to quantitative and qualitative disclosures about market risk is shown on page 38pages 41-42 of International Paper’s 2016 Form 10-K,Annual Report, which information is incorporated herein by reference. There have been no material changes in the Company’s exposure to market risk since December 31, 2016.2022.
| |
ITEM 4. | CONTROLS AND PROCEDURES |
Evaluation of Disclosure Controls and Procedures:
Disclosure controls and procedures are controls and other procedures that are designed to ensure that information required to be disclosed in our reports filed or submitted under the Securities Exchange Act of 1934, as amended (Exchange Act), is recorded, processed, summarized and reported (and accumulated and communicated to management, including our Chief Executive Officer and Chief Financial Officer, to allow timely decisions regarding required disclosure) within the time periods specified in the Securities and Exchange Commission’s rules and forms. As of the end of the period covered by this report,Form 10-Q, we conducted an evaluation, under the supervision and with the participation of our management, including the Chief Executive Officer and Chief Financial Officer, of the effectiveness of our disclosure controls and procedures pursuant to Rules 13a-15 and 15d-15 of the Exchange Act. Based upon that evaluation, our Chief Executive Officer and Chief Financial Officer concluded that the Company’s disclosure controls and procedures were effective as of SeptemberJune 30, 20172023 (the end of the period covered by this report)Form 10-Q).
Changes in Internal Control over Financial Reporting:
There have been no changes in our internal control over financial reporting during the quarter ended SeptemberJune 30, 20172023 that have materially affected, or are reasonably likely to materially affect, our internal control over financial reporting.
Our proposed transaction to contribute our North American Consumer Packaging business to Graphic Packaging may10-Q, which is incorporated by reference herein. The Company is not be completed within the expected timeframe, or at all, and we may not achieve the expected benefits from this transaction or from other strategic acquisitions, joint ventures, divestitures and other corporate transactions. On October 23, 2017, we entered into an agreement to contribute our North American Consumer Packaging business to Graphic Packaging in exchange for, among other things, an equity interest in the combined business and the assumption by the combined business of $660 million of indebtedness that we intend to incur prior to closing of the transaction. No assurances can be given about the timing, availability or cost of such financing. The transaction is expected to close in the first quarter of 2018. Completion of the transaction is subject to any administrative or judicial proceeding arising under any Federal, State or local provisions that have been enacted or adopted regulating the satisfactiondischarge of materials into the environment or waiverprimarily for the purpose of certain conditionsprotecting the environment that are beyond our control and may prevent, delayis likely to result in monetary sanctions of $1 million or otherwise negatively affect its completion. These conditions include U.S. antitrust clearance. The Antitrust Division of the U.S. Department of Justice or other regulatory agencies may refuse to approve the acquisition or seek to make its approval subject to compliance with unanticipated or onerous conditions that could reduce the anticipated benefits of the transaction.more.
The success of the transaction will depend, in part, on the financial performance of the combined business and on the ability of the combined business to realize anticipated growth opportunities, cost savings and other synergies. The combined business’s success in realizing these growth opportunities, cost savings and other synergies, and the timing of this realization, will depend on the successful integration of our North American Consumer Packaging business with Graphic Packaging’s business.
More broadly, our strategy for long-term growth, productivity and profitability depends, in part, on our ability to make prudent strategic acquisitions, joint ventures, divestitures and other corporate transactions and to realize the benefits we expect from them.
Otherwise, thereThere have been no material changes from the risk factors disclosed in our Annual Report on Form 10-K for the fiscal year ended December 31, 20162022 (Part I, Item 1A).
| |
ITEM 2. | UNREGISTERED SALES OF EQUITY SECURITIES AND USE OF PROCEEDS |
PURCHASES OF EQUITY SECURITIES BY THE ISSUER AND AFFILIATED PURCHASERS.
|
| | | | | | | | | |
| Period | Total Number of Shares Purchased (a) | Average Price Paid per Share | Total Number of Shares Purchased as Part of a Publicly Announced Plan or Program | Maximum Number (or Approximate Dollar Value) of Shares that May Yet Be Purchased Under the Plans or Programs (in millions) |
| July 1, 2017 - July 31, 2017 | 646 |
| $ | 56.41 |
| — |
| $0.933 |
| August 1, 2017 - August 31, 2017 | — |
| — |
| — |
| 0.933 |
|
| September 1, 2017 - September 30, 2017 | 173 |
| 56.82 |
| — |
| 0.933 |
|
| Total | 819 |
| | | |
| | | | | | | | | | | | | | |
| Period | Total Number of Shares Purchased (a) | Average Price Paid per Share | Total Number of Shares Purchased as Part of a Publicly Announced Plan or Program | Maximum Number (or Approximate Dollar Value) of Shares that May Yet Be Purchased Under the Plans or Programs (in billions) |
| April 1, 2023 - April 30, 2023 | 1,117,992 | $35.86 | 1,116,220 | $2.96 |
| May 1, 2023 - May 31, 2023 | 5,877 | 32.98 | — | 2.96 |
| June 1, 2023 - June 30, 2023 | 168 | 36.54 | — | 2.96 |
| Total | 1,124,037 | | | |
(a) 8197,817 shares were acquired from employees fromor board members as a result of share withholdings to pay income taxes under the Company's restricted stock programs.program. The remainder were purchased under a share repurchase program. On October 11, 2022, our Board increased the authorization up to a total of $3.35 billion shares. This repurchase program does not have an expiration date. As of June 30, 2023, approximately $2.96 billion aggregate shares of our common stock remained authorized for repurchase under a previous Board authorization.
Not applicable.
Not applicable.
Not applicable. Without limiting the generality of the foregoing, during the quarter ended June 30, 2023, no director or Section 16 officer adopted or terminated any Rule 10b5-1 trading arrangements or non-Rule 10b5-1 trading arrangements, as defined in Item 408(a) of Regulation S-K.
ITEM 6. EXHIBITS | | | | | 10.1 | | CommitmentThird Amended and Restated 5-Year Credit Agreement, dated September 26, 2017, betweenas of June 7, 2023, among International Paper Company, JPMorgan Chase Bank, N.A., individually and Prudential Insurance Company of America, relatingas administrative agent, Citibank, individually and as syndication agent, and certain lenders (incorporated by reference to Exhibit 10.1 to the Retirement Plan of International Paper Company.*Company’s Current Report on Form 8-K dated June 7, 2023). | | | | 1131.1* | | | | | 12 | | | | | 31.1 | | | | | 31.231.2* | | | | | 3232* | | | | | | 101.INS | | XBRL Instance Document.Document - the instance document does not appear in the Interactive Data File because its XBRL tags are embedded within the inline XBRL document. | | | | 101.SCH | | XBRL Taxonomy Extension Schema. | | | | 101.CAL | | XBRL Taxonomy Extension Calculation Linkbase. | | | | 101.DEF | | XBRL Taxonomy Extension Definition Linkbase. | | | | 101.LAB | | XBRL Taxonomy Extension Label Linkbase. | | | 101.PRE | | XBRL Extension Presentation Linkbase. |
| | *101.PRE | Confidential treatment has been requested for certain information pursuant to Rule 24b-2 under the Securities Exchange Act of 1934, | XBRL Extension Presentation Linkbase. | | | | | 104 | | Cover Page Interactive Data File (formatted as amended.Inline XBRL, and contained in Exhibit 101). |
SIGNATURES
* Filed herewith
Pursuant to the requirements of the Securities Exchange Act of 1934, the registrant has duly caused this report to be signed on its behalf by the undersigned thereunto duly authorized. | | | | | | | | | | INTERNATIONAL PAPER COMPANY
(Registrant) | | | | | July 28, 2023 | INTERNATIONAL PAPER COMPANY
(Registrant)
By | /s/ Tim S. Nicholls | | | Tim S. Nicholls | November 3, 2017 | By | /s/ Glenn R. Landau | | | Glenn R. Landau | | | Senior Vice President and Chief
Financial Officer
| | | | November 3, 2017July 28, 2023 | By | /s/ Vincent P. BonnotHolly G. Goughnour | | | Vincent P. BonnotHolly G. Goughnour | | | Vice President – Finance and Corporate Controller |
|