UNITED STATES
SECURITIES AND EXCHANGE COMMISSION
WASHINGTON, D.C. 20549
FORM 10-Q
ý QUARTERLY REPORT PURSUANT TO SECTION 13 OR 15(d) OF THE SECURITIES EXCHANGE ACT OF 1934
For the Quarterly Period Ended March 31, 20182019
¨ TRANSITION REPORT PURSUANT TO SECTION 13 OR 15(d) OF THE SECURITIES EXCHANGE ACT OF 1934
For the Transition Period From to
_________________________________________
Commission File Number 1-3157
INTERNATIONAL PAPER COMPANY
(Exact name of registrant as specified in its charter)
|
| |
| New York | 13-0872805 |
| (State or other jurisdiction of | (I.R.S. Employer |
| incorporation of organization) | Identification No.) |
| | |
| 6400 Poplar Avenue, Memphis, TN | 38197 |
| (Address of principal executive offices) | (Zip Code) |
Registrant’s telephone number, including area code: (901) 419-7000
Securities registered pursuant to Section 12(b) of the Act: |
| | |
| Title of each class | Trading Symbol(s) | Name of each exchange on which registered |
| Common Shares | IP | New York Stock Exchange |
Indicate by check mark whether the registrant (1) has filed all reports required to be filed by Section 13 or 15(d) of the Securities Exchange Act of 1934 during the preceding 12 months (or for such shorter period that the registrant was required to file such reports), and (2) has been subject to such filing requirements for the past 90 days. Yes ý No ¨
Indicate by check mark whether the registrant has submitted electronically and posted on its corporate Web site, if any, every Interactive Data File required to be submitted and posted pursuant to Rule 405 of Regulation S-T (paragraph 232.405 of this chapter) during the preceding 12 months (or for such shorter period that the registrant was required to submit and post such files). Yes ý No ¨
Indicate by check mark whether the registrant is a large accelerated filer, an accelerated filer, a non-accelerated filer or a smaller reporting company. See the definitions of “large accelerated filer,” “accelerated filer,” “smaller reporting company,” and "emerging growth company" in Rule 12b-2 of the Exchange Act.
|
| | | |
| Large accelerated filer | ý | Accelerated filer | ¨ |
| Non-accelerated filer | ¨ | Smaller reporting company | ¨ |
| | | Emerging growth company | ¨ |
If an emerging growth company, indicate by check mark if the registrant has elected not to use the extended transition period for complying with any new or revised financial accounting standards provided pursuant to Section 13 (a) of the Exchange
Act. ¨
Indicate by check mark whether the registrant is a shell company (as defined in Rule 12b-2 of the Exchange Act). Yes ¨ No ý
The number of shares outstanding of the registrant’s common stock, par value $1.00 per share, as of April 27, 201826, 2019 was 414,091,479397,333,976.
INDEX
|
| | |
| | | PAGE NO. |
| | | |
| | | |
| | |
| | | |
| | Condensed Consolidated Statement of Operations - Three Months Ended March 31, 20182019 and 20172018 | |
| | | |
| | Condensed Consolidated Statement of Comprehensive Income - Three Months Ended March 31, 20182019 and 20172018 | |
| | | |
| | Condensed Consolidated Balance Sheet - March 31, 20182019 and December 31, 20172018 | |
| | | |
| | Condensed Consolidated Statement of Cash Flows - Three Months Ended March 31, 20182019 and 20172018 | |
| | | |
| | | |
| | | |
| | |
| | | |
| | |
| | | |
| | |
| | | |
| | | |
| | | |
| | |
| | | |
| | |
| | | |
| | |
| | | |
| | |
| | |
| |
INTERNATIONAL PAPER COMPANY
(Unaudited)
(In millions, except per share amounts)
| | | | Three Months Ended
March 31, | Three Months Ended
March 31, |
| | 2018 | | 2017 | 2019 | | 2018 |
| Net Sales | $ | 5,621 |
| | $ | 5,132 |
| $ | 5,643 |
| | $ | 5,621 |
|
| Costs and Expenses | | | | | | |
| Cost of products sold | 3,948 |
| | 3,638 |
| 3,929 |
| | 3,948 |
|
| Selling and administrative expenses | 421 |
| | 393 |
| 413 |
| | 421 |
|
| Depreciation, amortization and cost of timber harvested | 325 |
| | 320 |
| 315 |
| | 325 |
|
| Distribution expenses | 366 |
| | 348 |
| 389 |
| | 366 |
|
| Taxes other than payroll and income taxes | 44 |
| | 42 |
| 43 |
| | 44 |
|
| Restructuring and other charges | 22 |
| | — |
| |
| Net bargain purchase gain on acquisition of business | — |
| | (6 | ) | |
| Restructuring and other charges, net | | — |
| | 22 |
|
| Net (gains) losses on sales and impairments of businesses | | (7 | ) | | — |
|
| Interest expense, net | 135 |
| | 142 |
| 133 |
| | 135 |
|
| Non-operating pension expense | 4 |
| | 38 |
| 10 |
| | 4 |
|
| Earnings (Loss) From Continuing Operations Before Income Taxes and Equity Earnings | 356 |
| | 217 |
| 418 |
| | 356 |
|
| Income tax provision (benefit) | 89 |
| | 73 |
| 106 |
| | 89 |
|
| Equity earnings (loss), net of taxes | 95 |
| | 48 |
| 114 |
| | 95 |
|
| Earnings (Loss) From Continuing Operations | 362 |
| | 192 |
| 426 |
| | 362 |
|
| Discontinued operations, net of taxes | 368 |
| | 17 |
| — |
| | 368 |
|
| Net Earnings (Loss) | 730 |
| | 209 |
| 426 |
| | 730 |
|
| Less: Net earnings (loss) attributable to noncontrolling interests | 1 |
| | — |
| 2 |
| | 1 |
|
| Net Earnings (Loss) Attributable to International Paper Company | $ | 729 |
| | $ | 209 |
| $ | 424 |
| | $ | 729 |
|
| Basic Earnings (Loss) Per Share Attributable to International Paper Company Common Shareholders | | | | | | |
| Earnings (loss) from continuing operations | $ | 0.87 |
| | $ | 0.47 |
| $ | 1.06 |
| | $ | 0.87 |
|
| Discontinued operations, net of taxes | 0.89 |
| | 0.04 |
| — |
| | 0.89 |
|
| Net earnings (loss) | $ | 1.76 |
| | $ | 0.51 |
| $ | 1.06 |
| | $ | 1.76 |
|
| Diluted Earnings (Loss) Per Share Attributable to International Paper Company Common Shareholders | | | | | | |
| Earnings (loss) from continuing operations | $ | 0.86 |
| | $ | 0.46 |
| $ | 1.05 |
| | $ | 0.86 |
|
| Discontinued operations, net of taxes | 0.88 |
| | 0.04 |
| — |
| | 0.88 |
|
| Net earnings (loss) | $ | 1.74 |
| | $ | 0.50 |
| $ | 1.05 |
| | $ | 1.74 |
|
| Average Shares of Common Stock Outstanding – assuming dilution | 418.2 |
| | 416.0 |
| 403.2 |
| | 418.2 |
|
| Cash Dividends Per Common Share | $ | 0.4750 |
| | $ | 0.4625 |
| $ | 0.5000 |
| | $ | 0.4750 |
|
| Amounts Attributable to International Paper Company Common Shareholders | | | | | | |
| Earnings (loss) from continuing operations | $ | 361 |
| | $ | 192 |
| $ | 424 |
| | $ | 361 |
|
| Discontinued operations, net of taxes | 368 |
| | 17 |
| — |
| | 368 |
|
| Net earnings (loss) | $ | 729 |
| | $ | 209 |
| $ | 424 |
| | $ | 729 |
|
The accompanying notes are an integral part of these condensed financial statements.
INTERNATIONAL PAPER COMPANY
(Unaudited)
(In millions)
| | | | Three Months Ended
March 31, | Three Months Ended
March 31, |
| | 2018 | | 2017 | 2019 | | 2018 |
| Net Earnings (Loss) | $ | 730 |
| | $ | 209 |
| $ | 426 |
| | $ | 730 |
|
| Other Comprehensive Income (Loss), Net of Tax: | | | | | | |
| Amortization of pension and post-retirement prior service costs and net loss: | | | | | | |
| U.S. plans | 66 |
| | 57 |
| 41 |
| | 66 |
|
| Pension and postretirement liability adjustments: | | | | |
| Non-U.S. plans | — |
| | (1 | ) | |
| Change in cumulative foreign currency translation adjustment | 42 |
| | 148 |
| 12 |
| | 42 |
|
| Net gains/losses on cash flow hedging derivatives: | | | | | | |
| Net gains (losses) arising during the period | (3 | ) | | 9 |
| — |
| | (3 | ) |
| Reclassification adjustment for (gains) losses included in net earnings (loss) | (2 | ) | | (2 | ) | 1 |
| | (2 | ) |
| Total Other Comprehensive Income (Loss), Net of Tax | 103 |
| | 211 |
| 54 |
| | 103 |
|
| Comprehensive Income (Loss) | 833 |
| | 420 |
| 480 |
| | 833 |
|
| Net (earnings) loss attributable to noncontrolling interests | (1 | ) | | — |
| (2 | ) | | (1 | ) |
| Other comprehensive (income) loss attributable to noncontrolling interests | — |
| | (1 | ) | — |
| | — |
|
| Comprehensive Income (Loss) Attributable to International Paper Company | $ | 832 |
| | $ | 419 |
| $ | 478 |
| | $ | 832 |
|
The accompanying notes are an integral part of these condensed financial statements.
INTERNATIONAL PAPER COMPANY
| | | | March 31,
2018 | | December 31,
2017 | March 31,
2019 | | December 31,
2018 |
| | (unaudited) | | | (unaudited) | | |
| Assets | | | | | | |
| Current Assets | | | | | | |
| Cash and temporary investments | $ | 1,141 |
| | $ | 1,018 |
| $ | 641 |
| | $ | 589 |
|
| Accounts and notes receivable, net | 3,416 |
| | 3,287 |
| 3,493 |
| | 3,521 |
|
| Contract assets | 388 |
| | — |
| 410 |
| | 395 |
|
| Inventories | 2,057 |
| | 2,313 |
| 2,301 |
| | 2,241 |
|
| Assets held for sale | — |
| | 1,377 |
| |
| Other current assets | 258 |
| | 282 |
| 217 |
| | 250 |
|
| Total Current Assets | 7,260 |
| | 8,277 |
| 7,062 |
| | 6,996 |
|
| Plants, Properties and Equipment, net | 13,335 |
| | 13,265 |
| 13,071 |
| | 13,067 |
|
| Forestlands | 453 |
| | 448 |
| 401 |
| | 402 |
|
| Investments | 1,490 |
| | 390 |
| 1,770 |
| | 1,648 |
|
| Financial Assets of Special Purpose Entities (Note 15) | 7,056 |
| | 7,051 |
| 7,074 |
| | 7,070 |
|
| Goodwill | 3,414 |
| | 3,411 |
| 3,393 |
| | 3,374 |
|
| Right of Use Assets | | 415 |
| | — |
|
| Deferred Charges and Other Assets | 1,022 |
| | 1,061 |
| 992 |
| | 1,019 |
|
| Total Assets | $ | 34,030 |
| | $ | 33,903 |
| $ | 34,178 |
| | $ | 33,576 |
|
| Liabilities and Equity | | | | | | |
| Current Liabilities | | | | | | |
| Notes payable and current maturities of long-term debt | $ | 587 |
| | $ | 311 |
| $ | 809 |
| | $ | 639 |
|
| Accounts payable | 2,534 |
| | 2,458 |
| 2,518 |
| | 2,413 |
|
| Accrued payroll and benefits | 352 |
| | 485 |
| 354 |
| | 535 |
|
| Liabilities held for sale | — |
| | 805 |
| |
| Other accrued liabilities | 992 |
| | 1,043 |
| |
| Other current liabilities | | 1,272 |
| | 1,107 |
|
| Total Current Liabilities | 4,465 |
| | 5,102 |
| 4,953 |
| | 4,694 |
|
| Long-Term Debt | 10,759 |
| | 10,846 |
| 9,965 |
| | 10,015 |
|
| Nonrecourse Financial Liabilities of Special Purpose Entities (Note 15) | 6,293 |
| | 6,291 |
| 6,300 |
| | 6,298 |
|
| Deferred Income Taxes | 2,480 |
| | 2,291 |
| 2,634 |
| | 2,600 |
|
| Pension Benefit Obligation | 1,893 |
| | 1,939 |
| 1,727 |
| | 1,762 |
|
| Postretirement and Postemployment Benefit Obligation | 317 |
| | 326 |
| 260 |
| | 264 |
|
| Long-term Lease Obligations | | 281 |
| | — |
|
| Other Liabilities | 558 |
| | 567 |
| 589 |
| | 560 |
|
| Equity | | | | | | |
| Common stock, $1 par value, 2018 – 448.9 shares and 2017 – 448.9 shares | 449 |
| | 449 |
| |
| Common stock, $1 par value, 2019 – 448.9 shares and 2018 – 448.9 shares | | 449 |
| | 449 |
|
| Paid-in capital | 6,175 |
| | 6,206 |
| 6,159 |
| | 6,280 |
|
| Retained earnings | 6,783 |
| | 6,180 |
| 8,211 |
| | 7,465 |
|
| Accumulated other comprehensive loss | (4,530 | ) | | (4,633 | ) | (4,975 | ) | | (4,500 | ) |
| | 8,877 |
| | 8,202 |
| 9,844 |
| | 9,694 |
|
| Less: Common stock held in treasury, at cost, 2018 – 34.8 shares and 2017 – 36.0 shares | 1,632 |
| | 1,680 |
| |
| Less: Common stock held in treasury, at cost, 2019 – 49.9 shares and 2018 – 48.3 shares | | 2,398 |
| | 2,332 |
|
| Total International Paper Shareholders’ Equity | 7,245 |
| | 6,522 |
| 7,446 |
| | 7,362 |
|
| Noncontrolling interests | 20 |
| | 19 |
| 23 |
| | 21 |
|
| Total Equity | 7,265 |
| | 6,541 |
| 7,469 |
| | 7,383 |
|
| Total Liabilities and Equity | $ | 34,030 |
| | $ | 33,903 |
| $ | 34,178 |
| | $ | 33,576 |
|
The accompanying notes are an integral part of these condensed financial statements.
INTERNATIONAL PAPER COMPANY
(Unaudited)
(In millions)
| | | | Three Months Ended
March 31, | Three Months Ended
March 31, |
| | 2018 | | 2017 | 2019 | | 2018 |
| Operating Activities | | | | | | |
| Net earnings (loss) | $ | 730 |
| | $ | 209 |
| $ | 426 |
| | $ | 730 |
|
| Depreciation, amortization and cost of timber harvested | 325 |
| | 345 |
| 315 |
| | 325 |
|
| Deferred income tax provision (benefit), net | 157 |
| | 7 |
| 22 |
| | 157 |
|
| Restructuring and other charges | 22 |
| | — |
| |
| Net gain on transfer of North American Consumer Packaging business to Graphic Packaging | (516 | ) | | — |
| |
| Net bargain purchase gain on acquisition of business | — |
| | (6 | ) | |
| Ilim dividends received | 116 |
| | 127 |
| |
| Equity (earnings) loss, net | (95 | ) | | (48 | ) | |
| Restructuring and other charges, net | | — |
| | 22 |
|
| Net gain on transfer of North American Consumer Packaging business | | — |
| | (516 | ) |
| Net (gains) losses on sales and impairments of businesses | | (7 | ) | | — |
|
| Equity method dividends received | | 6 |
| | 116 |
|
| Equity (earnings) losses, net | | (114 | ) | | (95 | ) |
| Periodic pension expense, net | 42 |
| | 78 |
| 26 |
| | 42 |
|
| Other, net | 14 |
| | 45 |
| 46 |
| | 14 |
|
| Changes in current assets and liabilities | | | | | | |
| Accounts and notes receivable | (122 | ) | | (57 | ) | 26 |
| | (122 | ) |
| Contract assets | (22 | ) | | — |
| (15 | ) | | (22 | ) |
| Inventories | 21 |
| | (15 | ) | (22 | ) | | 21 |
|
| Accounts payable and accrued liabilities | 11 |
| | 22 |
| 34 |
| | 11 |
|
| Interest payable | (34 | ) | | (18 | ) | (25 | ) | | (34 | ) |
| Other | 14 |
| | (56 | ) | 15 |
| | 14 |
|
| Cash Provided By (Used For) Operations | 663 |
| | 633 |
| 733 |
| | 663 |
|
| Investment Activities | | | | | | |
| Invested in capital projects | (489 | ) | | (374 | ) | (293 | ) | | (489 | ) |
| Acquisitions, net of cash acquired | | (17 | ) | | — |
|
| Net settlement on transfer of North American Consumer Packaging business | | — |
| | 1 |
|
| Proceeds from divestitures, net of cash divested | 1 |
| | — |
| 17 |
| | — |
|
| Proceeds from sale of fixed assets | 1 |
| | 1 |
| 3 |
| | 1 |
|
| Other | (2 | ) | | (27 | ) | (4 | ) | | (2 | ) |
| Cash Provided By (Used For) Investment Activities | (489 | ) | | (400 | ) | (294 | ) | | (489 | ) |
| Financing Activities | | | | | | |
| Repurchases of common stock and payments of restricted stock tax withholding | (31 | ) | | (46 | ) | (229 | ) | | (31 | ) |
| Issuance of debt | 223 |
| | 186 |
| 208 |
| | 223 |
|
| Reduction of debt | (34 | ) | | (227 | ) | (142 | ) | | (34 | ) |
| Change in book overdrafts | (17 | ) | | (6 | ) | (25 | ) | | (17 | ) |
| Dividends paid | (197 | ) | | (191 | ) | (201 | ) | | (197 | ) |
| Cash Provided By (Used For) Financing Activities | (56 | ) | | (284 | ) | (389 | ) | | (56 | ) |
| Effect of Exchange Rate Changes on Cash | 5 |
| | 16 |
| 2 |
| | 5 |
|
| Change in Cash and Temporary Investments | 123 |
| | (35 | ) | 52 |
| | 123 |
|
| Cash and Temporary Investments | | | | | | |
| Beginning of period | 1,018 |
| | 1,033 |
| 589 |
| | 1,018 |
|
| End of period | $ | 1,141 |
| | $ | 998 |
| $ | 641 |
| | $ | 1,141 |
|
The accompanying notes are an integral part of these condensed financial statements.
INTERNATIONAL PAPER COMPANY
(Unaudited)
The accompanying unaudited condensed financial statements have been prepared in conformity with accounting principles generally accepted in the United States and in accordance with the instructions to Form 10-Q and, in the opinion of management, include all adjustments that are necessary for the fair presentation of International Paper Company’s (International Paper’s, the Company’s or our) financial position, results of operations, and cash flows for the interim periods presented. Except as disclosed herein, such adjustments are of a normal, recurring nature. Results for the first three months of the year may not necessarily be indicative of full year results. It is suggested that these condensed financial statements be read in conjunction with the audited financial statements and the notes thereto included in the Company’s Annual Report on Form 10-K for the year ended December 31, 2017,2018, which have previously been filed with the Securities and Exchange Commission.
Intangibles
In August 2018, the FASB issued ASU 2018-15, "Intangibles - Goodwill and Other - Internal-Use Software (Subtopic 350-40): Customer's Accounting for Implementation Costs Incurred in a Cloud Computing Arrangement That Is a Service Contract." The guidance aligns the requirements for capitalizing implementation costs incurred in a hosting arrangement that is a service contract with the requirements for capitalizing implementation costs incurred to develop or obtain internal-use software (and hosting arrangements that include an internal use software license). The accounting for the service element of a hosting arrangement that is a service contract is not affected by the amendments in this guidance. This guidance is effective for annual reporting periods beginning after December 15, 2019, and interim periods within those fiscal years. Early adoption is permitted. The Company is currently evaluating the provisions of this guidance.
In January 2017, the FASB issued ASU 2017-04, "Intangibles - Goodwill and Other (Topic 350): Simplifying the Test for Goodwill Impairment." This guidance eliminates the requirement to calculate the implied fair value of goodwill under Step 2 of today's goodwill impairment test to measure a goodwill impairment charge. Instead, entities will record an impairment charge based on the excess of a reporting unit's carrying amount over its fair value. This guidance should be applied prospectively and is effective for annual reporting periods beginning after December 15, 2019, for any impairment test performed in 2020. Early adoption is permitted for annual and interim goodwill impairment testing dates after January 1, 2017. The Company is currently evaluating the provisions of this guidance; however, we do not anticipate adoption having a material impact on the financial statements.
Comprehensive Income
In February 2018, the FASB issued ASU 2018-02, "Income Statement - Reporting Comprehensive Income (Topic 220): Reclassification of Certain Tax Effects from Accumulated Other Comprehensive Income." This guidance gives entities the option to reclassify stranded tax effects caused by the newly-enacted U.S. Tax Cuts and Jobs Act from accumulated other comprehensive income to retained earnings. As a result, the Company adopted this guidance effective January 1, 2019, and recorded a net increase to opening Retained earnings and a decrease to opening Accumulated other comprehensive income of $529 million, due to the cumulative impact of adopting the new guidance.
Financial Instruments - Credit Losses
In June 2016, the FASB issued ASU 2016-13, "Financial Instruments - Credit Losses (Topic 326): Measurement of Credit Losses on Financial Instruments." This guidance replaces the current incurred loss impairment method with a method that reflects expected credit losses. This guidance is effective for annual reporting periods beginning after December 15, 2018, and2019, including interim periods within those fiscal years. Early adoption is permitted. This guidance should be applied using the modified-retrospective approach. The Company is currently evaluating the provisions of this guidance.
Derivativesguidance and Hedging
In August 2017, the FASB issued ASU 2017-12, "Derivatives and Hedging (Topic 815): Targeted Improvementsplans to Accounting for Hedging Activities." The objective of this new guidance is the improvement of the financial reporting of hedging relationships to better portray the economic results of an entity’s risk management activities in its financial statements. In addition to that main objective, the amendments inadopt this guidance make certain targeted improvements to simplifyand the applicationrelated amendments on its effective date of the hedge accounting guidance in current GAAP. This guidance is effective for annual reporting periods beginning after December 15, 2018, and interim periods within those years. Early adoption is permitted. The Company early adopted the provisions of this guidance on January 1, 2018, with no material impact on2020, by recognizing the financial statements.
Retirement Benefits
The Company adopted the provisioncumulative effect of ASU 2017-07, "Compensation - Retirement Benefits (Topic 715): Improving the Presentation of Net Periodic Pension Cost and Net Periodic Postretirement Benefit Cost" on January 1, 2018. Under this new guidance, employers present the service costs component of the net periodic benefit cost in the same income statement line item(s) as other employee compensation costs arising from services rendered during the period. In addition, only the service cost component is eligible for capitalization in assets. Employers present the other components separately from the line items(s) that includes the service cost and outside of any subtotal of operating income. In addition, disclosure of the line(s) used to present the other components of net periodic benefit cost are required if the components are not presented separately in the income statement. The following table details the impact of the retrospective adoption of this standard on 2017 first quarter amounts reported in the accompanying condensed consolidated statement of operations and on full-year amounts for 2017, 2016 and 2015 reported in in the Company's 2017 Form 10-K. The retrospective adoption had no impact on Net earnings (loss).
|
| | | | | | | | | | | | |
| Condensed Consolidated Statement of Operations |
| | | Three Months Ended March 31, 2017 |
| In millions | | Previously Reported | | Impact of Adoption Increase/(Decrease) | | As Revised |
| Cost of products sold | | $ | 3,669 |
| | $ | (31 | ) | | $ | 3,638 |
|
| Selling and administrative expenses | | 400 |
| | (7 | ) | | 393 |
|
| Non-operating pension expense | | — |
| | 38 |
| | 38 |
|
| | | | | | | |
| | | Year Ended December 31, 2017 |
| In millions | | Previously Reported | | Impact of Adoption Increase/(Decrease) | | As Revised |
| Cost of products sold | | $ | 15,300 |
| | $ | (499 | ) | | $ | 14,801 |
|
| Selling and administrative expenses | | 1,653 |
| | (32 | ) | | 1,621 |
|
| Non-operating pension expense | | — |
| | 531 |
| | 531 |
|
| | | | | | | |
| | | Year Ended December 31, 2016 |
| In millions | | Previously Reported | | Impact of Adoption Increase/(Decrease) | | As Revised |
| Cost of products sold | | $ | 14,057 |
| | $ | (639 | ) | | $ | 13,418 |
|
| Selling and administrative expenses | | 1,484 |
| | (26 | ) | | 1,458 |
|
| Non-operating pension expense | | — |
| | 665 |
| | 665 |
|
| | | | | | | |
| | | Year Ended December 31, 2015 |
| In millions | | Previously Reported | | Impact of Adoption Increase/(Decrease) | | As Revised |
| Cost of products sold | | $ | 14,313 |
| | $ | (270 | ) | | $ | 14,043 |
|
| Selling and administrative expenses | | 1,539 |
| | (43 | ) | | 1,496 |
|
| Non-operating pension expense | | — |
| | 313 |
| | 313 |
|
Business Combinations
In January 2017, the FASB issued ASU 2017-01, "Business Combinations (Topic 805): Clarifying the Definition of a Business." Underinitially applying the new guidance,standard as an entity must first determine whether substantially all of the fair value of the gross assets acquired is concentrated in a single identifiable asset or a group of similar identifiable assets. If this threshold is met, the set of transferred assets and activities is not a business. If this threshold is not met, the entity then evaluates whether the set meets the requirement that a business include, at a minimum, an input and a substantive process that together significantly contributeadjustment to the ability to create outputs. This guidance was effective for annual reporting periods beginning after December 15, 2017, and interim periods within those years. The Company adopted the provisionsopening balance of this guidance on January 1, 2018 with no material impact on the financial statements.
Income Taxes
In October 2016, the FASB issued ASU 2016-16, "Income Taxes (Topic 740): Intra-Entity Transfers of Assets Other Than Inventory." This ASU requires companies to recognize the income tax effects of intercompany sales and transfers of assets other than inventory in the period in which the transfer occurs rather than defer the income tax effects which is current practice. This new guidance was effective for annual reporting periods beginning after December 15, 2017, and interim periods within those years. The guidance requires companies to apply a modified retrospective approach with a cumulative catch-up adjustment to opening retained earnings in the period of adoption. The Company adopted the provisions of this guidance on January 1, 2018, with no material impact on the financial statements.
Stock Compensation
In May 2017, the FASB issued ASU 2017-09, "Compensation - Stock Compensation (Topic 718): Scope of Modification Accounting." This guidance clarifies when changes to the terms or conditions of a share-based payment award must be accounted for as modifications. Under this guidance, entities will apply the modification accounting guidance if the value, vesting conditions or classification of the award changes. This guidance was effective for annual reporting periods beginning after December 15, 2017, and interim periods within those years. The Company adopted the provisions of this guidance on January 1, 2018, with no material impact on the financial statements.Retained earnings.
Leases
In February 2016, the FASB issued ASU 2016-02, "Leases Topic (842): Leases.(Topic 842)." This ASU will require most leases to be recognized on the balance sheet which will increase reported assets and liabilities. Lessor accounting will remain substantially similar to current U.S. GAAP. This ASU is effective for annual reporting periods beginning after December 15, 2018, and interim periods within those years, and mandates a modified retrospective transition method for all entities. The Company expects to adopt this guidance using a modified retrospective transition approach for leases existing at, or entered into after, the beginning of the earliest comparative period presented in the financial statements. We expect to recognize a liability and corresponding asset associated with in-scope operating and finance leases but are still in the process of determining those amounts and the processes required to account for leasing activity on an ongoing basis.
The Company has formed a global implementation team, including representatives from accounting, tax, legal, global sourcing, information technology, policies and controls and operations. Surveys were developed and utilized to gather initial information regarding existing leases and the various processes that currently exist to procure, track and account for leases globally. The implementation team has selected and began working with a third-party vendor to implement a lease accounting solution to deliver the accounting and disclosures required under the new lease accounting guidance.
Revenue Recognition
On January 1, 2018, the Company adopted the new revenue recognition standard ASC 606, "Revenue from Contracts With Customers," (new revenue standard) and all related amendments,provisions of this guidance effective January 1, 2019, using the modified retrospective optional transition method. We recognizedTherefore, the cumulative effectstandard was applied
beginning January 1, 2019 and prior periods were not restated. The adoption of initially applying the new revenue standard as andid not result in a cumulative-effect adjustment to the opening balance of Retained earnings. The comparativeCompany elected the package of practical expedients and implemented internal controls and system functionality to enable the preparation of financial information has not been restated and continues to be reported under the accounting standards in effect for those periods.
upon adoption.
The Company recorded a net increase to opening Retained earningsadoption of $73 million as of January 1, 2018, due to the cumulative impact of adopting the new revenue standard withresulted in the impact primarilyrecognition of a right of use asset and short-term and long-term liabilities recorded on the Company's consolidated balance sheet related to our customized products. The impacts ofoperating leases. Accounting for finance leases remained substantially unchanged. In addition, the adoption of the new revenue standard did not have a material impact on the Company's condensed consolidated financial statements were as follows:results of operations or cash flows.
|
| | | | | | | | | | | | |
| Condensed Consolidated Statement of Operations |
| | | Three Months Ended March 31, 2018 |
| In millions | | As Reported | | Balances Without Adoption of ASC 606 | | Impact of Adoption Increase/(Decrease) |
| Net sales | | $ | 5,621 |
| | $ | 5,599 |
| | $ | 22 |
|
| Cost of products sold | | 3,948 |
| | 3,932 |
| | 16 |
|
| Distribution expenses | | 366 |
| | 367 |
| | (1 | ) |
| Income tax provision (benefit), net | | 89 |
| | 87 |
| | 2 |
|
| Earnings (loss) from continuing operations | | 362 |
| | 357 |
| | 5 |
|
| Net earnings (loss) | | 730 |
| | 725 |
| | 5 |
|
| Earnings per share attributable to International Paper Company Shareholders | | | | | | |
| Basic | | $ | 1.76 |
| | $ | 1.75 |
| | $ | 0.01 |
|
| Diluted | | 1.74 |
| | 1.73 |
| | 0.01 |
|
| | | | | | | |
| Condensed Consolidated Balance Sheet |
| | | March 31, 2018 |
| In millions | | As Reported | | Balances Without Adoption of ASC 606 | | Impact of Adoption Increase/(Decrease) |
| Contract assets | | $ | 388 |
| | $ | — |
| | $ | 388 |
|
| Inventories | | 2,057 |
| | 2,324 |
| | (267 | ) |
| Other current assets | | 258 |
| | 274 |
| | (16 | ) |
| Other accrued liabilities | | 992 |
| | 975 |
| | 17 |
|
| Deferred income taxes | | 2,480 |
| | 2,470 |
| | 10 |
|
| Retained earnings | | 6,783 |
| | 6,705 |
| | 78 |
|
| | | | | | | |
| Condensed Consolidated Statement of Cash Flows |
| | | Three Months Ended March 31, 2018 |
| In millions | | As Reported | | Balances Without Adoption of ASC 606 | | Impact of Adoption Increase/(Decrease) |
| Net earnings (loss) | | $ | 730 |
| | $ | 725 |
| | $ | 5 |
|
| Deferred income tax provision (benefit), net | | 157 |
| | 171 |
| | (14 | ) |
| Contract assets | | (22 | ) | | — |
| | (22 | ) |
| Inventories | | 21 |
| | 5 |
| | 16 |
|
| Accounts payable and accrued liabilities | | 11 |
| | 12 |
| | (1 | ) |
| Other | | 14 |
| | (2 | ) | | 16 |
|
Historically,Generally, the Company has recognized all of itsrecognizes revenue on a point-in-time basis across its businesses. The trigger for International Paper's point-in-time recognition is when the customer takes title to the goods and assumes the risks and rewards for the goods. As such, the adoption of ASC 606 did not have a material impact on the Company's revenue recognition for point-in-time goods. However, across the majority of our businesses, there are certain goods designed to customers' unique specifications, including customer logos and labels (customized goods). Due to the manually intensive process and significant costs that would be required to rework these products, and in many cases contractual restrictions, the Company has determined that these products do not have an alternative future use under ASC 606.
The majority of theFor customized goods discussed above are covered by non-cancelable purchase orders or customer agreements and the Company has determined that in most cases, it does have an enforceable right to payment for these goods. As such, the Company's adoption of ASC 606 resulted in the acceleration of revenue for customized products without an alternative future use and where the Company has a legally enforceable right to payment for production of products completed to date. Thethe goods, the Company now records a contract asset forrecognizes revenue recognized on our customized products prior to having an unconditional right to payment from the customer,over time which, generally, does not occur until title and risk of loss foris as the products passes to the customer.
Due to the recurring nature of our sales of these customized goods the impact of adopting ASC 606 is not expected to have a material impact on our operations or our cash flows in any period.
Disaggregated Revenue
A geographic disaggregation of revenues across our company segmentation in the following table providestables provide information to assist in evaluating the nature, timing and uncertainty of revenue and cash flows and how they may be impacted by economic factors.
| | | | | Three Months Ended March 31, 2018 | | Three Months Ended
March 31, 2019 |
| In millions | | Industrial Packaging | | Global Cellulose Fibers | | Printing Papers | | Corporate and Inter-segment Sales | | Total | | Industrial Packaging | | Global Cellulose Fibers | | Printing Papers | | Corporate and Inter-segment Sales | | Total |
| Primary Geographical Markets (a) | | | | | | | | | | | | | | | | | | | | |
| United States | | $ | 3,102 |
| | $ | 545 |
| | $ | 440 |
| | $ | 58 |
| | $ | 4,145 |
| | $ | 3,146 |
| | $ | 570 |
| | $ | 488 |
| | $ | 60 |
| | $ | 4,264 |
|
| EMEA | | 452 |
| | 75 |
| | 336 |
| | (5 | ) | | 858 |
| | 428 |
| | 81 |
| | 330 |
| | (2 | ) | | 837 |
|
| Pacific Rim and Asia | | 34 |
| | 57 |
| | 64 |
| | 16 |
| | 171 |
| | 18 |
| | 38 |
| | 59 |
| | 4 |
| | 119 |
|
| Americas, other than U.S. | | 239 |
| | — |
| | 213 |
| | (5 | ) | | 447 |
| | 240 |
| | — |
| | 188 |
| | (5 | ) | | 423 |
|
| Total | | $ | 3,827 |
| | $ | 677 |
| | $ | 1,053 |
| | $ | 64 |
| | $ | 5,621 |
| | $ | 3,832 |
| | $ | 689 |
| | $ | 1,065 |
| | $ | 57 |
| | $ | 5,643 |
|
| | | | | | | | | | | | | | | | | | | | | |
| Operating Segments | | | | | | | | | | | | | | | | | | | | |
| North American Industrial Packaging | | $ | 3,369 |
| | $ | — |
| | $ | — |
| | $ | — |
| | $ | 3,369 |
| | $ | 3,376 |
| | $ | — |
| | $ | — |
| | $ | — |
| | $ | 3,376 |
|
| EMEA Industrial Packaging | | 362 |
| | — |
| | — |
| | — |
| | 362 |
| | 339 |
| | — |
| | — |
| | — |
| | 339 |
|
| Brazilian Industrial Packaging | | 62 |
| | — |
| | — |
| | — |
| | 62 |
| | 57 |
| | — |
| | — |
| | — |
| | 57 |
|
| European Coated Paperboard | | 92 |
| | — |
| | — |
| | — |
| | 92 |
| | 91 |
| | — |
| | — |
| | — |
| | 91 |
|
| Global Cellulose Fibers | | — |
| | 677 |
| | — |
| | — |
| | 677 |
| | — |
| | 689 |
| | — |
| | — |
| | 689 |
|
| North American Printing Papers | | — |
| | — |
| | 458 |
| | — |
| | 458 |
| | — |
| | — |
| | 496 |
| | — |
| | 496 |
|
| Brazilian Papers | | — |
| | — |
| | 229 |
| | — |
| | 229 |
| | — |
| | — |
| | 215 |
| | — |
| | 215 |
|
| European Papers | | — |
| | — |
| | 319 |
| | — |
| | 319 |
| | — |
| | — |
| | 309 |
| | — |
| | 309 |
|
| Indian Papers | | — |
| | — |
| | 52 |
| | — |
| | 52 |
| | — |
| | — |
| | 53 |
| | — |
| | 53 |
|
| Intra-segment Eliminations | | (58 | ) | | — |
| | (5 | ) | | — |
| | (63 | ) | | (31 | ) | | — |
| | (8 | ) | | — |
| | (39 | ) |
| Corporate & Inter-segment Sales | | — |
| | — |
| | — |
| | 64 |
| | 64 |
| | — |
| | — |
| | — |
| | 57 |
| | 57 |
|
| Total | | $ | 3,827 |
| | $ | 677 |
| | $ | 1,053 |
| | $ | 64 |
| | $ | 5,621 |
| | $ | 3,832 |
| | $ | 689 |
| | $ | 1,065 |
| | $ | 57 |
| | $ | 5,643 |
|
(a) Net sales are attributed to countries based on the location of the seller.
The nature of the Company's contracts can vary
|
| | | | | | | | | | | | | | | | | | | | |
| | | Three Months Ended March 31, 2018 |
| In millions | | Industrial Packaging | | Global Cellulose Fibers | | Printing Papers | | Corporate & Intersegment | | Total |
Primary Geographical Markets (a) | | | | | | | | | | |
| United States | | $ | 3,102 |
| | $ | 545 |
| | $ | 440 |
| | $ | 58 |
| | $ | 4,145 |
|
| EMEA | | 452 |
| | 75 |
| | 336 |
| | (5 | ) | | 858 |
|
| Pacific Rim and Asia | | 34 |
| | 57 |
| | 64 |
| | 16 |
| | 171 |
|
| Americas, other than U.S. | | 239 |
| | — |
| | 213 |
| | (5 | ) | | 447 |
|
| Total | | $ | 3,827 |
| | $ | 677 |
| | $ | 1,053 |
| | $ | 64 |
| | $ | 5,621 |
|
| | | | | | | | | | | |
| Operating Segments | | | | | | | | | | |
| North American Industrial Packaging | | $ | 3,369 |
| | $ | — |
| | $ | — |
| | $ | — |
| | $ | 3,369 |
|
| EMEA Industrial Packaging | | 362 |
| | — |
| | — |
| | — |
| | 362 |
|
| Brazilian Industrial Packaging | | 62 |
| | — |
| | — |
| | — |
| | 62 |
|
| European Coated Paperboard | | 92 |
| | — |
| | — |
| | — |
| | 92 |
|
| Global Cellulose Fibers | | — |
| | 677 |
| | — |
| | — |
| | 677 |
|
| North American Printing Papers | | — |
| | — |
| | 458 |
| | — |
| | 458 |
|
| Brazilian Papers | | — |
| | — |
| | 229 |
| | — |
| | 229 |
|
| European Papers | | — |
| | — |
| | 319 |
| | — |
| | 319 |
|
| Indian Papers | | — |
| | — |
| | 52 |
| | — |
| | 52 |
|
| Intra-segment Eliminations | | (58 | ) | | — |
| | (5 | ) | | — |
| | (63 | ) |
| Corporate & Inter-segment Sales | | — |
| | — |
| | — |
| | 64 |
| | 64 |
|
| Total | | $ | 3,827 |
| | $ | 677 |
| | $ | 1,053 |
| | $ | 64 |
| | $ | 5,621 |
|
(a) Net sales are attributed to countries based on the business, customer type and region; however, in all instances it is International Paper's customary business practice to receive a valid order fromlocation of the customer, in which each parties' rights and related payment terms are clearly identifiable.seller.
Revenue Contract Balances
The opening and closing balances of the Company's contract assets and current contract liabilities are as follows:
| | | In millions | | Contract Assets (Short-Term) | | Contract Liabilities (Short-Term) | | Contract Assets (Short-Term) | | Contract Liabilities (Short-Term) |
| | | | | | |
| Beginning Balance - January 1, 2018 | | $ | 366 |
| | $ | 53 |
| |
| Ending Balance - March 31, 2018 | | 388 |
| | 38 |
| |
| Beginning Balance - January 1, 2019 | | | $ | 395 |
| | $ | 56 |
|
| Ending Balance - March 31, 2019 | | | 410 |
| | 53 |
|
| Increase / (Decrease) | | $ | 22 |
| | $ | (15 | ) | | $ | 15 |
| | $ | (3 | ) |
A contract asset is created when the Company recognizes revenue on its customized products prior to having an unconditional right to payment from the customer, which generally does not occur until title and risk of loss passes to the customer.
A contract liability is created when customers prepay for goods prior to the Company transferring those goods to the customer. The contract liability is reduced once control of the goods is transferred to the customer. The majority of our customer prepayments are received during the fourth quarter each year for goods that will be transferred to customers over the following twelve months. A contract asset is created when the Company recognizes revenue on its customized products prior to having an unconditional right to payment from the customer, which generally does not occur until title and risk of loss passes to the customer.
The difference between the opening and closing balances of the Company's contract assets and contract liabilities primarily results from the timing difference between the Company's performanceprice and the pointquantity at comparable points in time for goods for which we have an unconditional right to payment or receive pre-payment from the customer, respectively.
Performance Obligations and Significant Judgments
International Paper's principal business is to manufacture and sell fiber-based packaging, pulp and paper goods. As a general rule, none of our businesses provide equipment installation or other ancillary services outside producing and shipping packaging, pulp and paper goods to customers.
The Company's revenue is primarily derived from fixed consideration; however, we do have contract terms that give rise to variable consideration, primarily cash discounts and volume rebates. International Paper offers early payment discounts to customers across the Company's businesses. The Company estimates the expected cash discounts and other customer refunds based on the historical experience across the Company's portfolio of customers to record reductions in revenue which is consistent with the most likely amount method outlined in ASC 606. Management has concluded that this method is the best estimate of the consideration the Company will be entitled to from its customers.
Contracts or purchase orders with customers could include a single type of product or it could include multiple types/grades of products. Regardless, the contracted price with the customer is agreed to at the individual product level outlined in the customer contracts or purchase orders. The Company does not bundle prices; however, we do negotiate with customers on pricing and rebates for the same products based on a variety of factors (e.g. level of contractual volume, geographical location, etc.). Management has concluded that the prices negotiated with each individual customer are representative of the stand-alone selling price of the product.
Generally, the Company recognizes revenue on a point in time basis when the customer takes title to the goods and assumes the risks and rewards for the goods. Related to customized goods where the Company has a legally enforceable right to payment for the goods, the Company recognizes revenue over time which in this case, is generally as the goods are produced.
Practical Expedients and Exemptions
As part of our adoption of the new revenue standard, the Company has elected to present all sales taxes on a net basis, account for shipping and handling activities as fulfillment activities, recognize the incremental costs of obtaining a contract as expense when incurred if the amortization period of the asset the Company would recognize is one year or less and not record interest income or interest expense when the difference in timing of control transfer and customer payment is one year or less. The election of these practical expedients results in accounting treatments consistent with our historical accounting policies and therefore, these elections and expedients do not have a material impact on comparability of our financial statements.
A summary of the changes in equity for the three months ended March 31, 20182019 and 20172018 is provided below:
| | | | Three Months Ended
March 31, | |
| | 2018 | | 2017 | |
| Three Months Ended March 31, 2019 | | Three Months Ended March 31, 2019 |
| In millions, except per share amounts | Total International Paper Shareholders’ Equity | | Noncontrolling Interests | | Total Equity | | Total International Paper Shareholders’ Equity | | Noncontrolling Interests | | Total Equity | Common Stock Issued | | Paid-in Capital | | Retained Earnings | Accumulated Other Comprehensive Income (Loss) | | Treasury Stock | | Total International Paper Shareholders’ Equity | | Noncontrolling Interests | | Total Equity | |
| Balance, January 1 | $ | 6,522 |
| | $ | 19 |
| | $ | 6,541 |
| | $ | 4,341 |
| | $ | 18 |
| | $ | 4,359 |
| $ | 449 |
| | $ | 6,280 |
| | $ | 7,465 |
| $ | (4,500 | ) | | $ | 2,332 |
| | $ | 7,362 |
| | $ | 21 |
| | $ | 7,383 |
| |
| Adoption of ASC 606 revenue from contracts with customers | 73 |
| | — |
| | 73 |
| | — |
| | — |
| | — |
| |
| Adoption of ASU 2018-02 reclassification of stranded tax effects resulting from Tax Reform | | — |
| | — |
| | 529 |
| (529 | ) | | — |
| | — |
| | — |
| | — |
| |
| Issuance of stock for various plans, net | 38 |
| | — |
| | 38 |
| | 54 |
| | — |
| | 54 |
| — |
| | (118 | ) | | — |
| — |
| | (163 | ) | | 45 |
| | — |
| | 45 |
| |
| Repurchase of stock | (31 | ) | | — |
| | (31 | ) | | (46 | ) | | — |
| | (46 | ) | — |
| | — |
| | — |
| — |
| | 229 |
| | (229 | ) | | — |
| | (229 | ) | |
| Common stock dividends ($.4750 per share in 2018 and $.4625 per share in 2017) | (199 | ) | | — |
| | (199 | ) | | (195 | ) | | — |
| | (195 | ) | |
Common stock dividends ($.5000 per share) | | — |
| | — |
| | (207 | ) | — |
| | — |
| | (207 | ) | | — |
| | (207 | ) | |
| Transactions of equity method investees | 10 |
| | — |
| | 10 |
| | 2 |
| | — |
| | 2 |
| — |
| | (3 | ) | | — |
| — |
| | — |
| | (3 | ) | | — |
| | (3 | ) | |
| Comprehensive income (loss) | 832 |
| | 1 |
| | 833 |
| | 419 |
| | 1 |
| | 420 |
| — |
| | — |
| | 424 |
| 54 |
| | — |
| | 478 |
| | 2 |
| | 480 |
| |
| Ending Balance, March 31 | $ | 7,245 |
| | $ | 20 |
| | $ | 7,265 |
| | $ | 4,575 |
| | $ | 19 |
| | $ | 4,594 |
| $ | 449 |
| | $ | 6,159 |
| | $ | 8,211 |
| $ | (4,975 | ) | | $ | 2,398 |
| | $ | 7,446 |
| | $ | 23 |
| | $ | 7,469 |
| |
|
| | | | | | | | | | | | | | | | | | | | | | | | | | | | | | | |
| Three Months Ended March 31, 2018 |
| In millions, except per share amounts | Common Stock Issued | | Paid-in Capital | | Retained Earnings | Accumulated Other Comprehensive Income (Loss) | | Treasury Stock | | Total International Paper Shareholders’ Equity | | Noncontrolling Interests | | Total Equity | |
| Balance, January 1 | $ | 449 |
| | $ | 6,206 |
| | $ | 6,180 |
| $ | (4,633 | ) | | $ | 1,680 |
| | $ | 6,522 |
| | $ | 19 |
| | $ | 6,541 |
| |
| Adoption of ASC 606 revenue from contracts with customers | — |
| | — |
| | 73 |
| — |
| | — |
| | 73 |
| | — |
| | 73 |
| |
| Issuance of stock for various plans, net | — |
| | (41 | ) | | — |
| — |
| | (79 | ) | | 38 |
| | — |
| | 38 |
| |
| Repurchase of stock | — |
| | — |
| | — |
| — |
| | 31 |
| | (31 | ) | | — |
| | (31 | ) | |
| Common stock dividends ($.4750 per share) | — |
| | — |
| | (199 | ) | — |
| | — |
| | (199 | ) | | — |
| | (199 | ) | |
| Transactions of equity method investees | — |
| | 10 |
| | — |
| — |
| | — |
| | 10 |
| | — |
| | 10 |
| |
| Comprehensive income (loss) | — |
| | — |
| | 729 |
| 103 |
| | — |
| | 832 |
| | 1 |
| | 833 |
| |
| Ending Balance, March 31 | $ | 449 |
| | $ | 6,175 |
| | $ | 6,783 |
| $ | (4,530 | ) | | $ | 1,632 |
| | $ | 7,245 |
| | $ | 20 |
| | $ | 7,265 |
| |
The following table presents changes in accumulated other comprehensive income (AOCI) for the three-monthsthree months ended March 31, 20182019 and 2017:
2018:
| | | | | Three Months Ended
March 31, | | Three Months Ended
March 31, |
| In millions | | 2018 | | 2017 | | 2019 | | 2018 |
| Defined Benefit Pension and Postretirement Adjustments | | | | | | | | |
| Balance at beginning of period | | $ | (2,527 | ) | | $ | (3,072 | ) | | $ | (1,916 | ) | | $ | (2,527 | ) |
| Other comprehensive income (loss) before reclassifications | | — |
| | (1 | ) | |
| Reclassification of stranded tax effects | | | (527 | ) | | — |
|
| Amounts reclassified from accumulated other comprehensive income | | 66 |
| | 57 |
| | 41 |
| | 66 |
|
| Balance at end of period | | (2,461 | ) | | (3,016 | ) | | (2,402 | ) | | (2,461 | ) |
| Change in Cumulative Foreign Currency Translation Adjustments | | | | | | | | |
| Balance at beginning of period | | (2,111 | ) | | (2,287 | ) | | (2,581 | ) | | (2,111 | ) |
| Other comprehensive income (loss) before reclassifications | | 40 |
| | 148 |
| | 8 |
| | 40 |
|
| Amounts reclassified from accumulated other comprehensive income | | 2 |
| | — |
| | 4 |
| | 2 |
|
| Other comprehensive income (loss) attributable to noncontrolling interest | | — |
| | (1 | ) | | — |
| | — |
|
| Balance at end of period | | (2,069 | ) | | (2,140 | ) | | (2,569 | ) | | (2,069 | ) |
| Net Gains and Losses on Cash Flow Hedging Derivatives | | | | | | | | |
| Balance at beginning of period | | 5 |
| | (3 | ) | | (3 | ) | | 5 |
|
| Other comprehensive income (loss) before reclassifications | | (3 | ) | | 9 |
| | — |
| | (3 | ) |
| Reclassification of stranded tax effects | | | (2 | ) | | — |
|
| Amounts reclassified from accumulated other comprehensive income | | (2 | ) | | (2 | ) | | 1 |
| | (2 | ) |
| Balance at end of period | | — |
| | 4 |
| | (4 | ) | | — |
|
| Total Accumulated Other Comprehensive Income (Loss) at End of Period | | $ | (4,530 | ) | | $ | (5,152 | ) | | $ | (4,975 | ) | | $ | (4,530 | ) |
The following table presents details of the reclassifications out of AOCI for the three-monthsthree months ended March 31, 20182019 and 2017:
| | | In millions: | | Amounts Reclassified from Accumulated Other Comprehensive Income | | Location of Amount Reclassified from AOCI | | Amounts Reclassified from Accumulated Other Comprehensive Income | | Location of Amount Reclassified from AOCI |
| | Three Months Ended
March 31, | | | | Three Months Ended
March 31, | |
| | 2018 | | 2017 | | | 2019 | | 2018 | |
| Defined benefit pension and postretirement items: | | | | | | | | | | |
| Prior-service costs | | $ | (4 | ) | | $ | (6 | ) | | (a) | Non-operating pension expense | | $ | (3 | ) | | $ | (4 | ) | | (a) | Non-operating pension expense |
| Actuarial gains (losses) | | (84 | ) | | (87 | ) | | (a) | Non-operating pension expense | | (52 | ) | | (84 | ) | | (a) | Non-operating pension expense |
| Total pre-tax amount | | (88 | ) | | (93 | ) | | | (55 | ) | | (88 | ) | |
| Tax (expense) benefit | | 22 |
| | 36 |
| | | 14 |
| | 22 |
| |
| Net of tax | | (66 | ) | | (57 | ) | | | (41 | ) | | (66 | ) | |
| Reclassification of stranded tax effects | | | 527 |
| | — |
| |
| Retained Earnings |
| Total, net of tax | | | 486 |
| | (66 | ) | |
| | | | | | | | | | | |
| Change in cumulative foreign currency translation adjustments: | | | | | | | | | | |
| Business acquisitions/divestitures | | 2 |
| | — |
| | Discontinued operations, net of taxes | | (4 | ) | | (2 | ) | | (b) | Cost of products sold |
| Tax (expense) benefit | | — |
| | — |
| | | — |
| | — |
| |
| Net of tax | | 2 |
| | — |
| | | (4 | ) | | (2 | ) | |
| | | | | | | | | | | |
| Net gains and losses on cash flow hedging derivatives: | | | | | | | | | | |
| Foreign exchange contracts | | 3 |
| | 3 |
| | (b) | Cost of products sold | | (1 | ) | | 3 |
| | (c) | Cost of products sold |
| Total pre-tax amount | | 3 |
| | 3 |
| | | (1 | ) | | 3 |
| |
| Tax (expense)/benefit | | (1 | ) | | (1 | ) | | | — |
| | (1 | ) | |
| Net of tax | | 2 |
| | 2 |
| | | (1 | ) | | 2 |
| |
| Reclassification of stranded tax effects | | | 2 |
| | — |
| |
| Retained Earnings |
| Total, net of tax | | | 1 |
| | 2 |
| |
| Total reclassifications for the period | | $ | (62 | ) | | $ | (55 | ) | | | $ | 483 |
| | $ | (66 | ) | |
| |
| (a) | These accumulated other comprehensive income components are included in the computation of net periodic pension cost (see Note 18 for additional details). |
| |
| (b) | Amount for the three months ended March 31, 2018 was reclassified to Discontinued operations, net of taxes. |
| |
| (c) | This accumulated other comprehensive income component is included in our derivatives and hedging activities (see Note 17 for additional details). |
Basic earnings per common share areis computed by dividing earnings by the weighted average number of common shares outstanding. Diluted earnings per common share areis computed assuming that all potentially dilutive securities were converted into common shares. There are no adjustments required to be made to net income for purposes of computing basic and diluted EPS.earnings per share. A reconciliation of the amounts included in the computation of basic earnings (loss) per share from continuing operations, and diluted earnings (loss) per share from continuing operations is as follows:
| | | | Three Months Ended
March 31, | Three Months Ended
March 31, |
| In millions, except per share amounts | 2018 | | 2017 | 2019 | | 2018 |
| Earnings (loss) from continuing operations attributable to International Paper Company common shareholders | $ | 361 |
| | $ | 192 |
| $ | 424 |
| | $ | 361 |
|
| Weighted average common shares outstanding | 413.5 |
| | 412.1 |
| 400.5 |
| | 413.5 |
|
| Effect of dilutive securities | | | | | | |
| Restricted stock performance share plan | 4.7 |
| | 3.9 |
| |
| Restricted performance share plan | | 2.7 |
| | 4.7 |
|
| Weighted average common shares outstanding – assuming dilution | 418.2 |
| | 416.0 |
| 403.2 |
| | 418.2 |
|
| Basic earnings (loss) per share from continuing operations | $ | 0.87 |
| | $ | 0.47 |
| $ | 1.06 |
| | $ | 0.87 |
|
| Diluted earnings (loss) per common share from continuing operations | $ | 0.86 |
| | $ | 0.46 |
| |
| Diluted earnings (loss) per share from continuing operations | | $ | 1.05 |
| | $ | 0.86 |
|
2018:2019: During the three months ended March 31, 2019, there were no restructuring and other charges, net.
2018: TheDuring the three months ended March 31, 2018, the Company recorded a $22 million pre-tax charge, in the Industrial Packaging segment, primarily related to the severance of 221 employeescharges in conjunction with the optimization of our EMEA Packaging business.
2017: There were no restructuring and other charges recorded during the three months ended March 31, 2017.
Tangier, Morocco Facility
On June 30, 2017, the Company completed the acquisition of Europac's Tangier, Morocco facility, a corrugated packaging facility, for €40 million (approximately $46 million using the June 30, 2017 exchange rate). After working capital and other post-closing adjustments, final consideration exchanged was €33 million (approximately $38 million using the June 30, 2017 exchange rate).
The following table summarizes the provisional fair value assigned to assets and liabilities acquired as of June 30, 2017:
|
| | | |
| In millions | June 30, 2017 |
| Cash and temporary investments | $ | 1 |
|
| Accounts and notes receivable | 7 |
|
| Inventory | 3 |
|
| Plants, properties and equipment | 31 |
|
| Goodwill | 4 |
|
| Other intangible assets | 5 |
|
| Deferred charges and other assets | 5 |
|
| Total assets acquired | 56 |
|
| Accounts payable and accrued liabilities | 5 |
|
| Long-term debt | 11 |
|
| Other long-term liabilities | 2 |
|
| Total liabilities assumed | 18 |
|
| Net assets acquired | $ | 38 |
|
Adjustments, if any, to provisional amounts will be finalized within the measurement period of up to one year from the acquisition date. Pro forma information related to the acquisition of the Europac business has not been included as it is impractical to obtain the information due to the lack of availability of financial data and does not have a material effect on the Company’s consolidated results of operations.
The Company has accounted for the above acquisition under ASC 805, "Business Combinations" and the results of operations have been included in International Paper's financial statements beginning with the date of acquisition.
Discontinued Operations
2017:On January 1, 2018, the Company completed the transfer of its North American Consumer Packaging business, which included its North American Coated Paperboard and Foodservice businesses, to Graphic Packaging International Partners, LLC (GPIP), a subsidiary of Graphic Packaging Holding Company, in exchange for a 20.5% ownership interest in GPIP. GPIP subsequently transferred the North American Consumer Packaging business to Graphic Packaging International, LLC (GPI), a wholly owned subsidiary of Graphic Packaging Holding Company that holds the assets of the combined business.GPIP. International Paper is accounting for its ownership interest in the combined business under the equity method. The Company determined the fair value of its investment in the combined business and recorded a pre-tax gain of $516 million ($385 million, after taxes),net of tax) on the transfer in the first quarter of 2018, subject to final working capital settlement. See Note 11 for further discussionDuring the second quarter of 2018, the Company recorded a pre-tax charge of $28 million ($21 million after tax) to adjust the previously recorded gain on the Company's investment in Graphic Packaging International, LLC.transfer.
All historical operating results for North American Consumer Packaging are included in Discontinued operations, net of tax in the accompany consolidated statement of operations. The following summarizes the major classes of line items comprising Earnings (Loss) Before Income Taxes and Equity Earnings reconciled to Discontinued operations, net of tax, related to the transfer of the North American Consumer Packaging business for all periods presented in the consolidated statement of operations:
| | | | Three Months Ended
March 31, | |
| In millions | 2018 | | 2017 | Three Months Ended March 31, 2018 |
| Net Sales | $ | — |
| | $ | 379 |
| $ | — |
|
| Costs and Expenses | | | | |
| Cost of products sold | — |
| | 271 |
| |
| Selling and administrative expenses | 23 |
| | 23 |
| 23 |
|
| Depreciation, amortization and cost of timber harvested | — |
| | 24 |
| |
| Distribution expenses | — |
| | 31 |
| |
| Taxes other than payroll and income taxes | — |
| | 3 |
| |
| (Gain) loss on transfer of business | (516 | ) | | — |
| (516 | ) |
| Earnings (Loss) Before Income Taxes and Equity Earnings | 493 |
| | 27 |
| 493 |
|
| Income tax provision (benefit) | 125 |
| | 10 |
| 125 |
|
| Discontinued Operations, Net of Taxes | $ | 368 |
| | $ | 17 |
| $ | 368 |
|
Total cash provided by (used for)used for operations related to the North American Consumer Packaging business of $(23) million and $23 million for the three months ended March 31, 2018 and March 31, 2017 is included in Cash Provided By (Used For) Operations in the consolidated statement of cash flows. Total cash provided by (used for) investing activities related to the North American Consumer Packaging business of $1 million and $(25) million for the three months ended March 31, 2018, and March 31, 2017, is included in Cash Provided By (Used For) Investing Activities in the consolidated statement of cash flows.
Temporary Investments
Temporary investments with an original maturity of three months or less are treated as cash equivalents and are stated at cost. Temporary investments totaled $723$449 million and $661$402 million at March 31, 20182019 and December 31, 2017,2018, respectively.
Accounts and Notes Receivable
| | | In millions | March 31, 2018 | | December 31, 2017 | March 31, 2019 | | December 31, 2018 |
| Accounts and notes receivable, net: | | | | | | |
| Trade | $ | 3,117 |
| | $ | 3,017 |
| $ | 3,186 |
| | $ | 3,249 |
|
| Other | 299 |
| | 270 |
| 307 |
| | 272 |
|
| Total | $ | 3,416 |
| | $ | 3,287 |
| $ | 3,493 |
| | $ | 3,521 |
|
The allowance for doubtful accounts was $75$82 million and $73$81 million at March 31, 20182019 and December 31, 2017,2018, respectively.
Inventories
| | | In millions | March 31, 2018 | | December 31, 2017 | March 31, 2019 | | December 31, 2018 |
| Raw materials | $ | 285 |
| | $ | 274 |
| $ | 266 |
| | $ | 260 |
|
| Finished pulp, paper and packaging | 1,075 |
| | 1,337 |
| 1,282 |
| | 1,241 |
|
| Operating supplies | 589 |
| | 615 |
| 637 |
| | 641 |
|
| Other | 108 |
| | 87 |
| 116 |
| | 99 |
|
| Total | $ | 2,057 |
| | $ | 2,313 |
| $ | 2,301 |
| | $ | 2,241 |
|
DepreciationPlants, Properties and Equipment
Accumulated depreciation was $20.8 billion and $20.5 billion at March 31, 20182019 and December 31, 2017.2018. Depreciation expense was $306$297 million and $299$306 million for the three months ended March 31, 2019 and 2018, respectively.
Non-cash additions to plants, property and 2017,equipment included within accounts payable were $114 million and $135 million at March 31, 2019 and December 31, 2018, respectively.
Interest
Interest payments made during the three months ended March 31, 2019 and 2018 and 2017 were $223$214 million and $212$223 million, respectively.
Amounts related to interest were as follows:
| | | | Three Months Ended
March 31, | Three Months Ended
March 31, | |
| In millions | 2018 | | 2017 | 2019 | | 2018 | |
| Interest expense | $ | 180 |
| | $ | 187 |
| $ | 184 |
| | $ | 180 |
| |
| Interest income | 45 |
| | 45 |
| 51 |
| | 45 |
| |
| Capitalized interest costs | 8 |
| | 6 |
| 5 |
| | 8 |
| |
Asset Retirement Obligations
The Company had recorded liabilities of $90 million and $86 million related to asset retirement obligations at both March 31, 20182019 and December 31, 2017.2018, respectively.
International Paper leases various real estate, including certain operating facilities, warehouses, office space and land. The Company also leases material handling equipment, vehicles, and certain other equipment. The Company's leases have remaining lease terms of one year to 97 years. Leases having an initial term of twelve months or less are not recorded on the balance sheet and the related lease expense is recognized on a straight-line basis over the term of the lease. In addition, the Company has applied the practical expedient to account for the lease and non-lease components as a single lease component for all of the Company's leases.
Right-of-use (ROU) assets represent the Company's right to use an underlying asset for the lease term and lease liabilities represent the Company's obligation to make lease payments arising from the lease. Effective January 1, 2019, operating lease ROU assets and liabilities are recognized at the commencement date of the lease based on the present value of lease payments over the lease term. The Company's leases may include options to extend or terminate the lease. These options to extend are included in the lease term when it is reasonably certain that we will exercise that option. Some leases have variable payments, however, because they are not based on an index or rate, they are not included in the ROU assets and liabilities. Variable payments for real estate leases primarily relate to common area maintenance, insurance, taxes and utilities. Variable payments for equipment, vehicles, and leases within supply agreements primarily relate to usage, repairs, and maintenance. As the implicit rate is not readily determinable for most of the Company's leases, the Company applies a portfolio approach using an estimated incremental borrowing rate to determine the initial present value of lease payments over the lease terms, which is based on market and company specific information.
Components of Lease Expense
|
| | | | |
| In millions | | March 31, 2019 |
| Operating lease costs | | $ | 39 |
|
| Variable lease costs | | 22 |
|
| Short-term lease costs | | 11 |
|
| Finance lease cost | | |
| Amortization of lease assets | | 2 |
|
| Interest on lease liabilities | | 1 |
|
| Total lease cost, net | | $ | 75 |
|
Supplemental Balance Sheet Information Related to Leases
|
| | | | | | |
| In millions | | Classification | | March 31, 2019 |
| Assets | | | | |
| Operating lease assets | | Right-of-use assets | | $ | 415 |
|
| Finance lease assets | | Plants, properties and equipment, net (a) | | 104 |
|
| Total leased assets | | | | $ | 519 |
|
| Liabilities | | | | |
| Current | | | | |
| Operating | | Other current liabilities | | $ | 137 |
|
| Finance | | Notes payable and current maturities of long-term debt | | 9 |
|
| Noncurrent | | | | |
| Operating | | Long-term lease obligations | | 281 |
|
| Finance | | Long-term debt | | 90 |
|
| Total lease liabilities | | | | $ | 517 |
|
| |
| (a) | Finance leases are recorded net of accumulated amortization of $33 million. |
Lease Term and Discount Rate
|
| | | |
| In millions | | March 31, 2019 |
| Weighted average remaining lease term (years) | | |
| Operating leases | | 10.15 years |
|
| Finance leases | | 11.93 years |
|
| Weighted average discount rate | | |
| Operating leases | | 3.28 | % |
| Finance leases | | 4.55 | % |
Supplemental Cash Flow Information Related to Leases
|
| | | | |
| In millions | | March 31, 2019 |
| Cash paid for amounts included in the measurement of lease liabilities | | |
| Operating cash flows related to operating leases | | $ | (35 | ) |
| Financing cash flows related to finance leases | | (2 | ) |
Maturity of Lease Liabilities
|
| | | | | | | | | | | | |
| | | March 31, 2019 |
| In millions | | Operating Leases | | Financing Leases | | Total |
| 2019 (remainder of year) | | $ | 111 |
| | $ | 11 |
| | $ | 122 |
|
| 2020 | | 117 |
| | 14 |
| | 131 |
|
| 2021 | | 78 |
| | 12 |
| | 90 |
|
| 2022 | | 47 |
| | 11 |
| | 58 |
|
| 2023 | | 26 |
| | 11 |
| | 37 |
|
| Thereafter | | 100 |
| | 76 |
| | 176 |
|
| Total lease payments | | 479 |
| | 135 |
| | 614 |
|
| Less: Interest (a) | | 61 |
| | 36 |
| | 97 |
|
| Present value of lease liabilities | | $ | 418 |
| | $ | 99 |
| | $ | 517 |
|
| |
| (a) | Calculated using the interest rate for each lease. |
At December 31, 2018, total future minimum commitments under existing non-cancelable operating leases were as follows:
|
| | | | | | | | | | | | | | | | | | | | | | | | |
| In millions | | 2019 | | 2020 | | 2021 | | 2022 | | 2023 | | Thereafter |
| Lease obligations | | $ | 160 |
| | $ | 125 |
| | $ | 77 |
| | $ | 49 |
| | $ | 28 |
| | $ | 118 |
|
The Company accounts for the following investments in affiliated companies under the equity method of accounting.
Graphic Packaging International Partners, LLC
On January 1, 2018, the Company completed the transfer of its North American Consumer Packaging business, which includesincluded its North American Coated Paperboard and Foodservice businesses, to a subsidiary of Graphic Packaging International Partners, LLC (GPIP), a subsidiary of Graphic Packaging Holding Company, in exchange for a 20.5% ownership interest in GPIP. GPIP subsequently transferred the North American Consumer Packaging business to Graphic Packaging International, LLC (GPI), a wholly-owned subsidiary of GPIP that holds the assets of the combined business. The Company recorded equity earnings of $13 million and $2 million for the three months ended March 31, 2018. At March 31,2019 and 2018, respectively. The Company received cash dividends from GPIP of $6 million during the first three months of 2019. The Company's investment in GPIGPIP was $1.1 billion at both March 31, 2019 and December 31, 2018, which was $525$568 million and $562 million, respectively, more than the Company's proportionate share of the entity's underlying net assets. The difference primarily relates to the basis difference between the fair value of our investment and the underlying net assets and is generally amortized in equity earnings over a period consistent with the underlying long-lived assets. The Company is party to various agreements with GPI under which it sells fiber and other products to GPI. Sales under these agreements were $69 million and $60 million for the three months ended March 31, 2018.2019 and 2018, respectively.
Summarized financial information for Graphic Packaging International, LLCGPIP is presented in the following tables:
Balance Sheet
| | | In millions | March 31, 2018 | March 31, 2019 | | December 31, 2018 |
| Current assets | $ | 1,814 |
| $ | 1,831 |
| | $ | 1,757 |
|
| Noncurrent assets | 5,297 |
| 5,450 |
| | 5,292 |
|
| Current liabilities | 975 |
| 995 |
| | 1,148 |
|
| Noncurrent liabilities | 3,274 |
| 3,528 |
| | 3,156 |
|
Income Statement
| | | | Three Months Ended
March 31, | Three Months Ended
March 31, |
| In millions | 2018 | 2019 | | 2018 |
| Net sales | $ | 1,476 |
| $ | 1,506 |
| | $ | 1,476 |
|
| Gross profit | 223 |
| 266 |
| | 223 |
|
| Income from continuing operations | 62 |
| 95 |
| | 62 |
|
| Net income | 62 |
| 95 |
| | 62 |
|
Ilim Holding S.A.
The Company has a 50% equity interest in Ilim Holding S.A. and it’s(Ilim), which has subsidiaries (Ilim) that is a separate business segment, whose primary operations are in Russia. The Company recorded equity earnings (losses), net of taxes, of $92$101 million and $50$92 million for the three months ended March 31, 20182019 and 2017,2018, respectively. The Company received cash dividends from the joint venture of $116 million and $127 million during the first three months of 2018 and 2017, respectively.2018. At March 31, 20182019 and December 31, 2017,2018, the Company's investment in Ilim was $330$594 million and $338$478 million, respectively, which was $157
$150 million and $154$145 million, respectively, more than the Company's proportionate share of the joint venture's underlying net assets. The differences primarily relate to purchase pricecurrency translation adjustments and the basis difference between the fair value adjustmentsof our investment at acquisition and currency translation adjustments.the underlying net assets. The Company is party to a joint marketing agreement with JSC Ilim Group, a subsidiary of Ilim, under which the Company purchases, markets and sells paper produced by JSC Ilim Group. Purchases under this agreement were $53 million and $47 million for each of the three months ended March 31, 20182019 and 2017, respectively.2018.
Summarized financial information for Ilim is presented in the following tables:
Balance Sheet
| | | In millions | March 31, 2018 | | December 31, 2017 | March 31, 2019 | | December 31, 2018 |
| Current assets | $ | 581 |
| | $ | 689 |
| $ | 1,136 |
| | $ | 981 |
|
| Noncurrent assets | 1,740 |
| | 1,696 |
| 2,019 |
| | 1,710 |
|
| Current liabilities | 787 |
| | 1,039 |
| 706 |
| | 545 |
|
| Noncurrent liabilities | 1,174 |
| | 972 |
| 1,542 |
| | 1,470 |
|
| Noncontrolling interests | 11 |
| | 6 |
| 18 |
| | 11 |
|
Income Statement
|
| | | | | | | |
| | Three Months Ended
March 31, |
| In millions | 2018 | | 2017 |
| Net sales | $ | 677 |
| | $ | 449 |
|
| Gross profit | 375 |
| | 207 |
|
| Income from continuing operations | 189 |
| | 106 |
|
| Net income | 183 |
| | 100 |
|
|
| | | | | | | |
| | Three Months Ended
March 31, |
| In millions | 2019 | | 2018 |
| Net sales | $ | 620 |
| | $ | 677 |
|
| Gross profit | 336 |
| | 375 |
|
| Income from continuing operations | 205 |
| | 189 |
|
| Net income | 199 |
| | 183 |
|
Goodwill
The following table presents changes in goodwill balances as allocated to each business segment for the three-months ended March 31, 2018:2019:
| | | In millions | Industrial Packaging | | Global Cellulose Fibers | | Printing Papers | | Total | Industrial Packaging | | Global Cellulose Fibers | | Printing Papers | | Total |
| Balance as of January 1, 2018 | | | | | | | | |
| Balance as of January 1, 2019 | | | | | | | | |
| Goodwill | $ | 3,382 |
| | $ | 52 |
| | $ | 2,150 |
| | $ | 5,584 |
| $ | 3,379 |
| | $ | 52 |
| | $ | 2,116 |
| | $ | 5,547 |
|
| Accumulated impairment losses (a) | (296 | ) | | — |
| | (1,877 | ) | | (2,173 | ) | (296 | ) | | — |
| | (1,877 | ) | | (2,173 | ) |
| | 3,086 |
| | 52 |
| | 273 |
| | 3,411 |
| 3,083 |
| | 52 |
| | 239 |
| | 3,374 |
|
| Reclassifications and other (b) | 2 |
| | — |
| | 1 |
| | 3 |
| |
| Currency translation and other (b) | | — |
| | — |
| | (2 | ) | | (2 | ) |
| Additions/reductions | — |
| | — |
| | — |
| | — |
| 21 |
| (c) | — |
| | — |
| | 21 |
|
| Balance as of March 31, 2018 | | | | | | | | |
| Balance as of March 31, 2019 | | | | | | | | |
| Goodwill | 3,384 |
| | 52 |
| | 2,151 |
| | 5,587 |
| 3,400 |
| | 52 |
| | 2,114 |
| | 5,566 |
|
| Accumulated impairment losses | (296 | ) | | — |
| | (1,877 | ) | | (2,173 | ) | |
| Accumulated impairment losses (a) | | (296 | ) | | — |
| | (1,877 | ) | | (2,173 | ) |
| Total | $ | 3,088 |
| | $ | 52 |
| | $ | 274 |
| | $ | 3,414 |
| $ | 3,104 |
| | $ | 52 |
| | $ | 237 |
| | $ | 3,393 |
|
| |
| (a) | Represents accumulated goodwill impairment charges since the adoption of ASC 350, "Intangibles-Goodwill and Other" in 2002. |
| |
| (b) | Represents the effects of foreign currency translations and reclassifications. |
(c) Reflects the provisional goodwill for the acquisitions of two Industrial Packaging box plants in Spain.
Other Intangibles
Identifiable intangible assets comprised the following:
| | | | March 31, 2018 | | December 31, 2017 | March 31, 2019 | | December 31, 2018 |
| In millions | Gross Carrying Amount | | Accumulated Amortization | | Net Intangible Assets | | Gross Carrying Amount | | Accumulated Amortization | | Net Intangible Assets | Gross Carrying Amount | | Accumulated Amortization | | Net Intangible Assets | | Gross Carrying Amount | | Accumulated Amortization | | Net Intangible Assets |
| Customer relationships and lists | $ | 610 |
| | $ | 256 |
| | $ | 354 |
| | $ | 610 |
| | $ | 247 |
| | $ | 363 |
| $ | 541 |
| | $ | 253 |
| | $ | 288 |
| | $ | 542 |
| | $ | 247 |
| | $ | 295 |
|
| Non-compete agreements | 71 |
| | 71 |
| | — |
| | 72 |
| | 72 |
| | — |
| 68 |
| | 68 |
| | — |
| | 67 |
| | 67 |
| | — |
|
| Tradenames, patents and trademarks, and developed technology | 173 |
| | 77 |
| | 96 |
| | 172 |
| | 72 |
| | 100 |
| 173 |
| | 93 |
| | 80 |
| | 174 |
| | 90 |
| | 84 |
|
| Land and water rights | 8 |
| | 2 |
| | 6 |
| | 8 |
| | 2 |
| | 6 |
| 8 |
| | 2 |
| | 6 |
| | 8 |
| | 2 |
| | 6 |
|
| Software | 27 |
| | 25 |
| | 2 |
| | 24 |
| | 23 |
| | 1 |
| 26 |
| | 25 |
| | 1 |
| | 26 |
| | 25 |
| | 1 |
|
| Other | 40 |
| | 30 |
| | 10 |
| | 38 |
| | 26 |
| | 12 |
| 31 |
| | 24 |
| | 7 |
| | 30 |
| | 23 |
| | 7 |
|
| Total | $ | 929 |
| | $ | 461 |
| | $ | 468 |
| | $ | 924 |
| | $ | 442 |
| | $ | 482 |
| $ | 847 |
| | $ | 465 |
| | $ | 382 |
| | $ | 847 |
| | $ | 454 |
| | $ | 393 |
|
The Company recognized the following amounts as amortization expense related to intangible assets:
| | | | Three Months Ended
March 31, | Three Months Ended
March 31, |
| In millions | 2018 | | 2017 | 2019 | | 2018 |
| Amortization expense related to intangible assets | $ | 14 |
| | $ | 16 |
| $ | 12 |
| | $ | 14 |
|
International Paper madereceived a net income tax payments, netrefund of refunds, of $20 million and $29$51 million for the three months ended March 31, 2018 and 2017, respectively.2019 compared to payments, net of refunds, of $20 million for the three months ended March 31, 2018.
The Company currently estimates, that as a result of ongoing discussions, pending tax settlements and expirations of statutes of limitations, the amount of unrecognized tax benefits could be reduced by approximately $10$28 million during the next 12 months.
International Paper uses the flow-through method to account for investment tax credits earned on eligible open loop-biomass facilities and Combined Heat and Power system expenditures. Under this method, the investment tax credits are recognized as a
reduction to income tax expense in the year they are earned rather than a reduction in the asset basis. The Company recorded a tax benefit of $6 million and $0 million for each of the three months ended March 31, 20182019 and 2017,2018, respectively.
On December 22, 2017,The Brazilian Federal Revenue Service has challenged the U.S. government enacted comprehensive tax legislation commonly referred to asdeductibility of goodwill amortization generated in a 2007 acquisition by International Paper do Brasil Ltda., a wholly-owned subsidiary of the Tax Cuts and Jobs Act ("the Tax Act").Company. The Tax Act makes broad and complex changes to the U.S. tax code, including, but not limited to, (1) reducing the U.S. federal corporate tax rate from 35% to 21%; (2) requiring companies to pay a one-time deemed repatriation transition tax (the “Transition Tax”) on certain earnings of foreign subsidiaries; (3) generally eliminating U.S. federal income taxes on dividends from foreign subsidiaries; (4) requiring a current inclusion in U.S. federal taxable income of certain earnings of controlled foreign corporations; (5) eliminating the corporate alternative minimum tax (“AMT”) and changing how AMT credits can be realized; (6) capital expensing; (7) eliminating the deduction on U.S. manufacturing activities; and (8) creating new limitations on deductible interest expense and executive compensation.
The Securities Exchange Commission staff issued Staff Accounting Bulletin (“SAB”) 118 which provides guidance on accountingCompany received assessments for the tax effects of the Tax Act. SAB 118 provides a measurement period that should not extend beyond one year from the Tax Act enactment date for companies to complete the accounting under ASC 740. In accordance with SAB 118, a company must reflect the incomeyears 2007-2015 totaling approximately $158 million in tax, effects of those aspects of the Tax Act for which the accounting under ASC 740 is complete. To the extent that a company’s accounting for certain income tax effects of the Tax Act is incomplete but it is able to determine a reasonable estimate, it must record a provisional estimateand $401 million in the financial statements. If a company cannot determine a provisional estimate to be included in the financial statements, it should continue to apply ASC 740 on the basis of the provisions of the tax laws that were in effect immediately before the enactment of the Tax Act.
In connection with our initial analysis of the impact of the Tax Act, we recorded a provisional net tax benefit of $1.22 billion in the period ending December 31, 2017. The net tax benefit primarily consisted of a net tax benefit for the re-measurement of U.S. deferred taxes of $1.454 billioninterest and an expense for the Transition Tax of $231 million. For various reasons that are discussed more fully below, as of the quarter ended March 31, 2018, we have not completed our accounting for the income tax effects of the Tax Act.
Our accounting for the following elements of the Tax Act is incompletepenalties as of March 31, 2018.2019 (adjusted for variation in currency exchange rates). After a previous favorable ruling challenging the basis for these assessments, we received an unfavorable decision in October 2018 from the Brazilian Administrative Council of Tax Appeals. The estimates reportedCompany intends to further appeal the matter in the period ending December 31, 2017, were not adjustedBrazilian federal courts in the period ending March 31, 2018. As of the period ended March 31, 2018, there has been no change or clarification in guidance issued or interpretations or assumptions we have made that caused a change2019; however, this tax litigation matter may take many years to the estimates reported in the period ending December 31, 2017.
Reduction of U.S. federal corporate tax rate: The Tax Act reduced the corporate tax rate to 21%, effective January 1, 2018. For certain of our deferred tax assets and liabilities, we recorded a provisional net decrease of $1.451 billion with a corresponding adjustment to deferred income tax benefit in the same amount for the year ended December 31, 2017. While we are able to make a reasonable estimate of the impact of the reduction in the corporate rate, it may be affected by other analysis related to the Tax Act, including but not limited to, the state tax effect of adjustments made to federal temporary differences.
Deemed Repatriation Transition Tax: This is a tax on previously untaxed accumulated and current earnings and profits (“E&P”) of foreign subsidiaries. To determine the amount of the transition tax, we must determine, in addition to other factors, the amount of post-1986 E&P of the relevant subsidiaries, as well as the amount of non-U.S. income taxes paid on such earnings. We were able to make a reasonable estimate of the Transition Tax and recorded a provisional Transition Tax obligation of $231 million in the tax period ending December 31, 2017.
Valuation Allowances:resolve. The Company believes that it has assessed whetherappropriately evaluated the transaction underlying these assessments, and has concluded based on Brazilian tax law, that its U.S. stateposition would be sustained. The Company intends to vigorously defend its position against the current assessments and local income tax valuation allowance analysis is affected by various aspects of the Tax Act (e.g. deemed repatriation of foreign income, acceleration of cost recovery). Since, as discussed herein, the Company has recorded provisional amounts related to elements of the Tax Act, any corresponding determination of the need for or change in a valuation allowance is also provisional. For certain of our state deferred tax assets, we recorded a net $3 million provisional decrease in the recorded valuation allowance with a corresponding adjustment to deferred income tax benefit in the same amount for the year ended December 31, 2017. While we are able to make a reasonable estimate of the impact of the Tax Act on state attributes, the resolution of, or changes from, other factors noted herein may result in changes in our recorded valuation allowance.
The Tax Act may impact decisions surrounding the Company’s permanent reinvestment assertions related to its foreign investments and could have an impact on the Company’s accounting for untaxed outside basis differences. We previously considered the earnings in our non-U.S. subsidiaries to be permanently reinvested, and, accordingly deferred income taxes were not provided for such basis differences which totaled approximately $5.9 billion at December 31, 2017. While the transition tax resulted in a reduction in these basis differences, an actual repatriation from our non-U.S. subsidiaries could still be subject to additional taxes, including, but not limited to, foreign withholding taxes and U.S. state income taxes. In light of the Tax Act, the Company is evaluating its global cash management and non-U.S. repatriation strategy but we have yet to determine whether we plan to change our prior assertion. Accordingly, we have not recorded any deferred taxes attributable to our investments in our non-U.S. subsidiaries.
These estimates may change materially due to, among other things, further clarification of existing guidancesimilar assessments that may be issued by U.S. taxing authorities or regulatory bodies and/or changes in interpretations and assumptions we have preliminarily made. We will continuefor tax years subsequent to analyze the Tax Act to finalize its financial statement impact, including the mandatory deemed repatriation of foreign earnings, re-measurement of deferred taxes and all other provisions of the legislation and will record the effects of any changes to provisional amounts in the period we can complete our analysis or are first able to make a reasonable estimate, but no later than December 2018.
Because of the complexity of the new Global Intangible Low Tax Income (GILTI) rules, we are continuing to evaluate this provision of the Act and the application of ASC 740. Under U.S. GAAP, we are allowed to make an accounting policy choice of either (1) treating taxes due on future U.S. inclusions in taxable income related to GILTI as a current-period expense when incurred (the “period cost method”) or (2) factoring such amounts into a company’s measurement of its deferred taxes (the “deferred method”). Our selection of an accounting policy related to the new GILTI tax rules will depend, in part, on analyzing our global income to determine whether we expect to have future U.S. inclusions in taxable income related to GILTI and, if so, what the impact is expected to be. Because whether we expect to have future U.S. inclusions in taxable income related to GILTI depends on a number of different aspects of our estimated future results of global operations, we are not yet able to reasonably estimate the long-term effects of this provision of the Act. Therefore, we have not recorded any potential deferred tax effects related to GILTI in our financial statements and have not made a policy decision regarding whether to record deferred taxes on GILTI or use the period cost method. We expect to complete our accounting within the prescribed measurement period.2015.
Environmental
International Paper has been named as a potentially responsible party (PRP) in environmental remediation actions under various federal and state laws, including the Comprehensive Environmental Response, Compensation and Liability Act (CERCLA). Many of these proceedings involve the cleanup of hazardous substances at large commercial landfills that received
waste from many different sources. While joint and several liability is authorized under CERCLA and equivalent state laws, as a practical matter, liability for CERCLA cleanups is typically allocated among the many PRPs. There are other remediation costs typically associated with the cleanup of hazardous substances at the Company’s current, closed or formerly-owned facilities, and recorded as liabilities in the balance sheet.
Remediation costs are recorded in the consolidated financial statements when they become probable and reasonably estimable. International Paper has estimated the probable liability associated with these matters to be approximately $131$132 million ($143142 million undiscounted) in the aggregate atas of March 31, 2018.2019. Other than as described below, completion of required remedial actions is not expected to have a material effect on our consolidated financial statements.
Cass Lake: One of the matters included above arises out of a closed wood-treating facility located in Cass Lake, Minnesota. In June 2011, the United States Environmental Protection Agency (EPA) selected and published a proposed soil remedy at the site with an estimated cost of $46 million. The overall remediation reserve for the site is currently $51$49 million to address the selection of an alternative for the soil remediation component of the overall site remedy, which includes the ongoing groundwater remedy. In October 2011, the EPA released a public statement indicating that the final soil remedy decision would be delayed. In March 2016, the EPA issued a proposed plan concerning clean-up standards at a portion of the site, the estimated cost of which is included within the reserve referenced above. In October 2012, the Natural Resource Trustees for this site provided notice to International Paper and other PRPs of their intent to perform a Natural Resource Damage Assessment. It is premature to predict the outcome of the assessment or to estimate a loss or range of loss, if any, which may be incurred.
Kalamazoo River: The Company is a PRP with respect to the Allied Paper, Inc./Portage Creek/Kalamazoo River Superfund Site in Michigan. The EPA asserts that the site is contaminated by polychlorinated biphenyls (PCBs) primarily as a result of discharges from various paper mills located along the Kalamazoo River, including a paper mill (the Allied Paper Mill) formerly owned by St. Regis Paper Company (St. Regis). The Company is a successor in interest to St. Regis.
In March 2016, the Company and other PRPs received a special notice letter from the EPA (i) inviting participation in implementing a remedy for a portion of the site known as Operable Unit 5, Area 1, and (ii) demanding reimbursement of EPA past costs totaling $37 million, including $19 million in past costs previously demanded by the EPA. The Company responded to the special notice letter. In December 2016, the EPA issued a unilateral administrative order to the Company and other PRPs to perform the remedy. The Company responded to the unilateral administrative order, agreeing to comply with the order subject to its sufficient cause defenses.
In April 2016, the EPA issued a separate unilateral administrative order to the Company and certain other PRPs for a time-critical removal action (TCRA) of PCB-contaminated sediments from a different portion of the site. The Company responded to the unilateral administrative order and agreed along with two other parties to comply with the order subject to its sufficient cause defenses.
In October 2016, the Company and another PRP received a special notice letter from the EPA inviting participation in the remedial design component of the landfill remedy for the Allied Paper Mill. The record of decision establishing the final landfill remedy for the Allied Paper Mill was issued by the EPA in September 2016. The Company responded to the Allied Paper Mill special notice letter in late December 2016. In February 2017, the EPA informed the Company that it would make other arrangements for the performance of the remedial design.
The Company’s CERCLA liability has not been finally determined with respect to these or any other portions of the site, and except as noted above, the Company has declined to perform any work or reimburse the EPA at this time. As noted below, the Company is involved in allocation/apportionment litigation with regard to the site. Accordingly, it is premature to predict the outcome or estimate our maximum reasonably possible loss with respect to this site. However, we do not believe that any material loss is probable.
The Company was named as a defendant by Georgia-Pacific Consumer Products LP, Fort James Corporation and Georgia Pacific LLC in a contribution and cost recovery action for alleged pollution at the site. The suit seeks contribution under CERCLA for costs purportedly expended by plaintiffs ($79 million as of the filing of the complaint) and for future remediation costs. The suit alleges that a mill, during the time it was allegedly owned and operated by St. Regis, discharged PCB contaminated solids and paper residuals resulting from paper de-inking and recycling. NCR Corporation and Weyerhaeuser Company are also named as defendants in the suit. In mid-2011, the suit was transferred from the District Court for the Eastern District of Wisconsin to the District Court for the Western District of Michigan.
The trial of the initial liability phase took place in February 2013. Weyerhaeuser conceded prior to trial that it was a liable party with respect to the site. In September 2013, an opinion and order was issued in the suit. The order concluded that the Company (as the successor to St. Regis) was not an “operator,” but was an “owner,” of the mill at issue during a portion of the relevant period and is therefore liable under CERCLA. The order also determined that NCR is a liable party as an "arranger for disposal" of PCBs in waste paper that was de-inked and recycled by mills along the Kalamazoo River. The order did not address the Company's responsibility, if any, for past or future costs. The parties’ responsibility, including that of the Company, was the subject of a second trial, w
hichwhich was concluded in late 2015. In MarchJune 2018, the Court issued an Opinion addressing the Company's liability for past costs. The Courtits Final Judgment and Order, which fixed the past cost amount at approximately $50 million (plus interest to be determined) and allocated to the Company a 15% share of responsibility for those past costs. The Court did not address responsibility for future remediation costs in its decision. In July 2018, the Company and each of the other parties filed notices appealing the Final Judgment and prior orders incorporated into that Judgment. As to future remediation costs, the Company remainswe remain unable to estimate our maximum reasonably possible loss with respect to this site. However, we do not believe that any material loss is probable.
Harris County: International Paper and McGinnis Industrial Maintenance Corporation (MIMC), a subsidiary of Waste Management, Inc. (WMI), are PRPs at the San Jacinto River Waste Pits Superfund Site in Harris County, Texas. The PRPs have been actively participating in the activities at the site and share the costs of these activities. In September 2016, the EPA issued a proposed remedial action plan (PRAP) for the site, which identified the preferred remedy as the removal of the contaminated material currently protected by an armored cap. In addition, the EPA selected a preferred remedy for the separate southern impoundment that requires offsite disposal. In January 2017, the PRPs submitted comments on the PRAP.
On October 11, 2017, the EPA issued a Record of Decision (ROD) selecting the final remedy for the site: removal and relocation of the waste material from both the northern and southern impoundments. The EPA did not specify the methods or practices needed to perform this work. While the EPA’s selected remedy was accompanied by a cost estimate of approximately $115 million, we do not believe that estimate provides a reasonable basis for accrual under GAAP because the estimate was based on a technological method for performing the work that we believe is not feasible. Subsequent to the issuance of the ROD, there have been severalnumerous meetings between the EPA and the PRPs, and the Company continues to work with the EPA and MIMC/WMI to develop the remedial design.
To this end, in April 2018, the PRPs entered into an Administrative Order on Consent (AOC) with the EPA, agreeing to work together to develop the remedial design over the nextsubsequent 29 months. The AOC does not include any agreement to perform waste removal or other construction activity at the site. Rather, it involves adaptive management techniques and a pre-design investigation, the objectives of which include filling data gaps (including but not limited to post-Hurricane Harvey technical data generated prior to the ROD and not incorporated into the selected remedy), refining areas and volumes of materials to be addressed, determining if thean excavation remedy is able to be implemented in a manner protective of human health and the environment, and investigating potential impacts of remediation activities to infrastructure in the vicinity.
The Company has identified a number of concerns and uncertainties regarding the remedy described in the ROD and regarding the EPA’s estimates for the costs and time required to implement the selected remedy. The Company has determined, however, that even if the ROD cannot be implemented, a sheet pile "engineered barrier" can be constructed, which would enhance the
existing remedy and could also be used should the ROD be determined to be feasible and implementable. In the third quarter of 2018, we increased our recorded liability accordingly to reflect the estimated cost of constructing this barrier. Because of ongoing questions regarding cost effectiveness, technical feasibility, timing and other technical data, however, it is uncertain how the ROD will be implemented. Consequently, while additional losses are probable as a result of the selected remedy, we are currently unable to determine any further adjustment to our immaterial recorded liability. It remains reasonably possible that additional losses could be material as the remedial design process with the EPA continues over the coming quarters.
International Paper and MIMC/WMI are also defending an additional lawsuit related to the site brought by approximately 600 individuals who allege property damage and personal injury. Because this case is still in the discovery phase, it is premature to predict the outcome or to estimate a loss or range of loss, if any, which may be incurred.
Antitrust
Containerboard: In June 2016, a lawsuit captioned Ashley Furniture Indus., Inc. v. Packaging Corporation of America (W.D. Wis.), was filed in federal court in Wisconsin against ten defendants, including the Company, Temple-Inland and Weyerhaeuser Company. The Ashley Furniture lawsuit allegesalleged a civil violation of Section 1 of the Sherman Act (in particular, that defendants conspired to limit the supply and thereby increase prices of containerboard products), and also assertsasserted Wisconsin state antitrust claims. In January 2019, the parties filed a stipulation to dismiss the Ashley Furniture lawsuit with prejudice, and the case is now closed. The Company made no payment in consideration for the dismissal.
In January 2011, International Paper was named as a defendant in a lawsuit filed in state court in Cocke County, Tennessee alleging that International Paper violated Tennessee law by conspiring to limit the supply and fix the prices of containerboard from mid-2005 to the present. Plaintiffs in the state court action seek certification of a class of Tennessee indirect purchasers of containerboard products, damages and costs, including attorneys' fees. No class certification materials have been filed to date in the Tennessee action.
The Company disputes the allegations made in the Ashley Furniture and Tennessee lawsuitslawsuit and is vigorously defending each.it. At this time, however, because the actions areaction is in a preliminary stage, we are unable to predict an outcome or estimate a range of reasonably possible loss.
Contract
Signature: In August 2014, a lawsuit captioned Signature Industrial Services LLC et al. v. International Paper Company was filed in state court in Texas. The Signature lawsuit arises out of approximately $1 million in disputed invoices related to the installation of new equipment at the Company's Orange, Texas mill. In addition to the invoices in dispute, Signature and its president allege consequential damages arising from the Company's nonpayment of those invoices. The lawsuit was tried
before a jury in Beaumont, Texas, in May 2017. On June 1, 2017, the jury returned a verdict awarding approximately $125 million in damages to the plaintiffs. The Court issued a judgment on December 14, 2017, awarding the plaintiffs a total of approximately $137 million in actual and consequential damages, fees, costs and pre-judgment interest, and awarding post-judgment interest. The Company has appealed this judgment. The Company has presented in its briefing numerous and strong bases for appeal, and we believe we will prevail on appeal. Because the appellate proceedings are in a preliminary stage,ongoing, we are unable to estimate a range of reasonably possible loss, but we expect the amount of any loss to be immaterial.
General
The Company is involved in various other inquiries, administrative proceedings and litigation relating to environmental and safety matters, personal injury, labor and employment, contracts, sales of property, intellectual property, tax, antitrust and other matters, some of which allege substantial monetary damages. While any proceeding or litigation has the element of uncertainty, the Company believes that the outcome of any of these other lawsuits or claims that are pending or threatened or all of them combined (other than those that cannot be assessed due to their preliminary nature) will not have a material effect on its consolidated financial statements. See Note 13 for details regarding a tax matter.
Variable Interest Entities
As of March 31, 2018,2019, the fair value of the Timber Notes and Extension Loans is $4.68$4.77 billion and $4.22$4.24 billion, respectively, for the 2015 Financing Entities. The Timber Notes and Extension Loans are classified as Level 2 within the fair value hierarchy, which is further defined in Note 1416 in the Company’sCompany's Annual Report on Form 10-K for the year ended December 31, 2017.2018.
Activity between the Company and the 2015 Financing Entities was as follows:
| | | | Three Months Ended
March 31, | Three Months Ended
March 31, |
| In millions | 2018 | | 2017 | 2019 | | 2018 |
| Revenue (a) | $ | 24 |
| | $ | 24 |
| $ | 24 |
| | $ | 24 |
|
| Expense (a) | 32 |
| | 32 |
| 32 |
| | 32 |
|
| Cash receipts (b) | 47 |
| | 47 |
| 47 |
| | 47 |
|
| Cash payments (c) | 64 |
| | 64 |
| 64 |
| | 64 |
|
| |
| (a) | The revenue and expense are included in Interest expense, net in the accompanying statement of operations. |
| |
| (b) | The cash receipts are interest received on the Financial assets of special purpose entities. |
| |
| (c) | The cash payments represent interest paid on Nonrecourse financial liabilities of special purpose entities. |
As of March 31, 2018,2019, the fair value of the Timber Notes and Extension Loans is $2.22 billion and $2.07 billion, respectively, for the 2007 Financing Entities. The Timber Notes and Extension Loans are classified as Level 2 within the fair value hierarchy, which is further defined in Note 1416 in the Company’s Annual Report on Form 10-K for the year ended December 31, 2017.2018.
Activity between the Company and the 2007 Financing Entities was as follows:
| | | | Three Months Ended
March 31, | Three Months Ended
March 31, |
| In millions | 2018 | | 2017 | 2019 | | 2018 |
| Revenue (a) | $ | 15 |
| | $ | 13 |
| $ | 21 |
| | $ | 15 |
|
| Expense (b) | 14 |
| | 15 |
| 21 |
| | 14 |
|
| Cash receipts (c) | 9 |
| | 6 |
| 16 |
| | 9 |
|
| Cash payments (d) | 12 |
| | 9 |
| 18 |
| | 12 |
|
| |
| (a) | The revenue is included in Interest expense, net in the accompanying statement of operations and includes approximately $5 million for each of the three months ended March 31, 20182019 and 2017,2018, respectively, of accretion income for the amortization of the purchase accountingbasis difference adjustment on the Financial assets of special purpose entities. |
| |
| (b) | The expense is included in Interest expense, net in the accompanying statement of operations and includes approximately $2 million for each of the three months ended March 31, 20182019 and 2017,2018, respectively, of accretion expense for the amortization of the purchase accountingbasis difference adjustment on the Nonrecourse financial liabilities of special purpose entities. |
| |
| (c) | The cash receipts are interest received on the Financial assets of special purpose entities. |
| |
| (d) | The cash payments are interest paid on Nonrecourse financial liabilities of special purpose entities. |
In December 2017, International Paper received $660 million in cash proceeds from a new loan entered into as part of the transfer of the North American Consumer Packaging business to a subsidiary of Graphic Packing Holding Company discussed in Note 9. The Company used the cash proceeds, together with available cash, to pay down existing debt of approximately $900 million. The $660 million term loan was subsequently assumed by Graphic Packaging International, LLC on January 1, 2018 and was classified as Liabilities held for sale at December 31, 2017, in the accompanying consolidated balance sheet.
In June 2016,2018, the borrowing capacity of International Paper entered into aPaper's commercial paper program with a borrowing capacity ofwas increased from $750 million.million to $1.0 billion. Under the terms of the program, individual maturities on borrowings may vary, but not exceed one year from the date of issue. Interest bearing notes may be issued either as fixed or floating rate notes. As of March 31, 2018,2019, the Company had $375$530 million of borrowings outstanding under the program at a weighted average interest rate of 2.33%2.73%.
International Paper also has up to $600 million of uncommitted financings based on eligible receivable balances under a receivables securitization program that expires in December 2019. At March 31, 2019, $100 million was outstanding at a weighted-average interest rate of 3.32% under the receivables securitization program.
At March 31, 2018,2019, the fair value of International Paper’s $11.3$10.8 billion of debt was approximately $11.8$11.2 billion. The fair value of the Company’s long-term debt is estimated based on the quoted market prices for the same or similar issues. International Paper’s long-term debt is classified as Level 2 within the fair value hierarchy, which is further defined in Note 1416 in the Company’s Annual Report on Form 10-K for the year ended December 31, 2017.
As a multinational company we areInternational Paper is exposed to market risks, such as changes in interest rates, currency exchangesexchange rates and commodity prices.
For detailed information regarding the Company’s hedging activities and related accounting, refer to Note 14 in the Company’s Annual Report on Form 10-K for the fiscal year ended December 31, 2017.
The notional amounts of qualifying and non-qualifying financial instruments used in hedging transactions were as follows: | | | In millions | March 31, 2018 | | December 31, 2017 | March 31, 2019 | | December 31, 2018 |
| Derivatives in Cash Flow Hedging Relationships: | | | | | | |
| Foreign exchange contracts (a) | $ | 376 |
| | $ | 329 |
| $ | 403 |
| | $ | 407 |
|
| Derivatives in Fair Value Hedging Relationships: | | | | |
| Interest rate contracts | | 700 |
| | 700 |
|
| Derivatives Not Designated as Hedging Instruments: | | | | | | |
| Electricity contract | 8 |
| | 13 |
| 3 |
| | 8 |
|
| Foreign exchange contracts | 6 |
| | 10 |
| 11 |
| | 19 |
|
| |
| (a) | These contracts had maturities of two years or less as of March 31, 2018.2019. |
The following table shows gains or losses recognized in AOCI, net of tax, related to derivative instruments:
| | | | Gain (Loss) Recognized in AOCI on Derivatives (Effective Portion) | Gain (Loss) Recognized in AOCI on Derivatives (Effective Portion) |
| | Three Months Ended
March 31, | Three Months Ended
March 31, |
| In millions | 2018 | | 2017 | 2019 | | 2018 |
| Foreign exchange contracts | $ | — |
| | $ | 9 |
| |
| Interest rate contracts | (3 | ) | | — |
| $ | — |
| | $ | (3 | ) |
| Total | $ | (3 | ) | | $ | 9 |
| $ | — |
| | $ | (3 | ) |
During the next 12 months, the amount of the March 31, 20182019 AOCI balance, after tax, that is expected to be reclassified to earnings is a gainloss of $4$2 million.
The amounts of gains and losses recognized in the statement of operations on qualifying and non-qualifying financial instruments used in hedging transactions were as follows: | | | | Gain (Loss) Reclassified from AOCI (Effective Portion) | Location of Gain (Loss) Reclassified from AOCI (Effective Portion) | Gain (Loss) Reclassified from AOCI (Effective Portion) | Location of Gain (Loss) Reclassified from AOCI (Effective Portion) |
| | Three Months Ended
March 31, | | | Three Months Ended
March 31, | | |
| In millions | 2018 | | 2017 | | | 2019 | | 2018 | | |
| Derivatives in Cash Flow Hedging Relationships: | | | | | | | | |
| Foreign exchange contracts | $ | 2 |
| | $ | 2 |
| | Cost of products sold | $ | (1 | ) | | $ | 2 |
| | Cost of products sold |
| Total | $ | 2 |
| | $ | 2 |
| | $ | (1 | ) | | $ | 2 |
| |
| | | | Gain (Loss) Recognized | Location of Gain (Loss) In Statement of Operations | Gain (Loss) Recognized | Location of Gain (Loss) In Statement of Operations |
| | Three Months Ended
March 31, | | | Three Months Ended
March 31, | | |
| In millions | 2018 | | 2017 | | | 2019 | | 2018 | | |
| Derivatives in Fair Value Hedging Relationships: | | | | | |
| Interest rate contracts | | $ | 12 |
| | $ | — |
| | Interest expense, net |
| Debt | | (12 | ) | | — |
| | Interest expense, net |
| Total | | $ | — |
| | $ | — |
| |
| Derivatives Not Designated as Hedging Instruments: | | | | | | | | |
| Electricity contract | $ | (2 | ) | | $ | (1 | ) | | Cost of products sold | $ | 4 |
| | $ | (2 | ) | | Cost of products sold |
| Total | $ | (2 | ) | | $ | (1 | ) | | $ | 4 |
| | $ | (2 | ) | |
Fair Value Measurements
For a discussion of the Company’s fair value measurement policies under the fair value hierarchy, refer to Note 14 in the Company’s Annual Report on Form 10-K for the fiscal year ended December 31, 2017.
The Company has not changed its valuation techniques for measuring the fair value of any financial assets or liabilities during the year. Transfers between levels, if any, are recognized at the end of the reporting period.
The following table provides a summary of the impact of our derivative instruments in the balance sheet:
Fair Value Measurements
Level 2 – Significant Other Observable Inputs
| | | | Assets | | Liabilities | | Assets | | Liabilities | |
| In millions | March 31, 2018 | | December 31, 2017 | | March 31, 2018 | | December 31, 2017 | | March 31, 2019 | | December 31, 2018 | | March 31, 2019 | | December 31, 2018 | |
| Derivatives designated as hedging instruments | | | | | | | | | | | | | | | | |
| Foreign exchange contracts – cash flow | $ | 9 |
| (a) | $ | 11 |
| (b) | $ | 2 |
| (c) | $ | 1 |
| (c) | $ | 3 |
|
| $ | 3 |
|
| $ | 8 |
| | $ | 10 |
| |
| Interest rate contracts - fair value | | 29 |
| | 16 |
| | — |
| | — |
| |
| Total derivatives designated as hedging instruments | 9 |
| | 11 |
| | 2 |
| | 1 |
| | 32 |
| (a) | 19 |
| (b) | 8 |
| (c) | 10 |
| (c) |
| Derivatives not designated as hedging instruments | | | | | | | | | | | | | | | | |
| Electricity contract | — |
|
| — |
|
| 8 |
| (d) | 8 |
| (d) | — |
|
| — |
|
| 3 |
|
| 4 |
| |
| Foreign exchange contracts | | — |
|
| — |
| | — |
| | 1 |
| |
| Total derivatives not designated as hedging instruments | — |
| | — |
| | 8 |
| | 8 |
| | — |
| | — |
| | 3 |
| (c) | 5 |
| (c) |
| Total derivatives | $ | 9 |
| | $ | 11 |
| | $ | 10 |
| | $ | 9 |
| | $ | 32 |
| | $ | 19 |
| | $ | 11 |
| | $ | 15 |
| |
| |
| (a) | Includes $8$2 million recorded in Other current assets and $1$30 million recorded in Deferred charges and other assets in the accompanying consolidated balance sheet. |
| |
| (b) | Includes $10$2 million recorded in Other current assets and $1$17 million recorded in Deferred charges and other assets in the accompanying balance sheet. |
| |
| (c) | Included in Other accruedcurrent liabilities in the accompanying balance sheet. |
| |
(d) | Includes $5 million recorded in Other accrued liabilities and $3 million recorded in Other liabilities in the accompanying consolidated balance sheet. |
The above contracts are subject to enforceable master netting arrangements that provide rights of offset with each counterparty when amounts are payable on the same date in the same currency or in the case of certain specified defaults. Management has made an accounting policy election to not offset the fair value of recognized derivative assets and derivative liabilities in the
balance sheet. The amounts owed to the counterparties and owed to the Company are considered immaterial with respect to each counterparty and in the aggregate with all counterparties.
International Paper sponsors and maintains the Retirement Plan of International Paper Company (the Pension Plan), a tax-qualified defined benefit pension plan that provides retirement benefits to substantially all U.S. salaried employees and hourly employees (receiving salaried benefits) hired prior to July 1, 2004, and substantially all other U.S. hourly and union employees who work at a participating business unit regardless of hire date. These employees generally are eligible to participate in the Pension Plan upon attaining 21 years of age and completing one year of eligibility service. U.S. salaried employees and hourly employees (receiving salaried benefits) hired after June 30, 2004, are not eligible for the Pension Plan, but receive a company
contribution to their individual savings plan accounts;Retirement Savings Account under the International Paper Company Salaried Savings Plan; however, salaried employees hired by Temple Inland prior to March 1, 2007 or Weyerhaeuser Company's Cellulose Fibers division prior to December 1, 2011 also participate in the Pension Plan.
The Pension Plan provides defined pension benefits based on years of credited service and either final average earnings (salaried employees and hourly employees receiving salaried benefits), hourly job rates or specified benefit rates (hourly and union employees).
TheEffective January 1, 2019, the Company will freezefroze participation, including credited service and compensation, for salaried employees under the Pension Plan, the Pension Restoration Plan and the two SERP plans for all service on or after January 1, 2019.plan. This change willdoes not affect benefits accrued through December 31, 2018. For service after December 31, 2018, employees affected by the freeze will instead receive a company contribution to their individual Retirement Savings Account.
Net periodic pension expense for our qualified and nonqualified U.S. defined benefit plans comprised the following:
| | | | Three Months Ended
March 31, | Three Months Ended
March 31, |
| In millions | 2018 | | 2017 | 2019 | | 2018 |
| Service cost | $ | 38 |
| | $ | 40 |
| $ | 18 |
| | $ | 38 |
|
| Interest cost | 118 |
| | 138 |
| 110 |
| | 118 |
|
| Expected return on plan assets | (200 | ) | | (192 | ) | (157 | ) | | (200 | ) |
| Actuarial loss | 82 |
| | 85 |
| 51 |
| | 82 |
|
| Amortization of prior service cost | 4 |
| | 7 |
| 4 |
| | 4 |
|
| Net periodic pension expense | $ | 42 |
| | $ | 78 |
| $ | 26 |
| | $ | 42 |
|
The components of net periodic pension expense other than the serviceService cost component are included in Non-operating pension expense in the Consolidated Statement of Operations.
The Company’s funding policy for our pension plans is to contribute amounts sufficient to meet legal funding requirements, plus any additional amounts that the Company may determine to be appropriate considering the funded status of the plan, tax deductibility, the cash flows generated by the Company, and other factors. NoThe Company made no voluntary cash contributions were made to the qualified pension plan in the first three months of 2018 and 2017.2019 or 2018. The nonqualified defined benefit plans are funded to the extent of benefit payments, which totaled $14$5 million for the three months ended March 31, 2018.2019.
International Paper has an Incentive Compensation Plan (ICP) which is administered by the Management Development and Compensation Committee of the Board of Directors (the Committee). The ICP authorizes the grants of restricted stock, restricted or deferred stock units, performance awards payable in cash or stock upon the attainment of specified performance goals, dividend equivalents, stock options, stock appreciation rights, other stock-based awards and cash-based awards at the discretion of the Committee. As of March 31, 2018, 11.82019, 10.4 million shares were available for grant under the ICP.
Stock-based compensation expense and related income tax benefits were as follows:
| | | | Three Months Ended
March 31, | Three Months Ended
March 31, |
| In millions | 2018 | | 2017 | 2019 | | 2018 |
| Total stock-based compensation expense (selling and administrative) | $ | 31 |
| | $ | 42 |
| $ | 27 |
| | $ | 31 |
|
| Income tax benefits related to stock-based compensation | 22 |
| | 48 |
| 34 |
| | 22 |
|
At March 31, 2018, $1772019, $185 million, net of estimated forfeitures, of compensation cost related to unvested restricted performance shares, executive continuity awards and restricted stock attributable to future service had not yet been recognized. This amount will be recognized in expense over a weighted-average period of 2.32.1 years.
Performance Share Plan
During the first three months of 2018,2019, the Company granted 1.82.4 million performance units at an average grant date fair value of $62.97.
International Paper’s business segments, Industrial Packaging, Global Cellulose Fibers and Printing Papers, are consistent with the internal structure used to manage these businesses. All segments are differentiated on a common product, common customer basis consistent with the business segmentation generally used in the Forest Products industry.
The Company also holds a 50% interest in Ilim Holding S.A. and a 20.5% interest in Graphic Packaging International LLC, which are separate reportable industry segments. See Note 11 for details of the Company's ownership in each of these investments.
Business segment operating profits are used by International Paper's management to measure the earnings performance of its businesses. Management believes that this measure allows a better understanding of trends in costs, operating efficiencies, prices and volumes. Business segment operating profits are defined as earnings (loss) from continuing operations before income taxes and equity earnings, but including the impact of equity earnings and noncontrolling interests, excluding interest expense, net, corporate items,expenses, net, corporate special items, net and non-operating pension expense.
Sales by business segment for the three months and three months ended March 31, 20182019 and 20172018 were as follows:
| | | | Three Months Ended
March 31, | | Three Months Ended
March 31, |
| In millions | 2018 | | 2017 | | 2019 | | 2018 |
| Industrial Packaging | $ | 3,827 |
| | $ | 3,577 |
| | $ | 3,832 |
| | $ | 3,827 |
|
| Global Cellulose Fibers | 677 |
| | 564 |
| | 689 |
| | 677 |
|
| Printing Papers | 1,053 |
| | 995 |
| | 1,065 |
| | 1,053 |
|
| Corporate and Intersegment Sales | 64 |
| | (4 | ) | | 57 |
| | 64 |
|
| Net Sales | $ | 5,621 |
| | $ | 5,132 |
| | $ | 5,643 |
| | $ | 5,621 |
|
Operating profit by business segment for the three months ended March 31, 20182019 and 20172018 were as follows:
| | | | Three Months Ended
March 31, | | Three Months Ended
March 31, |
| In millions | 2018 | | 2017 | | 2019 | | 2018 |
| Industrial Packaging | $ | 437 |
| | $ | 384 |
| | $ | 404 |
| | $ | 437 |
|
| Global Cellulose Fibers | 11 |
| | (70 | ) | | 32 |
| | 11 |
|
| Printing Papers | 64 |
| | 100 |
| | 143 |
| | 64 |
|
| Business Segment Operating Profits | 512 |
| | 414 |
| | 579 |
| | 512 |
|
| | | | | | | | |
| Earnings (loss) from continuing operations before income taxes and equity earnings | 356 |
| | 217 |
| | 418 |
| | 356 |
|
| Interest expense, net | 135 |
| | 142 |
| | 133 |
| | 135 |
|
| Noncontrolling interests/equity earnings adjustment | (1 | ) | | — |
| | (3 | ) | | (1 | ) |
| Corporate items, net | 9 |
| | 24 |
| | |
| Corporate expenses, net | | 21 |
| | 9 |
|
| Corporate special items, net | 9 |
| | — |
| | — |
| | 9 |
|
| Non-operating pension expense | 4 |
| | 31 |
|
| 10 |
| | 4 |
|
| $ | 512 |
| | $ | 414 |
| | |
| Business Segment Operating Profits | | $ | 579 |
| | $ | 512 |
|
On April 16, 2019, International Paper signed agreements to acquire DS Smith's French subsidiary, DS Smith Packaging Normandie, with two converting sites in Saint-Armand and Cabourg, and the former Europac Ovar box plant in Portugal for approximately €63 million (approximately $71 million at current exchange rates), subject to post-closing adjustments. The transaction is subject to customary closing conditions, including regulatory approvals.
EXECUTIVE SUMMARY
Net earnings (loss) attributable to International Paper common shareholders were $424 million ($1.05 per diluted share) in the first quarter of 2019, compared with $316 million ($0.78 per diluted share) in the fourth quarter of 2018 and $729 million ($1.74 per diluted share) in the first quarter of 2018, compared with $1.5 billion ($3.50 per diluted share) in the fourth quarter of 2017 and $209 million ($0.50 per diluted share) in the first quarter of 2017.2018. Adjusted Operating Earnings is a non-GAAP measure and is defined as net earnings from continuing operations (a GAAP measure) excluding special items and non-operating pension expense. International Paper generated Adjusted Operating Earnings Attributable to International Paper Common Shareholders of $447 million ($1.11 per diluted share) in the first quarter of 2019, compared with $670 million ($1.65 per diluted share) in the fourth quarter of 2018 and $395 million ($0.94 per diluted share) in the first quarter of 2018, compared with $530 million ($1.27 per diluted share) in the 2017 fourth quarter and $232 million ($0.56 per diluted share) in the 2017 first quarter.2018.
International Paper delivered solid earnings and strong cash generation in the first quarter. Demand in North American corrugated packaging was lower seasonally as expected and export shipments for containerboard and absorbent pulp were weak, as customers drew down inventories. Operational performance was strong and we managed costs well by leveraging the strength and flexibility of our system in a heavy downtime quarter in North America. Our equity earnings were $114 million, which includes $101 million from our Ilim joint venture and $13 million from our ownership interest in Graphic Packaging. Overall, the Company performed well in a lower demand quarter to deliver meaningful year-over-year growth in cash from operations and free cash flow.
Price and mix were stable in the first quarter with higher average prices in our North American corrugated packaging offset by lower export prices for containerboard and absorbent fibers, as well as weaker mix in Latin America papers. Volume decreased primarily due to lower seasonal demand in North American corrugated packaging and Brazil Papers, as well as lower export containerboard and absorbent pulp shipments due to customer destocking in the first quarter. Operations and costs were impacted by economic downtime in our North American Packaging and Global Cellulose Fibers businesses as we managed our production to meet our customers’ needs. Mill performance was strong year-over-year earnings growth from the combination of healthy global demand for- we managed costs well and optimized our productssystem while managing economic downtime and the continued realization of recent price increases across all three of our business segments. We successfully executed approximately one-third of our 2018higher planned maintenance outages duringin the quarter. Input costs were favorable versus the prior quarter, with lower recovered fiber costs largely offsetting higher wood fiber costs. Energy costs were also lower and managed through weather-related disruptions and other unusual events. Duringdistribution costs moderated in the 2018 first quarter, ourquarter. Our Ilim joint venture generated recorddelivered solid commercial and operational performance. Ilim equity earnings also benefited from a non-cash, foreign exchange gain on Ilim’s U.S. dollar denominated net debt. International Paper generated strong cash from operations and delivered $116free cash flow in the first quarter. The Company returned $381 million, representing about 87% of free cash flow, to our shareholders through dividends of $201 million and share repurchases of $180 million in cash dividends to International Paper.the quarter.
The Company continued to experience price realization momentum across its portfolio during the 2018 first quarter as a result of recent pricing initiatives. As expected, volumes were seasonally lower than the 2017 fourth quarter across all three of our businesses; however, underlying demand remains strong. In addition to the impact of seasonality, volumes in our Global Cellulose Fibers business were impacted by lower shipments due to ongoing rail service issues in Canada. Input costs were higher versus the 2017 fourth quarter, driven by higher seasonal wood costs, as well as, higher chemical and fuel costs, which were partially offset by lower costs for recovered fiber. Supply chain cost pressures continued to be a headwind across all North American operations during the 2018 first quarter, driven by tight rail and truck capacity. Operationally, we performed well in the 2018 first quarter despite challenging weather conditions and a heavy planned maintenance outage quarter. Operations were impacted by weather disruptions, primarily frigid conditions across the eastern United States and heavy rainfall in the southern United States, as well as other unusual events, including unplanned downtime at our Kwidzyn, Poland mill. Finally, we reported equity earnings from our 20.5% ownership interest in Graphic Packaging for the first time during the 2018 first quarter.
Looking ahead to the 2018 second quarter 2019, we expect to see continuing benefits from previous price increases instronger seasonal demand across our North Americanbusinesses as we execute our highest planned maintenance outage quarter of the year. In Industrial Packaging business along with continued realization of previous price increaseswe expect stronger seasonal demand for corrugated packaging in North America and improved mixEurope, while export containerboard volume is expected to recover slowly as customer destocking continues in ourthe second quarter. In Global Cellulose Fibers, North American Papers and PrintingBrazil Papers businesses. Volumes are expected to be seasonally higherwe expect stronger seasonal demand. Price and mix in our North American Industrial Packaging and Printing Papers businesses while sequentially flat in our Global Cellulose Fibers business. Operations are expected to benefitnegatively impact earnings, while in North American Papers we expect to realize benefits from the non-repeat of the challenging weather conditions experienced during the 2018 first quarter. Maintenance outages are expected to again be high as we anticipate the completion of approximately 75% of our total annual maintenance outages by the end of the second quarter. Inputrecent price increases. Operations and costs are expected to remain largely flat in our Printing Papers and Global Cellulose Fibers businesses while our Industrial Packaging business should benefit from lower OCC costs. We also anticipate the start-up of the Madrid mill laterimprove in the second quarter whichdriven mostly by improved fixed cost absorption in North American Packaging and improved operations in European Packaging. The Company expects to complete the highest planned maintenance outage quarter of the year in the second quarter and across the system will produce 400,000 metric tonshave completed 75% of light-weight recycled containerboardplanned maintenance outages, representing about $400 million, during the first half of 2019. Finally, for our European packaging business. For our Ilim joint venture seasonally stronger sales volumes are expectedwe expect lower equity earnings due mostly to be partially offset by a heavyhigher planned maintenance outages in the second quarter.
Adjusted Operating Earnings and Adjusted Operating Earnings Per Share are non-GAAP measures and are defined as net earnings from continuing operations (a GAAP measure) excluding special items and non-operating pension expense. DilutedNet earnings (loss) and Diluted earnings (loss) per share attributable to common shareholders are the most direct comparable GAAP measures. The Company calculates Adjusted Operating Earnings by excluding the after-tax effect of non-operating pension expense, items considered by management to be unusual and discontinued operations from the earnings reported under GAAP, non-operating pension expense (includes all U.S. pension costs, excluding service costs and prior service costs), and discontinued operations.GAAP. Adjusted Operating Earnings Per Share is calculated by dividing Adjusted Operating Earnings by diluted average shares of common stock outstanding. Management uses this measure to focus on on-going operations, and believes that it is useful to investors because it enables them to perform meaningful comparisons of past and present operating results. The Company believes that using this information, along with the most directdirectly comparable GAAP measure, provides for a more complete analysis of the results of operations.
The following are reconciliations of Diluted earningsEarnings (loss) attributable to common shareholders to Adjusted Operating Earnings (Loss) attributable to common shareholders. | | | | Three Months Ended
March 31, | | Three Months Ended December 31, | Three Months Ended
March 31, | | Three Months Ended December 31, |
| In millions | 2018 | | 2017 | | 2017 | 2019 | | 2018 | | 2018 |
| Diluted Earnings (Loss) Attributable to Shareholders | $ | 729 |
| | $ | 209 |
| | $ | 1,460 |
| |
| Add back - Discontinued operations (gain) loss | (368 | ) | | (17 | ) | | 8 |
| |
| Diluted Earnings (Loss) from Continuing Operations | 361 |
| | 192 |
| | 1,468 |
| |
| Add Back - Non-operating pension (income) expense | 4 |
| | 31 |
| | 386 |
| |
| Earnings (Loss) Attributable to Shareholders | | $ | 424 |
| | $ | 729 |
| | $ | 316 |
|
| Less - Discontinued operations (gain) loss | | — |
| | (368 | ) | | — |
|
| Earnings (Loss) from Continuing Operations | | 424 |
| | 361 |
| | 316 |
|
| Add Back - Non-operating pension expense (income) | | 10 |
| | 4 |
| | 429 |
|
| Add Back - Net special items expense (income) | 40 |
| | 14 |
| | 106 |
| 21 |
| | 40 |
| | (15 | ) |
| Income tax effect - Non-operating pension and special items expense | (10 | ) | | (5 | ) | | (1,430 | ) | (8 | ) | | (10 | ) | | (60 | ) |
| Adjusted Operating Earnings (Loss) Attributable to Shareholders | $ | 395 |
| | $ | 232 |
| | $ | 530 |
| $ | 447 |
| | $ | 395 |
| | $ | 670 |
|
| | | | Three Months Ended
March 31, | | Three Months Ended December 31, | Three Months Ended
March 31, | | Three Months Ended December 31, |
| In millions | 2018 | | 2017 | | 2017 | |
| | | 2019 | | 2018 | | 2018 |
| Diluted Earnings (Loss) Per Share Attributable to Shareholders | $ | 1.74 |
| | $ | 0.50 |
| | $ | 3.50 |
| $ | 1.05 |
| | $ | 1.74 |
| | $ | 0.78 |
|
| Add Back - Discontinued operations (gain) loss per share | (0.88 | ) | | (0.04 | ) | | 0.02 |
| |
| Less - Discontinued operations (gain) loss per share | | — |
| | (0.88 | ) | | — |
|
| Diluted Earnings (Loss) Per Share from Continuing Operations | 0.86 |
| | 0.46 |
| | 3.52 |
| 1.05 |
| | 0.86 |
| | 0.78 |
|
| Add Back - Non-operating pension (income) expense per share | 0.01 |
| | 0.08 |
| | 0.92 |
| |
| Add Back - Non-operating pension expense (income) per share | | 0.02 |
| | 0.01 |
| | 1.05 |
|
| Add Back - Net special items expense (income) per share | 0.09 |
| | 0.03 |
| | 0.25 |
| 0.05 |
| | 0.09 |
| | (0.04 | ) |
| Income tax effect per share - Non-operating pension and special items expense | (0.02 | ) | | (0.01 | ) | | (3.42 | ) | (0.01 | ) | | (0.02 | ) | | (0.14 | ) |
| Adjusted Operating Earnings (Loss) Per Share Attributable to Shareholders | $ | 0.94 |
| | $ | 0.56 |
| | $ | 1.27 |
| $ | 1.11 |
| | $ | 0.94 |
| | $ | 1.65 |
|
The Company generated free cash flow of approximately $174$440 million and $259$174 million in the first three months of 20182019 and 2017,2018, respectively. Free cash flow is a non-GAAP measure and the most directly comparable GAAP measure is cash provided by operations. Management believes that free cash flow is useful to investors as a liquidity measure because it measures the amount of cash generated that is available, after reinvesting in the business, to maintain a strong balance sheet, pay dividends, repurchase stock, service debt and make investments for future growth. It should not be inferred that the entire free cash flow amount is available for discretionary expenditures. By adjusting for certain items that are not indicative of the Company's ongoing performance, free cash flow also enables investors to perform meaningful comparisons between past and present periods.
The following is a reconciliation of cash provided by operations to free cash flow:
| | | | Three Months Ended
March 31, | Three Months Ended
March 31, |
| In millions | 2018 | | 2017 | 2019 | | 2018 |
| Cash provided by operations | $ | 663 |
| | $ | 633 |
| $ | 733 |
| | $ | 663 |
|
| Adjustments: | | | | | | |
| Cash invested in capital projects | (489 | ) | | (374 | ) | (293 | ) | | (489 | ) |
| Free Cash Flow | $ | 174 |
| | $ | 259 |
| $ | 440 |
| | $ | 174 |
|
RECENT DEVELOPMENTS
On March 6, 2018, Smurfit Kappa Group plc (“Smurfit Kappa”) published a public announcement in which it stated that it had received and rejected an unsolicited proposal from us whereby International Paper would acquire the entire issued and to be issued share capital of Smurfit Kappa. Pursuant to the offer, Smurfit Kappa shareholders would have been entitled to receive €22.00 in cash and 0.3028 new International Paper shares of common stock for each Smurfit Kappa ordinary share held by them. On March 23, 2018, Smurfit Kappa announced that it had received and rejected a revised offer by International Paper whereby Smurfit Kappa shareholders would be entitled to receive €25.25 in cash and 0.3028 new International Paper shares of common stock for each Smurfit Kappa ordinary share held by them. The revised offer values Smurfit Kappa’s entire issued and to be issued share capital at approximately €9.5 billion.
No agreement has been reached with Smurfit Kappa and there can be no assurance that any transaction will result from our proposal.
For the first quarter of 2018,2019, International Paper Company reported net sales of $5.6 billion, compared with $5.7$6.0 billion in the fourth quarter of 20172018 and $5.1$5.6 billion in the first quarter of 2017.2018.
Net earnings attributable to International Paper totaled $424 million, or $1.05 per diluted share, in the 2019 first quarter. This compared with $316 million, or $0.78 per diluted share, in the fourth quarter of 2018 and $729 million, or $1.74 per diluted share, in the 2018 first quarter. This compared with $1.5 billion, or $3.50 per diluted share, in the fourth quarter of 2017 and $209 million or $0.50 per diluted share, in the first quarter of 2017.
2018.
Earnings from continuing operations attributable to International Paper Company were $424 million in the first quarter of 2019, $316 million in the fourth quarter of 2018 and $361 million in the first quarter of 2018.
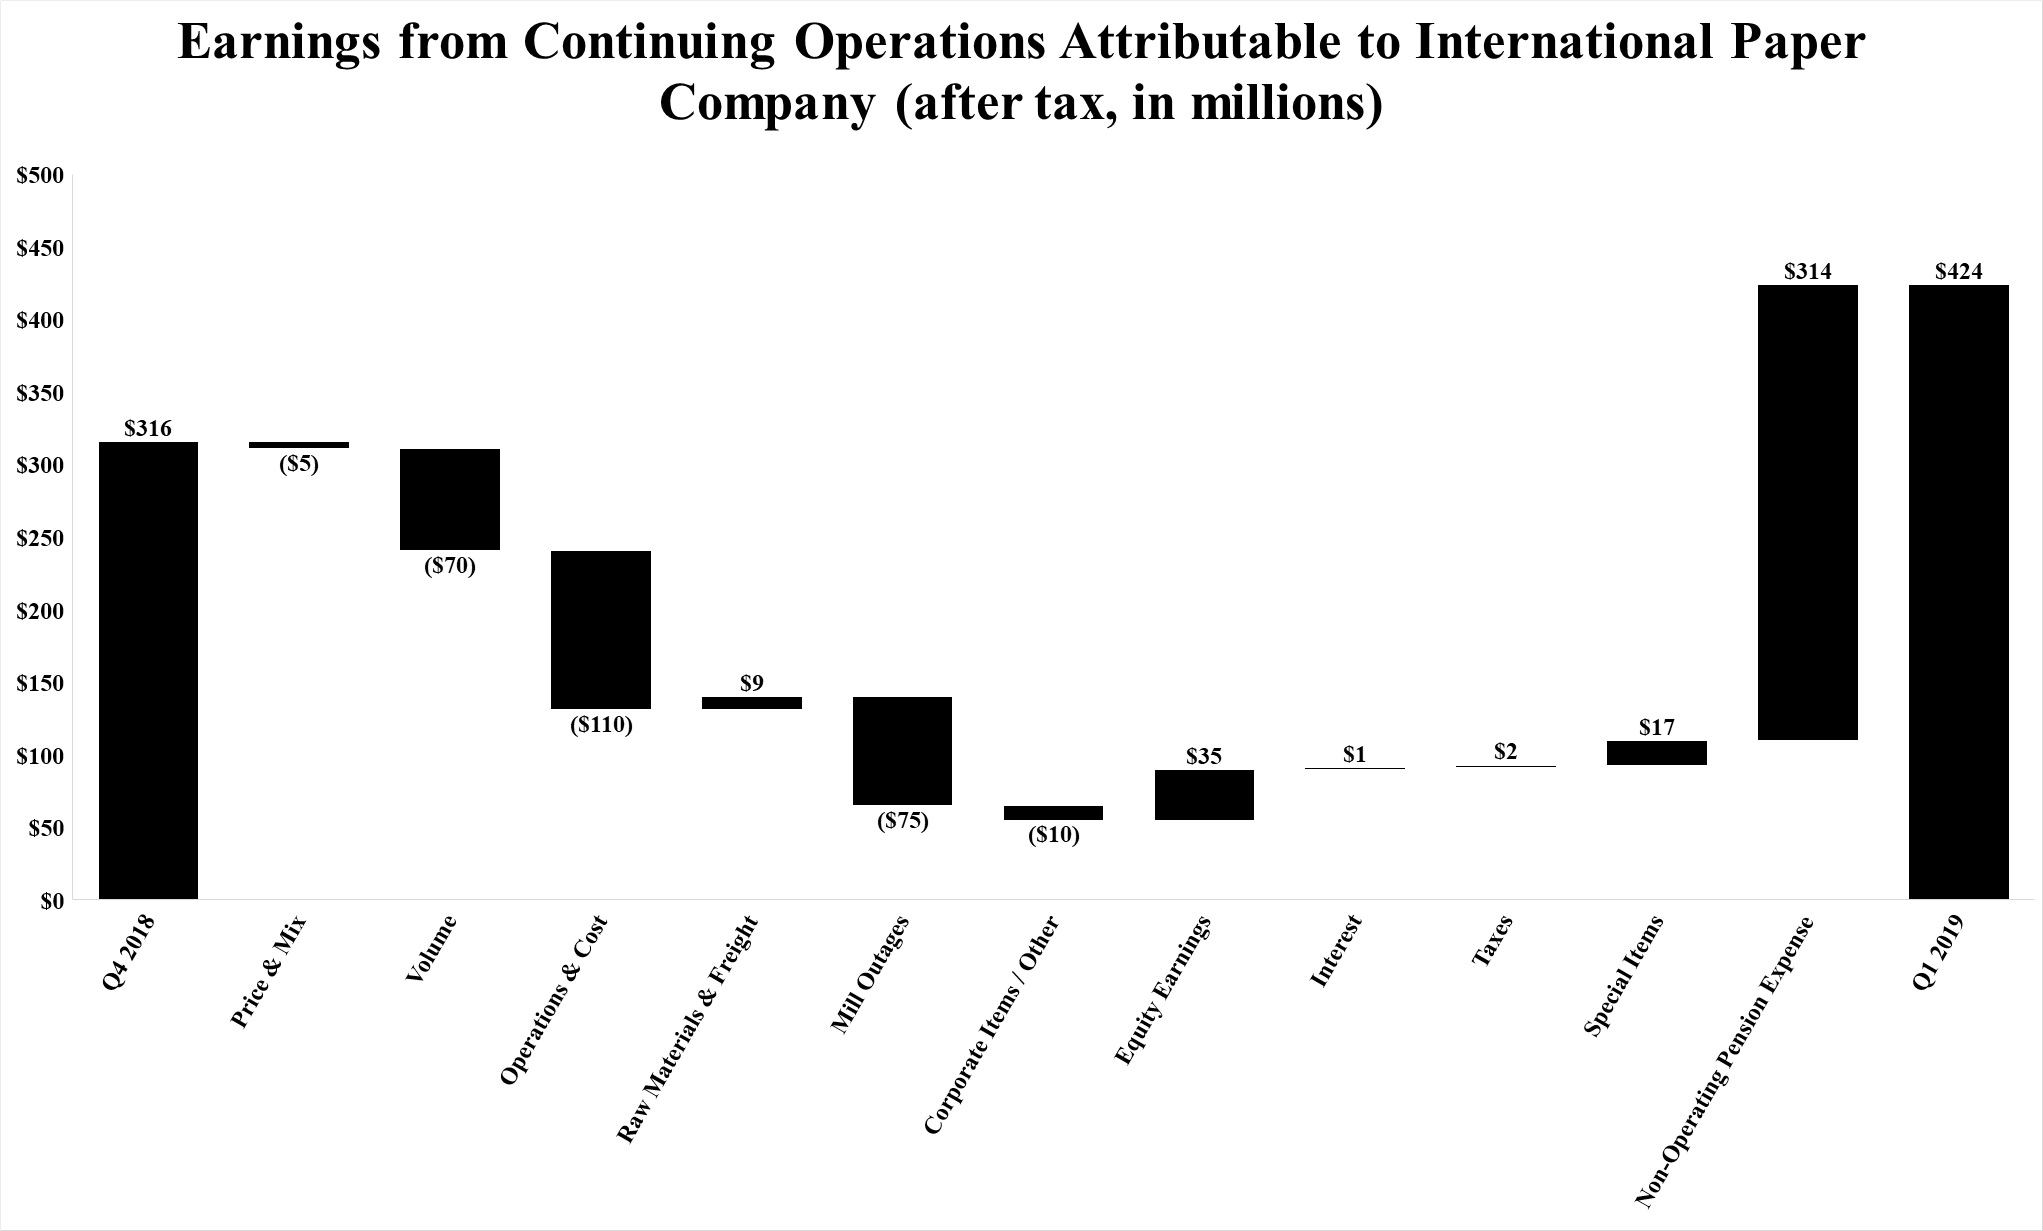
Compared with the fourth quarter of 2018, compared with $192earnings benefited from lower raw material and freight costs ($9 million), lower net interest expense ($1 million), lower tax expense ($2 million) and lower non-operating pension expense ($314 million). These benefits were offset by lower average sales prices and an unfavorable mix ($5 million), lower sales volumes ($70 million), higher operating costs ($110 million), higher mill maintenance outage costs ($75 million) and higher corporate and other items ($10 million). Equity earnings, net of taxes, relating to International Paper’s investments in Ilim Holding S.A., Graphic Packaging International Partners, LLC, and other investments were $35 million higher than in the fourth quarter of 2018. Net special items in the first quarter of 2017 and $1.5 billion2019 were a loss of $15 million compared with a loss of $32 million in the fourth quarter of 2017. 2018.
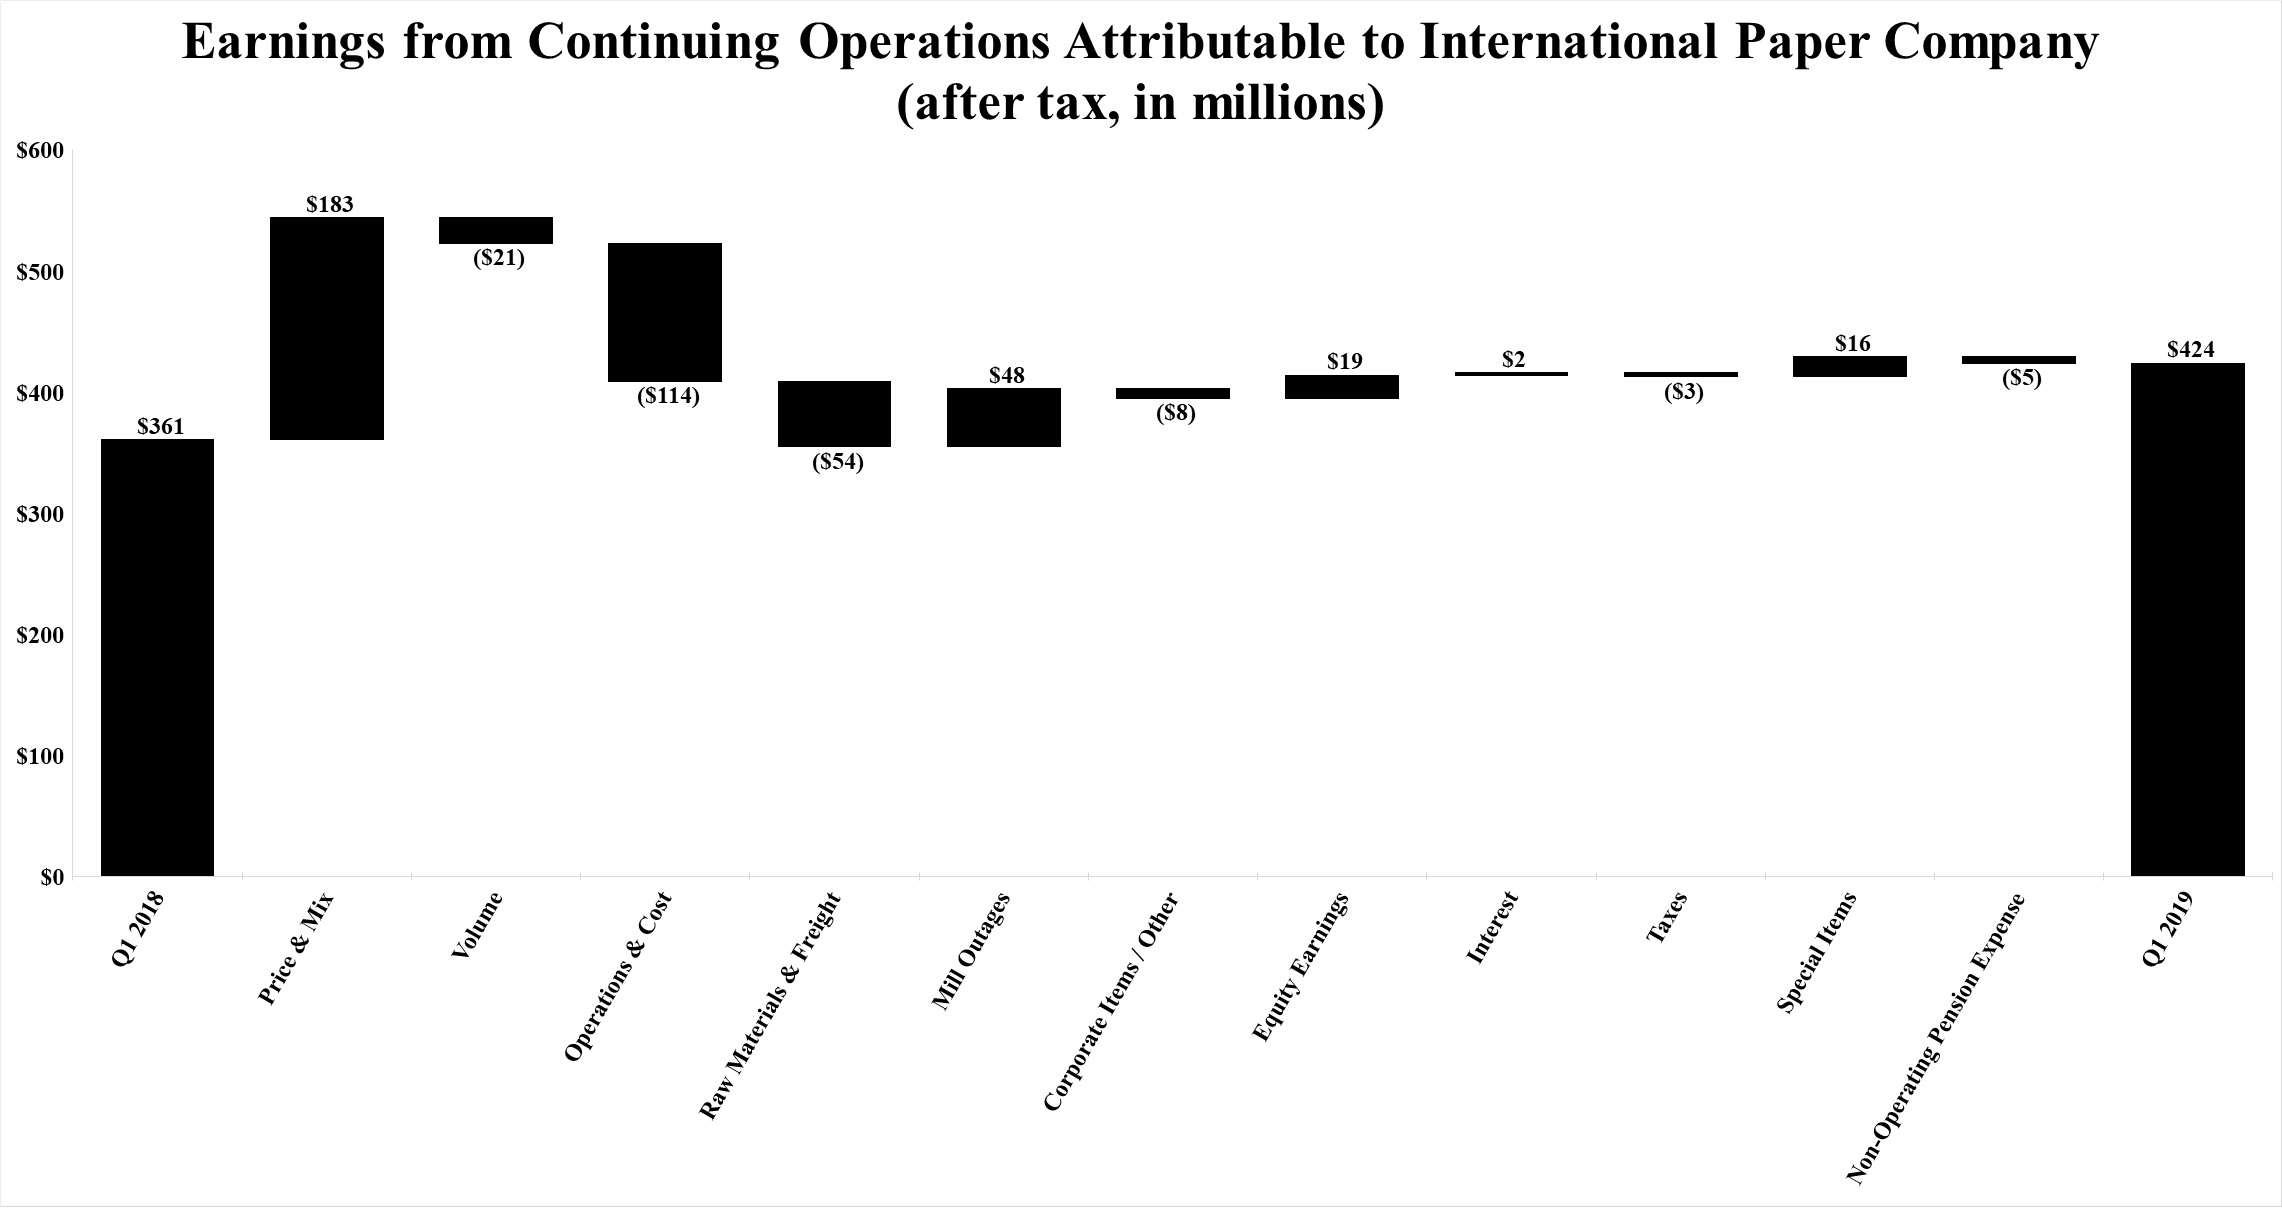
Compared with the first quarter of 2017,2018, the 2018 first quarter of 2019 reflects higher average sales prices, net of an unfavorable mix ($198 million), higher sales volumes ($4183 million), lower corporate and othermill maintenance outage costs ($1548 million), and lower net interest expense ($5 million), lower tax expense ($19 million) reflecting a lower estimated tax rate and lower non-operating pension expense ($162 million). These benefits were offset by lower sales volumes ($21 million), higher operating costs ($50114 million), higher raw material and freight costs ($2654 million), higher corporate and other costs ($8 million), higher tax expense ($3 million) and higher mill maintenance outage costsnon-operating pension expense ($445 million). Equity earnings, net of taxes, relating to International Paper’s investmentinvestments in Ilim Holding S.A., Graphic Packaging International Partners, LLC, and other investments were $42$19 million higher in the 2018 first quarter of 2019 than in the 2017 first quarter.quarter of 2018. Net special items in the 2018 first quarter of 2019 were a loss of $31$15 million compared with a loss of $21$31 million in the 2017 first quarter.
Compared with the fourth quarter of 2017, earnings benefited from higher average sales prices net of an unfavorable mix ($40 million), lower corporate and other items ($9 million), lower net interest expense ($5 million), lower tax expense ($30 million) reflecting a lower estimated tax rate and lower non-operating pension expense ($235 million). These benefits were offset by lower sales volumes ($56 million), higher operating costs ($62 million), higher raw material and freight costs ($24 million) and higher mill maintenance outage costs ($105 million). Equity earnings, net of taxes, relating to International Paper’s investment in Ilim Holding, S.A. were $28 million higher than in the 2017 fourth quarter. Net special items in the 2018 first quarter were a loss of $31 million compared with a gain of $1.2 billion in the 2017 fourth quarter.2018.
Business Segment Operating Profits are used by International Paper's management to measure the earnings performance of its businesses. Management uses this measure to focus on on-going operations, and believes that it is useful to investors because it enables them to perform meaningful comparisons of past and present operating results. International Paper believes that using this measure allowsinformation, along with net earnings, provides a better understandingmore complete analysis of trends in costs, operating efficiencies, prices and volumes.the results of operations by quarter. Business Segment Operating Profits are defined as earnings (loss) from continuing operations before income taxes and equity earnings, but including the impact of equity earnings and noncontrolling interests, excluding interest expense, net, corporate items,expenses, net, corporate special items, net and non-operating pension expense.
International Paper operates in three segments: Industrial Packaging, Global Cellulose Fibers and Printing Papers.
The following table presents a reconciliation of net earnings (loss) from continuing operations attributable to International Paper Company to its Total Business Segment Operating Profit:
| | | | Three Months Ended | Three Months Ended |
| | March 31, | | December 31, | March 31, | | December 31, |
| In millions | 2018 | | 2017 | | 2017 | 2019 | | 2018 | | 2018 |
| Earnings (Loss) From Continuing Operations Attributable to International Paper Company | $ | 361 |
| | $ | 192 |
| | $ | 1,468 |
| |
| Net Earnings (Loss) From Continuing Operations Attributable to International Paper Company | | $ | 424 |
| | $ | 361 |
| | $ | 316 |
|
| Add back (deduct): | | | | | | | | | | |
| Income tax provision (benefit) | 89 |
| | 73 |
| | (1,207 | ) | 106 |
| | 89 |
| | 143 |
|
| Equity (earnings) loss, net of taxes | (95 | ) | | (48 | ) | | (64 | ) | (114 | ) | | (95 | ) | | (79 | ) |
| Noncontrolling interests, net of taxes | 1 |
| | — |
| | — |
| 2 |
| | 1 |
| | 2 |
|
| Earnings (Loss) From Continuing Operations Before Income Taxes and Equity Earnings | 356 |
| | 217 |
| | 197 |
| 418 |
| | 356 |
| | 382 |
|
| Interest expense, net | 135 |
| | 142 |
| | 141 |
| 133 |
| | 135 |
| | 135 |
|
| Noncontrolling interests / equity earnings included in operations | (1 | ) | | — |
| | (1 | ) | (3 | ) | | (1 | ) | | (3 | ) |
| Corporate items | 9 |
| | 24 |
| | 18 |
| |
| Special items (income) expense | 9 |
| | — |
| | 83 |
| |
| Corporate expenses, net | | 21 |
| | 9 |
| | 8 |
|
| Corporate special items (income) expense | | — |
| | 9 |
| | (21 | ) |
| Non-operating pension expense | 4 |
| | 31 |
| | 386 |
| 10 |
| | 4 |
| | 429 |
|
| Adjusted Operating Profit | $ | 512 |
| | $ | 414 |
| | $ | 824 |
| $ | 579 |
| | $ | 512 |
| | $ | 930 |
|
| Business Segment Operating Profit: | | | | | | | | | | |
| Industrial Packaging | $ | 437 |
| | $ | 384 |
| | $ | 609 |
| $ | 404 |
| | $ | 437 |
| | $ | 647 |
|
| Global Cellulose Fibers | 11 |
| | (70 | ) | | 79 |
| 32 |
| | 11 |
| | 91 |
|
| Printing Papers | 64 |
| | 100 |
| | 136 |
| 143 |
| | 64 |
| | 192 |
|
| Total Business Segment Operating Profit | $ | 512 |
| | $ | 414 |
| | $ | 824 |
| $ | 579 |
| | $ | 512 |
| | $ | 930 |
|
Business Segment Operating Profit
Total business segment operating profits were $579 million in the first quarter of 2019, $930 million in the fourth quarter of 2018 and $512 million in the 2018 first quarter comparedof 2018.
Compared with $414the fourth quarter of 2018, operating profits benefited from lower raw material and freight costs ($12 million). These benefits were offset by lower average sales prices and an unfavorable mix ($7 million), lower sales volumes ($94 million), higher operating costs ($147 million) and higher mill outage costs ($100 million). Special items were a loss of $21 million in the 2017 first quarter and $824of 2019 compared with a loss of $6 million in the 2017 fourth quarter. quarter of 2018.
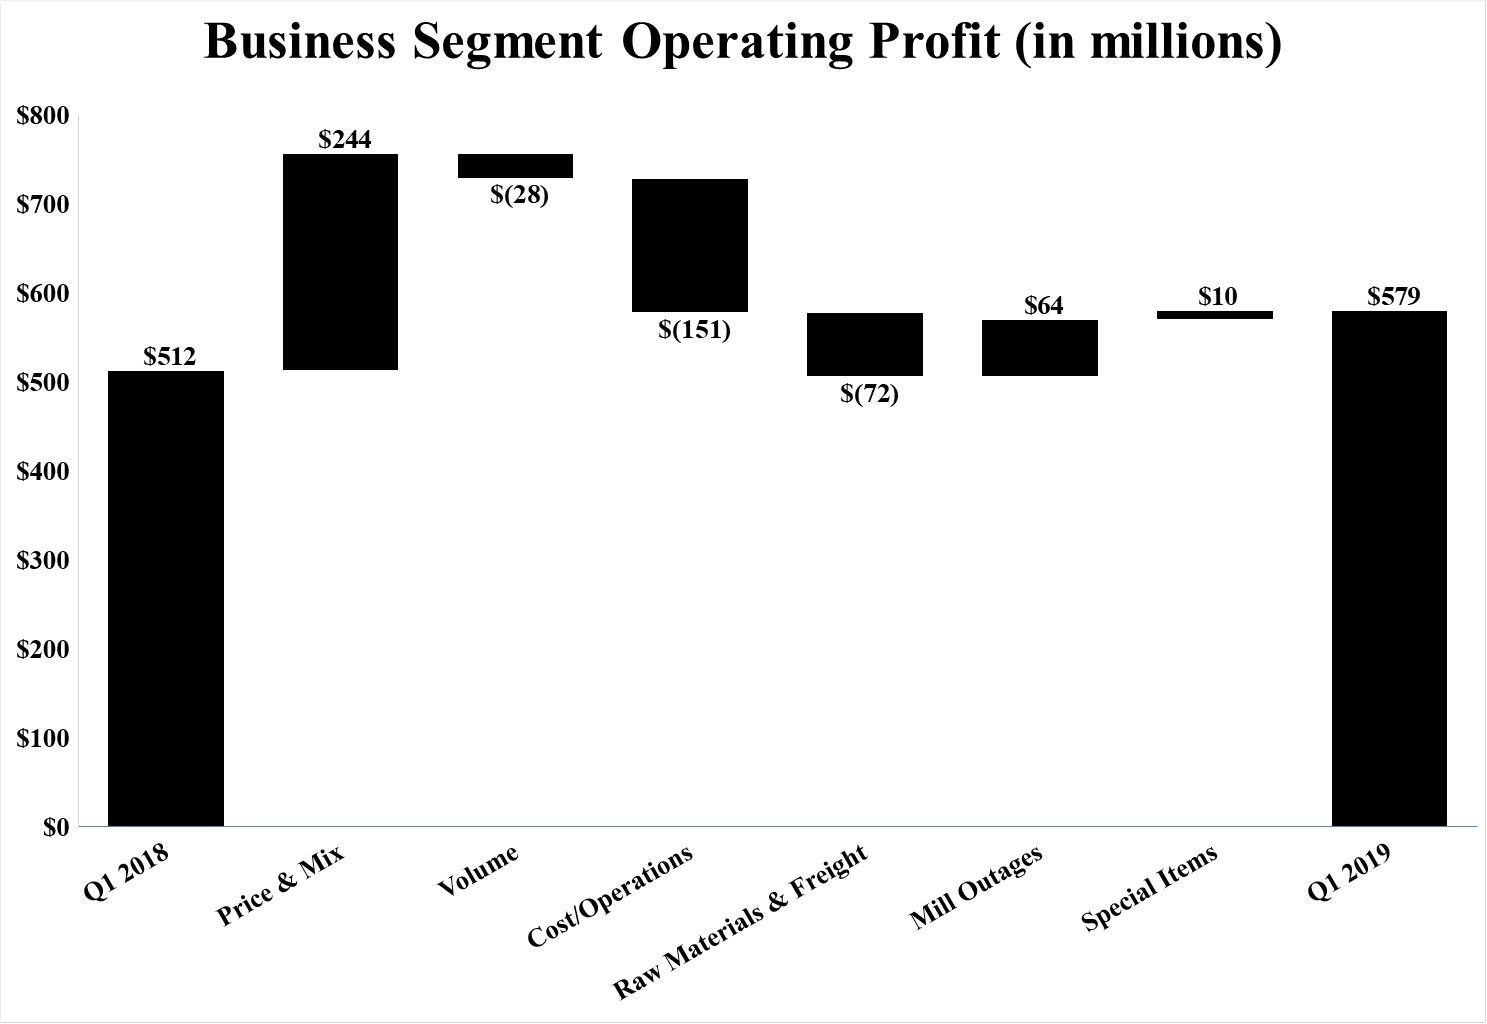
Compared with the first quarter of 2017,2018, operating profits in the current quarter benefited from higher average sales prices net of an unfavorable mix ($282244 million) and higher sales volumes ($5 million). These benefits were offset by higher operating costs ($72 million), higher raw material and freight costs ($37 million) and higherlower mill outage costs ($63 million). Special items were a loss of $31 million in the 2018 first quarter compared with a loss of $14 million in the 2017 first quarter.
Compared with the fourth quarter of 2017, operating profits benefited from higher average sales prices net of an unfavorable mix ($5964 million). These benefits were offset by lower sales volumes ($8328 million), higher operating costs ($90151 million), and higher raw material and freight costs ($36 million) and higher mill outage costs ($15572 million). Special items were a loss of $31$21 million in the 2018 first quarter of 2019 compared with a loss of $24$31 million in the 2017 fourth quarter.first quarter of 2018.
During the 2018 first quarter, International Paper took approximately 322,000 tons of downtime of which none were economic-related, compared with approximately 242,000 tons of downtime, which included about 35,000 tons that were economic-related, in the 2017 first quarter. During the 2017 fourth quarter, International Paper took approximately 80,000 tons of downtime of which approximately 6,000 tons were economic-related. Economic downtime is takenresults from the amount of production required to balance internal supply withmeet our customer demand, whiledemand. Planned maintenance downtime is taken periodically duringthroughout the year. The following table details planned maintenance and economic-related downtime (in tons):
|
| | | | | | |
| | Three Months Ended March 31, 2019 | Three Months Ended March 31, 2018 | Three Months Ended December 31, 2018 |
| Economic-related downtime | 484 |
| — |
| — |
|
| Maintenance downtime | 156 |
| 285 |
| 57 |
|
Sales Volumes by Product (a)
Sales volumes of major products for the three months ended March 31, 20182019 and 20172018 were as follows:
| | | | Three Months Ended
March 31, | Three Months Ended
March 31, |
| In thousands of short tons (except as noted) | 2018 | | 2017 | 2019 | | 2018 |
| Industrial Packaging | | | | | | |
| Corrugated Packaging (c) | 2,579 |
| | 2,537 |
| 2,535 |
| | 2,579 |
|
| Containerboard | 783 |
| | 813 |
| 697 |
| | 783 |
|
| Recycling | 537 |
| | 585 |
| 609 |
| | 537 |
|
| Saturated Kraft | 46 |
| | 46 |
| 41 |
| | 46 |
|
| Gypsum/Release Kraft | 53 |
| | 53 |
| 51 |
| | 53 |
|
| Bleached Kraft | 7 |
| | 7 |
| 7 |
| | 7 |
|
| EMEA Packaging (c) (d) | 397 |
| | 374 |
| |
| EMEA Packaging (c) | | 370 |
| | 397 |
|
| Brazilian Packaging (c) | 86 |
| | 86 |
| 85 |
| | 86 |
|
| European Coated Paperboard | 96 |
| | 99 |
| 104 |
| | 96 |
|
| Industrial Packaging | 4,584 |
| | 4,600 |
| 4,499 |
| | 4,584 |
|
Global Cellulose Fibers (in thousands of metric tons) (b) | 895 |
| | 877 |
| 859 |
| | 895 |
|
| Printing Papers | | | | | | |
| U.S. Uncoated Papers | 470 |
| | 489 |
| 448 |
| | 470 |
|
| European and Russian Uncoated Papers | 361 |
| | 359 |
| 354 |
| | 361 |
|
| Brazilian Uncoated Papers | 260 |
| | 264 |
| 244 |
| | 260 |
|
| Indian Uncoated Papers | 67 |
| | 61 |
| 68 |
| | 67 |
|
| Printing Papers | 1,158 |
| | 1,173 |
| 1,114 |
| | 1,158 |
|
| |
| (a) | Sales volumes include third party and inter-segment sales and exclude sales of equity investees. |
| |
| (b) | Includes North American, European and Brazilian volumes and internal sales to mills. |
| |
| (c) | Volumes for corrugated box sales reflect consumed tons sold (CTS). Board sales for these businesses reflect invoiced tons. |
| |
(d) | Excludes newsprint sales volumes at the Madrid, Spain mill. |
Discontinued Operations
Income Taxes
An income tax provision of $89$106 million was recorded for the 2018 first quarter of 2019 and the reported effective income tax rate was 25%. Excluding a benefit of $6 million related to the tax effects of special items and a benefit of $2 million related to the tax effects of non-operating pension expense, the effective income tax rate was 25% for continuing operationsthe quarter.
An income tax provision of $143 million was recorded for the fourth quarter of 2018 and the reported effective income tax rate was 37%. Excluding an expense of $47 million related to the tax effects of special items and a benefit of $107 million related to the tax effects of non-operating pension expense, the effective income tax rate was 26% for the quarter.
An income tax provision of $89 million was recorded for the first quarter of 2018 and the reported effective income tax rate was 25%. Excluding a benefit of $9 million related to the tax effects of special items and a benefit of $1 million related to the tax effects of non-operating pension expense, the effective income tax rate for continuing operations was 25% for the quarter.
An income tax benefit of $1.2 billion was recorded for the 2017 fourth quarter and the effective income tax rate for continuing operations was (613)%. Excluding a provisional net tax benefit of $1.2 billion related to the enactment of the Tax Cuts and Jobs
Act, a benefit of $60 million related to the tax effects of other special items and a benefit of $148 million related to the tax effects of non-operating pension expense, the effective income tax rate for continuing operations was 32% for the quarter.
An income tax provision of $73 million was recorded for the 2017 first quarter and the reported effective income tax rate for continuing operations was 34%. Excluding a provision of $7 million related to the tax effects of special items and a benefit of $12 million related to the tax effects of non-operating pension expense, the effective income tax rate for continuing operations was 30% for the quarter.
Interest Expense
Net interest expense forwas $133 million in the 2018 first quarter wasof 2019 compared with $135 million compared with $141 million which includes interest income of $1 million related to income tax refund claims in both the 2017 fourth quarter and $142 million in the 2017 first quarter.quarter of 2018.
Effects of Special Items and Non-Operating Pension Expense
Details of special items and non-operating pension expense (income) for the three months ended are as follows:
| | | | | Three Months Ended | | Three Months Ended |
| | | March 31, | | December 31, | | March 31, | | December 31, |
| | | 2018 | | 2017 | | 2017 | | 2019 | | 2018 | | 2018 |
| In millions | | Before Tax | | After Tax | | Before Tax | | After Tax | | Before Tax | | After Tax | | Before Tax | | After Tax | | Before Tax | | After Tax | | Before Tax | | After Tax |
| Business Segments | | | | | | | | | | | | | | | | | | | | | | | | |
| Multi-employer pension plan exit liability | | | $ | 16 |
| | $ | 12 |
| | $ | — |
| | $ | — |
| | $ | — |
| | $ | — |
|
| Gain on sale of EMEA Packaging box plant | | | (7 | ) | | (6 | ) | | — |
| | — |
| | — |
| | — |
|
| EMEA Packaging optimization | | $ | 22 |
| | $ | 17 |
| | $ | — |
| | $ | — |
| | $ | — |
| | $ | — |
| | — |
| | — |
| | 22 |
| | 17 |
| | (1 | ) | | (1 | ) |
| Abandoned property removal | | 9 |
| | 7 |
| | 2 |
| | 2 |
| | 6 |
| | 4 |
| | 11 |
| | 8 |
| | 9 |
| | 7 |
| | 8 |
| | 6 |
|
| Weyerhaeuser pulp business acquisition inventory fair value step-up amortization | | — |
| | — |
| | 14 |
| | 8 |
| | — |
| | — |
| |
| Weyerhaeuser pulp business integration costs | | — |
| | — |
| | 4 |
| | 2 |
| | 18 |
| | 11 |
| |
| Holmen mill bargain purchase gain | | — |
| | — |
| | (6 | ) | | (6 | ) | | — |
| | — |
| |
| Riverdale mill conversion | | | 1 |
| | 1 |
| | — |
| | — |
| | 4 |
| | 3 |
|
| Litigation settlement recovery | | | — |
| | — |
| | — |
| | — |
| | (5 | ) | | (4 | ) |
| Business Segments Total | | 31 |
| | 24 |
| | 14 |
| | 6 |
| | 24 |
| | 15 |
| | 21 |
| | 15 |
| | 31 |
| | 24 |
| | 6 |
| | 4 |
|
| Corporate | | | | | | | | | | | | | | | | | | | | | | | | |
| Debt extinguishment | | — |
| | — |
| | — |
| | — |
| | 83 |
| | 51 |
| |
| Legal settlement | | 9 |
| | 7 |
| | — |
| | — |
| | — |
| | — |
| | — |
| | — |
| | 9 |
| | 7 |
| | — |
| | — |
|
| Interest income related to income tax refund claim | | — |
| | — |
| | — |
| | — |
| | (1 | ) | | (1 | ) | |
| Debt extinguishment costs | | | — |
| | — |
| | — |
| | — |
| | 10 |
| | 7 |
|
| Gain on sale of investment in Liaison Technologies | | | — |
| | — |
| | — |
| | — |
| | (31 | ) | | (23 | ) |
| Corporate Total | | 9 |
| | 7 |
| | — |
| | — |
| | 82 |
| | 50 |
| | — |
| | — |
| | 9 |
| | 7 |
| | (21 | ) | | (16 | ) |
| Total special items | | 40 |
| | 31 |
| | 14 |
| | 6 |
| | 106 |
| | 65 |
| | 21 |
| | 15 |
| | 40 |
| | 31 |
| | (15 | ) | | (12 | ) |
| Non-operating pension expense | | 4 |
| | 3 |
| | 31 |
| | 19 |
| | 386 |
| | 238 |
| | 10 |
| | 8 |
| | 4 |
| | 3 |
| | 429 |
| | 322 |
|
| Total | | $ | 44 |
| | $ | 34 |
| | $ | 45 |
| | $ | 25 |
| | $ | 492 |
| | $ | 303 |
| |
| Total special items and non-operating pension expense | | | $ | 31 |
| | $ | 23 |
| | $ | 44 |
| | $ | 34 |
| | $ | 414 |
| | $ | 310 |
|
Special items include the following tax expenses (benefits):
| | | | | Three Months Ended | | Three Months Ended |
| | | March 31, | | December 31, | | March 31, | | December 31, |
| In millions | | 2018 | | 2017 | | 2017 | | 2019 | | 2018 | | 2018 |
| Income tax refund claims | | $ | — |
| | $ | — |
| | $ | (28 | ) | |
| Tax benefit of Tax Cuts and Jobs Act | | — |
| | — |
| | (1,222 | ) | |
| International tax law change | | — |
| | — |
| | 9 |
| |
| International investment restructuring | | — |
| | 15 |
| | — |
| | $ | — |
| | $ | — |
| | $ | 19 |
|
| Foreign tax audits | | | — |
| | — |
| | 25 |
|
| Total | | $ | — |
| | $ | 15 |
| | $ | (1,241 | ) | | $ | — |
| | $ | — |
| | $ | 44 |
|
The following tables present net sales and operating profit (loss) which is the Company's measure of segment profitability. The tables include a detail of special items in each year, where applicable, in order to show operating profit before special items. The Company calculates Operating Profit Before Special Items (non-GAAP) by excluding the pre-tax effect of items considered by management to be unusual from the earnings reported under U.S. generally accepted accounting principles (“GAAP”). Management uses this measure to focus on on-going operations, and believes that it is useful to investors because it enables them to perform meaningful comparisons of past and present operating results. International Paper believes that using
this information, along with net earnings, provides for a more complete analysis of the results of operations by quarter. Net earnings attributable to International Paper is the most directly comparable GAAP measure. See Note 20 - Business Segment Information in the Condensed Notes to the Consolidated Financial Statements for the GAAP reconciliation of segment operating profit.
Industrial Packaging
| | | Total Industrial Packaging | 2018 | 2017 | 2019 | 2018 |
| In millions | 1st Quarter | | 1st Quarter | | 4th Quarter | 1st Quarter | | 1st Quarter | | 4th Quarter |
| Sales | $ | 3,827 |
| | $ | 3,577 |
| | $ | 3,893 |
| $ | 3,832 |
| | $ | 3,827 |
| | $ | 4,017 |
|
| Operating Profit | $ | 437 |
| | $ | 384 |
| | $ | 609 |
| $ | 404 |
| | $ | 437 |
| | $ | 647 |
|
| Multi-employer pension plan exit liability | | 16 |
| | — |
| | — |
|
| Gain on sale of EMEA Packaging box plant | | (7 | ) | | — |
| | — |
|
| EMEA Packaging optimization | 22 |
| | — |
| | — |
| — |
| | 22 |
| | (1 | ) |
| Holmen mill bargain purchase gain | — |
| | (6 | ) | | — |
| |
| Litigation settlement recovery | | — |
| | — |
| | (5 | ) |
| Abandoned property removal | 5 |
| | 1 |
| | 5 |
| 8 |
| | 5 |
| | 5 |
|
| Operating Profit Before Special Items | $ | 464 |
| | $ | 379 |
| | $ | 614 |
| $ | 421 |
| | $ | 464 |
| | $ | 646 |
|
Industrial Packaging net sales for the first quarter of 20182019 were 2%5% lower than in the fourth quarter of 20172018 and were 7% higherabout even with the first quarter of 2018. Operating profit before special items was 35% lower in the first quarter of 2019 than in the fourth quarter of 2018 and 9% lower than in the first quarter of 2017. Operating profit before special items was 24% lower in the first quarter of 2018 than in the fourth quarter of 2017 and 22% higher than in the first quarter of 2017.2018.
| | | North American Industrial Packaging | 2018 | 2017 | 2019 | | 2018 |
| In millions | 1st Quarter | | 1st Quarter | | 4th Quarter | 1st Quarter | | 1st Quarter | | 4th Quarter |
| Sales (a) | $ | 3,369 |
| | $ | 3,155 |
| | $ | 3,455 |
| $ | 3,376 |
| | $ | 3,369 |
| | $ | 3,583 |
|
| Operating Profit | $ | 459 |
| | $ | 361 |
| | $ | 605 |
| $ | 395 |
| | $ | 459 |
| | $ | 641 |
|
| Multi-employer pension plan exit liability | | 16 |
| | — |
| | — |
|
| Litigation settlement recovery | | — |
| | — |
| | (5 | ) |
| Abandoned property removal | 5 |
| | 1 |
| | 5 |
| 8 |
| | 5 |
| | 5 |
|
| Operating Profit Before Special Items | $ | 464 |
| | $ | 362 |
| | $ | 610 |
| $ | 419 |
| | $ | 464 |
| | $ | 641 |
|
| |
| (a) | Includes intra-segment sales of $31 million, $58 million and $32$55 million for the three months ended March 31, 2019, March 31, 2018 and 2017, respectively, and $59 million for the three months ended December 31, 2017.2018, respectively. |
North American Industrial Packaging sales volumes for boxes in the first quarter of 20182019 were seasonally lower for boxes and export containerboard than in the fourth quarter of 2017 despite two more shipping days. Containerboard2018, reflecting lower seasonal demand and weaker box shipments, to both domestic andas well as lower export markets decreased partly due to production constraints at the mills related to unplanned outages associated with extreme weather conditions, energy supply disruptions and reliability events although export market demand remains strong. Total maintenance downtime increased 135,000 tons from 46,000 tons to 181,000 tons. Average sales margins for boxes were higher although box sales prices were stable. Average sales price realizations for containerboard continued to increase in export markets. Input costs were higher for energy, wood and chemicals, but lower for recycled fiber. Planned maintenance downtime costs were $74 million highershipments as customer destocking progressed in the 2018 first quarter compared with the 2017 fourth quarter. Operating costs were higher due to the unplanned outages including approximately $20 million related to adverse weather conditions and $11 million for other unplanned events.
Compared with the first quarter of 2017, sales volumes for boxes were higher in the first quarter of 2018 which included one fewer shipping day. Sales volumes for containerboard were relatively flat in both domestic and export markets. Total maintenance and economic downtime was 53,000498,000 tons higher in the first quarter of 20182019, which comprises an increase of 88,000 tons for planned maintenance downtime and 410,000 tons for economic downtime. Economic downtime was driven by lower volumes as we managed production to meet our customers' needs, as well as the significant reduction of in-transit inventory from our mills to our box plants, as we were able to manage our system with lower inventories due to improved velocity in our supply chain. Average sales margins were slightly higher, reflecting higher average sales prices for boxes and a favorable mix, largely offset by lower prices for export containerboard. Manufacturing performance was strong and we managed variable costs well to mitigate the impact of unabsorbed fixed costs related to economic downtime in the quarter. Input costs were slightly favorable, primarily for recycled fiber and freight, offset by higher wood costs. Planned maintenance downtime costs were $86 million higher in the first quarter of 2019 compared with the fourth quarter of 2018.
Compared with the first quarter of 2018, sales volumes were lower in the first quarter of 2019 for boxes and containerboard. Total maintenance and economic downtime was 339,000 tons higher in the first quarter of 2019, which comprises a decrease of 35,00071,000 tons for planned maintenance downtime and 410,000 tons for economic downtime. Average sales marginsprices for boxes increased primarilywere higher, due to higher averagecarryover of the Spring 2018 sales prices. Average salesprice increase. Export containerboard prices were significantly higher for sales to export containerboard markets, reflecting sales price increases implemented during 2017 and the current quarter.slightly lower. Input costs for recycled fiber were lower, but were mostlymore than offset by higher costs for wood, freight wood and chemicals.energy. Planned maintenance downtime costs were $33$9 million higherlower in the first quarter of 20182019 compared with the first quarter of 2017.2018. Manufacturing costs were lower, but were more than offset by other operating and distribution costs.
Entering the second quarter of 2018,2019, sales volumes for boxes are expected to be seasonally higher with one more shipping day.higher. Containerboard domestic and export shipments are also expected to be relatively flat.increase. Input costs are expectedprojected to decreasebe lower, primarily for wood and recycled fiber, energy, chemicals and wood.fiber. Planned maintenance downtime costs should be $10$30 million higher in the 2018 second quarter of 2019 than in the 2018 first quarter. Operating costs should recover with the non-repeat of the first quarter disruptions.of 2019.
| | | EMEA Industrial Packaging | 2018 | 2017 | 2019 | | 2018 |
| In millions | 1st Quarter | | 1st Quarter | | 4th Quarter | 1st Quarter | | 1st Quarter | | 4th Quarter |
| Sales | $ | 362 |
| | $ | 317 |
| | $ | 343 |
| $ | 339 |
| | $ | 362 |
| | $ | 338 |
|
| Operating Profit | $ | (34 | ) | | $ | 14 |
| | $ | (8 | ) | $ | (8 | ) | | $ | (34 | ) | | $ | (6 | ) |
| Gain on sale of EMEA Packaging box plant | | (7 | ) | | — |
| | — |
|
| EMEA Packaging optimization | 22 |
| | — |
| | — |
| — |
| | 22 |
| | (1 | ) |
| Holmen mill net bargain purchase gain | — |
| | (6 | ) | | — |
| |
| Operating Profit Before Special Items | $ | (12 | ) | | $ | 8 |
| | $ | (8 | ) | $ | (15 | ) | | $ | (12 | ) | | $ | (7 | ) |
EMEA Industrial Packaging sales volumes for boxes in the first quarter of 20182019 were slightly lower than in the fourth quarter of 20172018 primarily due to lower seasonal demand in Europe, as seasonally higher volumeswell as a weaker economic environment in Morocco wereTurkey and Italy, which was partly offset by lower volumesstronger seasonal demand in Turkey.Morocco. Average sales margins were about flat. Input costs for energy were higher. Earningslower in Turkey reflecting weaker economic conditions, while margins improved in the first quarterEurozone as containerboard prices decreased and box prices remained stable. Manufacturing operations improved as we begin to see the benefits of our box system optimization initiatives. Earnings were negatively impactedaffected by costs associated with the Madrid mill conversion to recycled containerboard production.unfavorable foreign currency impacts in Turkey.
Compared with the first quarter of 2017,2018, sales volumes in the first quarter of 20182019 were higher.lower, primarily due to the recession in Turkey. Average sales margins decreased in the Euro-zonefor boxes improved, reflecting sales price increases during 2018 and Morocco due to higherlower containerboard costs. InputOperating costs for energy were flat. Also, compared with the first quarter of 2017, earnings declined due to the absence of newsprint sales and earnings from the Madrid mill.unfavorably impacted by inflation, particularly in Turkey.
Looking ahead to the second quarter of 2018,2019, sales volumes for boxes are expected to be higher despite seasonally weaker demand in Morocco.stable. Average sales margins are expected toshould improve reflecting further materialization of both prior box price increases and recent containerboard cost reduction. Operating costs for the box business should be lower as the benefits of optimization initiatives continue to decrease due to higher containerboard costs. Conversion costs at the Madrid mill will continue to impact earnings.be realized.
| | | Brazilian Industrial Packaging | 2018 | 2017 | 2019 | | 2018 |
| In millions | 1st Quarter | | 1st Quarter | | 4th Quarter | 1st Quarter | | 1st Quarter | | 4th Quarter |
| Sales | $ | 62 |
| | $ | 59 |
| | $ | 64 |
| $ | 57 |
| | $ | 62 |
| | $ | 57 |
|
| Operating Profit | $ | (8 | ) | | $ | (10 | ) | | $ | (6 | ) | $ | (5 | ) | | $ | (8 | ) | | $ | (5 | ) |
Brazilian Industrial Packaging sales volumes in the first quarter of 20182019 compared with the fourth quarter of 20172018 were slightly lower for both boxes andbut increased for containerboard. Improved averageAverage sales margins reflectimproved reflecting higher sales prices for boxes and an improved mix. Operatingcontainerboard. There were no planned maintenance downtime costs in either the first quarter of 2019 or the fourth quarter of 2018. Input costs were flat, while input costs, primarilyhigher for wood and energy, though lower for recycled fiber, were higher.fiber.
Compared with the first quarter of 2017,2018, sales volumes in the first quarter of 20182019 were flat as higher volumes for boxes butwere offset by lower for containerboard.containerboard volumes. Average sales price realizationsprices increased for boxes. Inputboxes and containerboard. Operating costs were slightlylower, but were partially offset by higher input costs for recycled fiber, energy and operating costs also increased. Planned maintenance downtime costs were $2 million lower in the first quarter of 2018 than in the first quarter of 2017.wood.
Looking ahead to the second quarter of 2018,2019, sales volumes for boxes and containerboard are expected to be higher. Average sales margins are expected to be about flat, reflecting higher sales price realizations for boxes, partially offset by an unfavorabledue to favorable product mix. Input costs shouldare projected to be about flat. Planned maintenance downtime costs should be $3 million higher in the second quarter.lower for recycled fiber.
| | | European Coated Paperboard | 2018 | 2017 | 2019 | | 2018 |
| In millions | 1st Quarter | | 1st Quarter | | 4th Quarter | 1st Quarter | | 1st Quarter | | 4th Quarter |
| Sales | $ | 92 |
| | $ | 78 |
| | $ | 90 |
| $ | 91 |
| | $ | 92 |
| | $ | 94 |
|
| Operating Profit | $ | 20 |
| | $ | 19 |
| | $ | 18 |
| $ | 22 |
| | $ | 20 |
| | $ | 17 |
|
European Coated Paperboard sales volumes in the first quarter of 20182019 compared with the fourth quarter of 20172018 were lower in both Europe and Russia. Average sales margins increasedimproved in both regions primarily reflecting higherdue to increased sales prices, in Europe and a favorablenet of an unfavorable geographic mix in Russia. InputEurope. In Europe, input costs were lower for energy and purchased fiber, partially offset by higher wood costs. In Russia, input costs were lower, primarily for wood and energy. There were no planned maintenance outage costs in Russia, and for energy, chemicals and purchased pulp in Europe. Planned maintenance downtime costs were $4 million higher ineither the first quarter of 2018 compared with2019 or the fourth quarter of 2017 due to an outage at2018. Mill operating costs were lower, reflecting the Kwidzyn mill.benefits of savings initiatives. Earnings were also unfavorably impactednegatively affected by $2 million by two operational incidents at the Kwidzyn mill during the quarter.unfavorable foreign currency impacts, primarily in Russia.
Compared with the first quarter of 2017,2018, sales volumes decreasedincreased in Europe, but increased in Russia. In Russia, average sales margins decreasedpartially due to lower average sales price realizationsthe impact of production constraints related to the Kwidzyn fire and an unfavorable mix, but in Europe average sales margins reflected higher average sales price realizations and a more favorable mix. Input costs increased for wood and energy in both regions, while in Europe purchased pulp prices also increased. Plannedplanned maintenance downtime costs were $4 million higheroutages in the first quarter of 20182018. Sales volumes were flat in Russia. Average sales margins decreased in Europe due to an unfavorable mix, though improved in Russia reflecting higher average sales prices and a favorable mix. Input costs for energy and chemicals increased in both Europe and Russia, and in Europe wood and purchased fiber prices also increased. In Russia, wood costs were lower. Planned maintenance downtime costs in the first quarter of 2019 were $4 million lower than in the first quarter of 2017.2018. Mill operating costs were lower in Europe, but higher in Russia.
Entering the second quarter of 2018,2019, sales volumes are expected to be lower in both Europe but about flat inand Russia. Average sales margins are expected to increase, reflecting a more favorable miximprove in Europe anddue to realization of previous salesprior price increases in Russia.and a favorable mix. In Russia, average sales
margins are expected to be stable. Input costs in Europe are expected to increase in both regions, primarily for wood, partially offset by lower purchased board costs. Input costs should be flat in Russia.wood. Planned maintenance downtime costs are expected toshould be $1$7 million lowerhigher in the second quarter of
2018 2019 than in the first quarter of 20182019 with an outageoutages scheduled at the Kwidzyn and Svetogorsk mill. Earnings will be negatively impacted by an additional $1 million associated with the first quarter incidents at the Kwidzyn mill.mills.
Global Cellulose Fibers
| | | Total Global Cellulose Fibers | 2018 | 2017 | 2019 | | 2018 |
| In millions | 1st Quarter | | 1st Quarter | | 4th Quarter | 1st Quarter | | 1st Quarter | | 4th Quarter |
| Sales | $ | 677 |
| | $ | 564 |
| | $ | 721 |
| $ | 689 |
| | $ | 677 |
| | $ | 736 |
|
| Operating Profit | $ | 11 |
| | $ | (70 | ) | | $ | 79 |
| $ | 32 |
| | $ | 11 |
| | $ | 91 |
|
| Acquisition costs | — |
| | 4 |
| | 18 |
| |
| Inventory fair value step-up amortization | — |
| | 14 |
| | — |
| |
| Abandoned property removal | 4 |
| | 1 |
| | 1 |
| 3 |
| | 4 |
| | 2 |
|
| Operating Profit Before Special Items | $ | 15 |
| | $ | (51 | ) | | $ | 98 |
| $ | 35 |
| | $ | 15 |
| | $ | 93 |
|
Global Cellulose Fibers net sales were 6% lower in the first quarter of 20182019 than in the fourth quarter of 20172018 and 20%2% higher than in the first quarter of 2017.2018. Operating profit before special items was 85%62% lower in the first quarter of 20182019 than in the fourth quarter of 20172018 and significantly133% higher than in the first quarter of 2017.2018.
Sales volumes in the first quarter of 2018 decreased2019 compared with the fourth quarter of 2017 primarily2018 were lower driven by continued weaker demand for softwood pulp due to production capacity constraints associated with plannedhigh customer inventories, particularly in China, as well as the impact from lower fluff pulp volume resulting from our customer mix initiatives. Total maintenance outages.and economic downtime was 84,000 tons higher in the first quarter of 2019, which comprises an increase of 10,000 tons for maintenance downtime and 74,000 tons for economic downtime. Average sales margins decreased reflecting lower market pulp sales prices and an unfavorable product mix. Average sales prices for fluff pulp increased. Input costs were higher across all product lines, but were partially offset by an unfavorable mix.stable. Operating costs were higher due to extremeunfavorable reflecting inflation, seasonally colder weather conditions in January (approximately $12 million) and reliability issues.economic downtime. Planned maintenance downtime costs in the first quarter of 20182019 were $51$11 million higher than in the fourth quarter of 20172018. In Europe and represent approximately 40% of the full yearRussia, sales volumes were higher. Average sales prices were lower in both regions. There were no planned maintenance costs.outages in either the first quarter of 2019 or the fourth quarter of 2018 in Europe and Russia. Input costs primarily for energy, were higher. Sales volumes were flat in Europe, but lower in Russia, while average sales prices were favorable in both regions. Planned maintenance downtimeregions, primarily due to favorable energy costs in Europe and Russialower wood costs in Russia. Manufacturing and other operating costs were $3 millionfavorable in the first quarter of 2018 compared with no outagesEurope. but were higher in the previous quarter.Russia.
Compared with the first quarter of 2017,2018, sales volumes increased in the first quarter of 2018.2019 were down driven by weaker global demand. Total maintenance and economic downtime was 31,000 tons higher in the first quarter of 2019, which comprises a decrease of 43,000 tons for maintenance downtime and 74,000 tons for economic downtime. Average sales prices improved significantly across our portfolioall product lines reflecting the realization of previousprior price increases. Product mix was unfavorable. Input costs were higher, primarily for softwood. Planned maintenance downtime costs in the first quarter of 2019 were $22 million lower than in the first quarter of 2018. Operating costs were higher, largely due to distribution costs. In Europe and Russia, sales volumes increased significantly. Average sales margins were lower, reflecting lower average sales prices and an unfavorable mix. Planned maintenance downtime costs in the first quarter of 2019 were $3 million lower than in the first quarter of 2018 in Europe and Russia. Input costs were $10higher, primarily for wood and energy in Europe and energy in Russia. Manufacturing and other operating costs were favorable in Europe and flat in Russia.
Entering the second quarter of 2019, sales volumes are expected to increase. Average sales margins should reflect the continuing effects of prior price decreases resulting from commercial conditions unfavorably impacted by slower growth in developing markets, tariff uncertainty and regional economic conditions. Input costs are expected to be favorable. Planned maintenance downtime costs in the second quarter of 2019 should be $29 million higher than in the first quarter of 2017. Input costs increased for energy.2019. In Europe and Russia, sales volumes decreased, but average sales margins improved, reflecting higher sales price realizations and a favorable mix.
Entering the second quarter of 2018, sales volumes are expected to be lower in Europe and relatively flat while average sales prices are expected to continue to increase due to the realization of previous price increases.in Russia as demand softens. Average sales margins will also benefit from a more favorable mix. Input costs are expected to be lower.lower in Europe, primarily due to an unfavorable mix, and stable in Russia. Planned maintenance downtime costs should be $32 million lower in the second quarter of 20182019 should be $3 million higher than in North America, but $6 million higherthe first quarter of 2019 in Europe and Russia. Sales volumes are expected to increase slightly in both EuropeRussia with outages scheduled at the Kwidzyn and Russia, while average sales margins will be about flat.Svetogorsk mills.
Printing Papers
| | | Total Printing Papers | 2018 | 2017 | 2019 | | 2018 |
| In millions | 1st Quarter | | 1st Quarter | | 4th Quarter | 1st Quarter | | 1st Quarter | | 4th Quarter |
| Sales | $ | 1,053 |
| | $ | 995 |
| | $ | 1,106 |
| $ | 1,065 |
| | $ | 1,053 |
| | $ | 1,160 |
|
| Operating Profit | $ | 64 |
| | $ | 100 |
| | $ | 136 |
| $ | 143 |
| | $ | 64 |
| | $ | 192 |
|
| Abandoned property removal | | — |
| | — |
| | 1 |
|
| Riverdale mill conversion | | 1 |
| | — |
| | 4 |
|
| Operating Profit Before Special Items | | $ | 144 |
| | $ | 64 |
| | $ | 197 |
|
Printing Papers net sales for the first quarter of 20182019 were 5%8% lower than in the fourth quarter of 20172018 and 6%1% higher than in the first quarter of 2017.2018. Operating profit before special items in the first quarter of 20182019 was 53%27% lower than in the fourth
quarter of 20172018 and 36% lower125% higher than in the first quarter of 2017.2018. Overall, our Papers business performed well, with strong results in North America and Europe, while Brazil managed through its slowest seasonal demand quarter and was impacted by weaker geographic mix on exports.
| | | North American Papers | 2018 | 2017 | 2019 | | 2018 |
| In millions | 1st Quarter | | 1st Quarter | | 4th Quarter | 1st Quarter | | 1st Quarter | | 4th Quarter |
| Sales | $ | 458 |
| | $ | 468 |
| | $ | 449 |
| $ | 496 |
| | $ | 458 |
| | $ | 513 |
|
| Operating Profit | $ | 1 |
| | $ | 33 |
| | $ | 26 |
| $ | 56 |
| | $ | 1 |
| | $ | 75 |
|
| Abandoned property removal | | — |
| | — |
| | 1 |
|
| Riverdale mill conversion | | 1 |
| | — |
| | 4 |
|
| Operating Profit Before Special Items | | $ | 57 |
| | $ | 1 |
| | $ | 80 |
|
North American Papers sales volumes in the first quarter of 20182019 were essentially flat compared withlower than in the fourth quarter of 2017. During the fourth quarter of 2017, the business took approximately 6,000 tons of economic downtime compared with none in the first quarter of 2018. Average sales prices2018 for uncoated freesheet paperpaper. Price and mix were higher due tofavorable, benefiting from the implementationrealization of salesrecent price increases, from the fourth quarter of 2017. Average sales margins were also favorably impacted by geographicas well as improved customer mix. Input costs were lower despite higher for chemicals, energywood costs. Operating costs were higher, primarily due to seasonal manufacturing mix and wood.inflation. Planned maintenance downtime costs were $16$3 million higher in the first quarter of 2018,2019, compared with the fourth quarter of 2017. Operating costs were higher, largely due to inflation.2018.
Compared with the first quarter of 2017,2018, sales volumes in the first quarter of 2018 decreased, reflecting lower market demand.2019 were lower. Average sales prices were about flat assignificantly higher reflecting the impact of price decreases throughout 2017 were offset by increases in the current quarter.2018. Average sales margins were also impactedfavorably affected by an improved product and geographic mix, partially offset by an unfavorable mill sourcing mix. Input costs increased.increased, primarily for wood. Planned maintenance downtime costs were $3$14 million higherlower than in the first quarter of 2017.2018.
Entering the second quarter of 2018,2019, sales volumes are expected to be higher.higher for uncoated freesheet paper. Average sales price realizationsprices for uncoated freesheet paper are expected toshould reflect thecontinuing realization of sales price increases announced duringfrom the first quarter. Input costs andare expected to be favorable, while operating costs are both expected to be seasonally lower.higher. Planned maintenance downtime costs should be $2$24 million higher.higher in the second quarter. | | | European Papers | 2018 | 2017 | 2019 | | 2018 |
| In millions | 1st Quarter | | 1st Quarter | | 4th Quarter | 1st Quarter | | 1st Quarter | | 4th Quarter |
| Sales | $ | 319 |
| | $ | 274 |
| | $ | 322 |
| $ | 309 |
| | $ | 319 |
| | $ | 320 |
|
| Operating Profit | $ | 21 |
| | $ | 29 |
| | $ | 43 |
| $ | 47 |
| | $ | 21 |
| | $ | 47 |
|
European Papers sales volumes for uncoated freesheet paper in the first quarter of 20182019 compared with the fourth quarter of 20172018 were higher in Europe, but lower in both Russia and Europe.Russia. Average sales margins for uncoated freesheet paper increased in Europeboth regions due to the realization of sales price increases partially offset by an unfavorable geographic mix in Russia.for cut-size paper. Input costs were lower for energy, but higher primarily for wood in Europe. In Russia, and purchased pulpinput costs were lower for wood and energy, but higher for chemicals. There were no planned maintenance outages in Europe. Planned maintenance downtime costs ineither the first quarter of 2018 included an outage at the Kwidzyn mill and were $8 million higher than in2019 or the fourth quarter of 2017. Earnings2018. Operating costs were unfavorably impacted by $1 million by two operational incidentslower reflecting the benefits of manufacturing initiatives implemented at the Kwidzyn mill during the quarter.mills.
Sales volumes for uncoated freesheet paper in the first quarter of 20182019 compared with the first quarter of 20172018 were lower in Europe, but higher in Russia.both Europe and Russia mainly due to timing. Average sales price realizationsprices for uncoated freesheet paper increased significantly in both Europeregions reflecting increases implemented in late 2018 and Russia.in 2019. Input costs, primarily for woodenergy and chemicals in Russia and for purchased board,pulp, wood, chemicals and energy in Europe, were higher. Planned maintenance downtime costs in the first quarter of 2018 were $8 million higherlower than in the first quarter of 2017.2018. Earnings were negatively affected by unfavorable foreign currency impacts, primarily in Russia.
Looking forward to the second quarter of 2018,2019, sales volumes for uncoated freesheet paper are expected to be higher in Russia, but lower in Europe, duebut increase in Russia. In Europe, average sales margins are expected to be lower. In Russia, average sales margins should reflect the operational incidents at the Kwidzyn mill in the first quarter.continuing realization of prior price increases. Input costs are expected to increase, primarily for wood and chemicals in Europe, and wood, energy and chemicals in Russia. Manufacturing operating costs are expected to be flat in Russia and lower for purchased fiber and energy in Europe.higher. Planned maintenance downtime costs should be $9$17 million higher than in the firstsecond quarter of 2018 with outages scheduled at the Kwidzyn and Svetogorsk and Saillat mills. Earnings will be negatively impacted by an additional $10 million associated with the first quarter incidents at the Kwidzyn mill.
| | | Brazilian Papers | 2018 | 2017 | 2019 | | 2018 |
| In millions | 1st Quarter | | 1st Quarter | | 4th Quarter | 1st Quarter | | 1st Quarter | | 4th Quarter |
| Sales (a) | $ | 229 |
| | $ | 214 |
| | $ | 287 |
| $ | 215 |
| | $ | 229 |
| | $ | 272 |
|
| Operating Profit | $ | 40 |
| | $ | 39 |
| | $ | 66 |
| $ | 33 |
| | $ | 40 |
| | $ | 63 |
|
| |
| (a) | Includes intra-segment sales of $8 million, $5 million and $9$(3) million for the three months ended March 31, 2019, March 31, 2018 and 2017, respectively, and $2 million for the three months ended December 31, 2017.2018, respectively. |
Brazilian Papers sales volumes in the first quarter of 2018 were seasonally lower than in2019 compared with the fourth quarter of 20172018 were lower due to normal seasonality in both the domestic and export markets, higher supply availability and customer inventory levels in other Latin American markets. AverageDespite higher domestic sales prices, average sales margins were higher due to increased average sales price realizations for domestic and export uncoated freesheet papers, partially offset by anlower, reflecting a seasonally unfavorable geographic mix and product mix.an increase in the tariff on rolls shipped to Mexico. Input costs increased for purchased pulp and chemicals, but decreased for virgin fiber. Plannedwere slightly favorable. There were no planned maintenance downtimeoutage costs were $3 million higher in either the first quarter of 2018, which included outages at the Luiz Antonio and Tres Lagoas, mills than in2019 or the fourth quarter of 2017.2018. Operating costs were slightly higher.
Compared with the first quarter of 2017,2018, sales volumes for uncoated freesheet paper in the first quarter of 20182019 were lower infor both the domestic and export markets, reflecting a planned reduction in domestic cutsize distributor inventory levels and higher supply availability and customer inventory levels in other Latin American export markets. Average sales margins improved reflectingdue to higher average sales price realizations for export markets.prices, both domestically and abroad, net of an unfavorable geographic mix and the tariff in Mexico. Input costs were higher, primarily for purchased pulp.pulp, wood, chemicals and energy, while operating costs were lower. Planned maintenance downtime costsoutage expenses were $3 million higherlower in the first quarter of 2018 than in2019 compared with the first quarter of 2017.2018.
Entering the second quarter of 2018,2019, sales volumes for uncoated freesheet paper are expected to be seasonally higherstronger in Brazilthe domestic and the Latin AmericaAmerican export market.markets. Average sales margins should benefit from higherare expected to increase for domestic markets as first quarter 2019 price increases continue to be realized. However, export sales prices and a favorable mix.margins are expected to be lower due to competitive pressure. Input costs are expected to be higherincrease, primarily for purchased pulp, energy and chemicals.wood. Planned maintenance outage costs shouldexpenses are expected to be about even with the first quarter of 2018.$3 million higher.
| | | Indian Papers | 2018 | 2017 | 2019 | | 2018 |
| In millions | 1st Quarter | | 1st Quarter | | 4th Quarter | 1st Quarter | | 1st Quarter | | 4th Quarter |
| Sales | $ | 52 |
| | $ | 48 |
| | $ | 50 |
| $ | 53 |
| | $ | 52 |
| | $ | 52 |
|
| Operating Profit | $ | 2 |
| | $ | (1 | ) | | $ | 1 |
| $ | 7 |
| | $ | 2 |
| | $ | 7 |
|
Indian Papers sales volumes in the first quarter of 20182019 compared with the fourth quarter of 20172018 were essentially flat.flat due to continued strong demand. Improved sales margins were due to higher average sales prices and a more favorable mix. Manufacturing operating costs were higher due to the impact of a planned maintenance outage at the Rajahmundry mill and a labor strike at the Kadiam mill. Input costs were favorable. The first quarter of 2019 benefited from favorable foreign currency impacts.
Compared with the first quarter of 2018, sales volumes in the first quarter of 2019 were slightly higher. Average sales prices improved reflecting the impact of 2018 sale price realizations were higher.increases. Operating costs were lower, reflecting improved mill efficiencies and lowerproductivity, while input costs were higher for fiber and chemical costs. Compared with the first quarter of 2017, sales volumes in the first quarter of 2018 were higher and average sales price realizations increased. Input costs were lower for wood, partially offset by higher chemical and coal costs.chemicals.
Looking ahead to the second quarter of 2018,2019, sales volumes are expected to be lower due to production constraints related toassociated with the planned maintenance downtimeannual outage at the KadiyamKadiam mill. Average sales price realizations should be higher due to the implementation of a sales price increase announced in the first quarter. Input costs are expected to be slightly higher.higher, primarily for chemicals.
Equity Earnings, Net of Taxes – Ilim
Since October 2007, International Paper and Ilim Holding S.A. (Ilim) have operated a 50:50 joint venture in Russia. Ilim is a separate reportable industry segment. The Company recorded equity earnings, net of taxes, of $101 million in the first quarter of 2019, compared with $67 million in the fourth quarter of 2018 and $92 million in the first quarter of 2018, compared with $64 million in the fourth quarter of 2017 and $50 million in the first quarter of 2017.2018. In the first quarter of 2018,2019, the after-tax foreign exchange impact primarily on the remeasurement of U.S. dollar-denominated net debt was a lossgain of $0.4$21 million compared with a gainloss of $3$19 million in the fourth quarter of 2017.2018.
Compared with the fourth quarter of 2017,2018, sales volumes in the first quarter of 20182019 were 5%2% lower, primarily for sales of softwood and hardwood pulp in China and sales of containerboard in Russia, but were partially offset by higher sales of containerboardsoftwood pulp in China and other export markets. Average sales price realizations were higher primarily for softwood pulp, hardwood pulp and containerboardlower in China Russia and other export markets. Input costs were lower. The Company received a cash dividend from the joint venture of $116 million inmarkets, mainly for containerboard, softwood pulp and hardwood pulp. In the first quarter of 2018.2019, input costs were relatively flat.
Compared with the first quarter of 2017,2018, sales volumes in the first quarter of 20182019 increased overall by 18%2%, primarily for sales of softwood pulp hardwood pulp and paper in Russia and other export markets that is partly offset by decreased sales of containerboard in China, Russia and other export markets. Average sales price realizations were higher, across all gradeslower for softwood pulp and allhardwood pulp in China and other export markets. Input costs, primarily for wood, fuel and chemicals were higher. OperatingDistribution costs were relatively flat.also higher. An after-tax foreign exchange gainloss of $23$0.4 million primarily on the remeasurement of U.S. dollar denominated net debt was recorded in the first quarter of 2017. The Company received a cash dividend from the joint venture of $127 million in the first quarter of 2017.2018.
Looking forward to the second quarter of 2018,2019, sales volumes are expected to be relatively stable.lower. Average sales margins should reflect the continuing effects of prior price realizations are projected to increase compared with the first quarter of 2018,decreases, primarily for export sales of hardwood pulp and containerboard.containerboard in China. Input costs are expected to be seasonally higher primarily for wood. Distribution costs are expected to increase. Plannedhigher. A planned maintenance mill outages areoutage is scheduled at the Bratsk and Koryazhma mills.mill.
Equity Earnings Net of Taxes – GPI
International Paper recorded equity earnings of $2$13 million on its 20.5% ownership position in GPI.GPI in the first quarter of 2019 compared with $10 million in the fourth quarter of 2018 and $2 million in the first quarter of 2018.
Cash provided by operations totaled $663733 million for the first three months of 20182019, compared with $633663 million for the comparable 20172018 three-month period. Cash used forprovided by working capital components totaled $13213 million for the first three months of 20182019 compared to cash used by working capital components of $124132 million for the comparable 2017three2018-month three-month period.
Investments in capital projects totaled$293 million in the first three months of 2019 compared to $489 million in the first three months of 2018 compared to $374 million in the first three months of 2017. Full-year 20182019 capital spending is currently expected to be approximately $1.5$1.4 billion, or about 111%104% of depreciation and amortization, expense for our current businesses.including approximately $400 million of strategic investments.
Financing activities for the first three months of 20182019 included a $66 million net increase in debt versus a $189 million net increase in debt versus a $41 million net decrease in debt during the comparable 20172018 three-month period.
Amounts related to early debt extinguishment during the three months ended March 31, 2019 and 2018 were as follows: |
| | | | | | | |
| | Three Months Ended
March 31, |
| In millions | 2019 | | 2018 |
| Early debt reductions (a) | $ | 94 |
| | $ | — |
|
| Pre-tax early debt extinguishment costs | (1 | ) | | — |
|
| |
| (a) | Reductions related to notes with interest rates ranging from 3.00% to 9.50% with original maturities from 2024 to 2033 for the three months ended March 31, 2019. |
At March 31, 2018,2019, contractual obligations for future payments of debt maturities (including finance lease liabilities disclosed in Note 10 - Leases) by calendar year were as follows: $485 million in 2018; $130$790 million in 2019; $145$103 million in 2020; $444$447 million in 2021; $951$491 million in 2022; $164$352 million in 2023; and $9.0$8.6 billion thereafter. Maintaining an investment-grade credit rating is an important element of International Paper’s financing strategy. At March 31, 20182019, the Company held long-term credit ratings of BBB (stable outlook) and Baa2 (stable outlook) by S&P and Moody’s, respectively. In addition, the Company held short-term credit ratings of A2 and P2 by S&P and Moody's, respectively, for borrowings during the current quarter under the Company's commercial paper program.
At March 31, 2018,2019, International Paper’s credit agreements totaled $2.1 billion, which management believes are adequate to cover expected operating cash flow variability during the current economic cycle. The credit agreements generally provide for interest rates at a floating rate index plus a pre-determined margin dependent upon International Paper’s credit rating. The liquidity facilities include a $1.5 billion contractually committed bank credit agreement that expires in December 2021 and has a facility fee of 0.15% per annum payable quarterly. The liquidity facilities also include up to $600 million of uncommitted
financings based on eligible receivable balances under a receivables securitization program that expires in December 2018.2019. At March 31, 2018, there2019, $100 million at a weighted average rate of 3.32% was outstanding under the receivables securitization program. There were no outstanding borrowings outstanding under either the bankcredit facility or receivables securitization program.at March 31, 2019.
In June 2016, International Paper entered into a2018, the borrowing capacity of the commercial paper program with a borrowing capacity ofwas increased from $750 million.million to $1.0 billion. Under the terms of the program, individual maturities on borrowings may vary, but not exceed one year from the date of issue. Interest bearing notes may be issued either as fixed notes or floating rate notes. As of March 31, 2018,2019, the Company had $375$530 million of borrowings outstanding under this program at a weighted average interest rate of 2.33%2.73%.
During the first three months of 2019, International Paper used 3.4 million shares of treasury stock for various incentive plans. International Paper also acquired 5.0 million shares of treasury stock, including restricted stock tax withholding. Repurchases of common stock and payments of restricted stock withholding taxes totaled $229 million, including $180 million related to shares repurchased under the Company's repurchase program. On October 9, 2018, the Company announced an authorization to repurchase $2 billion of the Company's common stock to supplement remaining amounts under prior share repurchase authorizations, bringing total share repurchase authorizations since 2013 to $5.0 billion. The Company will continue to repurchase such shares in open market repurchase transactions. Under the $5.0 billion share repurchase program, the Company has repurchased 62.0 million shares at an average price of $47.55, for a total of approximately $2.9 billion, as of March 31, 2019.
During the first three months of 2018, International Paper used approximately 1.7 million shares of treasury stock for various incentive plans. International Paper also acquired 0.5 million shares of treasury stock for the payment of restricted stock tax
withholding. Repurchases of common stock and payments of restricted stock withholding taxes totaled $31 million. In September 2013, the Company announced a share repurchase program to acquire up to $1.5 billion of the Company's common stock in open market repurchase transactions. In addition, in July 2014, the Company announced that it would acquire up to $1.5 billion of additional shares of the Company's common stock to supplement the $1.5 billion share repurchase program authorized in September 2013 and would continue to repurchase such shares in open market repurchase transactions. Under this $3.0 billion share repurchase program, the Company has repurchased 44.6 million shares at an average price of $46.40, for a total of approximately $2.1 billion, as of March 31, 2018.
During the first three months of 2017, International Paper used approximately 2.5 million shares of treasury stock for various incentive plans. International Paper also acquired 0.9 million shares of treasury stock for the payment of restricted stock tax withholding. Repurchases of common stock and payments of restricted stock withholding taxes totaled $46.0 million. Cash dividend payments related to common stock totaled $197$201 million and $191$197 million for the first three months of 20182019 and 2017,2018, respectively. Dividends were $0.4750$0.5000 per share and $0.4625$0.4750 per share for the first three months in 20182019 and 2017,2018, respectively.
International Paper expects to be able to meet projected capital expenditures, service existing debt and meet working capital and dividend requirements during the remainder of 20182019 with current cash balances and cash from operations, supplemented as required by its existing credit facilities. The Company will continue to rely on debt and capital markets for the majority of any necessary long-term funding not provided by operating cash flows. Funding decisions will be guided by our capital structure planning objectives. The primary goals of the Company’s capital structure planning are to maximize financial flexibility and preserve liquidity while reducing interest expense. The majority of International Paper’s debt is accessed through global public capital markets where we have a wide base of investors.
Acquisitions
Ilim Holding S.A. Shareholders’ Agreement
In October 2007, in connection with the formation of the Ilim Holding S.A. joint venture (Ilim), International Paper entered into a shareholder’s agreement that includes provisions relating to the reconciliation of disputes among the partners. This agreement provides that at any time, either the Company or its partners may commence procedures specified under the deadlock agreement. If these or any other deadlock procedures under the shareholder's agreement are commenced, although it is not obligated to do so, the Company may in certain situations choose to purchase its partners' 50% interest in Ilim Holding S.A.Ilim. Any such transaction would be subject to review and approval by Russian and other relevant anti-trust authorities. Based on the provisions of the agreement, the Company estimates that the current purchase price for its partners' 50% interests would be approximately $1.7$2.4 billion, which could be satisfied by payment of cash or International Paper common stock, or some combination of the two, at the Company's option. The purchase by the Company of its partners’ 50% interest in Ilim Holding S.A. would result in the consolidation of Ilim Holding S.A.'sIlim's financial position and results of operations in all subsequent periods. The parties have informed each other that they have no current intention to commence procedures specified under the deadlock provisions of the shareholder’s agreement.
CRITICAL ACCOUNTING POLICIES AND SIGNIFICANT ACCOUNTING ESTIMATES
The preparation of financial statements in conformity with accounting principles generally accepted in the United States requires International Paper to establish accounting policies and to make estimates that affect both the amounts and timing of the recording of assets, liabilities, revenues and expenses. Some of these estimates require judgments about matters that are inherently uncertain.
Accounting policies whose application may have a significant effect on the reported results of operations and financial position of International Paper, and that can require judgments by management that affect their application, include accounting for contingencies, impairment or disposal of long-lived assets, goodwill and other intangible assets, pensions postretirement benefits other than pensions,and income taxes and business combinations.taxes.
The Company has included in its 20172018 Form 10-K a discussion of these critical accounting policies, which are important to the portrayal of the Company’s financial condition and results of operations and require management’s judgments. The Company
has not made any changes in these critical accounting policies during the first three months of 20182019, other than a change in the accounting for revenue recognition prescribed under ASC 606, which is referenced in Note 2 - Recent Accounting Developments in the Condensed Notes to the Consolidated Financial Statements and discussed below.. FORWARD-LOOKING STATEMENTS
Certain statements in this Quarterly Report on Form 10-Q that are not historical in nature may be considered “forward-looking” statements within the meaning of the Private Securities Litigation Reform Act of 1995. These statements are often identified by the words, “will,” “may,” “should,” “continue,” “anticipate,” “believe,” “expect,” “plan,” “appear,” “project,” “estimate,” “intend,” and words of a similar nature. These statements are not guarantees of future performance and reflect management’s current views with respect to future events, which are subject to risks and uncertainties that could cause actual results to differ materially from those expressed or implied in these statements. Factors which could cause actual results to differ include but are not limited to: (i) the level of our indebtedness and changes in interest rates; (ii) industry conditions, including but not limited to changes in the cost or availability of raw materials, energy and transportation costs, competition we face, cyclicality and changes in consumer preferences, demand and pricing for our products; (iii) global economic conditions and political changes, including but not limited to trade protection measures, the impairment of financial institutions, changes in currency exchange rates, credit ratings issued by recognized credit rating organizations, the amount of our future pension funding obligation, changes in tax laws and pension and health care costs; (iv) unanticipated expenditures related to the cost of compliance with existing and new environmental and other governmental regulations and to actual or potential litigation; (v) whether we experience a material disruption at one of our manufacturing facilities; (vi) risks inherent in conducting business through joint ventures; (vii) our ability to achieve the benefits we expect from all other strategic acquisitions, divestitures, restructurings and restructurings;capital investments, and (viii) International Paper announcing its firm intention to make an offer for Smurfit Kappa; (ix) the willingness of the Smurfit Kappa Board to recommend a transaction with International Paper, and (x) other factors you can find in our press releases and filings with the Securities and Exchange Commission, including the risk factors identified in Item 1A of Part I of the Company’s Annual Report on Form 10-K for the fiscal year ended December 31, 2017,2018, as updated in Item 1A of Part II of this Quarterly Report on Form 10-Q ("Risk Factors").
We undertake no obligation to publicly update any forward-looking statements, whether as a result of new information, future events or otherwise.
Information relating to quantitative and qualitative disclosures about market risk is shown on pagespage 35 and 36 of International Paper’s 20172018 Form 10-K, which information is incorporated herein by reference. There have been no material changes in the Company’s exposure to market risk since December 31, 20172018.
Evaluation of Disclosure Controls and Procedures:
Disclosure controls and procedures are controls and other procedures that are designed to ensure that information required to be disclosed in our reports filed or submitted under the Securities Exchange Act of 1934, as amended (Exchange Act), is recorded, processed, summarized and reported (and accumulated and communicated to management, including our Chief Executive Officer and Chief Financial Officer, to allow timely decisions regarding required disclosure) within the time periods specified in the Securities and Exchange Commission’s rules and forms. As of the end of the period covered by this report, we conducted an evaluation, under the supervision and with the participation of our management, including the Chief Executive Officer and Chief Financial Officer, of the effectiveness of our disclosure controls and procedures pursuant to Rules 13a-15 and 15d-15 of the Exchange Act. Based upon that evaluation, our Chief Executive Officer and Chief Financial Officer concluded that the Company’s disclosure controls and procedures were effective as of March 31, 20182019 (the end of the period covered by this report).
Changes in Internal Control over Financial Reporting:
Although the new revenuelease standard did not have a material impact on our ongoing net income,consolidated financial statements, we did implement changes to our processes and internal controls related to revenue recognition.leases. These included the development of new policies based on the five-step model provided in the new revenuelease standard, new training, ongoing contract review requirements,reviews, and gathering of information providedin order to account for disclosures.our leases and provide the required disclosures under the new standard.
There have been no other changes in our internal control over financial reporting during the quarter ended March 31, 20182019 that have materially affected, or are reasonably likely to materially affect, our internal control over financial reporting.
A discussion of material developments in the Company’s litigation matters occurring in the period covered by this report is found in Note 14 of the Condensed Notes to the Consolidated Financial Statements in this Form 10-Q.
Additionally, in March 2019, the Company received a proposed environmental penalty of $142,607 from the Georgia Environmental Protection Division (EPD) arising from an exceedance of a hydrogen chloride air emission limit at the Company’s mill in Rome, Georgia. The exceedance was disclosed by the Company to EPD in August 2018 and resulted from malfunctioning pollution control equipment. The Company promptly fixed the malfunctioning equipment and is not contesting the penalty.
There have been no material changes from the risk factors disclosed in our Annual Report on Form 10-K for the fiscal year ended December 31, 20172018 (Part I, Item 1A).
| |
ITEM 2. | UNREGISTERED SALES OF EQUITY SECURITIES AND USE OF PROCEEDS |
PURCHASES OF EQUITY SECURITIES BY THE ISSUER AND AFFILIATED PURCHASERS.
|
| | | | | | | | |
| Period | Total Number of Shares Purchased (a) | Average Price Paid per Share | Total Number of Shares Purchased as Part of a Publicly Announced Plan or Program | Maximum Number (or Approximate Dollar Value) of Shares that May Yet Be Purchased Under the Plans or Programs (in millions) |
| January 1, 2018 - January 31, 2018 | 542 |
| $62.38 | — |
| $0.933 |
| February 1, 2018 - February 28, 2018 | 537,405 |
| 57.21 |
| — |
| 0.933 |
|
| March 1, 2018 - March 31, 2018 | 3,212 |
| 53.87 |
| — |
| 0.933 |
|
| Total | 541,159 |
| | | |
|
| | | | | | | | |
| Period | Total Number of Shares Purchased (a) | Average Price Paid per Share | Total Number of Shares Purchased as Part of a Publicly Announced Plan or Program | Maximum Number (or Approximate Dollar Value) of Shares that May Yet Be Purchased Under the Plans or Programs (in billions) |
| January 1, 2019 - January 31, 2019 | 376,054 |
| $41.55 | 373,678 |
| $2.22 |
| February1, 2019 - February 28, 2019 | 2,087,105 |
| 46.36 |
| 1,053,224 |
| 2.17 |
|
| March 1, 2019 - March 31, 2019 | 2,551,764 |
| 45.79 |
| 2,519,637 |
| 2.05 |
|
| Total | 5,014,923 |
| | | |
(a) 541,1591,068,384 shares were acquired from employees from share withholdings to pay income taxes under the Company's restricted stock programs. The remainder were purchased under a share repurchase program that was approved by our Board of Directors and announced on July 8, 2014 and October 9, 2018. Through this program, which does not have an expiration date, we were authorized to purchase, in open market transactions (including block trades), privately negotiated transactions or otherwise, up to $3.5 billion of shares of our common stock. As of March 31, 2019, approximately $2.05 billion aggregate amount of shares of our common stock remained authorized for purchase under this program.
|
| | |
1110.1 | | |
| | |
12 | | |
| | |
| 31.1 | | |
| | |
| 31.2 | | |
| | |
| 32 | | |
| | |
| 101.INS | | XBRL Instance Document. |
| | |
| 101.SCH | | XBRL Taxonomy Extension Schema. |
| | |
| 101.CAL | | XBRL Taxonomy Extension Calculation Linkbase. |
| | |
| 101.DEF | | XBRL Taxonomy Extension Definition Linkbase. |
| | |
| 101.LAB | | XBRL Taxonomy Extension Label Linkbase. |
| | |
| 101.PRE | | XBRL Extension Presentation Linkbase. |
* Management contract or compensatory plan or arrangement.
Pursuant to the requirements of the Securities Exchange Act of 1934, the registrant has duly caused this report to be signed on its behalf by the undersigned thereunto duly authorized.
|
| | |
| | INTERNATIONAL PAPER COMPANY (Registrant) |
| | | |
May 7, 20183, 2019 | By | /s/ Glenn R. LandauTim S. Nicholls |
| | | Glenn R. LandauTim S. Nicholls |
| | | Senior Vice President and Chief Financial Officer |
| | | |
May 7, 20183, 2019 | By | /s/ Vincent P. Bonnot |
| | | Vincent P. Bonnot |
| | | Vice President – Finance and Controller |