UNITED STATES
SECURITIES AND EXCHANGE COMMISSION
WASHINGTON, D.C. 20549
FORM 10-Q
☒ QUARTERLY REPORT PURSUANT TO SECTION 13 OR 15(d) OF THE SECURITIES EXCHANGE ACT OF 1934
For the Quarterly Period Ended September 30, 20192020
☐ TRANSITION REPORT PURSUANT TO SECTION 13 OR 15(d) OF THE SECURITIES EXCHANGE ACT OF 1934
For the Transition Period From to
_________________________________________
Commission File Number 001-03157
INTERNATIONAL PAPER COMPANY
(Exact name of registrant as specified in its charter)
|
| | | | |
| New York | 13-0872805 |
(State or other jurisdiction of incorporation) | (I.R.S. Employer Identification No.) |
incorporation of organization) | Identification No.) |
| | | |
| 6400 Poplar Avenue, | Memphis, | TN Tennessee | 38197 |
(Address of principal executive offices)Principal Executive Offices) | (Zip Code) |
Registrant’s telephone number, including area code: (901) (901) 419-7000
Securities registered pursuant to Section 12(b) of the Act: |
| | | | | | | |
| Title of each class | Trading Symbol(s) | Name of each exchange on which registered |
| Common Shares | IP | New York Stock Exchange |
Indicate by check mark whether the registrant (1) has filed all reports required to be filed by Section 13 or 15(d) of the Securities Exchange Act of 1934 during the preceding 12 months (or for such shorter period that the registrant was required to file such reports), and (2) has been subject to such filing requirements for the past 90 days. Yes ☒ No ¨
Indicate by check mark whether the registrant has submitted electronically every Interactive Data File required to be submitted pursuant to Rule 405 of Regulation S-T (paragraph 232.405 of this chapter) during the preceding 12 months (or for such shorter period that the registrant was required to submit such files). Yes ☒ No ¨
Indicate by check mark whether the registrant is a large accelerated filer, an accelerated filer, a non-accelerated filer, or a smaller reporting company or an emerging growth company. See the definitions of “large accelerated filer,” “accelerated filer,” “smaller reporting company,” and "emerging growth company" in Rule 12b-2 of the Exchange Act.
|
| | | | | | | | | | |
| Large accelerated filer | ☒ | Accelerated filer | ☐ |
| Non-accelerated filer | ☐ | Smaller reporting company | ☐ |
| | Emerging growth company | ☐ |
If an emerging growth company, indicate by check mark if the registrant has elected not to use the extended transition period for complying with any new or revised financial accounting standards provided pursuant to Section 13 (a) of the Exchange
Act. ¨
Indicate by check mark whether the registrant is a shell company (as defined in Rule 12b-2 of the Exchange Act). Yes ¨☐ No ☐☒
The number of shares outstanding of the registrant’s common stock, par value $1.00 per share, as of October 25, 201923, 2020 was 393,095,466.
INDEX
| | | | | | | | |
| | PAGE NO. |
| | |
| | |
| | PAGE NO. |
| | |
| | |
| | |
| | |
| Condensed Consolidated Statement of Operations - Three Months and Nine Months Ended September 30, 20192020 and 20182019 | |
| | |
| Condensed Consolidated Statement of Comprehensive Income - Three Months and Nine Months Ended September 30, 20192020 and 20182019 | |
| | |
| Condensed Consolidated Balance Sheet - September 30, 20192020 and December 31, 20182019 | |
| | |
| Condensed Consolidated Statement of Cash Flows - Nine Months Ended September 30, 20192020 and 20182019 | |
| | |
| | |
| | |
| | |
| | |
| | |
| | |
| | |
| | |
| | |
| | |
| | |
| | |
| | |
| | |
| | |
| | |
| | |
| |
| |
INTERNATIONAL PAPER COMPANY
(Unaudited)
(In millions, except per share amounts)
| | | | Three Months Ended
September 30, | | Nine Months Ended
September 30, | | Three Months Ended
September 30, | | Nine Months Ended
September 30, |
| | 2019 | | 2018 | | 2019 | | 2018 | | 2020 | | 2019 | | 2020 | | 2019 |
| Net Sales | $ | 5,568 |
| | $ | 5,901 |
| | $ | 16,878 |
| | $ | 17,355 |
| Net Sales | $ | 5,123 | | | $ | 5,568 | | | $ | 15,341 | | | $ | 16,878 | |
| Costs and Expenses | | | | | | | | Costs and Expenses | |
| Cost of products sold | 3,772 |
| | 3,887 |
| | 11,602 |
| | 11,757 |
| Cost of products sold | 3,541 | | | 3,772 | | | 10,714 | | | 11,602 | |
| Selling and administrative expenses | 387 |
| | 405 |
| | 1,202 |
| | 1,277 |
| Selling and administrative expenses | 360 | | | 387 | | | 1,110 | | | 1,202 | |
| Depreciation, amortization and cost of timber harvested | 327 |
| | 335 |
| | 963 |
| | 990 |
| Depreciation, amortization and cost of timber harvested | 320 | | | 327 | | | 955 | | | 963 | |
| Distribution expenses | 395 |
| | 397 |
| | 1,168 |
| | 1,166 |
| Distribution expenses | 377 | | | 395 | | | 1,149 | | | 1,168 | |
| Taxes other than payroll and income taxes | 42 |
| | 44 |
| | 128 |
| | 130 |
| Taxes other than payroll and income taxes | 44 | | | 42 | | | 129 | | | 128 | |
| Restructuring and other charges, net | 21 |
| | — |
| | 21 |
| | 48 |
| Restructuring and other charges, net | 105 | | | 21 | | | 131 | | | 21 | |
| Net (gains) losses on sales and impairments of businesses | 8 |
| | 122 |
| | 153 |
| | 122 |
| Net (gains) losses on sales and impairments of businesses | (5) | | | 8 | | | 347 | | | 153 | |
| Net (gains) losses on sales of equity method investments | | Net (gains) losses on sales of equity method investments | (2) | | | 0 | | | (35) | | | 0 | |
| Antitrust fines | 32 |
| | — |
| | 32 |
| | — |
| Antitrust fines | 0 | | | 32 | | | 0 | | | 32 | |
| Interest expense, net | 123 |
| | 133 |
| | 378 |
| | 401 |
| Interest expense, net | 112 | | | 123 | | | 345 | | | 378 | |
| Non-operating pension expense | 9 |
| | 25 |
| | 27 |
| | 65 |
| |
| Earnings (Loss) From Continuing Operations Before Income Taxes and Equity Earnings | 452 |
| | 553 |
| | 1,204 |
| | 1,399 |
| |
| Non-operating pension expense (income) | | Non-operating pension expense (income) | (11) | | | 9 | | | (31) | | | 27 | |
| Earnings (Loss) Before Income Taxes and Equity Earnings | | Earnings (Loss) Before Income Taxes and Equity Earnings | 282 | | | 452 | | | 527 | | | 1,204 | |
| Income tax provision (benefit) | 137 |
| | 83 |
| | 371 |
| | 302 |
| Income tax provision (benefit) | 50 | | | 137 | | | 211 | | | 371 | |
| Equity earnings (loss), net of taxes | 27 |
| | 92 |
| | 221 |
| | 257 |
| Equity earnings (loss), net of taxes | (28) | | | 27 | | | 13 | | | 221 | |
| Earnings (Loss) From Continuing Operations | 342 |
| | 562 |
| | 1,054 |
| | 1,354 |
| |
| Discontinued operations, net of taxes | — |
| | — |
| | — |
| | 345 |
| |
| Net Earnings (Loss) | 342 |
| | 562 |
| | 1,054 |
| | 1,699 |
| Net Earnings (Loss) | 204 | | | 342 | | | 329 | | | 1,054 | |
| Less: Net earnings (loss) attributable to noncontrolling interests | (2 | ) | | — |
| | (6 | ) | | 3 |
| Less: Net earnings (loss) attributable to noncontrolling interests | 0 | | | (2) | | | 0 | | | (6) | |
| Net Earnings (Loss) Attributable to International Paper Company | $ | 344 |
| | $ | 562 |
| | $ | 1,060 |
| | $ | 1,696 |
| Net Earnings (Loss) Attributable to International Paper Company | $ | 204 | | | $ | 344 | | | $ | 329 | | | $ | 1,060 | |
| Basic Earnings (Loss) Per Share Attributable to International Paper Company Common Shareholders | | | | | | | | Basic Earnings (Loss) Per Share Attributable to International Paper Company Common Shareholders | |
| Earnings (loss) from continuing operations | $ | 0.88 |
| | $ | 1.38 |
| | $ | 2.67 |
| | $ | 3.28 |
| |
| Discontinued operations, net of taxes | — |
| | — |
| | — |
| | 0.84 |
| |
| Net earnings (loss) | $ | 0.88 |
| | $ | 1.38 |
| | $ | 2.67 |
| | $ | 4.12 |
| Net earnings (loss) | $ | 0.52 | | | $ | 0.88 | | | $ | 0.84 | | | $ | 2.67 | |
| Diluted Earnings (Loss) Per Share Attributable to International Paper Company Common Shareholders | | | | | | | | Diluted Earnings (Loss) Per Share Attributable to International Paper Company Common Shareholders | |
| Earnings (loss) from continuing operations | $ | 0.87 |
| | $ | 1.37 |
| | $ | 2.65 |
| | $ | 3.25 |
| |
| Discontinued operations, net of taxes | — |
| | — |
| | — |
| | 0.83 |
| |
| Net earnings (loss) | $ | 0.87 |
| | $ | 1.37 |
| | $ | 2.65 |
| | $ | 4.08 |
| Net earnings (loss) | $ | 0.52 | | | $ | 0.87 | | | $ | 0.83 | | | $ | 2.65 | |
| Average Shares of Common Stock Outstanding – assuming dilution | 395.4 |
| | 411.4 |
| | 399.6 |
| | 416.3 |
| Average Shares of Common Stock Outstanding – assuming dilution | 394.6 | | | 395.4 | | | 394.5 | | | 399.6 | |
The accompanying notes are an integral part of these condensed financial statements.
INTERNATIONAL PAPER COMPANY
(Unaudited)
(In millions)
| | | | Three Months Ended
September 30, | | Nine Months Ended
September 30, | | Three Months Ended
September 30, | | Nine Months Ended
September 30, |
| | 2019 | | 2018 | | 2019 | | 2018 | | 2020 | | 2019 | | 2020 | | 2019 |
| Net Earnings (Loss) | $ | 342 |
| | $ | 562 |
| | $ | 1,054 |
| | $ | 1,699 |
| Net Earnings (Loss) | $ | 204 | | | $ | 342 | | | $ | 329 | | | $ | 1,054 | |
| Other Comprehensive Income (Loss), Net of Tax: | | | | | | | | Other Comprehensive Income (Loss), Net of Tax: | |
| Amortization of pension and post-retirement prior service costs and net loss: | | | | | | | | Amortization of pension and post-retirement prior service costs and net loss: | |
| U.S. plans | 41 |
| | 76 |
| | 122 |
| | 227 |
| U.S. plans | 42 | | | 41 | | | 127 | | | 122 | |
| Non-U.S. plans | | Non-U.S. plans | 1 | | | 0 | | | 1 | | | 0 | |
| Change in cumulative foreign currency translation adjustment | (179 | ) | | (87 | ) | | (106 | ) | | (467 | ) | Change in cumulative foreign currency translation adjustment | (28) | | | (179) | | | (515) | | | (106) | |
| Net gains/losses on cash flow hedging derivatives: | | | | | | | | Net gains/losses on cash flow hedging derivatives: | |
| Net gains (losses) arising during the period | (10 | ) | | 1 |
| | (6 | ) | | (20 | ) | Net gains (losses) arising during the period | (4) | | | (10) | | | (34) | | | (6) | |
| Reclassification adjustment for (gains) losses included in net earnings (loss) | 4 |
| | 2 |
| | 5 |
| | 2 |
| Reclassification adjustment for (gains) losses included in net earnings (loss) | 6 | | | 4 | | | 26 | | | 5 | |
| Total Other Comprehensive Income (Loss), Net of Tax | (144 | ) | | (8 | ) | | 15 |
| | (258 | ) | Total Other Comprehensive Income (Loss), Net of Tax | 17 | | | (144) | | | (395) | | | 15 | |
| Comprehensive Income (Loss) | 198 |
| | 554 |
| | 1,069 |
| | 1,441 |
| Comprehensive Income (Loss) | 221 | | | 198 | | | (66) | | | 1,069 | |
| Net (earnings) loss attributable to noncontrolling interests | 2 |
| | — |
| | 6 |
| | (3 | ) | Net (earnings) loss attributable to noncontrolling interests | 0 | | | 2 | | | 0 | | | 6 | |
| Other comprehensive (income) loss attributable to noncontrolling interests | — |
| | 2 |
| | — |
| | 4 |
| Other comprehensive (income) loss attributable to noncontrolling interests | 0 | | | 0 | | | 2 | | | 0 | |
| Comprehensive Income (Loss) Attributable to International Paper Company | $ | 200 |
| | $ | 556 |
| | $ | 1,075 |
| | $ | 1,442 |
| Comprehensive Income (Loss) Attributable to International Paper Company | $ | 221 | | | $ | 200 | | | $ | (64) | | | $ | 1,075 | |
The accompanying notes are an integral part of these condensed financial statements.
INTERNATIONAL PAPER COMPANY
| | | | September 30,
2019 | | December 31,
2018 | | September 30,
2020 | | December 31,
2019 |
| | (unaudited) | | | | (unaudited) | | |
| Assets | | | | Assets | |
| Current Assets | | | | Current Assets | |
| Cash and temporary investments | $ | 697 |
| | $ | 589 |
| Cash and temporary investments | $ | 678 | | | $ | 511 | |
| Accounts and notes receivable, net | 3,305 |
| | 3,521 |
| Accounts and notes receivable, net | 3,034 | | | 3,280 | |
| Contract assets | 388 |
| | 395 |
| Contract assets | 388 | | | 393 | |
| Inventories | 2,194 |
| | 2,241 |
| Inventories | 2,007 | | | 2,208 | |
| Current financial assets of variable interest entities (Note 16) | | Current financial assets of variable interest entities (Note 16) | 4,850 | | | 0 | |
| Assets held for sale | 278 |
| | — |
| Assets held for sale | 114 | | | 0 | |
| Other current assets | 189 |
| | 250 |
| Other current assets | 217 | | | 247 | |
| Total Current Assets | 7,051 |
| | 6,996 |
| Total Current Assets | 11,288 | | | 6,639 | |
| Plants, Properties and Equipment, net | 12,845 |
| | 13,067 |
| Plants, Properties and Equipment, net | 12,410 | | | 13,004 | |
| Forestlands | 378 |
| | 402 |
| Forestlands | 288 | | | 391 | |
| Investments | 1,651 |
| | 1,648 |
| Investments | 1,100 | | | 1,721 | |
| Financial Assets of Variable Interest Entities (Note 16) | 7,084 |
| | 7,070 |
| |
| Long-Term Financial Assets of Variable Interest Entities (Note 16) | | Long-Term Financial Assets of Variable Interest Entities (Note 16) | 2,252 | | | 7,088 | |
| Goodwill | 3,412 |
| | 3,374 |
| Goodwill | 3,304 | | | 3,347 | |
| Right of Use Assets | 425 |
| | — |
| Right of Use Assets | 422 | | | 434 | |
| Deferred Charges and Other Assets | 1,002 |
| | 1,019 |
| Deferred Charges and Other Assets | 776 | | | 847 | |
| Total Assets | $ | 33,848 |
| | $ | 33,576 |
| Total Assets | $ | 31,840 | | | $ | 33,471 | |
| Liabilities and Equity | | | | Liabilities and Equity | |
| Current Liabilities | | | | Current Liabilities | |
| Notes payable and current maturities of long-term debt | $ | 402 |
| | $ | 639 |
| Notes payable and current maturities of long-term debt | $ | 179 | | | $ | 168 | |
| Current nonrecourse financial liabilities of variable interest entities (Note 16) | | Current nonrecourse financial liabilities of variable interest entities (Note 16) | 4,220 | | | 4,220 | |
| Accounts payable | 2,349 |
| | 2,413 |
| Accounts payable | 2,226 | | | 2,423 | |
| Accrued payroll and benefits | 442 |
| | 535 |
| Accrued payroll and benefits | 453 | | | 466 | |
| Liabilities held for sale | 248 |
| | — |
| Liabilities held for sale | 376 | | | 0 | |
| Other current liabilities | 1,288 |
| | 1,107 |
| Other current liabilities | 1,022 | | | 1,369 | |
| Total Current Liabilities | 4,729 |
| | 4,694 |
| Total Current Liabilities | 8,476 | | | 8,646 | |
| Long-Term Debt | 9,957 |
| | 10,015 |
| Long-Term Debt | 8,525 | | | 9,597 | |
| Nonrecourse Financial Liabilities of Variable Interest Entities (Note 16) | 6,303 |
| | 6,298 |
| |
| Long-Term Nonrecourse Financial Liabilities of Variable Interest Entities (Note 16) | | Long-Term Nonrecourse Financial Liabilities of Variable Interest Entities (Note 16) | 2,091 | | | 2,085 | |
| Deferred Income Taxes | 2,643 |
| | 2,600 |
| Deferred Income Taxes | 2,639 | | | 2,633 | |
| Pension Benefit Obligation | 1,653 |
| | 1,762 |
| Pension Benefit Obligation | 1,421 | | | 1,578 | |
| Postretirement and Postemployment Benefit Obligation | 248 |
| | 264 |
| Postretirement and Postemployment Benefit Obligation | 246 | | | 270 | |
| Long-Term Lease Obligations | 292 |
| | — |
| Long-Term Lease Obligations | 290 | | | 304 | |
| Other Liabilities | 567 |
| | 560 |
| Other Liabilities | 1,056 | | | 640 | |
| Equity | | | | Equity | |
| Common stock, $1 par value, 2019 – 448.9 shares and 2018 – 448.9 shares | 449 |
| | 449 |
| |
| Common stock, $1 par value, 2020 – 448.9 shares and 2019 – 448.9 shares | | Common stock, $1 par value, 2020 – 448.9 shares and 2019 – 448.9 shares | 449 | | | 449 | |
| Paid-in capital | 6,261 |
| | 6,280 |
| Paid-in capital | 6,302 | | | 6,297 | |
| Retained earnings | 8,447 |
| | 7,465 |
| Retained earnings | 8,122 | | | 8,408 | |
| Accumulated other comprehensive loss | (5,014 | ) | | (4,500 | ) | Accumulated other comprehensive loss | (5,132) | | | (4,739) | |
| | 10,143 |
| | 9,694 |
| | 9,741 | | | 10,415 | |
| Less: Common stock held in treasury, at cost, 2019 – 56.8 shares and 2018 – 48.3 shares | 2,702 |
| | 2,332 |
| |
| Less: Common stock held in treasury, at cost, 2020 – 55.8 shares and 2019 – 56.8 shares | | Less: Common stock held in treasury, at cost, 2020 – 55.8 shares and 2019 – 56.8 shares | 2,648 | | | 2,702 | |
| Total International Paper Shareholders’ Equity | 7,441 |
| | 7,362 |
| Total International Paper Shareholders’ Equity | 7,093 | | | 7,713 | |
| Noncontrolling interests | 15 |
| | 21 |
| Noncontrolling interests | 3 | | | 5 | |
| Total Equity | 7,456 |
| | 7,383 |
| Total Equity | 7,096 | | | 7,718 | |
| Total Liabilities and Equity | $ | 33,848 |
| | $ | 33,576 |
| Total Liabilities and Equity | $ | 31,840 | | | $ | 33,471 | |
The accompanying notes are an integral part of these condensed financial statements.
INTERNATIONAL PAPER COMPANY
(Unaudited)
(In millions)
| | | | | | | | | | | |
| | Nine Months Ended
September 30, |
| | 2020 | | 2019 |
| Operating Activities | | | |
| Net earnings (loss) | $ | 329 | | | $ | 1,054 | |
| Depreciation, amortization and cost of timber harvested | 955 | | | 963 | |
| Deferred income tax provision (benefit), net | (5) | | | 68 | |
| Restructuring and other charges, net | 131 | | | 21 | |
| Net (gains) losses on sales and impairments of businesses | 347 | | | 153 | |
| Net (gains) losses on sales of equity method investments | (35) | | | 0 | |
| Antitrust fines | 0 | | | 32 | |
| Equity method dividends received | 158 | | | 260 | |
| Equity (earnings) losses, net | (13) | | | (221) | |
| Periodic pension expense, net | 24 | | | 70 | |
| Other, net | 212 | | | 106 | |
| Changes in current assets and liabilities | | | |
| Accounts and notes receivable | 96 | | | 168 | |
| Contract assets | 2 | | | 6 | |
| Inventories | 74 | | | (9) | |
| Accounts payable and accrued liabilities | 0 | | | (11) | |
| Interest payable | (26) | | | (31) | |
| Other | 25 | | | 53 | |
| Cash Provided By (Used For) Operations | 2,274 | | | 2,682 | |
| Investment Activities | | | |
| Invested in capital projects, net of insurance recoveries | (657) | | | (913) | |
| Acquisitions, net of cash acquired | (64) | | | (99) | |
| Proceeds from sales of equity method investments | 500 | | | 0 | |
| Proceeds from sales of businesses, net of cash divested | 0 | | | 17 | |
| Proceeds from sale of fixed assets | 3 | | | 15 | |
| Other | 18 | | | (14) | |
| Cash Provided By (Used For) Investment Activities | (200) | | | (994) | |
| Financing Activities | | | |
| Repurchases of common stock and payments of restricted stock tax withholding | (42) | | | (535) | |
| Issuance of debt | 692 | | | 381 | |
| Reduction of debt | (1,795) | | | (772) | |
| Change in book overdrafts | 16 | | | (29) | |
| Dividends paid | (605) | | | (595) | |
| Debt tender premiums paid | (124) | | | 0 | |
| Other | (1) | | | 3 | |
| Cash Provided By (Used For) Financing Activities | (1,859) | | | (1,547) | |
| Cash Included in Assets Held for Sale | (11) | | | (19) | |
| Effect of Exchange Rate Changes on Cash | (37) | | | (14) | |
| Change in Cash and Temporary Investments | 167 | | | 108 | |
| Cash and Temporary Investments | | | |
| Beginning of period | 511 | | | 589 | |
| End of period | $ | 678 | | | $ | 697 | |
|
| | | | | | | |
| | Nine Months Ended
September 30, |
| | 2019 | | 2018 |
| Operating Activities | | | |
| Net earnings (loss) | $ | 1,054 |
| | $ | 1,699 |
|
| Depreciation, amortization and cost of timber harvested | 963 |
| | 990 |
|
| Deferred income tax provision (benefit), net | 68 |
| | 163 |
|
| Restructuring and other charges, net | 21 |
| | 48 |
|
| Net gain on transfer of North American Consumer Packaging business | — |
| | (488 | ) |
| Net (gains) losses on sales and impairments of businesses | 153 |
| | 122 |
|
| Antitrust fines | 32 |
| | — |
|
| Equity method dividends received | 260 |
| | 130 |
|
| Equity (earnings) losses, net | (221 | ) | | (257 | ) |
| Periodic pension expense, net | 70 |
| | 172 |
|
| Other, net | 106 |
| | 75 |
|
| Changes in current assets and liabilities | | | |
| Accounts and notes receivable | 168 |
| | (441 | ) |
| Contract assets | 6 |
| | (20 | ) |
| Inventories | (9 | ) | | (120 | ) |
| Accounts payable and accrued liabilities | (11 | ) | | 301 |
|
| Interest payable | (31 | ) | | (33 | ) |
| Other | 53 |
| | 64 |
|
| Cash Provided By (Used For) Operations | 2,682 |
| | 2,405 |
|
| Investment Activities | | | |
| Invested in capital projects | (913 | ) | | (1,286 | ) |
| Acquisitions, net of cash acquired | (99 | ) | | — |
|
| Net settlement on transfer of North American Consumer Packaging business | — |
| | (40 | ) |
| Proceeds from divestitures, net of cash divested | 17 |
| | — |
|
| Proceeds from sale of fixed assets | 15 |
| | 12 |
|
| Other | (14 | ) | | 4 |
|
| Cash Provided By (Used For) Investment Activities | (994 | ) | | (1,310 | ) |
| Financing Activities | | | |
| Repurchases of common stock and payments of restricted stock tax withholding | (535 | ) | | (532 | ) |
| Issuance of debt | 381 |
| | 349 |
|
| Reduction of debt | (772 | ) | | (242 | ) |
| Change in book overdrafts | (29 | ) | | (33 | ) |
| Dividends paid | (595 | ) | | (588 | ) |
| Other | 3 |
| | — |
|
| Cash Provided By (Used For) Financing Activities | (1,547 | ) | | (1,046 | ) |
| Cash Included in Assets Held for Sale | (19 | ) | | — |
|
| Effect of Exchange Rate Changes on Cash | (14 | ) | | (41 | ) |
| Change in Cash and Temporary Investments | 108 |
| | 8 |
|
| Cash and Temporary Investments | | | |
| Beginning of period | 589 |
| | 1,018 |
|
| End of period | $ | 697 |
| | $ | 1,026 |
|
The accompanying notes are an integral part of these condensed financial statements.
INTERNATIONAL PAPER COMPANY
(Unaudited)
The accompanying unaudited condensed financial statements have been prepared in conformity with accounting principles generally accepted in the United States and in accordance with the instructions to Form 10-Q and, in the opinion of management, include all adjustments that are necessary for the fair presentation of International Paper Company’s (International Paper’s, the Company’s or our) financial position, results of operations, and cash flows for the interim periods presented. Except as disclosed herein, such adjustments are of a normal, recurring nature. Results for the first nine months of the year may not necessarily be indicative of full year results. It is suggested that these condensed financial statements be read in conjunction with the audited financial statements and the notes thereto included in the Company’s Annual Report on Form 10-K for the year ended December 31, 2018,2019, which have previously been filed with the Securities and Exchange Commission.
We have seen a significant negative impact on demand for our printing papers products. Demand for our pulp, containerboard and corrugated box products has not been negatively impacted by COVID-19 to date, but could be unfavorably impacted going forward if negative economic conditions associated with COVID-19 persist or deteriorate. Furthermore, if there is a resurgence of the virus leading to additional governmental measures, such as stay-at-home orders or business and school closures, our supply chain, and therefore our production, could be negatively impacted.
There continue to be significant uncertainties associated with the COVID-19 pandemic, including with respect to the various economic reopening plans and the resurgence of the virus in many areas; additional actions that may be taken by governmental authorities and private businesses to attempt to contain the COVID-19 outbreak or to mitigate its impact; the extent and duration of social distancing and stay-at-home orders; the possibility of development of a vaccine; and the ongoing impact of COVID-19 on unemployment, economic activity and consumer confidence. Developments related to COVID-19 are significantly adversely affecting portions of our business, and could have a material adverse effect on our financial condition, results of operations and cash flows, particularly if negative global economic conditions persist for a significant period of time or deteriorate.
Recently Adopted Accounting Pronouncements
Leases
In February 2016, the FASB issued ASU 2016-02, "Leases (Topic 842)." The Company adopted the provisions of this guidance effective January 1, 2019, using the modified retrospective optional transition method. Therefore, the standard was applied beginning January 1, 2019 and prior periods were not restated. The adoption of the standard did not result in a cumulative-effect adjustment to the opening balance of Retained earnings. The Company elected the package of practical expedients and implemented internal controls and system functionality to enable the preparation of financial information upon adoption.
The adoption of the new standard resulted in the recognition of a right of use asset and short-term and long-term liabilities recorded on the Company's consolidated balance sheet related to operating leases. Accounting for finance leases remained substantially unchanged. In addition, the adoption of the standard did not have a material impact on the Company's results of operations or cash flows.
Comprehensive Income
In February 2018, the FASB issued ASU 2018-02, "Income Statement - Reporting Comprehensive Income (Topic 220): Reclassification of Certain Tax Effects from Accumulated Other Comprehensive Income." This guidance gives entities the option to reclassify stranded tax effects caused by the newly-enacted U.S. Tax Cuts and Jobs Act from accumulated other comprehensive income to retained earnings. As a result, the Company adopted this guidance effective January 1, 2019, and recorded a net increase to opening Retained earnings and a decrease to opening Accumulated other comprehensive income of $529 million, due to the cumulative impact of adopting the new guidance.
Recently Issued Accounting Pronouncements Not Yet Adopted
Intangibles
In January 2017, the FASB issued ASU 2017-04, "Intangibles - Goodwill and Other (Topic 350): Simplifying the Test for Goodwill Impairment." This guidance eliminates the requirement to calculate the implied fair value of goodwill under Step 2 of today's goodwill impairment test to measure a goodwill impairment charge. Instead, entities will record an impairment charge based on the excess of a reporting unit's carrying amount over its fair value. This guidance should be applied prospectively and is effective for annual reporting periods beginning after December 15, 2019, for any impairment test performed in 2020. Early adoption is permitted for annual and interim goodwill impairment testing dates after January 1, 2017. The Company plans to early adopt this guidance in the fourth quarter of 2019 in conjunction with our annual evaluation for possible goodwill impairment which is performed in addition to interim evaluations when management believes that it is more likely than not, that events or circumstances have occurred that would result in the impairment of a reporting unit's goodwill.
Financial Instruments - Credit Losses
In June 2016, the FASB issued ASU 2016-13, "Financial Instruments - Credit Losses (Topic 326): Measurement of Credit Losses on Financial Instruments." This guidance replaces the current incurred loss impairment method with a method that reflects expected credit losses. The Company adopted this guidance using the modified retrospective approach on January 1, 2020. As a result of using this approach, the Company recognized a cumulative effect adjustment of $2 million to the opening balance of retained earnings representing the adjustment to our opening allowance for doubtful accounts required to state our trade receivables and contract assets net of their expected credit losses, net of deferred taxes.
Recently Issued Accounting Pronouncements Not Yet Adopted
Reference Rate Reform
In March 2020, the FASB issued ASU 2020-04, "Reference Rate Reform (Topic 848): Facilitation of the Effects of Reference Rate Reform on Financial Reporting." This guidance provides companies with optional guidance to ease the potential accounting burden associated with transitioning away from reference rates that are expected to be discontinued. This guidance
is effective upon issuance and generally can be applied through December 31, 2022. The Company is currently evaluating the provisions of this guidance.
Income Taxes
In December 2019, the FASB issued ASU 2019-12, "Income Taxes (Topic 740): Simplifying the Accounting for Income Taxes." This guidance removes certain exceptions from recognizing deferred taxes for investments, performing intraperiod allocation and calculating income taxes in interim periods. It also adds guidance to reduce complexity in certain areas, including recognizing deferred taxes for tax goodwill and allocating taxes to members of a consolidated group. This guidance is effective for annual reporting periods beginning after December 15, 2019,
including2020, and interim periods within those fiscal years. Early adoption of the amendments is permitted. This guidance should be applied using the modified-retrospective approach. In May 2019, the FASB issued ASU 2019-05, "Financial Instruments - Credit Losses (Topic 326): Targeted Transition Relief." The amendmentspermitted, including adoption in this Update provideany interim period for public business entities with targeted transition relief that is intended to increase comparability offor periods for which financial statement information for some entities that otherwise would have measured similar financial instruments using different measurement methodologies. The amendments also decrease costs for some financial statement preparers while providing financial statement users with decision-useful information. For entities thatstatements have not yet adopted the amendments in Update 2016-13, the effective date and transition methodology for the amendments in this Update are the same as in Update 2016-13.been issued. The Company is currently evaluatingplans to early adopt the provisions of this guidance in the fourth quarter of 2020 and plansdoes not expect the impact to adopt this guidance and the related amendments on its effective date of January 1, 2020, by recognizing any cumulative effect of initially applying the new standard as an adjustment to the opening balance of Retained earnings.be material.
Pension Plan Disclosures
In July 2018, the FASB issued ASU 2018-09, "Codification Improvements," which included amendments to Subtopic 962-325. This disclosure guidance pertains to the presentation of certain types of investments and is effective for annual reporting periods beginning after December 15, 2018. The Company is currently evaluating the provisions of this guidance and its potential impact on our 2019 annual Form 10-K disclosures and presentation related to pension plan assets.
Generally, the Company recognizes revenue on a point-in-time basis when the customer takes title to the goods and assumes the risks and rewards for the goods. For customized goods where the Company has a legally enforceable right to payment for the goods, the Company recognizes revenue over time which, generally, is as the goods are produced.
Disaggregated Revenue
A geographic disaggregation of revenues across our company segmentation in the following tables provides information to assist in evaluating the nature, timing and uncertainty of revenue and cash flows and how they may be impacted by economic factors.
| | | | | | | | | | | | | | | | | | | | | | | | | | | | | | | | |
| | Three Months Ended September 30, 2020 |
| In millions | | Industrial Packaging | | Global Cellulose Fibers | | Printing Papers | | Corporate and Inter-segment Sales | | Total |
| Primary Geographical Markets (a) | | | | | | | | | | |
| United States | | $ | 3,169 | | | $ | 479 | | | $ | 362 | | | $ | 44 | | | $ | 4,054 | |
| EMEA | | 394 | | | 59 | | | 244 | | | (3) | | | 694 | |
| Pacific Rim and Asia | | 15 | | | 26 | | | 6 | | | 10 | | | 57 | |
| Americas, other than U.S. | | 190 | | | 0 | | | 131 | | | (3) | | | 318 | |
| Total | | $ | 3,768 | | | $ | 564 | | | $ | 743 | | | $ | 48 | | | $ | 5,123 | |
| | | | | | | | | | |
| Operating Segments | | | | | | | | | | |
| North American Industrial Packaging | | $ | 3,351 | | | $ | — | | | $ | — | | | $ | — | | | $ | 3,351 | |
| EMEA Industrial Packaging | | 306 | | | — | | | — | | | — | | | 306 | |
| Brazilian Industrial Packaging | | 52 | | | — | | | — | | | — | | | 52 | |
| European Coated Paperboard | | 90 | | | — | | | — | | | — | | | 90 | |
| Global Cellulose Fibers | | — | | | 564 | | | — | | | — | | | 564 | |
| North American Printing Papers | | — | | | — | | | 362 | | | — | | | 362 | |
| Brazilian Papers | | — | | | — | | | 150 | | | — | | | 150 | |
| European Papers | | — | | | — | | | 232 | | | — | | | 232 | |
| Indian Papers | | — | | | — | | | 0 | | | — | | | 0 | |
| Intra-segment Eliminations | | (31) | | | — | | | (1) | | | — | | | (32) | |
| Corporate & Inter-segment Sales | | — | | | — | | | — | | | 48 | | | 48 | |
| Total | | $ | 3,768 | | | $ | 564 | | | $ | 743 | | | $ | 48 | | | $ | 5,123 | |
|
| | | | | | | | | | | | | | | | | | | | |
| | | Three Months Ended September 30, 2019 |
| In millions | | Industrial Packaging | | Global Cellulose Fibers | | Printing Papers | | Corporate and Inter-segment Sales | | Total |
| Primary Geographical Markets (a) | | | | | | | | | | |
| United States | | $ | 3,180 |
| | $ | 535 |
| | $ | 486 |
| | $ | 56 |
| | $ | 4,257 |
|
| EMEA | | 415 |
| | 62 |
| | 315 |
| | (1 | ) | | 791 |
|
| Pacific Rim and Asia | | 20 |
| | 27 |
| | 47 |
| | 3 |
| | 97 |
|
| Americas, other than U.S. | | 205 |
| | — |
| | 223 |
| | (5 | ) | | 423 |
|
| Total | | $ | 3,820 |
| | $ | 624 |
| | $ | 1,071 |
| | $ | 53 |
| | $ | 5,568 |
|
| | | | | | | | | | | |
| Operating Segments | | | | | | | | | | |
| North American Industrial Packaging | | $ | 3,368 |
| | $ | — |
| | $ | — |
| | $ | — |
| | $ | 3,368 |
|
| EMEA Industrial Packaging | | 324 |
| | — |
| | — |
| | — |
| | 324 |
|
| Brazilian Industrial Packaging | | 61 |
| | — |
| | — |
| | — |
| | 61 |
|
| European Coated Paperboard | | 92 |
| | — |
| | — |
| | — |
| | 92 |
|
| Global Cellulose Fibers | | — |
| | 624 |
| | — |
| | — |
| | 624 |
|
| North American Printing Papers | | — |
| | — |
| | 492 |
| | — |
| | 492 |
|
| Brazilian Papers | | — |
| | — |
| | 247 |
| | — |
| | 247 |
|
| European Papers | | — |
| | — |
| | 299 |
| | — |
| | 299 |
|
| Indian Papers | | — |
| | — |
| | 38 |
| | — |
| | 38 |
|
| Intra-segment Eliminations | | (25 | ) | | — |
| | (5 | ) | | — |
| | (30 | ) |
| Corporate & Inter-segment Sales | |
|
| | — |
| | — |
| | 53 |
| | 53 |
|
| Total | | $ | 3,820 |
| | $ | 624 |
| | $ | 1,071 |
| | $ | 53 |
| | $ | 5,568 |
|
(a) Net sales are attributed to countries based on the location of the seller.
| | | | | Nine Months Ended September 30, 2019 | | Nine Months Ended September 30, 2020 |
| In millions | | Industrial Packaging | | Global Cellulose Fibers | | Printing Papers | | Corporate and Inter-segment Sales | | Total | In millions | | Industrial Packaging | | Global Cellulose Fibers | | Printing Papers | | Corporate and Inter-segment Sales | | Total |
| Primary Geographical Markets (a) | | | | | | | | | | | Primary Geographical Markets (a) | |
| United States | | $ | 9,531 |
| | $ | 1,656 |
| | $ | 1,448 |
| | $ | 174 |
| | $ | 12,809 |
| United States | | $ | 9,364 | | | $ | 1,507 | | | $ | 1,069 | | | $ | 146 | | | $ | 12,086 | |
| EMEA | | 1,263 |
| | 207 |
| | 986 |
| | (8 | ) | | 2,448 |
| EMEA | | 1,213 | | | 175 | | | 765 | | | (11) | | | 2,142 | |
| Pacific Rim and Asia | | 50 |
| | 111 |
| | 167 |
| | 9 |
| | 337 |
| Pacific Rim and Asia | | 43 | | | 55 | | | 20 | | | 20 | | | 138 | |
| Americas, other than U.S. | | 672 |
| | — |
| | 623 |
| | (11 | ) | | 1,284 |
| Americas, other than U.S. | | 600 | | | 0 | | | 380 | | | (5) | | | 975 | |
| Total | | $ | 11,516 |
| | $ | 1,974 |
| | $ | 3,224 |
| | $ | 164 |
| | $ | 16,878 |
| Total | | $ | 11,220 | | | $ | 1,737 | | | $ | 2,234 | | | $ | 150 | | | $ | 15,341 | |
| | | | | | | | | | | | |
| Operating Segments | | | | | | | | | | | Operating Segments | |
| North American Industrial Packaging | | $ | 10,158 |
| | $ | — |
| | $ | — |
| | $ | — |
| | $ | 10,158 |
| North American Industrial Packaging | | $ | 9,947 | | | $ | — | | | $ | — | | | $ | — | | | $ | 9,947 | |
| EMEA Industrial Packaging | | 994 |
| | — |
| | — |
| | — |
| | 994 |
| EMEA Industrial Packaging | | 953 | | | — | | | — | | | — | | | 953 | |
| Brazilian Industrial Packaging | | 176 |
| | — |
| | — |
| | — |
| | 176 |
| Brazilian Industrial Packaging | | 148 | | | — | | | — | | | — | | | 148 | |
| European Coated Paperboard | | 275 |
| | — |
| | — |
| | — |
| | 275 |
| European Coated Paperboard | | 266 | | | — | | | — | | | — | | | 266 | |
| Global Cellulose Fibers | | — |
| | 1,974 |
| | — |
| | — |
| | 1,974 |
| Global Cellulose Fibers | | — | | | 1,737 | | | — | | | — | | | 1,737 | |
| North American Printing Papers | | — |
| | — |
| | 1,474 |
| | — |
| | 1,474 |
| North American Printing Papers | | — | | | — | | | 1,073 | | | — | | | 1,073 | |
| Brazilian Papers | | — |
| | — |
| | 702 |
| | — |
| | 702 |
| Brazilian Papers | | — | | | — | | | 434 | | | — | | | 434 | |
| European Papers | | — |
| | — |
| | 929 |
| | — |
| | 929 |
| European Papers | | — | | | — | | | 728 | | | — | | | 728 | |
| Indian Papers | | — |
| | — |
| | 144 |
| | — |
| | 144 |
| Indian Papers | | — | | | — | | | 0 | | | — | | | 0 | |
| Intra-segment Eliminations | | (87 | ) | | — |
| | (25 | ) | | — |
| | (112 | ) | Intra-segment Eliminations | | (94) | | | — | | | (1) | | | — | | | (95) | |
| Corporate & Inter-segment Sales | |
|
| | — |
| | — |
| | 164 |
| | 164 |
| Corporate & Inter-segment Sales | | — | | | — | | | — | | | 150 | | | 150 | |
| Total | | $ | 11,516 |
| | $ | 1,974 |
| | $ | 3,224 |
| | $ | 164 |
| | $ | 16,878 |
| Total | | $ | 11,220 | | | $ | 1,737 | | | $ | 2,234 | | | $ | 150 | | | $ | 15,341 | |
(a) Net sales are attributed to countries based on the location of the seller.
| | | | | | | | | | | | | | | | | | | | | | | | | | | | | | | | |
| | Three Months Ended September 30, 2019 |
| In millions | | Industrial Packaging | | Global Cellulose Fibers | | Printing Papers | | Corporate & Intersegment | | Total |
Primary Geographical Markets (a) | | | | | | | | | | |
| United States | | $ | 3,180 | | | $ | 535 | | | $ | 486 | | | $ | 56 | | | $ | 4,257 | |
| EMEA | | 415 | | | 62 | | | 315 | | | (1) | | | 791 | |
| Pacific Rim and Asia | | 20 | | | 27 | | | 47 | | | 3 | | | 97 | |
| Americas, other than U.S. | | 205 | | | 0 | | | 223 | | | (5) | | | 423 | |
| Total | | $ | 3,820 | | | $ | 624 | | | $ | 1,071 | | | $ | 53 | | | $ | 5,568 | |
| | | | | | | | | | |
| Operating Segments | | | | | | | | | | |
| North American Industrial Packaging | | $ | 3,368 | | | $ | — | | | $ | — | | | $ | — | | | $ | 3,368 | |
| EMEA Industrial Packaging | | 324 | | | — | | | — | | | — | | | 324 | |
| Brazilian Industrial Packaging | | 61 | | | — | | | — | | | — | | | 61 | |
| European Coated Paperboard | | 92 | | | — | | | — | | | — | | | 92 | |
| Global Cellulose Fibers | | — | | | 624 | | | — | | | — | | | 624 | |
| North American Printing Papers | | — | | | — | | | 492 | | | — | | | 492 | |
| Brazilian Papers | | — | | | — | | | 247 | | | — | | | 247 | |
| European Papers | | — | | | — | | | 299 | | | — | | | 299 | |
| Indian Papers | | — | | | — | | | 38 | | | — | | | 38 | |
| Intra-segment Eliminations | | (25) | | | — | | | (5) | | | — | | | (30) | |
| Corporate & Inter-segment Sales | | — | | | — | | | — | | | 53 | | | 53 | |
| Total | | $ | 3,820 | | | $ | 624 | | | $ | 1,071 | | | $ | 53 | | | $ | 5,568 | |
|
| | | | | | | | | | | | | | | | | | | | |
| | | Three Months Ended September 30, 2018 |
| In millions | | Industrial Packaging | | Global Cellulose Fibers | | Printing Papers | | Corporate & Intersegment | | Total |
Primary Geographical Markets (a) | | | | | | | | | | |
| United States | | $ | 3,394 |
| | $ | 602 |
| | $ | 482 |
| | $ | 52 |
| | $ | 4,530 |
|
| EMEA | | 396 |
| | 77 |
| | 328 |
| | (4 | ) | | 797 |
|
| Pacific Rim and Asia | | 40 |
| | 35 |
| | 62 |
| | 6 |
| | 143 |
|
| Americas, other than U.S. | | 204 |
| | — |
| | 230 |
| | (3 | ) | | 431 |
|
| Total | | $ | 4,034 |
| | $ | 714 |
| | $ | 1,102 |
| | $ | 51 |
| | $ | 5,901 |
|
| | | | | | | | | | | |
| Operating Segments | | | | | | | | | | |
| North American Industrial Packaging | | $ | 3,653 |
| | $ | — |
| | $ | — |
| | $ | — |
| | $ | 3,653 |
|
| EMEA Industrial Packaging | | 311 |
| | — |
| | — |
| | ��� |
| | 311 |
|
| Brazilian Industrial Packaging | | 57 |
| | — |
| | — |
| | — |
| | 57 |
|
| European Coated Paperboard | | 87 |
| | — |
| | — |
| | — |
| | 87 |
|
| Global Cellulose Fibers | | — |
| | 714 |
| | — |
| | — |
| | 714 |
|
| North American Printing Papers | | — |
| | — |
| | 492 |
| | — |
| | 492 |
|
| Brazilian Papers | | — |
| | — |
| | 255 |
| | — |
| | 255 |
|
| European Papers | | — |
| | — |
| | 311 |
| | — |
| | 311 |
|
| Indian Papers | | — |
| | — |
| | 47 |
| | — |
| | 47 |
|
| Intra-segment Eliminations | | (74 | ) | | — |
| | (3 | ) | | — |
| | (77 | ) |
| Corporate & Inter-segment Sales | | — |
| | — |
| | — |
| | 51 |
| | 51 |
|
| Total | | $ | 4,034 |
| | $ | 714 |
| | $ | 1,102 |
| | $ | 51 |
| | $ | 5,901 |
|
(a) Net sales are attributed to countries based on the location of the seller.
| | | | | Nine Months Ended September 30, 2018 | | Nine Months Ended September 30, 2019 |
| In millions | | Industrial Packaging | | Global Cellulose Fibers | | Printing Papers | | Corporate & Intersegment | | Total | In millions | | Industrial Packaging | | Global Cellulose Fibers | | Printing Papers | | Corporate & Intersegment | | Total |
Primary Geographical Markets (a) | | | | | | | | | | | Primary Geographical Markets (a) | |
| United States | | $ | 9,832 |
| | $ | 1,720 |
| | $ | 1,399 |
| | $ | 163 |
| | $ | 13,114 |
| United States | | $ | 9,531 | | | $ | 1,656 | | | $ | 1,448 | | | $ | 174 | | | $ | 12,809 | |
| EMEA | | 1,275 |
| | 222 |
| | 988 |
| | (13 | ) | | 2,472 |
| EMEA | | 1,263 | | | 207 | | | 986 | | | (8) | | | 2,448 | |
| Pacific Rim and Asia | | 110 |
| | 140 |
| | 185 |
| | 35 |
| | 470 |
| Pacific Rim and Asia | | 50 | | | 111 | | | 167 | | | 9 | | | 337 | |
| Americas, other than U.S. | | 666 |
| | 1 |
| | 643 |
| | (11 | ) | | 1,299 |
| Americas, other than U.S. | | 672 | | | 0 | | | 623 | | | (11) | | | 1,284 | |
| Total | | $ | 11,883 |
| | $ | 2,083 |
| | $ | 3,215 |
| | $ | 174 |
| | $ | 17,355 |
| Total | | $ | 11,516 | | | $ | 1,974 | | | $ | 3,224 | | | $ | 164 | | | $ | 16,878 | |
| | | | | | | | | | | | |
| Operating Segments | | | | | | | | | | | Operating Segments | |
| North American Industrial Packaging | | $ | 10,604 |
| | $ | — |
| | $ | — |
| | $ | — |
| | $ | 10,604 |
| North American Industrial Packaging | | $ | 10,158 | | | $ | — | | | $ | — | | | $ | — | | | $ | 10,158 | |
| EMEA Industrial Packaging | | 1,017 |
| | — |
| | — |
| | — |
| | 1,017 |
| EMEA Industrial Packaging | | 994 | | | — | | | — | | | — | | | 994 | |
| Brazilian Industrial Packaging | | 175 |
| | — |
| | — |
| | — |
| | 175 |
| Brazilian Industrial Packaging | | 176 | | | — | | | — | | | — | | | 176 | |
| European Coated Paperboard | | 265 |
| | — |
| | — |
| | — |
| | 265 |
| European Coated Paperboard | | 275 | | | — | | | — | | | — | | | 275 | |
| Global Cellulose Fibers | | — |
| | 2,083 |
| | — |
| | — |
| | 2,083 |
| Global Cellulose Fibers | | — | | | 1,974 | | | — | | | — | | | 1,974 | |
| North American Printing Papers | | — |
| | — |
| | 1,443 |
| | — |
| | 1,443 |
| North American Printing Papers | | — | | | — | | | 1,474 | | | — | | | 1,474 | |
| Brazilian Papers | | — |
| | — |
| | 706 |
| | — |
| | 706 |
| Brazilian Papers | | — | | | — | | | 702 | | | — | | | 702 | |
| European Papers | | — |
| | — |
| | 932 |
| | — |
| | 932 |
| European Papers | | — | | | — | | | 929 | | | — | | | 929 | |
| Indian Papers | | — |
| | — |
| | 150 |
| | — |
| | 150 |
| Indian Papers | | — | | | — | | | 144 | | | — | | | 144 | |
| Intra-segment Eliminations | | (178 | ) | | — |
| | (16 | ) | | — |
| | (194 | ) | Intra-segment Eliminations | | (87) | | | — | | | (25) | | | — | | | (112) | |
| Corporate & Inter-segment Sales | | — |
| | — |
| | — |
| | 174 |
| | 174 |
| Corporate & Inter-segment Sales | | — | | | — | | | — | | | 164 | | | 164 | |
| Total | | $ | 11,883 |
| | $ | 2,083 |
| | $ | 3,215 |
| | $ | 174 |
| | $ | 17,355 |
| Total | | $ | 11,516 | | | $ | 1,974 | | | $ | 3,224 | | | $ | 164 | | | $ | 16,878 | |
(a) Net sales are attributed to countries based on the location of the seller.
Revenue Contract Balances
The opening and closing balances of the Company's contract assets and current contract liabilities are as follows:
|
| | | | | | | | |
| In millions | | Contract Assets (Short-Term) | | Contract Liabilities (Short-Term) |
| Beginning Balance - January 1, 2019 | | $ | 395 |
| | $ | 56 |
|
| Ending Balance -September 30, 2019 | | 388 |
| | 28 |
|
| Increase / (Decrease) | | $ | (7 | ) | | $ | (28 | ) |
A contract asset is created when the Company recognizes revenue on its customized products prior to having an unconditional right to payment from the customer, which generally does not occur until title and risk of loss passes to the customer.
A contract liability is created when customers prepay for goods prior to the Company transferring those goods to the customer. The contract liability is reduced once control of the goods is transferred to the customer. The majority of our customer prepayments are received during the fourth quarter each year for goods that will be transferred to customers over the following twelve months. Contract liabilities of $20 million and $56 million are included in Other current liabilities in the accompanying condensed consolidated balance sheet as of September 30, 2020 and December 31, 2019, respectively.
The difference between the opening and closing balances of the Company's contract assets and contract liabilities primarily results from the difference between the price and quantity at comparable points in time for goods for which we have an unconditional right to payment or receive pre-payment from the customer, respectively.
A summary of the changes in equity for the three months and nine months ended September 30, 20192020 and 20182019 is provided below:
| | | | | | | | | | | | | | | | | | | | | | | | | | | | | | | | | | | | | | | | | | | | | | | |
| Three Months Ended September 30, 2020 |
| In millions, except per share amounts | Common Stock Issued | | Paid-in Capital | | Retained Earnings | Accumulated Other Comprehensive Income (Loss) | | Common Stock Held In Treasury, At Cost | | Total
International
Paper
Shareholders’
Equity | | Noncontrolling
Interests | | Total
Equity | |
| Balance, July 1 | $ | 449 | | | $ | 6,283 | | | $ | 8,123 | | $ | (5,149) | | | $ | 2,649 | | | $ | 7,057 | | | $ | 3 | | | $ | 7,060 | | |
| Issuance of stock for various plans, net | — | | | 18 | | | — | | — | | | (2) | | | 20 | | | — | | | 20 | | |
| Repurchase of stock | — | | | — | | | — | | — | | | 1 | | | (1) | | | — | | | (1) | | |
Common stock dividends ($0.5125 per share) | — | | | — | | | (205) | | — | | | — | | | (205) | | | — | | | (205) | | |
| Transactions of equity method investees | — | | | 1 | | | — | | — | | | — | | | 1 | | | — | | | 1 | | |
| Comprehensive income (loss) | — | | | — | | | 204 | | 17 | | | — | | | 221 | | | 0 | | | 221 | | |
| Ending Balance, September 30 | $ | 449 | | | $ | 6,302 | | | $ | 8,122 | | $ | (5,132) | | | $ | 2,648 | | | $ | 7,093 | | | $ | 3 | | | $ | 7,096 | | |
|
| | | | | | | | | | | | | | | | | | | | | | | | | | | | | | | |
| | Three Months Ended September 30, 2019 |
| In millions, except per share amounts | Common Stock Issued | | Paid-in Capital | | Retained Earnings | Accumulated Other Comprehensive Income (Loss) | | Treasury Stock | | Total International Paper Shareholders’ Equity | | Noncontrolling Interests | | Total Equity | |
| Balance, July 1 | $ | 449 |
| | $ | 6,229 |
| | $ | 8,302 |
| $ | (4,870 | ) | | $ | 2,628 |
| | $ | 7,482 |
| | $ | 17 |
| | $ | 7,499 |
| |
| Issuance of stock for various plans, net | — |
| | 32 |
| | — |
| — |
| | (1 | ) | | 33 |
| | — |
| | 33 |
| |
| Repurchase of stock | — |
| | — |
| | — |
| — |
| | 75 |
| | (75 | ) | | — |
| | (75 | ) | |
Common stock dividends ($0.5000 per share) | — |
| | — |
| | (199 | ) | — |
| | — |
| | (199 | ) | | — |
| | (199 | ) | |
| Transactions of equity method investees | — |
| | — |
| | — |
| — |
| | — |
| | — |
| | — |
| | — |
| |
| Comprehensive income (loss) | — |
| | — |
| | 344 |
| (144 | ) | | — |
| | 200 |
| | (2 | ) | | 198 |
| |
| Ending Balance, September 30 | $ | 449 |
| | $ | 6,261 |
| | $ | 8,447 |
| $ | (5,014 | ) | | $ | 2,702 |
| | $ | 7,441 |
| | $ | 15 |
| | $ | 7,456 |
| |
| | | | | | | | | | | | | | | | | | | | | | | | | | | | | | | | | | | | | | | | | | | | | | | |
| Nine Months Ended September 30, 2020 |
| In millions, except per share amounts | Common Stock Issued | | Paid-in Capital | | Retained Earnings | Accumulated Other Comprehensive Income (Loss) | | Common Stock Held In Treasury, At Cost | | Total
International
Paper
Shareholders’
Equity | | Noncontrolling
Interests | | Total
Equity | |
| Balance, January 1 | $ | 449 | | | $ | 6,297 | | | $ | 8,408 | | $ | (4,739) | | | $ | 2,702 | | | $ | 7,713 | | | $ | 5 | | | $ | 7,718 | | |
| Adoption of ASU 2016-13 measurement of credit losses on financial instruments | — | | | — | | | (2) | | — | | | — | | | (2) | | | — | | | (2) | | |
| Issuance of stock for various plans, net | — | | | (31) | | | — | | — | | | (96) | | | 65 | | | — | | | 65 | | |
| Repurchase of stock | — | | | — | | | — | | — | | | 42 | | | (42) | | | — | | | (42) | | |
Common stock dividends ($1.5375 per share) | — | | | — | | | (613) | | — | | | — | | | (613) | | | — | | | (613) | | |
| Transactions of equity method investees | — | | | 36 | | | — | | — | | | — | | | 36 | | | — | | | 36 | | |
| Comprehensive income (loss) | — | | | — | | | 329 | | (393) | | | — | | | (64) | | | (2) | | | (66) | | |
| Ending Balance, September 30 | $ | 449 | | | $ | 6,302 | | | $ | 8,122 | | $ | (5,132) | | | $ | 2,648 | | | $ | 7,093 | | | $ | 3 | | | $ | 7,096 | | |
|
| | | | | | | | | | | | | | | | | | | | | | | | | | | | | | | |
| | Nine Months Ended September 30, 2019 |
| In millions, except per share amounts | Common Stock Issued | | Paid-in Capital | | Retained Earnings | Accumulated Other Comprehensive Income (Loss) | | Treasury Stock | | Total International Paper Shareholders’ Equity | | Noncontrolling Interests | | Total Equity | |
| Balance, January 1 | $ | 449 |
| | $ | 6,280 |
| | $ | 7,465 |
| $ | (4,500 | ) | | $ | 2,332 |
| | $ | 7,362 |
| | $ | 21 |
| | $ | 7,383 |
| |
| Adoption of ASU 2018-02 reclassification of stranded tax effects resulting from Tax Reform | — |
| | — |
| | 529 |
| (529 | ) | | — |
| | — |
| | — |
| | — |
| |
| Issuance of stock for various plans, net | — |
| | (52 | ) | | — |
| — |
| | (165 | ) | | 113 |
| | — |
| | 113 |
| |
| Repurchase of stock | — |
| | — |
| | — |
| — |
| | 535 |
| | (535 | ) | | — |
| | (535 | ) | |
Common stock dividends ($1.5000 per share) | — |
| | — |
| | (607 | ) | — |
| | — |
| | (607 | ) | | — |
| | (607 | ) | |
| Transactions of equity method investees | — |
| | 33 |
| | — |
| — |
| | — |
| | 33 |
| | — |
| | 33 |
| |
| Comprehensive income (loss) | — |
| | — |
| | 1,060 |
| 15 |
| | — |
| | 1,075 |
| | (6 | ) | | 1,069 |
| |
| Ending Balance, September 30 | $ | 449 |
| | $ | 6,261 |
| | $ | 8,447 |
| $ | (5,014 | ) | | $ | 2,702 |
| | $ | 7,441 |
| | $ | 15 |
| | $ | 7,456 |
| |
| | | | | | | | | | | | | | | | | | | | | | | | | | | | | | | | | | | | | | | | | | | | | | | |
| Three Months Ended September 30, 2019 |
| In millions, except per share amounts | Common Stock Issued | | Paid-in Capital | | Retained Earnings | Accumulated Other Comprehensive Income (Loss) | | Common Stock Held In Treasury, At Cost | | Total
International
Paper
Shareholders’
Equity | | Noncontrolling
Interests | | Total
Equity | |
| Balance, July 1 | $ | 449 | | | $ | 6,229 | | | $ | 8,302 | | $ | (4,870) | | | $ | 2,628 | | | $ | 7,482 | | | $ | 17 | | | $ | 7,499 | | |
| Issuance of stock for various plans, net | — | | | 32 | | | — | | — | | | (1) | | | 33 | | | — | | | 33 | | |
| Repurchase of stock | — | | | — | | | — | | — | | | 75 | | | (75) | | | — | | | (75) | | |
| Common stock dividends ($0.5000 per share) | — | | | — | | | (199) | | — | | | — | | | (199) | | | — | | | (199) | | |
| Transactions of equity method investees | — | | | 0 | | | — | | — | | | — | | | 0 | | | — | | | 0 | | |
| Comprehensive income (loss) | — | | | — | | | 344 | | (144) | | | — | | | 200 | | | (2) | | | 198 | | |
| Ending Balance, September 30 | $ | 449 | | | $ | 6,261 | | | $ | 8,447 | | $ | (5,014) | | | $ | 2,702 | | | $ | 7,441 | | | $ | 15 | | | $ | 7,456 | | |
|
| | | | | | | | | | | | | | | | | | | | | | | | | | | | | | | |
| | Three Months Ended September 30, 2018 |
| In millions, except per share amounts | Common Stock Issued | | Paid-in Capital | | Retained Earnings | Accumulated Other Comprehensive Income (Loss) | | Treasury Stock | | Total International Paper Shareholders’ Equity | | Noncontrolling Interests | | Total Equity | |
| Balance, July 1 | $ | 449 |
| | $ | 6,219 |
| | $ | 6,988 |
| $ | (4,881 | ) | | $ | 1,931 |
| | $ | 6,844 |
| | $ | 20 |
| | $ | 6,864 |
| |
| Issuance of stock for various plans, net | — |
| | 36 |
| | — |
| — |
| | (1 | ) | | 37 |
| | — |
| | 37 |
| |
| Repurchase of stock | — |
| | — |
| | — |
| — |
| | 201 |
| | (201 | ) | | — |
| | (201 | ) | |
| Common stock dividends ($0.4750 per share) | — |
| | — |
| | (197 | ) | — |
| | — |
| | (197 | ) | | — |
| | (197 | ) | |
| Transactions of equity method investees | — |
| | 1 |
| | — |
| — |
| | — |
| | 1 |
| | — |
| | 1 |
| |
| Comprehensive income (loss) | — |
| | — |
| | 562 |
| (6 | ) | | — |
| | 556 |
| | (2 | ) | | 554 |
| |
| Ending Balance, September 30 | $ | 449 |
| | $ | 6,256 |
| | $ | 7,353 |
| $ | (4,887 | ) | | $ | 2,131 |
| | $ | 7,040 |
| | $ | 18 |
| | $ | 7,058 |
| |
| | | | | | | | | | | | | | | | | | | | | | | | | | | | | | | | | | | | | | | | | | | | | | | |
| Nine Months Ended September 30, 2019 |
| In millions, except per share amounts | Common Stock Issued | | Paid-in Capital | | Retained Earnings | Accumulated Other Comprehensive Income (Loss) | | Common Stock Held In Treasury, At Cost | | Total
International
Paper
Shareholders’
Equity | | Noncontrolling
Interests | | Total
Equity | |
| Balance, January 1 | $ | 449 | | | $ | 6,280 | | | $ | 7,465 | | $ | (4,500) | | | $ | 2,332 | | | $ | 7,362 | | | $ | 21 | | | $ | 7,383 | | |
| Adoption of ASU 2018-02 reclassification of stranded tax effects resulting from Tax Reform | — | | | — | | | 529 | | (529) | | | — | | | — | | | — | | | 0 | | |
| Issuance of stock for various plans, net | — | | | (52) | | | — | | — | | | (165) | | | 113 | | | — | | | 113 | | |
| Repurchase of stock | — | | | — | | | — | | — | | | 535 | | | (535) | | | — | | | (535) | | |
| Common stock dividends ($1.5000 per share) | — | | | — | | | (607) | | — | | | — | | | (607) | | | — | | | (607) | | |
| Transactions of equity method investees | — | | | 33 | | | — | | — | | | — | | | 33 | | | — | | | 33 | | |
| Comprehensive income (loss) | — | | | — | | | 1,060 | | 15 | | | — | | | 1,075 | | | (6) | | | 1,069 | | |
| Ending Balance, September 30 | $ | 449 | | | $ | 6,261 | | | $ | 8,447 | | $ | (5,014) | | | $ | 2,702 | | | $ | 7,441 | | | $ | 15 | | | $ | 7,456 | | |
|
| | | | | | | | | | | | | | | | | | | | | | | | | | | | | | | |
| | Nine Months Ended September 30, 2018 |
| In millions, except per share amounts | Common Stock Issued | | Paid-in Capital | | Retained Earnings | Accumulated Other Comprehensive Income (Loss) | | Treasury Stock | | Total International Paper Shareholders’ Equity | | Noncontrolling Interests | | Total Equity | |
| Balance, January 1 | $ | 449 |
| | $ | 6,206 |
| | $ | 6,180 |
| $ | (4,633 | ) | | $ | 1,680 |
| | $ | 6,522 |
| | $ | 19 |
| | $ | 6,541 |
| |
| Adoption of ASC 606 revenue from contracts with customers | — |
| | — |
| | 73 |
| — |
| | — |
| | 73 |
| | — |
| | 73 |
| |
| Issuance of stock for various plans, net | — |
| | 31 |
| | — |
| — |
| | (81 | ) | | 112 |
| | — |
| | 112 |
| |
| Repurchase of stock | — |
| | — |
| | — |
| — |
| | 532 |
| | (532 | ) | | — |
| | (532 | ) | |
| Common stock dividends ($1.4250 per share) | — |
| | — |
| | (596 | ) | — |
| | — |
| | (596 | ) | | — |
| | (596 | ) | |
| Transactions of equity method investees | — |
| | 19 |
| | — |
| — |
| | — |
| | 19 |
| | — |
| | 19 |
| |
| Comprehensive income (loss) | — |
| | — |
| | 1,696 |
| (254 | ) | | — |
| | 1,442 |
| | (1 | ) | | 1,441 |
| |
| Ending Balance, September 30 | $ | 449 |
| | $ | 6,256 |
| | $ | 7,353 |
| $ | (4,887 | ) | | $ | 2,131 |
| | $ | 7,040 |
| | $ | 18 |
| | $ | 7,058 |
| |
The following table presents changes in accumulated other comprehensive income (AOCI) for the three months and nine months ended September 30, 20192020 and 2018:2019:
| | | | | | | | | | | | | | | | | | | | | | | | | | |
| | Three Months Ended
September 30, | | Nine Months Ended
September 30, |
| In millions | | 2020 | | 2019 | | 2020 | | 2019 |
| Defined Benefit Pension and Postretirement Adjustments | | | | | | | | |
| Balance at beginning of period | | $ | (2,192) | | | $ | (2,362) | | | $ | (2,277) | | | $ | (1,916) | |
| Reclassification of stranded tax effects | | 0 | | | 0 | | | 0 | | | (527) | |
| Amounts reclassified from accumulated other comprehensive income | | 43 | | | 41 | | | 128 | | | 122 | |
| Balance at end of period | | (2,149) | | | (2,321) | | | (2,149) | | | (2,321) | |
| Change in Cumulative Foreign Currency Translation Adjustments | | | | | | | | |
| Balance at beginning of period | | (2,950) | | | (2,508) | | | (2,465) | | | (2,581) | |
| Other comprehensive income (loss) before reclassifications | | (28) | | | (179) | | | (515) | | | (110) | |
| Amounts reclassified from accumulated other comprehensive income | | 0 | | | 0 | | | 0 | | | 4 | |
| Other comprehensive income (loss) attributable to noncontrolling interest | | 0 | | | 0 | | | 2 | | | 0 | |
| Balance at end of period | | (2,978) | | | (2,687) | | | (2,978) | | | (2,687) | |
| Net Gains and Losses on Cash Flow Hedging Derivatives | | | | | | | | |
| Balance at beginning of period | | (7) | | | 0 | | | 3 | | | (3) | |
| Other comprehensive income (loss) before reclassifications | | (4) | | | (10) | | | (34) | | | (6) | |
| Reclassification of stranded tax effects | | 0 | | | 0 | | | 0 | | | (2) | |
| Amounts reclassified from accumulated other comprehensive income | | 6 | | | 4 | | | 26 | | | 5 | |
| Balance at end of period | | (5) | | | (6) | | | (5) | | | (6) | |
| Total Accumulated Other Comprehensive Income (Loss) at End of Period | | $ | (5,132) | | | $ | (5,014) | | | $ | (5,132) | | | $ | (5,014) | |
|
| | | | | | | | | | | | | | | | |
| | | Three Months Ended
September 30, | | Nine Months Ended
September 30, |
| In millions | | 2019 | | 2018 | | 2019 | | 2018 |
| Defined Benefit Pension and Postretirement Adjustments | | | | | | | | |
| Balance at beginning of period | | $ | (2,362 | ) | | $ | (2,376 | ) | | $ | (1,916 | ) | | $ | (2,527 | ) |
| Reclassification of stranded tax effects | | — |
| | — |
| | (527 | ) | | — |
|
| Amounts reclassified from accumulated other comprehensive income | | 41 |
| | 76 |
| | 122 |
| | 227 |
|
| Balance at end of period | | (2,321 | ) | | (2,300 | ) | | (2,321 | ) | | (2,300 | ) |
| Change in Cumulative Foreign Currency Translation Adjustments | | | | | | | | |
| Balance at beginning of period | | (2,508 | ) | | (2,489 | ) | | (2,581 | ) | | (2,111 | ) |
| Other comprehensive income (loss) before reclassifications | | (179 | ) | | (87 | ) | | (110 | ) | | (469 | ) |
| Amounts reclassified from accumulated other comprehensive income | | — |
| | — |
| | 4 |
| | 2 |
|
| Other comprehensive income (loss) attributable to noncontrolling interest | | — |
| | 2 |
| | — |
| | 4 |
|
| Balance at end of period | | (2,687 | ) | | (2,574 | ) | | (2,687 | ) | | (2,574 | ) |
| Net Gains and Losses on Cash Flow Hedging Derivatives | | | | | | | | |
| Balance at beginning of period | | — |
| | (16 | ) | | (3 | ) | | 5 |
|
| Other comprehensive income (loss) before reclassifications | | (10 | ) | | 1 |
| | (6 | ) | | (20 | ) |
| Reclassification of stranded tax effects | | — |
| | — |
| | (2 | ) | | — |
|
| Amounts reclassified from accumulated other comprehensive income | | 4 |
| | 2 |
| | 5 |
| | 2 |
|
| Balance at end of period | | (6 | ) | | (13 | ) | | (6 | ) | | (13 | ) |
| Total Accumulated Other Comprehensive Income (Loss) at End of Period | | $ | (5,014 | ) | | $ | (4,887 | ) | | $ | (5,014 | ) | | $ | (4,887 | ) |
The following table presents details of the reclassifications out of AOCI for the three months and nine months ended September 30, 20192020 and 2018:2019:
| | | In millions: | | Amounts Reclassified from Accumulated Other Comprehensive Income | Location of Amount Reclassified from AOCI | In millions: | | Amounts Reclassified from Accumulated Other Comprehensive Income | Location of Amount Reclassified from AOCI |
| | Three Months Ended
September 30, | | Nine Months Ended
September 30, | | | | Three Months Ended
September 30, | | Nine Months Ended
September 30, | |
| | 2019 | | 2018 | | 2019 | | 2018 | | | 2020 | | 2019 | | 2020 | | 2019 | |
| Defined benefit pension and postretirement items: | | | | | | | | | | Defined benefit pension and postretirement items: | |
| Prior-service costs | | $ | (4 | ) | | $ | (4 | ) | | $ | (10 | ) | | $ | (11 | ) | | (a) | Non-operating pension expense | Prior-service costs | | $ | (5) | | | $ | (4) | | | $ | (15) | | | $ | (10) | | | (a) | Non-operating pension expense |
| Actuarial gains (losses) | | (50 | ) | | (97 | ) | | (152 | ) | | (291 | ) | | (a) | Non-operating pension expense | Actuarial gains (losses) | | (52) | | | (50) | | | (155) | | | (152) | | | (a) | Non-operating pension expense |
| Total pre-tax amount | | (54 | ) | | (101 | ) | | (162 | ) | | (302 | ) | | Total pre-tax amount | | (57) | | | (54) | | | (170) | | | (162) | | |
| Tax (expense) benefit | | 13 |
| | 25 |
| | 40 |
| | 75 |
| | Tax (expense) benefit | | 14 | | | 13 | | | 42 | | | 40 | | |
| Net of tax | | (41 | ) | | (76 | ) | | (122 | ) | | (227 | ) | | Net of tax | | (43) | | | (41) | | | (128) | | | (122) | | |
| Reclassification of stranded tax effects | | — |
| | — |
| | 527 |
| | — |
| |
| Retained Earnings | Reclassification of stranded tax effects | | 0 | | | 0 | | | 0 | | | 527 | | | Retained Earnings |
| Total, net of tax | | (41 | ) | | (76 | ) | | 405 |
| | (227 | ) | | Total, net of tax | | (43) | | | (41) | | | (128) | | | 405 | | |
| | | | | | | | | | | |
| Change in cumulative foreign currency translation adjustments: | | | | | | | | | | Change in cumulative foreign currency translation adjustments: | |
| Business acquisitions/divestitures | | — |
| | — |
| | (4 | ) | | (2 | ) | | (b) | Cost of products sold | Business acquisitions/divestitures | | 0 | | | 0 | | | 0 | | | (4) | | | Cost of products sold |
| Tax (expense) benefit | | — |
| | — |
| | — |
| | — |
| | Tax (expense) benefit | | 0 | | | 0 | | | 0 | | | 0 | | |
| Net of tax | | — |
| | — |
| | (4 | ) | | (2 | ) | | | Net of tax | | 0 | | | 0 | | | 0 | | | (4) | | |
| | | | | | | | | | | |
| Net gains and losses on cash flow hedging derivatives: | | | | | | | | | | Net gains and losses on cash flow hedging derivatives: | |
| Foreign exchange contracts | | (6 | ) | | (3 | ) | | (7 | ) | | (3 | ) | | (c) | Cost of products sold | Foreign exchange contracts | | (8) | | | (6) | | | (39) | | | (7) | | | (b) | Cost of products sold |
| Total pre-tax amount | | (6 | ) | | (3 | ) | | (7 | ) | | (3 | ) | | Total pre-tax amount | | (8) | | | (6) | | | (39) | | | (7) | | |
| Tax (expense)/benefit | | 2 |
| | 1 |
| | 2 |
| | 1 |
| | Tax (expense)/benefit | | 2 | | | 2 | | | 13 | | | 2 | | |
| Net of tax | | (4 | ) | | (2 | ) | | (5 | ) | | (2 | ) | | Net of tax | | (6) | | | (4) | | | (26) | | | (5) | | |
| Reclassification of stranded tax effects | | — |
| | — |
| | 2 |
| | — |
| |
| Retained Earnings | Reclassification of stranded tax effects | | 0 | | | 0 | | | 0 | | | 2 | | | Retained Earnings |
| Total, net of tax | | (4 | ) | | (2 | ) | | (3 | ) | | (2 | ) | | Total, net of tax | | (6) | | | (4) | | | (26) | | | (3) | | |
| Total reclassifications for the period | | $ | (45 | ) | | $ | (78 | ) | | $ | 398 |
| | $ | (231 | ) | | Total reclassifications for the period | | $ | (49) | | | $ | (45) | | | $ | (154) | | | $ | 398 | | |
| |
(a) | (a)These accumulated other comprehensive income components are included in the computation of net periodic pension cost (see Note 19Note 19 for additional details). |
| |
(b) | Amounts for the three months and nine months ended September 30, 2018 were reclassified to Discontinued operations, net of taxes. |
| |
(c) | This accumulated other comprehensive income component is included in our derivatives and hedging activities (see Note 18 for additional details). |
(b)This accumulated other comprehensive income component is included in our derivatives and hedging activities (see Note 18 for additional details).
Basic earnings per share is computed by dividing earnings by the weighted average number of common shares outstanding. Diluted earnings per share is computed assuming that all potentially dilutive securities were converted into common shares. There are no adjustments required to be made to net income for purposes of computing basic and diluted earnings per share. A reconciliation of the amounts included in the computation of basic earnings (loss) per share from continuing operations, and diluted earnings (loss) per share from continuing operations is as follows:
| | | | | | | | | | | | | | | | | | | | | | | |
| | Three Months Ended
September 30, | | Nine Months Ended
September 30, |
| In millions, except per share amounts | 2020 | | 2019 | | 2020 | | 2019 |
| Earnings (loss) attributable to International Paper Company common shareholders | $ | 204 | | | $ | 344 | | | $ | 329 | | | $ | 1,060 | |
| Weighted average common shares outstanding | 393.1 | | | 392.6 | | | 392.9 | | | 396.3 | |
| Effect of dilutive securities | | | | | | | |
| Restricted performance share plan | 1.5 | | | 2.8 | | | 1.6 | | | 3.3 | |
| Weighted average common shares outstanding – assuming dilution | 394.6 | | | 395.4 | | | 394.5 | | | 399.6 | |
| Basic earnings (loss) per share attributable to International Paper Company Common Shareholders | $ | 0.52 | | | $ | 0.88 | | | $ | 0.84 | | | $ | 2.67 | |
| Diluted earnings (loss) per share attributable to International Paper Company Common Shareholders | $ | 0.52 | | | $ | 0.87 | | | $ | 0.83 | | | $ | 2.65 | |
|
| | | | | | | | | | | | | | | |
| | Three Months Ended
September 30, | | Nine Months Ended
September 30, |
| In millions, except per share amounts | 2019 | | 2018 | | 2019 | | 2018 |
| Earnings (loss) from continuing operations attributable to International Paper Company common shareholders | $ | 344 |
| | $ | 562 |
| | $ | 1,060 |
| | $ | 1,351 |
|
| Weighted average common shares outstanding | 392.6 |
| | 407.4 |
| | 396.3 |
| | 411.4 |
|
| Effect of dilutive securities | | | | | | | |
| Restricted performance share plan | 2.8 |
| | 4.0 |
| | 3.3 |
| | 4.9 |
|
| Weighted average common shares outstanding – assuming dilution | 395.4 |
| | 411.4 |
| | 399.6 |
| | 416.3 |
|
| Basic earnings (loss) per share from continuing operations | $ | 0.88 |
| | $ | 1.38 |
| | $ | 2.67 |
| | $ | 3.28 |
|
| Diluted earnings (loss) per share from continuing operations | $ | 0.87 |
| | $ | 1.37 |
| | $ | 2.65 |
| | $ | 3.25 |
|
2020: During the three months ended September 30, 2020, the Company recorded a $105 million pre-tax charge in Corporate related to early debt extinguishment costs.
During the three months ended June 30, 2020, the Company recorded an $18 million pre-tax charge in Corporate related to early debt extinguishment costs.
During the three months ended March 31, 2020, the Company recorded an $8 million pre-tax charge in Corporate related to early debt extinguishment costs.
2019: During the three months and nine months ended September 30, 2019, the Company recorded an $11 million pre-tax charge in Corporate, a $6 million pre-tax charge in the Printing Papers segment and a $4 million pre-tax charge in the Global Cellulose Fibers segment for severance related to an overhead cost reduction initiative. The majority of the severance is expected to bewas paid over the next twelve months.
There were no restructuring and other charges recorded during the three months and six months ended June 30, 2019.
2018: There were no restructuring and other charges recorded during the three months ended September 30, 2018.
During the three months ended June 30, 2018, the Company recorded a $26 million pre-tax charge, in the Industrial Packaging segment, related to approximately $12 million of severance, $6 million in accelerated depreciation, $2 million in accelerated amortization, and $6 million in other charges in conjunction with the optimization of our EMEA Packaging business.
During the three months ended March 31, 2018, the Company recorded a $22 million pre-tax charge, in the Industrial Packaging segment, primarily related to severance charges in conjunction with the optimization of our EMEA Packaging business.
2020: In May 2020, the Company increased its noncontrolling interest in an entity that produces corrugated sheets. The equity purchase price was $64 million. The Company is party to various agreements with the entity which includes a containerboard supply agreement. The Company will account for its interest as an equity method investment.
2019:On June 28, 2019, the Company closed on the previously announced acquisition of two packaging businesses located in Portugal (Ovar) and France (Torigni and Cabourg) from DS Smith Packaging. The total purchase consideration, inclusive of working capital adjustments, was approximately €72€71 million (approximately $82$81 million at June 30, 2019 exchange rates), subject to post-closing adjustments..
The following table summarizes the provisionalfinal fair value assigned to assets and liabilities acquired as of June 28, 2019:
|
| | | |
| In millions | |
| Cash and temporary investments | $ | 1 |
|
| Accounts and notes receivable | 23 |
|
| Inventory | 8 |
|
| Plants, properties and equipment | 28 |
|
| Goodwill | 48 |
|
| Right of use assets | 2 |
|
| Total assets acquired | 110 |
|
| Accounts payable and accrued liabilities | 20 |
|
| Other current liabilities | 1 |
|
| Long-term debt | 2 |
|
| Postretirement and postemployment benefit obligation | 3 |
|
| Long-term lease obligations | 2 |
|
| Total liabilities assumed | 28 |
|
| Net assets acquired | $ | 82 |
|
| | | | | |
| In millions | |
| Cash and temporary investments | $ | 2 | |
| Accounts and notes receivable | 22 | |
| Inventory | 8 | |
| Plants, properties and equipment | 37 | |
| Goodwill | 27 | |
| Intangible assets | 14 | |
| Right of use assets | 3 | |
| Deferred charges and other assets | 2 | |
| Total assets acquired | $ | 115 | |
| Short-term debt | $ | 2 | |
| Accounts payable and accrued liabilities | 17 | |
| Other current liabilities | 5 | |
| Deferred income taxes | 4 | |
| Long-term debt | 1 | |
| Postretirement and postemployment benefit obligation | 3 | |
| Long-term lease obligations | 2 | |
| Total liabilities assumed | 34 | |
| Net assets acquired | $ | 81 | |
Since the date of acquisition, Net sales of $25 million and Earnings (loss) from continuing operations before income taxes and equity earnings of $2 million from the acquired business have been included in the Company's consolidated statement of operations for the three months ended September 30, 2019.
The purchase price and related allocation are preliminary and could be revised as a result of adjustments made to the purchase price, additional information obtained regarding assets acquired and liabilities assumed, and revisions of provisional estimates of fair values, including, but not limited to, the completion of independent appraisals and valuations related to inventory, property, plant and equipment and acquired intangible assets. Adjustments to provisional amounts will be finalized as new information becomes available, but within the adjustment period of up to one year from the acquisition date.
Pro forma information has not been included as it is impracticable to obtain the information due to the lack of availability of historical U.S. GAAP financial data. The results of the operations of these businesses do not have a material effect on the Company's condensed consolidated results of operations.
The Company has accounted for the above acquisition under ASC 805, "Business Combinations" and the results
Discontinued Operations
On January 1, 2018, the Company completed the transfer of its North American Consumer Packaging business, which included its North American Coated Paperboard and Foodservice businesses, to Graphic Packaging International Partners, LLC (GPIP), a subsidiary of Graphic Packaging Holding Company, in exchange for a 20.5% ownership interest in GPIP. GPIP subsequently transferred the North American Consumer Packaging business to Graphic Packaging International, LLC (GPI), a wholly owned subsidiary of GPIP. International Paper is accounting for its ownership interest in the combined business under the equity method. The Company determined the fair value of its investment in the combined business and recorded a pre-tax gain of $516 million ($385 million after taxes) on the transfer in the first quarter of 2018, subject to final working capital settlement. During the second quarter of 2018, the Company recorded a pre-tax charge of $28 million ($21 million after taxes) to adjust the previously recorded gain on the transfer.
The following summarizes the major classes of line items comprising Earnings (Loss) Before Income Taxes and Equity Earnings reconciled to Discontinued operations, net of tax, related to the transfer of the North American Consumer Packaging business for all periods presented in the consolidated statement of operations:
|
| | | | | | | |
| | Three Months Ended
September 30, | | Nine Months Ended
September 30, |
| In millions | 2018 | | 2018 |
| Net Sales | $ | — |
| | $ | — |
|
| Costs and Expenses | | | |
| Selling and administrative expenses | — |
| | 25 |
|
| (Gain) loss on transfer of business | — |
| | (488 | ) |
| Earnings (Loss) Before Income Taxes and Equity Earnings | — |
| | 463 |
|
| Income tax provision (benefit) | — |
| | 118 |
|
| Discontinued Operations, Net of Taxes | $ | — |
| | $ | 345 |
|
Total cash used for operations related to the North American Consumer Packaging business of $25 million for the nine months ended September 30, 2018, is included in Cash Provided By (Used For) Operations in the consolidated statement of cash flows. Total cash used for investing activities related to the North American Consumer Packaging business of $40 million for the nine months ended September 30, 2018, is included in Cash Provided By (Used For) Investing Activities in the consolidated statement of cash flows.
Other Divestitures
2020:On MayMarch 29, 2019,2020, the Company announced that it had entered into an agreement with West Coast Paper Mills Limited (WCPM) to sell its controlling interest in International Paper APPM Limited (APPM), an India-based paperBrazilian Industrial Packaging business for ₨275 (Indian Rupees) per share.R$330 million (approximately $58.5 million using the September 30, 2020 exchange rate), with R$280 million to be paid at closing and R$50 million one year thereafter, subject to the final working capital adjustments. This business includes 3 containerboard mills and 4 box plants and the agreement follows International Paper then owned approximately 30 million shares, or 75%Paper's previously announced strategic review of the outstanding shares of APPM.Brazilian Industrial Packaging business.
In conjunction with the announced agreement, in the second quarter of 2019, a determination was made that the current book value of the APPM disposal group exceeded its estimated fair value of $119 million which was based on the agreed upon transaction price. As a result, a preliminary pre-tax charge of $152$347 million ($150340 million after taxes) was recorded during the second quarterfirst nine months of 2019. During the third quarter of 2019, the Company recorded an additional charge of $8 million (before and after taxes), which included $2 million related to the change in cumulative foreign currency translation loss and a $6 million loss related to the change in the book value of the long-lived assets of APPM compared to the estimated fair value of the disposal group.2020. These charges are included in the Net (gains) losses on sales and impairments of businesses line item in the accompanying condensed consolidated statement of operations and is included in the results for the Printing PapersIndustrial Packaging segment. A year-to-
date loss of $9 million (before and after taxes) has been allocatedSubsequent to September 30, 2020, the noncontrolling interest related to the impairment of the long-lived assets of APPM.
The transaction closed on October 30, 2019 and the Company retained a passive investment of 20% in APPM. Duringfinal working capital adjustments, if any, will be recognized during the fourth quarter of 2019, a final immaterial adjustment to the impairment charge to reflect the difference between the proceeds received from the transaction and the closing book value of the long-lived assets will be recorded. In addition, the Company will record our retained investment at fair value.2020.
At September 30, 2019,2020, all assets and liabilities related to APPMthe Brazilian Industrial Packaging business are classified as current assets held for sale and current liabilities held for sale in the accompanying condensed consolidated balance sheet.
The following summarizes the major classes of assets and liabilities of APPMthis business reconciled to total Assets held for sale and total Liabilities held for sale in the accompanying condensed consolidated balance sheet:sheet.
|
| | | |
| In millions | September 30, 2019 |
| Cash and temporary investments | $ | 19 |
|
| Accounts and notes receivable | 16 |
|
| Inventories | 23 |
|
| Other current assets | 19 |
|
| Plants, properties and equipment | 195 |
|
| Deferred charges and other assets | 6 |
|
| Total Assets Held for Sale | $ | 278 |
|
| | |
| Accounts payable and accrued liabilities | $ | 18 |
|
| Other current liabilities | 22 |
|
| Deferred income taxes | 47 |
|
| Other liabilities | 1 |
|
| Net impairment reserve | 160 |
|
| Total Liabilities Held for Sale | $ | 248 |
|
| | | | | |
| In millions | September 30, 2020 |
| Cash and temporary investments | $ | 11 | |
| Accounts and notes receivable | 41 | |
| Inventories | 22 | |
| Other current assets | 1 | |
| Plants, properties and equipment (net of impairment) | 28 | |
| Deferred charges and other assets | 11 | |
| Total Assets Held for Sale | $ | 114 | |
| |
| Accounts payable and accrued liabilities | $ | 36 | |
| Deferred income taxes | 3 | |
| Other liabilities | 8 | |
| Impairment reserve (cumulative foreign currency translation) | 329 | |
| Total Liabilities Held for Sale | $ | 376 | |
2019: On October 30, 2019, the Company closed the previously announced sale of its controlling interest in International Paper APPM Limited (APPM) to West Coast Paper Mills (WCPM). During the second quarter of 2020 the Company sold substantially all of its remaining investment and recorded a gain of $6 million. During the third quarter of 2020 the Company sold its remaining immaterial investment in APPM.
Temporary Investments
Temporary investments with an original maturity of three months or less and money market funds with greater than three month maturities but with the right to redeem without notices are treated as cash equivalents and are stated at cost. Temporary investments totaled $484$450 million and $402$335 million at September 30, 20192020 and December 31, 2018,2019, respectively.
Accounts and Notes Receivable
| | | | | | | | | | | |
| In millions | September 30, 2020 | | December 31, 2019 |
| Accounts and notes receivable, net: | | | |
| Trade | $ | 2,789 | | | $ | 3,020 | |
| Other | 245 | | | 260 | |
| Total | $ | 3,034 | | | $ | 3,280 | |
|
| | | | | | | |
| In millions | September 30, 2019 | | December 31, 2018 |
| Accounts and notes receivable, net: | | | |
| Trade | $ | 3,055 |
| | $ | 3,249 |
|
| Other | 250 |
| | 272 |
|
| Total | $ | 3,305 |
| | $ | 3,521 |
|
The allowance for expected credit losses was $86 million at September 30, 2020 and the allowance for doubtful accounts was $77 million and $81$73 million at September 30, 2019 and December 31, 2018, respectively.2019. Based on the Company's accounting estimates and the facts and circumstances available as of the reporting date, we believe our allowance for expected credit losses is adequate. While we have taken into account certain impacts of COVID-19 in connection with our estimate of the allowance for expected credit losses, it is possible that additional expected credit losses in excess of such allowance could occur if additional containment and mitigation measures are required or negative economic conditions persist or deteriorate as a result of of COVID-19.
Inventories
| | | | | | | | | | | |
| In millions | September 30, 2020 | | December 31, 2019 |
| Raw materials | $ | 257 | | | $ | 298 | |
| Finished pulp, paper and packaging | 1,023 | | | 1,192 | |
| Operating supplies | 638 | | | 659 | |
| Other | 89 | | | 59 | |
| Total | $ | 2,007 | | | $ | 2,208 | |
|
| | | | | | | |
| In millions | September 30, 2019 | | December 31, 2018 |
| Raw materials | $ | 270 |
| | $ | 260 |
|
| Finished pulp, paper and packaging | 1,140 |
| | 1,241 |
|
| Operating supplies | 637 |
| | 641 |
|
| Other | 147 |
| | 99 |
|
| Total | $ | 2,194 |
| | $ | 2,241 |
|
Plants, Properties and Equipment
Accumulated depreciation was $20.4$21.0 billion and $20.5 billion at September 30, 20192020 and December 31, 2018,2019, respectively. Depreciation expense was $305$300 million and $315$305 million for the three months ended September 30, 20192020 and 2018,2019, respectively, and $902 million and $930 million for both the nine months ended September 30, 20192020 and 2018, respectively.2019.
Non-cash additions to plants, property and equipment included within accounts payable were $104$33 million and $135$164 million at September 30, 20192020 and December 31, 2018,2019, respectively.
Amounts invested in capital projects in the accompanying condensed consolidated statement of cash flows are presented net of insurance recoveries of $40 million received during the nine months ended September 30, 2020. There were 0 insurance recoveries received during the nine months ended September 30, 2019.
Interest
Interest payments made during the nine months ended September 30, 2020 and 2019 were $520 million and 2018 were $591 million, and $606 million, respectively.
Amounts related to interest were as follows:
|
| | | | | | | | | | | | | | | |
| | Three Months Ended
September 30, | | Nine Months Ended
September 30, |
| In millions | 2019 | | 2018 | | 2019 | | 2018 |
| Interest expense | $ | 177 |
| | $ | 184 |
| | $ | 538 |
| | $ | 547 |
|
| Interest income | 54 |
| | 51 |
| | 160 |
| | 146 |
|
| Capitalized interest costs | 7 |
| | 9 |
| | 21 |
| | 26 |
|
| | | | | | | | | | | | | | | | | | | | | | | |
| | Three Months Ended
September 30, | | Nine Months Ended
September 30, |
| In millions | 2020 | | 2019 | | 2020 | | 2019 |
| Interest expense | $ | 148 | | | $ | 177 | | | $ | 467 | | | $ | 538 | |
| Interest income | 36 | | | 54 | | | 122 | | | 160 | |
| Capitalized interest costs | 9 | | | 7 | | | 27 | | | 21 | |
Asset Retirement Obligations
The Company had recorded liabilities of $95$97 million and $86$96 million related to asset retirement obligations at September 30, 20192020 and December 31, 2018,2019, respectively.
International Paper leases various real estate, including certain operating facilities, warehouses, office space and land. The Company also leases material handling equipment, vehicles, and certain other equipment. The Company's leases have remaining lease terms of one year to 9796 years. Leases having aTotal lease term of twelvecost was $68 million for both the three months or less are not recorded on the balance sheetended September 30, 2020 and the related lease expense is recognized on a straight-line basis over the term of the lease. In addition, the Company has applied the practical expedient to account2019, and $202 million and $206 million for the leasenine months ended September 30, 2020 and non-lease components as a single lease component for all of the Company's leases.2019, respectively.
Right of use (ROU) assets represent the Company's right to use an underlying asset for the lease term and lease liabilities represent the Company's obligation to make lease payments arising from the lease. Effective January 1, 2019, operating lease ROU assets and liabilities are recognized at the commencement date of the lease based on the present value of lease payments over the lease term. The Company's leases may include options to extend or terminate the lease. These options to extend are included in the lease term when it is reasonably certain that we will exercise that option. Some leases have variable payments, however, because they are not based on an index or rate, they are not included in the ROU assets and liabilities. Variable payments for real estate leases primarily relate to common area maintenance, insurance, taxes and utilities. Variable payments for equipment, vehicles, and leases within supply agreements primarily relate to usage, repairs, and maintenance. As the implicit rate is not readily determinable for most of the Company's leases, the Company applies a portfolio approach using an estimated incremental borrowing rate to determine the initial present value of lease payments over the lease terms on a collateralized basis over a similar term, which is based on market and company specific information. We use the unsecured borrowing rate and risk-adjust that rate to approximate a collateralized rate, and apply the rate based on the currency of the lease, which is updated on a quarterly basis for measurement of new lease liabilities.
Components of Lease Expense
|
| | | | | | | | |
| In millions | | Three Months Ended September 30, 2019 | | Nine Months Ended September 30, 2019 |
| Operating lease costs | | $ | 39 |
| | $ | 115 |
|
| Variable lease costs | | 16 |
| | 53 |
|
| Short-term lease costs | | 9 |
| | 27 |
|
| Finance lease cost | | | | |
| Amortization of lease assets | | 3 |
| | 8 |
|
| Interest on lease liabilities | | 1 |
| | 3 |
|
| Total lease cost, net | | $ | 68 |
| | $ | 206 |
|
Supplemental Balance Sheet Information Related to Leases
|
| | | | | | |
| In millions | | Classification | | September 30, 2019 |
| Assets | | | | |
| Operating lease assets | | Right-of-use assets | | $ | 425 |
|
| Finance lease assets | | Plants, properties and equipment, net (a) | | 105 |
|
| Total leased assets | | | | $ | 530 |
|
| Liabilities | | | | |
| Current | | | | |
| Operating | | Other current liabilities | | $ | 136 |
|
| Finance | | Notes payable and current maturities of long-term debt | | 13 |
|
| Noncurrent | | | | |
| Operating | | Long-term lease obligations | | 292 |
|
| Finance | | Long-term debt | | 91 |
|
| Total lease liabilities | | | | $ | 532 |
|
| |
(a) | Finance leases are recorded net of accumulated amortization of $37 million. |
Lease Term and Discount Rate
|
| | | |
In millions | | September 30, 2019 |
Weighted average remaining lease term (years) | | |
Operating leases | | 9.8 years |
|
Finance leases | | 11.3 years |
|
Weighted average discount rate | | |
Operating leases | | 3.24 | % |
Finance leases | | 4.74 | % |
| | | | | | | | | | | | | | | | | | | | |
| In millions | | Classification | | September 30, 2020 | | December 31, 2019 |
| Assets | | | | | | |
| Operating lease assets | | Right-of-use assets | | $ | 422 | | | $ | 434 | |
| Finance lease assets | | Plants, properties and equipment, net (a) | | 95 | | | 103 | |
| Total leased assets | | | | $ | 517 | | | $ | 537 | |
| Liabilities | | | | | | |
| Current | | | | | | |
| Operating | | Other current liabilities | | $ | 137 | | | $ | 134 | |
| Finance | | Notes payable and current maturities of long-term debt | | 12 | | | 12 | |
| Noncurrent | | | | | | |
| Operating | | Long-term lease obligations | | 290 | | | 304 | |
| Finance | | Long-term debt | | 83 | | | 88 | |
| Total lease liabilities | | | | $ | 522 | | | $ | 538 | |
Supplemental Cash Flow Information Related to Leases
|
| | | | |
| In millions | | Nine Months Ended September 30, 2019 |
| Cash paid for amounts included in the measurement of lease liabilities | | |
| Operating cash flows related to operating leases | | $ | 110 |
|
| Operating cash flows related to financing leases | | 3 |
|
| Financing cash flows related to finance leases | | 7 |
|
Maturity(a)Finance leases are recorded net of Lease Liabilities
|
| | | | | | | | | | | | |
| | | September 30, 2019 |
| In millions | | Operating Leases | | Financing Leases | | Total |
| 2019 (remainder of year) | | $ | 39 |
| | $ | 4 |
| | $ | 43 |
|
| 2020 | | 138 |
| | 17 |
| | 155 |
|
| 2021 | | 97 |
| | 15 |
| | 112 |
|
| 2022 | | 64 |
| | 13 |
| | 77 |
|
| 2023 | | 35 |
| | 11 |
| | 46 |
|
| 2024 | | 18 |
| | 10 |
| | 28 |
|
| Thereafter | | 95 |
| | 65 |
| | 160 |
|
| Total lease payments | | 486 |
| | 135 |
| | 621 |
|
| Less: Interest (a) | | 58 |
| | 31 |
| | 89 |
|
| Present value of lease liabilities | | $ | 428 |
| | $ | 104 |
| | $ | 532 |
|
| |
(a) | Calculated using the interest rate for each lease. |
Ataccumulated amortization of $49 million and $40 million as of September 30, 2020 and December 31, 2018, total future minimum commitments under existing non-cancelable operating leases were as follows:2019, respectively.
|
| | | | | | | | | | | | | | | | | | | | | | | | |
| In millions | | 2019 | | 2020 | | 2021 | | 2022 | | 2023 | | Thereafter |
| Lease obligations | | $ | 160 |
| | $ | 125 |
| | $ | 77 |
| | $ | 49 |
| | $ | 28 |
| | $ | 118 |
|
The Company accounts for the following investments in affiliated companies under the equity method of accounting.
Graphic Packaging International Partners, LLC
On January 1, 2018, theThe Company completed the transfer of its North American Consumer Packaging business which included its North American Coated Paperboard and Foodservice businesses, to a subsidiary ofin exchange for an initial 20.5% ownership interest (79,911,511 units) in Graphic Packaging International Partners, LLC (GPIP), a subsidiary of Graphic Packaging Holding Company, in exchange for a 20.5% ownership interest in GPIP.2018. GPIP subsequently transferred the North American Consumer Packaging business to Graphic Packaging International, LLC (GPI), a wholly-owned subsidiary of GPIP that holds the assets of the combined business. On January 29, 2020, the Company exchanged 15,150,784 units of the aggregate units owned by the Company for an aggregated price of $250 million, resulting in a pre-tax gain of $33 million ($25 million after taxes) which was recorded in the first quarter of 2020. On August 7, 2020, the Company exchanged 17,399,414 units of the aggregate units owned by the Company for an aggregated price of $250 million, resulting in an immaterial gain which was recorded in the third quarter of 2020. As of September 30, 2019,2020, the Company's ownership interest in GPIP was 21.6%14.8%. The Company recorded equity earnings of $10$11 million and $19$10 million for the three months ended September 30, 20192020 and 2018,2019, respectively, and $37$29 million and $36$37 million for the nine months ended September 30, 20192020 and 2018,2019, respectively. The Company received cash dividends from GPIP of $20$16 million and $12$20 million during the first nine months of 20192020 and 2018,2019, respectively. The Company's investment in GPIP was $693 million and $1.1 billion at both September 30, 20192020 and December 31, 2018,2019, respectively, which was $534$347 million and $562$529 million, respectively, more than the Company's proportionate share of the entity's underlying net assets. The difference primarily relates to the basis difference between the fair value of our investment and the underlying net assets, and is generally amortized in equity earnings over a period consistent with the underlying long-lived assets. The Company is party to various agreements with GPI under which it sells fiber and other products to GPI. Sales under these agreements were $69$60 million and $62$69 million for the three months ended September 30, 20192020 and 2018,2019, respectively, and $212$190 million and $180$212 million for the nine months ended September 30, 20192020 and 2018,2019, respectively.
The Company continues to evaluate its investment in GPI relative to options available to further monetize this investment.
Summarized financial information for GPIP is presented in the following tables:
Balance Sheet
| | | | | | | | | | | |
| In millions | September 30, 2020 | | December 31, 2019 |
| Current assets | $ | 2,013 | | | $ | 1,796 | |
| Noncurrent assets | 5,662 | | | 5,482 | |
| Current liabilities | 1,692 | | | 1,178 | |
| Noncurrent liabilities | 3,617 | | | 3,244 | |
|
| | | | | | | |
| In millions | September 30, 2019 | | December 31, 2018 |
| Current assets | $ | 1,765 |
| | $ | 1,757 |
|
| Noncurrent assets | 5,419 |
| | 5,292 |
|
| Current liabilities | 1,067 |
| | 1,148 |
|
| Noncurrent liabilities | 3,325 |
| | 3,156 |
|
Income Statement
| | | | | | | | | | | | | | | | | | | | | | | |
| Three Months Ended
September 30, | | Nine Months Ended
September 30, |
| In millions | 2020 | | 2019 | | 2020 | | 2019 |
| Net sales | $ | 1,698 | | | $ | 1,581 | | | $ | 4,908 | | | $ | 4,640 | |
| Gross profit | 255 | | | 266 | | | 838 | | | 820 | |
| Income from continuing operations | 89 | | | 83 | | | 146 | | | 283 | |
| Net income | 89 | | | 83 | | | 146 | | | 283 | |
|
| | | | | | | | | | | | | | | |
| | Three Months Ended
September 30, | | Nine Months Ended
September 30, |
| In millions | 2019 | | 2018 | | 2019 | | 2018 |
| Net sales | $ | 1,581 |
| | $ | 1,530 |
| | $ | 4,640 |
| | $ | 4,515 |
|
| Gross profit | 266 |
| | 256 |
| | 820 |
| | 714 |
|
| Income from continuing operations | 83 |
| | 135 |
| | 283 |
| | 278 |
|
| Net income | 83 |
| | 135 |
| | 283 |
| | 278 |
|
Ilim S.A.
The Company has a 50% equity interest in Ilim S.A. (Ilim), which has subsidiaries whose primary operations are in Russia. The Company recorded equity earnings (losses), net of taxes, of $18$(33) million and $74$18 million for the three months ended September 30, 20192020 and 2018,2019, respectively, and $186$(5) million and $223$186 million for the nine months ended September 30, 20192020 and 2018,2019, respectively. The Company received cash dividends from the joint venture of $239$141 million and $118$239 million during the first nine months of 20192020 and 2018,2019, respectively. At September 30, 20192020 and December 31, 2018,2019, the Company's investment in Ilim was $477$322 million and $478$508 million, respectively, which was $146$126 million and $145$136 million, respectively, more than the Company's proportionate share of the joint venture's underlying net assets. The differences primarily relate to currency translation adjustments and the basis difference between the fair value of our investment at acquisition and the underlying net assets. The Company is party to a joint marketing agreement with JSC Ilim Group, a subsidiary of Ilim, under which the Company purchases, markets and sells paper produced by JSC Ilim Group. Purchases under this agreement were $51$41 million and $50$51 million for the three months ended September 30, 20192020 and 2018,2019, respectively, and $162$131 million and $159$162 million for the nine months ended September 30, 20192020 and 2018,2019, respectively.
Summarized financial information for Ilim is presented in the following tables:
Balance Sheet
| | | | | | | | | | | |
| In millions | September 30, 2020 | | December 31, 2019 |
| Current assets | $ | 592 | | | $ | 804 | |
| Noncurrent assets | 2,442 | | | 2,813 | |
| Current liabilities | 613 | | | 1,015 | |
| Noncurrent liabilities | 2,015 | | | 1,844 | |
| Noncontrolling interests | 13 | | | 16 | |
|
| | | | | | | |
| In millions | September 30, 2019 | | December 31, 2018 |
| Current assets | $ | 749 |
| | $ | 981 |
|
| Noncurrent assets | 2,392 |
| | 1,710 |
|
| Current liabilities | 947 |
| | 545 |
|
| Noncurrent liabilities | 1,509 |
| | 1,470 |
|
| Noncontrolling interests | 22 |
| | 11 |
|
Income Statement
| | | | | | | | | | | | | | | | | | | | | | | |
| Three Months Ended
September 30, | | Nine Months Ended
September 30, |
| In millions | 2020 | | 2019 | | 2020 | | 2019 |
| Net sales | $ | 498 | | | $ | 479 | | | $ | 1,474 | | | $ | 1,692 | |
| Gross profit | 191 | | | 196 | | | 597 | | | 836 | |
| Income (loss) from continuing operations | (62) | | | 41 | | | 7 | | | 388 | |
| Net income (loss) | (60) | | | 40 | | | 7 | | | 375 | |
|
| | | | | | | | | | | | | | | |
| | Three Months Ended
September 30, | | Nine Months Ended
September 30, |
| In millions | 2019 | | 2018 | | 2019 | | 2018 |
| Net sales | $ | 479 |
| | $ | 655 |
| | $ | 1,692 |
| | $ | 2,030 |
|
| Gross profit | 196 |
| | 376 |
| | 836 |
| | 1,152 |
|
| Income from continuing operations | 41 |
| | 149 |
| | 388 |
| | 454 |
|
| Net income | 40 |
| | 143 |
| | 375 |
| | 438 |
|
Goodwill
The following table presents changes in goodwill balances as allocated to each business segment for the nine-months ended September 30, 2019:2020:
| | | In millions | Industrial Packaging | | Global Cellulose Fibers | | Printing Papers | | Total | In millions | Industrial
Packaging | | Global Cellulose Fibers | | Printing
Papers | | Total |
| Balance as of January 1, 2019 | | | | | | | | |
| Balance as of January 1, 2020 | | Balance as of January 1, 2020 | |
| Goodwill | $ | 3,379 |
| | $ | 52 |
| | $ | 2,116 |
| | $ | 5,547 |
| Goodwill | $ | 3,410 | | | $ | 52 | | | $ | 1,998 | | | $ | 5,460 | |
| Accumulated impairment losses | (296 | ) | | — |
| | (1,877 | ) | | (2,173 | ) | Accumulated impairment losses | (296) | | | (52) | | | (1,765) | | | (2,113) | |
| | 3,083 |
| | 52 |
| | 239 |
| | 3,374 |
| | 3,114 | | | 0 | | | 233 | | | 3,347 | |
| Currency translation and other (a) | (2 | ) | | — |
| | (14 | ) | | (16 | ) | Currency translation and other (a) | 1 | | | 0 | | | (45) | | | (44) | |
| Goodwill additions/reductions | 54 |
| (b) | — |
| | (112 | ) | (c) | (58 | ) | Goodwill additions/reductions | 1 | | | 0 | | | 0 | | | 1 | |
| Accumulated impairment loss additions / reductions | — |
| | — |
| | 112 |
| (c) | 112 |
| Accumulated impairment loss additions / reductions | 0 | | | 0 | | | 0 | | | 0 | |
| Balance as of September 30, 2019 | | | | | | | | |
| Balance as of September 30, 2020 | | Balance as of September 30, 2020 | |
| Goodwill | 3,431 |
| | 52 |
| | 1,990 |
| | 5,473 |
| Goodwill | 3,412 | | | 52 | | | 1,953 | | | 5,417 | |
| Accumulated impairment losses | (296 | ) | | — |
| | (1,765 | ) | | (2,061 | ) | Accumulated impairment losses | (296) | | | (52) | | | (1,765) | | | (2,113) | |
| Total | $ | 3,135 |
| | $ | 52 |
| | $ | 225 |
| | $ | 3,412 |
| Total | $ | 3,116 | | | $ | 0 | | | $ | 188 | | | $ | 3,304 | |
| |
(a) | Represents the effects of foreign currency translations. |
| |
(b) | Reflects the provisional goodwill for the acquisitions of Industrial Packaging box plants in EMEA. |
| |
(c) | Reflects the reclassification of India goodwill and accumulated impairment losses to held for sale. |
(a)Represents the effects of foreign currency translations.
Other Intangibles
Identifiable intangible assets comprised the following:
|
| | | | | | | | | | | | | | | | | | | | | | | |
| | September 30, 2019 | | December 31, 2018 |
| In millions | Gross Carrying Amount | | Accumulated Amortization | | Net Intangible Assets | | Gross Carrying Amount | | Accumulated Amortization | | Net Intangible Assets |
| Customer relationships and lists | $ | 541 |
| | $ | 266 |
| | $ | 275 |
| | $ | 542 |
| | $ | 247 |
| | $ | 295 |
|
| Non-compete agreements | 26 |
| | 26 |
| | — |
| | 67 |
| | 67 |
| | — |
|
| Tradenames, patents and trademarks, and developed technology | 173 |
| | 101 |
| | 72 |
| | 174 |
| | 90 |
| | 84 |
|
| Land and water rights | 8 |
| | 2 |
| | 6 |
| | 8 |
| | 2 |
| | 6 |
|
| Software | 26 |
| | 25 |
| | 1 |
| | 26 |
| | 25 |
| | 1 |
|
| Other | 25 |
| | 18 |
| | 7 |
| | 30 |
| | 23 |
| | 7 |
|
| Total | $ | 799 |
| | $ | 438 |
| | $ | 361 |
| | $ | 847 |
| | $ | 454 |
| | $ | 393 |
|
| | | | | | | | | | | | | | | | | | | | | | | | | | | | | | | | | | | |
| | September 30, 2020 | | December 31, 2019 |
| In millions | Gross
Carrying
Amount | | Accumulated
Amortization | | Net Intangible Assets | | Gross
Carrying
Amount | | Accumulated
Amortization | | Net Intangible Assets |
| Customer relationships and lists | $ | 534 | | | $ | 280 | | | $ | 254 | | | $ | 560 | | | $ | 275 | | | $ | 285 | |
| Tradenames, patents and trademarks, and developed technology | 170 | | | 113 | | | 57 | | | 170 | | | 102 | | | 68 | |
| Land and water rights | 8 | | | 2 | | | 6 | | | 8 | | | 2 | | | 6 | |
| Software | 25 | | | 25 | | | 0 | | | 26 | | | 25 | | | 1 | |
| Other | 19 | | | 10 | | | 9 | | | 18 | | | 10 | | | 8 | |
| Total | $ | 756 | | | $ | 430 | | | $ | 326 | | | $ | 782 | | | $ | 414 | | | $ | 368 | |
The Company recognized the following amounts as amortization expense related to intangible assets:
|
| | | | | | | | | | | | | | | |
| | Three Months Ended
September 30, | | Nine Months Ended
September 30, |
| In millions | 2019 | | 2018 | | 2019 | | 2018 |
| Amortization expense related to intangible assets | $ | 15 |
| | $ | 15 |
| | $ | 40 |
| | $ | 44 |
|
| | | | | | | | | | | | | | | | | | | | | | | |
| | Three Months Ended
September 30, | | Nine Months Ended
September 30, |
| In millions | 2020 | | 2019 | | 2020 | | 2019 |
| Amortization expense related to intangible assets | $ | 17 | | | $ | 15 | | | $ | 43 | | | $ | 40 | |
International Paper made income tax payments, net of refunds, of $245$203 million and $195$245 million for the nine months ended September 30, 20192020 and 2018,2019, respectively.
The Company currently estimates, that as a result of ongoing discussions, pending tax settlements and expirations of statutes of limitations, the amount of unrecognized tax benefits could be reduced by approximately $10$70 million during the next 12 months.
International Paper uses the flow-through method to account for investment tax credits earned on eligible open loop-biomass facilities and Combined Heat and Power system expenditures. Under this method, the investment tax credits are recognized as a reduction to income tax expense in the year they are earned rather than a reduction in the asset basis. The Company recorded a tax benefit of $8 million and $6 million for the nine months ended September 30, 2019 and 2018, respectively.
The Brazilian Federal Revenue Service has challenged the deductibility of goodwill amortization generated in a 2007 acquisition by International Paper do Brasil Ltda., a wholly-owned subsidiary of the Company. The Company received
assessments for the tax years 2007-2015 totaling approximately $146$107 million in tax, and $379$342 million in interest, penalties, and penaltiesfees as of September 30, 20192020 (adjusted for variation in currency exchange rates). After a previous favorable ruling challenging the basis for these assessments, we received another subsequent unfavorable decision in October 2018decisions from the Brazilian Administrative Council of Tax Appeals. The Company has appealed this judgmentand intends to further appeal these and any future unfavorable administrative judgments to the Brazilian federal courts; however, this tax litigation matter may take many years to resolve. The Company believes that it has appropriately evaluated the transaction underlying these assessments, and has concluded based on Brazilian tax law, that its position would be sustained. The Company intends to vigorously defend its position against the current assessments and any similar assessments that may be issued for tax years subsequent to 2015.
On March 27, 2020, the U.S. government enacted the Coronavirus Aid, Relief, and Economic Security (CARES) Act ("the CARES Act"). The CARES Act provides various types of economic relief for individuals and businesses due to the COVID-19 pandemic, including temporary corporate tax relief. We currently do not believe there to be a material impact to the income tax provision resulting from the CARES Act.
Environmental
International Paper has been named as a potentially responsible party (PRP) in environmental remediation actions under various federal and state laws, including the Comprehensive Environmental Response, Compensation and Liability Act (CERCLA). Many of these proceedings involve the cleanup of hazardous substances at large commercial landfills that received waste from many different sources. While joint and several liability is authorized under CERCLA and equivalent state laws, as a practical matter, liability for CERCLA cleanups is typically allocated among the many PRPs. There are other remediation costs typically associated with the cleanup of hazardous substances at the Company’s current, closed or formerly-owned facilities, and recorded as liabilities in the balance sheet.
Remediation costs are recorded in the consolidated financial statements when they become probable and reasonably estimable. International Paper has estimated the probable liability associated with these environmental remediation matters, including those described herein, to be approximately $145$186 million ($155195 million undiscounted) in the aggregate as of September 30, 2019.2020. Other than as described below, completion of required remedial actions is not expected to have a material effect on our consolidated financial statements.
Cass Lake: One of the matters included above arises out of a closed wood-treatingwood-treatment facility located in Cass Lake, Minnesota. In June 2011, the United States Environmental Protection Agency (EPA) selected and published a proposed soil remedy at the site with an estimated cost of $46 million. The overall remediation reserve for the site is currently $47$45 million to address the selection of an alternative for the soil remediation component of the overall site remedy, which includes the ongoing groundwater remedy.at September 30, 2020. In October 2011, the EPA released a public statement indicating that the final soil remedy decision would be delayed. In June 2019,April 2020, the EPA issued a revised proposedfinal plan concerning clean-up standards at a portion of the site, the estimated cost of which is included within the reserve referenced above. In October 2012, the Natural Resource Trustees for this site provided notice to International Paper and other PRPs of their intent to perform a Natural Resource Damage Assessment. It is premature to predict the outcome of the assessment or to estimate a loss or range of loss, if any, in excess of the applicable reserve referenced above, which may be incurred.
Kalamazoo River: The Company is a PRP with respect to the Allied Paper, Inc./Portage Creek/Kalamazoo River Superfund Site in Michigan. The EPA asserts that the site is contaminated by polychlorinated biphenyls (PCBs) primarily as a result of discharges from various paper mills located along the Kalamazoo River, including a paper mill (the Allied Paper Mill) formerly owned by St. Regis Paper Company (St. Regis). The Company is a successor in interest to St. Regis.
| |
• | •Operable Unit 5, Area 1: In March 2016, the Company and other PRPs received a special notice letter from the EPA (i) inviting participation in implementing a remedy for a portion of the site known as Operable Unit 5, Area 1, and (ii) demanding reimbursement of EPA past costs totaling $37 million, including $19 millionin past costs previously demanded by the EPA. The Company responded to the special notice letter. In December 2016, the EPA issued a unilateral administrative order to the Company and other PRPs to perform the remedy. The Company responded to the unilateral administrative order, agreeing to comply with the order subject to its sufficient cause defenses.
•in past costs previously demanded by the EPA. The Company responded to the special notice letter. In December 2016, the EPA issued a unilateral administrative order to the Company and other PRPs to perform the remedy. The Company responded to the unilateral administrative order, agreeing to comply with the order subject to its sufficient cause defenses. |
Operable Unit 5, Area 2: In September 2017, the EPA issued a Record of Decision selecting the final remedy for a portion of the site known as Operable Unit 5, Area 2, but has not yet issued a special notice letter for implementing the remedy.
Operable Unit 5, Area 3: In April 2016, the EPA issued a separate unilateral administrative order to the Company and certain other PRPs for a time-critical removal action (TCRA) of PCB-contaminated banks and sediments from a portion of the site known as Operable Unit 5, Area 3. The Company responded to the unilateral administrative order and agreed along with two other parties to comply with the order subject to its sufficient cause defenses.The removal work has been completed.
•Operable Unit 1: In October 2016, the Company and another PRP received a special notice letter from the EPA inviting participation in the remedial design component of the landfill remedy for the Allied Paper Mill, which is also known as Operable Unit 1. The Record of Decision establishing the final landfill remedy for the Allied Paper Mill was
issued by the EPA in September 2016. The Company responded to the Allied Paper Mill special notice letter in December 2016. In February 2017, the EPA informed the Company that it would make other arrangements for the performance of the remedial design.
In addition, in December 2019, the United States published notice in the Federal Register of a proposed consent decree with NCR Corporation (one of the parties to the allocation/apportionment litigation described below), the State of Michigan and natural resource trustees under which NCR would make payments of more than $100 million and perform work at the Site at an estimated cost of $135.7 million. The public comment period with respect to the proposed consent decree closed in February 2020 and we are awaiting the court's final decision.
The Company’s CERCLA liability has not been finally determined with respect to these or any other portions of the site, and except as noted above, the Company has declined to perform any work or reimburse the EPA at this time. As noted below, the Company is involved in allocation/apportionment litigation with regard to the site. Accordingly, it is premature to predict the outcome or estimate our maximum reasonably possible loss or range of loss with respect to this site. We have an immaterial recorded a liability for future remediation costs at the site that are probable and reasonably estimable, and it remains reasonably possible that additional losses in excess of this recorded liability could be material.
The Company was named as a defendant by Georgia-Pacific Consumer Products LP, Fort James Corporation and Georgia Pacific LLC in a contribution and cost recovery action for alleged pollution at the site. NCR Corporation and Weyerhaeuser Company are also named as defendants in the suit. The suit seeks contribution under CERCLA for costs purportedly expended by plaintiffs ($($79 million as of the filing of the complaint) and for future remediation costs. The suit alleges that a mill, during the time it was allegedly owned and operated by St. Regis, discharged PCB contaminated solids and paper residuals resulting from paper de-inking and recycling. NCR Corporation and Weyerhaeuser Company are also named as defendants in the suit. In mid-2011, the suit was transferred from the District Court for the Eastern District of Wisconsin to the District Court for the Western District of Michigan.
The trial of the initial liability phase took place in February 2013. Weyerhaeuser conceded prior to trial that it was a liable party with respect to the site. In September 2013, an opinion and order was issued in the suit. The order concluded that the Company (as the successor to St. Regis) was not an “operator,” but was an “owner,” of the mill at issue during a portion of the relevant period and is therefore liable under CERCLA. The order also determined that NCR is a liable party as an "arranger for disposal" of PCBs in waste paper that was de-inked and recycled by mills along the Kalamazoo River. The order did not address the Company's responsibility, if any, for past or future costs. The parties’ responsibility, including that of the Company, was the subject of a second trial, which was concluded in late 2015. In June 2018, the Court issued its Final Judgment and Order, which fixed the past cost amount at approximately $50 million (plus interest to be determined) and allocated to the Company a 15% share of responsibility for those past costs. The Court did not address responsibility for future costs in its decision. In July 2018, the Company and each of the other parties filed notices appealing the Final Judgment and prior orders incorporated into that Judgment. The proposed consent decree by NCR described above, if entered, would result in the termination of NCR's involvement in the appeal.
Harris County: International Paper and McGinnis Industrial Maintenance Corporation (MIMC), a subsidiary of Waste Management, Inc. (WMI), are PRPs at the San Jacinto River Waste Pits Superfund Site in Harris County, Texas. The PRPs have been actively participating in the activities at the site and share the costs of these activities. In September 2016, the EPA issued a proposed remedial action plan (PRAP) for the site, which identified the preferred remedy as the removal of the contaminated material currently protected by an armored cap. In addition, the EPA selected a preferred remedy for the separate southern impoundment that requires offsite disposal. In January 2017, the PRPs submitted comments on the PRAP.
OnIn October 11, 2017, the EPA issued a Record of Decision (ROD) selecting the final remedy for the site: removal and relocation of the waste material from both the northern and southern impoundments. The EPA did not specify the methods or practices needed to perform this work. While theThe EPA’s selected remedy was accompanied by a cost estimate of approximately $115 million we do not believe that estimate provides a reasonable basis($105 million for accrual under GAAP because the estimate was based on a technological methodnorthern impoundment, and $10 million for performing the work that we believe is not feasible.southern impoundment). Subsequent to the issuance of the ROD, there have been numerous meetings between the EPA and the PRPs, and the Company continues to work with the EPA and MIMC/WMI to develop the remedial design.
To this end, in April 2018, the PRPs entered into an Administrative Order on Consent (AOC) with the EPA, agreeing to work together to develop the remedial design over the subsequent 29 months.until April 2021. The AOC does not include any agreement to perform waste removal or other construction activity at the site. Rather, it involves adaptive management techniques and a pre-design
investigation, the objectives of which include filling data gaps (including but not limited to post-Hurricane Harvey technical data generated prior to the ROD and not incorporated into the selected remedy), refining areas and volumes of materials to be addressed, determining if an excavation remedy is able to be implemented in a manner protective of human health and the environment, and investigating potential impacts of remediation activities to infrastructure in the vicinity. On October 14, 2019,
During the PRPs receivedfirst quarter of 2020, through a special notice letter fromseries of meetings among the Company, MIMC/WMI, our consultants, the EPA (i) inviting participationand the Texas Commission on Environmental Quality (TCEQ), progress was made to resolve key technical issues previously preventing the Company from determining the manner in implementingwhich the selected remedy describedfor the northern impoundment would be feasibly implemented. As a result of these developments, as of September 30, 2020, the Company has reserved the following amounts in relation to remediation at this site: (a) $10 million for the ROD,southern impoundment; and (ii) demanding reimbursement(b) $55 million for the northern impoundment, which represents the Company's 50% share of EPA past costs totaling $8 million. The PRPs are preparing their responseour estimate of the low end of the range of probable remediation costs.
Although key technical issues have been resolved, we still face significant challenges remediating the northern impoundment in a cost-efficient manner and without a release to the special notice letter.
The Company has identified a number of concernsenvironment and uncertainties regardingtherefore our discussions with the remedy described inEPA on the ROD and regarding the EPA’s estimates for the costs and time requiredbest approach to implement the selected remedy. The Company has determined, however, that even if the ROD cannot be implemented, a sheet pile "engineered barrier" can be constructed, which would enhance the existing remedy and could also be used should the ROD be determined to be feasible and implementable. In the third quarter of 2018, we increased our recorded liability accordingly to reflect the estimated cost of constructing this barrier.remediation will continue. Because of ongoing questions regarding cost effectiveness, technical feasibility, timing and gathering other technical data, however, it is uncertain how the ROD will be implemented. Consequently, while additional losses in excess of our recorded liability are probable as a result of the selected remedy, wepossible. We are currently unable to determine reasonably estimate
any further adjustment to our immaterial recorded liability. It remains reasonably possible that additional losses could be material as the remedial design process with the EPA continues over the coming quarters.
International Paper and MIMC/WMI are also defending an additional lawsuit related to the site brought by approximately 600 individuals who allege property damage and personal injury. This case is stillliability or any loss or range of loss in the discovery phase, andexcess of such liability; however, we believe it is premature to predict the outcome or to estimate our maximum reasonably possible loss. However, we do not believe thatunlikely any material loss is probable.adjustment would be material.
AntitrustAsbestos-Related Matters
Containerboard: In January 2011, International Paper was
We have been named as a defendant in a lawsuit filedvarious asbestos-related personal injury litigation, in both state and federal court, primarily in Cocke County, Tennessee alleging that International Paper violated Tennessee law by conspiring to limit the supply and fix the prices of containerboard from mid-2005relation to the present. Plaintiffs inprior operations of certain companies previously acquired by the state court action seek certification of a class of Tennessee indirect purchasers of containerboard products, damages and costs, including attorneys' fees. No class certification materials have been filed to date in the Tennessee action.Company. The Company disputesregularly conducts a comprehensive legal review of its asbestos liabilities and reviews recent and historical claims data. During the allegations madesecond quarter of 2020, as previously disclosed, we adjusted our estimated net liability associated with asbestos-related litigation concerning products sold by Champion International Corporation prior to our acquisition of Champion in 2000 to revise the Tennessee lawsuit and is vigorously defending it. Attime period associated with anticipated future claims through 2059, a commonly viewed end point when such claims are more predictable. We concluded the adjustment of $43 million to increase this time, however, because the action isnet liability, which resulted in a preliminary stage, we are unableliability of $75 million, net of estimated insurance recoveries, was not material to predict an outcome or estimate a rangeany period. As of September 30, 2020, the Company's total recorded liability with respect to pending and future asbestos-related claims was $117 million, net of estimated insurance recoveries. While it is reasonably possible loss.that the Company may incur losses in excess of its recorded liability with respect to asbestos-related matters, we do not believe additional material losses are probable.
Antitrust
Italy: In March 2017, the Italian Competition Authority (ICA) commenced an investigation into the Italian packaging industry to determine whether producers of corrugated sheets and boxes violated the applicable European competition law. In April 2019, the ICA concluded its investigation and issued initial findings alleging that over 30 producers, including our Italian packaging subsidiary (IP Italy), improperly coordinated the production and sale of corrugated sheets and boxes. On August 6, 2019, the ICA issued its decision and assessed IP Italy a fine of €29 million (approximately $32 million at current exchange rates) which was recorded in the third quarter of 2019. This charge is included in the Antitrust fines line item in the accompanying consolidated statement of operations. However, we are vigorously appealing this decision of the ICA to the Italian courts and have numerous and strong bases for our appeal.
Contract
Signature:In August 2014, a lawsuit captioned Signature Industrial Services LLC et al. v. International Paper Company was filed in state court in Texas. The Signature lawsuit arises out of approximately $1 million in disputed invoices related to the installation of new equipment at the Company's Orange, Texas mill. In addition to the invoices in dispute, Signature and its president allege consequential damages arising from the Company's nonpayment of those invoices. The lawsuit was tried before a jury in Beaumont, Texas, in May 2017. On June 1, 2017, the jury returned a verdict awarding approximately $125 million in damages to the plaintiffs. The Court issued a judgment on December 14, 2017, awarding the plaintiffs a total of approximately $137 million in actual and consequential damages, fees, costs and pre-judgment interest, and awarding post-judgment interest. The Company has appealed this judgment and, on April 30, 2020, the Court of Appeals for the Thirteenth District of Texas issued a decision affirming in part and reversing and rendering judgment in favor of the Company in part. The Court affirmed approximately $14.8 million of the judgment. Otherwise, the Court rendered judgment in favor of the Company on the remainder of the jury’s verdict. The Company continues to have strong bases by which to challenge the affirmed portions of the award and has presented in its briefing numerous and strong bases forthose arguments on appeal and we believe we will prevail on appeal. Becauseto the Supreme Court of Texas. The plaintiffs have also appealed the decision of the appellate proceedingscourt. We do not expect that potential losses, if any, related to this lawsuit will be material.
Taxes Other Than Payroll Taxes
In 2017, the Brazilian Federal Supreme Court decided that the state value-added tax (VAT) should not be included in the basis of federal VAT calculations. In 2018 and 2019, the Brazilian tax authorities published both an internal consultation and a normative ruling with a narrow interpretation of the effects of the case. We have determined that any related federal VAT refunds should be recognized when they are ongoing,both probable and reasonably estimable. Based upon the best information available to us, we are unable to estimate a range of reasonably possible loss, but we expecthave determined that the amount of any lossrefund that is probable of being realized is limited to be immaterial.that determined by the tax authorities' narrow interpretation, for which we have recognized a receivable of $11 million as of September 30, 2020. It is possible that future court decisions and guidance from the tax authorities could expand the scope of the federal VAT refunds.
General
The Company is involved in various other inquiries, administrative proceedings and litigation relating to environmental and safety matters, personal injury, product liability, labor and employment, contracts, sales of property, intellectual property, tax, antitrust and other
matters, some of which allege substantial monetary damages. While any proceeding or litigation has the element of uncertainty, the Company believes that the outcome of any of these other lawsuits or claims that are pending or threatened or all of them combined (other than those that cannot be assessed due to their preliminary nature) will not have a material effect on its consolidated financial statements. See Note 14 for details regarding a tax matter. Assessments of lawsuits and claims can involve a series of complex judgments about future events, can rely heavily on
Variable Interest Entities
As of September 30, 2019,2020, the fair value of the Timber Notes and Extension Loans is $4.84was $4.92 billion and $4.27$4.24 billion, respectively, for the 2015 Financing Entities. The Timber Notes and Extension Loans are classified as Level 2 within the fair value hierarchy, which is further defined in Note 1617 in the Company's Annual Report on Form 10-K for the year ended December 31, 2018.2019.
The Timber Notes of $4.85 billion mature in August 2021. The Extension Loans of $4.22 billion mature in November and December of 2020, and we are currently negotiating the extension of these third-party loans to August 2021 and expect to complete the extension before the maturity dates. The Timber Notes and Extension Loans are shown in Current nonrecourse financial assets of variable interest entities and Current nonrecourse financial liabilities of variable interest entities, respectively, on the accompanying balance sheet.
Failure to extend these third-party loans to August 2021 prior to their respective maturity dates in November and December of 2020 could necessitate a disposition of the installment notes to facilitate the $4.22 billion debt payment. We are confident we would be able to dispose of the installment notes, if necessary.
Activity between the Company and the 2015 Financing Entities was as follows:
| | | | Three Months Ended
September 30, | | Nine Months Ended
September 30, | | Three Months Ended
September 30, | | Nine Months Ended
September 30, |
| In millions | 2019 | | 2018 | | 2019 | | 2018 | In millions | 2020 | | 2019 | | 2020 | | 2019 |
| Revenue (a) | $ | 24 |
| | $ | 24 |
| | $ | 71 |
| | $ | 71 |
| Revenue (a) | $ | 24 | | | $ | 24 | | | $ | 71 | | | $ | 71 | |
| Expense (a) | 32 |
| | 32 |
| | 96 |
| | 96 |
| Expense (a) | 32 | | | 32 | | | 96 | | | 96 | |
| Cash receipts (b) | 48 |
| | 48 |
| | 95 |
| | 95 |
| Cash receipts (b) | 48 | | | 48 | | | 95 | | | 95 | |
| Cash payments (c) | 64 |
| | 64 |
| | 128 |
| | 128 |
| Cash payments (c) | 64 | | | 64 | | | 128 | | | 128 | |
| |
(a) | The revenue and expense are included in Interest expense, net in the accompanying statement of operations. |
| |
(b) | The cash receipts are interest received on the Financial assets of special purpose entities. |
| |
(c) | The cash payments represent interest paid on Nonrecourse financial liabilities of special purpose entities. |
(a)The revenue and expense are included in Interest expense, net in the accompanying statement of operations.
(b)The cash receipts are interest received on the Financial assets of special purpose entities.
(c)The cash payments represent interest paid on Nonrecourse financial liabilities of special purpose entities.
As of September 30, 2019,2020, the fair value of the Timber Notes and Extension Loans is $2.28was $2.29 billion and $2.11$2.12 billion, respectively, for the 2007 Financing Entities. The Timber Notes and Extension Loans are classified as Level 2 within the fair value hierarchy, which is further defined in Note 1617 in the Company’s Annual Report on Form 10-K for the year ended December 31, 2018.2019.
Activity between the Company and the 2007 Financing Entities was as follows:
| | | | Three Months Ended
September 30, | | Nine Months Ended
September 30, | | Three Months Ended
September 30, | | Nine Months Ended
September 30, |
| In millions | 2019 | | 2018 | | 2019 | | 2018 | In millions | 2020 | | 2019 | | 2020 | | 2019 |
| Revenue (a) | $ | 19 |
| | $ | 19 |
| | $ | 61 |
| | $ | 52 |
| Revenue (a) | $ | 7 | | | $ | 19 | | | $ | 35 | | | $ | 61 | |
| Expense (b) | 19 |
| | 18 |
| | 60 |
| | 48 |
| Expense (b) | 8 | | | 19 | | | 36 | | | 60 | |
| Cash receipts (c) | 16 |
| | 15 |
| | 48 |
| | 34 |
| Cash receipts (c) | 5 | | | 16 | | | 28 | | | 48 | |
| Cash payments (d) | 17 |
| | 16 |
| | 53 |
| | 40 |
| Cash payments (d) | 8 | | | 17 | | | 34 | | | 53 | |
| |
(a) | The revenue is included in Interest expense, net in the accompanying statement of operations and includes approximately $5 million and $14 million for three and nine months ended September 30, 2019 and 2018, respectively, of accretion income for the amortization of the basis difference adjustment on the Financial assets of special purpose entities. |
| |
(b) | The expense is included in Interest expense, net in the accompanying statement of operations and includes approximately $2 million and $5 million for the three and nine months ended September 30, 2019 and 2018, respectively, of accretion expense for the amortization of the basis difference adjustment on the Nonrecourse financial liabilities of special purpose entities. |
| |
(c) | The cash receipts are interest received on the Financial assets of special purpose entities. |
| |
(d) | The cash payments are interest paid on Nonrecourse financial liabilities of special purpose entities. |
(a)The revenue is included in Interest expense, net in the accompanying statement of operations and includes approximately $5 million and $14 million for the three and nine months ended September 30, 2020 and 2019, respectively, of accretion income for the amortization of the basis difference adjustment on the Financial assets of special purpose entities.
(b)The expense is included in Interest expense, net in the accompanying statement of operations and includes approximately $2 million and $5 million for the three and nine months ended September 30, 2020 and 2019, respectively, of accretion expense for the amortization of the basis difference adjustment on the Nonrecourse financial liabilities of special purpose entities.
(c)The cash receipts are interest received on the Financial assets of special purpose entities.
(d)The cash payments are interest paid on Nonrecourse financial liabilities of special purpose entities.
In June 2019, International Paper issued $200 million of 3.55% senior unsecured notes with a maturity date in 2029. The proceeds from this offering, together with a combination of available cash and other borrowings, were used for general corporate purposes, including repayment of outstanding commercial paper borrowings and other existing indebtedness.
In June 2018, the borrowing capacity of International Paper'sthe Company's commercial paper program was increased from $750 million tois $1.0 billion. Under the terms of the program, individual maturities on borrowings may vary, but not exceed one year from the
date of issue. Interest bearing notes may be issued either as fixed or floating rate notes. As of September 30, 2019,2020, the Company had $245$140 million of borrowings outstanding under the program at a weighted averageweighted-average interest rate of 2.29%0.17%.
In March 2020, the Company entered into a $750 million contractually committed 364-day revolving credit agreement with a syndicate of banks and other financial institutions which augments the Company's access to liquidity due to current macroeconomic conditions and supplements the Company's $1.5 billion five-year credit agreement. In October 2020, the company extended the expiration date of the $1.5 billion credit agreement from December 2021 to December 2022. As of September 30, 2020, the Company had 0 borrowings outstanding under either the $750 million revolving credit agreement or the $1.5 billion credit agreement.
In April 2020, the Company's receivable securitization program was amended from an uncommitted financing arrangement to a committed financing arrangement with a borrowing limit up to $550 million based on eligible receivable balances that expires in April 2022. As of September 30, 2020, the Company had 0 borrowings outstanding under the program.
In July 2020, International Paper refinanced $122 million of industrial development bonds that now have interest rates ranging from 1.38% to 1.60% and maturity dates in 2025.
As a result of a debt tender offer in September 2020, the Company economically retired $700 million of corporate bonds with interest rates ranging from 3.00% to 3.80% and maturity dates ranging from 2024 to 2027. This is in addition to the August 2020 economical debt extinguishment of $203 million of corporate bonds with an interest rate of 7.50% due in 2021 and brings the full year-to-date debt reductions related to the 2021 bonds to $406 million.
The Company’s financial covenants require the maintenance of a minimum net worth, as defined in our debt agreements, of $9 billion and a total debt-to-capital ratio of less than 60%. Net worth is defined as the sum of common stock, paid-in capital and retained earnings, less treasury stock plus any cumulative goodwill impairment charges. The calculation also excludes accumulated other comprehensive income/loss and both the current and long-term Nonrecourse Financial Liabilities of Variable Interest Entities. The total debt-to-capital ratio is defined as total debt divided by the sum of total debt plus net worth. As of September 30, 2020, we were in compliance with our debt covenants.
At September 30, 2019,2020, the fair value of International Paper’s $10.4$8.7 billion of debt was approximately $11.4$10.7 billion. The fair value of the Company’s long-term debt is estimated based on the quoted market prices for the same or similar issues. International Paper’s long-term debt is classified as Level 2 within the fair value hierarchy, which is further defined in Note 1617 in the Company’s Annual Report on Form 10-K for the year ended December 31, 2018.2019.
In October 2019, International Paper issued $127 million of industrial development bonds with interest rates ranging from 1.90% to 2.10% and maturity dates in 2024. The proceeds from this offering will be used to repay other existing industrial development bonds.
As a multinational company International Paper is exposed to market risks, such as changes in interest rates, currency exchange rates and commodity prices.
The notional amounts of qualifying and non-qualifying financial instruments used in hedging transactions were as follows:
|
| | | | | | | |
| In millions | September 30, 2019 | | December 31, 2018 |
| Derivatives in Cash Flow Hedging Relationships: | | | |
| Foreign exchange contracts | $ | 570 |
| | $ | 407 |
|
| Derivatives in Fair Value Hedging Relationships: | | | |
| Interest rate contracts | 700 |
| | 700 |
|
| Derivatives in Net Investment Hedging Relationships: | | | |
| Interest rate contracts | 475 |
| | — |
|
| Derivatives Not Designated as Hedging Instruments: | | | |
| Electricity contract | 19 |
| | 8 |
|
| Foreign exchange contracts | 11 |
| | 19 |
|
| | | | | | | | | | | |
| In millions | September 30, 2020 | | December 31, 2019 |
| Derivatives in Cash Flow Hedging Relationships: | | | |
| Foreign exchange contracts | $ | 245 | | | $ | 407 | |
| Derivatives in Fair Value Hedging Relationships: | | | |
| Interest rate contracts | 0 | | | 700 | |
| Derivatives in Net Investment Hedging Relationships: | | | |
| Interest rate contracts | 0 | | | 475 | |
| Foreign exchange contracts | 50 | | 0 | |
| Derivatives Not Designated as Hedging Instruments: | | | |
| Electricity contract | 12 | | | 16 | |
| Foreign exchange contracts | 0 | | | 7 | |
During the first quarter of 2020, International Paper terminated its interest rate contracts in fair value hedging relationships. These contracts had a notional value of $700 million and an approximate fair value of $85 million at the time of termination. Subsequent to the termination of the interest rate swaps, the fair value basis adjustment is accounted for as a debt premium for the previously hedged debt. During the first and second quarter of 2020, International Paper also terminated interest rate contracts in net investment hedging relationships with a notional value of $475 million. These contracts had an approximate fair value of $33 million at the time of termination. Subsequent to the termination of the net investment hedges, the fair value is accounted for in other comprehensive income as cumulative translation adjustment for the previously hedged net investments.
The following table shows gains or losses recognized in AOCI, net of tax, related to derivative instruments:
|
| | | | | | | | | | | | | | | |
| | Gain (Loss) Recognized in AOCI on Derivatives (Effective Portion) |
| | Three Months Ended
September 30, | | Nine Months Ended
September 30, |
| In millions | 2019 | | 2018 | | 2019 | | 2018 |
| Derivatives in Cash Flow Hedging Relationships: | | | | | | | |
| Foreign exchange contracts | $ | (10 | ) | | $ | 1 |
| | $ | (6 | ) | | $ | (18 | ) |
| Interest rate contracts | — |
| | — |
| | — |
| | (2 | ) |
| Total | $ | (10 | ) | | $ | 1 |
| | $ | (6 | ) | | $ | (20 | ) |
| Derivatives in Net Investment Hedging Relationships: | | | | | | | |
| Interest rate contracts | $ | 18 |
| | $ | — |
| | $ | 15 |
| | $ | — |
|
| Total | $ | 18 |
| | $ | — |
| | $ | 15 |
| | $ | — |
|
| | | | | | | | | | | | | | | | | | | | | | | |
| | Gain (Loss)
Recognized in
AOCI
on Derivatives
(Effective Portion) |
| | Three Months Ended
September 30, | | Nine Months Ended
September 30, |
| In millions | 2020 | | 2019 | | 2020 | | 2019 |
| Derivatives in Cash Flow Hedging Relationships: | | | | | | | |
| Foreign exchange contracts | $ | (4) | | | $ | (10) | | | $ | (34) | | | $ | (6) | |
| | | | | | | |
| Total | $ | (4) | | | $ | (10) | | | $ | (34) | | | $ | (6) | |
| Derivatives in Net Investment Hedging Relationships: | | | | | | | |
| Interest rate contracts | $ | 0 | | | $ | 18 | | | $ | 24 | | | $ | 15 | |
| Total | $ | 0 | | | $ | 18 | | | $ | 24 | | | $ | 15 | |
During the next 12 months, the amount of the September 30, 20192020 AOCI balance, after tax, that is expected to be reclassified to earnings is a loss of $3$4 million.
The amounts of gains and losses recognized in the statement of operations on qualifying and non-qualifying financial instruments used in hedging transactions were as follows: |
| | | | | | | | | | | | | | | | | |
| | Gain (Loss) Reclassified from AOCI (Effective Portion) | | Location of Gain (Loss) Reclassified from AOCI (Effective Portion) |
| | Three Months Ended
September 30, | | Nine Months Ended
September 30, | | |
| In millions | 2019 | | 2018 | | 2019 | | 2018 | | |
| Derivatives in Cash Flow Hedging Relationships: | | | | | | | | | |
| Foreign exchange contracts | $ | (4 | ) | | $ | (2 | ) | | $ | (5 | ) | | $ | (2 | ) | | Cost of products sold |
| Total | $ | (4 | ) | | $ | (2 | ) | | $ | (5 | ) | | $ | (2 | ) | | |
|
| | | | | | | | | | | | | | | | | |
| | Gain (Loss) Recognized | | Location of Gain (Loss) In Statement of Operations |
| | Three Months Ended
September 30, | | Nine Months Ended
September 30, | | |
| In millions | 2019 | | 2018 | | 2019 | | 2018 | | |
| Derivatives in Fair Value Hedging Relationships: | | | | | | | | | |
| Interest rate contracts | $ | 11 |
| | $ | — |
| | $ | 42 |
| | $ | — |
| | Interest expense, net |
| Debt | (11 | ) | | — |
| | (42 | ) | | — |
| | Interest expense, net |
| Total | — |
| | — |
| | — |
| | — |
| | |
| Derivatives Not Designated as Hedging Instruments: | | | | | | | | | |
| Electricity contract | $ | (5 | ) | | $ | 2 |
| | $ | — |
| | $ | 1 |
| | Cost of products sold |
| Foreign exchange contracts | (1 | ) | | 3 |
| | (2 | ) | | 4 |
| | Cost of products sold |
| Total | $ | (6 | ) | | $ | 5 |
| | $ | (2 | ) | | $ | 5 |
| | |
| | | | | | | | | | | | | | | | | | | | | | | | | | | | | |
| | Gain (Loss)
Reclassified from
AOCI
(Effective Portion) | | Location of Gain (Loss)
Reclassified from AOCI
(Effective Portion) |
| | Three Months Ended
September 30, | | Nine Months Ended
September 30, | | |
| In millions | 2020 | | 2019 | | 2020 | | 2019 | | |
| Derivatives in Cash Flow Hedging Relationships: | | | | | | | | | |
| Foreign exchange contracts | $ | (6) | | | $ | (4) | | | $ | (26) | | | $ | (5) | | | Cost of products sold |
| Total | $ | (6) | | | $ | (4) | | | $ | (26) | | | $ | (5) | | | |
Fair Value Measurements
The Company has not changed its valuation techniques for measuring the fair value of any financial assets or liabilities during the year. Transfers between levels, if any, are recognized at the end of the reporting period. | | | | | | | | | | | | | | | | | | | | | | | | | | | | | |
| | Gain (Loss) Recognized | | Location of Gain (Loss)
In
Statement
of Operations |
| | Three Months Ended
September 30, | | Nine Months Ended
September 30, | | |
| In millions | 2020 | | 2019 | | 2020 | | 2019 | | |
| Derivatives in Fair Value Hedging Relationships: | | | | | | | | | |
| Interest rate contracts | $ | 0 | | | $ | 11 | | | $ | 38 | | | $ | 42 | | | Interest expense, net |
| Debt | 0 | | | (11) | | | (38) | | | (42) | | | Interest expense, net |
| Total | $ | 0 | | | $ | 0 | | | $ | 0 | | | $ | 0 | | | |
| Derivatives in Net Investment Hedging Relationships: | | | | | | | | | |
| Foreign exchange contracts | $ | 1 | | | $ | 0 | | | $ | 2 | | | $ | 0 | | | Net (gains) losses on sales and impairments of businesses |
| Total | $ | 1 | | | $ | 0 | | | $ | 2 | | | $ | 0 | | | |
| Derivatives Not Designated as Hedging Instruments: | | | | | | | | | |
| Electricity contract | $ | 1 | | | $ | (5) | | | $ | (2) | | | $ | 0 | | | Cost of products sold |
| Foreign exchange contracts | 0 | | | (1) | | | 0 | | | (2) | | | Cost of products sold |
| Total | $ | 1 | | | $ | (6) | | | $ | (2) | | | $ | (2) | | | |
The following table provides a summary of the impact of our derivative instruments in the balance sheet:
Fair Value Measurements
The Company has not changed its valuation techniques for measuring the fair value of any financial assets or liabilities during the year. Transfers between levels, if any, are recognized at the end of the reporting period.
The following table provides a summary of the impact of our derivative instruments in the balance sheet:
Fair Value Measurements
Level 2 – Significant Other Observable Inputs
| | | | Assets | | Liabilities | | | Assets | | Liabilities | |
| In millions | September 30, 2019 | | December 31, 2018 | | September 30, 2019 | | December 31, 2018 | | In millions | September 30, 2020 | | December 31, 2019 | | September 30, 2020 | | December 31, 2019 | |
| Derivatives designated as hedging instruments | | | | | | | | | Derivatives designated as hedging instruments | |
| Foreign exchange contracts – cash flow | $ | 5 |
|
| $ | 3 |
|
| $ | 13 |
| | $ | 10 |
| | Foreign exchange contracts – cash flow | $ | 2 | | | $ | 10 | | | $ | 16 | | | $ | 4 | | |
| | Interest rate contracts - net investment | 20 |
| | — |
| | — |
| | — |
| | Interest rate contracts - net investment | 0 | | | 11 | | | 0 | | | 0 | | |
| Interest rate contracts - fair value | 59 |
| | 16 |
| | — |
| | — |
| | Interest rate contracts - fair value | 0 | | | 47 | | | 0 | | | 0 | | |
| Total derivatives designated as hedging instruments | 84 |
|
| 19 |
|
| 13 |
|
| 10 |
|
| Total derivatives designated as hedging instruments | 2 | | | 68 | | | 16 | | | 4 | | |
| Derivatives not designated as hedging instruments | | | | | | | | | Derivatives not designated as hedging instruments | |
| Electricity contract | — |
|
| — |
|
| 5 |
|
| 4 |
| | Electricity contract | 0 | | | 0 | | | 0 | | | 2 | | |
| Foreign exchange contracts | — |
|
| — |
| | 2 |
| | 1 |
| | Foreign exchange contracts | 0 | | | 0 | | | 0 | | | 1 | | |
| Total derivatives not designated as hedging instruments | — |
| | — |
| | 7 |
|
| 5 |
|
| Total derivatives not designated as hedging instruments | 0 | | | 0 | | | 0 | | | 3 | | |
| Total derivatives | $ | 84 |
| (a) | $ | 19 |
| (b) | $ | 20 |
| (c) | $ | 15 |
| (d) | Total derivatives | $ | 2 | | (a) | $ | 68 | | (b) | $ | 16 | | (c) | $ | 7 | | (d) |
| |
(a) | Includes $8 million recorded in Other current assets and $76 million recorded in Deferred charges and other assets in the accompanying consolidated balance sheet. |
| |
(b) | Includes $2 million recorded in Other current assets and $17 million recorded in Deferred charges and other assets in the accompanying consolidated balance sheet. |
| |
(c) | Includes $15 million recorded in Other accrued liabilities and $5 million recorded in Other liabilities in the accompanying consolidated balance sheet. |
| |
(d) | Included in Other current liabilities in the accompanying consolidated balance sheet. |
(a)Included in Other current assets in the accompanying consolidated balance sheet.
(b)Includes $14 million recorded in Other current assets and $54 million recorded in Deferred charges and other assets in the accompanying consolidated balance sheet.
(c)Includes $14 million recorded in Other current liabilities and $2 million recorded in Other liabilities in the accompanying consolidated balance sheet.
(d)Included in Other current liabilities in the accompanying consolidated balance sheet.
The above contracts are subject to enforceable master netting arrangements that provide rights of offset with each counterparty when amounts are payable on the same date in the same currency or in the case of certain specified defaults. Management has made an accounting policy election to not offset the fair value of recognized derivative assets and derivative liabilities in the
balance sheet. The amounts owed to the counterparties and owed to the Company are considered immaterial with respect to each counterparty and in the aggregate with all counterparties.
International Paper sponsors and maintains the Retirement Plan of International Paper Company (the Pension Plan), a tax-qualified defined benefit pension plan that provides retirement benefits to substantially all U.S. salaried employees and hourly employees (receiving salaried benefits) hired prior to July 1, 2004, and substantially all other U.S. hourly and union employees who work at a participating business unit regardless of hire date. These employees generally are eligible to participate in the Pension Plan upon attaining 21 years of age and completing 1 year of eligibility service. U.S. salaried employees and hourly employees (receiving salaried benefits) hired after June 30, 2004, are not eligible for the Pension Plan, but receive a company contribution to their Retirement Savings Account under the International Paper Company Salaried Savings Plan; however, salaried employees hired by Temple Inland prior to March 1, 2007 or Weyerhaeuser Company's Cellulose Fibers division prior to December 1, 2011 also participate in the Pension Plan.unit.
The Pension Plan provides defined pension benefits based on years of credited service and either final average earnings (salaried employees and hourly employees receiving salaried benefits), hourly job rates or specified benefit rates (hourly and union employees).
Effective January 1, 2019, the Company froze participation, including credited service and compensation, for salaried employees under the Pension Plan, the Pension Restoration Plan and the SERP plan. This change does not affect benefits accrued through December 31, 2018. For service after December 31, 2018, employees affected by the freeze receive a company contribution to their individual Retirement Savings Account.
Net periodic pension expense for our qualified and nonqualified U.S. defined benefit plans comprised the following:
|
| | | | | | | | | | | | | | | |
| | Three Months Ended
September 30, | | Nine Months Ended
September 30, |
| In millions | 2019 | | 2018 | | 2019 | | 2018 |
| Service cost | $ | 17 |
| | $ | 40 |
| | $ | 51 |
| | $ | 119 |
|
| Interest cost | 110 |
| | 118 |
| | 330 |
| | 356 |
|
| Expected return on plan assets | (158 | ) | | (200 | ) | | (473 | ) | | (600 | ) |
| Actuarial loss | 50 |
| | 95 |
| | 150 |
| | 285 |
|
| Amortization of prior service cost | 4 |
| | 4 |
| | 12 |
| | 12 |
|
| Net periodic pension expense | $ | 23 |
| | $ | 57 |
| | $ | 70 |
| | $ | 172 |
|
| | | | | | | | | | | | | | | | | | | | | | | |
| | Three Months Ended
September 30, | | Nine Months Ended
September 30, |
| In millions | 2020 | | 2019 | | 2020 | | 2019 |
| Service cost | $ | 21 | | | $ | 17 | | | $ | 64 | | | $ | 51 | |
| Interest cost | 98 | | | 110 | | | 294 | | | 330 | |
| Expected return on plan assets | (167) | | | (158) | | | (501) | | | (473) | |
| Actuarial loss | 51 | | | 50 | | | 152 | | | 150 | |
| Amortization of prior service cost | 5 | | | 4 | | | 15 | | | 12 | |
| Net periodic pension expense | $ | 8 | | | $ | 23 | | | $ | 24 | | | $ | 70 | |
The components of net periodic pension expense other than the Service cost component are included in Non-operating pension expense in the Consolidated Statement of Operations.
The Company’s funding policy for our pension plans is to contribute amounts sufficient to meet legal funding requirements, plus any additional amounts that the Company may determine to be appropriate considering the funded status of the plan, tax deductibility, the cash flows generated by the Company, and other factors. The Company made no0 voluntary cash contributions to the qualified pension plan in the first nine months of 20192020 or 2018.2019. The nonqualified defined benefit plans are funded to the extent of benefit payments, which totaled $21$22 million for the nine months ended September 30, 2019.2020.
International Paper has an Incentive Compensation Plan (ICP) which is administered by the Management Development and Compensation Committee of the Board of Directors (the Committee). The ICP authorizes the grants of restricted stock, restricted or deferred stock units, performance awards payable in cash or stock upon the attainment of specified performance goals, dividend equivalents, stock options, stock appreciation rights, other stock-based awards and cash-based awards at the discretion of the Committee. As of September 30, 2019, 9.82020, 8.4 million shares were available for grant under the ICP.
Stock-based compensation expense and related income tax benefits were as follows:
|
| | | | | | | | | | | | | | | |
| | Three Months Ended
September 30, | | Nine Months Ended
September 30, |
| In millions | 2019 | | 2018 | | 2019 | | 2018 |
| Total stock-based compensation expense (selling and administrative) | $ | 31 |
| | $ | 35 |
| | $ | 94 |
| | $ | 102 |
|
| Income tax benefits related to stock-based compensation | (2 | ) | | (6 | ) | | 31 |
| | 16 |
|
| | | | | | | | | | | | | | | | | | | | | | | |
| | Three Months Ended
September 30, | | Nine Months Ended
September 30, |
| In millions | 2020 | | 2019 | | 2020 | | 2019 |
| Total stock-based compensation expense (selling and administrative) | $ | 17 | | | $ | 31 | | | $ | 48 | | | $ | 94 | |
| Income tax benefits related to stock-based compensation | 1 | | | (2) | | | 18 | | | 31 | |
At September 30, 2019, $1242020, $85 million, net of estimated forfeitures, of compensation cost related to unvested restricted performance shares, executive continuity awards and restricted stock attributable to future service had not yet been recognized. This amount will be recognized in expense over a weighted-average period of 1.81.7 years.
Performance Share Plan
During the first nine months of 2019,2020, the Company granted 2.42.2 million performance units at an average grant date fair value of $43.49.$49.15.
International Paper’s business segments, Industrial Packaging, Global Cellulose Fibers and Printing Papers, are consistent with the internal structure used to manage these businesses. All segments are differentiated on a common product, common customer basis consistent with the business segmentation generally used in the Forest Products industry.
Business segment operating profits are used by International Paper's management to measure the earnings performance of its businesses. Management believes that this measure allows a better understanding of trends in costs, operating efficiencies, prices and volumes. Business segment operating profits are defined as earnings (loss) from continuing operations before income taxes and equity earnings, but including the impact of equity earnings and noncontrolling interests, excluding interest expense, net, corporate expenses,items, net, corporate net special items, business net special items and non-operating pension expense.
Sales
Net sales by business segment for the three months and nine months ended September 30, 20192020 and 20182019 were as follows:
|
| | | | | | | | | | | | | | | |
| | Three Months Ended
September 30, | | Nine Months Ended
September 30, |
| In millions | 2019 | | 2018 | | 2019 | | 2018 |
| Industrial Packaging | $ | 3,820 |
| | $ | 4,034 |
| | $ | 11,516 |
| | $ | 11,883 |
|
| Global Cellulose Fibers | 624 |
| | 714 |
| | 1,974 |
| | 2,083 |
|
| Printing Papers | 1,071 |
| | 1,102 |
| | 3,224 |
| | 3,215 |
|
| Corporate and Intersegment Sales | 53 |
| | 51 |
| | 164 |
| | 174 |
|
| Net Sales | $ | 5,568 |
| | $ | 5,901 |
| | $ | 16,878 |
| | $ | 17,355 |
|
| | | | | | | | | | | | | | | | | | | | | | | |
| | Three Months Ended
September 30, | | Nine Months Ended
September 30, |
| In millions | 2020 | | 2019 | | 2020 | | 2019 |
| Industrial Packaging | $ | 3,768 | | | $ | 3,820 | | | $ | 11,220 | | | $ | 11,516 | |
| Global Cellulose Fibers | 564 | | | 624 | | | 1,737�� | | | 1,974 | |
| Printing Papers | 743 | | | 1,071 | | | 2,234 | | | 3,224 | |
| Corporate and Intersegment Sales | 48 | | | 53 | | | 150 | | | 164 | |
| Net Sales | $ | 5,123 | | | $ | 5,568 | | | $ | 15,341 | | | $ | 16,878 | |
Operating profit (loss) by business segment for the three months and nine months ended September 30, 20192020 and 20182019 were as follows:
|
| | | | | | | | | | | | | | | |
| | Three Months Ended
September 30, | | Nine Months Ended
September 30, |
| In millions | 2019 | | 2018 | | 2019 | | 2018 |
| Industrial Packaging | $ | 510 |
| | $ | 472 |
| | $ | 1,421 |
| | $ | 1,446 |
|
| Global Cellulose Fibers | (3 | ) | | 83 |
| | 27 |
| | 160 |
|
| Printing Papers | 148 |
| | 183 |
| | 258 |
| | 341 |
|
| Business Segment Operating Profits | $ | 655 |
| | $ | 738 |
| | $ | 1,706 |
| | $ | 1,947 |
|
| | | | | | | | |
| Earnings (loss) from continuing operations before income taxes and equity earnings | $ | 452 |
| | $ | 553 |
| | $ | 1,204 |
| | $ | 1,399 |
|
| Interest expense, net | 123 |
| | 133 |
| | 378 |
| | 401 |
|
| Noncontrolling interests/equity earnings adjustment | 2 |
| | (2 | ) | | 4 |
| | (7 | ) |
| Corporate expenses, net | 21 |
| | 20 |
| | 45 |
| | 59 |
|
| Corporate special items, net | 48 |
| | 9 |
| | 48 |
| | 30 |
|
| Non-operating pension expense | 9 |
| | 25 |
| | 27 |
| | 65 |
|
| Business Segment Operating Profits | $ | 655 |
| | $ | 738 |
| | $ | 1,706 |
| | $ | 1,947 |
|
| | | | | | | | | | | | | | | | | | | | | | | |
| | Three Months Ended
September 30, | | Nine Months Ended
September 30, |
| In millions | 2020 | | 2019 | | 2020 | | 2019 |
| Industrial Packaging | $ | 469 | | | $ | 535 | | | $ | 1,388 | | | $ | 1,471 | |
| Global Cellulose Fibers | (59) | | | 4 | | | (123) | | | 39 | |
| Printing Papers | 63 | | | 162 | | | 148 | | | 420 | |
| Business Segment Operating Profits | $ | 473 | | | $ | 701 | | | $ | 1,413 | | | $ | 1,930 | |
| | | | | | | |
| Earnings (loss) before income taxes and equity earnings | $ | 282 | | | $ | 452 | | | $ | 527 | | | $ | 1,204 | |
| Interest expense, net | 112 | | | 123 | | | 345 | | | 378 | |
| Noncontrolling interests adjustment | 0 | | | 2 | | | 0 | | | 4 | |
| Corporate expenses, net | (20) | | | 21 | | | 9 | | | 45 | |
| Corporate net special items | 108 | | | 48 | | | 195 | | | 48 | |
| Business net special items | 2 | | | 46 | | | 368 | | | 224 | |
| Non-operating pension expense (income) | (11) | | | 9 | | | (31) | | | 27 | |
| Business Segment Operating Profits | $ | 473 | | | $ | 701 | | | $ | 1,413 | | | $ | 1,930 | |
EXECUTIVE SUMMARY
Net earnings (loss) attributable to International Paper common shareholders were $204 million ($0.52 per diluted share) in the third quarter of 2020, compared with $266 million ($0.67 per diluted share) in the second quarter of 2020 and $344 million ($0.87 per diluted share) in the third quarter of 2019, compared with $292 million ($0.73 per diluted share) in the second quarter of 2019 and $562 million ($1.37 per diluted share) in the third quarter of 2018. Adjusted Operating Earnings is a non-GAAP measure and is defined as net earnings from continuing operations (a GAAP measure) excluding special items and non-operating pension expense.2019. International Paper generated Adjusted Operating Earnings Attributable to International Paper Common Shareholders (a non-GAAP measure defined below) of $280 million ($0.71 per diluted share) in the third quarter of 2020, compared with $305 million ($0.77 per diluted share) in the second quarter of 2020 and $431 million ($1.09 per diluted share) in the third quarter of 2019, compared with $460 million ($1.15 per diluted share) in the second quarter of 2019 and $641 million ($1.56 per diluted share) in2019.
In the third quarter of 2018.
2020, International Paper delivered another quarter of solid earnings and stronggenerated robust cash generationfrom operations in a challenging globaldynamic environment. These results demonstrate the strengthWe continued to deliver strong commercial and resilience ofoperational performance, with outstanding cost management across all our cash generation and the flexibility to perform well in the face of challenging conditions. Demand inbusinesses. In the third quarter of 2019 was mixed with seasonal improvement2020, we generated $735 million in the North American packaging business, largelycash from operations and $616 million in line with our expectations, but with lower export containerboardfree cash flow, bringing cash generated from operations and pulp shipments driven by pressure from challenging supplyfree cash flow to $2.3 billion and demand conditions. Operational performance was strong and we optimized our system and managed costs well across our three businesses, taking advantage of our system flexibility. Our continued strong cash generation has enabled us to return $1.1$1.6 billion, to shareholders duringrespectively, through the first three quarters of 2019 through dividends2020. The Company’s solid performance reinforces our financial strength and share repurchasescommitment to our capital allocation framework. We continued to use cash consistent with our capital allocation framework to maintain a strong balance sheet, return cash to shareowners and reduceinvest to create value. During the third quarter, we reduced debt by $400$760 million, bringing year-to-date debt reduction to $1.1 billion. In October, the board of directors approved the fourth quarter dividend, bringing the full-year authorizations to $800 million.
Comparing performance with the second quarter of 2019, prices were lowerRelative to demand, recovery trends continue to vary by business and end-use consumer segments. Demand for corrugated packaging accelerated in the third quarter mainly dueand that momentum continues in the fourth quarter. In our Global Cellulose Fibers business, we experienced seasonally lower demand and destocking across most regions, as expected. In our Printing Papers business, we are in the early stages of recovery as office and school activities restart. Against this backdrop, our commercial, supply chain and manufacturing organizations are collaborating at a high level to ensure we meet our customers’ changing needs, leveraging the scale and flexibility of our system and optimizing costs. We remain committed to our COVID-19 principles and will continue to focus on what we need to do to further strengthen the Company for all our stakeholders in the short-term and the long-term.
Comparing performance in the third quarter 2020 to the second quarter 2020, price and mix was essentially flat across our businesses. Volume was favorable, driven by strong demand for corrugated packaging in North America and improved demand for printing papers across all regions. Operations and costs benefited from improved fixed cost absorption on higher volume. Our businesses continued to do an excellent job managing costs and delivered strong operational performance to mitigate the impact of prior index movements in North America Packaging and Global Cellulose Fibers, as well as the flow through of lower prices for export containerboard. Volume was seasonally higher in our North American packaging business, along with improved export containerboard volume, while relatively flat across the rest of the businesses. Operations and cost performance was favorable following the heavy maintenance activityhurricanes in the 2019 secondthird quarter. Third quarter performance also benefited from about $30 million of one-time items, which favorably impacted operations and costs. As expected, maintenance outage costs reduced earnings in the third quarter, which is our highest planned maintenance quarter this year. Input costs were favorable, versus the prior quarter, withmostly due to lower wood and recovered fiber costs. We did experience higher energy and distribution costs acrossas we exited the third quarter, which we see as a positive sign of an improving economy. Corporate expense and taxes were favorable compared to the second quarter 2020, reflecting foreign currency translation gains and favorable adjustments to our businesses. Ourfederal tax provision after finalizing our 2019 tax return. Equity earnings from our Ilim joint venture delivered solid operational performance, but its earnings were impacted by sequentially lower export pulp pricesa loss of $33 million and higher planned maintenance outage expenses, which also drove lower volume in the quarter.include a $55 million non-cash foreign exchange loss primarily associated with foreign currency translation on Ilim’s US dollar denominated net debt.
Looking ahead to the fourth quarter 2020, as compared to the third quarter of 2019, overall across2020, in our businessesIndustrial Packaging business, we expect lowerstable price and mix improved seasonal volumein our North America and export shipments, lower input costs and significantly lower maintenance outage costs due to completing most of that work in the prior quarters. In IndustrialEuropean Packaging we expect lower price and mix tied to the impact of prior price index movements and price flow-through on exports along with the negative mix impact from export volume recovery.businesses. Volume is expected to improve on improveddecrease modestly, with continued strong demand for corrugated packaging offsetting the impact of three less days in North America and continued export volume recovery.the fourth quarter. Operations and costs are expected to be unfavorablynegatively impacted by the non-repeat of favorable one-time items in the third quarter of 2019. Maintenancequarter. Planned maintenance outage expense willis expected to be lower, whileand input costs shouldare expected to be stable.higher, mostly due to higher energy and transportation costs. In our Global Cellulose Fibers business, we expect lower price and mix driven byto be modestly lower in the impact of prior index movements.fourth quarter. Volume is expected to be stable as higher fluff volume is offset by lower softwood volume. Operations and costs are expected to be higher driven by higher seasonal energy consumption, while input costs are expected to remain stable. In Printing Papers, we expect lower price and mix primarily related to our North America and Latin America businesses as well as unfavorable geographic mix. This should be offset by improved volume on seasonally stronger demand in North America and Brazil. Operationsoperations and costs are expected to negatively impact earnings due to higher seasonal energy consumption andassociated
with the non-repeat of favorable one-time items. We expect increased planned maintenance outage expenses, and input costs are expected to be stable. In our Printing Papers business, we expect price and mix to be stable. Volume is expected to improve on higher seasonal demand in Latin America. Operations and costs are expected to be negatively impacted by the non-repeat of favorable one-time items in the third quarter, of 2019. Finally,along with higher seasonal energy costs. Planned maintenance outage expenses are expected to decrease, and input costs are expected to increase on higher wood and energy costs. Lastly, in our Ilim joint venture, we expect higher sales volumes, lower input costsimproved earnings on the non-repeat of the foreign currency loss on U.S. dollar denominated net debt incurred in the third quarter.
On March 11, 2020 the World Health Organization declared the novel strain of coronavirus (COVID-19) a global pandemic and lower maintenance outage expensesrecommended containment and mitigation measures worldwide. Most of our manufacturing and converting facilities have remained open and operational during the pandemic. The health and safety of our employees and contractors is our most important responsibility as we manage through the COVID-19 pandemic. We have implemented work-systems across the Company, including hygiene, social distancing, site cleaning, contact tracing, and other measures, as recommended by the CDC and WHO. Our COVID-19 measures are proving to be offseteffective and we have not had any material disruptions to our operations.
We have seen a significant negative impact on demand for our printing papers products. Demand for our pulp, containerboard and corrugated box products has not been negatively impacted by continued priceCOVID-19 to date, but could be unfavorably impacted going forward if negative economic conditions associated with COVID-19 persist or deteriorate. Furthermore, if there is a resurgence of the virus leading to additional governmental measures, such as stay-at-home orders or business and mix pressure.school shut downs, our supply chain, and therefore our production, could be negatively impacted.
There continue to be significant uncertainties associated with the COVID-19 pandemic, including with respect to the various economic reopening plans and the resurgence of the virus in many areas; additional actions that may be taken by governmental authorities and private businesses to attempt to contain the COVID-19 outbreak or to mitigate its impact; the extent and duration of social distancing and stay-at-home orders; the possibility of development of a vaccine; and the ongoing impact of COVID-19 on unemployment, economic activity and consumer confidence. Developments related to COVID-19 are significantly adversely affecting portions of our business, and could have a material adverse effect on our financial condition, results of operations and cash flows, particularly if negative global economic conditions persist for a significant period of time or deteriorate.
Adjusted Operating Earnings and Adjusted Operating Earnings Per Share are non-GAAP measures and are defined as net earnings from continuing operations(loss) attributable to International Paper (a GAAP measure) excluding net special items and non-operating pension expense.expense (income). Net earnings (loss) and Diluted earnings (loss) per share attributable to common shareholders are the most directly comparable GAAP measures. The Company calculates Adjusted Operating Earnings by excluding the after-tax effect of non-operating pension expense (income) and items considered by management to be unusual and discontinued operations(net special items) from the earnings reported under GAAP. Adjusted Operating Earnings Per Share is calculated by dividing Adjusted Operating Earnings by diluted average shares of common stock outstanding. Management uses this measure to focus on on-going operations, and believes that it is useful to investors because it enables them to perform meaningful comparisons of past and present consolidated operating results. The Company believes that using this information, along with the most directly comparable GAAP measure, provides for a more complete analysis of the results of operations.
The following are reconciliations of Earnings (loss) attributable to shareholders to Adjusted Operating Earnings (Loss) attributable to shareholders.
| | | | | | | | | | | | | | | | | |
| | Three Months Ended
September 30, | | Three Months Ended June 30, |
| In millions | 2020 | | 2019 | | 2020 |
| Net Earnings (Loss) Attributable to Shareholders | $ | 204 | | | $ | 344 | | | $ | 266 | |
| Add Back - Non-operating pension expense (income) | (11) | | | 9 | | | (14) | |
| Add Back - Net special items expense (income) | 109 | | | 94 | | | 68 | |
| Income tax effect - Non-operating pension and net special items expense | (22) | | | (16) | | | (15) | |
| Adjusted Operating Earnings (Loss) Attributable to International Paper Company | $ | 280 | | | $ | 431 | | | $ | 305 | |
|
| | | | | | | | | | | |
| | Three Months Ended
September 30, | | Three Months Ended June 30, |
| In millions | 2019 | | 2018 | | 2019 |
| Net Earnings (Loss) Attributable to International Paper Company | $ | 344 |
| | $ | 562 |
| | $ | 292 |
|
| Less - Discontinued operations (gain) loss | — |
| | — |
| | — |
|
| Earnings (Loss) from Continuing Operations | 344 |
| | 562 |
| | 292 |
|
| Add Back - Non-operating pension expense (income) | 9 |
| | 25 |
| | 8 |
|
| Add Back - Net special items expense (income) | 94 |
| | 142 |
| | 158 |
|
| Income tax effect - Non-operating pension and special items expense | (16 | ) | | (88 | ) | | 2 |
|
| Adjusted Operating Earnings (Loss) Attributable to International Paper Company | $ | 431 |
| | $ | 641 |
| | $ | 460 |
|
|
| | | | | | | | | | | |
| | Three Months Ended
September 30, | | Three Months Ended June 30, |
| In millions | 2019 | | 2018 | | 2019 |
| Diluted Earnings (Loss) Per Share Attributable to International Paper Company Common Shareholders | $ | 0.87 |
| | $ | 1.37 |
| | $ | 0.73 |
|
| Less - Discontinued operations (gain) loss per share | — |
| | — |
| | — |
|
| Diluted Earnings (Loss) Per Share from Continuing Operations | 0.87 |
| | 1.37 |
| | 0.73 |
|
| Add Back - Non-operating pension expense (income) per share | 0.02 |
| | 0.06 |
| | 0.02 |
|
| Add Back - Net special items expense (income) per share | 0.24 |
| | 0.34 |
| | 0.40 |
|
| Income tax effect per share - Non-operating pension and special items expense | (0.04 | ) | | (0.21 | ) | | — |
|
| Adjusted Operating Earnings (Loss) Per Share Attributable to International Paper Company Common Shareholders | $ | 1.09 |
| | $ | 1.56 |
| | $ | 1.15 |
|
| | | | | | | | | | | | | | | | | |
| | Three Months Ended
September 30, | | Three Months Ended June 30, |
| In millions | 2020 | | 2019 | | 2020 |
| Diluted Earnings (Loss) Per Share Attributable to Shareholders | $ | 0.52 | | | $ | 0.87 | | | $ | 0.67 | |
| Add Back - Non-operating pension expense (income) per share | (0.03) | | | 0.02 | | | (0.04) | |
| Add Back - Net special items expense (income) per share | 0.28 | | | 0.24 | | | 0.17 | |
| Income tax effect per share - Non-operating pension and net special items expense | (0.06) | | | (0.04) | | | (0.03) | |
| Adjusted Operating Earnings (Loss) Per Share Attributable to Shareholders | $ | 0.71 | | | $ | 1.09 | | | $ | 0.77 | |
Cash provided by operations totaled $2.7$2.3 billion and $2.4$2.7 billion for the first nine months of 20192020 and 2018,2019, respectively. The Company generated free cash flow of approximately $1.8$1.6 billion and $1.1$1.8 billion in the first nine months of 20192020 and 2018,2019, respectively. Free cash flow is a non-GAAP measure and the most directly comparable GAAP measure is cash provided by operations. Management utilizes this measure in connection with managing our business and believes that free cash flow is useful to investors as a liquidity measure because it measures the amount of cash generated that is available, after reinvesting in the business, to maintain a strong balance sheet, pay dividends, repurchase stock, service debt and make investments for future growth. It should not be inferred that the entire free cash flow amount is available for discretionary expenditures. By adjusting for certain items that are not indicative of the Company's ongoing performance, we believe that free cash flow also enables investors to perform meaningful comparisons between past and present periods.
The following is a reconciliation of cash provided by operations to free cash flow:
| | | | | | | | | | | | | | | | | | | | | | | |
| | Three Months Ended
September 30, | | Nine Months Ended
September 30, |
| In millions | 2020 | | 2019 | | 2020 | | 2019 |
| Cash provided by operations | $ | 735 | | | $ | 882 | | | $ | 2,274 | | | $ | 2,682 | |
| Adjustments: | | | | | | | |
| Cash invested in capital projects, net of insurance recoveries | (119) | | | (285) | | | (657) | | | (913) | |
| Free Cash Flow | $ | 616 | | | $ | 597 | | | $ | 1,617 | | | $ | 1,769 | |
The non-GAAP financial measures presented in this Quarter Report on Form 10-Q as referenced above have limitations as analytical tools and should not be considered in isolation or as a substitute for an analysis of our results calculated in accordance with GAAP. In addition, because not all companies utilize identical calculations, the Company's presentation of non-GAAP measures in this Quarterly Report on Form 10-Q may not be comparable to similarly titled measures disclosed by other companies, including companies in the same industry as the Company.
|
| | | | | | | |
| | Nine Months Ended
September 30, |
| In millions | 2019 | | 2018 |
| Cash provided by operations | $ | 2,682 |
| | $ | 2,405 |
|
| Adjustments: | | | |
| Cash invested in capital projects | (913 | ) | | (1,286 | ) |
| Free Cash Flow | $ | 1,769 |
| | $ | 1,119 |
|
For the third quarter of 2019,2020, International Paper Company reported net sales of $5.6$5.1 billion, compared with $5.7$4.9 billion in the second quarter of 20192020 and $5.9$5.6 billion in the third quarter of 2018.2019.
Net earnings (loss) attributable to International Paper totaled $204 million, or $0.52 per diluted share, in the third quarter of 2020. This compared with $266 million, or $0.67 per diluted share, in the second quarter of 2020 and $344 million, or $0.87 per diluted share, in the third quarter of 2019. This compared with $292 million, or $0.73 per diluted share, in the second quarter
Earnings from continuing operations attributable to International Paper Company were $344 million in the third quarter of 2019, $292 million in the second quarter of 2019 and $562 million in the third quarter of 2018.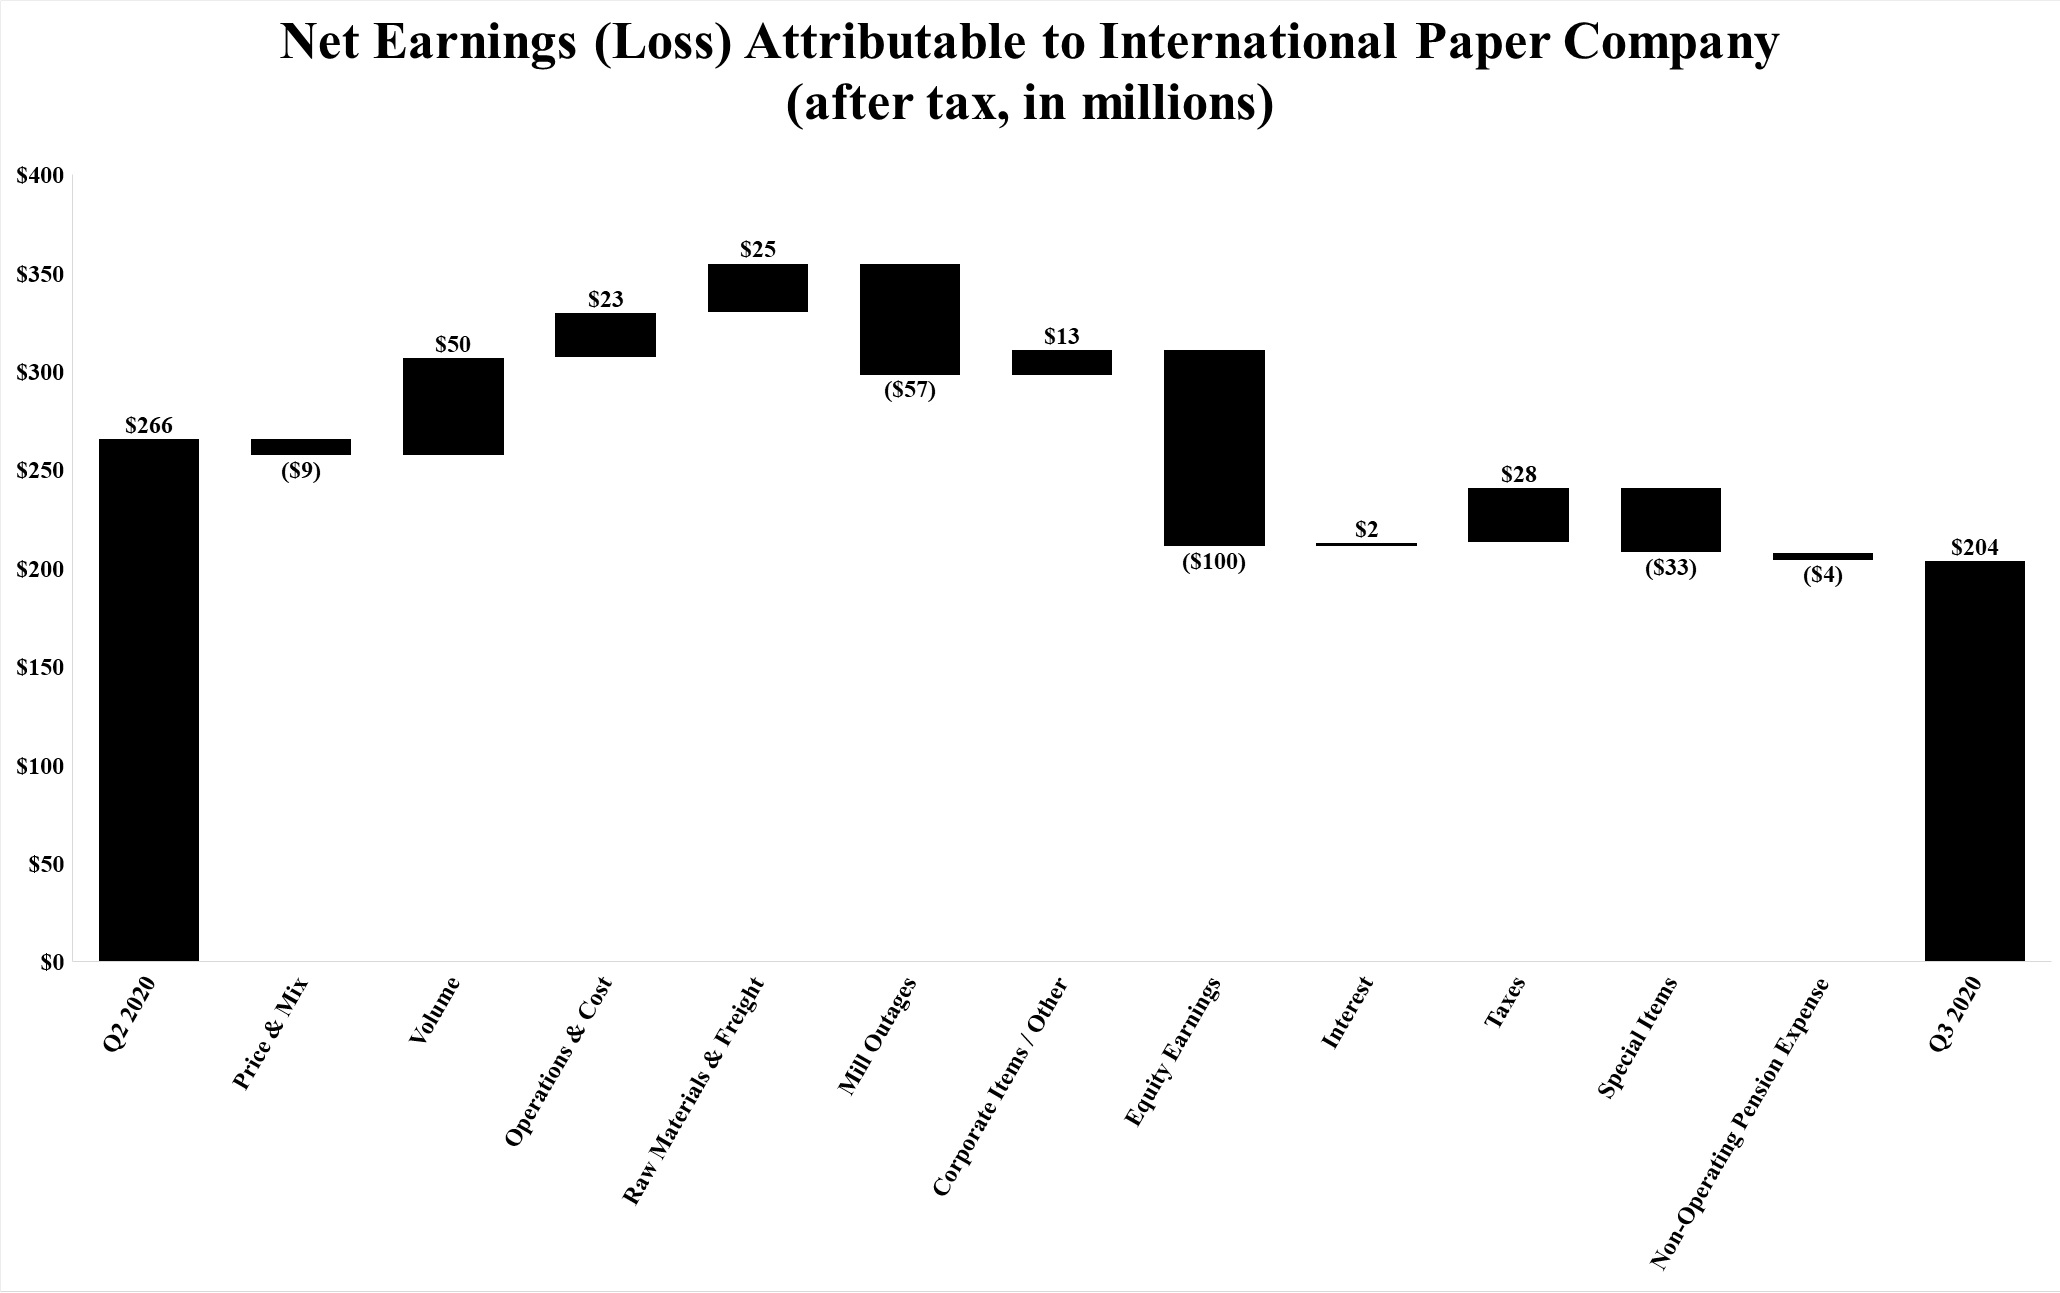
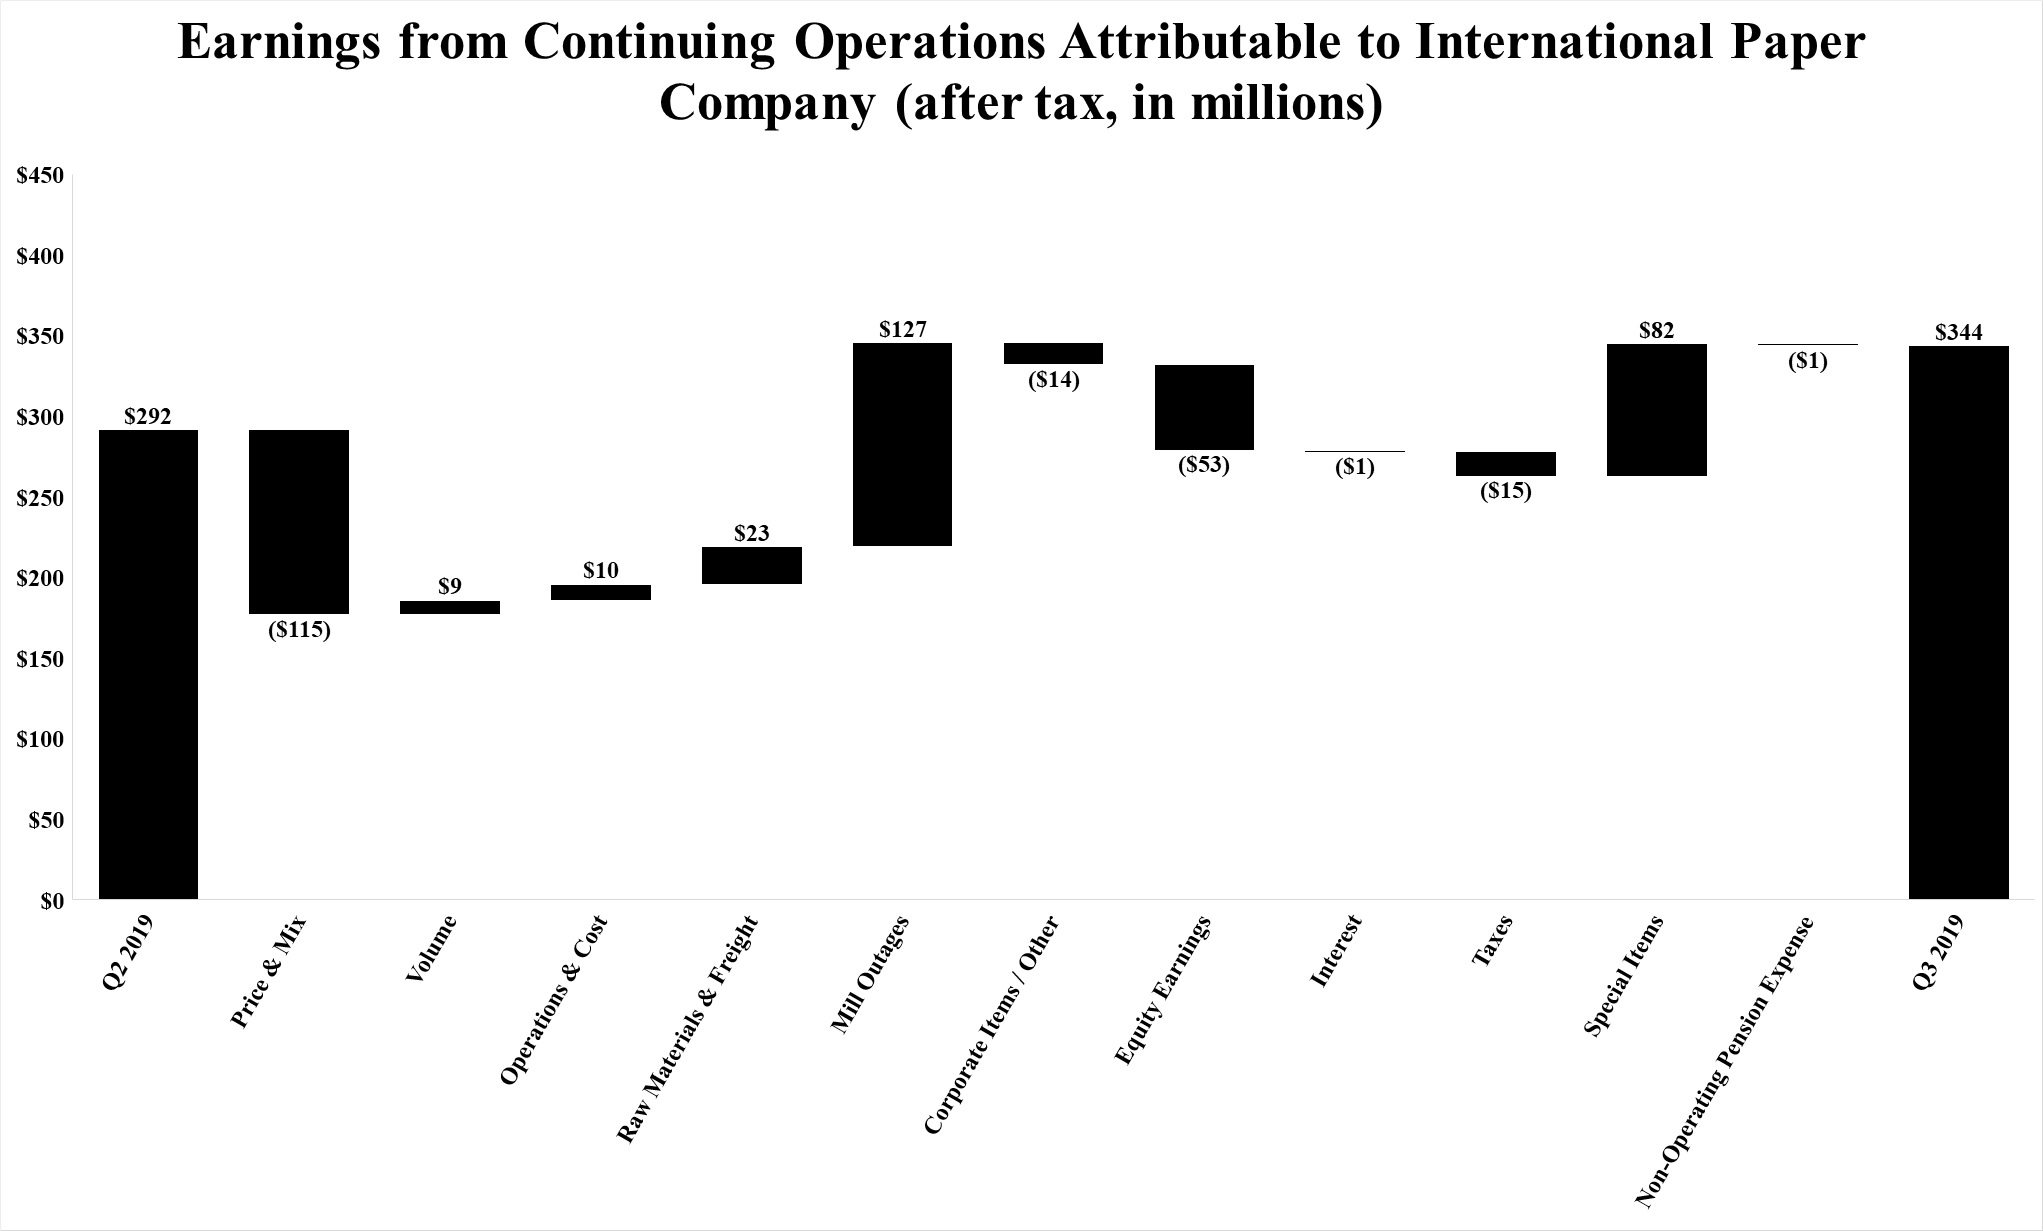
Compared with the second quarter of 2019,2020, earnings benefited from higher sales volumes ($950 million), lower operating costs ($1023 million), lower raw material and freight costs ($2325 million), lower corporate and other items ($13 million), lower net interest expense ($2 million) and lower mill maintenance outage coststax expense ($12728 million). These benefits were offset by lower average sales prices and an unfavorablenet of a favorable mix ($1159 million), higher corporate and other itemsmill maintenance outage costs ($14 million), higher net interest expense ($1 million), higher tax expense ($1557 million) and higher non-operating pension expense ($14 million). Equity earnings, net of taxes, relating to International Paper’s investments in Ilim S.A., Graphic Packaging International Partners, LLC, and other investments were $53$100 million lower than in the second quarter of 2019.2020. Net special items in the third quarter of 20192020 were a loss of $80$83 million compared with a loss of $162$50 million in the second quarter of 2019.2020.
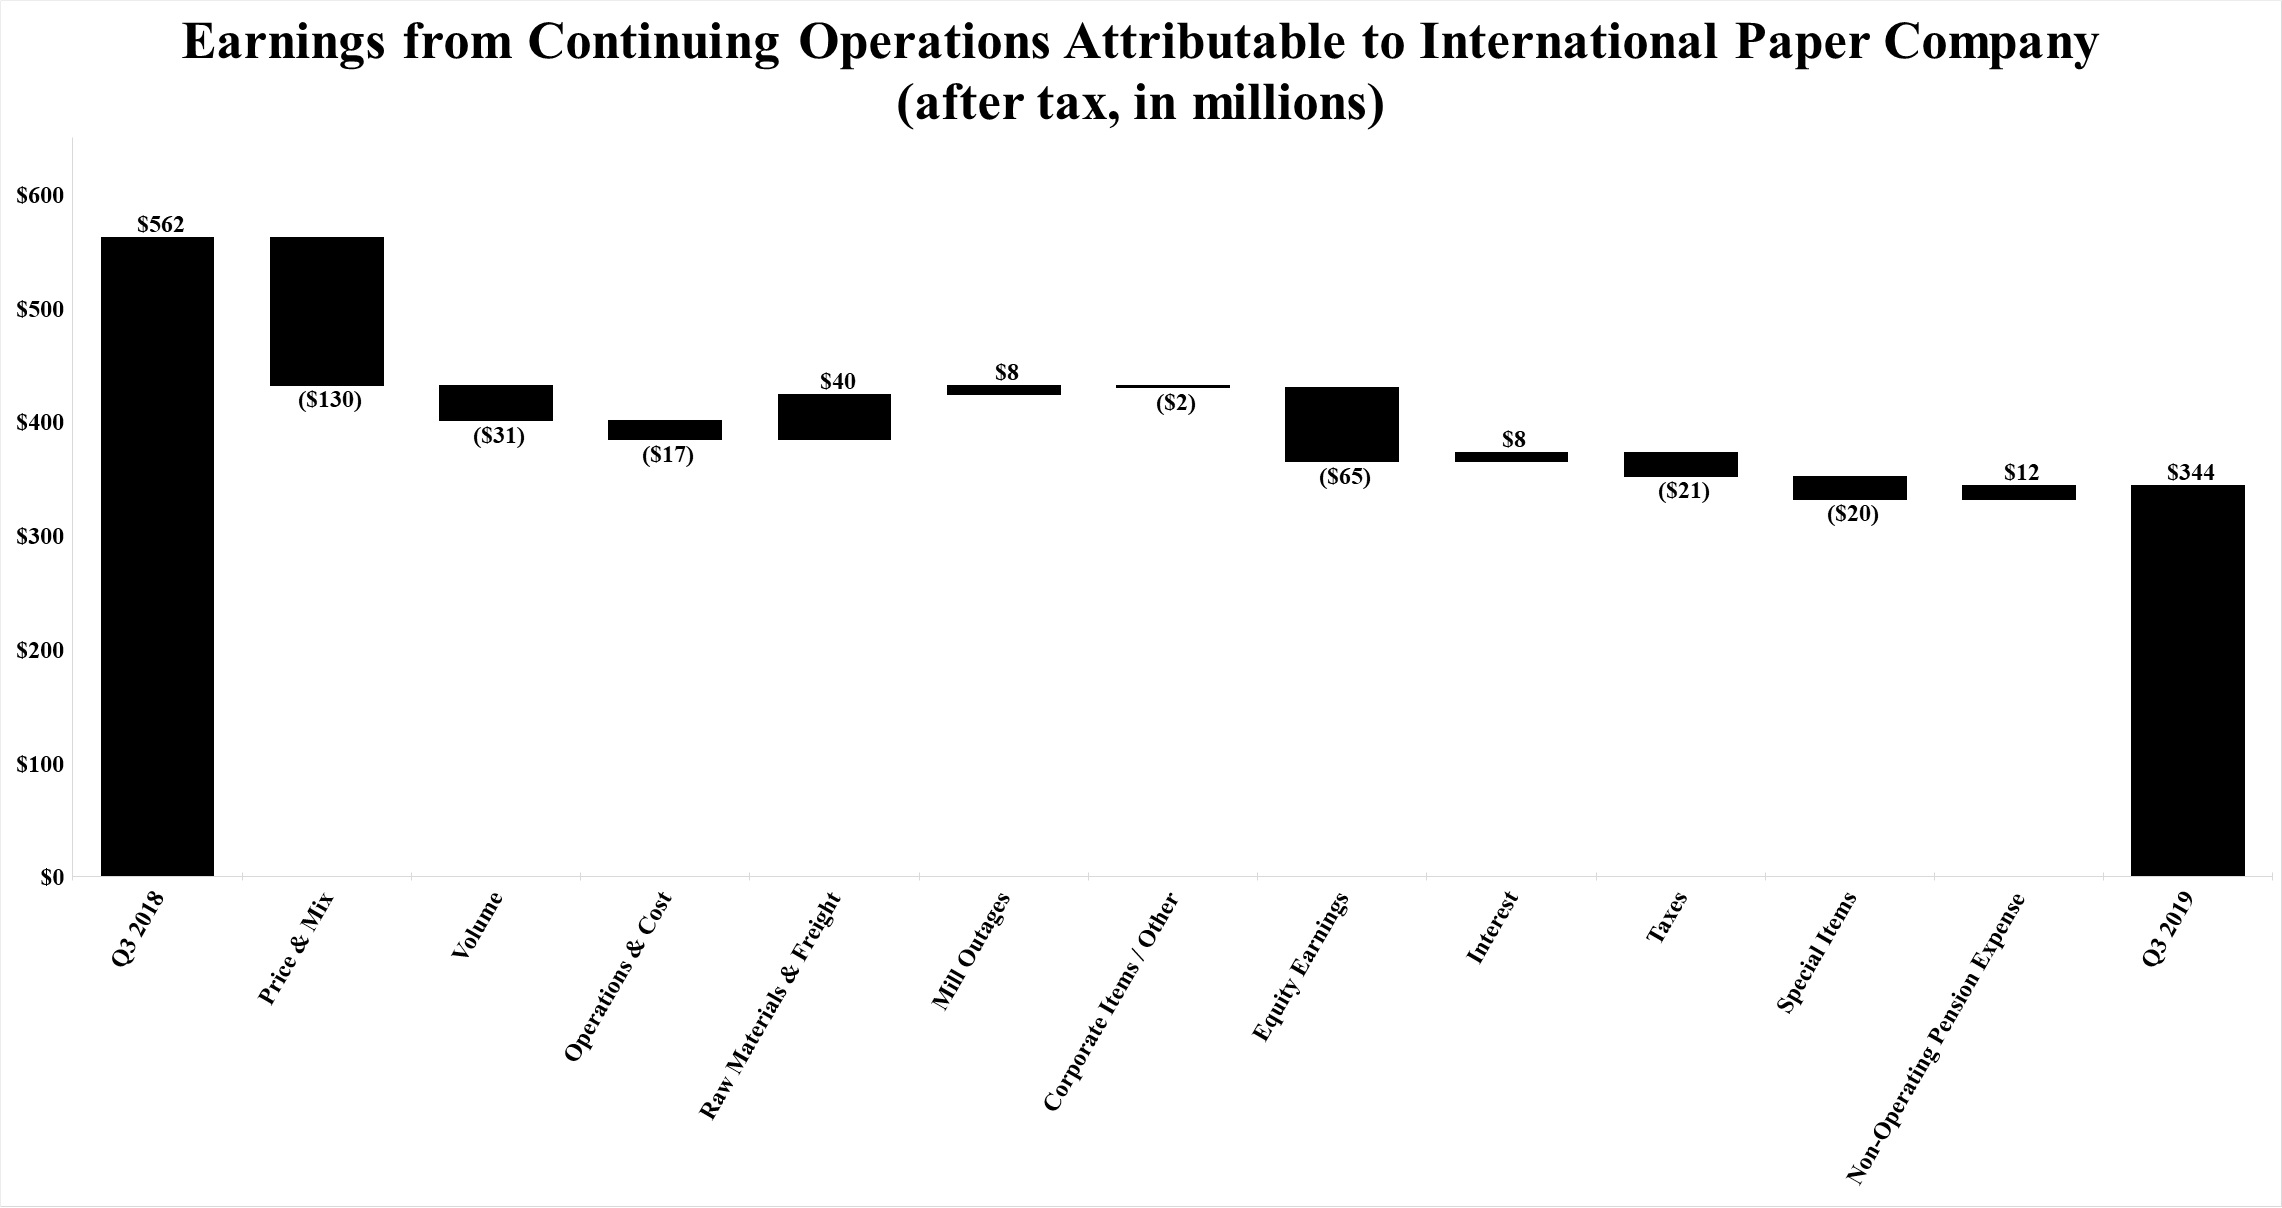
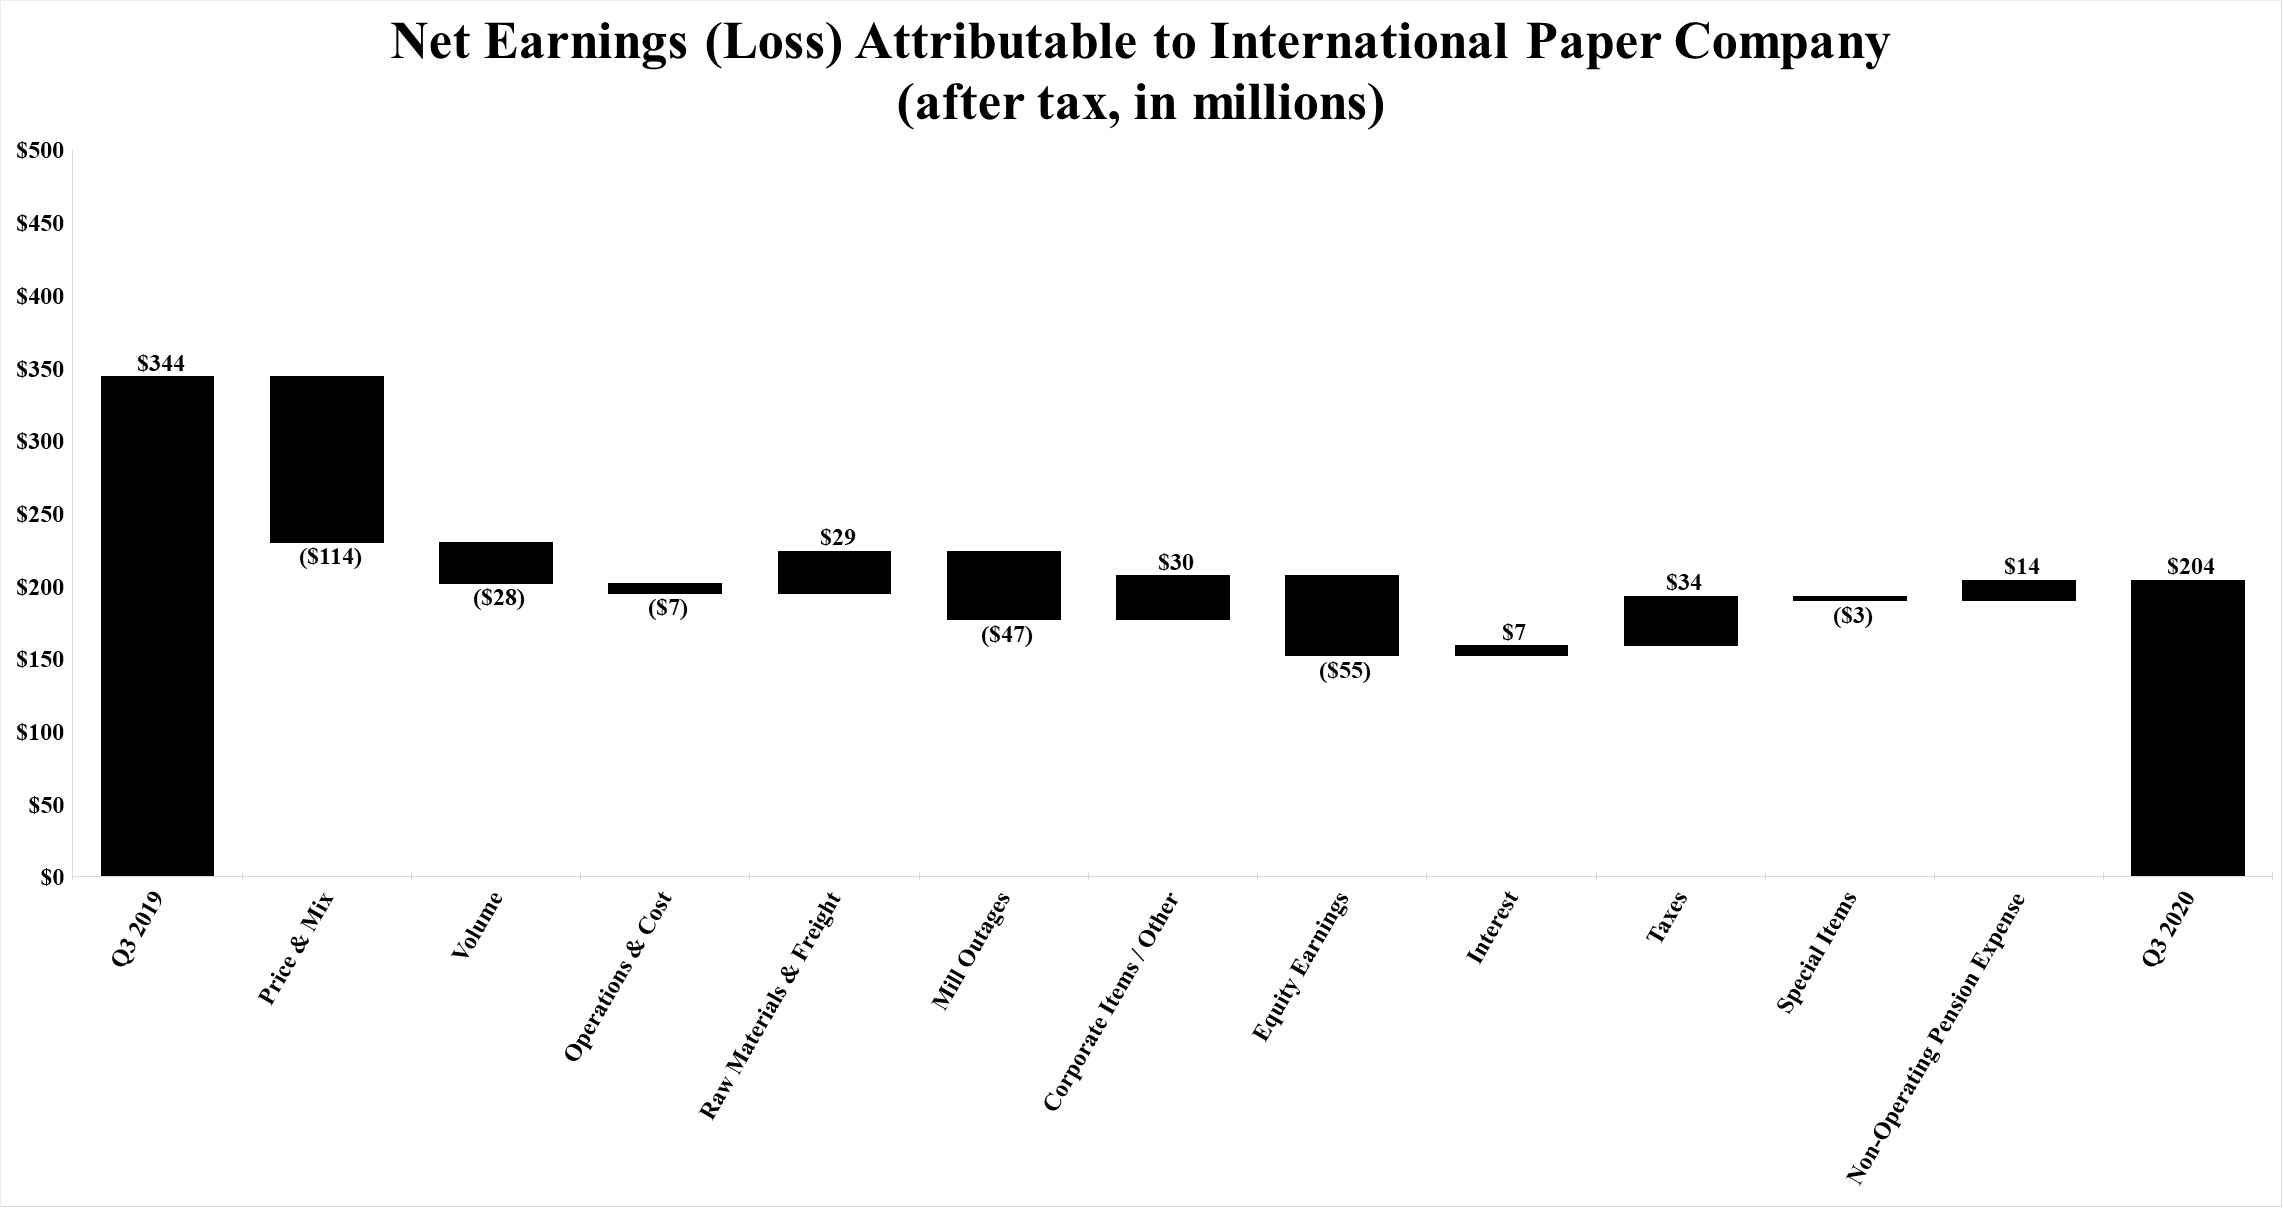
Compared with the third quarter of 2018,2019, the third quarter of 20192020 reflects lower raw material and freight costs ($4029 million), lower mill maintenance outagecorporate and other costs ($830 million), lower net interest expense ($87 million), lower tax expense ($34 million) and lower non-operating pension expense ($1214 million). These benefits were offset by lower average sales prices and an unfavorable mix ($130114 million), lower sales volumes ($3128 million), higher operating costs ($17 million), higher corporate and other costs ($27 million) and higher tax expensemill maintenance outage costs ($2147 million). Equity earnings, net of taxes, relating to International Paper’s investments in Ilim S.A., Graphic Packaging International Partners, LLC, and other investments were $65$55 million lower in the third quarter of 20192020 than in the third quarter of 2018.2019. Net special items in the third quarter of 20192020 were a loss of $80$83 million compared with a loss of $60$80 million in the third quarter of 2018.2019.
Business Segment Operating Profits are used by International Paper's management to measure the earnings performance of its businesses. Management uses this measure to focus on on-going operations, and believes that it is useful to investors because it enables them to perform meaningful comparisons of past and present operating results. International Paper believes that using this information, along with net earnings, provides a more complete analysis of the results of operations by quarter. Business Segment Operating Profits are defined as earnings (loss) from continuing operations before income taxes and equity earnings, but including the impact of equity earnings and noncontrolling interests, and excluding interest expense, net, corporate expenses, net, corporate net special items, business net special items and non-operating pension expense. Business Segment Operating Profits is a measure reported to our management for purposes of making decisions about allocating resources to our business segments and assessing the performance of our business segments and is presented in our financial statement footnotes in accordance with ASC 280.
International Paper operates in three segments: Industrial Packaging, Global Cellulose Fibers and Printing Papers.
The following table presents a reconciliation of net earnings (loss) from continuing operations attributable to International Paper Company to its Total Business Segment Operating Profit:
| | | | | | | | | | | | | | | | | |
| | Three Months Ended |
| | September 30, | | June 30, |
| In millions | 2020 | | 2019 | | 2020 |
| Net Earnings (Loss) Attributable to International Paper Company | $ | 204 | | | $ | 344 | | | $ | 266 | |
| Add back (deduct): | | | | | |
| Income tax provision (benefit) | 50 | | | 137 | | | 67 | |
| Equity (earnings) loss, net of taxes | 28 | | | (27) | | | (72) | |
| Noncontrolling interests, net of taxes | — | | | (2) | | | — | |
| Earnings (Loss) Before Income Taxes and Equity Earnings | 282 | | | 452 | | | 261 | |
| Interest expense, net | 112 | | | 123 | | | 116 | |
| Noncontrolling interests included in operations | — | | | 2 | | | — | |
| Corporate expenses, net | (20) | | | 21 | | | (3) | |
| Corporate net special items | 108 | | | 48 | | | 54 | |
| Business net special items | 2 | | | 46 | | | 14 | |
| Non-operating pension expense (income) | (11) | | | 9 | | | (14) | |
| Adjusted Operating Profit | $ | 473 | | | $ | 701 | | | $ | 428 | |
| Business Segment Operating Profit (Loss): | | | | | |
| Industrial Packaging | $ | 469 | | | $ | 535 | | | $ | 449 | |
| Global Cellulose Fibers | (59) | | | 4 | | | (10) | |
| Printing Papers | 63 | | | 162 | | | (11) | |
| Total Business Segment Operating Profit | $ | 473 | | | $ | 701 | | | $ | 428 | |
|
| | | | | | | | | | | |
| | Three Months Ended |
| | September 30, | | June 30, |
| In millions | 2019 | | 2018 | | 2019 |
| Net Earnings (Loss) From Continuing Operations Attributable to International Paper Company | $ | 344 |
| | $ | 562 |
| | $ | 292 |
|
| Add back (deduct): | | | | | |
| Income tax provision (benefit) | 137 |
| | 83 |
| | 128 |
|
| Equity (earnings) loss, net of taxes | (27 | ) | | (92 | ) | | (80 | ) |
| Noncontrolling interests, net of taxes | (2 | ) | | — |
| | (6 | ) |
| Earnings (Loss) From Continuing Operations Before Income Taxes and Equity Earnings | 452 |
| | 553 |
| | 334 |
|
| Interest expense, net | 123 |
| | 133 |
| | 122 |
|
| Noncontrolling interests / equity earnings included in operations | 2 |
| | (2 | ) | | 5 |
|
| Corporate expenses, net | 21 |
| | 20 |
| | 3 |
|
| Corporate special items (income) expense | 48 |
| | 9 |
| | — |
|
| Non-operating pension expense | 9 |
| | 25 |
| | 8 |
|
| Adjusted Operating Profit | $ | 655 |
| | $ | 738 |
| | $ | 472 |
|
| Business Segment Operating Profit: | | | | | |
| Industrial Packaging | $ | 510 |
| | $ | 472 |
| | $ | 507 |
|
| Global Cellulose Fibers | (3 | ) | | 83 |
| | (2 | ) |
| Printing Papers | 148 |
| | 183 |
| | (33 | ) |
| Total Business Segment Operating Profit | $ | 655 |
| | $ | 738 |
| | $ | 472 |
|
Business Segment Operating Profit
Total business segment operating profits were $655$473 million in the third quarter of 2019, $4722020, $428 million in the second quarter of 20192020 and $738$701 million in the third quarter of 2018.2019.
Compared with the second quarter of 2019,2020, operating profits benefited from higher sales volumes ($1268 million), lower operating costs ($1431 million), and lower raw material and freight costs ($3134 million). These benefits were offset by lower average sales prices net of a favorable mix ($11 million) and lowerhigher mill outage costs ($16977 million).
Compared with the third quarter of 2019, operating profits in the current quarter benefited from lower raw material and freight costs ($40 million). These benefits were offset by lower average sales prices and an unfavorable mix ($154 million). Special items were a loss of $46 million in the third quarter of 2019 compared with a loss of $157 million in the second quarter of 2019.
Compared with the third quarter of 2018, operating profits in the current quarter benefited from lower raw material and freight costs ($52 million) and lower mill outage costs ($11 million). These benefits were offset by lower average sales prices and an unfavorable mix ($170156 million), lower sales volumes ($4138 million), higher operating costs ($9 million) and higher operatingmill outage costs ($2265 million). Special items were a loss of $46 million in the third quarter of 2019 compared with a loss of $133 million in the third quarter of 2018.
EconomicEconomic-related downtime results from the amount of production required to meet our customer demand. Planned maintenance downtime is taken periodically throughout the year. The following table details North American planned maintenance and economic-related downtime:
| | | | | | | | | | | |
| In thousands of tons | Three Months Ended September 30, 2020 | Three Months Ended September 30, 2019 | Three Months Ended June 30, 2020 |
| Economic-related downtime | 126 | | 283 | | 328 | |
| Maintenance downtime | 170 | | 125 | | 51 | |
|
| | | | | | |
| in thousands of tons | Three Months Ended September 30, 2019 | Three Months Ended September 30, 2018 | Three Months Ended June 30, 2019 |
| Economic-related downtime | 287 |
| — |
| 339 |
|
| Maintenance downtime | 125 |
| 197 |
| 303 |
|
Sales Volumes by Product (a)
Sales volumes of major products for the three months and nine months ended September 30, 20192020 and 20182019 were as follows:
| | | | Three Months Ended
September 30, | | Nine Months Ended
September 30, | | Three Months Ended
September 30, | | Nine Months Ended
September 30, |
| In thousands of short tons (except as noted) | 2019 | | 2018 | | 2019 | | 2018 | In thousands of short tons (except as noted) | 2020 | | 2019 | | 2020 | | 2019 |
| Industrial Packaging | | | | | | | | Industrial Packaging | |
| Corrugated Packaging (b) | 2,651 |
| | 2,666 |
| | 7,810 |
| | 7,969 |
| Corrugated Packaging (b) | 2,705 | | | 2,651 | | | 7,900 | | | 7,810 | |
| Containerboard | 736 |
| | 853 |
| | 2,140 |
| | 2,436 |
| Containerboard | 760 | | | 736 | | | 2,370 | | | 2,140 | |
| Recycling | 556 |
| | 566 |
| | 1,790 |
| | 1,700 |
| Recycling | 460 | | | 556 | | | 1,388 | | | 1,790 | |
| Saturated Kraft | 47 |
| | 51 |
| | 140 |
| | 149 |
| Saturated Kraft | 36 | | | 47 | | | 123 | | | 140 | |
| Gypsum/Release Kraft | 49 |
| | 56 |
| | 149 |
| | 176 |
| Gypsum/Release Kraft | 50 | | | 49 | | | 154 | | | 149 | |
| Bleached Kraft | 5 |
| | 8 |
| | 17 |
| | 24 |
| Bleached Kraft | 7 | | | 5 | | | 22 | | | 17 | |
| EMEA Packaging (b) | 375 |
| | 329 |
| | 1,124 |
| | 1,113 |
| EMEA Packaging (b) | 374 | | | 375 | | | 1,190 | | | 1,124 | |
| Brazilian Packaging (b) | 96 |
| | 92 |
| | 272 |
| | 263 |
| Brazilian Packaging (b) | 98 | | | 96 | | | 271 | | | 272 | |
| European Coated Paperboard | 106 |
| | 98 |
| | 312 |
| | 284 |
| European Coated Paperboard | 102 | | | 106 | | | 308 | | | 312 | |
| Industrial Packaging | 4,621 |
| | 4,719 |
| | 13,754 |
| | 14,114 |
| Industrial Packaging | 4,592 | | | 4,621 | | | 13,726 | | | 13,754 | |
Global Cellulose Fibers (in thousands of metric tons) (c) | 878 |
| | 886 |
| | 2,606 |
| | 2,665 |
| Global Cellulose Fibers (in thousands of metric tons) (c) | 886 | | | 878 | | | 2,752 | | | 2,606 | |
| Printing Papers | | | | | | | | Printing Papers | |
| U.S. Uncoated Papers | 451 |
| | 461 |
| | 1,340 |
| | 1,415 |
| U.S. Uncoated Papers | 336 | | | 451 | | | 998 | | | 1,340 | |
| European and Russian Uncoated Papers | 352 |
| | 363 |
| | 1,073 |
| | 1,066 |
| European and Russian Uncoated Papers | 298 | | | 352 | | | 929 | | | 1,073 | |
| Brazilian Uncoated Papers | 301 |
| | 293 |
| | 828 |
| | 818 |
| Brazilian Uncoated Papers | 208 | | | 301 | | | 598 | | | 828 | |
| Indian Uncoated Papers | 49 |
| | 62 |
| | 183 |
| | 195 |
| Indian Uncoated Papers | — | | | 49 | | | — | | | 183 | |
| Printing Papers | 1,153 |
| | 1,179 |
| | 3,424 |
| | 3,494 |
| Printing Papers | 842 | | | 1,153 | | | 2,525 | | | 3,424 | |
| |
(a) | Sales volumes include third party and inter-segment sales and exclude sales of equity investees. |
| |
(b) | Volumes for corrugated box sales reflect consumed tons sold (CTS). Board sales for these businesses reflect invoiced tons. |
| |
(c) | (a)Sales volumes include third party and inter-segment sales and exclude sales of equity investees. (b)Volumes for corrugated box sales reflect consumed tons sold (CTS). Board sales for these businesses reflect invoiced tons. (c)Includes North American, European and Brazilian volumes and internal sales to mills. |
Discontinued Operations
Income Taxes
An income tax provision of $50 million was recorded for the third quarter of 2020 and the reported effective income tax rate was 18%. Excluding a benefit of $26 million related to the tax effects of net special items and expense of $4 million related to the tax effects of non-operating pension expense, the effective income tax rate was 19% for the quarter.
An income tax provision of $67 million was recorded for the second quarter of 2020 and the reported effective income tax rate was 26%. Excluding a benefit of $18 million related to the tax effects of net special items and expense of $3 million related to the tax effects of non-operating pension expense, the effective income tax rate was 26% for the quarter.
An income tax provision of $137 million was recorded for the third quarter of 2019 and the reported effective income tax rate was 30%. Excluding a benefit of $14 million related to the tax effects of net special items and a benefit of $2 million related to the tax effects of non-operating pension expense, the effective income tax rate was 27% for the quarter.
An income tax provision of $128 million was recorded for the second quarter of 2019 and the reported effective income tax rate was 38%. Excluding an expense of $4 million related to the tax effects of special items and a benefit of $2 million related to the tax effects of non-operating pension expense, the effective income tax rate was 25% for the quarter.
An income tax provision of $83 million was recorded for the third quarter of 2018 and the reported effective income tax rate was 15%. Excluding a benefit of $82 million related to the tax effects of special items and a benefit of $6 million related to the tax effects of non-operating pension expense, the effective income tax rate was 24% for the quarter.
Interest Expense
Net interest expense was $112 million in the third quarter of 2020, compared with $116 million in the second quarter of 2020 and $123 million in the third quarter of 2019, compared with $122 million which includes interest expense2019.
Effects of Net Special Items and Non-Operating Pension Expense
Details of net special items and non-operating pension expense (income) for the three months and nine months ended are as follows:
| | | | | | | | | | | | | | | | | | | | | | | | | | | | | | | | | | | | | | |
| Three Months Ended |
| September 30, | | June 30, | |
| 2020 | | 2019 | | 2020 | |
| In millions | Before Tax | | After Tax | | Before Tax | | After Tax | | Before Tax | | After Tax | |
| Business Segments | | | | | | | | | | | | |
| Environmental remediation reserve adjustment | $ | 7 | | | $ | 6 | | (a) | $ | — | | | $ | — | | | $ | — | | | $ | — | | |
| Brazil Packaging impairment | (4) | | | (2) | | (b) | — | | | — | | | 9 | | | 7 | | (b) |
| Abandoned property removal | — | | | — | | | 13 | | | 10 | | (d) | 5 | | | 4 | | (d) |
| Italian antitrust fine | — | | | — | | | 32 | | | 32 | | (b) | — | | | — | | |
| Overhead cost reduction initiative | — | | | — | | | 10 | | | 8 | | (e) | — | | | — | | |
| India Papers impairment | — | | | — | | | 6 | | | 6 | | (a) | — | | | — | | |
| Riverdale mill conversion | — | | | — | | | 1 | | | 1 | | (a) | — | | | — | | |
| Gain on sale of previously closed Oregon mill site | — | | | — | | | (9) | | | (7) | | (b) | — | | | — | | |
| Multi-employer pension plan exit liability | — | | | — | | | (7) | | | (6) | | (b) | — | | | — | | |
| Other | (1) | | | (1) | | (c) | — | | | — | | | — | | | — | | |
| Business Segments Total | 2 | | | 3 | | | 46 | | | 44 | | | 14 | | | 11 | | |
| Corporate | | | | | | | | | | | | |
| Debt extinguishment costs | 105 | | | 79 | | | — | | | — | | | 18 | | | 13 | | |
| Asbestos litigation reserve adjustment | — | | | — | | | — | | | — | | | 43 | | | 33 | | |
| Gain on sale of portion of investment in India | — | | | — | | | — | | | — | | | (6) | | | (6) | | |
| Litigation reserves | — | | | — | | | 22 | | | 17 | | | — | | | — | | |
| Environmental remediation reserve adjustment | — | | | — | | | 15 | | | 11 | | | — | | | — | | |
| Overhead cost reduction initiative | — | | | — | | | 11 | | | 8 | | | — | | | — | | |
| Other | 2 | | | 1 | | | — | | | — | | | (1) | | | (1) | | |
| Corporate Total | 107 | | | 80 | | | 48 | | | 36 | | | 54 | | | 39 | | |
| Total net special items | 109 | | | 83 | | | 94 | | | 80 | | | 68 | | | 50 | | |
| Non-operating pension expense (income) | (11) | | | (7) | | | 9 | | | 7 | | | (14) | | | (11) | | |
| Total net special items and non-operating pension expense (income) | $ | 98 | | | $ | 76 | | | $ | 103 | | | $ | 87 | | | $ | 54 | | | $ | 39 | | |
|
| | | | | | | | | | | | | | | | | | | | | | | | |
| | | Three Months Ended |
| | | September 30, | | June 30, |
| | | 2019 | | 2018 | | 2019 |
| In millions | | Before Tax | | After Tax | | Before Tax | | After Tax | | Before Tax | | After Tax |
| Business Segments | | | | | | | | | | | | |
| India impairment | | $ | 6 |
| | $ | 6 |
| | $ | — |
| | $ | — |
| | $ | 145 |
| | $ | 143 |
|
| Brazil Packaging impairment | | — |
| | — |
| | 122 |
| | 81 |
| | — |
| | — |
|
| Italian antitrust fine | | 32 |
| | 32 |
| | — |
| | — |
| | — |
| | — |
|
| Overhead cost reduction initiative | | 10 |
| | 8 |
| | — |
| | — |
| | — |
| | — |
|
| Multi-employer pension plan exit liability | | (7 | ) | | (6 | ) | | — |
| | — |
| | — |
| | — |
|
| Gain on sale of previously closed Oregon mill site | | (9 | ) | | (7 | ) | | — |
| | — |
| | — |
| | — |
|
| Abandoned property removal | | 13 |
| | 10 |
| | 6 |
| | 4 |
| | 11 |
| | 8 |
|
| Riverdale mill conversion | | 1 |
| | 1 |
| | 5 |
| | 4 |
| | 1 |
| | 1 |
|
| Business Segments Total | | 46 |
| | 44 |
| | 133 |
| | 89 |
| | 157 |
| | 152 |
|
| Corporate | | | | | | | | | | | | |
| Litigation reserves | | 22 |
| | 17 |
| | — |
| | — |
| | — |
| | — |
|
| Environmental remediation reserve adjustment | | 15 |
| | 11 |
| | 9 |
| | 7 |
| | — |
| | — |
|
| Overhead cost reduction initiative | | 11 |
| | 8 |
| | — |
| | — |
| | — |
| | — |
|
| Interest expense related to settlement of foreign tax audits | | — |
| | — |
| | — |
| | — |
| | 1 |
| | 1 |
|
| Corporate Total | | 48 |
| | 36 |
| | 9 |
| | 7 |
| | 1 |
| | 1 |
|
| Total special items | | 94 |
| | 80 |
| | 142 |
| | 96 |
| | 158 |
| | 153 |
|
| Non-operating pension expense | | 9 |
| | 7 |
| | 25 |
| | 19 |
| | 8 |
| | 6 |
|
| Total special items and non-operating pension expense | | $ | 103 |
| | $ | 87 |
| | $ | 167 |
| | $ | 115 |
| | $ | 166 |
| | $ | 159 |
|
Special items include(a) Recorded in the following tax expenses (benefits):Printing Papers segment.
(b) Recorded in the Industrial Packaging segment.
(c) Includes income of $2 million (before and after taxes) recorded in the Printing Papers segment and charges of $1 million (before and after taxes) recorded in the Industrial Packaging segment.
(d) Includes $3 million ($2 million after taxes) and $9 million ($7 million after taxes) for the three months ended June 30, 2020 and September 30, 2019, respectively, recorded in the Industrial Packaging segment; $2 million (before and after taxes) and $3 million ($2 million after taxes) for the three months ended June 30, 2020 and September 30, 2019, respectively, recorded in the Global Cellulose Fibers segment; $1 million (before and after taxes) for the three months ended September 30, 2019, recorded in the Printing Papers segment.
(e) Includes $4 million ($3 million after taxes) recorded in the Global Cellulose Fibers segment and $6 million ($5 million after taxes) recorded in the Printing Papers segment.
|
| | | | | | | | | | | | |
| | | Three Months Ended |
| | | September 30, | | June 30, |
| In millions | | 2019 | | 2018 | | 2019 |
| Luxembourg tax law rate change | | $ | — |
| | $ | — |
| | $ | 9 |
|
| Tax benefits from Tax Cuts and Jobs Act | | — |
| | (36 | ) | | — |
|
| State income tax legislative changes | | — |
| | — |
| | (3 | ) |
| Settlement of foreign tax audits | | — |
| | — |
| | 3 |
|
| Total | | $ | — |
| | $ | (36 | ) | | $ | 9 |
|
Details of net special items and non-operating pension expense for the nine months ended are as follows:
| | | | | | | | | | | | | | | | | | | | | | | | | | | | | |
| | Nine Months Ended |
| | September 30, |
| | 2020 | 2019 |
| In millions | | Before Tax | | After Tax | | Before Tax | | After Tax | |
| Business Segments | | | | | | | | | |
| Brazil Packaging impairment | | $ | 349 | | | $ | 342 | | (a) | $ | — | | | $ | — | | |
| Abandoned property removal | | 14 | | | 11 | | (b) | 35 | | | 26 | | (b) |
| Environmental remediation reserve adjustment | | 7 | | | 6 | | (c) | — | | | — | | |
| Riverdale mill conversion | | 1 | | | 1 | | (c) | 3 | | | 3 | | (c) |
| Foreign value-added tax refund accrual | | (2) | | | (1) | | (a) | — | | | — | | |
| India Papers impairment | | — | | | — | | | 151 | | | 149 | | (c) |
| Italian antitrust fine | | — | | | — | | | 32 | | | 32 | | (a) |
| Overhead cost reduction initiative | | — | | | — | | | 10 | | | 8 | | (e) |
| Multi-employer pension plan exit liability | | — | | | — | | | 9 | | | 6 | | (a) |
| Gain on sale of previously closed Oregon mill site | | — | | | — | | | (9) | | | (7) | | (a) |
| Gain on sale of EMEA Packaging box plant | | — | | | — | | | (7) | | | (6) | | (a) |
| Other | | (1) | | | (1) | | (d) | — | | | — | | |
| Business Segments Total | | 368 | | | 358 | | | 224 | | | 211 | | |
| Corporate | | | | | | | | | |
| Debt extinguishment costs | | 131 | | | 98 | | | — | | | — | | |
| Asbestos litigation reserve adjustment | | 43 | | | 33 | | | — | | | — | | |
| Gain on sale of portion of investment in India | | (6) | | | (6) | | | — | | | — | | |
| India investment fair value adjustment | | 17 | | | 17 | | | — | | | — | | |
| Environmental remediation reserve adjustment | | 41 | | | 31 | | | 15 | | | 11 | | |
| Gain on sale of portion of equity investment in Graphic Packaging | | (33) | | | (25) | | | — | | | — | | |
| Litigation reserves | | — | | | — | | | 22 | | | 17 | | |
| Overhead cost reduction initiative | | — | | | — | | | 11 | | | 8 | | |
| Interest expense related to foreign tax audits | | — | | | — | | | 1 | | | 1 | | |
| Other | | — | | | (1) | | | — | | | — | | |
| Corporate Total | | 193 | | | 147 | | | 49 | | | 37 | | |
| Total net special items | | 561 | | | 505 | | | 273 | | | 248 | | |
| Non-operating pension expense (income) | | (31) | | | (23) | | | 27 | | | 21 | | |
| Total net special items and non-operating pension expense (income) | | $ | 530 | | | $ | 482 | | | $ | 300 | | | $ | 269 | | |
|
| | | | | | | | | | | | | | | | |
| | | Nine Months Ended |
| | | September 30, |
| | | 2019 | | 2018 |
| In millions | | Before Tax | | After Tax | | Before Tax | | After Tax |
| Business Segments | | | | | | | | |
| India impairment | | $ | 151 |
| | $ | 149 |
| | $ | — |
| | $ | — |
|
| Brazil Packaging impairment | | — |
| | — |
| | 122 |
| | 81 |
|
| Italian antitrust fine | | 32 |
| | 32 |
| | — |
| | — |
|
| Overhead cost reduction initiative | | 10 |
| | 8 |
| | — |
| | — |
|
| Multi-employer pension plan exit liability | | 9 |
| | 6 |
| | — |
| | — |
|
| Gain on sale of previously closed Oregon mill site | | (9 | ) | | (7 | ) | | — |
| | — |
|
| Gain on sale of EMEA Packaging box plant | | (7 | ) | | (6 | ) | | — |
| | — |
|
| EMEA Packaging optimization | | — |
| | — |
| | 48 |
| | 35 |
|
| Abandoned property removal | | 35 |
| | 26 |
| | 24 |
| | 18 |
|
| Riverdale mill conversion | | 3 |
| | 3 |
| | 5 |
| | 4 |
|
| Business Segments Total | | 224 |
| | 211 |
| | 199 |
| | 138 |
|
| Corporate | | | | | | | | |
| Litigation reserves | | 22 |
| | 17 |
| | — |
| | — |
|
| Environmental remediation reserve adjustment | | 15 |
| | 11 |
| | 9 |
| | 7 |
|
| Overhead cost reduction initiative | | 11 |
| | 8 |
| | — |
| | — |
|
| Smurfit-Kappa acquisition proposal costs | | — |
| | — |
| | 12 |
| | 9 |
|
| Interest expense related to settlement of foreign tax audits | | 1 |
| | 1 |
| | — |
| | — |
|
| Legal settlement | | — |
| | — |
| | 9 |
| | 7 |
|
| Corporate Total | | 49 |
| | 37 |
| | 30 |
| | 23 |
|
| Total special items | | 273 |
| | 248 |
| | 229 |
| | 161 |
|
| Non-operating pension expense | | 27 |
| | 21 |
| | 65 |
| | 49 |
|
| Total special items and non-operating pension expense | | $ | 300 |
| | $ | 269 |
| | $ | 294 |
| | $ | 210 |
|
Special(a) Recorded in the Industrial Packaging segment.
(b) Includes $9 million ($7 million after taxes) and $25 million ($19 million after taxes) for the nine months ended September 30, 2020 and September 30, 2019, respectively, recorded in the Industrial Packaging segment; $5 million ($4 million after taxes) and $8 million ($5 million after taxes) for the nine months ended September 30, 2020 and September 30, 2019, respectively, recorded in the Global Cellulose Fibers segment; and $2 million (before and after taxes) for the nine months ended September 30, 2019, recorded in the Printing Papers segment.
(c) Recorded in the Printing Papers segment.
(d) Includes income of $2 million (before and after taxes) recorded in the Printing Papers segment and charges of $1 million (before and after taxes) recorded in the Industrial Packaging segment.
(e) Includes charges of $4 million ($3 million after taxes) recorded in the Global Cellulose Fibers segment and charges of $6 million ($5 million after taxes) recorded in the Printing Papers segment.
Net special items include the following tax expenses (benefits):
| | | | | | | | | | | | | | |
| | Nine Months Ended |
| | September 30, |
| In millions | | 2020 | | 2019 |
| Luxembourg tax law rate change | | $ | — | | | $ | 9 | |
| State income tax legislative changes | | — | | | (3) | |
| Settlement of foreign tax audits | | — | | | 3 | |
| Total | | $ | — | | | $ | 9 | |
|
| | | | | | | | |
| | | Nine Months Ended |
| | | September 30, |
| In millions | | 2019 | | 2018 |
| Luxembourg tax law rate change | | $ | 9 |
| | $ | — |
|
| Tax benefits from Tax Cuts and Jobs Act | | — |
| | (36 | ) |
| State income tax legislative changes | | (3 | ) | | 9 |
|
| Settlement of foreign tax audits | | 3 |
| | — |
|
| Total | | $ | 9 |
| | $ | (27 | ) |
The following tables present net sales and
business segment operating profit (loss) which is the Company's measure of segment profitability.
The tables include a detail of special items in each year, where applicable, in order to show operating profit before special items. The Company calculates Operating Profit Before Special Items (non-GAAP) by excluding the pre-tax effect of items considered by management to be unusual from the earnings reported under U.S. generally accepted accounting principles (GAAP). Management uses this measure to focus on on-going operations, and believes that it is useful to investors because it enables them to perform meaningful comparisons of past and present operating results. International Paper believes that using this information, along with net earnings, provides for a more complete analysis of the results of operations by quarter. Net earnings attributable to International Paper is the most directly comparable GAAP measure. See Note 21 - Business Segment
Industrial Packaging
|
| | | | | | | | | | | | | | | | | | | | | | | |
| Total Industrial Packaging | 2019 | | 2018 |
| In millions | 3nd Quarter | | 2nd Quarter | | Nine Months | | 3rd Quarter | | 2nd Quarter | | Nine Months |
| Sales | $ | 3,820 |
| | $ | 3,864 |
| | $ | 11,516 |
| | $ | 4,034 |
| | $ | 4,022 |
| | $ | 11,883 |
|
| Operating Profit | $ | 510 |
| | $ | 507 |
| | $ | 1,421 |
| | $ | 472 |
| | $ | 537 |
| | $ | 1,446 |
|
| Italian antitrust fine | 32 |
| | — |
| | 32 |
| | — |
| | — |
| | — |
|
| Gain on sale of previously closed Oregon mill site | (9 | ) | | — |
| | (9 | ) | | — |
| | — |
| | — |
|
| Multi-employer pension plan exit liability | (7 | ) | | — |
| | 9 |
| | — |
| | — |
| | — |
|
| Gain on sale of EMEA Packaging box plant | — |
| | — |
| | (7 | ) | | — |
| | — |
| | — |
|
| Brazil Packaging impairment | — |
| | — |
| | — |
| | 122 |
| | — |
| | 122 |
|
| EMEA Packaging optimization | — |
| | — |
| | — |
| | — |
| | 26 |
| | 48 |
|
| Abandoned property removal | 9 |
| | 8 |
| | 25 |
| | 4 |
| | 6 |
| | 15 |
|
| Operating Profit Before Special Items | $ | 535 |
| | $ | 515 |
| | $ | 1,471 |
| | $ | 598 |
| | $ | 569 |
| | $ | 1,631 |
|
| | | | | | | | | | | | | | | | | | | | | | | | | | | | | | | | | | | |
| Total Industrial Packaging | 2020 | | 2019 |
| In millions | 3rd Quarter | | 2nd Quarter | | Nine Months | | 3rd Quarter | | 2nd Quarter | | Nine Months |
| Sales | $ | 3,768 | | | $ | 3,633 | | | $ | 11,220 | | | $ | 3,820 | | | $ | 3,864 | | | $ | 11,516 | |
| Operating Profit (Loss) | $ | 469 | | | $ | 449 | | | $ | 1,388 | | | $ | 535 | | | $ | 515 | | | $ | 1,471 | |
Industrial Packaging net sales for the third quarter of 20192020 were 1% lower than in4% higher compared with the second quarter of 20192020 and 5%1% lower than incompared with the third quarter of 2018.2019. Operating profit before special items was 4% higher in the third quarter of 2019 than in2020 compared with the second quarter of 20192020 and 11%12% lower than incompared with the third quarter of 2018.2019.
|
| | | | | | | | | | | | | | | | | | | | | | | |
| North American Industrial Packaging | 2019 | | 2018 |
| In millions | 3nd Quarter | | 2nd Quarter | | Nine Months | | 3rd Quarter | | 2nd Quarter | | Nine Months |
| Sales (a) | $ | 3,368 |
| | $ | 3,414 |
| | $ | 10,158 |
| | $ | 3,653 |
| | $ | 3,582 |
| | $ | 10,604 |
|
| Operating Profit | $ | 532 |
| | $ | 507 |
| | $ | 1,434 |
| | $ | 618 |
| | $ | 574 |
| | $ | 1,651 |
|
| Gain on sale of previously closed Oregon mill site | (9 | ) | | — |
| | (9 | ) | | — |
| | — |
| | — |
|
| Multi-employer pension plan exit liability | (7 | ) | | — |
| | 9 |
| | — |
| | — |
| | — |
|
| Abandoned property removal | 9 |
| | 8 |
| | 25 |
| | 4 |
| | 6 |
| | 15 |
|
| Operating Profit Before Special Items | $ | 525 |
| | $ | 515 |
| | $ | 1,459 |
| | $ | 622 |
| | $ | 580 |
| | $ | 1,666 |
|
| | | | | | | | | | | | | | | | | | | | | | | | | | | | | | | | | | | |
| North American Industrial Packaging | 2020 | | 2019 |
| In millions | 3rd Quarter | | 2nd Quarter | | Nine Months | | 3rd Quarter | | 2nd Quarter | | Nine Months |
| Sales (a) | $ | 3,351 | | | $ | 3,241 | | | $ | 9,947 | | | $ | 3,368 | | | $ | 3,414 | | | $ | 10,158 | |
| Operating Profit (Loss) | $ | 455 | | | $ | 434 | | | $ | 1,326 | | | $ | 525 | | | $ | 515 | | | $ | 1,459 | |
| |
(a) | Includes intra-segment sales of $25 million and $74 million for the three months ended September 30, 2019 and 2018, respectively; $31 million and $46 million for the three months ended June 30, 2019 and 2018, respectively; and $87 million and $178 million for the nine months ended September 30, 2019 and 2018, respectively. |
(a)Includes intra-segment sales of $31 million and $25 million for the three months ended September 30, 2020 and 2019, respectively; $31 million for each of the three months ended June 30, 2020 and 2019, respectively; and $94 million and $87 million for the nine months ended September 30, 2020 and 2019, respectively.
North American Industrial Packaging sales volumes in the third quarter of 20192020 increased compared to the second quarter of 2019,2020, reflecting seasonally higher shipments for boxes, and higherpartially offset by lower export containerboard volumesvolumes. The COVID-19 pandemic continues to have a mixed impact on box demand reflecting strong growth in the eCommerce segment as customer inventory levels beganonline shopping continues to returnbe a major spending channel for consumers amid COVID-19 pandemic concerns. The shipping and distribution and protein segments were also favorably impacted. Demand for produce, processed foods and beverage in addition to normal.non-essential items within the durable and non-durable segments were negatively impacted by COVID-19 restrictions and lower discretionary spending. Total maintenance and economic downtime was 249,000about 51,000 tons lower in the third quarter of 2019.2020 compared with the second quarter of 2020, primarily driven by lower economic downtime. Average sales margins were lower, driven bystable as lower average sales prices for boxes was offset by higher export containerboard prices and export containerboard.a favorable mix. Operating costs were seasonally higher, fordriven by multiple weather events impacting our mix system and seasonality in our box plants and our mills continued to perform well.plants. Planned maintenance downtime costs were $73$20 million lowerhigher in the third quarter of 20192020 compared with the second quarter of 2019.2020. Input costs were favorable,lower, primarily for recycledrecovered fiber and wood, partially offset by higher distributionenergy costs. Earnings in both the third quarter and the second quarter of 2020 benefited from insurance recoveries related to the Rome fire and Bogalusa recovery boiler event.
Compared with the third quarter of 2018,2019, sales volumes were higher in the third quarter of 2020 for both boxes and export containerboard. Total maintenance and economic downtime was about 173,000 tons lower in the third quarter of 2019 for export2020, primarily driven by lower economic downtime. Export containerboard and boxes. Totalbox prices were significantly lower reflecting prior index movements throughout 2019 and early 2020. Operating costs increased, driven by multiple weather events impacting our mill system and costs associated with the Riverdale conversion. Planned maintenance and economic downtime was 120,000 tonscosts were $13 million higher in the third quarter of 2019. Box prices were lower as were export containerboard prices resulting from weaker global demand. Manufacturing costs were stable, driven by strong operational performance at our mills offset by inflation. Planned maintenance downtime costs were $18 million lower in the third quarter of 20192020 compared with the third quarter of 2018.2019. Input costs were significantly lower driven by recycled fiber.lower wood, energy and distribution costs, partially offset by higher recovered fiber costs. Earnings in the third quarter of 2020 benefited from insurance recoveries related to the Rome fire and Bogalusa recovery boiler event.
Entering the fourth quarter of 2019,2020, sales volumes for boxes are expected to be seasonally higher.lower, driven by three fewer shipping days compared with the third quarter of 2020. Demand continues to be mixed reflecting continued strong demand for eCommerce, protein and shipping and distribution, offset by slower demand for fresh foods and durable and other non-durable goods. Export containerboard shipmentsvolumes are also expected to increase, as demand continues to improve.be modestly higher. Average sales margins for boxes and export containerboard are expected to be lower, reflecting the impact of prior price index movement, mix andslightly offset by higher export pressure.containerboard average sales margins. Operating costs are expected to be higher.improve without the cost of weather related events that occurred in the third quarter of 2020. Planned maintenance downtime costs shouldare expected to be $44$35 million lower in the fourth quarter of 2019 than in2020 compared with the third quarter of 2019.2020. Input costs are projectedexpected to be slightly favorable, with lower wood costs mostly offset by higher recycled fiber and energy costs.
primarily for energy.
|
| | | | | | | | | | | | | | | | | | | | | | | |
| EMEA Industrial Packaging | 2019 | | 2018 |
| In millions | 3nd Quarter | | 2nd Quarter | | Nine Months | | 3rd Quarter | | 2nd Quarter | | Nine Months |
| Sales | $ | 324 |
| | $ | 331 |
| | $ | 994 |
| | $ | 311 |
| | $ | 344 |
| | $ | 1,017 |
|
| Operating Profit | $ | (33 | ) | | $ | (7 | ) | | $ | (48 | ) | | $ | (37 | ) | | $ | (43 | ) | | $ | (114 | ) |
| Italian antitrust fine | 32 |
| | — |
| | 32 |
| | — |
| | — |
| | — |
|
| Gain on sale of EMEA Packaging box plant | — |
| | — |
| | (7 | ) | | — |
| | — |
| | — |
|
| EMEA Packaging optimization | — |
| | — |
| | — |
| | — |
| | 26 |
| | 48 |
|
| Operating Profit Before Special Items | $ | (1 | ) | | $ | (7 | ) | | $ | (23 | ) | | $ | (37 | ) | | $ | (17 | ) | | $ | (66 | ) |
| | | | | | | | | | | | | | | | | | | | | | | | | | | | | | | | | | | |
| EMEA Industrial Packaging | 2020 | | 2019 |
| In millions | 3rd Quarter | | 2nd Quarter | | Nine Months | | 3rd Quarter | | 2nd Quarter | | Nine Months |
| Sales | $ | 306 | | | $ | 297 | | | $ | 953 | | | $ | 324 | | | $ | 331 | | | $ | 994 | |
| Operating Profit (Loss) | $ | 3 | | | $ | 5 | | | $ | 18 | | | $ | (1) | | | $ | (7) | | | $ | (23) | |
EMEA Industrial Packaging sales volumes for boxes in the third quarter of 20192020 were lower than inhigher compared with the second quarter of 2019, primarily driven2020 as the impacts of the COVID-19 pandemic showed some recovery in all regions at the end of the third quarter, partially offset by seasonally lower seasonal box demandvolumes in Morocco. Average sales margins were stable in Europe and seasonally lower in Morocco and the economic conditions in Turkey. Average sales margins improved in all regions driven by lower containerboard prices and stable box prices. Operating costs improved, reflecting the continued improved performance at the Madrid mill. There were no plannedlower. Planned maintenance downtime costs were $3 million higher in either the third quarter of 2019 or2020 compared with the second quarter of 2019.2020 with an outage at our Madrid, Spain mill. Input costs were stable.lower. Earnings benefited from favorablewere negatively affected by unfavorable foreign currency impacts, primarily in Turkey.Morocco.
Compared with the third quarter of 2018,2019, sales volumes in the third quarter of 20192020 were slightly lower, primarily due to the recessionimpacts of the COVID-19 pandemic mostly offset by strong year over year recovery in Turkey. Average sales margins improved significantly, reflecting stable sales prices for boxes improved, reflecting sales price increases during 2018 and lower containerboard costs. Operating costs significantly improved from the ramp-up of the Madrid mill. Earnings also benefited from the box plant acquisitions completed in the first half of 2019. There were no plannedPlanned maintenance downtime costs were $3 million higher in the third quarter of 2018.2020 compared with the third quarter of 2019. Input costs were stable.lower. Earnings were positivelynegatively affected by favorableunfavorable foreign currency impacts primarily in Turkey.
Looking ahead to the fourth quarter of 2019,2020, sales volumes for boxes are expected to be seasonally higher, primarily in Morocco and Turkey, and stable in the Eurozone. Average sales margins should improve in Morocco and Turkey, partially offset by lower average sales margins in the Eurozone. Operating and input costs should be stable. There are no planned maintenance downtime costs in the fourth quarter of 2019.
|
| | | | | | | | | | | | | | | | | | | | | | | |
| Brazilian Industrial Packaging | 2019 | | 2018 |
| In millions | 3nd Quarter | | 2nd Quarter | | Nine Months | | 3rd Quarter | | 2nd Quarter | | Nine Months |
| Sales | $ | 61 |
| | $ | 58 |
| | $ | 176 |
| | $ | 57 |
| | $ | 56 |
| | $ | 175 |
|
| Operating Profit | $ | (6 | ) | | $ | (1 | ) | | $ | (12 | ) | | $ | (127 | ) | | $ | (11 | ) | | $ | (146 | ) |
| Brazil Packaging impairment | — |
| | — |
| | — |
| | 122 |
| | — |
| | 122 |
|
| Operating Profit Before Special Items | $ | (6 | ) | | $ | (1 | ) | | $ | (12 | ) | | $ | (5 | ) | | $ | (11 | ) | | $ | (24 | ) |
Brazilian Industrial Packaging sales volumes in the third quarter of 2019 compared with the second quarter of 2019 were higher for boxes and lower for containerboard. Average sales margins reflected higher sales prices for boxes and a favorable product mix, partially offset by lower containerboard prices. Planned maintenance downtime costs were $2 million higher in the third quarter of 2019 compared with the second quarter of 2019. Input costs were higher for rollstock, recycled fiber, chemicals and energy.
Compared with the third quarter of 2018, sales volumes in the third quarter of 2019 were higher for both boxes and containerboard. Average sales prices increased for boxes and containerboard. Operating costs were flat. Input costs increased, primarily for recycled fiber and energy. Planned maintenance downtime costs were $2 million higher in the third quarter of 2019 than in the third quarter of 2018.
Looking ahead to the fourth quarter of 2019, sales volumes for boxes and containerboard are expected to be seasonally lower.Morocco. Average sales margins are expected to be higher, reflecting a favorable mix.slightly higher. Operating costs are expected to be higher. Planned maintenance downtime costs shouldare expected to be $2$3 million lower in the fourth quarter of 2019 than in2020 compared with the third quarter of 2019.2020. Input costs are projectedexpected to be lowerhigher, primarily for recycled fiber.energy.
| | | European Coated Paperboard | 2019 | | 2018 | |
| Brazilian Industrial Packaging | | Brazilian Industrial Packaging | 2020 | | 2019 |
| In millions | 3nd Quarter | | 2nd Quarter | | Nine Months | | 3rd Quarter | | 2nd Quarter | | Nine Months | In millions | 3rd Quarter | | 2nd Quarter | | Nine Months | | 3rd Quarter | | 2nd Quarter | | Nine Months |
| Sales | $ | 92 |
| | $ | 92 |
| | $ | 275 |
| | $ | 87 |
| | $ | 86 |
| | $ | 265 |
| Sales | $ | 52 | | | $ | 42 | | | $ | 148 | | | $ | 61 | | | $ | 58 | | | $ | 176 | |
| Operating Profit | $ | 17 |
| | $ | 8 |
| | $ | 47 |
| | $ | 18 |
| | $ | 17 |
| | $ | 55 |
| |
| Operating Profit (Loss) | | Operating Profit (Loss) | $ | — | | | $ | (2) | | | $ | (3) | | | $ | (6) | | | $ | (1) | | | $ | (12) | |
On March 29, 2020 International Paper announced that it had entered into an agreement to sell its Brazilian Industrial Packaging business. The transaction closed October 14, 2020.
| | | | | | | | | | | | | | | | | | | | | | | | | | | | | | | | | | | |
| European Coated Paperboard | 2020 | | 2019 |
| In millions | 3rd Quarter | | 2nd Quarter | | Nine Months | | 3rd Quarter | | 2nd Quarter | | Nine Months |
| Sales | $ | 90 | | | $ | 84 | | | $ | 266 | | | $ | 92 | | | $ | 92 | | | $ | 275 | |
| Operating Profit (Loss) | $ | 11 | | | $ | 12 | | | $ | 47 | | | $ | 17 | | | $ | 8 | | | $ | 47 | |
European Coated Paperboard sales volumes in the third quarter of 20192020 compared with the second quarter of 2019 were flat in both Europe and Russia. Average sales margins improved in Europe driven by a favorable mix. In Russia, average sales margins were slightly lower. Operating costs2020 were higher in both Europe and Russia.Russia as the negative demand impact of the COVID-19 pandemic showed some improvement. Average sales margins were lower in both regions driven by an unfavorable mix. Operating costs were higher in Europe were negatively impacted by recovery boiler issuesand flat in Kwidzyn.Russia. Planned maintenance downtime costs were $8$3 million lowerhigher in the third quarter
of 20192020 compared with the second quarter of 2020. Input costs were higher in Europe primarily for energy and purchased pulp. In Russia, input costs were lower, driven by wood and chemicals. Earnings benefited from favorable foreign currency impacts in both regions.
Compared with the third quarter of 2019, sales volumes increased in Russia, but decreased in Europe reflecting the demand impact of the COVID-19 pandemic. Average sales margins were lower in both regions, reflecting lower prices and an unfavorable mix. Operating costs were higher in Europe and lower in Russia. Planned maintenance downtime costs were $7 million higher in the third quarter of 2020 compared with the third quarter of 2019. Input costs were favorablelower in Europe primarily for purchased pulp, energy and energy.wood. In Russia, input costs were stable. Earnings benefited from favorable foreign currency impacts primarily in Russia.
Compared with the third quarter of 2018, sales volumes increased in Europe but were slightly lower in Russia. Average sales margins were flat in Europe but improved in Russia, reflecting a favorable mix. Operating costs were higher in Europe, reflecting the recovery boiler issues in Kwidzyn. In Russia, operating costs were lower. There were no planned maintenance downtime costs in either the third quarter of 2019 or the third quarter of 2018. Input costs were lower in Europe for purchased pulp and energy, slightly offset by higher wood costs. In Russia, input costs were higher for chemicals and energy, offset by lower wood costs. Earnings were negatively affected by unfavorable foreign currency impacts in both Europe and Russia.regions.
Entering the fourth quarter of 2019,2020, sales volumes are expected to be higherlower in Russia but lowerand stable in Europe. Average sales margins are expected to increasebe stable in both regions.Europe and higher in Russia. Operating costs are expected to be lowerhigher in Europe, as the third quarter was negatively impacted by the recovery boiler issues in Kwidzyn. In Russia, operatingboth regions. Planned maintenance downtime costs are expected to be higher. There are no planned maintenance downtime outages$7 million lower in the fourth quarter of 2019.2020 compared with the third quarter of 2020. Input costs are expected to be lower in Europe, primarily for purchased pulp and wood, and stable in Russia.both regions.
Global Cellulose Fibers
|
| | | | | | | | | | | | | | | | | | | | | | | |
| Total Global Cellulose Fibers | 2019 | | 2018 |
| In millions | 3nd Quarter | | 2nd Quarter | | Nine Months | | 3rd Quarter | | 2nd Quarter | | Nine Months |
| Sales | $ | 624 |
| | $ | 661 |
| | $ | 1,974 |
| | $ | 714 |
| | $ | 692 |
| | $ | 2,083 |
|
| Operating Profit | $ | (3 | ) | | $ | (2 | ) | | $ | 27 |
| | $ | 83 |
| | $ | 66 |
| | $ | 160 |
|
| Overhead cost reduction initiative | 4 |
| | — |
| | 4 |
| | — |
| | — |
| | — |
|
| Abandoned property removal | 3 |
| | 2 |
| | 8 |
| | 2 |
| | 3 |
| | 9 |
|
| Operating Profit Before Special Items | $ | 4 |
| | $ | — |
| | $ | 39 |
| | $ | 85 |
| | $ | 69 |
| | $ | 169 |
|
| | | | | | | | | | | | | | | | | | | | | | | | | | | | | | | | | | | |
| Total Global Cellulose Fibers | 2020 | | 2019 |
| In millions | 3rd Quarter | | 2nd Quarter | | Nine Months | | 3rd Quarter | | 2nd Quarter | | Nine Months |
| Sales | $ | 564 | | | $ | 605 | | | $ | 1,737 | | | $ | 624 | | | $ | 661 | | | $ | 1,974 | |
| Operating Profit (Loss) | $ | (59) | | | $ | (10) | | | $ | (123) | | | $ | 4 | | | $ | — | | | $ | 39 | |
Global Cellulose Fibers net sales were 6%7% lower in the third quarter of 20192020 than in the second quarter of 20192020 and 13%10% lower than in the third quarter of 2018.2019. Operating profit before special items in the third quarter of 20192020 was slightly higher thansignificantly lower compared to the second quarter of 20192020 and 95% lower than in the third quarter of 2018.2019.
Sales volumes in the third quarter of 20192020 compared with the second quarter of 20192020 were higher for fluff pulp,seasonally lower and reflect slower COVID-19 pandemic-related consumer demand. Weakened demand in the paper segment was partially offset by lower market pulp volumes.increased consumer demand for absorbent hygiene and tissue and towel products. Total maintenance and economic downtime was 11,000about 96,000 tons higher in the third quarter of 2019.2020 compared with the second quarter of 2020 primarily due to higher maintenance downtime. Average sales margins decreased,improved, reflecting lower average pulp prices driven by unfavorable supply/demand conditions associated with historically high industry inventory levels, trade and tariff uncertainty and regional economic conditions.flow through of previous sales price increases. Operating costs were favorable as our mills improved reliabilitylower driven by seasonality and reduced spending to overcome the impact of Hurricane Dorian.one-time items. Planned maintenance downtime costs in the third quarter of 20192020 were $51$43 million lower than inhigher compared with the second quarter of 2019. Earnings benefited $5 million in the third quarter of 2019 and $10 million in the second quarter of 2019 from insurance proceeds related to Hurricane Florence.2020. Input costs were favorable,higher, primarily for wood, energy and chemicals. Sales volumes were higher in Russia, but lower in Europe. Average sales prices were lower in both regions. Planned maintenance downtime costs in the third quarter of 2019 were $4 million lower than in the second quarter of 2019 in Europe and Russia. Operating costs were unfavorable in Europe and flat in Russia. Input costs were stable in both Europe and Russia.
Compared with the third quarter of 2018,2019, sales volumes in the third quarter of 20192020 were slightly higher.lower for both fluff and market pulp driven by slowing demand reflecting customer destocking related to the COVID-19 pandemic. Total maintenance and economic downtime was 56,000about 13,000 tons higher in the third quarter of 2019.2020, primarily due to higher maintenance downtime. Average sales prices were significantly lower for both fluff and market pulp. Operating costs were favorable.favorable reflecting one-time benefits in the third quarter of 2020 and the negative impacts of Hurricane Dorian in the third quarter of 2019. Planned maintenance downtime costs in the third quarter of 20192020 were $10$32 million higher compared with the third quarter of 2019. Input costs were stable.
Entering the fourth quarter of 2020, sales volumes are expected to be stable. Average sales margins are expected to be lower. Planned maintenance downtime costs in the fourth quarter of 2020 are expected to be $4 million higher compared with the third quarter of 2020. Operating costs are expected to be seasonally higher. Operating costs will be negatively affected by the non-repeat of one-time benefits in the third quarter of 2020. Input costs are expected to be higher primarily for wood, chemicals and energy.
Printing Papers
| | | | | | | | | | | | | | | | | | | | | | | | | | | | | | | | | | | |
| Total Printing Papers | 2020 | | 2019 |
| In millions | 3rd Quarter | | 2nd Quarter | | Nine Months | | 3rd Quarter | | 2nd Quarter | | Nine Months |
| Sales | $ | 743 | | | $ | 583 | | | $ | 2,234 | | | $ | 1,071 | | | $ | 1,088 | | | $ | 3,224 | |
| Operating Profit (Loss) | $ | 63 | | | $ | (11) | | | $ | 148 | | | $ | 162 | | | $ | 114 | | | $ | 420 | |
Printing Papers net sales for the third quarter of 2020 were 27% higher than in the second quarter of 2020 and 31% lower than in the third quarter of 2018.2019. Operating profit in the third quarter of 2020 was significantly higher compared with the second quarter of 2020 and significantly lower compared with the third quarter of 2019.
| | | | | | | | | | | | | | | | | | | | | | | | | | | | | | | | | | | |
| North American Papers | 2020 | | 2019 |
| In millions | 3rd Quarter | | 2nd Quarter | | Nine Months | | 3rd Quarter | | 2nd Quarter | | Nine Months |
| Sales | $ | 362 | | | $ | 265 | | | $ | 1,073 | | | $ | 492 | | | $ | 486 | | | $ | 1,474 | |
| Operating Profit (Loss) | $ | 31 | | | $ | (23) | | | $ | 31 | | | $ | 76 | | | $ | 41 | | | $ | 174 | |
North American Papers sales volumes in the third quarter of 2020 were higher compared with the second quarter of 2020 across all grades for uncoated freesheet paper reflecting signs of recovery from the unprecedented demand decline due to the COVID-19 pandemic. Total maintenance and economic downtime was about 128,000 tons lower in the third quarter of 2020 compared with the second quarter of 2020 primarily due to economic downtime. Average sales margins were stable. Operating costs were flat. Planned maintenance downtime costs were $1 million higher in the third quarter of 2020, compared with the second quarter of 2020. Input costs were slightly favorable. Salesflat.
Compared with the third quarter of 2019, sales volumes increased,in the third quarter of 2020 were significantly lower across all grades for uncoated freesheet paper driven by the demand impact of the COVID-19 pandemic. Total maintenance and economic
downtime was about 48,000 tons higher in the third quarter of 2020 compared with the third quarter of 2019 primarily in Russia.due to economic downtime associated with the COVID-19 pandemic. Average sales margins were lower, reflecting lower average sales prices. Operating costs were unfavorable in Europe and favorable in Russia. There were no plannedstable. Planned maintenance downtime costs were $3 million lower in either the third quarter of 2019 or2020 compared with the third quarter of 2018 in Europe and Russia.2019. Input costs were flat in both Europefavorable, primarily for wood, energy and Russia. Earnings benefited from favorable foreign currency impacts in Europe, slight offset by unfavorable impacts in Russia.chemicals.
Entering the fourth quarter of 2019,2020, sales volumes are expected to be flat.slightly higher driven by export sales. Average sales margins are expected to be lower, reflecting the continuing effects of historically high industry inventory levels, slower growth in developing markets, tariff uncertainty, regional economic conditions andstable. Operating costs are expected increases in operating costs.to be seasonally higher. Planned maintenance downtime costs are expected to be slightly lower in the fourth quarter of 2019 should be $8 million lower than in the third quarter of 2019.2020. Input costs are expected to be slightly higher. In Europe and Russia, sales volumes are expected to be stable in Europe and lower in Russia. Average sales margins are expected to be lower in both regions. Operating costs are expected to be stable in Europe and higher, in Russia. Planned maintenance downtime costs in the fourth quarter of 2019 should be $7 million higher than in the third quarter of 2019 in Europe and Russia.
Printing Papers
|
| | | | | | | | | | | | | | | | | | | | | | | |
| Total Printing Papers | 2019 | | 2018 |
| In millions | 3nd Quarter | | 2nd Quarter | | Nine Months | | 3rd Quarter | | 2nd Quarter | | Nine Months |
| Sales | $ | 1,071 |
| | $ | 1,088 |
| | $ | 3,224 |
| | $ | 1,102 |
| | $ | 1,060 |
| | $ | 3,215 |
|
| Operating Profit | $ | 148 |
| | $ | (33 | ) | | $ | 258 |
| | $ | 183 |
| | $ | 94 |
| | $ | 341 |
|
| India impairment | 6 |
| | 145 |
| | 151 |
| | — |
| | — |
| | — |
|
| Abandoned property removal | 1 |
| | 1 |
| | 2 |
| | — |
| | — |
| | — |
|
| Overhead cost reduction initiative | 6 |
| | — |
| | 6 |
| | — |
| | — |
| | — |
|
| Riverdale mill conversion | 1 |
| | 1 |
| | 3 |
| | 5 |
| | — |
| | 5 |
|
| Operating Profit Before Special Items | $ | 162 |
| | $ | 114 |
| | $ | 420 |
| | $ | 188 |
| | $ | 94 |
| | $ | 346 |
|
Printing Papers net sales for the third quarter of 2019 were 2% lower than in the second quarter of 2019 and 3% lower than in the third quarter of 2018. Operating profit before special items in the third quarter of 2019 was 42% higher than in the second quarter of 2019 and 14% lower than in the third quarter of 2018.
|
| | | | | | | | | | | | | | | | | | | | | | | |
| North American Papers | 2019 | | 2018 |
| In millions | 3nd Quarter | | 2nd Quarter | | Nine Months | | 3rd Quarter | | 2nd Quarter | | Nine Months |
| Sales | $ | 492 |
| | $ | 486 |
| | $ | 1,474 |
| | $ | 492 |
| | $ | 493 |
| | $ | 1,443 |
|
| Operating Profit | $ | 69 |
| | $ | 39 |
| | $ | 164 |
| | $ | 59 |
| | $ | 25 |
| | $ | 85 |
|
| Abandoned property removal | 1 |
| | 1 |
| | 2 |
| | — |
| | — |
| | — |
|
| Overhead cost reduction initiative | 5 |
| | — |
| | 5 |
| | — |
| | — |
| | — |
|
| Riverdale mill conversion | 1 |
| | 1 |
| | 3 |
| | 5 |
| | — |
| | 5 |
|
| Operating Profit Before Special Items | $ | 76 |
| | $ | 41 |
| | $ | 174 |
| | $ | 64 |
| | $ | 25 |
| | $ | 90 |
|
North American Papers sales volumes in the third quarter of 2019 were higher than in the second quarter of 2019 for uncoated freesheet paper, primarily driven by increased export volume. Total maintenance and economic downtime was 8,000 tons higher in the third quarter of 2019. Average sales margins were unfavorable, reflecting an unfavorable geographic mix. Operating costs were lower. Planned maintenance downtime costs were $19 million lower in the third quarter of 2019, compared with the second quarter of 2019. Input costs were lower, primarily for wood.
Compared with the third quarter of 2018, sales volumes in the third quarter of 2019 were lower for uncoated freesheet paper, primarily driven by weaker demand for commercial printing paper. Total maintenanceenergy and economic downtime was 39,000 tons higher in the third quarter of 2019. Average sales prices were higher, reflecting the impact of price increases in 2018. Operating costs were favorable. Planned maintenance downtime costs were $11 million higher than in the third quarter of 2018. Input costs increased, primarily for wood.
Entering the fourth quarter of 2019, sales volumes are expected to be higher, driven by increased export volumes, partially offset by lower cutsize volumes. Average sales margins are expected to be lower. Operating costs are expected to be higher. Planned maintenance downtime costs should be $7 million lower in the fourth quarter. Input costs are expected to be favorable, primarily for wood. | | | | | | | | | | | | | | | | | | | | | | | | | | | | | | | | | | | |
| European Papers | 2020 | | 2019 |
| In millions | 3rd Quarter | | 2nd Quarter | | Nine Months | | 3rd Quarter | | 2nd Quarter | | Nine Months |
| Sales | $ | 232 | | | $ | 209 | | | $ | 728 | | | $ | 299 | | | $ | 321 | | | $ | 929 | |
| Operating Profit (Loss) | $ | 17 | | | $ | 13 | | | $ | 71 | | | $ | 41 | | | $ | 29 | | | $ | 117 | |
|
| | | | | | | | | | | | | | | | | | | | | | | |
| European Papers | 2019 | | 2018 |
| In millions | 3nd Quarter | | 2nd Quarter | | Nine Months | | 3rd Quarter | | 2nd Quarter | | Nine Months |
| Sales | $ | 299 |
| | $ | 321 |
| | $ | 929 |
| | $ | 311 |
| | $ | 302 |
| | $ | 932 |
|
| Operating Profit | $ | 40 |
| | $ | 29 |
| | $ | 116 |
| | $ | 46 |
| | $ | 15 |
| | $ | 82 |
|
| Overhead cost reduction initiative | 1 |
| | — |
| | 1 |
| | — |
| | — |
| | — |
|
| Operating Profit Before Special Items | $ | 41 |
| | $ | 29 |
| | $ | 117 |
| | $ | 46 |
| | $ | 15 |
| | $ | 82 |
|
European Papers sales volumes for uncoated freesheet paper in the third quarter of 20192020 compared with the second quarter of 20192020 were stable in Europe and higher in Russia but continue to be impacted by the unprecedented demand decline due to the COVID-19 pandemic. Economic downtime due to the COVID-19 pandemic demand impact was lower in Europe, but higher in Russia. In Europe, the recovery boiler issues at Kwidzyn negatively impacted volumes.third quarter of 2020 compared to the second quarter of 2020. Average sales margins for uncoated freesheet paper decreased in Europe and Russia,both regions, reflecting lower average sales prices resulting from weaker demand and an unfavorable mix.mix in Russia. Operating costs were higherlower in Europe, reflecting the impact of the recovery boiler issues at Kwidzyn. Operating costs were flatbut higher in Russia. Planned maintenance downtime costs were $20$8 million lowerhigher in the third quarter of 20192020 compared to the second quarter of 2019.2020. Input costs were stablelower in both regions.regions, primarily for wood and chemicals. Earnings benefited from favorable foreign currency impacts in Russia, partially offset by unfavorable foreign currency impacts in Europe.
Sales volumes for uncoated freesheet paper in the third quarter of 2019,2020, compared with the third quarter of 2018,2019, were lower in Europe partiallyand Russia reflecting the negative demand impact of the COVID-19 pandemic. Earnings in both regions were negatively impacted by economic downtime in the third quarter of 2020 due to the impact of the recovery boiler issues at Kwidzyn. In Russia, sales volumes were higher.COVID-19 demand impact. Average sales margins for uncoated freesheet paper increasedwere lower in both regions reflecting price increases implemented in late 2018lower average sales prices and in 2019, net of an unfavorable mix. Operating costs were higherlower in both Europe and slightly lower in Russia. There were no plannedRussia reflecting strong cost management. Planned maintenance downtime costs were $16 million higher in either the third quarter of 2019 or2020 compared with the third quarter of 2018.2019. In Europe, input costs were higherlower, primarily for wood, energy and chemicals, partially offset by lower energy costs.chemicals. In Russia, input costs also increased, primarily for chemicals and energy, partially offset by lower wood costs.were flat. Earnings were negatively affected by unfavorable foreign currency impacts in both Europe, andmostly offset by favorable foreign currency impacts in Russia.
Looking forward to the fourth quarter of 2019,2020, sales volumes for uncoated freesheet paper are expected to be higherimprove in both Europe and Russia. In Europe, averageregions. Average sales margins are expected to be lower. In Russia, average sales margins will be negatively impacted by an unfavorable mix.stable in both regions. Operating costs shouldare expected to be higher in both Europe and Russia. Planned maintenance downtime costs shouldare expected to be $8$14 million higherlower in the fourth quarter.quarter of 2020 compared with the third quarter of 2020. Input costs are expected to be stablehigher in Europeboth regions, primarily for energy, wood and Russia.chemicals.
| | | Brazilian Papers | 2019 | | 2018 | Brazilian Papers | 2020 | | 2019 |
| In millions | 3nd Quarter | | 2nd Quarter | | Nine Months | | 3rd Quarter | | 2nd Quarter | | Nine Months | In millions | 3rd Quarter | | 2nd Quarter | | Nine Months | | 3rd Quarter | | 2nd Quarter | | Nine Months |
| Sales (a) | $ | 247 |
| | $ | 240 |
| | $ | 702 |
| | $ | 255 |
| | $ | 222 |
| | $ | 706 |
| Sales (a) | $ | 150 | | | $ | 108 | | | $ | 434 | | | $ | 247 | | | $ | 240 | | | $ | 702 | |
| Operating Profit | $ | 44 |
| | $ | 37 |
| | $ | 114 |
| | $ | 75 |
| | $ | 49 |
| | $ | 164 |
| |
| Operating Profit (Loss) | | Operating Profit (Loss) | $ | 15 | | | $ | (1) | | | $ | 46 | | | $ | 44 | | | $ | 37 | | | $ | 114 | |
| |
(a) | Includes intra-segment sales of $5 million and $3 million for the three months ended September 30, 2019 and 2018, respectively; $12 million and $8 million for the three months ended June 30, 2019 and 2018, respectively; and $25 million and $16 million for the nine months ended September 30, 2019 and 2018, respectively. |
(a)Includes intra-segment sales of $1 million and $5 million for the three months ended September 30, 2020 and 2019, respectively; $(1) million and $12 million for the three months ended June 30, 2020 and 2019, respectively; and $1 million and $25 million for the nine months ended September 30, 2020 and 2019, respectively.
Brazilian Papers sales volumes in the third quarter of 2019,2020, compared with the second quarter of 2019,2020, were seasonally higher for both domestic and export shipments of uncoated freesheet partially offsetpaper reflecting some improvement from the unprecedented decline in demand due to the COVID-19 pandemic. Economic downtime due to the demand impact of the COVID-19 pandemic was lower in the third quarter of 2020 compared with the second quarter of 2020. Average sales margins were lower driven by lower export volumes. Export average sales prices were lower for both Latin American and other export locations, reflecting higher supply availability in Latin America and softer demand conditions, while domestic average sales prices were stable.an unfavorable geographic mix. Operating costs were favorable.stable. Planned maintenance outage downtime costs were $3$1 million higherlower in the third quarter of 2019,2020 compared with the second quarter of 2019.2020. Input costs were flat.
Compared with the third quarter of 2018,2019, sales volumes for uncoated freesheet paper in the third quarter of 20192020 were slightly higher forlower in both export but lower forand domestic markets reflecting the domestic shipments, reflecting challenging demand conditionsimpact of the COVID-19 pandemic. Earnings were negatively impacted by a government textbook program delay. Lower exporteconomic downtime due to the demand impact of the COVID-19 pandemic. Average sales margins were lower reflecting lower average sales prices and an unfavorable geographic and product mix were slightly offset by higher average domestic prices.mix. Operating costs were unfavorable.lower. Planned maintenance
outage expenses were $3$1 million higherlower in the third quarter of 2020 compared with the third quarter of 2019. Input costs were higher,lower, primarily for woodvirgin fiber and energy.pulp.
Entering the fourth quarter of 2019,2020, sales volumes for uncoated freesheet paper are expected to be seasonally stronger domestically, partially offset by lowerimprove for both domestic and export volumes.shipments as demand continues to recover from COVID-19 negative demand impacts. Average sales margins are expected to be stable domestically, while export sales marginshigher driven by a favorable geographic mix. Operating costs are expected to be lower. Operating costs should be slightly favorable.stable. Planned maintenance outage expenses are expected to be $1 million lower in the fourth quarter.quarter of 2020 compared with the third quarter of 2020. Input costs are expected to be favorable.higher.
| | | Indian Papers | 2019 | | 2018 | Indian Papers | 2020 | | 2019 |
| In millions | 3nd Quarter | | 2nd Quarter | | Nine Months | | 3rd Quarter | | 2nd Quarter | | Nine Months | In millions | 3rd Quarter | | 2nd Quarter | | Nine Months | | 3rd Quarter | | 2nd Quarter | | Nine Months |
| Sales | $ | 38 |
| | $ | 53 |
| | $ | 144 |
| | $ | 47 |
| | $ | 51 |
| | $ | 150 |
| Sales | $ | — | | | $ | — | | | $ | — | | | $ | 38 | | | $ | 53 | | | $ | 144 | |
| Operating Profit | $ | (5 | ) | | $ | (138 | ) | | $ | (136 | ) | | $ | 3 |
| | $ | 5 |
| | $ | 10 |
| |
| India Impairment | 6 |
| | 145 |
| | 151 |
| | — |
| | — |
| | — |
| |
| Operating Profit Before Special Items | $ | 1 |
| | $ | 7 |
| | $ | 15 |
| | $ | 3 |
| | $ | 5 |
| | $ | 10 |
| |
| Operating Profit (Loss) | | Operating Profit (Loss) | $ | — | | | $ | — | | | $ | — | | | $ | 1 | | | $ | 7 | | | $ | 15 | |
On May 29, 2019, International Paper announced it had entered into an agreement to sell its controlling interest in its Indian Papers business. The transaction closed on October 30, 2019.
Equity Earnings, Net of Taxes – Ilim
International Paper accounts for its 50% equity interest in Ilim S.A. (Ilim) using the equity method of accounting. Ilim is a separate reportable industry segment whose primary operations are in Russia. The Company recorded equity earnings (loss), net of taxes, of $(33) million in the third quarter of 2020, compared with $63 million in the second quarter of 2020 and $18 million in the third quarter of 2019, compared with $67 million in the second quarter of 2019 and $74 million in the third quarter of 2018.2019. In the third quarter of 2019,2020, the after-tax foreign exchange impact primarily on the remeasurement of U.S. dollar-denominated net debt was a loss of $4$55 million, compared with a gain of $7$34 million in the second quarter of 2019.2020.
Compared with the second quarter of 2020, sales volumes in the third quarter of 2020 were 3% higher overall, primarily for sales of softwood and hardwood pulp in China, partially offset by lower sales of hardwood pulp and containerboard in Russia and lower sales of softwood pulp in other export markets. Average sales price realizations decreased for softwood pulp and hardwood pulp in China, Russia and other export markets. Average sales price realizations for containerboard increased in all regions. Input costs were relatively flat. Repair and outage costs were higher due to scheduled maintenance outages at the Koryzhama and Bratsk mills in the third quarter.
Compared with the third quarter of 2019, sales volumes in the third quarter of 2019 were 9% lower,2020 increased overall by 20%, primarily forfrom increased sales of hardwood pulp and containerboard in China, and softwood pulp in Russian and other export locations. Average sales price
realizations were lower for softwood pulp, hardwood pulp and containerboard in China, Russia and other export locations. Input costs for wood and fuel, were relatively flat. Outage and repair costs were $10 million higher than in the second quarter of 2019 due to the planned maintenance mill outages at the Bratsk and Ust-Ilimsk mills.
Compared with the third quarter of 2018, sales volumes in the third quarter of 2019 decreased overallmarkets, partially offset by 7%, primarily due tolower sales of containerboardhardwood pulp in China and Russia and softwood pulp and hardwood pulp in Russian and other export locations. Average sales prices for softwood pulp, hardwood pulp andRussia. Sales of containerboard in China and other export locationsmarkets improved. Average sales price realizations for softwood pulp and hardwood pulp were lower in all regions. Average sales price realizations for containerboard were slightly higher in China, but lower in Russia were lower.and other export markets. Input costs, primarily for wood and chemicals, were higher.increased. Distribution costs were also higher. An after-tax foreign exchange loss of $23$4 million primarily on the remeasurement of U.S. dollar denominated net debt was recorded in the third quarter of 2018.2019.
Looking forward to the fourth quarter of 2019,2020, sales volumes are expected to be higher followinghigher. Based on pricing to date in the start-up of the newly upgraded containerboard machine at the Bratsk mill and the recently modernized pulp line at the Ust-Ilimsk mill. Averagecurrent quarter, average sales marginsprice realizations are projected to decreaseincrease primarily for softwood pulp and containerboard compared with the third quarter of 2019, primarily due to hardwood pulp in China.2020. Input costs for wood and fuel are expected to decrease. Mill maintenance outagebe seasonally higher. Distribution costs will be lower as there are no outages scheduled in the fourth quarter of 2019.projected to increase.
Equity Earnings – GPIP
International Paper recorded equity earnings of $11 million in the third quarter of 2020, compared with $11 million in the second quarter of 2020 and $10 million in the third quarter of 2019, compared with $14 million in the second quarter of 2019 and $19 million in the third quarter of 2018.2019. As of September 30, 2019,2020, the Company's ownership interest in GPIP was 21.6%14.8%.
Cash provided by operations totaled $2.7$2.3 billion for the first nine months of 2019,2020, compared with $2.4$2.7 billion for the comparable 2018nine-month period. Cash provided by working capital components totaled $176 million for the first nine months of 2019, compared to cash used by working capital components of $249 million for the comparable 2018 nine-month period.
Investments in capital projects, net of insurance recoveries, totaled $913$657 million in the first nine months of 2019,2020, compared to $1.3 billion$913 million in the first nine months of 2018.2019. Full-year 20192020 capital spending is currently expected to be approximately $1.3 billion, or about 99%$800 million, which represents a reduction of approximately $200 million from our initial plan. This represents 62% of depreciation and amortization, including approximately $400$290 million of strategic investments.
Financing activities for the first nine months of 20192020 included a $1.1 billion net decrease in debt versus a $391 million net decrease in debt versus a $107 million net increase in debt during the comparable 20182019 nine-month period.
Amounts related to early debt extinguishment during the three and nine months ended September 30, 20192020 and 20182019 were as follows: | | | | Three Months Ended September 30, | | Nine Months Ended September 30, | | | Three Months Ended September 30, | Nine Months Ended September 30, |
| In millions | 2019 | | 2018 | | 2019 | | 2018 | In millions | | 2020 | | 2019 | 2020 | | 2019 |
| Early debt reductions (a) | $ | 77 |
| | $ | 75 |
| | $ | 245 |
| | $ | 79 |
| Early debt reductions (a) | | $ | 903 | | | $ | 77 | | $ | 1,190 | | | $ | 245 | |
| Pre-tax early debt extinguishment (gain) loss, net | 2 |
| | 1 |
| | (1 | ) | | 1 |
| Pre-tax early debt extinguishment (gain) loss, net | | 105 | | | 2 | | 131 | | | (1) | |
| |
(a) | Reductions related to notes with interest rates ranging from 3.00% to 4.40% with original maturities from 2027 to 2047 and from 3.00% to 7.00% with original maturities from 2022 to 2032 for the three months ended September 30, 2019 and 2018, respectively, and from 3.00% to 9.50% with original maturities from 2024 to 2048 and from 3.00% to 7.00% with original maturities from 2022 to 2032 for the nine months ended September 30, 2019 and 2018, respectively. |
(a)Reductions related to notes with interest rates ranging from 3.00% to 7.50% with original maturities from 2021 to 2027 and from 3.00% to 4.40% with original maturities from 2027 to 2047 for the three months ended September 30, 2020 and 2019, respectively, and from 3.00% to 7.50% with original maturities from 2021 to 2048 and from 3.00% to 9.50% with original maturities from 2024 to 2048 for the nine months ended September 30, 2020 and 2019, respectively.
Maintaining an investment-grade credit rating is an important element of International Paper’s financing strategy. At September 30, 2019,2020, the Company held long-term credit ratings of BBB (stable outlook) and Baa2 (stable outlook) by S&P and Moody’s, respectively. In addition, the Company held short-term credit ratings of A2 and P2 by S&P and Moody's, respectively, for borrowings under the Company's commercial paper program.
At September 30, 2019,2020, International Paper’s credit agreements totaled $2.1$2.8 billion, which managementis comprised of the $750 million contractually committed revolving credit agreement, the $1.5 billion contractually committed bank credit agreement, and up to $550 million under the receivables securitization program. Management believes these credit agreements are adequate to cover expected operating cash flow variability during the current economic cycle. The credit agreements generally provide for interest rates at a floating rate index plus a pre-determined margin dependent upon International Paper’s credit rating. The liquidity facilities include aAt September 30, 2020, the Company had no borrowings outstanding under the $750 million revolving credit agreement, the $1.5 billion contractually committed bank credit agreement, that expiresor the $550 million receivables securitization program. The Company’s credit agreements are not subject to any restrictive covenants other than the financial covenants as disclosed in December 2021Note 17 - Debt of the Condensed Notes to the Consolidated Financial Statements, and has a facility fee of 0.15% per annum payable quarterly. The liquidity facilities also include up to $600 million of uncommitted financings based on eligible receivable balancesthe borrowings under athe receivables securitization program that expiresbeing limited by eligible receivables. The Company was in December 2019. At
compliance with all its debt covenants at September 30, 2019, there were no outstanding2020 and was well below the thresholds stipulated under the covenants as defined in the credit agreements. Further the financial covenants do not restrict any borrowings under the credit facility nor under the receivables securitization program.agreements.
In June 2018,addition to the $2.8 billion in credit agreements, International Paper has a commercial paper program with a borrowing capacity of the commercial paper program was increased from $750 million to $1.0 billion. Under the terms of the program, individual maturities on borrowings may vary, but not exceed one year from the date of issue. Interest bearing notes may be issued either as fixed notes or floating rate notes. As of September 30, 2019,2020, the Company had $245$140 million of borrowings outstanding under thisthe program at a weighted average interest rate of 2.29%0.17%.
During the first nine months of 2019, International Paper used 3.4 million shares of treasury stock for various incentive plans. International Paper also acquired 11.9 million shares of treasury stock, including restricted stock tax withholdings. Repurchases of common stock and payments of restricted stock withholding taxes totaled $535 million, including $486 million related to shares repurchased under the Company's repurchase program. On October 9, 2018, the Company announced an authorization to repurchase $2 billion of the Company's common stock to supplement remaining amounts under prior share repurchase authorizations, bringing total share repurchase authorizations since 2013 to $5.0 billion. The Company will continue to repurchase such shares in open market repurchase transactions. Under the $5.0 billion share repurchase program, the Company has repurchased 68.9 million shares at an average price of $47.23, for a total of approximately $3.3 billion, as of September 30, 2019.
During the first nine months of 2018, International Paper used approximately 1.7 million shares of treasury stock for various incentive plans. International Paper also acquired 9.6 million shares of treasury stock, including restricted stock tax withholding. Repurchases of common stock and payments of restricted stock withholding taxes totaled $532 million. Cash dividend payments related to common stock totaled $595 million and $588 million for the first nine months of 2019 and 2018, respectively. Dividends were $1.50 per share and $1.42 per share for the first nine months in 2019 and 2018, respectively.
International Paper expects to be able to meet projected capital expenditures, service existing debt and meet working capital and dividend requirements duringfor the remainder of 2019next 12 months with current cash balances and cash from operations, supplemented as required by its existing credit facilities. The Company will continue to rely on debt and capital markets for the majority of any necessary long-term funding not provided by operating cash flows. Funding decisions will be guided by our capital structure planning objectives. The primary goals of the Company’s capital structure planning are to maximize financial flexibility and preservemaintain appropriate levels of liquidity to meet our needs while reducingmanaging balance sheet debt and interest expense. The majority of International Paper’s debt is accessed through global public capital markets where we have a wide base of investors. The COVID-19 pandemic has negatively impacted the global economy and created significant volatility and disruption of capital and financial markets. As a result of the current economic environment, management has taken various actions to further strengthen the Company’s liquidity position. In addition to the Company entering into a $750 million revolving credit agreement and the Company amending the receivable securitization program from uncommitted to committed financing, the Company is also on track to reduce capital expenditures by approximately $200 million from the initial 2020 plan, has indefinitely suspended the Company’s share repurchase program beginning April 2020, and has been deferring the payment of our payroll taxes as allowed under CARES Act. The CARES Act allows for the deferral of the payment of the employer portion of Social Security taxes accrued between March 27, 2020, and December 31, 2020. Under the CARES Act 50% of the deferred
payroll taxes will be paid by December 31, 2021 and the remainder will be paid by December 31, 2022. We believe that these actions provide us with sufficient liquidity to operate in this uncertain environment; however, an extended period of economic disruption could impact our access to additional sources of liquidity.
During the first nine months of 2020, International Paper used 2.0 million shares of treasury stock for various incentive plans. International Paper also acquired 1.0 million shares of treasury stock, including restricted stock tax withholdings. Repurchases of common stock and payments of restricted stock withholding taxes totaled $42 million, including $14 million related to shares repurchased under the Company's repurchase program. The Company indefinitely suspended its repurchase program in April 2020.
During the first nine months of 2019, International Paper used approximately 3.4 million shares of treasury stock for various incentive plans. International Paper also acquired 11.9 million shares of treasury stock, including restricted stock tax withholding. Repurchases of common stock and payments of restricted stock withholding taxes totaled $535 million, including $486 million related to shares repurchased under the Company's repurchase program.
Cash dividend payments related to common stock totaled $605 million and $595 million for the first nine months of 2020 and 2019, respectively. Dividends were $1.5375 per share and $1.5000 per share for the first nine months in 2020 and 2019, respectively.
Our pension plan is currently sufficiently funded and we do not anticipate any required contributions for the next 12 months.
Variable Interest Entities
Information concerning variable interest entities is set forth in Note 15 in the Company's Annual Report on Form 10-K for the year ended December 31, 2019. In connection with the 2006 International Paper installment sale of forestlands, we received $4.8 billion of installment notes. These installment notes were used by variable interest entities as collateral for borrowings from third-party lenders. These variable interest entities were restructured in 2015 when the installment notes and third-party loans were extended. The restructured variable interest entities hold installment notes of $4.85 billion that mature in August 2021 and third-party loans of $4.22 billion that mature in November and December of 2020. These third-party loans are shown in Current nonrecourse financial liabilities of variable interest entities on the accompanying consolidated balance sheet. We are currently negotiating the extension of the third-party loans to August 2021 and expect to complete the extension before the maturity dates.
Failure to extend these third-party loans to August 2021 prior to their respective maturity dates in November and December of 2020 could necessitate a disposition of the installment notes to facilitate the $4.22 billion debt payment. We are confident we would be able to dispose of the installment notes, if necessary.
Ilim S.A. Shareholders’ Agreement
In October 2007, in connection with the formation of the Ilim S.A. joint venture (Ilim), International Paper entered into a shareholders' agreement that includes provisions relating to the reconciliation of disputes among the partners. This agreement provides that at any time, either the Company or its partners may commence procedures specified under the deadlock agreement. If these or any other deadlock procedures under the shareholders' agreement are commenced, although it is not obligated to do so, the Company may in certain situations choose to purchase its partners' 50% interest in Ilim. Any such transaction would be subject to review and approval by Russian and other relevant anti-trust authorities. Based on the provisions of the agreement, the Company estimates that the current purchase price for its partners' 50% interest would be approximately $1.9 billion,$900 million, which could be satisfied by payment of cash or International Paper common stock, or some combination of the two, at the Company's option. The purchase by the Company of its partners’ 50% interest in Ilim would result in the consolidation of Ilim's financial position and results of operations in all subsequent periods. The parties have informed each other that they have no current intention to commence procedures specified under the deadlock provisions of the shareholders' agreement.
CRITICAL ACCOUNTING POLICIES AND SIGNIFICANT ACCOUNTING ESTIMATES
The preparation of financial statements in conformity with accounting principles generally accepted in the United States requires International Paper to establish accounting policies and to make estimates that affect both the amounts and timing of the recording of assets, liabilities, revenues and expenses. Some of these estimates require judgments about matters that are inherently uncertain.
Accounting policies whose application may have a significant effect on the reported results of operations and financial position of International Paper, and that can require judgments by management that affect their application, include accounting for contingencies, impairment or disposal of long-lived assets, goodwill and other intangible assets, pensions and income taxes.
The Company has included in its 20182019 Form 10-K a discussion of these critical accounting policies, which are important to the portrayal of the Company’s financial condition and results of operations and require management’s judgments. The Company has not made any changes in these critical accounting policies during the first nine months of 2020.
While we have taken into account certain impacts arising from COVID-19 in connection with the accounting estimates reflected in this Quarterly Report on Form 10-Q, the full impact of COVID-19 is unknown and cannot be reasonably estimated. However, we have made appropriate accounting estimates based on the facts and circumstances available as of the reporting date. To the extent there are differences between these estimates and actual results, our consolidated financial statements may be affected.
2019.
FORWARD-LOOKING STATEMENTS
Certain statements in this Quarterly Report on Form 10-Q that are not historical in nature may be considered “forward-looking” statements within the meaning of the Private Securities Litigation Reform Act of 1995. These statements are often identified by the words “will,” “may,” “should,” “continue,” “anticipate,” “believe,” “expect,” “plan,” “appear,” “project,” “estimate,” “intend,”“intend” and words of a similar nature. These statements are not guarantees of future performance and reflect management’s current views with respect to future events, which are subject to risks and uncertainties that could cause actual results to differ materially from those expressed or implied in these statements. Factors which could cause actual results to differ include but are not limited to: (i) developments related to the COVID-19 pandemic, including the severity, magnitude and duration of the pandemic, negative global economic conditions arising from the pandemic, the development, availability and effectiveness of treatments and vaccines, impacts of governments’ responses to the pandemic on our operations, impacts of the pandemic on commercial activity, our customers and business partners and consumer preferences and demand, supply chain disruptions, and disruptions in the capital or financial markets; (ii) the level of our indebtedness and changes in interest rates; (ii)(iii) industry conditions, including but not limited to changes in the cost or availability of raw materials, energy and transportation costs, competition we face,International Paper faces, cyclicality and changes in consumer preferences, demand and pricing for our products; (iii)International Paper products (including changes resulting from the COVID-19 pandemic); (iv) domestic and global economic conditions and political changes, including but not limited to trade protection measures, the impairment of financial institutions, changes in currency exchange rates, trade protectionist policies, downgrades in International Paper’s credit ratings, and/or the credit ratings of banks issuing certain letters of credit, issued by recognized credit rating organizations,organizations; (v) the amount of ourInternational Paper’s future pension funding obligation, changes in tax lawsobligations, and pension and health care costs; (iv)(vi) unanticipated expenditures or other adverse developments related to the cost of compliance with existing and new environmental, tax, labor and employment, privacy and other U.S. and non-U.S. governmental laws and regulations and to actual or potential litigation; (v) whether we experience a(including new legal requirements arising from the COVID-19 pandemic); (vii) any material disruption at oneany of ourInternational Paper’s manufacturing facilities; (vi)facilities due to severe weather, natural disasters or other causes (including as the result of the COVID-19 pandemic); (viii) risks inherent in conducting business through joint ventures; (vii) our(ix) International Paper’s ability to achieve the benefits we expectexpected from, strategicand other risks associated with, acquisitions, joint ventures, divestitures restructurings and capital investments,other corporate transactions, (x) information technology risks, and (viii)(xi) loss contingencies and pending, threatened or future litigation, including with respect to environmental related matters. These and other factors youthat could cause or contribute to actual results differing materially from such forward-looking statements can findbe found in ourInternational Paper’s press releases and filings with theU.S. Securities and Exchange Commission includingfilings. In addition, other risks and uncertainties not presently known to International Paper or that it currently believes to be immaterial could affect the risk factors identified in Item 1Aaccuracy of Part I of the Company’s Annual Report on Form 10-K for the fiscal year ended December 31, 2018. We undertakeany forward-looking statements. International Paper undertakes no obligation to publicly update any forward-looking statements, whether as a result of new information, future events or otherwise.
Information relating to quantitative and qualitative disclosures about market risk is shown on page 3536 of International Paper’s 20182019 Form 10-K, which information is incorporated herein by reference. There have been no material changes in the Company’s exposure to market risk since December 31, 20182019.
.
Evaluation of Disclosure Controls and Procedures:
Disclosure controls and procedures are controls and other procedures that are designed to ensure that information required to be disclosed in our reports filed or submitted under the Securities Exchange Act of 1934, as amended (Exchange Act), is recorded, processed, summarized and reported (and accumulated and communicated to management, including our Chief Executive Officer and Chief Financial Officer, to allow timely decisions regarding required disclosure) within the time periods specified in the Securities and Exchange Commission’s rules and forms. As of the end of the period covered by this report, we conducted an evaluation, under the supervision and with the participation of our management, including the Chief Executive Officer and Chief Financial Officer, of the effectiveness of our disclosure controls and procedures pursuant to Rules 13a-15 and 15d-15 of
the Exchange Act. Based upon that evaluation, our Chief Executive Officer and Chief Financial Officer concluded that the Company’s disclosure controls and procedures were effective as of September 30, 20192020 (the end of the period covered by this report).
Changes in Internal Control over Financial Reporting:
There have been no changes in our internal control over financial reporting during the quarter ended September 30, 20192020 that have materially affected, or are reasonably likely to materially affect, our internal control over financial reporting.
There have been no material changes from the risk factors disclosed in our Annual Report on Form 10-K for the fiscal year ended December 31, 20182019 (Part I, Item 1A). other than as discussed below.
The current COVID-19 pandemic has had an adverse effect on portions of our business, and may have material adverse effects on our business, financial condition, results of operations and cash flows, particularly if negative economic conditions associated with COVID-19 persist or deteriorate.
The COVID-19 pandemic has resulted in authorities throughout the world implementing widespread measures attempting to contain the spread and impact of COVID-19, such as travel bans and restrictions, quarantines, stay-at-home orders, the promotion of social distancing and limitations on business activity, including business closures. These measures and the pandemic have caused a significant global economic downturn, disrupting supply chains, significantly increasing unemployment and underemployment levels, and adversely impacting consumer confidence and spending. The continued spread of COVID-19 has also led to significant disruption and volatility in the global capital and financial markets.
Although governments of countries in which we operate have generally considered forest products and the supply chain on which we depend to be “essential industries” that should remain operational during this pandemic, any significant disruption in operations at one or more of our mills, plants or other facilities as a result of the COVID-19 pandemic, including precautionary measures we take or taken by governmental authorities that limits in-person workplace contact at any of our facilities to reduce the potential for employee exposure to COVID-19, could have an adverse effect on our business or operations. If a significant portion of our workforce is unable to work effectively due to measures taken in response to the COVID-19 pandemic such as those described herein, our operations will likely be negatively impacted.
COVID-19 has had a significant negative impact on demand for our printing papers products. In addition, demand for our pulp, containerboard and corrugated box products could be unfavorably impacted if the negative economic conditions associated with COVID-19 persist or deteriorate.
In addition to the reduction in demand for our products that the COVID-19 pandemic has had or could have, other negative impacts on our business, include, but are not limited to, the following:
•We rely on a global workforce, and we take measures to protect the health and safety of our employees, customers and others with whom we do business, while continuing to effectively manage our employees and maintain business operations. During the pandemic, we have taken additional measures and incurred additional expenses to protect the health and safety of our employees to comply with applicable government requirements and safety guidance. Our business operations may be additionally disrupted if a significant portion of our workforce is unable to work safely and effectively due to illness, quarantines, government actions, or other restrictions or measures responsive to the pandemic. Measures taken across our business operations to address health and safety may not be sufficient to prevent the spread of COVID-19 among our employee base, customers and others.
•A significant number of our employees as well as customers and others with whom we do business, continue to work remotely in response to the COVID-19 pandemic. Our business operations may be disrupted, and we may experience increased risk of adverse effects to our business, if a significant portion of our workforce or certain business operations are negatively impacted as a result of remote work arrangements, including due to cyber risks or other disruption to our technology infrastructure.
•Cost management and various cost-containment actions implemented across our business in response to the COVID-19 pandemic could hinder execution of our business strategy, including deferral of planned capital expenditures, and could adversely affect our business and results of operations.
While we are closely monitoring the impact of the pandemic on all aspects of our business, the extent of the impact on our results of operations, cash flow, liquidity, and financial performance, as well as our ability to execute near-term and long-term business strategies and initiatives, will depend on numerous evolving factors and future developments, which are highly uncertain and which we cannot predict or control, and some of which we are not currently aware, including, but not limited to: (a) the duration, severity and scope of the pandemic, including additional waves, increases and spikes in the number of COVID-19 cases in certain areas; (b) rapidly-changing governmental and public health directives to contain and combat the outbreak, including the duration, degree and effectiveness of directives, as well as the easing, removal and potential reinstitution of directives; (c) the development, availability and effectiveness of treatments and vaccines for COVID-19; (d) the extent and duration of the pandemic’s adverse effect on economic and social activity, consumer confidence, discretionary spending and preferences, labor and healthcare costs, and unemployment rates, any of which may reduce demand for our products; (e) any temporary reduction in our workforce, closures of our offices and facilities and our ability to adequately staff and maintain our operations; and (f) the ability of our customers and suppliers to continue their operations, which could result in terminations of contracts, losses of revenue, adverse effects to our supply chain. If the pandemic continues to create disruptions or turmoil in the credit or financial markets, or impacts our credit ratings, it could adversely affect our ability to access capital on favorable terms and continue to meet our liquidity needs.
Given the inherent uncertainty surrounding COVID-19, we expect the pandemic will continue to have an adverse impact on portions of our business in the near term. If these conditions persist for a prolonged period, the COVID-19 pandemic, including any of the above factors and others that are currently unknown, may have a material adverse effect on our business, results of operations, cash flow, liquidity, or financial condition.
PURCHASES OF EQUITY SECURITIES BY THE ISSUER AND AFFILIATED PURCHASERS.
|
| | | | | | | | |
| Period | Total Number of Shares Purchased (a) | Average Price Paid per Share | Total Number of Shares Purchased as Part of a Publicly Announced Plan or Program | Maximum Number (or Approximate Dollar Value) of Shares that May Yet Be Purchased Under the Plans or Programs (in billions) |
| July 1, 2019 - July 31, 2019 | 1,329,575 |
| $43.04 | 1,329,064 |
| $1.76 |
| August 1, 2019 - August 31, 2019 | 436,700 |
| 38.93 |
| 436,700 |
| 1.75 |
|
| September 1, 2019 - September 30, 2019 | 917 |
| 40.57 |
| — |
| 1.75 |
|
| Total | 1,767,192 |
| | | |
| | | | | | | | | | | | | | |
| Period | Total Number of Shares Purchased (a) | Average Price Paid per Share | Total Number of Shares Purchased as Part of a Publicly Announced Plan or Program | Maximum Number (or Approximate Dollar Value) of Shares that May Yet Be Purchased Under the Plans or Programs (in billions) |
| July 1, 2020 - July 31, 2020 | 3,415 | | $35.15 | — | | $1.73 |
| August 1, 2020 - August 31, 2020 | 1,663 | | 34.79 | | — | | 1.73 | |
| September 1, 2020 - September 30, 2020 | 549 | | 40.28 | | — | | 1.73 | |
| Total | 5,627 | | | | |
(a) 1,4295,627 shares were acquired from employees or board members as a result of share withholdings to pay income taxes under the Company's restricted stock programs. The remainder were purchased under aprogram. A share repurchase program that was approved on September 10, 2013, and increased twice by our Board of Directors and announced on September 10, 2013, July 8, 2014, and October 9, 2018. Through this program, which does not have an expiration date, we were authorized to purchase, in open market transactions (including block trades), privately negotiated transactions or otherwise, up to $5 billion of shares of our common stock. As of September 30, 2019,2020, approximately $1.75$1.73 billion aggregate amount of shares of our common stock remained authorized for purchase under this program. The Company indefinitely suspended its repurchase program in April 2020.
| | | | | | | | |
| 10.1 | | |
| | |
10.131.1 | | |
| | |
31.1 | | |
| |
| 31.2 | | |
| |
| 32 | | |
| |
| 101.INS | | XBRL Instance Document - the instance document does not appear in the Interactive Data File because its XBRL tags are embedded within the inline XBRL document. |
| |
| 101.SCH | | XBRL Taxonomy Extension Schema. |
| |
| 101.CAL | | XBRL Taxonomy Extension Calculation Linkbase. |
| |
| 101.DEF | | XBRL Taxonomy Extension Definition Linkbase. |
| |
| 101.LAB | | XBRL Taxonomy Extension Label Linkbase. |
| |
| 101.PRE | | XBRL Extension Presentation Linkbase. |
| | |
| 104 | | Cover Page Interactive Data File (formatted as Inline XBRL, and contained in Exhibit 101). |
Pursuant to the requirements of the Securities Exchange Act of 1934, the registrant has duly caused this report to be signed on its behalf by the undersigned thereunto duly authorized.
| | | | | | | | |
| INTERNATIONAL PAPER COMPANY
(Registrant) |
| | |
| October 30, 2020 | INTERNATIONAL PAPER COMPANY
(Registrant)
|
| By | | |
November 1, 2019 | By | /s/ Tim S. Nicholls |
| | Tim S. Nicholls |
| | Senior Vice President and Chief
Financial Officer
|
| | |
November 1, 2019October 30, 2020 | By | /s/ Vincent P. Bonnot |
| | Vincent P. Bonnot |
| | Vice President – Finance and Controller |