UNITED STATES
SECURITIES AND EXCHANGE COMMISSION
WASHINGTON, D.C. 20549
FORM 10-Q
☒ QUARTERLY REPORT PURSUANT TO SECTION 13 OR 15(d) OF THE SECURITIES EXCHANGE ACT OF 1934
For the Quarterly Period Ended September 30, 20202021
☐ TRANSITION REPORT PURSUANT TO SECTION 13 OR 15(d) OF THE SECURITIES EXCHANGE ACT OF 1934
For the Transition Period From to
_________________________________________
Commission File Number 001-03157
INTERNATIONAL PAPER COMPANY
(Exact name of registrant as specified in its charter)
| | | | | |
| New York | 13-0872805 |
(State or other jurisdiction of incorporation) | (I.R.S. Employer Identification No.) |
| |
| 6400 Poplar Avenue, Memphis, Tennessee | 38197 |
| (Address of Principal Executive Offices) | (Zip Code) |
Registrant’s telephone number, including area code: (901) 419-7000
Securities registered pursuant to Section 12(b) of the Act:
| | | | | | | | |
| Title of each class | Trading Symbol(s) | Name of each exchange on which registered |
| Common Shares | IP | New York Stock Exchange |
Indicate by check mark whether the registrant (1) has filed all reports required to be filed by Section 13 or 15(d) of the Securities Exchange Act of 1934 during the preceding 12 months (or for such shorter period that the registrant was required to file such reports), and (2) has been subject to such filing requirements for the past 90 days. Yes ☒ No ¨
Indicate by check mark whether the registrant has submitted electronically every Interactive Data File required to be submitted pursuant to Rule 405 of Regulation S-T (paragraph 232.405 of this chapter) during the preceding 12 months (or for such shorter period that the registrant was required to submit such files). Yes ☒ No ¨
Indicate by check mark whether the registrant is a large accelerated filer, an accelerated filer, a non-accelerated filer, a smaller reporting company or an emerging growth company. See the definitions of “large accelerated filer,” “accelerated filer,” “smaller reporting company,” and "emerging growth company" in Rule 12b-2 of the Exchange Act.
| | | | | | | | | | | |
| Large accelerated filer | ☒ | Accelerated filer | ☐ |
| Non-accelerated filer | ☐ | Smaller reporting company | ☐ |
| | Emerging growth company | ☐ |
If an emerging growth company, indicate by check mark if the registrant has elected not to use the extended transition period for complying with any new or revised financial accounting standards provided pursuant to Section 13 (a) of the Exchange
Act. ¨
Indicate by check mark whether the registrant is a shell company (as defined in Rule 12b-2 of the Exchange Act). Yes ☐ No ☒
The number of shares outstanding of the registrant’s common stock, par value $1.00 per share, as of October 23, 202021, 2021 was 393,095,466.387,263,169.
INDEX
| | | | | | | | |
| | | PAGE NO. |
| | |
| | |
| | |
| | |
| Condensed Consolidated Statement of Operations - Three Months and Nine Months Ended September 30, 20202021 and 20192020 | |
| | |
| Condensed Consolidated Statement of Comprehensive Income - Three Months and Nine Months Ended September 30, 20202021 and 20192020 | |
| | |
| Condensed Consolidated Balance Sheet - September 30, 20202021 and December 31, 20192020 | |
| | |
| Condensed Consolidated Statement of Cash Flows - Nine Months Ended September 30, 20202021 and 20192020 | |
| | |
| | |
| | |
| | |
| | |
| | |
| | |
| | |
| | |
| | |
| | |
| | |
| | |
| | |
| | |
| | |
| | |
| | |
| |
| |
INTERNATIONAL PAPER COMPANY
(Unaudited)
(In millions, except per share amounts)
| | | | Three Months Ended
September 30, | | Nine Months Ended
September 30, | | Three Months Ended
September 30, | | Nine Months Ended
September 30, |
| | | 2020 | | 2019 | | 2020 | | 2019 | | 2021 | | 2020 | | 2021 | | 2020 |
| Net Sales | Net Sales | $ | 5,123 | | | $ | 5,568 | | | $ | 15,341 | | | $ | 16,878 | | Net Sales | $ | 5,714 | | | $ | 5,123 | | | $ | 16,693 | | | $ | 15,341 | |
| Costs and Expenses | Costs and Expenses | | Costs and Expenses | |
| Cost of products sold | Cost of products sold | 3,541 | | | 3,772 | | | 10,714 | | | 11,602 | | Cost of products sold | 3,924 | | | 3,541 | | | 11,684 | | | 10,714 | |
| Selling and administrative expenses | Selling and administrative expenses | 360 | | | 387 | | | 1,110 | | | 1,202 | | Selling and administrative expenses | 434 | | | 360 | | | 1,255 | | | 1,110 | |
| Depreciation, amortization and cost of timber harvested | Depreciation, amortization and cost of timber harvested | 320 | | | 327 | | | 955 | | | 963 | | Depreciation, amortization and cost of timber harvested | 318 | | | 320 | | | 933 | | | 955 | |
| Distribution expenses | Distribution expenses | 377 | | | 395 | | | 1,149 | | | 1,168 | | Distribution expenses | 446 | | | 377 | | | 1,272 | | | 1,149 | |
| Taxes other than payroll and income taxes | Taxes other than payroll and income taxes | 44 | | | 42 | | | 129 | | | 128 | | Taxes other than payroll and income taxes | 42 | | | 44 | | | 131 | | | 129 | |
| Restructuring and other charges, net | Restructuring and other charges, net | 105 | | | 21 | | | 131 | | | 21 | | Restructuring and other charges, net | 39 | | | 105 | | | 243 | | | 131 | |
| Net (gains) losses on sales and impairments of businesses | Net (gains) losses on sales and impairments of businesses | (5) | | | 8 | | | 347 | | | 153 | | Net (gains) losses on sales and impairments of businesses | (360) | | | (5) | | | (367) | | | 347 | |
| Net (gains) losses on sales of equity method investments | Net (gains) losses on sales of equity method investments | (2) | | | 0 | | | (35) | | | 0 | | Net (gains) losses on sales of equity method investments | (1) | | | (2) | | | (205) | | | (35) | |
| Antitrust fines | 0 | | | 32 | | | 0 | | | 32 | | |
| Net (gains) losses on sales of fixed assets | | Net (gains) losses on sales of fixed assets | (86) | | | — | | | (86) | | | — | |
| Interest expense, net | Interest expense, net | 112 | | | 123 | | | 345 | | | 378 | | Interest expense, net | 93 | | | 112 | | | 242 | | | 345 | |
| Non-operating pension expense (income) | Non-operating pension expense (income) | (11) | | | 9 | | | (31) | | | 27 | | Non-operating pension expense (income) | (51) | | | (11) | | | (156) | | | (31) | |
| Earnings (Loss) Before Income Taxes and Equity Earnings | Earnings (Loss) Before Income Taxes and Equity Earnings | 282 | | | 452 | | | 527 | | | 1,204 | | Earnings (Loss) Before Income Taxes and Equity Earnings | 916 | | | 282 | | | 1,747 | | | 527 | |
| Income tax provision (benefit) | Income tax provision (benefit) | 50 | | | 137 | | | 211 | | | 371 | | Income tax provision (benefit) | 146 | | | 50 | | | 347 | | | 211 | |
| Equity earnings (loss), net of taxes | Equity earnings (loss), net of taxes | (28) | | | 27 | | | 13 | | | 221 | | Equity earnings (loss), net of taxes | 94 | | | (28) | | | 247 | | | 13 | |
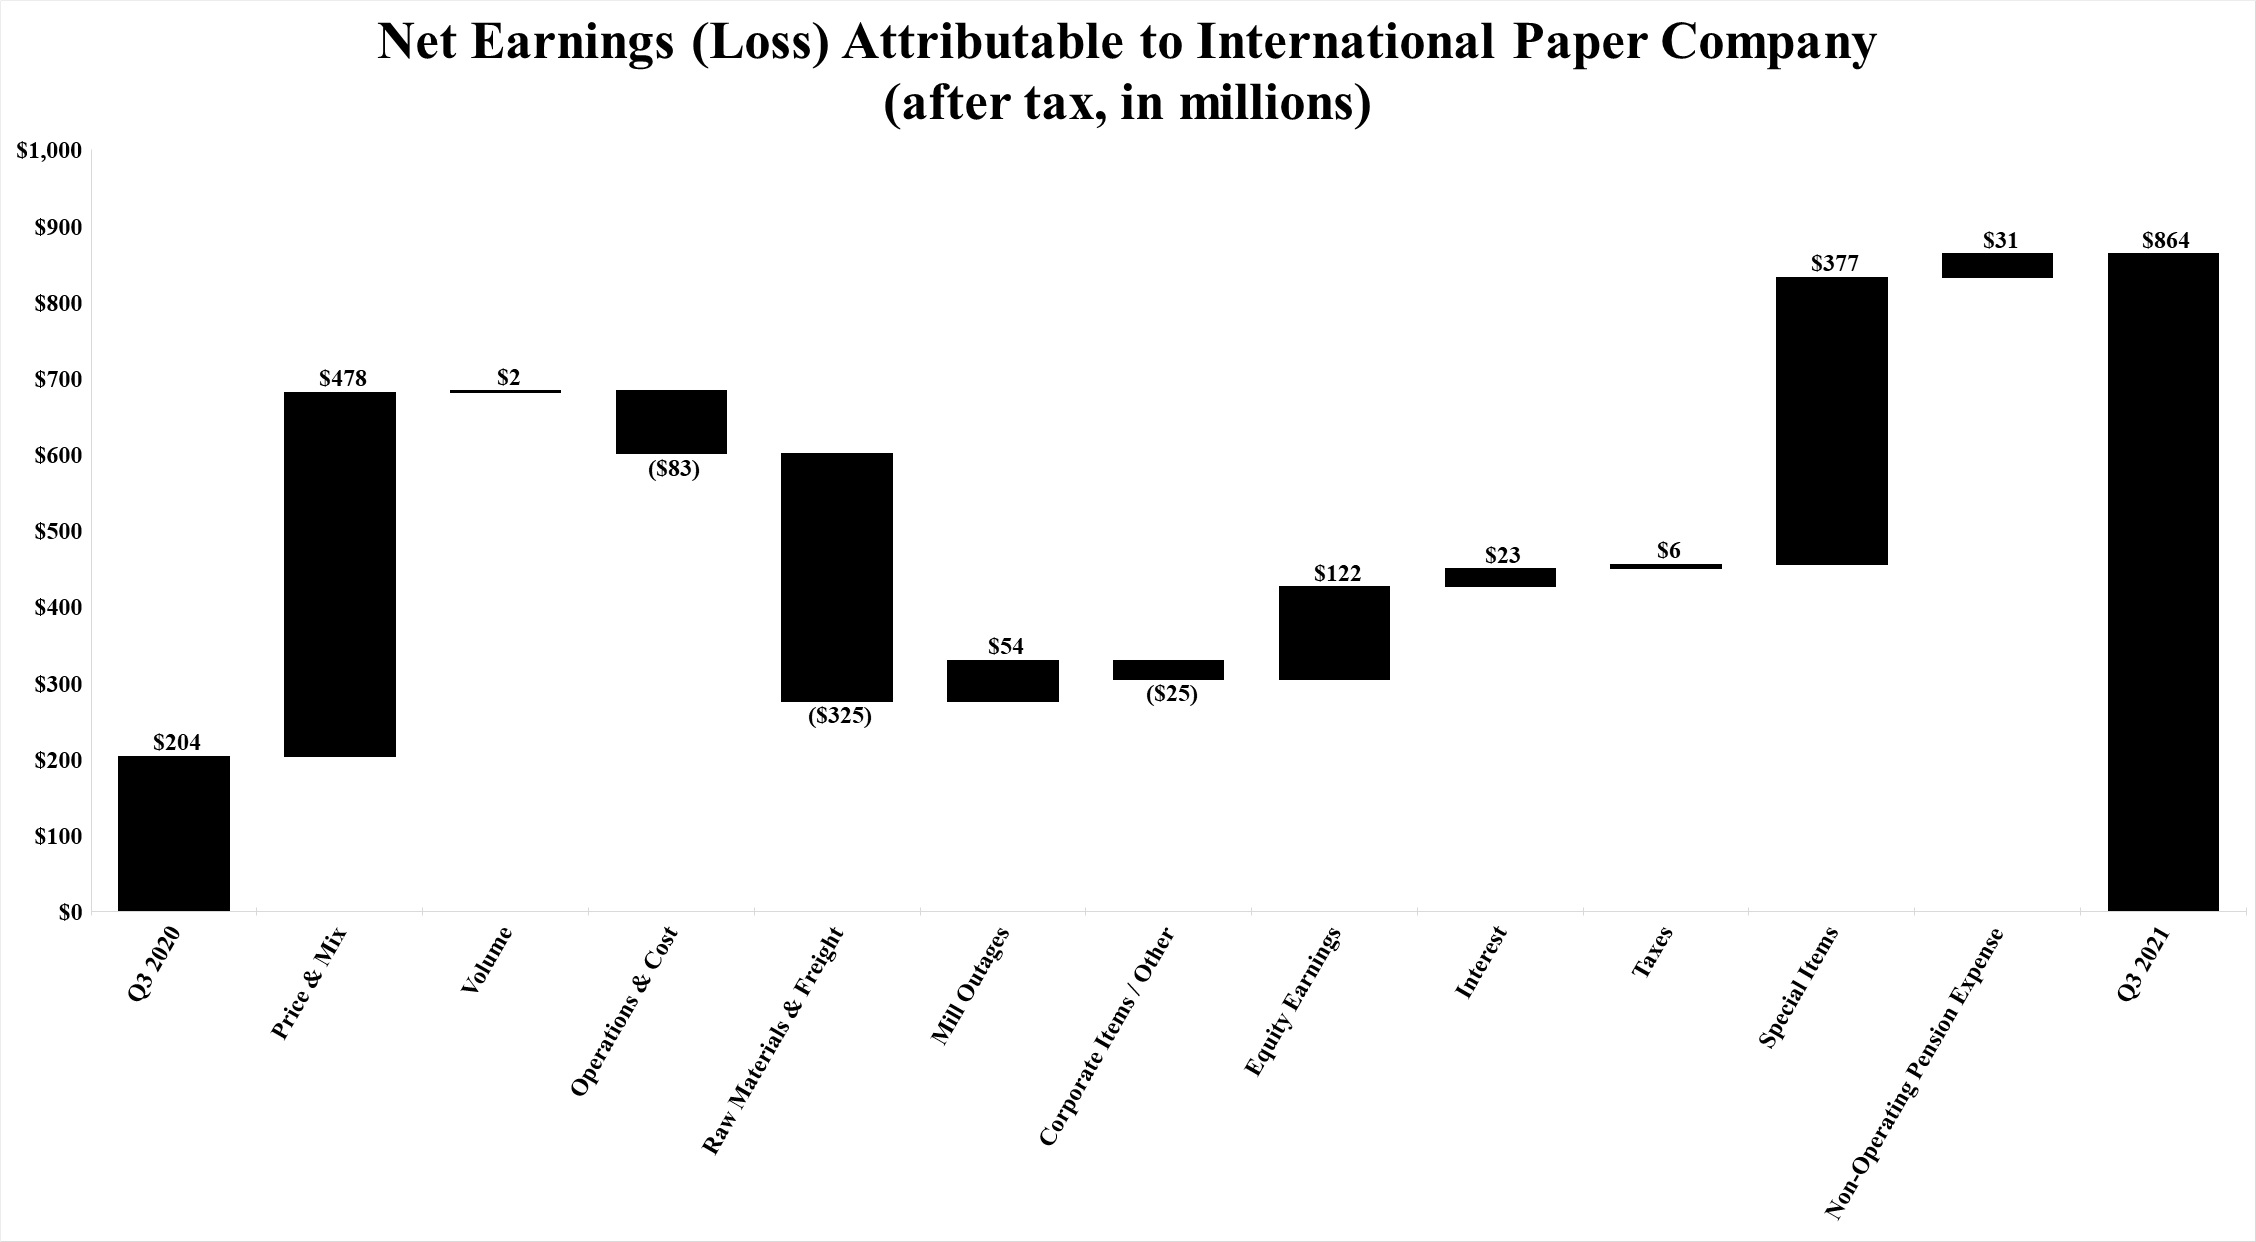
| Net Earnings (Loss) | Net Earnings (Loss) | 204 | | | 342 | | | 329 | | | 1,054 | | Net Earnings (Loss) | $ | 864 | | | $ | 204 | | | $ | 1,647 | | | $ | 329 | |
| Less: Net earnings (loss) attributable to noncontrolling interests | Less: Net earnings (loss) attributable to noncontrolling interests | 0 | | | (2) | | | 0 | | | (6) | | Less: Net earnings (loss) attributable to noncontrolling interests | — | | | — | | | 2 | | | — | |
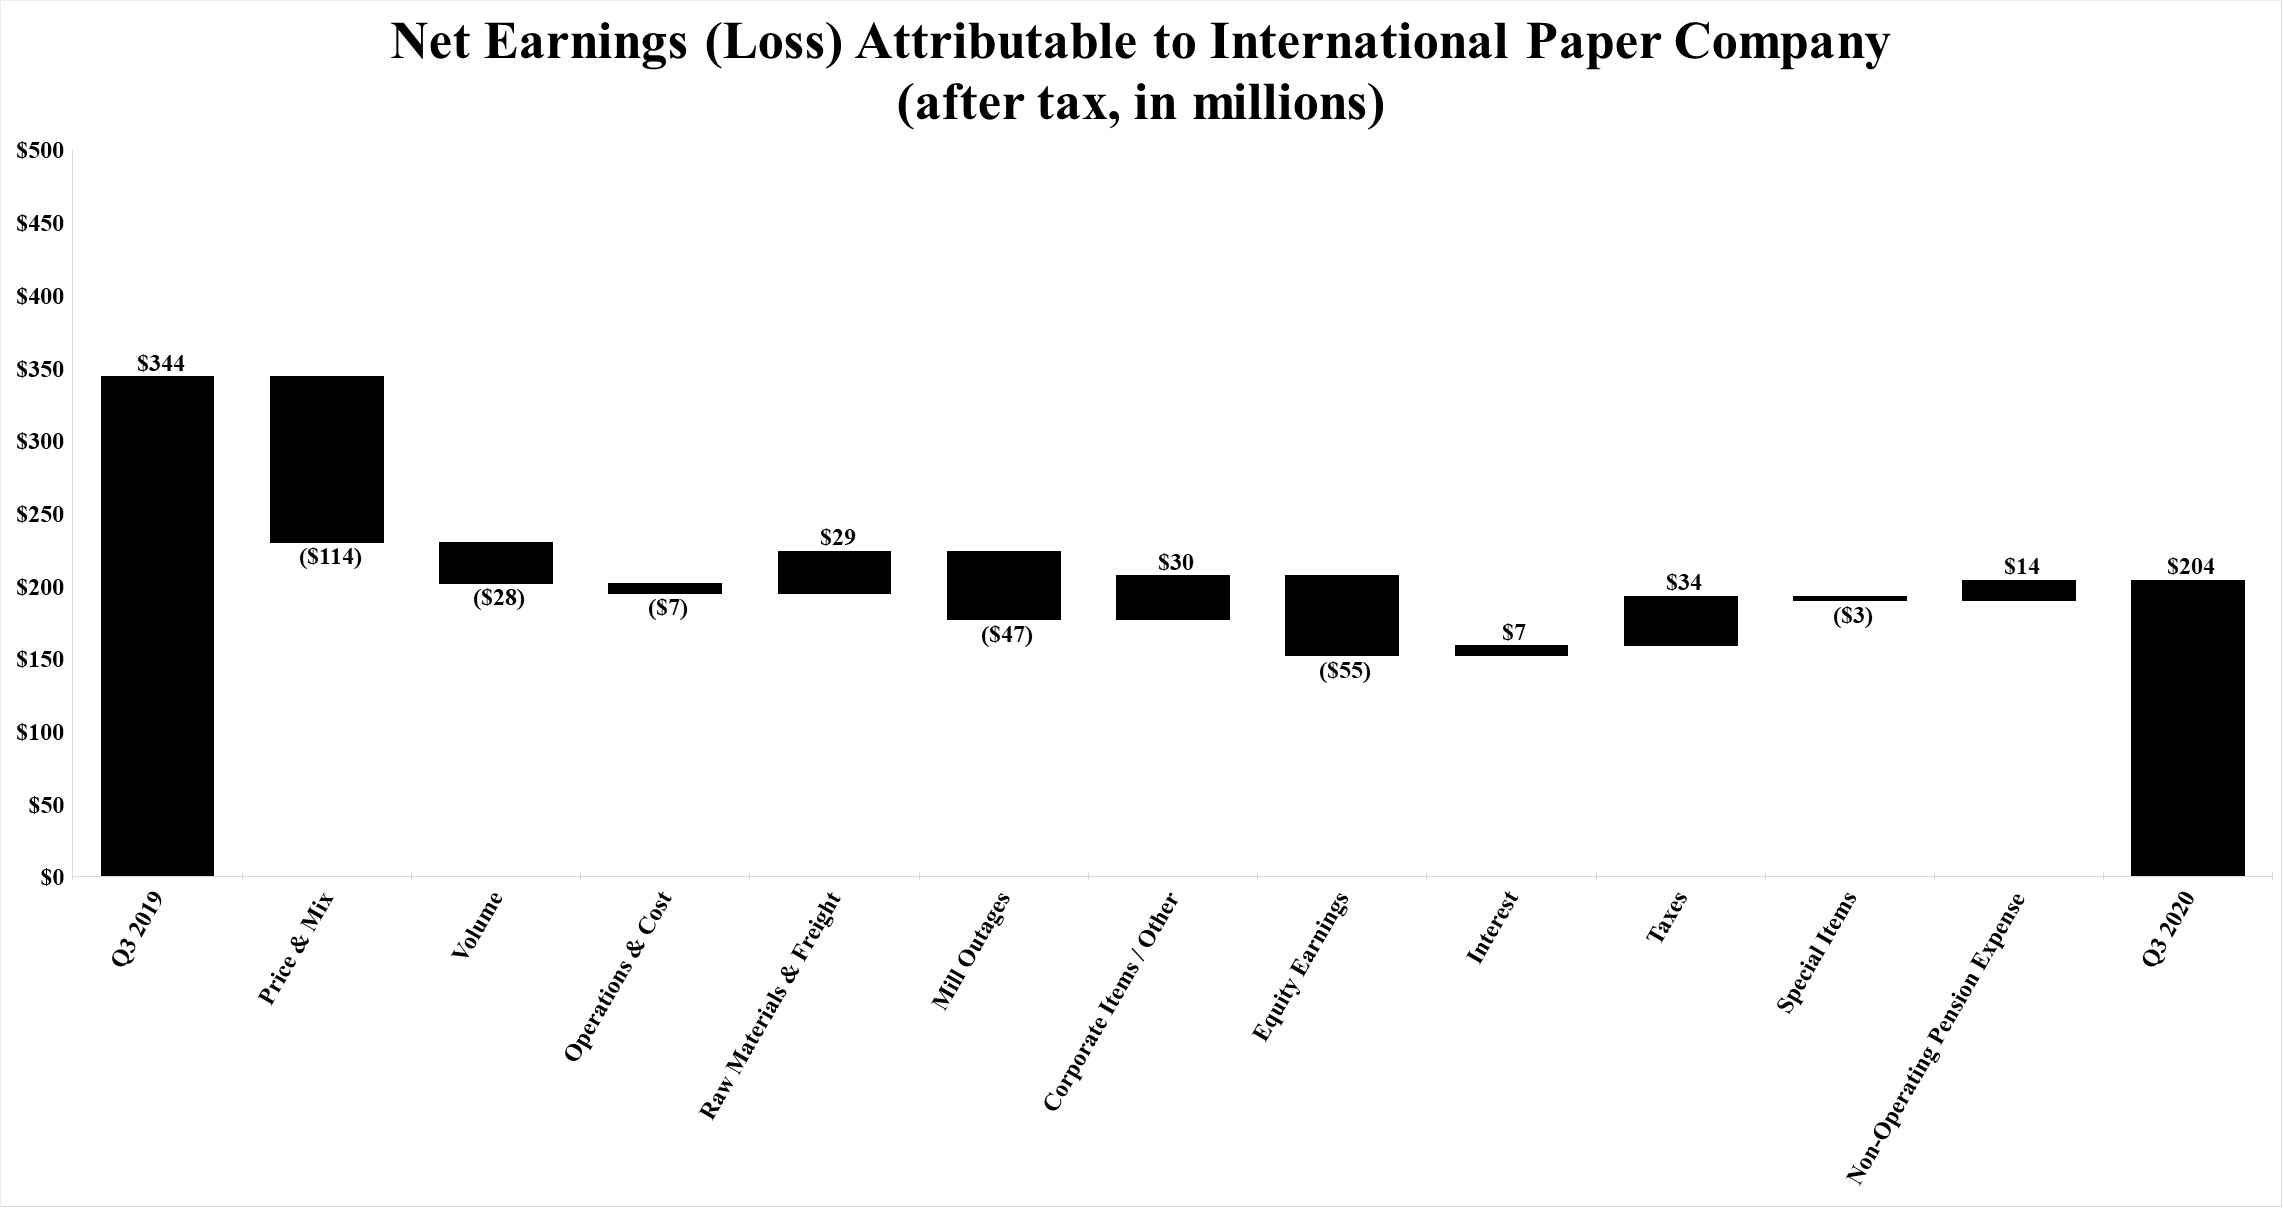
| Net Earnings (Loss) Attributable to International Paper Company | Net Earnings (Loss) Attributable to International Paper Company | $ | 204 | | | $ | 344 | | | $ | 329 | | | $ | 1,060 | | Net Earnings (Loss) Attributable to International Paper Company | $ | 864 | | | $ | 204 | | | $ | 1,645 | | | $ | 329 | |
| Basic Earnings (Loss) Per Share Attributable to International Paper Company Common Shareholders | Basic Earnings (Loss) Per Share Attributable to International Paper Company Common Shareholders | | Basic Earnings (Loss) Per Share Attributable to International Paper Company Common Shareholders | |
| Net earnings (loss) | Net earnings (loss) | $ | 0.52 | | | $ | 0.88 | | | $ | 0.84 | | | $ | 2.67 | | Net earnings (loss) | $ | 2.22 | | | $ | 0.52 | | | $ | 4.21 | | | $ | 0.84 | |
| Diluted Earnings (Loss) Per Share Attributable to International Paper Company Common Shareholders | Diluted Earnings (Loss) Per Share Attributable to International Paper Company Common Shareholders | | Diluted Earnings (Loss) Per Share Attributable to International Paper Company Common Shareholders | |
| Net earnings (loss) | Net earnings (loss) | $ | 0.52 | | | $ | 0.87 | | | $ | 0.83 | | | $ | 2.65 | | Net earnings (loss) | $ | 2.20 | | | $ | 0.52 | | | $ | 4.16 | | | $ | 0.83 | |
| Average Shares of Common Stock Outstanding – assuming dilution | Average Shares of Common Stock Outstanding – assuming dilution | 394.6 | | | 395.4 | | | 394.5 | | | 399.6 | | Average Shares of Common Stock Outstanding – assuming dilution | 392.6 | | | 394.6 | | | 395.3 | | | 394.5 | |
The accompanying notes are an integral part of these condensed financial statements.
INTERNATIONAL PAPER COMPANY
(Unaudited)
(In millions)
| | | | | | | | | | | | | | | | | | | | | | | |
| | Three Months Ended
September 30, | | Nine Months Ended
September 30, |
| | 2020 | | 2019 | | 2020 | | 2019 |
| Net Earnings (Loss) | $ | 204 | | | $ | 342 | | | $ | 329 | | | $ | 1,054 | |
| Other Comprehensive Income (Loss), Net of Tax: | | | | | | | |
| Amortization of pension and post-retirement prior service costs and net loss: | | | | | | | |
| U.S. plans | 42 | | | 41 | | | 127 | | | 122 | |
| Non-U.S. plans | 1 | | | 0 | | | 1 | | | 0 | |
| Change in cumulative foreign currency translation adjustment | (28) | | | (179) | | | (515) | | | (106) | |
| Net gains/losses on cash flow hedging derivatives: | | | | | | | |
| Net gains (losses) arising during the period | (4) | | | (10) | | | (34) | | | (6) | |
| Reclassification adjustment for (gains) losses included in net earnings (loss) | 6 | | | 4 | | | 26 | | | 5 | |
| Total Other Comprehensive Income (Loss), Net of Tax | 17 | | | (144) | | | (395) | | | 15 | |
| Comprehensive Income (Loss) | 221 | | | 198 | | | (66) | | | 1,069 | |
| Net (earnings) loss attributable to noncontrolling interests | 0 | | | 2 | | | 0 | | | 6 | |
| Other comprehensive (income) loss attributable to noncontrolling interests | 0 | | | 0 | | | 2 | | | 0 | |
| Comprehensive Income (Loss) Attributable to International Paper Company | $ | 221 | | | $ | 200 | | | $ | (64) | | | $ | 1,075 | |
| | | | | | | | | | | | | | | | | | | | | | | |
| | Three Months Ended
September 30, | | Nine Months Ended
September 30, |
| | 2021 | | 2020 | | 2021 | | 2020 |
| Net Earnings (Loss) | $ | 864 | | | $ | 204 | | | $ | 1,647 | | | $ | 329 | |
| Other Comprehensive Income (Loss), Net of Tax: | | | | | | | |
| Amortization of pension and post-retirement prior service costs and net loss: | | | | | | | |
| U.S. plans | 31 | | | 42 | | | 101 | | | 127 | |
| Non-U.S. plans | — | | | 1 | | | — | | | 1 | |
| Pension and postretirement adjustments: | | | | | | | |
| U.S. plans | 826 | | | — | | | 826 | | | — | |
| Non-U.S. plans | 5 | | | — | | | 6 | | | — | |
| Change in cumulative foreign currency translation adjustment | (70) | | | (28) | | | 99 | | | (515) | |
| Net gains/losses on cash flow hedging derivatives: | | | | | | | |
| Net gains (losses) arising during the period | (4) | | | (4) | | | 3 | | | (34) | |
| Reclassification adjustment for (gains) losses included in net earnings (loss) | (8) | | | 6 | | | (9) | | | 26 | |
| Total Other Comprehensive Income (Loss), Net of Tax | 780 | | | 17 | | | 1,026 | | | (395) | |
| Comprehensive Income (Loss) | 1,644 | | | 221 | | | 2,673 | | | (66) | |
| Net (earnings) loss attributable to noncontrolling interests | — | | | — | | | (2) | | | — | |
| Other comprehensive (income) loss attributable to noncontrolling interests | — | | | — | | | 2 | | | 2 | |
| Comprehensive Income (Loss) Attributable to International Paper Company | $ | 1,644 | | | $ | 221 | | | $ | 2,673 | | | $ | (64) | |
The accompanying notes are an integral part of these condensed financial statements.
INTERNATIONAL PAPER COMPANY
(In millions)
| | | | | | | | | | | |
| September 30,
2020 | | December 31,
2019 |
| | (unaudited) | | |
| Assets | | | |
| Current Assets | | | |
| Cash and temporary investments | $ | 678 | | | $ | 511 | |
| Accounts and notes receivable, net | 3,034 | | | 3,280 | |
| Contract assets | 388 | | | 393 | |
| Inventories | 2,007 | | | 2,208 | |
| Current financial assets of variable interest entities (Note 16) | 4,850 | | | 0 | |
| Assets held for sale | 114 | | | 0 | |
| Other current assets | 217 | | | 247 | |
| Total Current Assets | 11,288 | | | 6,639 | |
| Plants, Properties and Equipment, net | 12,410 | | | 13,004 | |
| Forestlands | 288 | | | 391 | |
| Investments | 1,100 | | | 1,721 | |
| Long-Term Financial Assets of Variable Interest Entities (Note 16) | 2,252 | | | 7,088 | |
| Goodwill | 3,304 | | | 3,347 | |
| Right of Use Assets | 422 | | | 434 | |
| Deferred Charges and Other Assets | 776 | | | 847 | |
| Total Assets | $ | 31,840 | | | $ | 33,471 | |
| Liabilities and Equity | | | |
| Current Liabilities | | | |
| Notes payable and current maturities of long-term debt | $ | 179 | | | $ | 168 | |
| Current nonrecourse financial liabilities of variable interest entities (Note 16) | 4,220 | | | 4,220 | |
| Accounts payable | 2,226 | | | 2,423 | |
| Accrued payroll and benefits | 453 | | | 466 | |
| Liabilities held for sale | 376 | | | 0 | |
| Other current liabilities | 1,022 | | | 1,369 | |
| Total Current Liabilities | 8,476 | | | 8,646 | |
| Long-Term Debt | 8,525 | | | 9,597 | |
| Long-Term Nonrecourse Financial Liabilities of Variable Interest Entities (Note 16) | 2,091 | | | 2,085 | |
| Deferred Income Taxes | 2,639 | | | 2,633 | |
| Pension Benefit Obligation | 1,421 | | | 1,578 | |
| Postretirement and Postemployment Benefit Obligation | 246 | | | 270 | |
| Long-Term Lease Obligations | 290 | | | 304 | |
| Other Liabilities | 1,056 | | | 640 | |
| Equity | | | |
| Common stock, $1 par value, 2020 – 448.9 shares and 2019 – 448.9 shares | 449 | | | 449 | |
| Paid-in capital | 6,302 | | | 6,297 | |
| Retained earnings | 8,122 | | | 8,408 | |
| Accumulated other comprehensive loss | (5,132) | | | (4,739) | |
| 9,741 | | | 10,415 | |
| Less: Common stock held in treasury, at cost, 2020 – 55.8 shares and 2019 – 56.8 shares | 2,648 | | | 2,702 | |
| Total International Paper Shareholders’ Equity | 7,093 | | | 7,713 | |
| Noncontrolling interests | 3 | | | 5 | |
| Total Equity | 7,096 | | | 7,718 | |
| Total Liabilities and Equity | $ | 31,840 | | | $ | 33,471 | |
| | | | | | | | | | | |
| September 30,
2021 | | December 31,
2020 |
| | (unaudited) | | |
| Assets | | | |
| Current Assets | | | |
| Cash and temporary investments | $ | 2,122 | | | $ | 595 | |
| Restricted cash | 1,499 | | | — | |
| Accounts and notes receivable, net | 3,549 | | | 3,064 | |
| Contract assets | 427 | | | 355 | |
| Inventories | 2,053 | | | 2,050 | |
| Current financial assets of variable interest entities (Note 16) | — | | | 4,850 | |
| Assets held for sale | — | | | 138 | |
| Other current assets | 246 | | | 184 | |
| Total Current Assets | 9,896 | | | 11,236 | |
| Plants, Properties and Equipment, net | 11,360 | | | 12,217 | |
| Forestlands | 303 | | | 311 | |
| Investments | 713 | | | 1,178 | |
| Long-Term Financial Assets of Variable Interest Entities (Note 16) | 2,270 | | | 2,257 | |
| Goodwill | 3,274 | | | 3,315 | |
| Pension Assets | 545 | | | 5 | |
| Right of Use Assets | 405 | | | 459 | |
| Deferred Charges and Other Assets | 705 | | | 740 | |
| Total Assets | $ | 29,471 | | | $ | 31,718 | |
| Liabilities and Equity | | | |
| Current Liabilities | | | |
| Notes payable and current maturities of long-term debt | $ | 233 | | | $ | 29 | |
| Current nonrecourse financial liabilities of variable interest entities (Note 16) | — | | | 4,220 | |
| Accounts payable | 2,704 | | | 2,320 | |
| Accrued payroll and benefits | 489 | | | 466 | |
| Liabilities held for sale | — | | | 181 | |
| Other current liabilities | 1,272 | | | 1,068 | |
| Total Current Liabilities | 4,698 | | | 8,284 | |
| Long-Term Debt | 8,241 | | | 8,064 | |
| Long-Term Nonrecourse Financial Liabilities of Variable Interest Entities (Note 16) | 2,098 | | | 2,092 | |
| Deferred Income Taxes | 2,728 | | | 2,743 | |
| Pension Benefit Obligation | 418 | | | 1,055 | |
| Postretirement and Postemployment Benefit Obligation | 235 | | | 251 | |
| Long-Term Lease Obligations | 263 | | | 315 | |
| Other Liabilities | 1,167 | | | 1,046 | |
| Equity | | | |
| Common stock, $1 par value, 2021 – 448.9 shares and 2020 – 448.9 shares | 449 | | | 449 | |
| Paid-in capital | 6,371 | | | 6,325 | |
| Retained earnings | 9,103 | | | 8,070 | |
| Accumulated other comprehensive loss | (3,314) | | | (4,342) | |
| 12,609 | | | 10,502 | |
| Less: Common stock held in treasury, at cost, 2021 – 61.7 shares and 2020 – 55.8 shares | 2,987 | | | 2,648 | |
| Total International Paper Shareholders’ Equity | 9,622 | | | 7,854 | |
| Noncontrolling interests | 1 | | | 14 | |
| Total Equity | 9,623 | | | 7,868 | |
| Total Liabilities and Equity | $ | 29,471 | | | $ | 31,718 | |
The accompanying notes are an integral part of these condensed financial statements.
INTERNATIONAL PAPER COMPANY
(Unaudited)
(In millions)
| | | | | | | | | | | |
| | Nine Months Ended
September 30, |
| | 2020 | | 2019 |
| Operating Activities | | | |
| Net earnings (loss) | $ | 329 | | | $ | 1,054 | |
| Depreciation, amortization and cost of timber harvested | 955 | | | 963 | |
| Deferred income tax provision (benefit), net | (5) | | | 68 | |
| Restructuring and other charges, net | 131 | | | 21 | |
| Net (gains) losses on sales and impairments of businesses | 347 | | | 153 | |
| Net (gains) losses on sales of equity method investments | (35) | | | 0 | |
| Antitrust fines | 0 | | | 32 | |
| Equity method dividends received | 158 | | | 260 | |
| Equity (earnings) losses, net | (13) | | | (221) | |
| Periodic pension expense, net | 24 | | | 70 | |
| Other, net | 212 | | | 106 | |
| Changes in current assets and liabilities | | | |
| Accounts and notes receivable | 96 | | | 168 | |
| Contract assets | 2 | | | 6 | |
| Inventories | 74 | | | (9) | |
| Accounts payable and accrued liabilities | 0 | | | (11) | |
| Interest payable | (26) | | | (31) | |
| Other | 25 | | | 53 | |
| Cash Provided By (Used For) Operations | 2,274 | | | 2,682 | |
| Investment Activities | | | |
| Invested in capital projects, net of insurance recoveries | (657) | | | (913) | |
| Acquisitions, net of cash acquired | (64) | | | (99) | |
| Proceeds from sales of equity method investments | 500 | | | 0 | |
| Proceeds from sales of businesses, net of cash divested | 0 | | | 17 | |
| Proceeds from sale of fixed assets | 3 | | | 15 | |
| Other | 18 | | | (14) | |
| Cash Provided By (Used For) Investment Activities | (200) | | | (994) | |
| Financing Activities | | | |
| Repurchases of common stock and payments of restricted stock tax withholding | (42) | | | (535) | |
| Issuance of debt | 692 | | | 381 | |
| Reduction of debt | (1,795) | | | (772) | |
| Change in book overdrafts | 16 | | | (29) | |
| Dividends paid | (605) | | | (595) | |
| Debt tender premiums paid | (124) | | | 0 | |
| Other | (1) | | | 3 | |
| Cash Provided By (Used For) Financing Activities | (1,859) | | | (1,547) | |
| Cash Included in Assets Held for Sale | (11) | | | (19) | |
| Effect of Exchange Rate Changes on Cash | (37) | | | (14) | |
| Change in Cash and Temporary Investments | 167 | | | 108 | |
| Cash and Temporary Investments | | | |
| Beginning of period | 511 | | | 589 | |
| End of period | $ | 678 | | | $ | 697 | |
| | | | | | | | | | | |
| | Nine Months Ended
September 30, |
| | 2021 | | 2020 |
| Operating Activities | | | |
| Net earnings (loss) | $ | 1,647 | | | $ | 329 | |
| Depreciation, amortization and cost of timber harvested | 933 | | | 955 | |
| Deferred income tax provision (benefit), net | (151) | | | (5) | |
| Restructuring and other charges, net | 243 | | | 131 | |
| Net (gains) losses on sales of equity method investments | (205) | | | (35) | |
| Net (gains) losses on sales and impairments of businesses | (367) | | | 347 | |
| Net (gains) losses on sales of fixed assets | (86) | | | — | |
| Equity method dividends received | 149 | | | 158 | |
| Equity (earnings) losses, net | (247) | | | (13) | |
| Periodic pension (income) expense, net | (84) | | | 24 | |
| Other, net | 129 | | | 212 | |
| Changes in current assets and liabilities | | | |
| Accounts and notes receivable | (510) | | | 96 | |
| Contract assets | (74) | | | 2 | |
| Inventories | (133) | | | 74 | |
| Accounts payable and accrued liabilities | 716 | | | — | |
| Interest payable | 9 | | | (26) | |
| Other | (46) | | | 25 | |
| Cash Provided By (Used For) Operations | 1,923 | | | 2,274 | |
| Investment Activities | | | |
| Invested in capital projects, net of insurance recoveries | (348) | | | (657) | |
| Acquisitions, net of cash acquired | (80) | | | (64) | |
| Proceeds from sales of equity method investments | 843 | | | 500 | |
| Proceeds from sales of businesses, net of cash divested | 827 | | | — | |
| Proceeds from settlement of Variable Interest Entity installment notes | 4,850 | | | — | |
| Proceeds from sale of fixed assets | 95 | | | 3 | |
| Other | (3) | | | 18 | |
| Cash Provided By (Used For) Investment Activities | 6,184 | | | (200) | |
| Financing Activities | | | |
| Repurchases of common stock and payments of restricted stock tax withholding | (425) | | | (42) | |
| Issuance of debt | 1,511 | | | 692 | |
| Reduction of debt | (1,132) | | | (1,795) | |
| Change in book overdrafts | 29 | | | 16 | |
| Dividends paid | (602) | | | (605) | |
| Reduction of Variable Interest Entity loans | (4,220) | | | — | |
| Net debt tender premiums paid | (221) | | | (124) | |
| Other | (14) | | | (1) | |
| Cash Provided By (Used For) Financing Activities | (5,074) | | | (1,859) | |
| Cash Included in Assets Held for Sale | — | | | (11) | |
| Effect of Exchange Rate Changes on Cash and Temporary Investments and Restricted Cash | (7) | | | (37) | |
| Change in Cash and Temporary Investments and Restricted Cash | 3,026 | | | 167 | |
| Cash and Temporary Investments and Restricted Cash | | | |
| Beginning of period | 595 | | | 511 | |
| End of period | $ | 3,621 | | | $ | 678 | |
The accompanying notes are an integral part of these condensed financial statements.
INTERNATIONAL PAPER COMPANY
(Unaudited)
The accompanying unaudited condensed financial statements have been prepared in conformity with accounting principles generally accepted in the United States and in accordance with the instructions to Form 10-Q and, in the opinion of management, include all adjustments that are necessary for the fair presentation of International Paper Company’s (International Paper’s, the Company’s or our) financial position, results of operations, and cash flows for the interim periods presented. Except as disclosed herein, such adjustments are of a normal, recurring nature. Results for the first nine months of the year may not necessarily be indicative of full year results. It is suggested that these condensed financial statements be read in conjunction with the audited financial statements and the notes thereto included in the Company’s Annual Report on Form 10-K for the year ended December 31, 2019,2020, which have previously been filed with the Securities and Exchange Commission.
On March 11, 2020 the World Health Organization (WHO) declared the novel strain of coronavirus (COVID-19) a global pandemic and recommended containment and mitigation measures worldwide. During the third quarter of 2021, the number of COVID-19 cases and deaths increased in the United States and numerous other countries, and restrictive measures, including mask and vaccine requirements, have been implemented or reinstituted by various governmental authorities and private businesses. Economic recovery in the United States has continued but may be threatened by the resurgence of COVID-19 cases and other factors. Most of our manufacturing and converting facilities have remained open and operational during the pandemic. The healthpandemic and safety ofat the current time our employeesmanufacturing and contractors is our most important responsibility as we manage through the COVID-19 pandemic. We have implemented work-systems across the Company, including hygiene, social distancing, site cleaning, contact tracing, and other measures, as recommended by the Centers for Disease Control (CDC) and WHO. Our COVID-19 measuresconverting facilities are proving to be effective and we have not had any material disruptions to our operations.generally operational.
We have seenThe pandemic has had a significant negativemixed impact on demand for our products. Initially, demand for printing papers products.products was significantly impacted by the pandemic, but has seen a steady increase over the first nine months of 2021. Demand for our pulp, containerboard and corrugated box products has not been negatively impacted and in some cases has been positively impacted by COVID-19 to date, but could be unfavorably impacted going forward if negative economic conditions associated with COVID-19 persist or deteriorate. Furthermore, if there is a resurgencedate. However, all of the virus leadingour operations continue to additional governmental measures, such as stay-at-home orders or business and school closures, ourexperience higher supply chain costs and therefore our production, could be negatively impacted.a constrained transportation environment due in part to the impacts of COVID-19.
There continue to be significant uncertainties associated with the COVID-19 pandemic, including with respect to the various economic reopening plans and the resurgence of new variants of the virus in many areas;areas globally; the additional actions that may be taken by governmental authorities and private businesses, including mask and vaccine requirements, to attempt to contain the COVID-19 outbreak or to mitigate its impact; the extentefficacy, acceptance and durationavailability of social distancingvarious vaccines and stay-at-home orders;booster shots, as well as the possibility that strains of development of a vaccine;the virus may be resistant to current available vaccines; and the ongoing impact of COVID-19 on unemployment,economic conditions, including with respect to labor market conditions, economic activity, consumer behavior, supply shortages and consumer confidence. Developments related todisruptions and inflationary pressures. COVID-19 are significantly adversely affectinghas had a significant adverse effect on portions of our business, and could have a material adverse effect on our financial condition, results of operations and cash flows particularly if negativepublic health and/or global economic conditions persistdeteriorate.
Printing Papers Spinoff
On October 1, 2021, the Company completed the previously announced spin-off of its Printing Papers segment along with certain mixed-use coated paperboard and pulp businesses in North America, France and Russia into a standalone, publicly-traded company, Sylvamo Corporation. The transaction was implemented through the distribution of shares of the standalone company to International Paper's shareholders (the "Distribution"). As a result of the Distribution, Sylvamo Corporation is an independent public company that trades on the New York Stock Exchange under the symbol "SLVM".
The Distribution was made to the Company's stockholders of record as of the close of business on September 15, 2021 (the "Record Date"), and such stockholders received one share of Sylvamo Corporation common stock for every 11 shares of International Paper common stock held as of the close of business on the Record Date. The Company retained 19.9% of the shares of Sylvamo at the time of the separation, with the intent to monetize its investment and to provide additional proceeds to the Company. The Company is accounting for its ownership interest in Sylvamo at fair value as an investment in equity securities. In the third quarter of 2021, Sylvamo incurred $1.5 billion in debt in anticipation of a significant periodnet cash distribution of time or deteriorate.$1.4 billion to be made to the Company as part of the spin-off. See Note 17 – Debt for further details regarding the Sylvamo debt.
All current and historical operating results of the Sylvamo Corporation businesses will be presented as Discontinued Operations, net of tax, in the consolidated statement of operations in the fourth quarter of 2021. The spin-off was tax-free for the Company and its shareholders for U.S. federal income tax purposes.
In connection with the Distribution, on September 29, 2021, the Company and Sylvamo Corporation entered into a separation and distribution agreement as well as various other agreements that govern the relationships between the parties following the Distribution, including a transition services agreement, a tax matters agreement and an employee matters agreement. These
agreements provide for the allocation between International Paper Company and Sylvamo Corporation of assets, liabilities and obligations attributable to periods prior to, at and after the Distribution and govern certain relationships between International Paper and Sylvamo Corporation after the Distribution.
Recently Adopted Accounting Pronouncements
Financial Instruments - Credit Losses
In June 2016, the FASB issued ASU 2016-13, "Financial Instruments - Credit Losses (Topic 326): Measurement of Credit Losses on Financial Instruments." This guidance replaces the current incurred loss impairment method with a method that reflects expected credit losses. The Company adopted this guidance using the modified retrospective approach on January 1, 2020. As a result of using this approach, the Company recognized a cumulative effect adjustment of $2 million to the opening balance of retained earnings representing the adjustment to our opening allowance for doubtful accounts required to state our trade receivables and contract assets net of their expected credit losses, net of deferred taxes.
Recently Issued Accounting Pronouncements Not Yet Adopted
Reference Rate Reform
In March 2020, the FASB issued ASU 2020-04, "Reference Rate Reform (Topic 848): Facilitation of the Effects of Reference Rate Reform on Financial Reporting." This guidance provides companies with optional guidance to ease the potential accounting burden associated with transitioning away from reference rates that are expected to be discontinued. This guidance
is effective upon issuance and generally can be applied through December 31, 2022. The Company is currently evaluating the provisions of this guidance.
Income Taxes
In December 2019, the FASB issued ASU 2019-12, "Income Taxes (Topic 740): Simplifying the Accounting for Income Taxes." This guidance removes certain exceptions from recognizing deferred taxes for investments, performing intraperiod allocation and calculating income taxes in interim periods. It also adds guidance to reduce complexity in certain areas, including recognizing deferred taxes for tax goodwill and allocating taxes to members of a consolidated group. This guidance is effective for annual reporting periods beginning after December 15, 2020, and interim periods within those years. Early adoption of the amendments is permitted, including adoption in any interim period for public business entities for periods for which financial statements have not yet been issued. The Company plans to early adopt the provisions of this guidance in the fourth quarter of 2020 and does not expect the impact to be material.
Generally, the Company recognizes revenue on a point-in-time basis when the customer takes title to the goods and assumes the risks and rewards for the goods. For customized goods where the Company has a legally enforceable right to payment for the goods, the Company recognizes revenue over time which, generally, is as the goods are produced.
Disaggregated Revenue
A geographic disaggregation of revenues across our company segmentation in the following tables provides information to assist in evaluating the nature, timing and uncertainty of revenue and cash flows and how they may be impacted by economic factors.
| | | | | | | | | | | | | | | | | | | | | | | | | | | | | | | | |
| | Three Months Ended September 30, 2020 |
| In millions | | Industrial Packaging | | Global Cellulose Fibers | | Printing Papers | | Corporate and Inter-segment Sales | | Total |
| Primary Geographical Markets (a) | | | | | | | | | | |
| United States | | $ | 3,169 | | | $ | 479 | | | $ | 362 | | | $ | 44 | | | $ | 4,054 | |
| EMEA | | 394 | | | 59 | | | 244 | | | (3) | | | 694 | |
| Pacific Rim and Asia | | 15 | | | 26 | | | 6 | | | 10 | | | 57 | |
| Americas, other than U.S. | | 190 | | | 0 | | | 131 | | | (3) | | | 318 | |
| Total | | $ | 3,768 | | | $ | 564 | | | $ | 743 | | | $ | 48 | | | $ | 5,123 | |
| | | | | | | | | | |
| Operating Segments | | | | | | | | | | |
| North American Industrial Packaging | | $ | 3,351 | | | $ | — | | | $ | — | | | $ | — | | | $ | 3,351 | |
| EMEA Industrial Packaging | | 306 | | | — | | | — | | | — | | | 306 | |
| Brazilian Industrial Packaging | | 52 | | | — | | | — | | | — | | | 52 | |
| European Coated Paperboard | | 90 | | | — | | | — | | | — | | | 90 | |
| Global Cellulose Fibers | | — | | | 564 | | | — | | | — | | | 564 | |
| North American Printing Papers | | — | | | — | | | 362 | | | — | | | 362 | |
| Brazilian Papers | | — | | | — | | | 150 | | | — | | | 150 | |
| European Papers | | — | | | — | | | 232 | | | — | | | 232 | |
| Indian Papers | | — | | | — | | | 0 | | | — | | | 0 | |
| Intra-segment Eliminations | | (31) | | | — | | | (1) | | | — | | | (32) | |
| Corporate & Inter-segment Sales | | — | | | — | | | — | | | 48 | | | 48 | |
| Total | | $ | 3,768 | | | $ | 564 | | | $ | 743 | | | $ | 48 | | | $ | 5,123 | |
| | | | | | | | | | | | | | | | | | | | | | | | | | | | | | | | |
| | Three Months Ended September 30, 2021 |
| In millions | | Industrial Packaging | | Global Cellulose Fibers | | Printing Papers | | Corporate and Inter-segment Sales | | Total |
| Primary Geographical Markets (a) | | | | | | | | | | |
| United States | | $ | 3,514 | | | $ | 623 | | | $ | 425 | | | $ | 50 | | | $ | 4,612 | |
| EMEA | | 383 | | | 69 | | | 232 | | | (1) | | | 683 | |
| Pacific Rim and Asia | | 12 | | | 37 | | | 8 | | | 3 | | | 60 | |
| Americas, other than U.S. | | 178 | | | — | | | 181 | | | — | | | 359 | |
| Total | | $ | 4,087 | | | $ | 729 | | | $ | 846 | | | $ | 52 | | | $ | 5,714 | |
| | | | | | | | | | |
| Operating Segments | | | | | | | | | | |
| North American Industrial Packaging | | $ | 3,738 | | | $ | — | | | $ | — | | | $ | — | | | $ | 3,738 | |
| EMEA Industrial Packaging | | 331 | | | — | | | — | | | — | | | 331 | |
| European Coated Paperboard | | 52 | | | — | | | — | | | — | | | 52 | |
| Global Cellulose Fibers | | — | | | 729 | | | — | | | — | | | 729 | |
| North American Printing Papers | | — | | | — | | | 425 | | | — | | | 425 | |
| Brazilian Papers | | — | | | — | | | 200 | | | — | | | 200 | |
| European Papers | | — | | | — | | | 218 | | | — | | | 218 | |
| Intra-segment Eliminations | | (34) | | | — | | | 3 | | | — | | | (31) | |
| Corporate & Inter-segment Sales | | — | | | — | | | — | | | 52 | | | 52 | |
| Total | | $ | 4,087 | | | $ | 729 | | | $ | 846 | | | $ | 52 | | | $ | 5,714 | |
(a) Net sales are attributed to countries based on the location of the seller.
| | | | | | | | | | | | | | | | | | | | | | | | | | | | | | | | |
| | Nine Months Ended September 30, 2020 |
| In millions | | Industrial Packaging | | Global Cellulose Fibers | | Printing Papers | | Corporate and Inter-segment Sales | | Total |
| Primary Geographical Markets (a) | | | | | | | | | | |
| United States | | $ | 9,364 | | | $ | 1,507 | | | $ | 1,069 | | | $ | 146 | | | $ | 12,086 | |
| EMEA | | 1,213 | | | 175 | | | 765 | | | (11) | | | 2,142 | |
| Pacific Rim and Asia | | 43 | | | 55 | | | 20 | | | 20 | | | 138 | |
| Americas, other than U.S. | | 600 | | | 0 | | | 380 | | | (5) | | | 975 | |
| Total | | $ | 11,220 | | | $ | 1,737 | | | $ | 2,234 | | | $ | 150 | | | $ | 15,341 | |
| | | | | | | | | | |
| Operating Segments | | | | | | | | | | |
| North American Industrial Packaging | | $ | 9,947 | | | $ | — | | | $ | — | | | $ | — | | | $ | 9,947 | |
| EMEA Industrial Packaging | | 953 | | | — | | | — | | | — | | | 953 | |
| Brazilian Industrial Packaging | | 148 | | | — | | | — | | | — | | | 148 | |
| European Coated Paperboard | | 266 | | | — | | | — | | | — | | | 266 | |
| Global Cellulose Fibers | | — | | | 1,737 | | | — | | | — | | | 1,737 | |
| North American Printing Papers | | — | | | — | | | 1,073 | | | — | | | 1,073 | |
| Brazilian Papers | | — | | | — | | | 434 | | | — | | | 434 | |
| European Papers | | — | | | — | | | 728 | | | — | | | 728 | |
| Indian Papers | | — | | | — | | | 0 | | | — | | | 0 | |
| Intra-segment Eliminations | | (94) | | | — | | | (1) | | | — | | | (95) | |
| Corporate & Inter-segment Sales | | — | | | — | | | — | | | 150 | | | 150 | |
| Total | | $ | 11,220 | | | $ | 1,737 | | | $ | 2,234 | | | $ | 150 | | | $ | 15,341 | |
| | | | | | | | | | | | | | | | | | | | | | | | | | | | | | | | |
| | Nine Months Ended September 30, 2021 |
| In millions | | Industrial Packaging | | Global Cellulose Fibers | | Printing Papers | | Corporate and Inter-segment Sales | | Total |
| Primary Geographical Markets (a) | | | | | | | | | | |
| United States | | $ | 10,125 | | | $ | 1,682 | | | $ | 1,195 | | | $ | 139 | | | $ | 13,141 | |
| EMEA | | 1,371 | | | 209 | | | 765 | | | (6) | | | 2,339 | |
| Pacific Rim and Asia | | 44 | | | 90 | | | 25 | | | 10 | | | 169 | |
| Americas, other than U.S. | | 556 | | | — | | | 488 | | | — | | | 1,044 | |
| Total | | $ | 12,096 | | | $ | 1,981 | | | $ | 2,473 | | | $ | 143 | | | $ | 16,693 | |
| | | | | | | | | | |
| Operating Segments | | | | | | | | | | |
| North American Industrial Packaging | | $ | 10,810 | | | $ | — | | | $ | — | | | $ | — | | | $ | 10,810 | |
| EMEA Industrial Packaging | | 1,121 | | | — | | | — | | | — | | | 1,121 | |
| European Coated Paperboard | | 252 | | | — | | | — | | | — | | | 252 | |
| Global Cellulose Fibers | | — | | | 1,981 | | | — | | | — | | | 1,981 | |
| North American Printing Papers | | — | | | — | | | 1,201 | | | — | | | 1,201 | |
| Brazilian Papers | | — | | | — | | | 557 | | | — | | | 557 | |
| European Papers | | — | | | — | | | 723 | | | — | | | 723 | |
| Intra-segment Eliminations | | (87) | | | — | | | (8) | | | — | | | (95) | |
| Corporate & Inter-segment Sales | | — | | | — | | | — | | | 143 | | | 143 | |
| Total | | $ | 12,096 | | | $ | 1,981 | | | $ | 2,473 | | | $ | 143 | | | $ | 16,693 | |
(a) Net sales are attributed to countries based on the location of the seller.
| | | | | | | | | | | | | | | | | | | | | | | | | | | | | | | | |
| | Three Months Ended September 30, 2019 |
| In millions | | Industrial Packaging | | Global Cellulose Fibers | | Printing Papers | | Corporate & Intersegment | | Total |
Primary Geographical Markets (a) | | | | | | | | | | |
| United States | | $ | 3,180 | | | $ | 535 | | | $ | 486 | | | $ | 56 | | | $ | 4,257 | |
| EMEA | | 415 | | | 62 | | | 315 | | | (1) | | | 791 | |
| Pacific Rim and Asia | | 20 | | | 27 | | | 47 | | | 3 | | | 97 | |
| Americas, other than U.S. | | 205 | | | 0 | | | 223 | | | (5) | | | 423 | |
| Total | | $ | 3,820 | | | $ | 624 | | | $ | 1,071 | | | $ | 53 | | | $ | 5,568 | |
| | | | | | | | | | |
| Operating Segments | | | | | | | | | | |
| North American Industrial Packaging | | $ | 3,368 | | | $ | — | | | $ | — | | | $ | — | | | $ | 3,368 | |
| EMEA Industrial Packaging | | 324 | | | — | | | — | | | — | | | 324 | |
| Brazilian Industrial Packaging | | 61 | | | — | | | — | | | — | | | 61 | |
| European Coated Paperboard | | 92 | | | — | | | — | | | — | | | 92 | |
| Global Cellulose Fibers | | — | | | 624 | | | — | | | — | | | 624 | |
| North American Printing Papers | | — | | | — | | | 492 | | | — | | | 492 | |
| Brazilian Papers | | — | | | — | | | 247 | | | — | | | 247 | |
| European Papers | | — | | | — | | | 299 | | | — | | | 299 | |
| Indian Papers | | — | | | — | | | 38 | | | — | | | 38 | |
| Intra-segment Eliminations | | (25) | | | — | | | (5) | | | — | | | (30) | |
| Corporate & Inter-segment Sales | | — | | | — | | | — | | | 53 | | | 53 | |
| Total | | $ | 3,820 | | | $ | 624 | | | $ | 1,071 | | | $ | 53 | | | $ | 5,568 | |
| | | | | | | | | | | | | | | | | | | | | | | | | | | | | | | | |
| | Three Months Ended September 30, 2020 |
| In millions | | Industrial Packaging | | Global Cellulose Fibers | | Printing Papers | | Corporate & Intersegment | | Total |
Primary Geographical Markets (a) | | | | | | | | | | |
| United States | | $ | 3,169 | | | $ | 479 | | | $ | 362 | | | $ | 44 | | | $ | 4,054 | |
| EMEA | | 394 | | | 59 | | | 244 | | | (3) | | | 694 | |
| Pacific Rim and Asia | | 15 | | | 26 | | | 6 | | | 10 | | | 57 | |
| Americas, other than U.S. | | 190 | | | — | | | 131 | | | (3) | | | 318 | |
| Total | | $ | 3,768 | | | $ | 564 | | | $ | 743 | | | $ | 48 | | | $ | 5,123 | |
| | | | | | | | | | |
| Operating Segments | | | | | | | | | | |
| North American Industrial Packaging | | $ | 3,351 | | | $ | — | | | $ | — | | | $ | — | | | $ | 3,351 | |
| EMEA Industrial Packaging | | 306 | | | — | | | — | | | — | | | 306 | |
| Brazilian Industrial Packaging | | 52 | | | — | | | — | | | — | | | 52 | |
| European Coated Paperboard | | 90 | | | — | | | — | | | — | | | 90 | |
| Global Cellulose Fibers | | — | | | 564 | | | — | | | — | | | 564 | |
| North American Printing Papers | | — | | | — | | | 362 | | | — | | | 362 | |
| Brazilian Papers | | — | | | — | | | 150 | | | — | | | 150 | |
| European Papers | | — | | | — | | | 232 | | | — | | | 232 | |
| Intra-segment Eliminations | | (31) | | | — | | | (1) | | | — | | | (32) | |
| Corporate & Inter-segment Sales | | — | | | — | | | — | | | 48 | | | 48 | |
| Total | | $ | 3,768 | | | $ | 564 | | | $ | 743 | | | $ | 48 | | | $ | 5,123 | |
(a) Net sales are attributed to countries based on the location of the seller.
| | | | | | | | | | | | | | | | | | | | | | | | | | | | | | | | |
| | Nine Months Ended September 30, 2019 |
| In millions | | Industrial Packaging | | Global Cellulose Fibers | | Printing Papers | | Corporate & Intersegment | | Total |
Primary Geographical Markets (a) | | | | | | | | | | |
| United States | | $ | 9,531 | | | $ | 1,656 | | | $ | 1,448 | | | $ | 174 | | | $ | 12,809 | |
| EMEA | | 1,263 | | | 207 | | | 986 | | | (8) | | | 2,448 | |
| Pacific Rim and Asia | | 50 | | | 111 | | | 167 | | | 9 | | | 337 | |
| Americas, other than U.S. | | 672 | | | 0 | | | 623 | | | (11) | | | 1,284 | |
| Total | | $ | 11,516 | | | $ | 1,974 | | | $ | 3,224 | | | $ | 164 | | | $ | 16,878 | |
| | | | | | | | | | |
| Operating Segments | | | | | | | | | | |
| North American Industrial Packaging | | $ | 10,158 | | | $ | — | | | $ | — | | | $ | — | | | $ | 10,158 | |
| EMEA Industrial Packaging | | 994 | | | — | | | — | | | — | | | 994 | |
| Brazilian Industrial Packaging | | 176 | | | — | | | — | | | — | | | 176 | |
| European Coated Paperboard | | 275 | | | — | | | — | | | — | | | 275 | |
| Global Cellulose Fibers | | — | | | 1,974 | | | — | | | — | | | 1,974 | |
| North American Printing Papers | | — | | | — | | | 1,474 | | | — | | | 1,474 | |
| Brazilian Papers | | — | | | — | | | 702 | | | — | | | 702 | |
| European Papers | | — | | | — | | | 929 | | | — | | | 929 | |
| Indian Papers | | — | | | — | | | 144 | | | — | | | 144 | |
| Intra-segment Eliminations | | (87) | | | — | | | (25) | | | — | | | (112) | |
| Corporate & Inter-segment Sales | | — | | | — | | | — | | | 164 | | | 164 | |
| Total | | $ | 11,516 | | | $ | 1,974 | | | $ | 3,224 | | | $ | 164 | | | $ | 16,878 | |
| | | | | | | | | | | | | | | | | | | | | | | | | | | | | | | | |
| | Nine Months Ended September 30, 2020 |
| In millions | | Industrial Packaging | | Global Cellulose Fibers | | Printing Papers | | Corporate & Intersegment | | Total |
Primary Geographical Markets (a) | | | | | | | | | | |
| United States | | $ | 9,364 | | | $ | 1,507 | | | $ | 1,069 | | | $ | 146 | | | $ | 12,086 | |
| EMEA | | 1,213 | | | 175 | | | 765 | | | (11) | | | 2,142 | |
| Pacific Rim and Asia | | 43 | | | 55 | | | 20 | | | 20 | | | 138 | |
| Americas, other than U.S. | | 600 | | | — | | | 380 | | | (5) | | | 975 | |
| Total | | $ | 11,220 | | | $ | 1,737 | | | $ | 2,234 | | | $ | 150 | | | $ | 15,341 | |
| | | | | | | | | | |
| Operating Segments | | | | | | | | | | |
| North American Industrial Packaging | | $ | 9,947 | | | $ | — | | | $ | — | | | $ | — | | | $ | 9,947 | |
| EMEA Industrial Packaging | | 953 | | | — | | | — | | | — | | | 953 | |
| Brazilian Industrial Packaging | | 148 | | | — | | | — | | | — | | | 148 | |
| European Coated Paperboard | | 266 | | | — | | | — | | | — | | | 266 | |
| Global Cellulose Fibers | | — | | | 1,737 | | | — | | | — | | | 1,737 | |
| North American Printing Papers | | — | | | — | | | 1,073 | | | — | | | 1,073 | |
| Brazilian Papers | | — | | | — | | | 434 | | | — | | | 434 | |
| European Papers | | — | | | — | | | 728 | | | — | | | 728 | |
| Intra-segment Eliminations | | (94) | | | — | | | (1) | | | — | | | (95) | |
| Corporate & Inter-segment Sales | | — | | | — | | | — | | | 150 | | | 150 | |
| Total | | $ | 11,220 | | | $ | 1,737 | | | $ | 2,234 | | | $ | 150 | | | $ | 15,341 | |
(a) Net sales are attributed to countries based on the location of the seller.
Revenue Contract Balances
A contract asset is created when the Company recognizes revenue on its customized products prior to having an unconditional right to payment from the customer, which generally does not occur until title and risk of loss passes to the customer.
A contract liability is created when customers prepay for goods prior to the Company transferring those goods to the customer. The contract liability is reduced once control of the goods is transferred to the customer. The majority of our customer prepayments are received during the fourth quarter each year for goods that will be transferred to customers over the following twelve months. Contract liabilities of $20$25 million and $56$31 million are included in Other current liabilities in the accompanying condensed consolidated balance sheet as of September 30, 20202021 and December 31, 2019,2020, respectively. During the second quarter of 2021, the Company also recorded a contract liability of $115 million related to the April 2021 acquisition disclosed in Note 8.
The difference between the opening and closing balances of the Company's contract assets and contract liabilities primarily results from the difference between the price and quantity at comparable points in time for goods for which we have an unconditional right to payment or receive pre-paymentprepayment from the customer, respectively.
A summary of the changes in equity for the three months and nine months ended September 30, 20202021 and 20192020 is provided below:
| | | | | | | | | | | | | | | | | | | | | | | | | | | | | | | | | | | | | | | | | | | | | | | |
| Three Months Ended September 30, 2020 |
| In millions, except per share amounts | Common Stock Issued | | Paid-in Capital | | Retained Earnings | Accumulated Other Comprehensive Income (Loss) | | Common Stock Held In Treasury, At Cost | | Total
International
Paper
Shareholders’
Equity | | Noncontrolling
Interests | | Total
Equity | |
| Balance, July 1 | $ | 449 | | | $ | 6,283 | | | $ | 8,123 | | $ | (5,149) | | | $ | 2,649 | | | $ | 7,057 | | | $ | 3 | | | $ | 7,060 | | |
| Issuance of stock for various plans, net | — | | | 18 | | | — | | — | | | (2) | | | 20 | | | — | | | 20 | | |
| Repurchase of stock | — | | | — | | | — | | — | | | 1 | | | (1) | | | — | | | (1) | | |
Common stock dividends ($0.5125 per share) | — | | | — | | | (205) | | — | | | — | | | (205) | | | — | | | (205) | | |
| Transactions of equity method investees | — | | | 1 | | | — | | — | | | — | | | 1 | | | — | | | 1 | | |
| Comprehensive income (loss) | — | | | — | | | 204 | | 17 | | | — | | | 221 | | | 0 | | | 221 | | |
| Ending Balance, September 30 | $ | 449 | | | $ | 6,302 | | | $ | 8,122 | | $ | (5,132) | | | $ | 2,648 | | | $ | 7,093 | | | $ | 3 | | | $ | 7,096 | | |
| | | | | | | | | | | | | | | | | | | | | | | | | | | | | | | | | | | | | | | | | | | | | | | |
| Three Months Ended September 30, 2021 |
| In millions, except per share amounts | Common Stock Issued | | Paid-in Capital | | Retained Earnings | Accumulated Other Comprehensive Income (Loss) | | Common Stock Held In Treasury, At Cost | | Total
International
Paper
Shareholders’
Equity | | Noncontrolling
Interests | | Total
Equity | |
| Balance, July 1 | $ | 449 | | | $ | 6,330 | | | $ | 8,442 | | $ | (4,094) | | | $ | 2,775 | | | $ | 8,352 | | | $ | 2 | | | $ | 8,354 | | |
| Issuance of stock for various plans, net | — | | | 41 | | | — | | — | | | — | | | 41 | | | — | | | 41 | | |
| Repurchase of stock | — | | | — | | | — | | — | | | 212 | | | (212) | | | — | | | (212) | | |
Common stock dividends ($0.5125 per share) | — | | | — | | | (203) | | — | | | — | | | (203) | | | — | | | (203) | | |
| | | | | | | | | | | | | | | |
| Divestiture of noncontrolling interests | — | | | — | | | — | | — | | | — | | | — | | | (1) | | | (1) | | |
| Comprehensive income (loss) | — | | | — | | | 864 | | 780 | | | — | | | 1,644 | | | — | | | 1,644 | | |
| Ending Balance, September 30 | $ | 449 | | | $ | 6,371 | | | $ | 9,103 | | $ | (3,314) | | | $ | 2,987 | | | $ | 9,622 | | | $ | 1 | | | $ | 9,623 | | |
| | | | | | | | | | | | | | | | | | | | | | | | | | | | | | | | | | | | | | | | | | | | | | | |
| Nine Months Ended September 30, 2020 |
| In millions, except per share amounts | Common Stock Issued | | Paid-in Capital | | Retained Earnings | Accumulated Other Comprehensive Income (Loss) | | Common Stock Held In Treasury, At Cost | | Total
International
Paper
Shareholders’
Equity | | Noncontrolling
Interests | | Total
Equity | |
| Balance, January 1 | $ | 449 | | | $ | 6,297 | | | $ | 8,408 | | $ | (4,739) | | | $ | 2,702 | | | $ | 7,713 | | | $ | 5 | | | $ | 7,718 | | |
| Adoption of ASU 2016-13 measurement of credit losses on financial instruments | — | | | — | | | (2) | | — | | | — | | | (2) | | | — | | | (2) | | |
| Issuance of stock for various plans, net | — | | | (31) | | | — | | — | | | (96) | | | 65 | | | — | | | 65 | | |
| Repurchase of stock | — | | | — | | | — | | — | | | 42 | | | (42) | | | — | | | (42) | | |
Common stock dividends ($1.5375 per share) | — | | | — | | | (613) | | — | | | — | | | (613) | | | — | | | (613) | | |
| Transactions of equity method investees | — | | | 36 | | | — | | — | | | — | | | 36 | | | — | | | 36 | | |
| Comprehensive income (loss) | — | | | — | | | 329 | | (393) | | | — | | | (64) | | | (2) | | | (66) | | |
| Ending Balance, September 30 | $ | 449 | | | $ | 6,302 | | | $ | 8,122 | | $ | (5,132) | | | $ | 2,648 | | | $ | 7,093 | | | $ | 3 | | | $ | 7,096 | | |
| | | Three Months Ended September 30, 2019 | | Nine Months Ended September 30, 2021 |
| In millions, except per share amounts | In millions, except per share amounts | Common Stock Issued | | Paid-in Capital | | Retained Earnings | Accumulated Other Comprehensive Income (Loss) | | Common Stock Held In Treasury, At Cost | | Total
International
Paper
Shareholders’
Equity | | Noncontrolling
Interests | | Total
Equity | | In millions, except per share amounts | Common Stock Issued | | Paid-in Capital | | Retained Earnings | Accumulated Other Comprehensive Income (Loss) | | Common Stock Held In Treasury, At Cost | | Total
International
Paper
Shareholders’
Equity | | Noncontrolling
Interests | | Total
Equity | |
| Balance, July 1 | $ | 449 | | | $ | 6,229 | | | $ | 8,302 | | $ | (4,870) | | | $ | 2,628 | | | $ | 7,482 | | | $ | 17 | | | $ | 7,499 | | | |
| Balance, January 1 | | Balance, January 1 | $ | 449 | | | $ | 6,325 | | | $ | 8,070 | | $ | (4,342) | | | $ | 2,648 | | | $ | 7,854 | | | $ | 14 | | | $ | 7,868 | | |
| Issuance of stock for various plans, net | Issuance of stock for various plans, net | — | | | 32 | | | — | | — | | | (1) | | | 33 | | | — | | | 33 | | | Issuance of stock for various plans, net | — | | | 27 | | | — | | — | | | (86) | | | 113 | | | — | | | 113 | | |
| Repurchase of stock | Repurchase of stock | — | | | — | | | — | | — | | | 75 | | | (75) | | | — | | | (75) | | | Repurchase of stock | — | | | — | | | — | | — | | | 425 | | | (425) | | | — | | | (425) | | |
| Common stock dividends ($0.5000 per share) | — | | | — | | | (199) | | — | | | — | | | (199) | | | — | | | (199) | | | |
Common stock dividends ($1.5375 per share) | | Common stock dividends ($1.5375 per share) | — | | | — | | | (612) | | — | | | — | | | (612) | | | — | | | (612) | | |
| Transactions of equity method investees | Transactions of equity method investees | — | | | 0 | | | — | | — | | | — | | | 0 | | | — | | | 0 | | | Transactions of equity method investees | — | | | 19 | | | — | | — | | | — | | | 19 | | | — | | | 19 | | |
| Divestiture of noncontrolling interests | | Divestiture of noncontrolling interests | — | | | — | | | — | | — | | | — | | | — | | | (13) | | | (13) | | |
| Comprehensive income (loss) | Comprehensive income (loss) | — | | | — | | | 344 | | (144) | | | — | | | 200 | | | (2) | | | 198 | | | Comprehensive income (loss) | — | | | — | | | 1,645 | | 1,028 | | | — | | | 2,673 | | | — | | | 2,673 | | |
| Ending Balance, September 30 | Ending Balance, September 30 | $ | 449 | | | $ | 6,261 | | | $ | 8,447 | | $ | (5,014) | | | $ | 2,702 | | | $ | 7,441 | | | $ | 15 | | | $ | 7,456 | | | Ending Balance, September 30 | $ | 449 | | | $ | 6,371 | | | $ | 9,103 | | $ | (3,314) | | | $ | 2,987 | | | $ | 9,622 | | | $ | 1 | | | $ | 9,623 | | |
| | | Nine Months Ended September 30, 2019 | | Three Months Ended September 30, 2020 |
| In millions, except per share amounts | In millions, except per share amounts | Common Stock Issued | | Paid-in Capital | | Retained Earnings | Accumulated Other Comprehensive Income (Loss) | | Common Stock Held In Treasury, At Cost | | Total
International
Paper
Shareholders’
Equity | | Noncontrolling
Interests | | Total
Equity | | In millions, except per share amounts | Common Stock Issued | | Paid-in Capital | | Retained Earnings | Accumulated Other Comprehensive Income (Loss) | | Common Stock Held In Treasury, At Cost | | Total
International
Paper
Shareholders’
Equity | | Noncontrolling
Interests | | Total
Equity | |
| Balance, January 1 | $ | 449 | | | $ | 6,280 | | | $ | 7,465 | | $ | (4,500) | | | $ | 2,332 | | | $ | 7,362 | | | $ | 21 | | | $ | 7,383 | | | |
| Adoption of ASU 2018-02 reclassification of stranded tax effects resulting from Tax Reform | — | | | — | | | 529 | | (529) | | | — | | | — | | | — | | | 0 | | | |
| Balance, July 1 | | Balance, July 1 | $ | 449 | | | $ | 6,283 | | | $ | 8,123 | | $ | (5,149) | | | $ | 2,649 | | | $ | 7,057 | | | $ | 3 | | | $ | 7,060 | | |
| Issuance of stock for various plans, net | Issuance of stock for various plans, net | — | | | (52) | | | — | | — | | | (165) | | | 113 | | | — | | | 113 | | | Issuance of stock for various plans, net | — | | | 18 | | | — | | — | | | (2) | | | 20 | | | — | | | 20 | | |
| Repurchase of stock | Repurchase of stock | — | | | — | | | — | | — | | | 535 | | | (535) | | | — | | | (535) | | | Repurchase of stock | — | | | — | | | — | | — | | | 1 | | | (1) | | | — | | | (1) | | |
| Common stock dividends ($1.5000 per share) | — | | | — | | | (607) | | — | | | — | | | (607) | | | — | | | (607) | | | |
| Common stock dividends ($0.5125 per share) | | Common stock dividends ($0.5125 per share) | — | | | — | | | (205) | | — | | | — | | | (205) | | | — | | | (205) | | |
| Transactions of equity method investees | Transactions of equity method investees | — | | | 33 | | | — | | — | | | — | | | 33 | | | — | | | 33 | | | Transactions of equity method investees | — | | | 1 | | | — | | — | | | — | | | 1 | | | — | | | 1 | | |
| Comprehensive income (loss) | Comprehensive income (loss) | — | | | — | | | 1,060 | | 15 | | | — | | | 1,075 | | | (6) | | | 1,069 | | | Comprehensive income (loss) | — | | | — | | | 204 | | 17 | | | — | | | 221 | | | — | | | 221 | | |
| Ending Balance, September 30 | Ending Balance, September 30 | $ | 449 | | | $ | 6,261 | | | $ | 8,447 | | $ | (5,014) | | | $ | 2,702 | | | $ | 7,441 | | | $ | 15 | | | $ | 7,456 | | | Ending Balance, September 30 | $ | 449 | | | $ | 6,302 | | | $ | 8,122 | | $ | (5,132) | | | $ | 2,648 | | | $ | 7,093 | | | $ | 3 | | | $ | 7,096 | | |
| | | | | | | | | | | | | | | | | | | | | | | | | | | | | | | | | | | | | | | | | | | | | | | |
| Nine Months Ended September 30, 2020 |
| In millions, except per share amounts | Common Stock Issued | | Paid-in Capital | | Retained Earnings | Accumulated Other Comprehensive Income (Loss) | | Common Stock Held In Treasury, At Cost | | Total
International
Paper
Shareholders’
Equity | | Noncontrolling
Interests | | Total
Equity | |
| Balance, January 1 | $ | 449 | | | $ | 6,297 | | | $ | 8,408 | | $ | (4,739) | | | $ | 2,702 | | | $ | 7,713 | | | $ | 5 | | | $ | 7,718 | | |
| Adoption of ASU 2016-13 measurement of credit losses on financial instruments | — | | | — | | | (2) | | — | | | — | | | (2) | | | — | | | (2) | | |
| Issuance of stock for various plans, net | — | | | (31) | | | — | | — | | | (96) | | | 65 | | | — | | | 65 | | |
| Repurchase of stock | — | | | — | | | — | | — | | | 42 | | | (42) | | | — | | | (42) | | |
Common stock dividends ($1.5375 per share) | — | | | — | | | (613) | | — | | | — | | | (613) | | | — | | | (613) | | |
| Transactions of equity method investees | — | | | 36 | | | — | | — | | | — | | | 36 | | | — | | | 36 | | |
| Comprehensive income (loss) | — | | | — | | | 329 | | (393) | | | — | | | (64) | | | (2) | | | (66) | | |
| Ending Balance, September 30 | $ | 449 | | | $ | 6,302 | | | $ | 8,122 | | $ | (5,132) | | | $ | 2,648 | | | $ | 7,093 | | | $ | 3 | | | $ | 7,096 | | |
The following table presents changes in accumulated other comprehensive income (AOCI) for the three months and nine months ended September 30, 20202021 and 2019:2020:
| | | Three Months Ended
September 30, | | Nine Months Ended
September 30, | | Three Months Ended
September 30, | | Nine Months Ended
September 30, |
| In millions | In millions | | 2020 | | 2019 | | 2020 | | 2019 | In millions | 2021 | | 2020 | | 2021 | | 2020 |
| Defined Benefit Pension and Postretirement Adjustments | Defined Benefit Pension and Postretirement Adjustments | | Defined Benefit Pension and Postretirement Adjustments | |
| Balance at beginning of period | Balance at beginning of period | | $ | (2,192) | | | $ | (2,362) | | | $ | (2,277) | | | $ | (1,916) | | Balance at beginning of period | $ | (1,809) | | | $ | (2,192) | | | $ | (1,880) | | | $ | (2,277) | |
| Reclassification of stranded tax effects | | 0 | | | 0 | | | 0 | | | (527) | | |
| Other comprehensive income (loss) before reclassifications | | Other comprehensive income (loss) before reclassifications | 831 | | | — | | | 832 | | | — | |
| Amounts reclassified from accumulated other comprehensive income | Amounts reclassified from accumulated other comprehensive income | | 43 | | | 41 | | | 128 | | | 122 | | Amounts reclassified from accumulated other comprehensive income | 31 | | | 43 | | | 101 | | | 128 | |
| Balance at end of period | Balance at end of period | | (2,149) | | | (2,321) | | | (2,149) | | | (2,321) | | Balance at end of period | (947) | | | (2,149) | | | (947) | | | (2,149) | |
| Change in Cumulative Foreign Currency Translation Adjustments | Change in Cumulative Foreign Currency Translation Adjustments | | Change in Cumulative Foreign Currency Translation Adjustments | |
| Balance at beginning of period | Balance at beginning of period | | (2,950) | | | (2,508) | | | (2,465) | | | (2,581) | | Balance at beginning of period | (2,286) | | | (2,950) | | | (2,457) | | | (2,465) | |
| Other comprehensive income (loss) before reclassifications | Other comprehensive income (loss) before reclassifications | | (28) | | | (179) | | | (515) | | | (110) | | Other comprehensive income (loss) before reclassifications | (114) | | | (28) | | | (85) | | | (515) | |
| Amounts reclassified from accumulated other comprehensive income | Amounts reclassified from accumulated other comprehensive income | | 0 | | | 0 | | | 0 | | | 4 | | Amounts reclassified from accumulated other comprehensive income | 44 | | | — | | | 184 | | | — | |
| Other comprehensive income (loss) attributable to noncontrolling interest | Other comprehensive income (loss) attributable to noncontrolling interest | | 0 | | | 0 | | | 2 | | | 0 | | Other comprehensive income (loss) attributable to noncontrolling interest | — | | | — | | | 2 | | | 2 | |
| Balance at end of period | Balance at end of period | | (2,978) | | | (2,687) | | | (2,978) | | | (2,687) | | Balance at end of period | (2,356) | | | (2,978) | | | (2,356) | | | (2,978) | |
| Net Gains and Losses on Cash Flow Hedging Derivatives | Net Gains and Losses on Cash Flow Hedging Derivatives | | Net Gains and Losses on Cash Flow Hedging Derivatives | |
| Balance at beginning of period | Balance at beginning of period | | (7) | | | 0 | | | 3 | | | (3) | | Balance at beginning of period | 1 | | | (7) | | | (5) | | | 3 | |
| Other comprehensive income (loss) before reclassifications | Other comprehensive income (loss) before reclassifications | | (4) | | | (10) | | | (34) | | | (6) | | Other comprehensive income (loss) before reclassifications | (4) | | | (4) | | | 3 | | | (34) | |
| Reclassification of stranded tax effects | | 0 | | | 0 | | | 0 | | | (2) | | |
| | Amounts reclassified from accumulated other comprehensive income | Amounts reclassified from accumulated other comprehensive income | | 6 | | | 4 | | | 26 | | | 5 | | Amounts reclassified from accumulated other comprehensive income | (8) | | | 6 | | | (9) | | | 26 | |
| Balance at end of period | Balance at end of period | | (5) | | | (6) | | | (5) | | | (6) | | Balance at end of period | (11) | | | (5) | | | (11) | | | (5) | |
| Total Accumulated Other Comprehensive Income (Loss) at End of Period | Total Accumulated Other Comprehensive Income (Loss) at End of Period | | $ | (5,132) | | | $ | (5,014) | | | $ | (5,132) | | | $ | (5,014) | | Total Accumulated Other Comprehensive Income (Loss) at End of Period | $ | (3,314) | | | $ | (5,132) | | | $ | (3,314) | | | $ | (5,132) | |
The following table presents details of the reclassifications out of AOCI for the three months and nine months ended September 30, 20202021 and 2019:2020:
| | In millions: | In millions: | | Amounts Reclassified from Accumulated Other Comprehensive Income | Location of Amount Reclassified from AOCI | In millions: | Amount Reclassified from Accumulated Other Comprehensive Income | | Location of Amount Reclassified from AOCI |
| Three Months Ended
September 30, | | Nine Months Ended
September 30, | | Three Months Ended
September 30, | | Nine Months Ended
September 30, | |
| 2020 | | 2019 | | 2020 | | 2019 | | 2021 | | 2020 | | 2021 | | 2020 | |
| Defined benefit pension and postretirement items: | Defined benefit pension and postretirement items: | | Defined benefit pension and postretirement items: | |
| Prior-service costs | Prior-service costs | | $ | (5) | | | $ | (4) | | | $ | (15) | | | $ | (10) | | | (a) | Non-operating pension expense | Prior-service costs | $ | (5) | | | $ | (5) | | | $ | (17) | | | $ | (15) | | | (a) | Non-operating pension expense |
| Actuarial gains (losses) | Actuarial gains (losses) | | (52) | | | (50) | | | (155) | | | (152) | | | (a) | Non-operating pension expense | Actuarial gains (losses) | (36) | | | (52) | | | (118) | | | (155) | | | (a) | Non-operating pension expense |
| Total pre-tax amount | Total pre-tax amount | | (57) | | | (54) | | | (170) | | | (162) | | | Total pre-tax amount | (41) | | | (57) | | | (135) | | | (170) | | |
| Tax (expense) benefit | Tax (expense) benefit | | 14 | | | 13 | | | 42 | | | 40 | | | Tax (expense) benefit | 10 | | | 14 | | | 34 | | | 42 | | |
| Net of tax | | (43) | | | (41) | | | (128) | | | (122) | | | |
| Reclassification of stranded tax effects | | 0 | | | 0 | | | 0 | | | 527 | | | Retained Earnings | |
| Total, net of tax | Total, net of tax | | (43) | | | (41) | | | (128) | | | 405 | | | Total, net of tax | (31) | | | (43) | | | (101) | | | (128) | | |
| | Change in cumulative foreign currency translation adjustments: | Change in cumulative foreign currency translation adjustments: | | Change in cumulative foreign currency translation adjustments: | |
| Business acquisitions/divestitures | Business acquisitions/divestitures | | 0 | | | 0 | | | 0 | | | (4) | | | Cost of products sold | Business acquisitions/divestitures | (44) | | | — | | | (184) | | | — | | | Net (gains) losses on sales and impairments of businesses and Cost of products sold |
| Tax (expense) benefit | Tax (expense) benefit | | 0 | | | 0 | | | 0 | | | 0 | | | Tax (expense) benefit | — | | | — | | | — | | | — | | |
| Net of tax | Net of tax | | 0 | | | 0 | | | 0 | | | (4) | | | Net of tax | (44) | | | — | | | (184) | | | — | | |
| | Net gains and losses on cash flow hedging derivatives: | Net gains and losses on cash flow hedging derivatives: | | Net gains and losses on cash flow hedging derivatives: | |
| Foreign exchange contracts | Foreign exchange contracts | | (8) | | | (6) | | | (39) | | | (7) | | | (b) | Cost of products sold | Foreign exchange contracts | 10 | | | (8) | | | 12 | | | (39) | | | (b) | Cost of products sold |
| Total pre-tax amount | Total pre-tax amount | | (8) | | | (6) | | | (39) | | | (7) | | | Total pre-tax amount | 10 | | | (8) | | | 12 | | | (39) | | |
| Tax (expense)/benefit | Tax (expense)/benefit | | 2 | | | 2 | | | 13 | | | 2 | | | Tax (expense)/benefit | (2) | | | 2 | | | (3) | | | 13 | | |
| Net of tax | Net of tax | | (6) | | | (4) | | | (26) | | | (5) | | | Net of tax | 8 | | | (6) | | | 9 | | | (26) | | |
| Reclassification of stranded tax effects | | 0 | | | 0 | | | 0 | | | 2 | | | Retained Earnings | |
| Total, net of tax | | (6) | | | (4) | | | (26) | | | (3) | | | |
| | Total reclassifications for the period | Total reclassifications for the period | | $ | (49) | | | $ | (45) | | | $ | (154) | | | $ | 398 | | | Total reclassifications for the period | $ | (67) | | | $ | (49) | | | $ | (276) | | | $ | (154) | | |
(a)These accumulated other comprehensive income components are included in the computation of net periodic pension cost (see Note 19 for additional details). (b)This accumulated other comprehensive income component is included in our derivatives and hedging activities (see Note 18 for additional details).
Basic earnings per share is computed by dividing earnings by the weighted average number of common shares outstanding. Diluted earnings per share is computed assuming that all potentially dilutive securities were converted into common shares. There are no adjustments required to be made to net income for purposes of computing basic and diluted earnings per share. A reconciliation of the amounts included in the computation of basic earnings (loss) per share and diluted earnings (loss) per share is as follows:
| | | | Three Months Ended
September 30, | | Nine Months Ended
September 30, | | Three Months Ended
September 30, | | Nine Months Ended
September 30, |
| In millions, except per share amounts | In millions, except per share amounts | 2020 | | 2019 | | 2020 | | 2019 | In millions, except per share amounts | 2021 | | 2020 | | 2021 | | 2020 |
| Earnings (loss) attributable to International Paper Company common shareholders | Earnings (loss) attributable to International Paper Company common shareholders | $ | 204 | | | $ | 344 | | | $ | 329 | | | $ | 1,060 | | Earnings (loss) attributable to International Paper Company common shareholders | $ | 864 | | | $ | 204 | | | $ | 1,645 | | | $ | 329 | |
| Weighted average common shares outstanding | Weighted average common shares outstanding | 393.1 | | | 392.6 | | | 392.9 | | | 396.3 | | Weighted average common shares outstanding | 388.8 | | | 393.1 | | | 391.0 | | | 392.9 | |
| Effect of dilutive securities | Effect of dilutive securities | | Effect of dilutive securities | |
| Restricted performance share plan | Restricted performance share plan | 1.5 | | | 2.8 | | | 1.6 | | | 3.3 | | Restricted performance share plan | 3.8 | | | 1.5 | | | 4.3 | | | 1.6 | |
| Weighted average common shares outstanding – assuming dilution | Weighted average common shares outstanding – assuming dilution | 394.6 | | | 395.4 | | | 394.5 | | | 399.6 | | Weighted average common shares outstanding – assuming dilution | 392.6 | | | 394.6 | | | 395.3 | | | 394.5 | |
| Basic earnings (loss) per share attributable to International Paper Company Common Shareholders | Basic earnings (loss) per share attributable to International Paper Company Common Shareholders | $ | 0.52 | | | $ | 0.88 | | | $ | 0.84 | | | $ | 2.67 | | Basic earnings (loss) per share attributable to International Paper Company Common Shareholders | $ | 2.22 | | | $ | 0.52 | | | $ | 4.21 | | | $ | 0.84 | |
| Diluted earnings (loss) per share attributable to International Paper Company Common Shareholders | Diluted earnings (loss) per share attributable to International Paper Company Common Shareholders | $ | 0.52 | | | $ | 0.87 | | | $ | 0.83 | | | $ | 2.65 | | Diluted earnings (loss) per share attributable to International Paper Company Common Shareholders | $ | 2.20 | | | $ | 0.52 | | | $ | 4.16 | | | $ | 0.83 | |
2021: During the three months ended September 30, 2021, the Company recorded a $35 million pre-tax charge in Corporate related to early debt extinguishment costs and a $4 million pre-tax charge in Corporate for severance. The majority of the severance is expected to be paid over the next twelve months.
During the three months ended June 30, 2021, the Company recorded a $170 million pre-tax charge in Corporate related to early debt extinguishment costs and a $4 million pre-tax charge in Corporate for severance. The majority of the severance is expected to be paid over the next twelve months.
During the three months ended March 31, 2021, the Company recorded an $18 million pre-tax charge in Corporate related to early debt extinguishment costs and a $12 million pre-tax charge in the Industrial Packaging segment for severance related to the optimization of our EMEA Packaging business. The majority of the severance is expected to be paid over the next twelve months.
In connection with our Building a Better IP initiative, we expect to incur additional restructuring charges over the course of the initiative, which could be material. At this time, the plans have not been finalized.
2020: During the three months ended September 30, 2020, the Company recorded a $105 million pre-tax charge in Corporate related to early debt extinguishment costs.
During the three months ended June 30, 2020, the Company recorded an $18 million pre-tax charge in Corporate related to early debt extinguishment costs.
During the three months ended March 31, 2020, the Company recorded an $8 million pre-tax charge in Corporate related to early debt extinguishment costs.
2019: During the three months and nine months ended September 30, 2019, the Company recorded an $11 million pre-tax charge in Corporate, a $6 million pre-tax charge in the Printing Papers segment and a $4 million pre-tax charge in the Global Cellulose Fibers segment for severance related to an overhead cost reduction initiative. The majority of the severance was paid over the next twelve months.
2020:2021: In May 2020, the Company increased its noncontrolling interest in an entity that produces corrugated sheets. The equity purchase price was $64 million. The Company is party to various agreements with the entity which includes a containerboard supply agreement. The Company will account for its interest as an equity method investment.
2019:On June 28, 2019,April 1, 2021, the Company closed on the previously announced acquisition of two packaging businessesbox plants located in Portugal (Ovar) and France (Torigni and Cabourg) from DS Smith Packaging.Spain. The total purchase consideration, inclusive of working capital adjustments, was approximately €71 million (approximately $81$83 million at June 30, 2019based on the April 1, 2021 exchange rates).
The following table summarizes the finalprovisional fair value assigned to assets and liabilities acquired as of June 28, 2019:April 1, 2021:
| | | | | |
| In millions | |
| Cash and temporary investments | $ | 25 | |
| Accounts and notes receivable | 2210 | |
InventoryInventories | 83 | |
| Plants, properties and equipment | 3738 | |
| Goodwill | 2730 | |
| Intangible assets | 14 | |
Right of use assets | 3 | |
Deferred charges and other assets | 2 | |
| Total assets acquired | $ | 115100 | |
| Short-term debt | $ | 23 | |
| Accounts payable and accrued liabilities | 174 | |
| Other current liabilities | 51 | |
| Deferred income taxes | 4 | |
Long-term debt | 1 | |
Postretirement and postemployment benefit obligation | 3 | |
Long-term lease obligations | 29 | |
| Total liabilities assumed | 3417 | |
| Net assets acquired | $ | 8183 | |
Since the date of acquisition, Net sales of $9 million and $18 million and Earnings from continuing operations before income taxes and equity earnings of $0 and $1 million have been included in the Company's consolidated statement of operations for the three months and year to date ended September 30, 2021, respectively.
The purchase price and related allocation are preliminary and could be revised as a result of adjustments made to the purchase price, additional information obtained regarding assets acquired and liabilities assumed, and revisions of provisional estimates of fair values, including, but not limited to, the completion of independent appraisals and valuations related to inventory, property, plant and equipment and acquired intangible assets. Adjustments to provisional amounts will be finalized as new information becomes available, but within the adjustment period of up to one year from the acquisition date.
Pro forma information has not been included as it is impracticable to obtain the information due to the lack of availability of historical U.S. GAAP financial data. The results of the operations of these businesses do not have a material effect on the Company's condensed consolidated results of operations.
The Company has accounted for the above acquisition under ASC 805, "Business Combinations" and the results of operations have been included in International Paper's financial statements beginning with the date of acquisition.
In April 2021, the Company received a noncontrolling interest in a U.S-based corrugated packaging producer. In the second quarter, the Company recorded its investment of $115 million based on the fair value of the noncontrolling interest, and a corresponding contract liability that is amortized over 15 years. The Company is party to various agreements with the entity which includes a containerboard supply agreement. The Company is accounting for its interest as an equity method investment.
Kwidzyn Mill
2021: On August 6,2021, the Company completed the sale of its Kwidzyn, Poland mill for €669 million (approximately $794 million using the July 31, 2021 exchange rate) in cash, subject to final working capital and net debt adjustments. The business includes the pulp and paper mill in Kwidzyn and supporting functions. During the third quarter of 2021, the Company recorded a net gain of $360 million ($350 million after taxes) including a gain of $404 million ($394 million after taxes) related to the sale of net assets and a loss of $44 million (before and after taxes) related to the cumulative foreign currency translation loss. These charges are included in the Net (gains) losses on sales and impairments of businesses in the accompanying consolidated statement of operations and are included in the results of the Printing Papers segment. All current year and historical operating results for Kwidzyn will be presented as Discontinued Operations, net of tax, in the consolidated statement of operations in the fourth quarter of 2021.
Olmuksan International Paper
2021: On May 31, 2021, the Company completed the sale of its 90.38% ownership interest in Olmuksan International Paper, a corrugated packaging business in Turkey, to Mondi Group for €66 million (approximately $81 million using the May 31, 2021 exchange rate). During the second quarter of 2021, the Company recorded a gain of $6 million ($0 after taxes) related to the business working capital adjustment. This charge is included in the Net (gains) losses on sales and impairments of businesses in the accompanying consolidated statement of operations and is included in the results for the Industrial Packaging segment.
In conjunction with the announced agreement in the fourth quarter of 2020, a determination was made that the current book value of the Olmuksan International Paper disposal group exceeded its estimated fair value of $79 million which was based on the agreed upon transaction price. As a result, a preliminary charge of $123 million (before and after taxes) was recorded during the fourth quarter of 2020. During the first quarter of 2021, the Company recorded an additional charge of $2 million (before and after taxes) related to the cumulative foreign currency translation loss. This charge is included in the Net (gains) losses on sales and impairments of businesses in the accompanying consolidated statement of operations and is included in the results for the Industrial Packaging segment.
Brazil Industrial Packaging
2020: On March 29,October 14, 2020, the Company closed the previously announced that it had entered into an agreement to sellsale of its Brazilian Industrial Packaging business for R$330 million (approximately $58.5($58.5 million using the September 30, 2020 exchange rate)U.S. dollars), with R$280 million to be($49.6 million U.S. dollars) paid at closing and R$50 million ($8.9 million U.S. dollars) to be paid one year thereafter, subject to the final working capital adjustments.from closing. This business includes 3 containerboard mills and 4 box plants and the agreement follows International Paper's previously announced strategic review of the Brazilian Industrial Packaging business.
In conjunction with the announced agreement, a preliminarynet pre-tax chargecharges of $347 million ($340 million after taxes) waswere recorded duringin 2020. These charges included $327 million related to the first nine monthscumulative foreign currency translation loss and a $20 million loss related to the write down of 2020.the long-lived assets of the Brazilian Industrial Packaging business to their estimated fair value. These charges are included in Net (gains) losses on sales and impairments of businesses in the accompanying condensed consolidated statement of operations and isare included in the results for the Industrial Packaging segment. Subsequent to September 30, 2020, the transaction closed and final working capital adjustments, if any, will be recognized during the fourth quarter of 2020.
At September 30, 2020, all assets and liabilities related to the Brazilian Industrial Packaging business are classified as current assets held for sale and current liabilities held for sale in the accompanying condensed consolidated balance sheet.
The following summarizes the major classes of assets and liabilities of this business reconciled to total Assets held for sale and total Liabilities held for sale in the accompanying condensed consolidated balance sheet.
| | | | | |
In millions | September 30, 2020 |
Cash and temporary investments | $ | 11 | |
Accounts and notes receivable | 41 | |
Inventories | 22 | |
Other current assets | 1 | |
Plants, properties and equipment (net of impairment) | 28 | |
Deferred charges and other assets | 11 | |
Total Assets Held for Sale | $ | 114 | |
| |
Accounts payable and accrued liabilities | $ | 36 | |
Deferred income taxes | 3 | |
Other liabilities | 8 | |
Impairment reserve (cumulative foreign currency translation) | 329 | |
Total Liabilities Held for Sale | $ | 376 | |
2019: On October 30, 2019, the Company closed the previously announced sale of its controlling interest in International Paper APPM Limited (APPM) to West Coast Paper Mills (WCPM). During the second quarter of 2020 the Company sold substantially all of its remaining investment and recorded a gain of $6 million. During the third quarter of 2020 the Company sold its remaining immaterial investment in APPM.
Temporary Investments
Temporary investments with an original maturity of three months or less and money market funds with greater than three month maturities but with the right to redeem without notices are treated as cash equivalents and are stated at cost. Temporary investments totaled $450 million$3.2 billion and $335$358 million at September 30, 20202021 and December 31, 2019,2020, respectively.
Restricted Cash
A reconciliation of cash and temporary investments and restricted cash in the consolidated balance sheet to cash and temporary investments and restricted cash in the consolidated statement of cash flows for the nine months ended September 30, 2021 and 2020 is as follows:
| | | | | | | | | | | |
| Nine Months Ended September 30, |
| In millions | 2021 | | 2020 |
| Cash and Temporary Investments | $ | 2,122 | | | $ | 678 | |
| Restricted Cash | 1,499 | | | — | |
| Total Cash and Temporary Investments and Restricted Cash | $ | 3,621 | | | $ | 678 | |
The Company's restricted cash consists of the cash proceeds from the debt incurred by Sylvamo Corporation as part of the Printing Papers segment spin-off that was completed on October 1, 2021. Of this amount, approximately $1.4 billion was remitted to the Company in the form of a cash distribution. See Note 17 - Debt for further details regarding the Sylvamo debt and the use of the cash proceeds from the debt issuances.
Accounts and Notes Receivable
| | | | | | | | | | | |
| In millions | September 30, 2020 | | December 31, 2019 |
| Accounts and notes receivable, net: | | | |
| Trade | $ | 2,789 | | | $ | 3,020 | |
| Other | 245 | | | 260 | |
| Total | $ | 3,034 | | | $ | 3,280 | |
| | | | | | | | | | | |
| In millions | September 30, 2021 | | December 31, 2020 |
| Accounts and notes receivable, net: | | | |
| Trade | $ | 3,222 | | | $ | 2,776 | |
| Other | 327 | | | 288 | |
| Total | $ | 3,549 | | | $ | 3,064 | |
The allowance for expected credit losses was $86$64 million and $76 million at September 30, 20202021 and the allowance for doubtful accounts was $73 million at December 31, 2019.2020, respectively. Based on the Company's accounting estimates and the facts and circumstances available as of the reporting date, we believe our allowance for expected credit losses is adequate. While we have taken into account certain impacts of COVID-19 in connection with our estimate of the allowance for expected credit losses, it is possible that additional expected credit losses in excess of such allowance could occur if additional containment and mitigation measures are required or negative economic conditions persist or deteriorate as a result of of COVID-19.
Inventories
| | In millions | In millions | September 30, 2020 | | December 31, 2019 | In millions | September 30, 2021 | | December 31, 2020 |
| Raw materials | Raw materials | $ | 257 | | | $ | 298 | | Raw materials | $ | 241 | | | $ | 268 | |
| Finished pulp, paper and packaging | Finished pulp, paper and packaging | 1,023 | | | 1,192 | | Finished pulp, paper and packaging | 1,156 | | | 1,091 | |
| Operating supplies | Operating supplies | 638 | | | 659 | | Operating supplies | 569 | | | 627 | |
| Other | Other | 89 | | | 59 | | Other | 87 | | | 64 | |
| Total | Total | $ | 2,007 | | | $ | 2,208 | | Total | $ | 2,053 | | | $ | 2,050 | |
Plants, Properties and Equipment
Accumulated depreciation was $21.0$21.2 billion and $20.5$21.4 billion at September 30, 20202021 and December 31, 2019,2020, respectively. Depreciation expense was $300$302 million and $305$300 million for the three months ended September 30, 2021 and 2020, respectively, and 2019, respectively,$888 million and $902 million for both the nine months ended September 30, 2021 and 2020, and 2019.respectively.
Non-cash additions to plants, property and equipment included within accounts payable were $33$61 million and $164$41 million at September 30, 20202021 and December 31, 2019,2020, respectively.
Amounts invested in capital projects in the accompanying condensed consolidated statement of cash flows are presented net of insurance recoveries of $6 million received during the nine months ended September 30, 2021 and $40 million received during the nine months ended September 30, 2020. There were 0 insurance recoveries received during the nine months ended September 30, 2019.
Interest
Interest payments made during the nine months ended September 30, 2021 and 2020 and 2019 were $520$357 million and $591$520 million, respectively.
Amounts related to interest were as follows:
| | | | Three Months Ended
September 30, | | Nine Months Ended
September 30, | | Three Months Ended
September 30, | | Nine Months Ended
September 30, |
| In millions | In millions | 2020 | | 2019 | | 2020 | | 2019 | In millions | 2021 | | 2020 | | 2021 | | 2020 |
| Interest expense | Interest expense | $ | 148 | | | $ | 177 | | | $ | 467 | | | $ | 538 | | Interest expense | $ | 117 | | | $ | 148 | | | $ | 358 | | | $ | 467 | |
| Interest income | Interest income | 36 | | | 54 | | | 122 | | | 160 | | Interest income | 24 | | | 36 | | | 116 | | | 122 | |
| Capitalized interest costs | Capitalized interest costs | 9 | | | 7 | | | 27 | | | 21 | | Capitalized interest costs | 3 | | | 9 | | | 8 | | | 27 | |
Asset Retirement Obligations
The Company had recorded liabilities of $97$135 million and $96$116 million related to asset retirement obligations at September 30, 20202021 and December 31, 2019,2020, respectively.
International Paper leases various real estate, including certain operating facilities, warehouses, office space and land. The Company also leases material handling equipment, vehicles, and certain other equipment. The Company's leases have a
remaining lease termsterm of one yearup to 9632 years. Total lease cost was $73 million and $68 million for both the three months ended September 30, 2021 and 2020, respectively, and 2019,$216 million and $202 million and $206 million for the nine months ended September 30, 20202021 and 2019,2020, respectively.
Supplemental Balance Sheet Information Related to Leases
| | | | | | | | | | | | | | | | | | | | |
| In millions | | Classification | | September 30, 2020 | | December 31, 2019 |
| Assets | | | | | | |
| Operating lease assets | | Right-of-use assets | | $ | 422 | | | $ | 434 | |
| Finance lease assets | | Plants, properties and equipment, net (a) | | 95 | | | 103 | |
| Total leased assets | | | | $ | 517 | | | $ | 537 | |
| Liabilities | | | | | | |
| Current | | | | | | |
| Operating | | Other current liabilities | | $ | 137 | | | $ | 134 | |
| Finance | | Notes payable and current maturities of long-term debt | | 12 | | | 12 | |
| Noncurrent | | | | | | |
| Operating | | Long-term lease obligations | | 290 | | | 304 | |
| Finance | | Long-term debt | | 83 | | | 88 | |
| Total lease liabilities | | | | $ | 522 | | | $ | 538 | |
| | | | | | | | | | | | | | | | | | | | |
| In millions | | Classification | | September 30, 2021 | | December 31, 2020 |
| Assets | | | | | | |
| Operating lease assets | | Right-of-use assets | | $ | 405 | | | $ | 459 | |
| Finance lease assets | | Plants, properties and equipment, net (a) | | 87 | | | 95 | |
| Total leased assets | | | | $ | 492 | | | $ | 554 | |
| Liabilities | | | | | | |
| Current | | | | | | |
| Operating | | Other current liabilities | | $ | 146 | | | $ | 148 | |
| Finance | | Notes payable and current maturities of long-term debt | | 12 | | | 13 | |
| Noncurrent | | | | | | |
| Operating | | Long-term lease obligations | | 263 | | | 315 | |
| Finance | | Long-term debt | | 75 | | | 82 | |
| Total lease liabilities | | | | $ | 496 | | | $ | 558 | |
(a)Finance leases are recorded net of accumulated amortization of $49$62 million and $40$53 million as of September 30, 20202021 and December 31, 2019,2020, respectively.
The Company accounts for the following investments in affiliated companies under the equity method of accounting.
Graphic Packaging International Partners, LLC
The Company completed the transfer of its North American Consumer Packaging business in exchange for an initial 20.5% ownership interest (79,911,511(79,911,591 units) in Graphic Packaging International Partners, LLC (GPIP) in 2018. The Company has since fully monetized its investment in GPIP subsequently transferred the North American Consumer Packaging business to Graphic Packaging International, LLC (GPI), a wholly-owned subsidiary of GPIP that holds the assets of the combined business. On January 29, 2020, the Company exchanged 15,150,784 units of the aggregate units owned by the Company for an aggregated price of $250 million, resulting in a pre-tax gain of $33 million ($25 million after taxes) which was recordedwith transactions beginning in the first quarter of 2020. On August 7, 2020 through the second quarter 2021.
GPIP Monetization Transactions
| | | | | | | | | | | | | | | | | |
| Date | Transaction Type | Units | Proceeds | Pre-tax Gain | After-Tax Gain |
| In millions except units | | | | | |
| 2020 First Quarter | Units exchange | 15,150,784 | $ | 250 | | $ | 33 | | $ | 25 | |
| 2020 Third Quarter | Units exchange | 17,399,414 | 250 | | — | | — | |
| 2021 First Quarter | Units exchange and open market sale | 24,588,316 | 397 | | 33 | | 25 | |
| 2021 First Quarter | TRA | | | 41 | | 31 | |
| 2021 Second Quarter | Units exchange and open market sale | 22,773,077 | 402 | | 64 | | 48 | |
| 2021 Second Quarter | TRA (a) | | | 66 | | 50 | |
(a) The TRA entitles the Company exchanged 17,399,414 unitsto 50% of the aggregate units ownedamount of any tax benefits projected to be realized by GPIP upon the Company's exchange of its units. This amount is recorded in other receivables and is expected to be received within the next 12 months.
As of June 30, 2021, the Company forno longer had an aggregated price of $250 million, resulting in an immaterial gain which was recorded in the third quarter of 2020. As of September 30, 2020, the Company's ownership interest in GPIP was 14.8%.GPIP. The Company recorded equity earnings of $11 million and $10 million for the three months ended September 30, 2020 and 2019, respectively,$4 million and $29 million and $37 million for the nine months ended September 30, 2021 and 2020, and 2019, respectively. There were no equity earnings recorded for the three months ended September 30, 2021. The Company received cash dividends from GPIP of $16$5 million and $20$16 million during the first nine months of 20202021 and 2019, respectively. The Company's investment in GPIP was $693 million and $1.1 billion at September 30, 2020, and December 31, 2019, respectively, which was $347 million and $529 million, respectively, more than the Company's proportionate share of the entity's underlying net assets. The difference primarily relates to the basis difference between the fair value of our investment and the underlying net assets, and is generally amortized in equity earnings over a period consistent with the underlying long-lived assets. The Company is party to various agreements with GPI under which it sells fiber and other products to GPI. Sales under these agreements were $60 million and $69 million for the three months ended September 30, 2020 and 2019, respectively, and $190 million and $212 million for the nine months ended September 30, 2020 and 2019, respectively.
The Company continues to evaluate its investment in GPI relative to options available to further monetize this investment.
Summarized financial information for GPIP is presented in the following tables:
Balance Sheet
| | | | | | | | | | | |
| In millions | September 30, 2020 | | December 31, 2019 |
| Current assets | $ | 2,013 | | | $ | 1,796 | |
| Noncurrent assets | 5,662 | | | 5,482 | |
| Current liabilities | 1,692 | | | 1,178 | |
| Noncurrent liabilities | 3,617 | | | 3,244 | |
Income Statement
| | | | | | | | | | | | | | | | | | | | | | | |
| Three Months Ended
September 30, | | Nine Months Ended
September 30, |
| In millions | 2020 | | 2019 | | 2020 | | 2019 |
| Net sales | $ | 1,698 | | | $ | 1,581 | | | $ | 4,908 | | | $ | 4,640 | |
| Gross profit | 255 | | | 266 | | | 838 | | | 820 | |
| Income from continuing operations | 89 | | | 83 | | | 146 | | | 283 | |
| Net income | 89 | | | 83 | | | 146 | | | 283 | |
Ilim S.A.
The Company has a 50% equity interest in Ilim S.A. (Ilim), which has subsidiaries whose primary operations are in Russia. The Company recorded equity earnings (losses), net of taxes, of $(33)$95 million and $18$(33) million for the three months ended September 30, 20202021 and 2019,2020, respectively, and $(5)$245 million and $186$(5) million for the nine months ended September 30, 2021 and 2020, respectively. Foreign exchange gains (losses) included in equity earnings for the three months and 2019, respectively.nine months ended September 30, 2021, were not material and JSC Ilim Group had no U.S. dollar-denominated debt outstanding as of September 30, 2021. Equity earnings (losses) for the three months and nine months ended September 30, 2020, included after-tax foreign exchange losses of $55 million and $72 million, respectively, primarily on the remeasurement of U.S. dollar-denominated net debt. The Company received cash dividends from the joint venture of $141$144 million and $239$141 million during the first nine months of 20202021 and 2019,2020, respectively. At September 30, 20202021 and December 31, 2019,2020, the Company's investment in Ilim was $322$517 million and $508$393 million, respectively, which was $126$131 million and $136$127 million, respectively, more than the Company's proportionate share of the joint venture's underlying net assets. The differences primarily relate to currency translation adjustments and the basis difference between the fair value of our investment at acquisition and the underlying net assets. ThePrior to the spin-off of the Printing Papers segment on October 1, 2021, the Company iswas party to a joint marketing agreement with JSC Ilim Group, a subsidiary of Ilim, under which the Company purchases, marketspurchased, marketed and sellssold paper produced by JSC Ilim Group. Purchases under this agreement were $41$42 million and $51$41 million for the three months ended September 30, 20202021 and 2019,2020, respectively, and $131$125 million and $162$131 million for the nine months ended September 30, 2021 and 2020, and 2019, respectively. The joint marketing agreement was conveyed to Sylvamo Corporation as part of the spin-off transaction on October 1, 2021.
Summarized financial information for Ilim is presented in the following tables:
Balance Sheet
| | | | | | | | | | | |
| In millions | September 30, 2020 | | December 31, 2019 |
| Current assets | $ | 592 | | | $ | 804 | |
| Noncurrent assets | 2,442 | | | 2,813 | |
| Current liabilities | 613 | | | 1,015 | |
| Noncurrent liabilities | 2,015 | | | 1,844 | |
| Noncontrolling interests | 13 | | | 16 | |
Income Statement
| | | | | | | | | | | | | | | | | | | | | | | |
| Three Months Ended
September 30, | | Nine Months Ended
September 30, |
| In millions | 2020 | | 2019 | | 2020 | | 2019 |
| Net sales | $ | 498 | | | $ | 479 | | | $ | 1,474 | | | $ | 1,692 | |
| Gross profit | 191 | | | 196 | | | 597 | | | 836 | |
| Income (loss) from continuing operations | (62) | | | 41 | | | 7 | | | 388 | |
| Net income (loss) | (60) | | | 40 | | | 7 | | | 375 | |
| | | | | | | | | | | |
| In millions | September 30, 2021 | | December 31, 2020 |
| Current assets | $ | 935 | | | $ | 739 | |
| Noncurrent assets | 3,069 | | | 2,733 | |
| Current liabilities | 711 | | | 674 | |
| Noncurrent liabilities | 2,487 | | | 2,249 | |
| Noncontrolling interests | 34 | | | 17 | |
| | | | | | | | | | | | | | | | | | | | | | | |
| Three Months Ended
September 30, | | Nine Months Ended
September 30, |
| In millions | 2021 | | 2020 | | 2021 | | 2020 |
| Net sales | $ | 729 | | | $ | 498 | | | $ | 1,993 | | | $ | 1,474 | |
| Gross profit | 393 | | | 191 | | | 1,051 | | | 597 | |
| Income (loss) from continuing operations | 190 | | | (62) | | | 498 | | | 7 | |
| Net income (loss) | 182 | | | (60) | | | 481 | | | 7 | |
Goodwill
The following table presents changes in goodwill balances as allocated to each business segment for the nine-months ended September 30, 2020:2021:
| | | | | | | | | | | | | | | | | | | | | | | |
| In millions | Industrial
Packaging | | Global Cellulose Fibers | | Printing
Papers | | Total |
| Balance as of January 1, 2020 | | | | | | | |
| Goodwill | $ | 3,410 | | | $ | 52 | | | $ | 1,998 | | | $ | 5,460 | |
| Accumulated impairment losses | (296) | | | (52) | | | (1,765) | | | (2,113) | |
| 3,114 | | | 0 | | | 233 | | | 3,347 | |
| Currency translation and other (a) | 1 | | | 0 | | | (45) | | | (44) | |
| Goodwill additions/reductions | 1 | | | 0 | | | 0 | | | 1 | |
| Accumulated impairment loss additions / reductions | 0 | | | 0 | | | 0 | | | 0 | |
| Balance as of September 30, 2020 | | | | | | | |
| Goodwill | 3,412 | | | 52 | | | 1,953 | | | 5,417 | |
| Accumulated impairment losses | (296) | | | (52) | | | (1,765) | | | (2,113) | |
| Total | $ | 3,116 | | | $ | 0 | | | $ | 188 | | | $ | 3,304 | |
| | | | | | | | | | | | | | | | | | | | | | | |
| In millions | Industrial
Packaging | | Global Cellulose Fibers | | Printing
Papers | | Total |
| Balance as of January 1, 2021 | | | | | | | |
| Goodwill | $ | 3,410 | | | $ | 52 | | | $ | 1,966 | | | $ | 5,428 | |
| Accumulated impairment losses | (296) | | | (52) | | | (1,765) | | | (2,113) | |
| 3,114 | | | — | | | 201 | | | 3,315 | |
| Currency translation and other (a) | (5) | | | — | | | (8) | | | (13) | |
| Goodwill additions/reductions | 29 | | (b) | — | | | (57) | | (c) | (28) | |
| Accumulated impairment loss additions / reductions | — | | | — | | | — | | | — | |
| Balance as of September 30, 2021 | | | | | | | |
| Goodwill | 3,434 | | | 52 | | | 1,901 | | | 5,387 | |
| Accumulated impairment losses | (296) | | | (52) | | | (1,765) | | | (2,113) | |
| Total | $ | 3,138 | | | $ | — | | | $ | 136 | | | $ | 3,274 | |
(a)Represents the effects of foreign currency translations.
(c)Reflects the Kwidzyn sale.
Other Intangibles
Identifiable intangible assets comprised the following:
| | | | September 30, 2020 | | December 31, 2019 | | September 30, 2021 | | December 31, 2020 |
| In millions | In millions | Gross
Carrying
Amount | | Accumulated
Amortization | | Net Intangible Assets | | Gross
Carrying
Amount | | Accumulated
Amortization | | Net Intangible Assets | In millions | Gross
Carrying
Amount | | Accumulated
Amortization | | Net Intangible Assets | | Gross
Carrying
Amount | | Accumulated
Amortization | | Net Intangible Assets |
| Customer relationships and lists | Customer relationships and lists | $ | 534 | | | $ | 280 | | | $ | 254 | | | $ | 560 | | | $ | 275 | | | $ | 285 | | Customer relationships and lists | $ | 552 | | | $ | 314 | | | $ | 238 | | | $ | 542 | | | $ | 294 | | | $ | 248 | |
| Tradenames, patents and trademarks, and developed technology | Tradenames, patents and trademarks, and developed technology | 170 | | | 113 | | | 57 | | | 170 | | | 102 | | | 68 | | Tradenames, patents and trademarks, and developed technology | 170 | | | 128 | | | 42 | | | 170 | | | 117 | | | 53 | |
| Land and water rights | Land and water rights | 8 | | | 2 | | | 6 | | | 8 | | | 2 | | | 6 | | Land and water rights | 8 | | | 2 | | | 6 | | | 8 | | | 2 | | | 6 | |
| Software | Software | 25 | | | 25 | | | 0 | | | 26 | | | 25 | | | 1 | | Software | 17 | | | 17 | | | — | | | 25 | | | 24 | | | 1 | |
| Other | Other | 19 | | | 10 | | | 9 | | | 18 | | | 10 | | | 8 | | Other | 14 | | | 10 | | | 4 | | | 19 | | | 10 | | | 9 | |
| Total | Total | $ | 756 | | | $ | 430 | | | $ | 326 | | | $ | 782 | | | $ | 414 | | | $ | 368 | | Total | $ | 761 | | | $ | 471 | | | $ | 290 | | | $ | 764 | | | $ | 447 | | | $ | 317 | |
The Company recognized the following amounts as amortization expense related to intangible assets:
| | | | Three Months Ended
September 30, | | Nine Months Ended
September 30, | | Three Months Ended
September 30, | | Nine Months Ended
September 30, |
| In millions | In millions | 2020 | | 2019 | | 2020 | | 2019 | In millions | 2021 | | 2020 | | 2021 | | 2020 |
| Amortization expense related to intangible assets | Amortization expense related to intangible assets | $ | 17 | | | $ | 15 | | | $ | 43 | | | $ | 40 | | Amortization expense related to intangible assets | $ | 12 | | | $ | 17 | | | $ | 35 | | | $ | 43 | |
International Paper made income tax payments, net of refunds, of $203$389 million and $245$203 million for the nine months ended September 30, 20202021 and 2019,2020, respectively.
The Company currently estimates, that as a result of ongoing discussions, pending tax settlements and expirations of statutes of limitations, the amount of unrecognized tax benefits could be reduced by approximately $70$11 million during the next 12 months.
The Brazilian Federal Revenue Service has challenged the deductibility of goodwill amortization generated in a 2007 acquisition by International PaperSylvamo do Brasil Ltda., a wholly-owned subsidiary of the Company. The Company received
assessments for the tax years 2007-2015 totaling approximately $107 million in tax, and $342$351 million in interest, penalties, and fees as of September 30, 20202021 (adjusted for variation in currency exchange rates). After a previous favorable ruling challenging the basis for these assessments, we received other subsequent unfavorable decisions from the Brazilian Administrative Council of Tax Appeals. The Company has appealed and intends to further appeal these and any future unfavorable administrative judgments to the Brazilian federal courts; however, this tax litigation matter may take many years to resolve. The Company believes that it has appropriately evaluated the transaction underlying these assessments, and has concluded based on Brazilian tax law, that its position would be sustained.
The Company intends to vigorously defend its position against the current assessments and any similar assessments that may be issued for tax years subsequent to 2015.
On March 27, 2020, the U.S. government enacted the Coronavirus Aid, Relief, and Economic Security (CARES) Act ("the CARES Act"). The CARES Act provides various types This assessment pertains to a business that was conveyed to Sylvamo Corporation as of economic relief for individuals and businesses dueOctober 1, 2021, as part of our spin-off transaction. Pursuant to the COVID-19 pandemic,terms of the tax matters agreement entered into between the Company and Sylvamo Corporation, the Company will pay 60% and Sylvamo will pay 40%, on up to $300 million of any assessment related to this matter, and the Company will pay all amounts of the assessment over $300 million. The Brazilian government may enact a tax amnesty program that would allow Sylvamo do Brasil Ltda. to resolve this dispute for less than the assessed amount. In addition, all decisions concerning the conduct of the litigation related to this matter, including temporary corporate tax relief. We currently do not believe therestrategy settlement, pursuit and abandonment, will continue to be a material impactmade by the Company. Sylvamo will thus have no control over any decision related to this ongoing litigation. As of October 1, 2021, in connection with the income tax provisionrecording of the distribution of assets and liabilities resulting from the CARES Act.spin-off transaction, International Paper will establish a liability on the Company's balance sheet representing the initial fair value of the contingent obligation under the tax matters agreement. The Company's fair value estimate is in process and the Company is currently unable to quantify the liability to be recognized in the fourth quarter. It is possible the amount could be material.
Environmental
International PaperThe Company has been named as a potentially responsible party (PRP) in environmental remediation actions under various federal and state laws, including the Comprehensive Environmental Response, Compensation and Liability Act (CERCLA). Many of these proceedings involve the cleanup of hazardous substances at large commercial landfills that received waste from many different sources. While joint and several liability is authorized under CERCLA and equivalent state laws, as a practical matter, liability for CERCLA cleanups is typically allocated among the many PRPs. There are other remediation costs typically associated with the cleanup of hazardous substances at the Company’s current, closed or formerly-owned facilities, and recorded as liabilities in the balance sheet.
Remediation costs are recorded in the consolidated financial statements when they become probable and reasonably estimable. International PaperThe Company has estimated the probable liability associated with these environmental remediation matters, including those described herein, to be approximately $186$187 million ($195 million undiscounted) in the aggregate as of September 30, 2020.2021. Other than as described below, completion of required remedial actions is not expected to have a material effect on our consolidated financial statements.
Cass Lake: One of the matters included above arises out of a closed wood-treatment facility located in Cass Lake, Minnesota. In June 2011, the United States Environmental Protection Agency (EPA) selected and published a proposed soil remedy at the site with an estimated cost of $45 million at September 30, 2020.$46 million. In April 2020, the EPA issued a final plan concerning clean-up standards at a portion of the site, the estimated cost of which is included within the reserve referenced above. In October 2012, the Natural Resource Trustees for this site provided notice to International Paper and other PRPs of their intent to perform a Natural Resource Damage Assessment. It is premature to predict the outcome of the assessment or to estimate a loss or range of loss, if any, in excess of the applicable reserve referenced above, which may be incurred.
Kalamazoo River: The Company is a PRP with respect to the Allied Paper, Inc./Portage Creek/Kalamazoo River Superfund Site in Michigan. The EPA asserts that the site is contaminated by polychlorinated biphenyls (PCBs) primarily as a result of discharges from various paper mills located along the Kalamazoo River, including a paper mill (the Allied Paper Mill) formerly owned by St. Regis Paper Company (St. Regis). The Company is a successor in interest to St. Regis.
•Operable Unit 5, Area 1: In March 2016, the Company and other PRPs received a special notice letter from the EPA (i) inviting participation in implementing a remedy for a portion of the site known as Operable Unit 5, Area 1, and (ii) demanding reimbursement of EPA past costs totaling $37 million, including $19 million in past costs previously demanded by the EPA. The Company responded to the special notice letter. In December 2016, the EPA issued a unilateral administrative order to the Company and other PRPs to perform the remedy. The Company responded to the unilateral administrative order, agreeing to comply with the order subject to its sufficient cause defenses.
•Operable Unit 5, Area 2: In September 2017, the EPA issued a Record of Decision selecting the final remedy for a portion of the site known as Operable Unit 5, Area 2, but has not yet issued a special notice letter for implementing the remedy.
•Operable Unit 1: In October 2016, the Company and another PRP received a special notice letter from the EPA inviting participation in the remedial design component of the landfill remedy for the Allied Paper Mill, which is also known as Operable Unit 1. The Record of Decision establishing the final landfill remedy for the Allied Paper Mill was
issued by the EPA in September 2016. The Company responded to the Allied Paper Mill special notice letter in December 2016. In February 2017, the EPA informed the Company that it would make other arrangements for the performance of the remedial design.
In addition, in December 2019, the United States published notice in the Federal Register of a proposed consent decree with NCR Corporation (one of the parties to the allocation/apportionment litigation described below), the State of Michigan and natural resource trustees under which NCR would make payments of more than $100 million and perform work at the Sitein Operable Unit 5, Areas 2, 3, and 4 at an estimated cost of $135.7 million. The public comment period with respect toIn December 2020, the Federal District Court approved the proposed consent decree closed in February 2020 and we are awaiting the court's final decision.decree.
The Company’s CERCLA liability has not been finally determined with respect to these or any other portions of the site, and except as noted above, the Company has declined to perform any work or reimburse the EPA at this time. As noted below, the Company is involved in allocation/apportionment litigation with regard to the site. Accordingly, it is premature to predict the outcome or estimate our maximum reasonably possible loss or range of loss with respect to this site. We have recorded a liability for future remediation costs at the site that are probable and reasonably estimable, and it remains reasonably possible that additional losses in excess of this recorded liability could be material.
The Company was named as a defendant by Georgia-Pacific Consumer Products LP, Fort James Corporation and Georgia Pacific LLC in a contribution and cost recovery action for alleged pollution at the site. NCR Corporation and Weyerhaeuser Company are also named as defendants in the suit. The suit seeks contribution under CERCLA for costs purportedly expended by plaintiffs ($79 million as of the filing of the complaint) and for future remediation costs. In June 2018, the Court issued its Final Judgment and Order, which fixed the past cost amount at approximately $50 million (plus interest to be determined) and allocated to the Company a 15% share of responsibility for those past costs. The Court did not address responsibility for future costs in its decision. In July 2018, the Company and each of the other parties filed notices appealing the Final Judgment and prior orders incorporated into that Judgment. The proposed consent decree by NCR described above, if entered, would result in the termination of NCR's involvement in the appeal.Company appeal is pending.
Harris County: International Paper and McGinnis Industrial Maintenance Corporation (MIMC), a subsidiary of Waste Management, Inc. (WMI), are PRPs at the San Jacinto River Waste Pits Superfund Site in Harris County, Texas. The PRPs have been actively participating in the activities at the site and share the costs of these activities.
In October 2017, the EPA issued a Record of Decision (ROD) selecting the final remedy for the site: removal and relocation of the waste material from both the northern and southern impoundments. The EPA did not specify the methods or practices needed to perform this work. The EPA’s selected remedy was accompanied by a cost estimate of approximately $115 million ($105 million for the northern impoundment, and $10 million for the southern impoundment). Subsequent to the issuance of the ROD, there have been numerous meetings between the EPA and the PRPs, and the Company continues to work with the EPA and MIMC/WMI to develop the remedial design.
To this end, in April 2018, the PRPs entered into an Administrative Order on Consent (AOC) with the EPA, agreeing to work together to develop the remedial design until April 2021.for the northern impoundment. That remedial design work is ongoing. The AOC does not include any agreement to perform waste removal or other construction activity at the site. Rather, it involves adaptive management techniques and a pre-design investigation, the objectives of which include filling data gaps (including but not limited to post-Hurricane Harvey technical data generated prior to the ROD and not incorporated into the selected remedy), refining areas and volumes of materials to be addressed, determining if an excavation remedy is able to be implemented in a manner protective of human health and the environment, and investigating potential impacts of remediation activities to infrastructure in the vicinity.
During the first quarter of 2020, through a series of meetings among the Company, MIMC/WMI, our consultants, the EPA and the Texas Commission on Environmental Quality (TCEQ), progress was made to resolve key technical issues previously preventing the Company from determining the manner in which the selected remedy for the northern impoundment would be feasibly implemented. As a result of these developments, as of September 30, 2020, the Company has reserved the following amounts in relation to remediation at this site: (a) $10 million for the southern impoundment; and (b) $55 million for the northern impoundment, which represents the Company's 50% share of our estimate of the low end of the range of probable remediation costs.
AlthoughWe have submitted the Final Design Package for the southern impoundment to the EPA, and the EPA approved this plan May 7, 2021. With respect to the northern impoundment, although several key technical issues have been resolved, we still face significant challenges remediating the northern impoundmentthis area in a cost-efficient manner and without a release to the environment and therefore our discussions with the EPA on the best approach to remediation will continue. Because of ongoing questions regarding cost effectiveness, timing and gathering other technical data, additional losses in excess of our recorded liability are possible. We are currently unable to reasonably estimate
any further adjustment to our recorded liability or any loss or range of loss in excess of such liability; however, we believe it is unlikely any adjustment would be material.
Asbestos-Related Matters
We have been named as a defendant in various asbestos-related personal injury litigation, in both state and federal court, primarily in relation to the prior operations of certain companies previously acquired by the Company. The Company regularly conducts a comprehensive legal review of its asbestos liabilities and reviews recent and historical claims data. During the second quarter of 2020, as previously disclosed, we adjusted our estimated net liability associated with asbestos-related litigation concerning products sold by Champion International Corporation prior to our acquisition of Champion in 2000 to revise the time period associated with anticipated future claims through 2059, a commonly viewed end point when such claims are more predictable. We concluded the adjustment of $43 million to increase this net liability, which resulted in a liability of $75 million, net of estimated insurance recoveries, was not material to any period. As of September 30, 2020,2021, the Company's total recorded liability with respect to pending and future asbestos-related claims was $117$112 million, net of estimated insurance recoveries. While it is reasonably possible that the Company may incur losses in excess of its recorded liability with respect to asbestos-related matters, we do not believe additional material losses are probable.
Antitrust
Italy:In March 2017, the Italian Competition Authority (ICA) commenced an investigation into the Italian packaging industry to determine whether producers of corrugated sheets and boxes violated the applicable European competition law. In April 2019, the ICA concluded its investigation and issued initial findings alleging that over 30 producers, including our Italian packaging subsidiary (IP Italy), improperly coordinated the production and sale of corrugated sheets and boxes. On August 6, 2019, the ICA issued its decision and assessed IP Italy a fine of €29 million (approximately $32 million at current exchange rates) which was recorded in the third quarter of 2019. We appealed the ICA decision and our appeal was denied on May 25, 2021. However, we are vigorously appealing this decision of the ICAcontinue to the Italian courts andbelieve we have numerous and strong bases for our appeal.
Contract
Signature: In August 2014, a lawsuit captioned Signature Industrial Services LLC et al. v. International Paper Company was filed in state court in Texas. The Signature lawsuit arises out of approximately $1 million in disputed invoices related to the installation of new equipment at the Company's Orange, Texas mill. In addition to the invoices in dispute, Signature and its president allege consequential damages arising from the Company's nonpayment of those invoices. The lawsuit was tried before a jury in Beaumont, Texas, in May 2017. On June 1, 2017, the jury returned a verdict awarding approximately $125 million in damages to the plaintiffs. The Court issued a judgment on December 14, 2017, awarding the plaintiffs a total of approximately $137 million in actual and consequential damages, fees, costs and pre-judgment interest, and awarding post-judgment interest. The Company appealed this judgment and, on April 30, 2020, the Court of Appeals for the Thirteenth District of Texas issued a decision affirming in part and reversing and rendering judgment in favor of the Company in part. The Court affirmed approximately $14.8 million of the judgment. Otherwise, the Court rendered judgment in favor of the Company on the remainder of the jury’s verdict. The Company continues to have strong bases by which to challenge the affirmed portions of the awardICA decision, and has presented those arguments on appeal to the Supreme Court of Texas. The plaintiffswe have alsofurther appealed the decision to the Italian Council of the appellate court. We do not expect that potential losses, if any, related to this lawsuit will be material.State.
Taxes Other Than Payroll Taxes
In 2017, the Brazilian Federal Supreme Court decided that the state value-added tax (VAT) should not be included in the basis of federal VAT calculations. In 2018 and 2019, the Brazilian tax authorities published both an internal consultation and a normative ruling with a narrow interpretation of the effects of the case. We have determined that any related federal VAT refunds should be recognized when they are both probable and reasonably estimable. Based upon the best information available to us at that time, we have determined that the amount ofan estimated refund that iswas probable of being realized is limited to that determined by the tax authorities' narrow interpretation, for whichrealized. As of March 31, 2021, we havehad recognized a receivable of $11 million based upon the authorities narrow interpretation. On May 13, 2021, the Brazilian Federal Supreme Court ruled again on the case. This ruling provides a much broader definition of the state VAT, which increased the exclusion amount from the Federal VAT calculations. Therefore, we recognized an additional receivable of $70 million during the three months ended June 30, 2021, which brought the total receivable to $81 million as of June 30, 2021. The $70 million of income recognized during the second quarter of 2021 included income of $42 million in Cost of Products sold and income of $28 million in Interest expense, net in the accompanying condensed consolidated statement of operations. A portion of this receivable has been consumed by offsetting various taxes payable. After giving effect to this offset, the ending balance of the total receivable is $48 million as of September 30, 2020. It2021. The issue is possible that future court decisionsnow considered fully resolved, and guidance fromno further ruling by either the Brazilian Supreme Court or the Brazilian tax authorities could expand the scopeis expected. This receivable pertains to a business that was conveyed to Sylvamo Corporation as of the federal VAT refunds.October 1, 2021, as part of our spin-off transaction.
General
The Company is involved in various other inquiries, administrative proceedings and litigation relating to environmental and safety matters, personal injury, product liability, labor and employment, contracts, sales of property, intellectual property, tax, and other matters, some of which allege substantial monetary damages. See Note 14 for details regarding a tax matter. Assessments of lawsuits and claims can involve a series of complex judgments about future events, can rely heavily on
estimates and assumptions, and are otherwise subject to significant uncertainties. As a result, there can be no certainty that the Company will not ultimately incur charges in excess of presently recorded liabilities. The Company believes that loss contingencies arising from pending matters including the matters described herein, will not have a material effect on the consolidated financial position or liquidity of the Company. However, in light of the inherent uncertainties involved in pending or threatened legal matters, some of which are beyond the Company's control, and the large or indeterminate damages sought in some of these matters, a future adverse ruling, settlement, unfavorable development, or increase in accruals with respect to these matters could result in future charges that could be material to the Company's results of operations or cash flows in any particular reporting period.
Variable Interest Entities
In August 2021, the Timber Notes of $4.8 billion and the Extension Loans of $4.2 billion related to the 2015 Financing Entities both matured. We settled the Extension Loans at their maturity with the proceeds from the Timber Notes. This resulted in cash proceeds of approximately $630 million representing our equity in the variable interest entities. Maturity of the installment notes and termination of the monetization structure also resulted in a $72 million tax liability that is expected to be paid in the fourth quarter of 2021.
As of September 30, 2020,2021, the fair value of the Timber Notes and Extension Loans was $4.92 billion and $4.24 billion, respectively, forCompany's remaining deferred tax liability associated with the 2015 Financing Entities.Entities was $815 million. The Timber Notesnature and Extension Loans are classified as Level 2 within the fair value hierarchy, which is further defined in Note 17 in the Company's Annual Report on Form 10-K for the year ended December 31, 2019.
The Timber Notes of $4.85 billion mature in August 2021. The Extension Loans of $4.22 billion mature in November and December of 2020, and we are currently negotiating the extension of these third-party loans to August 2021 and expect to complete the extension before the maturity dates. The Timber Notes and Extension Loans are shown in Current nonrecourse financial assets of variable interest entities and Current nonrecourse financial liabilities of variable interest entities, respectively, on the accompanying balance sheet.
Failure to extend these third-party loans to August 2021 prior to their respective maturity dates in November and December of 2020 could necessitate a dispositiontiming of the installment notesincome tax due related to facilitatethese transactions is currently under review by the $4.22 billion debt payment. We are confident we would be able to dispose of the installment notes, if necessary.Internal Revenue Service.
Activity between the Company and the 2015 Financing Entities was as follows:
| | | | | | | | | | | | | | | | | | | | | | | |
| | Three Months Ended
September 30, | | Nine Months Ended
September 30, |
| In millions | 2020 | | 2019 | | 2020 | | 2019 |
| Revenue (a) | $ | 24 | | | $ | 24 | | | $ | 71 | | | $ | 71 | |
| Expense (a) | 32 | | | 32 | | | 96 | | | 96 | |
| Cash receipts (b) | 48 | | | 48 | | | 95 | | | 95 | |
| Cash payments (c) | 64 | | | 64 | | | 128 | | | 128 | |
| | | | | | | | | | | | | | | | | | | | | | | |
| | Three Months Ended
September 30, | | Nine Months Ended
September 30, |
| In millions | 2021 | | 2020 | | 2021 | | 2020 |
| Revenue (a) | $ | 14 | | | $ | 24 | | | $ | 61 | | | $ | 71 | |
| Expense (a) | 8 | | | 32 | | | 34 | | | 96 | |
| Cash receipts (b) | 48 | | | 48 | | | 95 | | | 95 | |
| Cash payments (c) | 24 | | | 64 | | | 38 | | | 128 | |
(a)The revenue and expense are included in Interest expense, net in the accompanying statement of operations.
(b)The cash receipts are interest received on the Financial assets of special purpose entities.
(c)The cash payments represent interest paid on Nonrecourse financial liabilities of special purpose entities.
As of September 30, 2020,2021, the fair value of the Timber Notes and Extension Loans was $2.29 billion and $2.12 billion, respectively, for the 2007 Financing Entities.Entities was $2.3 billion and $2.1 billion, respectively. The Timber Notes and Extension Loans are classified as Level 2 within the fair value hierarchy, which is further defined in Note 17 in the Company’s Annual Report on Form 10-K for the year ended December 31, 2019.2020.
The Timber Notes of $2.3 billion and the Extension Loans of $2.1 billion both mature in 2027 and are shown in Long-term nonrecourse financial assets of variable interest entities and Long-term nonrecourse financial liabilities of variable interest entities, respectively, on the accompanying balance sheet.
Activity between the Company and the 2007 Financing Entities was as follows:
| | | Three Months Ended
September 30, | | Nine Months Ended
September 30, | | Three Months Ended
September 30, | | Nine Months Ended
September 30, |
| In millions | In millions | 2020 | | 2019 | | 2020 | | 2019 | In millions | 2021 | | 2020 | | 2021 | | 2020 |
| Revenue (a) | Revenue (a) | $ | 7 | | | $ | 19 | | | $ | 35 | | | $ | 61 | | Revenue (a) | $ | 5 | | | $ | 7 | | | $ | 18 | | | $ | 35 | |
| Expense (b) | Expense (b) | 8 | | | 19 | | | 36 | | | 60 | | Expense (b) | 6 | | | 8 | | | 18 | | | 36 | |
| Cash receipts (c) | Cash receipts (c) | 5 | | | 16 | | | 28 | | | 48 | | Cash receipts (c) | 1 | | | 5 | | | 4 | | | 28 | |
| Cash payments (d) | Cash payments (d) | 8 | | | 17 | | | 34 | | | 53 | | Cash payments (d) | 4 | | | 8 | | | 12 | | | 34 | |
(a)The revenue is included in Interest expense, net in the accompanying statement of operations and includes approximately $5 million and $14 million for the three months and nine months ended September 30, 20202021 and 2019,2020, respectively, of accretion income for the amortization of the basis difference adjustment on the Financial assets of special purpose entities.
(b)The expense is included in Interest expense, net in the accompanying statement of operations and includes approximately $2 million and $5 million for the three months and nine months ended September 30, 20202021 and 2019,2020, respectively, of accretion expense for the amortization of the basis difference adjustment on the Nonrecourse financial liabilities of special purpose entities.
(c)The cash receipts are interest received on the Financial assets of special purpose entities.
(d)The cash payments are interest paid on Nonrecourse financial liabilities of special purpose entities.
The borrowing capacity of the Company's commercial paper program is $1.0 billion. Under the terms of the program, individual maturities on borrowings may vary, but not exceed one year from the date of issue. Interest bearing notes may be issued either as fixed or floating rate notes. As of September 30, 2020,2021, the Company had $140 million ofno borrowings outstanding under the program.
At September 30, 2021, International Paper’s credit facilities totaled $2.1 billion. The Agreements generally provide for interest rates at a floating rate index plus a pre-determined margin dependent upon International Paper’s credit rating. The Agreements include a $1.5 billion contractually committed bank facility. In June 2021, the Company extended the maturity date of the $1.5 billion credit facility from December 2022 to June 2026. The liquidity facilities also include up to $550 million of uncommitted financings based on eligible receivables balances under a receivables securitization program. In February of 2021, after considering the Company’s liquidity position in relation to the macroeconomic environment at such time, the Company
amended the receivable securitization program at weighted-average interest ratefrom a committed financing arrangement to an uncommitted financing arrangement. In August of 0.17%.2021, the Company amended the receivable securitization program to remove receivable balances related to Sylvamo. The borrowing limit of up to $550 million based on eligible receivables balances and the expiration date in April 2022 were unchanged by the February 2021 and August 2021 amendments. At September 30, 2021, there were no borrowings under either the bank facility or receivables securitization program.
In March 2020, the Company entered into a $750 million contractually committed 364-day revolving credit agreement with a syndicate of banks and other financial institutions which augmentsaugmented the Company's access to liquidity due to currentthe macroeconomic conditions related to COVID-19 and supplementssupplemented the Company's $1.5 billion five-year credit agreement. In October 2020,After considering the company extendedCompany’s liquidity position in relation to the expiration date of the $1.5 billion credit agreement from December 2021 to December 2022. As of September 30, 2020,macroeconomic environment at such time, the Company had 0 borrowings outstanding under eitherdetermined not to extend the $750 million revolving credit agreement or the $1.5 billion credit agreement.after its expiration on March 24, 2021.
In April 2020,anticipation of the Company's receivable securitization program was amended from an uncommitted financing arrangementspin-off, Sylvamo incurred $1.5 billion in debt during the third quarter of 2021 with the proceeds to be used for a committed financing arrangement with a borrowing limit updistribution to $550 million based on eligible receivable balances that expires in April 2022. As of September 30, 2020, the Company had 0and other expenses associated with the transaction. The Company was an obligor of the debt prior to the spin-off as Sylvamo was a wholly-owned subsidiary. Subsequent to the distribution of the net assets, the Company was no longer an obligor of the Sylvamo debt. The $1.5 billion of borrowings outstanding underis comprised of $450 million of 7.00% senior unsecured notes due 2029 issued in September 2021. It is also comprised of the program.senior secured credit facility that Sylvamo entered into in September 2021 which consisted of $450 million of borrowings related to its term loan “B” facility, $520 million of borrowings related to its term loan “F” facility, and the $100 million draw on its revolving credit facility which has a capacity of $450 million.
In July 2020, International Paper refinanced $122The Company's early debt reductions in the third quarter of 2021 were a debt tender in August 2021 of approximately $200 million related to debt with an interest rate of industrial development bonds that now have3.55% and a maturity date of 2029.
The Company’s early debt reductions in the second quarter of 2021 were a debt tender in June 2021 of approximately $558 million related to debt with interest rates ranging from 1.38%4.35% to 1.60%4.40% and maturity dates in 2025.
As a resultranging from 2047 to 2048 and open market repurchases of aapproximately $232 million related to debt tender offer in September 2020, the Company economically retired $700 million of corporate bonds with interest rates ranging from 3.00% to 3.80%5.15% and maturity dates ranging from 20242027 to 2027. This is in addition to the August 2020 economical debt extinguishment of $203 million of corporate bonds with an interest rate of 7.50% due in 2021 and brings the full year-to-date2046.
The Company’s early debt reductions in the first quarter of 2021 were open market repurchases of approximately $107 million related to the 2021 bondsdebt with interest rates ranging from 3.00% to $406 million.4.80% and maturities dates from 2027 to 2048.
The Company’s financial covenants require the maintenance of a minimum net worth, as defined in our debt agreements, of $9 billion and a total debt-to-capital ratio of less than 60%. Net worth is defined as the sum of common stock, paid-in capital and retained earnings, less treasury stock plus any cumulative goodwill impairment charges. The calculation also excludes accumulated other comprehensive income/loss and both the current and long-term Nonrecourse Financial Liabilities of Variable Interest Entities. The total debt-to-capital ratio is defined as total debt divided by the sum of total debt plus net worth. As of September 30, 2020,2021, we were in compliance with our debt covenants.
At September 30, 2020,2021, the fair value of International Paper’s $8.7$8.5 billion of debt was approximately $10.7$10.2 billion. The fair value of the Company’s long-term debt is estimated based on the quoted market prices for the same or similar issues. International Paper’s long-term debt is classified as Level 2 within the fair value hierarchy, which is further defined in Note 17 in the Company’s Annual Report on Form 10-K for the year ended December 31, 2019.
As a multinational company, International Paper is exposed to market risks, such as changes in interest rates, currency exchange rates and commodity prices.
The notional amounts of qualifying and non-qualifying financial instruments used in hedging transactions were as follows:
| | | | | | | | | | | |
| In millions | September 30, 2020 | | December 31, 2019 |
| Derivatives in Cash Flow Hedging Relationships: | | | |
| Foreign exchange contracts | $ | 245 | | | $ | 407 | |
| Derivatives in Fair Value Hedging Relationships: | | | |
| Interest rate contracts | 0 | | | 700 | |
| Derivatives in Net Investment Hedging Relationships: | | | |
| Interest rate contracts | 0 | | | 475 | |
| Foreign exchange contracts | 50 | | 0 | |
| Derivatives Not Designated as Hedging Instruments: | | | |
| Electricity contract | 12 | | | 16 | |
| Foreign exchange contracts | 0 | | | 7 | |
| | | | | | | | | | | |
| In millions | September 30, 2021 | | December 31, 2020 |
| Derivatives in Cash Flow Hedging Relationships: | | | |
| Foreign exchange contracts (USD) | $ | 108 | | | $ | 85 | |
| Foreign exchange contracts (EUR) | — | | | 187 | |
| | | |
| | | |
| | | |
| Derivatives Not Designated as Hedging Instruments: | | | |
| Electricity contract (MWh) | 0.3 | | | 0.2 | |
| | | |
| | | |
| | | |
The following table shows gains or losses recognized in AOCI, net of tax, related to derivative instruments:
| | | | Gain (Loss)
Recognized in
AOCI
on Derivatives
(Effective Portion) | | Gain (Loss) Recognized in AOCI on Derivatives (Effective Portion) |
| | | Three Months Ended
September 30, | | Nine Months Ended
September 30, | | Three Months Ended
September 30, | | Nine Months Ended
September 30, |
| In millions | In millions | 2020 | | 2019 | | 2020 | | 2019 | In millions | 2021 | | 2020 | | 2021 | | 2020 |
| Derivatives in Cash Flow Hedging Relationships: | Derivatives in Cash Flow Hedging Relationships: | | Derivatives in Cash Flow Hedging Relationships: | |
| Foreign exchange contracts | Foreign exchange contracts | $ | (4) | | | $ | (10) | | | $ | (34) | | | $ | (6) | | Foreign exchange contracts | $ | (4) | | | $ | (4) | | | $ | 3 | | | $ | (34) | |
| | Total | Total | $ | (4) | | | $ | (10) | | | $ | (34) | | | $ | (6) | | Total | $ | (4) | | | $ | (4) | | | $ | 3 | | | $ | (34) | |
| Derivatives in Net Investment Hedging Relationships: | Derivatives in Net Investment Hedging Relationships: | | Derivatives in Net Investment Hedging Relationships: | |
| Foreign exchange contracts | | Foreign exchange contracts | $ | 6 | | | $ | — | | | $ | 18 | | | $ | — | |
| Interest rate contracts | Interest rate contracts | $ | 0 | | | $ | 18 | | | $ | 24 | | | $ | 15 | | Interest rate contracts | — | | | — | | | — | | | 24 | |
| Total | Total | $ | 0 | | | $ | 18 | | | $ | 24 | | | $ | 15 | | Total | $ | 6 | | | $ | — | | | $ | 18 | | | $ | 24 | |
During the next 12 months, the amount of the September 30, 20202021 AOCI balance, after tax, that is expected to be reclassified to earnings is a loss of $4$2 million.
The amounts of gains and losses recognized in the statement of operations on qualifying and non-qualifying financial instruments used in hedging transactions were as follows:
| | | | Gain (Loss)
Reclassified from
AOCI
(Effective Portion) | | Location of Gain (Loss)
Reclassified from AOCI
(Effective Portion) | | Gain (Loss) Reclassified from AOCI Into Income (Effective Portion) | | Location of Gain (Loss)
Reclassified from AOCI
(Effective Portion) |
| | | Three Months Ended
September 30, | | Nine Months Ended
September 30, | | | | Three Months Ended
September 30, | Nine Months Ended
September 30, | | |
| In millions | In millions | 2020 | | 2019 | | 2020 | | 2019 | | | In millions | 2021 | | 2020 | 2021 | | 2020 | | |
| Derivatives in Cash Flow Hedging Relationships: | Derivatives in Cash Flow Hedging Relationships: | | Derivatives in Cash Flow Hedging Relationships: | |
| Foreign exchange contracts | Foreign exchange contracts | $ | (6) | | | $ | (4) | | | $ | (26) | | | $ | (5) | | | Cost of products sold | Foreign exchange contracts | $ | 8 | | | $ | (6) | | $ | 9 | | | $ | (26) | | | Cost of products sold |
| Total | Total | $ | (6) | | | $ | (4) | | | $ | (26) | | | $ | (5) | | | Total | $ | 8 | | | $ | (6) | | $ | 9 | | | $ | (26) | | |
| | | | | | | | | | | | | | | | | | | | | | | | | | | | | |
| | Gain (Loss) Recognized in Income | | Location of Gain (Loss)
In
Statement
of Operations |
| | Three Months Ended
September 30, | | Nine Months Ended
September 30, | | |
| In millions | 2021 | | 2020 | | 2021 | | 2020 | | |
| Derivatives in Fair Value Hedging Relationships: | | | | | | | | | |
| Interest rate contracts | $ | — | | | $ | — | | | $ | — | | | $ | 38 | | | Interest expense, net |
| Debt | — | | | — | | | — | | | (38) | | | Interest expense, net |
| Total | $ | — | | | $ | — | | | $ | — | | | $ | — | | | |
| Derivatives in Net Investment Hedging Relationships: | | | | | | | | | |
| Foreign exchange contracts | — | | | 1 | | | — | | | 2 | | | Net (gain) losses on sales and impairments of businesses |
| Total | $ | — | | | $ | 1 | | | $ | — | | | $ | 2 | | | |
| Derivatives Not Designated as Hedging Instruments: | | | | | | | | | |
| Electricity contract | $ | 6 | | | $ | 1 | | | $ | 13 | | | $ | (2) | | | Cost of products sold |
| Foreign exchange contracts | 5 | | | — | | | (1) | | | — | | | Cost of products sold |
| | | | | | | | | |
| Total | $ | 11 | | | $ | 1 | | | $ | 12 | | | $ | (2) | | | |
| | | | | | | | | | | | | | | | | | | | | | | | | | | | | |
| | Gain (Loss) Recognized | | Location of Gain (Loss)
In
Statement
of Operations |
| | Three Months Ended
September 30, | | Nine Months Ended
September 30, | | |
| In millions | 2020 | | 2019 | | 2020 | | 2019 | | |
| Derivatives in Fair Value Hedging Relationships: | | | | | | | | | |
| Interest rate contracts | $ | 0 | | | $ | 11 | | | $ | 38 | | | $ | 42 | | | Interest expense, net |
| Debt | 0 | | | (11) | | | (38) | | | (42) | | | Interest expense, net |
| Total | $ | 0 | | | $ | 0 | | | $ | 0 | | | $ | 0 | | | |
| Derivatives in Net Investment Hedging Relationships: | | | | | | | | | |
| Foreign exchange contracts | $ | 1 | | | $ | 0 | | | $ | 2 | | | $ | 0 | | | Net (gains) losses on sales and impairments of businesses |
| Total | $ | 1 | | | $ | 0 | | | $ | 2 | | | $ | 0 | | | |
| Derivatives Not Designated as Hedging Instruments: | | | | | | | | | |
| Electricity contract | $ | 1 | | | $ | (5) | | | $ | (2) | | | $ | 0 | | | Cost of products sold |
| Foreign exchange contracts | 0 | | | (1) | | | 0 | | | (2) | | | Cost of products sold |
| Total | $ | 1 | | | $ | (6) | | | $ | (2) | | | $ | (2) | | | |
Fair Value Measurements
The Company has not changed its valuation techniques for measuring the fair value of any financial assets or liabilities during the year. Transfers between levels, if any, are recognized at the end of the reporting period.
The following table provides a summary of the impact of our derivative instruments in the balance sheet:
Fair Value Measurements
Level 2 – Significant Other Observable Inputs
| | | | | | | | | | | | | | | | | | | | | | | | | | |
| | Assets | | Liabilities | |
| In millions | September 30, 2020 | | December 31, 2019 | | September 30, 2020 | | December 31, 2019 | |
| Derivatives designated as hedging instruments | | | | | | | | |
| Foreign exchange contracts – cash flow | $ | 2 | | | $ | 10 | | | $ | 16 | | | $ | 4 | | |
| | | | | | | | |
| Interest rate contracts - net investment | 0 | | | 11 | | | 0 | | | 0 | | |
| Interest rate contracts - fair value | 0 | | | 47 | | | 0 | | | 0 | | |
| Total derivatives designated as hedging instruments | 2 | | | 68 | | | 16 | | | 4 | | |
| Derivatives not designated as hedging instruments | | | | | | | | |
| Electricity contract | 0 | | | 0 | | | 0 | | | 2 | | |
| Foreign exchange contracts | 0 | | | 0 | | | 0 | | | 1 | | |
| Total derivatives not designated as hedging instruments | 0 | | | 0 | | | 0 | | | 3 | | |
| Total derivatives | $ | 2 | | (a) | $ | 68 | | (b) | $ | 16 | | (c) | $ | 7 | | (d) |
| | | | | | | | | | | | | | | | | | | | | | | | | | |
| | Assets | | Liabilities | |
| In millions | September 30, 2021 | | December 31, 2020 | | September 30, 2021 | | December 31, 2020 | |
| Derivatives designated as hedging instruments | | | | | | | | |
| Foreign exchange contracts – cash flow | $ | 3 | | | $ | 5 | | | $ | 5 | | | $ | 8 | | |
| | | | | | | | |
| | | | | | | | |
| | | | | | | | |
| Total derivatives designated as hedging instruments | 3 | | | 5 | | | 5 | | | 8 | | |
| Derivatives not designated as hedging instruments | | | | | | | | |
| Electricity contract | 11 | | | — | | | — | | | 1 | | |
| | | | | | | | |
| Total derivatives not designated as hedging instruments | 11 | | | — | | | — | | | 1 | | |
| Total derivatives | $ | 14 | | (a) | $ | 5 | | (b) | $ | 5 | | (c) | $ | 9 | | (d) |
(a)Included in Other current assets in the accompanying consolidated balance sheet.
(b)Includes $14$13 million recorded in Other current assets and $54$1 million recorded in Deferred charges and other assets in the accompanying consolidated balance sheet.
(b)Included in Other current assets in the accompanying consolidated balance sheet.
(c)Includes $14$4 million recorded in Other current liabilities and $2$1 million recorded in Other liabilities in the accompanying consolidated balance sheet.
(d)IncludedIncludes $7 million recorded in Other current liabilities and $2 million recorded in Other liabilities in the accompanying consolidated balance sheet.
The above contracts are subject to enforceable master netting arrangements that provide rights of offset with each counterparty when amounts are payable on the same date in the same currency or in the case of certain specified defaults. Management has made an accounting policy election to not offset the fair value of recognized derivative assets and derivative liabilities in the
balance sheet. The amounts owed to the counterparties and owed to the Company are considered immaterial with respect to each counterparty and in the aggregate with all counterparties.
International Paper sponsors and maintains the Retirement Plan of International Paper Company (the Pension Plan), a tax-qualified defined benefit pension plan that provides retirement benefits to substantially all U.S. salaried and hourly and union employees who work at a participating business unit.
The Pension Plan provides defined pension benefits based on years of credited service and either final average earnings (salaried employees and hourly employees receiving salaried benefits), hourly job rates or specified benefit rates (hourly and union employees).
Effective January 1, 2019, the Company froze participation, including credited service and compensation, for salaried employees under the Pension Plan, the Pension Restoration Plan and the SERP plan. This change does not affect benefits accrued through December 31, 2018. For service after December 31, 2018, employees affected by the freeze receive a company contribution to their individual Retirement Savings Account.
In advance of the spin-off of the Printing Papers segment into a standalone, publicly-traded company, Sylvamo, a legally separate Sylvamo Pension Plan was established to transfer both pension liabilities and qualified pension assets for the approximately 900 active qualified pension participants who transitioned to Sylvamo. Effective September 1, 2021, the Retirement Plan of International Paper (“IP Pension Plan”) and the Sylvamo Pension Plan were legally separated and remeasured as of that date. The remeasurement resulted in a net asset balance of $520 million for the IP Pension Plan, which has been classified as part of the Pension Assets balance on the Consolidated Balance Sheet. Based on the September 1, 2021 remeasurement, the IP Pension Plan completed the transfer of approximately $286 million in projected benefit obligation and approximately $263 million in qualified pension assets to the Sylvamo Pension Plan.
Net periodic pension (income) expense for our qualified and nonqualified U.S. defined benefit plans comprised the following:
| | | | Three Months Ended
September 30, | | Nine Months Ended
September 30, | | Three Months Ended
September 30, | | Nine Months Ended
September 30, |
| In millions | In millions | 2020 | | 2019 | | 2020 | | 2019 | In millions | 2021 | | 2020 | | 2021 | | 2020 |
| Service cost | Service cost | $ | 21 | | | $ | 17 | | | $ | 64 | | | $ | 51 | | Service cost | $ | 26 | | | $ | 21 | | | $ | 78 | | | $ | 64 | |
| Interest cost | Interest cost | 98 | | | 110 | | | 294 | | | 330 | | Interest cost | 84 | | | 98 | | | 251 | | | 294 | |
| Expected return on plan assets | Expected return on plan assets | (167) | | | (158) | | | (501) | | | (473) | | Expected return on plan assets | (177) | | | (167) | | | (543) | | | (501) | |
| Actuarial loss | Actuarial loss | 51 | | | 50 | | | 152 | | | 150 | | Actuarial loss | 35 | | | 51 | | | 114 | | | 152 | |
| Amortization of prior service cost | Amortization of prior service cost | 5 | | | 4 | | | 15 | | | 12 | | Amortization of prior service cost | 5 | | | 5 | | | 16 | | | 15 | |
| Net periodic pension expense | $ | 8 | | | $ | 23 | | | $ | 24 | | | $ | 70 | | |
| Net periodic pension (income) expense | | Net periodic pension (income) expense | $ | (27) | | | $ | 8 | | | $ | (84) | | | $ | 24 | |
The components of net periodic pension (income) expense other than the Service cost component are included in Non-operating pension (income) expense in the Consolidated Statement of Operations.
The Company’s funding policy for our pension plans is to contribute amounts sufficient to meet legal funding requirements, plus any additional amounts that the Company may determine to be appropriate considering the funded status of the plan, tax deductibility, the cash flows generated by the Company, and other factors. The Company made 0no voluntary cash contributions to the qualified pension plan in the first nine months of 20202021 or 2019.2020. The nonqualified defined benefit plans are funded to the extent of benefit payments, which totaled $22$16 million for the nine months ended September 30, 2020.2021.
International Paper has an Incentive Compensation Plan (ICP) which is administered by the Management Development and Compensation Committee of the Board of Directors (the Committee). The ICP authorizes the grants of restricted stock, restricted or deferred stock units, performance awards payable in cash or stock upon the attainment of specified performance goals, dividend equivalents, stock options, stock appreciation rights, other stock-based awards and cash-based awards at the discretion of the Committee. As of September 30, 2020, 8.42021, 7.6 million shares were available for grant under the ICP.
Stock-based compensation expense and related income tax benefits were as follows:
| | | | Three Months Ended
September 30, | | Nine Months Ended
September 30, | | Three Months Ended
September 30, | | Nine Months Ended
September 30, |
| In millions | In millions | 2020 | | 2019 | | 2020 | | 2019 | In millions | 2021 | | 2020 | | 2021 | | 2020 |
| Total stock-based compensation expense (selling and administrative) | Total stock-based compensation expense (selling and administrative) | $ | 17 | | | $ | 31 | | | $ | 48 | | | $ | 94 | | Total stock-based compensation expense (selling and administrative) | $ | 42 | | | $ | 17 | | | $ | 103 | | | $ | 48 | |
| Income tax benefits related to stock-based compensation | Income tax benefits related to stock-based compensation | 1 | | | (2) | | | 18 | | | 31 | | Income tax benefits related to stock-based compensation | (2) | | | 1 | | | 13 | | | 18 | |
At September 30, 2020, $852021, $107 million, net of estimated forfeitures, of compensation cost related to unvested restricted performance shares, executive continuity awards and restricted stock attributable to future service had not yet been recognized. This amount will be recognized in expense over a weighted-average period of 1.71.9 years.
Performance Share Plan
During the first nine months of 2020,2021, the Company granted 2.22.0 million performance units at an average grant date fair value of $49.15.$53.15.
International Paper’s business segments, Industrial Packaging, Global Cellulose Fibers and Printing Papers, are consistent with the internal structure used to manage these businesses. All segments are differentiated on a common product, common customer basis consistent with the business segmentation generally used in the Forest Products industry. On October 1, 2021, the Company completed the previously announced spin-off of its Printing Papers segment into a standalone, publicly-traded company, Sylvamo Corporation. As a result of the spin-off, the Company no longer operated this Printing Papers segment effective October 1, 2021, and all current and historical financial results will be adjusted to reflect the Printing Papers segment as a discontinued operation in the fourth quarter of 2021. In addition, certain limited historical and ongoing business activities will be included in our Industrial Packaging and Global Cellulose Fibers segments.
Business segment operating profits are used by International Paper's management to measure the earnings performance of its businesses. Management believes that this measure allows a better understanding of trends in costs, operating efficiencies, prices and volumes. Business segment operating profits are defined as earnings (loss) before income taxes and equity earnings, but including the impact of noncontrolling interests, and excluding interest expense, net, corporate items,expenses, net, corporate net special items, business net special items and non-operating pension expense. In the fourth quarter of 2019, the Company changed its measure of business segment operating profits to exclude items considered by management to be unusual (business net special items) from the normal operations of the business segment. As a result, all prior periods have been restated to reflect the current measure.
Net sales by business segment for the three months and nine months ended September 30, 20202021 and 20192020 were as follows:
| | | | Three Months Ended
September 30, | | Nine Months Ended
September 30, | | Three Months Ended
September 30, | | Nine Months Ended
September 30, |
| In millions | In millions | 2020 | | 2019 | | 2020 | | 2019 | In millions | 2021 | | 2020 | | 2021 | | 2020 |
| Industrial Packaging | Industrial Packaging | $ | 3,768 | | | $ | 3,820 | | | $ | 11,220 | | | $ | 11,516 | | Industrial Packaging | $ | 4,087 | | | $ | 3,768 | | | $ | 12,096 | | | $ | 11,220 | |
| Global Cellulose Fibers | Global Cellulose Fibers | 564 | | | 624 | | | 1,737�� | | | 1,974 | | Global Cellulose Fibers | 729 | | | 564 | | | 1,981 | | | 1,737 | |
| Printing Papers | Printing Papers | 743 | | | 1,071 | | | 2,234 | | | 3,224 | | Printing Papers | 846 | | | 743 | | | 2,473 | | | 2,234 | |
| Corporate and Intersegment Sales | Corporate and Intersegment Sales | 48 | | | 53 | | | 150 | | | 164 | | Corporate and Intersegment Sales | 52 | | | 48 | | | 143 | | | 150 | |
| Net Sales | Net Sales | $ | 5,123 | | | $ | 5,568 | | | $ | 15,341 | | | $ | 16,878 | | Net Sales | $ | 5,714 | | | $ | 5,123 | | | $ | 16,693 | | | $ | 15,341 | |
Operating profit (loss) by business segment for the three months and nine months ended September 30, 20202021 and 20192020 were as follows:
| | | | Three Months Ended
September 30, | | Nine Months Ended
September 30, | | Three Months Ended
September 30, | | Nine Months Ended
September 30, |
| In millions | In millions | 2020 | | 2019 | | 2020 | | 2019 | In millions | 2021 | | 2020 | | 2021 | | 2020 |
| Industrial Packaging | Industrial Packaging | $ | 469 | | | $ | 535 | | | $ | 1,388 | | | $ | 1,471 | | Industrial Packaging | $ | 429 | | | $ | 469 | | | $ | 1,284 | | | $ | 1,388 | |
| Global Cellulose Fibers | Global Cellulose Fibers | (59) | | | 4 | | | (123) | | | 39 | | Global Cellulose Fibers | 96 | | | (59) | | | 24 | | | (123) | |
| Printing Papers | Printing Papers | 63 | | | 162 | | | 148 | | | 420 | | Printing Papers | 106 | | | 63 | | | 262 | | | 148 | |
| Business Segment Operating Profits | Business Segment Operating Profits | $ | 473 | | | $ | 701 | | | $ | 1,413 | | | $ | 1,930 | | Business Segment Operating Profits | $ | 631 | | | 473 | | $ | 1,570 | | | $ | 1,413 | |
| | Earnings (loss) before income taxes and equity earnings | Earnings (loss) before income taxes and equity earnings | $ | 282 | | | $ | 452 | | | $ | 527 | | | $ | 1,204 | | Earnings (loss) before income taxes and equity earnings | $ | 916 | | | $ | 282 | | | $ | 1,747 | | | $ | 527 | |
| Interest expense, net | Interest expense, net | 112 | | | 123 | | | 345 | | | 378 | | Interest expense, net | 93 | | | 112 | | | 242 | | | 345 | |
| Noncontrolling interests adjustment | Noncontrolling interests adjustment | 0 | | | 2 | | | 0 | | | 4 | | Noncontrolling interests adjustment | (1) | | | — | | | (3) | | | — | |
| Corporate expenses, net | Corporate expenses, net | (20) | | | 21 | | | 9 | | | 45 | | Corporate expenses, net | 12 | | | (20) | | | 44 | | | 9 | |
| Corporate net special items | Corporate net special items | 108 | | | 48 | | | 195 | | | 48 | | Corporate net special items | 11 | | | 108 | | | 81 | | | 195 | |
| Business net special items | Business net special items | 2 | | | 46 | | | 368 | | | 224 | | Business net special items | (349) | | | 2 | | | (385) | | | 368 | |
| Non-operating pension expense (income) | Non-operating pension expense (income) | (11) | | | 9 | | | (31) | | | 27 | | Non-operating pension expense (income) | (51) | | | (11) | | | (156) | | | (31) | |
| Business Segment Operating Profits | Business Segment Operating Profits | $ | 473 | | | $ | 701 | | | $ | 1,413 | | | $ | 1,930 | | Business Segment Operating Profits | $ | 631 | | | $ | 473 | | | $ | 1,570 | | | $ | 1,413 | |
The following discussion and analysis of our financial condition and results of operations should be read in conjunction with our condensed consolidated financial statements and related notes included in "Financial Statements and Supplementary Data" of this Quarterly Report on Form 10-Q (this "Form 10-Q") and the Company's Annual Report on Form 10-K for the year ended December 31, 20192020 (our "Annual Report"). In addition to historical consolidated financial information, the following discussion contains forward-looking statements that reflect our plans, estimates, and beliefs that involve significant risks and uncertainties. Our actual results could differ materially from those discussed in the forward-looking statements. Factors that could cause or contribute to those differences include those discussed below and in our Annual Report, particularly in "Risk Factors" andunder "Forward-Looking Statements" of this Form 10-Q and "Risk Factors" and "Forward-Looking Statements" of our Annual Report.
EXECUTIVE SUMMARY
Net earnings (loss) attributable to International Paper common shareholders were $864 million ($2.20 per diluted share) in the third quarter of 2021, compared with $432 million ($1.09 per diluted share) in the second quarter of 2021 and $204 million ($0.52 per diluted share) in the third quarter of 2020,2020. International Paper generated Adjusted operating earnings attributable to International Paper common shareholders (a non-GAAP measure defined below) of $532 million ($1.35 per diluted share) in the third quarter of 2021, compared with $266$421 million ($0.671.06 per diluted share) in the second quarter of 20202021 and $344 million ($0.87 per diluted share) in the third quarter of 2019. International Paper generated Adjusted Operating Earnings Attributable to International Paper Common Shareholders (a non-GAAP measure defined below) of $280 million ($0.71 per diluted share) in the third quarter of 2020, compared with $305 million ($0.77 per diluted share)2020.
During the third quarter 2021, International Paper grew revenue, margins and earnings, and generated strong cash from operations. The strong demand environment in the second quarter of 2020 and $431 million ($1.09 per diluted share)2021 continued in the third quarter, of 2019.
Inwith strong demand for corrugated packaging and solid demand for absorbent pulp. Our Industrial Packaging and Global Cellulose Fibers businesses made strong progress on price realization from prior price increases in the third quarter 2020, International Paper delivered solid earningsto mitigate the impact of a very challenging supply chain and generated robust cash from operationsinput cost environment. Input costs affected results much more than anticipated in a dynamic environment. We continued to deliver strong commercial and operational performance, with outstanding cost management across all our businesses. In the third quarter, 2020,mostly due to higher fiber and energy costs. The widespread supply chain constraints limited our ability to capture the full opportunity that comes with the strong demand environment. Our mills performed well; however, stretched supply chains constrained volumes in our Industrial Packaging and Global Cellulose Fibers businesses. Additionally, due to labor market constraints, we generated $735 millionhave had to increase overtime while we try to hire additional permanent employees. This has led to higher labor costs, particularly at our converting facilities. Containerboard inventories in cash from operations and $616 millionour packaging network improved in free cash flow, bringing cash generated from operations and free cash flowthe latter part of the third quarter, putting us in a much healthier position as we enter the seasonally stronger fourth quarter. With respect to $2.3 billion and $1.6 billion, respectively, through the first three quarters of 2020. The Company’s solid performance reinforces our financial strength and commitment to our capital allocation, framework. We continued to use cash consistent with our capital allocation framework to maintain a strong balance sheet, return cash to shareowners and invest to create value. Duringin the third quarter, we reduced debt by $760approximately $235 million bringing year-to-date debt reductionand returned $411 million to $1.1 billion. In October, the boardshareholders through dividends of directors approved the fourth quarter dividend, bringing the full-year authorizations to $800$199 million and share repurchases of $212 million.
Relative to demand, recovery trends continue to vary byFinally, the Printing Papers business delivered strong performance and end-use consumer segments. Demand for corrugated packaging acceleratedcarried good momentum in the third quarter, ahead of the spin-off of the business, which was completed on October 1, 2021. In consideration for the Printing Papers business spin-off, International Paper received a payment of $1.4 billion from Sylvamo and that momentum continuesretained a 19.9% interest in the fourth quarter.new company, which we intend to monetize within one year.
Comparing our performance in the third quarter 2021 to the second quarter 2021, price and mix improved, driven by strong realization of prior price increases across the three businesses. Input costs were a significant headwind in the third quarter, increasing by more than two times what we had anticipated, mostly due to higher fiber and energy costs. Volumes decreased sequentially. Supply chain constraints limited our ability to capture the full benefit of a strong demand backdrop. In our Global Cellulose Fibers business, demand for absorbent pulp remains solid; however, shipments were constrained by significant port congestion. Our mills performed well and we experienced seasonally lower demand and destocking across most regions, as expected. In our Printing Papers business, we are in the early stages of recovery as office and school activities restart. Against this backdrop, our commercial, supply chain and manufacturing organizations are collaborating at a high level to ensure we meet our customers’ changing needs, leveraging the scale and flexibility of our system and optimizing costs. We remain committed to our COVID-19 principles and will continue to focus on what we need to do to further strengthen the Company for all our stakeholders in the short-term and the long-term.
Comparing performancealso benefited from one-time items in the third quarter, 2020including insurance recovery in the Industrial Packaging business related to the second quarter 2020, price and mix was essentially flat across our businesses. Volume was favorable, driven by strong demand for corrugated packaging in North America and improved demand for printing papers across all regions. Operations and costs benefited from improved fixed cost absorption on higher volume. Our businesses continued to do an excellent job managing costs and delivered strong operational performance to mitigate the impact of hurricaneswinter storms early in the third quarter. Third quarter performance also benefited from about $30 millionyear and the sale of nitrogen credits in the Global Cellulose Fibers business. These one-time items, which favorablybenefits were largely offset by higher unplanned maintenance in Industrial Packaging and higher supply chain costs in Global Cellulose Fibers. We continue to be impacted operationsby a highly stressed supply chain environment that is affecting both inbound materials and costs. Asoutbound shipments. Every mode of transportation is tight, and is expected to remain so for the foreseeable future. Planned maintenance outage costs reduced earnings in the third quarter, which is our highest planned maintenance quarter this year. Input costs were favorable, mostly due to lower recovered fiber costs. We did experience higher energy and distribution costsdecreased sequentially as we exited the third quarter, which we see as a positive sign of an improving economy. Corporate expense and taxes were favorable compared to the second quarter 2020, reflecting foreign currency translation gains and favorable adjustments to our federal tax provision after finalizing our 2019 tax return. Equity earnings from ourexpected. Our Ilim joint venture were a lossdelivered another strong performance with equity earnings of $33 million and include a $55 million non-cash foreign exchange loss primarily associated with foreign currency translation on Ilim’s US dollar denominated net debt.$95 million.
Looking ahead to the fourth quarter 2020,2021, as compared to the third quarter of 2020,2021, in our Industrial Packaging business, we expect stablehigher price and mix primarily on the realization of our August 2021 price increases in our North America, and European Packaging businesses.partially offset by mix as we start to recover some export backlogs. Volume is expected to decrease modestly, with continued strongimprove sequentially on higher seasonal demand for corrugated packaging offsetting the impact ofdespite three lessfewer shipping days in the fourth quarter. Operations and costs are expected to be negatively impacted by the non-repeat of favorable one-time items in the third quarter. Planned maintenanceimprove moderately. Supply chains are expected to remain stretched, however, our North America packaging network will benefit from improved containerboard inventory levels, as planned. Maintenance outage expense is expected to be lower, and inputrelatively flat. Input costs are expected to beincrease, driven primarily by higher mostly due to higher energyaverage costs for fiber and transportation costs.energy. In our Global Cellulose Fibers business, we expect price and mix to be stable. Volume is expected to decrease modestly, lowerprimarily due to persistent port congestion, which is expected to impact absorbent pulp shipments again in the fourth quarter. Volume is expected to be stable while operationsOperations and costs are expected to negatively impact earnings associatedbe unfavorable due to the non-repeat of the previously mentioned nitrogen credit sales in the third quarter. Maintenance outage expenses are expected increase while
with the non-repeat of favorable one-time items. We expect increased planned maintenance outage expenses, and input costs are expected to be stable. In our Printing Papers business, we expect price and mix to be stable. Volume is expected to improve on higher seasonal demand in Latin America. Operations and costs are expected to be negatively impacted by the non-repeat of favorable one-time items in the third quarter, along with higher seasonal energy costs. Planned maintenance outage expenses are expected to decrease, and input costs are expected to increase on higher wood fiber and energy costs. Lastly, inEquity earnings from our Ilim joint venture we expect improved earnings onare expected decrease modestly.
Finally, following the non-repeatcompletion of the foreign currency lossPrinting Papers spin-off on U.S. dollar denominated net debt incurredOctober 1, 2021, the historical results of the business will be treated as a discontinued operation with a full recast of previously presented periods to reflect this treatment. Third quarter earnings included $134 million of Business Segment Operating Profit attributed to the Sylvamo spin-off and Kwidzyn mill, which are no longer part of International Paper in the thirdfourth quarter.
On March 11, 2020 the World Health Organization (WHO) declared the novel strain of coronavirus (COVID-19) a global pandemic and recommended containment and mitigation measures worldwide. During the third quarter of 2021, the number of COVID-19 cases and deaths increased in the United States and numerous other countries, and restrictive measures, including mask and vaccine requirements, have been implemented or reinstituted by various governmental authorities and private businesses. Economic recovery in the United States has continued but may be threatened by the resurgence of COVID-19 cases and other factors. Most of our manufacturing and converting facilities have remained open and operational during the pandemic. The healthpandemic and safety ofat the current time our employeesmanufacturing and contractors is our most important responsibility as we manage through the COVID-19 pandemic. We have implemented work-systems across the Company, including hygiene, social distancing, site cleaning, contact tracing, and other measures, as recommended by the CDC and WHO. Our COVID-19 measuresconverting facilities are proving to be effective and we have not had any material disruptions to our operations.generally operational.
We have seenThe pandemic has had a significant negativemixed impact on demand for our products. Initially, demand for printing papers products.products was significantly impacted by the pandemic, but has seen a steady increase over the first nine months of 2021. Demand for our pulp, containerboard and corrugated box products has not been negatively impacted and in some cases has been positively impacted by COVID-19 to date, but could be unfavorably impacted going forward if negative economic conditions associated with COVID-19 persist or deteriorate. Furthermore, if there is a resurgencedate. However, all of the virus leadingour operations continue to additional governmental measures, such as stay-at-home orders or business and school shut downs, ourexperience higher supply chain costs and therefore our production, could be negatively impacted.a constrained transportation environment due in part to the impacts of COVID-19.
There continue to be significant uncertainties associated with the COVID-19 pandemic, including with respect to the various economic reopening plans and the resurgence of new variants of the virus in many areas;areas globally; the additional actions that may be taken by governmental authorities and private businesses, including mask and vaccine requirements, to attempt to contain the COVID-19 outbreak or to mitigate its impact; the extentefficacy, acceptance and durationavailability of social distancingvarious vaccines and stay-at-home orders;booster shots, as well as the possibility that strains of development of a vaccine;the virus may be resistant to current available vaccines; and the ongoing impact of COVID-19 on unemployment,economic conditions, including with respect to labor market conditions, economic activity, consumer behavior, supply chain shortages and consumer confidence. Developments related todisruptions and inflationary pressures. COVID-19 are significantly adversely affectinghas had a significant adverse effect on portions of our business, and could have a material adverse effect on our financial condition, results of operations and cash flows particularly if negativepublic health and/or global economic conditions persist for a significant period of time or deteriorate.
Adjusted Operating Earningsoperating earnings and Adjusted Operating Earnings Per Shareoperating earnings per share are non-GAAP measures and are defined as net earnings (loss) attributable to International Paper (a GAAP measure) excluding net special items and non-operating pension expense (income). Net earnings (loss) and Diluted earnings (loss) per share attributable to common shareholders are the most directly comparable GAAP measures. The Company calculates Adjusted Operating Earningsoperating earnings by excluding the after-tax effect of non-operating pension expense (income) and items considered by management to be unusual (net special items) from the earnings reported under GAAP. Adjusted Operating Earnings Per Shareoperating earnings per share is calculated by dividing Adjusted Operating Earningsoperating earnings by diluted average shares of common stock outstanding. Management uses this measurethese measures to focus on on-going operations, and believes that it isthese measures are useful to investors because it enables themsuch measures enable investors to perform meaningful comparisons of past and present consolidated operating results. The Company believes that using this information, along with the most directly comparable GAAP measure, providesmeasures, provide for a more complete analysis of the results of operations.
The following are reconciliations of Earnings (loss) attributable to common shareholders to Adjusted Operating Earnings (Loss)operating earnings (loss) attributable to shareholders.common shareholders on a total and per share basis. Additional detail is provided later in this Form 10-Q regarding the net special items referenced in the charts below.
| | | | | | | | | | | | | | | | | |
| | Three Months Ended
September 30, | | Three Months Ended June 30, |
| In millions | 2020 | | 2019 | | 2020 |
| Net Earnings (Loss) Attributable to Shareholders | $ | 204 | | | $ | 344 | | | $ | 266 | |
| Add Back - Non-operating pension expense (income) | (11) | | | 9 | | | (14) | |
| Add Back - Net special items expense (income) | 109 | | | 94 | | | 68 | |
| Income tax effect - Non-operating pension and net special items expense | (22) | | | (16) | | | (15) | |
| Adjusted Operating Earnings (Loss) Attributable to International Paper Company | $ | 280 | | | $ | 431 | | | $ | 305 | |
| | | | | | | | | | | | | | | | | |
| | Three Months Ended
September 30, | | Three Months Ended June 30, |
| In millions | 2021 | | 2020 | | 2021 |
| Net Earnings (Loss) Attributable to International Paper Company | $ | 864 | | | $ | 204 | | | $ | 432 | |
| Add Back - Non-operating pension expense (income) | (51) | | | (11) | | | (52) | |
| Add Back - Net special items expense (income) | (330) | | | 109 | | | 23 | |
| Income tax effect - Non-operating pension and net special items expense | 49 | | | (22) | | | 18 | |
| Adjusted Operating Earnings (Loss) Attributable to International Paper Company | $ | 532 | | | $ | 280 | | | $ | 421 | |
| | | | Three Months Ended
September 30, | | Three Months Ended June 30, | | Three Months Ended
September 30, | | Three Months Ended June 30, |
| In millions | In millions | 2020 | | 2019 | | 2020 | In millions | 2021 | | 2020 | | 2021 |
| Diluted Earnings (Loss) Per Share Attributable to Shareholders | $ | 0.52 | | | $ | 0.87 | | | $ | 0.67 | | |
| Diluted Earnings (Loss) Per Share Attributable to International Paper Company Common Shareholders | | Diluted Earnings (Loss) Per Share Attributable to International Paper Company Common Shareholders | $ | 2.20 | | | $ | 0.52 | | | $ | 1.09 | |
| Add Back - Non-operating pension expense (income) per share | Add Back - Non-operating pension expense (income) per share | (0.03) | | | 0.02 | | | (0.04) | | Add Back - Non-operating pension expense (income) per share | (0.13) | | | (0.03) | | | (0.13) | |
| Add Back - Net special items expense (income) per share | Add Back - Net special items expense (income) per share | 0.28 | | | 0.24 | | | 0.17 | | Add Back - Net special items expense (income) per share | (0.84) | | | 0.28 | | | 0.06 | |
| Income tax effect per share - Non-operating pension and net special items expense | Income tax effect per share - Non-operating pension and net special items expense | (0.06) | | | (0.04) | | | (0.03) | | Income tax effect per share - Non-operating pension and net special items expense | 0.12 | | | (0.06) | | | 0.04 | |
| Adjusted Operating Earnings (Loss) Per Share Attributable to Shareholders | $ | 0.71 | | | $ | 1.09 | | | $ | 0.77 | | |
| Adjusted Operating Earnings (Loss) Per Share Attributable to International Paper Company Common Shareholders | | Adjusted Operating Earnings (Loss) Per Share Attributable to International Paper Company Common Shareholders | $ | 1.35 | | | $ | 0.71 | | | $ | 1.06 | |
Cash provided by operations totaled $2.3$1.9 billion and $2.7$2.3 billion for the first nine months of 20202021 and 2019,2020, respectively. The Company generated free cash flow of approximately $1.6 billion and $1.8 billion in each of the first nine months of 20202021 and 2019, respectively.2020. Free cash flow is a non-GAAP measure and the most directly comparable GAAP measure is cash provided by operations. Management utilizes this measure in connection with managing our business and believes that free cash flow is useful to investors as a liquidity measure because it measures the amount of cash generated that is available, after reinvesting in the business, to maintain a strong balance sheet, pay dividends, repurchase stock, service debt and make investments for future growth. It should not be inferred that the entire free cash flow amount is available for discretionary expenditures. By adjusting for certain items that are not indicative of the Company's ongoing performance, we believe that free cash flow also enables investors to perform meaningful comparisons between past and present periods.
The following is a reconciliation of cash provided by operations to free cash flow:
| | | | Three Months Ended
September 30, | | Nine Months Ended
September 30, | | Nine Months Ended
September 30, |
| In millions | In millions | 2020 | | 2019 | | 2020 | | 2019 | In millions | 2021 | | 2020 |
| Cash provided by operations | Cash provided by operations | $ | 735 | | | $ | 882 | | | $ | 2,274 | | | $ | 2,682 | | Cash provided by operations | $ | 1,923 | | | $ | 2,274 | |
| Adjustments: | Adjustments: | | Adjustments: | |
| Cash invested in capital projects, net of insurance recoveries | Cash invested in capital projects, net of insurance recoveries | (119) | | | (285) | | | (657) | | | (913) | | Cash invested in capital projects, net of insurance recoveries | (348) | | | (657) | |
| Free Cash Flow | Free Cash Flow | $ | 616 | | | $ | 597 | | | $ | 1,617 | | | $ | 1,769 | | Free Cash Flow | $ | 1,575 | | | $ | 1,617 | |
The non-GAAP financial measures presented in this Quarter Report on Form 10-Q as referenced above have limitations as analytical tools and should not be considered in isolation or as a substitute for an analysis of our results calculated in accordance with GAAP. In addition, because not all companies utilize identical calculations, the Company's presentation of non-GAAP measures in this Quarterly Report on Form 10-Q may not be comparable to similarly titled measures disclosed by other companies, including companies in the same industry as the Company.
For the third quarter of 2020,2021, International Paper Company reported net sales of $5.1$5.7 billion, compared with $4.9$5.6 billion in the second quarter of 20202021 and $5.6$5.1 billion in the third quarter of 2019.2020.
Net earnings (loss) attributable to International Paper totaled $864 million, or $2.20 per diluted share, in the third quarter of 2021. This compared with $432 million, or $1.09 per diluted share, in the second quarter of 2021 and $204 million, or $0.52 per diluted share, in the third quarter of 2020. This compared with $266 million, or $0.67 per diluted share, in the second quarter of 2020 and $344 million, or $0.87 per diluted share, in the third quarter of 2019.
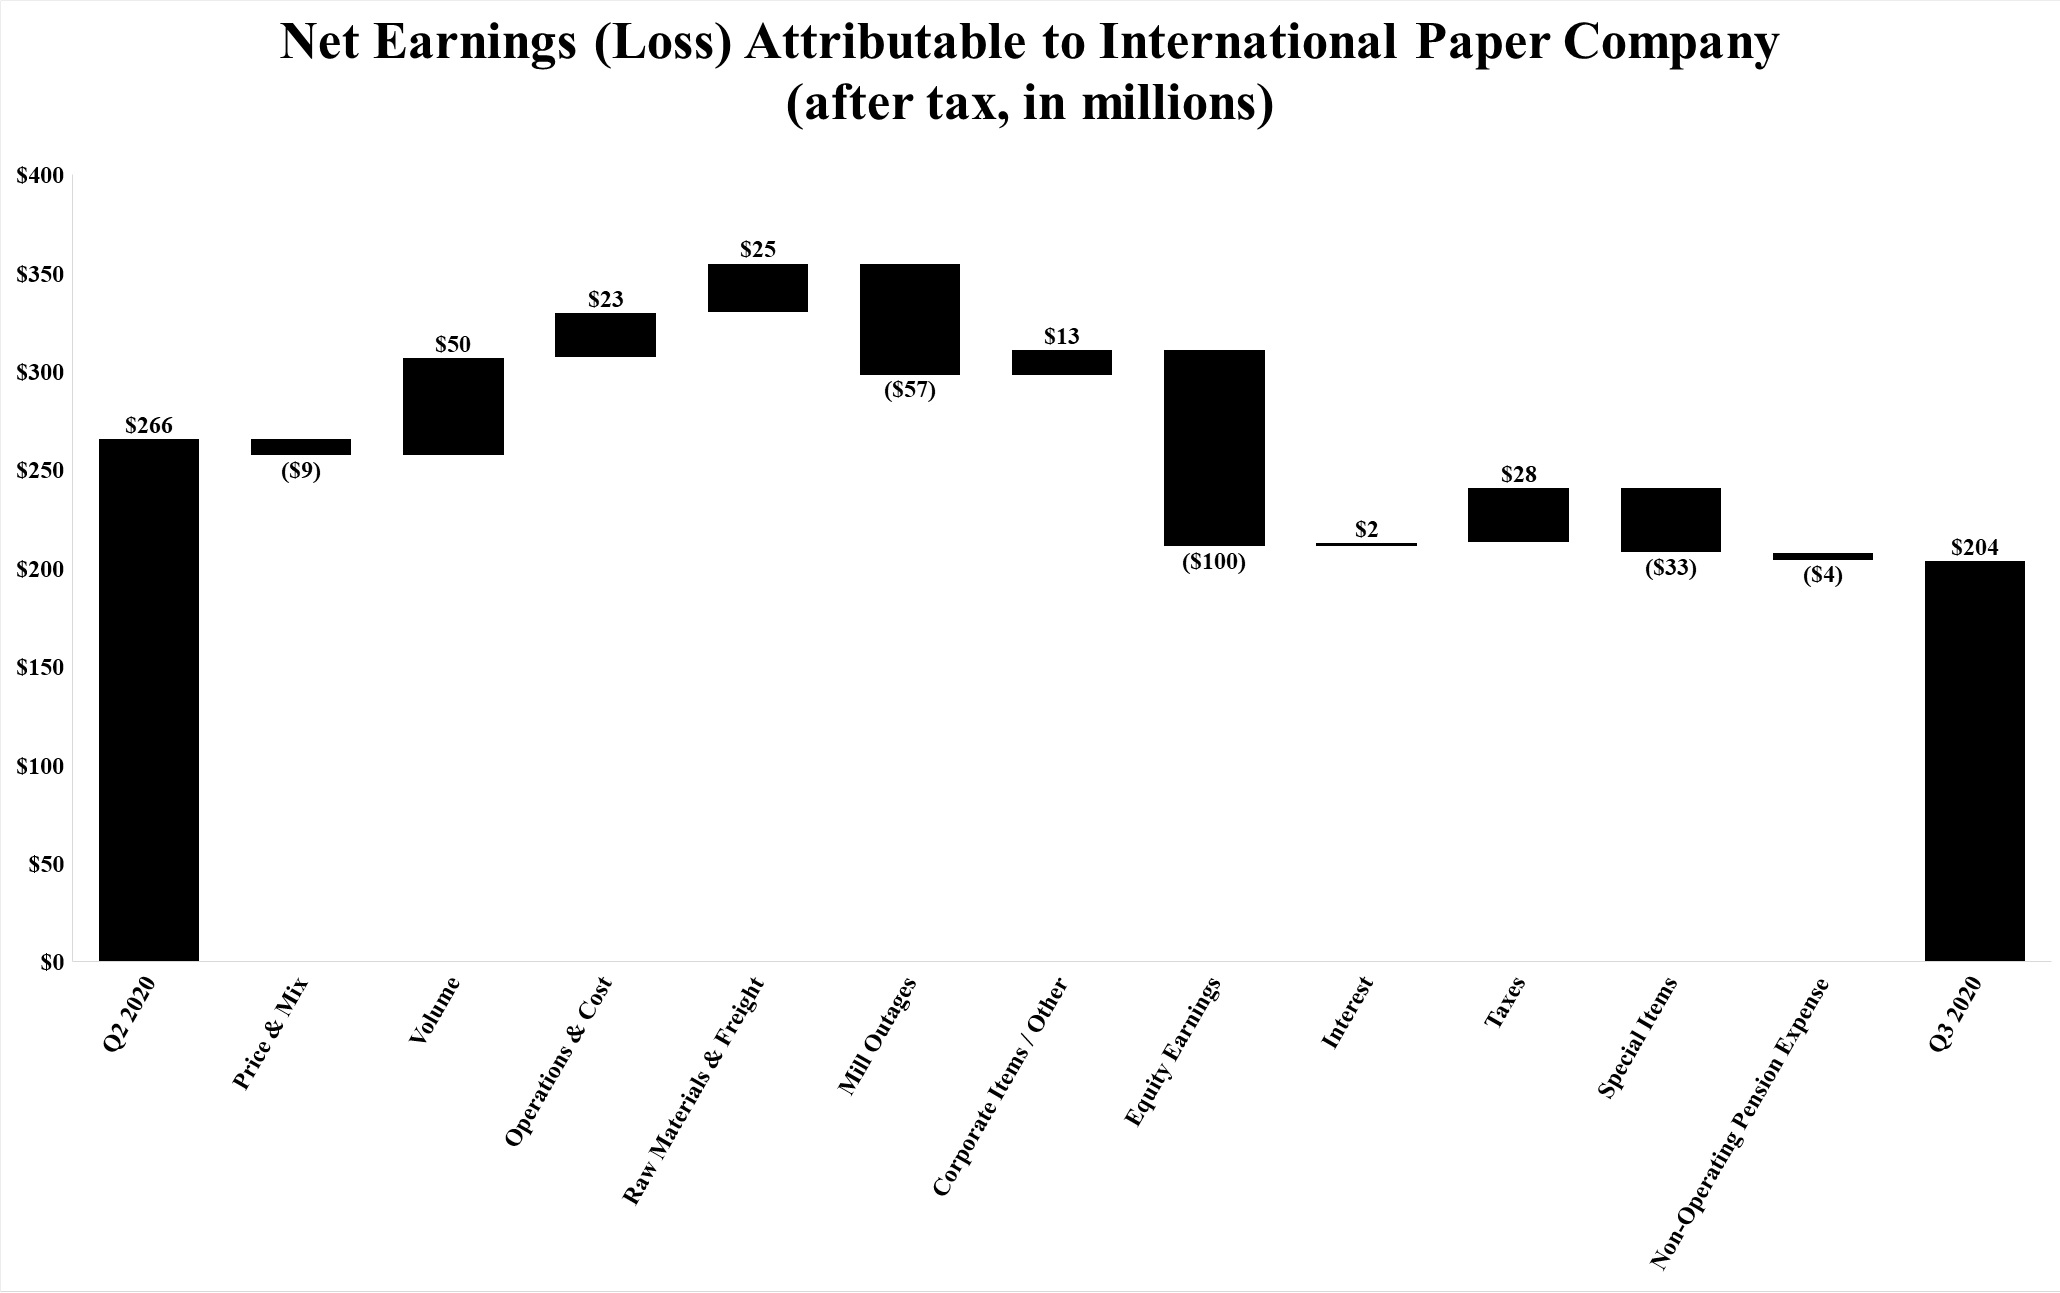
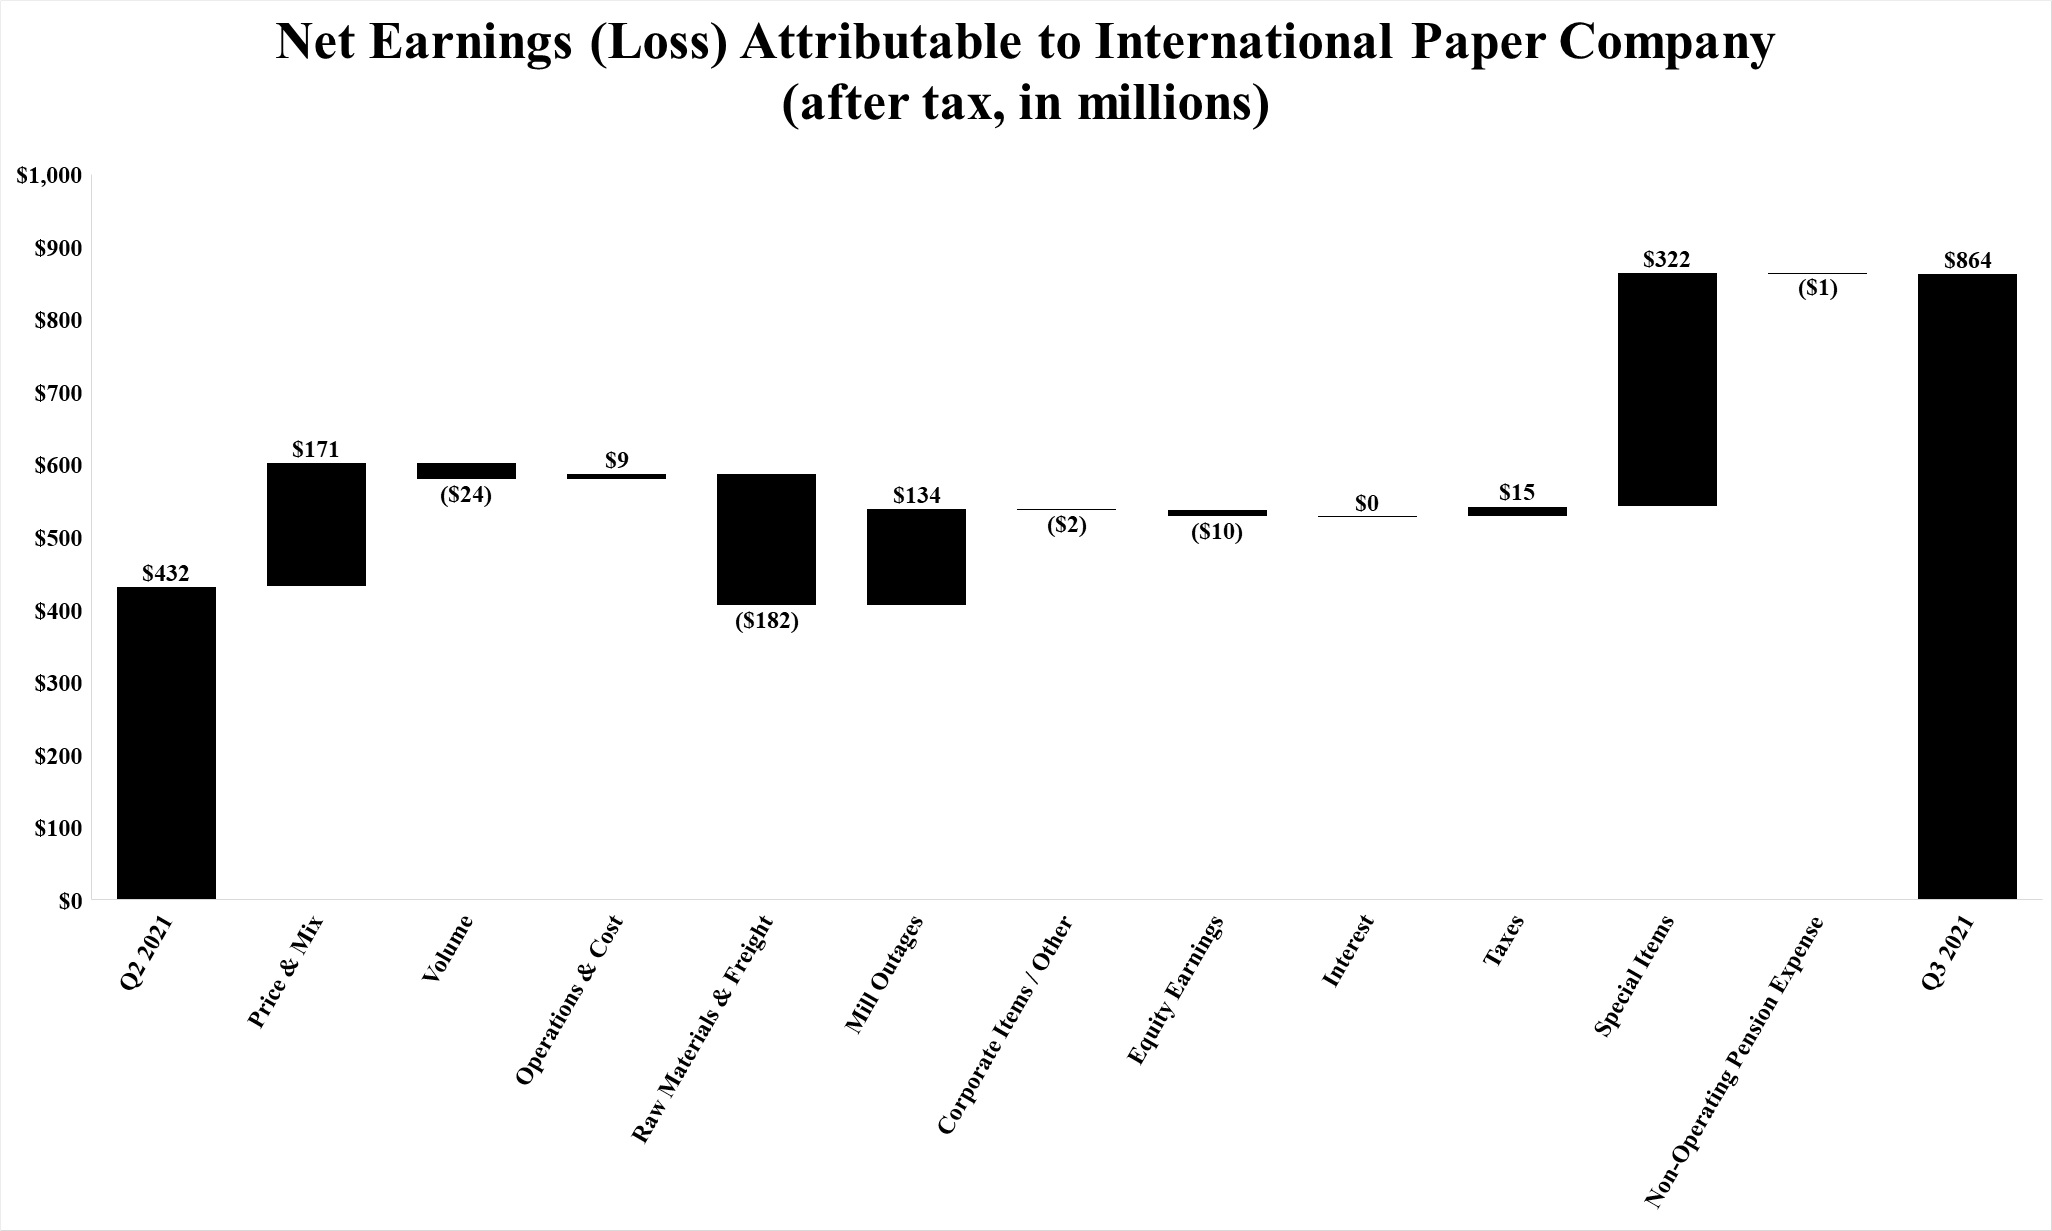
Compared with the second quarter of 2020,2021, earnings benefited from higher average sales volumesprices and a favorable mix ($50171 million), lower operating costs ($239 million), lower raw material and freightmill maintenance outage costs ($25 million), lower corporate and other items ($13 million), lower net interest expense ($2134 million) and lower tax expense ($2815 million). These benefits were offset by lower average sales prices net of a favorable mixvolumes ($924 million), higher mill maintenance outageraw material and freight costs ($57182 million), higher corporate and other items ($2 million) and higher non-operating pension expense ($41 million). Net interest expense was flat. Equity earnings, net of taxes, relating to International Paper’s investments in Ilim S.A., Graphic Packaging International Partners, LLC, and other investments were $10 million lower than in the second quarter of 2021. Net special items in the third quarter of 2021 were a gain of $294 million compared with a loss of $28 million in the second quarter of 2021.
Compared with the third quarter of 2020, the third quarter of 2021 reflects higher average sales prices and a favorable mix ($478 million), higher sales volumes ($2 million), lower mill maintenance outage costs ($54 million), lower net interest expense ($23 million), lower tax expense ($6 million) and lower non-operating pension expense ($31 million). These benefits were offset by higher operating costs ($83 million), higher raw material and freight costs ($325 million) and higher corporate and other costs ($25 million). Equity earnings, net of taxes, relating to International Paper’s investments in Ilim S.A., Graphic Packaging International Partners, LLC, and other investments were $100$122 million lowerhigher in the third quarter of 2021 than in the secondthird quarter of 2020. Net special items in the third quarter of 20202021 were a lossgain of $83$294 million compared with a loss of $50 million in the second quarter of 2020.
Compared with the third quarter of 2019, the third quarter of 2020 reflects lower raw material and freight costs ($29 million), lower corporate and other costs ($30 million), lower net interest expense ($7 million), lower tax expense ($34 million) and lower non-operating pension expense ($14 million). These benefits were offset by lower average sales prices and an unfavorable mix ($114 million), lower sales volumes ($28 million), higher operating costs ($7 million) and higher mill maintenance outage costs ($47 million). Equity earnings, net of taxes, relating to International Paper’s investments in Ilim S.A., Graphic Packaging International Partners, LLC, and other investments were $55 million lower in the third quarter of 2020 than in the third quarter of 2019. Net special items in the third quarter of 2020 were a loss of $83 million compared with a loss of $80 million in the third quarter of 2019.2020.
Business Segment Operating Profitssegment operating profits are used by International Paper's management to measure the earnings performance of its businesses. Management uses this measure to focus on on-going operations, and believes that it is useful to investors because it enables them to perform meaningful comparisons of past and present operating results. International Paper believes that using this information, along with net earnings, provides a more complete analysis of the results of operations by quarter. Business Segment Operating Profitssegment operating profits are defined as earnings (loss) before income taxes and equity earnings, but including the impact of noncontrolling interests, and excluding interest expense, net, corporate expenses, net, corporate net special items, business net special items and non-operating pension expense. Business Segment Operating Profitssegment operating profits is a measure reported to our management for purposes of making decisions about allocating resources to our business segments and assessing the performance of our business segments and is presented in our financial statement footnotes in accordance with ASC 280.
In the third quarter, International Paper operatesoperated in three segments: Industrial Packaging, Global Cellulose Fibers and Printing Papers.
The following table presents a reconciliation of netNet earnings (loss) from continuing operations attributable to International Paper Company to its Total Business Segment Operating Profit:business segment operating profit:
| | | | | | | | | | | | | | | | | |
| | Three Months Ended |
| | September 30, | | June 30, |
| In millions | 2020 | | 2019 | | 2020 |
| Net Earnings (Loss) Attributable to International Paper Company | $ | 204 | | | $ | 344 | | | $ | 266 | |
| Add back (deduct): | | | | | |
| Income tax provision (benefit) | 50 | | | 137 | | | 67 | |
| Equity (earnings) loss, net of taxes | 28 | | | (27) | | | (72) | |
| Noncontrolling interests, net of taxes | — | | | (2) | | | — | |
| Earnings (Loss) Before Income Taxes and Equity Earnings | 282 | | | 452 | | | 261 | |
| Interest expense, net | 112 | | | 123 | | | 116 | |
| Noncontrolling interests included in operations | — | | | 2 | | | — | |
| Corporate expenses, net | (20) | | | 21 | | | (3) | |
| Corporate net special items | 108 | | | 48 | | | 54 | |
| Business net special items | 2 | | | 46 | | | 14 | |
| Non-operating pension expense (income) | (11) | | | 9 | | | (14) | |
| Adjusted Operating Profit | $ | 473 | | | $ | 701 | | | $ | 428 | |
| Business Segment Operating Profit (Loss): | | | | | |
| Industrial Packaging | $ | 469 | | | $ | 535 | | | $ | 449 | |
| Global Cellulose Fibers | (59) | | | 4 | | | (10) | |
| Printing Papers | 63 | | | 162 | | | (11) | |
| Total Business Segment Operating Profit | $ | 473 | | | $ | 701 | | | $ | 428 | |
| | | | | | | | | | | | | | | | | |
| | Three Months Ended |
| | September 30, | | June 30, |
| In millions | 2021 | | 2020 | | 2021 |
| Net Earnings (Loss) Attributable to International Paper Company | $ | 864 | | | $ | 204 | | | $ | 432 | |
| Add back (deduct): | | | | | |
| Income tax provision (benefit) | 146 | | | 50 | | | 102 | |
| Equity (earnings) loss, net of taxes | (94) | | | 28 | | | (104) | |
| Noncontrolling interests, net of taxes | — | | | — | | | 2 | |
| Earnings (Loss) Before Income Taxes and Equity Earnings | 916 | | | 282 | | | 432 | |
| Interest expense, net | 93 | | | 112 | | | 57 | |
| Noncontrolling interests included in operations | (1) | | | — | | | (1) | |
| Corporate expenses, net | 12 | | | (20) | | | 7 | |
| Corporate net special items | 11 | | | 108 | | | 101 | |
| Business net special items | (349) | | | 2 | | | (50) | |
| Non-operating pension expense (income) | (51) | | | (11) | | | (52) | |
| Adjusted Operating Profit | $ | 631 | | | $ | 473 | | | $ | 494 | |
| Business Segment Operating Profit (Loss): | | | | | |
| Industrial Packaging | $ | 429 | | | $ | 469 | | | $ | 408 | |
| Global Cellulose Fibers | 96 | | | (59) | | | 10 | |
| Printing Papers | 106 | | | 63 | | | 76 | |
| Total Business Segment Operating Profit | $ | 631 | | | $ | 473 | | | $ | 494 | |
Business Segment Operating Profit
Total business segment operating profits were $631 million in the third quarter of 2021, $494 million in the second quarter of 2021 and $473 million in the third quarter of 2020, $428 million in the second quarter of 2020 and $701 million in the third quarter of 2019.2020.
Compared with the second quarter of 2020,2021, operating profits benefited from higher average sales volumesprices and a favorable mix ($68216 million), lower operating costs ($3112 million) and lower raw material and freightmill outage costs ($34170 million). These benefits were offset by lower average sales prices net of a favorable mixvolumes ($1130 million) and higher mill outageraw material and freight costs ($77231 million).
Compared with the third quarter of 2019,2020, operating profits in the current quarter benefited from higher average sales prices and a favorable mix ($591 million) and higher sales volumes ($3 million) and lower raw material and freightmill outage costs ($4067 million). These benefits were offset by lower average sales prices and an unfavorable mix ($156 million), lower sales volumes ($38 million), higher operating costs ($9102 million) and higher mill outageraw material and freight costs ($65401 million).
Economic-related downtime results from the amount of production required to meet our customer demand. Planned maintenance downtime is taken periodically throughout the year. The following table details North American planned maintenance and economic-related downtime:
| | | | | | | | | | | |
| In thousands of tons | Three Months Ended September 30, 2020 | Three Months Ended September 30, 2019 | Three Months Ended June 30, 2020 |
| Economic-related downtime | 126 | | 283 | | 328 | |
| Maintenance downtime | 170 | | 125 | | 51 | |
Sales Volumes by Product (a)
Sales volumes of major products for the three months and nine months ended September 30, 20202021 and 20192020 were as follows:
| | | | Three Months Ended
September 30, | | Nine Months Ended
September 30, | | Three Months Ended
September 30, | | Nine Months Ended
September 30, |
| In thousands of short tons (except as noted) | In thousands of short tons (except as noted) | 2020 | | 2019 | | 2020 | | 2019 | In thousands of short tons (except as noted) | 2021 | | 2020 | | 2021 | | 2020 |
| Industrial Packaging | Industrial Packaging | | Industrial Packaging | |
| Corrugated Packaging (b) | Corrugated Packaging (b) | 2,705 | | | 2,651 | | | 7,900 | | | 7,810 | | Corrugated Packaging (b) | 2,689 | | | 2,705 | | | 8,106 | | | 7,900 | |
| Containerboard | Containerboard | 760 | | | 736 | | | 2,370 | | | 2,140 | | Containerboard | 710 | | | 760 | | | 2,118 | | | 2,370 | |
| Recycling | Recycling | 460 | | | 556 | | | 1,388 | | | 1,790 | | Recycling | 521 | | | 541 | | | 1,647 | | | 1,630 | |
| Saturated Kraft | Saturated Kraft | 36 | | | 47 | | | 123 | | | 140 | | Saturated Kraft | 45 | | | 36 | | | 140 | | | 123 | |
| Gypsum/Release Kraft | Gypsum/Release Kraft | 50 | | | 49 | | | 154 | | | 149 | | Gypsum/Release Kraft | 56 | | | 50 | | | 179 | | | 154 | |
| Bleached Kraft | Bleached Kraft | 7 | | | 5 | | | 22 | | | 17 | | Bleached Kraft | 5 | | | 7 | | | 18 | | | 22 | |
| EMEA Packaging (b) | EMEA Packaging (b) | 374 | | | 375 | | | 1,190 | | | 1,124 | | EMEA Packaging (b) | 334 | | | 374 | | | 1,179 | | | 1,190 | |
| Brazilian Packaging (b) | Brazilian Packaging (b) | 98 | | | 96 | | | 271 | | | 272 | | Brazilian Packaging (b) | — | | | 98 | | | — | | | 271 | |
| European Coated Paperboard | European Coated Paperboard | 102 | | | 106 | | | 308 | | | 312 | | European Coated Paperboard | 56 | | | 102 | | | 267 | | | 308 | |
| Industrial Packaging | Industrial Packaging | 4,592 | | | 4,621 | | | 13,726 | | | 13,754 | | Industrial Packaging | 4,416 | | | 4,673 | | | 13,654 | | | 13,968 | |
Global Cellulose Fibers (in thousands of metric tons) (c) | Global Cellulose Fibers (in thousands of metric tons) (c) | 886 | | | 878 | | | 2,752 | | | 2,606 | | Global Cellulose Fibers (in thousands of metric tons) (c) | 856 | | | 886 | | | 2,605 | | | 2,752 | |
| Printing Papers | Printing Papers | | Printing Papers | |
| U.S. Uncoated Papers | U.S. Uncoated Papers | 336 | | | 451 | | | 998 | | | 1,340 | | U.S. Uncoated Papers | 379 | | | 336 | | | 1,104 | | | 998 | |
| European and Russian Uncoated Papers | European and Russian Uncoated Papers | 298 | | | 352 | | | 929 | | | 1,073 | | European and Russian Uncoated Papers | 248 | | | 298 | | | 882 | | | 929 | |
| Brazilian Uncoated Papers | Brazilian Uncoated Papers | 208 | | | 301 | | | 598 | | | 828 | | Brazilian Uncoated Papers | 275 | | | 208 | | | 801 | | | 598 | |
| Indian Uncoated Papers | — | | | 49 | | | — | | | 183 | | |
| Printing Papers | Printing Papers | 842 | | | 1,153 | | | 2,525 | | | 3,424 | | Printing Papers | 902 | | | 842 | | | 2,787 | | | 2,525 | |
(a)Sales volumes include third party and inter-segment sales and exclude sales of equity investees.
(b)Volumes for corrugated box sales reflect consumed tons sold (CTS). Board sales for these businesses reflect invoiced tons.
(c)Includes North American, European and Brazilian volumes and internal sales to mills.
Income Taxes
An income tax provision of $146 million was recorded for the third quarter of 2021 and the reported effective income tax rate was 16%. Excluding expense of $36 million related to the tax effects of net special items and expense of $13 million related to the tax effects of non-operating pension expense, the effective income tax rate was 18% for the quarter.
An income tax provision of $102 million was recorded for the second quarter of 2021 and the reported effective income tax rate was 24%. Excluding expense of $5 million related to the tax effects of net special items and expense of $13 million related to the tax effects of non-operating pension expense, the effective income tax rate was 21% for the quarter.
An income tax provision of $50 million was recorded for the third quarter of 2020 and the reported effective income tax rate was 18%. Excluding a benefit of $26 million related to the tax effects of net special items and expense of $4 million related to the tax effects of non-operating pension expense, the effective income tax rate was 19% for the quarter.
An income tax provision of $67 million was recorded for the second quarter of 2020 and the reported effective income tax rate was 26%. Excluding a benefit of $18 million related to the tax effects of net special items and expense of $3 million related to the tax effects of non-operating pension expense, the effective income tax rate was 26% for the quarter.
An income tax provision of $137 million was recorded for the third quarter of 2019 and the reported effective income tax rate was 30%. Excluding a benefit of $14 million related to the tax effects of net special items and a benefit of $2 million related to the tax effects of non-operating pension expense, the effective income tax rate was 27% for the quarter.
Interest Expense
Net interest expense was $93 million in the third quarter of 2021, compared with $57 million in the second quarter of 2021 and $112 million in the third quarter of 2020, compared with $1162020. Net interest expense includes interest expense of $8 million, in the second quarter of 2020 and $123 million in the third quarter of 2019.
Effects of Net Special Items and Non-Operating Pension Expense
Details of net special items and non-operating pension expense (income) for the three months and nine months ended are as follows:
| | | | | | | | | | | | | | | | | | | | | | | | | | | | | | | | | | | | | | |
| Three Months Ended |
| September 30, | | June 30, | |
| 2020 | | 2019 | | 2020 | |
| In millions | Before Tax | | After Tax | | Before Tax | | After Tax | | Before Tax | | After Tax | |
| Business Segments | | | | | | | | | | | | |
| Environmental remediation reserve adjustment | $ | 7 | | | $ | 6 | | (a) | $ | — | | | $ | — | | | $ | — | | | $ | — | | |
| Brazil Packaging impairment | (4) | | | (2) | | (b) | — | | | — | | | 9 | | | 7 | | (b) |
| Abandoned property removal | — | | | — | | | 13 | | | 10 | | (d) | 5 | | | 4 | | (d) |
| Italian antitrust fine | — | | | — | | | 32 | | | 32 | | (b) | — | | | — | | |
| Overhead cost reduction initiative | — | | | — | | | 10 | | | 8 | | (e) | — | | | — | | |
| India Papers impairment | — | | | — | | | 6 | | | 6 | | (a) | — | | | — | | |
| Riverdale mill conversion | — | | | — | | | 1 | | | 1 | | (a) | — | | | — | | |
| Gain on sale of previously closed Oregon mill site | — | | | — | | | (9) | | | (7) | | (b) | — | | | — | | |
| Multi-employer pension plan exit liability | — | | | — | | | (7) | | | (6) | | (b) | — | | | — | | |
| Other | (1) | | | (1) | | (c) | — | | | — | | | — | | | — | | |
| Business Segments Total | 2 | | | 3 | | | 46 | | | 44 | | | 14 | | | 11 | | |
| Corporate | | | | | | | | | | | | |
| Debt extinguishment costs | 105 | | | 79 | | | — | | | — | | | 18 | | | 13 | | |
| Asbestos litigation reserve adjustment | — | | | — | | | — | | | — | | | 43 | | | 33 | | |
| Gain on sale of portion of investment in India | — | | | — | | | — | | | — | | | (6) | | | (6) | | |
| Litigation reserves | — | | | — | | | 22 | | | 17 | | | — | | | — | | |
| Environmental remediation reserve adjustment | — | | | — | | | 15 | | | 11 | | | — | | | — | | |
| Overhead cost reduction initiative | — | | | — | | | 11 | | | 8 | | | — | | | — | | |
| Other | 2 | | | 1 | | | — | | | — | | | (1) | | | (1) | | |
| Corporate Total | 107 | | | 80 | | | 48 | | | 36 | | | 54 | | | 39 | | |
| Total net special items | 109 | | | 83 | | | 94 | | | 80 | | | 68 | | | 50 | | |
| Non-operating pension expense (income) | (11) | | | (7) | | | 9 | | | 7 | | | (14) | | | (11) | | |
| Total net special items and non-operating pension expense (income) | $ | 98 | | | $ | 76 | | | $ | 103 | | | $ | 87 | | | $ | 54 | | | $ | 39 | | |
(a) Recorded in the Printing Papers segment.
(b) Recorded in the Industrial Packaging segment.
(c) Includesinterest income of $2$28 million (before and after taxes) recorded in the Printing Papers segment and chargesinterest income of $1 million (before and after taxes) recorded in the Industrial Packaging segment.
(d) Includes $3 million ($2 million after taxes) and $9 million ($7 million after taxes) for the three months ended June 30, 2020 and September 30, 2019, respectively, recorded in the Industrial Packaging segment; $2 million (before and after taxes) and $3 million ($2 million after taxes) for the three months ended June 30, 2020 and September 30, 2019, respectively, recorded in the Global Cellulose Fibers segment; $1 million (before and after taxes) for the three months ended September 30, 2019, recorded in the Printing Papers segment.
(e) Includes $4 million ($3 million after taxes) recorded in the Global Cellulose Fibers segment2021, June 30, 2021 and $6 million ($5 million after taxes) recorded in the Printing Papers segment.
Effects of Net Special Items and Non-Operating Pension Expense
Details of net special items and non-operating pension expense (income) for the three months ended are as follows:
| | | | | | | | | | | | | | | | | | | | | | | | | | | | | | | | | | | | | | |
| Three Months Ended |
| September 30, | | June 30, | |
| 2021 | | 2020 | | 2021 | |
| In millions | Before Tax | | After Tax | | Before Tax | | After Tax | | Before Tax | | After Tax | |
| Business Segments | | | | | | | | | | | | |
| Foreign value-added tax credit accrual | $ | 7 | | | $ | 5 | | (a) | $ | — | | | $ | — | | | $ | (42) | | | $ | (28) | | (a) |
| Printing Papers spin-off | 4 | | | 4 | | (a) | — | | | — | | | — | | | — | | |
| Environmental remediation reserve adjustment | — | | | — | | | 7 | | | 6 | | (a) | — | | | — | | |
| Gain on sale of Kwidzyn, Poland mill | (360) | | | (350) | | (a) | — | | | — | | | — | | | — | | |
| EMEA Packaging impairment - Turkey | — | | | — | | | — | | | — | | | (8) | | | (2) | | (b) |
| Brazil Packaging impairment | — | | | — | | | (4) | | ` | (2) | | (b) | — | | | — | | |
| Other | — | | | — | | | (1) | | | (1) | | (c) | — | | | — | | |
| Business Segments Total | (349) | | | (341) | | | 2 | | | 3 | | | (50) | | | (30) | | |
| Corporate | | | | | | | | | | | | |
| Debt extinguishment costs | 35 | | | 26 | | | 105 | | | 79 | | | 170 | | | 128 | | |
| Printing Papers spin-off / Building a Better IP | 53 | | | 47 | | | — | | | — | | | 28 | | | 23 | | |
| Environmental remediation reserve adjustment | 5 | | | 4 | | | — | | | — | | | 5 | | | 3 | | |
| Real estate - office impairment | — | | | — | | | — | | | — | | | 21 | | | 16 | | |
| Gain on sale of La Mirada, California distribution center | (86) | | | (65) | | | — | | | — | | | — | | | — | | |
| Gain on sale of equity investment in Graphic Packaging | — | | | — | | | — | | | — | | | (130) | | | (98) | | |
| Other | 4 | | | 3 | | | 3 | | | 2 | | | 7 | | | 5 | | |
| Corporate Total | 11 | | | 15 | | | 108 | | | 81 | | | 101 | | | 77 | | |
| Total net special items | (338) | | | (326) | | | 110 | | | 84 | | | 51 | | | 47 | | |
| Non-operating pension expense (income) | (51) | | | (38) | | | (11) | | | (7) | | | (52) | | | (39) | | |
| Total net special items and non-operating pension expense (income) | $ | (389) | | | $ | (364) | | | $ | 99 | | | $ | 77 | | | $ | (1) | | | $ | 8 | | |
(a) Recorded in the Printing Papers segment.
(b) Recorded in the Industrial Packaging segment.
(c) Includes a charge of $1 million (before and after taxes) recorded in the Industrial Packaging segment and income of $2 million (before and after taxes) recorded in the Printing Papers segment.
Net special items include the following tax expenses (benefits):
| | | | | | | | | | | | | | | | | | | | |
| | Three Months Ended |
| | September 30, | | June 30, |
| In millions | | 2021 | | 2020 | | 2021 |
| Foreign and state taxes related to Printing Papers spin-off | | $ | 27 | | | $ | — | | | $ | — | |
| Total | | $ | 27 | | | $ | — | | | $ | — | |
Details of net special items and non-operating pension expense for the nine months ended are as follows:
| | | Nine Months Ended | | | Nine Months Ended
September 30, | |
| | September 30, | | |
| | 2020 | 2019 | | 2021 | 2020 | |
| In millions | In millions | | Before Tax | | After Tax | | Before Tax | | After Tax | | In millions | | Before Tax | | After Tax | | Before Tax | | After Tax | | |
| Business Segments | Business Segments | | | | Business Segments | | |
| EMEA Packaging business optimization | | EMEA Packaging business optimization | | $ | 12 | | | $ | 10 | | (a) | $ | — | | | $ | — | | | |
| Printing Papers spin-off | | Printing Papers spin-off | | 4 | | | 4 | | (c) | — | | | — | | | |
| Brazil Packaging impairment | Brazil Packaging impairment | | $ | 349 | | | $ | 342 | | (a) | $ | — | | | $ | — | | | Brazil Packaging impairment | | — | | | — | | | 349 | | | 342 | | (a) | |
| Abandoned property removal | Abandoned property removal | | 14 | | | 11 | | (b) | 35 | | | 26 | | (b) | Abandoned property removal | | — | | | — | | | 14 | | | 11 | | (b) | |
| Environmental remediation reserve adjustment | Environmental remediation reserve adjustment | | 7 | | | 6 | | (c) | — | | | — | | | Environmental remediation reserve adjustment | | — | | | — | | | 7 | | | 6 | | (c) | |
| Riverdale mill conversion | Riverdale mill conversion | | 1 | | | 1 | | (c) | 3 | | | 3 | | (c) | Riverdale mill conversion | | — | | | — | | | 1 | | | 1 | | (c) | |
| Foreign value-added tax refund accrual | | (2) | | | (1) | | (a) | — | | | — | | | |
| India Papers impairment | | — | | | — | | | 151 | | | 149 | | (c) | |
| Italian antitrust fine | | — | | | — | | | 32 | | | 32 | | (a) | |
| Overhead cost reduction initiative | | — | | | — | | | 10 | | | 8 | | (e) | |
| Multi-employer pension plan exit liability | | — | | | — | | | 9 | | | 6 | | (a) | |
| Gain on sale of previously closed Oregon mill site | | — | | | — | | | (9) | | | (7) | | (a) | |
| Gain on sale of EMEA Packaging box plant | | — | | | — | | | (7) | | | (6) | | (a) | |
| Gain on sale of Kwidzyn, Poland mill | | Gain on sale of Kwidzyn, Poland mill | | (360) | | | (350) | | (c) | — | | | — | | | |
| Foreign value-added tax credit accrual | | Foreign value-added tax credit accrual | | (35) | | | (23) | | (c) | (2) | | | (1) | | (a) | |
| EMEA Packaging impairment - Turkey | | EMEA Packaging impairment - Turkey | | (6) | | | — | | (a) | — | | | — | | | |
| Other | Other | | (1) | | | (1) | | (d) | — | | | — | | | Other | | — | | | — | | | $ | (1) | | | $ | (1) | | (d) | |
| Business Segments Total | Business Segments Total | | 368 | | | 358 | | | 224 | | | 211 | | | Business Segments Total | | (385) | | | (359) | | | $ | 368 | | | $ | 358 | | | |
| Corporate | Corporate | | Corporate | | |
| Debt extinguishment costs | Debt extinguishment costs | | 131 | | | 98 | | | — | | | — | | | Debt extinguishment costs | | 223 | | | 168 | | | 131 | | | 98 | | | |
| Printing Papers spin-off / Building a Better IP | | Printing Papers spin-off / Building a Better IP | | 106 | | | 90 | | | — | | | — | | | |
| Real estate - office impairment | | Real estate - office impairment | | 21 | | | 16 | | | — | | | — | | | |
| Environmental remediation reserve adjustment | | Environmental remediation reserve adjustment | | 10 | | | 7 | | | 41 | | | 31 | | | |
| Asbestos litigation reserve adjustment | Asbestos litigation reserve adjustment | | 43 | | | 33 | | | — | | | — | | | Asbestos litigation reserve adjustment | | — | | | — | | | 43 | | | 33 | | | |
| Gain on sale of portion of investment in India | | (6) | | | (6) | | | — | | | — | | | |
| India investment fair value adjustment | | 17 | | | 17 | | | — | | | — | | | |
| Environmental remediation reserve adjustment | | 41 | | | 31 | | | 15 | | | 11 | | | |
| Gain on sale of portion of equity investment in Graphic Packaging | | (33) | | | (25) | | | — | | | — | | | |
| Litigation reserves | | — | | | — | | | 22 | | | 17 | | | |
| Overhead cost reduction initiative | | — | | | — | | | 11 | | | 8 | | | |
| Interest expense related to foreign tax audits | | — | | | — | | | 1 | | | 1 | | | |
| India transaction | | India transaction | | — | | | — | | | 11 | | | 11 | | | |
| Gain on sale of equity investment in Graphic Packaging | | Gain on sale of equity investment in Graphic Packaging | | (204) | | | (154) | | | (33) | | | (25) | | | |
| Gain on sale of La Mirada, California distribution center | | Gain on sale of La Mirada, California distribution center | | (86) | | | (65) | | | — | | | — | | | |
| Other | Other | | — | | | (1) | | | — | | | — | | | Other | | 11 | | | 8 | | | 2 | | | 1 | | | |
| Corporate Total | Corporate Total | | 193 | | | 147 | | | 49 | | | 37 | | | Corporate Total | | 81 | | | 70 | | | $ | 195 | | | $ | 149 | | | |
| Total net special items | Total net special items | | 561 | | | 505 | | | 273 | | | 248 | | | Total net special items | | (304) | | | (289) | | | 563 | | | 507 | | | |
| Non-operating pension expense (income) | Non-operating pension expense (income) | | (31) | | | (23) | | | 27 | | | 21 | | | Non-operating pension expense (income) | | (156) | | | (117) | | | (31) | | | (23) | | | |
| Total net special items and non-operating pension expense (income) | Total net special items and non-operating pension expense (income) | | $ | 530 | | | $ | 482 | | | $ | 300 | | | $ | 269 | | | Total net special items and non-operating pension expense (income) | | $ | (460) | | | $ | (406) | | | $ | 532 | | | $ | 484 | | | |
(a) Recorded in the Industrial Packaging segment.
(b) Includes $9 million ($7 million after taxes) for the nine months ended September 30, 2020 recorded in the Industrial Packaging segment and $25$5 million ($194 million after taxes) for the nine months ended September 30, 2020 and September 30, 2019, respectively, recorded in the Industrial Packaging segment; $5 million ($4 million after taxes) and $8 million ($5 million after taxes) for the nine months ended September 30, 2020 and September 30, 2019, respectively, recorded in the Global Cellulose Fibers segment; and $2 million (before and after taxes) for the nine months ended September 30, 2019, recorded in the Printing Papers segment.
(c) Recorded in the Printing Papers segment.
(d) Includes income of $2 million (before and after taxes) recorded in the Printing Papers segment and charges of $1 million (before and after taxes) recorded in the Industrial Packaging segment.
(e) Includes charges of $4 million ($3 million after taxes) recorded in the Global Cellulose Fibers segment and charges of $6 million ($5 million after taxes) recorded in the Printing Papers segment.
Net special items include the following tax expenses (benefits):
| | | | | | | | | | | | | | |
| | Nine Months Ended |
| | September 30, |
| In millions | | 2020 | | 2019 |
| Luxembourg tax law rate change | | $ | — | | | $ | 9 | |
| State income tax legislative changes | | — | | | (3) | |
| Settlement of foreign tax audits | | — | | | 3 | |
| Total | | $ | — | | | $ | 9 | |
| | | | | | | | | | | | | | |
| | Nine Months Ended |
| | September 30, |
| In millions | | 2021 | | 2020 |
| Foreign and state taxes related to Printing Papers spin-off | | $ | 27 | | | $ | — | |
| Total | | $ | 27 | | | $ | — | |
The following tables present net sales and business segment operating profit (loss) which is the Company's measure of segment profitability.
Industrial Packaging
| | Total Industrial Packaging | Total Industrial Packaging | 2020 | | 2019 | Total Industrial Packaging | 2021 | | 2020 |
| In millions | In millions | 3rd Quarter | | 2nd Quarter | | Nine Months | | 3rd Quarter | | 2nd Quarter | | Nine Months | In millions | 3rd Quarter | | 2nd Quarter | | Nine Months | | 3rd Quarter | | 2nd Quarter | | Nine Months |
| Sales | Sales | $ | 3,768 | | | $ | 3,633 | | | $ | 11,220 | | | $ | 3,820 | | | $ | 3,864 | | | $ | 11,516 | | Sales | $ | 4,087 | | | $ | 4,056 | | | $ | 12,096 | | | $ | 3,768 | | | $ | 3,633 | | | $ | 11,220 | |
| Operating Profit (Loss) | Operating Profit (Loss) | $ | 469 | | | $ | 449 | | | $ | 1,388 | | | $ | 535 | | | $ | 515 | | | $ | 1,471 | | Operating Profit (Loss) | $ | 429 | | | $ | 408 | | | $ | 1,284 | | | $ | 469 | | | $ | 449 | | | $ | 1,388 | |
Industrial Packaging net sales for the third quarter of 20202021 were 4%1% higher compared with the second quarter of 20202021 and 1%8% higher compared with the third quarter of 2020. Operating profit was 5% higher in the third quarter of 2021 compared with the second quarter of 2021 and 9% lower compared with the third quarter of 2019. Operating profit was 4% higher in the third quarter of 2020 compared with the second quarter of 2020 and 12% lower compared with the third quarter of 2019.2020.
| | North American Industrial Packaging | North American Industrial Packaging | 2020 | | 2019 | North American Industrial Packaging | 2021 | | 2020 |
| In millions | In millions | 3rd Quarter | | 2nd Quarter | | Nine Months | | 3rd Quarter | | 2nd Quarter | | Nine Months | In millions | 3rd Quarter | | 2nd Quarter | | Nine Months | | 3rd Quarter | | 2nd Quarter | | Nine Months |
| Sales (a) | Sales (a) | $ | 3,351 | | | $ | 3,241 | | | $ | 9,947 | | | $ | 3,368 | | | $ | 3,414 | | | $ | 10,158 | | Sales (a) | $ | 3,738 | | | $ | 3,587 | | | $ | 10,810 | | | $ | 3,351 | | | $ | 3,241 | | | $ | 9,947 | |
| Operating Profit (Loss) | Operating Profit (Loss) | $ | 455 | | | $ | 434 | | | $ | 1,326 | | | $ | 525 | | | $ | 515 | | | $ | 1,459 | | Operating Profit (Loss) | $ | 418 | | | $ | 377 | | | $ | 1,190 | | | $ | 455 | | | $ | 434 | | | $ | 1,326 | |
(a)Includes intra-segment sales of $31$34 million and $25$31 million for the three months ended September 30, 2021 and 2020, respectively; $27 million and 2019, respectively; $31 million for each of the three months ended June 30, 20202021 and 2019,2020, respectively; and $94$87 million and $87$94 million for the nine months ended September 30, 20202021 and 2019,2020, respectively.
North American Industrial Packaging sales volumes in the third quarter of 2020 increased2021 were lower compared to the second quarter of 2020,2021, reflecting lower shipments for boxes and domestic containerboard partially offset by higher shipments for boxes, partially offset by lower export containerboard volumes. The COVID-19 pandemic continues to have a mixed impact on box demand reflecting strong growth in the eCommerce segment as online shopping continues to be a major spending channel for consumers amid COVID-19 pandemic concerns. The shipping and distribution and protein segmentscontainerboard. Box shipments were also favorably impacted. Demand for produce, processed foods and beverage in addition to non-essential items within the durable and non-durable segments were negatively impacted by COVID-19 restrictions and lower discretionary spending.constrained containerboard availability as supply chains remain stretched. Total maintenance and economic downtime was about 51,000202,000 tons lower in the third quarter of 20202021 compared with the second quarter of 2020, primarily2021, driven by lower economicmaintenance downtime. Average sales margins were stable as lowersignificantly higher reflecting higher average sales prices for boxes wasand export containerboard. Operating costs were lower, driven by strong mill operations partially offset by higher export containerboard prices and a favorable mix. Operating costs were higher, driven by multiple weather events impacting our mix system and seasonality in our box plants.converting costs. Planned maintenance downtime costs were $20$123 million higherlower in the third quarter of 20202021 compared with the second quarter of 2020.2021. Input costs were lower,substantially higher, primarily for wood, recovered fiber and wood, partially offset by higher energy costs. Earnings in both the third quarter and the second quarter of 2020 benefited from insurance recoveries related to the Rome fire and Bogalusa recovery boiler event.energy.
Compared with the third quarter of 2019,2020, sales volumes were higherlower in the third quarter of 20202021 for bothexport containerboard partially offset by higher shipments for domestic containerboard. Sales volumes for boxes and export containerboard.were slightly lower reflecting the impact of the challenging supply chain environment. Total maintenance and economic downtime was about 173,00040,000 tons lower in the third quarter of 2020, primarily2021, driven by lower economicmaintenance downtime. Export containerboard and box prices were significantly lowerhigher reflecting prior index movements throughout 2019 and early 2020.previous price increases. Operating costs increased, driven by multiple weather events impacting our mill systeminflation and costs associated with the Riverdale conversion.increased converting and transportation costs. Planned maintenance downtime costs were $13$17 million higherlower in the third quarter of 2020 compared with the third quarter of 2019. Input costs were lower driven by lower wood, energy and distribution costs, partially offset by higher recovered fiber costs. Earnings in the third quarter of 2020 benefited from insurance recoveries related to the Rome fire and Bogalusa recovery boiler event.
Entering the fourth quarter of 2020, sales volumes for boxes are expected to be lower, driven by three fewer shipping days compared with the third quarter of 2020. Demand continues to be mixed reflecting continued strong demand for eCommerce, protein and shipping and distribution, offset by slower demand for fresh foods and durable and other non-durable goods. Export containerboard volumes are expected to be modestly higher. Average sales margins for boxes are expected to be lower, slightly offset by higher export containerboard average sales margins. Operating costs are expected to improve without the cost of weather related events that occurred in the third quarter of 2020. Planned maintenance downtime costs are expected to be $35 million lower in the fourth quarter of 20202021 compared with the third quarter of 2020. Input costs were significantly higher driven by recovered fiber, energy, chemicals and wood.
Entering the fourth quarter of 2021, sales volumes for boxes and export containerboard are expected to be higher compared to the third quarter of 2021. Average sales margins are also expected to be higher, reflecting previous price increases. Operating costs are expected to be lower. Planned maintenance downtime costs are expected to be $4 million higher in the fourth quarter of 2021 compared with the third quarter of 2021. Input costs are expected to be higher primarily for energy.recovered fiber, energy and chemicals.
| | EMEA Industrial Packaging | EMEA Industrial Packaging | 2020 | | 2019 | EMEA Industrial Packaging | 2021 | | 2020 |
| In millions | In millions | 3rd Quarter | | 2nd Quarter | | Nine Months | | 3rd Quarter | | 2nd Quarter | | Nine Months | In millions | 3rd Quarter | | 2nd Quarter | | Nine Months | | 3rd Quarter | | 2nd Quarter | | Nine Months |
| Sales | Sales | $ | 306 | | | $ | 297 | | | $ | 953 | | | $ | 324 | | | $ | 331 | | | $ | 994 | | Sales | $ | 331 | | | $ | 394 | | | $ | 1,121 | | | $ | 306 | | | $ | 297 | | | $ | 953 | |
| Operating Profit (Loss) | Operating Profit (Loss) | $ | 3 | | | $ | 5 | | | $ | 18 | | | $ | (1) | | | $ | (7) | | | $ | (23) | | Operating Profit (Loss) | $ | (4) | | | $ | 12 | | | $ | 34 | | | $ | 3 | | | $ | 5 | | | $ | 18 | |
EMEA Industrial Packaging sales volumes for boxes in the third quarter of 20202021 were higherlower compared with the second quarter of 2020 as the impacts of the COVID-19 pandemic showed some recovery in all regions at the end of the third quarter, partially offset2021 driven by seasonally lower volumes in Morocco. Average sales margins for boxes were stable in Europe and seasonally lower in Morocco and Turkey.reflecting increased containerboard costs, partially offset by higher box prices. Operating costs were lower. Planned maintenance downtime costs were $3$2 million higher in the third quarter of 20202021 compared with the second quarter of 2020 with an outage at our Madrid, Spain mill.2021. Input costs were lower. Earnings were negatively affected by unfavorable foreign currency impacts,higher, primarily for recovered fiber and energy. The company completed the sale of its business in Morocco.Turkey during the second quarter of 2021.
Compared with the third quarter of 2019,2020, sales volumes in the third quarter of 20202021 were slightly lower, primarily due tohigher, reflecting recovery of the impacts of the COVID-19 pandemic mostly offset by strong year over year recovery in Turkey.pandemic. Average sales margins improved significantly, reflecting stable sales prices for boxes andwere lower driven by higher containerboard costs. Average sales margins for containerboard were higher reflecting higher sales prices. Operating costs improved from the ramp-upreflecting strong
operations and cost management. Planned maintenance downtime costs were $3$1 million higherlower in the third quarter of 20202021 compared with the third quarter of 2019.2020. Input costs were lower.higher, primarily for recovered fiber and energy. Earnings were negatively affected by unfavorable foreign currency impactsbenefited from the recent box plant acquisitions in Turkey.Spain.
Looking ahead to the fourth quarter of 2020,2021, sales volumes for boxes are expected to be seasonally higher, primarily in Morocco.higher. Average sales margins are expected to be slightly higher.lower due to continued rising containerboard pricing. Operating costs are expected to be higher. Planned maintenance downtime costs are expected to be $3$1 million lower in the fourth quarter of 20202021 compared with the third quarter of 2020.2021. Input costs are expected to be higher primarily for energy.due to rising energy costs.
| | | | | | | | | | | | | | | | | | | | | | | | | | | | | | | | | | | |
| Brazilian Industrial Packaging | 2020 | | 2019 |
| In millions | 3rd Quarter | | 2nd Quarter | | Nine Months | | 3rd Quarter | | 2nd Quarter | | Nine Months |
| Sales | $ | 52 | | | $ | 42 | | | $ | 148 | | | $ | 61 | | | $ | 58 | | | $ | 176 | |
| Operating Profit (Loss) | $ | — | | | $ | (2) | | | $ | (3) | | | $ | (6) | | | $ | (1) | | | $ | (12) | |
| | | | | | | | | | | | | | | | | | | | | | | | | | | | | | | | | | | |
| Brazilian Industrial Packaging | 2021 | | 2020 |
| In millions | 3rd Quarter | | 2nd Quarter | | Nine Months | | 3rd Quarter | | 2nd Quarter | | Nine Months |
| Sales | $ | — | | | $ | — | | | $ | — | | | $ | 52 | | | $ | 42 | | | $ | 148 | |
| Operating Profit (Loss) | $ | — | | | $ | — | | | $ | — | | | $ | — | | | $ | (2) | | | $ | (3) | |
On March 29, 2020 International Paper announced that it had entered into an agreement to sell its Brazilian Industrial Packaging business. The transaction closed October 14, 2020.
| | European Coated Paperboard | European Coated Paperboard | 2020 | | 2019 | European Coated Paperboard | 2021 | | 2020 |
| In millions | In millions | 3rd Quarter | | 2nd Quarter | | Nine Months | | 3rd Quarter | | 2nd Quarter | | Nine Months | In millions | 3rd Quarter | | 2nd Quarter | | Nine Months | | 3rd Quarter | | 2nd Quarter | | Nine Months |
| Sales | Sales | $ | 90 | | | $ | 84 | | | $ | 266 | | | $ | 92 | | | $ | 92 | | | $ | 275 | | Sales | $ | 52 | | | $ | 102 | | | $ | 252 | | | $ | 90 | | | $ | 84 | | | $ | 266 | |
| Operating Profit (Loss) | Operating Profit (Loss) | $ | 11 | | | $ | 12 | | | $ | 47 | | | $ | 17 | | | $ | 8 | | | $ | 47 | | Operating Profit (Loss) | $ | 15 | | | $ | 19 | | | $ | 60 | | | $ | 11 | | | $ | 12 | | | $ | 47 | |
European Coated Paperboard sales volumes in the third quarter of 20202021 compared with the second quarter of 20202021 were higher in both Europe and Russia as the negative demand impact of the COVID-19 pandemic showed some improvement.higher. Average sales margins were lower in both regions drivenflat reflecting higher average sales prices offset by an unfavorable mix. Operating costs were higher in Europe and flat in Russia.stable. Planned maintenance downtime costs were $3$5 million higherlower in the third quarter of 20202021 compared with the second quarter of 2020.2021 in Russia. Input costs were higher in Europe primarily for energy and purchased pulp. In Russia, input costs were lower, driven by wood and chemicals. Earnings benefited from favorable foreign currency impacts in both regions.flat.
Compared with the third quarter of 2019,2020, sales volumes increased in Russia, but decreased in Europe reflecting the demand impact of the COVID-19 pandemic.were lower. Average sales margins were lower in both regions,higher reflecting lowerhigher average sales prices and an unfavorablea favorable mix. Operating costs were higher in Europe and lower in Russia. Plannedflat. There were no planned maintenance downtime costs were $7 million higheroutages in either the third quarter of 2021 or the third quarter of 2020 compared with the third quarter of 2019.in Russia. Input costs were lower in Europeslightly higher primarily for purchased pulp, energywood and wood. In Russia, input costs were stable. Earnings benefited from favorable foreign currency impacts in both regions.chemicals.
EnteringOn October 1, 2021, International Paper successfully completed the fourth quarterspin-off of 2020, sales volumes are expected to be lowerour global papers business, including our remaining coated paperboard business in Russia, and stable in Europe. Average sales margins are expected to be stable in Europe and higher in Russia. Operating costs are expected to be higher in both regions. Planned maintenance downtime costs are expected to be $7 million lower in the fourth quarter of 2020 compared with the third quarter of 2020. Input costs are expected to be stable in both regions.into a standalone, publicly traded company named Sylvamo Corporation.
Global Cellulose Fibers
| | Total Global Cellulose Fibers | Total Global Cellulose Fibers | 2020 | | 2019 | Total Global Cellulose Fibers | 2021 | | 2020 |
| In millions | In millions | 3rd Quarter | | 2nd Quarter | | Nine Months | | 3rd Quarter | | 2nd Quarter | | Nine Months | In millions | 3rd Quarter | | 2nd Quarter | | Nine Months | | 3rd Quarter | | 2nd Quarter | | Nine Months |
| Sales | Sales | $ | 564 | | | $ | 605 | | | $ | 1,737 | | | $ | 624 | | | $ | 661 | | | $ | 1,974 | | Sales | $ | 729 | | | $ | 671 | | | $ | 1,981 | | | $ | 564 | | | $ | 605 | | | $ | 1,737 | |
| Operating Profit (Loss) | Operating Profit (Loss) | $ | (59) | | | $ | (10) | | | $ | (123) | | | $ | 4 | | | $ | — | | | $ | 39 | | Operating Profit (Loss) | $ | 96 | | | $ | 10 | | | $ | 24 | | | $ | (59) | | | $ | (10) | | | $ | (123) | |
Global Cellulose Fibers net sales were 7% lower in the third quarter of 2020 than in2021 were 9% higher compared with the second quarter of 20202021 and 10% lower29% higher than in the third quarter of 2019.2020. Operating profit in the third quarter of 2020 was2021 improved significantly lower compared to both the second quarter of 20202021 and the third quarter of 2019.2020.
On August 6, 2021 International Paper completed the sale of our Kwidzyn, Poland mill, including its cellulose fibers business. The third quarter of 2021 reflects one month of the Kwidzyn, Poland mill sales and operating profit. On October 1, 2021, International Paper successfully completed the spin-off of our global papers business, including our cellulose fibers business in France and Russia, into a standalone, publicly traded company named Sylvamo Corporation.
Sales volumes in the third quarter of 20202021 compared with the second quarter of 20202021 were seasonally lowerflat and reflect slower COVID-19 pandemic-related consumer demand. Weakened demandcontinue to be impacted by shipping delays due to significant port congestion in the paper segment was partially offset by increased consumer demand for absorbent hygiene and tissue and towel products.U.S. Total maintenance and economic downtime was about 96,00028,000 tons higherlower in the third quarter of 20202021 compared with the second quarter of 2020 primarily2021 due to higher maintenance downtime. Average sales margins improved significantly, reflecting flow through of previous sales price increases.increases and an improved product mix. Operating costs were lower, drivenpartially offset by seasonality and one-time items.higher distribution costs reflecting the challenging export supply chain
environment. Planned maintenance downtime costs in the third quarter of 20202021 were $43$18 million higherlower compared with the second quarter of 2021. Input costs were higher, primarily for wood, chemicals and energy.
Compared with the third quarter of 2020, sales volumes in the third quarter of 2021 were higher but were impacted by the shipping delays due to port congestion. Total maintenance and economic downtime was about 80,000 tons lower in the third quarter of 2021, driven by maintenance and economic downtime. Average sales prices were significantly higher for both fluff and market pulp. Operating costs were higher due to inflation. Distribution costs were also higher. Planned maintenance downtime costs in the third quarter of 2021 were $26 million lower compared with the third quarter of 2020. Input costs were higher primarily for wood, energychemicals and chemicals.
Compared with the third quarter of 2019, sales volumes in the third quarter of 2020 were lower for both fluff and market pulp driven by slowing demand reflecting customer destocking related to the COVID-19 pandemic. Total maintenance and economic downtime was about 13,000 tons higher in the third quarter of 2020, primarily due to higher maintenance downtime. Average sales prices were significantly lower for both fluff and market pulp. Operating costs were favorable reflecting one-time benefits in the third quarter of 2020 and the negative impacts of Hurricane Dorian in the third quarter of 2019. Planned maintenance downtime costs in the third quarter of 2020 were $32 million higher compared with the third quarter of 2019. Input costs were stable.energy.
Entering the fourth quarter of 2020,2021, sales volumes are expected to be stable.slightly lower. Average sales margins are expected to be lower.stable. Planned maintenance downtime costs in the fourth quarter of 20202021 are expected to be $4$36 million higher compared with the third quarter of 2020.2021. Operating costs are expected to be seasonally higher. Operating costs will be negatively affected by the non-repeat of one-time benefits in the third quarter of 2020. Input costs are expected to be higher primarilyincrease for wood, chemicals and energy.
Printing Papers
| | Total Printing Papers | Total Printing Papers | 2020 | | 2019 | Total Printing Papers | 2021 | 2020 | |
| In millions | In millions | 3rd Quarter | | 2nd Quarter | | Nine Months | | 3rd Quarter | | 2nd Quarter | | Nine Months | In millions | 3rd Quarter | | 2nd Quarter | | Nine Months | | 3rd Quarter | | 2nd Quarter | | Nine Months |
| Sales | Sales | $ | 743 | | | $ | 583 | | | $ | 2,234 | | | $ | 1,071 | | | $ | 1,088 | | | $ | 3,224 | | Sales | $ | 846 | | | $ | 846 | | | $ | 2,473 | | | $ | 743 | | | $ | 583 | | | $ | 2,234 | |
| Operating Profit (Loss) | Operating Profit (Loss) | $ | 63 | | | $ | (11) | | | $ | 148 | | | $ | 162 | | | $ | 114 | | | $ | 420 | | Operating Profit (Loss) | $ | 106 | | | $ | 76 | | | $ | 262 | | | $ | 63 | | | $ | (11) | | | $ | 148 | |
On October 1, 2021, International Paper successfully completed the spin-off of our global papers business into a standalone, publicly traded company named Sylvamo Corporation.
Printing Papers net sales for the third quarter of 20202021 were 27% higher than inflat compared with the second quarter of 20202021 and 31% lower14% higher than in the third quarter of 2019.2020. Operating profit in the third quarter of 20202021 was significantly39% higher compared with the second quarter of 20202021 and significantly lower68% higher compared with the third quarter of 2019.2020.
| | North American Papers | North American Papers | 2020 | | 2019 | North American Papers | 2021 | | 2020 |
| In millions | In millions | 3rd Quarter | | 2nd Quarter | | Nine Months | | 3rd Quarter | | 2nd Quarter | | Nine Months | In millions | 3rd Quarter | | 2nd Quarter | | Nine Months | | 3rd Quarter | | 2nd Quarter | | Nine Months |
| Sales | Sales | $ | 362 | | | $ | 265 | | | $ | 1,073 | | | $ | 492 | | | $ | 486 | | | $ | 1,474 | | Sales | $ | 425 | | | $ | 410 | | | $ | 1,201 | | | $ | 362 | | | $ | 265 | | | $ | 1,073 | |
| Operating Profit (Loss) | Operating Profit (Loss) | $ | 31 | | | $ | (23) | | | $ | 31 | | | $ | 76 | | | $ | 41 | | | $ | 174 | | Operating Profit (Loss) | $ | 45 | | | $ | 18 | | | $ | 78 | | | $ | 31 | | | $ | (23) | | | $ | 31 | |
North American Papers sales volumes in the third quarter of 20202021 were higherflat compared with the second quarter of 2021. Total maintenance and economic downtime was about 9,000 tons lower in the third quarter of 2021 compared with the second quarter of 2021 due to maintenance downtime. Average sales margins improved reflecting higher sales prices. Operating costs were lower reflecting strong mill operations. Planned maintenance downtime costs were $19 million lower in the third quarter of 2021, compared with the second quarter of 2021. Input costs were higher, primarily for wood, energy and chemicals.
Compared with the third quarter of 2020, across all grades for uncoated freesheet papersales volumes in the third quarter of 2021 were higher reflecting signs ofdemand recovery from the unprecedented demand decline due to the COVID-19 pandemic. Total maintenance and economic downtime was about 128,00078,000 tons lower in the third quarter of 20202021 compared with the secondthird quarter of 2020 primarily due to economic downtime. Average sales margins were stable. Operating costs were flat. Planned maintenance downtime costs were $1 million higher, in the third quarter of 2020, compared with the second quarter of 2020. Input costs were flat.
Compared with the third quarter of 2019, sales volumes in the third quarter of 2020 were significantly lower across all grades for uncoated freesheet paper driven by the demand impact of the COVID-19 pandemic. Total maintenance and economic
downtime was about 48,000 tons higher in the third quarter of 2020 compared with the third quarter of 2019 primarily due to economic downtime associated with the COVID-19 pandemic. Average sales margins were lower, reflecting lower average sales prices. Operating costs were stable.lower. Planned maintenance downtime costs were $3$6 million lower in the third quarter of 20202021 compared with the third quarter of 2019.2020. Input costs were favorable,higher, primarily for wood, energy and chemicals.
Entering | | | | | | | | | | | | | | | | | | | | | | | | | | | | | | | | | | | |
| European Papers | 2021 | | 2020 |
| In millions | 3rd Quarter | | 2nd Quarter | | Nine Months | | 3rd Quarter | | 2nd Quarter | | Nine Months |
| Sales | $ | 218 | | | $ | 255 | | | $ | 723 | | | $ | 232 | | | $ | 209 | | | $ | 728 | |
| Operating Profit (Loss) | $ | 16 | | | $ | 15 | | | $ | 53 | | | $ | 17 | | | $ | 13 | | | $ | 71 | |
On August 6, 2021 International Paper completed the fourthsale of our Kwidzyn, Poland mill. The third quarter of 2020,2021 reflects one month of the Kwidzyn, Poland mill sales volumes are expected to be slightly higher driven by export sales. Average sales margins are expected to be stable. Operating costs are expected to be seasonally higher. Planned maintenance downtime costs are expected to be slightly lower in the fourth quarter of 2020. Input costs are expected to be higher, primarily for energy and wood.
| | | | | | | | | | | | | | | | | | | | | | | | | | | | | | | | | | | |
| European Papers | 2020 | | 2019 |
| In millions | 3rd Quarter | | 2nd Quarter | | Nine Months | | 3rd Quarter | | 2nd Quarter | | Nine Months |
| Sales | $ | 232 | | | $ | 209 | | | $ | 728 | | | $ | 299 | | | $ | 321 | | | $ | 929 | |
| Operating Profit (Loss) | $ | 17 | | | $ | 13 | | | $ | 71 | | | $ | 41 | | | $ | 29 | | | $ | 117 | |
European Papers sales volumes for uncoated freesheet paper in the third quarter of 20202021, compared with the second quarter of 20202021, were stable in Europe and higher in Russia but continue to be impacted by the unprecedented demand decline due to the COVID-19 pandemic. Economic downtime due to the COVID-19 pandemic demand impact was lowerand flat in the third quarter of 2020 compared to the second quarter of 2020.Europe. Average sales margins for uncoated freesheet paper decreasedwere higher in both regions,Europe reflecting lowerhigher average sales prices and an unfavorable mix in Russia.prices. In Russia, average sales margins were stable. Operating costs were lower in Europe, but higher in Russia. Plannedboth regions. Excluding Kwidzyn, planned maintenance downtime costs were $8 million higherlower in the third quarter of 20202021 compared
to the second quarter of 2020.2021. Input costs were lowerhigher in both regions, primarily for woodenergy in Europe and chemicals.packaging in Russia. Earnings benefited from favorable foreign currency impacts, primarily in Russia, partially offset by unfavorable foreign currency impacts in Europe.Russia.
Sales volumes for uncoated freesheet paper in the third quarter of 2020,2021 compared with the third quarter of 2019,2020 were lowerhigher in both Europe and Russia, reflecting recovery of the negativesignificant decline in demand impact ofdue to the COVID-19 pandemic. Earnings in both regions were negatively impacted by economic downtime in the third quarter of 2020 due todriven by the COVID-19 demand impact.pandemic. Average sales margins for uncoated freesheet paper were lower in both regionsEurope reflecting lower average sales prices and an unfavorable mix. In Russia, average sales margins were higher driven by higher average sales prices. Operating costs were lowerhigher in both Europe and Russia reflecting strong cost management. Plannedregions. Excluding Kwidzyn, planned maintenance downtime costs were $16 million higher in the third quarter of 2020 compared with the third quarter of 2019. In Europe, input costs were lower, primarily for wood, energy and chemicals. In Russia, input costs were flat. Earnings were negatively affected by unfavorable foreign currency impacts in Europe, mostly offset by favorable foreign currency impacts in Russia.
Looking forward to the fourth quarter of 2020, sales volumes for uncoated freesheet paper are expected to improve in both regions. Average sales margins are expected to be stable in both regions. Operating costs are expected to be higher in both Europe and Russia. Planned maintenance downtime costs are expected to be $14 million lower in the fourth quarter of 2020flat compared with the third quarter of 2020. Input costs are expected to bewere higher in both regions, primarily for energy woodin Europe and chemicals.packaging in Russia.
| | Brazilian Papers | Brazilian Papers | 2020 | | 2019 | Brazilian Papers | 2021 | | 2020 |
| In millions | In millions | 3rd Quarter | | 2nd Quarter | | Nine Months | | 3rd Quarter | | 2nd Quarter | | Nine Months | In millions | 3rd Quarter | | 2nd Quarter | | Nine Months | | 3rd Quarter | | 2nd Quarter | | Nine Months |
| Sales (a) | Sales (a) | $ | 150 | | | $ | 108 | | | $ | 434 | | | $ | 247 | | | $ | 240 | | | $ | 702 | | Sales (a) | $ | 200 | | | $ | 189 | | | $ | 557 | | | $ | 150 | | | $ | 108 | | | $ | 434 | |
| Operating Profit (Loss) | Operating Profit (Loss) | $ | 15 | | | $ | (1) | | | $ | 46 | | | $ | 44 | | | $ | 37 | | | $ | 114 | | Operating Profit (Loss) | $ | 45 | | | $ | 43 | | | $ | 131 | | | $ | 15 | | | $ | (1) | | | $ | 46 | |
(a)Includes intra-segment sales of $1$(3) million and $5$1 million for the three months ended September 30, 2021 and 2020, and 2019, respectively; $(1)$8 million and $12$(1) million for the three months ended June 30, 20202021 and 2019,2020, respectively; and $1$8 million and $25 million$1 for the nine months ended September 30, 20202021 and 2019,2020, respectively.
Brazilian Papers sales volumes in the third quarter of 2020,2021, compared with the second quarter of 2020,2021, were higher for both domestic and export shipments of uncoated freesheet paper reflecting some improvement from the unprecedented decline in demand due to the COVID-19 pandemic. Economicpaper. Average sales margins improved driven by higher domestic and export sales prices and a favorable geographic mix. Operating costs were slightly higher. Planned maintenance outage downtime due to the demand impact of the COVID-19 pandemic was lowercosts were $7 million higher in the third quarter of 20202021 compared with the second quarter of 2020. Average sales margins were lower driven by lower export sales prices and an unfavorable geographic mix. Operating costs were stable. Planned maintenance outage downtime costs were $1 million lower in the third quarter of 2020 compared with the second quarter of 2020.2021. Input costs were flat.higher primarily for purchased pulp, chemicals and energy.
Compared with the third quarter of 2019,2020, sales volumes for uncoated freesheet paper in the third quarter of 2020 were lower2021 increased in both exportdomestic and domesticexport markets reflecting recovery from the demand impact of the COVID-19 pandemic. Earnings were negatively impacted by economic downtime due to thenegative demand impact of the COVID-19 pandemic. Average sales margins were lowerhigher reflecting lowerhigher average domestic and export sales prices and an unfavorable geographic mix. Operating costs were lower. Planned maintenance
outage expenses were $1 million lower in the third quarter of 2020 compared with the third quarter of 2019. Input costs were lower, primarily for virgin fiber and pulp.
Entering the fourth quarter of 2020, sales volumes for uncoated freesheet paper are expected to improve for both domestic and export shipments as demand continues to recover from COVID-19 negative demand impacts. Average sales margins are expected to be higher driven by a favorable geographic mix. Operating costs are expected to be stable.were slightly higher. Planned maintenance outage expenses are expected to be lowerwere $5 million higher in the fourththird quarter of 20202021 compared with the third quarter of 2020. Input costs are expected to be higher.
| | | | | | | | | | | | | | | | | | | | | | | | | | | | | | | | | | | |
| Indian Papers | 2020 | | 2019 |
| In millions | 3rd Quarter | | 2nd Quarter | | Nine Months | | 3rd Quarter | | 2nd Quarter | | Nine Months |
| Sales | $ | — | | | $ | — | | | $ | — | | | $ | 38 | | | $ | 53 | | | $ | 144 | |
| Operating Profit (Loss) | $ | — | | | $ | — | | | $ | — | | | $ | 1 | | | $ | 7 | | | $ | 15 | |
On May 29, 2019, International Paper announced it had entered into an agreement to sell its controlling interest in its Indian Papers business. The transaction closed on October 30, 2019.were higher, primarily for purchased pulp, chemicals and energy.
Equity Earnings, Net of Taxes – Ilim
International Paper accounts for its 50% equity interest in Ilim S.A. (Ilim) using the equity method of accounting. Ilim is a separate reportable industry segment whose primary operations are in Russia. The Company recorded equity earnings (loss), net of taxes, of $95 million in the third quarter of 2021, compared with $101 million in the second quarter of 2021 and $(33) million in the third quarter of 2020, compared2020. In the second and third quarters of 2021, the foreign exchange gains and losses included in equity earnings were not material and Ilim Group had no US dollar-denominated debt outstanding at September 30, 2021.
Compared with $63 million in the second quarter of 2020 and $18 million2021, sales volumes in the third quarter of 2019. In2021 were 8% lower overall, primarily for sales of softwood pulp in China, other export markets and Russia, and sales of hardwood pulp in China. Containerboard sales in China and Russia were slightly lower, but increased in other export markets. Average sales margins increased for softwood pulp and containerboard in all markets. Average sales margins for hardwood pulp were relatively flat in China, but increased in Russia and other export markets. Input costs for fuel and chemicals were higher. Following maintenance outages at the Ust-Ilimsk, Bratsk and Koryazhma mills in the third quarter of 2020,2021, repair and maintenance expenses increased. Distribution costs were higher primarily due to the after-tax foreign exchange impact primarily on the remeasurementglobal shortage of U.S. dollar-denominated net debt was a loss of $55 million, compared with a gain of $34 million in the second quarter of 2020.shipping containers and increased tariffs.
Compared with the secondthird quarter of 2020, sales volumes in the third quarter of 2020 were 3% higher2021 decreased overall by 5%, primarily for sales of softwood pulp and hardwood pulp in China, partially offset by lowerhigher sales of hardwood pulp and containerboard in Russia and lower sales of softwood pulp in other export markets. Average sales price realizations decreased for softwood pulp and hardwood pulp in China, Russia and other export markets. Average sales price realizations for containerboard increased in all regions. Input costs were relatively flat. Repair and outage costs were higher due to scheduled maintenance outages at the Koryzhama and Bratsk mills in the third quarter.
Compared with the third quarter of 2019, sales volumes in the third quarter of 2020 increased overall by 20%, primarily from increased sales of softwood pulp in China, Russia and other export markets, partially offset by lower sales of hardwood pulp in China and Russia. Sales of containerboard in China and other export markets improved.were higher, but declined in Russia. Average sales price realizationsmargins for softwood pulp, and hardwood pulp were lowerand containerboard increased in all regions. Average sales price realizations for containerboard were slightly higher in China, but lower in Russia and other export markets. Input costs, primarily for wood, increased.fuel and chemicals were higher. Distribution costs were higher.increased. An after-tax foreign exchange net loss of $4$55 million primarily on the remeasurement of U.S. dollar denominated net debt was recorded in the third quarter of 2019.2020.
Looking forward to the fourth quarter of 2020,2021, sales volumes are expected to be higher.increase. Based on pricing to date in the current quarter, average sales price realizationsmargins are projected to increase primarily for softwood pulp and containerboarddecrease compared with the third quarter of 2020.2021. Repair and maintenance costs will decrease as there are no scheduled mill outages in the fourth quarter. Input costs for wood and fuel are expected to be seasonallymoderately higher. Distribution costs are projected to increase.
Equity Earnings – GPIP
International Paper recordedThere were no Graphic Packaging equity earnings in the third quarter of 2021, compared with $3 million in the second quarter of 2021 and $11 million in the third quarter of 2020, compared with $11 million in the second quarter of 2020 and $10 million in the third quarter of 2019.2020. As of SeptemberJune 30, 2020,2021, the Company'sCompany no longer had an ownership interest in GPIP was 14.8%.GPIP.
Cash provided by operations totaled $2.3$1.9 billion for the first nine months of 2020,2021, compared with $2.7$2.3 billion for the comparable 20192020 nine-month period.
Investments in capital projects, net of insurance recoveries, totaled $348 million in the first nine months of 2021, compared to $657 million in the first nine months of 2020, compared to $913 million in the first nine months of 2019.2020. Full-year 20202021 capital spending is currently expected to be approximately $800$600 million, which represents a reduction of approximately $200 million from our initial plan. This represents 62%or 49% of depreciation and amortization, including approximately $290 million of strategic investments.
Financing activities for the first nine months of 20202021 included a $379 million net increase in debt versus a $1.1 billion net decrease in debt versus a $391 million net decrease in debt during the comparable 20192020 nine-month period.
Amounts related to early debt extinguishment during the three and nine months ended September 30, 20202021 and 20192020 were as follows:
| | | | | Three Months Ended September 30, | Nine Months Ended September 30, | | Three Months Ended
September 30, | | Nine Months Ended
September 30, |
| In millions | In millions | | 2020 | | 2019 | 2020 | | 2019 | In millions | 2021 | | 2020 | | 2021 | | 2020 |
| Early debt reductions (a) | Early debt reductions (a) | | $ | 903 | | | $ | 77 | | $ | 1,190 | | | $ | 245 | | Early debt reductions (a) | $ | 200 | | | $ | 903 | | | $ | 1,097 | | | $ | 1,190 | |
| Pre-tax early debt extinguishment (gain) loss, net | Pre-tax early debt extinguishment (gain) loss, net | | 105 | | | 2 | | 131 | | | (1) | | Pre-tax early debt extinguishment (gain) loss, net | 35 | | | 105 | | | 223 | | | 131 | |
(a)Reductions related to notes with interest rates of 3.55% with original maturities of 2029 and ranging from 3.00% to 7.50% with original maturities from 2021 to 2027 and from 3.00% to 4.40% with original maturities from 2027 to 2047 for the three months ended September 30, 2021 and 2020, respectively, and 2019, respectively,from 3.00% to 5.15% with original maturities from 2027 to 2048 and from 3.00% to 7.50% with original maturities from 2021 to 2048 and from 3.00% to 9.50% with original maturities from 2024 to 2048 for the nine months ended September 30, 20202021 and 2019,2020, respectively.
Maintaining an investment-grade credit rating is an important element of International Paper’s financing strategy. At September 30, 2020,2021, the Company held long-term credit ratings of BBB (stable outlook) and Baa2 (stable outlook) by S&P and Moody’s, respectively. In addition, the Company held short-term credit ratings of A2 and P2 by S&P and Moody's, respectively, for borrowings under the Company's commercial paper program.
At September 30, 2020,2021, International Paper’s credit agreements totaled $2.8$2.1 billion, which is comprised of the $750 million contractually committed revolving credit agreement, the $1.5 billion contractually committed bank credit agreement and up to $550 million under the receivables securitization program. Management believes these credit agreements are adequate to cover expected operating cash flow variability during the current economic cycle. The credit agreements generally provide for interest rates at a floating rate index plus a pre-determined margin dependent upon International Paper’s credit rating. At September 30, 2020,2021, the Company had no borrowings outstanding under the $750 million revolving credit agreement, the $1.5 billion credit agreement or the $550 million receivables securitization program. The Company’s credit agreements are not subject to any restrictive covenants other than the financial covenants as disclosed in Note 17 - Debt of the Condensed Notes to the Consolidated Financial Statements, and the borrowings under the receivables securitization program being limited by eligible receivables. The Company was in compliance with all its debt covenants at September 30, 20202021 and was well below the thresholds stipulated under the covenants as defined in the credit agreements. Further the financial covenants do not restrict any borrowings under the credit agreements. In addition to the $2.8$2.1 billion incapacity under the Company's credit agreements, International Paper has a commercial paper program with a borrowing capacity of $1.0 billion. Under the terms of the program, individual maturities on borrowings may vary, but not exceed one year from the date of issue. Interest bearing notes may be issued either as fixed or floating rate notes. As of September 30, 2020,2021, the Company had $140 million ofno borrowings outstanding under the program atprogram.
On October 28, 2021, the Company launched a weighted averagedebt tender to purchase up to $500 million of the Company's outstanding debt with interest rate of 0.17%.rates ranging from 4.35% to 6.00% and maturity dates ranging from 2035 to 2048.
International Paper expects to be able to meet projected capital expenditures, service existing debt, and meet working capital and dividend requirements and make common stock and/or debt repurchases for the next 12 months with current cash balances and
cash from operations, supplemented as required by its existing credit facilities. The Company will continue to rely on debt and capital markets for the majority of any necessary long-term funding not provided by operating cash flows. Funding decisions will be guided by our capital structure planning objectives. The primary goals of the Company’s capital structure planning are to maximize financial flexibility and maintain appropriate levels of liquidity to meet our needs while managing balance sheet debt and interest expense.expense, and we have purchased, and may continue to repurchase, our common stock (under our existing share repurchase program) and debt to the extent consistent with this capital structure planning. The majority of International Paper’s debt is accessed through global public capital markets where we have a wide base of investors. The COVID-19 pandemic has negatively impacted the global economy and created significant volatility and disruption of capital and financial markets. As a result of the current economic environment,During 2020, management has takentook various actions to further strengthen the Company’s liquidity position. In additionposition in response to the Company entering into a $750 million revolving credit agreement andCOVID-19 pandemic. This included the Company amending the receivable securitization program from uncommitted to committed financing, the Company is also on track to reduce capital expenditures by approximately $200 million from the initial 2020 plan, has indefinitely suspended the Company’s share repurchase program beginning April 2020, and has been deferring the payment of our payroll taxes as allowed under CARES Act. The CARES Act allows for the deferral of the payment of the employer portion of Social Security taxes accrued between March 27, 2020, and December 31, 2020. Under the CARES Act 50% of the deferred
payroll taxes will be paid by December 31, 2021 and the remainder will be paid by December 31, 2022. We believe that theseour credit agreements, commercial paper program, and the actions taken in response to COVID-19 provide us with sufficient liquidity to operate in this uncertainthe current environment; however, an extended period of economic disruption could impact our access to additional sources of liquidity.
During the first nine months of 2021, International Paper used 1.8 million shares of treasury stock for various incentive plans. International Paper also acquired 7.7 million shares of treasury stock, including restricted stock tax withholdings. Repurchases of common stock and payments of restricted stock withholding taxes totaled $425 million, including $398 million related to shares repurchased under the Company's repurchase program. In addition, on October 12, 2021, the Company announced that its board of directors authorized the repurchase of $2 billion additional shares of common stock under the Company's repurchase program (in addition to the existing amount available for purchase, which was $1.3 billion as of September 30, 2021).
During the first nine months of 2020, International Paper used approximately 2.0 million shares of treasury stock for various incentive plans. International Paper also acquired 1.0 million shares of treasury stock, including restricted stock tax withholdings.withholding. Repurchases of common stock and payments of restricted stock withholding taxes totaled $42 million, including $14 million related to shares repurchased under the Company's repurchase program. The Company indefinitely suspended its repurchase program in April 2020.
During the first nine months of 2019, International Paper used approximately 3.4 million shares of treasury stock for various incentive plans. International Paper also acquired 11.9 million shares of treasury stock, including restricted stock tax withholding. Repurchases of common stock and payments of restricted stock withholding taxes totaled $535 million, including $486 million related to shares repurchased under the Company's repurchase program.
Cash dividend payments related to common stock totaled $605$602 million and $595$605 million for the first nine months of 20202021 and 2019,2020, respectively. Dividends were $1.5375 per share and $1.5000$1.5375 per share for the first nine months in 2021 and 2020, and 2019, respectively. The Company announced on October 12, 2021, a decrease in the Company's quarterly dividend from $0.5125 per share to $0.4625 per share for the fourth quarter of 2021, which takes into account the fact that the spin-off completed on October 1, 2021, will result in a decrease in the amount of cash generated by the Company based on the historical performance of the Printing Papers business included in the spin-off.
Our pension plan is currently sufficiently funded and we do not anticipate any required contributions for the next 12 months.
Variable Interest Entities
Information concerning variable interest entities is set forth in Note 15 in the Company's Annual Report on Form 10-K for the year ended December 31, 2019.2020. In connection with the 2006 International Paper installment sale of forestlands, we received $4.8 billion of installment notes. These installment notes were used by variable interest entities as collateral for borrowings from third-party lenders. These variable interest entities were restructured in 2015 when the installment notes and third-party loans were extended. The restructured variable interest entities holdheld installment notes of $4.85$4.8 billion that mature in August 2021 and third-party loans of $4.22$4.2 billion that matureboth matured in November and December of 2020. These third-party loans are shown in Current nonrecourse financial liabilities of variable interest entities on the accompanying consolidated balance sheet.August 2021. We are currently negotiating the extension ofsettled the third-party loans to August 2021 and expect to completeat their maturity with the extension beforeproceeds from the maturity dates.
Failure to extend these third-party loans to August 2021 prior to their respective maturity datesinstallment notes. This resulted in November and Decembercash proceeds of 2020 could necessitate a dispositionapproximately $630 million representing our equity in the variable interest entities. Maturity of the installment notes to facilitate the $4.22 billion debt payment. We are confident we would be able to disposeand termination of the installment notes, if necessary.monetization structure also resulted in a $72 million tax liability that is expected to be paid in the fourth quarter of 2021. As of September 30, 2021, the Company's remaining deferred tax liability associated with the 2015 Financing Entities was $815 million. The nature and timing of the income tax due related to these transactions is currently under review by the Internal Revenue Service.
Ilim S.A. Shareholders’ Agreement
In October 2007, in connection with the formation of the Ilim S.A. joint venture (Ilim), International Paper entered into a shareholders' agreement that includes provisions relating to the reconciliation of disputes among the partners. This agreement provides that at any time, either the Company or its partners may commence procedures specified under the deadlock agreement. If these or any other deadlock procedures under the shareholders' agreement are commenced, although it is not obligated to do so, the Company may in certain situations choose to purchase its partners' 50% interest in Ilim. Any such transaction would be subject to review and approval by Russian and other relevant anti-trust authorities. Based on the provisions of the agreement, the Company estimates that the current purchase price for its partners' 50% interest would be
approximately $900 million,$2.1 billion, which could be satisfied by payment of cash or International Paper common stock, or some combination of the two, at the Company's option. The purchase by the Company of its partners’ 50% interest in Ilim would result in the consolidation of Ilim's financial position and results of operations in all subsequent periods. The parties have informed each other that they have no current intention to commence procedures specified under the deadlock provisions of the shareholders' agreement.
CRITICAL ACCOUNTING POLICIES AND SIGNIFICANT ACCOUNTING ESTIMATES
The preparation of financial statements in conformity with accounting principles generally accepted in the United States requires International Paper to establish accounting policies and to make estimates that affect both the amounts and timing of the recording of assets, liabilities, revenues and expenses. Some of these estimates require judgments about matters that are inherently uncertain.
Accounting policies whose application may have a significant effect on the reported results of operations and financial position of International Paper, and that can require judgments by management that affect their application, include accounting for contingencies, impairment or disposal of long-lived assets, goodwill and other intangible assets, pensions and income taxes.
The Company has included in its 20192020 Form 10-K a discussion of these critical accounting policies, which are important to the portrayal of the Company’s financial condition and results of operations and require management’s judgments. The Company has not made any changes in these critical accounting policies during the first nine months of 2020.2021.
While we have taken into account certain impacts arising from COVID-19 in connection with the accounting estimates reflected in this Quarterly Report on Form 10-Q, the full impact of COVID-19 is unknown and cannot be reasonably estimated. However, we have made appropriate accounting estimates based on the facts and circumstances available as of the reporting date. To the extent there are differences between these estimates and actual results, our consolidated financial statements may be affected.
FORWARD-LOOKING STATEMENTS
Certain statements in this Quarterly Report on Form 10-Q that are not historical in nature may be considered “forward-looking” statements“forward-looking statements” within the meaning of the Private Securities Litigation Reform Act of 1995. These statements are often identified by the words “will,” “may,” “should,” “continue,” “anticipate,” “believe,” “expect,” “plan,” “appear,” “project,” “estimate,” “intend”Words such as “expects”, “anticipates”, “believes”, “estimates” and words of a similar nature.expressions identify forward-looking statements. These statements are not guarantees of future performance and reflect management’s current views with respect to future events, whichand are subject to risks and uncertainties that could cause actual results to differ materially from those expressed or implied in these statements. Factors which could cause actual results to differ include but are not limited to: (i) developments related to the COVID-19 pandemic, including the severity, magnitude and durationspread of new variants of the pandemic, negative global economic conditions arising fromvirus, the pandemic,effectiveness, acceptance and availability of vaccines and booster shots, and associated levels of vaccination as well as the development, availability and effectivenesspossibility that strains of treatments andthe virus may be resistant to currently available vaccines, impacts of governments’government responses to the pandemic on our operations, including vaccine mandates, impacts of the pandemic on global and domestic economic conditions, including with respect to commercial activity, our customers and business partners, and consumer preferences and demand, supply chain shortages and disruptions, inflationary pressures and disruptions in the capitalcredit or financial markets; (ii) the level of our indebtedness and changes in interest rates; (iii) industry conditions, including but not limited to changes in the cost or availability of raw materials, energy sources and transportation costs,sources, the availability of labor and competitive labor market conditions, competition International Paper faces,we face, cyclicality and changes in consumer preferences, demand and pricing for International Paperour products (including any such changes resulting from the COVID-19 pandemic); (iv) domestic and global economic conditions and political changes, changes in currency exchange rates, trade protectionist policies, downgrades in International Paper’sour credit ratings, and/or the credit ratings of banks issuing certain letters of credit, issued by recognized credit rating organizations;organizations, (v) the amount of International Paper’sour future pension funding obligations, and pension and health care costs; (vi) unanticipated expenditures or other adverse developments related to the cost of compliance with existing and new environmental, tax, labor and employment, privacy, and other U.S. and non-U.S. governmental laws and regulations (including new legal requirements arising from the COVID-19 pandemic); (vii) any material disruption at any of International Paper’sour manufacturing facilities or other adverse impact on our operations due to severe weather, natural disasters, climate change or other causes (including as the result of the COVID-19 pandemic);causes; (viii) risks inherent in conducting business through joint ventures; (ix) International Paper’sour ability to achieve the benefits expected from, and other risks associated with, acquisitions, joint ventures, divestitures and other corporate transactions, (x) information technology risks, andrisks; (xi) loss contingencies and pending, threatened or future litigation, including with respect to environmental related matters.matters; (xii) our ability to realize the anticipated benefits of the spin-off transaction; and (xiii) the impact of the spin-off transaction on the Company and the relationship between the two companies going forward, including the ongoing commercial agreements and arrangements between us and Sylvamo. These and other factors that could cause or contribute to actual results differing materially from such forward-looking statements can be found in International Paper’sour press releases and U.S. Securities and Exchange Commission filings. In addition, other risks and uncertainties not presently known to International Paperthe Company or that itwe currently believesbelieve to be immaterial could affect the accuracy of any forward-looking statements. International PaperThe Company undertakes no obligation to publicly update any forward-looking statements, whether as a result of new information, future events or otherwise.
Information relating to quantitative and qualitative disclosures about market risk is shown on page 3638 of International Paper’s 20192020 Form 10-K, which information is incorporated herein by reference. There have been no material changes in the Company’s exposure to market risk since December 31, 2019.2020.
Evaluation of Disclosure Controls and Procedures:
Disclosure controls and procedures are controls and other procedures that are designed to ensure that information required to be disclosed in our reports filed or submitted under the Securities Exchange Act of 1934, as amended (Exchange Act), is recorded, processed, summarized and reported (and accumulated and communicated to management, including our Chief Executive Officer and Chief Financial Officer, to allow timely decisions regarding required disclosure) within the time periods specified in the Securities and Exchange Commission’s rules and forms. As of the end of the period covered by this report, we conducted an evaluation, under the supervision and with the participation of our management, including the Chief Executive Officer and Chief Financial Officer, of the effectiveness of our disclosure controls and procedures pursuant to Rules 13a-15 and 15d-15 of
the Exchange Act. Based upon that evaluation, our Chief Executive Officer and Chief Financial Officer concluded that the Company’s disclosure controls and procedures were effective as of September 30, 20202021 (the end of the period covered by this report).
Changes in Internal Control over Financial Reporting:
There have been no changes in our internal control over financial reporting during the quarter ended September 30, 20202021 that have materially affected, or are reasonably likely to materially affect, our internal control over financial reporting.
A discussion of material developments in the Company’s litigation matters occurring in the period covered by this report is found in Note 15 of the Condensed Notes to the Consolidated Financial Statements in this Form 10-Q, which is incorporated by reference. The Company is not subject to any administrative or judicial proceeding arising under any Federal, State or local provisions that have been enacted or adopted regulating the discharge of materials into the environment or primarily for the purpose of protecting the environment that is likely to result in monetary sanctions of $1 million or more.
There have been no material changes from the risk factors disclosed in our Annual Report on Form 10-K for the fiscal year ended December 31, 20192020 (Part I, Item 1A) other than as discussed below.
The current COVID-19 pandemic has had an adverse effect on portions of our business, and may have material adverse effects on our business, financial condition, results of operations and cash flows, particularly if negative economic conditions associated with COVID-19 persist or deteriorate.
The COVID-19 pandemic has resulted in authorities throughout the world implementing widespread measures attempting to contain the spread and impact of COVID-19, such as travel bans and restrictions, quarantines, stay-at-home orders, the promotion of social distancing and limitations on business activity, including business closures. These measures and the pandemic have caused a significant global economic downturn, disrupting supply chains, significantly increasing unemployment and underemployment levels, and adversely impacting consumer confidence and spending. The continued spread of COVID-19 has also led to significant disruption and volatility in the global capital and financial markets.
Although governments of countries in which we operate have generally considered forest products and the supply chain on which we depend to be “essential industries” that should remain operational during this pandemic, any significant disruption in operations at one or more of our mills, plants or other facilities as a result of the COVID-19 pandemic, including precautionary measures we take or taken by governmental authorities that limits in-person workplace contact at any of our facilities to reduce the potential for employee exposure to COVID-19, could have an adverse effect on our business or operations. If a significant portion of our workforce is unable to work effectively due to measures taken in response to the COVID-19 pandemic such as those described herein, our operations will likely be negatively impacted.
COVID-19 has had a significant negative impact on demand for our printing papers products. In addition, demand for our pulp, containerboard and corrugated box products could be unfavorably impacted if the negative economic conditions associated with COVID-19 persist or deteriorate.
In addition to the reduction in demand for our products that the COVID-19 pandemic has had or could have, other negative impacts on our business, include, but are not limited to, the following:
•We rely on a global workforce, and we take measures to protect the health and safety of our employees, customers and others with whom we do business, while continuing to effectively manage our employees and maintain business operations. During the pandemic, we have taken additional measures and incurred additional expenses to protect the health and safety of our employees to comply with applicable government requirements and safety guidance. Our business operations may be additionally disrupted if a significant portion of our workforce is unable to work safely and effectively due to illness, quarantines, government actions, or other restrictions or measures responsive to the pandemic. Measures taken across our business operations to address health and safety may not be sufficient to prevent the spread of COVID-19 among our employee base, customers and others.
•A significant number of our employees as well as customers and others with whom we do business, continue to work remotely in response to the COVID-19 pandemic. Our business operations may be disrupted, and we may experience increased risk of adverse effects to our business, if a significant portion of our workforce or certain business operations are negatively impacted as a result of remote work arrangements, including due to cyber risks or other disruption to our technology infrastructure.
•Cost management and various cost-containment actions implemented across our business in response to the COVID-19 pandemic could hinder execution of our business strategy, including deferral of planned capital expenditures, and could adversely affect our business and results of operations.
While we are closely monitoring the impact of the pandemic on all aspects of our business, the extent of the impact on our results of operations, cash flow, liquidity, and financial performance, as well as our ability to execute near-term and long-term business strategies and initiatives, will depend on numerous evolving factors and future developments, which are highly uncertain and which we cannot predict or control, and some of which we are not currently aware, including, but not limited to: (a) the duration, severity and scope of the pandemic, including additional waves, increases and spikes in the number of COVID-19 cases in certain areas; (b) rapidly-changing governmental and public health directives to contain and combat the outbreak, including the duration, degree and effectiveness of directives, as well as the easing, removal and potential reinstitution of directives; (c) the development, availability and effectiveness of treatments and vaccines for COVID-19; (d) the extent and duration of the pandemic’s adverse effect on economic and social activity, consumer confidence, discretionary spending and preferences, labor and healthcare costs, and unemployment rates, any of which may reduce demand for our products; (e) any temporary reduction in our workforce, closures of our offices and facilities and our ability to adequately staff and maintain our operations; and (f) the ability of our customers and suppliers to continue their operations, which could result in terminations of contracts, losses of revenue, adverse effects to our supply chain. If the pandemic continues to create disruptions or turmoil in the credit or financial markets, or impacts our credit ratings, it could adversely affect our ability to access capital on favorable terms and continue to meet our liquidity needs.
Given the inherent uncertainty surrounding COVID-19, we expect the pandemic will continue to have an adverse impact on portions of our business in the near term. If these conditions persist for a prolonged period, the COVID-19 pandemic, including any of the above factors and others that are currently unknown, may have a material adverse effect on our business, results of operations, cash flow, liquidity, or financial condition..
PURCHASES OF EQUITY SECURITIES BY THE ISSUER AND AFFILIATED PURCHASERS.
| | | | | | | | | | | | | | |
| Period | Total Number of Shares Purchased (a) | Average Price Paid per Share | Total Number of Shares Purchased as Part of a Publicly Announced Plan or Program | Maximum Number (or Approximate Dollar Value) of Shares that May Yet Be Purchased Under the Plans or Programs (in billions) |
| July 1, 2020 - July 31, 2020 | 3,415 | | $35.15 | — | | $1.73 |
| August 1, 2020 - August 31, 2020 | 1,663 | | 34.79 | | — | | 1.73 | |
| September 1, 2020 - September 30, 2020 | 549 | | 40.28 | | — | | 1.73 | |
| Total | 5,627 | | | | |
| | | | | | | | | | | | | | |
| Period | Total Number of Shares Purchased (a) | Average Price Paid per Share | Total Number of Shares Purchased as Part of a Publicly Announced Plan or Program | Maximum Number (or Approximate Dollar Value) of Shares that May Yet Be Purchased Under the Plans or Programs (in billions) |
| July 1, 2021 - July 31, 2021 | 1,102,595 | | $59.94 | 1,101,415 | | $1.48 |
| August 1, 2021 - August 31, 2021 | 1,979,380 | | 58.65 | | 1,978,334 | | 1.37 | |
| September 1, 2021 - September 30, 2021 | 500,841 | | 59.24 | | 500,841 | | 1.34 | |
| Total | 3,582,816 | | | | |
(a) 5,6272,226 shares were acquired from employees or board members as a result of share withholdings to pay income taxes under the Company's restricted stock program. AThe remainder were purchased under a share repurchase programprogram. Under current Board authorization that was approvedincreased on September 10, 2013, and increased twice on July 8, 2014, and October 9, 2018. Through this program, which does not have an expiration date,12, 2021, we wereare authorized to purchase, in open market transactions (including block trades), privately negotiated transactions or otherwise, up to $5$3.3 billion of shares of our common stock. This repurchase program does not have an expiration date. As of September 30, 2020,2021, approximately $1.73$1.3 billion aggregate amount of shares of our common stock remained authorized for purchase under this program. The Company indefinitely suspended its repurchase program in April 2020.before the increase.
| | | | | | | | |
| 10.1 | | |
| | |
| 31.1 | | |
| |
| 31.2 | | |
| |
| 32 | | |
| |
| 101.INS | | XBRL Instance Document - the instance document does not appear in the Interactive Data File because its XBRL tags are embedded within the inline XBRL document. |
| |
| 101.SCH | | XBRL Taxonomy Extension Schema. |
| |
| 101.CAL | | XBRL Taxonomy Extension Calculation Linkbase. |
| |
| 101.DEF | | XBRL Taxonomy Extension Definition Linkbase. |
| |
| 101.LAB | | XBRL Taxonomy Extension Label Linkbase. |
| |
| 101.PRE | | XBRL Extension Presentation Linkbase. |
| | |
| 104 | | Cover Page Interactive Data File (formatted as Inline XBRL, and contained in Exhibit 101). |
* Schedules and exhibits have been omitted pursuant to Item 601(a)(5) of Regulation S-K. The registrant agrees to furnish supplementally a copy of any omitted schedule or exhibit to the U.S. Securities and Exchange Commission upon request.
Pursuant to the requirements of the Securities Exchange Act of 1934, the registrant has duly caused this report to be signed on its behalf by the undersigned thereunto duly authorized.
| | | | | | | | |
| INTERNATIONAL PAPER COMPANY
(Registrant) |
| | |
October 30, 202028, 2021 | By | /s/ Tim S. Nicholls |
| | Tim S. Nicholls |
| | Senior Vice President and Chief
Financial Officer |
| | |
October 30, 202028, 2021 | By | /s/ Vincent P. Bonnot |
| | Vincent P. Bonnot |
| | Vice President – Finance and Controller |