UNITED STATES
SECURITIES AND EXCHANGE COMMISSION
WASHINGTON, D.C. 20549
FORM 10-Q
☒ QUARTERLY REPORT PURSUANT TO SECTION 13 OR 15(d) OF THE SECURITIES EXCHANGE ACT OF 1934
For the Quarterly Period Ended June 30, 2022March 31, 2023
☐ TRANSITION REPORT PURSUANT TO SECTION 13 OR 15(d) OF THE SECURITIES EXCHANGE ACT OF 1934
For the Transition Period From to
_________________________________________
Commission File Number 001-03157
INTERNATIONAL PAPER COMPANY
(Exact name of registrant as specified in its charter)
| | | | | |
| New York | 13-0872805 |
(State or other jurisdiction of incorporation) | (I.R.S. Employer Identification No.) |
| |
| 6400 Poplar Avenue, Memphis, Tennessee | 38197 |
| (Address of Principal Executive Offices) | (Zip Code) |
Registrant’s telephone number, including area code: (901) 419-7000
Securities registered pursuant to Section 12(b) of the Act: | | | | | | | | |
| Title of each class | Trading Symbol(s) | Name of each exchange on which registered |
| Common Shares | IP | New York Stock Exchange |
Indicate by check mark whether the registrant (1) has filed all reports required to be filed by Section 13 or 15(d) of the Securities Exchange Act of 1934 during the preceding 12 months (or for such shorter period that the registrant was required to file such reports), and (2) has been subject to such filing requirements for the past 90 days. Yes ☒ No ¨
Indicate by check mark whether the registrant has submitted electronically every Interactive Data File required to be submitted pursuant to Rule 405 of Regulation S-T (paragraph 232.405 of this chapter) during the preceding 12 months (or for such shorter period that the registrant was required to submit such files). Yes ☒ No ¨
Indicate by check mark whether the registrant is a large accelerated filer, an accelerated filer, a non-accelerated filer, a smaller reporting company or an emerging growth company. See the definitions of “large accelerated filer,” “accelerated filer,” “smaller reporting company,” and "emerging growth company" in Rule 12b-2 of the Exchange Act. | | | | | | | | | | | |
| Large accelerated filer | ☒ | Accelerated filer | ☐ |
| Non-accelerated filer | ☐ | Smaller reporting company | ☐ |
| | Emerging growth company | ☐ |
If an emerging growth company, indicate by check mark if the registrant has elected not to use the extended transition period for complying with any new or revised financial accounting standards provided pursuant to Section 13 (a) of the Exchange
Act. ¨
Indicate by check mark whether the registrant is a shell company (as defined in Rule 12b-2 of the Exchange Act). Yes ☐ No ☒
The number of shares outstanding of the registrant’s common stock, par value $1.00 per share, as of July 22, 2022April 21, 2023 was 362,016,847.347,056,943.
INDEX
| | | | | | | | |
| | | PAGE NO. |
| | |
| | |
| | |
| | |
| Condensed Consolidated Statement of Operations - Three Months Ended March 31, 2023 and Six Months Ended June 30, 2022 and 2021 | |
| | |
| Condensed Consolidated Statement of Comprehensive Income - Three Months Ended March 31, 2023 and Six Months Ended June 30, 2022 and 2021 | |
| | |
| Condensed Consolidated Balance Sheet - June 30, 2022March 31, 2023 and December 31, 20212022 | |
| | |
| Condensed Consolidated Statement of Cash Flows - SixThree Months Ended June 30,March 31, 2023 and 2022 and 2021 | |
| | |
| | |
| | |
| | |
| | |
| | |
| | |
| | |
| | |
| | |
| | |
| | |
| | |
| | |
| | |
| | |
| | |
| | |
| | |
| | |
| | |
| | |
| | |
| | |
| |
| |
INTERNATIONAL PAPER COMPANY
Condensed Consolidated Statement of Operations
(Unaudited)
(In millions, except per share amounts)
| | | | Three Months Ended
June 30, | Six Months Ended
June 30, | | Three Months Ended
March 31, |
| | | 2022 | | 2021 | 2022 | | 2021 | | 2023 | | 2022 |
| Net Sales | Net Sales | $ | 5,389 | | | $ | 4,770 | | $ | 10,626 | | | $ | 9,363 | | Net Sales | $ | 5,020 | | | $ | 5,237 | |
| Costs and Expenses | Costs and Expenses | | Costs and Expenses | |
| Cost of products sold | Cost of products sold | 3,806 | | | 3,402 | | 7,645 | | | 6,750 | | Cost of products sold | 3,642 | | | 3,839 | |
| Selling and administrative expenses | Selling and administrative expenses | 300 | | | 396 | | 641 | | | 698 | | Selling and administrative expenses | 381 | | | 341 | |
| Depreciation, amortization and cost of timber harvested | Depreciation, amortization and cost of timber harvested | 267 | | | 272 | | 528 | | | 540 | | Depreciation, amortization and cost of timber harvested | 241 | | | 261 | |
| Distribution expenses | Distribution expenses | 442 | | | 342 | | 866 | | | 677 | | Distribution expenses | 422 | | | 424 | |
| Taxes other than payroll and income taxes | Taxes other than payroll and income taxes | 36 | | | 36 | | 72 | | | 71 | | Taxes other than payroll and income taxes | 36 | | | 36 | |
| Restructuring and other charges, net | — | | | 174 | | — | | | 204 | | |
| Net (gains) losses on sales and impairments of businesses | — | | | (9) | | — | | | (7) | | |
| Net (gains) losses on sales of equity method investments | — | | | (130) | | — | | | (204) | | |
| Net (gains) losses on mark to market investments | Net (gains) losses on mark to market investments | (3) | | | — | | (49) | | | — | | Net (gains) losses on mark to market investments | — | | | (46) | |
| Interest expense, net | Interest expense, net | 74 | | | 86 | | 143 | | | 179 | | Interest expense, net | 62 | | | 69 | |
| Non-operating pension expense (income) | Non-operating pension expense (income) | (47) | | | (51) | | (96) | | | (103) | | Non-operating pension expense (income) | 15 | | | (49) | |
| Earnings (Loss) From Continuing Operations Before Income Taxes and Equity Earnings | Earnings (Loss) From Continuing Operations Before Income Taxes and Equity Earnings | 514 | | | 252 | | 876 | | | 558 | | Earnings (Loss) From Continuing Operations Before Income Taxes and Equity Earnings | 221 | | | 362 | |
| Income tax provision (benefit) | Income tax provision (benefit) | 96 | | | 46 | | 191 | | | 134 | | Income tax provision (benefit) | 48 | | | 95 | |
| Equity earnings (loss), net of taxes | Equity earnings (loss), net of taxes | 93 | | | 104 | | 186 | | | 153 | | Equity earnings (loss), net of taxes | (1) | | | — | |
| Earnings (Loss) From Continuing Operations | Earnings (Loss) From Continuing Operations | $ | 511 | | | $ | 310 | | $ | 871 | | | $ | 577 | | Earnings (Loss) From Continuing Operations | $ | 172 | | | $ | 267 | |
| Discontinued operations, net of taxes | Discontinued operations, net of taxes | — | | | 124 | | — | | | 206 | | Discontinued operations, net of taxes | — | | | 93 | |
| Net Earnings (Loss) | Net Earnings (Loss) | $ | 511 | | | $ | 434 | | $ | 871 | | | $ | 783 | | Net Earnings (Loss) | $ | 172 | | | $ | 360 | |
| Less: Net earnings (loss) attributable to noncontrolling interests | — | | | 2 | | — | | | 2 | | |
| Net Earnings (Loss) Attributable to International Paper Company | $ | 511 | | | $ | 432 | | $ | 871 | | | $ | 781 | | |
| Basic Earnings (Loss) Per Share Attributable to International Paper Company Common Shareholders | | |
| Basic Earnings (Loss) Per Share | | Basic Earnings (Loss) Per Share | |
| Earnings (loss) from continuing operations | Earnings (loss) from continuing operations | $ | 1.39 | | | $ | 0.79 | | $ | 2.34 | | | $ | 1.47 | | Earnings (loss) from continuing operations | $ | 0.49 | | | $ | 0.71 | |
| Discontinued operations, net of taxes | Discontinued operations, net of taxes | — | | | 0.31 | | — | | | 0.52 | | Discontinued operations, net of taxes | — | | | 0.25 | |
| Net earnings (loss) | Net earnings (loss) | $ | 1.39 | | | $ | 1.10 | | $ | 2.34 | | | $ | 1.99 | | Net earnings (loss) | $ | 0.49 | | | $ | 0.96 | |
| Diluted Earnings (Loss) Per Share Attributable to International Paper Company Common Shareholders | | |
| Diluted Earnings (Loss) Per Share | | Diluted Earnings (Loss) Per Share | |
| Earnings (loss) from continuing operations | Earnings (loss) from continuing operations | $ | 1.38 | | | $ | 0.78 | | $ | 2.32 | | | $ | 1.45 | | Earnings (loss) from continuing operations | $ | 0.49 | | | $ | 0.70 | |
| Discontinued operations, net of taxes | Discontinued operations, net of taxes | — | | | 0.31 | | — | | | 0.51 | | Discontinued operations, net of taxes | — | | | 0.25 | |
| Net earnings (loss) | Net earnings (loss) | $ | 1.38 | | | $ | 1.09 | | $ | 2.32 | | | $ | 1.96 | | Net earnings (loss) | $ | 0.49 | | | $ | 0.95 | |
| Average Shares of Common Stock Outstanding – assuming dilution | Average Shares of Common Stock Outstanding – assuming dilution | 370.7 | | | 396.8 | | 375.7 | | | 397.7 | | Average Shares of Common Stock Outstanding – assuming dilution | 353.3 | | | 379.2 | |
The accompanying notes are an integral part of these condensed financial statements.
INTERNATIONAL PAPER COMPANY
(Unaudited)
(In millions)
| | | | | | | | | | | | | | | | | | | | |
| | Three Months Ended
June 30, | Six Months Ended
June 30, |
| | 2022 | | 2021 | 2022 | | 2021 |
| Net Earnings (Loss) | $ | 511 | | | $ | 434 | | $ | 871 | | | $ | 783 | |
| Other Comprehensive Income (Loss), Net of Tax: | | | | | | |
| Amortization of pension and post-retirement prior service costs and net loss: | | | | | | |
| U.S. plans | 23 | | | 36 | | 43 | | | 70 | |
| Pension and postretirement adjustments: | | | | | | |
| Non-U.S. plans | — | | | 1 | | — | | | 1 | |
| Change in cumulative foreign currency translation adjustment | 182 | | | 312 | | 134 | | | 169 | |
| Net gains/losses on cash flow hedging derivatives: | | | | | | |
| Net gains (losses) arising during the period | — | | | 13 | | — | | | 7 | |
| Reclassification adjustment for (gains) losses included in net earnings (loss) | — | | | (4) | | — | | | (1) | |
| Total Other Comprehensive Income (Loss), Net of Tax | 205 | | | 358 | | 177 | | | 246 | |
| Comprehensive Income (Loss) | 716 | | | 792 | | 1,048 | | | 1,029 | |
| Net (earnings) loss attributable to noncontrolling interests | — | | | (2) | | — | | | (2) | |
| Other comprehensive (income) loss attributable to noncontrolling interests | — | | | 1 | | — | | | 2 | |
| Comprehensive Income (Loss) Attributable to International Paper Company | $ | 716 | | | $ | 791 | | $ | 1,048 | | | $ | 1,029 | |
| | | | | | | | | | | |
| | Three Months Ended
March 31, |
| | 2023 | | 2022 |
| Net Earnings (Loss) | $ | 172 | | | $ | 360 | |
| Other Comprehensive Income (Loss), Net of Tax: | | | |
| Amortization of pension and post-retirement prior service costs and net loss: | | | |
| U.S. plans | 23 | | | 20 | |
| Change in cumulative foreign currency translation adjustment | (9) | | | (48) | |
| Total Other Comprehensive Income (Loss), Net of Tax | 14 | | | (28) | |
| Comprehensive Income (Loss) | 186 | | | 332 | |
The accompanying notes are an integral part of these condensed financial statements.
INTERNATIONAL PAPER COMPANY
(In millions) | | | June 30,
2022 | | December 31,
2021 | | March 31,
2023 | | December 31,
2022 |
| | | (unaudited) | | | | (unaudited) | | |
| Assets | Assets | | Assets | |
| Current Assets | Current Assets | | Current Assets | |
| Cash and temporary investments | Cash and temporary investments | $ | 826 | | | $ | 1,295 | | Cash and temporary investments | $ | 636 | | | $ | 804 | |
| Restricted cash | | Restricted cash | 72 | | | — | |
| Accounts and notes receivable, net | Accounts and notes receivable, net | 3,462 | | | 3,232 | | Accounts and notes receivable, net | 3,196 | | | 3,284 | |
| Contract assets | Contract assets | 506 | | | 378 | | Contract assets | 533 | | | 481 | |
| Inventories | Inventories | 1,897 | | | 1,814 | | Inventories | 1,939 | | | 1,942 | |
| Current investments | 151 | | | 245 | | |
| Assets held for sale | | Assets held for sale | 90 | | | 133 | |
| Other current assets | Other current assets | 204 | | | 132 | | Other current assets | 149 | | | 126 | |
| Total Current Assets | Total Current Assets | 7,046 | | | 7,096 | | Total Current Assets | 6,615 | | | 6,770 | |
| Plants, Properties and Equipment, net | Plants, Properties and Equipment, net | 10,234 | | | 10,441 | | Plants, Properties and Equipment, net | 10,453 | | | 10,431 | |
| Long-Term Investments | 930 | | | 751 | | |
| Long-Term Financial Assets of Variable Interest Entities (Note 16) | 2,284 | | | 2,275 | | |
| Investments | | Investments | 187 | | | 186 | |
| Long-Term Financial Assets of Variable Interest Entities (Note 14) | | Long-Term Financial Assets of Variable Interest Entities (Note 14) | 2,298 | | | 2,294 | |
| Goodwill | Goodwill | 3,124 | | | 3,130 | | Goodwill | 3,042 | | | 3,041 | |
| Overfunded Pension Plan Assets | Overfunded Pension Plan Assets | 713 | | | 595 | | Overfunded Pension Plan Assets | 305 | | | 297 | |
| Right of Use Assets | Right of Use Assets | 383 | | | 365 | | Right of Use Assets | 422 | | | 424 | |
| Deferred Charges and Other Assets | Deferred Charges and Other Assets | 568 | | | 590 | | Deferred Charges and Other Assets | 449 | | | 497 | |
| Total Assets | Total Assets | $ | 25,282 | | | $ | 25,243 | | Total Assets | $ | 23,771 | | | $ | 23,940 | |
| Liabilities and Equity | Liabilities and Equity | | Liabilities and Equity | |
| Current Liabilities | Current Liabilities | | Current Liabilities | |
| Notes payable and current maturities of long-term debt | Notes payable and current maturities of long-term debt | $ | 293 | | | $ | 196 | | Notes payable and current maturities of long-term debt | $ | 367 | | | $ | 763 | |
| Accounts payable | Accounts payable | 2,678 | | | 2,606 | | Accounts payable | 2,541 | | | 2,708 | |
| Accrued payroll and benefits | Accrued payroll and benefits | 380 | | | 440 | | Accrued payroll and benefits | 350 | | | 355 | |
| Other current liabilities | Other current liabilities | 1,001 | | | 902 | | Other current liabilities | 1,008 | | | 1,174 | |
| Total Current Liabilities | Total Current Liabilities | 4,352 | | | 4,144 | | Total Current Liabilities | 4,266 | | | 5,000 | |
| Long-Term Debt | Long-Term Debt | 5,275 | | | 5,383 | | Long-Term Debt | 5,471 | | | 4,816 | |
| Long-Term Nonrecourse Financial Liabilities of Variable Interest Entities (Note 16) | 2,103 | | | 2,099 | | |
| Long-Term Nonrecourse Financial Liabilities of Variable Interest Entities (Note 14) | | Long-Term Nonrecourse Financial Liabilities of Variable Interest Entities (Note 14) | 2,108 | | | 2,106 | |
| Deferred Income Taxes | Deferred Income Taxes | 2,614 | | | 2,618 | | Deferred Income Taxes | 1,738 | | | 1,732 | |
| Underfunded Pension Benefit Obligation | Underfunded Pension Benefit Obligation | 364 | | | 377 | | Underfunded Pension Benefit Obligation | 283 | | | 281 | |
| Postretirement and Postemployment Benefit Obligation | Postretirement and Postemployment Benefit Obligation | 194 | | | 205 | | Postretirement and Postemployment Benefit Obligation | 145 | | | 150 | |
| Long-Term Lease Obligations | Long-Term Lease Obligations | 245 | | | 236 | | Long-Term Lease Obligations | 286 | | | 283 | |
| Other Liabilities | Other Liabilities | 1,092 | | | 1,099 | | Other Liabilities | 1,085 | | | 1,075 | |
| Equity | Equity | | Equity | |
| Common stock, $1 par value, 2022 – 448.9 shares and 2021 – 448.9 shares | 449 | | | 449 | | |
| Common stock, $1 par value, 2023 – 448.9 shares and 2022 – 448.9 shares | | Common stock, $1 par value, 2023 – 448.9 shares and 2022 – 448.9 shares | 449 | | | 449 | |
| Paid-in capital | Paid-in capital | 4,675 | | | 4,668 | | Paid-in capital | 4,699 | | | 4,725 | |
| Retained earnings | Retained earnings | 9,557 | | | 9,029 | | Retained earnings | 9,866 | | | 9,855 | |
| Accumulated other comprehensive loss | Accumulated other comprehensive loss | (1,489) | | | (1,666) | | Accumulated other comprehensive loss | (1,911) | | | (1,925) | |
| | 13,192 | | | 12,480 | | | 13,103 | | | 13,104 | |
| Less: Common stock held in treasury, at cost, 2022 – 86.9 shares and 2021 – 70.4 shares | 4,149 | | | 3,398 | | |
| Less: Common stock held in treasury, at cost, 2023 – 101.9 shares and 2022 – 98.6 shares | | Less: Common stock held in treasury, at cost, 2023 – 101.9 shares and 2022 – 98.6 shares | 4,714 | | | 4,607 | |
| Total Equity | Total Equity | 9,043 | | | 9,082 | | Total Equity | 8,389 | | | 8,497 | |
| Total Liabilities and Equity | Total Liabilities and Equity | $ | 25,282 | | | $ | 25,243 | | Total Liabilities and Equity | $ | 23,771 | | | $ | 23,940 | |
The accompanying notes are an integral part of these condensed financial statements.
INTERNATIONAL PAPER COMPANY
(Unaudited)
(In millions) | | | | | | | | | | | |
| | Six Months Ended
June 30, |
| | 2022 | | 2021 |
| Operating Activities | | | |
| Net earnings (loss) | $ | 871 | | | $ | 783 | |
| Depreciation, amortization and cost of timber harvested | 528 | | | 615 | |
| Deferred income tax provision (benefit), net | (5) | | | 5 | |
| Restructuring and other charges, net | — | | | 204 | |
| Net (gains) losses on mark to market investments | (49) | | | — | |
| Net (gains) losses on sales and impairments of businesses | — | | | (7) | |
| Net (gains) losses on sales of equity method investments | — | | | (204) | |
| Equity method dividends received | 204 | | | 149 | |
| Equity (earnings) losses, net | (186) | | | (153) | |
| Periodic pension (income) expense, net | (58) | | | (57) | |
| Other, net | 72 | | | 71 | |
| Changes in current assets and liabilities | | | |
| Accounts and notes receivable | (276) | | | (496) | |
| Contract assets | (129) | | | (62) | |
| Inventories | (133) | | | 110 | |
| Accounts payable and accrued liabilities | 199 | | | 367 | |
| Interest payable | 3 | | | (2) | |
| Other | (63) | | | (45) | |
| Cash Provided By (Used For) Operations | 978 | | | 1,278 | |
| Investment Activities | | | |
| Invested in capital projects, net of insurance recoveries | (371) | | | (222) | |
| Acquisitions, net of cash acquired | — | | | (80) | |
| Proceeds from sales of equity method investments | — | | | 800 | |
| Proceeds from sales of businesses, net of cash divested | — | | | 90 | |
| Proceeds from exchange of equity securities | 144 | | | — | |
| Proceeds from sale of fixed assets | 11 | | | — | |
| Other | (1) | | | (2) | |
| Cash Provided By (Used For) Investment Activities | (217) | | | 586 | |
| Financing Activities | | | |
| Repurchases of common stock and payments of restricted stock tax withholding | (823) | | | (213) | |
| Issuance of debt | 232 | | | 4 | |
| Reduction of debt | (243) | | | (914) | |
| Change in book overdrafts | (47) | | | 2 | |
| Dividends paid | (344) | | | (403) | |
| Net debt tender premiums paid | — | | | (188) | |
| Other | (1) | | | (3) | |
| Cash Provided By (Used For) Financing Activities | (1,226) | | | (1,715) | |
| Cash Included in Assets Held for Sale | — | | | (45) | |
| Effect of Exchange Rate Changes on Cash and Temporary Investments | (4) | | | 7 | |
| Change in Cash and Temporary Investments | (469) | | | 111 | |
| Cash and Temporary Investments | | | |
| Beginning of period | 1,295 | | | 595 | |
| End of period | $ | 826 | | | $ | 706 | |
| | | | | | | | | | | |
| | Three Months Ended
March 31, |
| | 2023 | | 2022 |
| Operating Activities | | | |
| Net earnings (loss) | $ | 172 | | | $ | 360 | |
| Depreciation, amortization and cost of timber harvested | 241 | | | 261 | |
| Deferred income tax provision (benefit), net | (2) | | | 30 | |
| Net (gains) losses on mark to market investments | — | | | (46) | |
| Net (gains) losses on sales and impairments of equity method investments | 43 | | | — | |
| Equity method dividends received | — | | | 204 | |
| Equity (earnings) losses, net | (42) | | | (93) | |
| Periodic pension (income) expense, net | 26 | | | (28) | |
| Other, net | 39 | | | 51 | |
| Changes in current assets and liabilities | | | |
| Accounts and notes receivable | 103 | | | (146) | |
| Contract assets | (52) | | | (114) | |
| Inventories | 52 | | | 31 | |
| Accounts payable and accrued liabilities | (203) | | | 89 | |
| Interest payable | (5) | | | 25 | |
| Other | (27) | | | (36) | |
| Cash Provided By (Used For) Operations | 345 | | | 588 | |
| Investment Activities | | | |
| Invested in capital projects, net of insurance recoveries | (341) | | | (185) | |
| Proceeds from sale of fixed assets | 2 | | | 5 | |
| Cash Provided By (Used For) Investment Activities | (339) | | | (180) | |
| Financing Activities | | | |
| Repurchases of common stock and payments of restricted stock tax withholding | (177) | | | (428) | |
| Issuance of debt | 670 | | | 88 | |
| Reduction of debt | (413) | | | (3) | |
| Change in book overdrafts | (26) | | | (66) | |
| Dividends paid | (162) | | | (174) | |
| Cash Provided By (Used For) Financing Activities | (108) | | | (583) | |
| Effect of Exchange Rate Changes on Cash and Temporary Investments and Restricted Cash | 6 | | | (1) | |
| Change in Cash and Temporary Investments and Restricted Cash | (96) | | | (176) | |
| Cash and Temporary Investments and Restricted Cash | | | |
| Beginning of period | 804 | | | 1,295 | |
| End of period | $ | 708 | | | $ | 1,119 | |
The accompanying notes are an integral part of these condensed financial statements.
INTERNATIONAL PAPER COMPANY
(Unaudited)
The accompanying unaudited condensed consolidated financial statements have been prepared in conformity with accounting principles generally accepted in the United States and in accordance with the instructions to Form 10-Q and, in the opinion of management, include all adjustments that are necessary for the fair presentation of International Paper Company’s ("International Paper's", "the Company’s" or "our") financial position, results of operations, and cash flows for the interim periods presented. Except as disclosed herein, such adjustments are of a normal, recurring nature. Results for the first sixthree months of the year may not necessarily be indicative of full year results. You should read these condensed financial statements in conjunction with the audited financial statements and the notes thereto included in the Company’s Annual Report on Form 10-K for the year ended December 31, 20212022 (the "Annual Report"), which have previously been filed with the Securities and Exchange Commission.
These consolidated financial statements have been prepared in conformity with accounting principles generally accepted in the United States that require the use of management’s estimates. Actual results could differ from management’s estimates.
Printing Papers Spinoff
On October 1, 2021, the Company completed the previously announced spin-off of its Printing Papers segment along with certain mixed-use coated paperboard and pulp businesses in North America, France and Russia into a standalone, publicly-traded company, Sylvamo Corporation ("Sylvamo"). The transaction was implemented through the distribution of shares of the standalone company to International Paper's shareholders (the "Distribution"). As a result of the Distribution, Sylvamo is an independent public company that trades on the New York Stock Exchange under the symbol "SLVM".
In addition to the spin-off of Sylvamo, the Company completed the sale of its Kwidzyn, Poland mill on August 6, 2021. All historical operating results of the Sylvamo businesses and Kwidzyn mill have been presented as Discontinued Operations, net of tax, in the condensed consolidated statement of operations. See Note 9 - Divestitures and Impairments of Businesses for further details regarding the Sylvamo spin-off and discontinued operations.
Russia/UkraineRussia-Ukraine Conflict
The Russia-Ukrainemilitary conflict between Russia and Ukraine, including current and futureongoing sanctions, actions by the Russian government, and associated domestic and global economic and geopolitical conditions, havehas adversely affected and could materially andmay continue to adversely affect our Ilim joint venture and could otherwise adversely affect our business,businesses, financial condition, results of operations and cash flows. We are unableOn January 24, 2023, we announced that we have reached an agreement to predict the full impact of Russia’s ongoing invasion of Ukraine, sanctions that have been imposed to date or that may in the future be imposed, geopolitical instability and the possibility of broadened military conflict may have on us orsell our Ilim joint venture, including whether our Ilim joint venture may be able to continue to pay dividends to us. We continue to actively explore strategic options with respect to the Ilim joint venture, including a sale of our 50% equity interest in Ilim. In addition, weIlim S.A. ("Ilim") and have disclosed our intentalso received from the same purchaser an indication of interest to monetize our remaining equity stake in Sylvamo (which has certain operations in Russia and announced in March 2022 that it began the suspension of operations in Russia and that it was continuing to assess various options for its operations in that country). While we may sellpurchase our equity interestsinvestment in JSC Ilim Group ("Ilim Group" and together with Ilim, the Ilim"Ilim joint venture and Sylvamo,venture"), however, we cannot be certain if and when thisthe completion of these sales may occur,occur. Our ability to complete such sales is subject to various risks, including (i) purchasers’ inability to obtain necessary regulatory approvals or to finance the purchase pursuant to the terms of the agreement, (ii) adverse actions by the Russian government, and (iii) new or expanded sanctions imposed by the U.S., the United Kingdom, or the European Union or its member countries. We are unable to predict the full impact that possibleRussia’s ongoing invasion of Ukraine, current or potential future sanctions, ongoing or potential disruptions resulting from the conflict, the changing regulatory environment in the capital markets, orRussia, negative macroeconomic conditions associated with the Russia-Ukrainearising from such conflict, couldsupply chain disruptions, and geopolitical instability and shifts, may have on the value of andus or our ability to sellcomplete the sale of our equity interestsinterest in the Ilim joint venture and/or Sylvamo and the timing of any such sales.venture.
Recently Issued Accounting Pronouncements Not Yet Adopted
Reference Rate Reform
In March 2020, the FASB issued ASU 2020-04, "Reference Rate Reform (Topic 848): Facilitation of the Effects of Reference Rate Reform on Financial Reporting." This guidance provides companies with optional guidance to ease the potential accounting burden associated with transitioning away from reference rates that are expected to be discontinued. This guidance is effective upon issuance and generally can be applied through December 31, 2022.2024. The Company will apply the amendments in this update to account for contract modifications due to changes in reference rates once those occur. We do not expect these amendments to have a material impact on our consolidated financial statements and related disclosures.
Liabilities - Supplier Finance Programs
Government Assistance
In
November 2021,September 2022, the FASB issued ASU
2021-10, "Government Assistance (Topic 832)2022-04, "Liabilities - Supplier Finance Programs (Subtopic 405-50):
Disclosures by Business Entities about Government Assistance.Disclosure of Supplier Finance Program Obligations." This guidance requires a business entity
operating as a buyer in a supplier finance agreement to
provide certain disclosures around assistance received from governments.disclose qualitative and quantitative information about its supplier finance programs. This guidance is effective for annual reporting periods beginning after December 15,
2021.2022, and interim periods within those years. The Company
is currently evaluatingadopted the provisions of
this guidance in the
guidance.first quarter of 2023. See Note 8 - Supplemental Financial Information.
Generally, the Company recognizes revenue on a point-in-time basis when the customer takes title to the goods and assumes the risks and rewards for the goods. For customized goods where the Company has a legally enforceable right to payment for the goods, the Company recognizes revenue over time which, generally, is as the goods are produced.
Disaggregated Revenue
A geographic disaggregation of revenues across our company segmentation in the following tables provides information to assist in evaluating the nature, timing and uncertainty of revenue and cash flows and how they may be impacted by economic factors.
| | | | | | | | | | | | | | | | | | | | | | | | | | |
| | Three Months Ended June 30, 2022 |
| In millions | | Industrial Packaging | | Global Cellulose Fibers | | Corporate and Inter-segment Sales | | Total |
| Primary Geographical Markets (a) | | | | | | | | |
| United States | | $ | 3,842 | | | $ | 752 | | | $ | 109 | | | $ | 4,703 | |
| EMEA | | 413 | | | 25 | | | — | | | 438 | |
| Pacific Rim and Asia | | 11 | | | 11 | | | 1 | | | 23 | |
| Americas, other than U.S. | | 225 | | | — | | | — | | | 225 | |
| Total | | $ | 4,491 | | | $ | 788 | | | $ | 110 | | | $ | 5,389 | |
| | | | | | | | |
| Operating Segments | | | | | | | | |
| North American Industrial Packaging | | $ | 4,126 | | | $ | — | | | $ | — | | | $ | 4,126 | |
| EMEA Industrial Packaging | | 413 | | | — | | | — | | | 413 | |
| Global Cellulose Fibers | | — | | | 788 | | | — | | | 788 | |
| Intra-segment Eliminations | | (48) | | | — | | | — | | | (48) | |
| Corporate & Inter-segment Sales | | — | | | — | | | 110 | | | 110 | |
| Total | | $ | 4,491 | | | $ | 788 | | | $ | 110 | | | $ | 5,389 | |
(a) Net sales are attributed to countries based on the location of the seller.
| | | Six Months Ended June 30, 2022 | | Three Months Ended March 31, 2023 |
| In millions | In millions | | Industrial Packaging | | Global Cellulose Fibers | | Corporate & Intersegment | | Total | In millions | | Industrial Packaging | | Global Cellulose Fibers | | Corporate & Intersegment | | Total |
| Primary Geographical Markets (a) | Primary Geographical Markets (a) | | Primary Geographical Markets (a) | |
| United States | United States | | $ | 7,603 | | | $ | 1,414 | | | $ | 229 | | | $ | 9,246 | | United States | | $ | 3,455 | | | $ | 730 | | | $ | 126 | | | $ | 4,311 | |
| EMEA | EMEA | | 823 | | | 55 | | | — | | | 878 | | EMEA | | 391 | | | 25 | | | — | | | 416 | |
| Pacific Rim and Asia | Pacific Rim and Asia | | 21 | | | 29 | | | 2 | | | 52 | | Pacific Rim and Asia | | 8 | | | 56 | | | — | | | 64 | |
| Americas, other than U.S. | Americas, other than U.S. | | 450 | | | — | | | — | | | 450 | | Americas, other than U.S. | | 229 | | | — | | | — | | | 229 | |
| Total | Total | | $ | 8,897 | | | $ | 1,498 | | | $ | 231 | | | $ | 10,626 | | Total | | $ | 4,083 | | | $ | 811 | | | $ | 126 | | | $ | 5,020 | |
| | Operating Segments | Operating Segments | | Operating Segments | |
| North American Industrial Packaging | North American Industrial Packaging | | $ | 8,151 | | | $ | — | | | $ | — | | | $ | 8,151 | | North American Industrial Packaging | | $ | 3,724 | | | $ | — | | | $ | — | | | $ | 3,724 | |
| EMEA Industrial Packaging | EMEA Industrial Packaging | | 823 | | | — | | | — | | | 823 | | EMEA Industrial Packaging | | 391 | | | — | | | — | | | 391 | |
| Global Cellulose Fibers | Global Cellulose Fibers | | — | | | 1,498 | | | — | | | 1,498 | | Global Cellulose Fibers | | — | | | 811 | | | — | | | 811 | |
| Intra-segment Eliminations | Intra-segment Eliminations | | (77) | | | — | | | — | | | (77) | | Intra-segment Eliminations | | (32) | | | — | | | — | | | (32) | |
| Corporate & Inter-segment Sales | | — | | | — | | | 231 | | | 231 | | |
| Corporate & Intersegment Sales | | Corporate & Intersegment Sales | | — | | | — | | | 126 | | | 126 | |
| Total | Total | | $ | 8,897 | | | $ | 1,498 | | | $ | 231 | | | $ | 10,626 | | Total | | $ | 4,083 | | | $ | 811 | | | $ | 126 | | | $ | 5,020 | |
(a) Net sales are attributed to countries based on the location of the seller.
| | | Three Months Ended June 30, 2021 | | Three Months Ended March 31, 2022 |
| In millions | In millions | | Industrial Packaging | | Global Cellulose Fibers | | Corporate & Intersegment | | Total | In millions | | Industrial Packaging | | Global Cellulose Fibers | | Corporate & Intersegment | | Total |
Primary Geographical Markets (a) | Primary Geographical Markets (a) | | Primary Geographical Markets (a) | |
| United States | United States | | $ | 3,430 | | | $ | 633 | | | $ | 43 | | | $ | 4,106 | | United States | | $ | 3,761 | | | $ | 662 | | | $ | 120 | | | $ | 4,543 | |
| EMEA | EMEA | | 395 | | | 22 | | | (1) | | | 416 | | EMEA | | 410 | | | 30 | | | — | | | 440 | |
| Pacific Rim and Asia | Pacific Rim and Asia | | 14 | | | 25 | | | 10 | | | 49 | | Pacific Rim and Asia | | 10 | | | 18 | | | 1 | | | 29 | |
| Americas, other than U.S. | Americas, other than U.S. | | 191 | | | — | | | 8 | | | 199 | | Americas, other than U.S. | | 225 | | | — | | | — | | | 225 | |
| Total | Total | | $ | 4,030 | | | $ | 680 | | | $ | 60 | | | $ | 4,770 | | Total | | $ | 4,406 | | | $ | 710 | | | $ | 121 | | | $ | 5,237 | |
| | Operating Segments | Operating Segments | | Operating Segments | |
| North American Industrial Packaging | North American Industrial Packaging | | $ | 3,663 | | | $ | — | | | $ | — | | | $ | 3,663 | | North American Industrial Packaging | | $ | 4,025 | | | $ | — | | | $ | — | | | $ | 4,025 | |
| EMEA Industrial Packaging | EMEA Industrial Packaging | | 394 | | | — | | | — | | | 394 | | EMEA Industrial Packaging | | 410 | | | — | | | — | | | 410 | |
| Global Cellulose Fibers | Global Cellulose Fibers | | — | | | 680 | | | — | | | 680 | | Global Cellulose Fibers | | — | | | 710 | | | — | | | 710 | |
| Intra-segment Eliminations | Intra-segment Eliminations | | (27) | | | — | | | — | | | (27) | | Intra-segment Eliminations | | (29) | | | — | | | — | | | (29) | |
| Corporate & Inter-segment Sales | | — | | | — | | | 60 | | | 60 | | |
| Corporate & Intersegment Sales | | Corporate & Intersegment Sales | | — | | | — | | | 121 | | | 121 | |
| Total | Total | | $ | 4,030 | | | $ | 680 | | | $ | 60 | | | $ | 4,770 | | Total | | $ | 4,406 | | | $ | 710 | | | $ | 121 | | | $ | 5,237 | |
(a) Net sales are attributed to countries based on the location of the seller.
| | | | | | | | | | | | | | | | | | | | | | | | | | |
| | Six Months Ended June 30, 2021 |
| In millions | | Industrial Packaging | | Global Cellulose Fibers | | Corporate & Intersegment | | Total |
| Primary Geographical Markets (a) | | | | | | | | |
| United States | | $ | 6,762 | | | $ | 1,176 | | | $ | 90 | | | $ | 8,028 | |
| EMEA | | 788 | | | 46 | | | (2) | | | 832 | |
| Pacific Rim and Asia | | 32 | | | 53 | | | 24 | | | 109 | |
| Americas, other than U.S. | | 378 | | | — | | | 16 | | | 394 | |
| Total | | $ | 7,960 | | | $ | 1,275 | | | $ | 128 | | | $ | 9,363 | |
| | | | | | | | |
| Operating Segments | | | | | | | | |
| North American Industrial Packaging | | $ | 7,223 | | | $ | — | | | $ | — | | | $ | 7,223 | |
| EMEA Industrial Packaging | | 790 | | | — | | | — | | | 790 | |
| Global Cellulose Fibers | | — | | | 1,275 | | | — | | | 1,275 | |
| Intra-segment Eliminations | | (53) | | | — | | | — | | | (53) | |
| Corporate & Inter-segment Sales | | — | | | — | | | 128 | | | 128 | |
| Total | | $ | 7,960 | | | $ | 1,275 | | | $ | 128 | | | $ | 9,363 | |
(a) Net sales are attributed to countries based on the location of the seller.
Revenue Contract Balances
A contract asset is created when the Company recognizes revenue on its customized products prior to having an unconditional right to payment from the customer, which generally does not occur until title and risk of loss passes to the customer.
A contract liability is created when customers prepay for goods prior to the Company transferring those goods to the customer. The contract liability is reduced once control of the goods is transferred to the customer. The majority of our customer prepayments are received during the fourth quarter each year for goods that will be transferred to customers over the following twelve months. Contract liabilities of
$16$36 million and
$27$38 million are included in Other current liabilities in the accompanying condensed consolidated balance sheet as of
June 30, 2022March 31, 2023 and December 31,
2021,2022, respectively.
During the second quarter of 2021, theThe Company also recorded a contract liability of $115 million related to
the April 2021 acquisition disclosed in Note 8 - Acquisitions.a previous acquisition. The balance of this contract liability was $103$97 million and $107$99 million at June 30, 2022March 31, 2023 and December 31, 2021,2022, respectively, and is recorded in Other current liabilities and Other Liabilities in the accompanying condensed consolidated balance sheet.
The difference between the opening and closing balances of the Company's contract assets and contract liabilities primarily results from the difference between the price and quantity at comparable points in time for goods for which we have an unconditional right to payment or receive prepayment from the customer, respectively.
A summary of the changes in equity for the three and six months ended June 30,March 31, 2023 and 2022 and 2021 is provided below:
| | | Three Months Ended June 30, 2022 | | Three Months Ended March 31, 2023 |
| In millions, except per share amounts | In millions, except per share amounts | Common Stock Issued | | Paid-in Capital | | Retained Earnings | Accumulated Other Comprehensive Income (Loss) | | Common Stock Held In Treasury, At Cost | | Total
Equity | | In millions, except per share amounts | Common Stock Issued | | Paid-in Capital | | Retained Earnings | Accumulated Other Comprehensive Income (Loss) | | Common Stock Held In Treasury, At Cost | | Total
Equity | |
| Balance, April 1 | $ | 449 | | | $ | 4,670 | | | $ | 9,218 | | $ | (1,694) | | | $ | 3,756 | | | $ | 8,887 | | | |
| Balance, January 1 | | Balance, January 1 | $ | 449 | | | $ | 4,725 | | | $ | 9,855 | | $ | (1,925) | | | $ | 4,607 | | | $ | 8,497 | | |
| Issuance of stock for various plans, net | Issuance of stock for various plans, net | — | | | 5 | | | — | | — | | | (2) | | | 7 | | | Issuance of stock for various plans, net | — | | | (26) | | | — | | — | | | (72) | | | 46 | | |
| Repurchase of stock | Repurchase of stock | — | | | — | | | — | | — | | | 395 | | | (395) | | | Repurchase of stock | — | | | — | | | — | | — | | | 179 | | | (179) | | |
Common stock dividends ($0.4625 per share) | Common stock dividends ($0.4625 per share) | — | | | — | | | (172) | | — | | | — | | | (172) | | | Common stock dividends ($0.4625 per share) | — | | | — | | | (161) | | — | | | — | | | (161) | | |
| Comprehensive income (loss) | Comprehensive income (loss) | — | | | — | | | 511 | | 205 | | | — | | | 716 | | | Comprehensive income (loss) | — | | | — | | | 172 | | 14 | | | — | | | 186 | | |
| Ending Balance, June 30 | $ | 449 | | | $ | 4,675 | | | $ | 9,557 | | $ | (1,489) | | | $ | 4,149 | | | $ | 9,043 | | | |
| Ending Balance, March 31 | | Ending Balance, March 31 | $ | 449 | | | $ | 4,699 | | | $ | 9,866 | | $ | (1,911) | | | $ | 4,714 | | | $ | 8,389 | | |
| | | Six Months Ended June 30, 2022 | | Three Months Ended March 31, 2022 |
| In millions, except per share amounts | In millions, except per share amounts | Common Stock Issued | | Paid-in Capital | | Retained Earnings | Accumulated Other Comprehensive Income (Loss) | | Common Stock Held In Treasury, At Cost | | Total
Equity | | In millions, except per share amounts | Common Stock Issued | | Paid-in Capital | | Retained Earnings | Accumulated Other Comprehensive Income (Loss) | | Common Stock Held In Treasury, At Cost | | Total
Equity | |
| Balance, January 1 | Balance, January 1 | $ | 449 | | | $ | 4,668 | | | $ | 9,029 | | $ | (1,666) | | | $ | 3,398 | | | $ | 9,082 | | | Balance, January 1 | $ | 449 | | | $ | 4,668 | | | $ | 9,029 | | $ | (1,666) | | | $ | 3,398 | | | $ | 9,082 | | |
| Issuance of stock for various plans, net | Issuance of stock for various plans, net | — | | | 7 | | | — | | — | | | (72) | | | 79 | | | Issuance of stock for various plans, net | — | | | 2 | | | — | | — | | | (70) | | | 72 | | |
| Repurchase of stock | Repurchase of stock | — | | | — | | | — | | — | | | 823 | | | (823) | | | Repurchase of stock | — | | | — | | | — | | — | | | 428 | | | (428) | | |
Common stock dividends ($0.9250 per share) | — | | | — | | | (343) | | — | | | — | | | (343) | | | |
| Common stock dividends ($0.4625 per share) | | Common stock dividends ($0.4625 per share) | — | | | — | | | (171) | | — | | | — | | | (171) | | |
| Comprehensive income (loss) | Comprehensive income (loss) | — | | | — | | | 871 | | 177 | | | — | | | 1,048 | | | Comprehensive income (loss) | — | | | — | | | 360 | | (28) | | | — | | | 332 | | |
| Ending Balance, June 30 | $ | 449 | | | $ | 4,675 | | | $ | 9,557 | | $ | (1,489) | | | $ | 4,149 | | | $ | 9,043 | | | |
| Ending Balance, March 31 | | Ending Balance, March 31 | $ | 449 | | | $ | 4,670 | | | $ | 9,218 | | $ | (1,694) | | | $ | 3,756 | | | $ | 8,887 | | |
| | | | | | | | | | | | | | | | | | | | | | | | | | | | | | | | | | | | | | | | | | | | | | | |
| Three Months Ended June 30, 2021 |
| In millions, except per share amounts | Common Stock Issued | | Paid-in Capital | | Retained Earnings | Accumulated Other Comprehensive Income (Loss) | | Common Stock Held In Treasury, At Cost | | Total
International
Paper
Shareholders’
Equity | | Noncontrolling
Interests | | Total
Equity | |
| Balance, April 1 | $ | 449 | | | $ | 6,267 | | | $ | 8,214 | | $ | (4,453) | | | $ | 2,719 | | | $ | 7,758 | | | $ | 13 | | | $ | 7,771 | | |
| Issuance of stock for various plans, net | — | | | 44 | | | — | | — | | | (2) | | | 46 | | | — | | | 46 | | |
| Repurchase of stock | — | | | — | | | — | | — | | | 58 | | | (58) | | | — | | | (58) | | |
| Common stock dividends ($0.5125 per share) | — | | | — | | | (204) | | — | | | — | | | (204) | | | — | | | (204) | | |
| Transactions of equity method investees | — | | | 19 | | | — | | — | | | — | | | 19 | | | — | | | 19 | | |
| Divestiture of noncontrolling interests | — | | | — | | | — | | — | | | — | | | — | | | (12) | | | (12) | | |
| Comprehensive income (loss) | — | | | — | | | 432 | | 359 | | | — | | | 791 | | | 1 | | | 792 | | |
| Ending Balance, June 30 | $ | 449 | | | $ | 6,330 | | | $ | 8,442 | | $ | (4,094) | | | $ | 2,775 | | | $ | 8,352 | | | $ | 2 | | | $ | 8,354 | | |
| | | | | | | | | | | | | | | | | | | | | | | | | | | | | | | | | | | | | | | | | | | | | | | |
| Six Months Ended June 30, 2021 |
| In millions, except per share amounts | Common Stock Issued | | Paid-in Capital | | Retained Earnings | Accumulated Other Comprehensive Income (Loss) | | Common Stock Held In Treasury, At Cost | | Total
International
Paper
Shareholders’
Equity | | Noncontrolling
Interests | | Total
Equity | |
| Balance, January 1 | $ | 449 | | | $ | 6,325 | | | $ | 8,070 | | $ | (4,342) | | | $ | 2,648 | | | $ | 7,854 | | | $ | 14 | | | $ | 7,868 | | |
| Issuance of stock for various plans, net | — | | | (14) | | | — | | — | | | (86) | | | 72 | | | — | | | 72 | | |
| Repurchase of stock | — | | | — | | | — | | — | | | 213 | | | (213) | | | — | | | (213) | | |
| Common stock dividends ($1.0250 per share) | — | | | — | | | (409) | | — | | | — | | | (409) | | | — | | | (409) | | |
| Transactions of equity method investees | — | | | 19 | | | — | | — | | | — | | | 19 | | | — | | | 19 | | |
| Divestiture of noncontrolling interests | — | | | — | | | — | | — | | | — | | | — | | | (12) | | | (12) | | |
| Comprehensive income (loss) | — | | | — | | | 781 | | 248 | | | — | | | 1,029 | | | — | | | 1,029 | | |
| Ending Balance, June 30 | $ | 449 | | | $ | 6,330 | | | $ | 8,442 | | $ | (4,094) | | | $ | 2,775 | | | $ | 8,352 | | | $ | 2 | | | $ | 8,354 | | |
The following table presents changes in accumulated other comprehensive incomeAccumulated Other Comprehensive Income (Loss) (AOCI), net of tax, for the three months ended March 31, 2023 and six months ended June 30, 2022 and 2021:2022:
| | | Three Months Ended
June 30, | | Six Months Ended
June 30, | | Three Months Ended
March 31, | |
| In millions | In millions | 2022 | | 2021 | | 2022 | | 2021 | In millions | 2023 | | 2022 | |
| Defined Benefit Pension and Postretirement Adjustments | Defined Benefit Pension and Postretirement Adjustments | | Defined Benefit Pension and Postretirement Adjustments | |
| Balance at beginning of period | Balance at beginning of period | $ | (942) | | | $ | (1,846) | | | $ | (962) | | | $ | (1,880) | | Balance at beginning of period | $ | (1,195) | | | $ | (962) | | |
| | Amounts reclassified from accumulated other comprehensive income | Amounts reclassified from accumulated other comprehensive income | 23 | | | 37 | | | 43 | | | 71 | | Amounts reclassified from accumulated other comprehensive income | 23 | | | 20 | | |
| Balance at end of period | Balance at end of period | (919) | | | (1,809) | | | (919) | | | (1,809) | | Balance at end of period | (1,172) | | | (942) | | |
| Change in Cumulative Foreign Currency Translation Adjustments | Change in Cumulative Foreign Currency Translation Adjustments | | Change in Cumulative Foreign Currency Translation Adjustments | |
| Balance at beginning of period | Balance at beginning of period | (742) | | | (2,599) | | | (694) | | | (2,457) | | Balance at beginning of period | (722) | | | (694) | | |
| Other comprehensive income (loss) before reclassifications | Other comprehensive income (loss) before reclassifications | 182 | | | 172 | | | 134 | | | 29 | | Other comprehensive income (loss) before reclassifications | (9) | | | (48) | | |
| Amounts reclassified from accumulated other comprehensive income | — | | | 140 | | | — | | | 140 | | |
| Other comprehensive income (loss) attributable to noncontrolling interest | — | | | 1 | | | — | | | 2 | | |
| | Balance at end of period | Balance at end of period | (560) | | | (2,286) | | | (560) | | | (2,286) | | Balance at end of period | (731) | | | (742) | | |
| Net Gains and Losses on Cash Flow Hedging Derivatives | Net Gains and Losses on Cash Flow Hedging Derivatives | | Net Gains and Losses on Cash Flow Hedging Derivatives | |
| Balance at beginning of period | Balance at beginning of period | (10) | | | (8) | | | (10) | | | (5) | | Balance at beginning of period | (8) | | | (10) | | |
| Other comprehensive income (loss) before reclassifications | — | | | 13 | | | — | | | 7 | | |
| Amounts reclassified from accumulated other comprehensive income | — | | | (4) | | | — | | | (1) | | |
| | Balance at end of period | Balance at end of period | (10) | | | 1 | | | (10) | | | 1 | | Balance at end of period | (8) | | | (10) | | |
| Total Accumulated Other Comprehensive Income (Loss) at End of Period | Total Accumulated Other Comprehensive Income (Loss) at End of Period | $ | (1,489) | | | $ | (4,094) | | | $ | (1,489) | | | $ | (4,094) | | Total Accumulated Other Comprehensive Income (Loss) at End of Period | $ | (1,911) | | | $ | (1,694) | | |
The following table presents details of the reclassifications out of AOCI for the three months ended March 31, 2023 and six months ended June 30, 2022 and 2021:2022:
| | | | | | | | | | | | | | | | | | | | | | | | | | | | | |
| In millions: | Amount Reclassified from Accumulated Other Comprehensive Income | | Location of Amount Reclassified from AOCI |
Three Months Ended
June 30, | | Six Months Ended
June 30, | |
| 2022 | | 2021 | | 2022 | | 2021 | |
| Defined benefit pension and postretirement items: | | | | | | | | | |
| Prior-service costs | $ | (6) | | | $ | (6) | | | $ | (11) | | | $ | (12) | | (a) | Non-operating pension expense (income) |
| Actuarial gains (losses) | (24) | | | (42) | | | (46) | | | (82) | | (a) | Non-operating pension expense (income) |
| Total pre-tax amount | (30) | | | (48) | | | (57) | | | (94) | | | |
| Tax (expense) benefit | 7 | | | 11 | | | 14 | | | 23 | | | |
| Net of tax | (23) | | | (37) | | | (43) | | | (71) | | | |
| | | | | | | | | |
| Change in cumulative foreign currency translation adjustments: | | | | | | | | | |
| Business acquisitions/divestitures | — | | | (140) | | | — | | | (140) | | | Net (gains) losses on sales and impairments of businesses and Cost of products sold |
| Tax (expense) benefit | — | | | — | | | — | | | — | | | |
| Net of tax | — | | | (140) | | | — | | | (140) | | | |
| | | | | | | | | |
| Net gains and losses on cash flow hedging derivatives: | | | | | | | | | |
| Foreign exchange contracts | — | | | 6 | | | — | | | 2 | | (b) | Cost of products sold |
| Total pre-tax amount | — | | | 6 | | | — | | | 2 | | | |
| Tax (expense)/benefit | — | | | (2) | | | — | | | (1) | | | |
| Net of tax | — | | | 4 | | | — | | | 1 | | | |
| Total reclassifications for the period | $ | (23) | | | $ | (173) | | | $ | (43) | | | $ | (210) | | | |
| | | | | | | | | | | | | | | | | | | | |
| In millions: | Amount Reclassified from Accumulated Other Comprehensive Income | | Location of Amount Reclassified from AOCI |
Three Months Ended
March 31, | | |
| 2023 | | 2022 | | |
| Defined benefit pension and postretirement items: | | | | | | |
| Prior-service costs | $ | (6) | | | $ | (5) | | | (a) | Non-operating pension expense (income) |
| Actuarial gains (losses) | (24) | | | (22) | | | (a) | Non-operating pension expense (income) |
| Total pre-tax amount | (30) | | | (27) | | | | |
| Tax (expense) benefit | 7 | | | 7 | | | | |
| Net of tax | (23) | | | (20) | | | | |
| | | | | | |
| | | | | | |
| | | | | | |
| | | | | | |
| | | | | | |
| | | | | | |
| Total reclassifications for the period | $ | (23) | | | $ | (20) | | | | |
(a)These accumulated other comprehensive income components are included in the computation of net periodic pension cost (see Note 19 for additional details). (b)This accumulated other comprehensive income component is included in our derivatives and hedging activities (see Note 1816 for additional details).
Basic earnings per share is computed by dividing earnings by the weighted average number of common shares outstanding. Diluted earnings per share is computed assuming that all potentially dilutive securities were converted into common shares. There are no adjustments required to be made to net income for purposes of computing basic and diluted earnings per share. A reconciliation of the amounts included in the computation of basic earnings (loss) per share and diluted earnings (loss) per share is as follows:
| | | | | | | | | | | | | | | | | | | | | | | |
| | Three Months Ended
June 30, | | Six Months Ended
June 30, |
| In millions, except per share amounts | 2022 | | 2021 | | 2022 | | 2021 |
| Earnings (loss) from continuing operations attributable to International Paper Company common shareholders | $ | 511 | | | $ | 308 | | | $ | 871 | | | $ | 575 | |
| Weighted average common shares outstanding | 367.6 | | | 391.5 | | | 371.4 | | | 392.1 | |
| Effect of dilutive securities | | | | | | | |
| Restricted performance share plan | 3.1 | | | 5.3 | | | 4.3 | | | 5.6 | |
| Weighted average common shares outstanding – assuming dilution | 370.7 | | | 396.8 | | | 375.7 | | | 397.7 | |
| Basic earnings (loss) per share from continuing operations | $ | 1.39 | | | $ | 0.79 | | | $ | 2.34 | | | $ | 1.47 | |
| Diluted earnings (loss) per share from continuing operations | $ | 1.38 | | | $ | 0.78 | | | $ | 2.32 | | | $ | 1.45 | |
| | | | | | | | | | | | | | |
| | Three Months Ended
March 31, | |
| In millions, except per share amounts | 2023 | | 2022 | |
| Earnings (loss) from continuing operations | $ | 172 | | | $ | 267 | | |
| Weighted average common shares outstanding | 349.3 | | | 375.2 | | |
| Effect of dilutive securities | | | | |
| Restricted performance share plan | 4.0 | | | 4.0 | | |
| Weighted average common shares outstanding – assuming dilution | 353.3 | | | 379.2 | | |
| Basic earnings (loss) per share from continuing operations | $ | 0.49 | | | $ | 0.71 | | |
| Diluted earnings (loss) per share from continuing operations | $ | 0.49 | | | $ | 0.70 | | |
2022: There were no restructuring and other charges recorded during the three months ended June 30, 2022 and March 31, 2022.
2021: During the three months ended June 30, 2021, the Company recorded a $170 million pre-tax charge in Corporate related to early debt extinguishment costs and a $4 million pre-tax charge in Corporate for severance.
During the three months ended March 31, 2021, the Company recorded an $18 million pre-tax charge in Corporate related to early debt extinguishment costs and a $12 million pre-tax charge in the Industrial Packaging segment for severance related to the optimization of our EMEA Packaging business.
2021: On April 1, 2021, the Company closed on the previously announced acquisition of two box plants located in Spain. The total purchase consideration, inclusive of working capital adjustments, was approximately €71 million (approximately $83 million based on the April 1, 2021 exchange rate).
The following table summarizes the final fair value assigned to assets and liabilities acquired as of April 1, 2021:
| | | | | |
In millions | |
Cash and temporary investments | $ | 5 | |
Accounts and notes receivable | 10 | |
Inventories | 3 | |
Plants, properties and equipment | 50 | |
Goodwill | 23 | |
Intangible assets | 13 | |
Total assets acquired | $ | 104 | |
Short-term debt | 2 | |
Accounts payable and accrued liabilities | 4 | |
Other current liabilities | 2 | |
Long-term debt | 1 | |
Deferred income taxes | 12 | |
Total liabilities assumed | 21 | |
Net assets acquired | $ | 83 | |
Pro forma information has not been included as it is impracticable to obtain the information due to the lack of availability of historical U.S. GAAP financial data. The results of the operations of these businesses do not have a material effect on the Company's consolidated results of operations.
The Company has accounted for the above acquisition under ASC 805, "Business Combinations" and the results of operations have been included in the Company's financial statements beginning with the date of acquisition.
2021: In April 2021, the Company received a noncontrolling interest in a U.S-based corrugated packaging producer. In the second quarter of 2021, the Company recorded its investment of $115 million based on the fair value of the noncontrolling interest and a corresponding contract liability that is amortized over 15 years. The Company is party to various agreements with the entity which includes a containerboard supply agreement. The Company is accounting for its interest as an equity method investment.
Printing Papers Spin-off
2021:On October 1, 2021, the Company completed the previously announced spin-off of its Printing Papers segment along with certain mixed-use coated paperboard and pulp businesses in North America, France and Russia into a standalone, publicly-traded company, Sylvamo Corporation. The transaction was implemented through the distribution of shares of the standalone company to International Paper's shareholders (the "Distribution"). The Company retained 19.9% of the shares of Sylvamo at the time of the separation and this investment is discussed further in Note 8 - Supplementary Financial Statement Information. As a result of the Distribution, Sylvamo Corporation is an independent public company that trades on the New York Stock Exchange under the symbol "SLVM".
The Distribution was made to the Company's stockholders of record as of the close of business on September 15, 2021 (the "Record Date"), and such stockholders received one share of Sylvamo common stock for every 11 shares of International Paper common stock held as of the close of business on the Record Date. The Company retained 19.9% of the shares of Sylvamo at the time of the separation and this retained investment is discussed further in Note 10 - Supplementary Financial Statement Information. The spin-off was tax-free for the Company and its shareholders for U.S. federal income tax purposes.
In connection with the Distribution, on September 29, 2021, the Company and Sylvamo entered into a separation and distribution agreement as well as various other agreements that govern the relationships between the parties following the Distribution, including a transition services agreement, a tax matters agreement and an employee matters agreement. These agreements provide for the allocation between the Company and Sylvamo of assets, liabilities and obligations attributable to periods prior to, at and after the Distribution and govern certain relationships between the Company and Sylvamo after the Distribution. The Company is also party tohas various ongoing operational agreements with Sylvamo under which it sells fiber, paper and other products. SalesRelated party sales under these agreements were $211 million and $409$198 million for the three months and six months ended June 30, 2022, respectively.
All historical operating resultsMarch 31, 2022. Following the sale of theits ownership interest in Sylvamo businesses, as well as the results of our Kwidzyn, Poland mill that was sold on August 6, 2021, are presented as Discontinued Operations, net of tax, in the condensed consolidated statement of operations.
Kwidzyn was previously part of the Printing Papers business prior to its sale in August 2021. See the Kwidzyn Mill section below for further details regarding this sale.
The following summarizes the major classes of line items comprising Earnings (Loss) Before Income Taxes and Equity Earnings reconciled to Discontinued Operations, net of tax, related to the Sylvamo businesses and Kwidzyn for the three months and six months ended June 30, 2021 in the condensed consolidated statement of operations:
| | | | | | | | |
| In millions | Three Months Ended June 30, 2021 | Six Months Ended June 30, 2021 |
| Net Sales | $ | 846 | | $ | 1,617 | |
| Costs and Expenses | | |
| Cost of products sold | 510 | | 1,009 | |
| Selling and administrative expenses | 63 | | 122 | |
| Depreciation, amortization and cost of timber harvested | 35 | | 76 | |
| Distribution expenses | 77 | | 147 | |
| Taxes other than payroll and income taxes | 9 | | 18 | |
| Interest expense, net | (29) | | (30) | |
| Earnings (Loss) Before Income Taxes and Equity Earnings | 181 | | 275 | |
| Income tax provision (benefit) | 57 | | 69 | |
| Discontinued Operations, Net of Taxes | $ | 124 | | $ | 206 | |
The following summarizes the total cash provided by operations and total cash used for investing activities related to the Sylvamo businesses and Kwidzyn and included in the condensed consolidated statement of cash flows for the six months ended June 30, 2021:
| | | | | |
In millions | Six Months Ended
June 30, 2021 |
Cash Provided by (Used For) Operating Activities | $ | 198 | |
Cash Provided by (Used For) Investment Activities | $ | (35) | |
In anticipation of the spin-off, Sylvamo incurred $1.5 billion in debt during the third quarter of 2021 with the proceeds used for a distribution to the Company and other expenses associated with the transaction. The Company was an obligor of the debt prior to the spin-off as2022, Sylvamo was a wholly-owned subsidiary. Subsequent to the distribution of the net assets, the Company wasis no longer an obligor of the Sylvamo debt. The $1.5 billion of borrowings was comprised of $450 million of 7.00% senior unsecured notes due 2029 issued in September 2021. It was also comprised of the senior secured credit facility that Sylvamo entered into in September 2021 which consisted of $450 million of borrowingsconsidered a related to its term loan “B” facility, $520 million of borrowings related to its term loan “F” facility, and the $100 million draw on its revolving credit facility which had a capacity of $450 million. Additionally, at the time of the spin-off in the fourth quarter of 2021, the Company distributed $130 million to Sylvamo.
Kwidzyn Mill
2021: On August 6,2021, the Company completed the sale of its Kwidzyn, Poland mill for €669 million (approximately $794 million using the July 31, 2021 exchange rate) in cash. The business included the pulp and paper mill in Kwidzyn and supporting functions. During the third quarter of 2021, the Company recorded a net gain of $360 million ($350 million after taxes) including a gain of $404 million ($394 million after taxes) related to the sale of net assets and a loss of $44 million (before and after taxes) related to the cumulative foreign currency translation loss. During the fourth quarter of 2021, the Company incurred $9 million ($6 million after taxes) of costs related to the sale of Kwidzyn. All historical operating results for Kwidzyn have been presented as Discontinued Operations, net of tax, in the condensed consolidated statement of operations.
Olmuksan International Paper
2021: On May 31, 2021, the Company completed the sale of its 90.38% ownership interest in Olmuksan International Paper, a corrugated packaging business in Turkey, to Mondi Group for €66 million (approximately $81 million using the May 31, 2021 exchange rate). During the second quarter of 2021, the Company recorded a gain of $6 million ($0 after taxes) related to the business working capital adjustment.
In conjunction with the announced agreement in the fourth quarter of 2020, a determination was made that the current book value of the Olmuksan International Paper disposal group exceeded its estimated fair value of $79 million which was based on the agreed upon transaction price. As a result, a preliminary charge of $123 million (before and after taxes) was recorded during the fourth quarter of 2020. During the first quarter of 2021, the Company recorded an additional charge of $2 million (before and after taxes) related to the cumulative foreign currency translation loss. This charge is included in the Net (gains) losses on sales and impairments of businesses in the accompanying condensed consolidated statement of operations and is included in the results for the Industrial Packaging segment.party.
Temporary Investments
Temporary investments with an original maturity of three months or less and money market funds with greater than three month maturities but with the right to redeem without notices are treated as cash equivalents and are stated at cost. Temporary investments totaled $702$534 million and $1.1 billion$690 million at June 30, 2022March 31, 2023 and December 31, 2021,2022, respectively.
Restricted Cash
A reconciliation of cash and temporary investments and restricted cash in the condensed consolidated balance sheet to cash and temporary investments and restricted cash in the condensed consolidated statement of cash flows for the three months ended March 31, 2023 and 2022, respectively is below.
| | | | | | | | | | | |
| Three Months Ended March 31, |
| In millions | 2023 | | 2022 |
| Cash and Temporary Investments | $ | 636 | | | $ | 1,031 | |
| Restricted Cash | 72 | | | 88 | |
| Total Cash and Temporary Investments and Restricted Cash | $ | 708 | | | $ | 1,119 | |
The Company's restricted cash at March 31, 2023 consists of the cash proceeds from the $72 million first quarter 2023 environmental development bond (EDB) issuance. Proceeds from this debt issuance were used to repay an EDB maturing on April 1, 2023. See Note 15 - Debt for further details regarding the first quarter 2023 EDB issuance and the expected debt repayment.
Accounts and Notes Receivable
| | In millions | In millions | June 30, 2022 | | December 31, 2021 | In millions | March 31, 2023 | | December 31, 2022 |
| Accounts and notes receivable, net: | Accounts and notes receivable, net: | | Accounts and notes receivable, net: | |
| Trade (less allowances of $29 in 2022 and $34 in 2021) | $ | 3,241 | | | $ | 3,027 | | |
| Trade (less allowances of $33 in 2023 and $31 in 2022) | | Trade (less allowances of $33 in 2023 and $31 in 2022) | $ | 2,935 | | | $ | 3,064 | |
| Other | Other | 221 | | | 205 | | Other | 261 | | | 220 | |
| Total | Total | $ | 3,462 | | | $ | 3,232 | | Total | $ | 3,196 | | | $ | 3,284 | |
Inventories
| | In millions | In millions | June 30, 2022 | | December 31, 2021 | In millions | March 31, 2023 | | December 31, 2022 |
| Raw materials | Raw materials | $ | 258 | | | $ | 245 | | Raw materials | $ | 242 | | | $ | 267 | |
| Finished pulp, paper and packaging | Finished pulp, paper and packaging | 1,123 | | | 1,014 | | Finished pulp, paper and packaging | 1,043 | | | 1,071 | |
| Operating supplies | Operating supplies | 460 | | | 486 | | Operating supplies | 583 | | | 516 | |
| Other | Other | 56 | | | 69 | | Other | 71 | | | 88 | |
| Total | Total | $ | 1,897 | | | $ | 1,814 | | Total | $ | 1,939 | | | $ | 1,942 | |
Current Investments
As a result of the 2021 spin-off of Sylvamo, the Company retained 19.9% of the shares of Sylvamo with the intent to monetize its investment and provide additional proceeds to the Company. In Aprilthe second quarter 2022, the Company exchanged 4,132,000 shares of Sylvamo common stock owned by the Company in exchange and as repayment for an approximately $144 million term loan obligation - see Note 17 - Debt for further discussion. This transactionwhich resulted in the reversal of a $31 million deferred tax liability due to the tax-free exchange of the Sylvamo Corporation common stock. After this transaction,In the third quarter 2022, the Company ownsexchanged the remaining 4,614,358 shares, or approximately 10.5% of the shares of Sylvamo common stock.
The Company's investmentstock owned by the Company in Sylvamo was valued at $151exchange for $167 million and $245as partial repayment of a $210 million at June 30, 2022 and December 31, 2021, respectively, and is recorded in Current investmentsterm loan obligation. This also resulted in the accompanying condensed consolidated balance sheet. Thereversal of a $35 million deferred tax liability due to the tax-free exchange of the Sylvamo Corporation common stock. As of the end of the third quarter 2022, the Company is accounting for itsno longer had an ownership interest in Sylvamo at fair value as an investment in equity securities.Sylvamo.
Plants, Properties and Equipment
Accumulated depreciation was $18.0$18.6 billion and $17.6$18.4 billion at June 30, 2022March 31, 2023 and December 31, 2021,2022, respectively. Depreciation expense was $256$232 million and $262$250 million for the three months ended June 30,March 31, 2023 and 2022, and 2021, respectively, and $506 million and $520 million for the six months ended June 30, 2022 and 2021, respectively.
Non-cash additions to plants, properties and equipment included within accounts payable were $66$94 million and $106$185 million at June 30, 2022March 31, 2023 and December 31, 2021,2022, respectively.
Amounts investedThere were no insurance recoveries included within capital spending for the three months ended March 31, 2023. Insurance recoveries included in capital projects inspending were $18 million for the accompanying condensed consolidated statement of cash flows are presented net of insurance recoveries of $25 million received during the sixthree months ended June 30,March 31, 2022.
Accounts Payable
Under a supplier finance program, IP agrees to pay a bank the stated amount of confirmed invoices from its designated suppliers on the original maturity dates of the invoices. IP or the bank may terminate the agreement upon at least 90 days’ notice. The supplier invoices that have been confirmed as valid under the program require payment in full with the payment date not to exceed 180 days past the invoice date. The accounts payable balance included $142 million and $122 million of supplier finance program liabilities as of March 31, 2023 and December 31, 2022, and $4 million received during the six months ended June 30, 2021.respectively.
Interest
Interest payments made during the sixthree months ended June 30,March 31, 2023 and 2022 and 2021 were $165$114 million and $247$56 million, respectively.
Amounts related to interest were as follows:
| | | | Three Months Ended
June 30, | | Six Months Ended
June 30, | | Three Months Ended
March 31, | |
| In millions | In millions | 2022 | | 2021 | | 2022 | | 2021 | In millions | 2023 | | 2022 | |
| Interest expense | Interest expense | $ | 83 | | | $ | 117 | | | $ | 160 | | | $ | 241 | | Interest expense | $ | 103 | | | $ | 77 | | |
| Interest income | Interest income | 9 | | | 31 | | | 17 | | | 62 | | Interest income | 41 | | | 8 | | |
| Capitalized interest costs | Capitalized interest costs | 4 | | | 3 | | | 8 | | | 5 | | Capitalized interest costs | 5 | | | 4 | | |
Asset Retirement Obligations
The Company had recorded liabilities of $107$104 million and $105 million related to asset retirement obligations at June 30, 2022March 31, 2023 and December 31, 2021.
2022, respectively.
International Paper leases various real estate, including certain operating facilities, warehouses, office space and land. The Company also leases material handling equipment, vehicles, and certain other equipment. The Company's leases have a remaining lease term of up to 3130 years. Total lease costs were $64$75 million and $63$60 million for the three months ended June 30,March 31, 2023 and 2022, and 2021, respectively, and $124 million and $123 million for the six months ended June 30, 2022 and 2021, respectively.
Supplemental Balance Sheet Information Related to Leases
| | | | | | | | | | | | | | | | | | | | |
| In millions | | Classification | | June 30, 2022 | | December 31, 2021 |
| Assets | | | | | | |
| Operating lease assets | | Right-of-use assets | | $ | 383 | | | $ | 365 | |
| Finance lease assets | | Plants, properties and equipment, net (a) | | 53 | | | 57 | |
| Total leased assets | | | | $ | 436 | | | $ | 422 | |
| Liabilities | | | | | | |
| Current | | | | | | |
| Operating | | Other current liabilities | | $ | 143 | | | $ | 132 | |
| Finance | | Notes payable and current maturities of long-term debt | | 10 | | | 10 | |
| Noncurrent | | | | | | |
| Operating | | Long-term lease obligations | | 245 | | | 236 | |
| Finance | | Long-term debt | | 52 | | | 56 | |
| Total lease liabilities | | | | $ | 450 | | | $ | 434 | |
| | | | | | | | | | | | | | | | | | | | |
| In millions | | Classification | | March 31, 2023 | | December 31, 2022 |
| Assets | | | | | | |
| Operating lease assets | | Right-of-use assets | | $ | 422 | | | $ | 424 | |
| Finance lease assets | | Plants, properties and equipment, net (a) | | 48 | | | 49 | |
| Total leased assets | | | | $ | 470 | | | $ | 473 | |
| Liabilities | | | | | | |
| Current | | | | | | |
| Operating | | Other current liabilities | | $ | 143 | | | $ | 147 | |
| Finance | | Notes payable and current maturities of long-term debt | | 10 | | | 10 | |
| Noncurrent | | | | | | |
| Operating | | Long-term lease obligations | | 286 | | | 283 | |
| Finance | | Long-term debt | | 47 | | | 49 | |
| Total lease liabilities | | | | $ | 486 | | | $ | 489 | |
(a)Finance leases are recorded net of accumulated amortization of $55$62 million and $51$59 million as of June 30, 2022March 31, 2023 and December 31, 2021,2022, respectively.
The Company accounts for the following investmentsinvestment under the equity method of accounting.
Ilim S.A.
The Company has a 50% equity interest in Ilim S.A. (Ilim), which has subsidiaries, including JSC Ilim Group ("Ilim Group" and together with Ilim, the "Ilim joint venture"), whose primary operations are in Russia. The Company announced in January 2023 that it had entered into an agreement to sell its interest in Ilim to its joint venture partners for $484 million. The completion of the sale is subject to various closing conditions, including the receipt of regulatory approvals in Russia.
The Company also received an indication of interest from its Ilim joint venture partners to purchase all of the Company’s shares (constituting a 2.39% stake) in Ilim Group for $24 million, on terms and conditions to be agreed. The Company intends to pursue an agreement to sell the Ilim Group shares, and to divest other non-material residual interests associated with Ilim, to its Ilim joint venture partners.
In conjunction with the entry into the announced agreement, a determination was made that the book value of the Ilim and Ilim Group investments plus associated cumulative translation losses, exceeded fair value, based upon the agreed upon transaction price for Ilim and the offer price for Ilim Group. As a result, an other than temporary impairment of $43 million and $533 million was recorded in the first quarter of 2023 and fourth quarter of 2022, respectively, to write down these investments to fair value. The impairment charges included approximately $43 million and $375 million of foreign currency cumulative translation adjustment loss in the first quarter of 2023 and fourth quarter of 2022, respectively. As of March 31, 2023, the approximately $418 million of cumulative translation adjustment loss remained within AOCI with the recognition of this loss recorded as an offset to the investment balance.
The Company also evaluated facts and circumstances as of March 31, 2023 and concluded that the held for sale balance sheet classification criteria had been met as of that date and therefore have classified the Ilim joint venture investment balance, net of impairment, as Assets held for sale.
All current and historical results of the Ilim joint venture investment are presented as Discontinued Operations, net of taxes in the consolidated statement of operations. The Company recorded equity earnings, net of taxes, of
$95$43 million and
$101$93 million for the three months ended
June 30,March 31, 2023 and 2022,
and 2021, respectively and $188 million and $150 million for the six months ended June 30, 2022 and 2021, respectively.
Foreign exchange gains and losses, net of tax, included in equity earnings for the three months and six months ended June 30, 2022 were $13 million and $(2) million, respectively. They relate primarily to the re-measurement of receivables, payables and borrowings. JSC Ilim Group ("Ilim Group"), a subsidiary of Ilim, had no U.S. dollar-denominated debt outstanding as of June 30, 2022. The Company received cash dividends from the
Ilim joint venture of
$204$0 million and
$144$204 million during the first
sixthree months of
20222023 and
2021,2022, respectively. At
June 30, 2022March 31, 2023 and December 31,
2021,2022, the Company's investment in
the Ilim
joint venture, which is recorded in
Long-Term InvestmentsAssets held for sale in the condensed consolidated balance sheets, was
$737$90 million and
$557$133 million, respectively, which was
$130$442 million and
$121$403 million, respectively,
morelower than the Company's proportionate share of the
Ilim joint venture's underlying net assets.
The differences primarily relate to currency translation adjustments and the basis difference between the fair value of our investment at acquisition and the underlying net assets. As of June 30, 2022, there was $187 million of cumulative translation adjustment loss included within equity related to our Ilim investment. Prior to the spin-off of the Printing Papers segment on October 1, 2021, the Company was party to a joint marketing agreement with Ilim Group under which the Company purchased, marketed and sold paper produced by Ilim Group. Purchases under this agreement were $42 million and $83 million for the three months and six months ended June 30, 2021, respectively. The joint marketing agreement was conveyed to Sylvamo as part of the spin-off transaction on October 1, 2021. See Note 1 - Basis of Presentation for additional discussion regarding our Ilim investment.
Summarized financial information for the Ilim joint venture is presented in the following tables:
Balance Sheet
| | In millions | In millions | June 30, 2022 | | December 31, 2021 | In millions | March 31, 2023 | | December 31, 2022 |
| Current assets | Current assets | 1,135 | | | $ | 1,010 | | Current assets | $ | 717 | | | $ | 766 | |
| Noncurrent assets | Noncurrent assets | 4,755 | | | 3,145 | | Noncurrent assets | 3,377 | | | 3,663 | |
| Current liabilities | Current liabilities | 2,238 | | | 1,212 | | Current liabilities | 1,365 | | | 1,275 | |
| Noncurrent liabilities | Noncurrent liabilities | 2,391 | | | 2,047 | | Noncurrent liabilities | 1,627 | | | 2,040 | |
| Noncontrolling interests | Noncontrolling interests | 46 | | | 24 | | Noncontrolling interests | 39 | | | 40 | |
Income Statement | | | Three Months Ended
June 30, | | Six Months Ended
June 30, | | Three Months Ended
March 31, | |
| In millions | In millions | 2022 | | 2021 | | 2022 | | 2021 | In millions | 2023 | | 2022 | |
| Net sales | Net sales | $ | 815 | | | $ | 733 | | | $ | 1,522 | | | $ | 1,264 | | Net sales | $ | 622 | | | $ | 707 | | |
| Gross profit | Gross profit | 444 | | | 410 | | | 843 | | | 658 | | Gross profit | 277 | | | 399 | | |
| Income (loss) from continuing operations | Income (loss) from continuing operations | 189 | | | 205 | | | 372 | | | 308 | | Income (loss) from continuing operations | 84 | | | 182 | | |
| Net income (loss) | Net income (loss) | 185 | | | 199 | | | 362 | | | 299 | | Net income (loss) | 80 | | | 177 | | |
The Company's remaining equity method investments are not material.
Goodwill
The following table presents changes in goodwill balances as allocated to each business segment for the six-monthsthree-months ended June 30, 2022:March 31, 2023:
| | In millions | In millions | Industrial
Packaging | | Global Cellulose Fibers | | Total | In millions | Industrial
Packaging | | Global Cellulose Fibers | | Total |
| Balance as of January 1, 2022 | | |
| Balance as of January 1, 2023 | | Balance as of January 1, 2023 | |
| Goodwill | Goodwill | $ | 3,426 | | | $ | 52 | | | $ | 3,478 | | Goodwill | $ | 3,413 | | | $ | 52 | | | $ | 3,465 | |
| Accumulated impairment losses | Accumulated impairment losses | (296) | | | (52) | | | (348) | | Accumulated impairment losses | (372) | | | (52) | | | (424) | |
| | 3,130 | | | — | | | 3,130 | | | 3,041 | | | — | | | 3,041 | |
| Currency translation and other (a) | Currency translation and other (a) | (6) | | | — | | | (6) | | Currency translation and other (a) | 1 | | | — | | | 1 | |
| Goodwill additions/reductions | — | | | — | | | — | | |
| Accumulated impairment loss additions / reductions | Accumulated impairment loss additions / reductions | — | | | — | | | — | | Accumulated impairment loss additions / reductions | — | | | — | | | — | |
| Balance as of June 30, 2022 | | |
| Balance as of March 31, 2023 | | Balance as of March 31, 2023 | |
| Goodwill | Goodwill | 3,420 | | | 52 | | | 3,472 | | Goodwill | 3,414 | | | 52 | | | 3,466 | |
| Accumulated impairment losses | Accumulated impairment losses | (296) | | | (52) | | | (348) | | Accumulated impairment losses | (372) | | | (52) | | | (424) | |
| Total | Total | $ | 3,124 | | | $ | — | | | $ | 3,124 | | Total | 3,042 | | | — | | | 3,042 | |
(a)Represents the effects of foreign currency translations.
Other Intangibles
Identifiable intangible assets are recorded in Deferred Charges and Other Assets in the accompanying condensed consolidated balance sheet and comprised the following:
| | | | June 30, 2022 | | December 31, 2021 | | March 31, 2023 | | December 31, 2022 |
| In millions | In millions | Gross
Carrying
Amount | | Accumulated
Amortization | | Net Intangible Assets | | Gross
Carrying
Amount | | Accumulated
Amortization | | Net Intangible Assets | In millions | Gross
Carrying
Amount | | Accumulated
Amortization | | Net Intangible Assets | | Gross
Carrying
Amount | | Accumulated
Amortization | | Net Intangible Assets |
| Customer relationships and lists | Customer relationships and lists | $ | 490 | | | $ | 288 | | | $ | 202 | | | $ | 493 | | | $ | 273 | | | $ | 220 | | Customer relationships and lists | $ | 492 | | | $ | 312 | | | $ | 180 | | | $ | 490 | | | $ | 303 | | | $ | 187 | |
| Tradenames, patents and trademarks, and developed technology | Tradenames, patents and trademarks, and developed technology | 170 | | | 139 | | | 31 | | | 170 | | | 131 | | | 39 | | Tradenames, patents and trademarks, and developed technology | 170 | | | 148 | | | 22 | | | 170 | | | 146 | | | 24 | |
| Land and water rights | Land and water rights | 8 | | | 2 | | | 6 | | | 8 | | | 2 | | | 6 | | Land and water rights | 8 | | | 2 | | | 6 | | | 8 | | | 2 | | | 6 | |
| Other | Other | 22 | | | 20 | | | 2 | | | 24 | | | 21 | | | 3 | | Other | 21 | | | 18 | | | 3 | | | 23 | | | 20 | | | 3 | |
| Total | Total | $ | 690 | | | $ | 449 | | | $ | 241 | | | $ | 695 | | | $ | 427 | | | $ | 268 | | Total | $ | 691 | | | $ | 480 | | | $ | 211 | | | $ | 691 | | | $ | 471 | | | $ | 220 | |
The Company recognized the following amounts as amortization expense related to intangible assets:
| | | | Three Months Ended
June 30, | | Six Months Ended
June 30, | | Three Months Ended
March 31, | |
| In millions | In millions | 2022 | | 2021 | | 2022 | | 2021 | In millions | 2023 | | 2022 | |
| Amortization expense related to intangible assets | Amortization expense related to intangible assets | $ | 11 | | | $ | 11 | | | $ | 22 | | | $ | 22 | | Amortization expense related to intangible assets | $ | 9 | | | $ | 11 | | |
International Paper made income tax payments, net of refunds, of $150$169 million and $185$20 million for the sixthree months ended June 30,March 31, 2023 and 2022, and 2021, respectively.
The Company currently estimates, that as a result of ongoing discussions, pending tax settlements and expirations of statutes of limitations, the amount of unrecognized tax benefits could be reduced by approximately $15$30 million during the next 12 months.
Guarantees
In connection with sales of businesses, property, equipment, forestlands and other assets, International Paper commonly makes representations and warranties relating to such businesses or assets, and may agree to indemnify buyers with respect to tax and environmental liabilities, breaches of representations and warranties, and other matters. Where liabilities for such matters are determined to be probable and reasonably estimable, accrued liabilities are recorded at the time of sale as a cost of the transaction.
Brazil Goodwill Tax Matter: The Brazilian Federal Revenue Service has challenged the deductibility of goodwill amortization generated in a 2007 acquisition by Sylvamo do Brasil Ltda. ("Sylvamo Brazil"), a wholly-owned subsidiary of the Company, until the October 1, 2021 spin-off of the Printing Papers business after which it became a subsidiary of Sylvamo. Sylvamo Brazil received assessments for the tax years 2007-2015 totaling approximately $114$111 million in tax, and $355$375 million in interest, penalties, and fees as of June 30, 2022March 31, 2023 (adjusted for variation in currency exchange rates). After an initial favorable ruling challenging the basis for these assessments, Sylvamo Brazil received subsequent unfavorable decisions from the Brazilian Administrative Council of Tax Appeals. Sylvamo Brazil has appealed these decisions and intends to appeal any future unfavorable administrative judgments to the Brazilian federal courts; however, this tax litigation matter may take many years to resolve. Sylvamo Brazil and International Paper believe the transaction underlying these assessments was appropriately evaluated, and that Sylvamo Brazil's tax position would be sustained, based on Brazilian tax law.
This matter pertains to a business that was conveyed to Sylvamo as of October 1, 2021, as part of our spin-off transaction. Pursuant to the terms of the tax matters agreement entered into between the Company and Sylvamo, the Company will pay pay 60% and Sylvamo will pay 40%, on up to $300 million of any assessment related to this matter, and the Company will pay all amounts of the assessment over $300 million. Under the terms of the agreement, decisions concerning the conduct of the litigation related to this matter, including strategy, settlement, pursuit and abandonment, will be made by the Company. Sylvamo thus has no control over any decision related to this ongoing litigation. The Company intends to vigorously defend this historic tax position against the current assessments and any similar assessments that may be issued for tax years subsequent to 2015. The Brazilian government may enact a tax amnesty program that would allow Sylvamo Brazil to resolve this dispute for less than the assessed amount. As of October 1, 2021, in connection with the recording of the distribution of assets and liabilities resulting from the spin-off transaction, the Company established a liability representing the initial fair value of the contingent liability under the tax matters agreement. The contingent liability was determined in accordance with ASC 460 "Guarantees" based on the probability weighting of various possible outcomes. The initial fair value estimate and recorded liability as of December 31, 20212022 was $48 million and remains this amount at June 30, 2022.March 31, 2023. This liability will not be increased in subsequent periods unless facts and circumstances change such that an amount greater than the initial recognized liability becomes probable and estimable.
Environmental
The Company has been named as a potentially responsible party (PRP) in environmental remediation actions under various federal and state laws, including the Comprehensive Environmental Response, Compensation and Liability Act (CERCLA). Many of these proceedings involve the cleanup of hazardous substances at large commercial landfills that received waste from many different sources. While joint and several liability is authorized under CERCLA and equivalent state laws, as a practical matter, liability for CERCLA cleanups is typically allocated among the many PRPs. There are other remediation costs typically associated with the cleanup of hazardous substances at the Company’s current, closed orand formerly-owned facilities, and recorded as liabilities in the balance sheet.
Remediation costs are recorded in the consolidated financial statements when they become probable and reasonably estimable. International Paper has estimated the probable liability associated with these environmental remediation matters, including those described herein, to be approximately $198$240 million ($207248 million undiscounted) in the aggregate as of June 30, 2022.March 31, 2023. Other than as described below, completion of required environmental remedial actions is not expected to have a material effect on our consolidated financial statements.
Cass Lake: One of the matters included above arises out of a closed wood-treatment facility located in Cass Lake, Minnesota. In June 2011, the United States Environmental Protection Agency (EPA) selected and published a proposed soil remedy at the site with an estimated cost of $46 million. In April 2020, the EPA issued a final plan concerning clean-up standards at a portion of the site, the estimated cost of which is included within the soil remedy referenced above.
Kalamazoo River: The Company is a PRP with respect to the Allied Paper, Inc./Portage Creek/Kalamazoo River Superfund Site in Michigan. The EPA asserts that the site is contaminated by polychlorinated biphenyls (PCBs) primarily as a result of
discharges from various paper mills located along the Kalamazoo River, including a paper mill formerly owned by St. Regis Paper Company (St. Regis). The Company is a successor in interest to St. Regis.
•Operable Unit 5, Area 1: In March 2016, the Company and other PRPs received a special notice letter from the EPA (i) inviting participation in implementing a remedy for a portion of the site known as Operable Unit 5, Area 1, and (ii) demanding reimbursement of EPA past costs totaling $37 million, including $19 million in past costs previously demanded by the EPA. The Company responded to the special notice letter. In December 2016, the EPA issued a unilateral administrative order to the Company and other PRPs to perform the remedy. The Company responded to the unilateral administrative order, agreeing to comply with the order subject to its sufficient cause defenses.
•Operable Unit 1: In October 2016, the Company and another PRP received a special notice letter from the EPA inviting participation in the remedial design (RD) component of the landfill remedy for the Allied Paper Mill, which is also known as Operable Unit 1. The Record of Decision (ROD) establishing the final landfill remedy for the Allied Paper Mill was issued by the EPA in September 2016. The Company responded to the Allied Paper Mill special notice letter in December 2016. In February 2017, the EPA informed the Company that it would make other arrangements for the performance of the RD. In the summer 2021, remedial design.action (RA) activities were initiated by the EPA. In October 2022, the Company received a unilateral administrative order to perform the RA. As a result, the Company increased its reserve by $27 million in the fourth quarter of 2022. The total reserve for the Kalamazoo River superfund site was $37 million as of March 31, 2023 and December 31, 2022.
In addition, in December 2019, the United States published notice in the Federal Register of a proposed consent decree with NCR Corporation (one of the parties to the allocation/apportionment litigation described below), the State of Michigan and natural resource trustees under which NCR would make payments of more than $100 million and perform work in Operable Unit 5, Areas 2, 3, and 4 at an estimated cost of $136 million. In December 2020, the Federal District Court approved the proposed consent decree.
The Company’s CERCLA liability has not been finally determined with respect to these or any other portions of the site, and except as noted above, the Company has declined to perform any work or reimburse the EPA at this time. As noted below, the Company is involved in allocation/apportionment litigation with regard to the site. Accordingly, it is premature to predict the outcome or estimate our maximum reasonably possible loss or range of loss with respect to this site. We have recorded a liability for future remediation costs at the site that are probable and reasonably estimable, and it remains reasonably possible that additional losses in excess of this recorded liability could be material.
The Company was named as a defendant by Georgia-Pacific Consumer Products LP, Fort James Corporation and Georgia Pacific LLC (collectively, GP) in a contribution and cost recovery action for alleged pollution at the site. NCR Corporation and Weyerhaeuser Company are also named as defendants in the suit. The suit seeks contribution under CERCLA for costs purportedly expended by plaintiffs ($79 million as of the filing of the complaint) and for future remediation costs. In June 2018, the Court issued its Final Judgment and Order, which fixed the past cost amount at approximately $50 million (plus interest to be determined) and allocated to the Company a 15% share of responsibility for those past costs. The Court did not address responsibility for future costs in its decision. In July 2018, the Company and each of the other parties filed notices appealing the Final Judgment and prior orders incorporated into that Judgment. On April 25, 2022, the appellate court reversed the Judgment of the Court, finding that the suit againstagainst the Company was time-barred by the applicable statute of limitations. On May 9, 2022, GP filed a petition for remaining with the Sixth Circuit Court of Appeals. The Sixth Circuit issued an order denying GP's petition on July 14, 2022. On November 14, 2022, GP filed a petition for writ of certiorari with the U.S. Supreme Court. The Company has filed a brief in opposition to this writ.
Harris County: International Paper and McGinnis Industrial Maintenance Corporation (MIMC), a subsidiary of Waste Management, Inc. (WMI), are PRPs at the San Jacinto River Waste Pits Superfund Site in Harris County, Texas. The PRPs have been actively participating in the activities at the site and share the costs of these activities.
In October 2017, the EPA issued a ROD selecting the final remedy for the site: removal and relocation of the waste material from both the northern and southern impoundments. The EPA did not specify the methods or practices needed to perform this work. The EPA’s selected remedy was accompanied by a cost estimate of approximately $115 million ($105 million for the northern impoundment, and $10 million for the southern impoundment). Subsequent to the issuance of the ROD, there have been numerous meetings between the EPA and the PRPs, and the Company continues to work with the EPA and MIMC/WMI to develop the remedial design.
To this end, in April 2018, the PRPs entered into an Administrative Order on Consent (AOC) with the EPA, agreeing to work together to develop the remedial design for the northern impoundment. That remedial design work is ongoing. The AOC does
not include any agreement to perform waste removal or other construction activity at the site. Rather, it involves adaptive management techniques and a pre-design investigation, the objectives of which include filling data gaps (including but not limited to post-Hurricane Harvey technical data generated prior to the ROD and not incorporated into the selected remedy), refining areas and volumes of materials to be addressed, determining if an excavation remedy is able to be implemented in a manner protective of human health and the environment, and investigating potential impacts of remediation activities to infrastructure in the vicinity.
During the first quarter of 2020, through a series of meetings among the Company, MIMC/WMI, our consultants, the EPA and the Texas Commission on Environmental Quality (TCEQ), progress was made to resolve key technical issues previously preventing the Company from determining the manner in which the selected remedy for the northern impoundment would be feasibly implemented. As a result of these developments, the Company reserved the following amounts in relation to remediation at this site: (a) $10 million for the southern impoundment; and (b) $55 million for the northern impoundment, which represents the Company's 50% share of our estimate of the low end of the range of probable remediation costs.
We submitted the Final Design Package for the southern impoundment to the EPA, and the EPA approved this plan May 7, 2021. The EPA issued a Unilateral Administrative Order for Remedial Action of the southern impoundment on August 5, 2021. An addendum to the Final 100% Remedial Design (Amended April 2021) was submitted to the EPA for the southern impoundment on June 2, 2022. This addendum incorporated additional data collected to date which indicated that additional waste material removal will be required, lengthening the time to complete the remedial action. This resulted in the Company increasing its reserve by $15 million for a total reserve of $22 million as of June 30, 2022.
With respect to the northern impoundment, althoughthe respondents submitted final component of the 90% remedial design to the EPA on November 8, 2022. Upon submittal of the final component, an updated engineering estimate was developed and the Company increased the reserved amount by approximately $21 million, which represents the Company's 50% share of our estimate of the low end of the range of probable remediation costs. While several key technical issues have been resolved, werespondents still face significant challenges remediating this area in a cost-efficient manner and without a release to the environment, and therefore our discussions with the EPA on the best approach to remediation will continue. Because of ongoing questions regarding cost effectiveness, timing and gathering other technical data, additional losses in excess of our recorded liability are possible. We are currently unable to reasonably estimate any further adjustment to our recorded liability or any loss or rangeThe total reserve for the southern and northern impoundment was $95 million as of loss in excess of such liability; however, we believe it is unlikely any adjustment would be material.both March 31, 2023 and December 31, 2022.
Asbestos-Related Matters
We have been named as a defendant in various asbestos-related personal injury litigation, in both state and federal court, primarily in relation to the prior operations of certain companies previously acquired by the Company. As of June 30, 2022, theThe Company's total recorded liability with respect to pending and future asbestos-related claims was $106$107 million, net of estimated insurance recoveries.recoveries and $105 million, net of estimated insurance recoveries as of March 31, 2023 and December 31, 2022, respectively. While it is reasonably possible that the Company may incur losses in excess of its recorded liability with respect to asbestos-related matters, we are unable to estimate any loss or range of loss in excess of such liability, and do not believe additional material losses are probable.
Antitrust
In March 2017, the Italian Competition Authority (ICA) commenced an investigation into the Italian packaging industry to determine whether producers of corrugated sheets and boxes violated the applicable European competition law. In April 2019, the ICA concluded its investigation and issued initial findings alleging that over 30 producers, including our Italian packaging subsidiary (IP Italy), improperly coordinated the production and sale of corrugated sheets and boxes. OnIn August 6, 2019, the ICA issued its decision and assessed IP Italy a fine of €29 million (approximately $32$31 million at currentthe then-current exchange rates) which was recorded in the third quarter of 2019. We appealed the ICA decision and our appeal was denied onin May 25, 2021. However, we continue to believe we have numerous and strong bases to challenge the ICA decision, and we haveWe further appealed the decision to the Italian Council of State.State, and in March 2023 the Council of State largely upheld the ICA’s findings, but referred the calculation of IP Italy’s fine back to the ICA, finding that it was disproportionately high based on the conduct found. We are evaluating whether to further appeal the Italian Council of State decision to uphold the ICA’s findings. The Company and other producers also have been named in lawsuits, and we have received other claims, by a number of customers in Italy for damages associated with the alleged anticompetitive conduct. We do not believe material losses arising from such private lawsuits and claims are probable.
General
The Company is involved in various other inquiries, administrative proceedings and litigation relating to environmental and safety matters, personal injury, product liability, labor and employment, contracts, sales of property, intellectual property, tax, and other matters, some of which allege substantial monetary damages. Assessments of lawsuits and claims can involve a series of complex judgments about future events, can rely heavily on estimates and assumptions, and are otherwise subject to significant uncertainties. As a result, there can be no certainty that the Company will not ultimately incur charges in excess of presently recorded liabilities. The Company believes that loss contingencies arising from pending matters including the matters described herein, will not have a material effect on the consolidated financial position or liquidity of the Company. However, in light of the inherent uncertainties involved in pending or threatened legal matters, some of which are beyond the Company's control, and the large or indeterminate damages sought in some of these matters, a future adverse ruling, settlement, unfavorable development, or increase in accruals with respect to these matters could result in future charges that could be material to the Company's results of operations or cash flows in any particular reporting period.
Variable Interest Entities
As of June 30, 2022,March 31, 2023, the fair value of the Timber Notes and Extension Loans for the 2007 Financing Entities was $2.3 billion and $2.1 billion, respectively. The Timber Notes and Extension Loans are classified as Level 2 within the fair value hierarchy, which is further defined in Note 171 in the Company’s Annual Report.
The Timber Notes of $2.3 billion and the Extension Loans of $2.1 billion both mature in 2027 and are shown in Long-term nonrecourse financial assets of variable interest entities and Long-term nonrecourse financial liabilities of variable interest entities, respectively, on the accompanying condensed consolidated balance sheet.
Activity between the Company and the 2007 Financing Entities was as follows:
| | | Three Months Ended
June 30, | | Six Months Ended
June 30, | | Three Months Ended
March 31, | |
| In millions | In millions | 2022 | | 2021 | | 2022 | | 2021 | In millions | 2023 | | 2022 | |
| Revenue (a) | Revenue (a) | $ | 6 | | | $ | 6 | | | $ | 13 | | | $ | 13 | | Revenue (a) | $ | 33 | | | $ | 7 | | |
| Expense (b) | Expense (b) | 10 | | | 6 | | | 16 | | | 12 | | Expense (b) | 31 | | | 6 | | |
| Cash receipts (c) | Cash receipts (c) | 2 | | | 1 | | | 3 | | | 3 | | Cash receipts (c) | 27 | | | 1 | | |
| Cash payments (d) | Cash payments (d) | 6 | | | 4 | | | 10 | | | 8 | | Cash payments (d) | 27 | | | 4 | | |
(a)The revenue is included in Interest expense, net in the accompanying statement of operations and includes approximately $4$5 million and $9$5 million for the three months and sixthree months ended June 30,March 31, 2023 and 2022, and 2021, respectively, of accretion income for the amortization of the basis difference adjustment on the Financial assets of special purpose entities.
(b)The expense is included in Interest expense, net in the accompanying statement of operations and includes approximately $1$2 million and $3$2 million for the three months and sixthree months ended June 30,March 31, 2023 and 2022, and 2021, respectively, of accretion expense for the amortization of the basis difference adjustment on the Nonrecourse financial liabilities of special purpose entities.
(c)The cash receipts are interest received on the Financial assets of special purpose entities.
(d)The cash payments are interest paid on Nonrecourse financial liabilities of special purpose entities.
In August 2021,On September 2, 2022, the Timber Notes of $4.8 billionCompany and the Extension LoansInternal Revenue Service agreed to settle the previously disclosed timber monetization restructuring tax matter involving wholly-owned, special purpose entities (the "2015 Financing Entities"). Under this agreement, the Company will fully resolve the matter and pay $252 million in U.S. federal income taxes. As a result, interest will also be charged upon closing of $4.2 billion related tothe audit. The amount of interest expense recognized in 2022 was $58 million. As of March 31, 2023, $252 million in U.S. federal income taxes and $58 million in interest expense have been paid as a result of the settlement agreement. The Company paid $163 million in U.S. federal income taxes and $30 million in interest during the first quarter of 2023 and has now fully satisfied the payment terms of the settlement agreement regarding the 2015 Financing Entities both matured. We settled the Extension Loans at their maturity with the proceeds from the Timber Notes. This resulted in cash proceeds of approximately $630 million representing our equity in the variable interest entities. Maturitytimber monetization restructuring tax matter. The reversal of the installment notes and termination of the monetization structure also resulted in a $72 million tax liability that was paid in the fourth quarter of 2021.
As of June 30, 2022, the Company'sCompany’s remaining deferred tax liability associated with the 2015 Financing Entities of $604 million was $813 million. The 2015 timber monetization restructuring is currently under examination byrecognized as a one-time tax benefit in the Internal Revenue Service (IRS). During the secondthird quarter of 2022, the Company entered into a voluntary mediation program with the IRS which could accelerate the resolution of this matter. The ultimate outcome of the IRS’s examination remains uncertain; however, an unfavorable resolution in such current examination, future administrative procedures, or future tax litigation could result in material, accelerated cash tax payments as a result of all or a portion of deferred tax liability becoming payable.2022.
Activity between the Company and the 2015 Financing Entities for the three months and six months ended June 30, 2021 was as follows:
| | | | | | | | | | | |
| In millions | Three Months Ended June 30, 2021 | | Six Months Ended June 30, 2021 |
| Revenue (a) | $ | 23 | | | $ | 47 | |
| Expense (a) | 13 | | | 26 | |
| Cash receipts (b) | — | | | 47 | |
| Cash payments (c) | — | | | 14 | |
(a)The revenue and expense are included in Interest expense, net in the accompanying statement of operations.
(b)The cash receipts are interest received on the Financial assets of special purpose entities.
(c)The cash payments represent interest paid on Nonrecourse financial liabilities of special purpose entities.
The borrowing capacity of the Company's commercial paper program is $1.0 billion supported by its $1.5 billion credit agreement. Under the terms of the program, individual maturities on borrowings may vary, but not exceed one year from the date of issue. Interest bearing notes may be issued either as fixed or floating rate notes. As of June 30, 2022,March 31, 2023, the Company had no borrowings outstanding under the program.
At June 30, 2022,March 31, 2023, International Paper’s credit facilities totaled $2.0$2 billion. The Agreements generally provide for interest rates at a floating rate index plus a pre-determined margin dependent upon International Paper’s credit rating. The Agreements include a $1.5 billion contractually committed bank facility with a maturity date of June 2026. The liquidity facilities also previously included up to $550$500 million of uncommitted financings based on eligible receivables balances under a receivables securitization program that had an expiration date in April 2022. The receivables securitization program was renewed on April 27, 2022 with up to $500 million of uncommitted financings based on eligible receivables balances with the expiration dateexpires in April 2024. At June 30, 2022,March 31, 2023, there were no borrowings outstanding under either the bank facility or receivables securitization program.
During the first quarter of 2022,2023, the Company entered into a variable term loan agreement providing for a $600 million term loan which was fully drawn on the date of such loan agreement and matures in 2028. The $600 million debt was issued following the repayment of $410 million of commercial paper earlier in 2023 and will be used to repay debt maturing later in 2023 and general corporate purposes. Additionally during the first quarter of 2023, the Company issued an approximately $88$72 million of debtEDB with an interest rate of 2.65%4.00% and a maturity date of 2037.April 1, 2026. The proceeds from this issuance were used to repay an approximately $88$72 million of outstanding debtEDB that matured on April 1, 2022.
During the second quarter of 2022, the Company borrowed approximately $144 million under a term loan credit agreement with a third party lender. Subsequently, the Company exchanged 4,132,000 shares of Sylvamo common stock owned by the Company in exchange and as repayment of the approximately $144 million term loan obligation. In addition to debt activity noted above, the Company had debt reductions of $11 million during the first six months of 2022 related primarily to open market debt repurchases, and decreases in the amount of capital leases and international debt.2023.
The Company’s financial covenants require the maintenance of a minimum net worth, as defined in our debt agreements, of $9 billion and a total debt-to-capital ratio of less than 60%. Net worth is defined as the sum of common stock, paid-in capital and retained earnings, less treasury stock plus any cumulative goodwill impairment charges. The calculation also excludes accumulated other comprehensive income/loss and both the current and long-term Nonrecourse Financial Liabilities of Variable Interest Entities. The total debt-to-capital ratio is defined as total debt divided by the sum of total debt plus net worth. As of June 30, 2022,March 31, 2023, we were in compliance with our debt covenants.
At June 30, 2022,March 31, 2023, the fair value of International Paper’s $5.6$5.8 billion of debt was approximately $5.5$5.6 billion. The fair value of the Company’s long-term debt is estimated based on the quoted market prices for the same or similar issues. International Paper’s long-term debt is classified as Level 2 within the fair value hierarchy, which is further defined in Note 171 in the Company’s Annual Report.
As a multinational company, International Paper is exposed to market risks, such as changes in interest rates, currency exchange rates and commodity prices.
The notional amounts of qualifying and non-qualifying financial instruments used in hedging transactions were as follows:
| | | | | | | | | | | |
| In millions | June 30, 2022 | | December 31, 2021 |
| | | |
| | | |
| | | |
| | | |
| | | |
| | | |
| Derivatives Not Designated as Hedging Instruments: | | | |
| Electricity contract (MWh) | 0.4 | | | 0.5 | |
| | | |
| | | |
| | | |
The following table shows gains or losses recognized in AOCI, net of tax, related to derivative instruments:
| | | | | | | | | | | | | | | | | | | | | | | |
| | Gain (Loss) Recognized in AOCI on Derivatives (Effective Portion) |
| | Three Months Ended
June 30, | | Six Months Ended
June 30, |
| In millions | 2022 | | 2021 | | 2022 | | 2021 |
| Derivatives in Cash Flow Hedging Relationships: | | | | | | | |
| Foreign exchange contracts | $ | — | | | $ | 13 | | | $ | — | | | $ | 7 | |
| Total | $ | — | | | $ | 13 | | | $ | — | | | $ | 7 | |
| Derivatives in Net Investment Hedging Relationships: | | | | | | | |
| Foreign exchange contracts | $ | — | | | $ | (5) | | | $ | — | | | $ | 12 | |
| Total | $ | — | | | $ | (5) | | | $ | — | | | $ | 12 | |
During the next 12 months, the amount of the June 30, 2022 AOCI balance, after tax, that is expected to be reclassified to earnings is a loss of $1 million.
The amounts of gains and losses recognized in the statement of operations on qualifying and non-qualifying financial instruments used in hedging transactions were as follows:
| | | | | | | | | | | | | | | | | | | | | | | | | | | | | |
| | Gain (Loss) Reclassified from AOCI Into Income (Effective Portion) | | Location of Gain (Loss)
Reclassified from AOCI
(Effective Portion) |
| | Three Months Ended
June 30, | | Six Months Ended
June 30, | | |
| In millions | 2022 | | 2021 | | 2022 | | 2021 | | |
| Derivatives in Cash Flow Hedging Relationships: | | | | | | | | | |
| Foreign exchange contracts | $ | — | | | $ | 4 | | | $ | — | | | $ | 1 | | | Discontinued operations, net of taxes |
| Total | $ | — | | | $ | 4 | | | $ | — | | | $ | 1 | | | |
| | | | | | | | | | | | | | | | | | | | | | | | | | | | | |
| | Gain (Loss) Recognized in Income | | Location of Gain (Loss)
In
Statement
of Operations |
| | Three Months Ended
June 30, | | Six Months Ended
June 30, | | |
| In millions | 2022 | | 2021 | | 2022 | | 2021 | | |
| Derivatives Not Designated as Hedging Instruments: | | | | | | | | | |
| Electricity contract | $ | 3 | | | $ | 5 | | | $ | 11 | | | $ | 7 | | | Cost of products sold |
| Foreign exchange contracts | — | | | (6) | | | — | | | (6) | | | Cost of products sold |
| Total | $ | 3 | | | $ | (1) | | | $ | 11 | | | $ | 1 | | | |
Fair Value Measurements
The Company has not changed its valuation techniques for measuring the fair value of any financial assets or liabilities during the year. Transfers between levels, if any, are recognized at the end of the reporting period.
The following table provides a summary of the impact of our derivative instruments in the balance sheet:
Fair Value Measurements
Level 2 – Significant Other Observable Inputs
| | | | | | | | | | | | | | |
| | Assets | |
| In millions | June 30, 2022 | | December 31, 2021 | |
| | | | |
| | | | |
| | | | |
| | | | |
| | | | |
| | | | |
| Derivatives not designated as hedging instruments | | | | |
| Electricity contract | $ | 18 | | | $ | 10 | | |
| | | | |
| | | | |
| Total derivatives | $ | 18 | | (a) | $ | 10 | | (b) |
(a)Includes $13 million recorded in Other current assets and $5 million recorded in Deferred charges and other assets in the accompanying condensed consolidated balance sheet.
(b)Includes $6 million recorded in Other current assets and $4 million recorded in Deferred charges and other assets in the accompanying condensed consolidated balance sheet.
The above contracts are subject to enforceable master netting arrangements that provide rights of offset with each counterparty when amounts are payable on the same date in the same currency or in the case of certain specified defaults. Management has made an accounting policy election to not offset the fair value of recognized derivative assets and derivative liabilities in the balance sheet. The amounts owed to the counterparties and owed to the Company are considered immaterial with respect to each counterparty and in the aggregate with all counterparties.
International Paper sponsors and maintains the Retirement Plan of International Paper Company (the Pension Plan)"Pension Plan"), a tax-qualified defined benefit pension plan that provides retirement benefits to substantially all hourly and union employees who work at a participating business unit. The Pension Plan was frozen as of January 1, 2019 for salaried participants.
The Pension Plan provides defined pension benefits based on years of credited service and either final average earnings (salaried employees and hourly employees receiving salaried benefits), hourly job rates or specified benefit rates (hourly and union employees).
Net periodic pension expense (income) for our qualified and nonqualified U.S. defined benefit plans comprised the following:
| | | | Three Months Ended
June 30, | | Six Months Ended
June 30, | | Three Months Ended
March 31, | |
| In millions | In millions | 2022 | | 2021 | | 2022 | | 2021 | In millions | 2023 | | 2022 | |
| Service cost | Service cost | $ | 20 | | | $ | 25 | | | $ | 43 | | | $ | 52 | | Service cost | $ | 12 | | | $ | 23 | | |
| Interest cost | Interest cost | 85 | | | 84 | | | 169 | | | 167 | | Interest cost | 116 | | | 84 | | |
| Expected return on plan assets | Expected return on plan assets | (163) | | | (183) | | | (325) | | | (366) | | Expected return on plan assets | (132) | | | (162) | | |
| Actuarial loss | Actuarial loss | 23 | | | 40 | | | 44 | | | 79 | | Actuarial loss | 24 | | | 21 | | |
| Amortization of prior service cost | Amortization of prior service cost | 5 | | | 5 | | | 11 | | | 11 | | Amortization of prior service cost | 6 | | | 6 | | |
| Net periodic pension expense (income) | Net periodic pension expense (income) | $ | (30) | | | $ | (29) | | | $ | (58) | | | $ | (57) | | Net periodic pension expense (income) | $ | 26 | | | $ | (28) | | |
The components of net periodic pension expense (income) other than the Service cost component are included in Non-operating pension expense (income) in the Condensed Consolidated Statement of Operations.
The Company’s funding policy for our pension plans is to contribute amounts sufficient to meet legal funding requirements, plus any additional amounts that the Company may determine to be appropriate considering the funded status of the plan, tax deductibility, the cash flows generated by the Company, and other factors. The Company made no voluntary cash contributions to the qualified pension plan in the first sixthree months of 20222023 or 2021.2022. The nonqualified defined benefit plans are funded to the extent of benefit payments, which totaled $11$5 million for the sixthree months ended June 30, 2022.March 31, 2023.
The Company has an Incentive Compensation Plan (ICP) which is administered by the Management Development and Compensation Committee of the Board of Directors (the Committee). The ICP authorizes the grants of restricted stock, restricted or deferred stock units, performance awards payable in cash or stock upon the attainment of specified performance goals, dividend equivalents, stock options, stock appreciation rights, other stock-based awards and cash-based awards at the discretion of the Committee. As of June 30, 2022, 7.3March 31, 2023, 5.5 million shares were available for grant under the ICP.
Stock-based compensation expense and related income tax benefits were as follows:
| | | | Three Months Ended
June 30, | | Six Months Ended
June 30, | | Three Months Ended
March 31, | |
| In millions | In millions | 2022 | | 2021 | | 2022 | | 2021 | In millions | 2023 | | 2022 | |
| Total stock-based compensation expense (selling and administrative) | Total stock-based compensation expense (selling and administrative) | $ | 6 | | | $ | 47 | | | $ | 72 | | | $ | 61 | | Total stock-based compensation expense (selling and administrative) | $ | 34 | | | $ | 66 | | |
| Income tax benefits related to stock-based compensation | Income tax benefits related to stock-based compensation | 1 | | | (2) | | | 13 | | | 15 | | Income tax benefits related to stock-based compensation | 11 | | | 12 | | |
At June 30, 2022, $143March 31, 2023, $174 million, net of estimated forfeitures, of compensation cost related to unvested restricted performancetime-based and performance-based shares, executive continuity awards and restricted stock attributable to future service had not yet been recognized. This amount will be recognized in expense over a weighted-average period of 2.01.7 years.
Performance ShareLong-Term Incentive Plan
During the first sixthree months of 2022,2023, the Company granted 1.91.6 million performance units at an average grant date fair value of $50.32.$37.83 and 1.3 million time-based units at an average grant date fair value of $34.63.
International Paper’s business segments, Industrial Packaging and Global Cellulose Fibers, are consistent with the internal structure used to manage these businesses. AllBoth segments are differentiated on a common product, common customer basis consistent with the business segmentation generally used in the Forest Products industry. On October 1, 2021, the Company completed the previously announced spin-off of its Printing Papers business into a new, publicly-traded company, Sylvamo, listed on the New York Stock Exchange. Additionally, on August 6, 2021, the Company completed the sale of its Kwidzyn, Poland mill which included the pulp and paper mill in Kwidzyn and supporting functions. As a result of the Sylvamo spin-off and the sale of Kwidzyn, the Company no longer has a Printing Papers segment, and all prior year amounts have been adjusted to reflect the Sylvamo and Kwidzyn businesses as a discontinued operation.
Business segment operating profits are used by International Paper's management to measure the earnings performance of its businesses. Management believes that this measure allows a better understanding of trends in costs, operating efficiencies, prices and volumes. Business segment operating profits are defined as earnings (loss) from continuing operations before income taxes and equity earnings, but including the impact of noncontrolling interests,less than wholly owned subsidiaries, and excluding interest expense, net, corporate expenses, net, corporate net special items, business net special items and non-operating pension expense.
Net sales by business segment for the three months ended March 31, 2023 and six months ended June 30, 2022 and 2021 were as follows:
| | | | Three Months Ended
June 30, | | Six Months Ended
June 30, | | Three Months Ended
March 31, | |
| In millions | In millions | 2022 | | 2021 | | 2022 | | 2021 | In millions | 2023 | | 2022 | |
| Industrial Packaging | Industrial Packaging | $ | 4,491 | | | $ | 4,030 | | | $ | 8,897 | | | $ | 7,960 | | Industrial Packaging | $ | 4,083 | | | $ | 4,406 | | |
| Global Cellulose Fibers | Global Cellulose Fibers | 788 | | | 680 | | | 1,498 | | | 1,275 | | Global Cellulose Fibers | 811 | | | 710 | | |
| Corporate and Intersegment Sales | Corporate and Intersegment Sales | 110 | | | 60 | | | 231 | | | 128 | | Corporate and Intersegment Sales | 126 | | | 121 | | |
| Net Sales | Net Sales | $ | 5,389 | | | $ | 4,770 | | | $ | 10,626 | | | $ | 9,363 | | Net Sales | $ | 5,020 | | | $ | 5,237 | | |
Operating profit (loss) by business segment for the three months ended March 31, 2023 and six months ended June 30, 2022 and 2021 were as follows:
| | | | Three Months Ended
June 30, | | Six Months Ended
June 30, | | Three Months Ended
March 31, | |
| In millions | In millions | 2022 | | 2021 | | 2022 | | 2021 | In millions | 2023 | | 2022 | |
| Industrial Packaging | Industrial Packaging | $ | 560 | | | $ | 389 | | | $ | 957 | | | $ | 810 | | Industrial Packaging | $ | 322 | | | $ | 397 | | |
| Global Cellulose Fibers | Global Cellulose Fibers | 25 | | | 1 | | | (24) | | | (80) | | Global Cellulose Fibers | (16) | | | (49) | | |
| Business Segment Operating Profits | Business Segment Operating Profits | $ | 585 | | | 390 | | $ | 933 | | | 730 | Business Segment Operating Profits | $ | 306 | | | 348 | |
| | Earnings (loss) from continuing operations before income taxes and equity earnings | Earnings (loss) from continuing operations before income taxes and equity earnings | $ | 514 | | | $ | 252 | | | $ | 876 | | | $ | 558 | | Earnings (loss) from continuing operations before income taxes and equity earnings | $ | 221 | | | $ | 362 | | |
| Interest expense, net | Interest expense, net | 74 | | | 86 | | | 143 | | | 179 | | Interest expense, net | 62 | | | 69 | | |
| Noncontrolling interests adjustment | (1) | | | (1) | | | (1) | | | (2) | | |
| Corporate expenses, net | Corporate expenses, net | 27 | | | 36 | | | 39 | | | 72 | | Corporate expenses, net | 8 | | | 12 | | |
| Corporate net special items | Corporate net special items | 18 | | | 77 | | | (28) | | | 21 | | Corporate net special items | — | | | (46) | | |
| Business net special items | — | | | (9) | | | — | | | 5 | | |
| Non-operating pension expense (income) | Non-operating pension expense (income) | (47) | | | (51) | | | (96) | | | (103) | | Non-operating pension expense (income) | 15 | | | (49) | | |
| Business Segment Operating Profits | Business Segment Operating Profits | $ | 585 | | | $ | 390 | | | $ | 933 | | | $ | 730 | | Business Segment Operating Profits | $ | 306 | | | $ | 348 | | |
The following discussion and analysis of our financial condition and results of operations should be read in conjunction with our condensed consolidated financial statements and related notes included in "Financial Statements and Supplementary Data" of this Quarterly Report on Form 10-Q (this "Form 10-Q") and the Company's Annual Report on Form 10-K for the year ended December 31, 20212022 (our "Annual Report"). In addition to historical consolidated financial information, the following discussion contains forward-looking statements that reflect our plans, estimates, and beliefs that involve significant risks and uncertainties. Our actual results could differ materially from those discussed in the forward-looking statements. Factors that could cause or contribute to those differences include those discussed below and in our Annual Report, particularly under "Risk Factors" and "Forward-Looking Statements" of this Form 10-Q and our Annual Report.
EXECUTIVE SUMMARY
Net earnings (loss) attributable to the Company's common shareholders were $511$172 million ($1.380.49 per diluted share) in the secondfirst quarter of 2023, compared with $(318) million ($(0.90) per diluted share) in the fourth quarter of 2022 compared withand $360 million ($0.95 per diluted share) in the first quarter of 2022 and $432 million ($1.09 per diluted share) in the second quarter of 2021.2022. The Company generated Adjusted operating earnings attributable to its common shareholders (a non-GAAP measure defined below) of $459$185 million ($1.24 per diluted share) in the second quarter of 2022, compared with $288 million ($0.760.53 per diluted share) in the first quarter of 2022 and $3252023, compared with $309 million ($0.820.87 per diluted share) in the second quarter of 2021.
During the second quarter 2022, we delivered strong revenue and earnings growth through continued strong price realization and solid operating performance, overcoming higher than expected input costs. Our mills and converting system performed well as we managed through continued logistics constraints which negatively impacted operating costs. We successfully executed our second highest maintenance outagefourth quarter of 2022 and have completed approximately 65% of full-year planned maintenance outages$195 million ($0.51 per diluted share) in the first halfquarter of 2022. Demand for our products
International Paper’s first quarter 2023 earnings reflect solid performance in the second quarter was impacted by a shift in consumer spending from goods to services, while the retail channel managed through elevated inventory levels. Additionally, our businesses continued to manage throughface of a challenging supply chain and labormacroeconomic environment. We continued to make progress onDuring the quarter, we delivered $65 million of year-over-year incremental earnings benefit from our Building a Better IP initiatives, generating approximately $65 millioninitiatives. Additionally, our mill system continued to perform well as we successfully executed our highest planned maintenance outage quarter of earnings benefit2023. As we entered 2023, we recognized there were macroeconomic uncertainties ahead of us and that our businesses are not immune to these risks. These macro trends shifted in the latter half of the first quarter 2023 resulting in a weaker demand environment as our customers and the broader supply chain worked through elevated inventories of their products. We also believe inflationary pressure, rising interest rates and the pull forward of goods during the pandemic are weighing on consumers resulting in lower demand for our products as consumer priorities remain focused on non-discretionary goods and services in the near term. Margins were also under pressure from lower prices across our portfolio, partially offset by lower input costs. Our customers and the broader supply chain continued to work through elevated inventories of their products which has constrained demand. While we believe most of the destocking through the retail chain has been resolved, it continues throughout the rest of the supply chain, especially our manufacturer customers. We believe this will run its course through the second quarter, resulting in an improved demand environment in the second quarter for a total of $105 million through the first half of the year. We expect these initiatives to significantly lower our cost structure and accelerate profitable growth with the potential to generate $225 million of full-year 2022 benefit. With respect to2023. Regarding capital allocation in the secondfirst quarter 2023, we returned $565$319 million to shareholders through dividends of $170 million and approximately $395shareowners, including $157 million of share repurchases. InDuring the first half of 2022, we have returned $1.1 billion to shareowners, highlighting the opportunities that our strong balance sheetquarter 2023, cash from operations was $345 million and free cash generation providesflow was $4 million. First quarter cash from operations and free cash flow included a $193 million final payment to the Company.IRS for the timber monetization restructuring settlement. Finally, the Company continues to actively explore strategic options with respect to the sale of our interest in the Ilim joint venture, includingwe made good progress in the quarter toward the completion of the sale, with the buyers receiving an important required approval from a sale of our 50% interest.Russian commission overseeing exits by foreign companies, but we are still awaiting approval from the Russian competition authority. We are optimistic this approval will be received soon and we plan to close shortly thereafter.
Comparing our performance in the secondfirst quarter 20222023 to the firstfourth quarter 2022, price and mix significantly improved, driven by realization of our prior price increasewas lower in our North American Industrial Packaging business as well as price realization from prior increasesdue to index movements and lower export prices. Price in our Global Cellulose Fibers business. Volumes werebusiness was relatively flat as the earnings benefit from contract restructuring was offset by unfavorable mix as a result of lower absorbent pulp shipments and prior index movements. Volume in our North American Industrial Packaging business while on-goingwas flat as weaker demand and customer inventory destocking was offset by four additional shipping constraints continued to impactdays in the first quarter 2023. Volume in our Global Cellulose Fibers business.business was similarly impacted by customer inventory destocking in addition to the negative volume impact from the Chinese new year. Operations and costs improved sequentially for both business segments aswere higher in our North American Industrial Packaging and Global Cellulose Fibers businesses, in spite of the mills and converting system performed well. Operations and costs also benefited from an insurance recovery associated withrunning well, on the Prattville mill along withnon-repeat of favorable one-time items from the fourth quarter 2022 associated with lower employee benefits costs, workers’ compensation costs and medical claims. Additionally, our Global Cellulose Fibers business was impacted by higher economic downtime due in large part to the lower benefit costs.demand environment. Maintenance outages were sequentially lower in both business segments coming off ofhigher as the first quarter 2023 represents the highest planned maintenance outage quarter of 2022.in 2023. Input costs were sequentially unfavorablesignificantly lower in both business segments, driven by higherlower energy, chemicalsfreight and distributionrecovered fiber costs. Elevated diesel fuel and natural gas costs were primary drivers of the increased inputs costs which continue to be a significant headwind across our business segments.
Looking ahead to the thirdsecond quarter 2022,2023, as compared to the secondfirst quarter 2022,2023, in our Industrial Packaging business, we expect higher price and mix onto be lower primarily due to prior index movements along with lower prices in the continued flow-through of previous price increases in North America.export market to date. Volume is expected to improve onbe seasonally higher in North America, partially offset by one moreless shipping day. Operations and costs are expected to be higher ondue to the non-repeattiming of spending in the Prattville insurance recovery as well as the non-repeat of the favorable one-time items.second quarter 2023. Maintenance outage expense is expected to be lower coming off
decrease relative to the first quarter 2023. The second quarter 2023 will represent approximately 40% of total planned maintenance outage with approximately 80% of the second highest outage quarterannual outages completed through the first half of 2022.2023. Input costs are expected to be higher.lower driven by lower costs for energy and freight. In our Global Cellulose Fibers business, we expect price and mix to improvedecrease earnings on price realization of prior period increases.index movements. Volume is expected to remain stable as the solid demand environment is offset by continued logistics challenges.be seasonally higher demand. Operations and costs are expected to be favorable due to lower supply chain costs, lower unabsorbed fixed costs due to higher on the non-repeat of favorable one-time items.volume and seasonality. Maintenance outage expenses are expected to decrease while input costs areexpense is expected to be higher.
The Russia-Ukraine conflict, including currentlower along with lower input costs, primarily due to lower energy and future sanctions, actions by the Russian government, and associated domestic and global economic and geopolitical conditions, have affected and could materially and adversely affect our Ilim joint venture and could otherwise adversely affect our business, financial condition, results of operations and cash flows. We are unable to predict the full impact Russia’s ongoing invasion of Ukraine, sanctions that have been imposed to date or that may in the future be imposed, geopolitical instability and the possibility of broadened military conflict may have on us or our
Ilim joint venture, including whether our Ilim joint venture may be able to continue to pay dividends to us. We continue to actively explore strategic options with respect to the Ilim joint venture, including a sale of our 50% equity interest in Ilim. In addition, we have disclosed our intent to monetize our remaining equity stake in Sylvamo (which has certain operations in Russia, and announced in March 2022 that it began the suspension of operations in Russia and that it was continuing to assess various options for its operations in that country). While we may sell our equity interests in the Ilim joint venture and Sylvamo, we cannot be certain if and when this may occur, or the impact that possible disruptions in the capital markets, or conditions associated with the Russia-Ukraine conflict, could have on the value of and our ability to sell our equity interests in the Ilim joint venture and/or Sylvamo and the timing of any such sales.fiber costs.
Adjusted operating earningsOperating Earnings and Adjusted operating earnings per shareOperating Earnings Per Share are non-GAAP measures and are defined as net earnings (loss) attributable to International Paper (a GAAP measure) excluding discontinued operations, net special items and non-operating pension expense (income). Net earnings (loss) and Diluted earnings (loss) per share attributable to common shareholders are the most directly comparable GAAP measures. The Company calculates Adjusted operating earningsOperating Earnings by excluding the after-tax effect of discontinued operations, non-operating pension expense (income) and items considered by management to be unusual or otherwise not reflective of on-going operations (net special items) from net earnings (loss) attributable to shareholders reported under GAAP. Adjusted operating earnings per shareOperating Earnings Per Share is calculated by dividing Adjusted operating earningsOperating Earnings by diluted average shares of common stock outstanding. Management uses these measuresthis measure to focus on on-going operations, and believes that these measures areit is useful to investors because such measures enable investorsit enables them to perform meaningful comparisons of past and present consolidated operating results.results from continuing operations. The Company believes that using this information, along with the most directlydirect comparable GAAP measures, providemeasure, provides for a more complete analysis of the results of operations.
The following are reconciliations of Net earnings (loss) attributable to shareholders to Adjusted operating earnings (loss) attributable to common shareholders on a total and per share basis. Additional detail is provided later in this Form 10-Q regarding the net special items expense (income) referenced in the charts below.
| | | | Three Months Ended
June 30, | | Three Months Ended March 31, | | Three Months Ended
March 31, | | Three Months Ended December 31, |
| In millions | In millions | 2022 | | 2021 | | 2022 | In millions | 2023 | | 2022 | | 2022 |
| Net earnings (loss) attributable to shareholders | $ | 511 | | | $ | 432 | | | $ | 360 | | |
| Net earnings (loss) | | Net earnings (loss) | $ | 172 | | | $ | 360 | | | $ | (318) | |
| Less - Discontinued operations (gain) loss | Less - Discontinued operations (gain) loss | — | | | $ | (124) | | | $ | — | | Less - Discontinued operations (gain) loss | — | | | (93) | | | 489 | |
| Earnings (loss) from continuing operations attributable to shareholders | 511 | | | 308 | | | 360 | | |
| Earnings (loss) from continuing operations | | Earnings (loss) from continuing operations | 172 | | | 267 | | | 171 | |
| Add back - Non-operating pension expense (income) | Add back - Non-operating pension expense (income) | (47) | | | (51) | | | (49) | | Add back - Non-operating pension expense (income) | 15 | | | (49) | | | (48) | |
| Add back - Net special items expense (income) | Add back - Net special items expense (income) | 18 | | | 69 | | | (46) | | Add back - Net special items expense (income) | 3 | | | (46) | | | 144 | |
| Income tax effect - Non-operating pension and net special items expense | (23) | | | (1) | | | 23 | | |
| Adjusted operating earnings (loss) attributable to shareholders | $ | 459 | | | $ | 325 | | | $ | 288 | | |
| Income tax effect - Non-operating pension and net special items expense (income) | | Income tax effect - Non-operating pension and net special items expense (income) | (5) | | | 23 | | | 42 | |
| Adjusted operating earnings (loss) | | Adjusted operating earnings (loss) | $ | 185 | | | $ | 195 | | | $ | 309 | |
| | | | | | | | | | | | | | | | | |
| | Three Months Ended
June 30, | | Three Months Ended March 31, |
| In millions | 2022 | | 2021 | | 2022 |
| Diluted earnings (loss) per share attributable to shareholders | $ | 1.38 | | | $ | 1.09 | | | $ | 0.95 | |
| Less - Discontinued operations (gain) loss per share | — | | | (0.31) | | | — | |
| Diluted earnings (loss) per share from continuing operations attributable to shareholders | 1.38 | | | 0.78 | | | 0.95 | |
| Add back - Non-operating pension expense (income) per share | (0.13) | | | (0.13) | | | (0.13) | |
| Add back - Net special items expense (income) per share | 0.05 | | | 0.17 | | | (0.12) | |
| Income tax effect per share - Non-operating pension and net special items expense | (0.06) | | | — | | | 0.06 | |
| Adjusted operating earnings (loss) per share attributable to shareholders | $ | 1.24 | | | $ | 0.82 | | | $ | 0.76 | |
| | | | | | | | | | | | | | | | | |
| | Three Months Ended
March 31, | | Three Months Ended December 31, |
| 2023 | | 2022 | | 2022 |
| Diluted earnings (loss) per share | $ | 0.49 | | | $ | 0.95 | | | $ | (0.90) | |
| Less - Discontinued operations (gain) loss per share | — | | | (0.25) | | | 1.38 | |
| Diluted earnings (loss) per share from continuing operations | 0.49 | | | 0.70 | | | 0.48 | |
| Add back - Non-operating pension expense (income) per share | 0.04 | | | (0.13) | | | (0.13) | |
| Add back - Net special items expense (income) per share | 0.01 | | | (0.12) | | | 0.41 | |
| Income tax effect per share - Non-operating pension and net special items expense (income) | (0.01) | | | 0.06 | | | 0.11 | |
| Adjusted operating earnings (loss) per share | $ | 0.53 | | | $ | 0.51 | | | $ | 0.87 | |
Cash provided by operations, including discontinued operations, totaled $978$345 million and $1.3 billion$588 million for the first sixthree months of 20222023 and 2021,2022, respectively. The Company generated free cash flow of approximately $607$4 million and $1.1 billion$403 million in the first sixthree months of 20222023 and 2021,2022, respectively. Free cash flow is a non-GAAP measure and the most directly comparable GAAP measure is cash provided by operations. Management utilizes this measure in connection with managing our business and believes that free cash flow is useful to investors as a liquidity measure because it measures the amount of cash generated that is available, after reinvesting in the business, to maintain a strong balance sheet, pay dividends, repurchase stock, service debt and make investments for future growth. It should not be inferred that the entire free cash flow amount is available for discretionary expenditures. By adjusting for certain items that are not indicative of the Company's ongoing performance, we believe that free cash flow also enables investors to perform meaningful comparisons between past and present periods.
The following is a reconciliation of cash provided by operations to free cash flow:
| | | | Six Months Ended
June 30, | | Three Months Ended
March 31, |
| In millions | In millions | 2022 | | 2021 | In millions | 2023 | | 2022 |
| Cash provided by operations | Cash provided by operations | $ | 978 | | | $ | 1,278 | | Cash provided by operations | $ | 345 | | | $ | 588 | |
| Adjustments: | Adjustments: | | Adjustments: | |
| Cash invested in capital projects, net of insurance recoveries | Cash invested in capital projects, net of insurance recoveries | (371) | | | (222) | | Cash invested in capital projects, net of insurance recoveries | (341) | | | (185) | |
| Free Cash Flow | Free Cash Flow | $ | 607 | | | $ | 1,056 | | Free Cash Flow | $ | 4 | | | $ | 403 | |
The non-GAAP financial measures presented in this Form 10-Q as referenced above have limitations as analytical tools and should not be considered in isolation or as a substitute for an analysis of our results calculated in accordance with GAAP. In addition, because not all companies utilize identical calculations, the Company's presentation of non-GAAP measures in this Form 10-Q may not be comparable to similarly titled measures disclosed by other companies, including companies in the same industry as the Company.
For the secondfirst quarter of 2022,2023, International Paper reported net sales of $5.4$5.0 billion, compared with $5.1 billion in the fourth quarter of 2022 and $5.2 billion in the first quarter of 2022 and $4.8 billion in the second quarter of 2021.2022.
Net earnings (loss) attributable to International Paper totaled $511$172 million, or $1.38$0.49 per diluted share, in the secondfirst quarter of 2022.2023. This compared with $(318) million, or $(0.90) per diluted share, in the fourth quarter of 2022 and $360 million, or $0.95 per diluted share, in the first quarter of 2022.

Compared with the fourth quarter of 2022, earnings from continuing operations benefited from lower raw material and $432freight costs ($100 million) and lower tax expense ($8 million). These benefits were offset by lower average sales prices and an unfavorable mix ($38 million), lower sales volumes ($4 million), higher operating costs ($93 million), higher mill maintenance outage costs ($74 million), higher corporate and other items ($23 million), higher net interest expense ($2 million) and higher non-operating pension expense ($47 million). Equity earnings, net of taxes, were $2 million or $1.09 per diluted share,higher in the secondfirst quarter of 2021.2023 than in the fourth quarter of 2022. Net special items in the first quarter of 2023 were a charge of $2 million compared with a charge of $174 million in the fourth quarter of 2022.
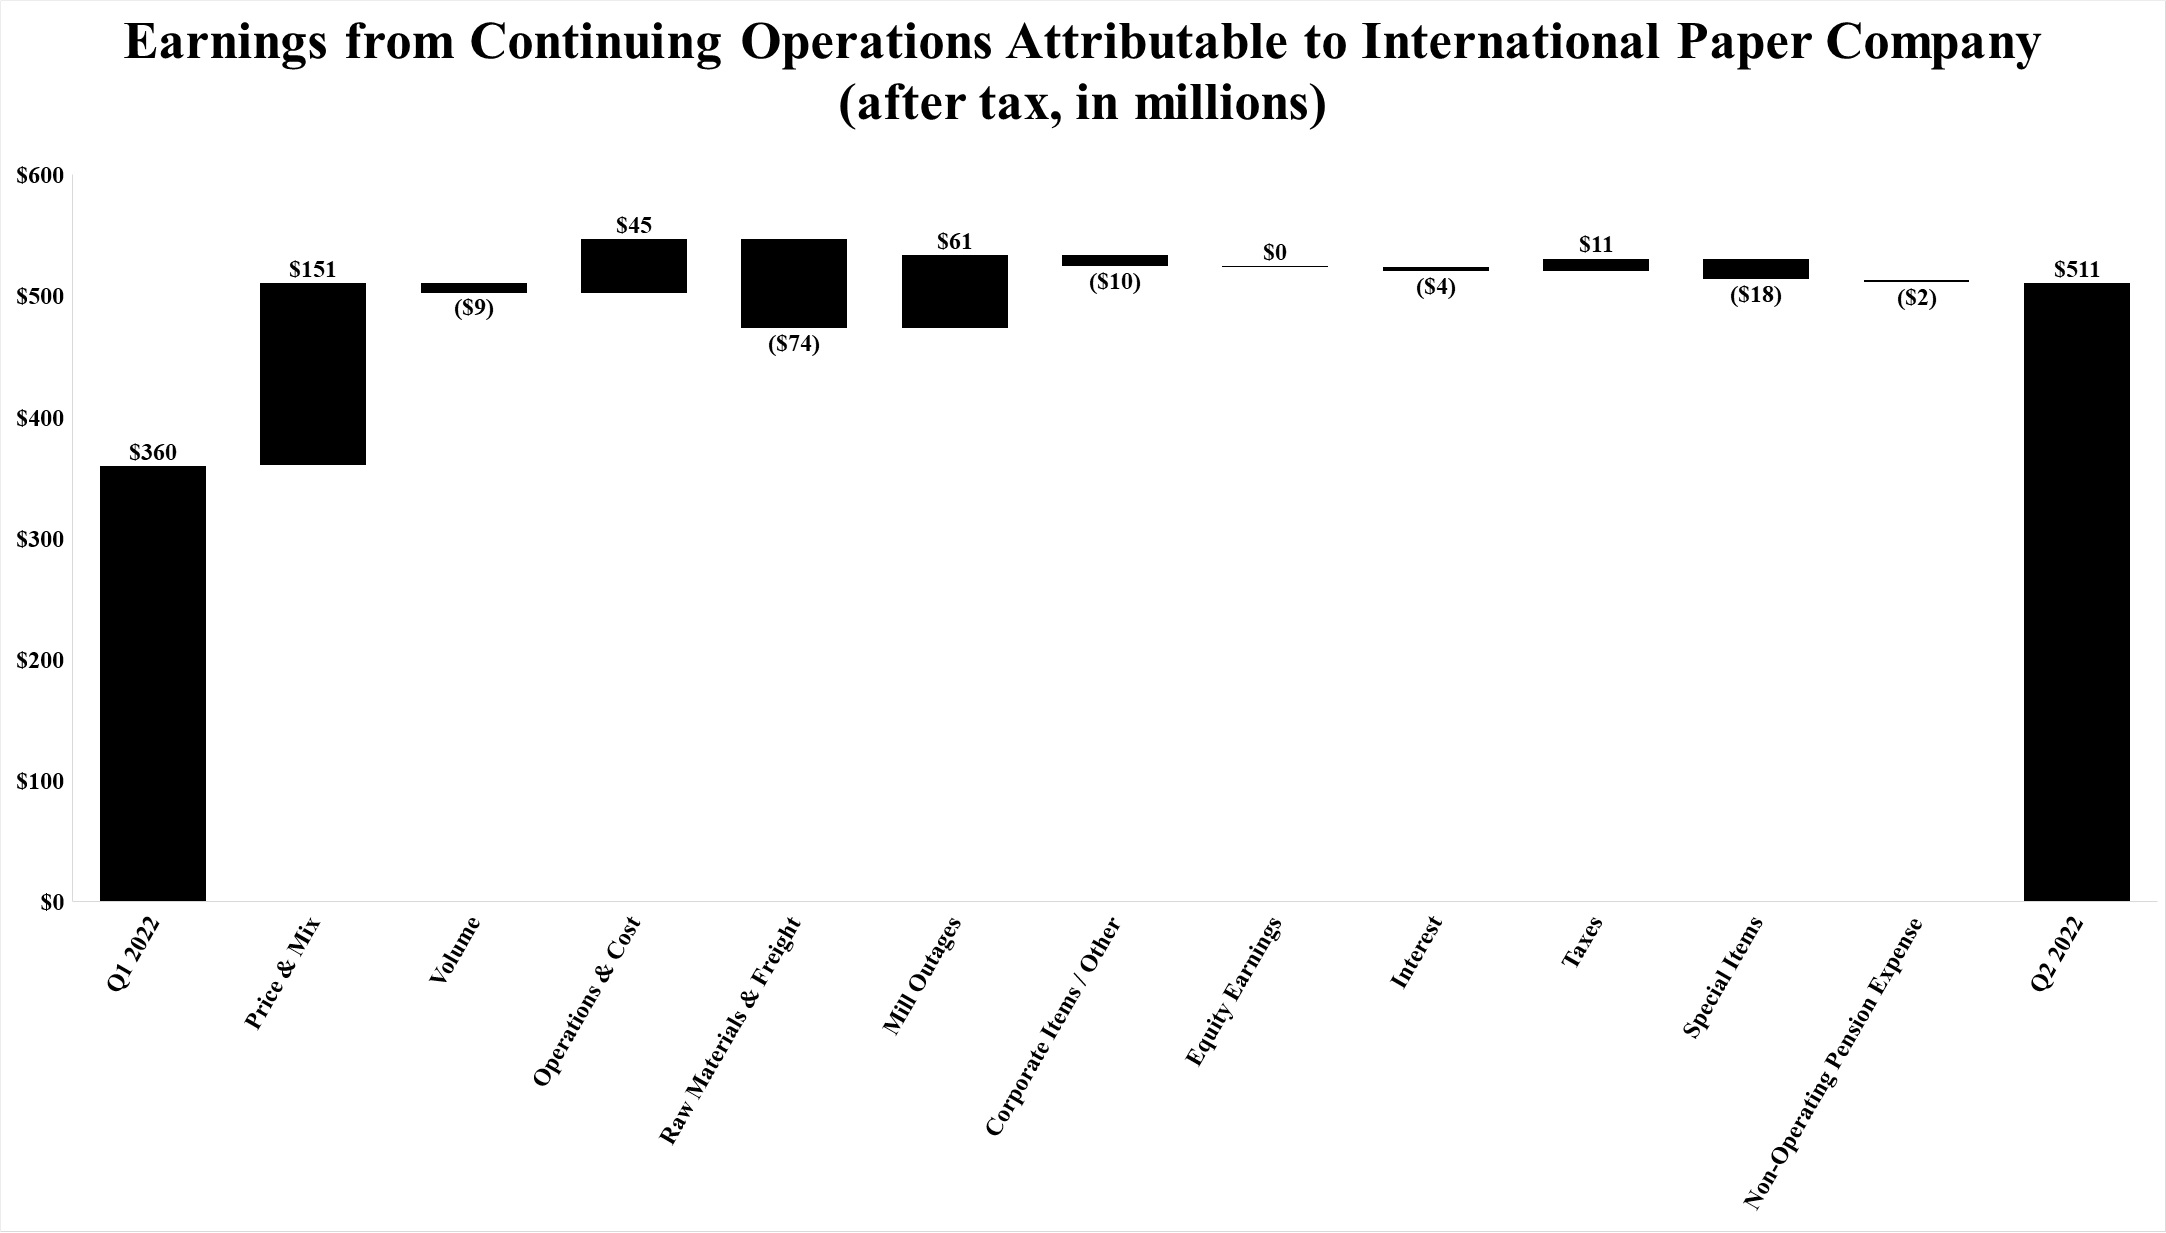

Compared with the first quarter of 2022, earnings benefited fromthe first quarter of 2023 reflects higher average sales prices net of an unfavorable mix ($151227 million), lower operatingraw material and freight costs ($4587 million), lower mill maintenance outage costs ($614 million), lower corporate and other costs ($3 million), lower net interest expense ($7 million) and lower tax expense ($11 million). These benefits were offset by lower sales volumes ($973 million), higher raw material and freightoperating costs ($74 million), higher corporate and other items ($10 million), higher net interest expense ($4275 million) and higher non-operating pension expense ($248 million). Equity earnings, net of taxes, relating to International Paper’s investmentswere $1 million lower in Ilim and other investments were flat compared withthe first quarter of 2023 than in the first quarter of 2022. Net special items in the secondfirst quarter of 20222023 were a gaincharge of $17$2 million compared with a gain of $35 million in the first quarter of 2022.
Compared with the second quarter of 2021, the second quarter of 2022 reflects higher average sales prices net of an unfavorable mix ($493 million), lower mill maintenance outage costs ($45 million), lower corporate and other costs ($8 million) and lower net interest expense ($10 million). These benefits were offset by lower sales volumes ($36 million), higher operating costs ($22 million), higher raw material and freight costs ($318 million), higher tax expense ($35 million) and higher non-operating pension expense ($3 million). Equity earnings, net of taxes, relating to International Paper’s investments in Ilim and other investments were $11 million lower in the second quarter of 2022 than in the second quarter of 2021. Net special items in the second quarter of 2022 were a gain of $17 million compared with a loss of $55 million in the second quarter of 2021.
Business segment operating profits are used by International Paper's management to measure the earnings performance of its businesses. Management uses this measure to focus on on-going operations, and believes that it is useful to investors because it enables them to perform meaningful comparisons of past and present operating results. International Paper believes that using this information, along with net earnings, provides a more complete analysis of the results of operations by quarter. Business segment operating profits are defined as earnings (loss) from continuing operations before income taxes and equity earnings, but including the impact of noncontrolling interests,less than wholly owned subsidiaries, and excluding interest expense, net, corporate expenses, net, corporate net special items, business net special items and non-operating pension expense. Business segment operating profits is a measure reported to our management for purposes of making decisions about allocating resources to our business segments and assessing the performance of our business segments and is presented in our financial statement footnotes in accordance with ASC 280.
The Company currently operates in two segments: Industrial Packaging and Global Cellulose Fibers. On January 24, 2023, the Company announced an agreement to sell its Ilim equity investment and, as a result, all current and historical results of the Ilim investment are presented as Discontinued Operations, net of taxes and our equity investment is no longer a separate reportable industry segment.
The following table presents a reconciliation of Net earnings (loss) attributable to International Paper Companyfrom continuing operations to its Totaltotal business segment operating profit:
| | | | Three Months Ended | | Three Months Ended |
| | | June 30, | | March 31, | | March 31, | | December 31, |
| In millions | In millions | 2022 | | 2021 | | 2022 | In millions | 2023 | | 2022 | | 2022 |
| Net Earnings (Loss) from Continuing Operations Attributable to International Paper Company | $ | 511 | | | $ | 308 | | | $ | 360 | | |
| Net Earnings (Loss) from Continuing Operations | | Net Earnings (Loss) from Continuing Operations | $ | 172 | | | $ | 267 | | | $ | 171 | |
| Add back (deduct): | Add back (deduct): | | Add back (deduct): | |
| Income tax provision (benefit) | Income tax provision (benefit) | 96 | | | 46 | | | 95 | | Income tax provision (benefit) | 48 | | | 95 | | | 148 | |
| Equity (earnings) loss, net of taxes | Equity (earnings) loss, net of taxes | (93) | | | (104) | | | (93) | | Equity (earnings) loss, net of taxes | 1 | | | — | | | 3 | |
| Noncontrolling interests, net of taxes | — | | | 2 | | | — | | |
| Earnings (Loss) From Continuing Operations Before Income Taxes and Equity Earnings | Earnings (Loss) From Continuing Operations Before Income Taxes and Equity Earnings | 514 | | | 252 | | | 362 | | Earnings (Loss) From Continuing Operations Before Income Taxes and Equity Earnings | 221 | | | 362 | | | 322 | |
| Interest expense, net | Interest expense, net | 74 | | | 86 | | | 69 | | Interest expense, net | 62 | | | 69 | | | 59 | |
| Noncontrolling interests included in operations | (1) | | | (1) | | | — | | |
| Less than wholly owned subsidiaries included in operations | | Less than wholly owned subsidiaries included in operations | — | | | — | | | (3) | |
| Corporate expenses, net | Corporate expenses, net | 27 | | | 36 | | | 12 | | Corporate expenses, net | 8 | | | 12 | | | (20) | |
| Corporate net special items | Corporate net special items | 18 | | | 77 | | | (46) | | Corporate net special items | — | | | (46) | | | 65 | |
| Business net special items | Business net special items | — | | | (9) | | | — | | Business net special items | — | | | — | | | 76 | |
| Non-operating pension expense (income) | Non-operating pension expense (income) | (47) | | | (51) | | | (49) | | Non-operating pension expense (income) | 15 | | | (49) | | | (48) | |
| Adjusted Operating Profit | Adjusted Operating Profit | $ | 585 | | | $ | 390 | | | $ | 348 | | Adjusted Operating Profit | $ | 306 | | | $ | 348 | | | $ | 451 | |
| Business Segment Operating Profit (Loss): | Business Segment Operating Profit (Loss): | | Business Segment Operating Profit (Loss): | |
| Industrial Packaging | Industrial Packaging | $ | 560 | | | $ | 389 | | | $ | 397 | | Industrial Packaging | $ | 322 | | | $ | 397 | | | $ | 416 | |
| Global Cellulose Fibers | Global Cellulose Fibers | 25 | | | 1 | | | (49) | | Global Cellulose Fibers | (16) | | | (49) | | | 35 | |
| Total Business Segment Operating Profit | Total Business Segment Operating Profit | $ | 585 | | | $ | 390 | | | $ | 348 | | Total Business Segment Operating Profit | $ | 306 | | | $ | 348 | | | $ | 451 | |
Business Segment Operating Profit
Total business segment operating profits were $585$306 million in the secondfirst quarter of 2023, $451 million in the fourth quarter of 2022 and $348 million in the first quarter of 2022 and $390 million in the second quarter of 2021.2022.
Compared with the firstfourth quarter of 2022, operating profits benefited from higher average sales prices net of an unfavorable mix ($206 million), lower operatingraw material and freight costs ($62 million) and lower mill outage costs ($84134 million). These benefits were offset by lower average sales prices and an unfavorable mix ($51 million), lower sales volumes ($135 million), higher operating costs ($124 million) and higher raw material and freightmill outage costs ($10299 million).
Compared with the secondfirst quarter of 2021,2022, operating profits in the current quarter benefited from higher average sales prices net of an unfavorable mix ($597311 million), lower raw material and freight costs ($119 million) and lower mill outage costs ($545 million). These benefits were offset by lower sales volumes ($44100 million), and higher operating costs ($27 million) and higher raw material and freight costs ($385377 million).
Sales Volumes by Product (a)
Sales volumes of major products for the three months ended March 31, 2023 and six months ended June 30, 2022 and 2021 were as follows:
| | | | Three Months Ended
June 30, | | Six Months Ended
June 30, | | Three Months Ended
March 31, | |
| In thousands of short tons (except as noted) | In thousands of short tons (except as noted) | 2022 | | 2021 | | 2022 | | 2021 | In thousands of short tons (except as noted) | 2023 | | 2022 | |
| Industrial Packaging | Industrial Packaging | | Industrial Packaging | |
| Corrugated Packaging (b) | Corrugated Packaging (b) | 2,619 | | | 2,733 | | | 5,237 | | | 5,417 | | Corrugated Packaging (b) | 2,381 | | | 2,618 | | |
| Containerboard | Containerboard | 707 | | | 699 | | | 1,419 | | | 1,408 | | Containerboard | 544 | | | 712 | | |
| Recycling | Recycling | 535 | | | 568 | | | 1,099 | | | 1,126 | | Recycling | 560 | | | 564 | | |
| Saturated Kraft | Saturated Kraft | 51 | | | 50 | | | 95 | | | 95 | | Saturated Kraft | 34 | | | 44 | | |
| Gypsum/Release Kraft | Gypsum/Release Kraft | 64 | | | 68 | | | 118 | | | 123 | | Gypsum/Release Kraft | 60 | | | 54 | | |
| EMEA Packaging (b) | EMEA Packaging (b) | 354 | | | 410 | | | 722 | | | 845 | | EMEA Packaging (b) | 335 | | | 368 | | |
| Industrial Packaging | Industrial Packaging | 4,330 | | | 4,528 | | | 8,690 | | | 9,014 | | Industrial Packaging | 3,914 | | | 4,360 | | |
Global Cellulose Fibers (in thousands of metric tons) (c) | Global Cellulose Fibers (in thousands of metric tons) (c) | 720 | | | 743 | | | 1,432 | | | 1,498 | | Global Cellulose Fibers (in thousands of metric tons) (c) | 688 | | | 712 | | |
(a)Sales volumes include third party and inter-segmentintersegment sales and exclude sales of equity investees.
(b)Volumes for corrugated box sales reflect consumed tons sold (CTS). Board sales for these businesses reflect invoiced tons.
(c)Includes North American volumes and internal sales to mills.
Discontinued Operations
On October 1, 2021,January 24, 2023, the Company completed the previously announced spin-offit had reached an agreement to sell its equity investment in Ilim and had also received an indication of interest to purchase its Printing Papers business along with certain mixed-use coated paperboardequity investment in Ilim Group. All current and pulp businesses in North America, France and Russia into a standalone, publicly-traded company, Sylvamo. On August 6, 2021, the Company completed the sale of its Kwidzyn, Poland mill which included the pulp and paper mill in Kwidzyn and supporting functions. As a resulthistorical results of the Sylvamo spin-off and saleIlim joint venture investment are presented as Discontinued Operations, net of Kwidzyn,taxes in the Company no longer has a Printing Papers business segment, and all historical results have been adjusted to reflect the Kwidzyn and the Printing Papers business and other businesses conveyed to Sylvamo as discontinuedconsolidated statement of operations. SeeThis transaction is discussed further in Note 910 - Divestitures and ImpairmentsEquity Method Investments ofItem 1. Financial Statements for further discussion..
Discontinued operations include the operatingequity earnings of the businesses noted above.Ilim joint venture. Discontinued operations also includes after-tax net special items incomecharges of $27$43 million and $7$533 million for the three months ended March 31, 2023 and six months ended June 30, 2021,December 31, 2022, respectively.
Details of these charges were as follows:
| | | Three Months Ended | | Six Months | | Three Months | | Three Months |
| | June 30, | | June 30. | | March 31, | | December 31, |
| | 2021 | | 2021 | | 2023 | | 2022 |
| In millions | In millions | Before Tax | | After Tax | | Before Tax | | After Tax | In millions | Before Tax | | After Tax | | Before Tax | | After Tax |
| Printing Papers spin-off | $ | 24 | | | $ | 20 | | | $ | 49 | | | $ | 40 | | |
| Foreign value-added tax credit (including interest) | (70) | | | (47) | | | (70) | | | (47) | | |
| Ilim equity method investment impairment | | Ilim equity method investment impairment | $ | 43 | | | $ | 43 | | | $ | 533 | | | $ | 533 | |
| Total | Total | $ | (46) | | | $ | (27) | | | $ | (21) | | | $ | (7) | | Total | $ | 43 | | | $ | 43 | | | $ | 533 | | | $ | 533 | |
Income Taxes
An income tax provision of $96$48 million was recorded for the secondfirst quarter of 2023 and the reported effective income tax rate was 22%. Excluding a benefit of $1 million related to the tax effects of net special items and a benefit of $4 million related to the tax effects of non-operating pension expense, the operational effective income tax rate was 22% for the quarter. The effective tax rate for the first quarter of 2023 was lower than the prior quarter primarily due to a decrease in state income taxes in the first quarter of 2023.
An income tax provision of $148 million was recorded for the fourth quarter of 2022 and the reported effective income tax rate was 19%46%. Excluding benefitexpense of $35$30 million related to the tax effects of net special items and expense of $12 million related to the tax effects of non-operating pension expense, the operational effective income tax rate was 25% for the quarter. The effective tax rate for the second quarter of 2022 was lower due to the tax-free exchange of a portion of the Company’s shares of Sylvamo Corporation.
An income tax provision of $95 million was recorded for the first quarter of 2022 and the reported effective income tax rate was 26%. Excluding expense of $11 million related to the tax effects of net special items and expense of $12 million related to the tax effects of non-operating pension expense, the operational effective income tax rate was 27% for the quarter. The higher operational effective income tax rate in the first quarter of 2022 was primarily due to reduced tax benefits for equity-based compensation.
AnThe operational tax provision and rate are non-GAAP measures and are calculated by adjusting the income tax provision of $46 million was recorded for the second quarter of 2021from continuing operations and the reported effective income tax rate was 18%. Excluding benefit of $14 million related to exclude the tax effectseffect of net special items and expense of $13 million related to the tax effects of non-operating pension expense (income). Management believes that the effectivepresentation provides useful information to investors by providing a more meaningful comparison of the income tax rate was 17% for the quarter. The tax rate in the second quarter of 2021 was lower primarily due to a discrete period tax benefit of $15 million related to the adjustment of the tax depreciation method for certain of the Company’s fixed assets. This adjustment was partially offset by the tax rate differential associated with a foreign value-added tax credit accrual.between past and present periods.
Interest Expense
Net interest expense was $74$62 million in the secondfirst quarter of 2023, compared with $59 million in the fourth quarter of 2022 compared withand $69 million in the first quarter of 2022 and $86 million in the second2022. The first quarter of 2021.2023 and fourth quarter of 2022 include $3 million of interest expense related to the previously announced settlement of the timber monetization restructuring tax matter.
Effects of Net Special Items Expense (Income) and Non-Operating Pension Expense
Details of net special items expense (income) excluding interest expense and non-operating pension expense (income) for the three months ended are as follows:
| | | | | | | | | | | | | | | | | | | | | | | | | | | | | | | | | | | | | | |
| Three Months Ended |
| June 30, | | March 31, | |
| 2022 | | 2021 | | 2022 | |
| In millions | Before Tax | | After Tax | | Before Tax | | After Tax | | Before Tax | | After Tax | |
| Business Segments | | | | | | | | | | | | |
| EMEA Packaging impairment - Turkey | $ | — | | | $ | — | | | $ | (8) | | | $ | (2) | | (a) | $ | — | | | $ | — | | |
| Business Segments Total | — | | | — | | | (8) | | | (2) | | | — | | | — | | |
| Corporate | | | | | | | | | | | | |
| Environmental remediation reserve adjustment | 15 | | | 11 | | | 5 | | | 3 | | | — | | | — | | |
| Sylvamo investment | (3) | | | (2) | | | — | | | — | | | (46) | | | (35) | | |
| Debt extinguishment costs | — | | | — | | | 170 | | | 128 | | | — | | | — | | |
| Building a Better IP | — | | | — | | | 4 | | | 3 | | | — | | | — | | |
| Real estate - office impairment | — | | | — | | | 21 | | | 16 | | | — | | | — | | |
| Gain on sale of equity investment in Graphic Packaging | — | | | — | | | (130) | | | (98) | | | — | | | — | | |
| Other | 6 | | | 5 | | | 7 | | | 5 | | | — | | | — | | |
| Corporate Total | 18 | | | 14 | | | 77 | | | 57 | | | (46) | | | (35) | | |
| Total net special items | 18 | | | 14 | | | 69 | | | 55 | | | (46) | | | (35) | | |
| Non-operating pension expense (income) | (47) | | | (35) | | | (51) | | | (38) | | | (49) | | | (37) | | |
| Total net special items and non-operating pension expense (income) | $ | (29) | | | $ | (21) | | | $ | 18 | | | $ | 17 | | | $ | (95) | | | $ | (72) | | |
(a) Recorded in the Industrial Packaging segment.
| | | | | | | | | | | | | | | | | | | | | | | | | | | | | | | | | | | | | | |
| Three Months Ended |
| March 31, | | December 31, | |
| 2023 | | 2022 | | 2022 | |
| In millions | Before Tax | | After Tax | | Before Tax | | After Tax | | Before Tax | | After Tax | |
| Business Segments | | | | | | | | | | | | |
| Net (gains) losses on sales and impairments of businesses | $ | — | | | $ | — | | | $ | — | | | $ | — | | | $ | 76 | | | $ | 76 | | |
| Business Segments Total | — | | | — | | | — | | | — | | | 76 | | | 76 | | |
| Corporate | | | | | | | | | | | | |
| Environmental remediation reserve adjustment | $ | — | | | $ | — | | | $ | — | | | $ | — | | | $ | 48 | | | $ | 36 | | |
| Sylvamo investment | — | | | — | | | (46) | | | (35) | | | — | | | — | | |
| Legal reserve adjustments | — | | | — | | | — | | | — | | | 11 | | | 8 | | |
| Foreign currency cumulative translation loss related to sale of equity method investment | — | | | — | | | — | | | — | | | 10 | | | 10 | | |
| Other | — | | | — | | | — | | | — | | | (4) | | | (3) | | |
| Corporate Total | — | | | — | | | (46) | | | (35) | | | 65 | | | 51 | | |
| Total net special items expense (income) | — | | | — | | | (46) | | | (35) | | | 141 | | | 127 | | |
| Non-operating pension expense (income) | 15 | | | 11 | | | (49) | | | (37) | | | (48) | | | (36) | | |
| Total net special items and non-operating pension expense (income) | $ | 15 | | | $ | 11 | | | $ | (95) | | | $ | (72) | | | $ | 93 | | | $ | 91 | | |
Net special items expense (income) include the following tax expenses (benefits):
| | | | | | | | | | | | | | | | | | | | |
| | Three Months Ended |
| | June 30, | | March 31, |
| In millions | | 2022 | | 2021 | | 2022 |
| Tax benefit related to tax-free exchange of Sylvamo shares | | $ | (31) | | | $ | — | | | $ | — | |
| Total | | $ | (31) | | | $ | — | | | $ | — | |
Details of net special items and non-operating pension expense (income) for the six months ended are as follows:
| | | | | | | | | | | | | | | | | | | | | | | | | | |
| Six Months Ended |
| June 30, | |
| 2022 | | 2021 | |
| In millions | Before Tax | | After Tax | | Before Tax | | After Tax | |
| Business Segments | | | | | | | | |
| EMEA Packaging business optimization | $ | — | | | $ | — | | | $ | 12 | | | $ | 10 | | (a) |
| EMEA Packaging impairment - Turkey | — | | | — | | | (6) | | | — | | (a) |
| Business Segments Total | — | | | — | | | 6 | | | 10 | | |
| Corporate | | | | | | | | |
| Environmental remediation reserve adjustment | 15 | | | 11 | | | 5 | | | 3 | | |
| Sylvamo investment | (49) | | | (37) | | | — | | | — | | |
| Debt extinguishment costs | — | | | — | | | 188 | | | 142 | | |
| Building a Better IP | — | | | — | | | 4 | | | 3 | | |
| Real estate - office impairment | — | | | — | | | 21 | | | 16 | | |
| Gain on sale of equity investment in Graphic Packaging | — | | | — | | | (204) | | | (154) | | |
| Other | 6 | | | 5 | | | 7 | | | 5 | | |
| Corporate Total | (28) | | | (21) | | | 21 | | | 15 | | |
| Total net special items | (28) | | | (21) | | | 27 | | | 25 | | |
| Non-operating pension expense (income) | (96) | | | (72) | | | (103) | | | (77) | | |
| Total net special items and non-operating pension expense (income) | $ | (124) | | | $ | (93) | | | $ | (76) | | | $ | (52) | | |
(a) Recorded in the Industrial Packaging segment.
Net special items include the following tax expenses (benefits):
| | | Six Months Ended | | Three Months Ended |
| | June 30, | | March 31, | | December 31, |
| In millions | In millions | | 2022 | | 2021 | In millions | | 2023 | | 2022 | | 2022 |
| Tax benefit related to tax-free exchange of Sylvamo shares | | $ | (31) | | | $ | — | | |
| Foreign deferred tax valuation allowance | | Foreign deferred tax valuation allowance | | $ | — | | | $ | — | | | $ | 45 | |
| | Total | Total | | $ | (31) | | | $ | — | | Total | | $ | — | | | $ | — | | | $ | 45 | |
The following tables present net sales and business segment operating profit (loss) which is the Company's measure of segment profitability.
Industrial Packaging
| | Total Industrial Packaging | Total Industrial Packaging | 2022 | | 2021 | Total Industrial Packaging | 2023 | 2022 |
| In millions | In millions | 2nd Quarter | | 1st Quarter | | Six Months | | 2nd Quarter | | 1st Quarter | | Six Months | In millions | 1st Quarter | | 1st Quarter | | 4th Quarter | |
| Sales | Sales | $ | 4,491 | | | $ | 4,406 | | | $ | 8,897 | | | $ | 4,030 | | | $ | 3,930 | | | $ | 7,960 | | Sales | $ | 4,083 | | | $ | 4,406 | | | $ | 4,169 | | |
| Operating Profit (Loss) | Operating Profit (Loss) | $ | 560 | | | $ | 397 | | | $ | 957 | | | $ | 389 | | | $ | 421 | | | $ | 810 | | Operating Profit (Loss) | $ | 322 | | | $ | 397 | | | $ | 416 | | |
Industrial Packaging net sales for the secondfirst quarter of 2023 were 2% lower compared with the fourth quarter of 2022 were 2% higherand 7% lower compared with the first quarter of 2022 and 11% higher2022. Operating profit was 23% lower in the first quarter of 2023 compared with the secondfourth quarter of 2021. Operating profit was 41% higher in the second quarter of 2022 and 19% lower compared with the first quarter of 2022 and 44% higher compared with the second quarter of 2021.2022.
| | North American Industrial Packaging | North American Industrial Packaging | 2022 | | 2021 | North American Industrial Packaging | 2023 | 2022 |
| In millions | In millions | 2nd Quarter | | 1st Quarter | | Six Months | | 2nd Quarter | | 1st Quarter | | Six Months | In millions | 1st Quarter | | 1st Quarter | | 4th Quarter | |
| Sales (a) | Sales (a) | $ | 4,126 | | | $ | 4,025 | | | $ | 8,151 | | | $ | 3,663 | | | $ | 3,560 | | | $ | 7,223 | | Sales (a) | $ | 3,724 | | | $ | 4,025 | | | $ | 3,805 | | |
| Operating Profit (Loss) | Operating Profit (Loss) | $ | 550 | | | $ | 400 | | | $ | 950 | | | $ | 377 | | | $ | 395 | | | $ | 772 | | Operating Profit (Loss) | $ | 302 | | | $ | 400 | | | $ | 416 | | |
(a)Includes intra-segment sales of $32 million, $29 million and $30 million for the three months ended March 31, 2023 and 2022 and December 31, 2022, respectively.
(a)Includes intra-segment sales of $48 million and $27 million for the three months ended June 30, 2022 and 2021, respectively; $29 million and $26 million for the three months ended March 31, 2022 and 2021, respectively; and $77 million and $53 million for the six months ended June 30, 2022 and 2021, respectively.
North American Industrial Packaging sales volumes in the secondfirst quarter of 20222023 were stablelower compared to the firstfourth quarter of 2022 for corrugated boxes reflecting slower demandin all segments driven by inflation. Export containerboard volumes increasedthe macroeconomic environment reflecting consumer focus on non-discretionary and domestic containerboardvalue spending and retailer and manufacturer inventory reduction. Containerboard sales volumes were lower.flat. Total maintenance and economic downtime was about 64,00045,000 short tons lower in the secondfirst quarter of 2023 compared with the fourth quarter of 2022, driven by lower economic downtime partially offset by higher maintenance downtime. Average sales margins were lower reflecting lower average sales prices for boxes and containerboard partially offset by a favorable mix. Operating costs were higher driven by the non-repeat of favorable one-time items for employee benefit costs and medical claims in the fourth quarter of 2022 partially offset by lower distribution costs. Planned maintenance downtime costs were $92 million higher in the first quarter of 2023 compared with the fourth quarter of 2022. Input costs were lower driven by energy, recovered fiber and wood.
Compared with the first quarter of 2022, sales volumes in the first quarter of 2023 were lower for corrugated boxes and containerboard. Sales volumes for corrugated boxes were lower reflecting inflation impacts on consumer spending as well as inventory destocking by retailers and manufacturers. Total maintenance and economic downtime was about 409,000 short tons higher in the first quarter of 2023, primarily due to lower maintenancehigher economic downtime. Average sales margins were higher reflecting higher average sales prices for boxes and exportwere higher reflecting previous price increases. Export containerboard partially offset by an unfavorable mix in our box system.prices were lower. Operating costs were flat as solid millincreased, driven by economic downtime, inflation on goods and converting performance offset inflation.services and distribution costs. Planned maintenance downtime costs were $59$4 million lower in the secondfirst quarter of 20222023 compared with the first quarter of 2022. Input costs were highersignificantly lower driven by energy, chemicals and freightrecovered fiber costs. Earnings benefited from insurance recoveries and one-time items in both
Entering the second quarter of 2022 and insurance recoveries in2023, sales volumes are expected to be seasonally higher compared to the first quarter of 2022.
Compared with the second quarter of 2021, sales volumes2023. There is one less shipping day in the second quarter of 2022 were lower for corrugated boxes but increased for export and domestic containerboard. Sales volumes for corrugated boxes were lower reflecting slower demand driven by inflation and a strong second quarter of 2021. Total maintenance and economic downtime was about 143,000 short tons lower in the second quarter of 2022, due to lower maintenance downtime. Export containerboard and box prices were higher reflecting previous price increases. Operating costs increased, driven mainly by inflation. Distribution costs increased. Planned maintenance downtime costs were $60 million lower in the second quarter of 2022 compared with the second quarter of 2021. Input costs were significantly higher driven by energy, recovered fiber, wood, chemicals and freight.
Entering the third quarter of 2022, sales volumes for corrugated boxes and export containerboard are expected to be stable compared to the second quarter of 2022.quarter. Average sales margins are expected to be higher, reflecting previous price increases.lower. Operating costs are expected to be higher. Planned maintenance downtime costs are expected to be $41$10 million lower in the thirdsecond quarter of 20222023 compared with the secondfirst quarter of 2022.2023. Input costs are expected to be higher. Earnings are expected to be impactedlower driven by the non-repeat of favorable one-time items in the second quarter of 2022.energy, wood and freight.
| | EMEA Industrial Packaging | EMEA Industrial Packaging | 2022 | | 2021 | EMEA Industrial Packaging | 2023 | 2022 |
| In millions | In millions | 2nd Quarter | | 1st Quarter | | Six Months | | 2nd Quarter | | 1st Quarter | | Six Months | In millions | 1st Quarter | | 1st Quarter | | 4th Quarter | |
| Sales | Sales | $ | 413 | | | $ | 410 | | | $ | 823 | | | $ | 394 | | | $ | 396 | | | $ | 790 | | Sales | $ | 391 | | | $ | 410 | | | $ | 394 | | |
| Operating Profit (Loss) | Operating Profit (Loss) | $ | 10 | | | $ | (3) | | | $ | 7 | | | $ | 12 | | | $ | 26 | | | $ | 38 | | Operating Profit (Loss) | $ | 20 | | | $ | (3) | | | $ | — | | |
EMEA Industrial Packaging sales volumes for corrugated boxes in the secondfirst quarter of 2023 were stable compared with the fourth quarter of 2022 seasonally as higher volumes in Morocco were lower compared with the first quarter of 2022 reflecting seasonallyoffset by lower volumes in Morocco.Europe. Average sales margins for corrugated boxes were higher reflecting higher average sales prices in the Eurozone.stable. Average sales margins in Moroccofor containerboard were lower driven by higher containerboard costs.lower. Operating costs were lower. Therestable. Planned maintenance outage costs were no planned maintenance outages$4 million lower in either the secondfirst quarter of 2022 or2023 compared with the firstfourth quarter of 2022. Input costs were stable.lower driven by energy costs.
Compared with the secondfirst quarter of 2021,2022, sales volumes in the secondfirst quarter of 20222023 were lower driven by the sale of our EMEA Packaging business in Turkeyreflecting softening demand in the second quarter of 2021.Eurozone. Average sales margins for corrugated boxes were higher driven by higher sales prices.lower containerboard costs. Operating costs were higher mostly due to inflation.driven by inflation on goods and services. Distribution costs were higher. There were no planned maintenance outages in either the secondfirst quarter of 20222023 or the secondfirst quarter of 2021.2022. Input costs were significantly higher driven bylower primarily for energy.
Looking ahead to the thirdsecond quarter of 2022,2023, sales volumes for corrugated boxes are expected to be stable as higher volumes in the Eurozone are offset byEurope and seasonally lower volumes in Morocco. Average sales margins are expected to be lower. Operating costs are expected to be flat.higher. There are no planned maintenance outages scheduled forin the thirdsecond quarter of 2022.2023. Input costs are expected to increase.be lower.
Global Cellulose Fibers
| | Total Global Cellulose Fibers | Total Global Cellulose Fibers | 2022 | | 2021 | Total Global Cellulose Fibers | 2023 | 2022 |
| In millions | In millions | 2nd Quarter | | 1st Quarter | | Six Months | | 2nd Quarter | | 1st Quarter | | Six Months | In millions | 1st Quarter | | 1st Quarter | | 4th Quarter | |
| Sales | Sales | $ | 788 | | | $ | 710 | | | $ | 1,498 | | | $ | 680 | | | $ | 595 | | | $ | 1,275 | | Sales | $ | 811 | | | $ | 710 | | | $ | 842 | | |
| Operating Profit (Loss) | Operating Profit (Loss) | $ | 25 | | | $ | (49) | | | $ | (24) | | | $ | 1 | | | $ | (81) | | | $ | (80) | | Operating Profit (Loss) | $ | (16) | | | $ | (49) | | | $ | 35 | | |
Global Cellulose Fibers net sales in the secondfirst quarter of 2023 were 4% lower compared with the fourth quarter of 2022 were 11%and 14% higher than in the first quarter of 2022. Operating profit was lower in the first quarter of 2023 compared with the fourth quarter of 2022 and improved compared with the first quarter of 2022 and 16% higher than2022.
Sales volumes in the secondfirst quarter of 2021. Operating profit in2023 compared with the secondfourth quarter of 2022 improvedwere lower due to seasonality and customer inventory destocking. Total maintenance and economic downtime was about 100,000 short tons higher in the first quarter of 2023 compared towith the firstfourth quarter of 2022 driven by economic downtime. Average sales margins were slightly lower as the
quarter of 2022benefits from contract restructuring was offset by price index movement and an unfavorable product mix. Operating costs were higher driven by economic downtime and the second quarternon-repeat of 2021. Earnings were impacted by favorable one-time items for employee benefit costs and medical claims in the secondfourth quarter of 2022.
Sales volumes Planned maintenance downtime costs in the secondfirst quarter of 20222023 were $11 million higher compared with the fourth quarter of 2022. Input costs were lower, primarily for energy and wood.
Compared with the first quarter of 2022, sales volumes in the first quarter of 2023 were slightly higher despite continuing supply chain challenges.lower driven by customer inventory destocking. Total maintenance and economic downtime was about 30,000132,000 short tons lowerhigher in the second quarter of 2022 compared with the first quarter of 20222023, mainly due to maintenanceeconomic downtime. Average sales margins improved significantly,were higher reflecting higher average sales price for both fluff pulp and market pulp.prices partially offset by an unfavorable product mix. Operating costs were lower, reflecting improved mill performancehigher driven by economic downtime and seasonality.distribution costs. Planned maintenance downtime costs in the secondfirst quarter of 20222023 were $25$1 million lower compared with the first quarter of 2022. Input costs were higher primarily for chemicals and wood partially offset by lower energy and chemicals. Earnings were impacted by favorable one-time items incosts.
Entering the second quarter of 2022.
Compared with the second quarter of 2021,2023, sales volumes in the second quarter of 2022 were lower driven by on-going logistics challenges. Total maintenance and economic downtime was about 16,000 short tons lower in the second quarter of 2022, dueare expected to maintenance downtime.be higher. Average sales prices were higher for both fluff and market pulp. Operating costs were higher duemargins are expected to logistics challenges and inflation. Distribution costs were also higher.be lower. Planned maintenance downtime costs in the second quarter of 2022 were $6 million higher compared with the second quarter of 2021. Input costs were higher primarily for wood, chemicals and energy.
Entering the third quarter of 2022, sales volumes2023 are expected to be stable and constrained by continued logistics challenges. Average sales margins are expected to be higher. Planned maintenance downtime costs in the third quarter of 2022 are expected to be $24$33 million lower compared with the secondfirst quarter of 2022.2023. Operating costs are expected to be higher.lower. Input costs are expected to be higher. Earnings are expected to be impacted by the non-repeat of favorable one-time items in the second quarter of 2022.lower.
Equity Earnings, Net of Taxes – Ilim
International Paper accounts forOn January 24, 2023, the Company announced it had reached an agreement to sell its 50% equity interestinvestment in Ilim usingand also received from the same purchasers an indication of interest to purchase its equity methodinvestment in Ilim Group. This transaction is discussed further in Note 10 - Equity Method Investments of accounting.Item 1. Financial Statements .
In conjunction with the entry into the announced agreement, a determination was made that the book value of the Ilim isand Ilim Group investments plus associated cumulative translation losses, exceeded fair value, based upon the agreed upon transaction price for Ilim and the offer price for Ilim Group. As a separate reportable industry segment with primary operationsresult, an other than temporary impairment of $43 million and $533 million was recorded in Russia. During the first quarter of 2023 and fourth quarter of 2022, respectively, to write down these investments to fair value. The impairment charges included approximately $43 million and $375 million of foreign currency cumulative translation adjustment loss in the Company announced its intentionfirst quarter of 2023 and fourth quarter of 2022, respectively. As of March 31, 2023, the approximately $418 million of cumulative translation adjustment loss remained within AOCI with the recognition of this loss recorded as an offset to explore strategic options, including a salethe investment balance.
All current and historical results of its 50% ownershipthe Ilim joint venture investment are presented as Discontinued Operations, net of taxes in Ilim.the consolidated statement of operations. The Company recorded equity earnings, net of taxes, related to Ilim of $95$43 million in the secondfirst quarter of 2022,2023, compared with earnings of $45 million in the fourth quarter 2022 and $93 million in the first quarter of 2022 and $101 million in the second quarter of 2021.2022. In the secondfirst quarter of 2022, foreign exchange gains (losses) of $13($15) million, arewere included in equity earnings, compared with ($15) million in the first quarter of 2022 and ($2) million in the second quarter of 2021. earnings.Ilim Group had no US dollar-denominated debt outstanding at June 30,March 31, 2023 and December 31 2022. There is
Compared with the fourth quarter of 2022, results in the first quarter of 2023 were relatively flat, reflecting the negative impact of lower volumes and lower average sales prices, offset by lower operating costs and the positive impact of a weaker ruble. Sales volumes in the first quarter of 2023 were 10% lower driven primarily by lower sales of softwood pulp in China, other export markets and Russia. Sales of hardwood pulp declined sharply in other export markets and Russia, but were partially offset by higher sales of hardwood pulp in China. Containerboard sales declined in China and other export markets, but were more than offset by significantly higher sales of containerboard in Russia. Average sales margins were markedly lower for sales of softwood pulp, hardwood pulp and containerboard reflecting lower average sales prices in all markets. Input costs were relatively flat. Lower maintenance and no recourseoutages in the first quarter of Ilim debt2023 contributed to International Paper.a decrease in operating costs.
Compared with the first quarter of 2022, lower sales volumes, declining average sales margins, higher input costs due to inflation, and higher operating costs contributed to lower earnings in the first quarter of 2023. Sales volumes in the secondfirst quarter of 2022 edged2023 were 7% lower as shipments of softwood pulp, hardwood pulp and containerboard to Europe and other export countries declined, but were partially offset by higher led byshipments of those products to China. In Russia, sales of containerboard shipments to China, whichwere higher, but were partially offset by lower shipmentssales of softwood pulp and hardwood pulp. Average sales margins were significantly lower reflecting lower average sales prices for sales of containerboard in China, Russia and other export markets, partially offset by higher average sales margins for sales of softwood pulp and hardwood pulp to other export markets. In Russia, shipments overall were moderately lower, as higher containerboard shipments were partially offset by higher softwood pulp and hardwood pulp shipments. Average sales prices for softwood pulp and hardwood pulp increased in all markets. Average sales prices for containerboard were lower in China and other export markets, but were higher in Russia. CostsInput costs for wood and fuel increased. The sale of timber and energy increased. Logistical constraintssaw logs declined. Transportation costs decreased as transportation tariffs and shipping routes were changed. The Company received cash dividends from the joint venture of $0 million in the second quarterfirst three months of 2022 drove distribution costs higher. Planned mill maintenance outage costs were also higher2023 and $204 million in the second quarterfirst three months of 2022.
Compared with the second quarter of 2021, sales volumes in the second quarter of 2022 were lower particularly for shipments to export markets other than China. Shipments to China were higher primarily for containerboard. Shipments in Russia increased for softwood pulp and hardwood pulp, but were offset by a decrease in containerboard shipments. Average sales margins for softwood pulp and hardwood pulp increased reflecting higher average sales prices in all regions. Average sales prices for containerboard increased in Russia, but were lower in China and other export markets.
Looking forward to the third quarter
Cash provided by operations totaled $978$345 million for the first sixthree months of 2022,2023, compared with $1.3 billion$588 million for the comparable 2021 six-month2022 three-month period.
Investments in capital projects, net of insurance recoveries, totaled $371$341 million in the first sixthree months of 2022,2023, compared to $222$185 million in the first sixthree months of 2021.2022. Full-year 20222023 capital spending is currently expected to be approximately $1.0 billion to $1.2 billion, or 91%99% to 118% of depreciation and amortization.
Financing activities for the first sixthree months of 20222023 included a $11$257 million net decreaseincrease in debt versus a $910$85 million net decreaseincrease in debt during the comparable 2021 six-month2022 three-month period.
Amounts related to early debt extinguishmentSee Note 15 - Debt of Item 1. Financial Statements for a discussion of various debt-related actions taken by the Company during the three and six months ended June 30, 2022 and 2021 were as follows: | | | | | | | | | | | | | | | | | | | | | | | |
| | Three Months Ended
June 30, | | Six Months Ended
June 30, |
| In millions | 2022 | | 2021 | | 2022 | | 2021 |
| Early debt reductions (a) | $ | 5 | | | $ | 790 | | | $ | 5 | | | $ | 897 | |
| Pre-tax early debt extinguishment (gain) loss, net | — | | | 170 | | | — | | | 188 | |
(a)Reductions related to notes with interest rates ranging from 4.35% to 4.40% with original maturities from 2047 to 2048 and from 3.00% to 5.15% with original maturities 2027 to 2048There were no early debt reductions for the three month ended June 30, 2022 and 2021, respectively, and from 4.35% to 4.40% with original maturities from 2047 to 2048 and from 3.00% to 5.15% with original maturities 2027 to 2048 for the six months ended June 30,March 31, 2023 and 2022, and 2021, respectively.
At June 30, 2022,March 31, 2023, contractual obligations for future payments of debt maturities (including finance lease liabilities disclosed in Note 119 - Leases and excluding the timber monetization structuresstructure disclosed in Note 1614 - Variable Interest Entities) by calendar year were as follows: $104 million in 2022; $359$352 million in 2023; $149$148 million in 2024; $206$191 million in 2025; $74$144 million in 2026; $298 million in 2027; and $4.7 billion thereafter.
Maintaining an investment-grade credit rating is an important element of International Paper’s financing strategy. At June 30, 2022,March 31, 2023, the Company held long-term credit ratings of BBB (stable outlook) and Baa2 (stable outlook) by S&P and Moody’s, respectively. In addition, the Company held short-term credit ratings of A2 and P2 by S&P and Moody's, respectively, for borrowings under the Company's commercial paper program.
At June 30, 2022,March 31, 2023, International Paper’s credit agreements totaled $2.0 billion, which is comprised of the $1.5 billion contractually committed bank credit agreement and up to $500 million under the receivables securitization program. Management believes these credit agreements are adequate to cover expected operating cash flow variability during the current economic cycle. The credit agreements generally provide for interest rates at a floating rate index plus a pre-determined margin dependent upon International Paper’s credit rating. At June 30, 2022,March 31, 2023, the Company had no borrowings outstanding under the $1.5 billion credit agreement or the $500 million receivables securitization program. The Company’s credit agreements are not subject to any restrictive covenants other than the financial covenants as disclosed in Note 1715 - Debt, and the borrowings under the receivables securitization program being limited by eligible receivables. The Company was in compliance with all its debt covenants at June 30, 2022March 31, 2023 and was well below the thresholds stipulated under the covenants as defined in the credit agreements. Further the financial covenants do not restrict any borrowings under the credit agreements.
In addition to the $2.0 billion capacity under the Company's credit agreements, International Paper has a commercial paper program with a borrowing capacity of $1.0 billion supported by its $1.5 billion credit agreement. Under the terms of the program, individual maturities on borrowings may vary, but not exceed one year from the date of issue. Interest bearing notes may be issued either as fixed or floating rate notes. As of June 30, 2022,March 31, 2023, the Company had no borrowings outstanding under the program.
During the first quarter of 2023, the Company entered into a variable term loan agreement providing for a $600 million term loan which was fully drawn on the date of such loan agreement and matures in 2028. The $600 million debt was issued following the repayment of $410 million of commercial paper earlier in 2023 and will be used to repay debt maturing later in 2023 and general corporate purposes.
International Paper expects to be able to meet projected capital expenditures, service existing debt, meet working capital and dividend requirements and make common stock and/or debt repurchases for the next 12 months and for the foreseeable future thereafter with current cash balances and cash from operations, supplemented as required by its existing credit facilities. The Company will continue to rely on debt and capital markets for the majority of any necessary long-term funding not provided by operating cash flows. Funding decisions will be guided by our capital structure planning objectives. The primary goals of the Company’s capital structure planning are to maximize financial flexibility and maintain appropriate levels of liquidity to meet our needs while managing balance sheet debt and interest expense, and we have repurchased, and may continue to repurchase, our common stock (under our existing share repurchase program) and debt (including in open market purchases) to the extent consistent with this capital structure planning. The majority of International Paper’s debt is accessed through global public capital markets where we have a wide base of investors.
During the first sixthree months of 2022,2023, International Paper used 1.5 million shares of treasury stock for various incentive plans. International Paper also acquired 18.14.8 million shares of treasury stock, including restricted stock tax withholdings. Repurchases of common stock and payments of restricted stock withholding taxes totaled $823$177 million, including $801$157 million related to shares repurchased under the Company's repurchase program. Our current share repurchase program approved by our Board of Directors on October 12, 2021,11, 2022, which does not have an expiration date, has approximately $2.12$3.01 billion aggregate amount of shares of common stock remaining authorized for purchase as of June 30, 2022.
During the first sixthree months of 2021,2022, International Paper used approximately 1.81.5 million shares of treasury stock for various incentive plans. International Paper also acquired 4.19.4 million shares of treasury stock, including restricted stock tax withholding. Repurchases of common stock and payments of restricted stock withholding taxes totaled $213$428 million, including $186$406 million related to shares repurchased under the Company's repurchase program.
Cash dividend payments related to common stock totaled $344$162 million and $403$174 million for the first sixthree months of 20222023 and 2021,2022, respectively. Dividends were $0.9250 per share and $1.0250$0.4625 per share for the both of the first sixthree months in 2022of 2023 and 2021, respectively.2022.
Our pension plan is currently sufficiently funded and we do not anticipate any required contributions for the next 12 months.
Variable Interest Entities
Information concerning variable interest entities is set forth in Note 15 in the Company's Annual Report on Form 10-K for the year ended December 31, 2021.2022. In connection with the 2006 International Paper installment sale of forestlands, we received $4.8 billion of installment notes. These installment notes were used by variable interest entities as collateral for borrowings from third-party lenders. These variable interest entities were restructured in 2015 when the installment notes and third-party loans were extended. The restructured variable interest entities held installment notes of $4.8 billion and third-party loans of $4.2 billion which both matured in August 2021. We settled the third-party loans at their maturity with the proceeds from the installment notes. This resulted in cash proceeds of approximately $630 million representing our equity in the variable interest entities. Maturity of the installment notes and termination of the monetization structure also resulted in a $72 million tax liability that was paid in the fourth quarter of 2021. On September 2, 2022, the Company and the Internal Revenue Service agreed to settle the 2015 Financing Entities timber monetization restructuring tax matter. Under this agreement, the Company will fully resolve the matter and pay $252 million in U.S. federal income taxes. As a result, interest will also be charged upon closing of the audit. The amount of interest expense recognized in 2022 was $58 million. As of June 30, 2022,March 31, 2023, $252 million in U.S. federal income taxes and $58 million in interest expense have been paid as a result of the Company'ssettlement agreement. The Company has now fully satisfied the payment terms of the settlement agreement regarding the 2015 Financing Entities timber monetization restructuring tax matter. The reversal of the Company’s remaining deferred tax liability associated with the 2015 Financing Entities of $604 million was $813 million. The nature and timing ofrecognized as a one-time tax benefit in the income tax due related to these transactions is currently under review by the Internal Revenue Service (IRS). During the secondthird quarter of 2022, the Company entered into a voluntary mediation program with the IRS which could accelerate the resolution of this matter. The ultimate outcome of the IRS’s examination remains uncertain; however, an unfavorable resolution in such current examination, future administrative procedures, or future tax litigation could result in material, accelerated cash tax payments as a result of all or a portion of deferred tax liability becoming payable.
Ilim S.A. Shareholders’ Agreement
In October 2007, in connection with the formation of the Ilim joint venture, International Paper entered into a shareholders' agreement with an initial 15-year term expiring in October 2022 that automatically renews for successive five-year terms, unless terminated by either party. We continue to actively explore strategic options with respect to the Ilim joint venture, including a sale of our 50% equity interest in Ilim. While we may sell our equity interests in the Ilim joint venture in the future, we cannot be certain if and when this may occur, or the impact that possible disruptions in the capital markets, or conditions associated with the Russia-Ukraine conflict, could have on the value of and our ability to sell our equity interests in the Ilim joint venture and the timing of any such sales.2022.
CRITICAL ACCOUNTING POLICIES AND SIGNIFICANT ACCOUNTING ESTIMATES
The preparation of financial statements in conformity with accounting principles generally accepted in the United States requires International Paper to establish accounting policies and to make estimates that affect both the amounts and timing of the recording of assets, liabilities, revenues and expenses. Some of these estimates require judgments about matters that are inherently uncertain.
Accounting policies whose application may have a significant effect on the reported results of operations and financial position of International Paper, and that can require judgments by management that affect their application, include accounting for contingencies, impairment or disposal of long-lived assets, goodwill and other intangible assets, pensions and income taxes.
The Company has included in its Annual Report a discussion of these critical accounting policies, which are important to the portrayal of the Company’s financial condition and results of operations and require management’s judgments. The Company has not made any changes in these critical accounting policies during the first sixthree months of 2022.2023.
FORWARD-LOOKING STATEMENTS
Certain statements in this Quarterly Report on Form 10-Q that are not historical in nature may be considered “forward-looking statements” within the meaning of the Private Securities Litigation Reform Act of 1995. Words such as “expects,” “anticipates,” “believes,” “estimates” and similar expressions identify forward-looking statements. These statements are not guarantees of future performance and reflect management’s current views and are subject to risks and uncertainties that could cause actual results to differ materially from those expressed or implied in these statements. Factors which could cause actual
results to differ include but are not limited to: (i) risks with respect to climate change and global, regional, and local weather conditions, as well as risks related to our ability to meet targets and goals with respect to climate change and the emission of
GHGs and other environmental, social and governance matters; (ii) the level of our indebtedness and changes in interest rates (including the impact of current elevated interest rate levels); (iii) the impact of global and domestic economic conditions and industry conditions, including with respect to current negative macroeconomic conditions, inflationary pressures and changes in the cost or availability of raw materials, energy sources and transportation sources, supply chain shortages and disruptions, competition we face, cyclicality and changes in consumer preferences, demand and pricing for our products, and conditions impacting the credit, capital and financial markets, including possible instability in such markets and/or disruptions to the banking system due to potential or actual bank failures; (iv) domestic and global geopolitical conditions, changes in currency exchange rates, trade protectionist policies, downgrades in our credit ratings, and/or the credit ratings of banks issuing certain letters of credit, issued by recognized credit rating organizations; (v) the amount of our future pension funding obligations, and pension and healthcare costs; (vi) unanticipated expenditures or other adverse developments related to compliance with existing and new environmental, tax, labor and employment, privacy, anti-bribery and anti-corruption, and other U.S. and non-U.S. governmental laws and regulations; (vii) any material disruption at any of our manufacturing facilities or other adverse impact on our operations due to severe weather, natural disasters, climate change or other causes; (viii) the impact of the conflict involving Russia and Ukraine, including in connection with related escalated sanctions imposed by the United States, the European Union, G7 and other countries and possible actions by the Russian government, and the impact of such developments on domestic and global economic and geopolitical conditions in general and on us and our Ilim joint venture, which could be materially and adversely affected by such developments, and our inability to predict the full impact of the Russian invasion of Ukraine, current or future sanctions, current or future actions by the Russian government, geopolitical instability and the possibility of broadened military conflict on our Ilim joint venture, and on our receipt of dividends from our Ilim joint venture; (iii)venture and on our ability to complete the possible impactsale of these developments involving Ukraine and Russia and potential negative capital markets conditionsour interest in the Ilim joint venture under the terms of the agreement with our joint venture partners to purchase our interest (and, if we are unable to complete such a sale, on the value of and our ability to sell all or a portion of our equity stake in Sylvamo Corporation and the timing of any such sales; (iv) the impact of and developments relatedinterest to the ongoing COVID-19 pandemic; (v) the level of our indebtedness and changes in interest rates; (vi) the impact of global and domestic economic conditions and industry conditions, including with respect to commercial activity, inflationary pressures and changes in the cost or availability of raw materials, energy sources and transportation sources, supply chain shortages and disruptions, the availability of labor, particularly in light of current labor market conditions which are exceptionally tight, competition we face, cyclicality and changes in consumer preferences, demand and pricing for our products, and conditions impacting the credit, capital and financial markets; (vii) domestic and global geopolitical conditions, changes in currency exchange rates, trade protectionist policies, downgrades in our credit ratings, and/or the credit ratings of banks issuing certain letters of credit, issued by recognized credit rating organizations; (viii) the amount of our future pension funding obligations, and pension and healthcare costs;another purchaser); (ix) unanticipated expenditures or other adverse developments related to compliance with existing and new environmental, tax, labor and employment, privacy, anti-bribery and anti-corruption, and other U.S. and non-U.S. governmental laws and regulations; (x) any material disruption at any of our manufacturing facilities or other adverse impact on our operations due to severe weather, natural disasters, climate change or other causes; (xi) risks inherent in conducting business through joint ventures; (xii)(x) our ability to achieve the benefits expected from, and other risks associated with, acquisitions, joint ventures, divestitures, spinoffs and other corporate transactions, (xiii)(xi) cybersecurity and information technology risks; (xiv)(xii) loss contingencies and pending, threatened or future litigation, including with respect to environmental related matters; (xv)(xiii) our exposure to claims under our agreements with Sylvamo Corporation; (xvi)(xiv) our failure to realize the anticipated benefits of the spin-off of Sylvamo Corporation and the qualification of such spin-off as a tax-free transaction for U.S. federal income tax purposes; and (xvii)(xv) our ability to attract and retain qualified personnel.personnel, particularly in light of current labor market conditions. These and other factors that could cause or contribute to actual results differing materially from such forward-looking statements can be found in our press releases and SEC filings. In addition, other risks and uncertainties not presently known to the Company or that we currently believe to be immaterial could affect the accuracy of any forward-looking statements. The Company undertakes no obligation to publicly update any forward-looking statements, whether as a result of new information, future events or otherwise.
Information relating to quantitative and qualitative disclosures about market risk is shown on pages 39-4041-42 of International Paper’s Annual Report, which information is incorporated herein by reference. There have been no material changes in the Company’s exposure to market risk since December 31, 2021.2022.
Evaluation of Disclosure Controls and Procedures:
Disclosure controls and procedures are controls and other procedures that are designed to ensure that information required to be disclosed in our reports filed or submitted under the Securities Exchange Act of 1934, as amended (Exchange Act), is recorded, processed, summarized and reported (and accumulated and communicated to management, including our Chief Executive Officer and Chief Financial Officer, to allow timely decisions regarding required disclosure) within the time periods specified in the Securities and Exchange Commission’s rules and forms. As of the end of the period covered by this Form 10-Q, we conducted an evaluation, under the supervision and with the participation of our management, including the Chief Executive Officer and Chief Financial Officer, of the effectiveness of our disclosure controls and procedures pursuant to Rules 13a-15 and 15d-15 of the Exchange Act. Based upon that evaluation, our Chief Executive Officer and Chief Financial Officer concluded that the Company’s disclosure controls and procedures were effective as of June 30, 2022March 31, 2023 (the end of the period covered by this Form 10-Q).
Changes in Internal Control over Financial Reporting:
There have been no changes in our internal control over financial reporting during the quarter ended June 30, 2022March 31, 2023 that have materially affected, or are reasonably likely to materially affect, our internal control over financial reporting.
A discussion of material developments regarding certain legal proceedings involving the Company occurring in the period covered by this Form 10-Q is found in Note 1513 of the Condensed Notes to the Consolidated Financial Statements in this Form 10-Q, which is incorporated by reference herein. The Company is not subject to any administrative or judicial proceeding arising under any Federal, State or local provisions that have been enacted or adopted regulating the discharge of materials into the environment or primarily for the purpose of protecting the environment that is likely to result in monetary sanctions of $1 million or more.
There have been no material changes from the risk factors disclosed in Part I, Item 1A of our Annual Report other than as discussed below.
Our financial results and businesses, including our Ilim joint venture and equity interest in Sylvamo Corporation, have been adversely and may continue to be affected byon Form 10-K for the current military conflict between Russia and Ukraine, including ongoing or future sanctions and export controls targeting Russia and other responses to Russia's invasion of Ukraine.
The global economy has been, and may continue to be, negatively impacted by Russia’s invasion of Ukraine. As a result of Russia's invasion of Ukraine, the United States, the United Kingdom, the European Union and other G7 countries, among other countries, have imposed coordinated financial and economic sanctions and export-control measures on certain industry sectors and parties in Russia. Some of these measures include: (i) comprehensive financial sanctions against major Russian banks; (ii) additional designations of Russian individuals with significant business interests and government connections; (iii) designations of individuals and entities involved in Russian military activities; and (iv) enhanced export controls and trade sanctions targeting Russia's import of various goods. The negative impacts arising from the conflict and these sanctions have included and may continue to include reduced consumer demand, supply chain disruptions and increased costs for transportation, energy, and raw materials. We will continue to monitor the conflict and the potential impact of financial and economic sanctions on the regional and global economy.
We have a 50% equity interest in Ilim, the parent company of Ilim Group, whose primary operations are in Russia. Specifically, Ilim Group’s facilities include three paper mills located in Bratsk, Ust-Ilimsk, and Koryazhma, Russia, with combined total pulp and paper capacity of over 3.6 million metric tons. In joint ventures, such as the Ilim joint venture, we share ownership and management of a company with one or more parties who may or may not have the same goals, strategies, priorities or resources as we do. Ilim, and its directors and employees are not specially designated nationals or blocked persons or otherwise named in sanctions issued by the United States or other countries. We also have an equity interest in Sylvamo Corporation, which is a standalone, publicly traded company created by the spin-off of our Printing Papers business in October 2021. Sylvamo Corporation reported that Russian operations accounted for roughly 15% of its 2021 total revenue, as of Mayfiscal year ended December 31, 2022 it reported operating its Russian mill in accordance with applicable sanction regimes as it continues to assess various options for its operations in that country.
The military conflict between Russia and Ukraine, including ongoing sanctions, actions by the Russian government, and associated domestic and global economic and geopolitical conditions, has adversely affected and may continue to adversely affect our Ilim joint venture and our businesses, financial condition, results of operations and cash flows. We are unable to predict the full impact that Russia’s ongoing invasion of Ukraine, current or potential future sanctions, potential embargoes, supply chain disruptions, geopolitical instability and shifts, and the possibility of broadened military conflict may have on us or our Ilim joint venture, including on whether our Ilim joint venture will be able to continue to pay dividends to us. We continue to explore strategic options, including a sale of our equity interest in the Ilim joint venture and the sale of our interest in Sylvamo Corporation, but we cannot be certain if and when this may occur. Further, potential disruptions resulting from the conflict or negative economic or capital market conditions more generally may adversely impact the value of and our ability to sell all or a portion of our equity interest in Sylvamo Corporation or our interest in the Ilim joint venture and the timing of any such sales. In addition, the effects of further escalated or prolonged military conflict could heighten many of our known risks described in Part(Part I, Item 1A. “Risk Factors” in our Annual Report. Such risks include, but are not limited to, adverse effects on global business and economic conditions, including volatility and increases in the price and demand of oil and natural gas and inflation and demand for our products, increased cyber security risks, adverse changes in trade policies, taxes, government regulations, our ability to implement and execute our business strategy including with respect to joint ventures, divestitures, spin-offs, capital investments and other corporate transactions that we have pursued or may pursue, disruptions in global supply chains, risks related to employees and contracts in the affected regions, our exposure to foreign currency fluctuations and potential nationalizations and asset seizures in Russia, constraints, volatility, or disruption in the capital markets and our sources of liquidity, and our potential inability to service our remaining performance obligations and potential contractual breaches and litigations. Additionally, fluctuations in the value of the Russian ruble versus the U.S. dollar impacts our investment carrying value as well as financial results based on translation of ruble denominated results into U.S. dollars and the remeasurement impact associated with non-functional currency financial assets and liabilities.
In particular, our investments in Ilim and Sylvamo Corporation involve certain legal, geopolitical, investment, repatriation, and transparency risks as a result of the military conflict between Russia and Ukraine including: (i) the legal framework of Russia continues to rapidly evolve and it is not possible to accurately predict the content or implications of changes in their statutes or regulations. For example, the Russian Parliament is considering legislation that could result in nationalization, expropriation or other unfavorable regulations and may be introduced at any time without prior warning or consultation; (ii) current and future statutes and regulations may be unfairly or unevenly enforced, the courts may decline to enforce legal protections covering our investments altogether and the cost and difficulties of litigation in Russia may make enforcement of our rights impractical or impossible.; (iii) the risk we may inadvertently violate sanctions that may be imposed by the United States or foreign governments, including Russia, given the complexity and rapidly changing nature of the situation; (iv) financial and economic sanctions and export-control measures imposed on certain industry sectors and parties in Russia as well as counter-sanctions measures implemented by Russia could lead to further disruptions in supply chains and adversely affect operations in Russia; (v) increased risks of economic, political, or social instability, escalating military conflicts with Ukraine or new conflicts with any other countries, war, or terrorism, which could adversely affect the economies of Russia or lead to a material adverse change in the value of our investments in Russia; and (vi) disclosure, accounting, and financial standards and requirements in Russia may rapidly evolve and it is not possible to accurately predict the content or implications of changes in their disclosure requirements.1A).
PURCHASES OF EQUITY SECURITIES BY THE ISSUER AND AFFILIATED PURCHASERS. | | | | | | | | | | | | | | |
| Period | Total Number of Shares Purchased (a) | Average Price Paid per Share | Total Number of Shares Purchased as Part of a Publicly Announced Plan or Program | Maximum Number (or Approximate Dollar Value) of Shares that May Yet Be Purchased Under the Plans or Programs (in billions) |
| April 1, 2022 - April 30, 2022 | 1,422,545 | $46.55 | 1,420,340 | $2.45 |
| May 1, 2022 - May 31, 2022 | 2,099,262 | 47.61 | 2,096,336 | 2.35 |
| June 1, 2022 - June 30, 2022 | 5,134,940 | 44.58 | 5,134,940 | 2.12 |
| Total | 8,656,747 | | | |
| | | | | | | | | | | | | | |
| Period | Total Number of Shares Purchased (a) | Average Price Paid per Share | Total Number of Shares Purchased as Part of a Publicly Announced Plan or Program | Maximum Number (or Approximate Dollar Value) of Shares that May Yet Be Purchased Under the Plans or Programs (in billions) |
| January 1, 2023 - January 31, 2023 | 213,568 | $34.74 | 211,409 | $3.15 |
| February 1, 2023 - February 28, 2023 | 2,225,142 | 39.04 | 1,739,884 | 3.09 |
| March 1, 2023 - March 31, 2023 | 2,313,792 | 35.88 | 2,314,259 | 3.00 |
| Total | 4,752,502 | | | |
(a) 5,131486,951 shares were acquired from employees or board members as a result of share withholdings to pay income taxes under the Company's restricted stock program. The remainder were purchased under a share repurchase program. Under current Board authorization that was increased on October 12, 2021, we are authorized to purchase, in open market transactions (including block trades), privately negotiated transactions or otherwise, up to $3.3As of March 31, 2023 approximately $3.01 billion ofaggregate shares of our common stock.stock remained authorized for repurchase under a previous Board authorization. This authorization was increased by our Board on October 11, 2022, up to a total of $3.35 billion shares. This repurchase program does not have an expiration date. As of June 30, 2022, approximately $2.12 billion aggregate amount of shares of our common stock remained authorized for purchase under this program.
Not applicable.
Not applicable.
Not applicable.
ITEM 6. EXHIBITS | | | | | | | | |
| 31.1 | | |
| |
| 31.2 | | |
| |
| 32 | | |
| |
| 101.INS | | XBRL Instance Document - the instance document does not appear in the Interactive Data File because its XBRL tags are embedded within the inline XBRL document. |
| |
| 101.SCH | | XBRL Taxonomy Extension Schema. |
| |
| 101.CAL | | XBRL Taxonomy Extension Calculation Linkbase. |
| |
| 101.DEF | | XBRL Taxonomy Extension Definition Linkbase. |
| |
| 101.LAB | | XBRL Taxonomy Extension Label Linkbase. |
| |
| 101.PRE | | XBRL Extension Presentation Linkbase. |
| | |
| 104 | | Cover Page Interactive Data File (formatted as Inline XBRL, and contained in Exhibit 101). |
Pursuant to the requirements of the Securities Exchange Act of 1934, the registrant has duly caused this report to be signed on its behalf by the undersigned thereunto duly authorized. | | | | | | | | |
| INTERNATIONAL PAPER COMPANY
(Registrant) |
| | |
July 29, 2022April 28, 2023 | By | /s/ Tim S. Nicholls |
| | Tim S. Nicholls |
| | Senior Vice President and Chief
Financial Officer |
| | |
July 29, 2022April 28, 2023 | By | /s/ Holly G. Goughnour |
| | Holly G. Goughnour |
| | Vice President – Finance and Corporate Controller |