UNITED STATES
SECURITIES AND EXCHANGE COMMISSION
Washington, D.C. 20549
Form 10-Q
|
| |
ý☒ | QUARTERLY REPORT PURSUANT TO SECTION 13 OR 15(d) OF THE SECURITIES EXCHANGE ACT OF 1934 |
| For the quarterly period ended September 30, 2017 |
For the quarterly period ended March 31, 2020
or
|
| |
¨☐ | TRANSITION REPORT PURSUANT TO SECTION 13 OR 15(d) OF THE SECURITIES EXCHANGE ACT OF 1934 |
| | For the transition period from to |
Commission File Number 1-4717
KANSAS CITY SOUTHERN
(Exact name of registrant as specified in its charter)
|
| | | | | | |
| Delaware | | | | 44-0663509 |
(State or other jurisdiction of incorporation or organization) | | | (I.R.S. Employer Identification No.) |
427 West 12th Street Kansas City, Missouri
| | |
|
| Kansas City | , | Missouri | | | 64105 |
| (Address of principal executive offices) | | | (Zip Code) |
816.983.1303816.983.1303
(Registrant’s telephone number, including area code)
No Change
(Former name, former address and former fiscal year, if changed since last report.)
Securities registered pursuant to Section 12(b) of the Act:
|
| | |
| Title of Each Class | Trading Symbol(s) | Name of Each Exchange on Which Registered |
| Preferred Stock, Par Value $25 Per Share, 4%, Noncumulative | KSU | New York Stock Exchange |
| Common Stock, $.01 Per Share Par Value | KSU | New York Stock Exchange |
Indicate by check mark whether the registrant (1) has filed all reports required to be filed by Section 13 or 15(d) of the Securities Exchange Act of 1934 during the preceding 12 months (or for such shorter period that the registrant was required to file such reports), and (2) has been subject to such filing requirements for the past 90 days. Yes ý No ¨☐
Indicate by check mark whether the registrant has submitted electronically, and posted on its corporate Web site, if any, every Interactive Data File required to be submitted and posted pursuant to Rule 405 of Regulation S-T during the preceding 12 months (or for such shorter period that the registrant was required to submit and post such files). Yes ý No ¨☐
Indicate by check mark whether the registrant is a large accelerated filer, an accelerated filer, a non-accelerated filer, a smaller reporting company, or an emerging growth company. See the definitions of “large accelerated filer,” “accelerated filer,” “smaller reporting company,” and “emerging growth company” in Rule 12b-2 of the Exchange Act. (Check one):
Large accelerated filer Accelerated Filer ýAccelerated filer ¨ ☐ Non-accelerated filer (Do not check if a smaller reporting company) ¨
☐ Smaller reporting company ¨ ☐
Emerging growth company ¨☐
If an emerging growth company, indicate by check mark if the registrant has elected not to use the extended transition period for complying with any new or revised financial accounting standards provided pursuant to Section 13(a) of the Exchange Act. ¨☐
Indicate by check mark whether the registrant is a shell company (as defined in Rule 12b-2 of the Exchange Act). Yes ¨☐ No ý
Indicate the number of shares outstanding of each of the issuer’s classes of common stock, as of the latest practicable date.
|
| | |
| Class | | October 13, 2017April 10, 2020 |
| Common Stock, $0.01 per share par value | | 103,543,12195,020,228 Shares |
Kansas City Southern and Subsidiaries
Form 10-Q
September 30, 2017March 31, 2020
Index
|
| | |
| | Page |
| PART I — FINANCIAL INFORMATION | |
| Item 1. | | |
| | | |
| | | |
| | | |
| | | |
| | | |
| | |
| Item 2. | | |
| Item 3. | | |
| Item 4. | | |
| PART II — OTHER INFORMATION | |
| Item 1. | | |
| Item 1A. | | |
| Item 2. | | |
| Item 3. | | |
| Item 4. | | |
| Item 5. | | |
| Item 6. | | |
| | | |
PART I — FINANCIAL INFORMATION
| |
| Item 1. | Financial Statements (unaudited) |
Kansas City Southern and Subsidiaries
Consolidated Statements of Income
| | | | Three Months Ended | | Nine Months Ended | Three Months Ended |
| | September 30, | | September 30, | March 31, |
| | 2017 | | 2016 | | 2017 | | 2016 | 2020 | | 2019 |
| | (In millions, except share and per share amounts) (Unaudited) | (In millions, except share and per share amounts) (Unaudited) |
| Revenues | $ | 656.6 |
| | $ | 604.5 |
| | $ | 1,922.5 |
| | $ | 1,735.7 |
| $ | 731.7 |
| | $ | 674.8 |
|
| Operating expenses: | | | | | | | | | | |
| Compensation and benefits | 129.0 |
| | 127.9 |
| | 371.6 |
| | 347.0 |
| 133.4 |
| | 128.9 |
|
| Purchased services | 46.3 |
| | 54.5 |
| | 146.5 |
| | 159.1 |
| 53.3 |
| | 52.8 |
|
| Fuel | 80.1 |
| | 67.6 |
| | 234.4 |
| | 186.0 |
| 74.9 |
| | 83.0 |
|
| Mexican fuel excise tax credit | (11.1 | ) | | (15.6 | ) | | (35.6 | ) | | (49.6 | ) | |
| Equipment costs | 30.9 |
| | 32.0 |
| | 93.3 |
| | 85.9 |
| 21.9 |
| | 30.4 |
|
| Depreciation and amortization | 81.9 |
| | 76.9 |
| | 241.6 |
| | 226.9 |
| 89.4 |
| | 88.5 |
|
| Materials and other | 65.7 |
| | 61.4 |
| | 186.9 |
| | 172.8 |
| 64.0 |
| | 63.4 |
|
| Restructuring charges | | 6.0 |
| | 67.5 |
|
| Total operating expenses | 422.8 |
| | 404.7 |
| | 1,238.7 |
| | 1,128.1 |
| 442.9 |
| | 514.5 |
|
| Operating income | 233.8 |
| | 199.8 |
| | 683.8 |
| | 607.6 |
| 288.8 |
| | 160.3 |
|
| Equity in net earnings of affiliates | 2.8 |
| | 3.5 |
| | 9.7 |
| | 10.4 |
| 1.0 |
| | 1.7 |
|
| Interest expense | (25.2 | ) | | (25.2 | ) | | (74.9 | ) | | (73.2 | ) | (34.2 | ) | | (28.2 | ) |
| Debt retirement costs | | — |
| | (0.6 | ) |
| Foreign exchange gain (loss) | 0.8 |
| | (19.8 | ) | | 61.8 |
| | (47.3 | ) | (59.5 | ) | | 4.6 |
|
| Other income (expense), net | (0.3 | ) | | — |
| | 0.7 |
| | (0.5 | ) | |
| Other income, net | | 1.4 |
| | 0.1 |
|
| Income before income taxes | 211.9 |
| | 158.3 |
| | 681.1 |
| | 497.0 |
| 197.5 |
| | 137.9 |
|
| Income tax expense | 82.0 |
| | 37.3 |
| | 269.6 |
| | 147.4 |
| 45.2 |
| | 34.7 |
|
| Net income | 129.9 |
| | 121.0 |
| | 411.5 |
| | 349.6 |
| 152.3 |
| | 103.2 |
|
| Less: Net income attributable to noncontrolling interest | 0.6 |
| | 0.4 |
| | 1.2 |
| | 1.1 |
| 0.5 |
| | 0.4 |
|
| Net income attributable to Kansas City Southern and subsidiaries | 129.3 |
| | 120.6 |
| | 410.3 |
| | 348.5 |
| 151.8 |
| | 102.8 |
|
| Preferred stock dividends | 0.1 |
| | 0.1 |
| | 0.2 |
| | 0.2 |
| 0.1 |
| | 0.1 |
|
| Net income available to common stockholders | $ | 129.2 |
| | $ | 120.5 |
| | $ | 410.1 |
| | $ | 348.3 |
| $ | 151.7 |
| | $ | 102.7 |
|
| | | | | | | | | | | |
| Earnings per share: | | | | | | | | | | |
| Basic earnings per share | $ | 1.24 |
| | $ | 1.12 |
| | $ | 3.89 |
| | $ | 3.23 |
| $ | 1.59 |
| | $ | 1.02 |
|
| Diluted earnings per share | $ | 1.23 |
| | $ | 1.12 |
| | $ | 3.88 |
| | $ | 3.23 |
| $ | 1.58 |
| | $ | 1.02 |
|
| | | | | | | | | | | |
Average shares outstanding (in thousands): | | | | | | | | | | |
| Basic | 104,324 |
| | 107,621 |
| | 105,297 |
| | 107,800 |
| 95,662 |
| | 100,500 |
|
| Potentially dilutive common shares | 354 |
| | 191 |
| | 285 |
| | 199 |
| 509 |
| | 415 |
|
| Diluted | 104,678 |
| | 107,812 |
| | 105,582 |
| | 107,999 |
| 96,171 |
| | 100,915 |
|
See accompanying notes to the unaudited consolidated financial statements.
Kansas City Southern and Subsidiaries
Consolidated Statements of Comprehensive Income
| | | | Three Months Ended | | Nine Months Ended | Three Months Ended |
| | September 30, | | September 30, | March 31, |
| | 2017 | | 2016 | | 2017 | | 2016 | 2020 | | 2019 |
| | (In millions)
(Unaudited) | (In millions)
(Unaudited) |
| Net income | $ | 129.9 |
| | $ | 121.0 |
| | $ | 411.5 |
| | $ | 349.6 |
| $ | 152.3 |
| | $ | 103.2 |
|
| Other comprehensive loss: | | | | | | | | |
| Unrealized loss on interest rate derivative instruments during the period, net of tax of $(0.3) million and $(1.8) million, respectively | (0.5 | ) | | — |
| | (2.8 | ) | | — |
| |
| Foreign currency translation adjustments, net of tax of $(0.1) million, $(0.2) million, $0.7 million and $(0.7) million, respectively | (0.2 | ) | | (0.3 | ) | | 1.1 |
| | (1.0 | ) | |
| Other comprehensive loss | (0.7 | ) | | (0.3 | ) | | (1.7 | ) | | (1.0 | ) | |
| Other comprehensive income (loss): | | | | |
| Unrealized gain (loss) on interest rate derivative instruments, net of tax of $1.2 million and $(1.7) million, respectively | | 4.8 |
| | (5.1 | ) |
| Reclassification adjustment from cash flow hedges included in net income, net of tax of $0.1 million | | 0.5 |
| | — |
|
| Foreign currency translation adjustments | | (1.7 | ) | | 0.2 |
|
| Other comprehensive income (loss) | | 3.6 |
| | (4.9 | ) |
| Comprehensive income | 129.2 |
| | 120.7 |
| | 409.8 |
| | 348.6 |
| 155.9 |
| | 98.3 |
|
| Less: Comprehensive income attributable to noncontrolling interest | 0.6 |
| | 0.4 |
| | 1.2 |
| | 1.1 |
| 0.5 |
| | 0.4 |
|
| Comprehensive income attributable to Kansas City Southern and subsidiaries | $ | 128.6 |
| | $ | 120.3 |
| | $ | 408.6 |
| | $ | 347.5 |
| $ | 155.4 |
| | $ | 97.9 |
|
See accompanying notes to the unaudited consolidated financial statements.
Kansas City Southern and Subsidiaries
Consolidated Balance Sheets
| | | | September 30,
2017 | | December 31,
2016 | March 31,
2020 | | December 31,
2019 |
| | (In millions, except share and per share amounts) | (In millions, except share and per share amounts) |
| | (Unaudited) | | | (Unaudited) | | |
| ASSETS | | | | | | |
| Current assets: | | | | | | |
| Cash and cash equivalents | $ | 88.4 |
| | $ | 170.6 |
| $ | 91.0 |
| | $ | 148.8 |
|
| Accounts receivable, net | 237.2 |
| | 191.0 |
| 269.8 |
| | 274.2 |
|
| Materials and supplies | 151.2 |
| | 152.6 |
| 143.6 |
| | 150.6 |
|
| Other current assets | 163.7 |
| | 133.8 |
| 117.5 |
| | 155.0 |
|
| Total current assets | 640.5 |
| | 648.0 |
| 621.9 |
| | 728.6 |
|
| Operating lease right-of-use assets | | 81.4 |
| | 158.4 |
|
| Investments | 51.9 |
| | 32.9 |
| 45.9 |
| | 47.6 |
|
| Property and equipment (including concession assets), net | 8,335.6 |
| | 8,069.7 |
| 8,924.0 |
| | 8,806.3 |
|
| Other assets | 72.3 |
| | 66.9 |
| 92.5 |
| | 45.9 |
|
| Total assets | $ | 9,100.3 |
| | $ | 8,817.5 |
| $ | 9,765.7 |
| | $ | 9,786.8 |
|
| LIABILITIES AND EQUITY | | | | | | |
| Current liabilities: | | | | | | |
| Long-term debt due within one year | $ | 40.5 |
| | $ | 25.4 |
| $ | 17.1 |
| | $ | 18.0 |
|
| Short-term borrowings | 355.9 |
| | 181.3 |
| |
| Accounts payable and accrued liabilities | 528.4 |
| | 537.7 |
| 453.6 |
| | 473.3 |
|
| Total current liabilities | 924.8 |
| | 744.4 |
| 470.7 |
| | 491.3 |
|
| Long-term operating lease liabilities | | 51.4 |
| | 85.7 |
|
| Long-term debt | 2,238.4 |
| | 2,271.5 |
| 3,227.0 |
| | 3,228.0 |
|
| Deferred income taxes | 1,432.3 |
| | 1,289.3 |
| 1,149.2 |
| | 1,128.0 |
|
| Other noncurrent liabilities and deferred credits | 98.4 |
| | 107.8 |
| 105.4 |
| | 107.9 |
|
| Total liabilities | 4,693.9 |
| | 4,413.0 |
| 5,003.7 |
| | 5,040.9 |
|
| Stockholders’ equity: | | | | | | |
| $25 par, 4% noncumulative, preferred stock, 840,000 shares authorized, 649,736 shares issued, 242,170 shares outstanding | 6.1 |
| | 6.1 |
| |
| $.01 par, common stock, 400,000,000 shares authorized; 123,352,185 shares issued; 103,694,613 and 106,606,619 shares outstanding at September 30, 2017 and December 31, 2016, respectively | 1.0 |
| | 1.1 |
| |
| $25 par, 4% noncumulative, preferred stock, 840,000 shares authorized, 649,736 shares issued; 222,625 shares outstanding at March 31, 2020 and December 31, 2019, respectively | | 5.6 |
| | 5.6 |
|
| $.01 par, common stock, 400,000,000 shares authorized; 123,352,185 shares issued; 95,014,649 and 96,115,669 shares outstanding at March 31, 2020 and December 31, 2019, respectively | | 1.0 |
| | 1.0 |
|
| Additional paid-in capital | 930.5 |
| | 954.8 |
| 925.0 |
| | 843.7 |
|
| Retained earnings | 3,160.9 |
| | 3,134.1 |
| 3,532.0 |
| | 3,601.3 |
|
| Accumulated other comprehensive loss | (7.9 | ) | | (6.2 | ) | (25.5 | ) | | (29.1 | ) |
| Total stockholders’ equity | 4,090.6 |
| | 4,089.9 |
| 4,438.1 |
| | 4,422.5 |
|
| Noncontrolling interest | 315.8 |
| | 314.6 |
| 323.9 |
| | 323.4 |
|
| Total equity | 4,406.4 |
| | 4,404.5 |
| 4,762.0 |
| | 4,745.9 |
|
| Total liabilities and equity | $ | 9,100.3 |
| | $ | 8,817.5 |
| $ | 9,765.7 |
| | $ | 9,786.8 |
|
See accompanying notes to the unaudited consolidated financial statements.
Kansas City Southern and Subsidiaries
Consolidated Statements of Cash Flows
| | | | Nine Months Ended | Three Months Ended |
| | September 30, | March 31, |
| | 2017 | | 2016 | 2020 | | 2019 |
| | (In millions) (Unaudited) | (In millions) (Unaudited) |
| Operating activities: | | | | | | |
| Net income | $ | 411.5 |
| | $ | 349.6 |
| $ | 152.3 |
| | $ | 103.2 |
|
| Adjustments to reconcile net income to net cash provided by operating activities: | | | | | | |
| Depreciation and amortization | 241.6 |
| | 226.9 |
| 89.4 |
| | 88.5 |
|
| Deferred income taxes | 146.6 |
| | 117.4 |
| 19.8 |
| | 6.9 |
|
| Equity in net earnings of affiliates | (9.7 | ) | | (10.4 | ) | (1.0 | ) | | (1.7 | ) |
| Share-based compensation | 14.6 |
| | 15.2 |
| 10.3 |
| | 6.0 |
|
| Distributions from affiliates | 5.0 |
| | 5.0 |
| |
| Settlement of foreign currency derivative instruments | (14.4 | ) | | (58.4 | ) | (3.7 | ) | | 0.7 |
|
| (Gain) loss on foreign currency derivative instruments | (45.5 | ) | | 35.8 |
| 33.7 |
| | (3.6 | ) |
| Mexican fuel excise tax credit | (35.6 | ) | | (49.6 | ) | |
| Foreign exchange (gain) loss | | 25.8 |
| | (1.0 | ) |
| Restructuring charges | | 6.0 |
| | 67.5 |
|
| Cash payments for restructuring charges | | (0.5 | ) | | (0.5 | ) |
| Changes in working capital items: | | | | | | |
| Accounts receivable | (46.8 | ) | | (21.5 | ) | (2.9 | ) | | 33.8 |
|
| Materials and supplies | 1.1 |
| | (6.0 | ) | 5.9 |
| | (8.7 | ) |
| Other current assets | (24.4 | ) | | (4.2 | ) | (6.7 | ) | | 4.2 |
|
| Accounts payable and accrued liabilities | 109.0 |
| | 86.3 |
| (38.0 | ) | | (15.6 | ) |
| Other, net | (19.3 | ) | | (2.5 | ) | (7.2 | ) | | (7.0 | ) |
| Net cash provided by operating activities | 733.7 |
| | 683.6 |
| 283.2 |
| | 272.7 |
|
| | | | | | | |
| Investing activities: | | | | | | |
| Capital expenditures | (446.9 | ) | | (405.1 | ) | (98.8 | ) | | (179.9 | ) |
| Purchase or replacement of equipment under operating leases | (42.6 | ) | | (26.6 | ) | |
| Purchase or replacement of assets under operating leases | | (78.2 | ) | | — |
|
| Property investments in MSLLC | (23.7 | ) | | (31.2 | ) | (4.3 | ) | | (4.7 | ) |
| Investments in and advances to affiliates | (20.3 | ) | | (0.9 | ) | (4.3 | ) | | (8.4 | ) |
| Proceeds from disposal of property | 6.6 |
| | 3.6 |
| 3.3 |
| | 2.2 |
|
| Other, net | (15.1 | ) | | (5.8 | ) | (6.3 | ) | | 1.1 |
|
| Net cash used for investing activities | (542.0 | ) | | (466.0 | ) | (188.6 | ) | | (189.7 | ) |
| | | | | | | |
| Financing activities: | | | | | | |
| Proceeds from short-term borrowings | 9,772.2 |
| | 6,499.0 |
| |
| Repayment of short-term borrowings | (9,600.9 | ) | | (6,579.3 | ) | |
| Proceeds from issuance of long-term debt | — |
| | 248.7 |
| |
| Repayment of long-term debt | (20.2 | ) | | (20.8 | ) | (2.4 | ) | | (2.7 | ) |
| Dividends paid | (105.1 | ) | | (107.2 | ) | (38.6 | ) | | (36.4 | ) |
| Shares repurchased | (320.4 | ) | | (99.8 | ) | (111.7 | ) | | (50.3 | ) |
| Debt costs | — |
| | (2.6 | ) | |
| Debt issuance costs paid | | — |
| | (1.6 | ) |
| Proceeds from employee stock plans | 0.5 |
| | 0.9 |
| 4.4 |
| | 0.2 |
|
| Net cash used for financing activities | (273.9 | ) | | (61.1 | ) | (148.3 | ) | | (90.8 | ) |
| | | | | |
| Effect of exchange rate changes on cash | | (4.1 | ) | | — |
|
| | | | | |
| Cash and cash equivalents: | | | | | | |
| Net increase (decrease) during each period | (82.2 | ) | | 156.5 |
| |
| Net decrease during each period | | (57.8 | ) | | (7.8 | ) |
| At beginning of year | 170.6 |
| | 136.6 |
| 148.8 |
| | 100.5 |
|
| At end of period | $ | 88.4 |
| | $ | 293.1 |
| $ | 91.0 |
| | $ | 92.7 |
|
See accompanying notes to the unaudited consolidated financial statements.
Kansas City Southern and Subsidiaries
Consolidated Statements of Changes in Equity
(in millions, except per share amounts)
(Unaudited)
|
| | | | | | | | | | | | | | | | | | | | | | | | | | | |
| | $25 Par Preferred Stock | | $.01 Par Common Stock | | Additional Paid-in Capital | | Retained Earnings | | Accumulated Other Comprehensive Loss | | Non- controlling Interest | | Total |
| |
| | | | | | | | | | | | | | |
| Balance at December 31, 2018 | $ | 5.7 |
| | $ | 1.0 |
| | $ | 946.6 |
| | $ | 3,870.6 |
| | $ | (10.9 | ) | | $ | 319.7 |
| | $ | 5,132.7 |
|
| Net income | | | | | | | 102.8 |
| | | | 0.4 |
| | 103.2 |
|
| Other comprehensive loss | | | | | | | | | (4.9 | ) | | | | (4.9 | ) |
| Contribution from noncontrolling interest | | | | | | | | | | | 1.8 |
| | 1.8 |
|
| Dividends on common stock ($0.36/share) | | | | | | | (36.3 | ) | | | | | | (36.3 | ) |
| Dividends on $25 par preferred stock ($0.25/share) | | | | | | | (0.1 | ) | | | | | | (0.1 | ) |
| Share repurchases | — |
| | — |
| | (4.4 | ) | | (45.9 | ) | | | | | | (50.3 | ) |
| Options exercised and stock subscribed, net of shares withheld for employee taxes | | | | | (2.1 | ) | | | | | | | | (2.1 | ) |
| Share-based compensation | | | | | 6.0 |
| | | | | | | | 6.0 |
|
| Balance at March 31, 2019 | 5.7 |
| | 1.0 |
| | 946.1 |
| | 3,891.1 |
| | (15.8 | ) | | 321.9 |
| | 5,150.0 |
|
| Net income | | | | | | | 128.7 |
| | | | 0.4 |
| | 129.1 |
|
| Other comprehensive loss | | | | | | | | | (7.5 | ) | | | | (7.5 | ) |
| Dividends on common stock ($0.36/share) | | | | | | | (36.0 | ) | | | | | | (36.0 | ) |
| Dividends on $25 par preferred stock ($0.25/share) | | | | | | | — |
| | | | | | — |
|
| Share repurchases | (0.1 | ) | | — |
| | (7.3 | ) | | (85.0 | ) | | | | | | (92.4 | ) |
| Options exercised and stock subscribed, net of shares withheld for employee taxes | | | | | 2.3 |
| | | | | | | | 2.3 |
|
| Share-based compensation | | | | | 6.0 |
| | | | | | | | 6.0 |
|
| Balance at June 30, 2019 | 5.6 |
| | 1.0 |
| | 947.1 |
| | 3,898.8 |
| | (23.3 | ) | | 322.3 |
| | 5,151.5 |
|
| Net income | | | | | | | 180.2 |
| | | | 0.4 |
| | 180.6 |
|
| Other comprehensive loss | | | | | | | | | (7.3 | ) | | | | (7.3 | ) |
| Dividends on common stock ($0.36/share) | | | | | | | (35.6 | ) | | | | | | (35.6 | ) |
| Dividends on $25 par preferred stock ($0.25/share) | | | | | | | (0.1 | ) | | | | | | (0.1 | ) |
| Share repurchases | — |
| | — |
| | (7.7 | ) | | (92.1 | ) | | | | | | (99.8 | ) |
| Options exercised and stock subscribed, net of shares withheld for employee taxes | | | | | 2.7 |
| | | | | | | | 2.7 |
|
| Share-based compensation | | | | | 5.2 |
| | | | | | | | 5.2 |
|
| Balance at September 30, 2019 | 5.6 |
| | 1.0 |
| | 947.3 |
| | 3,951.2 |
| | (30.6 | ) | | 322.7 |
| | 5,197.2 |
|
| Net income | | | | | | | 127.2 |
| | | | 0.7 |
| | 127.9 |
|
| Other comprehensive income | | | | | | | | | 1.5 |
| | | | 1.5 |
|
| Dividends on common stock ($0.40/share) | | | | | | | (38.6 | ) | | | | | | (38.6 | ) |
| Dividends on $25 par preferred stock ($0.25/share) | | | | | | | — |
| | | | | | — |
|
| Share repurchases | — |
| | — |
| | (29.0 | ) | | (438.5 | ) | | | | | | (467.5 | ) |
| Forward contract for accelerated share repurchases | | | | | (82.5 | ) | | | | | | | | (82.5 | ) |
| Options exercised and stock subscribed, net of shares withheld for employee taxes | | | | | 1.2 |
| | | | | | | | 1.2 |
|
| Share-based compensation | | | | | 6.7 |
| | | | | | | | 6.7 |
|
| Balance at December 31, 2019 | 5.6 |
| | 1.0 |
| | 843.7 |
| | 3,601.3 |
| | (29.1 | ) | | 323.4 |
| | 4,745.9 |
|
| Net income | | | | | | | 151.8 |
| | | | 0.5 |
| | 152.3 |
|
| Other comprehensive income | | | | | | | | | 3.6 |
| | | | 3.6 |
|
| Dividends on common stock ($0.40/share) | | | | | | | (38.2 | ) | | | | | | (38.2 | ) |
| Dividends on $25 par preferred stock ($0.25/share) | | | | | | | (0.1 | ) | | | | | | (0.1 | ) |
| Share repurchases | | | — |
| | (11.4 | ) | | (182.8 | ) | | | | | | (194.2 | ) |
| Settlement of forward contract for accelerated share repurchases | | | | | 82.5 |
| | | | | | | | 82.5 |
|
| Options exercised and stock subscribed, net of shares withheld for employee taxes | | | | | (0.1 | ) | | | | | | | | (0.1 | ) |
| Share-based compensation | | | | | 10.3 |
| | | | | | | | 10.3 |
|
| Balance at March 31, 2020 | $ | 5.6 |
| | $ | 1.0 |
| | $ | 925.0 |
| | $ | 3,532.0 |
| | $ | (25.5 | ) | | $ | 323.9 |
| | $ | 4,762.0 |
|
See accompanying notes to the unaudited consolidated financial statements.
Kansas City Southern and Subsidiaries
Notes to the Unaudited Consolidated Financial Statements
For purposes of this report, “KCS” or the “Company” may refer to Kansas City Southern or, as the context requires, to one or more subsidiaries of Kansas City Southern.
1. Basis of Presentation
In the opinion of the management of KCS, the accompanying unaudited consolidated financial statements contain all adjustments (consisting of normal and recurring adjustments) necessary to fairly presentreflect a fair statement of the results for interim periods in accordance with U.S. generally accepted accounting principles (“U.S. GAAP”). Pursuant to the rules and regulations of the Securities and Exchange Commission (“SEC”), certain information and note disclosures normally included in financial statements prepared in accordance with U.S. GAAP have been condensed or omitted. These consolidated financial statements should be read in conjunction with the consolidated financial statements and accompanying notes included in the Company’s Annual Report on Form 10-K for the year ended December 31, 20162019. The results of operations for the three and nine months ended September 30, 2017March 31, 2020, are not necessarily indicative of the results to be expected for the full year ending December 31, 20172020. Certain prior year amounts have been reclassified to conform to the current year presentation.
During the first quarter of 2017,2020, the Company adopted Accounting Standards Update (“ASU”) No. 2016-09, Improvements2016-13, “Financial Instruments - Credit Losses,” which required the Company to Employee Share-Based Payment Accounting. The Company now recognizes forfeitures as they occur rather than estimating a forfeiture ratemeasure all expected credit losses for the year. Excess tax benefits or deficiencies resulting from the exercise or vesting of awards are included in income tax expense infinancial instruments held at the reporting period in which they occur. Upon adoption,date based on historical experience, current conditions, and reasonable supportable forecasts. This replaced the Company recognized a cumulative-effect adjustment to equity at the beginning of 2017, as disclosed in Note 10 - Equity.
During the third quarter of 2017, the Company early adopted ASU No. 2017-12, Derivativesexisting incurred loss model and Hedging: Targeted Improvements to Accounting for Hedging Activities. The Company now asserts qualitatively, on a quarterly basis, that the hedging relationship was and continues to be highly effective as long as facts and circumstances relatedis applicable to the hedging relationship have not changed. If facts and circumstances have changed, the Company will perform a quantitative assessment to ensure the hedging relationship is still deemed highly effective. In addition, the ineffective portionmeasurement of an effective hedge is no longer measured periodically and included in the income statement; rather, the total periodic change in fair value of an effective hedge is included in accumulated other comprehensive incomecredit losses on the balance sheet, until settlement occurs. The adoptionfinancial assets, including trade receivables. Adoption of the new guidance had nostandard did not have a material impact on the Company’s consolidated financial statements as there was no ineffectiveness recognized on the Company’s cash flow hedges prior to adoption.statements.
2. New Accounting Pronouncements
In May 2014, the FASB issued ASU No. 2014-09, Revenue from Contracts with Customers, which requires companies to recognize revenue to depict the transfer of promised goods or services to customers in an amount that reflects the consideration it expects to be entitled in exchange for those goods or services. The new standard will become effective for the Company beginning withDuring the first quarter 2018 andof 2020, the Company plans to adoptearly adopted the accounting standard usingSEC’s, Financial Disclosures About Guarantors and Issuers of Guaranteed Securities and Affiliates Whose Securities Collateralize a Registrant’s Securities rules, which simplify the modified retrospective transition approach. The modified retrospective transition approach will recognize any changes from the beginning of the year of initial application through retained earnings with no restatement of comparative periods.The Company has substantially completed a review of the likely impacts of the application of the new standard to its existing portfolio of customer contracts. Under the new standard, the Company will continue to recognize freight revenue proportionally as a shipment moves from origin to destination. Furthermore, the Company will be required to assess variable consideration included in its contracts and make judgments and estimates throughout the applicable periods. Certain additional financial statement disclosure requirements are mandated byrelated to the new standard includingCompany’s registered securities under Rule 3-10 of Regulation S-X. The final rule also allows for the simplified disclosure of contract assets and contract liabilities as well as a disaggregated view of revenue, which the Company expects to be similar to the current disclosuresincluded within the “Results of Operations” for revenues section of Item 2, “Management’sManagement’s Discussion and Analysis of Financial Condition and Results of Operations.” Based
2. COVID-19
In March 2020, the World Health Organization categorized Coronavirus Disease 2019 (“COVID-19”) as a pandemic, and the President of the United States declared the COVID-19 outbreak a national emergency. The U.S. and Mexico governments have deemed rail transportation as “critical infrastructure” providing essential services during this global emergency. As a provider of critical infrastructure, Kansas City Southern has an obligation to keep employees working and freight moving. KCS remains focused on protecting the health and wellbeing of its employees and the communities in which it operates while assuring the continuity of its business operations.
The Company’s consolidated financial statements reflect estimates and assumptions made by management that affect the reported amounts of assets and liabilities and disclosure of contingent assets and liabilities at the date of the consolidated financial statements and reported amounts of revenue and expenses during the reporting periods presented. The Company considered the impact of COVID-19 on the assumptions and estimates used and determined that there were no material adverse impacts on the Company’s review,first quarter 2020 results of operations, excluding the adoptionimpacts of this guidanceforeign exchange losses. The Company recognized $59.5 million of foreign currency exchange losses due to the depreciation of the Mexican peso against the U.S. dollar, partially resulting from the increased market volatility driven by the global COVID-19 pandemic. The Company hedges its exposure to foreign currency fluctuations and the related impacts in Mexican income tax expense by entering into foreign currency contracts, which have historically offset on an annual basis.
On March 27, 2020, the U.S. government enacted the Coronavirus Aid, Relief, and Economic Security Act (“CARES Act”) which includes modifications to the limitation on business interest expense and net operating loss provisions, and provides a payment delay of employer payroll taxes during 2020 after the date of enactment. The Company estimates the payment of approximately $12.0 million of employer payroll taxes otherwise due in 2020 will be delayed with 50% due by December 31, 2021 and the remaining 50% by December 31, 2022. The CARES Act is not expected to have a significantmaterial impact on the Company’s consolidated financial statements.
In February 2016,
3. Restructuring Charges
During 2019, the FASB issued ASU No. 2016-02, LeasesCompany began implementing principles of Precision Scheduled Railroading (“PSR”), which requires lessees to recognize for all leasesfocus on providing reliable customer service, facilitating growth, improving asset utilization, and improving the cost profile of the Company. As a right-to-use asset andresult of the PSR initiatives in 2019, management approved 4 separate restructuring plans that totaled $168.8 million, including a lease obligation$67.5 million restructuring plan in the Consolidated Balance Sheet. Expenses are recognized in the Consolidated Statement of Income in a manner similar to current accounting guidance. Lessees are permitted to make an accounting policy election to not recognize an asset and liability for leases with a term of twelve months or less. Lessor accounting under the new standard is substantially unchanged. Additional qualitative and quantitative disclosures, including significant judgments made by management, will be required. The new standard will become effective for the Company beginning with the first quarter 2019 and requires a modified retrospective transition approach.of 2019. The Company has created a cross functional team to develop an implementation plan for the new standard and is assessing contractual arrangements that may qualify as a lease under the new standard. The Company has selected a lease management system and is progressing towards implementation. At December 31, 2016, KCS disclosed approximately $300 million of operating leasesrestructuring plans were substantially completed in the contractual obligations table in the Company’s most recent Form 10-K and will evaluate those contracts as well as other existing2019.
Kansas City Southern and Subsidiaries
Notes to the Unaudited Consolidated Financial Statements—(Continued)
arrangements to determine if they qualifyDuring the first quarter of 2020, the Company purchased 91 locomotives for $78.2 million that were part of 2 existing leases. Of the 91 locomotives, 13 were impaired during the fourth quarter of 2019. The purchase of the impaired lease accounting underlocomotives resulted in $6.0 million of make-whole payments recorded as incremental restructuring charges in the new standard. The Company is continuing to evaluate the impacts the adoptionfirst quarter of this accounting guidance will have on the consolidated financial statements.2020.
3. Mexican Fuel Excise Tax Credit4. Revenue
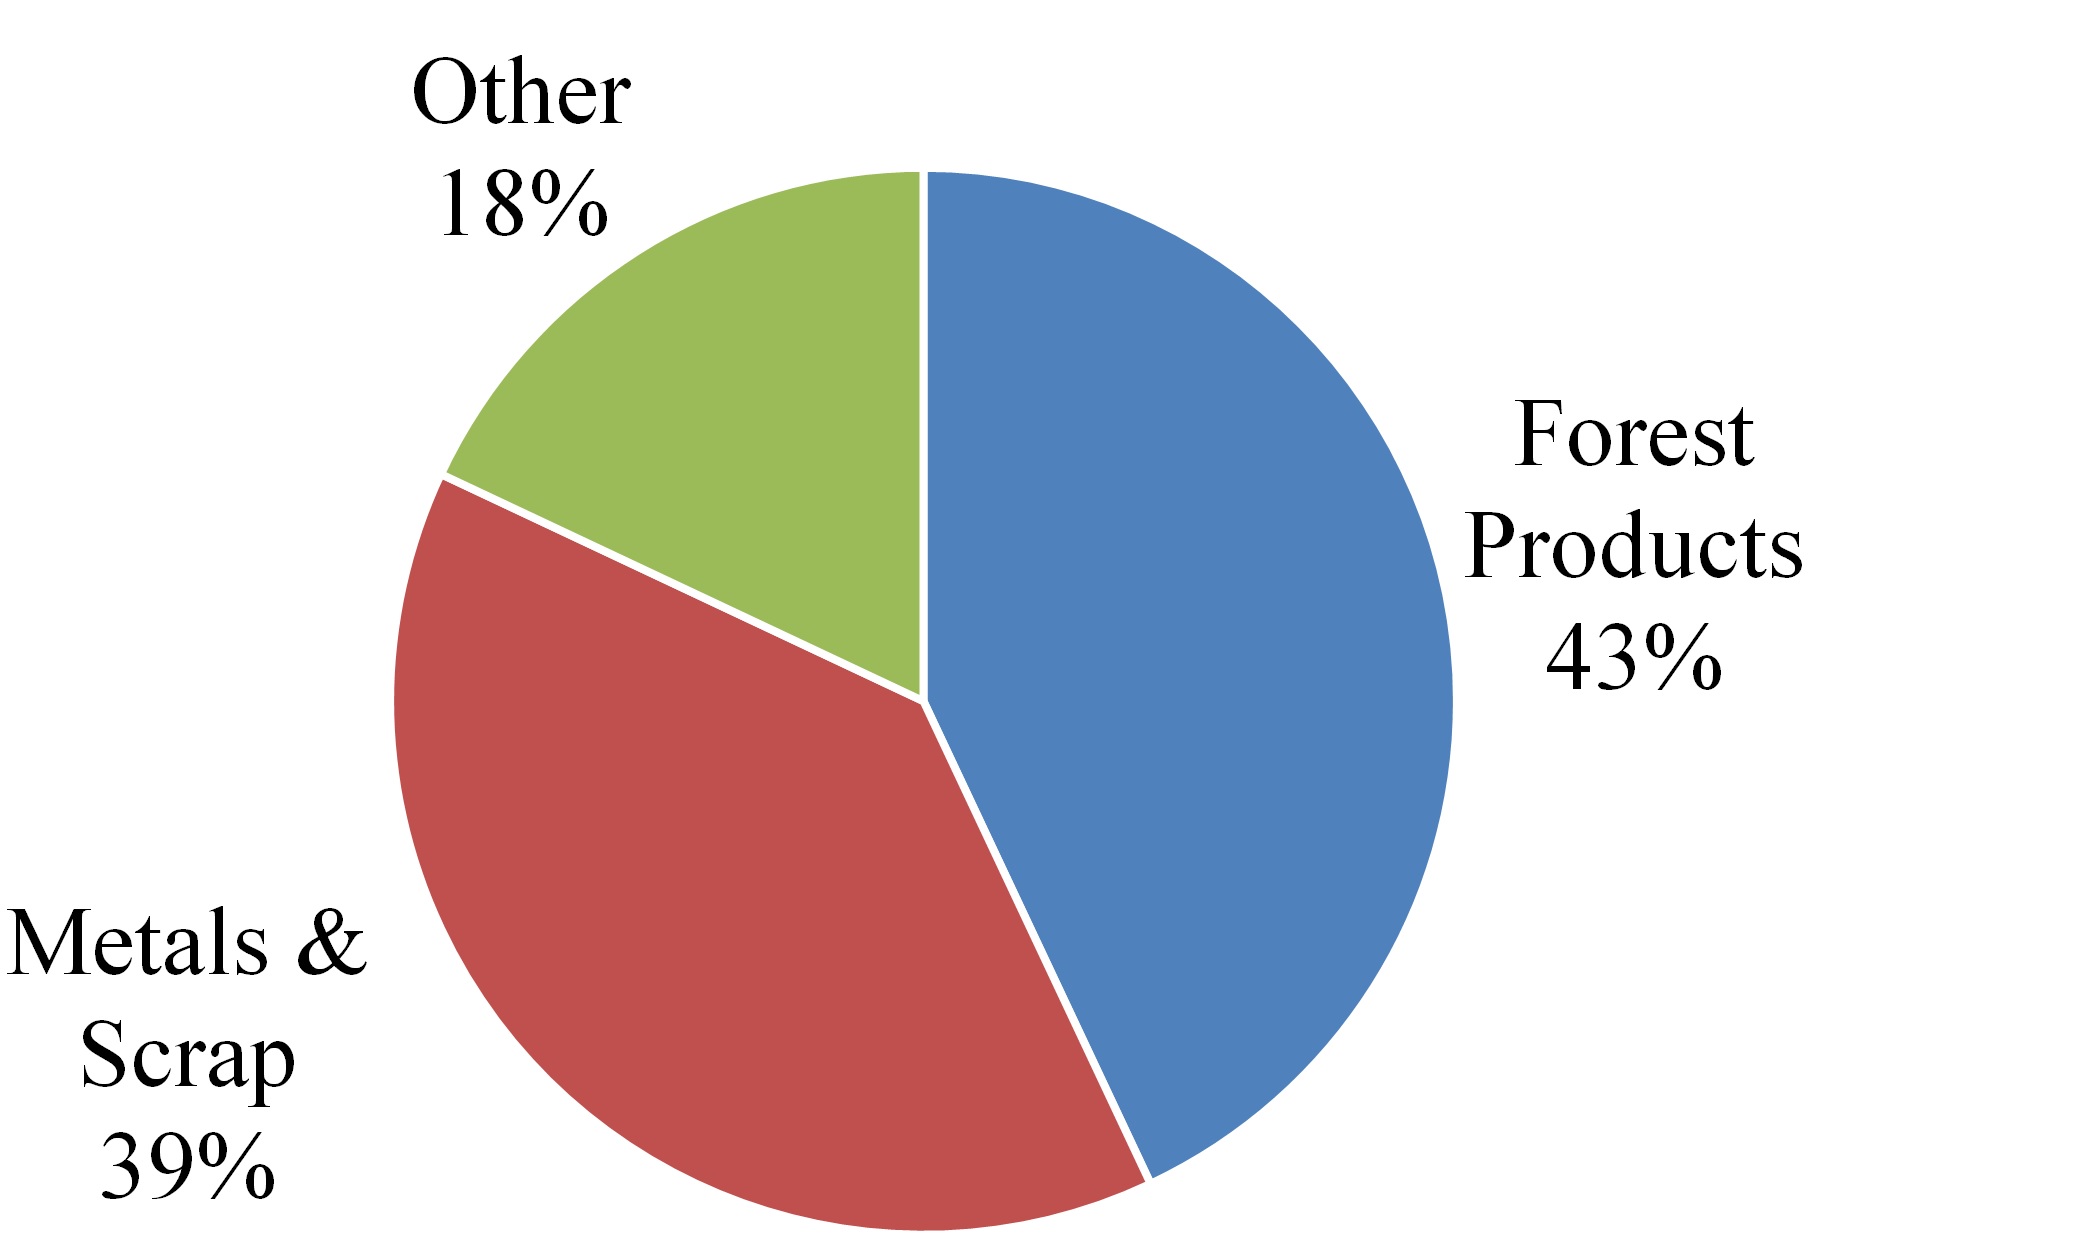
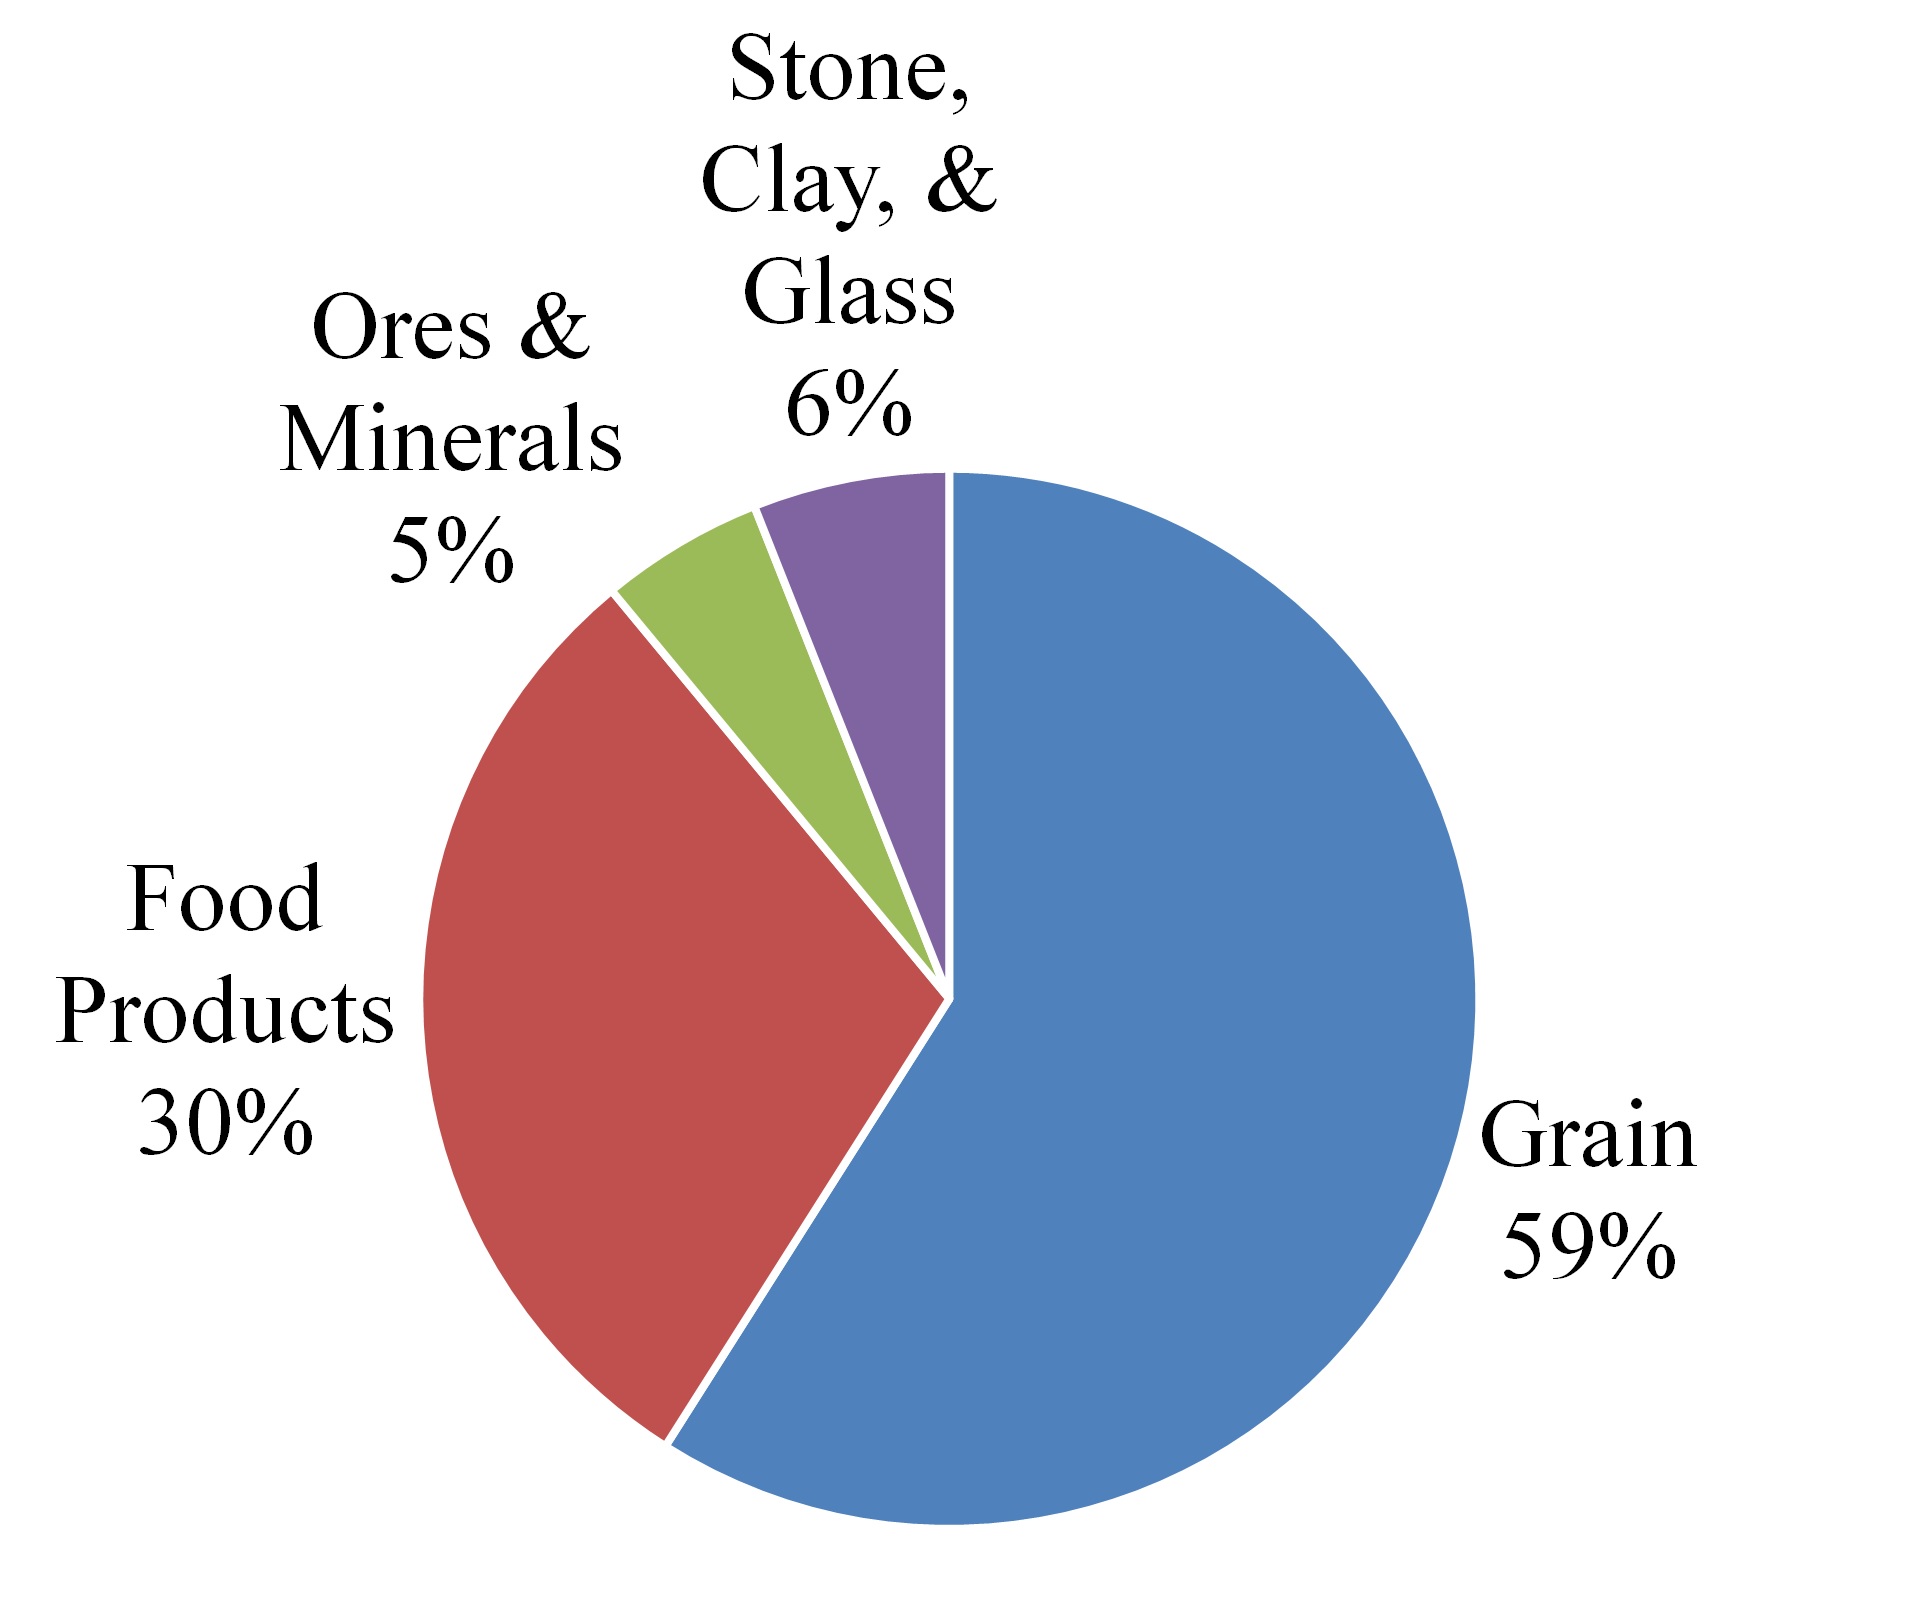
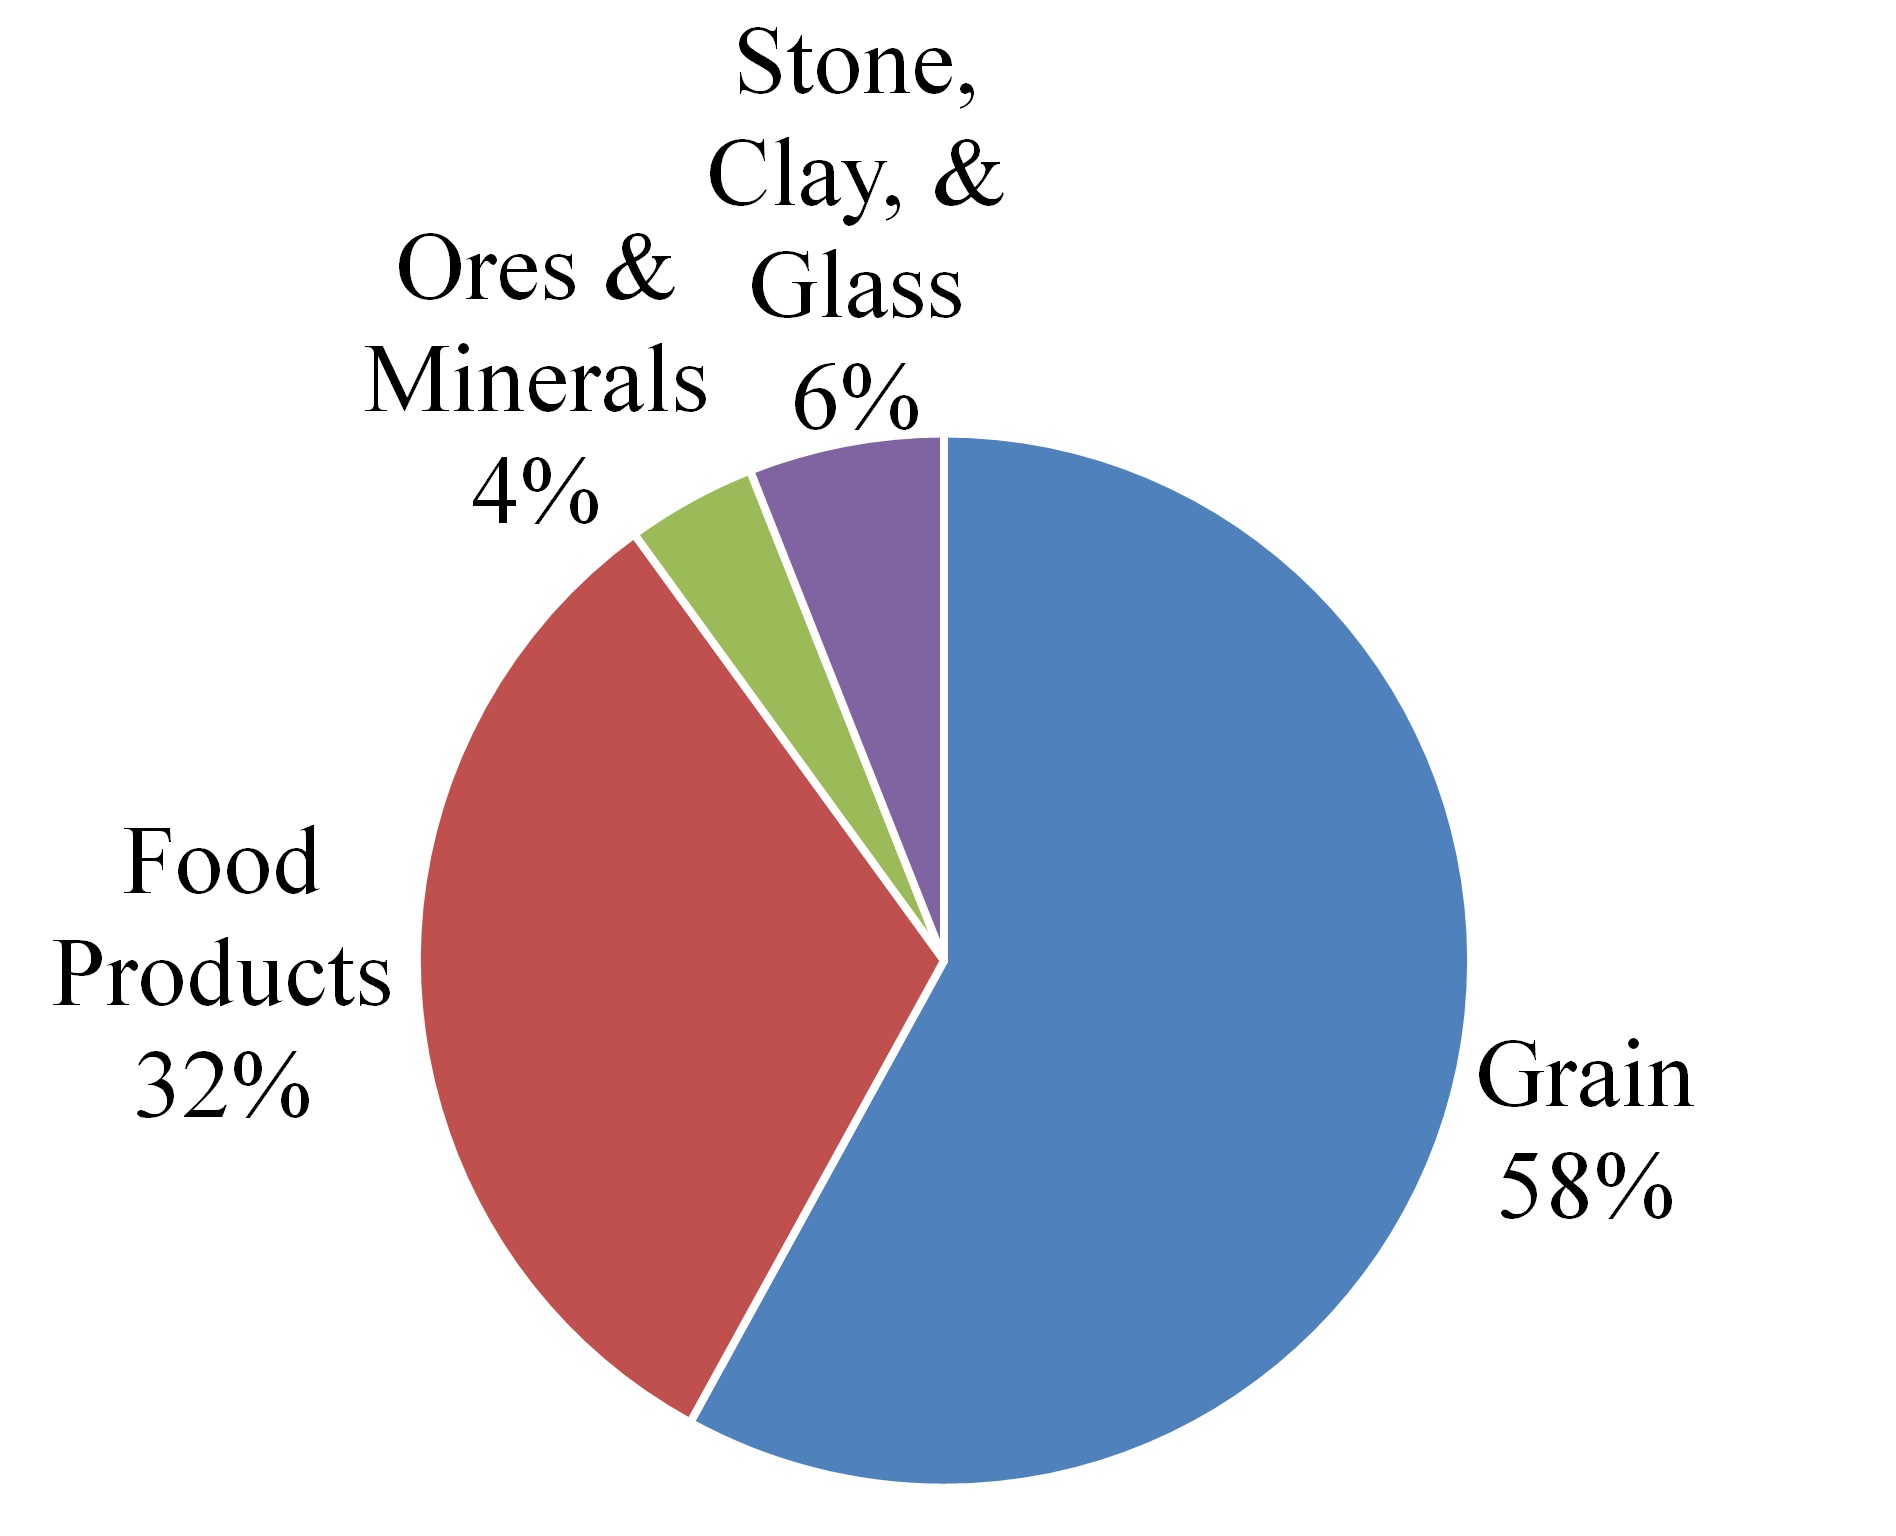
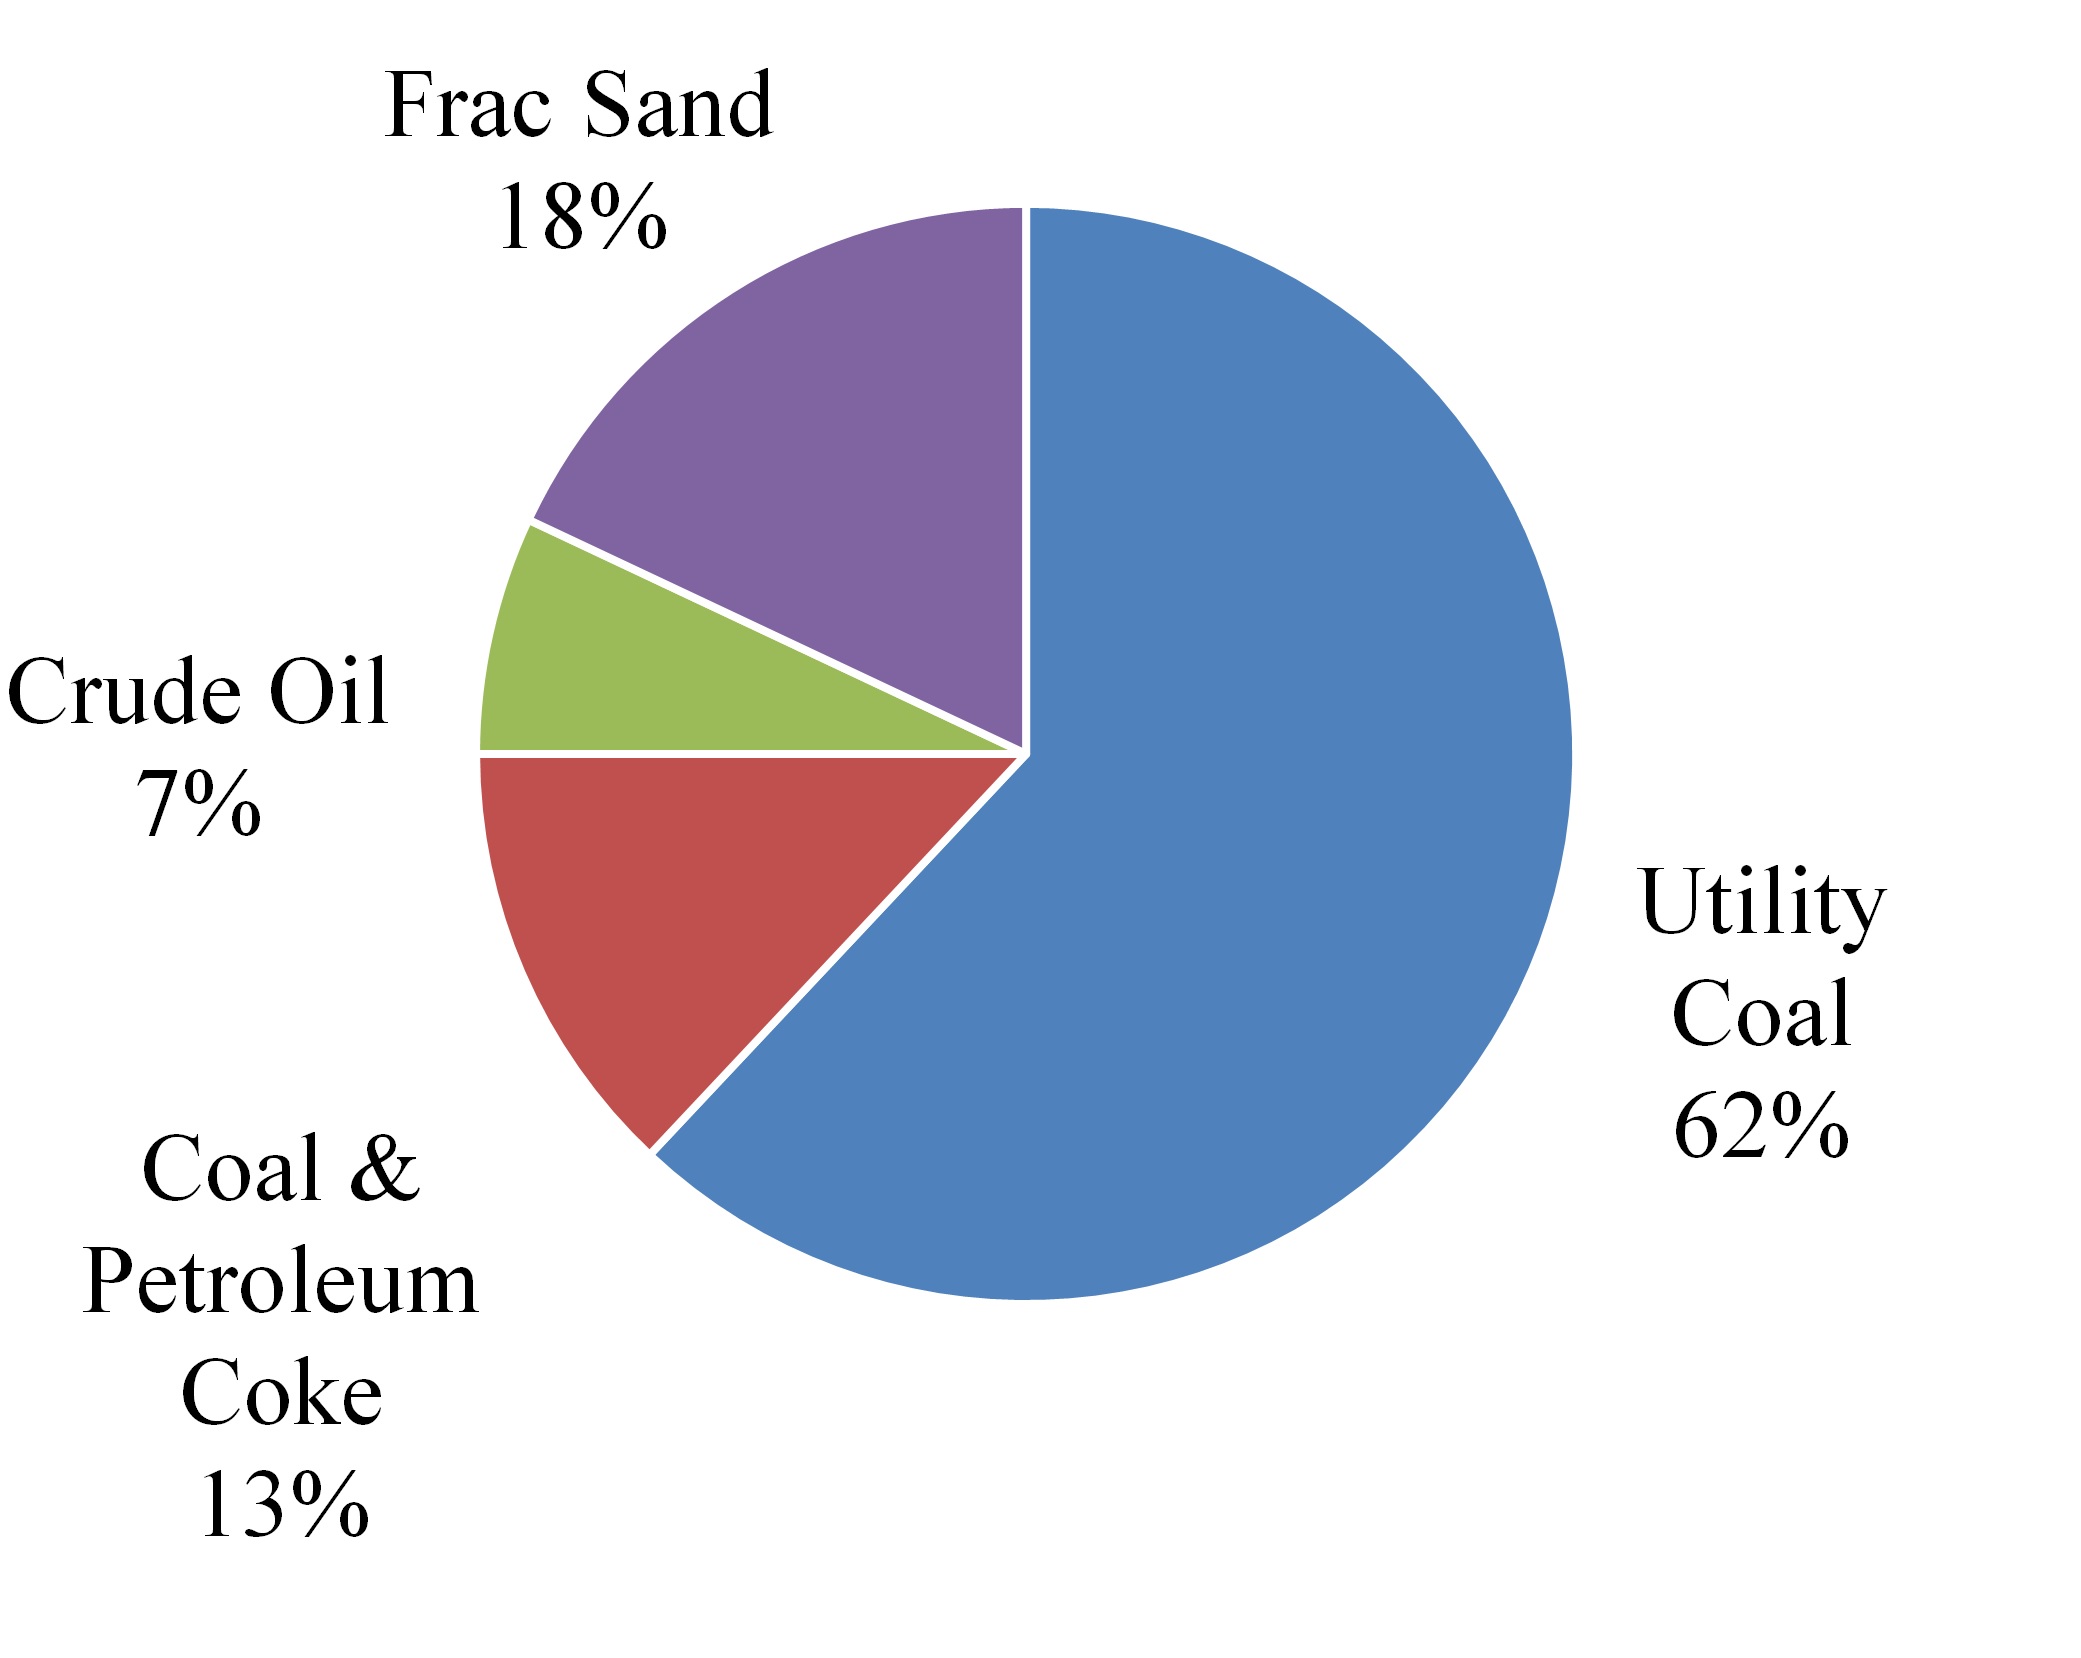
Fuel purchases made Disaggregation of Revenue
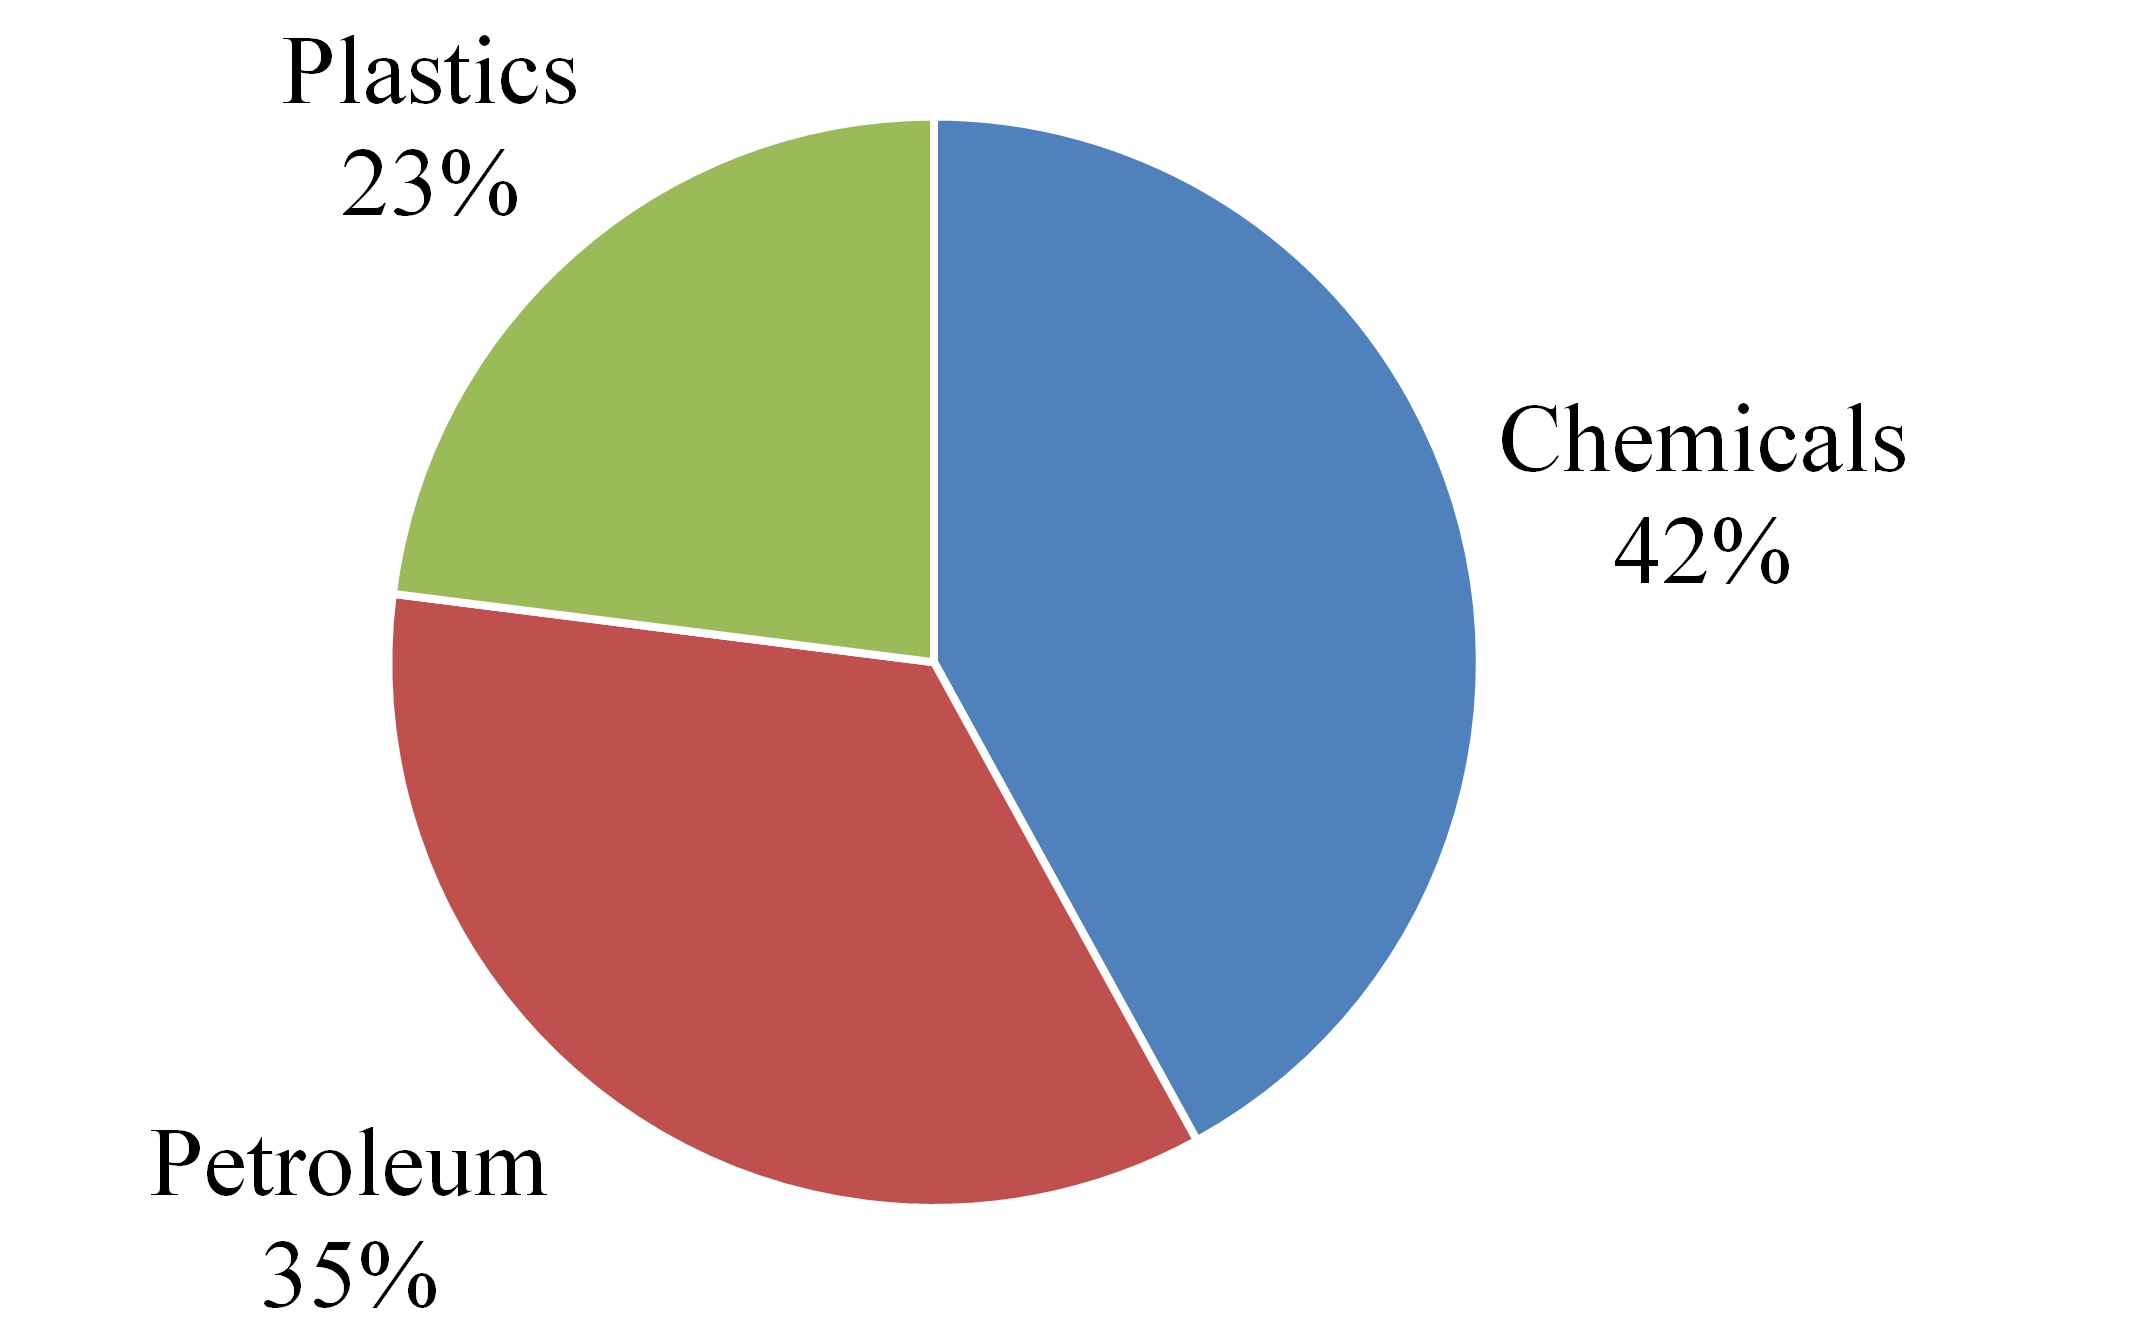
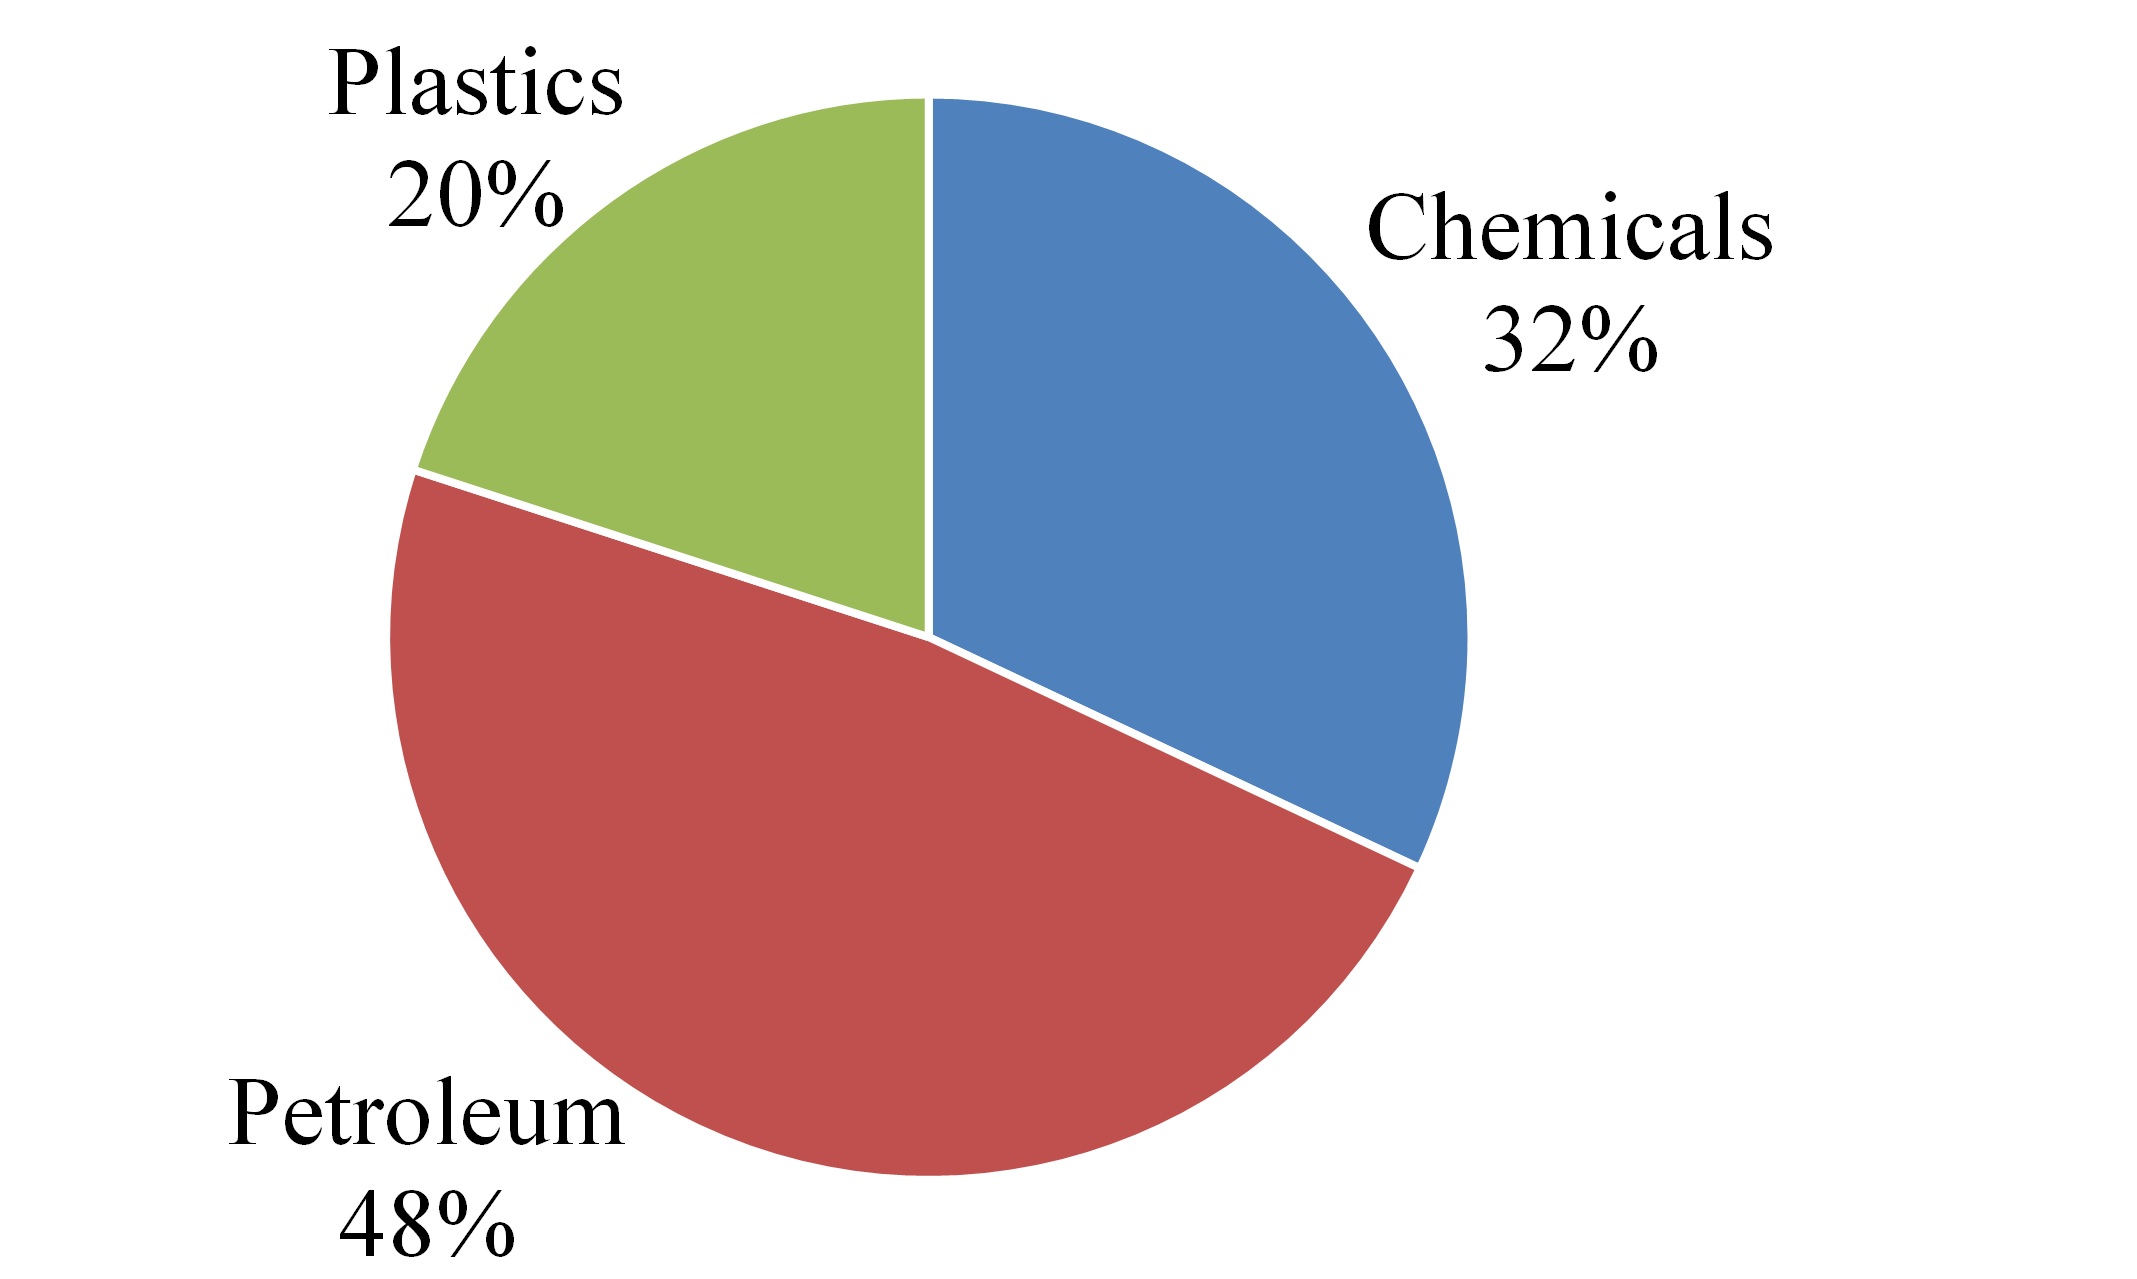
The following table presents revenues disaggregated by the major commodity groups as well as the product types included within the major commodity groups (in Mexicomillions). The Company believes disaggregation by product type best depicts how cash flows are subjectaffected by economic factors. See Note 12 for revenues by geographical area.
|
| | | | | | | |
| | Three Months Ended |
| | March 31, |
| | 2020 | | 2019 |
| Chemical & Petroleum | | | |
| Chemicals | $ | 62.5 |
| | $ | 60.5 |
|
| Petroleum | 95.8 |
| | 74.3 |
|
| Plastics | 40.3 |
| | 33.8 |
|
| Total | 198.6 |
| | 168.6 |
|
| | | | |
| Industrial & Consumer Products | | | |
| Forest Products | 68.9 |
| | 66.4 |
|
| Metals & Scrap | 62.3 |
| | 57.0 |
|
| Other | 27.8 |
| | 26.4 |
|
| Total | 159.0 |
| | 149.8 |
|
| | | | |
| Agriculture & Minerals | | | |
| Grain | 77.8 |
| | 72.7 |
|
| Food Products | 42.7 |
| | 35.7 |
|
| Ores & Minerals | 5.8 |
| | 6.5 |
|
| Stone, Clay & Glass | 8.2 |
| | 8.0 |
|
| Total | 134.5 |
| | 122.9 |
|
| | | | |
| Energy | | | |
| Utility Coal | 23.6 |
| | 32.5 |
|
| Coal & Petroleum Coke | 11.6 |
| | 10.5 |
|
| Frac Sand | 3.8 |
| | 8.0 |
|
| Crude Oil | 17.3 |
| | 13.6 |
|
| Total | 56.3 |
| | 64.6 |
|
| | | | |
| Intermodal | 88.7 |
| | 79.9 |
|
| | | | |
| Automotive | 53.9 |
| | 57.6 |
|
| | | | |
| Total Freight Revenues | 691.0 |
| | 643.4 |
|
| | | | |
| Other Revenue | 40.7 |
| | 31.4 |
|
| | | | |
| Total Revenues | $ | 731.7 |
| | $ | 674.8 |
|
Contract Balances
The amount of revenue recognized in the first quarter of 2020 from performance obligations partially satisfied in previous periods was $17.7 million. The performance obligations that were unsatisfied or partially satisfied as of March 31, 2020, were $18.2 million, which represents in-transit shipments that are fully satisfied the following month.
A receivable is any unconditional right to an excise taxconsideration, and is recognized as shipments have been completed and the relating performance obligation has been fully satisfied. At March 31, 2020 and December 31, 2019, the accounts receivable, net balance was $269.8 million and $274.2 million, respectively. Contract assets represent a conditional right to consideration in exchange for goods or services. The Company did not have any contract assets at March 31, 2020 and December 31, 2019.
Kansas City Southern and Subsidiaries
Notes to the Unaudited Consolidated Financial Statements—(Continued)
Contract liabilities represent consideration received in advance from customers, and are recognized as revenue over time as the relating performance obligation is satisfied. The amount of revenue recognized in the first quarter of 2020 that iswas included in the price of fuel.opening contract liability balance was $10.5 million. The Company is eligible forhas recognized contract liabilities within the accounts payable and utilizes an available credit for the excise tax included in the price of fuel that is purchased and consumed in locomotives and certain work equipment in Mexico. For the three and nine months ended September 30, 2017, the Company recognized an $11.1 million and $35.6 million benefit, respectively, and a $15.6 million and $49.6 million benefit for the same periods in 2016. The Mexican fuel excise tax credit is realized through the offset of the total annual Mexico income tax liability and income tax withholding payment obligations of Kansas City Southern de Mexico, S.A. de C.V. (“KCSM”), with no carryforward to future periods.
4. Hurricane Harvey
In late August 2017, Hurricane Harvey made landfallaccrued liabilities financial statement caption on the Texas coast and caused flood damage to the Company’s track infrastructure and significantly disrupted the Company’s rail service. The Company continues to evaluate the impact of Hurricane Harvey on the business and intends to file a claim under its insurance program for property damage, incremental expenses, and lost profits caused by Hurricane Harvey. Accordingly, during the three months ended September 30, 2017, the Company recognized a receivable for probable insurance recovery offsetting the impact of incremental expenses recognized in the quarter. The recognition of remaining probable insurance recoveries in excess of incremental expenses and self-insured retention represents a contingent gain, whichbalance sheet. These are considered current liabilities as they will be recognized when all contingencies have been resolved, which generally occurs atsettled in less than 12 months.
The following tables summarize the time of final settlement or when nonrefundable cash payments are received.changes in contract liabilities (in millions):
|
| | | | | | | |
| Contract liabilities | Three Months Ended |
| | March 31, |
| | 2020 | | 2019 |
| Beginning balance | $ | 30.5 |
| | $ | 32.4 |
|
| Revenue recognized that was included in the contract liability balance at the beginning of the period | (10.5 | ) | | (15.7 | ) |
| Increases due to consideration received, excluding amounts recognized as revenue during the period | 1.1 |
| | 5.6 |
|
| Ending balance | $ | 21.1 |
| | $ | 22.3 |
|
5. Earnings Per Share Data
Basic earnings per common share is computed by dividing net income available to common stockholders by the weighted-average number of common shares outstanding for the period. Diluted earnings per share adjusts basic earnings per common share for the effects of potentially dilutive common shares, if the effect is not anti-dilutive. Potentially dilutive common shares include the dilutive effects of shares issuable under the stock option and performance award plans.
The following table reconciles the basic earnings per share computation to the diluted earnings per share computation (in millions, except share and per share amounts):
|
| | | | | | | |
| | Three Months Ended |
| | March 31, |
| | 2020 | | 2019 |
| Net income available to common stockholders for purposes of computing basic and diluted earnings per share | $ | 151.7 |
| | $ | 102.7 |
|
Weighted-average number of shares outstanding (in thousands): | | | |
| Basic shares | 95,662 |
| | 100,500 |
|
| Effect of dilution | 509 |
| | 415 |
|
| Diluted shares | 96,171 |
| | 100,915 |
|
| Earnings per share: | | | |
| Basic earnings per share | $ | 1.59 |
| | $ | 1.02 |
|
| Diluted earnings per share | $ | 1.58 |
| | $ | 1.02 |
|
|
| | | | | | | | | | | | | | | |
| | Three Months Ended | | Nine Months Ended |
| | September 30, | | September 30, |
| | 2017 | | 2016 | | 2017 | | 2016 |
| Net income available to common stockholders for purposes of computing basic and diluted earnings per share | $ | 129.2 |
| | $ | 120.5 |
| | $ | 410.1 |
| | $ | 348.3 |
|
Weighted-average number of shares outstanding (in thousands): | | | | | | | |
| Basic shares | 104,324 |
| | 107,621 |
| | 105,297 |
| | 107,800 |
|
| Effect of dilution | 354 |
| | 191 |
| | 285 |
| | 199 |
|
| Diluted shares | 104,678 |
| | 107,812 |
| | 105,582 |
| | 107,999 |
|
| Earnings per share: | | | | | | | |
| Basic earnings per share | $ | 1.24 |
| | $ | 1.12 |
| | $ | 3.89 |
| | $ | 3.23 |
|
| Diluted earnings per share | $ | 1.23 |
| | $ | 1.12 |
| | $ | 3.88 |
| | $ | 3.23 |
|
Potentially dilutive shares excluded from the calculation (in thousands): |
| | | | | |
| Stock options excluded as their inclusion would be anti-dilutive | 72 |
| | 212 |
|
|
| | | | | | | | | | | |
| Stock options excluded as their inclusion would be anti-dilutive | 14 |
| | 34 |
| | 159 |
| | 220 |
|
Kansas City Southern and Subsidiaries
Notes to the Unaudited Consolidated Financial Statements—(Continued)
6. Property and Equipment (including Concession Assets)
Property and equipment, including concession assets, and related accumulated depreciation and amortization are summarized below (in millions):
|
| | | | | | | |
| | March 31,
2020 | | December 31,
2019 |
| Land | $ | 225.2 |
| | $ | 224.9 |
|
| Concession land rights | 141.1 |
| | 141.1 |
|
| Road property | 7,969.3 |
| | 7,962.1 |
|
| Equipment | 2,762.8 |
| | 2,652.6 |
|
| Technology and other | 348.8 |
| | 345.1 |
|
| Construction in progress | 203.5 |
| | 170.2 |
|
| Total property | 11,650.7 |
| | 11,496.0 |
|
| Accumulated depreciation and amortization | 2,726.7 |
| | 2,689.7 |
|
| Property and equipment (including concession assets), net | $ | 8,924.0 |
| | $ | 8,806.3 |
|
|
| | | | | | | |
| | September 30,
2017 | | December 31,
2016 |
| Land | $ | 218.7 |
| | $ | 219.2 |
|
| Concession land rights | 141.2 |
| | 141.2 |
|
| Road property | 7,438.5 |
| | 7,186.0 |
|
| Equipment | 2,530.9 |
| | 2,439.8 |
|
| Technology and other | 209.7 |
| | 182.2 |
|
| Construction in progress | 388.4 |
| | 293.4 |
|
| Total property | 10,927.4 |
| | 10,461.8 |
|
| Accumulated depreciation and amortization | 2,591.8 |
| | 2,392.1 |
|
| Property and equipment (including concession assets), net | $ | 8,335.6 |
| | $ | 8,069.7 |
|
Concession assets, net of accumulated amortization of $667.5$695.0 million and $610.7$678.1 million, totaled $2,177.8$2,342.1 million and $2,131.62,335.5 million at September 30, 2017March 31, 2020 and December 31, 20162019, respectively.
7. Fair Value Measurements
Assets and liabilities recognized at fair value are required to be classified into a three-level hierarchy. In general, fair values determined by Level 1 inputs utilize quoted prices (unadjusted) in active markets for identical assets or liabilities that the Company has the ability to access. Level 2 inputs include quoted prices for similar assets and liabilities in active markets, and inputs other than quoted prices that are observable for the asset or liability. Level 3 inputs are unobservable inputs for the asset or liability, and include situations where there is little, if any, market activity for the asset or liability. In certain cases, the inputs used to measure fair value may fall into different levels of the fair value hierarchy. In such cases, the level in the fair value hierarchy within which the fair value measurement in its entirety falls has been determined based on the lowest level input that is significant to the fair value measurement in its entirety. The Company’s assessment of the significance of a particular input to the fair value in its entirety requires judgment and considers factors specific to the asset or liability.
The Company’s derivative financial instruments are measured at fair value on a recurring basis and consist of foreign currency forward and option contracts and treasury lock agreements, which are classified as Level 2 valuations. The Company determines the fair value of its derivative financial instrument positions based upon pricing models using inputs observed from actively quoted markets and also takes into consideration the contract terms as well as other inputs, including market currency exchange rates and in the case of option contracts, volatility, the risk-free interest rate and the time to expiration. The fair value of the foreign currency derivative instruments was an asset of $18.8 million and a liability of $41.1 million at September 30, 2017 and December 31, 2016, respectively, and the fair value of the forward treasury lock agreements was a liability of $4.6 million at September 30, 2017. There were no outstanding treasury lock agreements at December 31, 2016.
The Company’s short-term financial instruments include cash and cash equivalents, accounts receivable, accounts payable and short-term borrowings. The carrying value of the short-term financial instruments approximates their fair value.
The fair value of the Company’s debt is estimated using quoted market prices when available. When quoted market prices are not available, fair value is estimated based on current market interest rates for debt with similar maturities and credit quality. The faircarrying value of the Company’s debt was $2,396.0$3,244.1 million and $2,303.8$3,246.0 million at September 30, 2017March 31, 2020 and December 31, 2016, respectively. The carrying value was $2,278.9 million and $2,296.9 million at September 30, 2017 and December 31, 2016,2019, respectively. If the Company’s debt were measured at fair value, the fair value measurements of the individual debt instruments would have been classified as either Level 1 or Level 2 in the fair value hierarchy.
The fair value of the Company’s financial instruments is presented in the following table (in millions):
9 |
| | | | | | | | |
| | | March 31, 2020 | | December 31, 2019 |
| | | Level 2 | | Level 2 |
| Assets | | | | |
| Foreign currency derivative instruments | | $ | — |
| | $ | 2.5 |
|
| Treasury lock agreements | | 6.0 |
| | — |
|
| Liabilities | | | | |
| Debt instruments | | 3,403.0 |
| | 3,535.7 |
|
| Foreign currency derivative instruments | | 27.5 |
| | — |
|
Kansas City Southern and Subsidiaries
Notes to Consolidated Financial Statements—(Continued)
8. Derivative Instruments
The Company enters into derivative transactions in certain situations based on management’s assessment of current market conditions and perceived risks. Management intends to respond to evolving business and market conditions and in doing so, may enter into such transactions as deemed appropriate.
Kansas City Southern and Subsidiaries
Notes to the Unaudited Consolidated Financial Statements—(Continued)
Credit Risk. As a result of the use of derivative instruments, the Company is exposed to counterparty credit risk. The Company manages this risk by limiting its counterparties to large financial institutions which meet the Company’s credit rating standards and have an established banking relationship with the Company. As of September 30, 2017,March 31, 2020, the Company did not expect any losses as a result of default of its counterparties.
Interest Rate Derivative Instruments. In May 2017,March 2020, the Company executed four3 30-year treasury lock agreements with an aggregate notional value of $275.0$400.0 million and a weighted average interest rate of 2.85%1.45%. The purpose of the treasury locks is to hedge the U.S. Treasury benchmark interest rate associated with future interest payments related to the anticipated refinancing of the $275.0$444.7 million, of KCS 2.35%3.00% senior notes due May 15, 2020.2023 (the “3.00% Senior Notes”). The Company has designated the treasury locks as cash flow hedges and recorded unrealized gains and losses in Accumulatedaccumulated other comprehensive income.loss. Upon settlement, the unrealized gain or loss in Accumulatedaccumulated other comprehensive income will be amortized to interest expense over the life of the future underlying debt issuance.
Foreign Currency Derivative Instruments. The Company’s Mexican subsidiaries have net U.S. dollar-denominated monetary liabilities which, for Mexican income tax purposes, are subject to periodic revaluation based on changes in the value of the Mexican peso against the U.S. dollar. This revaluation creates fluctuations in the Company’s Mexican income tax expense and the amount of income taxes paid in Mexico. The Company hedges its exposure to this cash tax risk by entering into foreign currency forward contracts and foreign currency option contracts known as zero-cost collars.
The foreign currency forward contracts involve the Company’s purchase of pesos at an agreed-upon weighted-average exchange rate to each U.S dollar. The zero-cost collars involve the Company’s purchase of a Mexican peso call option and a simultaneous sale of a Mexican peso put option, with equivalent U.S. dollar notional amounts for each option and no net cash premium paid by the Company. The Company’s foreign currency forward and zero-cost collar contracts are executed with counterparties in the U.S. and are governed by International Swaps and Derivatives Association agreements that include standard netting arrangements. Asset and liability positions from contracts with the same counterparty are net settled upon maturity/expiration and presented on a net basis in the consolidated balance sheets prior to settlement. There was no offsetting of derivative assets or liabilities in the consolidated balance sheets as of March 31, 2020 and December 31, 2019.
Below is a summary of the Company’s 2020 and 2019 foreign currency derivative contracts (amounts in millions, except Ps./USD):
|
| | | | | | | | | | | | | | | | | | | | | | | | | | | |
| Foreign currency forward contracts | | | | | | |
| | Contracts to purchase Ps./pay USD | | Offsetting contracts to sell Ps./receive USD | | |
| | Notional amount | | Notional amount | | Weighted-average exchange rate (in Ps./USD) | | Notional amount | | Notional amount | | Weighted-average exchange rate (in Ps./USD) | | Cash received/(paid) on settlement |
| Contracts executed in 2020 and outstanding | $ | 155.0 |
| | Ps. | 3,158.4 |
| | Ps. | 20.4 |
| | — |
| | — |
| | — |
| | — |
|
| Contracts executed in 2020 and settled in 2020 | $ | 305.0 |
| | Ps. | 5,816.0 |
| | Ps. | 19.1 |
| | $ | 293.3 |
| | Ps. | 5,816.0 |
| | Ps. | 19.8 |
| | $ | (7.3 | ) (i) |
| Contracts executed in 2019 and settled in 2020 | $ | 105.0 |
| | Ps. | 2,041.2 |
| | Ps. | 19.4 |
| | $ | 108.6 |
| | Ps. | 2,041.2 |
| | Ps. | 18.8 |
| | $ | 3.6 |
|
| Contracts executed in 2019 and settled in 2019 (ii) | $ | 400.0 |
| | Ps. | 7,892.5 |
| | Ps. | 19.7 |
| | $ | 410.7 |
| | Ps. | 7,892.5 |
| | Ps. | 19.2 |
| | $ | 10.7 |
|
| Contracts executed in 2018 and settled in 2019 (ii) | $ | 20.0 |
| | Ps. | 410.9 |
| | Ps. | 20.5 |
| | $ | 20.9 |
| | Ps. | 410.9 |
| | Ps. | 19.6 |
| | $ | 0.9 |
|
| | | | | | | | | | | | | | |
| Foreign currency zero-cost collar contracts | | | | |
| | Notional amount | | Cash received/(paid) on settlement | | | | | | | | | | |
| Contracts executed in 2018 and settled in 2019 (ii) | $ | 120.0 |
| | $ | 0.3 |
| | | | | | | | | | |
(i) During April 2020, the Company does not physically exchange currencies upon maturity or expirationpaid an additional $4.4 million for the settlement of itsthese forward contracts.
(ii) During the first quarter of 2019, the Company settled $120.0 million and $75.0 million of zero-cost collar contracts and forward contracts, or zero-cost collars. Instead, the Company settles the maturing/expiring transactions by entering into offsetting transactions, which resultsrespectively, resulting in a physical exchangecash received of only the net gain or loss between the Company$0.3 million and the counterparty.$0.4 million.
Kansas City Southern and Subsidiaries
Notes to the Unaudited Consolidated Financial Statements—(Continued)
Below is a summary of the Company’s 2017 and 2016 foreign currency derivative contracts (amounts in millions, except Ps./USD):
|
| | | | | | | | | | | | | | | | | | | | | | | | | | | | | | | | | |
| Foreign currency forward contracts | | | | | | | | | | |
| | Contracts to purchase Ps./pay USD | | Offsetting contracts to sell Ps./receive USD | | |
| | Notional amount | | Notional amount | | Weighted-average exchange rate (in Ps./USD) | | Maturity date | | Notional amount | | Notional amount | | Weighted-average exchange rate (in Ps./USD) | | Maturity date | | Cash received/(paid) on settlement |
| Contracts executed in 2016 and settled in 2017 | $ | 340.0 |
| | Ps. | 6,207.7 |
| | Ps. | 18.3 |
| | 1/17/2017 |
| | $ | 287.0 |
| | Ps. | 6,207.7 |
| | Ps. | 21.6 |
| | 1/17/2017 | | $ | (53.0 | ) |
| Contracts executed in 2016 and settled in 2016 | $ | 60.0 |
| | Ps. | 1,057.3 |
| | Ps. | 17.6 |
| | 4/29/2016 |
| | $ | 60.7 |
| | Ps. | 1,057.3 |
| | Ps. | 17.4 |
| | 4/29/2016 | | $ | 0.7 |
|
| Contracts executed in 2015 and settled in 2016 | $ | 300.0 |
| | Ps. | 4,480.4 |
| | Ps. | 14.9 |
| | 1/15/2016 |
| | $ | 251.0 |
| | Ps. | 4,480.4 |
| | Ps. | 17.9 |
| | 1/15/2016 | | $ | (49.0 | ) |
| | | | | | | | | | | | | | | | | | |
| Foreign currency zero-cost collar contracts | | | | | | | | | | | | |
| | Notional amount | | Maturity date | | Weighted-average call rate outstanding options (in Ps./USD) | | Weighted-average put rate outstanding options (in Ps./USD) | | Cash received/(paid) on settlement | | | | | | | | |
| Contracts executed in 2017 and partially settled in 2017 | $ | 255.0 |
| | 1/16/2018 |
| | Ps. | 21.6 |
| | Ps. | 24.7 |
| | $ | 7.7 | (i) | | | | | | | | |
| Contracts executed in 2017 and settled in 2017 | $ | 10.0 |
| | 1/18/2018 |
| | — |
| | — |
| | $ | 0.4 |
| | | | | | | | |
| Contracts executed in 2017 and settled in 2017 | $ | 70.0 |
| | 7/27/2017 |
| | — |
| | — |
| | $ | 4.7 |
| | | | | | | | |
| Contracts executed in 2017 and settled in 2017 | $ | 195.0 |
| | 4/25/2017 |
| | — |
| | — |
| | $ | 25.8 |
| | | | | | | | |
| Contracts executed in 2015 and settled in 2016 | $ | 80.0 |
| | 1/15/2016 |
| | — |
| | — |
| | $ | (10.1 | ) | | | | | | | | |
(i) During February and September 2017, the Company settled $115.0 million and $25.0 million, respectively, of the zero-cost collar contracts.
The Company has not designated any of the foreign currency derivative contracts as hedging instruments for accounting purposes. The Company measures the foreign currency derivative contracts at fair value each period and recognizes any change in fair value in Foreignforeign exchange gain (loss) within the Consolidated Statementsconsolidated statements of Income.income. The cash flows associated with these instruments is classified as an operating activity within the consolidated statements of cash flows.
Kansas City Southern and Subsidiaries
Notes to Consolidated Financial Statements—(Continued)
The following tables present the fair value of derivative instruments included in the Consolidated Balance Sheets (in millions): | | | | Derivative Assets | Derivative Assets |
| | Balance Sheet Location | | September 30,
2017 | | December 31, 2016 | Balance Sheet Location | | March 31,
2020 | | December 31, 2019 |
| Derivatives designated as hedging instruments: | | | | | |
| Treasury lock agreements | | Other assets | | $ | 6.0 |
| | $ | — |
|
| Total derivatives designated as hedging instruments | | | 6.0 |
| | — |
|
| Derivatives not designated as hedging instruments: | | | | | | | | |
| Foreign currency zero-cost collar contracts | Other current assets | | $ | 18.8 |
| | $ | — |
| |
| Foreign currency forward contracts | | Other current assets | | — |
| | 2.5 |
|
| Total derivatives not designated as hedging instruments | | 18.8 |
| | — |
| | — |
| | 2.5 |
|
| Total derivative assets | | $ | 18.8 |
| | $ | — |
| | $ | 6.0 |
| | $ | 2.5 |
|
|
| | | | | | | | | |
| | Derivative Liabilities |
| | Balance Sheet Location | | March 31,
2020 | | December 31, 2019 |
| Derivatives not designated as hedging instruments: | | | | | |
| Foreign currency forward contracts | Accounts payable and accrued liabilities | | $ | 27.5 |
| | $ | — |
|
| Total derivatives not designated as hedging instruments | | | 27.5 |
| | — |
|
| Total derivative liabilities | | | $ | 27.5 |
| | $ | — |
|
|
| | | | | | | | | |
| | Derivative Liabilities |
| | Balance Sheet Location | | September 30,
2017 | | December 31, 2016 |
| Derivatives designated as hedging instruments: | | | | | |
| Treasury lock agreements | Other noncurrent liabilities and deferred credits | | $ | 4.6 |
| | $ | — |
|
| Total derivatives designated as hedging instruments | | | 4.6 |
| | — |
|
| Derivatives not designated as hedging instruments: | | | | | |
| Foreign currency forward contracts | Accounts payable and accrued liabilities | | — |
| | 41.1 |
|
| Total derivatives not designated as hedging instruments | | | — |
| | 41.1 |
|
| Total derivative liabilities | | | $ | 4.6 |
| | $ | 41.1 |
|
The following table presents the effects of derivative instruments on the Consolidated Statements of Income and Consolidated Statements of Comprehensive Income for the three months ended March 31 (in millions):
|
| | | | | | | | | | | | | | | | | | |
| Derivatives in Cash Flow Hedging Relationships | | Amount of Gain/(Loss) Recognized in OCI on Derivative | | Location of Gain/(Loss) Reclassified from AOCI into Income | | Amount of Gain/(Loss) Reclassified from AOCI into Income |
| | | 2020 | | 2019 | | | | 2020 | | 2019 |
| Treasury lock agreements | | $ | 6.0 |
| | $ | (6.8 | ) | | Interest expense | | $ | (0.6 | ) | | $ | — |
|
| Total | | $ | 6.0 |
| | $ | (6.8 | ) | | | | $ | (0.6 | ) | | $ | — |
|
| | | Derivatives in Cash Flow Hedging Relationships | | | Amount of Gain/(Loss) Recognized in OCI on Derivative | |
| | | Three Months Ended | | Nine Months Ended | |
| | | September 30, | | September 30, | |
| | | 2017 | | 2016 | | 2017 | | 2016 | |
| Treasury lock agreements | | $ | (0.8 | ) | | $ | — |
| | $ | (4.6 | ) | | $ | — |
| |
| Total | | $ | (0.8 | ) | | $ | — |
| | $ | (4.6 | ) | | $ | — |
| |
|
| | | | | | | |
| Derivatives Not Designated as Hedging Instruments | Location of Gain/(Loss) Recognized in Income on Derivative | | Amount of Gain/(Loss) Recognized in Income on Derivative | | Location of Gain/(Loss) Recognized in Income on Derivative | | Amount of Gain/(Loss) Recognized in Income on Derivative |
| | | Three Months Ended | | Nine Months Ended | | 2020 | | 2019 |
| | | September 30, | | September 30, | |
| | | 2017 | | 2016 | | 2017 | | 2016 | |
| Foreign currency forward contracts | Foreign exchange gain (loss) | | $ | — |
| | $ | (16.1 | ) | | $ | (11.9 | ) | | $ | (31.9 | ) | | Foreign exchange gain (loss) | | $ | (33.7 | ) | | $ | 3.6 |
|
| Foreign currency zero-cost collar contracts | Foreign exchange gain (loss) | | 3.3 |
| | — |
| | 57.4 |
| | (3.9 | ) | |
| Total | | $ | 3.3 |
| | $ | (16.1 | ) | | $ | 45.5 |
| | $ | (35.8 | ) | | $ | (33.7 | ) | | $ | 3.6 |
|
See Note 7, Fair Value Measurements, for the determination of the fair values of derivatives.
9. Short-Term Borrowings
Commercial Paper. The Company’s commercial paper program generally serves as the primary means of short-term funding. As of September 30, 2017,March 31, 2020 and December 31, 2019, KCS had $355.9 million0 commercial paper outstanding, net of $0.1 million discount, at a weighted-average interest rate of 1.661%. As of Decemberoutstanding. For the three months ended March 31, 2016, KCS had $181.3 million of2020 and 2019, any commercial paper borrowings were outstanding for less than 90 days and the related activity is presented on a net basis in the consolidated statements of $0.1 million discount, at a weighted-average interest rate of 1.290%.cash flows.
Kansas City Southern and Subsidiaries
Notes to the Unaudited Consolidated Financial Statements—(Continued)
10. EquityShare Repurchases
The following tables summarize the changes in equity (in millions):
|
| | | | | | | | | | | | | | | | | | | | | | | |
| | Three Months Ended September 30, 2017 | | Three Months Ended September 30, 2016 |
| | Kansas City Southern Stockholders’ Equity | | Noncontrolling Interest | | Total Equity | | Kansas City Southern Stockholders’ Equity | | Noncontrolling Interest | | Total Equity |
| Beginning balance | $ | 4,192.6 |
| | $ | 315.2 |
| | $ | 4,507.8 |
| | $ | 4,020.6 |
| | $ | 311.1 |
| | $ | 4,331.7 |
|
| Net income | 129.3 |
| | 0.6 |
| | 129.9 |
| | 120.6 |
| | 0.4 |
| | 121.0 |
|
| Other comprehensive loss | (0.7 | ) | | — |
| | (0.7 | ) | | (0.3 | ) | | — |
| | (0.3 | ) |
| Contribution from noncontrolling interest | — |
| | — |
| | — |
| | — |
| | 2.4 |
| | 2.4 |
|
| Dividends on common stock | (37.3 | ) | | — |
| | (37.3 | ) | | (35.5 | ) | | — |
| | (35.5 | ) |
Dividends on $25 par preferred stock
| (0.1 | ) | | — |
| | (0.1 | ) | | (0.1 | ) | | — |
| | (0.1 | ) |
| Share repurchases | (200.0 | ) | | — |
| | (200.0 | ) | | (40.6 | ) | | — |
| | (40.6 | ) |
| Options exercised and stock subscribed, net of shares withheld for employee taxes | 2.7 |
| | — |
| | 2.7 |
| | 2.9 |
| | — |
| | 2.9 |
|
| Excess tax benefit from share-based compensation | — |
| | — |
| | — |
| | 0.2 |
| | — |
| | 0.2 |
|
| Share-based compensation | 4.1 |
| | — |
| | 4.1 |
| | 4.1 |
| | — |
| | 4.1 |
|
| Ending balance | $ | 4,090.6 |
| | $ | 315.8 |
| | $ | 4,406.4 |
| | $ | 4,071.9 |
| | $ | 313.9 |
| | $ | 4,385.8 |
|
|
| | | | | | | | | | | | | | | | | | | | | | | |
| | Nine Months Ended September 30, 2017 | | Nine Months Ended September 30, 2016 |
| | Kansas City Southern Stockholders’ Equity | | Noncontrolling Interest | | Total Equity | | Kansas City Southern Stockholders’ Equity | | Noncontrolling Interest | | Total Equity |
| Beginning balance | $ | 4,089.9 |
| | $ | 314.6 |
| | $ | 4,404.5 |
| | $ | 3,914.3 |
| | $ | 310.4 |
| | $ | 4,224.7 |
|
| Cumulative-effect adjustment (i) | 2.5 |
| | — |
| | 2.5 |
| | — |
| | — |
| | — |
|
| Net income | 410.3 |
| | 1.2 |
| | 411.5 |
| | 348.5 |
| | 1.1 |
| | 349.6 |
|
| Other comprehensive loss | (1.7 | ) | | — |
| | (1.7 | ) | | (1.0 | ) | | — |
| | (1.0 | ) |
| Contribution from noncontrolling interest | — |
| | — |
| | — |
| | — |
| | 2.4 |
| | 2.4 |
|
| Dividends on common stock | (107.2 | ) | | — |
| | (107.2 | ) | | (106.7 | ) | | — |
| | (106.7 | ) |
| Dividends on $25 par preferred stock | (0.2 | ) | | — |
| | (0.2 | ) | | (0.2 | ) | | — |
| | (0.2 | ) |
| Share repurchases | (320.4 | ) | | — |
| | (320.4 | ) | | (99.8 | ) | | — |
| | (99.8 | ) |
| Options exercised and stock subscribed, net of shares withheld for employee taxes | 2.8 |
| | — |
| | 2.8 |
| | 1.8 |
| | — |
| | 1.8 |
|
| Excess tax benefit from share-based compensation | — |
| | — |
| | — |
| | (0.2 | ) | | — |
| | (0.2 | ) |
| Share-based compensation | 14.6 |
| | — |
| | 14.6 |
| | 15.2 |
| | — |
| | 15.2 |
|
| Ending balance | $ | 4,090.6 |
| | $ | 315.8 |
| | $ | 4,406.4 |
| | $ | 4,071.9 |
| | $ | 313.9 |
| | $ | 4,385.8 |
|
| |
(i) | The Company recognized a $2.5 million net cumulative-effect adjustment to equity as of January 1, 2017, due to the adoption of ASU 2016-09, Improvements to Employee Share-Based Payment Accounting. For additional discussion, see Note 1 - Basis of Presentation.
|
Kansas City Southern and Subsidiaries
Notes to Consolidated Financial Statements—(Continued)
Share Repurchase Programs
During the second quarter of 2017, the Company concluded a $500.0 million share repurchase program that was announced in May 2015 (the “2015 Program”). In August 2017,November 2019, the Company announced a new common share repurchase program authorizing the Company to repurchasepurchase up to $800.0 million$2.0 billion of its outstanding shares of common stock through June 30, 2020December 31, 2022 (the “2017“2019 Program”). Share repurchases may be made in the open market, through privately negotiated transactions, or through an accelerated share repurchase (“ASR”) program limited to $200.0 million.transactions.
Under an ASR agreement, the Company pays a specified amount to a financial institution and receives an initial delivery of shares. Upon settlement of the ASR agreement, typically the financial institution delivers additional shares, with theThe final aggregate number and total cost of shares delivered determined with reference torepurchased is then based on the volume weighted-averagevolume-weighted average price per share of the Company’s common stock overduring the term of the ASR agreement, less a negotiated discount.agreements. The transactions are accounted for as equity transactions with any excess of repurchase price over par value allocated between additional paid-in capital and retained earnings. At the time the shares are received, there is an immediate reduction in the weighted-average number of shares outstanding for purposes of the basic and diluted earnings per share computation.
During the thirdfourth quarter of 2017,2019, the Company entered into twopaid $550.0 million under 2 ASR agreements and received an aggregate initial delivery of shares, which represented approximately 85% of the total shares to be received under the agreements. The final number and total cost of shares repurchased was then based on the volume-weighted-average price of the Company’s common stock during the term of the agreements, which were settled in March 2020. The terms of the ASR agreements, structured as outlined above, were as follows:
| | | Third Party Institution | | Agreement Date | | Settlement Date | | Total Amount of Agreement (in millions) | | Initial Shares Delivered | | Fair Market Value of Initial Shares (in millions) | | Additional Shares Delivered | | Fair Market Value of Additional Shares (in millions) | | Total Shares Delivered | | Weighted-Average Price Per Share | | Agreement Date | | Settlement Date | | Total Amount of Agreement (in millions) | | Initial Shares Delivered | | Fair Market Value of Initial Shares (in millions) | | Additional Shares Delivered | | Fair Market Value of Additional Shares (in millions) | | Total Shares Delivered | | Weighted-Average Price Per Share |
| ASR Agreement #1 | | August 2017 | | August 2017 | | $ | 100.0 |
| | 799,398 |
| | $ | 85.0 |
| | 151,481 |
| | $ | 15.0 |
| | 950,879 |
| | $ | 105.17 |
| | November 2019 | | March 2020 | | $ | 275.0 |
| | 1,511,380 | | $ | 233.75 |
| | 224,244 |
| | $ | 41.25 |
| | 1,735,624 | | $ | 158.44 |
|
| ASR Agreement #2 | | August 2017 | | October 2017 | | $ | 100.0 |
| | 799,398 |
| | $ | 85.0 |
| | 151,492 |
| | $ | 15.0 | (i) | | 950,890 |
| | $ | 105.16 |
| | November 2019 | | March 2020 | | $ | 275.0 |
| | 1,511,380 | | $ | 233.75 |
| | 221,692 |
| | $ | 41.25 |
| | 1,733,072 | | $ | 158.68 |
|
| Total | | $ | 200.0 |
| | 1,598,796 |
| | $ | 170.0 |
| | 302,973 |
| | $ | 30.0 |
| | 1,901,769 |
| | $ | 105.17 |
| | $ | 550.0 |
| | 3,022,760 |
| | $ | 467.5 |
| | 445,936 |
| | $ | 82.5 |
| | 3,468,696 |
| | $ | 158.56 |
|
(i)The remaining $15.0 million as of September 30, 2017 was recorded as a forward contract indexed to
During the Company’s own common stock and included in capital surplus within Additional paid-in capital in the accompanying Consolidated Balance Sheet, and was subsequently settled in October 2017.
Following settlement of the ASR program in October 2017, the Company’s 2017 repurchasesthree months ended March 31, 2020, KCS repurchased 1,291,635 shares of common stock for $194.2 million, which includes shares delivered to settle the ASR agreements noted above. Since inception of the 2019 Program, KCS has repurchased through the 2015 Program and the 2017 Program, totaled 3,241,9784,314,395 shares of common stock for $661.7 million at an average price of $98.83$153.37 per shareshare. The excess of repurchase price over par value is allocated between additional paid-in capital and a total cost of $320.4 million.retained earnings.
Cash Dividends on Common Stock
On August 15, 2017, the Company’s Board of Directors declared a cash dividend of $0.360 per share payable on October 4, 2017, to common stockholders of record as of September 11, 2017. The aggregate amount of the dividends declared for the three and nine months ended September 30, 2017 was $37.3 million and $107.2 million, respectively.
The following table presents the amount of cash dividends declared per common share by the Company’s Board of Directors:
|
| | | | | | | | | | | | | | | |
| | Three Months Ended | | Nine Months Ended |
| | September 30, | | September 30, |
| | 2017 | | 2016 | | 2017 | | 2016 |
| Cash dividends declared per common share | $ | 0.360 |
| | $ | 0.330 |
| | $ | 1.020 |
| | $ | 0.990 |
|
11. Commitments and Contingencies
Concession Duty. Under KCSM’s 50-yearKansas City Southern de México, S.A. de C.V. (“KCSM”)’s 50-year railroad concession from the Mexican government (the “Concession”), which wouldcould expire in 2047 unless extended, KCSM pays annual concession duty expense of 1.25% of gross revenues. For the three and nine months ended September 30, 2017March 31, 2020, the concession duty expense, which is recorded within Materialsmaterials and other in operating expenses, was $4.2$4.8 million, and $12.7 million, respectively, compared to $3.9 million and $11.2$4.2 million for the same periodsperiod in 2016.2019.
Kansas City Southern and Subsidiaries
Notes to Consolidated Financial Statements—(Continued)
Litigation. The Occasionally, the Company is a party to various legal proceedings, and regulatory examinations, investigations,
administrative actions, alland other legal matters, arising for the most part in the ordinary course of which, except as set forth below, are of an ordinary, routine nature andbusiness, incidental to its operations. Included in these proceedings are various tort claims brought by current and former employees for job-related injuries and by third parties for injuries related to railroad operations. KCS aggressively defends these matters and has established liability provisions whichthat management believes are adequate to cover expected costs. AlthoughThe outcome of litigation and other legal matters is always uncertain. KCS believes it has valid defenses to the legal matters currently pending against it, is not possibledefending itself vigorously, and has recorded accruals determined in accordance with U.S. GAAP, where appropriate. In making a determination regarding accruals, using available information, KCS evaluates the likelihood of an unfavorable outcome in legal or regulatory proceedings to predict with certaintywhich it is a party to and records a loss contingency when it is probable a liability has been incurred and the outcomeamount of any legal proceeding, in the opinion of management, other than those proceedings described in detail below, such proceedings and actions should not, individually, or in the aggregate, have a material adverse effectloss can be reasonably estimated. These subjective determinations are based on the Company’sstatus of such legal or regulatory proceedings, the merits of KCS’s defenses and consultation with legal counsel. Actual outcomes of these legal and regulatory proceedings may materially differ from the current
Kansas City Southern and Subsidiaries
Notes to the Unaudited Consolidated Financial Statements—(Continued)
estimates. It is possible that resolution of one or more of the legal matters currently pending or threatened could result in losses material to KCS’s consolidated results of operations, liquidity or financial statements.condition.
Environmental Liabilities. The Company’s U.S. operations are subject to extensive federal, state and local environmental laws and regulations. The major U.S. environmental laws to which the Company is subject include, among others, the federal Comprehensive Environmental Response, Compensation and Liability Act (“CERCLA,” also known as the Superfund law), the Toxic Substances Control Act, the FederalClean Water Pollution Control Act, and the Hazardous Materials Transportation Act. CERCLA can impose joint and several liabilities for cleanup and investigation costs, without regard to fault or legality of the original conduct, on current and predecessor owners and operators of a site, as well as those who generate, or arrange for the disposal of hazardous substances. The Company does not believe that compliance with the requirements imposed by the environmental lawslegislation will impair its competitive capability or result in any material additional capital expenditures, operating or maintenance costs. The Company is, however, subject to environmental remediation costs as described in the following paragraphs.
The Company’s Mexico operations are subject to Mexican federal and state laws and regulations relating to the protection of the environment through the establishment of standards for water discharge, water supply, emissions, noise pollution, hazardous substances and transportation and handling of hazardous and solid waste. The Mexican government may bring administrative and criminal proceedings, impose economic sanctions against companies that violate environmental laws, and temporarily or even permanently close non-complying facilities.
The risk of incurring environmental liability is inherent in the railroad industry. As part of serving the petroleum and chemicals industry, the Company transports hazardous materials and has a professional team available to respond to and handle environmental issues that might occur in the transport of such materials.
The Company performs ongoing reviews and evaluations of the various environmental programs and issues within the Company’s operations, and, as necessary, takes actions intended to limit the Company’s exposure to potential liability. Although these costs cannot be predicted with certainty, management believes that the ultimate outcome of identified matters will not have a material adverse effect on the Company’s consolidated financial statements.
Personal Injury. The Company’s personal injury liability is based on semi-annual actuarial studies performed on an undiscounted basis by an independent third party actuarial firm and reviewed by management. This liability is based on personal injury claims filed and an estimate of claims incurred but not yet reported. Actual results may vary from estimates due to the number, type and severity of the injury, costs of medical treatments and uncertainties in litigation. Adjustments to the liability are reflected within operating expenses in the period in which changes to estimates are known. Personal injury claims in excess of self-insurance levels are insured up to certain coverage amounts, depending on the type of claim and year of occurrence. The personal injury liability as of September 30, 2017March 31, 2020, wasis based on an updated actuarial study of personal injury claims through May 31, 2017,November 30, 2019, and review of the last four months’ experience. Although these estimates cannot be predicted with certainty, management believes that the ultimate outcome will not have a material adverse effect on the Company’s consolidated financial statements.
The personal injury liability activity was as follows (in millions):
|
| | | | | | | |
| | Nine Months Ended September 30, |
| | 2017 | | 2016 |
| Balance at beginning of year | $ | 23.8 |
| | $ | 23.9 |
|
| Accruals | 3.6 |
| | 3.6 |
|
| Change in estimate | (2.0 | ) | | (0.6 | ) |
| Payments | (4.0 | ) | | (2.3 | ) |
| Balance at end of period | $ | 21.4 |
| | $ | 24.6 |
|
Tax Contingencies. Tax returns filed in the U.S. for periods after 20132015 and in Mexico for periods after 20112012 remain open to examination by the taxing authorities. TheIn 2018, the IRS initiated an examination of the 2016 U.S. federal tax return. In 2019, the Servicio de Administración Tributaria (the “SAT”), the Mexican equivalent of the IRS, completed the examinationinitiated an audit of the KCSM 20112013 and 2014 Mexico tax return duringreturns. The Company does not expect that these examinations will have a material impact on the consolidated financial statements. During the first quarter without adjustment. An SAT examination was
Kansas City Southern and Subsidiaries
Notes to Consolidated Financial Statements—(Continued)
completed during2017, the second quarter without adjustment for the KCSM Servicios, S.A. de C.V. (“KCSM Servicios”) 2013 Mexico tax return. The Company received audit assessments from the SAT during the first quarter of 2017 for the KCSM 2009 and 2010 Mexico tax returns. TheIn 2017, the Company commenced administrative actions with the SAT. During the first quarter of 2018, the audit assessments were nullified by the SAT. In the third quarter of 2018, the SAT issued new assessments and if these assessments are not nullified, the matters will be litigated.Company filed administrative appeals with the SAT. The Company believes that it has strong legal arguments in its favor and it is more likely than not that the Companyit will prevail in any challenge of the assessments.
A tax benefit of $3.7 million was recognized in the third quarter of 2017 relating to a previous uncertain tax position as a result of a lapse of the statute of limitations.
The Company litigated a Value Added Tax (“VAT”) audit assessment from the SAT for KCSM for the year ended December 31, 2005. In November 2016, KCSM was notified of a resolution by the Mexican tax court annulling this assessment. The SAT appealed this resolution to the Mexican circuit court. In September 2017, KCSM was notified of a resolution by the circuit court which ordered the tax court to consider an argument made by KCSM in the original tax court proceeding that was not addressed in the tax court’s November 2016 resolution and which, if successful, would preclude the SAT from issuing a new 2005 VAT audit assessment. The Company believes it is probable that the tax court will continue to annul the 2005 VAT assessment. Further, the Company believes it is more likely than not that the SAT will ultimately be precluded from issuing a new 2005 VAT audit assessment. In the unexpected event that the SAT is provided the opportunity to issue a new 2005 VAT audit assessment, the Company cannot predict if the SAT would issue a new assessment or the basis of any new assessment. Accordingly, the Company is not able to estimate any related potential exposure.
KCSM has not historically assessed VAT on international import transportation services provided to its customers based on a written ruling that KCSM obtained from the SAT in 2008 stating that such services were not subject to VAT (the “2008 Ruling”). Notwithstanding the 2008 Ruling, in December 2013, the SAT unofficially informed KCSM of an intended implementation of new criteria effective as of January 1, 2014, pursuant to which VAT would be assessed on all international import transportation services on the portion of the services provided within Mexico. Additionally, in November 2013, the SAT filed an action to nullify the 2008 Ruling, potentially exposing the application of the new criteria to open tax years. In February 2014, KCSM filed an action opposing the SAT’s nullification action. In December 2016, KCSM was notified of a resolution issued by the Mexican tax court confirming the 2008 Ruling. The SAT appealed this resolution. In October 2017, the circuit court resolved to not render a decision on the case but rather to send the SAT’s appeal to the Supreme Court. In February 2018, the Supreme Court decided not to hear the case and
Kansas City Southern and Subsidiaries
Notes to the Unaudited Consolidated Financial Statements—(Continued)
remanded the SAT’s appeal back to the circuit court for a decision. In July 2018, the circuit court ordered the tax court to consider certain arguments made by the SAT in the original court proceeding that were not addressed in the tax court’s December 2016 resolution. In October 2018, the tax court issued a decision confirming the 2008 Ruling. The SAT has appealed this resolution and the matter is currently under review by the Mexican circuit court.decision. The Company believes it is more likely than not that it will continue to prevail in this matter. Further, as of the date of this filing, the SAT has not implemented any new criteria regarding thisthe assessment of VAT on international import transportation services. The Company believes it is probable that any unexpected nullification of the 2008 Ruling and the implementation of any new VAT criteria would be applied on a prospective basis, in which case, due to the pass-through nature of VAT, KCSM would begin to assess its customers for VAT on international import transportation services, resulting in no material impact to the Company’s consolidated financial statements.
Contractual Agreements. In the normal course of business, the Company enters into various contractual agreements related to commercial arrangements and the use of other railroads’ or governmental entities’ infrastructure needed for the operations of the business. The Company is involved or may become involved in certain disputes involving transportation rates, product loss or damage, charges, and interpretations related to these agreements. While the outcome of these matters cannot be predicted with certainty, the Company believes that, when resolved, these disputes will not have a material effect on its consolidated financial statements.
Credit Risk. The Company continually monitors risks related to economic changes and certain customer receivables concentrations. Significant changes in customer concentration or payment terms, deterioration of customer creditworthiness, bankruptcy, insolvency or liquidation of a customer, or further weakening in economic trends could have a significant impact on the collectability of the Company’s receivables and its operating results. If the financial condition of the Company’s customers were to deteriorate and result in an impairment of their ability to make payments, additional allowances may be required. The Company has recorded provisions for uncollectability based on its best estimate at September 30, 2017.March 31, 2020.
Panama Canal Railway Company (“PCRC”) Guarantees and Indemnities. At September 30, 2017,March 31, 2020, the Company had issued and outstanding $5.5$5.6 million under a standby letter of credit to fulfill its obligation to fund fifty50 percent of the debt service reserve and liquidity reserve established by PCRC in connection with the issuance of the 7.0% Senior Secured Notes due November 1, 2026 (the “PCRC Notes”). Additionally, KCS has pledged its shares of PCRC as security for the PCRC Notes.
Mexican Antitrust Review. Pursuant to the Mexican Antitrust Law and the Regulatory Railroad Service Law, on September 12, 2016, the Mexican government’s antitrust commission (Comisión Federal de Competencia Económica or “COFECE”), announced that it would review competitive conditions in the Mexican railroad industry, with respect to the existence of effective competition in the provision of interconnection services, trackage rights, switching rights and interline services used to render public freight transport in
Kansas City Southern and Subsidiaries
Notes to Consolidated Financial Statements—(Continued)
Mexico. The COFECE review includes the entire freight rail transportation market in Mexico and is not targeted to any single rail carrier.
On March 15, 2017, the COFECE published an executive summary of its preliminary report in the Diario Oficial de la Federación. The COFECE’s preliminary report concluded that there was a lack of effective competition in the market for trackage rights (“Relevant Market”) throughout the entire networks of KCSM, Ferrocarril Mexicano, S.A. de C.V., Ferrosur, S.A. de C.V., and Ferrocarril y Terminal del Valle de Mexico, S.A. de C.V.
The Company disagrees with the COFECE’s reasoning and preliminary conclusions, and responded on April 20, 2017 with evidence and arguments to support the Company’s position, as provided in the Mexican antitrust law. The Company’s response argues that the investigation which supports the conclusions in the preliminary report was conducted contrary to the rule of law, the rules of procedure, and relied upon faulty economic analysis.
On April 27, 2017, the COFECE initiated the incidental procedure to analyze the recusal of two of its commissioners from ongoing proceedings (“Motion to Recuse”). On June 6, 2017, KCSM presented arguments in connection with the Motion to Recuse. On July 7, 2017, KCSM was served with rulings dated June 22, 2017 and June 2, 2017, regarding the Motion to Recuse. Consequently, the two commissioners excluded themselves from further participation in the investigation.
The COFECE has an additional term of up to 110 business days after the decision of the Motion to Recuse to issue a final report in connection with effective competition conditions in the Relevant Market. It is expected a final ruling will be issued around January 2018. It is too early to determine what, if any, impact this review may have on Mexican rail operations in the future. If the COFECE’s final report determines there is a lack of effective competition, the COFECE could request the new Mexican Agencia Reguladora del Transporte Ferroviario (“Regulatory Agency of Rail Transportation” or “ARTF”), which has primary regulatory jurisdiction over the Company’s Mexican operations, to conduct proceedings to determine whether to establish new limited mandatory trackage rights and/or rate regulation under the Amendments to the Mexican Regulatory Railroad Service Law.
U.S. Surface Transportation Board. On July 27, 2016, the Surface Transportation Board issued a Notice of Proposed Rulemaking in Ex Parte 711 (Sub-No.1) Reciprocal Switching, proposing rules related to reciprocal switching. Initial comments on the proposed rule were due by October 26, 2016, and replies to the initial comments were due by January 13, 2017. On December 27, 2016, the agency suspended the procedural deadline following submission of reply comments, pending anticipated changes in the agency’s membership. Until the rule has been finalized, KCS cannot determine what effect, if any, the rule will have on its business.
12. Geographic Information
The Company strategically manages its rail operations as one1 reportable business segment over a single coordinated rail network that extends from the Midwestmidwest and Southeastsoutheast portions of the United States south into Mexico and connects with other Class I railroads. Financial information reported at this level, such as revenues, operating income and cash flows from operations, is used by corporate management, including the Company’s chief operating decision-maker, in evaluating overall financial and operational performance, market strategies, as well as the decisions to allocate capital resources. The Company’s chief operating decision-maker is the chief executive officer.
The following tables provide information by geographic area (in millions):
|
| | | | | | | |
| | Three Months Ended |
| | March 31, |
| Revenues | 2020 | | 2019 |
| U.S. | $ | 379.9 |
| | $ | 365.6 |
|
| Mexico | 351.8 |
| | 309.2 |
|
| Total revenues | $ | 731.7 |
| | $ | 674.8 |
|
| | | | |
| Property and equipment (including concession assets), net | March 31,
2020 | | December 31,
2019 |
| U.S. | $ | 5,559.4 |
| | $ | 5,435.9 |
|
| Mexico | 3,364.6 |
| | 3,370.4 |
|
| Total property and equipment (including concession assets), net | $ | 8,924.0 |
| | $ | 8,806.3 |
|
|
| | | | | | | | | | | | | | | |
| | Three Months Ended | | Nine Months Ended |
| | September 30, | | September 30, |
| Revenues | 2017 | | 2016 | | 2017 | | 2016 |
| U.S. | $ | 345.9 |
| | $ | 317.4 |
| | $ | 1,011.5 |
| | $ | 896.4 |
|
| Mexico | 310.7 |
| | 287.1 |
| | 911.0 |
| | 839.3 |
|
| Total revenues | $ | 656.6 |
| | $ | 604.5 |
| | $ | 1,922.5 |
| | $ | 1,735.7 |
|
| | | | | | | | |
| Property and equipment (including concession assets), net | | | | | September 30,
2017 | | December 31,
2016 |
| U.S. | | | | | $ | 5,185.9 |
| | $ | 4,960.6 |
|
| Mexico | | | | | 3,149.7 |
| | 3,109.1 |
|
| Total property and equipment (including concession assets), net | | | | | $ | 8,335.6 |
| | $ | 8,069.7 |
|
Kansas City Southern and Subsidiaries
Notes to Consolidated Financial Statements—(Continued)
13. Condensed Consolidating Financial Information
Pursuant to Securities and Exchange Commission (“SEC”) Regulation S-X Rule 3-10 “Financial statements of guarantors and issuers of guaranteed securities registered or being registered”, the Company is required to provide condensed consolidating financial information for issuers of certain of its senior notes that are guaranteed.
As of September 30, 2017, KCS had outstanding $2,093.5 million senior notes due through 2045. The senior notes are unsecured obligations of KCS, and are also jointly and severally and fully and unconditionally guaranteed on an unsecured senior basis by Kansas City Southern Railway Company (“KCSR”) and certain wholly-owned domestic subsidiaries of KCS. As a result, the Company is providing the following condensed consolidating financial information (in millions).
Condensed Consolidating Statements of Comprehensive Income - KCS Notes
|
| | | | | | | | | | | | | | | | | | | |
| | Three Months Ended September 30, 2017 |
| | Parent | | Guarantor Subsidiaries | | Non-Guarantor Subsidiaries | | Consolidating Adjustments | | Consolidated KCS |
| Revenues | $ | — |
| | $ | 316.1 |
| | $ | 344.9 |
| | $ | (4.4 | ) | | $ | 656.6 |
|
| Operating expenses | 0.8 |
| | 221.6 |
| | 204.8 |
| | (4.4 | ) | | 422.8 |
|
| Operating income (loss) | (0.8 | ) | | 94.5 |
| | 140.1 |
| | — |
| | 233.8 |
|
| Equity in net earnings of affiliates | 130.2 |
| | 2.5 |
| | 2.2 |
| | (132.1 | ) | | 2.8 |
|
| Interest expense | (20.3 | ) | | (17.7 | ) | | (8.8 | ) | | 21.6 |
| | (25.2 | ) |
| Foreign exchange gain | — |
| | — |
| | 0.8 |
| | — |
| | 0.8 |
|
| Other income (expense), net | 20.8 |
| | (0.3 | ) | | 0.7 |
| | (21.5 | ) | | (0.3 | ) |
| Income before income taxes | 129.9 |
| | 79.0 |
| | 135.0 |
| | (132.0 | ) | | 211.9 |
|
| Income tax expense | 0.6 |
| | 26.4 |
| | 55.0 |
| | — |
| | 82.0 |
|
| Net income | 129.3 |
| | 52.6 |
| | 80.0 |
| | (132.0 | ) | | 129.9 |
|
| Less: Net income attributable to noncontrolling interest | — |
| | 0.6 |
| | — |
| | — |
| | 0.6 |
|
| Net income attributable to Kansas City Southern and subsidiaries | 129.3 |
| | 52.0 |
| | 80.0 |
| | (132.0 | ) | | 129.3 |
|
| Other comprehensive loss | (0.7 | ) | | — |
| | (0.3 | ) | | 0.3 |
| | (0.7 | ) |
| Comprehensive income attributable to Kansas City Southern and subsidiaries | $ | 128.6 |
| | $ | 52.0 |
| | $ | 79.7 |
| | $ | (131.7 | ) | | $ | 128.6 |
|
Kansas City Southern and Subsidiaries
Notes to Consolidated Financial Statements—(Continued)
Condensed Consolidating Statements of Comprehensive Income - KCS Notes—(Continued)
|
| | | | | | | | | | | | | | | | | | | |
| | Three Months Ended September 30, 2016 |
| | Parent | | Guarantor Subsidiaries | | Non-Guarantor Subsidiaries | | Consolidating Adjustments | | Consolidated KCS |
| Revenues | $ | — |
| | $ | 289.9 |
| | $ | 319.0 |
| | $ | (4.4 | ) | | $ | 604.5 |
|
| Operating expenses | 0.9 |
| | 214.7 |
| | 193.5 |
| | (4.4 | ) | | 404.7 |
|
| Operating income (loss) | (0.9 | ) | | 75.2 |
| | 125.5 |
| | — |
| | 199.8 |
|
| Equity in net earnings of affiliates | 119.1 |
| | 1.7 |
| | 3.0 |
| | (120.3 | ) | | 3.5 |
|
| Interest expense | (21.7 | ) | | (20.6 | ) | | (16.7 | ) | | 33.8 |
| | (25.2 | ) |
| Foreign exchange loss | — |
| | — |
| | (19.8 | ) | | — |
| | (19.8 | ) |
| Other income (expense), net | 26.3 |
| | (0.1 | ) | | 7.1 |
| | (33.3 | ) | | — |
|
| Income before income taxes | 122.8 |
| | 56.2 |
| | 99.1 |
| | (119.8 | ) | | 158.3 |
|
| Income tax expense | 2.2 |
| | 19.9 |
| | 15.2 |
| | — |
| | 37.3 |
|
| Net income | 120.6 |
| | 36.3 |
| | 83.9 |
| | (119.8 | ) | | 121.0 |
|
| Less: Net income attributable to noncontrolling interest | — |
| | 0.4 |
| | — |
| | — |
| | 0.4 |
|
| Net income attributable to Kansas City Southern and subsidiaries | 120.6 |
| | 35.9 |
| | 83.9 |
| | (119.8 | ) | | 120.6 |
|
| Other comprehensive loss | (0.3 | ) | | — |
| | (0.4 | ) | | 0.4 |
| | (0.3 | ) |
| Comprehensive income attributable to Kansas City Southern and subsidiaries | $ | 120.3 |
| | $ | 35.9 |
| | $ | 83.5 |
| | $ | (119.4 | ) | | $ | 120.3 |
|
|
| | | | | | | | | | | | | | | | | | | |
| | Nine Months Ended September 30, 2017 |
| | Parent | | Guarantor Subsidiaries | | Non-Guarantor Subsidiaries | | Consolidating Adjustments | | Consolidated KCS |
| Revenues | $ | — |
| | $ | 924.4 |
| | $ | 1,011.2 |
| | $ | (13.1 | ) | | $ | 1,922.5 |
|
| Operating expenses | 4.9 |
| | 661.4 |
| | 585.5 |
| | (13.1 | ) | | 1,238.7 |
|
| Operating income (loss) | (4.9 | ) | | 263.0 |
| | 425.7 |
| | — |
| | 683.8 |
|
| Equity in net earnings of affiliates | 410.8 |
| | 5.3 |
| | 8.2 |
| | (414.6 | ) | | 9.7 |
|
| Interest expense | (61.0 | ) | | (54.6 | ) | | (27.1 | ) | | 67.8 |
| | (74.9 | ) |
| Foreign exchange gain | — |
| | — |
| | 61.8 |
| | — |
| | 61.8 |
|
| Other income, net | 66.7 |
| | 0.5 |
| | 1.3 |
| | (67.8 | ) | | 0.7 |
|
| Income before income taxes | 411.6 |
| | 214.2 |
| | 469.9 |
| | (414.6 | ) | | 681.1 |
|
| Income tax expense | 1.3 |
| | 78.1 |
| | 190.2 |
| | — |
| | 269.6 |
|
| Net income | 410.3 |
| | 136.1 |
| | 279.7 |
| | (414.6 | ) | | 411.5 |
|
| Less: Net income attributable to noncontrolling interest | — |
| | 1.2 |
| | — |
| | — |
| | 1.2 |
|
| Net income attributable to Kansas City Southern and subsidiaries | 410.3 |
| | 134.9 |
| | 279.7 |
| | (414.6 | ) | | 410.3 |
|
| Other comprehensive income (loss) | (1.7 | ) | | — |
| | 1.8 |
| | (1.8 | ) | | (1.7 | ) |
| Comprehensive income attributable to Kansas City Southern and subsidiaries | $ | 408.6 |
| | $ | 134.9 |
| | $ | 281.5 |
| | $ | (416.4 | ) | | $ | 408.6 |
|
Kansas City Southern and Subsidiaries
Notes to Consolidated Financial Statements—(Continued)
Condensed Consolidating Statements of Comprehensive Income - KCS Notes—(Continued)
|
| | | | | | | | | | | | | | | | | | | |
| | Nine Months Ended September 30, 2016 |
| | Parent | | Guarantor Subsidiaries | | Non-Guarantor Subsidiaries | | Consolidating Adjustments | | Consolidated KCS |
| Revenues | $ | — |
| | $ | 817.5 |
| | $ | 931.6 |
| | $ | (13.4 | ) | | $ | 1,735.7 |
|
| Operating expenses | 3.7 |
| | 585.1 |
| | 552.7 |
| | (13.4 | ) | | 1,128.1 |
|
| Operating income (loss) | (3.7 | ) | | 232.4 |
| | 378.9 |
| | — |
| | 607.6 |
|
| Equity in net earnings of affiliates | 336.3 |
| | 4.7 |
| | 9.0 |
| | (339.6 | ) | | 10.4 |
|
| Interest expense | (61.1 | ) | | (63.2 | ) | | (46.6 | ) | | 97.7 |
| | (73.2 | ) |
| Foreign exchange loss | — |
| | — |
| | (47.3 | ) | | — |
| | (47.3 | ) |
| Other income, net | 79.1 |
| | — |
| | 16.9 |
| | (96.5 | ) | | (0.5 | ) |
| Income before income taxes | 350.6 |
| | 173.9 |
| | 310.9 |
| | (338.4 | ) | | 497.0 |
|
| Income tax expense | 2.1 |
| | 65.9 |
| | 79.4 |
| | — |
| | 147.4 |
|
| Net income | 348.5 |
| | 108.0 |
| | 231.5 |
| | (338.4 | ) | | 349.6 |
|
| Less: Net income attributable to noncontrolling interest | — |
| | 1.1 |
| | — |
| | — |
| | 1.1 |
|
| Net income attributable to Kansas City Southern and subsidiaries | 348.5 |
| | 106.9 |
| | 231.5 |
| | (338.4 | ) | | 348.5 |
|
| Other comprehensive loss | (1.0 | ) | | — |
| | (1.7 | ) | | 1.7 |
| | (1.0 | ) |
| Comprehensive income attributable to Kansas City Southern and subsidiaries | $ | 347.5 |
| | $ | 106.9 |
| | $ | 229.8 |
| | $ | (336.7 | ) | | $ | 347.5 |
|
Condensed Consolidating Balance Sheets - KCS Notes
|
| | | | | | | | | | | | | | | | | | | |
| | September 30, 2017 |
| | Parent | | Guarantor Subsidiaries | | Non-Guarantor Subsidiaries | | Consolidating Adjustments | | Consolidated KCS |
| Assets: | | | | | | | | | |
| Current assets | $ | 29.3 |
| | $ | 250.2 |
| | $ | 398.7 |
| | $ | (37.7 | ) | | $ | 640.5 |
|
| Investments | — |
| | 3.9 |
| | 48.0 |
| | — |
| | 51.9 |
|
| Investments in consolidated subsidiaries | 3,906.9 |
| | 498.1 |
| | — |
| | (4,405.0 | ) | | — |
|
| Property and equipment (including concession assets), net | — |
| | 4,414.1 |
| | 3,924.1 |
| | (2.6 | ) | | 8,335.6 |
|
| Other assets | 2,525.2 |
| | 48.7 |
| | 252.7 |
| | (2,754.3 | ) | | 72.3 |
|
| Total assets | $ | 6,461.4 |
| | $ | 5,215.0 |
| | $ | 4,623.5 |
| | $ | (7,199.6 | ) | | $ | 9,100.3 |
|
| Liabilities and equity: | | | | | | | | | |
| Current liabilities | $ | 257.2 |
| | $ | 475.4 |
| | $ | 231.4 |
| | $ | (39.2 | ) | | $ | 924.8 |
|
| Long-term debt | 2,066.2 |
| | 1,883.7 |
| | 1,042.8 |
| | (2,754.3 | ) | | 2,238.4 |
|
| Deferred income taxes | 27.0 |
| | 1,149.2 |
| | 256.9 |
| | (0.8 | ) | | 1,432.3 |
|
| Other liabilities | 9.0 |
| | 72.7 |
| | 16.7 |
| | — |
| | 98.4 |
|
| Stockholders’ equity | 4,102.0 |
| | 1,318.2 |
| | 3,075.7 |
| | (4,405.3 | ) | | 4,090.6 |
|
| Noncontrolling interest | — |
| | 315.8 |
| | — |
| | — |
| | 315.8 |
|
| Total liabilities and equity | $ | 6,461.4 |
| | $ | 5,215.0 |
| | $ | 4,623.5 |
| | $ | (7,199.6 | ) | | $ | 9,100.3 |
|
Kansas City Southern and Subsidiaries
Notes to Consolidated Financial Statements—(Continued)
Condensed Consolidating Balance Sheets - KCS Notes—(Continued)
|
| | | | | | | | | | | | | | | | | | | |
| | December 31, 2016 |
| | Parent | | Guarantor Subsidiaries | | Non-Guarantor Subsidiaries | | Consolidating Adjustments | | Consolidated KCS |
| Assets: | | | | | | | | | |
| Current assets | $ | 18.3 |
| | $ | 275.4 |
| | $ | 389.6 |
| | $ | (35.3 | ) | | $ | 648.0 |
|
| Investments | — |
| | 3.9 |
| | 29.0 |
| | — |
| | 32.9 |
|
| Investments in consolidated subsidiaries | 3,497.7 |
| | 493.7 |
| | — |
| | (3,991.4 | ) | | — |
|
| Property and equipment (including concession assets), net | — |
| | 4,203.6 |
| | 3,868.8 |
| | (2.7 | ) | | 8,069.7 |
|
| Other assets | 2,767.9 |
| | 43.0 |
| | 252.6 |
| | (2,996.6 | ) | | 66.9 |
|
| Total assets | $ | 6,283.9 |
| | $ | 5,019.6 |
| | $ | 4,540.0 |
| | $ | (7,026.0 | ) | | $ | 8,817.5 |
|
| Liabilities and equity: | | | | | | | | | |
| Current liabilities | $ | 87.3 |
| | $ | 432.8 |
| | $ | 261.0 |
| | $ | (36.7 | ) | | $ | 744.4 |
|
| Long-term debt | 2,064.3 |
| | 1,928.9 |
| | 1,274.9 |
| | (2,996.6 | ) | | 2,271.5 |
|
| Deferred income taxes | 26.9 |
| | 1,075.3 |
| | 188.0 |
| | (0.9 | ) | | 1,289.3 |
|
| Other liabilities | 4.0 |
| | 86.3 |
| | 17.5 |
| | — |
| | 107.8 |
|
| Stockholders’ equity | 4,101.4 |
| | 1,181.7 |
| | 2,798.6 |
| | (3,991.8 | ) | | 4,089.9 |
|
| Noncontrolling interest | — |
| | 314.6 |
| | — |
| | — |
| | 314.6 |
|
| Total liabilities and equity | $ | 6,283.9 |
| | $ | 5,019.6 |
| | $ | 4,540.0 |
| | $ | (7,026.0 | ) | | $ | 8,817.5 |
|
Kansas City Southern and Subsidiaries
Notes to Consolidated Financial Statements—(Continued)
Condensed Consolidating Statements of Cash Flows - KCS Notes
|
| | | | | | | | | | | | | | | | | | | |
| | Nine Months Ended September 30, 2017 |
| | Parent | | Guarantor Subsidiaries | | Non-Guarantor Subsidiaries | | Consolidating Adjustments | | Consolidated KCS |
| Operating activities: | | | | | | | | | |
| Net cash provided | $ | 215.1 |
| | $ | 413.9 |
| | $ | 109.7 |
| | $ | (5.0 | ) | | $ | 733.7 |
|
| Investing activities: | | | | | | | | | |
| Capital expenditures | — |
| | (292.9 | ) | | (154.0 | ) | | — |
| | (446.9 | ) |
| Purchase or replacement of equipment under operating leases | — |
| | (42.6 | ) | | — |
| | — |
| | (42.6 | ) |
| Property investments in MSLLC | — |
| | — |
| | (23.7 | ) | | — |
| | (23.7 | ) |
| Investments in and advances to affiliates | (0.5 | ) | | (0.5 | ) | | (20.3 | ) | | 1.0 |
| | (20.3 | ) |
| Proceeds from repayment of loans to affiliates | 9,814.6 |
| | — |
| | — |
| | (9,814.6 | ) | | — |
|
| Loans to affiliates | (9,772.2 | ) | | — |
| | — |
| | 9,772.2 |
| | — |
|
| Proceeds from disposal of property | — |
| | 5.2 |
| | 1.4 |
| | — |
| | 6.6 |
|
| Other investing activities | — |
| | (16.5 | ) | | 1.4 |
| | — |
| | (15.1 | ) |
| Net cash provided (used) | 41.9 |
| | (347.3 | ) | | (195.2 | ) | | (41.4 | ) | | (542.0 | ) |
| Financing activities: | | | | | | | | | |
| Proceeds from short-term borrowings | 9,772.2 |
| | — |
| | — |
| | — |
| | 9,772.2 |
|
| Repayment of short-term borrowings | (9,600.9 | ) | | — |
| | — |
| | — |
| | (9,600.9 | ) |
| Repayment of long-term debt | — |
| | (2.7 | ) | | (17.5 | ) | | — |
| | (20.2 | ) |
| Dividends paid | (105.1 | ) | | — |
| | (5.0 | ) | | 5.0 |
| | (105.1 | ) |
| Shares repurchased | (320.4 | ) | | — |
| | — |
| | — |
| | (320.4 | ) |
| Proceeds from loans from affiliates | — |
| | 9,772.2 |
| | — |
| | (9,772.2 | ) | | — |
|
| Repayment of loans from affiliates | — |
| | (9,814.6 | ) | | — |
| | 9,814.6 |
| | — |
|
| Contribution from affiliates | — |
| | 0.5 |
| | 0.5 |
| | (1.0 | ) | | — |
|
| Other financing activities | 0.5 |
| | — |
| | — |
| | — |
| | 0.5 |
|
| Net cash used | (253.7 | ) | | (44.6 | ) | | (22.0 | ) | | 46.4 |
| | (273.9 | ) |
| Cash and cash equivalents: | | | | | | | | | |
| Net increase (decrease) | 3.3 |
| | 22.0 |
| | (107.5 | ) | | — |
| | (82.2 | ) |
| At beginning of year | 0.2 |
| | 32.6 |
| | 137.8 |
| | — |
| | 170.6 |
|
| At end of period | $ | 3.5 |
| | $ | 54.6 |
| | $ | 30.3 |
| | $ | — |
| | $ | 88.4 |
|
Kansas City Southern and Subsidiaries
Notes to Consolidated Financial Statements—(Continued)
Condensed Consolidating Statements of Cash Flows - KCS Notes—(Continued)
|
| | | | | | | | | | | | | | | | | | | |
| | Nine Months Ended September 30, 2016 |
| | Parent | | Guarantor Subsidiaries | | Non-Guarantor Subsidiaries | | Consolidating Adjustments | | Consolidated KCS |
| Operating activities: | | | | | | | | | |
| Net cash provided | $ | 178.2 |
| | $ | 380.8 |
| | $ | 288.5 |
| | $ | (163.9 | ) | | $ | 683.6 |
|
| Investing activities: | | | | | | | | | |
| Capital expenditures | — |
| | (269.5 | ) | | (135.6 | ) | | — |
| | (405.1 | ) |
| Purchase or replacement of equipment under operating leases | — |
| | (26.6 | ) | | — |
| | — |
| | (26.6 | ) |
| Property investments in MSLLC | — |
| | — |
| | (31.2 | ) | | — |
| | (31.2 | ) |
| Investments in and advances to affiliates | (103.4 | ) | | (6.5 | ) | | (0.9 | ) | | 109.9 |
| | (0.9 | ) |
| Proceeds from repayment of loans to affiliates | 6,743.5 |
| | — |
| | — |
| | (6,743.5 | ) | | — |
|
| Loans to affiliates | (6,742.5 | ) | | — |
| | — |
| | 6,742.5 |
| | — |
|
| Proceeds from disposal of property | — |
| | 1.4 |
| | 2.3 |
| | (0.1 | ) | | 3.6 |
|
| Other investing activities | — |
| | (10.4 | ) | | 4.5 |
| | 0.1 |
| | (5.8 | ) |
| Net cash used | (102.4 | ) | | (311.6 | ) | | (160.9 | ) | | 108.9 |
| | (466.0 | ) |
| Financing activities: | | | | | | | | | |
| Proceeds from short-term borrowings | 6,499.0 |
| | 243.5 |
| | — |
| | (243.5 | ) | | 6,499.0 |
|
| Repayment of short-term borrowings | (6,579.3 | ) | | — |
| | — |
| | — |
| | (6,579.3 | ) |
| Proceeds from issuance of long-term debt | 248.7 |
| | — |
| | — |
| | — |
| | 248.7 |
|
| Repayment of long-term debt | — |
| | (2.6 | ) | | (18.2 | ) | | — |
| | (20.8 | ) |
| Dividends paid | (107.2 | ) | | — |
| | (162.2 | ) | | 162.2 |
| | (107.2 | ) |
| Shares repurchased | (99.8 | ) | | — |
| | — |
| | — |
| | (99.8 | ) |
| Proceeds from loans from affiliates | — |
| | 6,499.0 |
| | — |
| | (6,499.0 | ) | | — |
|
| Repayment of loans from affiliates | — |
| | (6,743.5 | ) | | — |
| | 6,743.5 |
| | — |
|
| Contribution from affiliates | — |
| | 103.1 |
| | 6.8 |
| | (109.9 | ) | | — |
|
| Other financing activities | (1.5 | ) | | (0.1 | ) | | (1.8 | ) | | 1.7 |
| | (1.7 | ) |
| Net cash provided (used) | (40.1 | ) | | 99.4 |
| | (175.4 | ) | | 55.0 |
| | (61.1 | ) |
| Cash and cash equivalents: | | | | | | | | | |
| Net increase (decrease) | 35.7 |
| | 168.6 |
| | (47.8 | ) | | — |
| | 156.5 |
|
| At beginning of year | 0.2 |
| | 10.2 |
| | 126.2 |
| | — |
| | 136.6 |
|
| At end of period | $ | 35.9 |
| | $ | 178.8 |
| | $ | 78.4 |
| | $ | — |
| | $ | 293.1 |
|
As of September 30, 2017, KCSR had outstanding $2.9 million principal amount of senior notes due through 2045. The senior notes are unsecured obligations of KCSR, and are also jointly and severally and fully and unconditionally guaranteed on an unsecured senior basis by KCS and certain wholly-owned domestic subsidiaries. As a result, the Company is providing the following condensed consolidating financial information (in millions).
Kansas City Southern and Subsidiaries
Notes to Consolidated Financial Statements—(Continued)
Condensed Consolidating Statements of Comprehensive Income - KCSR Notes |
| | | | | | | | | | | | | | | | | | | | | | | |
| | Three Months Ended September 30, 2017 |
| | Parent | | KCSR | | Guarantor Subsidiaries | | Non-Guarantor Subsidiaries | | Consolidating Adjustments | | Consolidated KCS |
| Revenues | $ | — |
| | $ | 310.7 |
| | $ | 9.9 |
| | $ | 344.9 |
| | $ | (8.9 | ) | | $ | 656.6 |
|
| Operating expenses | 0.8 |
| | 216.5 |
| | 9.6 |
| | 204.8 |
| | (8.9 | ) | | 422.8 |
|
| Operating income (loss) | (0.8 | ) | | 94.2 |
| | 0.3 |
| | 140.1 |
| | — |
| | 233.8 |
|
| Equity in net earnings (losses) of affiliates | 130.2 |
| | (0.3 | ) | | 2.1 |
| | 2.2 |
| | (131.4 | ) | | 2.8 |
|
| Interest expense | (20.3 | ) | | (17.7 | ) | | — |
| | (8.8 | ) | | 21.6 |
| | (25.2 | ) |
| Foreign exchange gain | — |
| | — |
| | — |
| | 0.8 |
| | — |
| | 0.8 |
|
| Other income (expense), net | 20.8 |
| | (0.3 | ) | | — |
| | 0.7 |
| | (21.5 | ) | | (0.3 | ) |
| Income before income taxes | 129.9 |
| | 75.9 |
| | 2.4 |
| | 135.0 |
| | (131.3 | ) | | 211.9 |
|
| Income tax expense | 0.6 |
| | 25.4 |
| | 1.0 |
| | 55.0 |
| | — |
| | 82.0 |
|
| Net income | 129.3 |
| | 50.5 |
| | 1.4 |
| | 80.0 |
| | (131.3 | ) | | 129.9 |
|
| Less: Net income attributable to noncontrolling interest | — |
| | — |
| | 0.6 |
| | — |
| | — |
| | 0.6 |
|
| Net income attributable to Kansas City Southern and subsidiaries | 129.3 |
| | 50.5 |
| | 0.8 |
| | 80.0 |
| | (131.3 | ) | | 129.3 |
|
| Other comprehensive loss | (0.7 | ) | | — |
| | — |
| | (0.3 | ) | | 0.3 |
| | (0.7 | ) |
| Comprehensive income attributable to Kansas City Southern and subsidiaries | $ | 128.6 |
| | $ | 50.5 |
| | $ | 0.8 |
| | $ | 79.7 |
| | $ | (131.0 | ) | | $ | 128.6 |
|
|
| | | | | | | | | | | | | | | | | | | | | | | |
| | Three Months Ended September 30, 2016 |
| | Parent | | KCSR | | Guarantor Subsidiaries | | Non-Guarantor Subsidiaries | | Consolidating Adjustments | | Consolidated KCS |
| Revenues | $ | — |
| | $ | 283.5 |
| | $ | 11.8 |
| | $ | 319.0 |
| | $ | (9.8 | ) | | $ | 604.5 |
|
| Operating expenses | 0.9 |
| | 210.1 |
| | 10.0 |
| | 193.5 |
| | (9.8 | ) | | 404.7 |
|
| Operating income (loss) | (0.9 | ) | | 73.4 |
| | 1.8 |
| | 125.5 |
| | — |
| | 199.8 |
|
| Equity in net earnings (losses) of affiliates | 119.1 |
| | (0.3 | ) | | 1.2 |
| | 3.0 |
| | (119.5 | ) | | 3.5 |
|
| Interest expense | (21.7 | ) | | (20.6 | ) | | — |
| | (16.7 | ) | | 33.8 |
| | (25.2 | ) |
| Foreign exchange loss | — |
| | — |
| | — |
| | (19.8 | ) | | — |
| | (19.8 | ) |
| Other income (expense), net | 26.3 |
| | (0.1 | ) | | — |
| | 7.1 |
| | (33.3 | ) | | — |
|
| Income before income taxes | 122.8 |
| | 52.4 |
| | 3.0 |
| | 99.1 |
| | (119.0 | ) | | 158.3 |
|
| Income tax expense | 2.2 |
| | 18.8 |
| | 1.1 |
| | 15.2 |
| | — |
| | 37.3 |
|
| Net income | 120.6 |
| | 33.6 |
| | 1.9 |
| | 83.9 |
| | (119.0 | ) | | 121.0 |
|
| Less: Net income attributable to noncontrolling interest | — |
| | — |
| | 0.4 |
| | — |
| | — |
| | 0.4 |
|
| Net income attributable to Kansas City Southern and subsidiaries | 120.6 |
| | 33.6 |
| | 1.5 |
| | 83.9 |
| | (119.0 | ) | | 120.6 |
|
| Other comprehensive loss | (0.3 | ) | | — |
| | — |
| | (0.4 | ) | | 0.4 |
| | (0.3 | ) |
| Comprehensive income attributable to Kansas City Southern and subsidiaries | $ | 120.3 |
| | $ | 33.6 |
| | $ | 1.5 |
| | $ | 83.5 |
| | $ | (118.6 | ) | | $ | 120.3 |
|
Kansas City Southern and Subsidiaries
Notes to Consolidated Financial Statements—(Continued)
Condensed Consolidating Statements of Comprehensive Income - KCSR Notes—(Continued)
|
| | | | | | | | | | | | | | | | | | | | | | | |
| | Nine Months Ended September 30, 2017 |
| | Parent | | KCSR | | Guarantor Subsidiaries | | Non-Guarantor Subsidiaries | | Consolidating Adjustments | | Consolidated KCS |
| Revenues | $ | — |
| | $ | 906.4 |
| | $ | 33.0 |
| | $ | 1,011.2 |
| | $ | (28.1 | ) | | $ | 1,922.5 |
|
| Operating expenses | 4.9 |
| | 647.0 |
| | 29.4 |
| | 585.5 |
| | (28.1 | ) | | 1,238.7 |
|
| Operating income (loss) | (4.9 | ) | | 259.4 |
| | 3.6 |
| | 425.7 |
| | — |
| | 683.8 |
|
| Equity in net earnings (losses) of affiliates | 410.8 |
| | (0.6 | ) | | 3.9 |
| | 8.2 |
| | (412.6 | ) | | 9.7 |
|
| Interest expense | (61.0 | ) | | (54.6 | ) | | — |
| | (27.1 | ) | | 67.8 |
| | (74.9 | ) |
| Foreign exchange gain | — |
| | — |
| | — |
| | 61.8 |
| | — |
| | 61.8 |
|
| Other income, net | 66.7 |
| | 0.5 |
| | — |
| | 1.3 |
| | (67.8 | ) | | 0.7 |
|
| Income before income taxes | 411.6 |
| | 204.7 |
|
| 7.5 |
|
| 469.9 |
|
| (412.6 | ) | | 681.1 |
|
| Income tax expense | 1.3 |
| | 75.2 |
| | 2.9 |
| | 190.2 |
| | — |
| | 269.6 |
|
| Net income | 410.3 |
| | 129.5 |
|
| 4.6 |
|
| 279.7 |
|
| (412.6 | ) | | 411.5 |
|
| Less: Net income attributable to noncontrolling interest | — |
| | — |
| | 1.2 |
| | — |
| | — |
| | 1.2 |
|
| Net income attributable to Kansas City Southern and subsidiaries | 410.3 |
| | 129.5 |
|
| 3.4 |
|
| 279.7 |
|
| (412.6 | ) | | 410.3 |
|
| Other comprehensive income (loss) | (1.7 | ) | | — |
| | — |
| | 1.8 |
| | (1.8 | ) | | (1.7 | ) |
| Comprehensive income attributable to Kansas City Southern and subsidiaries | $ | 408.6 |
| | $ | 129.5 |
| | $ | 3.4 |
| | $ | 281.5 |
| | $ | (414.4 | ) | | $ | 408.6 |
|
|
| | | | | | | | | | | | | | | | | | | | | | | |
| | Nine Months Ended September 30, 2016 |
| | Parent | | KCSR | | Guarantor Subsidiaries | | Non-Guarantor Subsidiaries | | Consolidating Adjustments | | Consolidated KCS |
| Revenues | $ | — |
| | $ | 798.8 |
| | $ | 33.9 |
| | $ | 931.6 |
| | $ | (28.6 | ) | | $ | 1,735.7 |
|
| Operating expenses | 3.7 |
| | 571.6 |
| | 28.7 |
| | 552.7 |
| | (28.6 | ) | | 1,128.1 |
|
| Operating income (loss) | (3.7 | ) | | 227.2 |
| | 5.2 |
| | 378.9 |
| | — |
| | 607.6 |
|
| Equity in net earnings of affiliates | 336.3 |
| | — |
| | 3.3 |
| | 9.0 |
| | (338.2 | ) | | 10.4 |
|
| Interest expense | (61.1 | ) | | (63.2 | ) | | — |
| | (46.6 | ) | | 97.7 |
| | (73.2 | ) |
| Foreign exchange loss | — |
| | — |
| | — |
| | (47.3 | ) | | — |
| | (47.3 | ) |
| Other income, net | 79.1 |
| | — |
| | — |
| | 16.9 |
| | (96.5 | ) | | (0.5 | ) |
| Income before income taxes | 350.6 |
| | 164.0 |
| | 8.5 |
| | 310.9 |
| | (337.0 | ) | | 497.0 |
|
| Income tax expense | 2.1 |
| | 62.4 |
| | 3.5 |
| | 79.4 |
| | — |
| | 147.4 |
|
| Net income | 348.5 |
| | 101.6 |
| | 5.0 |
| | 231.5 |
| | (337.0 | ) | | 349.6 |
|
| Less: Net income attributable to noncontrolling interest | — |
| | — |
| | 1.1 |
| | — |
| | — |
| | 1.1 |
|
| Net income attributable to Kansas City Southern and subsidiaries | 348.5 |
| | 101.6 |
| | 3.9 |
| �� | 231.5 |
| | (337.0 | ) | | 348.5 |
|
| Other comprehensive loss | (1.0 | ) | | — |
| | — |
| | (1.7 | ) | | 1.7 |
| | (1.0 | ) |
| Comprehensive income attributable to Kansas City Southern and subsidiaries | $ | 347.5 |
| | $ | 101.6 |
| | $ | 3.9 |
| | $ | 229.8 |
| | $ | (335.3 | ) | | $ | 347.5 |
|
Kansas City Southern and Subsidiaries
Notes to Consolidated Financial Statements—(Continued)
Condensed Consolidating Balance Sheets - KCSR Notes
|
| | | | | | | | | | | | | | | | | | | | | | | |
| | September 30, 2017 |
| | Parent | | KCSR | | Guarantor Subsidiaries | | Non-Guarantor Subsidiaries | | Consolidating Adjustments | | Consolidated KCS |
| Assets: | | | | | | | | | | | |
| Current assets | $ | 29.3 |
| | $ | 245.5 |
| | $ | 4.7 |
| | $ | 398.7 |
| | $ | (37.7 | ) | | $ | 640.5 |
|
| Investments | — |
| | 3.9 |
| | — |
| | 48.0 |
| | — |
| | 51.9 |
|
| Investments in consolidated subsidiaries | 3,906.9 |
| | (11.7 | ) | | 496.0 |
| | — |
| | (4,391.2 | ) | | — |
|
| Property and equipment (including concession assets), net | — |
| | 4,240.6 |
| | 173.5 |
| | 3,924.1 |
| | (2.6 | ) | | 8,335.6 |
|
| Other assets | 2,525.2 |
| | 48.7 |
| | — |
| | 252.7 |
| | (2,754.3 | ) | | 72.3 |
|
| Total assets | $ | 6,461.4 |
| | $ | 4,527.0 |
| | $ | 674.2 |
| | $ | 4,623.5 |
| | $ | (7,185.8 | ) | | $ | 9,100.3 |
|
| Liabilities and equity: | | | | | | | | | | | |
| Current liabilities | $ | 257.2 |
| | $ | 392.4 |
| | $ | 83.0 |
| | $ | 231.4 |
| | $ | (39.2 | ) | | $ | 924.8 |
|
| Long-term debt | 2,066.2 |
| | 1,883.7 |
| | — |
| | 1,042.8 |
| | (2,754.3 | ) | | 2,238.4 |
|
| Deferred income taxes | 27.0 |
| | 1,008.9 |
| | 140.3 |
| | 256.9 |
| | (0.8 | ) | | 1,432.3 |
|
| Other liabilities | 9.0 |
| | 72.6 |
| | 0.1 |
| | 16.7 |
| | — |
| | 98.4 |
|
| Stockholders’ equity | 4,102.0 |
| | 1,169.4 |
| | 135.0 |
| | 3,075.7 |
| | (4,391.5 | ) | | 4,090.6 |
|
| Noncontrolling interest | — |
| | — |
| | 315.8 |
| | — |
| | — |
| | 315.8 |
|
| Total liabilities and equity | $ | 6,461.4 |
| | $ | 4,527.0 |
| | $ | 674.2 |
| | $ | 4,623.5 |
| | $ | (7,185.8 | ) | | $ | 9,100.3 |
|
|
| | | | | | | | | | | | | | | | | | | | | | | |
| | December 31, 2016 |
| | Parent | | KCSR | | Guarantor Subsidiaries | | Non-Guarantor Subsidiaries | | Consolidating Adjustments | | Consolidated KCS |
| Assets: | | | | | | | | | | | |
| Current assets | $ | 18.3 |
| | $ | 271.8 |
| | $ | 4.6 |
| | $ | 389.6 |
| | $ | (36.3 | ) | | $ | 648.0 |
|
| Investments | — |
| | 3.9 |
| | — |
| | 29.0 |
| | — |
| | 32.9 |
|
| Investments in consolidated subsidiaries | 3,497.7 |
| | (9.8 | ) | | 491.7 |
| | — |
| | (3,979.6 | ) | | — |
|
| Property and equipment (including concession assets), net | — |
| | 4,024.5 |
| | 179.1 |
| | 3,868.8 |
| | (2.7 | ) | | 8,069.7 |
|
| Other assets | 2,767.9 |
| | 43.0 |
| | — |
| | 252.6 |
| | (2,996.6 | ) | | 66.9 |
|
| Total assets | $ | 6,283.9 |
| | $ | 4,333.4 |
| | $ | 675.4 |
| | $ | 4,540.0 |
| | $ | (7,015.2 | ) | | $ | 8,817.5 |
|
| Liabilities and equity: | | | | | | | | | | | |
| Current liabilities | $ | 87.3 |
| | $ | 342.1 |
| | $ | 91.7 |
| | $ | 261.0 |
| | $ | (37.7 | ) | | $ | 744.4 |
|
| Long-term debt | 2,064.3 |
| | 1,928.8 |
| | 0.1 |
| | 1,274.9 |
| | (2,996.6 | ) | | 2,271.5 |
|
| Deferred income taxes | 26.9 |
| | 937.7 |
| | 137.6 |
| | 188.0 |
| | (0.9 | ) | | 1,289.3 |
|
| Other liabilities | 4.0 |
| | 86.2 |
| | 0.1 |
| | 17.5 |
| | — |
| | 107.8 |
|
| Stockholders’ equity | 4,101.4 |
| | 1,038.6 |
| | 131.3 |
| | 2,798.6 |
| | (3,980.0 | ) | | 4,089.9 |
|
| Noncontrolling interest | — |
| | — |
| | 314.6 |
| | — |
| | — |
| | 314.6 |
|
| Total liabilities and equity | $ | 6,283.9 |
| | $ | 4,333.4 |
| | $ | 675.4 |
| | $ | 4,540.0 |
| | $ | (7,015.2 | ) | | $ | 8,817.5 |
|
Kansas City Southern and Subsidiaries
Notes to Consolidated Financial Statements—(Continued)
Condensed Consolidating Statements of Cash Flows - KCSR Notes
|
| | | | | | | | | | | | | | | | | | | | | | | |
| | Nine Months Ended September 30, 2017 |
| | Parent | | KCSR | | Guarantor Subsidiaries | | Non-Guarantor Subsidiaries | | Consolidating Adjustments | | Consolidated KCS |
| Operating activities: | | | | | | | | | | | |
| Net cash provided | $ | 215.1 |
| | $ | 413.5 |
| | $ | 0.4 |
| | $ | 109.7 |
| | $ | (5.0 | ) | | $ | 733.7 |
|
| Investing activities: | | | | | | | | | | | |
| Capital expenditures | — |
| | (292.6 | ) | | (0.3 | ) | | (154.0 | ) | | — |
| | (446.9 | ) |
| Purchase or replacement of equipment under operating leases | — |
| | (42.6 | ) | | — |
| | — |
| | — |
| | (42.6 | ) |
| Property investments in MSLLC | — |
| | — |
| | — |
| | (23.7 | ) | | — |
| | (23.7 | ) |
| Investments in and advances to affiliates | (0.5 | ) | | — |
| | (0.5 | ) | | (20.3 | ) | | 1.0 |
| | (20.3 | ) |
| Proceeds from repayment of loans to affiliates | 9,814.6 |
| | — |
| | — |
| | — |
| | (9,814.6 | ) | | — |
|
| Loans to affiliates | (9,772.2 | ) | | — |
| | — |
| | — |
| | 9,772.2 |
| | — |
|
| Proceeds from disposal of property | — |
| | 5.2 |
| | — |
| | 1.4 |
| | — |
| | 6.6 |
|
| Other investing activities | — |
| | (16.5 | ) | | — |
| | 1.4 |
| | — |
| | (15.1 | ) |
| Net cash provided (used) | 41.9 |
| | (346.5 | ) | | (0.8 | ) | | (195.2 | ) | | (41.4 | ) | | (542.0 | ) |
| Financing activities: | | | | | | | | | | | |
| Proceeds from short-term borrowings | 9,772.2 |
| | — |
| | — |
| | — |
| | — |
| | 9,772.2 |
|
| Repayment of short-term borrowings | (9,600.9 | ) | | — |
| | — |
| | — |
| | — |
| | (9,600.9 | ) |
| Repayment of long-term debt | — |
| | (2.6 | ) | | (0.1 | ) | | (17.5 | ) | | — |
| | (20.2 | ) |
| Dividends paid | (105.1 | ) | | — |
| | — |
| | (5.0 | ) | | 5.0 |
| | (105.1 | ) |
| Shares repurchased | (320.4 | ) | | — |
| | — |
| | — |
| | — |
| | (320.4 | ) |
| Proceeds from loans from affiliates | — |
| | 9,772.2 |
| | — |
| | — |
| | (9,772.2 | ) | | — |
|
| Repayment of loans from affiliates | — |
| | (9,814.6 | ) | | — |
| | — |
| | 9,814.6 |
| | — |
|
| Contribution from affiliates | — |
| | — |
| | 0.5 |
| | 0.5 |
| | (1.0 | ) | | — |
|
| Other financing activities | 0.5 |
| | — |
| | — |
| | — |
| | — |
| | 0.5 |
|
| Net cash provided (used) | (253.7 | ) | | (45.0 | ) | | 0.4 |
| | (22.0 | ) | | 46.4 |
| | (273.9 | ) |
| Cash and cash equivalents: | | | | | | | | | | | |
| Net increase (decrease) | 3.3 |
| | 22.0 |
| | — |
| | (107.5 | ) | | — |
| | (82.2 | ) |
| At beginning of year | 0.2 |
| | 32.6 |
| | — |
| | 137.8 |
| | — |
| | 170.6 |
|
| At end of period | $ | 3.5 |
| | $ | 54.6 |
| | $ | — |
| | $ | 30.3 |
| | $ | — |
| | $ | 88.4 |
|
Kansas City Southern and Subsidiaries
Notes to Consolidated Financial Statements—(Continued)
Condensed Consolidating Statements of Cash Flows - KCSR Notes—(Continued)
|
| | | | | | | | | | | | | | | | | | | | | | | |
| | Nine Months Ended September 30, 2016 |
| | Parent | | KCSR | | Guarantor Subsidiaries | | Non-Guarantor Subsidiaries | | Consolidating Adjustments | | Consolidated KCS |
| Operating activities: | | | | | | | | | | | |
| Net cash provided | $ | 178.2 |
| | $ | 380.2 |
| | $ | 0.6 |
| | $ | 288.5 |
| | $ | (163.9 | ) | | $ | 683.6 |
|
| Investing activities: | | | | | | | | | | | |
| Capital expenditures | — |
| | (269.0 | ) | | (0.5 | ) | | (135.6 | ) | | — |
| | (405.1 | ) |
| Purchase or replacement of equipment under operating leases | — |
| | (26.6 | ) | | — |
| | — |
| | — |
| | (26.6 | ) |
| Property investments in MSLLC | — |
| | — |
| | — |
| | (31.2 | ) | | — |
| | (31.2 | ) |
| Investment in and advances to affiliates | (103.4 | ) | | — |
| | (6.5 | ) | | (0.9 | ) | | 109.9 |
| | (0.9 | ) |
| Proceeds from repayment of loans to affiliates | 6,743.5 |
| | — |
| | — |
| | — |
| | (6,743.5 | ) | | — |
|
| Loans to affiliates | (6,742.5 | ) | | — |
| | — |
| | — |
| | 6,742.5 |
| | — |
|
| Proceeds from disposal of property | — |
| | 1.4 |
| | — |
| | 2.3 |
| | (0.1 | ) | | 3.6 |
|
| Other investing activities | — |
| | (10.4 | ) | | — |
| | 4.5 |
| | 0.1 |
| | (5.8 | ) |
| Net cash used | (102.4 | ) | | (304.6 | ) | | (7.0 | ) | | (160.9 | ) | | 108.9 |
| | (466.0 | ) |
| Financing activities: | | | | | | | | | | | |
| Proceeds from short-term borrowings | 6,499.0 |
| | 243.5 |
| | — |
| | — |
| | (243.5 | ) | | 6,499.0 |
|
| Repayment of short-term borrowings | (6,579.3 | ) | | — |
| | — |
| | — |
| | — |
| | (6,579.3 | ) |
| Proceeds from issuance of long-term debt | 248.7 |
| | — |
| | — |
| | — |
| | — |
| | 248.7 |
|
| Repayment of long-term debt | — |
| | (2.5 | ) | | (0.1 | ) | | (18.2 | ) | | — |
| | (20.8 | ) |
| Dividends paid | (107.2 | ) | | — |
| | — |
| | (162.2 | ) | | 162.2 |
| | (107.2 | ) |
| Shares repurchased | (99.8 | ) | | — |
| | — |
| | — |
| | — |
| | (99.8 | ) |
| Proceeds from loans from affiliates | — |
| | 6,499.0 |
| | — |
| | — |
| | (6,499.0 | ) | | — |
|
| Repayment of loans from affiliates | — |
| | (6,743.5 | ) | | — |
| | — |
| | 6,743.5 |
| | — |
|
| Contribution from affiliates | — |
| | 96.6 |
| | 6.5 |
| | 6.8 |
| | (109.9 | ) | | — |
|
| Other financing activities | (1.5 | ) | | (0.1 | ) | | — |
| | (1.8 | ) | | 1.7 |
| | (1.7 | ) |
| Net cash provided (used) | (40.1 | ) | | 93.0 |
| | 6.4 |
| | (175.4 | ) | | 55.0 |
| | (61.1 | ) |
| Cash and cash equivalents: | | | | | | | | | | | |
| Net increase (decrease) | 35.7 |
| | 168.6 |
| | — |
| | (47.8 | ) | | — |
| | 156.5 |
|
| At beginning of year | 0.2 |
| | 10.1 |
| | 0.1 |
| | 126.2 |
| | — |
| | 136.6 |
|
| At end of period | $ | 35.9 |
| | $ | 178.7 |
| | $ | 0.1 |
| | $ | 78.4 |
| | $ | — |
| | $ | 293.1 |
|
| |
| Item 2. | Management’s Discussion and Analysis of Financial Condition and Results of Operations |
The discussion below, as well as other portions of this Form 10-Q, contain forward-looking statements that arewithin the meaning of Section 27A of the Securities Act of 1933, as amended, Section 21E of the Securities Exchange Act of 1934, as amended and the Private Securities Litigation Reform Act of 1995. In addition, management may make forward-looking statements orally or in other writing, including, but not based upon historical information. limited to, in press releases, quarterly earnings calls, executive presentations, in the annual report to stockholders and in other filings with the Securities and Exchange Commission.Readers can usually identify these forward-looking statements by the use of such verbswords as “expects,“may,” “will,” “should,” “likely,” “plans,” “projects,”“expects,” “anticipates,” “believes” or similar verbs or conjugationswords. These statements involve a number of risks and uncertainties. Actual results could materially differ from those anticipated by such verbs.forward-looking statements. Such forward-looking statements are based upon information currently available to management and management’s perception thereof as of the date of this Form 10-Q. However, such statements are dependent on and, therefore, candifferences could be influencedcaused by a number of external variables over which management has littlefactors or no control, including: competitioncombination of factors including, but not limited to, the factors identified below and consolidation within the transportation industry; the business environment in industries that produce and use items shipped by rail; lossthose discussed under Item 1A, “Risk Factors”, of the rail concessionCompany’s Annual Report on Form 10-K for the year ended December 31, 2019. Readers are strongly encouraged to consider these factors and the following factors when evaluating any forward-looking statements concerning the Company: public health threats or outbreaks of Kansas City Southern’s subsidiary, Kansas City Southern de México, S.A. de C.V.; the termination of, or failure to renew, agreements with customers, other railroads and third parties; access to capital; disruptions to the Company’s technology infrastructure, including its computer systems; natural eventscommunicable diseases, such as severe weather, hurricanesthe ongoing COVID-19 pandemic and floods; marketits impact on KCS’s business, suppliers, consumers, customers, employees and regulatory responses to climate change; legislative and regulatory developments and disputes; supply chains;rail accidents or other incidents or accidents on KCS’s rail network or at KCS’s facilities or customer facilities involving the release of hazardous materials, including toxic inhalation hazards; fluctuation in prices or availabilitylegislative and regulatory developments and disputes, including environmental regulations; loss of key materials, in particular diesel fuel; dependency on certain key suppliersthe rail concession of core rail equipment; changes in securities and capital markets; availability of qualified personnel; labor difficulties, including strikes and work stoppages; insufficiency of insurance to cover lost revenue, profits or other damages; acts of terrorism or risk of terrorist activities; war or risk of war;Kansas City Southern’s subsidiary, Kansas City Southern de México, S.A. de C.V.; domestic and international economic, political and social conditions; disruptions to the Company’s technology infrastructure, including its computer systems; increased demand and traffic congestion; the level of trade between the United States and Asia or Mexico; fluctuations in the peso-dollar exchange rate; increased demandnatural events such as severe weather, hurricanes and traffic congestion;floods; the outcome of claims and litigation involving the Company or its subsidiaries; competition and consolidation within the transportation industry; the business environment in industries that produce and use items shipped by rail; the termination of, or failure to renew, agreements with customers, other railroads and third parties; fluctuation in prices or availability of key materials, in particular diesel fuel; access to capital; climate change and the market and regulatory responses to climate change; dependency on certain key suppliers of core rail equipment; changes in securities and capital markets; unavailability of qualified personnel; labor difficulties, including strikes and work stoppages; acts of terrorism or risk of terrorist activities, war or other acts of violence; and other factors affecting the operation of the business. For more discussion about each risk factor, see Part II, Item 7 “Management’s Discussion and Analysis of Financial Condition and Results of Operations” and Part I, Item 1A - “Risk Factors” in the Company’s Annual Report on Form 10-K for the year ended December 31, 2016, which is on file2019, filed with the U.S. Securities and Exchange Commission (File No. 1-4717) and Part I Item 1A — “Risk Factors” in the Form 10-Kon January 24, 2020 and any updates contained herein. Readers are strongly encouraged to consider these factors when evaluating forward-looking statements.
Forward-looking statements should not be readreflect the information only as a guarantee of future performance or results and will not necessarily be accurate indications of the timing when, or bydate on which such performance or results will be achieved. As a result, actual outcomes or results could materially differ from those indicated in forward-looking statements. Wethey are made. The Company does not under any obligation, and we expressly disclaimundertake any obligation to update or alter any forward-looking statements to reflect future events, developments, or other information. If KCS does update one or more forward-looking statements, no inference should be drawn that additional updates will be made regarding that statement or any other forward-looking statements.
This discussion is intended to clarify and focus on Kansas City Southern’s (“KCS” or the “Company”)KCS’s results of operations, certain changes in its financial position, liquidity, capital structure and business developments for the periods covered by the consolidated financial statements included under Item 1 of this Quarterly Report on Form 10-Q.10-Q for the quarter ended March 31, 2020. This discussion should be read in conjunction with those consolidated financial statements and the related notes and is qualified by reference to them.
Critical Accounting Policies and Estimates
The Company’s discussion and analysis of its financial position and results of operations is based upon its consolidated financial statements. The preparation of these consolidated financial statements requires estimation and judgment that affect the reported amounts of revenue, expenses, assets and liabilities. The Company bases its estimates on historical experience and on various other factors that are believed to be reasonable under the circumstances, the results of which form the basis for making judgments about the accounting for assets and liabilities that are not readily apparent from other sources. If the estimates differ materially from actual results, the impact on the consolidated financial statements may be material. The Company’s critical accounting policies are disclosed in the 2016its 2019 Annual Report on Form 10-K filed with the SEC.
Overview
The Company is engaged primarily in the freight rail transportation business, operating a single coordinated rail network under one reportable business segment. The primary operating subsidiaries of the Company consist of the following: The Kansas City Southern Railway Company (“KCSR”), Kansas City Southern de México, S.A. de C.V. (“KCSM”), Meridian Speedway, LLC (“MSLLC”), and The Texas Mexican Railway Company (“TexMex”). The Company generates revenues and cash flows by providing customers with freight delivery services both within its regions and throughout North America through connections with other Class I rail carriers. KCS’s customers conduct business in a number of different industries, including chemical and petroleum, products, industrial and
consumer products, agriculture and mineral products,minerals, energy, products, automotive, products and intermodal transportation. Appropriate eliminations and reclassifications have been recorded in preparing the consolidated financial statements.
ThirdStrategic Initiatives
During 2019, KCS began implementing principles of Precision Scheduled Railroading (“PSR”), focusing on operational excellence and driving the following improvements:
| |
| • | Customer service—improve and sustain consistency and reliability of service and create a more resilient and dependable network; |
Facilitating growth — additional capacity for new opportunities;
Improving asset utilization — meet growing or changing demand with the same or fewer assets; and,
Improving the cost profile of the Company — increased profitability driven by volume and revenue growth and improved productivity and asset utilization.
As a result of the PSR initiatives in 2019, management approved four separate restructuring plans that totaled $168.8 million, including a $67.5 million restructuring plan in the first quarter of 2019. The PSR plans included asset impairments, workforce reductions, and contract restructuring, which resulted in 2019 operating expense savings of approximately $58.0 million. Management’s restructuring plans were substantially completed in 2019.
In 2020, the Company continues to focus on implementing PSR initiatives and expects to have incremental annual operating expense savings of approximately $61.0 million.
The Company established the following key metrics and goals to measure PSR progress and performance:
|
| | | | | | | | |
| | | Three Months Ended | | Improvement/ (Deterioration) | | FY 2020 Goal |
| | | March 31, | |
| | | 2020 | | 2019 | |
| Gross velocity (mph) (i) | | 15.9 | | 12.6 | | 26% | | 17.0 |
| Terminal dwell (hours) (ii) | | 19.8 | | 21.8 | | 9% | | 18.0 |
| Train length (feet) (iii) | | 5,973 | | 5,760 | | 4% | | 6,350 |
| Car miles per day (iv) | | 120.7 | | 101.0 | | 20% | | 135.0 |
| Fuel efficiency (gallons per 1,000 GTM's) (v) | | 1.26 | | 1.34 | | 6% | | 1.24 |
|
| | | | | |
| (i) Gross velocity is the average train speed between origin and destination in miles per hour calculated as the sum of the miles traveled divided by the sum of total transit hours. Transit hours are measured as the difference between a train’s origin departure and destination arrival date and times broken down by segment across the train route (includes all time spent including crew changes, terminal dwell, delays, and incidents). |
| | | | |
| (ii) Terminal dwell is the average amount of time in hours between car arrival to and departure from the yard (excludes cars that move through a terminal on a run-through train, stored, bad ordered, and maintenance-of-way cars). Calculated by dividing the total number of hours cars spent in terminals by the total count of car dwell events. |
| | | | | |
| (iii) Train length is the average length of a train across its reporting stations, including the origin and intermediate stations. Length of a train is the sum of car and locomotive lengths measured in feet. |
| | | | | |
| (iv) Car miles per day is the miles a car travels divided by total transit days. Transit days are measured from opening event to closing event (includes all time spent in terminals and on trains). |
| | | | | |
| (v) Fuel efficiency is calculated by taking locomotive fuel consumed in gallons divided by thousand gross ton miles (“GTM’s”) net of detours with no associated fuel gallons. GTM’s are the movement of one ton of train weight over one mile calculated by multiplying total train weight by distance the train moved. GTM’s exclude locomotive gross ton miles. |
Operating performance continued to improve in the first three months of 2020, compared to the same period in 2019. Improvements in velocity and dwell are largely due to increased focus on execution, and refining service design. Additionally, the Company has consolidated trains, which has increased train length, improved fuel efficiency, and led to reduced crew costs.
The Company remains focused on executing the strategic initiatives and achieving the operational metric targets noted above, which will deliver improved customer service, facilitate growth, and drive better asset utilization while improving the cost profile of the Company.
COVID-19 Update
With the global outbreak of the Coronavirus Disease 2019 (“COVID-19”) and the declaration of a pandemic by the World Health Organization on March 11, 2020, the U.S. and Mexico governments have deemed rail transportation as “critical infrastructure” providing essential services during this global emergency. As a provider of critical infrastructure, Kansas City Southern has an obligation to keep employees working and freight moving. KCS remains focused on protecting the health and wellbeing of its employees and the communities in which it operates while assuring the continuity of its business operations.
KCS created a dedicated crisis team that proactively implemented its business continuity plans and has taken a variety of measures to ensure the ongoing availability of its transportation services, while taking health and safety measures, including separating dispatching and crew operations, implementing enhanced cleaning and hygiene protocols in all of its facilities and locomotives, and implementing remote work policies, where possible. To date, as a result of these business continuity measures, the Company has not experienced disruptions in the Company’s railroad operations.
The fundamentals of the Company remain strong. KCS believes it has sufficient liquidity on hand to continue business operations during this volatile period. As disclosed in the Liquidity and Capital Resources section, the Company has total available liquidity of $691.0 million as of March 31, 2020, consisting of cash on hand and a revolving credit facility. In addition, there are no debt maturities until 2023. If the Company experienced a significant reduction in revenues, the Company would have additional alternatives to maintain liquidity, including capital expenditure reductions, adjustments to its capital allocation policy, and cost reductions. As a result of the Company’s ongoing PSR initiatives, KCS has been able to respond quickly to its customers’ changing business demands related to the COVID-19 pandemic and has been able to further reduce costs through implementation of service design changes and consolidation of trains. At this time, the Company does not expect the impact of COVID-19 to reduce its projected cost savings from PSR initiatives.
The pandemic presents potential new risks to the Company’s business. Although there have been logistical and other challenges to date, there has been no material adverse impact on the Company’s first quarter 2020 results of operations, excluding the impacts of foreign exchange losses (see foreign exchange gain (loss) within non-operating income and expenses for further discussion). The Company began to see the impacts of COVID-19 on customer demand in late March and continues to see declines in the second quarter of 2020, primarily in the automotive business unit due to plant shutdowns and expected lower production volumes. Intermodal volume has also been affected by overall decline in demand due to COVID-19 and automotive plant shutdowns resulting in significant declines in auto parts shipments. In addition, reductions in crude and frac sand volumes are expected due to the declines in oil prices. These volume declines are expected to result in lower second quarter 2020 volumes compared to the same period in 2019. The situation surrounding COVID-19 remains fluid and the potential for a material impact on the Company increases the longer the virus impacts the level of economic activity in the United States and globally. For this reason, KCS cannot reasonably estimate with any degree of certainty the future impact COVID-19 may have on the Company’s results of operations, financial position, and liquidity. See Part II, Item 1A - “Risk Factors” - “Public health threats or outbreaks of communicable diseases, including the ongoing COVID-19 pandemic, could have a material adverse effect on the Company’s operations and financial results.”
First Quarter AnalysisHighlights
Revenues increased 9%8% for the three months ended September 30, 2017,March 31, 2020, as compared to the same period in 2016,2019, due to a 6%4% increase in carloads/unit volumes and a 3% increase in revenue per carload/unitunit. Revenues increased primarily due to growth in refined fuel products and a 3% increaseliquid petroleum gas shipments to Mexico, and favorable comparable volumes due to service interruptions at Lazaro Cardenas due to teacher protests in carload/unit volumes.2019. Revenue per carload/unit increased due to mix,as a result of higher fuel surcharge, positive pricing impacts, and higher fuel surcharge.
haul, partially offset by mix.
Operating expenses increased 4%decreased 14% during the three months ended September 30, 2017,March 31, 2020, as compared to the same period in 2016,2019, primarily due to higher fuel prices and consumption.a decrease in restructuring charges as a result of PSR initiatives. Operating expenses as a percentage of revenues was 64.4%60.5% for the three months ended September 30, 2017,March 31, 2020, compared to 66.9%76.2% for the same period in 2016.2019.
The Company reported quarterly earnings of $1.23$1.58 per diluted share on consolidated net income of $129.3$151.8 million for the three months ended September 30, 2017,March 31, 2020, compared to earnings of $1.12$1.02 per diluted share on consolidated net income of $120.6$102.8 million for the same period in 2016,2019, due to increased nethigher operating income, and the accelerated share repurchase program that was implemented during the third quarter of 2017, which reduced the weighted-average shares outstanding.partially offset by foreign exchange loss as compared to a gain in 2019.
In late August 2017, Hurricane Harvey made landfall on the Texas coast and caused flood damage to the Company’s track infrastructure and significantly disrupted the Company’s rail service. The Company continues to evaluate the impact of Hurricane Harvey on the business and intends to file a claim under its insurance program in the fourth quarter of 2017. The Company estimates the impact of lost profits negatively affected operating expenses as a percentage of revenues by 1.4% to 1.6% and earnings per diluted share by $0.12 to $0.14.
Results of Operations
The following summarizes KCS’s consolidated statement of income statement components (in millions): |
| | | | | | | | | | | |
| | Three Months Ended | | Change |
| | September 30, | |
| | 2017 | | 2016 | |
| Revenues | $ | 656.6 |
| | $ | 604.5 |
| | $ | 52.1 |
|
| Operating expenses | 422.8 |
| | 404.7 |
| | 18.1 |
|
| Operating income | 233.8 |
| | 199.8 |
| | 34.0 |
|
| Equity in net earnings of affiliates | 2.8 |
| | 3.5 |
| | (0.7 | ) |
| Interest expense | (25.2 | ) | | (25.2 | ) | | — |
|
| Foreign exchange gain (loss) | 0.8 |
| | (19.8 | ) | | 20.6 |
|
| Other expense, net | (0.3 | ) | | — |
| | (0.3 | ) |
| Income before income taxes | 211.9 |
| | 158.3 |
| | 53.6 |
|
| Income tax expense | 82.0 |
| | 37.3 |
| | 44.7 |
|
| Net income | 129.9 |
| | 121.0 |
| | 8.9 |
|
| Less: Net income attributable to noncontrolling interest | 0.6 |
| | 0.4 |
| | 0.2 |
|
| Net income attributable to Kansas City Southern and subsidiaries | $ | 129.3 |
| | $ | 120.6 |
| | $ | 8.7 |
|
|
| | | | | | | | | | | |
| | Nine Months Ended | | Change |
| | September 30, | |
| | 2017 | | 2016 | |
| Revenues | $ | 1,922.5 |
| | $ | 1,735.7 |
| | $ | 186.8 |
|
| Operating expenses | 1,238.7 |
| | 1,128.1 |
| | 110.6 |
|
| Operating income | 683.8 |
| | 607.6 |
| | 76.2 |
|
| Equity in net earnings of affiliates | 9.7 |
| | 10.4 |
| | (0.7 | ) |
| Interest expense | (74.9 | ) | | (73.2 | ) | | (1.7 | ) |
| Foreign exchange gain (loss) | 61.8 |
| | (47.3 | ) | | 109.1 |
|
| Other income (expense), net | 0.7 |
| | (0.5 | ) | | 1.2 |
|
| Income before income taxes | 681.1 |
| | 497.0 |
| | 184.1 |
|
| Income tax expense | 269.6 |
| | 147.4 |
| | 122.2 |
|
| Net income | 411.5 |
| | 349.6 |
| | 61.9 |
|
| Less: Net income attributable to noncontrolling interest | 1.2 |
| | 1.1 |
| | 0.1 |
|
| Net income attributable to Kansas City Southern and subsidiaries | $ | 410.3 |
| | $ | 348.5 |
| | $ | 61.8 |
|
|
| | | | | | | | | | | |
| | Three Months Ended | | Change |
| | March 31, | |
| | 2020 | | 2019 | |
| Revenues | $ | 731.7 |
| | $ | 674.8 |
| | $ | 56.9 |
|
| Operating expenses | 442.9 |
| | 514.5 |
| | (71.6 | ) |
| Operating income | 288.8 |
| | 160.3 |
| | 128.5 |
|
| Equity in net earnings of affiliates | 1.0 |
| | 1.7 |
| | (0.7 | ) |
| Interest expense | (34.2 | ) | | (28.2 | ) | | (6.0 | ) |
| Debt retirement costs | — |
| | (0.6 | ) | | 0.6 |
|
| Foreign exchange gain (loss) | (59.5 | ) | | 4.6 |
| | (64.1 | ) |
| Other income, net | 1.4 |
| | 0.1 |
| | 1.3 |
|
| Income before income taxes | 197.5 |
| | 137.9 |
| | 59.6 |
|
| Income tax expense | 45.2 |
| | 34.7 |
| | 10.5 |
|
| Net income | 152.3 |
| | 103.2 |
| | 49.1 |
|
| Less: Net income attributable to noncontrolling interest | 0.5 |
| | 0.4 |
| | 0.1 |
|
| Net income attributable to Kansas City Southern and subsidiaries | $ | 151.8 |
| | $ | 102.8 |
| | $ | 49.0 |
|
Revenues
The following summarizes revenues (in millions), carload/unit statistics (in thousands) and revenue per carload/unit:
| | | | Revenues | | Carloads and Units | | Revenue per Carload/Unit | Revenues | | Carloads and Units | | Revenue per Carload/Unit |
| | Three Months Ended | | | | Three Months Ended | | | | Three Months Ended | | | Three Months Ended | | | | Three Months Ended | | | | Three Months Ended | | |
| | September 30, | | | | September 30, | | | | September 30, | | | March 31, | | | | March 31, | | | | March 31, | | |
| | 2017 | | 2016 | | % Change | | 2017 | | 2016 | | % Change | | 2017 | | 2016 | | % Change | 2020 | | 2019 | | % Change | | 2020 | | 2019 | | % Change | | 2020 | | 2019 | | % Change |
| Chemical and petroleum | $ | 136.9 |
| | $ | 124.3 |
| | 10 | % | | 67.6 |
| | 65.8 |
| | 3 | % | | $ | 2,025 |
| | $ | 1,889 |
| | 7 | % | $ | 198.6 |
| | $ | 168.6 |
| | 18 | % | | 90.9 |
| | 79.4 |
| | 14 | % | | $ | 2,185 |
| | $ | 2,123 |
| | 3 | % |
| Industrial and consumer products | 152.5 |
| | 140.5 |
| | 9 | % | | 82.3 |
| | 79.2 |
| | 4 | % | | 1,853 |
| | 1,774 |
| | 4 | % | 159.0 |
| | 149.8 |
| | 6 | % | | 83.4 |
| | 79.9 |
| | 4 | % | | 1,906 |
| | 1,875 |
| | 2 | % |
| Agriculture and minerals | 116.0 |
| | 113.4 |
| | 2 | % | | 61.2 |
| | 61.7 |
| | (1 | %) | | 1,895 |
| | 1,838 |
| | 3 | % | 134.5 |
| | 122.9 |
| | 9 | % | | 63.1 |
| | 62.0 |
| | 2 | % | | 2,132 |
| | 1,982 |
| | 8 | % |
| Energy | 74.5 |
| | 62.8 |
| | 19 | % | | 76.7 |
| | 77.9 |
| | (2 | %) | | 971 |
| | 806 |
| | 20 | % | 56.3 |
| | 64.6 |
| | (13 | %) | | 57.6 |
| | 60.8 |
| | (5 | %) | | 977 |
| | 1,063 |
| | (8 | %) |
| Intermodal | 92.3 |
| | 88.6 |
| | 4 | % | | 249.5 |
| | 240.6 |
| | 4 | % | | 370 |
| | 368 |
| | 1 | % | 88.7 |
| | 79.9 |
| | 11 | % | | 233.6 |
| | 220.9 |
| | 6 | % | | 380 |
| | 362 |
| | 5 | % |
| Automotive | 61.4 |
| | 51.4 |
| | 19 | % | | 39.1 |
| | 36.5 |
| | 7 | % | | 1,570 |
| | 1,408 |
| | 12 | % | 53.9 |
| | 57.6 |
| | (6 | %) | | 32.2 |
| | 36.6 |
| | (12 | %) | | 1,674 |
| | 1,574 |
| | 6 | % |
| Carload revenues, carloads and units | 633.6 |
| | 581.0 |
| | 9 | % | | 576.4 |
| | 561.7 |
| | 3 | % | | $ | 1,099 |
| | $ | 1,034 |
| | 6 | % | 691.0 |
| | 643.4 |
| | 7 | % | | 560.8 |
| | 539.6 |
| | 4 | % | | $ | 1,232 |
| | $ | 1,192 |
| | 3 | % |
| Other revenue | 23.0 |
| | 23.5 |
| | (2 | %) | | | | | | | | | | | | | 40.7 |
| | 31.4 |
| | 30 | % | | | | | | | | | | | | |
| Total revenues (i) | $ | 656.6 |
| | $ | 604.5 |
| | 9 | % | | | | | | | | | | | | | $ | 731.7 |
| | $ | 674.8 |
| | 8 | % | | | | | | | | | | | | |
| | | | | | | | | | | | | | | | | | | | | | | | | | | | | | | | | | | |
| (i) Included in revenues: | | | | | | | | | | | | | | | | | | | | | | | | | | | | | | | | | | |
| Fuel surcharge | $ | 44.3 |
| | $ | 25.9 |
| | | | | | | | | | | | | | | $ | 77.5 |
| | $ | 62.4 |
| | | | | | | | | | | | | | |
|
| | | | | | | | | | | | | | | | | | | | | | | | | | | | | | |
| | Revenues | | Carloads and Units | | Revenue per Carload/Unit |
| | Nine Months Ended | | | | Nine Months Ended | | | | Nine Months Ended | | |
| | September 30, | | | | September 30, | | | | September 30, | | |
| | 2017 | | 2016 | | % Change | | 2017 | | 2016 | | % Change | | 2017 | | 2016 | | % Change |
| Chemical and petroleum | $ | 402.2 |
| | $ | 364.0 |
| | 10 | % | | 205.8 |
| | 197.8 |
| | 4 | % | | $ | 1,954 |
| | $ | 1,840 |
| | 6 | % |
| Industrial and consumer products | 441.2 |
| | 418.0 |
| | 6 | % | | 245.8 |
| | 240.4 |
| | 2 | % | | 1,795 |
| | 1,739 |
| | 3 | % |
| Agriculture and minerals | 355.7 |
| | 338.5 |
| | 5 | % | | 183.6 |
| | 184.6 |
| | (1 | %) | | 1,937 |
| | 1,834 |
| | 6 | % |
| Energy | 214.0 |
| | 142.0 |
| | 51 | % | | 218.0 |
| | 182.5 |
| | 19 | % | | 982 |
| | 778 |
| | 26 | % |
| Intermodal | 266.4 |
| | 265.1 |
| | — |
| | 716.6 |
| | 712.0 |
| | 1 | % | | 372 |
| | 372 |
| | — |
|
| Automotive | 170.2 |
| | 137.0 |
| | 24 | % | | 114.6 |
| | 94.4 |
| | 21 | % | | 1,485 |
| | 1,451 |
| | 2 | % |
| Carload revenues, carloads and units | 1,849.7 |
| | 1,664.6 |
| | 11 | % | | 1,684.4 |
| | 1,611.7 |
| | 5 | % | | $ | 1,098 |
| | $ | 1,033 |
| | 6 | % |
| Other revenue | 72.8 |
| | 71.1 |
| | 2 | % | | | | | | | | | | | | |
| Total revenues (i) | $ | 1,922.5 |
| | $ | 1,735.7 |
| | 11 | % | | | | | | | | | | | | |
| | | | | | | | | | | | | | | | | | |
| (i) Included in revenues: | | | | | | | | | | | | | | | | | |
| Fuel surcharge | $ | 121.3 |
| | $ | 76.8 |
| | | | | | | | | | | | | | |
Freight revenuesRevenues include both revenue for transportation services and fuel surcharges. For the three months ended September 30, 2017,March 31, 2020, revenues increased 8% and carload/unit volumes increased 9% and 3%4%, respectively, compared to the same period in 2016.2019. Revenues for certain commodity groups were significantly affected by Hurricane Harvey. Revenueincreased primarily due to growth in refined fuel products and liquid petroleum gas shipments to Mexico, and favorable comparable volumes due to service interruptions at Lazaro Cardenas due to teacher protests in 2019.
For the three months ended March 31, 2020, revenue per carload/unit increased by 6% due to mix, positive pricing impacts, and higher fuel surcharge. In addition, revenue per carload/unit increased due to the strengthening of the Mexican peso against the U.S. dollar by approximately $6.0 million,3%, compared to the same period in 2016, for transactions denominated in Mexican pesos. The average exchange rate of Mexican peso per U.S. dollar was Ps.17.8 for the three months ended September 30, 2017, compared to Ps.18.7 for the same period in 2016.
For the nine months ended September 30, 2017, revenues and carload/unit volumes increased 11% and 5%, respectively, compared to the same period in 2016. Revenue per carload/unit increased by 6%2019, due to mix,higher fuel surcharge, positive pricing impacts, and higher fuel surcharge. Energy revenues increased $72.0 million, primarily due to an increase in frac sand volumes due to strong demand as a resultlonger average length of higher crude oil prices. In addition, utility coal volumes increased due to higher natural gas prices and lower coal inventory levels. The increase in revenue per carload/unit washaul. These increases were partially offset by the weakeningmix.
The average exchange rate of Mexican pesos per U.S. dollar was Ps.18.9Ps.19.9 for the ninethree months ended SeptemberMarch 30, 2017,2020, compared to Ps.18.3Ps.19.2 for the same period in 2016.
approximately $0.3 million.
KCS’s fuel surcharges are a mechanism to adjust revenue based upon changes in fuel prices above fuel price thresholds set in KCS’s tariffs or contracts. Fuel surcharge revenue is calculated using a fuel price from a prior time period that can be up to 60 days earlier. In a period of volatile fuel prices or changing customer business mix, changes in fuel expense and fuel surcharge revenue may differ.
For the three and nine months ended September 30, 2017,March 31, 2020, fuel surcharge revenue increased $18.4$15.1 million, and $44.5 million, respectively, compared to the same periodsperiod in 2016,2019, primarily due to separating theincreased fuel surcharge for certain customers from the line haul rate. Additionally, the increase isrates due to higher fuel pricescosts as a result of the loss of the Mexican fuel excise tax credit and the impact ofhigher fuel prices increasing above the fuel price thresholds for certain of KCS’s tariffs and contracts.prices.
The following discussion provides an analysis of revenues by commodity group: |
| |
| | Revenues by commodity group
for the three months ended
September 30, 2017
March 31, 2020 |
Chemical and petroleum. Revenues increased $12.6$30.0 million for the three months ended September 30, 2017,March 31, 2020, compared to the same period in 2016,2019, due to a 7%14% increase in carload/unit volumes and a 3% increase in revenue per carload/unit and a 3% increase in carload/unit volumes. Revenuesunit. Volumes increased $38.2 million for the nine months ended September 30, 2017, compared to the same period in 2016,primarily due to a 6% increaseincreased refined fuel product and liquid petroleum gas shipments to Mexico and favorable comparable petroleum volumes due to service interruptions at Lazaro Cardenas in revenue per carload/unit and a 4% increase in carload/unit volumes.2019. Revenue per carload/unit increased due to increased average length of haulhigher fuel surcharge and positive pricing impacts. Petroleum volumes increased due to refined product and liquefied petroleum gas shipments to Mexico. In the third quarter of 2017, volumes were affected by Hurricane Harvey.
| |
|
| |
Industrial and consumer products.products. Revenues increased $12.0$9.2 million for the three months ended September 30, 2017,March 31, 2020, compared to the same period in 2016, due to 4% increases in revenue per carload/unit and carload/unit volumes. Revenues increased $23.2 million for the nine months ended September 30, 2017, compared to the same period in 2016,2019, due to a 3%4% increase in carload/unit volumes and a 2% increase in revenue per carload/unitunit. Revenues increased due to a change in traffic patterns and a 2%an increase in carload/unit volumes.market demand for metals shipments. In addition, revenues increased due to favorable comparable volumes as a result of service interruptions at Lazaro Cardenas in 2019. Revenue per carload/unit increased due to metals and scrapas a result of longer average length of haul, positive pricing impacts, and higher fuel surcharge, and positive pricing impacts. Other carloads’ volumes increased due to strong military movements. In the third quarter of 2017, volumes were affectedpartially offset by Hurricane Harvey.mix. | |
|
| |
| | Revenues by commodity group
for the three months ended
September 30, 2017
March 31, 2020 |
Agriculture and minerals.Revenues increased $2.6$11.6 million for the three months ended September 30, 2017,March 31, 2020, compared to the same period in 2016,2019, due to a 3%an 8% increase in revenue per carload/unit partially offset byand a 1% decrease2% increase in carload/unit volumes. Revenues increased $17.2 million for the nine months ended September 30, 2017, compared to the same period in 2016, due to a 6%The increase in revenue per carload/unit partially offsetwas driven by food products and grain as a 1% decrease in carload/unit volumes. Revenue per carload/unitresult of longer average length of haul, higher fuel surcharge, and positive pricing impacts. Food products volume increased primarily due to positive pricing impacts and higher fuel surcharge.a customer change in traffic patterns. | |
|
| |
Energy.Revenues increased $11.7decreased $8.3 million for the three months ended September 30, 2017,March 31, 2020, compared to the same period in 2016,2019, due to a 20% increasean 8% decrease in revenue per carload/unit partially offset byand a 2%5% decrease in carload/unit volumes. Revenue per carload/unit increaseddecreased due to longermix and shorter average length of haul, positive pricing impacts, mix, and higher fuel surcharge. Frac sandhaul. Utility coal volumes increased due to strong demanddecreased as a result of higher crude oil prices. Revenues increased $72.0 million for the nine months ended September 30, 2017, compared to the same period in 2016, due to a 26% increase in revenue per carload/unit and a 19% increase in carload/unit volumes. Utility coal volumes increased due to higherlow natural gas prices and lower coal inventory levels. Additionally, fracwarm weather. Frac sand volumes increaseddecreased due to strong demand as a result of higherchanges in sourcing patterns. These decreases were partially offset by an increase in crude oil prices.attributable to temporary improvement in Canadian crude spreads early in the quarter. | |
Intermodal.Revenues increased $3.7$8.8 million for the three months ended September 30, 2017,March 31, 2020, compared to the same period in 2016,2019, due to a 4%6% increase in carload/unit volumes, and a 1%5% increase in revenue per carload/unit. The volume increase was attributableprimarily driven by strong cross-border shipments and favorable comparative volumes due to new business,service interruptions at Lazaro Cardenas in 2019, partially offset by the impacts of Hurricane Harveyvolume declines due to COVID-19 in the third quarter of 2017, and truck capacity in the U.S. and Mexico. late March. Revenue per carload/unit increased due to higher fuel surcharge.
Automotive. Revenues remained flatdecreased $3.7 million for the ninethree months ended September 30, 2017,March 31, 2020, compared to the same period in 2016.
Automotive. Revenues increased $10.0 million for the three months ended September 30, 2017, compared to the same period in 2016,2019, due to a 12% increase in revenue per carload/unit and a 7% increase in carload/unit volumes. Revenue per carload/unit increased due to the strengthening of the Mexican peso against the U.S. dollar, higher fuel surcharge, increased average length of haul, and positive pricing impacts. Volumes increased due to the introduction of new automobile models and new plant openings. For the nine months ended September 30, 2017, revenues increased $33.2 million, compared to the same period in 2016, due to a 21% increasedecrease in carload/unit volumes, andpartially offset by a 2%6% increase in revenue per carload/unit. Volumes increaseddecreased due to customers’ temporarylower overall automotive production in Mexico and auto plant shutdowns due to COVID-19 in the first half of 2016, the introduction of new automobile models, and new plant openings.late March, partially offset by favorable comparable volumes due to service interruptions at Lazaro Cardenas in 2019. Revenue per carload/unit increased due to higher fuel surcharge and positive pricing impacts, partially offset by the weakening of the Mexican peso against the U.S. dollar.impacts.
Operating Expenses
Operating expenses, as shown below (in millions), increased $18.1decreased $71.6 million for the three months ended September 30, 2017,March 31, 2020, compared to the same period in 2016,2019, primarily due to higher fuel prices and consumption.a decrease in restructuring charges as a result of PSR initiatives. The strengtheningweakening of the Mexican peso against the U.S. dollar during the three months ended September 30, 2017,March 31, 2020, resulted in reduced expense increases of approximately $4.0 million, compared to the same period in 2016,2019, for expense transactions denominated in Mexican pesos. The average exchange rate of Mexican pesos per U.S. dollar was Ps. 17.8Ps.19.9 for the three months ended September 30, 2017,March 31, 2020, compared to Ps.18.7Ps.19.2 for the same period in 2016.2019.
Operating expenses, as shown below (in millions), |
| | | | | | | | | | | | | | |
| | Three Months Ended | | |
| | March 31, | | Change |
| | 2020 | | 2019 | | Dollars | | Percent |
| Compensation and benefits | $ | 133.4 |
| | $ | 128.9 |
| | $ | 4.5 |
| | 3 | % |
| Purchased services | 53.3 |
| | 52.8 |
| | 0.5 |
| | 1 | % |
| Fuel | 74.9 |
| | 83.0 |
| | (8.1 | ) | | (10 | %) |
| Equipment costs | 21.9 |
| | 30.4 |
| | (8.5 | ) | | (28 | %) |
| Depreciation and amortization | 89.4 |
| | 88.5 |
| | 0.9 |
| | 1 | % |
| Materials and other | 64.0 |
| | 63.4 |
| | 0.6 |
| | 1 | % |
| Restructuring charges | 6.0 |
| | 67.5 |
| | (61.5 | ) | | (91 | %) |
| Total operating expenses | $ | 442.9 |
| | $ | 514.5 |
| | $ | (71.6 | ) | | (14 | %) |
Compensation and benefits. Compensation and benefits increased $110.6$4.5 million for the ninethree months ended September 30, 2017,March 31, 2020, compared to the same period in 2016, primarily2019, due to higher fuel pricesincreases in incentive compensation of approximately $9.0 million and consumptionwages of approximately $4.0 million, partially offset by a decrease of approximately $6.0 million in headcount and compensationhours worked as a result of PSR initiatives, and benefits. Thethe weakening of the Mexican peso against the U.S. dollar duringof approximately $2.0 million.
Purchased services. Purchased services expense increased $0.5 million for the ninethree months ended September 30, 2017, resulted in expense reductions of approximately $9.0 million,March 31, 2020, compared to the same period in 2016, for expense transactions denominated2019, due to increases in corporate services and trackage rights, partially offset by decreases in repairs and maintenance and the weakening of the Mexican pesos. The average exchange rate of Mexican pesos perpeso against the U.S. dollar was Ps. 18.9 for the nine months ended September 30, 2017, compared to Ps.18.3 for the same period in 2016.dollar.
|
| | | | | | | | | | | | | | |
| | Three Months Ended | | |
| | September 30, | | Change |
| | 2017 | | 2016 | | Dollars | | Percent |
| Compensation and benefits | $ | 129.0 |
| | $ | 127.9 |
| | $ | 1.1 |
| | 1 | % |
| Purchased services | 46.3 |
| | 54.5 |
| | (8.2 | ) | | (15 | %) |
| Fuel | 80.1 |
| | 67.6 |
| | 12.5 |
| | 18 | % |
| Mexican fuel excise tax credit | (11.1 | ) | | (15.6 | ) | | 4.5 |
| | (29 | %) |
| Equipment costs | 30.9 |
| | 32.0 |
| | (1.1 | ) | | (3 | %) |
| Depreciation and amortization | 81.9 |
| | 76.9 |
| | 5.0 |
| | 7 | % |
| Materials and other | 65.7 |
| | 61.4 |
| | 4.3 |
| | 7 | % |
| Total operating expenses | $ | 422.8 |
| | $ | 404.7 |
| | $ | 18.1 |
| | 4 | % |
|
| | | | | | | | | | | | | | |
| | Nine Months Ended | | |
| | September 30, | | Change |
| | 2017 | | 2016 | | Dollars | | Percent |
| Compensation and benefits | $ | 371.6 |
| | $ | 347.0 |
| | $ | 24.6 |
| | 7 | % |
| Purchased services | 146.5 |
| | 159.1 |
| | (12.6 | ) | | (8 | %) |
| Fuel | 234.4 |
| | 186.0 |
| | 48.4 |
| | 26 | % |
| Mexican fuel excise tax credit | (35.6 | ) | | (49.6 | ) | | 14.0 |
| | (28 | %) |
| Equipment costs | 93.3 |
| | 85.9 |
| | 7.4 |
| | 9 | % |
| Depreciation and amortization | 241.6 |
| | 226.9 |
| | 14.7 |
| | 6 | % |
| Materials and other | 186.9 |
| | 172.8 |
| | 14.1 |
| | 8 | % |
| Total operating expenses | $ | 1,238.7 |
| | $ | 1,128.1 |
| | $ | 110.6 |
| | 10 | % |
Compensation and benefits. Compensation and benefits increased $1.1Fuel. Fuel decreased $8.1 million for the three months ended September 30, 2017,March 31, 2020, compared to the same period in 2016,2019, due to annual wage increaseslower diesel fuel prices of approximately $3.0 million in both Mexico and the U.S., increased efficiency of approximately $5.0 million and the weakening of the Mexican peso against the U.S. dollar of approximately $1.0 million, partially offset by increased consumption of approximately $4.0 million. The average price per gallon was $2.34 for the three months ended March 31, 2020, compared to $2.54 for the same period in 2019.
Equipment costs. Equipment costs decreased $8.5 million increased headcountfor the three months ended March 31, 2020, compared to the same period in 2019, due to lower lease expense as a result of the termination of locomotive leases during the second quarter of 2019 and first quarter of 2020 of approximately $2.0$5.0 million, and additional headcount forlower car repair in Mexico being performed in-house starting in October 2016hire expense primarily as a result of reduced cycle times due to PSR initiatives of approximately $2.0$3.0 million.
Depreciation and amortization. Depreciation and amortization expense increased $0.9 million for the three months ended March 31, 2020, compared to the same period in 2019, due to a larger asset base, partially offset by lower depreciation as a result of PSR initiatives implemented during 2019.
Materials and other.Materials and other expense increased $0.6 million for the three months ended March 31, 2020, compared to the same period in 2019, primarily due to higher derailment activity of approximately $4.0 million, partially offset by a decrease in incentive compensation of approximately $6.0 million. Compensationmaterials and benefits increased $24.6 million for the nine months ended September 30, 2017, compared to the same period in 2016, due to increases in annual wages and benefits of approximately $18.0 million, increased headcount of approximately $4.0 million, and additional headcount for car repair in Mexico being performed in-house starting in October 2016 of approximately $4.0 million, partially offset by decreased incentive compensationsupplies expense of approximately $2.0 million and the weakening of the Mexican peso against the U.S. dollar of approximately $2.0$1.0 million.
Purchased services. Purchased services expense decreased $8.2 million and $12.6 million forRestructuring charges. During the three and nine months ended September 30, 2017, respectively, comparedMarch 31, 2020, the Company recognized restructuring charges of $6.0 million, primarily as a result of make-whole payments for leased locomotives impaired in the fourth quarter of 2019. For the three months ended March 31, 2019, the Company recognized restructuring charges of $67.5 million, related to the same periods in 2016, due to car repair in Mexico being performed in-house starting in October 2016 and the restructuringimpairment of certain locomotive maintenance contracts. For the nine months ended September 30, 2017, the decrease was partially offset by increases in repairslocomotives and maintenance, detours,rail cars, severance costs related to workforce reductions, and computer software expenses.contract restructuring activities. Refer to Note 3, Restructuring Charges for more information.
Fuel. Fuel increased $12.5Non-Operating Income and Expenses
Equity in net earnings of affiliates. Equity in net earnings of affiliates decreased $0.7 million for the three months ended September 30, 2017,March 31, 2020, compared to the same period in 2016, due to higher diesel fuel prices of approximately $6.0 million and $3.0 million in Mexico and the U.S., respectively, higher consumption of approximately $3.0 million, and the strengthening of the Mexican peso of approximately $2.0 million. These increases were partially offset by improved efficiency of approximately $2.0 million. Fuel increased $48.4 million for the nine months ended September 30, 2017, compared to the same period in 2016, due to higher diesel fuel prices of approximately $25.0 million and $15.0 million in Mexico and the U.S., respectively, and higher consumption of approximately $16.0 million, partially offset by the weakening of the Mexican peso of approximately $5.0 million and improved efficiency of approximately $3.0 million. The average price per gallon was $2.30 and $2.24 for the three and nine months ended September 30, 2017, respectively, compared to $1.99 and $1.93 for the same periods in 2016.
Mexican fuel excise tax credit. Fuel purchases made in Mexico are subject to an excise tax that is included in the price of fuel. The Company is eligible for and utilizes an available credit for the excise tax included in the price of fuel that is purchased and consumed in locomotives and certain work equipment in Mexico. For the three and nine months ended September 30, 2017, the Company recognized an $11.1 million and $35.6 million benefit, respectively, compared to $15.6 million and $49.6 million for the same periods in 2016. The reduced benefit is2019, primarily due to a lower excise tax rate in effect for 2017 as compared to 2016. The Mexican fuel excise tax credit is realized through the offset of the total annual Mexico income tax liability and income tax withholding payment obligations of KCSM, with no carryforward to future periods.
Equipment costs. Equipment costs decreased $1.1 million for the three months ended September 30, 2017, compared to the same period in 2016, due to lower freight car rent. Equipment costs increased $7.4 million for the nine months ended September 30, 2017, compared to the same period in 2016, due to higher car hire expense resulting from increased automotive business impacting rates and volumes, partially offset by improved efficiency.
Depreciation and amortization. Depreciation and amortization expense increased $5.0 million and $14.7 million for the three and nine months ended September 30, 2017, respectively, compared to the same periods in 2016, due to a larger asset base.
Materials and other.Materials and other expense increased $4.3 million and $14.1 million for the three and nine months ended September 30, 2017, compared to the same periods in 2016, due to car repair in Mexico being performed in-house starting in October 2016.
Non-Operating Income and Expenses
Equity in net earnings of affiliates. Equitydecrease in net earnings from affiliates decreased $0.7 million for the threeoperations of TFCM, S. de R.L de C.V. (“TCM”) due to increased tax expense and nine months ended September 30, 2017, compared to the same periodsforeign exchange losses. This decrease was partially offset by increase in 2016 as a result of lower equity in net earnings from the operations of Panama Canal Railway Company dueFerrocarril y Terminal del Valle de Mexico, S.A de C.V. (“FTVM”) as a result of higher expenses recognized in the first quarter of 2019 related to a decrease in container volumes.the cancellation of Mexico City’s new international airport.
Interest expense. Interest expense remained flat for For the three months ended September 30, 2017, compared to the same period in 2016. For the nine months ended September 30, 2017,March 31, 2020, interest expense increased $1.7$6.0 million, compared to the same period in 2016,2019, due to higher average debt balances, partially offset by lower average interest rates as a result of an increased proportion of commercial paper in the overall debt mix.balances. During the three and nine months ended September 30, 2017,March 31, 2020, the average debt balances (including commercial paper) were $2,640.6balance was $3,275.2 million, and $2,594.1 million, respectively, compared to $2,577.7 million and $2,490.2$2,711.9 million for the same periodsperiod in 2016. Average2019. The average interest ratesrate during the three and nine months ended September 30, 2017March 31, 2020 and 2019 was 4.2%, for both periods.
Debt retirement costs. The Company did not incur debt retirement costs during the first quarter of 2020. Debt retirement costs were 3.8% and 3.9%, respectively, compared to 4.0%$0.6 million for the same periodsthree months ended March 31, 2019, related to the write-off of previously capitalized debt issuance costs associated with the establishment of the new revolving credit facility in 2016.the first quarter of 2019.
Foreign exchange gain (loss). For the three and nine months ended September 30, 2017,March 31, 2020, foreign exchange gainloss was $0.8$59.5 million, and $61.8 million, respectively, compared to a lossgain of $19.8 million and $47.3$4.6 million, for the same periodsperiod in 2016.2019. Foreign exchange gain (loss) includes the re-measurement and settlement of net monetary assets and liabilities denominated in Mexican pesos and the gain (loss) on foreign currency derivative contracts. The significant fluctuation in foreign exchange gain (loss) is a result of depreciation in the Mexican peso against the U.S. dollar partially resulting from the increased market volatility driven by the global COVID-19 pandemic.
For the three and nine months ended September 30, 2017,March 31, 2020, the re-measurement and settlement of monetary assets and liabilities denominated in Mexican pesos resulted in a foreign exchange loss of $2.5$25.8 million, andcompared to a gain of $16.3 million, respectively, compared to a loss of $3.7 million and $11.5$1.0 million, for the same periodsperiod in 2016.2019.
The Company enters into foreign currency derivative contracts to hedge its net exposure to fluctuations in the Mexican cash tax obligation due to changes in the value of the Mexican peso against the U.S. dollar. For the three and nine months ended September 30, 2017,March 31, 2020, the Company incurred a foreign exchange gain on foreign currency derivative contracts was $3.3loss of $33.7 million, and $45.5 million, respectively, compared to a lossgain of $16.1 million and $35.8$3.6 million, for the same periodsperiod in 2016.2019.
Other income, (expense), net. Other income, (expense) remained flatnet increased $1.3 million for the three months ended September 30, 2017,March 31, 2020, compared to the same period in 2016. For2019, due to an increase in miscellaneous income.
Income tax expense. Income tax expense increased $10.5 million for the ninethree months ended September 30, 2017, other income (expense), net increased $1.2 million,March 31, 2020, compared to the same period in 2016,2019, due to an increase in miscellaneoushigher pre-tax income, partially offset by a lower effective tax rate. The decrease in the first half of 2017.
Income tax expense. Income tax expense increased $44.7 million and $122.2 million for the three and nine months ended September 30, 2017, respectively, compared to the same periods in 2016, due to a higher effective tax rate was primarily due to fluctuations in the foreign exchange rate, partially offset by the loss of the Mexican fuel excise tax credit. See the tax rates reconciliation below.
The Treasury Department issued proposed regulations in June 2019 that provides for a high-tax exception to the GILTI tax. Specifically, if foreign earnings are subject to a foreign tax rate of at least 90% of the U.S. tax rate, an election can be made to not treat the high-taxed earnings as GILTI income. As currently proposed, the high-tax exception provisions would not be effective until taxable years beginning on or after the date the proposed regulations are finalized. The regulations as proposed should render the GILTI tax immaterial to the consolidated financial statements if and higher pre-tax income. when they become effective.
The components of the effective tax rates for the three and nine months ended September 30, 2017,March 31, 2020, compared to the same periods in 2016,2019, are as follows:
| | | | Three Months Ended | | Nine Months Ended | Three Months Ended |
| | September 30, | | September 30, | March 31, |
| | 2017 | | 2016 | | 2017 | | 2016 | 2020 | | 2019 |
| Statutory rate in effect | 35.0 | % | | 35.0 | % | | 35.0 | % | | 35.0 | % | 21.0 | % | | 21.0 | % |
| Tax effect of: | | | | | | | | | | |
| Difference between U.S. and foreign tax rate | (3.1 | %) | | (2.5 | %) | | (3.1 | %) | | (2.8 | %) | 5.7 | % | | 5.8 | % |
| Global intangible low-taxed income (“GILTI”) tax, net | | 1.1 | % | | 1.0 | % |
| Mexican fuel excise tax credit, net (i) | | — |
| | (4.9 | %) |
| State and local income tax provision, net | 1.0 | % | | 1.4 | % | | 1.0 | % | | 1.2 | % | 1.3 | % | | 1.1 | % |
| Foreign exchange (i) | 6.1 | % | | (8.9 | %) | | 5.8 | % | | (3.7 | %) | |
| Foreign exchange (ii) | | (4.8 | %) | | 1.2 | % |
| Other, net | (0.3 | %) | | (1.4 | %) | | 0.9 | % | | — |
| (1.4 | %) | | — |
|
| Effective tax rate | 38.7 | % | | 23.6 | % | | 39.6 | % | | 29.7 | % | 22.9 | % | | 25.2 | % |
| |
| (i) | See discussion of the inclusion of the Mexican fuel excise tax credit, net within the effective tax rate in the Mexico Tax Reform section below. |
| |
| (ii) | Mexican income taxes are paid in Mexican pesos, and as a result, the effective income tax rate reflects fluctuations in the value of the Mexican peso against the U.S. dollar measured by the forward exchange rate. The foreign exchange impact on income taxes includes the gain or loss from the revaluation of net U.S. dollar-denominated monetary liabilities into Mexican pesos which is included in Mexican taxable income under Mexican tax law. As a result, a strengthening of the Mexican peso against the U.S. dollar for the reporting period will generally increase the Mexican cash tax obligation and the effective income tax rate, and a weakening of the Mexican peso against the U.S. dollar for the reporting period will generally decrease the Mexican cash tax obligation and the effective tax rate. To hedge its exposure to this cash tax risk, the Company enters into foreign currency derivative contracts, which are measured at fair value each period and any change in fair value is recognized in foreign exchange gain (loss) within the consolidated statements of income as described above. Refer to Note 8, Derivative Instruments for more information. |
Mexico Tax Reform
In December 2019, the Mexican government enacted changes in the tax law effective January 1, 2020 (“Mexico 2020 Tax Reform”). Mexico 2020 Tax Reform excluded railroads from eligibility for the Mexican fuel excise tax credit. Mexico 2020 Tax Reform also included permanent changes to the Value Added Tax (“VAT”) Law, Income Tax Law and Federal Fiscal Code which, among other things, requires certain VAT withholding, limits the deduction of interest expense and certain payments to related parties in preferential tax regimes, adopts a general anti-avoidance rule, requires mandatory disclosure of reportable transactions beginning in 2021, and permanently eliminates universal compensation, which allowed Mexican taxpayers to offset recoverable tax balances against balances due for other federal taxes. The elimination of universal compensation, which was instituted at the beginning of 2019 and then made permanent beginning in 2020, resulted in favorable VAT balances of $53.2 million as of March 31, 2020. The Company believes the favorable VAT balance will ultimately be refunded by the Mexican government. As a result, Mexico 2020 Tax Reform did not have a material impact to the consolidated financial statements for the three months ended March 31, 2020, and is not expected to for the remainder of 2020.
Liquidity and Capital Resources
Overview
TheOn November 12, 2019, the Company focusesannounced its cash andnew capital resources on investingallocation policy (the “Policy”) that was approved by the Company’s Board of Directors (the “Board”). Pursuant to that Policy, the Company intends to deploy available cash in the business, shareholder returnsfollowing manner:
• Approximately 40-50% to capital projects and optimizing its capital structure.strategic investments; and
The Company believes, based on current expectations, that cash and other liquid assets, operating cash flows, accessApproximately 50-60% to debt and equity capital markets, and other available financing resources will be sufficient to fund anticipated operating expenses, capital expenditures, debt service costs, dividends, share repurchases and other commitmentsdividends.
In connection with the new Policy, the Board also approved the following actions:
An increase in the foreseeable future. quarterly dividend on KCS’s common stock from $0.36 to $0.40 per share; and
A new $2.0 billion share repurchase program (“2019 Program”), expiring December 31, 2022.
During the three months ended March 31, 2020, the Company invested $86.6 million in capital expenditures. See the Capital Expenditures section for further details.
During the first quarter of 2020, KCS repurchased 1,291,635 shares of common stock for $194.2 million under the 2019 Program, which includes shares delivered to settle the Company’s accelerated share repurchase (“ASR”) agreements entered into in November 2019. Since inception of the 2019 Program, KCS has repurchased 4,314,395 shares of common stock for $661.7 million at an average price of $153.37 per share. Management’s assessment of market conditions, available liquidity and other factors will determine the timing and volume of any future repurchases. Refer to Note 10, Share Repurchases, for additional information on the Company’s common share repurchase program and ASR agreements.
During the first quarter of 2020, the Company’s Board of Directors declared a quarterly cash dividend on its common stock of $0.40 per share (total of $38.2 million). Subject to the discretion of the Board of Directors, capital availability and a determination that cash dividends continue to be in the best interest of its stockholders, the Company intends to pay a quarterly dividend on an ongoing basis.
AtMarch 31, 2020, the Company had $444.7 million principal amount outstanding of 3.00% senior notes that mature May 15, 2023 (the “3.00% Notes”). The Company has the intention and ability to refinance the 3.00% Notes into a new long-term debt instrument prior to maturity. The Company has executed treasury lock agreements to hedge the U.S. Treasury benchmark interest rate associated with any future interest payments related to the anticipated refinancing of the 3.00% Notes. See Note 8, Derivative Instruments for further discussion of the treasury lock agreements.
The Company’s current financing instruments contain restrictive covenants which limit or preclude certain actions; however, the covenants are structured such that the Company expects to have sufficient flexibility to conduct its operations. The Company was in compliance with all of its debt covenants as of September 30, 2017.
Though KCS’s cash flows from operations are expected to be sufficient to fund operations, capital expenditures, debt service and dividends, the Company may, from time to time, incur debt to refinance existing indebtedness, purchase equipment under operating leases, repurchase shares or fund equipment additions or new investments.
During the nine months ended September 30, 2017, the Company invested $419.3 million in capital expenditures. See Capital Expenditures section for further details.
During the first half of 2017, KCS concluded its $500.0 million share repurchase program, announced in May 2015 (the “2015 program”). In August 2017, the Company announced a new share repurchase program of up to $800.0 million, which expires on June 30, 2020 (the “2017 program”). Included within the 2017 program was authorization for an accelerated share repurchase (“ASR”) program limited to $200.0 million. The Company entered into an ASR program of $200.0 million in the third quarter of 2017. Following settlement of the ASR program in October 2017, the Company’s 2017 repurchases of common stock, which includes shares repurchased through the 2015 Program and the 2017 Program, totaled 3,241,978 shares of common stock at an average price of $98.83 per share and a total cost of $320.4 million. Refer to Note 10 - Equity for additional detail on the Company’s share repurchase activity.
During the first and second quarters of 2017, the Company’s Board of Directors declared quarterly cash dividends on its common stock of $0.33 per share (total of $69.9 million), and during the third quarter of 2017 declared quarterly cash dividends on its common stock of $0.36 per share (total $37.3 million). Subject to the discretion of the Board of Directors, capital availability and a determination that cash dividends continue to be in the best interest of its stockholders, the Company intends to pay a quarterly dividend on an ongoing basis.March 31, 2020.
For additional discussion of the agreements representing the indebtedness of KCS, see “Note 11,Note 13, Short-Term Borrowings”Borrowings and “Note 12,Note 14, Long-Term Debt”Debt in the “Notes to the Consolidated Financial Statements” section of the Company’s Annual Report on Form 10-K for the year ended December 31, 2016.2019.
On September 30, 2017March 31, 2020, total available liquidity (the cash balance plus revolving credit facility availability) was $532.4$691.0 million, compared to availability at December 31, 20162019 of $789.2$748.8 million. This decrease was primarily due to a reduction in cash on hand as a result of the Company’s ASR program as well as an increase in commercial paper to fund share repurchases inshares repurchased during the first halfquarter of 2017.2020.
As of September 30, 2017,March 31, 2020, the total cash and cash equivalents held outside of the U.S. in foreign subsidiaries was $28.4 million.$33.5 million, after repatriating approximately $66.0 million during the first quarter of 2020. The Company expects that this cash will be available to fund operations without incurring significant additional income taxes.
KCS’s operating results and financing alternatives can be unexpectedly impactedMexico 2020 Tax Reform permanently eliminated universal compensation that allowed Mexican taxpayers to offset
recoverable tax balances against balances due for other federal taxes. The elimination of universal compensation could negatively impact the timing of KCSM’s cash flow by various factors, someup to $60.0 million in 2020 while awaiting refunds of which are outside of its control. For example, if KCS were to experience a reduction in revenues or a substantial increase in operating costs or other liabilities, its earnings could be significantly reduced, increasingvalue added tax from the risk of non-compliance with debt covenants. Additionally, the Company is subject to external factors impacting debt and equity capital markets and its ability to obtain financing under reasonable terms is subject to market conditions. Volatility in capital markets and the tightening of market liquidity could impact KCS’s access to capital. Further, KCS’s cost of debt can be impacted by independent rating agencies which assign debt ratings based on certain factors including competitive position, credit measurements such as interest coverage and leverage ratios, and liquidity.Mexican government.
Cash Flow Information
Summary cash flow data follows (in millions):
| | | | Nine Months Ended | Three Months Ended |
| | September 30, | March 31, |
| | 2017 | | 2016 | 2020 | | 2019 |
| Cash flows provided by (used for): | | | | | | |
| Operating activities | $ | 733.7 |
| | $ | 683.6 |
| $ | 283.2 |
| | $ | 272.7 |
|
| Investing activities | (542.0 | ) | | (466.0 | ) | (188.6 | ) | | (189.7 | ) |
| Financing activities | (273.9 | ) | | (61.1 | ) | (148.3 | ) | | (90.8 | ) |
| Net increase (decrease) in cash and cash equivalents | (82.2 | ) | | 156.5 |
| |
| Effect of exchange rate changes on cash | | (4.1 | ) | | — |
|
| Net decrease in cash and cash equivalents | | (57.8 | ) | | (7.8 | ) |
| Cash and cash equivalents beginning of year | 170.6 |
| | 136.6 |
| 148.8 |
| | 100.5 |
|
| Cash and cash equivalents end of period | $ | 88.4 |
| | $ | 293.1 |
| $ | 91.0 |
| | $ | 92.7 |
|
Cash flows from operating activities increased $50.1$10.5 million for the ninethree months ended September 30, 2017,March 31, 2020, compared to the same period in 2016,2019, primarily due to increasedan increase in net income, of $61.9 million, partially offset by a decrease in cash inflows fromreceived for working capital items of $15.7 million resulting mainly from the timing of certain receipts.
Net cash used for investing activities increased $76.0decreased $1.1 million for the ninethree months ended September 30, 2017,March 31, 2020, compared to the same period in 2016,2019, due to a $41.8 million increasean decrease in capital expenditures a $19.4of $81.1 million, partially offset by an increase in investments in and advances to affiliates and a $16.0 million increase in expenditures for the purchase or replacement of equipmentassets under existing operating leases. Additional information regarding capital expenditures is provided below.leases of $78.2 million.
Net cash used for financing activities increased $212.8$57.5 million for the ninethree months ended September 30, 2017,March 31, 2020, compared to the same period in 2016,2019, primarily due to an increase in the repurchaseshares repurchased of common$61.4 million, partially offset by an increase in proceeds from employee stock plans of $220.6$4.2 million.
Capital Expenditures
KCS has funded, and expects to continue to fund capital expenditures with operating cash flows and short and long-term debt.
The following table summarizes capital expenditures by type (in millions):
| | | | Nine Months Ended | Three Months Ended |
| | September 30, | March 31, |
| | 2017 | | 2016 | 2020 | | 2019 |
| Roadway capital program | $ | 201.0 |
| | $ | 210.3 |
| $ | 56.6 |
| | $ | 59.8 |
|
| Locomotives and freight cars | 64.7 |
| | 65.0 |
| 6.7 |
| | 85.3 |
|
| Capacity | 79.3 |
| | 71.8 |
| 10.2 |
| | 16.4 |
|
| Positive train control | 40.0 |
| | 34.4 |
| 3.3 |
| | 3.7 |
|
| Information technology | 24.6 |
| | 18.0 |
| 9.0 |
| | 8.1 |
|
| Other | 9.7 |
| | 5.1 |
| 0.8 |
| | 1.6 |
|
| Total capital expenditures (accrual basis) | 419.3 |
| | 404.6 |
| 86.6 |
| | 174.9 |
|
| Change in capital accruals | 27.6 |
| | 0.5 |
| 12.2 |
| | 5.0 |
|
| Total cash capital expenditures | $ | 446.9 |
| | $ | 405.1 |
| $ | 98.8 |
| | $ | 179.9 |
|
| | | | | | | |
| | | | | |
| Purchase or replacement of equipment under operating leases (accrual basis) | $ | 42.6 |
| | $ | 26.6 |
| $ | 78.2 |
| | $ | — |
|
| Change in capital accruals | — |
| | — |
| — |
| | — |
|
| Total cash purchase or replacement of equipment under operating leases | $ | 42.6 |
| | $ | 26.6 |
| $ | 78.2 |
| | $ | — |
|
Generally, the Company’s capital program consists of capital replacement and equipment. For 2017,2020, internally generated cash flows are expected to fund cash capital expenditures, which are currently estimated to be between $550.0$400.0 million and $560.0 million.$450.0 million, depending on market conditions. In addition, the Company periodically reviews its equipment and property under operating leases. Any additional purchase or replacement of equipment and property under operating leases during 20172020 is expected to be funded with internally generated cash flows and/or short-term debt.
Other Matters
Regulatory Updates
USMCA. On January 16, 2020, the U.S. Senate approved the “USMCA Implementation Act” that had been approved by the U.S. House of Representatives on December 19, 2019. On January 29, 2020, U.S. President Donald J. Trump signed the implementing legislation into law.
Both Canada and Mexico have taken their required legislative actions to implement the new agreement.
The Canadian and Mexican governments have sent the notifications required under the USMCA that they have completed all the necessary requirements for its implementation. The U.S. has not provided the required notification. If the U.S. sends its notification before the end of April 2020, the deal could enter into force on July 1, 2020.
North American trade is important to the Company and its business. The Company believes completion of the USMCA approval process and implementation of the agreement should create more certainty about such trade going forward, improving the cross-border environment in which the Company operates.
U.S. Tariff Imposition on Imports. The administration of U.S. President Donald J. Trump has implemented new U.S. tariffs that could impact global commerce. U.S. trading partners have responded by announcing retaliatory tariffs on some U.S. exports. At this time, the Company cannot determine the impacts these tariffs will have on the Company’s consolidated financial statements.
Collective Bargaining
KCSR participates in industry-wide multi-employer bargaining as a member of the National Carriers’ Conference Committee (“NCCC”), as well as local bargaining for agreements that are limited to KCSR's property. Approximately 75%Over 70% of KCSR employees are covered by collective bargaining agreements. Long-term settlement agreements were reached voluntarily or through the arbitration process during 2017 and ratified during 2011 and the first half of 20122018 covering all of the participating unions. TheseThe terms of these agreements werewill remain in effect through December 2015, and currently remainuntil new agreements are reached in effect.
The National Carriers’ Conference Committee (“NCCC”) representsthe next bargaining round. In November 2019, KCSR and the other large freight railroadsits unions commenced negotiations in industry-wide multi-employer bargaining. The NCCC has been bargainingconnection with the rail unions since January 2015 for changes to these collective2020 bargaining agreements. On October 5, 2017, the NCCC, as representatives of KCSR and the railroad industry, reached a tentative agreement with Collective Bargaining Group (“CBG”), a coalition comprised of multiple unions that represent approximately 60% of KCSR’s unionized workforce. The unions in the CBG coalition have now commenced ratification of this tentative agreement by its members. If ratified, the revised agreement will be in effect through December 2019. The NCCC is still in mediation with the other unions regarding proposed amendments to their agreements.round.
KCSM Servicios, S.A. de C.V. (“KCSM Servicios”), a wholly owned subsidiary of KCS, provides employee services to KCSM, and KCSM pays KCSM Servicios market-based rates for these services. KCSM Servicios union employees are covered by one labor agreement, which was signed on April 16, 2012, between KCSM Servicios and the Sindicato de Trabajadores Ferrocarrileros de la República Mexicana (“Mexican Railroad Union”), for an indefiniteand which remains in effect during the period of time,the Concession, for the purpose of regulating the relationship between the parties. Approximately 80%Over 75% of KCSM Servicios employees are covered by this labor agreement. The compensation terms under this labor agreement are subject to renegotiation on an annual basis and all other benefits are subject to negotiation every two years. KCSM Servicios has started negotiations ofThe parties are currently negotiating compensation terms and all other benefits terms with the Mexican Railroad Union for the period coveringthat will apply from July 1, 20172019 to June 30, 2018.2020, along with other terms. The anticipated resolutionfinalization of this negotiationthe compensation terms is not expected to have a material impact tosignificant effect on the consolidated financial statements.
Union labor negotiations have not historically resulted in any strike, boycott, or other disruption in the Company’s business operations.
Supplemental Guarantor Financial Information
The following is a description of the terms and conditions of the guarantees with respect to senior notes for which KCS is an issuer or provides full and unconditional guarantee.
Note Guarantees
As of March 31, 2020, KCS had outstanding $3,186.2 million principal amount of senior notes due through 2069. The Kansas City Southern Railway Company (“KCSR”) had outstanding $2.7 million principal amount of senior notes due through 2045 (together, the “Senior Notes”). The senior notes for which KCS is the issuer are unconditionally guaranteed, jointly and severally, on an unsecured senior basis, by each of KCS’s current and future domestic consolidated subsidiaries that from time to time guarantees certain of KCS’s credit agreements, or any other debt of KCS, or any of KCS’s significant subsidiaries that is a guarantor (each, a “Guarantor Subsidiary,” and collectively, the “Guarantor Subsidiaries”). In addition, the senior notes for which KCSR is the issuer are unconditionally guaranteed, jointly and severally, on an unsecured senior basis, by KCS and each of its current and future domestic consolidated subsidiaries that from time to time guarantees KCSR’s credit agreement, or any other debt of KCSR or any of KCSR’s significant subsidiaries that is a Guarantor Subsidiary. The obligations of each Guarantor Subsidiary under its note guarantee are limited as necessary to prevent such note guarantee from constituting a fraudulent conveyance under applicable law. A guarantee of the Senior Notes by KCS or a Guarantor Subsidiary is subject to release in the following circumstances: (i) the sale, disposition, exchange or other transfer (including through merger, consolidation, amalgamation or otherwise) of the capital stock of the Guarantor Subsidiary made in a manner not in violation of the indenture; (ii) the designation of the subsidiary as an “Unrestricted Subsidiary” under the indenture; (iii) the legal defeasance or covenant defeasance of the Senior Notes in accordance with the terms of the indenture; or (iv) the Guarantor Subsidiary ceasing to be KCS’s subsidiary as a result of any foreclosure of any pledge or security interest securing KCS’s Revolving Credit Facility or other exercise of remedies in respect thereof.
KCSM and any other foreign subsidiaries of KCS do not and will not guarantee the Senior Notes (“Non-Guarantor Subsidiaries”).
The following tables present summarized financial information for KCS and the Guarantor Subsidiaries on a combined basis after intercompany transactions have been eliminated, including adjustments to remove the receivable and payable balances, investment in, and equity in earnings from the Non-Guarantor Subsidiaries.
Summarized Financial Information
|
| | | | | | | |
| Income Statements | KCS and Guarantor Subsidiaries |
| | Three Months Ended March 31, 2020 | | Twelve Months Ended December 31, 2019 |
| Revenues | $ | 374.6 |
| | $ | 1,472.0 |
|
| Operating expenses | 232.1 |
| | 1,068.5 |
|
| Operating income | 142.5 |
| | 403.5 |
|
| Income before income taxes | 111.3 |
| | 291.7 |
|
| Net income | 99.2 |
| | 235.0 |
|
|
| | | | | | | |
| Balance Sheets | KCS and Guarantor Subsidiaries |
| | March 31, 2020 | | December 31, 2019 |
| Assets: | | | |
| Current assets | $ | 261.2 |
| | $ | 332.9 |
|
| Property and equipment (including concession assets), net | 4,716.1 |
| | 4,596.3 |
|
| Other non-current assets | 85.8 |
| | 156.9 |
|
| | | | |
| Liabilities and equity: | | | |
| Current liabilities | $ | 280.7 |
| | $ | 313.5 |
|
| Non-current liabilities | 4,252.2 |
| | 4,267.7 |
|
| Noncontrolling interest | 323.9 |
| | 323.4 |
|
Excluded from current assets in the table above are $134.1 million and $95.2 million of current intercompany receivables due to KCS and the Guarantor Subsidiaries from the Non-Guarantor Subsidiaries as of March 31, 2020 and December 31, 2019, respectively. Excluded from current liabilities in the table above are $110.5 million and $55.0 million of current intercompany payables due to the Non-Guarantor Subsidiaries from KCS and the Guarantor Subsidiaries as of March 31, 2020 and December 31, 2019, respectively.
The Senior Notes are structurally subordinated to the indebtedness and other liabilities of the Non-Guarantor Subsidiaries. The Non-Guarantor Subsidiaries are separate and distinct legal entities and have no obligation, contingent or otherwise, to pay any amounts due pursuant to the Senior Notes or the indentures, or to make any funds available therefor, whether by dividends, loans, distributions or other payments. Any right that the KCS or the Guarantor Subsidiaries have to receive any assets of any of the Non-Guarantor Subsidiaries upon the liquidation or reorganization of any Non-Guarantor Subsidiary, and the consequent rights of holders of Senior Notes to realize proceeds from the sale of any of a Non-Guarantor Subsidiary’s assets, would be effectively subordinated to the claims of such Non-Guarantor Subsidiary’s creditors, including trade creditors and holders of preferred equity interests, if any, of such Non-Guarantor Subsidiary. Accordingly, in the event of a bankruptcy, liquidation or reorganization of any of the Non-Guarantor Subsidiaries, the Non-Guarantor Subsidiaries will pay the holders of their debts, holders of preferred equity interests, if any, and their trade creditors before they will be able to distribute any of their assets to KCS or any Guarantor Subsidiary.
If a Guarantor Subsidiary were to become a debtor in a case under the U.S. Bankruptcy Code or encounter other financial difficulty, under federal or state fraudulent transfer or conveyance law, a court may avoid, subordinate or otherwise decline to enforce its guarantee of the Senior Notes. A court might do so if it is found that when such Guarantor Subsidiary entered into its guarantee of the Senior Notes, or in some states when payments became due under the Senior Notes, such Guarantor Subsidiary received less than reasonably equivalent value or fair consideration and either:
• was insolvent or rendered insolvent by reason of such incurrence;
• was left with unreasonably small or otherwise inadequate capital to conduct its business; or
• believed or reasonably should have believed that it would incur debts beyond its ability to pay.
The court might also avoid the guarantee of the Senior Notes without regard to the above factors, if the court found that a Guarantor Subsidiary entered into its guarantee with actual intent to hinder, delay or defraud its creditors.
A court would likely find that a Guarantor Subsidiary did not receive reasonably equivalent value or fair consideration for its guarantee of the Senior Notes, if such Guarantor Subsidiary did not substantially benefit directly or indirectly from the funding made available by the issuance of the Senior Notes. If a court were to avoid a guarantee of the Senior Notes provided
by a Guarantor Subsidiary, holders of the Senior Notes would no longer have any claim against such Guarantor Subsidiary. The measures of insolvency for purposes of these fraudulent transfer or conveyance laws will vary depending upon the law applied in any proceeding to determine whether a fraudulent transfer or conveyance has occurred, such that the Company cannot predict what standards a court would use to determine whether or not a Guarantor Subsidiary was solvent at the relevant time or, regardless of the standard that a court uses, that the guarantee of a Guarantor Subsidiary would not be subordinated to such Guarantor Subsidiary’s other debt. As noted above, each guarantee provided by a Guarantor Subsidiary includes a provision intended to limit the Guarantor Subsidiary’s liability to the maximum amount that it could incur without causing the incurrence of obligations under its guarantee to be a fraudulent transfer or conveyance. This provision may not be effective to protect those guarantees from being avoided under fraudulent transfer or conveyance law, or it may reduce that Guarantor Subsidiary’s obligation to an amount that effectively makes its guarantee worthless, and the Company cannot predict whether a court will ultimately find it to be effective.
On the basis of historical financial information, operating history and other factors, the Company believes that each of the Guarantor Subsidiaries, after giving effect to the issuance of its guarantee of the Senior Notes when such guarantee was issued, was not insolvent, did not have unreasonably small capital for the business in which it engaged and did not and has not incurred debts beyond its ability to pay such debts as they mature. The Company cannot predict, however, as to what standard a court would apply in making these determinations or that a court would agree with the Company’s conclusions in this regard.
| |
| Item 3. | Quantitative and Qualitative Disclosures about Market Risk |
There was no material change during the quarter from the information set forth in Part II, Item 7A. “Quantitative and Qualitative Disclosure about Market Risk” in the Annual Report on Form 10-K for the year ended December 31, 20162019.
| |
| Item 4. | Controls and Procedures |
(a) Disclosure Controls and Procedures
As of the end of the period for which this Quarterly Report on Form 10-Q is filed, the Company’s Chief Executive Officer and Chief Financial Officer have each reviewed and evaluated the effectiveness of the Company’sThe Company maintains disclosure controls and procedures (as that term is defined in Rules 13a-15(e) and 15d-15(e) ofunder the Securities Exchange Act of 1934, as amended (the “Exchange Act”)). Based on that evaluation, the Chief Executive Officer and Chief Financial Officer have each concluded that the Company’s current disclosure controls and procedures are effectivedesigned to ensure that information required to be disclosed byin the Company inCompany’s reports that it files or submits under the Exchange Act is recorded, processed, summarized and reported within the time periods specified in the Securities and Exchange CommissionSEC’s rules and forms, and include controls and procedures designed to ensure that information required to be disclosed by the Company in such reportsinformation is accumulated and communicated to the Company’s management, including theits Chief Executive Officer and Chief Financial Officer, as appropriate, to allow timely decisions regarding required disclosure.disclosures. Any controls and procedures, no matter how well designed and operated, can provide only reasonable assurance of achieving the desired control objectives. The Company’s management, with the participation of the Company’s Chief Executive Officer and Chief Financial Officer, has evaluated the effectiveness of the design and operation of the Company’s disclosure controls and procedures as of the end of the quarterly period covered by this Quarterly Report on Form 10-Q. Based upon that evaluation, the Company’s Chief Executive Officer and Chief Financial Officer concluded that, as of the end of the fiscal quarter ended March 31, 2020, the design and operation of the Company’s disclosure controls and procedures were effective to accomplish their objectives at a reasonable assurance level.
(b) Changes in Internal Control over Financial Reporting
There have not been anyno changes in the Company’s internal control over financial reporting (as that term is defined in Rules 13a-15(f) and 15d-15(f) under the Exchange Act) that occurred during the thirdfiscal quarter of 2017ended March 31, 2020 that have materially affected, or are reasonably likely to materially affect, the Company’s internal control over financial reporting.
PART II — OTHER INFORMATION
For information related to the Company’s legal proceedings, see Note 11,, Commitments and Contingencies, under Part I, Item 1 of this quarterly report on Form 10-Q.
The following risk factor, which is includedExcept as set forth below, during the quarter ended March 31, 2020, there were no material changes to the Risk Factors disclosed in our 2016Item 1A - “Risk Factors” in the Company’s Annual Report on Form 10-K is updatedfor the year ended December 31, 2019.
Public health threats or outbreaks of communicable diseases could have a material adverse effect on the Company’s operations and financial results.
The Company may face risks related to public health threats or outbreaks of communicable diseases. A widespread healthcare crisis, such as follows. The remaining risk factors includedan outbreak of a communicable disease could adversely affect the global economy and the Company’s and its business partners’ ability to conduct business in our 2016 Form 10-K remain unchangedthe U.S. and are incorporated herein by reference.
KCS’s business is subjectMexico for an indefinite period of time. For example, the ongoing global Coronavirus Disease 2019 (COVID-19) pandemic, has negatively impacted global economy, disrupted financial markets and international trade, resulted in increased unemployment levels and significantly impacted global supply chains, all of which have started to regulation by federal,negatively impact the rail transportation industry and the Company’s business. In addition, Federal, state, and local legislaturesgovernments have implemented various mitigation measures, including travel restrictions, border closings, restrictions on public gatherings, shelter-in-place restrictions and agencies thatlimitations on business. Although the Company is considered an essential business, some of these actions have adversely impacted the ability of KCS employees, contractors, suppliers, customers, and other business partners to conduct business activities, and could impose significant costultimately do so for an indefinite period of time. This could have a material adverse effect on the Company’s business operations.results of operations, financial condition, and liquidity. In particular, the continued spread of COVID-19 and efforts to contain the virus could:
Mexican Antitrust Review. Pursuant•continue to impact customer demand of the Mexican Antitrust LawCompany’s transportation services;
•cause the Company to experience an increase in costs as a result of the Company’s emergency measures, delayed payments from customers and uncollectable accounts;
•cause delays and disruptions in the supply chain resulting in disruptions in the commercial operation dates of certain projects;
•impact availability of qualified personnel; and
•cause other unpredictable events.
The situation surrounding COVID-19 remains fluid and the Regulatory Railroad Service Law,potential for a material impact on September 12, 2016, the Mexican government’s antitrust commission (Comisión Federal de Competencia Económica or “COFECE”), announced that it would review competitive conditionsCompany’s results of operations, financial condition, and liquidity increases the longer the virus impacts activity levels in the Mexican railroad industry,United States and globally. For this reason, KCS cannot reasonably estimate with respect toany degree of certainty the existence of effective competition in the provision of interconnection services, trackage rights, switching rights and interline services used to render public freight transport in Mexico. The COFECE review includes the entire freight rail transportation market in Mexico and is not targeted to any single rail carrier.
On March 15, 2017, the COFECE published an executive summary of its preliminary report in the Diario Oficial de la Federación. The COFECE’s preliminary report concluded that there was a lack of effective competition in the market for trackage rights (“Relevant Market”) throughout the entire networks of Kansas City Southern de Mexico, S.A. de C.V. (“KCSM”), Ferrocarril Mexicano, S.A. de C.V., Ferrosur, S.A. de C.V., and Ferrocarril y Terminal del Valle de Mexico, S.A. de C.V.
The Company disagrees with the COFECE’s reasoning and preliminary conclusions, and responded on April 20, 2017 with its evidence and arguments to support its position, as provided in the Mexican antitrust law.
On April 27, 2017, the COFECE initiated the incidental procedure to analyze the recusal of two of its commissioners from ongoing proceedings (“Motion to Recuse”). On June 6, 2017, KCSM presented arguments in connection with the Motion to Recuse. On July 7, 2017, KCSM was served with rulings dated June 22, 2017 and June 2, 2017, regarding the Motion to Recuse. Consequently, the two commissioners excluded themselves from further participation in the investigation.
The COFECE has an additional term of up to 110 business days after the decision of the Motion to Recuse to issue a final report in connection with effective competition conditions in the Relevant Market. It is expected a final ruling will be issued around January 2018. It is too early to determine what, if any,future impact this reviewCOVID-19 may have on Mexican rail operations in the future. If the COFECE’s final report determines there is a lack of effective competition, the COFECE could request the new Mexican Agencia Reguladora del Transporte Ferroviario (“Regulatory Agency of Rail Transportation” or “ARTF”), which has primary regulatory jurisdiction over the Company’s Mexicanresults of operations, financial position, and liquidity. The extent to conduct proceedingswhich the COVID-19 pandemic may impact the Company’s business, operating results, financial condition, or liquidity will depend on future developments, including the duration of the outbreak, travel restrictions, business and workforce disruptions, and the effectiveness of actions taken to determine whether to establish new limited mandatory trackage rights and/or rate regulation undercontain and treat the Amendments to the Mexican Regulatory Railroad Service Law.disease.
| |
| Item 2. | Unregistered Sales of Equity Securities and Use of Proceeds |
Purchases of Equity Securities
The following table presents common stock repurchases during each month for the thirdfirst quarter of 2017:2020:
|
| | | | | | | | | | | | | | | | | | | |
| Period | | (a) Total Number of Shares (or Units) Purchased | | (b) Average Price Paid per Share (or Unit) | | (c) Total Number of Shares (or Units) Purchased as Part of Publicly Announced Plans or Programs (1) | | (d) Maximum Number (or Approximate Dollar Value) of Shares (or Units) that may yet be purchased under the Plans or Programs (1) (2) | |
| July 1-31, 2017 | | — |
| | | $ | — |
| | | — |
| | | $ | — |
| | |
| August 1-31, 2017 | | 1,750,277 |
| | | $ | 105.70 |
| | | 1,750,277 |
| | | $ | 600,000,000 |
| | |
| September 1-30, 2017 | | — |
| | | $ | — |
| | | — |
| | | $ | 600,000,000 |
| | |
| Total | | 1,750,277 |
| | | |
| | | 1,750,277 |
| | | |
| | |
|
| | | | | | | | | | | | | | | | | | | |
| Period | | (a) Total Number of Shares (or Units) Purchased | | (b) Average Price Paid per Share (or Unit) | | (c) Total Number of Shares (or Units) Purchased as Part of Publicly Announced Plans or Programs (1) | | (d) Maximum Number (or Approximate Dollar Value) of Shares (or Units) that may yet be purchased under the Plans or Programs (1) | |
| Common stock | | | | | | | | | | | | | |
| January 1-31, 2020 | | — |
| | | — |
| | | — |
| | | $ | 1,532,500,000 |
| | |
| February 1-29, 2020 | | 72,000 |
| | | $ | 157.59 |
| | | 72,000 |
| | | $ | 1,521,153,565 |
| | |
March 1-31, 2020 (2) | | 1,219,635 |
| | | $ | 149.94 |
| | | 1,219,635 |
| | | $ | 1,338,280,820 |
| | |
| Total | | 1,291,635 |
| | | |
| | | 1,291,635 |
| | | |
| | |
|
| | |
| (1 | ) | On August 15, 2017,November 12, 2019, the Company announced that the Board of Directors approved a share repurchase program, pursuant to which up to $800.0 million$2.0 billion in shares of common stock could be repurchased through June 30, 2020. The authorization included a $200.0 million AcceleratedDecember 31, 2022. Share Repurchaserepurchases may be made in the open market, through privately negotiated transactions, or through accelerated share repurchase (“ASR”) program and a $600.0 million open market share repurchase program.transactions. |
| (2 | ) | In the third quarter of 2017,March 2020, the Company paid $200.0 million under two ASR agreements and received an aggregate of initial delivery of 1,598,796 shares. One445,936 shares in settlement of theits ASR agreements was settledentered into in the third quarterNovember 2019. This delivery of 2017, with the Company receiving 151,481 additional shares for a total of 1,750,277 and a value of $185.0 million, which is reflected in the table above. In October 2017, the second ASR agreement was settled with the Company receiving 151,492 additional shares and a valuetheir market price at time of $15.0 million, which is notdelivery are included in the number of shares or the average price paid per share in the table above. The final number of total shares repurchased and the cost of shares repurchased was based on the volume-weighted average price paid per share upon completion of the ASR agreements was $105.17. SeeCompany’s common stock during the term of the agreements. Refer to Note 10, to the Consolidated Financial Statements included in this report.Share Repurchases for additional information. |
| |
| Item 3. | Defaults upon Senior Securities |
None.
| |
| Item 4. | Mine Safety Disclosures |
Not applicable.
None.
|
| | |
Exhibit No. | | DescriptionExhibits |
| | |
| 22.1 | | |
| | | |
| 31.1 | | |
| | |
| 31.2 | | |
| | | |
32.132.1* | | |
| | | |
32.232.2* | | |
| | | |
101101.INS | | The following unaudited financial information from Kansas City Southern’s Quarterly Report on Form 10-Q forXBRL Instance Document - the quarter ended September 30, 2017, formattedinstance document does not appear in the Interactive Data File because its XBRL
tags are embedded within the Inline XBRL (Extensible Business Reporting Language) includes: (i) Consolidated Statements of Income for the threedocument.
|
| | |
| 101.SCH | | Inline XBRL Taxonomy Extension Schema Document. |
| | |
| 101.CAL | | Inline XBRL Taxonomy Extension Calculation Linkbase Document. |
| | |
| 101.DEF | | Inline XBRL Taxonomy Extension Definition Linkbase Document. |
| | |
| 101.LAB | | Inline XBRL Taxonomy Extension Label Linkbase Document. |
| | |
| 101.PRE | | Inline XBRL Taxonomy Extension Presentation Linkbase Document. |
| | |
| 104 | | Cover Page Interactive Data File (formatted as an Inline XBRL document and nine months ended September 30, 2017 and 2016, (ii) Consolidated Statements of Comprehensive Income for the three and nine months ended September 30, 2017 and 2016, (iii) Consolidated Balance Sheets as of September 30, 2017 and December 31, 2016, (iv) Consolidated Statements of Cash Flows for the nine months ended September 30, 2017 and 2016, and (v) the Notes to Consolidated Financial Statements.included in Exhibit 101). |
| | |
| | * Furnished herewith. |
| | |
SIGNATURES
Pursuant to the requirements of the Securities Exchange Act of 1934, the Company has duly caused this report to be signed on its behalf by the undersigned thereunto duly authorized and in the capacities indicated on October 20, 2017April 17, 2020.
|
|
| Kansas City Southern |
| |
/s/ MICHAEL W. UPCHURCH |
| Michael W. Upchurch |
Executive Vice President and Chief Financial Officer (Principal Financial Officer) |
| |
/s/ SUZANNE M. GRAFTON |
| Suzanne M. Grafton |
| Vice President and Chief Accounting Officer |
| (Principal Accounting Officer) |